The local vertical density distribution of ultracool dwarfs M7 to ...
Upload
khangminh22Category
view
0download
0
MNRAS 000, 000–000 (0000) Preprint 9 February 2017 Compiled using MNRAS LATEX style file v3.0
The stellar mass-halo mass relation of isolated field dwarfs:a critical test of ΛCDM at the edge of galaxy formation
J. I. Read1?, G. Iorio2,3, O. Agertz1, F. Fraternali2,41Department of Physics, University of Surrey, Guildford, GU2 7XH, Surrey, UK2Dipartimento di Fisica e Astronomia, Universita di Bologna, Viale Berti Pichat 6/2, I-40127, Bologna, Italy3INAF – Osservatorio Astronomico di Bologna, via Ranzani 1, I-40127, Bologna, Italy4Kapteyn Astronomical Institute, University of Groningen, Landleven 12, 9747 AD Groningen, The Netherlands
9 February 2017
ABSTRACTWe fit the rotation curves of isolated dwarf galaxies to directly measure the stellarmass-halo mass relation (M∗ −M200) over the mass range 5 × 10⁵ <∼ M∗/M
<∼ 108.By accounting for cusp-core transformations due to stellar feedback, we find a mono-tonic relation with little scatter. Such monotonicity implies that abundance matchingshould yield a similar M∗ −M200 if the cosmological model is correct. Using the ‘fieldgalaxy’ stellar mass function from the Sloan Digital Sky Survey (SDSS) and the halomass function from the Λ Cold Dark Matter Bolshoi simulation, we find remark-able agreement between the two. This holds down to M200 ∼ 5 × 10⁹ M, and toM200 ∼ 5 × 10⁸ M if we assume a power law extrapolation of the SDSS stellar massfunction below M∗ ∼ 107 M.
However, if instead of SDSS we use the stellar mass function of nearby galaxygroups, then the agreement is poor. This occurs because the group stellar mass functionis shallower than that of the field below M∗ ∼ 109 M, recovering the familiar ‘missingsatellites’ and ‘too big to fail’ problems. Our result demonstrates that both problemsare confined to group environments and must, therefore, owe to ‘galaxy formationphysics’ rather than exotic cosmology.
Finally, we repeat our analysis for a Λ Warm Dark Matter cosmology, findingthat it fails at 68% confidence for a thermal relic mass of mWDM < 1.25 keV, andmWDM < 2 keV if we use the power law extrapolation of SDSS. We conclude bymaking a number of predictions for future surveys based on these results.
Key words: (cosmology:) dark matter, (cosmology:) cosmological parameters,(galaxies:) Local Group, galaxies: dwarf, galaxies: irregular, galaxies: kinematics
1 INTRODUCTION
The standard Λ Cold Dark Matter (ΛCDM) cosmologicalmodel gives an excellent description of the growth of struc-ture in the Universe, matching the observed temperaturefluctuations in the cosmic microwave background radiation(e.g. Smoot et al. 1992; Planck Collaboration et al. 2013);the growth of large scale structure (e.g. Springel et al. 2006);the clustering of galaxies (Crocce et al. 2016); large scaleweak lensing distortions (e.g. Blandford et al. 1991; Fu et al.2014); baryon acoustic oscillations (e.g. Blake & Glazebrook2003; Eisenstein et al. 2005; Dawson et al. 2013); and the fluxpower spectrum of quasar absorption lines (e.g. Croft et al.1998; Baur et al. 2015). However, over the past two decades
? E-mail: [email protected]
there have been persistent tensions claimed on small scalesinside galaxy groups and individual galaxies. These include:
(i) The ‘missing satellites’ problem: Pure dark matter cos-mological simulations of structure formation predict thatthousands of bound dark matter halos should orbit theMilky Way and Andromeda, yet only a few tens of visi-ble satellites have been observed to date (e.g. Klypin et al.1999; Moore et al. 1999; McConnachie 2012).
(ii) The ‘cusp-core’ problem: These same simulations pre-dict that the dark matter density distribution within galax-ies should be self-similar and well fit at the ∼10% level bythe ‘NFW’ profile (Navarro et al. 1996b):
ρNFW(r) = ρ0
(r
rs
)−1(1 +
r
rs
)−2
(1)
c© 0000 The Authors
arX
iv:1
607.
0312
7v3
[as
tro-
ph.G
A]
8 F
eb 2
017
2 J. I. Read et al.
where the central density ρ0 and scale length rs are givenby:
ρ0 = ρcrit∆c3gc/3 ; rs = r200/c (2)
gc =1
log (1 + c)− c1+c
; r200 =
[3
4M200
1
π∆ρcrit
]1/3
(3)
c is the dimensionless ‘concentration parameter’; ∆ = 200is the over-density parameter; ρcrit is the critical density ofthe Universe today; r200 is the ‘virial’ radius at which themean enclosed density is ∆ × ρcrit; and M200 is the ‘virial’mass within r200.
For over two decades now, the rotation curves of smalldwarf and low surface brightness galaxies have favoured acentral constant density core over the ‘cuspy’ NFW profiledescribed above (e.g. Flores & Primack 1994; Moore 1994;de Blok & Bosma 2002; Kuzio de Naray & Kaufmann 2011;Oh et al. 2011; Hague & Wilkinson 2013).
(iii) The ‘too big to fail’ problem (TBTF): The centralvelocity dispersion of Local Group dwarfs appears to betoo low to be consistent with the most massive subhalosin ΛCDM (Read et al. 2006; Boylan-Kolchin et al. 2011).
The above puzzles could be hinting at physics beyondΛCDM, for example exotic inflation models (e.g. Zentner& Bullock 2002), or exotic dark matter models (e.g. Moore1994; Rocha et al. 2013; Elbert et al. 2014). However, it isimportant to emphasise that all of these puzzles arise froma comparison between the observed Universe and a modelΛCDM universe entirely devoid of stars and gas (that weshall refer to from here on as ‘baryons’; e.g. see the discus-sion in Pontzen & Governato 2014 and Read 2014). Semi-analytic models make some attempt to improve on this bypainting stars onto pure dark matter simulations (e.g. Baugh2006). However, implicit in such analyses is an assumptionthat the distribution of dark matter is unaltered by the pro-cess of galaxy formation. It is becoming increasingly likelythat this assumption is poor, especially within group envi-ronments and on the scale of tiny dwarf galaxies.
Navarro et al. (1996a) were the first to suggest that darkmatter could be collisionlessly heated by impulsive gas massloss driven by supernova explosions. They found that, forreasonable initial conditions corresponding to isolated dwarfgalaxies, the effect is small (see also Gnedin & Zhao 2002).However, Read & Gilmore (2005) showed that the effect canbe significant if star formation proceeds in repeated bursts,gradually grinding a dark matter cusp down to a core. Thereis mounting observational evidence for such bursty star for-mation (Leaman et al. 2012; Teyssier et al. 2013; Weiszet al. 2012a; Kauffmann 2014; McQuinn et al. 2015), whilethe physics of such ‘cusp-core transformations’ is now well-understood (Pontzen & Governato 2012; Pontzen et al. 2015,and for a review see Pontzen & Governato 2014). The latestnumerical simulations that resolve the effect of individual su-pernovae explosions are substantially more predictive (e.g.Onorbe et al. 2015; Chan et al. 2015; Read et al. 2016a, here-after R16a); these demonstrate that dark matter cores arean unavoidable prediction of ΛCDM (with baryons) for all
low mass dwarf galaxies, so long as star formation proceedsfor long enough1.
However, there remains a debate in the literature overthe efficiency of star formation in low mass halos. Di Cin-tio et al. (2014), Chan et al. (2015) and Tollet et al. (2015)find insufficient star formation to excite cusp-core transfor-mations below M200 ∼ 1010 M; Madau et al. (2014) findthat core formation proceeds in M200 ∼ 109 M dwarfs; andR16a find that core formation proceeds ‘all the way down’to halo masses ∼108 M. These differences owe in part toresolution. R16a have a typical spatial resolution of 4 pc fortheir isolated dwarfs, with a stellar and dark matter parti-cle mass resolution of ∼250 M. This allows them to resolvethe <∼ 500 pc size cores that form in their M200
<∼ 109 Mdwarfs. Such small cores cannot be captured by the Di Cin-tio et al. (2014) and Tollet et al. (2015) simulations thathave a spatial resolution of ∼80 − 100 pc. However, Chanet al. (2015) have a spatial resolution of ∼30 pc for their109 M dwarf, yet they find that no significant dark mattercore forms. This owes to a second key difference betweenthese studies: the treatment of reionisation. In R16a, reion-isation is not modelled and so star formation is allowed toproceed unhindered at very low halo mass. In all of the otherstudies, some model of reionisation heating is included. Butthe mass scale at which reionisation begins to suppress starformation, Mreion, remains controversial. Some recent sim-ulations favour a high Mreion ∼ 1010 M (e.g. Chan et al.2015; Tollet et al. 2015), while others favour a much lowerMreion ∼ 5 × 10⁸ M (Gnedin & Kaurov 2014), consistentwith the assumption of no reionisation in R16a. Observation-ally, the continuous low star formation rate of nearby dwarfirregular galaxies (dIrrs) appears to favour a low Mreion (Ri-cotti 2009; Weisz et al. 2012b, and see the discussion inR16a). We will discuss Mreion further in §6.7.
Despite the differences in Mreion, all of the above studiesfind that when dark matter cores do form, they are of size ∼the projected half stellar mass radius (R1/2). Such cores aredynamically important by construction because they alterthe dark matter distribution precisely where we can hope tomeasure it using stellar kinematics (R16a). They also haveimportant effects beyond just the internal structure of galax-ies. Cored dwarfs are much more susceptible to tidal shock-ing and stripping on infall to a larger host galaxy (e.g. Readet al. 2006; Penarrubia et al. 2010; Brooks et al. 2013). Thisaids in the morphological transformation of dwarfs fromdiscs to spheroids (Mayer et al. 2001a; Lokas et al. 2012;Kazantzidis et al. 2013); and physically reshapes the darkmatter halo mass function within groups (Penarrubia et al.2010; Zolotov et al. 2012; Brooks et al. 2013; Wetzel et al.2016, and see the discussion in R16a).
Using simulations of isolated dwarfs at a spatial andmass resolution of ∼4 pc and ∼250 M, respectively, R16aderived a new ‘coreNFW’ fitting function that describescusp-core transformations in ΛCDM over the mass range108 <∼M200/M <∼ 1010 (see equation 6). In Read et al.
1 Two recent studies have claimed that dark matter cores do not
form at any mass scale (Sawala et al. 2016b; Zhu et al. 2016).
However, both of these used simulations with a ‘cooling floor’ of104 K, meaning that they are unable to resolve the clumpy in-
terstellar medium. Resolving this is crucial for exciting cusp-core
transformations, as explained in Pontzen & Governato (2012).
MNRAS 000, 000–000 (0000)
The stellar mass-halo mass relation of isolated field dwarfs 3
(2016b) (hereafter R16b), we showed that this gives a re-markable match to the rotation curves of four isolated dwarfirregular galaxies, using just two free fitting parameters:M200 and c (that take on the same meaning as in equa-tion 1 for the NFW profile). In particular, using mock data,we demonstrated that if the data are good enough (i.e. ifthe dwarfs are not face-on; starbursting; and/or of uncer-tain distance) then we are able to successfully measure bothM200 and c within our quoted uncertainties.
In this paper, we apply the rotation curve fittingmethod described in R16b to 19 isolated dwarf irreg-ulars (dIrrs) to measure the stellar mass-halo mass re-lation M∗ −M200|rot over the stellar mass range 5 ×10⁵ <∼M∗/M <∼ 108. We then compare this with the stellarmass-halo mass relation obtained from ‘abundance match-ing’, M∗ −M200|abund, to arrive at a comparatively cleantest of our current cosmological model.
This paper is organised as follows. In §2, weshow how the comparison between M∗ −M200|rot andM∗ −M200|abund constitutes a rather clean cosmologicalprobe at the edge of galaxy formation. In §3, we describeour data compilation of rotation curves, stellar masses, andstellar mass functions. In §4, we briefly review our rotationcurve fitting method that is described and tested in detailin R16b. In §5, we present the results from applying ourrotation curve fitting method to 19 isolated dwarf irregulargalaxies in the field (the individual fits and fitted param-eters are reported in Table 2 and Appendix A). In §6, wediscuss the implications of our results and their relation toprevious works in the literature. Finally, in §7 we presentour conclusions.
2 A CLEAN COSMOLOGICAL PROBE ATTHE EDGE OF GALAXY FORMATION
In this paper, we test cosmological models by comparingthe stellar mass-halo mass relation derived from galaxy ro-tation curves (M∗ −M200|rot) with the mean stellar mass-halo mass relation derived from ‘abundance matching’(M∗ −M200|abund). The idea in itself is not new. For ex-ample, Moster et al. (2010) compare M∗ −M200|abund inΛCDM with the stellar mass-halo mass relation derived fromgalaxy-galaxy lensing, finding good agreement. However,most studies to date have focussed on the high mass endof this relation where the differences between ΛCDM andalternative cosmologies like Λ Warm Dark Matter (ΛWDM)are small (e.g. Cacciato et al. 2009; Shan et al. 2015; and seeFigure 3). More recently, Pace (2016) and Katz et al. (2016)have used the baryon-influenced mass models from Di Cin-tio et al. (2014) to fit rotation curves and measure M200 andc for a large sample of dwarfs, comparing their results withabundance matching predictions. We will compare and con-trast our analysis with these studies in §6. However, whatis new to this paper are the following key ingredients: (i)we focus on building a particularly clean sample of rotationcurves, derived in a consistent manner and with a state-of-the-art technique 3DBarolo (Di Teodoro & Fraternali2015; Iorio et al. 2016); (ii) we perform our comparison atM∗ <∼ 108 M, maximising the constraints on cosmologicalmodels; and (iii) we make use of a new predictive coreNFWprofile for the dark matter distribution on these mass scales
that accounts for cusp-core transformations due to stellarfeedback (R16a,b). In the remainder of this section, we dis-cuss in detail how our cosmological test works and why it isparticularly clean.
Classical abundance matching relies on a key assump-tion that galaxy stellar masses are monotonically related todark matter halo masses (Vale & Ostriker 2004). Armed withthis, galaxies are mapped to dark matter halos of the samecumulative number density, providing a statistical estimateof M∗ −M200|abund for a given cosmological model. Thus,by comparing this M∗ −M200|abund with M∗ −M200|rot, wearrive at a comparatively clean cosmological probe of struc-ture formation on small scales. The probe is clean becauseit relies only on the following theoretical ingredients:
(i) A monotonic relation between stellar mass and halomass. We will directly test this with our measurement ofM∗ −M200|rot in §5.2.
(ii) The dark matter halo mass function. This is readilycalculated for a given cosmological model using cosmologicalsimulations (e.g. Dehnen & Read 2011; Klypin et al. 2011).
(iii) A robust prediction of the internal dark matter dis-tribution in dwarf irregular galaxies ρdm(r), for a given cos-mological model. This is required in order to measure M200
from rotation curve data to obtain M∗ −M200|rot. In §5.1we show that, while our coreNFW dark matter density pro-file gives a significantly better fit to our sample of rotationcurves than the NFW profile, we are not particularly sensi-tive to this choice so long as ρdm → ρNFW (see equation 1)for r > R1/2.
Armed with the above theory ingredients, our probe reliessolely on observational data: rotation curves for dwarf galax-ies with well measured inclination and distance, and no evi-dence of a recent starburst (see R16b); stellar masses derivedfrom SED model fitting2; and a good measure of the stellarmass function of galaxies.
For our abundance matching, we use as default thestellar mass function from SDSS that reaches down toM∗ ∼ 107 M (Blanton et al. 2005; Baldry et al. 2008;Behroozi et al. 2010, 2013); and the halo mass functionfrom the ΛCDM ‘Bolshoi’ simulation that is accurate toM200 ∼ 1010 M (Klypin et al. 2011; the cosmological pa-rameters assumed by this simulation are reported in Ta-ble 1). Below these mass scales, we use power law extrap-olations. We compare the SDSS stellar mass function tothose derived in Read & Trentham (2005) (hereafter RT05);GAMA (Baldry et al. 2012); and zCOSMOS (Giodini et al.2012) in Figure 1. The survey data are described in §3.2,while we explore reasons for their different faint end slopesin §5.3.
In addition to testing a ΛCDM cosmology, we explorean effective Λ ‘warm’ dark matter cosmology (ΛWDM). Thiscorresponds to a dark matter particle that is relativistic forsome time after decoupling in the early Universe, leadingto a suppression in the growth of structure on small scales
2 Note that such stellar masses are theoretically derived quanti-ties, not directly measured from the data. However, this critique
applies equally to the stellar masses derived for M∗ −M200|rotand M∗ −M200|abund. As such, the comparison between these
two should not be sensitive to the details of our stellar mass mod-
elling, so long as we are consistent.
MNRAS 000, 000–000 (0000)

4 J. I. Read et al.
Cosmological Parameter Value
Hubble h 0.7
ΩM 0.27ΩΛ 0.73
Tilt n 0.95
σ8 0.82
Table 1. Cosmological parameters assumed in this work. From
top to bottom, these are: the Hubble parameter; the ratio of mat-ter and dark energy density to the critical density; the ‘tilt’ of the
power spectrum; and the amplitude of the power spectrum on a
scale of 8h−1 Mpc (see e.g. Peacock 1999, for a full definition ofthese). These parameters are chosen to match those used in the
Bolshoi simulation (Klypin et al. 2011) and give a good descrip-
tion of the latest cosmological data (see the discussion in Klypinet al. 2011).
and at early times (e.g. Bode et al. 2001; Avila-Reese et al.2001). We describe this model in detail in §5.5.
3 THE DATA
3.1 The rotation curve sample
We compile HI data for 19 isolated dwarf irregular galaxiesover the mass range 5×10⁵ <∼M∗/M <∼ 108 from Weldrakeet al. (2003) and Oh et al. (2015); and stellar mass and sur-face density data from Zhang et al. (2012). Our sample se-lection, that primarily comprises a subset of Little THINGSgalaxies, is discussed in detail in Iorio et al. (2016) and R16b.We exclude galaxies that are known to have very low incli-nation (for which the rotation curve extraction can becomebiased; R16b); four Blue Compact Dwarfs; and any galaxyfor which there is no published stellar mass profile. Thisleaves about half of the full Little THINGS sample. Iorioet al. (2016) show that this subset is representative of thefull Little THINGS survey in terms of its distribution of dis-tances, absolute magnitudes, star formation rate densities,and baryonic masses.
In addition, we include two galaxies which do not havegaseous rotation curves: the isolated dwarf irregular Leo Tand the Milky Way dwarf spheroidal galaxy Carina. We es-timate M200 for Leo T by direct comparison to the simu-lations in R16a. There, we showed that Leo T gave a poormatch to our M200 = 108 M and M200 = 109 M simula-tions, but an excellent match to the photometric light pro-file; star formation history; stellar metallicity distributionfunction; and star/gas kinematics of our M200 = 5×10⁸ Msimulation. From this comparison, we estimate M200,LeoT =3.5− 7.5× 10⁸ M (see Table 2). (A similar analysis for theAquarius dwarf yields a mass M200 ∼ 109 M in good agree-ment with its rotation curve derived value; see Table 2.) ForCarina, we use the pre-infall ‘tidal mass estimate’ from Uralet al. (2015). This is derived by directly fitting N -body sim-ulations of Carina tidally disrupting in the halo of the MilkyWay to data for the positions and velocities of ‘extra-tidal’stars reported in Munoz et al. (2006). Leo T is interestingbecause it is the lowest mass dwarf discovered to date withongoing star formation (Ryan-Weber et al. 2008). In R16a,we argued that its lack of a visible HI rotation curve owesto it having a low inclination (i < 20). Carina is interestingbecause, despite its close proximity to the Milky Way, it has
Figure 1. Galaxy stellar mass functions compiled from the liter-
ature. The blue data points show the stellar mass function from
SDSS (Behroozi et al. 2013); the black data points show the groupstellar mass function from RT05; the red data points show the
stellar mass function from GAMA (Baldry et al. 2012); and the
magenta data points show the stellar mass functions from zCOS-MOS field galaxies over the redshift range z = 0.2− 0.4 (circles)
and from X-ray selected groups (diamonds; Giodini et al. 2012 and
see §3 for further details). The green tracks show a non-parametricfit to the SDSS stellar mass function, where the upper and lower
tracks encompass the 68% confidence intervals of the data. Be-
low M∗ = 108 M we assume a power law with logarithmic slopeα = 1.6.
continued to form stars for almost a Hubble time (thoughwith notable bursts; de Boer et al. 2014). We use Carinato discuss at what mean orbital distance from the MilkyWay environmental effects start to play an important role,driving scatter in the M∗ −M200|rot relation (§6).
All of the data are summarised in Table 2, including ourderived model fitting parameters. We describe our methodol-ogy for extracting the rotation curves from the HI datacubesand fitting model rotation curves in §4.
3.2 The stellar mass functions
We take the SDSS stellar mass function from Behrooziet al. (2013), which was originally obtained by Baldry et al.(2008). The uncertainty on the stellar mass is comparable toour assumed uncertainty for the isolated dwarf galaxy sam-ple described above of ∼25% (Oh et al. 2015), making thecomparison between the stellar masses in Behroozi et al.(2013) and those taken from Zhang et al. (2012) entirelyreasonable.
In Figure 1, we compare the SDSS stellar mass func-tion (blue data points) with those derived by Read & Tren-tham (2005) (black data points; hereafter RT05); GAMA
MNRAS 000, 000–000 (0000)

The stellar mass-halo mass relation of isolated field dwarfs 5
(red data points; Baldry et al. 2012); and zCOSMOS (ma-genta data points; Giodini et al. 2012).
The SDSS stellar mass function is derived from theBlanton et al. (2005) survey of low luminosity galaxies(Baldry et al. 2008). This is complete to a stellar mass ofM∗ ∼ 2 × 10⁷ M over a volume of ∼2 × 10⁶ Mpc3. TheGAMA stellar mass function is derived from about a tenthof the SDSS survey volume (∼2×10⁵ Mpc3), and is completeto a stellar mass of M∗ ∼ 108 M. Due to its smaller sur-vey volume, its stellar mass function is more prone to cosmicvariance (Blanton et al. 2005; Driver et al. 2011). The zCOS-MOS survey covers a small 1.7 deg2 patch of the sky, but tomuch higher redshift (Lilly et al. 2007). Here, we use the low-est redshift range 0.2 < z < 0.4 that corresponds to a volumesimilar to that of the GAMA survey (∼1.8×10⁵ Mpc3), com-plete down to a stellar mass of M∗ ∼ 4 × 10⁸ M (Giodiniet al. 2012). The full zCOSMOS sample is split into a ‘field’population (magenta circles) and X-ray selected groups (ma-genta diamonds), both over the redshift range 0.2 < z < 0.4.Since group environments are more dense on average, werenormalise the X-ray selected groups from Giodini et al.(2012) to match SDSS at M∗ = 1010 M. Finally, we con-sider the stellar mass function from RT05. At M∗ >∼ 109 M,this is taken from SDSS (Blanton et al. 2001, 2003); at lowerstellar mass it comes from the Trentham & Tully (2002) cat-alogue of five nearby groups, including the Local Group (seeTrentham et al. (2005) for details of how these surveys aresewn together). The Trentham & Tully (2002) group cata-logue is derived from deep mosaic surveys that are completeto a stellar mass of M∗ ∼ 106 M, but cover a tiny volumeas compared to SDSS of just ∼5 Mpc3.
As can be seen in Figure 1, all of these different stellarmass functions agree within their uncertainties above M∗ ∼109 M. However, at lower stellar masses there is a strikingdivergence between all of them bar SDSS and the zCOSMOSfield stellar mass function that are in good agreement. Wediscuss this further, and the possible reasons for it, in §5.3.
4 EXTRACTING & MODELLING DWARFGALAXY ROTATION CURVES
4.1 Extracting rotation curves from HI data cubes
Our rotation curves are derived from HI datacubes (Wel-drake et al. 2003; Oh et al. 2015) using the publicly avail-able software 3DBarolo (Di Teodoro & Fraternali 2015).3DBarolo fits tilted-ring models directly to the datacubeby building artificial 3D data and minimising the residu-als, without explicitly extracting velocity fields (as in e.g.Oh et al. 2015). This ensures full control of the observa-tional effects and, in particular, a proper account of beamsmearing that can strongly affect the derivation of the rota-tion velocities in the inner regions of dwarf galaxies (see e.g.Swaters 1999). 3DBarolo was extensively tested on mockdata in R16b and shown to give an excellent recovery ofthe rotation curve so long as the best fit inclination an-gle was ifit > 40. The final rotation curves were correctedfor asymmetric drift, as described in R16b and Iorio et al.(2016). The detailed description of the data analysis, includ-ing comments on individual galaxies, are presented in thosepapers.
4.2 The mass model
We use the same mass model as described in detail in R16b.Briefly, we decompose the circular speed curve into contri-butions from stars, gas and dark matter:
v2c = v2
∗ + v2gas + v2
dm (4)
where v∗ and vgas are the contributions from stars and gas,respectively, and vdm is the dark matter contribution. Weassume that both the stars and gas are well-represented byexponential discs:
v2∗/gas =
2GM∗/gas
R∗/gas
y2 [I0(y)K0(y)− I1(y)K1(y)] (5)
where M∗/gas is the mass of the star/gas disc, respectively;R∗/gas is the exponential scale length; y = R/R∗/gas is adimensionless radius parameter; and I0, I1,K0 and K1 areBessel functions (Binney & Tremaine 2008). We fix the val-ues of R∗ and Rgas in advance of running our Markov ChainMonte Carlo (MCMC) models (see §4.3). All values used arereported in Table 2.
For the dark matter profile, we use the coreNFW pro-file from R16a:
McNFW(< r) = MNFW(< r)fn (6)
where MNFW(< r) is the usual NFW enclosed mass profile(Navarro et al. 1996b):
MNFW(< r) = M200gc
[ln
(1 +
r
rs
)− r
rs
(1 +
r
rs
)−1](7)
and M200; c; rs; gc; ρcrit; and ∆ = 200 are as in equation 1.The function fn generates a shallower profile below a
core radius rc:
fn =
[tanh
(r
rc
)]n(8)
where the parameter 0 < n 6 1 controls how shallow thecore becomes (n = 0 corresponds to no core; n = 1 to com-plete core formation). The parameter n is tied to the totalstar formation time3 tSF:
n = tanh(q) ; q = κtSF
tdyn(9)
where tdyn is the circular orbit time at the NFW profilescale radius rs:
tdyn = 2π
√r3s
GMNFW(rs)(10)
and κ = 0.04 is a fitting parameter (see R16a). For the iso-lated dwarfs that we consider here, we assume tSF = 14 Gyrssuch that they have formed stars continuously for a Hubble
3 More precisely, the total duration of star formation, not tobe confused with the star formation depletion timescale tdep =
Σgas/ΣSFR (e.g. Bigiel et al. 2011).
MNRAS 000, 000–000 (0000)

6 J. I. Read et al.
time. For this value of tSF, n ∼ 1 and we expect the dwarfsto be maximally cored.
The core size is set by the projected half stellar massradius of the stars R1/2:
rc = ηR1/2 (11)
where, for an exponential disc, R1/2 = 1.68R∗. By de-fault, we assume that the dimensionless core size parameter,η = 1.75 since this gives the best match to the simulationsin R16a. However, as discussed in R16a, there could be somescatter in η due to varying halo spin, concentration parame-ter and/or halo assembly history. We explore our sensitivityto η in Appendix B where we perform our rotation curve fitsusing a flat prior on η over the range 0 < η < 2.75 (the up-per bound on the η prior is set by energetic arguments; seeAppendix B for details). This allows both no core (η = 0),corresponding to an NFW profile, and substantially largercores than were found in the R16a simulations. In AppendixB, we show that the NFW profile (η = 0) is disfavouredat > 99% confidence, reaffirming the well-known cusp-coreproblem (see §1). However, as we showed for WLM in R16b,η is otherwise poorly constrained (though consistent withour default choice of η = 1.75). Allowing η to vary slightlyincreases our errors on M200 but is otherwise benign. Thisis because M200 is set by the outermost bins of the rotationcurve where in many cases it begins to turn over and becomeflat. Indeed, in §5.1, we show that demanding an NFW pro-file leads to a poor rotation curve fit, but little change in ourderived halo masses. This demonstrates that so long as thedark matter density profile ρdm approaches the NFW formfor r > R1/2, our measurements of M200 are not sensitive toour particular coreNFW parameterisation of ρdm.
4.3 Fitting the mass model to data & our choiceof priors
We fit the above mass model to the data using the emceeaffine invariant Markov Chain Monte Carlo (MCMC) sam-pler from Foreman-Mackey et al. (2013). We assume uncor-related Gaussian errors such that the Likelihood function isgiven by L = exp(−χ2/2). We use 100 walkers, each gener-ating 1500 models and we throw out the first half of these asa conservative ‘burn in’ criteria. We explicitly checked thatour results are converged by running more models and ex-amining walker convergence. All parameters were held fixedexcept for the dark matter virial mass M200; the concentra-tion parameter c; and the total stellar massM∗. We assume aflat logarithmic prior on M200 of 8 < log10 [M200/M] < 11;a flat linear prior on c of 14 < c < 30 and a flat linear prioron M∗ over the range given by stellar population synthesismodelling, as reported in Table 2. We assume an error onM∗ of 25% unless a larger error than this is reported in theliterature (Zhang et al. 2012; Oh et al. 2015). The generousprior range on c is set by the cosmic mean redshift z = 0 ex-pectation value of c at the extremities of the prior on M200
(Maccio et al. 2007). In R16b, we showed that our resultsare not sensitive to this prior choice. For each galaxy, we fitdata over a range [Rmin, Rmax] as reported in Table 2, where‘−’ means that Rmax was set by the outermost data point.Rmin is marked by thin vertical lines on the individual rota-tion curve fits reported in Appendix A. For most galaxies,
Rmin = 0. It is only non-zero where the innermost rotationcurve is affected by an expanding HI bubble (see R16b forfurther details). In Appendix B, we explore allowing the coresize parameter η (equation 11) to vary also in the fits.
4.4 Tests on mock data and the exclusion of‘rogues’
Our ability to measure M200 and c from mock rotation curvedata was extensively tested in R16b. There, we showed thatthere are three key difficulties that can lead to systematicbiases. Firstly, we must account for cusp-core transforma-tions due to stellar feedback if we wish to obtain a goodfit to the rotation curve inside R1/2. We account for thisby using our coreNFW profile (§4.2). Secondly, our simu-lated dwarfs continuously cycle between quiescent and ‘star-burst’ modes that cause the HI rotation curve to fluctuate.This can lead to a systematic bias on M200 of up to half adex in the most extreme cases. However, this disequilibriumcan be readily identified by the presence of large and fast-expanding ( >∼ 20− 30 km s−1) HI superbubbles in the ISM.Thirdly, low inclination galaxies, particularly if also under-going a starburst, can be difficult to properly inclination cor-rect. Using mock HI datacubes, we found that 3DBarolocan return a systematically low inclination if ifit
<∼ 40. Forthis reason, if 3DBarolo returns an inclination of ifit < 40,we marginalise over i in our fits assuming a flat prior overthe range 0 < i < 40. We call such galaxies ‘inclinationRogues’ or i-Rogues and we discuss them in Appendix B.(We find that five of our 19 dIrrs are i-Rogues.)
Two galaxies – DDO 216 (Pegasus) and NGC 1569 –have highly irregular rotation curves. For Pegasus, this owesto the limited radial extent of its rotation curve that doesnot extend beyond R1/2. For NGC 1569, its inner rotationcurve is shallower than required to support even its stellarmass, indicating that it is far from equilibrium. This is fur-ther supported by the presence of large and fast-expandingHI holes (see R16b; Table 2; and Johnson et al. 2012) andthe fact that it is classified as a ‘Blue Compact Dwarf’, witha very recent starburst some ∼40 Myrs ago (McQuinn et al.2010). (Indeed, Lelli et al. (2014) classify it as having a ‘kine-matically disturbed HI disc’ and do not attempt to derive itsrotation curve.) From a more theoretical standpoint, R16band more recently El-Badry et al. (2016) show that star-bursts are expected to drive exactly the sort of disequilib-rium seen in NGC 1569. For these reasons, we exclude thesetwo ‘disequilibrium rogues’ from further analysis from hereon. For completeness, we report their best-fitting M200 and cin Table 2 and we show their rotation curve fits in AppendixA.
Finally, one galaxy – DDO 101 – has a very uncertaindistance; we refer to this galaxy as a ‘distance Rogue’. Wediscussed DDO 101 in detail in R16b, showing that for adistance of ∼12 Mpc it can be well-fit by a coreNFW darkmatter halo. We consider its position on the M∗ −M200|rot
relation alongside the i-Rogues in Appendix B.
MNRAS 000, 000–000 (0000)
The stellar mass-halo mass relation of isolated field dwarfs 7
Galaxy
vm
ax
iD
M∗
Mgas
R∗
Rgas
[Rm
in,R
max]
M200
cχ2 re
d
HI
bubbles
Refs.
(km
/s)
()
(Mp
c)(1
07
M
)(1
07
M
)(k
pc)
(kp
c)(k
pc)
(10
10M
)
NG
C6822
56.0±
2.2
65-7
50.4
9±
0.0
47.6
3±
1.9
17.4
0.6
81.9
4[2.5,−
]2
+0.2
−0.3
15.1
+1.8
−0.8
0.3
71.4−
2kp
c;
0km
/s
1,2
,3,7
WL
M39.0±
3.3
74±
2.3
0.9
85±
0.0
33
1.6
2±
0.4
7.9
0.7
51.0
4[0,−
]0.8
30.2 −0.2
17
+3.9
−2.2
0.2
70.4
6kp
c;0
km
/s
3,4
,5,6
,8
DD
O52
50.7±
13.4
55.1±
2.9
10.3
5.2
7±
1.3
37.1
0.9
42.4
9[0,−
]1.2
+0.2
9−
0.2
717.3
+4.2
−2.4
0.2
–3,6
DD
O87
52.0±
9.1
42.7±
7.3
7.4
3.3±
0.8
31.0
1.1
31.5
1[0,−
]1.1
3+
0.2
7−
0.2
517.6
+4.6
−2.7
0.3
1–
3,6
DD
O154•
46.7±
5.1
67.9±
1.1
3.7
0.8
35±
0.2
30.9
0.5
42.3
4[0,−
]1.2
6+
0.0
5−
0.0
514.2
+0.2
4−
0.1
72.1
4–
3,6
DD
O210
17.8±
9.5
63.2±
3.2
0.9
0.0
68±
0.0
17
0.3
30.2
20.2
5[0.2,−
]0.0
68
+0.1
3−
0.0
421.4
+5.5
−5.2
0.6
5–
3,6
NG
C2366
58.8±
5.4
65.1±
4.2
3.4
6.9
5±
1.7
3103
1.5
42.6
9[0,−
]2.4
+0.4
9−
0.5
417.3
+4.5
−2.4
0.4
80.5−
1kp
c;
30
km
/s
3,6
,10
UG
C8508
32.1±
6.2
67.6±
5.3
2.6
0.7
64±
0.1
91
3.5
0.3
11.1
[0,−
]0.6
3+
0.5
−0.2
21.0
+5.3
−4.8
0.0
50.2
85
pc;
0km
/s
3,6
,11
CV
nId
wA
22.4±
3.9
49.2±
10.9
3.6
0.4
1±
0.1
6.4
20.6
81.1
8[0,−
]0.1
7+
0.1
−0.0
521.4
+5.4
−5.3
0.2
1–
3,6
DD
O126
39.2±
3.1
62.2±
2.9
4.9
1.6
1±
0.4
18.7
0.8
21.5
1[2,−
]0.5
8+
0.2
−0.1
20.6
+5.9
−4.7
0.1
6–
3,6
DD
O168
56.3±
7.2
47.3±
7.4
4.3
5.9±
1.4
845.8
0.8
21.5
1[0,−
]2.1
+0.5
2−
0.4
816.8
+3.2
−2.0
0.2
4–
3,6
∼∼∼i-Rogues∼∼∼
DD
O133
49.0±
5.1
36.9
+2.3
−4.0
3.5
3.0
4±
0.7
616.9
0.8
04
1.3
9[0,−
]1.6
+1.1
−0.4
425.8
+2.8
−5.5
0.1
6–
3,6
IC1613
19.9±
2.2
27.6
+9.0
−11.3
0.7
4±
0.0
11.5±
0.5
80.6
51.2
9[1.9,−
]0.1
7+
1.0
−0.1
21.8
+5.3
−5.4
0.1
31
kp
c;25
km
/s
3,6
,9
DD
O50
37.6±
10.1
37.4
+2.0
−3.7
3.4
10.7
2±
2.6
897.6
50.8
93.1
[0,−
]0.3
2+
0.1
6−
0.0
826.2
+2.5
−4.7
0.8
0.6
5-
0.8
4kp
c;14
km
/s
3,6
,13
DD
O53•
23.2±
6.6
23.9
+7.3
−6.4
3.6
0.9
7±
0.2
424.6
0.8
91.1
4[0,−
]0.3
9+
3.4
−0.3
621.6
+5.3
−5.1
0.3
8–
3,6
DD
O47
62.6±
5.2
31.4
+5.7
−5.2
5.2
9.4±
4.7
35.3
0.7
8.2
[3.5,−
]4.4
+3.2
−1.9
20.5
+5.6
−4.6
0.8
3–
6,2
3
∼∼∼
Disequilib
riu
mRogues∼∼∼
DD
O216
13.8±
5.0
70.0±
5.0
1.1
1.5
2±
0.3
80.1
52
0.5
20.2
97
[0,−
]0.0
67
+0.0
48
−0.0
25
23.4
+4.6
−6.0
0.5
2–
3,6
NG
C1569
55.9±
22.4
67.0±
5.6
3.4
36±
923.8
0.4
51.2
2[1.8,−
]0.8
1+
2.1
−0.7
19.7
+6.7
−6.1
–∼
200
pc;
10-7
0km
/s
3,6
,14
∼∼∼
Dista
nceRogues∼∼∼
DD
O101
64.8±
2.6
52.4±
1.7
6.4
6.5
4±
13.4
80.5
81.0
1[0,−
]5.2
+0.6
−0.4
28.9
+0.6
−1.3
7.2
–3,6
12.9
26.6±
414.1
31.1
62.0
3[0,−
]3.0
+0.4
−0.2
28.3
+1.1
−2.2
1.9
2–
–
∼∼∼
No
Rota
tion
Curve∼∼∼
Leo
T–
∼20
0.4
07±
0.0
38
0.0
135±
0.0
08
0.0
28
0.1
06
––
0.0
35−
0.0
75
––
–16,1
7,1
8,1
9,2
0
Cari
na
––
0.0
85±
0.0
05
0.0
48
+0.0
06
−0.0
04
–0.1
77
––
0.0
36
+0.0
38
−0.0
23
––
–15,2
1,2
2
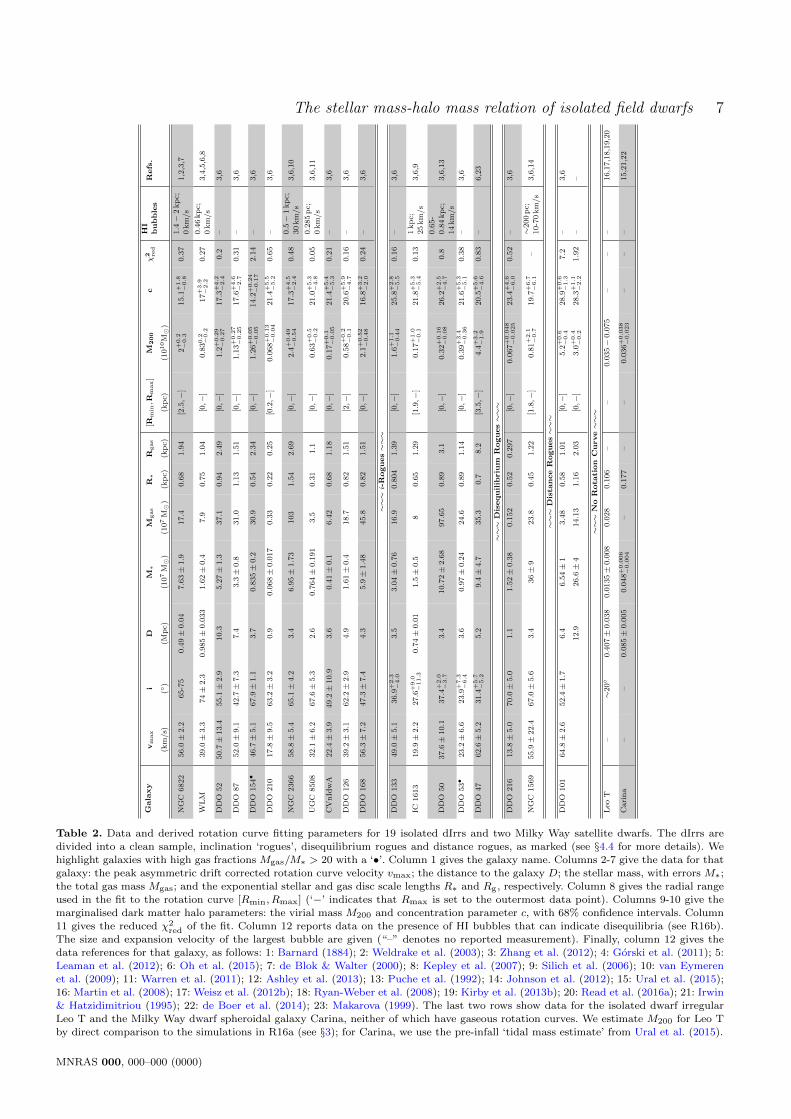
Table 2. Data and derived rotation curve fitting parameters for 19 isolated dIrrs and two Milky Way satellite dwarfs. The dIrrs aredivided into a clean sample, inclination ‘rogues’, disequilibrium rogues and distance rogues, as marked (see §4.4 for more details). Wehighlight galaxies with high gas fractions Mgas/M∗ > 20 with a ‘•’. Column 1 gives the galaxy name. Columns 2-7 give the data for that
galaxy: the peak asymmetric drift corrected rotation curve velocity vmax; the distance to the galaxy D; the stellar mass, with errors M∗;the total gas mass Mgas; and the exponential stellar and gas disc scale lengths R∗ and Rg, respectively. Column 8 gives the radial rangeused in the fit to the rotation curve [Rmin, Rmax] (‘−’ indicates that Rmax is set to the outermost data point). Columns 9-10 give the
marginalised dark matter halo parameters: the virial mass M200 and concentration parameter c, with 68% confidence intervals. Column11 gives the reduced χ2
red of the fit. Column 12 reports data on the presence of HI bubbles that can indicate disequilibria (see R16b).The size and expansion velocity of the largest bubble are given (“–” denotes no reported measurement). Finally, column 12 gives the
data references for that galaxy, as follows: 1: Barnard (1884); 2: Weldrake et al. (2003); 3: Zhang et al. (2012); 4: Gorski et al. (2011); 5:
Leaman et al. (2012); 6: Oh et al. (2015); 7: de Blok & Walter (2000); 8: Kepley et al. (2007); 9: Silich et al. (2006); 10: van Eymerenet al. (2009); 11: Warren et al. (2011); 12: Ashley et al. (2013); 13: Puche et al. (1992); 14: Johnson et al. (2012); 15: Ural et al. (2015);
16: Martin et al. (2008); 17: Weisz et al. (2012b); 18: Ryan-Weber et al. (2008); 19: Kirby et al. (2013b); 20: Read et al. (2016a); 21: Irwin& Hatzidimitriou (1995); 22: de Boer et al. (2014); 23: Makarova (1999). The last two rows show data for the isolated dwarf irregular
Leo T and the Milky Way dwarf spheroidal galaxy Carina, neither of which have gaseous rotation curves. We estimate M200 for Leo T
by direct comparison to the simulations in R16a (see §3); for Carina, we use the pre-infall ‘tidal mass estimate’ from Ural et al. (2015).
MNRAS 000, 000–000 (0000)

8 J. I. Read et al.
Figure 2. Rotation curve fits for three example galaxies: CVnIdwA, WLM and NGC 6822, chosen to span the range of stellar massesin our full sample (see Table 2). We show the full sample, including the ‘rogues’, in Appendix A. The black contours show the median
(black), 68% (dark grey) and 95% (light grey) confidence intervals of our fitted rotation curve models (see §4.2). The vertical green dashed
line shows the projected stellar half light radius R1/2. The thin vertical black line marks the inner data point used for the fit, Rmin
(where this is not marked Rmin = 0). The blue and green lines show the rotation curve contribution from stars and gas, respectively.
The top three panels show fits using our coreNFW profile that accounts for cusp-core transformations due to stellar feedback (see §4.2).
These give an excellent fit to the rotation curve shape in all three cases. The bottom three panels show fits using an NFW profile, wherewe set Rmin to ensure that the outer rotation curve is well-fit. This gives a much poorer fit to the rotation curve shape, reaffirming the
long-standing ‘cusp-core’ problem.
5 RESULTS
5.1 The rotation curve fits
In Figure 2, we show three example rotation curve fits forCVnIdwA, WLM and NGC 6822, chosen to span the rangeof stellar masses in our full sample (see Table 2). (We showthe full sample, including the ‘rogues’, in Appendix A.) Theblack contours show the median (black), 68% (dark grey)and 95% (light grey) confidence intervals of our fitted rota-tion curve models (see §4.2). The vertical green dashed lineshows the projected stellar half light radius R1/2. The thinvertical black line marks the inner data point used for thefit, Rmin (where this is not marked Rmin = 0). The blueand green lines show the rotation curve contribution fromstars and gas, respectively. The top three panels of Figure2 show fits using the coreNFW profile, the bottom threeusing an NFW profile, where we set Rmin to ensure thatthe outer rotation curve is well-fit (see §4 for details of ourfitting methodology and priors).
As can be seen in Figure 2, in all three cases the
coreNFW profile provides an excellent fit to the data,while the NFW profile gives a poor fit, reaffirming the long-standing ‘cusp-core’ problem (see §1). The good fits thatwe find when using the coreNFW profile are particularlystriking since, like the NFW profile, it has only two free pa-rameters: M200 and c (see §4.2). However, despite the NFWprofile giving a poor fit to the rotation curve shape, theNFW-derived M200 are actually in good agreement withthose from our coreNFW fits. For NGC 6822, we findM200,NFW = 2.0+0.13
−0.2 × 10¹⁰ M; for WLM, M200,NFW =5.2+2.1−1.2×10⁹ M; and for CVnIdwA, M200,NFW = 0.79+0.5
−0.3×10⁹ M. These agree, within our 68% confidence intervals,with the coreNFW values reported in Table 2.
The above demonstrates that the coreNFW profile isimportant for obtaining a good fit to the rotation curveshape inside ∼R1/2, however it is not critical for measur-ing M200. What matters for measuring M200 is that thedark matter density profile approaches the NFW form forr > R1/2 (as is the case for the coreNFW profile by con-struction). Since there is not enough integrated supernova
MNRAS 000, 000–000 (0000)
The stellar mass-halo mass relation of isolated field dwarfs 9
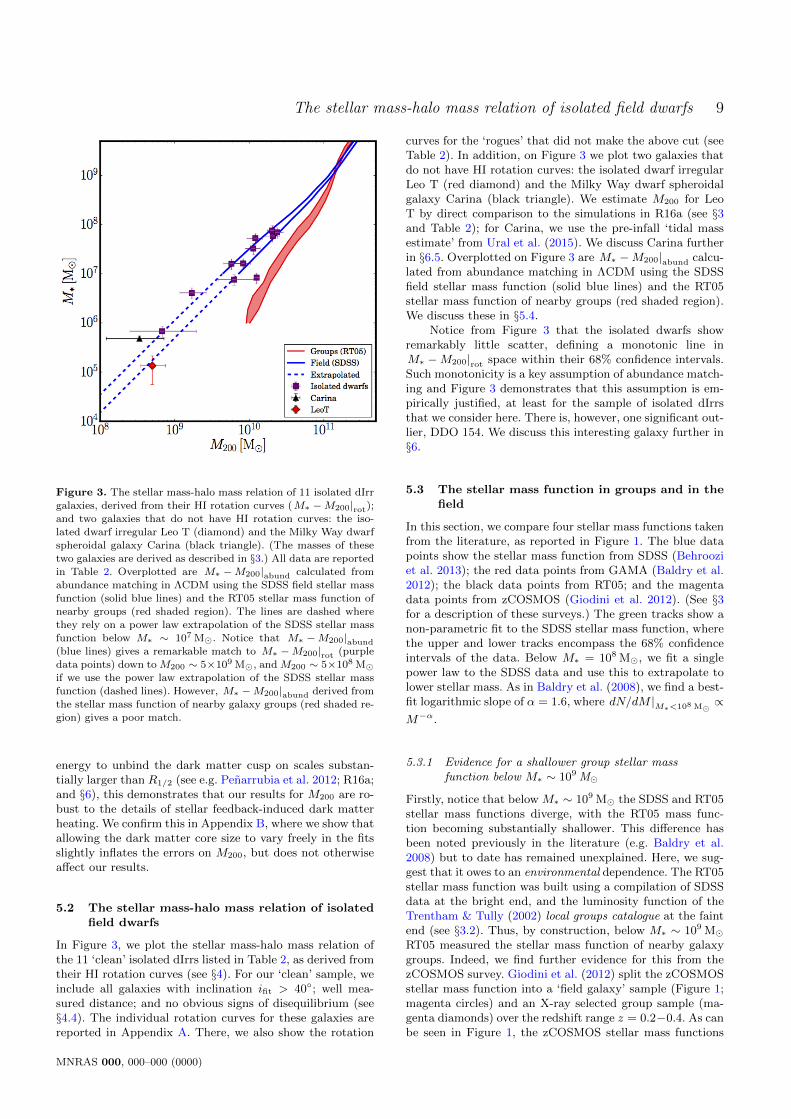
Figure 3. The stellar mass-halo mass relation of 11 isolated dIrr
galaxies, derived from their HI rotation curves (M∗ −M200|rot);
and two galaxies that do not have HI rotation curves: the iso-lated dwarf irregular Leo T (diamond) and the Milky Way dwarf
spheroidal galaxy Carina (black triangle). (The masses of these
two galaxies are derived as described in §3.) All data are reportedin Table 2. Overplotted are M∗ −M200|abund calculated from
abundance matching in ΛCDM using the SDSS field stellar mass
function (solid blue lines) and the RT05 stellar mass function ofnearby groups (red shaded region). The lines are dashed where
they rely on a power law extrapolation of the SDSS stellar massfunction below M∗ ∼ 107 M. Notice that M∗ −M200|abund(blue lines) gives a remarkable match to M∗ −M200|rot (purple
data points) down to M200 ∼ 5×10⁹ M, and M200 ∼ 5×10⁸ Mif we use the power law extrapolation of the SDSS stellar mass
function (dashed lines). However, M∗ −M200|abund derived from
the stellar mass function of nearby galaxy groups (red shaded re-gion) gives a poor match.
energy to unbind the dark matter cusp on scales substan-tially larger than R1/2 (see e.g. Penarrubia et al. 2012; R16a;and §6), this demonstrates that our results for M200 are ro-bust to the details of stellar feedback-induced dark matterheating. We confirm this in Appendix B, where we show thatallowing the dark matter core size to vary freely in the fitsslightly inflates the errors on M200, but does not otherwiseaffect our results.
5.2 The stellar mass-halo mass relation of isolatedfield dwarfs
In Figure 3, we plot the stellar mass-halo mass relation ofthe 11 ‘clean’ isolated dIrrs listed in Table 2, as derived fromtheir HI rotation curves (see §4). For our ‘clean’ sample, weinclude all galaxies with inclination ifit > 40; well mea-sured distance; and no obvious signs of disequilibrium (see§4.4). The individual rotation curves for these galaxies arereported in Appendix A. There, we also show the rotation
curves for the ‘rogues’ that did not make the above cut (seeTable 2). In addition, on Figure 3 we plot two galaxies thatdo not have HI rotation curves: the isolated dwarf irregularLeo T (red diamond) and the Milky Way dwarf spheroidalgalaxy Carina (black triangle). We estimate M200 for LeoT by direct comparison to the simulations in R16a (see §3and Table 2); for Carina, we use the pre-infall ‘tidal massestimate’ from Ural et al. (2015). We discuss Carina furtherin §6.5. Overplotted on Figure 3 are M∗ −M200|abund calcu-lated from abundance matching in ΛCDM using the SDSSfield stellar mass function (solid blue lines) and the RT05stellar mass function of nearby groups (red shaded region).We discuss these in §5.4.
Notice from Figure 3 that the isolated dwarfs showremarkably little scatter, defining a monotonic line inM∗ −M200|rot space within their 68% confidence intervals.Such monotonicity is a key assumption of abundance match-ing and Figure 3 demonstrates that this assumption is em-pirically justified, at least for the sample of isolated dIrrsthat we consider here. There is, however, one significant out-lier, DDO 154. We discuss this interesting galaxy further in§6.
5.3 The stellar mass function in groups and in thefield
In this section, we compare four stellar mass functions takenfrom the literature, as reported in Figure 1. The blue datapoints show the stellar mass function from SDSS (Behrooziet al. 2013); the red data points from GAMA (Baldry et al.2012); the black data points from RT05; and the magentadata points from zCOSMOS (Giodini et al. 2012). (See §3for a description of these surveys.) The green tracks show anon-parametric fit to the SDSS stellar mass function, wherethe upper and lower tracks encompass the 68% confidenceintervals of the data. Below M∗ = 108 M, we fit a singlepower law to the SDSS data and use this to extrapolate tolower stellar mass. As in Baldry et al. (2008), we find a best-fit logarithmic slope of α = 1.6, where dN/dM |M∗<108 M
∝M−α.
5.3.1 Evidence for a shallower group stellar massfunction below M∗ ∼ 109 M
Firstly, notice that below M∗ ∼ 109 M the SDSS and RT05stellar mass functions diverge, with the RT05 mass func-tion becoming substantially shallower. This difference hasbeen noted previously in the literature (e.g. Baldry et al.2008) but to date has remained unexplained. Here, we sug-gest that it owes to an environmental dependence. The RT05stellar mass function was built using a compilation of SDSSdata at the bright end, and the luminosity function of theTrentham & Tully (2002) local groups catalogue at the faintend (see §3.2). Thus, by construction, below M∗ ∼ 109 MRT05 measured the stellar mass function of nearby galaxygroups. Indeed, we find further evidence for this from thezCOSMOS survey. Giodini et al. (2012) split the zCOSMOSstellar mass function into a ‘field galaxy’ sample (Figure 1;magenta circles) and an X-ray selected group sample (ma-genta diamonds) over the redshift range z = 0.2−0.4. As canbe seen in Figure 1, the zCOSMOS stellar mass functions
MNRAS 000, 000–000 (0000)
10 J. I. Read et al.
are only complete down to M∗ ∼ 4 × 10⁸ M (see §3) butnonetheless, at this mass scale, there is a statistically sig-nificant bifurcation between the zCOSMOS field and groupsamples that matches that seen in SDSS and RT05.
There are two key challenges involved in comparingzCOSMOS with RT05 and SDSS. Firstly, the redshift rangeof the surveys are different (see §3). However, this is not asignificant effect since the stellar mass function is known tobe almost constant out to z = 0.5 (Behroozi et al. 2013). (In-deed, we find no difference between the zCOSMOS field stel-lar mass function (magenta circles) and that of SDSS (bluedata points) down to M∗ ∼ 4× 10⁸ M.) Secondly, the def-inition of a ‘group’ differs. The Giodini et al. (2012) groupsare selected based on co-added XMM and Chandra X-rayimages, using a wavelet method to detect extended emission(Finoguenov et al. 2007). In this way, they find groups overthe mass range 0.14 < M500/(1013M) < 26. By contrast,Trentham & Tully (2002) study five nearby optically selectedgroups, including the Local Group. Only one of these has re-ported X-ray emission (Romanowsky et al. 2009), but theydo span a similar mass range to the Giodini et al. (2012)sample (Zhang et al. 2007; Makarov & Karachentsev 2011;Penarrubia et al. 2016). For these reasons, a direct compari-son between the Trentham & Tully (2002) and (Giodini et al.2012) groups is reasonable. Indeed, their stellar mass func-tions agree remarkably well down to the stellar mass limitof the zCOSMOS survey (compare the magenta diamondsand black data points in Figure 1).
Finally, consider the GAMA stellar mass function inFigure 1 (red data points). This agrees well with both thezCOSMOS field sample (magenta circles) and SDSS (bluedata points) down to M∗ ∼ 2× 10⁸ M. The one data pointbelow this is slightly, though not statistically significantly,shallower than SDSS. It is beyond the scope of this presentwork to explore this discrepancy in any detail, though it hasbeen noted previously (e.g. Baldry et al. 2012). As empha-sised in §3, the GAMA survey covers about one tenth ofthe volume of SDSS and is complete only at a higher stel-lar mass. For these reasons, we will use the SDSS stellarmass function for the remainder of this paper. We discussthe GAMA stellar mass function further in §6.
5.3.2 The origin of the M∗ ∼ 109 M mass scale
The shallower group stellar mass function that we find hereis perhaps not surprising. It has long been known that satel-lites are quenched on infall to groups due to a combination ofram pressure stripping and tides (e.g. Peng et al. 2012; Gattoet al. 2013; Carollo et al. 2013). Ram pressure shuts downstar formation, leading to a lower stellar mass for a givenpre-infall halo mass, while tides physically destroy halos de-pleting the dark matter subhalo mass function. In the MilkyWay, this is evidenced by the ‘distance-morphology’ relation:most satellites within ∼200 kpc of the Galactic centre havetruncated star formation and are devoid of gas, while thoseat larger radii have HI and are currently forming stars (e.g.Haynes et al. 1984; Mateo 1998; Mayer et al. 2001b; Grebelet al. 2003; Tolstoy et al. 2009; McConnachie 2012; Gattoet al. 2013).
It is interesting to ask, however, whether ram pres-sure or tides can explain why the stellar mass functionis affected only below M∗ ∼ 109 M. In R16a, we cal-
culated the effect of tides on satellites orbiting within aMilky Way mass host (their section 4.3). The effect is max-imised if satellites have their dark matter cusps transformedinto cores. But even in this extremum limit, satellites areonly fully destroyed if they have a pericentre of rp <∼ 30 kpcand a mass M200
<∼ 1010 M. Using our M∗ −M200|rot re-lation in Figure 3, this corresponds to a stellar mass ofM∗ ∼ 2 − 3 × 10⁷ M, suggesting that tides are not likelyto be the primary cause of the shallower group stellar massfunction that we find here.
The second potential culprit is ram pressure. This oc-curs when (Gatto et al. 2013):
ρh(rp)v2p>∼
1
5ρdv2
max
2(12)
where ρh is the coronal gas density of the host at pericentre;vp is the velocity of the satellite at pericentre; ρd is thedensity of gas in the dwarf ISM; vmax is the peak rotationalvelocity of the dwarf4; and the factor 1/5 accounts for non-linear effects (Gatto et al. 2013).
For a satellite falling into the Milky Way, ρh ∼ 3 ×10⁻⁴ atoms cm−3; vp ∼ 450 km/s; and ρd ∼ 0.1 atoms cm−3
(Gatto et al. 2013). Thus, we can rearrange equation 12 toprovide a limiting vmax below which ram pressure becomesimportant:
vmax,ram =
√10ρhρd
vp ∼ 78 km s−1 (13)
This is similar to the vmax of the LMC (van der Marel et al.2002) that has a stellar mass of M∗ ∼ 1.5 × 10⁹ M (Mc-Connachie 2012). This suggests that the shallower groupstellar mass function that we find here owes to satellitequenching, driven primarily by ram pressure. Indeed, Gehaet al. (2012) found, using SDSS data, that all field galaxiesabove M∗ = 109 M are star-forming today, independentof environment. By contrast, galaxies with M∗ < 109 Mcan be quenched, with the quenched fraction increasing withproximity to a larger host galaxy.
5.4 Abundance matching in groups and in thefield
In this section, we measure M∗ −M200|abund using the stel-lar mass functions in Figure 1 matched to the ΛCDM Bolshoisimulation (Klypin et al. 2011). Our abundance matching is‘non-parametric’ in the sense that we numerically integratethe curves in Figure 1 to obtain the cumulative stellar massfunction; we then match these numerically to the cumula-tive halo mass function from the Bolshoi simulation. For thislatter, we use a Schechter function fit to the halo mass func-tion, defining the ‘halo mass’ as the virial mass M200 beforeinfall.
The results are shown in Figure 3 for the SDSS fieldstellar mass function (blue lines) and the RT05 group stel-lar mass function (red shaded region). The lines are dashed
4 We have assumed here that v2max ' 2σ2
∗, where σ∗ is the stellar
velocity dispersion of the dwarf. This amounts to an assumptionof a flat, isothermal, rotation curve for the dwarf (e.g. Binney &
Tremaine 2008).
MNRAS 000, 000–000 (0000)

The stellar mass-halo mass relation of isolated field dwarfs 11
where they rely on a power law extrapolation of the SDSSstellar mass function below M∗ ∼ 107 M. (We compareand contrast our abundance matching results with previousdeterminations in the literature in Appendix C.)
Notice that M∗ −M200|abund (blue lines) gives a re-markable match to M∗ −M200|rot (purple data points)down to M200 ∼ 5 × 10⁹ M, and M200 ∼ 5 × 10⁸ Mif we use the power law extrapolation of SDSS. However,M∗ −M200|abund derived from the stellar mass function ofnearby galaxy groups (RT05; red shaded region) gives a poormatch. In particular, it leads to the familiar result that alldwarf galaxies must inhabit implausibly massive ∼1010 Mhalos (e.g. Read et al. 2006) that has become known as the‘too big to fail’ (TBTF) problem (e.g. Boylan-Kolchin et al.2011).
There are a number of problems with using the RT05stellar mass function for ‘classical’ abundance matching aswe have done here. Firstly, we have assumed a monotonicrelation between M∗ and M200. We have shown that thisis true for our sample of isolated dIrrs (§5.2), but we ex-pect it to fail for satellites whose M∗ will depend on M200,their time of infall and their orbit, inducing scatter in M∗for a given pre-infall M200 (e.g. Ural et al. 2015; Tomozeiuet al. 2016; Garrison-Kimmel et al. 2017, and see §5.3.2).Secondly, there is what we might call a ‘volume problem’.If we wish to match a pure-dark matter simulation to theMilky Way, what volume should we use to normalise theMilky Way satellite mass function? Brook et al. (2014) andGarrison-Kimmel et al. (2014) solve this by explicitly match-ing satellites to constrained simulations of the Local Group.Here, we solve it by using the RT05 stellar mass function.This solves the ‘volume problem’ by renormalising the groupstellar mass functions derived from Trentham & Tully (2002)to match SDSS at the bright end (see §3). Since this nor-malises the volume to SDSS field galaxies, we must thenabundance match RT05 with the full Bolshoi simulation, aswe have done here. Indeed, in Appendix C we verify that ourRT05 M∗ −M200|abund relation, derived in this way, agreesvery well with those derived independently by Brook et al.2014 and Garrison-Kimmel et al. (2014). Finally, there isthe problem of satellite quenching. As discussed in §5.3.2,satellites can have their star formation shut down by rampressure stripping, or be tidally disrupted on infall. Tidalstripping is already dealt with, in part, by using the pre-infall M200 (e.g. Diemand et al. 2007). However, we expecttidal disruption to be enhanced by cusp-core transforma-tions and the presence of the Milky Way stellar disc, neitherof which are captured by pure dark matter simulations (e.g.Read et al. 2006; Penarrubia et al. 2010; D’Onghia et al.2010; Zolotov et al. 2012; Wetzel et al. 2016, and see thediscussion in R16a).
For all of the above reasons, we expect ‘classical’ abun-dance matching with the RT05 stellar mass function to fail.Nonetheless, it is instructive because the key assumptionsthat go into it are common in the literature (e.g. Brook et al.2014; Garrison-Kimmel et al. 2014). Indeed, it is likely thatthese assumptions are responsible for the now long-standing‘missing satellites’ and TBTF problems that manifest forsatellite galaxies below MTBTF ∼ 1010 M (Read et al. 2006;Boylan-Kolchin et al. 2011; Tollerud et al. 2014, and see §1).The fact that M∗ −M200|rot matches M∗ −M200|abund forour sample of isolated dIrrs demonstrates that every isolated
Figure 4. M∗ −M200|rot (purple data points) as compared
to M∗ −M200|abund in ΛCDM (blue lines) and ΛWDM (green
lines), using the SDSS field stellar mass function. The thermalrelic mass mWDM is marked on the curves in keV. The lines and
symbols are as in Figure 3.
field halo is occupied with a dIrr down to M200 ∼ 5×10⁹ Mand to M200 ∼ 5×10⁸ M if we use the power law extrapola-tion of SDSS. Furthermore, these dwarfs inhabit dark mat-ter halos that are perfectly consistent with their observedgaseous rotation curves. Thus, our sample of isolated dIrrs– that extend to M200 < MTBTF – has no missing satellitesor TBTF problem, suggesting that both depend on environ-ment. We discuss this further in §6.
5.5 Constraints on warm dark matter
We have shown so far that the field dIrr M∗ −M200|abund
is consistent with M∗ −M200|rot in ΛCDM. In this section,we consider how well these match in a ΛWDM cosmology.We use the formulae in Schneider et al. (2012) to transform
MNRAS 000, 000–000 (0000)
12 J. I. Read et al.
the Bolshoi halo mass function, derived for ΛCDM, to onein ΛWDM5:
dN
dM
∣∣∣∣WDM
=dN
dM
∣∣∣∣CDM
(1 +
Mhm
M
)−β(14)
where Mhm = 4/3πρcrit(λhm/2)3 is the ‘half mode mass’;β = 1.16; λhm is the ‘half mode’ scale length, given by:
λhm = 0.683(mWDM
keV
)−1.11(
ΩM
0.25
)0.11(h
0.7
)1.22
Mpch−1;
(15)mWDM is the warm dark matter particle mass in keV; ΩM isthe matter density of the Universe at redshift z = 0; and his the Hubble parameter (we assume the same cosmologicalparameters as in the Bolshoi simulation; see Table 1).
In Figure 4, we show tracks of M∗ −M200|abund inΛWDM for varying thermal relic mass over the range 1 <mWDM < 5 keV, as marked (green lines). Where these linesrely on the extrapolated SDSS stellar mass function, they aredashed. We deliberately pick the most conservative limits byusing the lower bound of the SDSS stellar mass function tocalculate M∗ −M200|abund.
As can be seen from Figure 4, without using the powerlaw extrapolation of the SDSS stellar mass function belowM∗ ∼ 107 M, we can rule out mWDM < 1.25 keV at 68%confidence. Using the power law extrapolation, this limitimproves to mWDM < 2 keV at 68% confidence. If we furtheradd the Leo T data point, then this tightens to mWDM <3 keV. However, for this limit to become robust we wouldneed to find many more Leo T-like galaxies in the LocalVolume, ideally with measured rotation curves. We discussthis further in §6.
Our limit on mWDM approaches the latest limits fromthe Lyman-α forest (e.g. Baur et al. 2015). It is competi-tive with a more model-dependent limit from Local Groupsatellite galaxies (e.g. Anderhalden et al. 2013) and a recentconstraint from the high redshift UV luminosity function(Menci et al. 2016). We discuss how our constraint will im-prove with a deeper stellar mass function and/or a completecensus of low-mass isolated dwarfs in §6.
5 There is a known problem in the literature with the formation
of spurious halos at the resolution limit in WDM simulations (e.g.Wang & White 2007; Hahn et al. 2013; Angulo et al. 2013; Lovell
et al. 2014; Hobbs et al. 2015). Equation 14 is derived from fits toN -body simulations where such spurious halos have been prunedfrom the analysis. We refer to it as describing an ‘effective warm
dark matter’ cosmology because it really describes a suppression
in the halo mass function at low mass, parameterised by an effec-tive thermal relic mass, mWDM. More realistic warm dark matter
models will show model-specific features in the small scale matterpower spectrum (see e.g. Boyarsky et al. 2009 for sterile neutrino
models). It is beyond the scope of this present work to test such
models in detail.
6 DISCUSSION
6.1 A shallower group stellar mass function belowM∗ ∼ 109 M
In §5.3, we argued that the stellar mass function is shal-lower in groups below M∗ ∼ 109 M. It has been noted al-ready in the literature that there are significant differencesin both the luminosity and stellar mass functions of galaxyclusters and field galaxies (e.g. Trentham 1998; Xia et al.2006; Bolzonella et al. 2010; Peng et al. 2010, 2012; Eckertet al. 2016). However, a similar such environmental depen-dence on group scales has proven more elusive. Using SDSSdata, Yang et al. (2009) found no difference between thestellar mass function in groups or the field. However, theywere only complete down to M∗ ∼ 109 M and so would nothave been able to detect the difference that we find here. Inprinciple, it should be possible to split the SDSS luminos-ity function in Blanton et al. (2005) into a group and fieldsample to test our findings, but this is beyond the scope ofthis present work. As we noted in §5.3, it is compelling thatGeha et al. (2012) report a field galaxy quenching mass scaleof M∗ = 109 M that depends on proximity to a larger hostgalaxy. This is precisely the stellar mass scale at which wecalculated that ram pressure stripping will become impor-tant (§5.3.2), and it is precisely the mass scale at which wefind a suppression in the group stellar mass function. Wewill explore these ideas further in future work.
6.2 The missing satellite problem and TBTF ingroups and the field
We have shown that abundance matching in ΛCDM is con-sistent with isolated dwarf galaxy rotation curves down toM200 ∼ 5 × 10⁹ M, and M200 ∼ 5 × 10⁸ M if we assumea power law extrapolation of the SDSS stellar mass func-tion. A direct corollary of this is that every single halo inthe field is occupied with a galaxy down to these limits and,furthermore, that their gas dynamics are consistent with thehalo that they live in. This means that there is no ‘missingsatellites’ or TBTF problem in the field down to these limits.
The above is interesting because both the missing satel-lites and TBTF problems occur in the Milky Way and An-dromeda satellite population below a mass scale ofMTBTF ∼1010 M (Read et al. 2006; Boylan-Kolchin et al. 2011;Tollerud et al. 2014). If there is no similar problem at thismass scale for isolated ‘field’ galaxies, then both problemsmust owe to some environmental effect. Indeed, a likely cul-prit is quenching due to ram pressure on infall to groups,as we have discussed already in §5.3.2. It is beyond thescope of this paper to determine whether or not such en-vironmental processes can fully solve the missing satellitesand TBTF problems inside groups. However, it is hard tounderstand how some change to the underlying cosmologi-cal model could act inside groups but not in the field. Forthis reason, we assert that both of these small scale puzzlesmust owe to ‘galaxy formation physics’, rather than exoticcosmology.
A final implication of the above result is that we expectsignificant scatter in M∗ for a given pre-infall M200 insidegroups. This means that, inside groups, classical ‘monotonic’abundance matching will fail (see also Ural et al. 2015; To-mozeiu et al. 2016). However, more sophisticated mappings
MNRAS 000, 000–000 (0000)

The stellar mass-halo mass relation of isolated field dwarfs 13
between dark and luminous subhalos that take account ofthe radial or orbit distribution of satellites could still work(e.g. Maccio et al. 2010; Lux et al. 2010; Anderhalden et al.2013). Similarly, it may be possible to build a working abun-dance matching model that simply introduces significantscatter in the M∗ −M200 relation below some stellar massscale (e.g. Garrison-Kimmel et al. 2017; Jethwa et al. 2016,and see Appendix C).
6.3 Comparison with other works
Our result that there is no missing satellites or TBTF prob-lem for field dIrrs is apparently at odds with Klypin et al.(2015) and Papastergis et al. (2015) who report a severeabundance/TBTF problem in the Local Volume. To arriveat this conclusion, both studies compare the distributionfunction of HI velocity line widths of a sample of Local Vol-ume galaxies with predictions from the Bolshoi simulation.However, this relies on being able to convert HI velocity linewidths to the peak rotation velocity of dark matter halos,vmax. Brook & Shankar (2016) have argued that this conver-sion is complex, particularly for dwarfs with vmax < 50 km/s.With reasonable assumptions, they find that they can rec-oncile ΛCDM with the data in Klypin et al. (2015) (andsee also Papastergis & Shankar 2016). Recently, however,Trujillo-Gomez et al. (2016) have revived the debate. Theytake similar care with the conversion from HI line widthsto vmax, accounting for ‘cusp-core’ transformations due tostellar feedback. Yet, they find that the Local Volume abun-dance problem persists. It is beyond the scope of this workto explore this further, but we note that if the stellar massfunction is shallower inside groups, then it is likely to besuppressed also on the ∼10 Mpc3 scale of the Local Volume.If this is the case, then Local Volume galaxies should lie onthe M∗ −M200|rot relation that we find here, but have astellar mass function that is shallower than SDSS.
Our results are also in tension with the higher redshiftstudy of Miller et al. (2014). They derive an M∗ −M200|rot
relation for galaxies over the redshift range 0.2 < z < 1,finding a significant offset from M∗ −M200|abund. However,due to the higher redshift of their galaxy sample, they haveonly a single measure of the rotational velocity at 2.2 discscale lengths. This is then extrapolated to the velocity at thevirial radius V200 via a weak lensing calibration at a stellarmass of log10[M∗/M] = 9.0. As highlighted by Miller et al.(2014), this could introduce a potentially large systematicerror. Furthermore, it is challenging with just a single mea-surement of the rotation velocity to identify ‘rogues’ (seeFigures A1, A2 and A3). We will explore the Miller et al.(2014) data further in future work.
More similar to our analysis here is the recent study ofPace (2016) (hereafter P16). They use the baryon-influencedmass models from Di Cintio et al. (2014) to fit rotationcurves and measure M200 and c for a large sample of dwarfsin the Little THINGS and THINGS surveys. Comparingtheir results with abundance matching predictions, similarlyto our analysis here, they arrive at the opposite conclusionthat ΛCDM is inconsistent with the data. Our analyses aresufficiently different that a detailed comparison is somewhatchallenging, but we note here three key differences that likelylead to this apparent discrepancy: (i) P16 use the LittleTHINGS and THINGS rotation curves, whereas we derive
the rotation curves using 3DBarolo (Iorio et al. 2016); (ii)P16 use the Di Cintio et al. (2014) model that does not showcusp-core transformations below M200 ∼ 1010 M, whereaswe use the coreNFW profile from R16a that does; and (iii)P16 primarily compare their results with M∗ −M200|abund
from Garrison-Kimmel et al. (2014), whereas we favourmatching the SDSS stellar mass function to the Bolshoi sim-ulation. The most significant of these is (iii). The Garrison-Kimmel et al. (2014) M∗ −M200|abund relation relies on Lo-cal Group galaxies. This is problematic since – as we arguedin §5.4 – classical abundance matching is expected to failinside groups. Indeed, using the RT05 group stellar massfunction, we derive an (erroneous) M∗ −M200|abund rela-tion that is remarkably similar to that derived in Garrison-Kimmel et al. (2014), and a similar relation derived in Brooket al. 2014 (see Appendix C).
A similar critique explains the apparent discrepancybetween our findings here and the earlier work of Ferreroet al. (2012). They find, in agreement with us, that galaxieswith stellar mass M∗ <∼ 3× 10⁷ M inhabit halos with massM200
<∼ 1010 M. However, they argue that this is at oddswith abundance matching in ΛCDM. Similarly to P16, thisis because they use a steep M∗ −M200|abund that is similarto our erroneous RT05 ‘group’ relation. Using the shallowerfield galaxy SDSS M∗ −M200|abund, the Ferrero et al. (2012)results are in good agreement with ours.
Finally, Katz et al. (2016) have recently compared theDi Cintio et al. (2014) model to data for 147 rotationcurves from the SPARC sample. Comparing their derivedM∗ −M200|rot relation with M∗ −M200|abund, they con-clude similarly to us here that ΛCDM works very well. Inthis case, there is no discrepancy. Katz et al. (2016) focus ongalaxies that are substantially more massive than those westudy here, with M200 > 1010 M. In this sense, the Katzet al. (2016) study is wholly complementary to ours thatfocusses on the regime M200 < 1010 M.
6.4 The interesting outlier DDO 154
As discussed in §5.2, our M∗ −M200|rot relation in Figure 3has one significant outlier, DDO 154. This galaxy also hasan unusually high HI gas mass fraction, with MHI/M∗ = 37.At its currently observed star formation rate of M∗ =3.82× 10⁻³ (Zhang et al. 2012), DDO 154 would move ontoour M∗ −M200|rot relation in ∼5.7 Gyrs. This is an inter-esting timescale. In ΛCDM, most major galaxy mergers arecomplete by redshift z = 1 some ∼8 Gyrs ago (e.g. Stewartet al. 2009). Thus, if post-merger isolated dwarfs look likeDDO 154, then most would have had time to deplete theirexcess HI gas and move onto the M∗ −M200|rot relation bytoday. A possible explanation for DDO 154, then, is thatit has just undergone a relatively rare late merger. We willexplore this idea further in future work.
6.5 How close is too close?
It is interesting to ask how close to the Milky Way satellitescan orbit before they become quenched. The Carina dwarfspheroidal is particularly interesting in this regard. Its or-bit remains highly uncertain due to its large proper motionerrors, but Lux et al. (2010) find that it seems to be substan-tially more circular than the mean of subhalos in a ΛCDM
MNRAS 000, 000–000 (0000)
14 J. I. Read et al.
pure dark matter simulation. With an apo-to-pericentre ra-tio of rp/ra = 0.3 − 0.7, it is also potentially more circularthan all of the other Milky Way dwarfs, except one: Fornax.Fornax is on a cosmologically unusual near circular orbit,with rp/ra ∼ 0.6 − 0.8 (Lux et al. 2010). Along with Ca-rina, it is the only other Milky Way dwarf spheroidal thathas continued to form stars for nearly a Hubble time (delPino et al. 2013). Such circularity may be the key to thesedwarfs’ ability to continue to form stars, lending further sup-port to the idea that quenching is driven primarily by rampressure. From equation 12, we can see that ram pressure isproportional to the satellite velocity at pericentre squared:v2p. Circular orbits minimise vp and will therefore also min-
imise the effect of ram pressure stripping. The fact that Ca-rina appears to lie on the M∗ −M200|rot relation of isolateddwarfs suggests that it has come just about as close to theMilky Way as possible while maintaining its ability to formstars. This may help to explain its puzzlingly unique starformation history (de Boer et al. 2014).
6.6 Implications for cusp-core transformations atlow stellar mass
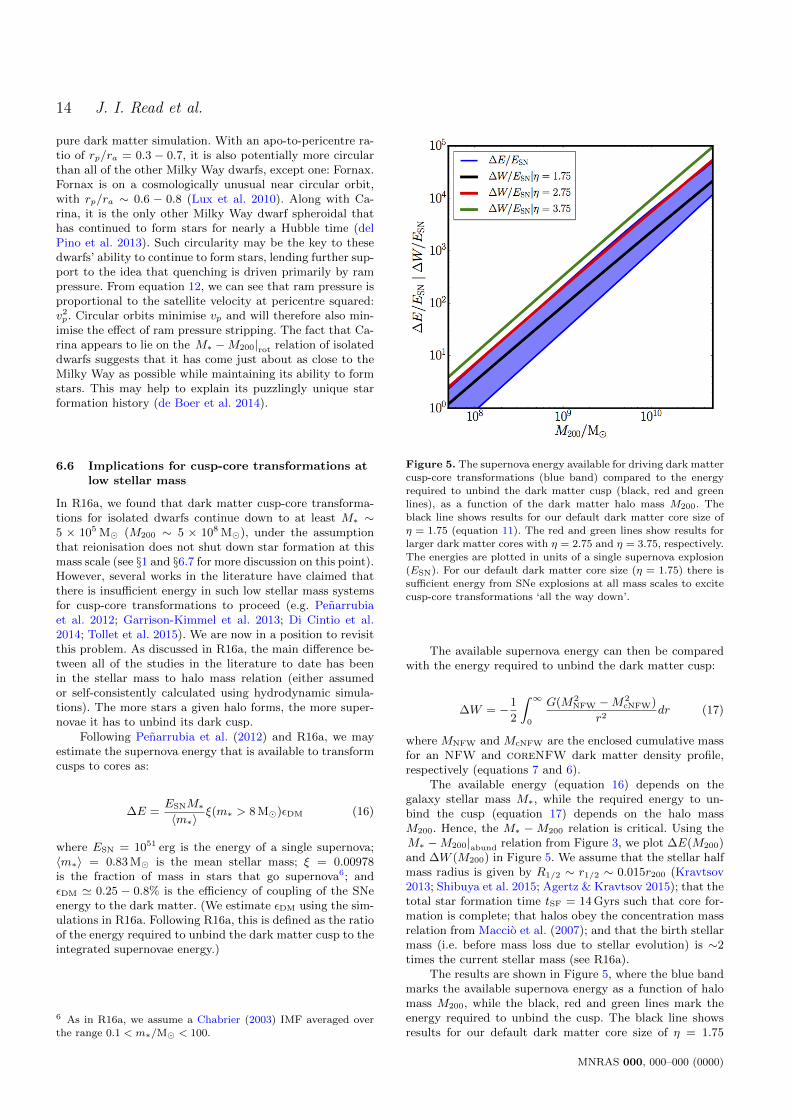
In R16a, we found that dark matter cusp-core transforma-tions for isolated dwarfs continue down to at least M∗ ∼5 × 10⁵ M (M200 ∼ 5 × 10⁸ M), under the assumptionthat reionisation does not shut down star formation at thismass scale (see §1 and §6.7 for more discussion on this point).However, several works in the literature have claimed thatthere is insufficient energy in such low stellar mass systemsfor cusp-core transformations to proceed (e.g. Penarrubiaet al. 2012; Garrison-Kimmel et al. 2013; Di Cintio et al.2014; Tollet et al. 2015). We are now in a position to revisitthis problem. As discussed in R16a, the main difference be-tween all of the studies in the literature to date has beenin the stellar mass to halo mass relation (either assumedor self-consistently calculated using hydrodynamic simula-tions). The more stars a given halo forms, the more super-novae it has to unbind its dark cusp.
Following Penarrubia et al. (2012) and R16a, we mayestimate the supernova energy that is available to transformcusps to cores as:
∆E =ESNM∗〈m∗〉
ξ(m∗ > 8 M)εDM (16)
where ESN = 1051 erg is the energy of a single supernova;〈m∗〉 = 0.83 M is the mean stellar mass; ξ = 0.00978is the fraction of mass in stars that go supernova6; andεDM ' 0.25 − 0.8% is the efficiency of coupling of the SNeenergy to the dark matter. (We estimate εDM using the sim-ulations in R16a. Following R16a, this is defined as the ratioof the energy required to unbind the dark matter cusp to theintegrated supernovae energy.)
6 As in R16a, we assume a Chabrier (2003) IMF averaged over
the range 0.1 < m∗/M < 100.
Figure 5. The supernova energy available for driving dark mattercusp-core transformations (blue band) compared to the energy
required to unbind the dark matter cusp (black, red and green
lines), as a function of the dark matter halo mass M200. Theblack line shows results for our default dark matter core size of
η = 1.75 (equation 11). The red and green lines show results for
larger dark matter cores with η = 2.75 and η = 3.75, respectively.The energies are plotted in units of a single supernova explosion
(ESN). For our default dark matter core size (η = 1.75) there issufficient energy from SNe explosions at all mass scales to excite
cusp-core transformations ‘all the way down’.
The available supernova energy can then be comparedwith the energy required to unbind the dark matter cusp:
∆W = −1
2
∫ ∞0
G(M2NFW −M2
cNFW)
r2dr (17)
where MNFW and McNFW are the enclosed cumulative massfor an NFW and coreNFW dark matter density profile,respectively (equations 7 and 6).
The available energy (equation 16) depends on thegalaxy stellar mass M∗, while the required energy to un-bind the cusp (equation 17) depends on the halo massM200. Hence, the M∗ −M200 relation is critical. Using theM∗ −M200|abund relation from Figure 3, we plot ∆E(M200)and ∆W (M200) in Figure 5. We assume that the stellar halfmass radius is given by R1/2 ∼ r1/2 ∼ 0.015r200 (Kravtsov2013; Shibuya et al. 2015; Agertz & Kravtsov 2015); that thetotal star formation time tSF = 14 Gyrs such that core for-mation is complete; that halos obey the concentration massrelation from Maccio et al. (2007); and that the birth stellarmass (i.e. before mass loss due to stellar evolution) is ∼2times the current stellar mass (see R16a).
The results are shown in Figure 5, where the blue bandmarks the available supernova energy as a function of halomass M200, while the black, red and green lines mark theenergy required to unbind the cusp. The black line showsresults for our default dark matter core size of η = 1.75
MNRAS 000, 000–000 (0000)
The stellar mass-halo mass relation of isolated field dwarfs 15
(equation 11). The red and green lines show results for largerdark matter cores with η = 2.75 and η = 3.75, respectively.As can be seen, there is sufficient energy to unbind a darkmatter cusp ‘all the way down’ for η < 2.75, but insufficientenergy to build larger cores than this.
These results support our assertion in R16a that darkmatter cores can form ‘all the way down’. However, thisis only energetically possible if isolated low mass halos arelargely unaffected by reionisation. We discuss this, next.
6.7 But what about reionisation?
Our results suggest that all field dark matter halos are oc-cupied with galaxies down to M200 ∼ 5× 10⁸ M (if we as-sume a power law extrapolation of the SDSS stellar massfunction). Indeed, Leo T – which appears to sit at thismass scale – has formed stars continuously at a rate of just∼ 10−5 M yr−1 for a Hubble time (Weisz et al. 2012b). IfLeo T does inhabit such a low mass halo, then a corollary ofthis is that reionisation does not appear to suppress galaxyformation above Mreion ∼ 5 × 10⁸ M. This is in excellentagreement with recent models by Gnedin & Kaurov (2014),but at tension with other simulations that favour a substan-tially higher Mreion
>∼ 3× 10⁹ M (e.g. Simpson et al. 2013;Wheeler et al. 2015; Ocvirk et al. 2015; Sawala et al. 2016a;Fitts et al. 2016).
The above tension is not necessarily a cause for con-cern. There is a least a factor 2 − 4 uncertainty in the fluxof ionising photons at high redshift, with galaxies being thedominant ionising source at z & 3 and quasars dominat-ing at lower redshifts (e.g. Haardt & Madau 2012). Largevolume simulations are required to capture these photonsources correctly. These require very high spatial resolutionand accurate ray propagation to model self shielding effectsand to correctly predict the photon escape fraction, fesc (e.g.Gnedin 2016). In particular, Kimm & Cen (2014) found, us-ing high resolution simulations of galaxies forming in haloeswith virial masses ∼108 − 1010M at z & 7, that fesc fluc-tuates by orders of magnitude over a dynamical time dueto stellar feedback (and see also Trebitsch et al. 2015). Nu-merical resolution is also important. Bland-Hawthorn et al.(2015) find that reionisation blows out far more gas in lowresolution simulations as compared to higher resolution sim-ulations that better-capture dense gas. Finally, it is impor-tant to include all of the important physics. Ricotti (2009)highlight the importance of adiabatic cooling due to the ex-pansion of the Universe; while Vandenbroucke et al. (2016)suggest that additional feedback due to Population III starscould reduce early star formation and feedback, leading toless hot diffuse gas and less reionisation-driven gas blow out.It is beyond the scope of this present work to explore theseideas in more detail. We simply note here that at presentthere is no cause for concern if Leo T inhabits a dark mat-ter halo of mass M200 ∼ 5× 10⁸ M.
6.8 Implications for near-field cosmology
Our results allow us to make several concrete predictions forupcoming near-field cosmology surveys:
• Firstly, assuming that ΛCDM is correct, we predict thatthe stellar mass function of field galaxies should continue as
an unbroken power law with slope α ∼ 1.6, at least over themass range 105 < M∗/M < 107. Testing this will requirelarge volume surveys like SDSS to avoid contamination fromgroups.• Secondly, below M∗ ∼ 105 M, we may see the first
signs of star formation truncation due to reionisation.The smoking gun for this would be an extremely isolatedquenched dwarf. However, as discussed in Geha et al. (2012),to be classified as ‘extremely isolated’ it would need to befound >∼ 4 virial radii away from any nearby larger galaxy.• Thirdly, our results imply that there should be many
galaxies like Leo T on the outskirts of the Milky Way andAndromeda just waiting to be found. Extrapolating theBolshoi mass function to low mass, we predict that thereshould be ∼2000 galaxies like Leo T in a typical 10 Mpc3
volume, with halo mass 5 × 10⁸ < M200/M < 109; stel-lar mass ∼2 × 10⁵ < M∗/M < 6 × 10⁵; and HI gas mass∼3× 10⁵ < MHI/M < 3× 10⁶. In practice, this will be anupper bound because many of these ‘Leo T’-like dIrrs willhave been ram pressure stripped by a nearby host galaxy.Nonetheless, it is tantalising that Leo T lies right on theedge of the SDSS survey footprint (Koposov et al. 2009).Any closer to the Milky Way and Leo T would have beenstripped of its gas, similarly to the recently discovered Eri-danus II galaxy (Crnojevic et al. 2016). Any further away,and it would have been too faint to be seen. Indeed, Jameset al. (2016) have recently discovered a slew of new starforming dIrrs in the Local Volume. These may be the tip ofthe iceberg.
Finally, we note that the comparison betweenM∗ −M200|abund and M∗ −M200|rot shows great promisefor constraining mWDM if we can reach down to Leo T massgalaxies and below. This suggests that it is worth the ef-fort of attempting to model the Local Group at the fidelityof the simulations presented in R16a, despite the compu-tational challenges that this presents. At least some of the‘ultra-faint’ dwarfs that have already been found orbitingthe Milky Way and Andromeda are likely even less massivethan Leo T (e.g. Kirby et al. 2013a), holding the promise ofproviding unparalleled constraints on mWDM and/or othercosmologies that suppress small scale power.
7 CONCLUSIONS
We have presented a clean probe of cosmology on smallscales that follows from the comparison of M∗ −M200|rot,measured from the rotation curves of isolated dwarf galax-ies in the field, and M∗ −M200|abund calculated from abun-dance matching (see §2). These should agree if the cosmo-logical model is correct, but will diverge if the halo massfunction is too shallow or steep on small scales. Our probeis comparatively clean since it relies only on the followingtheory ingredients: (i) a monotonic relation between stel-lar mass and halo mass; (ii) a predicted dark matter halomass function; and (iii) a robust prediction of the internaldark matter distribution in dwarf irregular galaxies, for agiven cosmological model. The first of these can be empir-ically tested using M∗ −M200|rot; while (ii) and (iii) arereadily obtained from state-of-the art numerical simulations(see §2).
Our key results are as follows:
MNRAS 000, 000–000 (0000)
16 J. I. Read et al.
• We fit the rotation curves of a carefully selected sampleof 19 isolated dIrr galaxies. Of these, five were found to beof too low inclination to be reliably inclination corrected(‘inclination rogues’); another two (DDO 216 and NGC1569) showed clear signs of disequilibrium (‘disequilibriumrogues’); while one (DDO 101) had a very large distance un-certainty (‘distance rogues’). For the remaining 11 dIrrs, wefound that an NFW dark matter halo profile is ruled outat > 99% confidence, reaffirming the well known ‘cusp-core’problem. By contrast, the coreNFW profile from R16a –that accounts for cusp-core transformations due to stellarfeedback – gives an excellent fit in all cases, without intro-ducing any more free parameters than the NFW form.• Although we required the coreNFW profile to obtain
a good fit to the rotation curve shape, we showed that theimplied dark matter halo mass M200 was not sensitive tothe form of the dark matter density profile within r <∼ R1/2.For this reason, we were able to robustly measure the stellarmass-halo mass relation M∗ −M200|rot over the mass range5× 105 <∼M∗/M <∼ 108, finding a monotonic relation withlittle scatter.• Such monotonicity implies that abundance match-
ing should yield a M∗ −M200|abund relation that matchesM∗ −M200|rot, if the cosmological model is correct. Usingthe ‘field galaxy’ stellar mass function from the Sloan Digi-tal Sky Survey (SDSS) and the halo mass function from theΛCDM Bolshoi simulation, we found remarkable agreementbetween the two. This held down to M200 ∼ 5×10⁹ M, andto M200 ∼ 5×10⁸ M if we assumed a power law extrapola-tion of the SDSS stellar mass function below M∗ ∼ 107 M.• The good agreement between M∗ −M200|rot and
M∗ −M200|abund means that there is no ‘missing satellites’or TBTF problem for our sample of isolated dIrrs down toat least M200 ∼ 5 × 10⁹ M. This is lower than the massscale at which the ‘missing satellites’ and TBTF problemsmanifest in the Local Group, MTBTF ∼ 1010 M (e.g. Readet al. 2006; Boylan-Kolchin et al. 2011; Tollerud et al. 2014).This suggests that both problems depend on environmentand therefore owe to ‘galaxy formation physics’ rather thanexotic cosmology.• Compiling stellar mass functions from the literature, we
showed that the group stellar mass function is substantiallyshallower than the field belowM∗ ∼ 109 M. We argued thatthis likely owes to ram pressure stripping on group infall.This induces a significant scatter in M∗ for a given pre-infallM200 causing classical abundance matching to fail.• We considered how well a Λ Warm Dark Matter
(ΛWDM) cosmology can fit M∗ −M200|rot. Repeating ourabundance matching using the SDSS field stellar mass func-tion, we showed that ΛWDM fails at 68% confidence fora thermal relic mass of mWDM < 1.25 keV, and mWDM <2 keV if we used the power law extrapolation of the SDSSstellar mass function.• If ΛCDM is correct, we predict that the stellar mass
function of galaxies should continue as an unbroken powerlaw with slope α ∼ 1.6, at least over the mass range 105 <M∗/M < 107. There should be ∼2000 galaxies like LeoT in a typical 10 Mpc3 volume, with halo mass 5 × 10⁸ <M200/M < 109; stellar mass ∼2×10⁵ < M∗/M < 6×10⁵;and HI gas mass ∼3 × 10⁵ < MHI/M < 3 × 10⁶. Belowthis mass scale, we may see the first signs of star formationsuppression due to reionisation.
8 ACKNOWLEDGEMENTS
JIR and OA would like to acknowledge support fromSTFC consolidated grant ST/M000990/1. JIR ac-knowledges support from the MERAC foundation. OAwould like to acknowledge support from the SwedishResearch Council (grant 2014-5791). This researchmade use of APLpy, an open-source plotting pack-age for Python hosted at http://aplpy.github.com.This work used PyNbody for the simulation analysis(https://github.com/pynbody/pynbody; Pontzen et al.2013). All simulations were run on the Surrey GalaxyFactory. We would like to thank Se-Heon Oh and LittleTHINGS for kindly making their data public, and Erwinde Blok for providing the data for NGC 6822. We wouldlike to thank Andrew Pontzen, Julio Navarro, Kyle Oman,Peter Behroozi and Annika Peter for useful discussions.We would like to thank the anonymous referee for usefulcomments that improved the clarity of this work.
APPENDIX A: THE ROTATION CURVE FITS
In this Appendix, we show the rotation curves and modelfits for all of the galaxies listed in Table 2. In Figures A1 andA2, we show all of the galaxies that we include in Figure 3; inFigure A3, we show all of the ‘rogues’ that we exclude fromfurther analysis. The rogues fall into three categories: ‘in-clination’ (i-Rogues); ‘disequilibrium’ (Diseq. Rogues); and‘distance’ (D-Rogues), as marked (see §4.4). The first classof these three have uncertain inclination, with ifit < 40.The second class show signs of disequilibrium, either in theform of significant fast-expanding HI bubbles (see Table 2),or – as is the case for Pegasus – because we only have datafor the inner rotation curve inside R1/2. This inner region isparticularly susceptible to disequilibrium effects from bothsupernova-driven HI holes and non-circular motions. (Thiscan be seen, for example, in the inner rotation curves ofNGC 6822 and DDO 126 that are otherwise both in our‘clean’ sample.) The third class (which contains only DDO101) have very uncertain distance D (see R16b for a detaileddiscussion of this galaxy). The individual galaxies are dis-cussed in more detail in Iorio et al. (2016) where we presentthe full details of our rotation curve derivation, including acomparison with the rotation curves from Little THINGS.
APPENDIX B: TESTING THE ROBUSTNESSOF OUR M∗ −M200|rot RELATION
In this Appendix, we explore how robust our M∗ −M200|rot
relation is to key assumptions in our methodology. In FigureB1, left panel, we show our M∗ −M200|rot relation includingthe i-Rogues (blue data points) and D-Rogue (magenta datapoints). Recall that for the i-Rogues, we marginalise overthe inclination angle with a flat prior over the range 0 <i < 40 (see §4). In most cases, this significantly inflates theuncertainties. However, DDO 133 has sufficiently good datathat – under the assumption of a coreNFW dark matterprofile – its rotation curve shape is sufficient to provide ameasurement of i (see Figure A3 and Table 2).
As can be seen in Figure B1, left panel, including thei-Rogues introduces substantially more scatter about the
MNRAS 000, 000–000 (0000)

The stellar mass-halo mass relation of isolated field dwarfs 17
Figure A1. Rotation curve data (red data points) and models for our sample of ‘clean’ dIrr galaxies (see Table 2). The black contours
show the median (black), 68% (dark grey) and 95% (light grey) confidence intervals of our fitted coreNFW rotation curve models (see
§4.2). The vertical green dashed line shows the projected stellar half light radius R1/2. The thin vertical black line marks the inner datapoint used for the fit, Rmin (where this is not marked Rmin = 0). The blue and green lines show the rotation curve contribution from
stars and gas, respectively.
M∗ −M200|rot relation, but no more than is expected giventheir larger uncertainties onM200. Thus, the i-Rogues do notsubstantially alter our key results and conclusions. We do,however, find an additional outlier, DDO 50, that appearsto have a very high M∗ for its M200, even when marginalis-ing over i. As can be seen in Figure A3, however, DDO 50has an unusual rotation curve with prominent wiggles outto large radii. This makes it challenging to inclination cor-rect. Indeed, from a stability analysis, Sanchez-Salcedo et al.
(2014) argue for an inclination for DDO 50 of i = 27 thatis substantially smaller than the ∼37 that we find here (seeTable 2). This lower inclination would be sufficient to pushDDO 50 onto the M∗ −M200|rot relation.
Our one D-Rogue – DDO 101 – is marked on Figure B1,left panel, by the magenta data points. Since the distance forthis galaxy is highly uncertain (see the discussion in R16b),we plot two points for DDDO101 = 6.4 Mpc and DDDO101 =12.9 Mpc. As can be seen, these straddle the M∗ −M200|rot
MNRAS 000, 000–000 (0000)

18 J. I. Read et al.
Figure A2. Continuation of Figure A1.
relation. Thus, our D-Rogue does not affect our key resultsand conclusions either.
Finally, we consider the effect of allowing the dark mat-ter core size to freely vary by performing our rotation curvefits assuming a flat prior on η (equation 11) over the range0 < η < 2.75. (The upper bound on η is set by the energeticarguments in §6.6. There, we showed that the integrated su-pernova energy is not sufficient to build cores larger than∼2.75R1/2; see Figure 5.) The results for M∗ −M200|rot areshown in Figure B1, middle panel; while Figure B1, rightpanel, shows the marginalised η parameters for each galaxythat result from this fit, including the i-Rogues (blue datapoints) and D-Rogue (magenta data points). The horizontalblack line marks our default η = 1.75.
From Figure B1, middle panel, we see that allowing ηto vary increases our errors on M200 but does not otherwiseaffect our key results or conclusions. This is consistent withour findings in §5.1, where we showed that fitting an NFWprofile to the rotation curves gives a poorer fit, but doesnot significantly alter the derived M200 within our quoteduncertainties. Finally, from the rightmost panel of FigureB1, we can see that we do not obtain very strong constraintson η, similarly to our findings for WLM in R16b. The dataare consistent with our default η = 1.75, with perhaps ahint that the more massive galaxies (with M200
>∼ 1010 M)favour a slightly larger core. For our sample of ‘clean’ dIrrs(purple data points), we can definitively rule out a cusp(η = 0) at greater than 99% confidence.
APPENDIX C: COMPARISON WITH OTHERABUNDANCE MATCHING WORK IN THELITERATURE
In this Appendix, we compare our abundance matchingcurves in Figure 3 with other determinations in the literaturefrom Moster et al. (2010); Brook et al. (2014); and Garrison-Kimmel et al. (2014) (G-K14). Moster et al. (2010) performa parametric ‘classical’ abundance matching of SDSS galax-ies in ΛCDM down to M200 ∼ 3×10¹⁰ M. Below this massscale, the extrapolation of the Moster et al. (2010) relationdiverges from our abundance matching curve shown in blue.However, this extrapolation is not supported by the latest
data from SDSS. Over the mass range 7×10⁹ < M200/M <3 × 10¹⁰, our relation (that is based on deeper SDSS datathan Moster et al. 2010; see Behroozi et al. 2010, 2013) di-verges significantly from the Moster et al. (2010) extrapola-tion, suggesting that the Moster et al. (2010) relation shouldnot be used below M200 ∼ 3× 10¹⁰ M.
Brook et al. (2014) (black data points) and Garrison-Kimmel et al. (2014) (G-K14; solid black line) reach to muchlower stellar mass than SDSS by using constrained simula-tions of the Local Volume in ΛCDM abundance-matched toLocal Group galaxies. In this sense, they are both similar toabundance matching with the group stellar mass functionof RT05. In particular, both studies – like our RT05 anal-ysis – rely on the assumption that the Local Group satel-lites have a monotonic relation between stellar mass andhalo mass. Thus, it is perhaps not surprising that Brooket al. (2014), Garrison-Kimmel et al. (2014) and RT05 allagree within their 95% confidence intervals. All three aresubstantially steeper than the SDSS abundance matchingcurve (blue). We argued in §5.4 and §6.2 that the assump-tion of monotonicity is expected to break down inside groups(see also Ural et al. 2015). Indeed, the poor correspondencebetween the group abundance matching M∗ −M200|abund
and M∗ −M200|rot is evidence for this. Thus, we concludethat, similarly to our RT05 abundance matching relation,the G-K14 and Brook et al. (2014) relations are likely flaweddue to the erroneous assumption of monotonicity.
Finally, Garrison-Kimmel et al. (2017) explore relaxingthe monotonicity assumption for Local Group galaxies byadding significant scatter to the stellar mass-halo mass re-lation below some stellar mass scale. They show that thiscauses M∗ −M200|abund to steepen, consistent with the ap-parently steeper group M∗ −M200|abund relation that wefind here. Adding such scatter to classical abundance match-ing is a promising avenue for probing ΛCDM in group en-vironments, as has been demonstrated recently by Jethwaet al. (2016).
REFERENCES
Agertz O., Kravtsov A. V., 2015, ArXiv e-prints: 1509.00853,
MNRAS 000, 000–000 (0000)

The stellar mass-halo mass relation of isolated field dwarfs 19
Figure A3. Rotation curve data and models for our ‘rogue’ dIrr galaxies (see Table 2). The lines and symbols are as in Figure A1. The
rogue galaxies fall into three categories: ‘inclination’ (i-Rogues); ‘disequilibrium’ (Diseq. Rogues); and ‘distance’ (D-Rogues), as marked.
Anderhalden D., Schneider A., Maccio A. V., Diemand J.,Bertone G., 2013, JCAP, 3, 014
Angulo R. E., Hahn O., Abel T., 2013, MNRAS, 434, 3337
Ashley T., Simpson C. E., Elmegreen B. G., 2013, AJ, 146, 42
Avila-Reese V., Colın P., Valenzuela O., D’Onghia E., Firmani
C., 2001, ApJ, 559, 516
Baldry I. K., Glazebrook K., Driver S. P., 2008, MNRAS, 388,
945
Baldry I. K., et al., 2012, MNRAS, 421, 621
Barnard E. E., 1884, Astronomische Nachrichten, 110, 125
Baugh C. M., 2006, Reports on Progress in Physics, 69, 3101
Baur J., Palanque-Delabrouille N., Yeche C., Magneville C., Viel
M., 2015, preprint, (arXiv:1512.01981)
Behroozi P. S., Conroy C., Wechsler R. H., 2010, ApJ, 717, 379
Behroozi P. S., Wechsler R. H., Conroy C., 2013, ApJ, 770, 57
Bigiel F., et al., 2011, ApJ, 730, L13
Binney J., Tremaine S., 2008, Galactic dynamics. Prince-ton, NJ, Princeton University Press, 2008, 747 p.,http://adsabs.harvard.edu/cgi-bin/nph-bib_query?
bibcode=1987gady.book.....B&db_key=AST
Blake C., Glazebrook K., 2003, ApJ, 594, 665
Bland-Hawthorn J., Sutherland R., Webster D., 2015, ApJ, 807,154
Blandford R. D., Saust A. B., Brainerd T. G., Villumsen J. V.,
MNRAS 000, 000–000 (0000)

20 J. I. Read et al.
Figure B1. Testing the robustness of our M∗ −M200|rot relation. In the left panel, we show M∗ −M200|rot including the i-Rogues(blue data points) and D-Rogue (magenta data points); the lines and symbols are as in Figure 3. In the middle panel, we show the same
but now marginalising over the dark matter core size, using a flat prior on 0 < η < 2.75 (see equation 11). In the right panel, we show
the marginalised η parameters for each galaxy that result from this fit, including the i-Rogues (blue data points) and D-Rogue (magentadata points). The horizontal black line marks our default η = 1.75.
Figure C1. A comparison of different abundance matchingcurves from the literature. The lines and symbols are as in Fig-
ure 3, but we include abundance matching curves from Mosteret al. (2010) (green); Brook et al. (2014) (black data points); andGarrison-Kimmel et al. (2014) (G-K14; black solid line).
1991, MNRAS, 251, 600
Blanton M. R., et al., 2001, AJ, 121, 2358
Blanton M. R., et al., 2003, ApJ, 592, 819
Blanton M. R., Lupton R. H., Schlegel D. J., Strauss M. A.,
Brinkmann J., Fukugita M., Loveday J., 2005, ApJ, 631, 208
Bode P., Ostriker J. P., Turok N., 2001, ApJ, 556, 93
Bolzonella M., et al., 2010, A&A, 524, A76
Boyarsky A., Lesgourgues J., Ruchayskiy O., Viel M., 2009,
JCAP, 5, 12
Boylan-Kolchin M., Bullock J. S., Kaplinghat M., 2011, MNRAS,
415, L40
Brook C. B., Shankar F., 2016, MNRAS, 455, 3841
Brook C. B., Di Cintio A., Knebe A., Gottlober S., Hoffman Y.,
Yepes G., Garrison-Kimmel S., 2014, ApJ, 784, L14
Brooks A. M., Kuhlen M., Zolotov A., Hooper D., 2013, ApJ, 765,
22
Cacciato M., van den Bosch F. C., More S., Li R., Mo H. J., YangX., 2009, MNRAS, 394, 929
Carollo C. M., et al., 2013, ApJ, 776, 71
Chabrier G., 2003, PASP, 115, 763
Chan T. K., Keres D., Onorbe J., Hopkins P. F., Muratov A. L.,Faucher-Giguere C.-A., Quataert E., 2015, MNRAS, 454, 2981
Crnojevic D., Sand D. J., Zaritsky D., Spekkens K., Willman B.,
Hargis J. R., 2016, ApJ, 824, L14
Crocce M., et al., 2016, MNRAS, 455, 4301
Croft R. A. C., Weinberg D. H., Katz N., Hernquist L., 1998,ApJ, 495, 44
D’Onghia E., Springel V., Hernquist L., Keres D., 2010, ApJ, 709,
1138
Dawson K. S., et al., 2013, AJ, 145, 10
Dehnen W., Read J. I., 2011, European Physical Journal Plus,126, 55
Di Cintio A., Brook C. B., Dutton A. A., Maccio A. V., Stinson
G. S., Knebe A., 2014, MNRAS, 441, 2986
Di Teodoro E. M., Fraternali F., 2015, MNRAS, 451, 3021
Diemand J., Kuhlen M., Madau P., 2007, ApJ, 667, 859
Driver S. P., et al., 2011, MNRAS, 413, 971
Eckert K. D., Kannappan S. J., Stark D. V., Moffett A. J., BerlindA. A., Norris M. A., 2016, preprint, (arXiv:1604.03957)
Eisenstein D. J., et al., 2005, ApJ, 633, 560
El-Badry K., Wetzel A. R., Geha M., Quataert E., Hopkins P. F.,Keres D., Chan T. K., Faucher-Giguere C.-A., 2016, preprint,
(arXiv:1610.04232)
Elbert O. D., Bullock J. S., Garrison-Kimmel S., Rocha M.,
Onorbe J., Peter A. H. G., 2014, preprint, (arXiv:1412.1477)
Ferrero I., Abadi M. G., Navarro J. F., Sales L. V., Gurovich S.,2012, MNRAS, 425, 2817
Finoguenov A., et al., 2007, ApJS, 172, 182
Fitts A., et al., 2016, preprint, (arXiv:1611.02281)
Flores R. A., Primack J. R., 1994, ApJ, 427, L1
Foreman-Mackey D., Hogg D. W., Lang D., Goodman J., 2013,
PASP, 125, 306
MNRAS 000, 000–000 (0000)

The stellar mass-halo mass relation of isolated field dwarfs 21
Fu L., et al., 2014, MNRAS, 441, 2725
Garrison-Kimmel S., Rocha M., Boylan-Kolchin M., Bullock J. S.,
Lally J., 2013, MNRAS, 433, 3539
Garrison-Kimmel S., Boylan-Kolchin M., Bullock J. S., Kirby
E. N., 2014, MNRAS, 444, 222
Garrison-Kimmel S., Bullock J. S., Boylan-Kolchin M., BardwellE., 2017, MNRAS, 464, 3108
Gatto A., Fraternali F., Read J. I., Marinacci F., Lux H., Walch
S., 2013, MNRAS, 433, 2749
Geha M., Blanton M. R., Yan R., Tinker J. L., 2012, ApJ, 757,
85
Giodini S., et al., 2012, A&A, 538, A104
Gnedin N. Y., 2016, preprint, (arXiv:1601.05802)
Gnedin N. Y., Kaurov A. A., 2014, ApJ, 793, 30
Gnedin O. Y., Zhao H., 2002, MNRAS, 333, 299
Gorski M., Pietrzynski G., Gieren W., 2011, AJ, 141, 194
Grebel E. K., Gallagher J. S., Harbeck D., 2003, AJ, 125, 1926
Haardt F., Madau P., 2012, ApJ, 746, 125
Hague P. R., Wilkinson M. I., 2013, MNRAS, 433, 2314
Hahn O., Abel T., Kaehler R., 2013, MNRAS, 434, 1171
Haynes M. P., Giovanelli R., Chincarini G. L., 1984, ARA&A, 22,
445
Hobbs A., Read J., Agertz O., Iannuzzi F., Power C., 2015,
preprint, (arXiv:1503.02689)
Iorio G., Fraternali F., Nipoti C., Di Teodoro E., Read J. I.,Battaglia G., 2016, preprint, (arXiv:1611.03865)
Irwin M., Hatzidimitriou D., 1995, MNRAS, 277, 1354
James B. L., Koposov S. E., Stark D. P., Belokurov V., Pet-
tini M., Olszewski E. W., McQuinn K. B. W., 2016, preprint,
(arXiv:1611.05888)
Jethwa P., Belokurov V., Erkal D., 2016, preprint,(arXiv:1612.07834)
Johnson M., Hunter D. A., Oh S.-H., Zhang H.-X., Elmegreen B.,
Brinks E., Tollerud E., Herrmann K., 2012, AJ, 144, 152
Katz H., Lelli F., McGaugh S. S., Di Cintio A., Brook C. B.,
Schombert J. M., 2016, preprint, (arXiv:1605.05971)
Kauffmann G., 2014, MNRAS, 441, 2717
Kazantzidis S., Lokas E. L., Mayer L., 2013, ApJ, 764, L29
Kepley A. A., Wilcots E. M., Hunter D. A., Nordgren T., 2007,
AJ, 133, 2242
Kimm T., Cen R., 2014, ApJ, 788, 121
Kirby E. N., Boylan-Kolchin M., Cohen J. G., Geha M., BullockJ. S., Kaplinghat M., 2013a, ApJ, 770, 16
Kirby E. N., Cohen J. G., Guhathakurta P., Cheng L., Bullock
J. S., Gallazzi A., 2013b, ApJ, 779, 102
Klypin A., Kravtsov A. V., Valenzuela O., Prada F., 1999, ApJ,
522, 82
Klypin A. A., Trujillo-Gomez S., Primack J., 2011, ApJ, 740, 102
Klypin A., Karachentsev I., Makarov D., Nasonova O., 2015, MN-
RAS, 454, 1798
Koposov S. E., Yoo J., Rix H.-W., Weinberg D. H., Maccio A. V.,Escude J. M., 2009, ApJ, 696, 2179
Kravtsov A. V., 2013, ApJ, 764, L31
Kuzio de Naray R., Kaufmann T., 2011, MNRAS, 414, 3617
Leaman R., et al., 2012, ApJ, 750, 33
Lelli F., Verheijen M., Fraternali F., 2014, A&A, 566, A71
Lilly S. J., et al., 2007, ApJS, 172, 70
Lokas E. L., Kazantzidis S., Mayer L., 2012, ApJ, 751, L15
Lovell M. R., Frenk C. S., Eke V. R., Jenkins A., Gao L., TheunsT., 2014, MNRAS, 439, 300
Lux H., Read J. I., Lake G., 2010, MNRAS, 406, 2312
Maccio A. V., Dutton A. A., van den Bosch F. C., Moore B.,
Potter D., Stadel J., 2007, MNRAS, 378, 55
Maccio A. V., Kang X., Fontanot F., Somerville R. S., Koposov
S., Monaco P., 2010, MNRAS, 402, 1995
Madau P., Shen S., Governato F., 2014, ApJ, 789, L17
Makarov D., Karachentsev I., 2011, MNRAS, 412, 2498
Makarova L., 1999, A&AS, 139, 491
Martin N. F., de Jong J. T. A., Rix H.-W., 2008, ApJ, 684, 1075
Mateo M. L., 1998, ARA&A, 36, 435
Mayer L., Governato F., Colpi M., Moore B., Quinn T., Wadsley
J., Stadel J., Lake G., 2001a, ApJ, 547, L123
Mayer L., Governato F., Colpi M., Moore B., Quinn T., Wadsley
J., Stadel J., Lake G., 2001b, ApJ, 559, 754
McConnachie A. W., 2012, AJ, 144, 4
McQuinn K. B. W., et al., 2010, ApJ, 721, 297
McQuinn K. B. W., Lelli F., Skillman E. D., Dolphin A. E., Mc-Gaugh S. S., Williams B. F., 2015, MNRAS, 450, 3886
Menci N., Grazian A., Castellano M., Sanchez N. G., 2016, ApJ,825, L1
Miller S. H., Ellis R. S., Newman A. B., Benson A., 2014, ApJ,
782, 115
Moore B., 1994, Nature, 370, 629
Moore B., Ghigna S., Governato F., Lake G., Quinn T., StadelJ., Tozzi P., 1999, ApJ, 524, L19
Moster B. P., Somerville R. S., Maulbetsch C., van den Bosch
F. C., Maccio A. V., Naab T., Oser L., 2010, ApJ, 710, 903
Munoz R. R., et al., 2006, ApJ, 649, 201
Navarro J. F., Eke V. R., Frenk C. S., 1996a, MNRAS, 283, L72
Navarro J. F., Frenk C. S., White S. D. M., 1996b, ApJ, 462, 563
Onorbe J., Boylan-Kolchin M., Bullock J. S., Hopkins P. F., KeresD., Faucher-Giguere C.-A., Quataert E., Murray N., 2015,
preprint, (arXiv:1502.02036)
Ocvirk P., et al., 2015, preprint, (arXiv:1511.00011)
Oh S.-H., Brook C., Governato F., Brinks E., Mayer L., de Blok
W. J. G., Brooks A., Walter F., 2011, AJ, 142, 24
Oh S.-H., et al., 2015, AJ, 149, 180
Pace A. B., 2016, preprint, (arXiv:1605.05326)
Papastergis E., Shankar F., 2016, A&A, 591, A58
Papastergis E., Giovanelli R., Haynes M. P., Shankar F., 2015,A&A, 574, A113
Penarrubia J., Benson A. J., Walker M. G., Gilmore G., Mc-
Connachie A. W., Mayer L., 2010, MNRAS, 406, 1290
Penarrubia J., Pontzen A., Walker M. G., Koposov S. E., 2012,
ApJ, 759, L42
Penarrubia J., Gomez F. A., Besla G., Erkal D., Ma Y.-Z., 2016,
MNRAS, 456, L54
Peacock J. A., 1999, Cosmological physics. Cosmologicalphysics. Publisher: Cambridge, UK: Cambridge University
Press, 1999. ISBN: 0521422701
Peng Y.-j., et al., 2010, ApJ, 721, 193
Peng Y.-j., Lilly S. J., Renzini A., Carollo M., 2012, ApJ, 757, 4
Planck Collaboration et al., 2013, preprint, (arXiv:1303.5076)
Pontzen A., Governato F., 2012, MNRAS, 421, 3464
Pontzen A., Governato F., 2014, Nature, 506, 171
Pontzen A., Roskar R., Stinson G., Woods R., 2013, pynbody:
N-Body/SPH analysis for python, Astrophysics Source CodeLibrary (ascl:1305.002)
Pontzen A., Read J., Teyssier R., Governato F., Gualandris A.,Roth N., Devriendt J., 2015, preprint, (arXiv:1502.07356)
Puche D., Westpfahl D., Brinks E., Roy J.-R., 1992, AJ, 103, 1841
Read J. I., 2014, Journal of Physics G Nuclear Physics, 41, 063101
Read J. I., Gilmore G., 2005, MNRAS, 356, 107
Read J. I., Trentham N., 2005, Royal Society of London Philo-sophical Transactions Series A, 363, 2693
Read J. I., Wilkinson M. I., Evans N. W., Gilmore G., KleynaJ. T., 2006, MNRAS, 367, 387
Read J. I., Agertz O., Collins M. L. M., 2016a, MNRAS, 459,
2573
Read J. I., Iorio G., Agertz O., Fraternali F., 2016b, MNRAS,
462, 3628
Ricotti M., 2009, MNRAS, 392, L45
Rocha M., Peter A. H. G., Bullock J. S., Kaplinghat M., Garrison-
Kimmel S., Onorbe J., Moustakas L. A., 2013, MNRAS, 430,81
MNRAS 000, 000–000 (0000)
22 J. I. Read et al.
Romanowsky A. J., Strader J., Spitler L. R., Johnson R., Brodie
J. P., Forbes D. A., Ponman T., 2009, AJ, 137, 4956
Ryan-Weber E. V., Begum A., Oosterloo T., Pal S., Irwin M. J.,
Belokurov V., Evans N. W., Zucker D. B., 2008, MNRAS,
384, 535
Sanchez-Salcedo F. J., Hidalgo-Gamez A. M., Martınez-Garcıa
E. E., 2014, Rev. Mex. Astron. Astrofis., 50, 225
Sawala T., et al., 2016a, MNRAS, 456, 85
Sawala T., et al., 2016b, MNRAS, 457, 1931
Schneider A., Smith R. E., Maccio A. V., Moore B., 2012, MN-RAS, 424, 684
Shan H., et al., 2015, preprint, (arXiv:1502.00313)
Shibuya T., Ouchi M., Harikane Y., 2015, ApJS, 219, 15
Silich S., Lozinskaya T., Moiseev A., Podorvanuk N., Rosado M.,Borissova J., Valdez-Gutierrez M., 2006, A&A, 448, 123
Simpson C. M., Bryan G. L., Johnston K. V., Smith B. D., Mac
Low M.-M., Sharma S., Tumlinson J., 2013, MNRAS, 432,1989
Smoot G. F., et al., 1992, ApJ, 396, L1
Springel V., Frenk C. S., White S. D. M., 2006, Nature, 440, 1137
Stewart K. R., Bullock J. S., Barton E. J., Wechsler R. H., 2009,
ApJ, 702, 1005
Swaters R. A., 1999, PhD thesis, , Rijksuniversiteit Groningen,
(1999)
Teyssier R., Pontzen A., Dubois Y., Read J. I., 2013, MNRAS,
429, 3068
Tollerud E. J., Boylan-Kolchin M., Bullock J. S., 2014, MNRAS,
440, 3511
Tollet E., et al., 2015, preprint, (arXiv:1507.03590)
Tolstoy E., Hill V., Tosi M., 2009, ARA&A, 47, 371
Tomozeiu M., Mayer L., Quinn T., 2016, preprint,(arXiv:1605.00004)
Trebitsch M., Blaizot J., Rosdahl J., 2015, in Martins F., Boissier
S., Buat V., Cambresy L., Petit P., eds, SF2A-2015: Proceed-ings of the Annual meeting of the French Society of Astron-
omy and Astrophysics. pp 105–108 (arXiv:1510.06949)
Trentham N., 1998, MNRAS, 294, 193
Trentham N., Tully R. B., 2002, MNRAS, 335, 712
Trentham N., Sampson L., Banerji M., 2005, MNRAS, pp 52–+
Trujillo-Gomez S., Schneider A., Papastergis E., Reed D. S., Lake
G., 2016, preprint, (arXiv:1610.09335)
Ural U., Wilkinson M. I., Read J. I., Walker M. G., 2015, Nature
Communications, 6, 7599
Vale A., Ostriker J. P., 2004, MNRAS, 353, 189
Vandenbroucke B., Verbeke R., De Rijcke S., 2016, MNRAS, 458,
912
Wang J., White S. D. M., 2007, MNRAS, 380, 93
Warren S. R., et al., 2011, ApJ, 738, 10
Weisz D. R., et al., 2012a, ApJ, 744, 44
Weisz D. R., et al., 2012b, ApJ, 748, 88
Weldrake D. T. F., de Blok W. J. G., Walter F., 2003, MNRAS,
340, 12
Wetzel A. R., Hopkins P. F., Kim J.-h., Faucher-Giguere C.-A.,Keres D., Quataert E., 2016, preprint, (arXiv:1602.05957)
Wheeler C., Onorbe J., Bullock J. S., Boylan-Kolchin M., El-bert O., Garrison-Kimmel S., Hopkins P. F., Keres D., 2015,
preprint, (arXiv:1504.02466)
Xia L., Zhou X., Yang Y., Ma J., Jiang Z., 2006, ApJ, 652, 249
Yang X., Mo H. J., van den Bosch F. C., 2009, ApJ, 695, 900
Zentner A. R., Bullock J. S., 2002, Phys. Rev. D, 66, 43003
Zhang Z., Xu H., Wang Y., An T., Xu Y., Wu X.-P., 2007, ApJ,656, 805
Zhang H.-X., Hunter D. A., Elmegreen B. G., Gao Y., Schruba
A., 2012, AJ, 143, 47
Zhu Q., Marinacci F., Maji M., Li Y., Springel V., Hernquist L.,2016, MNRAS, 458, 1559
Zolotov A., et al., 2012, ApJ, 761, 71
de Blok W. J. G., Bosma A., 2002, A&A, 385, 816
de Blok W. J. G., Walter F., 2000, ApJ, 537, L95de Boer T. J. L., Tolstoy E., Lemasle B., Saha A., Olszewski
E. W., Mateo M., Irwin M. J., Battaglia G., 2014, A&A, 572,
A10del Pino A., Hidalgo S. L., Aparicio A., Gallart C., Carrera R.,
Monelli M., Buonanno R., Marconi G., 2013, MNRAS, 433,1505
van Eymeren J., Marcelin M., Koribalski B., Dettmar R.-J., Bo-
mans D. J., Gach J.-L., Balard P., 2009, A&A, 493, 511van der Marel R. P., Alves D. R., Hardy E., Suntzeff N. B., 2002,
AJ, 124, 2639
MNRAS 000, 000–000 (0000)
Copyright © 2022 FDOKUMEN