Admixture, migrations, and dispersals in Central Asia: evidence from maternal DNA lineages
Upload
independentCategory
view
0download
0
Admixture Mapping in Lupus Identifies MultipleFunctional Variants within IFIH1 Associated withApoptosis, Inflammation, and Autoantibody ProductionJulio E. Molineros1., Amit K. Maiti1., Celi Sun1., Loren L. Looger2, Shizhong Han1,3, Xana Kim-Howard1,
Stuart Glenn1, Adam Adler1, Jennifer A. Kelly1, Timothy B. Niewold4, Gary S. Gilkeson5,
Elizabeth E. Brown6, Graciela S. Alarcon6, Jeffrey C. Edberg6, Michelle Petri7, Rosalind Ramsey-
Goldman8, John D. Reveille9, Luis M. Vila10, Barry I. Freedman11, Betty P. Tsao12, Lindsey A. Criswell13,
Chaim O. Jacob14, Jason H. Moore15, Timothy J. Vyse16,17, Carl L. Langefeld18, Joel M. Guthridge1,
Patrick M. Gaffney1, Kathy L. Moser1,19, R. Hal Scofield1, Marta E. Alarcon-Riquelme1,20 on behalf of the
BIOLUPUS Network", Scott M. Williams21, Joan T. Merrill22, Judith A. James1,19, Kenneth M. Kaufman1,
Robert P. Kimberly6, John B. Harley23, Swapan K. Nath1*
1 Arthritis and Clinical Immunology Research Program, Oklahoma Medical Research Foundation, Oklahoma City, Oklahoma, United States of America, 2 Howard Hughes
Medical Institute, Janelia Farm Research Campus, Ashburn, Virginia, United States of America, 3 Department of Psychiatry, Yale School of Medicine, New Haven,
Connecticut, United States of America, 4 Mayo Clinic, Division of Rheumatology and Department of Immunology, Rochester, Minnesota, United States of America,
5 Division of Rheumatology, Medical University of South Carolina, Charleston, South Carolina, United States of America, 6 Department of Medicine, University of Alabama
at Birmingham, Birmingham, Alabama, United States of America, 7 Department of Medicine, Johns Hopkins University School of Medicine, Baltimore, Maryland, United
States of America, 8 Division of Rheumatology, Northwestern University Feinberg School of Medicine, Chicago, Illinois, United States of America, 9 Department of
Rheumatology and Clinical Immunogenetics, University of Texas Health Science Center at Houston, Houston, Texas, United States of America, 10 Department of Medicine,
Division of Rheumatology, University of Puerto Rico Medical Sciences Campus, San Juan, Puerto Rico, 11 Department of Internal Medicine, Wake Forest School of
Medicine, Winston-Salem, North Carolina, United States of America, 12 Division of Rheumatology, Department of Medicine, University of California Los Angeles, Los
Angeles, California, United States of America, 13 Rosalind Russell Medical Research Center for Arthritis, University of California San Francisco, San Francisco, California,
United States of America, 14 Department of Medicine, University of Southern California, Los Angeles, California, United States of America, 15 Department of Genetics,
Dartmouth Medical School, Lebanon, New Hampshire, United States of America, 16 Division of Genetics and Molecular Medicine, King’s College London, London, United
Kingdom, 17 Division of Immunology, Infection and Inflammatory Diseases, Kings College London, London, United Kingdom, 18 Department of Biostatistical Sciences,
Wake Forest University Health Sciences, Wake Forest, North Carolina, United States of America, 19 College of Medicine, University of Oklahoma Health Sciences Center,
Oklahoma City, Oklahoma, United States of America, 20 Centro de Genomica e Investigacion Oncologica (GENyO)–Pfizer/Universidad de Granada/Junta de Andalucıa,
Granada, Spain, 21 Department of Genetics, Geisel School of Medicine, Dartmouth College, Hanover, New Hampshire, United States of America, 22 Clinical Pharmacology
Research Program, Oklahoma Medical Research Foundation, Oklahoma City, Oklahoma, United States of America, 23 Cincinnati Children’s Hospital Medical Center and the
U.S. Department of Veterans Affairs Medical Center, Cincinnati, Ohio, United States of America
Abstract
Systemic lupus erythematosus (SLE) is an inflammatory autoimmune disease with a strong genetic component. African-Americans (AA) are at increased risk of SLE, but the genetic basis of this risk is largely unknown. To identify causal variants inSLE loci in AA, we performed admixture mapping followed by fine mapping in AA and European-Americans (EA). Throughgenome-wide admixture mapping in AA, we identified a strong SLE susceptibility locus at 2q22–24 (LOD = 6.28), and theadmixture signal is associated with the European ancestry (ancestry risk ratio ,1.5). Large-scale genotypic analysis on19,726 individuals of African and European ancestry revealed three independently associated variants in the IFIH1 gene: anintronic variant, rs13023380 [Pmeta = 5.20610214; odds ratio, 95% confidence interval = 0.82 (0.78–0.87)], and two missensevariants, rs1990760 (Ala946Thr) [Pmeta = 3.0861027; 0.88 (0.84–0.93)] and rs10930046 (Arg460His) [Pdom = 1.1661028; 0.70(0.62–0.79)]. Both missense variants produced dramatic phenotypic changes in apoptosis and inflammation-related geneexpression. We experimentally validated function of the intronic SNP by DNA electrophoresis, protein identification, and invitro protein binding assays. DNA carrying the intronic risk allele rs13023380 showed reduced binding efficiency to a cellularprotein complex including nucleolin and lupus autoantigen Ku70/80, and showed reduced transcriptional activity in vivo.Thus, in SLE patients, genetic susceptibility could create a biochemical imbalance that dysregulates nucleolin, Ku70/80, orother nucleic acid regulatory proteins. This could promote antibody hypermutation and auto-antibody generation, furtherdestabilizing the cellular network. Together with molecular modeling, our results establish a distinct role for IFIH1 inapoptosis, inflammation, and autoantibody production, and explain the molecular basis of these three risk alleles for SLEpathogenesis.
Citation: Molineros JE, Maiti AK, Sun C, Looger LL, Han S, et al. (2013) Admixture Mapping in Lupus Identifies Multiple Functional Variants within IFIH1 Associatedwith Apoptosis, Inflammation, and Autoantibody Production. PLoS Genet 9(2): e1003222. doi:10.1371/journal.pgen.1003222
Editor: Mark I. McCarthy, University of Oxford, United Kingdom
Received July 26, 2012; Accepted November 20, 2012; Published February , 2013
Copyright: � 2013 Molineros et al. This is an open-access article distributed under the terms of the Creative Commons Attribution License, which permitsunrestricted use, distribution, and reproduction in any medium, provided the original author and source are credited.
PLOS Genetics | www.plosgenetics.org 1 February 2013 | Volume 9 | Issue 2 | e1003222
18

Funding: This work was supported by grants from the National Institutes of Health (AR060366, AR049084, AI094377, AR053483, AR33062, RR020143, RR0155577,AI082714, AR058554, AI083194, AI024717, GM103510, AR057172), the U.S. Department of Defense (PR094002, AR002138, AR30692, RR025741, AR042460, AI024717,AI031584, AI101934, AR062277, AR048940, AR043814, DE018209, AI082714, AI062629, DE015223, RR027190, PR094002, P60 AR053308, R01 AR44804, M01 RR-00079,UL1 TR000165), the U.S. Department of Veterans Affairs (IMMA 9), the Alliance for Lupus Research, the Swedish Research Council, Kirkland Scholar Award, Instituto deSalud Carlos III (PS09/00129, co-financed through the European Union Fonds Europeen de Developpement Regional (FEDER)), and European Science Foundation(BIOLUPUS). The funders had no role in the study design, data collection and analysis, decision to publish, or preparation of the manuscript.
Competing Interests: The authors have declared that no competing interests exist.
* E-mail: [email protected]
. These authors contributed equally to this work.
" Membership of the BIOLUPUS Network is available in Text S1.
Introduction
Systemic lupus erythematosus (SLE, [MIM 152700]) is a
clinically heterogeneous autoimmune disease with a strong genetic
component, characterized by inflammation, dysregulation of type-1
interferon responses and autoantibodies directed towards nuclear
components. SLE overwhelmingly targets women, and its incidence
and clinical course differ dramatically between ethnic populations.
In particular, SLE occurs with at least 3–5 times higher prevalence
and more severe complications in African-Americans (AA)
compared to Americans with European ancestry (EA) [1]. However,
the genetic basis of this increased risk is largely unknown. The
recently ‘‘admixed’’ AA population is likely to provide critical
information necessary to identify chromosomal regions that harbor
variants associated with SLE and provide insights about allele
frequency differences among distinct ancestral populations (i.e.,
European and African). Admixture mapping (AM) has proven to be
a powerful method to leverage ancestry information to identify
chromosomal segments linked to disease [2–9]. For instance, AM
has helped identify the risk gene MYH9 in idiopathic focal
segmental glomerulosclerosis in AA [10], and risk alleles in several
genes associated with breast [11] and prostate cancer [12]. In
addition to the greater lupus incidence, studying AA populations
offers a second advantage. Africans have the smallest haplotype
blocks of all human populations: African average population
recombination distance is 6 kb, while it is 22 kb in Europeans
and Asians [13,14]. This 3-fold smaller haplotype size gives rise to
correspondingly tighter genomic associations in admixed popula-
tions such as AA, making causal mutations easier to decipher.
Although several genes for SLE susceptibility have been found
through candidate gene analysis and genome wide association
scans (GWAS), none or very few causal mutations have been
identified in each gene. In this study we employed AM in AA to
identify admixture signals, and performed a follow-up association
study on AA and EA to further identify and localize variants
associated with SLE. We experimentally validated predicted
variants with biochemistry, cell culture experiments and sequenc-
ing of patient-isolated samples. We showed distinct functions of
two coding SNPs including changes in gene expression. Through
electrophoretic mobility shift assays (EMSAs), protein identifica-
tion and in vitro protein binding assays, we determined that the
intronic SNP disrupts function of a transcriptional enhancer of the
IFIH1 locus. Taken together, these results explain the effects of
three independent causal mutations on SLE, and begin to
elucidate the disparity in disease prevalence between different
human populations.
Results
Admixture mappingSince case-only analysis has greater statistical power than case-
control, we first performed a case-only admixture scan [3,6,8] on
1032 AA SLE cases (Figure 1, Table S1). Individual admixture
estimates and genome scans for admixture mapping were analyzed
using STRUCTURE [15] and ANCESTRYMAP [7] and later
verified with ADMIXMAP [6]. As expected, a two-ancestral
population model (African and European) best explained the
population structure of these samples. By applying the ANCES-
TRYMAP software, we identified seven potential admixture
signals that exceeded our predefined LOD threshold of 2
(Figure 2A, Table S2). Specifically, we identified a genomewide
significant association [7] of SLE risk with European ancestry at
2q22–q24 (highest LOD = 6.28 was achieved between rs6733811
and rs4129786) using a weighted prior risk model; the strongest
association at the same locus was observed at a fixed prior risk of
1.5, which represents a 1.5-fold increased risk of SLE due to one
European ancestral allele at this locus. To evaluate how the prior
risk model could influence the ANCESTRYMAP results, we also
applied a uniform prior risk model and found consistent genome-
wide evidence for association at 2q22–q24 (LOD = 5.86). We also
reassessed the strength of the admixture signal at 2q22–24 using
alternate markers (LODodd = 3.65, LODeven = 4.32), and comput-
er simulation (P = 0.02). We also validated case-only admixture
signals with a case-control admixture scan with 800 ancestry
informative markers (AIMs), using 1726 controls from the Dallas
Heart Study (DHS) (Table S2). We next repeated the admixture
scan using ADMIXMAP, which uses a classical (non-Bayesian)
hypothesis test (i.e., score tests for allelic associations with the trait,
conditional on individual admixture and other covariates). All the
admixture signals identified by the case-only design using
ANCESTRYMAP were strongly validated by ADMIXMAP
(Table S2). The strongest peak was identified at 2q22–24 through
ADMIXMAP (P = 2.9961028, Table S2). Both AM programs
found that the strongest effect was on the AIM rs6733811
(P = 2.9961028, LOD = 5.65). Two weaker signals were also
found on chromosome 2 (LOD = 3.61, P = 4.8261023; and
LOD = 3.52, P = 1.6461024), as well as on chromosomes 7
(LOD = 3.26, P = 6.4961026), 9 (LOD = 3.43, P = 1.4161025),
14 (LOD = 2.44, P = 3.8461025) and 19 (LOD = 3.20,
P = 1.1561025) (Table S2).
Fine mapping and association analysisTo identify SLE-susceptibility gene(s) within 2q22–24, we
performed a follow-up case-control (CC) association study in two
ethnically diverse groups: CCAA (1525 cases, 1810 controls) and
CCEA (3968 cases, 3542 controls) (Figure 1, Table S1). Individual
ancestry was estimated using 216 highly informative AIMs. Case-
control association tests were performed using 284 SNPs from 20
plausible candidate genes spanning ,21 megabases of 2q22–q24
(95% CI (142.4–163.6), Table S3). Forty-two SNPs from 10 genes
(IFIH1, CACNB4, ACVR1C, KCNH7, NEB, STAM2, ZEB2, NMI,
ARHGAP15, and ACVR2A) showed significant association for the
allelic test (Puncorrected,0.05) in CCAA, whereas 23 SNPs (in IFIH1,
Admixture Mapping, IFIH1, and SLE Susceptibility
PLOS Genetics | www.plosgenetics.org 2 February 2013 | Volume 9 | Issue 2 | e1003222
CACNB4, NEB, ARHGAP15, and TNFA1P6) showed significant
association in CCEA (Table S4). The strongest associations
occurred at IFIH1 (interferon-induced helicase 1;
PAA = 3.5261025, PEA = 8.8261025) and CACNB4 (voltage-gated
calcium channel, beta subunit; PAA = 9.0761025,
PEA = 2.6161022), which are separated by 10.2 Mb. Among the
22 SNPs tested within IFIH1, 13 were significantly (P,0.05)
associated in AA and 4 in EA. Among 23 CACNB4 SNPs, 12 were
significant in AA and 2 in EA. Considering the number of
associated SNPs, level of replication and involvement in autoim-
mune phenotypes [16–20], we considered IFIH1 as the strongest
candidate to explain the admixture-mapping signal.
Of the 13 SNPs significantly associated in AA, a preliminary
imputation-based association analysis and comparing linkage
disequilibrium (LD) determined that 11 were sufficient to tag the
13 associated SNPs (Table S6). To increase the statistical power to
detect variants associated with SLE, we genotyped these 11 IFIH1
SNPs in 949 healthy AA controls from the DHS, along with
Author Summary
African-Americans (AA) are at increased risk of systemiclupus erythematosus (SLE), but the genetic basis of this riskincrease is largely unknown. We used admixture mappingto localize disease-causing genetic variants that differ infrequency across populations. This approach is advanta-geous for localizing susceptibility genes in recentlyadmixed populations like AA. Our genome-wide admixturescan identified seven admixture signals, and we followedthe best signal at 2q22–24 with fine-mapping, imputation-based association analysis and experimental validation. Weidentified two independent coding variants and a non-coding variant within the IFIH1 gene associated with SLE.Together with molecular modeling, our results establish adistinct role for IFIH1 in apoptosis, inflammation, andautoantibody production, and explain the molecular basisof these three risk alleles for SLE pathogenesis.
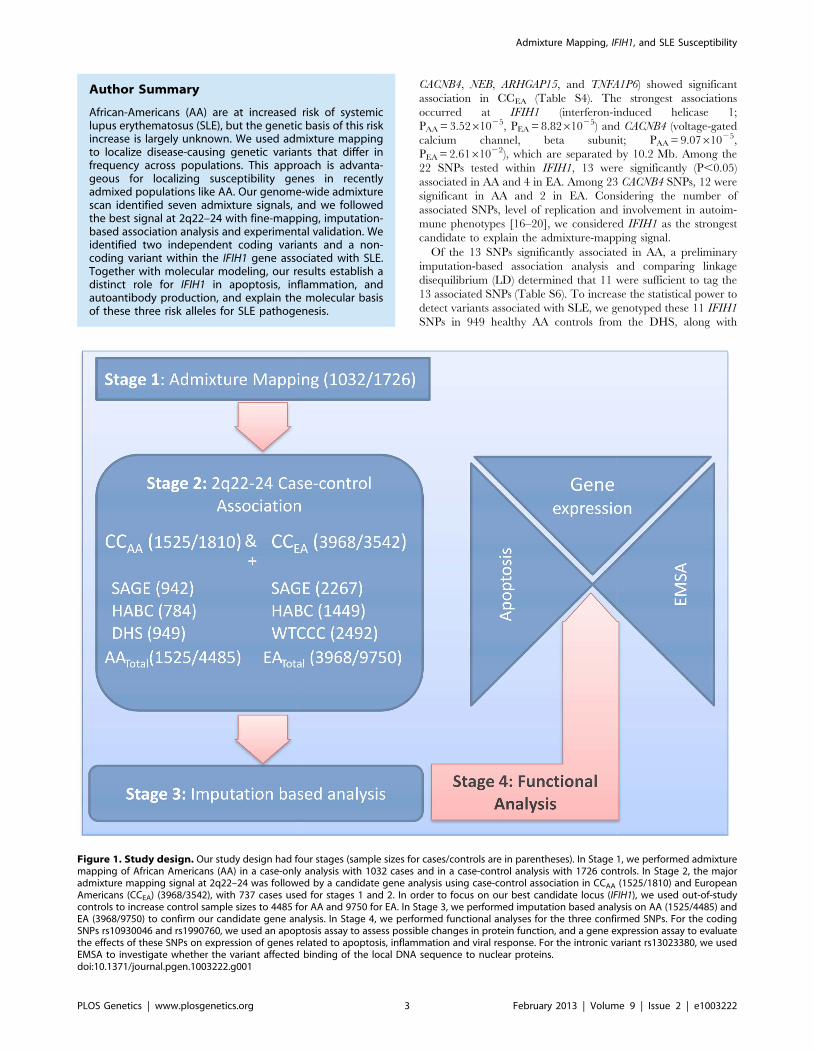
Figure 1. Study design. Our study design had four stages (sample sizes for cases/controls are in parentheses). In Stage 1, we performed admixturemapping of African Americans (AA) in a case-only analysis with 1032 cases and in a case-control analysis with 1726 controls. In Stage 2, the majoradmixture mapping signal at 2q22–24 was followed by a candidate gene analysis using case-control association in CCAA (1525/1810) and EuropeanAmericans (CCEA) (3968/3542), with 737 cases used for stages 1 and 2. In order to focus on our best candidate locus (IFIH1), we used out-of-studycontrols to increase control sample sizes to 4485 for AA and 9750 for EA. In Stage 3, we performed imputation based analysis on AA (1525/4485) andEA (3968/9750) to confirm our candidate gene analysis. In Stage 4, we performed functional analyses for the three confirmed SNPs. For the codingSNPs rs10930046 and rs1990760, we used an apoptosis assay to assess possible changes in protein function, and a gene expression assay to evaluatethe effects of these SNPs on expression of genes related to apoptosis, inflammation and viral response. For the intronic variant rs13023380, we usedEMSA to investigate whether the variant affected binding of the local DNA sequence to nuclear proteins.doi:10.1371/journal.pgen.1003222.g001
Admixture Mapping, IFIH1, and SLE Susceptibility
PLOS Genetics | www.plosgenetics.org 3 February 2013 | Volume 9 | Issue 2 | e1003222

Figure 2. Admixture mapping and conditional analysis. (A) A whole-genome admixture scan on AA SLE cases identified 7 admixture signalsthat achieved the predefined LOD score .2 (red dashed line). (B) We performed an imputation-based association analysis of IFIH1, which wasidentified as the most promising candidate gene by a case-control study on 20 candidate genes in the largest peak (2q22–24), followed by 4-SNPhaplotype conditional analysis (C). Filled dots indicate the 2log10 P values for the association to SLE, and color coding represents inter-markercorrelation (r2) between the strongest associated SNP, rs10930046 (‘‘purple diamond’’), and the individual SNPs, as shown in the color bar. (C) Afterconditioning the 4-marker haplotypes for the three markers rs1990760–rs10930046–rs13023380, all individual SNP associations are explained as
Admixture Mapping, IFIH1, and SLE Susceptibility
PLOS Genetics | www.plosgenetics.org 4 February 2013 | Volume 9 | Issue 2 | e1003222

additional out-of-study controls (Figure 1, Table S1). Using single
SNP analysis (allelic and genotypic models), followed by condi-
tional analysis and LD analysis across two populations, we
detected three SNPs with potentially independent SLE association
(Table 1, Figure 2B and 2E). Based on an allelic model, intronic
variant rs13023380 [PAA = 4.3361025, PEA = 9.52610211;
Pmeta = 5.20610214; OR = 0.82 (0.78–0.87)], and a missense
(Ala946Thr) variant rs1990760 [PAA = 2.0261024,
PEA = 1.2261024; Pmeta = 3.0861027; OR = 0.88 (0.84–0.93)],
were associated with SLE in both AA and EA. Another non-
synonymous missense variant (Arg460His), rs10930046, was
initially associated only with SLE in AA (PAA = 1.8161027;
OR = 0.80 (0.73–0.87)), where the best fit genetic model was
identified as dominant (Pdom = 1.1661028, OR = 0.70 (0.62–0.79))
(Table 1, Table S5). This SNP is rare in EA, having a minor allele
frequency (MAF) of only 1.3% in controls and 1.6% in cases
(PEA = 0.086) (Table 1). However, after conditioning on the other
two associated SNPs (rs13023380 and rs1990760), the rs10930046
became marginally significant in EA (PEA = 0.017; OR = 1.2).
These SNPs remained significant in both AA and EA after
adjusting for ancestry (Table 1). Strikingly, the ancestral alleles at
these three SNPs (all ‘G’) are the minor alleles in at least one
population: all three ancestral alleles are the minor alleles in EA;
the ancestral rs10930046 allele is minor in AA as well.
We analytically estimated the joint population attributable risk
(PAR) [21] using these three SNPs (rs13023380, rs10930046 and
rs1990760) for AA (18.1%) and EA (14.7%). Most of the increased
PAR (%) in AA was attributable to rs1090046 (12.5% PAR),
whereas for EA very little was attributable to this SNP (0.3%
PAR), likely due to the extremely low MAF. For AA, we also
sought to determine how much of the European ancestry risk ratio
(l= 1.5, estimated by ANCESTRYMAP) was attributable to the
three SNPs at 2q22–24. Using the estimated ORs in AAs and the
SNP allele frequencies of the two ancestral populations (YRI, the
Yoruba people of West Africa, was used as an African ancestral
population; CEPH, Utah residents with Northern and Western
European heritage, was used as an European ancestral population
(Table S8), we estimated the locus-specific ancestry risk ratio (l;
see Methods) for each SNP (lrs1990760 = 1.12, lrs10930046 = 1.15,
lrs13023380 = 1.12). Assuming that each SNP contributes to the
ancestry risk ratio independently, about 80% of the increased risk
due to one copy of the European ancestry alleles estimated from
ANCESTRYMAP (,1.5) can be explained by the three SNPs at
2q22–24, reinforcing our conclusion from admixture mapping that
local European ancestry increases the disease risk at 2q22–24.
We also repeated our admixture mapping by stratifying the
cases by three genotype (‘AA’, ‘AG’ and ‘GG’) at the most
differentiated (FstCEPH-YRI = 0.38) SNP, rs10930046 (NAA = 279,
NAG = 323, NGG = 114). Even with the small samples, we found a
dramatically increased risk of European ancestry at rs10930046
(LOD = 10.78) in the homozygous ‘AA’ compared to the other
genotypes, where ancestry association is insignificant (LOD for
‘GG’ = 26.46 and ‘AG’ = 23.38).
Imputation-based association analysisTo identify additional SLE-associated variants, we performed
an imputation-based association analysis in and around IFIH1
using MACH [22] with reference data from AA (207 controls) and
EA (594 controls) using genotyping data from the ImmunoChip
(Figure 2B, 2E and Tables S6, S7). Using stringent predefined
shown. (D) We analyzed the LD between SNPs on the ImmunoChip, and these LD values were used as a reference panel for imputation in AA. Darkercolor denotes higher correlation between markers (r2). The LD pattern showed high correlation between markers, making it possible to increase SNPdensity by imputation. The three independently associated SNPs identified in (B) are denoted by arrows. (E) We performed an imputation based case-control association analysis in EA. Filled dots indicate the 2log10 P values for each SNP, and color coding represents the inter-marker correlation (r2)between each individual SNP and the strongest associated SNP, rs13023380 (‘‘purple diamond’’), as shown in the color bar. (F) We then performed atwo SNP haplotype analysis followed by a three marker haplotype analysis conditioned on the two independent variants rs10930046 and rs13023380.(G) LD analysis of SNPs on the ImmunoChip reference panel showed low inter-marker correlation, which largely precluded imputation basedassociation. Darker color indicates greater r2. Arrows indicate the position of the independent SNPs.doi:10.1371/journal.pgen.1003222.g002
Table 1. Case-control association for genotyped variants in AA and EA.
SNP Position Alleles AA EA
Affected Control P-value OR Affected Control P-value OR
(N = 1525) (N = 4485) [95%CI] (N = 3968) (N = 9750) [95%CI]
rs13023380 162,862,609 G/A 0.885 0.911 4.3361025+ 0.75 0.433 0.478 9.52610211+ 0.84
3.9261024* (0.66–0.86) 6.66610211* (0.79–0.88)
1.7561022** 8.71610211**
rs10930046 162,846,229 G/A 0.374 0.428 1.8161027+ 0.80 0.016 0.013 8.6161022+ 1.21
3.2261026* (0.73–0.87) 8.461022* (0.97–1.50)
8.5161026** 0.12**
rs1990760 162,832,297 G/A 0.799 0.829 2.0261024+ 0.82 0.375 0.400 1.2261024+ 0.90
2.6161023* (0.74–0.91) 1.4461024* (0.85–0.95)
1.4361022** 1.7461024**
The numbers of affected and control samples are provided in parentheses. Allele frequencies, odds ratios (OR), and 95% confidence intervals [95% CI] are given for the‘G’ alleles. Allelic association legends are:+uncorrected;*corrected by local ancestry; and**corrected by global ancestry.doi:10.1371/journal.pgen.1003222.t001
Admixture Mapping, IFIH1, and SLE Susceptibility
PLOS Genetics | www.plosgenetics.org 5 February 2013 | Volume 9 | Issue 2 | e1003222

criteria for imputation, there were 61 additional SNPs for AA, but
only 1 for EA later used for conditional analysis. Inefficiency of EA
imputation was mainly due to presence of many low frequency
(,1%) alleles and strikingly different LD structure (Figure 2D and
2G, Table S7).
Conditional analysisA pair-wise logistic regression analysis conditioned on each SNP
revealed that the three previously identified SNPs were each
independently associated with SLE. While in AA, rs13023380,
rs10930046 and rs1990760 accounted for the entire association
spanning the whole gene (Figure 2B, 2C), in EA, rs13023380 and
rs10930046 were independently associated with SLE and
accounted for the association (Figure 2E, 2F). Finally, comparing
LD (r2) between these three SNPs across nine datasets from seven
ethnic populations, we concluded that these three SNPs are also
physically independent (Figure S2). Interestingly, using D9 we
found that these SNPs are on the same haplotype in EA and AA,
but most likely they are not in the ancestral populations (Figure
S2).
Ancestry and conservation of the associated allelesIn order to discover the ancestral origin of the risk (‘A’ in each of
the 3 SNPs) and protective (‘G’ in each case) alleles for these three
SNPs, we estimated local ancestry around the SNPs, then
compared (by allele frequency and fixation index) AA individuals
whose both haplotypes were European (AAEUR, N = 129) or
African (AAAFR, N = 2124), and to individuals from HapMap
populations CEPH and YRI (Table S8). Risk allele frequencies
derived from the haplotypes were similar between AAEUR and
CEPH, and between AAAFR and YRI. Alignment of the human
genome with other genomes strongly suggests that the protective
alleles (‘G’) are ancestral, and that the risk (‘A’) alleles are derived.
For the two coding SNPs, the ‘G’ allele of rs1990760 (and the
resulting alanine amino acid) is ,100% conserved across 34
mammalian genomes (Table S9); the ‘G’ allele of rs10930046 (and
the resulting arginine amino acid) is ,100% conserved across 50
vertebrate genomes (Table S10). Introns are typically less
conserved than protein-coding sequence, and accordingly the
intronic sequence surrounding the rs13023380 SNP is only
strongly conserved in primates; the base corresponding to
rs13023380 is ‘G’ in each case (Figure S6). In AA, only the
rs10930046 risk allele is major; interestingly, all three ‘A’ risk,
derived alleles are the major alleles in EA and the rs10930046 risk
allele is almost fixed (Table 1). This suggests a strong selective
pressure against the SLE-protective alleles in humans [23], which
is not manifest in other animal species.
Experimental validationGiven the strong association of these three SNPs in IFIH1 with
SLE, we evaluated their effect on the function of the IFIH1 gene.
IFIH1 has been implicated in binding with dsRNA complexes
generated as replication intermediates during RNA viral infec-
tions, leading to inflammation and apoptosis [24,25]. The full
length IFIH1 protein contains 1025aa in the following domains:
caspase recruitment (CARD) (aa115–200), helicase ATP-binding
(aa305–493), helicase C-terminal (aa743–826) and RIG-I regula-
tory (aa901–1022) (Figure 5A). Deletion of the ATP-binding
domain, which includes rs10930046, induces apoptosis in mela-
noma cells [26]. The RIG-I regulatory domain, which includes
rs1990760, recognizes dsRNA, upon which the helicase domains
are activated [27]. Apoptosis has been associated with SLE
pathogenesis in humans and mice [28]. Furthermore, Ingenuity
Pathway Analysis (IPA) indicates that IFIH1 interacts with several
genes involved in apoptosis and inflammation (Figure S3).
ApoptosisTo assess the effects of coding variants in apoptosis and
inflammation, we mutagenized IFIH1 cDNA cloned in a
mammalian expression vector with a poly-cistronic (IRES) GFP
marker at the C-terminus. We over-expressed IFIH1 in a K562
leukemia cell line and measured cell death for each risk SNP,
comparing with the ancestral protective allele. The rs10930046
risk allele ‘A’ significantly increased apoptosis over the protective
allele ‘G’ (14.6% average increase at each time point between 44
and 92 hours, P = 0.014) (Figure 3A). In contrast, the risk allele ‘A’
of rs1990760 had little impact on apoptosis (P = 1.0), as expected
since it is located in the RIG-1 regulatory domain, which is not
involved in apoptosis.
Gene expressionTo assess the effect of these polymorphisms on expression of
downstream genes, additional transfected K562 cells were sorted
for GFP+ cells by FACS and total RNAs were isolated from these
cells. These were subjected to RT-qPCR of 11 genes related to
apoptosis, inflammation or viral response: NFk-B1, NFk-B2,
RELA, CASP8, CASP9, TNFa, MAPK8, MAVS, IFNA, IFIT1 and
MX1.
Gene expression analysis showed that over-expression of the ‘A’
allele of rs10930046 significantly increased expression of NFk-B1
(.2.8-fold, P = 2.161022), CASP8 (.1.8-fold, P = 4.561024),
CASP9 (.3.5-fold, P = 7.261026) and MAVS (.2-fold,
P = 9.661023) compared to the ‘G’ allele (Figure 3B, 3D, 3E,
3H) but did not affect expression of NFk-B2 (P = 0.14), TNFa(P = 0.7) or MAPK8 (P = 0.9) (Figure 3C, 3F, 3G). While the ‘A’
allele of rs1990760 had no significant effect on expression of NFk-
B1 (P = 0.14) or CASP9 (P = 0.08), it showed a significant decrease
of TNFa (.5-fold, P = 1.861027), NFk-B2 (.3-fold,
P = 1.361023) and CASP8 (.1.5-fold, P = 1.661026) expression
(Figure 3B, 3C, 3D, 3E, 3F). The rs1990760 risk allele also
significantly increased expression of MAPK8 (.2-fold,
P = 6.261023) and MAVS (.1.6-fold, P = 8.561023) (Figure 3G,
3H).
Strikingly, interferon alpha (IFNA) expression was reduced for
both risk alleles (rs10930046, .2-fold, P = 4.261023; rs1990760,
2-fold, P = 9.161023) (Figure 3I). Reduced IFNA expression in
SLE patients had been predicted for the risk allele of rs1990760
[29]. Our results not only confirmed this but also showed that
expression of the risk allele of rs10930046 similarly reduced IFNA
expression (Figure 3I). Similarly, expression of IFIT1 was also
reduced (rs10930046, .0.75-fold, P = 8.761023; rs1990760,
.3.5-fold, P = 9.161027); and MX1 expression was decreased
for rs10930046 (.2.5-fold, P = 2.161023) but was increased for
rs1990760 (.1.5-fold, P = 3.361024) (Figure 3J, 3K). Following
induction of transfected cells with Type-1 interferon IFN beta
(IFNB), IFIT1 and MX1 showed strong up-regulation (Figure 3L,
3M) by both SNPs (IFIT1: rs10930046, .2-fold, P = 2.061022;
rs1990760, .2-fold, P = 2.761022; MX1: rs10930046, .1.3-fold,
P = 3.161022; rs1990760, .2.2-fold, P = 4.761025). RELA ex-
pression did not change significantly (for rs10930046, P = 0.61 and
for rs1990760, P = 0.77) for either risk allele (not shown).
In our expression analysis, significant up-regulation of CASP8,
CASP9 and NFk-B1 (and unchanged NFk-B2 and TNFa levels) by
the rs10930046 risk allele would be expected to dramatically
increase apoptosis, as observed. For rs1990760, levels of these five
pro-apoptotic factors are dramatically lowered, consistent with
absence of an apoptosis phenotype. MAVS (mitochondrial
Admixture Mapping, IFIH1, and SLE Susceptibility
PLOS Genetics | www.plosgenetics.org 6 February 2013 | Volume 9 | Issue 2 | e1003222

Figure 3. Apoptosis and expression assays for exonic SNPs. (A) K652 cells were transfected with IFIH1 full length cDNA containing theprotective ‘G’ or risk ‘A’ allele for rs10930046 and rs1990760 in the following combinations: ‘A-G’, ‘G-A’ and ‘G-G’. After transfection, the percentage ofapoptotic cells was quantified by FACS for annexin V and AAD positivity among GFP+ cells (transfection positive) at seven different time points (inhours). At all time points, the risk allele ‘A’ for rs10930046 produced a significant increase in the proportion of apoptotic cells compared to the ‘G’allele (mean increase 14.6%, P#1.461023, ‘A-G’ vs ‘G-G’). In contrast, the ‘A’ allele for rs1990760 had no significant effect on apoptosis compared tothe ‘G’ allele at any time point (P = 1, ‘G-A’ vs ‘G-G’). IFIH1 cDNA encoding the risk or protective allele of rs10930046 or rs1990760 was transientlytransfected, GFP+ cells were sorted by FACS and total RNA was isolated. cDNAs were subjected to RT-qPCR for quantification of expression of NFk-B1,NFk-B2, CASP8, CASP9, TNFA, MAPK8, MAVS, IFNA, IFIT1 and MXI (B–K). All of these genes showed significantly altered expression with at least one ofthe risk alleles. Further, we observed that IFIT1 and MX1 (L, M) expression both increased with risk alleles when transfected cells were treated with IFNbeta. Also, IFN beta stimulation increased IFIH1 expression (N), and IFIH1 over-expression induced IFNA expression (O), suggesting a positive feedbackloop between IFNA and IFIH1 (P). Although it was known that IFNA induces IFIH1 expression, it was not previously shown that IFIH1 induces IFNAexpression, which here is designated by ‘‘X’’. Colors used in the expression figures are blue for ancestral ‘G-G’, red for rs10930046-‘A’+rs1990760-‘G’;and green shows rs10930046-‘G’+rs1990760-‘A’.doi:10.1371/journal.pgen.1003222.g003
Admixture Mapping, IFIH1, and SLE Susceptibility
PLOS Genetics | www.plosgenetics.org 7 February 2013 | Volume 9 | Issue 2 | e1003222

antiviral-signaling protein) expression was increased for both risk
alleles. MAVS is an antiviral protein in the host defense system
whose virus-triggered cleavage is necessary to attenuate apoptosis
[30,31]. However, without viral attack MAVS induces apoptosis
through caspase and NFKB activation [30]. In our case, it could
promote apoptosis, particularly for the risk allele of rs10930046. In
terms of inflammation, the expression data shows some interesting
effects. For rs10930046, neither TNFa nor MAPK8 changed, but
for rs1990760, TNFa decreased while MAPK8 increased leading to
inflammation signaling through non-apoptotic pathways.
We next examined known transcriptional networks in the
context of our expression data. At the root, IFIH1 and type-1
interferons constitute a positive-feedback loop (Figure 3P). We
verified this in our cellular model: indeed, in control cells, IFIH1
expression increased several hundred-fold upon IFNB treatment
(Figure 3N), and in IFIH1 over-expressing cells, IFNA expression
increased (Figure 3O). Taken together, our results support the
predicted IFIH1-Type1 interferon feedback loop through IRF7
[32] and MAVS [33].
IFNA and TNFa are known to drive IFIT1 expression [34], and
the IFIH1 SNP-driven decrease in IFIT1 may be mediated
through decreased IFNA and/or TNFa. MX1 (interferon-induced
GTP-binding protein) is also driven by IFNA and TNFa [35].
Surprisingly, although both IFNA and TNFa decreased in the
Figure 4. Binding assay for rs13023380 and molecular model of IFIH1. (A) EMSA was performed using nuclear protein extracts from K562cells (A) with 141-bp PCR products including either the protective (‘G’) or risk (‘A’) sequence at rs13023380. Both ‘G’ and ‘A’ allele-containing PCRproducts bound to a protein complex in the nuclear extracts. However, the ‘A’ allele bound with at least 2-fold reduced efficiency compared to the ‘G’allele-carrying PCR product, as measured by the intensity of the shifted band relative to the free DNA band in the same lane. As a nonspecific (NS)DNA control, a 140-bp DNA sequence not present in the genome was created by PCR amplification of bisulfite-modified genomic DNA. (B, C) EMSAfor purified recombinant Nucleolin and Ku70/80 protein with PCR products carrying the ‘G’ or ‘A’ allele of rs13023380. In both the cases, the ‘G’ allelebinds both of these proteins with increased efficiency. +signs are used to denote the increasing amount of protein added in the reaction. Numbersbelow EMSA pictures denote the ratio between the intensities of protein bound DNA to the free DNA. (D) Luciferase activities of intronic DNAsequences carrying ancestral ‘G’ or risk allele ‘A’. The protective allele has approximately 2-fold higher promoter activity (luciferase units) than riskallele ‘A’ carrying sequences. Tkmin-only vector, MCS-vector with multiple cloning sites, 380G-protective allele, 380A-risk allele. (E) Crystal structure ofRIG-I in complex with dsRNA (from PDB 3TMI) [27]. Side-chains are shown in red for the positions corresponding to the two coding SNPs in IFIH1. Bothmutations are in close proximity to the dsRNA-binding pocket. (F) Close-up of the side-chain of Ala946, modeled from 3TMI. The side-chain makesclose contact with the opposing helicase ‘‘cap’’ domain; together these two domains regulate dsRNA entry and processing. Threonine is shown intransparent colors. (G) Superimposition of the RIG-I ATP-binding domain (PDB 4A2W) in blue, and the human IFIH1 ATP-binding domain (PDB 3B6E) ingreen. The IFIH1 structure contains the histidine side-chain resulting from the rs10930046 risk allele. Large portions of the IFIH1 structure are absent inthe 3B6E model, and the two helices are shifted by 1.5 A. In the ancestral protein, Arg460 likely interacts with the Leu421 main-chain oxygen, as wellas the negative helix dipole and the side-chains of Gln433, and Glu425 and 428 (not present in 3B6E).doi:10.1371/journal.pgen.1003222.g004
Admixture Mapping, IFIH1, and SLE Susceptibility
PLOS Genetics | www.plosgenetics.org 8 February 2013 | Volume 9 | Issue 2 | e1003222

presence of rs1990760 ‘A’, MX1 was significantly up-regulated.
This result is similar to a recent paper [29], which showed that
when SLE patients’ cells were induced with IFNA, the rs1990760
‘A’ risk allele displayed higher levels of MX1 than ‘G’ allele
patients, even though these patients had lower circulating IFNA
levels. Our data suggest that IFIH1 risk alleles at these two coding
SNPs down-regulate IFNA expression (either through reduced
expression or activity of IFIH1) and, in turn, IFNA down-regulates
interferon regulatory antiviral genes, potentially conferring viral
susceptibility. It is also possible that the rs1990760 risk variant in
IFIH1 may increase sensitivity of cells to IFNA pathway activation
and subsequent IFN-induced gene transcription [36].
Protein binding, identification, and in vitro bindingThe intronic variant rs13023380 could influence IFIH1 function
either by producing a functional miRNA or by altering the binding
efficiency to one or more nuclear regulatory proteins. Through
bioinformatic analyses (miRBase: http://www.mirbase.org/) we
confirmed that no reported or predicted miRNA-producing or
binding sites were present in these sequences. To address whether
rs13023380 alters nuclear protein-DNA interaction, we performed
EMSAs on nuclear protein extracts from K562 and JURKAT cell
lines, using 150-bp PCR products amplified from genomic DNA of
‘AA’ and ‘GG’ homozygous patients. Both PCR products
containing the ‘A’ risk sequences or ancestral ‘G’ sequences
bound to nuclear protein extract, but DNA containing ‘A’
sequences consistently showed ,2-fold reduced binding efficiency
to a protein complex compared to ‘G’ sequences (Figure 4A,
Figure S4F).
To identify any DNA-bound proteins, we performed mass
spectrometric sequencing (MALDI-TOF) on the protein/DNA
complexes isolated using two separate methods: 2D electrophoresis
and protein pull-down. In 2D electrophoresis, the visible DNA-
bound protein complex in EMSA was excised from a native PAGE
gel (Figure S4A–S4C) and sequenced directly, which identified
lupus autoantigen Ku70/80 (XRCC5/6), nucleolin (NCL) and
HSP90AA1/AB1 as the major constituents of the DNA–protein
band (Table S11). Using the second method, we performed EMSA
with biotinylated PCR products and pulled down the DNA-bound
proteins using immobilized streptavidin-coated agarose beads.
Subsequent fractionation by SDS-PAGE (Figure S4D), and
sequencing of two distinct visible protein bands (not present in
the control pull-down product), confirmed NCL and HSP90AB1
(Table S11). We did not identify Ku70/80 in the streptavidin
method, possibly because these two proteins were washed off or
were present in insufficient quantities to detect and sequence.
However, when we performed ‘‘super-shift’’ assays with antibodies
to these proteins, surprisingly, anti-NCL and anti-Ku70/80
antibodies released EMSA-bound DNA instead of super-shifting
the complex (Figure S4E). It is possible that the antibodies either
induce conformational changes in their targets to release DNA or
compete with target proteins for DNA binding. Autoantibodies
Figure 5. Three risk variants of IFIH1 and the proposed functional model. (A) IFIH1 protein (1025 amino acids (aa)) structure shows fourconserved domains (start-stop aa) in boxes: a caspase recruitment (CARD) domain 115–200 aa); a helicase ATP-binding domain (305–493 aa), ahelicase C-terminal domain (743–826 aa), and a RIG-I regulatory domain (901–1022 aa). (B) Domain prediction by Pfam: Gene intron/exon structure ispresented below, with exons represented by thick vertical lines. (C) The three associated SNPs are represented by arrowed boxes. SNP rs10930046 islocated in the helicase ATP-binding domain encoded by exons 4–7; rs1990760 is located in the RIG-1 regulatory domain encoded by exons 14–16;rs13023380 is on intron 3. We present a model of the functions implicated by the risk alleles in each variant, where each identified variant has aneffect on the expression of NFk-B1, CASP9, MAVS, MX1, IFIT1, NFk-B2, TNFA and MAPK8, and their impact on inflammation, viral response andtranscription.doi:10.1371/journal.pgen.1003222.g005
Admixture Mapping, IFIH1, and SLE Susceptibility
PLOS Genetics | www.plosgenetics.org 9 February 2013 | Volume 9 | Issue 2 | e1003222

against NCL and Ku70/Ku80 are characteristic features of SLE
[37,38] and release of free DNA from EMSA-bound DNA in vitro
implies that autoantibodies in vivo could impair the function of
these proteins by disrupting the binding of bound proteins from
target DNA, including the rs13023380 locus.
In light of the observed competition of added antibodies to
protein-DNA binding, we determined whether purified recombi-
nant proteins of NCL and Ku70/80 bound to these DNAs. Both
recombinant proteins, purified from insect cells, produced
identical gel shifts as the nuclear extract (Figure 4B, 4C), but
again the risk ‘A’ allele bound to the recombinant proteins with
,2-fold decreased efficiency relative to the protective ‘G’ allele.
These results prompted us to enquire whether DNA sequence
containing rs13023380 and its surroundings could act as a
transcriptional regulatory element (TRE, e.g. enhancer/silencer)
in vivo, and if the risk allele has any effect on transcription. The
same sequences used for EMSA were cloned before a minimal
TKmin promoter and a luciferase reporter gene, and luminescence
assays were performed. Both sequences increased reporter gene
activity over the core vector, suggesting that the rs13023380 locus
contains a transcriptional enhancer. The risk allele-carrying
sequences showed almost a 2-fold reduction (Figure 4D) in
luciferase activity compared to those with the ancestral allele.
Taken together, these results suggest that the rs13023380 locus
recruits transcriptional activity of IFIH1 through binding of
Ku70/80, NCL and HSP90AA1/AB1 (and potentially more
proteins), and that the risk allele at this base position interferes
with this enhancer activity, potentially decreasing IFIH1 transcript
levels.
Molecular modelingThe absolute conservation of Ala946 (rs1990760, Ala946Thr) in
all sequenced mammalian genomes, with diverse codons, strongly
suggests selection at the amino acid level (Table S9). We
performed molecular modeling of IFIH1-Thr946, based on the
protein structure of the IFIH1 C-terminal domain (PDB 2RQB),
and the full-length structure of the homologous enzyme RIG-I,
bound to dsRNA (PDB 3TMI). Ala946 is placed directly at the
mouth of the helicase active site; in RIG-I this region makes
contact with the helicase ‘‘cap’’, which mediates dsRNA entry and
processing [27]. Mutation of alanine to the bulker threonine side-
chain (Figure 4E, 4F) may alter the sterics and/or dynamics of this
protein region, leading to loss-of-function.
Similarly, Arg460 (rs10930046, Arg460His) is conserved in all
vertebrate genomes sequenced, with diverse codons, again
implying amino acid-level selection (Table S10). Comparison with
RIG-I (PDB 3TMI) suggests that in the ancestral protein, Arg460
may form hydrogen bonds with the 419–433 loop, most likely with
the strictly conserved acidic side-chains of Glu425 and Glu428,
and the conserved Gln433 (Figure 4E, 4G). Intriguingly, the
crystal structure of the human IFIH1 ATP-binding (DECH)
domain (PDB 3B6E) incorporates the pervasive rs10930046 risk
mutation. In this structure the His460 side-chain does not make
favorable contacts with the 419–433 loop and much of this loop is
poorly structured. Loss of stabilizing interactions of Arg460 might
lead to weakened structural integrity of the helicase ATP-binding
domain (the 3B6E domain is internally shifted ,1.5 A relative to
the RIG-I structure; Figure 4G), and subsequently with the
helicase C-terminal and RIG-I regulatory domains. DsRNA
binding, which occurs at a site proximal to the rs10930046
mutation (Figure 5A), leads to RIG-I dimerization [39]. The
disruptive nature of the rs10930046 risk allele on overall protein
structural integrity apparently decreases dimerization, as the 3B6E
structure was determined as a monomer (all related structures are
dimers). Indeed it is likely that the rs10930046 risk allele structure
‘‘poisons’’ an ancestral binding partner, leading to a dominant
negative phenotype, consistent with the genetically dominant
model, especially in AA.
The intronic rs13023380 risk allele has no effect on the protein-
coding sequence of IFIH1. The region directly surrounding
rs13023380 is rich in strongly conserved C/G bases (Figure
S6A). Given the binding of the locus to NCL and other nuclear
regulatory proteins, we hypothesized that the site might play a role
in mRNA processing. Modeling of the region around rs13023380
predicts a highly structured pre-mRNA, with strongly favorable
folding free energies (CentroidFold, ncRNA.org) (Figure S6B). In
the ancestral pre-mRNA, the rs13023380 base is part of a highly
structured 7-mer RNA stem with a 7-base loop (Figure S6B). In
the risk allele pre-mRNA, mutation of the conserved rs13023380
base disrupts RNA stem formation, and likely perturbs structure
and stability of the loop (Figure S6C, S6D), which might disrupt
the binding of RNA-binding proteins (such as NCL [40]),
impairing pre-mRNA trafficking and processing.
Discussion
Our whole genome admixture scan identified 7 admixture peaks
associated with SLE in AA, with the strongest at 2q22–24,
containing the IFIH1 gene. Three SNPs (two coding: rs1990760
and rs10930046, and one intronic: rs13023380) accounted for the
increased risk. IFIH1 has been associated with Type 1 diabetes
(T1D) [41], IgA deficiency [18], Graves’ disease [17], and
suggestively linked to SLE [20,42]. The role of IFIH1 in apoptosis
and inflammation makes it potentially critical for SLE progression.
Moreover, allele frequency differences in associated and non-
associated SNPs (high FST values), together with the differences in
the number of rare variants between EA and AA, imply a strong
positive selection in EA (intriguingly, for the SLE-risk alleles at all
three positions), as previously suggested [23]. In AA, local
European ancestry at these loci correlates with increased risk.
Variant rs1990760 has been recently reported to affect
expression of viral resistance genes IFIT1 and MX1 in SLE
patients [29]. The risk allele of rs1990760 positively correlated
with interferon-induced gene expression in SLE patients who were
positive for anti-dsDNA antibodies [29]. Another report on
rs1990760 suggested that the risk allele correlated with increased
expression of IFIH1 in T1D patients [32]. The rs10930046 risk
allele has been implicated in psoriasis susceptibility [43]. Here we
have systematically examined the effects of the two coding SNPs
on immune cell biology, and demonstrated that the rs10930046
risk allele dramatically increases apoptosis, and that both
significantly perturb inflammatory gene profiles. The intronic risk
allele disrupts a transcriptional enhancer that recruits nucleolin,
lupus autoantigen Ku70/80 and HSP90, potentially decreasing
IFIH1 transcript levels. Combined with molecular modeling, our
results strongly suggest that these effects are due to several specific
amino acid and nucleotide substitutions, rather than to indirect
effects due to LD with other SNPs.
SLE is commonly identified with an up-regulation of the
interferon pathway [44]. Intriguingly, our results suggest that the
two non-synonymous IFIH1 mutations down-regulate interferon
signaling. However, recent findings demonstrated that SLE patients
with anti-DNA antibodies have lower serum IFNA levels [29], and
this dose-dependent decrease suggests that there exists a sub-
population of SLE patients with lower serum IFNA levels with
increased IFN sensitivity [36]. Heterogeneity is also observed in
clinical TNFa levels; rs1990760 would seem a likely candidate to be
associated with low TNFa levels in this patient sub-population [45].
Admixture Mapping, IFIH1, and SLE Susceptibility
PLOS Genetics | www.plosgenetics.org 10 February 2013 | Volume 9 | Issue 2 | e1003222

The intronic SNP (rs13023380) discovered in this study has not
been previously implicated in SLE or any other medical condition.
The transcriptional enhancer uncovered in this genomic region,
and the risk allele’s disruption of its activity, opens up new avenues
for investigation. Nucleolin, in addition to contributing to RNA
polymerase 1 function [46], is known to be a principal component
of the B-cell transcription factor complex LR1 [47], which binds
the Ig heavy chain switch region and functions in Ig recombina-
tion. Disruption of nucleolin binding to the rs13023380 risk allele
may dysregulate polymerase binding, IFIH1 transcription, auto-
antibody production and interaction. The region surrounding
rs13023380 is rich in highly conserved C/G bases, which are
preferentially recognized by NCL and Ku70/80 [48,49]. In
addition to perturbing transcription at the locus, molecular
modeling implicates the base substitution in destabilizing non-
spliced mRNA, further altering proper regulation of expression
levels. Nucleolin, as a matrix-binding protein [50], could also
provide a scaffold for matrix and DNA during immunoglobulin
hyper-recombination. Thus in SLE patients, a positive feedback
loop potentially exists where genetic susceptibility creates a
biochemical imbalance, dysregulating NCL, which may then
promote antibody hypermutation and autoantibody production,
further destabilizing the cellular network. Similarly, Ku70/80
facilitates DNA repair and promotes transcription initiation by
complexing with RNA polymerase 1. Disruption of Ku70/80
binding to the rs13023380 locus would be expected to have similar
consequences for autoantibody production and interaction.
Additionally, Ku70/80 mediates the predominant pathway of
non-homologous end joining (NHEJ) during immunoglobulin class
switch recombination (CSR) [51,52]. Our discovery that antibod-
ies directed against NCL and Ku70/80 promote release of dsDNA
by nuclear proteins suggests that in SLE, hallmark autoantibodies
against these two proteins may alter their activity. Thus in SLE
patients, genetic susceptibility could create a biochemical imbal-
ance that dysregulates NCL, Ku70/80, or other nucleic acid
regulatory proteins binding to the rs13023380 locus (and other
DNA sequences). Follow-up studies could systematically explore
the effect of both antibodies and SNP-induced protein mutations
on the DNA-binding and transcriptional properties of a number of
gene products implicated in SLE and other diseases.
From an evolutionary point of view, evidence suggests that IFIH1
is under strong positive selection, especially in EA. The derived
allele of rs10930046 (risk in AA) is highly differentiated in ethnically
diverse populations and allele frequency increases from AA (60%) to
EA (.98%), and may be acting as a protective allele (for some
condition other than SLE). This indicates that at some time point,
the risk allele may have offered competitive advantage to individuals
by increasing apoptosis in defense to new threats of infection
encountered during migrations to the New World from Africa [53].
This selection is evident in an observed gradient of geographical
distribution (Figure S5) of the allele frequency [53]. Therefore, the
different haplotype block structure between the two groups derived
from African and European homozygotes is expected.
To evaluate the epidemiological significance of IFIH1 polymor-
phism in the genetic and ethnic background of SLE in AA and EA
populations, we estimated the joint PAR. The joint PAR from the
three SNPs for AA and EA are 18.1% and 14.7%, respectively.
Most of the increased PAR in AA was attributable to rs1090046
(12.5%). Interestingly, the admixture peak at 2q22–24 is associated
with increased local European ancestry, suggesting that European
ancestry at this locus confers a higher risk of SLE compared to
African ancestry. Indeed, we observed the strongest locus-specific
LOD score at 2q22–24 using a fixed prior risk of 1.5, meaning that
carrying one European ancestry allele confers 1.5 fold increased
risk of SLE relative to having no European ancestry alleles.
Furthermore, we addressed the question whether the locus-specific
ancestry risk ratio calculated from the estimated OR of the three
SNPs in AA and their allele frequencies in ancestral populations
accounts for the European ancestry risk ratio of ,1.5 estimated
from the admixture scan. The total increased ancestry risk (45%)
due to these three SNPs (lrs1990760 = 1.12, lrs10930046 = 1.12,
lrs13023380 = 1.16) were close to the increased risk 50% estimated
from our admixture mapping (l= 1.5). Therefore, the locus-
specific ancestry risk ratio corroborates the ancestry risk ratio
estimated from the admixture scan.
In summary, to our knowledge this is the first study to use a
whole-genome admixture mapping design to identify SLE
susceptibility loci, confirm case-control association analysis in
AA and EA, and identify novel variants within IFIH1 associated
with SLE susceptibility. We report three independently associated
IFIH1 variants with significant ethnic variation, providing a
possible basis for differences in SLE risk between ethnically diverse
populations. In addition, we show allele-specific differential
cellular signaling and predict an in vivo role of Ku70/80 and
NCL autoantibodies that could impair function of IFIH1 by
disrupting DNA binding. Therefore, these results clearly establish
IFIH1 as an SLE susceptibility gene and provide mechanisms for
the IFIH1 variants in SLE etiopathogenesis.
Materials and Methods
Study designWe designed our study in four stages: In Stage 1, we performed a
case-only admixture scan on 1032 AA SLE cases (Figure 1, Table S1)
followed by exploring the largest admixture peak at 2q22–24 with a
more focused candidate gene analysis in both AA and EA populations
(Stage 2), including out-of-study controls from dbGaP for AA (2675)
and EA (6208) to boost statistical power. In Stage 3, an imputation-
based analysis was performed to fine-map our selected gene using
SNPs from ImmunoChip arrays [54]. In Stage 4, we experimentally
tested the biochemical function of associated SNPs in cellular models,
in vitro protein experiments and molecular modeling.
DemographicsFor our admixture mapping (AM), we used 1032 African-
American (AA) SLE cases and 1726 AA controls (Table S1).
Individuals were recruited by the coordinating institutions: Lupus
Family Repository and Registry (LFRR) at the Oklahoma Medical
Research Foundation (OMRF, 540 AA), and the University of
Alabama at Birmingham (UAB) (492 AA) through the PROFILE
study group. Cases fulfilled at least 4 of 11 criteria from the
American College of Rheumatology (ACR) [55,56] based on
medical record review.
In the follow-up case control study (CC), we used both AA
(CCAA: 1525 cases and 1810 controls,) and European-Americans
(EA) (CCEA: 3968 cases and 3542 controls). There was an overlap
of 737 cases between AM and CC. We increased the sample size
using out of study controls from publicly available datasets in
dbGaP [57] (dbGaP see Web Resources), including 942 AA and
2267 EA controls from the Study of Addiction (SAGE); 784 AA
and 1449 EA controls from Health ABC (HABC); 2492 EA
controls from the Wellcome Trust Consortium (WTCCC see Web
Resources); 949 AA controls from the Dallas Heart Study (DHS
see Web Resources) provided by Dr. Helen H. Hobbs. AA and EA
samples were collected by the coordinating institutions: LFRR,
BIOLUPUS, Medical University of South Carolina, the PRO-
FILE study group, the Oklahoma Lupus cohort, the Feinstein
Institute of Medical Research and ODRCC.
Admixture Mapping, IFIH1, and SLE Susceptibility
PLOS Genetics | www.plosgenetics.org 11 February 2013 | Volume 9 | Issue 2 | e1003222

All individuals were de-identified prior to being genotyped.
Within each stage of this experiment, all cases and controls were
independent. This study was approved by the Institutional Review
Boards of the OMRF or the ethical committees at the institutions
where subjects were recruited.
Genotyping and quality controlRigorous quality control (QC) was applied to all data used in
this study. Subjects were excluded from analysis if they had ,95%
genotyping success or were population-stratification outliers. Using
ancestral informative markers (AIMs), we performed principal
components analysis (PCA) using EIGENSOFT [58] (EIGEN-
SOFT see Web Resources) and STRUCTURE [59] (STRUC-
TURE see Web Resources) to identify outliers, hidden population
structure and estimate individual ancestry proportions (European).
Relatedness between individuals was calculated using PLINK [60]
(PLINK see Web Resources) and GCTA [61]. All related and
duplicate individuals (r.0.25) were removed. SNPs were removed
for .10% missing genotyping, being out of Hardy-Weinberg
equilibrium (HWE, P,0.001 in controls) or for poor clustering.
SNPs were also removed for minor allele frequency (MAF) ,1%.
We used AIMs which passed QC, had a minimum intermarker
distance .1 Megabase and were not in linkage disequilibrium
(LD) in the ancestral populations. In addition to these QC
measures, imputed SNPs were included in the analysis only if Rsq
.0.90. This ensures the all high quality imputed SNPs were
included in the analysis.
Genomic DNA samples in AM from SLE patients were
genotyped at OMRF using Affymetrix MALD 3K panel,
including 2154 SNPs that passed QC. Fourteen duplicate
individuals were removed. DHS samples were genotyped by
Perlegen Sciences including 800 AIMs and 10 SNPs within 2q22–
24. Samples in the follow-up CC study were genotyped on a
custom Illumina iSelect platform. SAGE, HABC and WTCCC
genotypes were merged with our data for further QC. PCA was
performed for all samples using 401 SNPs to detect PCA outliers
from SAGE, HABC and WTCCC. We used 163 AIMs to
compare our samples with SAGE, and 755 AIMs to compare our
samples with DHS (Figure S1). After QC, individuals were
removed from analysis if they were related or duplicate (57 AA
and 138 EA), had a missing genotype call rate .5% (19 AA and
361 EA), or were within 2 standard deviations of the mean first
eigenvector (30 AA and 51 EA) (Figure S1). Since we used several
thousand out of study controls from different publicly available
sources [dbGaP (SAGE, HABC) and WTCCC], we had to take
very strict QC. Some from the out of study control samples were
identified as outliers by PCA; these individuals were mainly the
AA samples with .75% European ancestry, and EA samples
with ,90% European ancestry. All SNPs that passed QC were
used in the analysis.
Stage 1: Admixture mappingSNP panel used for admixture mapping. Our initial
marker set was taken from the Smith panel [62], which has been
validated as having little LD in the parental African and European
populations. To optimize these SNPs for our AM study, 1533
AIMs were selected for case-only analysis. We used ANCESTRY-
MAP [7] (ANCESTRYMAP see Web Resources) to check the
plausibility of parental frequencies provided in the prior files. Prior
frequencies with likelihood ratio statistic (S) .10 were replaced
with frequencies of Utah residents from the CEPH collection
representative of north and west European ancestry (CEPH) and
of Nigerian Yorubans (YRI) from the HapMap [63] Project
(HAPMAP see Web Resources). SNPs with S .10 score that were
not represented in HapMap were excluded. All AIMs had at least
a 30% allele difference between African and European popula-
tions. Our final set of AIMs included 1440 SNPs for case-only
analysis, and 800 SNPs for case-control analysis with the average
s (absolute allele frequency differences between 2 ancestry
populations) of 0.56 for both AIM panels.
Admixture mapping. We used ANCESTRYMAP [7] as
the main tool for AM primarily because it gets unique LGS local
scores, which points to a possible association not only at a given
maker but also at any chromosomal position. ANCESTRYMAP
[7] uses a Hidden Markov Model (HMM) for estimating ancestry
along the genome. A Markov Chain Monte Carlo (MCMC) is
used to account for uncertainty in HMM by comparing the
likelihood of each locus as being associated with the disease versus
being a locus unrelated to disease (the log base 10 of this
likelihood ratio is LOD score). To obtain a genome-wide
assessment of a disease locus, a genome-wide score was provided
by averaging the locus specific LOD at each point. We
considered a locus specific LOD score .5 as significant at the
genome-wide level, which is quite conservative considering that a
genome-wide score .2 can be declared significant [3]. ANCES-
TRYMAP requires a disease risk distribution as a prior to be used
in a Bayesian likelihood ratio test. We initially investigated the
genome-wide score under a series of disease risk priors from 0.4
to 3 times increased risk of disease due to one copy of European
ancestry under the multiplicative genetic model. Prior distribu-
tion of risks was given by a gamma distribution with a mean
increase in risk of 1.6-fold, with a standard deviation of 0.3. A
LOD score greater than 2 was considered as suggestive and
greater than 5 was considered to have genome-wide significance
[3,7]. We implemented this prior distribution by testing a grid of
27 risk models from 0.4 to 3.0, weighting the LOD scores
obtained in each model according to the distribution. We ran
ANCESTRYMAP for a burn-in period of 100 iterations with 200
follow-on iterations. In order to narrow down the estimate of
disease risk we used a weighted risk range between 1.3 and 1.6 at
0.01 steps. We repeated the analysis using only females and then
only males. We also repeated the analyses using alternate AIMs
(odd and even) to verify that our results were not influenced by
any individual AIM. To confirm that the chosen risk model
distribution had no effect on our results we ran an unweighted
risk distribution (from 0.4 to 3), as well as a fixed risk model at
1.5.
In order to confirm the existence of the detected peaks, we used
1726 controls with similar parameters as our case-only analysis.
Our case-control analysis used ANCESTRYMAP, which calcu-
lates a Z distributed case-control statistic (Table S2).
We also used the program ADMIXMAP [6] (ADMIXMAP see
Web Resources) to validate our previous results. ADMIXMAP
uses a similar MCMC algorithm as ANCESTRYMAP to model
probability distributions conditional on genotype, phenotypic
values and a priori ancestral genotype frequencies. Models from
ADMIXMAP calculate results in terms of standard normal Z-
statistics and p-values. We applied 20,000 MCMC iterations with
1000 burn-in iterations in ADMIXMAP. Individual admixture
estimates from ANCESTRYMAP were validated using both
ADMIXMAP and STRUCTURE (10,000 MCMC iterations and
50,000 burn-in iterations). ADMIXMAP Z-statistics (and P-values)
were compared to ANCESTRYMAP LOD scores at each
genotyped marker. Tests for Case-only and Case-control design
were carried with both programs. Bearing in mind that the more
powerful Case-only design also had a higher density of variants
[1440 AIMs for ANCESTRYMAP and 1355 AIMs (no AIMs
from X chromosome) for ADMIXMAP, versus 800 AIMs/743
Admixture Mapping, IFIH1, and SLE Susceptibility
PLOS Genetics | www.plosgenetics.org 12 February 2013 | Volume 9 | Issue 2 | e1003222

AIMs for the Case-control design], the peaks identified were at
similar locations of the genome (Table S2).
Computer simulations to evaluate empirical statistical
significance. To evaluate the empirical significance of the case-
only genome-wide LOD score, we simulated 100 replicate data
sets (1032 cases) without the disease locus using ANCESTRY-
MAP. We generated a normal distribution of the best scores
attained and calculated the probability that our best marker score
(6.28) would have occurred by chance.
Stage 2: Follow up of 2q22–24 admixture signal usingCase-Control analysis
After QC our analysis included 1525 AA SLE cases and 1810
AA healthy controls. We genotyped 347 highly informative AIMs
to detect hidden population structure and correct for spurious
associations. To assess robustness of these results we analyzed 3968
EA cases and 3542 EA.
In order to follow the admixture signal within 2q22–24, we
genotyped 284 SNPs from 20 candidate genes. The peak and 95%
CI of the 2q22–24 region spanned about 21 MB. We used logistic
regression in PLINK, with individual admixture estimates as a
covariate to identify and remove individual outliers, and to correct
for admixture and population stratification in our data analysis.
We increased our sample sets using out-of-study controls for a total
of 1525 cases and 4485 controls in AA, and 3968 cases and 9750
controls in EA.
Population structure estimation. We estimated global
admixture proportions of our AA samples using STRUCTURE.
AIMs were selected for each dataset based on the platform in
which they were genotyped. We used 216 AIMs to estimate
admixture proportions in CC AA samples, 755 AIMs for DHS
samples, and 642 AIMs for SAGE and HABC samples. CEPH
and YRI HapMap populations served as fixed prior populations.
The optimal number of admixture components was determined
using methods described by Evanno [64]. Global ancestry of EA
was estimated using 748 common SNPs overlapping all popula-
tions using EIGENSTRAT.
Local ancestry estimation. We estimated local ancestry
proportions for AA and EA using STRUCTURE and corrected
for European ancestry as a covariate in the logistic regression
procedure in PLINK. We only selected markers within the
admixture peak (2q22–24) for correct estimation of our area of
interest. Estimated average European ancestry was similar for AA
cases and controls (17.569.0% vs. 17.369.1%, Pt-test = 0.48). For
AA, we used STRUCTURE with the linkage model, CEPH and
YRI HapMap populations as fixed prior populations with seven
SNPs to estimate the local European ancestral proportions for
DHS, and nine SNPs for SAGE, HABC and WTCCC. We
estimated local ancestry at the three SNPs of interest for Stage1-
AA samples using ANCESTRYMAP with 195 genome-wide
AIMs and averaged their European ancestry proportion. EA
samples with .95% European ancestry were included in analysis.
We confirmed local ancestry estimates for AA samples using a
PCA based local ancestry deconvolution method [65] implement-
ed in PCAdmix. Phased CEPH and YRI HapMap populations
were used as references. Because the aforementioned method
requires phased known haplotypes, we used ten iterations in
BEAGLE [66] to phase AA genotypes (149 SNPs). Local ancestry
estimation was restricted to the coordinates between 138 MB and
164 MB, and created eight moving windows of 20 SNPs. We used
the estimated ancestral state assignment (European or African) to
group individuals with two European haplotypes, mixed haplo-
types, or two African haplotypes, and extracted their genotypes for
rs1990760, rs10930046 and rs13023380. We calculated FST [67]
between CEPH (N = 87), LWK (N = 110), MKK (N = 156),
Ghanaian individuals (N = 92), YRI (N = 147), AA with two
European haplotypes (N = 129), and AA with two African
haplotypes (N = 2124) for each variant using Arlequin [68]. Allele
frequencies were compared to assign the most likely origin of the
risk allele. Additionally we compared the LD structure of these
groups for our three SNPs of interest.
Population stratification. In order to account for the effect of
global population stratification on allelic association in AA, we used
European admixture proportion as a logistic regression covariate. We
used the first four principal components in a logistic regression model to
correct for EA population stratification. Also, to account for the effect
of local admixture on allelic association, we used local ancestry
proportion as a logistic regression covariate for both AA and EA.
Population attributable risk. Population Attributable Risk
(PAR) was estimated for the set of (rs1990760, rs10930046 and
rs13023380) for AA and EA; and for the set (rs1990760 and
rs13023380) for AA and EA. We followed the formula:
PAR~p � (OR{1)
p � (OR{1)z1,
Where p is the frequency of the risk allele for controls, and OR is
the odds ratio for that allele. The joint PAR was calculated as:
Jo int PAR~1{½Pn
i~1(1{PARi)�,
Where n denotes the number of SNPs included in the calculation
[21,69].
Locus-specific ancestry risk. We estimated the locus-
specific ancestry risk ratio (l), defined as the increased disease
risk due to one copy of European ancestry allele at a specific bi-
allelic locus by:
l~
P(aa,Eur=Afr)f (aa)zP(Aa,Eur=Afr)f (Aa)zP(AA,Eur=Afr)f (AA)
P(aa,Afr=Afr)f (aa)zP(Aa,Afr=Afr)f (Aa)zP(AA,Afr=Afr)f (AA)
ð1Þ
where P(aa, Eur=Afr), P(Aa, Eur=Afr) and P(AA, Eur=Afr) are
genotype frequencies for aa, Aa and AA genotypes at the locus
with one copy of the European ancestry allele, respectively; P(aa,
Afr/Afr), P(Aa, Afr/Afr) and P(AA, Afr/Afr) are genotype
frequencies for aa, Aa, AA genotypes at the locus with zero copy
of the European ancestry allele, respectively. The f(aa), f(Aa), f(AA)
denote the disease penetrance for each genotype that we assume
constant between ancestry populations. For our particular case,
‘‘a’’ is used for the protective ‘‘G’’ allele of the three independent
SNPs identified in this study, and ‘‘A’’ stands for the risk allele
‘‘A’’. Let the ‘‘a’’ allele frequency is p and q in European and
African ancestry population, respectively, and assuming HWE
holds for the estimated locus, formula (1) can be further expressed
as:
l~pqf (aa)z(p(1{q)zq(1{p))f (Aa)z(1{q)(1{p)f (AA)
q2f (aa)z2q(1{q)f (Aa)z(1{q)2f (AA)ð2Þ
Dividing the numerator and denominator in equation (1) by f(AA),
we have:
l~pqRR(aa)z(p(1{q)zq(1{p))RR(Aa)z(1{q)(1{p)
q2RR(aa)z2q(1{q)RR(Aa)z(1{q)2ð3Þ
Admixture Mapping, IFIH1, and SLE Susceptibility
PLOS Genetics | www.plosgenetics.org 13 February 2013 | Volume 9 | Issue 2 | e1003222

where RR(aa) and RR(Aa) are the disease relative risk ratio for
genotype aa and Aa compared with AA, respectively. For less
common diseases, like SLE, the relative risk ratio can be further
approximated by odds ratio (OR); therefore, we estimated l as
l~pqOR(aa)z(p(1{q)zq(1{p))OR(Aa)z(1{q)(1{p)
q2OR(aa)z2q(1{q)OR(Aa)z(1{q)2ð4Þ
where OR(aa) and OR(Aa) are the disease odds ratios for the aa
and Aa genotype relative to AA genotype. The OR was estimated
from our case-control analysis in AAs assuming a multiplicative
genetic model and the allele frequencies of the three investigated
SNPs in European and African ancestry populations are approx-
imated by their frequencies in HapMap CEU and YRI samples.Stratified ancestry risk. To assess whether European
ancestry at 2q22–24 is associated with increased disease risk, we
used a subset (N = 716) of our CCAA cases) and repeated our
admixture scan. These samples were also included in our initial
AM that contained the genotype for the most diverse SNP
rs10930046 (FstCEU-YRI = 0.38; InCEU-YRI = 0.23), then we ran an
admixture scan using ANCESTRYMAP separately for the three
different genotypes (NAA = 279, NAG = 323, NGG = 114) using
both a fixed risk model of 1.5, and the previously described
weighted risk model distribution. We compared the LOD score
across genotypes at 2q22–24.
Stage 3: Imputation-based fine-map analysisImputation-based association analysis. In order to opti-
mize the efficiency of our experiment, we performed an
imputation-based analysis on IFIH1. There are two components
to this approach: (i) predicting (‘‘imputing’’) cohort genotypes, and
(ii) analyzing association between cohort genotypes and pheno-
types. In order to impute genotypes for study samples, existing
models for population genetic variation across multiple markers
were leveraged. Imputation was also used to estimate missing
genotypes. Imputation was performed using MACH [22,70],
which provides a quantitative assessment of estimate uncertainty
(r2) [70]. Allelic association results were consistent when account-
ing for imputation uncertainty using mach2dat [71].
A subset of our study samples, both of AA and EA, were
genotyped on the ImmunoChip array, which provides a finer map
with 233 IFIH1 SNPs. To investigate whether there were new
causative variants in the IFIH1 region (162,817,515 to
162,901,398 bp, build 36), we used fine mapped controls as a
reference panel to impute our study samples.
For AA imputation, the target sample set contained 1525 cases
and 1810 controls for AA genotyped for 22 SNPs, 949 DHS
samples with 11 SNPs, 942 SAGE samples with 27 SNPs, and 784
HABC samples with 27 SNPs from IFIH1 (162,817,515 to
162,901,398 bp). Our reference panel had 207 AA controls with
233 SNPs in and around IFIH1. After QC, 123 SNPs were used
for imputation. Imputation results contained 74 SNPs (61 SNPs of
which were not genotyped in the target set) with r2$90% and
MAF.1%. Of these 74 SNPs there were 64 SNPs with P-
values,0.05 and 41 SNPs with P values,561025 (Table S6). The
rationale for using a high threshold for imputation quality
(r2$90%) was to reduce bias due to different genotyping platforms
and different number of variants genotyped on those platforms.
For EA imputation, the target sample contained 3968 cases and
3542 controls with 22 SNPs, 2267 SAGE samples with 27 SNPs,
1449 HABC samples with 27 SNPs, and 2492 samples with six
SNPs in and around IFIH1. Our reference sample had 594
controls with 233 SNPs and 126 SNPs with MAF$1% were used
for imputation (Most of them have low allele frequencies and only
13 SNPs have MAF.5%). As a result of imputation, only 36 SNPs
passed QC(HWE.0.001, MAF$1% and r2$90%). Besides 4
genotyped SNPs with P,0.05, no additional imputed SNP with
P,0.05 was found. (Table S7).
Conditional analysis. In order to identify if there were other
independent SNPs associated to SLE, we performed a conditional
SNP analysis using WHAP [72]. For AA and EA, first we
performed two-SNP pair-wise conditional analysis to identify
independent effect of each SNP, starting with the most significant
SNP. If the most significant SNP does not explain the entire
association of the pair, then the other SNP is considered as
independent SNP. Once we identified all possible independent
SNPs, we then used the same conditional procedure using the two
most significant independent SNPs and so on until all the
associations were explained (Figure 2B, 2C for AA and
Figure 2E, 2F for EA). We also performed conditional logistic
regressions in SAS to reassess the independence of each SNP
identified earlier. We stratified each one of the three variants
(rs13023380, rs10930046 and rs1990760) while including the
other two SNPs in the model as covariates. Independence of each
SNP was determined if the SNPs in the model remained significant
[73]. To see if any haplotype (based on the independent SNPs)
could explain the whole association, we also used conditional
haplotype analysis. The haplotypes were constructed using the EM
algorithm implemented in WHAP.
Stage 4: Experimental validationCloning, site-directed mutagenesis, and transient
transfection. The full length IFIH1 cDNA was fused with a
C-terminal GFP and cloned under a CMV promoter with
neomycin resistance gene in an expression-ready mammalian
expression vector (M46- P receiver; Capital Bioscience, MD see
Web Resources). cDNA sequence was confirmed by sequencing in
both directions.
Site-directed mutagenesis (‘G’.‘A’) was performed indepen-
dently at both rs10930046 and rs1990760 in the parent clone
using the site directed mutagenesis kit (Stratagene see Web
Resources). After mutagenesis, all clones were sequenced in both
directions to confirm the ‘G’.‘A’ conversion at these bases. No
other base modifications were observed. Three clones (ancestral
rs10930046–rs1990760 ‘G-G’, risk for rs10930046 and non-risk
for rs1990760 ‘A-G’ and non-risk for rs1990760 and risk for
rs10930046 ‘G-A’) were obtained and used in the allele-specific
apoptosis and gene expression assays.
Fluorescent activated cell sorting (FACS) analysis for
measurement of apoptosis. Vectors carrying IFIH1 alterna-
tive alleles were transiently transfected in a myeloid leukemia
K562 cell line. Cell survival was measured through an apoptotic
assay (Annexin PE apoptotic kit, Becton Dickinson Bioscience see
Web Resources) in flow cytometry (Fluorescent Activated Cell
Sorting). Cells were stained with Annexin-PE and AAD and were
analyzed as the percentage of cell death among GFP+ cells
(transfected cell count) through Annexin+, and Annexin+ AAD+.
Measurements were taken at 44, 50, 66, 74, 80, 86 and 92 hours.
Only vectors without the IFIH1 gene did not induce apoptosis in
these cells.
Contingency tables were created for the counts of dead cells
versus the count of healthy cells for cells carrying the risk allele ‘A’
versus the protective allele ‘G’. Counts were corrected using the
Yates method when appropriate. We compared the proportion of
dead cells between the ancestral ‘G-G’ for rs10930046–rs1990760,
and the ‘A-G’ and ‘G-A’ cells using a Wilcoxon signed ranked test
with continuity correction [74].
Admixture Mapping, IFIH1, and SLE Susceptibility
PLOS Genetics | www.plosgenetics.org 14 February 2013 | Volume 9 | Issue 2 | e1003222

Expression analysis of apoptosis and inflammation
related genes in IFIH1 overexpressed cells. IFIH1 cDNA
(carrying protective alleles for rs10930046 and rs1990760, or the
risk allele for rs10930046 or rs1990760) were transfected and
GFP+ cells were sorted using FACs. Total RNA was isolated from
these sorted cells, reverse transcribed and subjected to qPCR for:
GAPDH (internal control), IFIH1, NFk-B1, NFk-B2, RELA, TNF,
MAPK8, CASP9, CASP8, IFNA, MAVS, IFIT1 and MX1 genes.
qPCR fold changes were calculated after normalizing with
GAPDH expression. Fold changes in expression of these genes
were again normalized to IFIH1 expression. These experiments
were performed in duplicates, independently repeated three times,
and then differences were analyzed with a paired t-test with
unequal variance. In some of the cases (e.g. IFN beta treatment),
non-transfected controls were also used to prepare cDNA and
qPCR for IFNA and IFIH1 measurement.
Electrophoretic mobility shift assay (EMSA). We ampli-
fied 150-mer DNA sequences surrounding SNP rs130233380 from
homozygous ‘GG’ (protective genotype) and ‘AA’ (risk genotype)
carrying patients using PCR (150-mer, forward primer- 59-
ATAACCATCCAGTTAAGAGATAGG and reverse primer-59
ACTCAAGATGTGATTGCAAAA TAAGG). PCR products
were sequenced to confirm ‘GG’ and ‘AA’ genotype and that
these PCR products did not have any other base modification.
EMSA was performed using non-radioactive EMSA kit (Invitro-
gen,USA see Web Resources) with SYBR which detects DNA at
1 ng sensitivity. Nuclear extracts were prepared from K562 and
Jurkat cell lines with a nuclear extract isolation kit (EpiQuik
Nuclear Extraction Kit, Epigentek, USA). Both PCR amplified
DNA sequences were purified and incubated with the nuclear
extracts for 25 minutes at 25uC with increasing the amount of
nuclear extract. Reaction mixtures were loaded in 2.2% agarose
gel (Figure 4B) and 2.5% agarose gel (Figure 4C), where a 150-mer
DNA was separated out from the 150-mer free DNA. Non-specific
DNA is a 140-mer PCR product from bisulfate treated genomic
DNA that does not occur in the cell. DNA bands were visualized
with the dye SYBR. Intensity (as a measure of DNA quantity) of
the shifted band and free DNA bands were calculated with
TOTALLABQUANT (Totallabquant Limited, UK see Web
Resources) for each lane. The ratio of DNA quantity for the
shifted band to the free DNA band in each lane was calculated as a
measure of binding efficiency.
Identification of proteins from EMSA complex by 2D
electrophoresis. EMSA reactions were performed in large
scale as described above, and a native PAGE gel (precast, 4–15%,
Biorad laboratories) was run in the first dimension. Gels were
stained with SYBR Green to locate the DNA-bound protein band
(Figure S4A). For the second dimension, the gel was rotated 90
degrees and continued to run for 6 hours and again stained with
SYBR green to locate the position of DNA-bound protein band
(Figure S4B). The same gel was stained with Coomassie protein
stain (Figure S4C), and the protein band aligned with the DNA
bound band (arrow). Bands were excised from the gel and
sequenced in a mass spectrometry core facility (LMBCR see Web
Resources). Gel bands were digested with Trypsin and used for
MASS spectrometry sequencing with HPLC and MS/MS analysis
by the Dionex UltiMate 3000 and ABI MDS Sciex Qstar Elite,
respectively. Data obtained from these analyses were submitted to
the MASCOT (Matrix Science) server for protein identification
against the SwissProt protein database (2011). These bands
constituted Nucleolin (NCL), Ku70 (XRCC5), and Ku80 (XRCC6)
as major constituents of nuclear protein (Table S11).
Identification of proteins from EMSA complex by
immobilized streptavidin agarose beads. EMSA reactions
were performed in large scale (106) with PCR products with
biotin-labeled primers for rs13023380 of IFIH1 and rs1143679 of
ITGAM as control. EMSAs were confirmed as described earlier
using aliquots of these reactions. Streptavidin coated agarose beads
(Invitrogen, USA) were added and incubated with gentle rotary
shaking for 1 hour to bind biotinylated DNA bound proteins with
streptavidin beads. Unbound cellular proteins were removed with
repeated washing (106) with 16EMSA buffer by centrifugation.
SDS-PAGE protein dye was added to beads and heated to 95uCand spun for 5 minutes to take supernatant as eluent. Both beads
and eluents were fractionated in an SDS-PAGE gel to separate the
component proteins in separate bands. Gels were stained with
Coomassie blue for proteins, and a distinct band was visible
(Figure S4D; arrow) that was not present in ITGAM control. This
band yielded NCL as a major constituent of the band (Table S11).
Release of EMSA bound DNA by anti-Nucleolin and anti-
Ku70/80 antibodies. EMSA was performed with Jurkat cell
nuclear extract using the same PCR products but with a reduced
proportion to ensure all DNA was bound with protein and no free
DNA was left. This protein-bound DNA was equally divided into
several aliquots and antibodies against Actin, NCL, Ku70/80, or
HSP90AA1/HSP90AB1 were added to each tube and incubated
for 1 hour at room temperature. The 2.5% agarose gel was run,
stained with SYBR Green, and photographed. The free DNA
band again appeared in the lane where NCL or Ku70/80
antibodies were added.
EMSA with purified recombinant protein of Nucleolin and
Ku70/Ku80. EMSA was performed using the same PCR
products carrying ‘G’ or ‘A’ allele of rs13023380 with purified
recombinant protein, NCL (from insect cells, ABCAM, USA) and
Ku70/80 (from insect cells, Biorbyt, UK). Protein-bound DNA
was shifted, and confirmed specific binding of those proteins with
the specific DNA fragments.
Luciferase assay. The exact sequence for risk and protective
allele that were used for EMSA were cloned before a minimal TKmin
(Thymidylate Kinase) promoter-carrying vector expressing luciferase.
HeLa cells were transiently transfected with only the vector, vector
carrying only MCS (Multiple cloning sites), and risk and protective
allele carrying 150-mer DNA sequences. Luciferase activity was
measured (Xactagen Inc, USA) after 48 hrs of transfection using
Gaussia Luciferase Assay (GLOW) with the Gaussia luciferase assay
kit (catalog # 31001, Xactagen, LLC) per manufacturer’s directions.
Medium was aspirated from transfected cells, plated in white 96-well
assay plates. Cells were washed once by addition and aspiration of
100 uL of GLum.1 assay buffer. 50 uL of GLum.1 assay reagent
(assay buffer plus coelenterazine substrate) was then added to each
well and incubated (dark) for 5 minutes prior to reading luminescence
(SpectraMax L, Molecular Devices: 475 nm).
Each experiment had three replicates at each time interval, and
each experiment was repeated eight times, thus totaling 24 data
points for each construct. These measurements (Relative Luminis-
cence Units) were normalized to a ‘cell-only’ control. After
normalization, the average values were used to draw the bar chart
and statistical significance was calculated using a two-sided
unequal variance t-test.
Conservation of the protective alleles across
genomes. Available genome sequences for IFIH1 were down-
loaded from the UCSC Genome Browser (USCS see Web
Resources). In some cases sequences were missing from the
alignment or obviously incomplete or incorrect (e.g. missing exons
or having long regions of non-homologous sequence). In these
cases genomic sequences were obtained from the NCBI sequenc-
ing Trace Archive (BLAST [75] see Web Resources) and aligned
using ClustalW [76] (ClustalW see Web Resources).
Admixture Mapping, IFIH1, and SLE Susceptibility
PLOS Genetics | www.plosgenetics.org 15 February 2013 | Volume 9 | Issue 2 | e1003222

Molecular modeling. Structure files were retrieved from the
Protein Data Bank (Protein Data Bank see Web Resources):
3TMI: human RIG-I bound to dsRNA. X-ray diffraction to
2.9 A.
4A2W: duck RIG-I without nucleic acid. X-ray diffraction to
3.7 A.
3B6E: human IFIH1, DECH (helicase ATP-binding) domain,
incorporating translated rs10930046 risk allele. X-ray diffraction
to 1.6 A.
2RQB: human IFIH1, helicase C-terminal domain, incorpo-
rating translated rs1990760 protective allele. NMR.
All protein structural figures were rendered in PyMOL
(PyMOL see Web Resources).
Single-stranded RNA (pre-mRNA) secondary structure predic-
tion was performed using CentroidFold [77].
Web resourcesThe URLs for the data presented here are as follows:
PLINK, http://pngu.mgh.harvard.edu/,purcell/plink
STRUCTURE, http://pritch.bsd.uchicago.edu/structure.html
EIGENSOFT, http://genepath.med.harvard.edu/,reich/
Software.htm
ANCESTRYMAP, http://genepath.med.harvard.edu/
,reich/Software.htm
ADMIXMAP, http://homepages.ed.ac.uk/pmckeigu/
admixmap
MACH, http://www.sph.umich.edu/csg/abecasis/MACH/
index.html
HAPMAP, http://www.hapmap.org
dbGaP, http://www.ncbi.nlm.nih.gov/gap
Wellcome Trust Consortium, http://www.wtccc.org.uk
DHS, http://clinicaltrials.gov/ct2/show/NCT00344903
Ingenuity Pathway Analysis, http://www.ingenuity.com
Capital Bioscience, MD: http://www.capitalbiosciences.com/
Becton Dickinson Bioscience: http://www.bd.com/
Stratagene: www.stratagene.com/
Invitrogen,USA: www.invitrogen.com
Totallabquant: http://www.totallab.com
UCSC Genome Browser: http://genome.ucsc.edu
NCBI sequencing Trace Archive: http://blast.ncbi.nlm.nih.gov
ClustalW: http://www.clustal.org/clustal2/
Protein Data Bank: http://www.rcsb.org
PyMOL: http://www.pymol.org/
CentroidFold: http://www.ncrna.org
LMBCR: www.ouhsc.edu/lmbcr
miRBase: http://www.mirbase.org/
Supporting Information
Figure S1 PCA-based population structure for AA and EA. We
maximized the number of ancestral informative markers (AIMs)
given these datasets were genotyped in different platforms: (A) 755
SNPs for CCAA and DHS AA samples, (B) first 2 principal
components using 163 SNPs for AA samples (SAGE and CCAA),
(C) 401 SNPs EA and AA samples (SAGE, HABC and WTCCC).
(PDF)
Figure S2 Linkage disequilibrium blocks for AA African and AA
European haplotypes. Linkage disequilibrium blocks for African-
American (AA) individuals with 2 African haplotypes (AAAFR,
N = 2124), AA with 2 European Haplotypes (AAEUR, N = 129),
AA controls (N = 4485), HAPMAP CEPH (CEPH, N = 87), EA
controls (N = 9750), HAPMAP Yoruba from Nigeria (YRI,
N = 153), HAPMAP Luhya from Kenya (LWK, N = 110), and
HAPMAP Masaai from Kenya (MKK, N = 156), and Ghana
samples (N = 92). Values and color pattern shown on gray-scale
were based on R-square between each pair of SNPs, values and
colors shown in red were based on D9 between each pair of SNPs.
(PDF)
Figure S3 Gene network related to IFIH1. Solid lines show
direct interactions, dashed lines show indirect relationships.
(PDF)
Figure S4 Identification of proteins from EMSA. (A) EMSA
reaction was run in native PAGE gel and stained with SYBR to
locate protein-bound DNA band (arrow). (B) Marker was excised
from the gel and gel is rotated to 90 degree, ran again and stained
with SYBR green to locate 2 d protein-bound DNA band (arrow).
(C) The same gel was stained with Coomassie for visualizing
protein and aligned DNA-bound protein band was excised and
sequenced by MASS-spectometry. (D) EMSA bound biotinylated
DNA-proteins complex were pulled down with streptavidin coated
agarose beads and fractionated in an SDS-PAGE gel. Protein
bands that were present only in IFIH1 (arrows) in comparison to
ITGAM (control) were sequenced. (E) The addition of the
respective antibodies facilitated release of free DNA from the
EMSA bound complex. Here EMSA was saturated such that there
was no free DNA (EMSA lane). EMSA bound DNA was divided
to 4 aliquots and antibodies were added in each tube, incubated
for 1 hr and loaded in a native PAGE gel. Distinct free DNAs
were released in the anti-NCL and anti-KU70/80 lanes, but not in
the anti-actin lane. (F) EMSA was performed using nuclear protein
extracts from Jurkat cells with 141-bp PCR products including
either the protective ‘G’ or risk ‘A’ sequence at rs13023380. Both
‘G’ and ‘A’ allele-containing PCR products bound to a protein
complex in the nuclear extracts. However, the ‘A’ allele bound
with at least 2-fold reduced efficiency compared to the ‘G’ allele-
carrying PCR product, as measured by the intensity of the shifted
band relative to the free DNA band in the same lane. As a
nonspecific (NS) DNA control, a 140-bp DNA sequence not
present in the genome was created by PCR amplification of
bisulfite-modified genomic DNA.
(PDF)
Figure S5 Geographical distribution of allele frequencies for our
3 independently associated SNPs in IFIH1. Allele frequency
differences between populations of the Human Genome Diversity
Project for our three independent SNPs of interest show a south-
to-north gradient of increase in allele frequency of derived (risk)
alleles. Source HGDP Selection browser (http://hgdp.uchicago.
edu/cgi-bin/gbrowse/HGDP/) (accessed January 2012).
(PDF)
Figure S6 Alignment of genomic region surrounding
rs13023380 for available primate genomes. (A) The base
corresponding to rs13023380 is universally conserved as ‘G’.
Sequence is shown reverse complement, in the direction of the
pre-mRNA. (B) Nucleolin, in addition to binding dsDNA, is also a
sequence-specific ssRNA-binding protein, particularly of intronic
pre-mRNA species, controlling their processing and trafficking
[40]. Loss of pre-mRNA structure may impair trafficking and
splicing. The region of single-stranded pre-mRNA surrounding
rs13023380 is predicted to have a great degree of secondary
structure, with a strongly favorable folding free energy. Secondary
structure prediction is shown from CentroidFold (ncrna.org); a
,1 kb fragment surrounding the rs13023380 locus was used for
alignment and RNA folding. Aligned sequences of human,
chimpanzee, gorilla, and orangutan were used for folding. (C)
The rs13023380 risk allele sequence disrupts formation of a
strongly conserved stem-loop structure, and globally disrupts RNA
Admixture Mapping, IFIH1, and SLE Susceptibility
PLOS Genetics | www.plosgenetics.org 16 February 2013 | Volume 9 | Issue 2 | e1003222

folding. (D) Control RNA folding experiment with reverse
complement sequence shows little secondary structure and
essentially zero folding free energy, consistent with pre-mRNA
reading direction in the ‘‘sense’’ orientation of (A)–(C). For all
panels, heat color shows the probability of base pair formation,
from 0 (blue) to 1 (red).
(PDF)
Table S1 Overview of study design, samples sizes, ethnicity and
demographics. Our study comprised admixture mapping on
African Americans (AA), followed by a case-control study on AA
and individuals of European Ancestry (EA). Data sources:
Oklahoma Medical Research Foundation (OMRF); Dallas Heart
Study (DHS); University of Alabama at Birmingham (UAB); Study
of Addiction Gene x Environment (SAGE); Health ABC (HABC);
Wellcome Trust Consortium Case Control Study (WTCC). CCAA
and CCEA are cases and controls from AA and EA samples
genotyped at OMRF.
(DOCX)
Table S2 Admixture mapping signals generated by ANCES-
TRYMAP and ADMIXMAP using a low-density or high-density
map. We report logarithm of odds (LOD) scores for ANCES-
TRYMAP in case-only design, and P-values for significance
derived from the Z-distributed case-control statistic from ANCES-
TRYMAP and ADMIXMAP. The 95% confidence interval (CI)
for each peak was calculated where the ANCESTRYMAP local
ancestry significantly deviated from the mean global European.
The strongest peak was found at 2q22.2–q24.3, spanning 21
megabases (MB).
(DOCX)
Table S3 Rationale for selecting 20 candidate genes at 2q22–24.
In order to follow-up the peak at 2q22–24, we chose 20 genes to
target on the basis of previous information about their function
and reported clinical associations related with SLE. Positions
based on genome build 36.
(DOCX)
Table S4 Follow-up case-control association results. Case-
control association results for the follow-up study at selected
candidate genes from the strongest admixture peak (2q22–q24)
using 1525 cases and 1810 controls from CCAA and 3968 cases
and 3542 controls from CCEA pinpoint IFIH1 as a candidate gene
for SLE. * Allele frequencies given correspond to the A1 allele.
Local ancestry correction is labeled as Pc, whereas P-value refers
to the uncorrected value.
(DOCX)
Table S5 Genetic models of association of IFIH1 with SLE.
Genetic models at each independent SNP for African-Americans
(AA) and European-Americans (EA) show that the best model for
rs1990760 and rs130233890 are allelic, and dominant for
rs10930046. The best model was chosen using the Akaike
information criterion (AIC).
(DOCX)
Table S6 Imputation based association analysis for African
Americans (N = 1525 cases; 4485 controls). Pc denotes the local
ancestry-corrected P-value. ‘Rsq denotes the quality measure of
the squared correlation between imputed and true genotypes. *
denotes the 11 SNPs that were genotyped in DHS controls.
(DOCX)
Table S7 Imputation based association analysis for European
Americans (N = 3968 cases; 9750 controls). ‘Rsq denotes the
quality measure of the squared correlation between imputed and
true genotypes. Pc stands for the P-value corrected for local
ancestry.
(DOCX)
Table S8 Risk allele frequencies and Fst values between
populations for three IFIH1 SNPs. Local ancestry at three SNPs
in IFIH1 was estimated for AA. Individuals whose ancestral state
was European (N = 129) and African (N = 2124) were selected, and
their risk allele (‘‘A’’) frequency compared with allele frequencies
in CEPH and YRI. FST was calculated between these groups.
(DOCX)
Table S9 Alignment of genomic region surrounding rs1990760
for available mammal genomes. The base corresponding to
rs1990760 is nearly universally conserved as ‘‘G’’, with a resulting
alanine codon. Sequence is shown reverse complement, in the
direction of the reading frame, showing five codons in either
direction. Squirrel may have a threonine (Thr) side-chain;
interestingly, tenrec may have a 2-amino acid deletion. Alignment
of Chr2: 163124034–163124066, 33 bps (reverse complement).
(DOCX)
Table S10 Alignment of genomic region surrounding
rs10930046 for available vertebrate genomes. The base corre-
sponding to rs10930046 is universally conserved as ‘‘G’’, with a
resulting arginine codon. Sequence is shown reverse complement,
in the direction of the reading frame, showing five codons in either
direction. Alignment of Chr2: 163137967–163137999, 33 bps
(reverse complement).
(DOCX)
Table S11 Mass Spectrometry sequencing and MASCOT
database searches of 2D-gel and streptavidin agarose beads of
EMSA.
(DOCX)
Text S1 Additional list of investigators.
(DOCX)
Acknowledgments
We are grateful to the affected and unaffected individuals who participated
in this study. We thank the research assistants, coordinators, and physicians
who helped in the recruitment of subjects, including the individuals in the
coordinating projects, the LFRR, and the PROFILE Study group. We
thank Dr. Peter K. Gregersen for providing some of the control samples
used in this study. We thank Dr. Helen H. Hobbs for providing the
genotype data from the Dallas Heart Study used for admixture mapping
and subsequent case control analysis. We also thank Drs. Paul McKeigue,
David Reich, Hemant Tiwari, Indrani Halder, and Harshal Deshmukh for
their help in troubleshooting while running and interpreting ANCES-
TRYMAP and ADMIXMAP software. We acknowledge multiple lively
discussions with Dr. Nick Patterson in analyzing data and interpreting
results regarding the ancestry association. We are grateful to J. Donald
Capra, M.D., and John Knight, Ph.D., for critical reading and helpful
comments on this manuscript. Finally, we are indebted to the two
anonymous reviewers for their constructive comments which definitely
improved the quality of this manuscript.
Author Contributions
Conceived and designed the experiments: SKN. Performed the experi-
ments: AKM JEM. Analyzed the data: JEM CS SH SG XK-H LLL.
Contributed reagents/materials/analysis tools: JBH KMK JAK AA SG CS
CLL PMG JAJ MEA-R TBN EEB RR-G GSA MP JDR LMV BPT BIF
LAC COJ KLM JCE JMG TJV GSG JTM JHM SMW RHS RPK. Wrote
the paper: JEM AKM LLL SKN.
Admixture Mapping, IFIH1, and SLE Susceptibility
PLOS Genetics | www.plosgenetics.org 17 February 2013 | Volume 9 | Issue 2 | e1003222

References
1. Helmick CG, Felson DT, Lawrence RC, Gabriel S, Hirsch R, et al. (2008)
Estimates of the prevalence of arthritis and other rheumatic conditions in theUnited States. Part I. Arthritis Rheum 58: 15–25.
2. Chakraborty R, Weiss KM (1988) Admixture as a Tool for Finding Linked Genes and
Detecting That Difference from Allelic Association between Loci. Proceedings of theNational Academy of Sciences of the United States of America 85: 9119–9123.
3. Reich D, Patterson N (2005) Will admixture mapping work to find disease
genes? Philos Trans R Soc Lond B Biol Sci 360: 1605–1607.
4. Seldin MF (2007) Admixture mapping as a tool in gene discovery. Curr OpinGenet Dev 17: 177–181.
5. Winkler CA, Nelson GW, Smith MW (2010) Admixture mapping comes of age.
Annu Rev Genomics Hum Genet 11: 65–89.
6. Hoggart CJ, Shriver MD, Kittles RA, Clayton DG, McKeigue PM (2004)Design and analysis of admixture mapping studies. Am J Hum Genet 74: 965–
978.
7. Patterson N, Hattangadi N, Lane B, Lohmueller KE, Hafler DA, et al. (2004)Methods for high-density admixture mapping of disease genes. Am J Hum
Genet 74: 979–1000.
8. Montana G, Pritchard JK (2004) Statistical tests for admixture mapping with
case-control and cases-only data. American journal of human genetics 75: 771–789.
9. Seldin MF, Pasaniuc B, Price AL (2011) New approaches to disease mapping in
admixed populations. Nat Rev Genet 12: 523–528.10. Kao WHL, Klag MJ, Meoni LA, Reich D, Berthier-Schaad Y, et al. (2008)
MYH9 is associated with nondiabetic end-stage renal disease in African
Americans. Nature Genetics 40: 1185–1192.
11. Fejerman L, Chen GK, Eng C, Huntsman S, Hu DL, et al. (2012) Admixturemapping identifies a locus on 6q25 associated with breast cancer risk in US
Latinas. Human Molecular Genetics 21: 1907–1917.
12. Freedman ML, Haiman CA, Patterson N, McDonald GJ, Tandon A, et al.(2006) Admixture mapping identifies 8q24 as a prostate cancer risk locus in
African-American men. Proc Natl Acad Sci U S A 103: 14068–14073.
13. Hinch AG, Tandon A, Patterson N, Song Y, Rohland N, et al. (2011) Thelandscape of recombination in African Americans. Nature 476: 170–175.
14. Gabriel SB, Schaffner SF, Nguyen H, Moore JM, Roy J, et al. (2002) The
structure of haplotype blocks in the human genome. Science 296: 2225–2229.
15. Pritchard JK, Stephens M, Donnelly P (2000) Inference of population structureusing multilocus genotype data. Genetics 155: 945–959.
16. Smyth DJ, Cooper JD, Bailey R, Field S, Burren O, et al. (2006) A genome-wide
association study of nonsynonymous SNPs identifies a type 1 diabetes locus inthe interferon-induced helicase (IFIH1) region. Nature genetics 38: 617–619.
17. Sutherland A, Davies J, Owen CJ, Vaikkakara S, Walker C, et al. (2007)
Genomic polymorphism at the interferon-induced helicase (IFIH1) locuscontributes to Graves’ disease susceptibility. J Clin Endocrinol Metab 92:
3338–3341.
18. Ferreira RC, Pan-Hammarstrom Q, Graham RR, Gateva V, Fontan G, et al.(2010) Association of IFIH1 and other autoimmunity risk alleles with selective
IgA deficiency. Nat Genet 42: 777–780.
19. Nejentsev S, Walker N, Riches D, Egholm M, Todd JA (2009) Rare variants ofIFIH1, a gene implicated in antiviral responses, protect against type 1 diabetes.
Science 324: 387–389.
20. Cunninghame Graham DS, Morris DL, Bhangale TR, Criswell LA, Syvanen
AC, et al. (2011) Association of NCF2, IKZF1, IRF8, IFIH1, and TYK2 withsystemic lupus erythematosus. PLoS Genet 7: e1002341. doi:10.1371/journal.p-
gen.1002341
21. Bruzzi P, Green SB, Byar DP, Brinton LA, Schairer C (1985) Estimating thepopulation attributable risk for multiple risk factors using case-control data.
Am J Epidemiol 122: 904–914.
22. Li Y, Willer CJ, Ding J, Scheet P, Abecasis GR (2010) MaCH: using sequenceand genotype data to estimate haplotypes and unobserved genotypes. Genet
Epidemiol.
23. Fumagalli M, Cagliani R, Riva S, Pozzoli U, Biasin M, et al. (2010) PopulationGenetics of IFIH1: Ancient Population Structure, Local Selection, and
Implications for Susceptibility to Type 1 Diabetes. Molecular Biology andEvolution 27: 2555–2566.
24. Kato H, Takeuchi O, Sato S, Yoneyama M, Yamamoto M, et al. (2006)
Differential roles of MDA5 and RIG-I helicases in the recognition of RNA
viruses. Nature 441: 101–105.25. Lin L, Su Z, Lebedeva IV, Gupta P, Boukerche H, et al. (2006) Activation of
Ras/Raf protects cells from melanoma differentiation-associated gene-5-induced
apoptosis. Cell death and differentiation 13: 1982–1993.
26. Kang DC, Gopalkrishnan RV, Lin L, Randolph A, Valerie K, et al. (2004)Expression analysis and genomic characterization of human melanoma
differentiation associated gene-5, mda-5: a novel type I interferon-responsiveapoptosis-inducing gene. Oncogene 23: 1789–1800.
27. Jiang F, Ramanathan A, Miller MT, Tang GQ, Gale M, Jr., et al. (2011)
Structural basis of RNA recognition and activation by innate immune receptorRIG-I. Nature 479: 423–427.
28. van Bavel CC, Dieker JW, Kroeze Y, Tamboer WP, Voll R, et al. (2011)
Apoptosis-induced histone H3 methylation is targeted by autoantibodies insystemic lupus erythematosus. Annals of the Rheumatic Diseases 70: 201–207.
29. Robinson T, Kariuki SN, Franek BS, Kumabe M, Kumar AA, et al. (2011)
Autoimmune Disease Risk Variant of IFIH1 Is Associated with IncreasedSensitivity to IFN-{alpha} and Serologic Autoimmunity in Lupus Patients.
Journal of immunology 187: 1298–1303.
30. Yu CY, Chiang RL, Chang TH, Liao CL, Lin YL (2010) The interferon
stimulator mitochondrial antiviral signaling protein facilitates cell death bydisrupting the mitochondrial membrane potential and by activating caspases.
J Virol 84: 2421–2431.
31. Mukherjee A, Morosky SA, Delorme-Axford E, Dybdahl-Sissoko N, ObersteMS, et al. (2011) The coxsackievirus B 3C protease cleaves MAVS and TRIF to
attenuate host type I interferon and apoptotic signaling. PLoS Pathog 7:e1001311. doi: 10.1371/journal.ppat.1001311
32. Downes K, Pekalski M, Angus KL, Hardy M, Nutland S, et al. (2010) Reduced
expression of IFIH1 is protective for type 1 diabetes. PLoS ONE 5: e12646.
doi:10.1371/journal.pone.0012646
33. Kumar H, Kawai T, Akira S (2009) Pathogen recognition in the innate immuneresponse. Biochem J 420: 1–16.
34. Tamassia N, Le Moigne V, Rossato M, Donini M, McCartney S, et al. (2008)
Activation of an immunoregulatory and antiviral gene expression program inpoly(I:C)-transfected human neutrophils. Journal of immunology 181: 6563–
6573.
35. Gerardin JA, Baise EA, Pire GA, Leroy MP, Desmecht DJ (2004) Genomicstructure, organisation, and promoter analysis of the bovine (Bos taurus) Mx1
gene. Gene 326: 67–75.
36. Weckerle CE, Franek BS, Kelly JA, Kumabe M, Mikolaitis RA, et al. (2011)Network analysis of associations between serum interferon-alpha activity,
autoantibodies, and clinical features in systemic lupus erythematosus. Arthritis
and rheumatism 63: 1044–1053.
37. Minota S, Jarjour WN, Suzuki N, Nojima Y, Roubey RA, et al. (1991)Autoantibodies to nucleolin in systemic lupus erythematosus and other diseases.
Journal of immunology 146: 2249–2252.
38. Routsias JG, Tzioufas AG, Moutsopoulos HM (2004) The clinical value ofintracellular autoantigens B-cell epitopes in systemic rheumatic diseases. Clinica
chimica acta; international journal of clinical chemistry 340: 1–25.
39. Cui S, Eisenacher K, Kirchhofer A, Brzozka K, Lammens A, et al. (2008) TheC-terminal regulatory domain is the RNA 59-triphosphate sensor of RIG-I. Mol
Cell 29: 169–179.
40. Ghisolfi-Nieto L, Joseph G, Puvion-Dutilleul F, Amalric F, Bouvet P (1996)
Nucleolin is a sequence-specific RNA-binding protein: characterization oftargets on pre-ribosomal RNA. Journal of molecular biology 260: 34–53.
41. Aminkeng F, Van Autreve JE, Weets I, Quartier E, Van Schravendijk C, et al.
(2009) IFIH1 gene polymorphisms in type 1 diabetes: genetic association analysisand genotype-phenotype correlation in the Belgian population. Hum Immunol
70: 706–710.
42. Gateva V, Sandling JK, Hom G, Taylor KE, Chung SA, et al. (2009) A large-scale replication study identifies TNIP1, PRDM1, JAZF1, UHRF1BP1 and
IL10 as risk loci for systemic lupus erythematosus. Nat Genet 41: 1228–1233.
43. Li Y, Liao W, Cargill M, Chang M, Matsunami N, et al. (2010) Carriers of rare
missense variants in IFIH1 are protected from psoriasis. The Journal ofinvestigative dermatology 130: 2768–2772.
44. Baechler EC, Batliwalla FM, Karypis G, Gaffney PM, Ortmann WA, et al.
(2003) Interferon-inducible gene expression signature in peripheral blood cells ofpatients with severe lupus. Proc Natl Acad Sci U S A 100: 2610–2615.
45. Zhu L, Yang X, Chen W, Li X, Ji Y, et al. (2007) Decreased expressions of the
TNF-alpha signaling adapters in peripheral blood mononuclear cells (PBMCs)are correlated with disease activity in patients with systemic lupus erythematosus.
Clin Rheumatol 26: 1481–1489.
46. Bouche G, Caizergues-Ferrer M, Bugler B, Amalric F (1984) Interrelationsbetween the maturation of a 100 kDa nucleolar protein and pre rRNA synthesis
in CHO cells. Nucleic acids research 12: 3025–3035.
47. Hanakahi LA, Dempsey LA, Li MJ, Maizels N (1997) Nucleolin is one
component of the B cell-specific transcription factor and switch region bindingprotein, LR1. Proceedings of the National Academy of Sciences of the United
States of America 94: 3605–3610.
48. Miranda GA, Chokler I, Aguilera RJ (1995) The murine nucleolin protein is aninducible DNA and ATP binding protein which is readily detected in nuclear
extracts of lipopolysaccharide-treated splenocytes. Exp Cell Res 217: 294–308.
49. Okuya K, Tamura Y, Saito K, Kutomi G, Torigoe T, et al. (2010)Spatiotemporal regulation of heat shock protein 90-chaperoned self-DNA and
CpG-oligodeoxynucleotide for type I IFN induction via targeting to static early
endosome. Journal of immunology 184: 7092–7099.
50. Dickinson LA, Kohwi-Shigematsu T (1995) Nucleolin is a matrix attachmentregion DNA-binding protein that specifically recognizes a region with high base-
unpairing potential. Mol Cell Biol 15: 456–465.
51. Kotnis A, Du L, Liu C, Popov SW, Pan-Hammarstrom Q (2009) Non-homologous end joining in class switch recombination: the beginning of the end.
Philos Trans R Soc Lond B Biol Sci 364: 653–665.
52. Kracker S, Imai K, Gardes P, Ochs HD, Fischer A, et al. (2010) Impairedinduction of DNA lesions during immunoglobulin class-switch recombination in
humans influences end-joining repair. Proceedings of the National Academy of
Sciences of the United States of America 107: 22225–22230.
Admixture Mapping, IFIH1, and SLE Susceptibility
PLOS Genetics | www.plosgenetics.org 18 February 2013 | Volume 9 | Issue 2 | e1003222
53. Vasseur E, Patin E, Laval G, Pajon S, Fornarino S, et al. (2011) The selective
footprints of viral pressures at the human RIG-I-like receptor family. Humanmolecular genetics 20: 4462–4474.
54. Polychronakos C (2011) Fine points in mapping autoimmunity. Nature genetics
43: 1173–1174.55. Hochberg MC (1997) Updating the American College of Rheumatology revised
criteria for the classification of systemic lupus erythematosus. Arthritis Rheum40: 1725.
56. Tan EM, Cohen AS, Fries JF, Masi AT, McShane DJ, et al. (1982) The 1982
revised criteria for the classification of systemic lupus erythematosus. ArthritisRheum 25: 1271–1277.
57. Mailman MD, Feolo M, Jin Y, Kimura M, Tryka K, et al. (2007) The NCBIdbGaP database of genotypes and phenotypes. Nat Genet 39: 1181–1186.
58. Patterson N, Price AL, Reich D (2006) Population structure and eigenanalysis.PLoS Genet 2: e190. doi:10.1371/journal.pgen.0020190
59. Pritchard JK, Rosenberg NA (1999) Use of unlinked genetic markers to detect
population stratification in association studies. Am J Hum Genet 65: 220–228.60. Purcell S, Neale B, Todd-Brown K, Thomas L, Ferreira MA, et al. (2007)
PLINK: a tool set for whole-genome association and population-based linkageanalyses. Am J Hum Genet 81: 559–575.
61. Yang J, Lee SH, Goddard ME, Visscher PM (2011) GCTA: a tool for genome-
wide complex trait analysis. American journal of human genetics 88: 76–82.62. Smith MW, Patterson N, Lautenberger JA, Truelove AL, McDonald GJ, et al.
(2004) A high-density admixture map for disease gene discovery in africanamericans. Am J Hum Genet 74: 1001–1013.
63. Consortium TIH (2003) The International HapMap Project. Nature 426: 789–796.
64. Evanno G, Regnaut S, Goudet J (2005) Detecting the number of clusters of
individuals using the software STRUCTURE: a simulation study. Mol Ecol 14:2611–2620.
65. Brisbin AG (2010) Linkage analysis for categorical traits and ancestry assignmentin admixed individuals.
66. Browning SR, Browning BL (2007) Rapid and accurate haplotype phasing and
missing-data inference for whole-genome association studies by use of localizedhaplotype clustering. American journal of human genetics 81: 1084–1097.
67. Weir BS, Cardon LR, Anderson AD, Nielsen DM, Hill WG (2005) Measures of
human population structure show heterogeneity among genomic regions.Genome Res 15: 1468–1476.
68. Excoffier L, Lischer HE (2010) Arlequin suite ver 3.5: a new series of programsto perform population genetics analyses under Linux and Windows. Molecular
ecology resources 10: 564–567.
69. Rockhill B, Newman B, Weinberg C (1998) Use and misuse of populationattributable fractions. American Journal of Public Health 88: 15–19.
70. Scheet P, Stephens M (2006) A fast and flexible statistical model for large-scalepopulation genotype data: applications to inferring missing genotypes and
haplotypic phase. Am J Hum Genet 78: 629–644.71. Li Y, Willer C, Sanna S, Abecasis G (2009) Genotype imputation. Annual
review of genomics and human genetics 10: 387–406.
72. Purcell S, Daly MJ, Sham PC (2007) WHAP: haplotype-based associationanalysis. Bioinformatics 23: 255–256.
73. Coffey CS, Hebert PR, Ritchie MD, Krumholz HM, Gaziano JM, et al. (2004)An application of conditional logistic regression and multifactor dimensionality
reduction for detecting gene-gene interactions on risk of myocardial infarction:
the importance of model validation. BMC Bioinformatics 5: 49.74. Lam FC, Longnecker MT (1983) A Modified Wilcoxon Rank Sum Test for
Paired Data. Biometrika 70: 510–513.75. Altschul SF, Madden TL, Schaffer AA, Zhang JH, Zhang Z, et al. (1997)
Gapped BLAST and PSI-BLAST: a new generation of protein database searchprograms. Nucleic acids research 25: 3389–3402.
76. Larkin MA, Blackshields G, Brown NP, Chenna R, McGettigan PA, et al. (2007)
Clustal W and clustal X version 2.0. Bioinformatics 23: 2947–2948.77. Sato K, Hamada M, Asai K, Mituyama T (2009) CENTROIDFOLD: a web
server for RNA secondary structure prediction. Nucleic acids research 37:W277–W280.
Admixture Mapping, IFIH1, and SLE Susceptibility
PLOS Genetics | www.plosgenetics.org 19 February 2013 | Volume 9 | Issue 2 | e1003222
Copyright © 2022 FDOKUMEN