
Sequestration of ubiquitous dietary derived pigments enables ...
Upload
khangminh22Category
view
0download
0

1
Zinc(II) Silicate based pigments for Corrosion Inhibition of
Cold Rolled Steel
A thesis submitted to the Division of Research and Advanced Studies at the
University of Cincinnati
in partial fulfillment of the requirements for the degree of
MASTER OF SCIENCE
In the Materials Science and Engineering Graduate Program,
College of Engineering and Applied Science
by
Prajyula Pemmaraju
November 2016
Bachelors of Science, Mechanical Engineering,
Vasavi College of Engineering, Hyderabad, India 2012
Thesis Advisor and Committee Chair: Dr. Relva C. Buchanan

2
ABSTRACT
In solution form, zinc silicate and phosphates are widely used as corrosion inhibitors for prevention
of corrosion, especially in cooling water systems and pipelines. Zinc silicate in powder/pigment
form (derived from reaction of ethyl silicate and zinc tailings) has been extensively used in organic
based primer coatings, for long-term corrosion protection of large steel structures in harsh
environments. However, not much work has been done on characterizing these pigments on the
basis of their structure and composition, which specially relate to their corrosion inhibiting action.
This research investigates, therefore, the corrosion inhibition behavior of a novel Zinc silicate –
pigment system, prepared using different synthesis techniques, with focus on the characteristics of
the pigment along with the corrosion mechanism on cold rolled steel substrates. The aim was to
develop a non-toxic, environment friendly, and low cost alternative zinc silicate processed
pigment.
The unique feature of this work is the development of the zinc (meta) silicate pigments using a
combination of Zinc sulfate and Sodium silicate powders with solution based co-precipitation
technique. By controlling the stoichiometry temperature, time, and stirring regime, followed by
controlled drying and heat treatment. The particle size and structural characteristics of the powders,
were thereby determined, with respect corrosion inhibition efficiency, as determined from
electrochemical analysis and immersion testing. Further the structural study of these pigments
were carried out by standard characterization techniques such as XRD, FTIR, SEM and EDAX to
analyze the crystallite size, structural bond vibrations and morphological changes which brings out
the inhibition effect. Optical measurements of the immersed samples show the corrosion inhibition
of these pigments. This study explains the structural dependence of the inhibitors on the
electrochemical behavior of the zinc silicate powders produced and also gives an optimum way of
producing zinc silicate powders which were proved to be the best suited phase for anti-corrosive
behavior.

3
ACKNOWLEDGEMENT
I would like to take this opportunity to express my sincere respect and gratitude to my advisor Dr.
Relva C Buchanan for providing continuous guidance throughout my research work. I would like
to thank Dr. Rodney Roseman and Dr. John Yin for taking time to review my work and being a
part of my thesis committee.
I would like to thank my research mate Shivani and Yongkun who taught all the processes and
guide me throughout. Siddhartha and Dhaval for their continuous encouragement and help with
analysis. Amulya for asking me questions and having thoughtful discussions. Nitin, Dushyant and
Aman for always providing a helping hand when needed.
I would also like to thank my parents for always being loving and supportive. My sister and my
boyfriend who were a strong support both emotionally, financially and without whom I wouldn’t
have gotten so far. I would like to thank all my cousins and friends here, who are my extended
family in US.
I would take this opportunity to mention about Sudheera, my best friend and the spark of
inspiration in my life, to make a change and dream big.
Also I would like to thank the Almighty for what I am today.

4
Table of Contents
ABSTRACT……………………………………………………………………………………………………………………………………………… 2
ACKNOWLEDGEMENT…………………………………………………………………………………………………………………………….3
TABLE OF CONTENTS………………………………………………………………………………………………………………………………4
LIST OF FIGURES …………………………………………………………………………………………………………………………………… 6
LIST OF TABLES……………………………………………………………………………………………………………………………………… 7
LIST OF ABBREVIATIONS…………………………………………………………………………………………………………………………7
1. INTRODUCTION ................................................................................................................................ 9
1.1. Significance of Corrosion ................................................................................................... 9
1.2. History of Corrosion ........................................................................................................... 9
1.3. Electrochemical behavior of Aqueous Corrosion ............................................................. 10
1.4. Kinetics of Equilibrium at Electrode: ............................................................................... 12
1.5. Activation Polarization: .................................................................................................... 12
1.6. Polarization Resistance ..................................................................................................... 19
1.7. Corrosion Measurements: ................................................................................................. 21
1.8. Concentration Polarization: .............................................................................................. 22
1.9. Corrosion of Cold Rolled Steel ......................................................................................... 23
1.10. Corrosion control in steels: ............................................................................................... 25
1.11. Corrosion Inhibitors .......................................................................................................... 26
1.12. Water based corrosion inhibitors ...................................................................................... 27
1.13. Zinc and Silicates as Corrosion Inhibitors review: ........................................................... 28
1.13.1 Mechanism of Zinc Silicate primer: ............................................................................................ 28
1.13.2 Pigment preparation techniques:.................................................................................................. 31
2. RESEARCH PLAN............................................................................................................................ 34
2.1. Objective: .......................................................................................................................... 34
2.2. Approach: .......................................................................................................................... 34
3. EXPERIMENTAL ............................................................................................................................. 36
3.1. MATERIALS:................................................................................................................... 36
3.1.1. Precursor materials: ...................................................................................................................... 36

5
3.1.2. Substrate ....................................................................................................................................... 36
3.1.3. Corrosive Environment ................................................................................................................. 36
3.2. Pigment Processing: .......................................................................................................... 36
3.2.1 Co- Blending: ................................................................................................................................ 36
3.2.2 Co- Precipitation Technique: ......................................................................................................... 37
3.3. Substrate Preparation: ....................................................................................................... 38
3.4. Electrochemical Characterization: .................................................................................... 38
3.4.1 Evaluation of corrosion inhibition of zinc metasilicate ................................................................. 38
3.4.2. Echem Analyst .............................................................................................................................. 39
3.5. Structural Characterization: .............................................................................................. 39
3.5.1: Thermogravimetric Analysis: ....................................................................................................... 39
3.5.2: X- Ray Diffraction: ....................................................................................................................... 40
3.5.3 Fourier Transform Infrared Spectroscopy (FTIR) ......................................................................... 41
3.5.4. Scanning Electron Microscopy (SEM) and Energy Dispersive Spectroscopy ............................. 42
3.5.5. Immersion and Optical Microscopy: ............................................................................................ 42
4. RESULTS .......................................................................................................................................... 43
4.1. TGA: ................................................................................................................................. 43
4.2. ELECTROCHEMICAL ANALYSIS: .............................................................................. 44
4.2.1. Electrochemical Results: .............................................................................................................. 45
4.3. FTIR ANALYSIS ............................................................................................................. 55
4.4. XRD ANALYSIS ............................................................................................................. 59
4.5. SEM: ................................................................................................................................. 66
4.6. Immersion Testing: ........................................................................................................... 73
5. DISCUSSION: ................................................................................................................................... 75
6. CONCLUSION: ................................................................................................................................. 77
7. SUGGESTIONS FOR FUTURE WORK……………………………………………………………………………………………..77
8. REFERENCES………………………………………………………………………………......... 78
6
LIST OF FIGURES
Figure.1.1 Schematic for equilibrium state of metal
Figure 1.2 Schematic Representation: Free energy curve of the electrode for activation over potential. (---)
polarized state, (---) equilibrium state
Figure 1.3 Mixed Potential and Corrosion for zinc in acid solution
Figure 1.4 Polarization curve with Tafel Extrapolation
Figure 1.5 Illustration for polarization resistance measurement
Figure 1.6 Corrosion of Metal M under diffusion control
Figure 1.7 Mechanism of zinc rich coatings for corrosion inhibition
Figure 1.8 Mechanism of Corrosion inhibition of zinc silicate coatings
Figure 1.9 Schematic of the top-down and bottom-up approach with the techniques used
Figure 2.1 Inhibitor Co-Blending Processing Procedure
Figure 4.1. Thermogravimetric analysis of co-precipitated Zinc silicate pigment
Figure 4.2 Potentiodynamic Curve of 1% NaCl + Coblended ZnO:SiO2 at 80°C
Figure 4.3 Potentiodynamic curve of 1% NaCl + Coblended pigment at 450°C
Figure 4.4 Potentiodynamic curve of 1%NaCl + Coprecipitated pigment at 80°C
Figure 4.5 Potentiodynamic curve of 1% NaCl + coprecipitated powder at 450°C
Figure 4.6 Potentiodynamic curve of 1%NaCl + comparison of Coblended and Coprecipitated powders
Figure 4.7 Potentiodynamic curve of 1%NaCl + coprecipitated pigment with stirring at 80°C
Figure 4.8 Potentiodynamic curve of 1%NaCl + coprecipitated pigment with stirring at 300°C
Figure 4.9 Potentiodynamic curve of 1%NaCl + coprecipitated pigment with stirring at 450°C
Figure 4.10 Potentiodynamic curve of 1%NaCl + coprecipitated pigment with stirring at 600°C
Figure 4.11 Potentiodynamic curve of 1%NaCl + coprecipitated pigment with stirring at 800°C
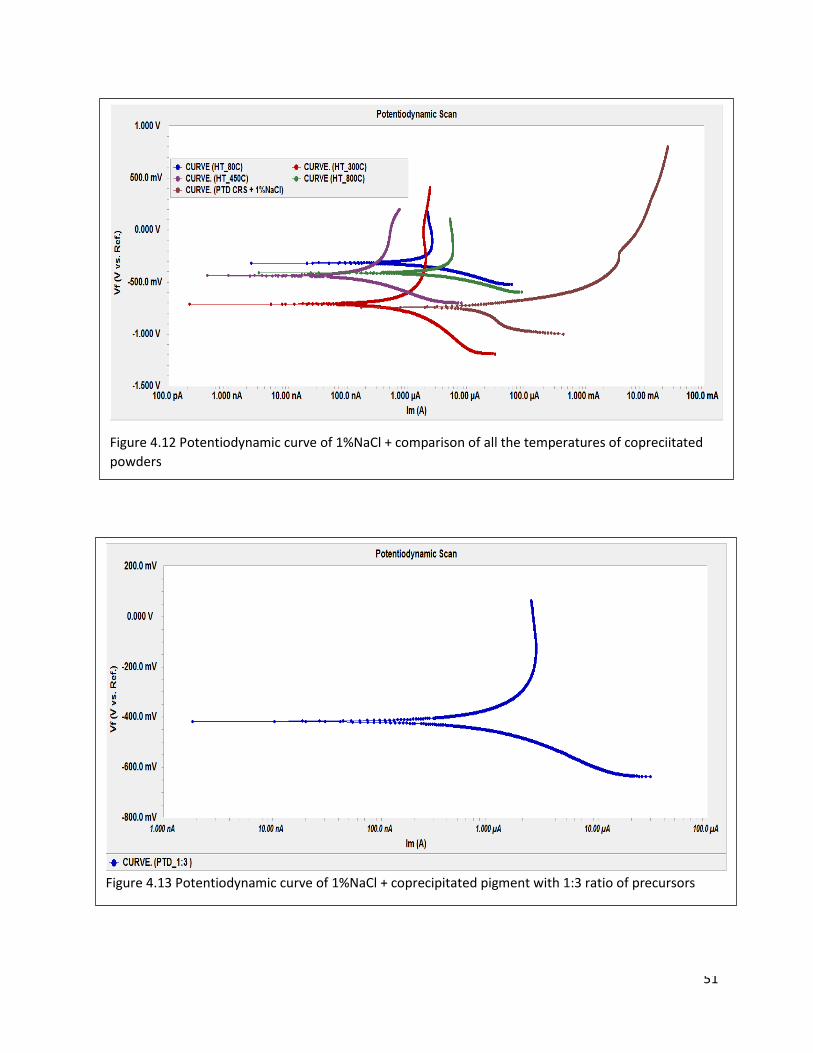
Figure 4.12 Potentiodynamic curve of 1%NaCl + comparison of all the temperatures of copreciitated powders
Figure 4.13 Potentiodynamic curve of 1%NaCl + coprecipitated pigment with 1:3 ratio of precursors
Figure 4.14 Potentiodynamic curve of 1%NaCl + coprecipitated pigment with 3:1 ratio of precursors
Figure 4.15 Potentiodynamic curve of 1%NaCl + comparison of different ratios
Figure 4.16 FTIR analysis of the processed ZS powders with change in processing techniques
Figure 4.17 FTIR for ZS inhibitors at different heat treatment temperatures
Figure 4.18 JCPDF of zinc silicate (ZnSiO3)

7
Figure 4.19 XRD of coprecipitated pigment with Stirring at 80°C
Figure 4.20 XRD of coprecipitated pigment without Stirring at 80°C
Figure 4.21 XRD of coprecipitated pigment with Stirring at 300°C
Figure 4.22 XRD of coprecipitated pigment with Stirring at 400°C
Figure 4.23 XRD of coprecipitated pigment with Stirring at 450°C
Figure 4.24 XRD of coprecipitated pigment with Stirring at 550°C
Figure 4.25 XRD of coprecipitated pigment with Stirring at 600°C
Figure 4.26 XRD of coprecipitated pigment with Stirring at 800°C
Figure 4. 27 Cummulative XRD of all the powders at different temperatures
Figure 4.28 Coprecipitated Zinc silicate at 500X maginifcation for powders sintered at 80°C
Figure 4.29 Coprecipitated Zinc silicate at 12000X magnification for powders sintered at 80°C
Figure 4.30 Coprecipitated Zinc silicate at 500X magnification for powders sintered at 300°C
Figure 4.31 Coprecipitated Zinc silicate at 500X magnification for powders sintered at 450°C
Figure 4.32 Coprecipitated Zinc silicate at 500X magnification for powders sintered at 600°C
Figure 4.33 Coprecipitated Zinc silicate at 500X magnification for powders sintered at 800°C
Figure 4.34 Coprecipitated Zinc silicate at 12000X magnification for powders sintered at 300°C
Figure 4.35 Coprecipitated Zinc silicate at 12000X magnification for powders sintered at 450°C
Figure 4.36 Coprecipitated Zinc silicate at 12000X magnification for powders sintered at 600°C
Figure 4.37 Coprecipitated Zinc silicate at 12000X magnification for powders sintered at 800°C
Figure 4.38 EDS of the powder at 80°C where the composition of the pigment is measured
Figure 4.39 Graph showing the elements present in the pigment
Figure 4.40 Optical microscopy samples in 1% Nacl solution at 100 μm a) with the inhibitor b) without
inhibitor
Figure 4.41 Optical microscopy samples in 1% Nacl solution at 50 μm a) with the inhibitor b) without
inhibitor
Figure 4.42. Optical microscopy samples in 1% Nacl solution at 20 μm a) with the inhibitor b) without
inhibitor

8
LIST OF TABLES
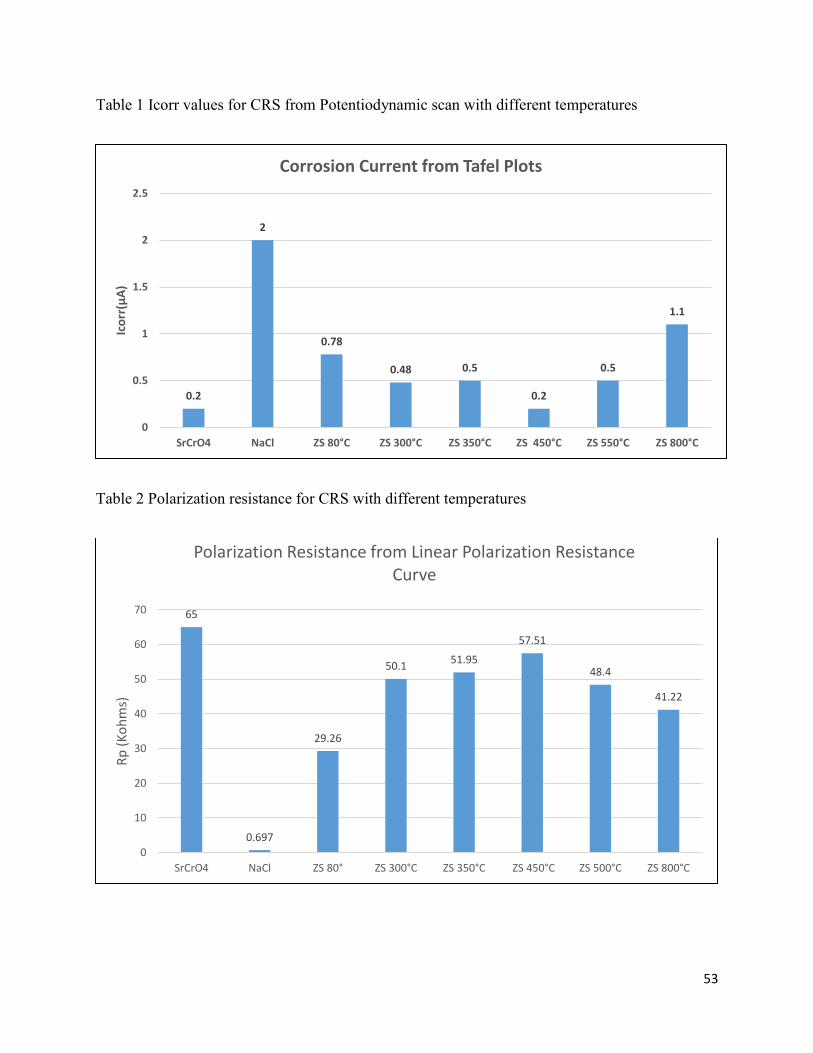
Table 1 Icorr values for CRS from Potentiodynamic scan with different temperatures
Table 2 Polarization resistance for CRS with different temperatures
Table 3 Corrosion Rate for CRS from Potentiodynamic Scan for different temperatures
Table 4. Icorr values for all the pigments at different temperatures.
Table 5. Icorr values for the pigments prepared out of precursors with different stoichiometry
Table 6. FTIR peaks for bonds present in the zinc silicate pigment
Table 7 Crystallite sizes of the zinc silicate pigment at different sintering temperatures
Table 8. The percentage composition of the elements in the pigment
LIST OF ABBREVIATIONS
CRS Cold Rolled Steel
UNHT Un-Heat Treated
HT Heat Treated
ZS Zinc Silicate
PTD Potentiodynamic
ZnSO4 Zinc sulfate
Na2SiO3 Sodium metasilicate
SEM Scanning Electron Microscopy
XRD X-ray Diffraction

9
1. INTRODUCTION
1.1. Significance of Corrosion
Corrosion is the destructive attack of a material by reaction with its environment. The serious
consequences of the corrosion process have become a problem of worldwide significance. In
addition to our everyday encounters with this form of degradation, corrosion causes plant
shutdowns, waste of valuable resources, loss or contamination of product, reduction in efficiency,
costly maintenance, and expensive overdesign. It can also jeopardize safety and inhibit
technological progress [1].
1.2. History of Corrosion
The word “corrode” is derived from the Latin word rodere, meaning “to gnaw.” The term “corrosion”
entered the French language in 1314 to designate the act of gnawing, or wearing away because of chemical
effect. The term did not formally enter the English lexicon until the beginning of the 19th century, at which
point it was first adopted into medical vocabulary.
Corrosion is not an easy process to define. It is either a slow, progressive or rapid deterioration of
a metal's properties, such as appearance, surface aspects, or mechanical properties, under the effect
of the surrounding environment (seawater, water, various solutions and organic environments).
Previously, “oxidation” was a more commonly used term than corrosion. The former was a more
accurate term as corrosion usually consists of an electrochemical reaction during which metal is
oxidized, transforming into the state in which it existed in the mineral. Pure metal, with the
exception of noble metals, is thermodynamically unstable at normal conditions and tries to return
to its oxide state. [3]

10
Corrosion phenomena have baffled humans since the discovery of metals. Pliny the Younger was
already complaining about the rusting of Roman soldiers' weapons. Scientists began investigating
corrosion in the early 19th century with Nicholson and Carlyle's discovery of the electrolyte
decomposition of water due to the electric current supplied by a galvanic battery.
Humphrey Davy established a relationship between the production of electricity and the oxidation
of zinc, in which one of the two metals was copper and the other acted as the generator of
electricity. In 1830, the Genevan chemist Auguste de la Rive developed the basis of the
electrochemical theory of corrosion. At the beginning of the 20th century, this theory was taken
up by Whitney and then completed by Hoar and Evans at the end of the 1920s [2][3][8].
1.3. Electrochemical behavior of Aqueous Corrosion
All metallic corrosion processes involve transfer of electronic charges and a conductive media for
its transfer mostly an aqueous phase called electrolyte, illustrated in Figure 1. If we take the
example of basic corrosion reaction:
Zn + 2HCl = ZnCl2 + H2 (1)
The ionic form of this reaction can be split into two reactions and the same reaction can be written
as two separate reactions (3) and (5)
Anodic or oxidation reaction, involving dissolution of metal in aqueous solution, with release of
electrons and of the form:
M = M n+ + ne-
(2)
Zn = Zn 2+ + 2e-
(3)
Cathodic or reduction reaction, involving electron consumption with decrease in oxidation state
and of the form:
11
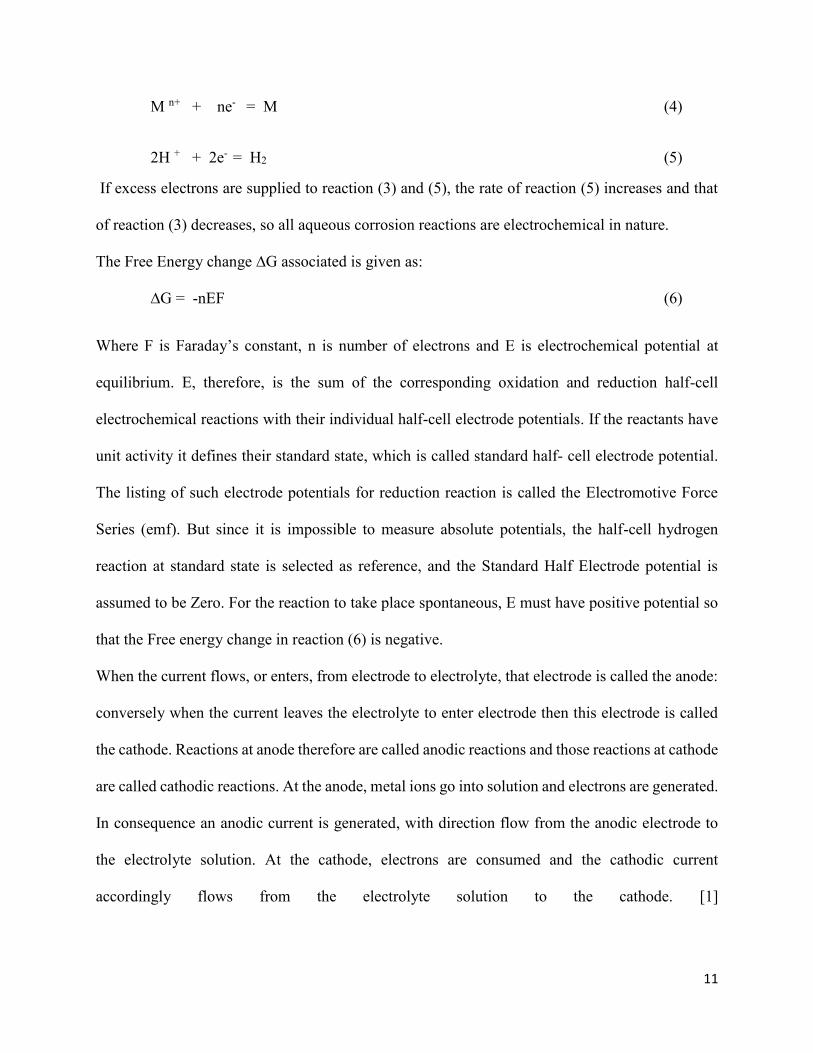
M n+ + ne- = M (4)
2H + + 2e- = H2 (5)
If excess electrons are supplied to reaction (3) and (5), the rate of reaction (5) increases and that
of reaction (3) decreases, so all aqueous corrosion reactions are electrochemical in nature.
The Free Energy change ∆G associated is given as:
∆G = -nEF (6)
Where F is Faraday’s constant, n is number of electrons and E is electrochemical potential at
equilibrium. E, therefore, is the sum of the corresponding oxidation and reduction half-cell
electrochemical reactions with their individual half-cell electrode potentials. If the reactants have
unit activity it defines their standard state, which is called standard half- cell electrode potential.
The listing of such electrode potentials for reduction reaction is called the Electromotive Force
Series (emf). But since it is impossible to measure absolute potentials, the half-cell hydrogen
reaction at standard state is selected as reference, and the Standard Half Electrode potential is
assumed to be Zero. For the reaction to take place spontaneous, E must have positive potential so
that the Free energy change in reaction (6) is negative.
When the current flows, or enters, from electrode to electrolyte, that electrode is called the anode:
conversely when the current leaves the electrolyte to enter electrode then this electrode is called
the cathode. Reactions at anode therefore are called anodic reactions and those reactions at cathode
are called cathodic reactions. At the anode, metal ions go into solution and electrons are generated.
In consequence an anodic current is generated, with direction flow from the anodic electrode to
the electrolyte solution. At the cathode, electrons are consumed and the cathodic current
accordingly flows from the electrolyte solution to the cathode. [1]
12
1.4. Kinetics of Equilibrium at Electrode:
At equilibrium the net current in the system is zero or:
i a = -ic = io (7)
Where, io is exchange current density, depending on the kinetics of the reaction, it gives us
understanding of how charge transfer takes place at equilibrium. And if the equilibrium system is
polarized in positive or negative direction a net current will flow depending on which direction it
is polarized.
Polarization is the potential change from equilibrium electrode potential, because of
electrochemical reactions occurring on the electrode surface, preferential electron transfer takes
place, current is generated depending on kinetics of reactants. In cathodic polarization the electrode
surface has potential negative to equilibrium potential, electrons are consumed by positive
electrode ions and the electrode has a surface negative potential to referenced to the equilibrium
potential. The opposite happens in case of anodic polarization where the electrons are released
from the electrode surface at a faster rate and cause a positive potential change from equilibrium
potential. Polarization is of two types:
1.5. Activation Polarization:
The reactions on the electrode surface happens in steps, if we consider the cathodic half-cell
reaction for Hydrogen reduction, it occurs in steps
Step 1: Formation of adsorbed Hydrogen
H+ + e- = H adsorbed (8)
Step 2: Formation of Hydrogen molecule

13
H adsorbed + H adsorbed = H2 (9)
Step 3: Nucleation of hydrogen bubble
If any of the steps in the above reaction controls the rate of charge (electron) flow that step would
be rate controlling, and the overall reaction will be under activation polarization control.
Figure1.1 Schematic for equilibrium state of metal [16]
The equilibrium state of the system is as shown in Figure 1.2. As mentioned above at equilibrium
the net current in the system is zero or: ia= -ic=i0, but when the equilibrium is disturbed, for example
in case of cathodic polarization - ic >ia
and net cathodic current will flow and if anodic polarization ia > -ic and net anodic current will
flow, with low over-potential, the driving force for each reaction being low, the concentration of
ionic species on the surface and bulk can be assumed to be same , the rate of current can be given
as : the rate of oxidization(rr) and reduction reaction (rf) which is dependent on activation energy
of each reaction given by the Arrhenius equation (applicable to many reactions over reasonable
temperature range) :

14
Reduction: r𝑓 = K𝑓 𝑒𝑥𝑝(−
∆𝐺𝑓 ∗
𝑅𝑇 ) (10)
Oxidation: r𝑟 = K𝑟 𝑒𝑥𝑝(−
∆𝐺𝑟 ∗
𝑅𝑇 ) (11)
Where ∆G is energy barrier for specific reaction, and Kf and Kr are the rate constants , as seen
above from Equation 7 at equilibrium rf = rr. But, as an over potential is applied the activation
energy of the reduction reaction in cathodic polarization is reduced and activation energy for
anodic polarization is increased. Schematic representation by Free Energy curve is shown in
Figure 1.2. The reduction reaction’s Free energy is decreased by αnFηc and the activation energy
for oxidation reaction is increased by (1- α)nFηc. Where , α and (1- α)is the specific fractional
contribution for the reduction and oxidation reaction respectively from the over potential For such
electrochemical system the movement of charged species generate current , so the rate rr, rf can be
replaced by i , where :
Figure 1.2 Schematic Representation: Free energy curve of the electrode for activation over potential.
(---) polarized state, (---) equilibrium state [17]
15
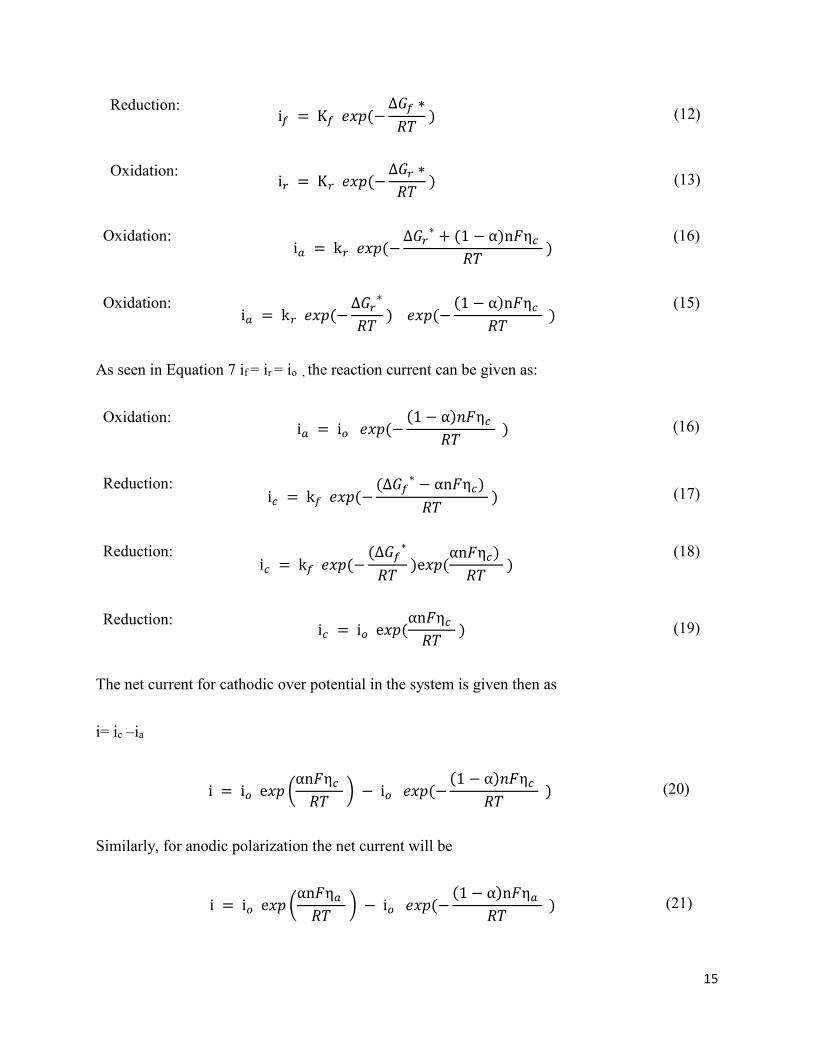
Reduction: i𝑓 = K𝑓 𝑒𝑥𝑝(−
∆𝐺𝑓 ∗
𝑅𝑇 ) (12)
Oxidation: i𝑟 = K𝑟 𝑒𝑥𝑝(−
∆𝐺𝑟 ∗
𝑅𝑇 ) (13)
Oxidation: i𝑎 = k𝑟 𝑒𝑥𝑝(−
∆𝐺𝑟∗ + (1 − α)n𝐹η𝑐
𝑅𝑇 )
(16)
Oxidation: i𝑎 = k𝑟 𝑒𝑥𝑝(−
∆𝐺𝑟∗
𝑅𝑇 ) 𝑒𝑥𝑝(−
(1 − α)n𝐹η𝑐
𝑅𝑇 )
(15)
As seen in Equation 7 if = ir = io , the reaction current can be given as:
Oxidation: i𝑎 = i𝑜 𝑒𝑥𝑝(−
(1 − α)𝑛𝐹η𝑐
𝑅𝑇 ) (16)
Reduction: i𝑐 = k𝑓 𝑒𝑥𝑝(−
(∆𝐺𝑓∗ − αn𝐹η𝑐)
𝑅𝑇 ) (17)
Reduction: i𝑐 = k𝑓 𝑒𝑥𝑝(−
(∆𝐺𝑓∗
𝑅𝑇 )e𝑥𝑝(
αn𝐹η𝑐)
𝑅𝑇 )
(18)
Reduction: i𝑐 = i𝑜 e𝑥𝑝(
αn𝐹η𝑐
𝑅𝑇 ) (19)
The net current for cathodic over potential in the system is given then as
i= ic –ia
i = i𝑜 e𝑥𝑝 (
αn𝐹η𝑐
𝑅𝑇 ) − i𝑜 𝑒𝑥𝑝(−
(1 − α)𝑛𝐹η𝑐
𝑅𝑇 ) (20)
Similarly, for anodic polarization the net current will be
i = i𝑜 e𝑥𝑝 (
αn𝐹η𝑎
𝑅𝑇 ) − i𝑜 𝑒𝑥𝑝(−
(1 − α)n𝐹η𝑎
𝑅𝑇 ) (21)

16
The above equation (21) is called Butler Volmer equation , for high over voltage one of the two
anodic or cathodic current is dominant over the other and the Equation 21 can be simplified, if
there is large cathodic polarization, the anodic part of the current will be negligible then we get :
𝑖𝑐= 𝑖𝑜 𝑒𝑥𝑝(𝑎n𝐹ηc
𝑅𝑇) (22)
log (𝑖𝑐
𝑖𝑜) =(
𝑎n𝐹ηc
𝑅𝑇) (23)
η𝑐 = b𝑐log (𝑖𝑐
𝑖𝑜) (24)
η𝑐 = b𝑐log (𝑖𝑐) − b𝑐log (𝑖𝑜) (24)
𝑖𝑎= 𝑖𝑜 𝑒𝑥𝑝(𝑎n𝐹 η𝑎
𝑅𝑇) (25)
log (𝑖𝑎
𝑖𝑜) =(
𝑎n𝐹η𝑎
𝑅𝑇) (26)
η𝑎 = b𝑎log (𝑖𝑎
𝑖𝑜) (27)
And, can be written as a single equation for both anodic and cathodic reaction as:
η = b log (𝑖𝑜) ± b𝑐log (𝑖) (28)
This approximation was developed by a German investigator Tafel in 1905, and is known as
Tafel’s Equation and the Constant β is known as Tafel Slope, estimation of Tafel Slope, exchange
and limiting current values are important to describe and understand any electrochemically
corroding system. By knowing the half-cell reactions, which occur simultaneously on the electrode
surface and using the basis of charge conservation for these reactions , underlines the basis of
Mixed Potential Theory, and so for each of the half-cell reaction potentials are polarized to an
intermediate potential value , this potential is known as the Mixed Corrosion Potential or Ecorr,
17
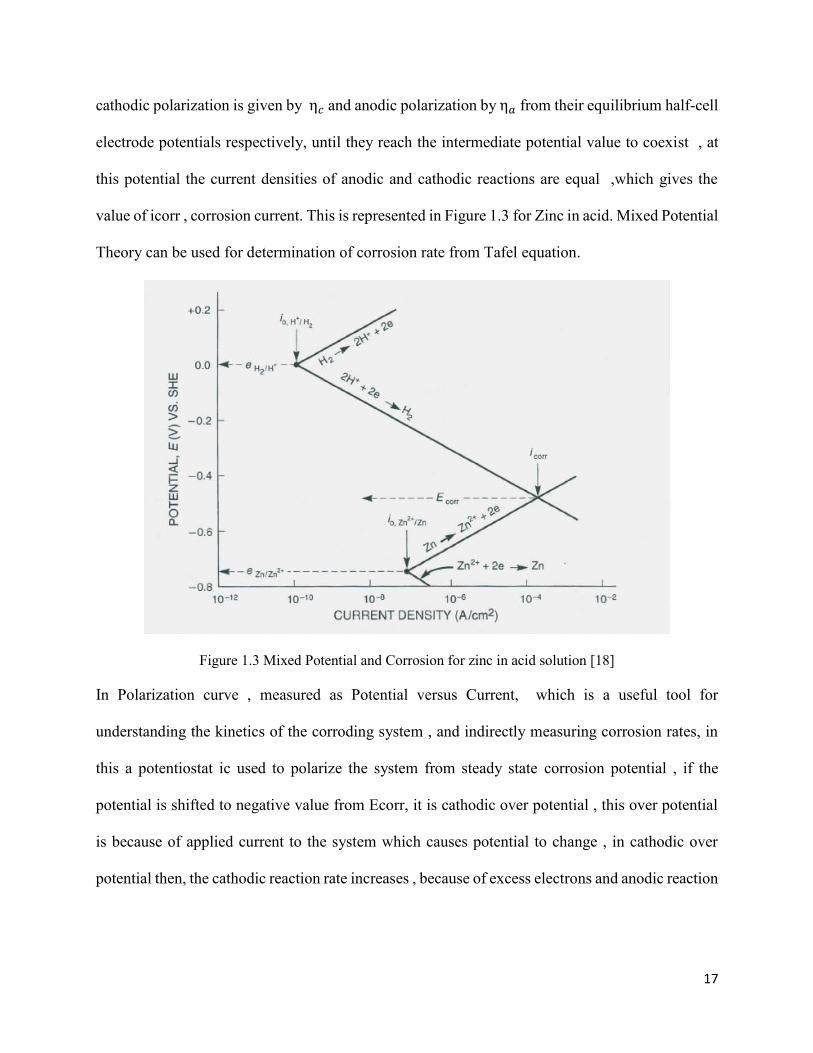
cathodic polarization is given by η𝑐 and anodic polarization by η𝑎 from their equilibrium half-cell
electrode potentials respectively, until they reach the intermediate potential value to coexist , at
this potential the current densities of anodic and cathodic reactions are equal ,which gives the
value of icorr , corrosion current. This is represented in Figure 1.3 for Zinc in acid. Mixed Potential
Theory can be used for determination of corrosion rate from Tafel equation.
Figure 1.3 Mixed Potential and Corrosion for zinc in acid solution [18]
In Polarization curve , measured as Potential versus Current, which is a useful tool for
understanding the kinetics of the corroding system , and indirectly measuring corrosion rates, in
this a potentiostat ic used to polarize the system from steady state corrosion potential , if the
potential is shifted to negative value from Ecorr, it is cathodic over potential , this over potential
is because of applied current to the system which causes potential to change , in cathodic over
potential then, the cathodic reaction rate increases , because of excess electrons and anodic reaction
18
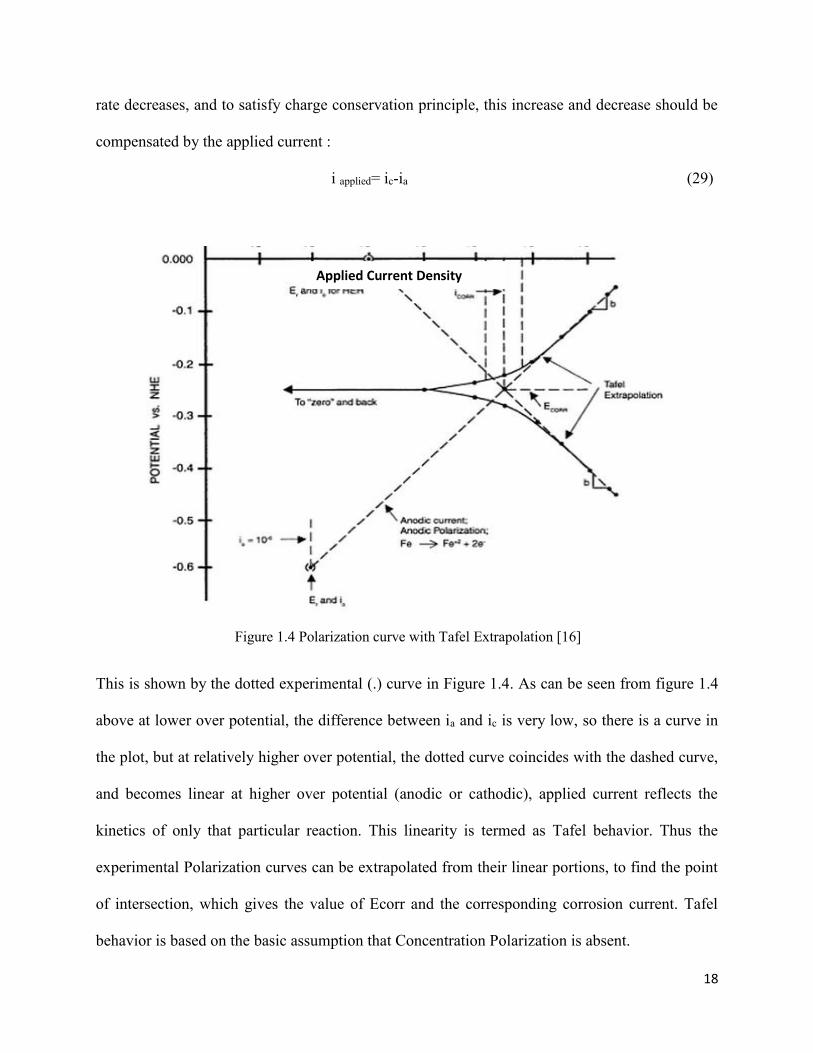
rate decreases, and to satisfy charge conservation principle, this increase and decrease should be
compensated by the applied current :
i applied= ic-ia (29)
This is shown by the dotted experimental (.) curve in Figure 1.4. As can be seen from figure 1.4
above at lower over potential, the difference between ia and ic is very low, so there is a curve in
the plot, but at relatively higher over potential, the dotted curve coincides with the dashed curve,
and becomes linear at higher over potential (anodic or cathodic), applied current reflects the
kinetics of only that particular reaction. This linearity is termed as Tafel behavior. Thus the
experimental Polarization curves can be extrapolated from their linear portions, to find the point
of intersection, which gives the value of Ecorr and the corresponding corrosion current. Tafel
behavior is based on the basic assumption that Concentration Polarization is absent.
Figure 1.4 Polarization curve with Tafel Extrapolation [16]
Applied Current Density

19
1.6. Polarization Resistance
In the one of the most early work [19][20], Stern and Gary derived an equation which established
a linear relation between slope of linear region of polarization measurements , corrosion rate and
Tafel Slopes , it is important to note here that the in these measurements over potential is very
close to corrosion potential , avoiding any surface damage to the electrode surface . To avoid
confusion with Linear Tafel region, it is important to note here is that the linear Tafel region is not
seen until an applied current of approximately 10 times the magnitude of icorr is reached. The
background and illustration of this condition is given in Figure 6 below:
The applied current, derived from the potentiostatic measurements, as given in Equation (29), as
(iapplied = ic-ia). The value of individual currents ia and ic can be obtained by rearranging Equation
(27) and (24), hence Equation 29 can be written as:
i applied= icorr (10(-η /βc) -10( η /βa) ) (30)
The exchange current is analogous to corrosion current icorr in the corroding system.
Approximating it with power series expansion, with the assumption that (η /β) value is very small,
that is β greater than η [19][20][22].
10 η/βa = 1 + 2.3 η/βa
10 -η/βc = 1 - 2.3 η/βc
We obtained, therefore:
η
i𝑎𝑝𝑝𝑙𝑖𝑒𝑑= 2.3𝑜 i𝑐𝑜𝑟𝑟 (
β𝑎 + β𝑐
β𝑎β𝑐 ) (31)

20
icorr = βa β𝑐
2.3(βa + β𝑐) *(
∆𝑖
(∆𝐸)) (32)
Where the slope of the curve is (∆𝑖
(∆𝐸)) is polarization Resistance Rp, so polarization resistance is
given as shown from the experimental illustration is given in Figure below and can be written as:
Rp = βa β𝑐
2.3(βa + β𝑐)i𝑐𝑜𝑟𝑟 (33)
From the icorr the Corrosion rate can be measured by use of the Faraday‘s Law and given as
C.R (mpy)= 0.13i𝑐𝑜𝑟𝑟(E.W)
d (34)
Where, mpy= milli-inches per year, Icorr=corrosion current density (µΑ/cm2), E.W=equivalent
weight of the corroding species, (g). d = density of the corroding species, (g/cm3).
Figure 1.5 Illustration for polarization resistance measurement [23]

21
1.7. Corrosion Measurements:
The speed of electrochemical measurements makes them a useful tool for corrosion studies with
quick measurements of corrosion rates. In polarization techniques, external voltage is imposed,
and this done by polarizing the electrode, for Polarization Resistance measurements over voltages
of 25mV are usually allowed [22]. And Tafel constant’s absolute value are in the range 0.03 to 0.2
V and are not required to be equal for cathodic and anodic reactions, for speedy measurement of
Polarization resistance analysis the values of Tafel Constants βa =βc =0.1 to 0.12V are acceptable,
in this work the values are assumed to be 0.12 as representative of the average of all corroding
system [19][20][23]. The exact values can be determined from Tafel plots. Advantages of using
this technique is that test can be completed within few minutes, since the over potential is small
no damage is done to the electrode surface and so Polarization Resistance can be considered as the
non–destructive technique of corrosion rate measurement and the same sample can be used for
other further measurement. It can also be used as important technique for corrosion analysis of
structures, for which visual inspection is not possible and weight loss studies cannot be performed.
However using only Polarization resistance test results can be unreliable, since other effects like
Ohmic solution resistance, effect of charge transfer and resistance due to protective film formation
are not considered in Rp calculations .So, along with DC Polarization Resistance, Potentiodynamic
and Immersion studies are used together in this work. For Potentiodynamic curves, over potential
(both anodic and cathodic) in the range of 250 -300 mV can be used. For correct and accurate
measurements by Tafel extrapolation method at least one of the anodic or cathodic branch should
show Tafel behavior, and the extrapolation should be done at least 50 to 100mV away from Ecorr
[16]. Potentiodynamic curve act like identification or figure print of behavior of a metal in a
particular environment, with advantages of providing various information, as corrosion current

22
from Tafel analysis, passivation region, and rapid determination of corrosion currents with Tafel
analysis makes it the most advantageous for studies of corrosion inhibitor efficiency evaluation
studies [15]. The logarithmic scale of current can lead to higher error for measurements in
corrosion currents with error factor in calculation of current up to 5 in manual extrapolations. The
time required for potentiodynamic scans can take 1-2 hours which is more than that required for
Polarization resistance [22]. However, since the over potential applied in this case is high it can
cause damage to the electrode surface, so it is not useful for continuous corrosion rate
measurements. Polarization measurements can be complicated if different phenomenon are
interfering or taking place at the same time, for higher over potential the surface of electrode can
change or damage and concentration polarization can also interfere [22].
1.8. Concentration Polarization:
As the system is further polarized more from Ecorr , subsequent to net current in system in
accordance to Tafel equation , current ceases to increase as the electrode surface gets depleted of
the concentration of dissolved ionic charges carrying charge from solution to the electrode surface
for reaction , and the reaction is diffusion controlled ,dependent on diffusion rate of ions from
solution to the electrode surface and back, for anodic reaction the charged ions are produced at
faster rate at surface and concentration becomes high compared to bulk solution to surface,
conversely in cathodic reaction the concentration is depressed compared to the bulk solution.
Consequently, the change of potential is greater than that of Tafel Equation. It can be seen for
reduction reaction in Figure 1.6. First it is in activation polarization and then in concentration. This
excess potential is Concentration Polarization ηc. which can be calculated by Nernst Equation
taking the difference in potential of electrode at un-polarized E state and the polarized state E`.
This is given as: ηc = E` − E =0.059
𝑍log
[𝑎Mz+]
[𝑎Mz+]p [35]
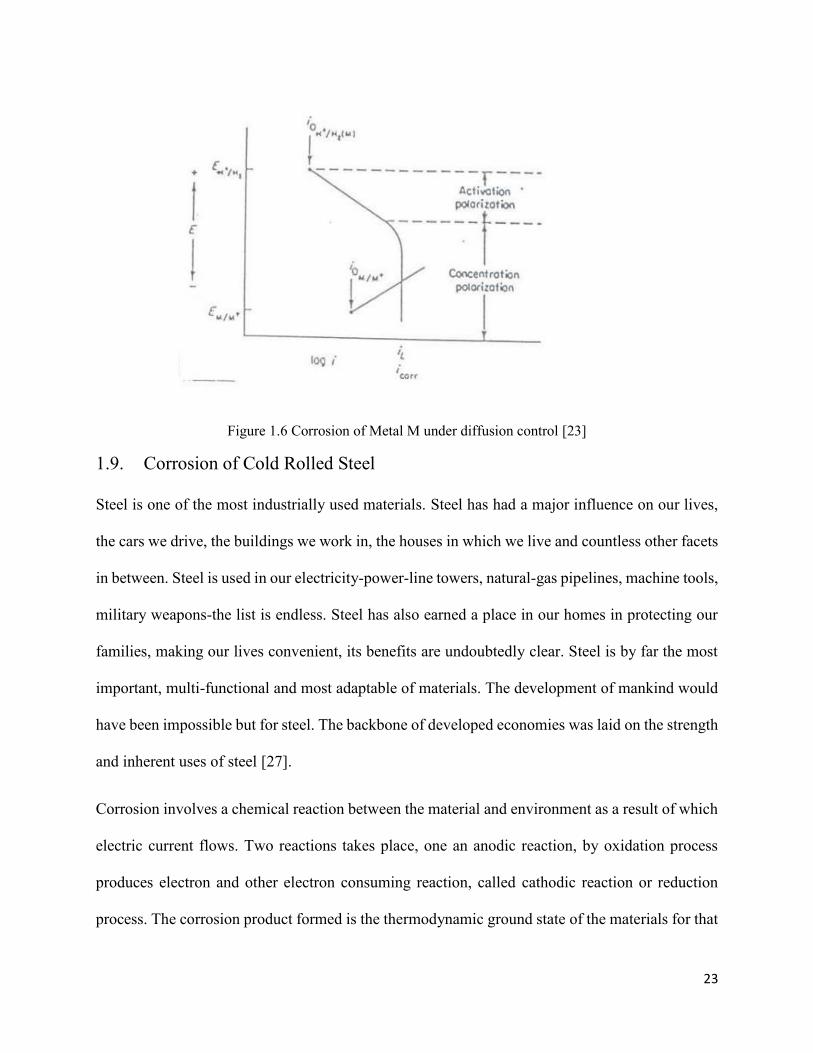
23
Figure 1.6 Corrosion of Metal M under diffusion control [23]
1.9. Corrosion of Cold Rolled Steel
Steel is one of the most industrially used materials. Steel has had a major influence on our lives,
the cars we drive, the buildings we work in, the houses in which we live and countless other facets
in between. Steel is used in our electricity-power-line towers, natural-gas pipelines, machine tools,
military weapons-the list is endless. Steel has also earned a place in our homes in protecting our
families, making our lives convenient, its benefits are undoubtedly clear. Steel is by far the most
important, multi-functional and most adaptable of materials. The development of mankind would
have been impossible but for steel. The backbone of developed economies was laid on the strength
and inherent uses of steel [27].
Corrosion involves a chemical reaction between the material and environment as a result of which
electric current flows. Two reactions takes place, one an anodic reaction, by oxidation process
produces electron and other electron consuming reaction, called cathodic reaction or reduction
process. The corrosion product formed is the thermodynamic ground state of the materials for that
24
particular corrosion environment. Essentially, the iron in the steel is oxidized to produce rust,
which occupies approximately six times the volume of the original material. The rate at which the
corrosion process progresses depends on a number of factors, but principally the 'micro-climate'
immediately surrounding the steel structure.
The use of corrosion inhibitors for corrosion resistance of steels has received significant attentions,
because of its wide applications and understanding the process .The corrosion of steel which is
considered as an electrochemical process which occurs in stages. Initial attack occurs at anodic
areas on the surface, where ferrous ions go into solution. Electrons are released from the anode
and move through the metallic structure to the adjacent cathodic sites on the surface, where they
combine with oxygen and water to form hydroxyl ions. These react with the ferrous ions from the
anode to produce ferrous hydroxide, which itself is further oxidized in air to produce hydrated
ferric oxide (i.e. red rust.) Since the major component of steel is iron (Fe) , at the surface of a
component its undergoes changes :
Fe → Fe n+ + n electrons
(This allows it to bond to other groups which are negatively charged)
Since the corrosion product of steel is a variant of iron oxide the cathodic reaction involve water
and Oxygen
O2 + 2H2O + 4e- → 4OH – (1)
The negative and positively charged material combine
2Fe + O2 + 2H2O → 2Fe (OH)2 (2)
Iron + Water with Oxygen dissolved in it → Iron Hydroxide
Oxygen dissolves quite readily in water and because there is usually an excess of it, reacts with
the iron hydroxide.

25
4Fe (OH)2 + O2 → 2H2O + 2Fe2O3.H2O (3)
Or
4Fe + 3O2 + 2H2O = 2Fe2O3H2O (4)
(Steel) + (Oxygen) + (Water) = Hydrated ferric oxide (Brown Rust)
Chloride ions also act as catalyst to corrosion when present in sufficient amount at surface, they
are not consumed in the process and permit the corrosion to proceed
Fe +2 + 2Cl- = FeCl2 (5)
FeCl2 + 2OH- = Fe (OH)2 + 2Cl- (6)
Over long periods the loss of metal is reasonably uniform over the surface, and this is usually
described as 'general corrosion'. A schematic representation of how corrosion reaction proceed on
the steel surface is shown in Figure 1. The above reactions helps us understand how corrosion
takes place.
1.10. Corrosion control in steels:
There are four common methods used to control corrosion. They include protective coatings and
linings, cathodic protection, materials selection, and corrosion inhibitors.
A) Coatings and linings are principal tools for defending against corrosion. These substances are
often applied in conjunction with cathodic protection systems to provide the most cost-effective
protection for a structure.
B) Cathodic Protection (CP) is a technology that uses direct electrical current to counteract the
normal external corrosion of a structure that contains metal, such as an underground petroleum
storage tank or natural gas pipeline. On new structures, CP can help prevent corrosion from
starting; on existing structures; CP can help stop existing corrosion from getting worse.

26
C).Materials selection refers to the selection and use of corrosion-resistant materials such as
stainless steels, plastics, and special alloys to enhance the life span of a structure. Some of the most
common materials used in constructing a variety of facilities, such as steel and steel-reinforced
concrete, can be severely affected by corrosion.
D).Corrosion inhibitors are substances that, when added to a particular environment, decrease the
rate of attack of that environment on a material such as metal. They can help extend the life of
equipment, prevent system shutdowns and failures, avoid product contamination, prevent loss of
heat transfer, and preserve an attractive appearance of structures. The prevention of corrosion on
the surfaces of metallic pipes, heat exchangers, and the like which are in contact with industrial
cooling waters, and particularly industrial cooling waters containing utilizing a corrosion
inhibiting amount of a composition .Superior corrosion inhibition can be achieved using the
corrosion inhibitors, particularly in cooling water systems. Costly problems facing drinking water
utilities. A large number of parameters affect pipe corrosion, including water quality and
composition, flow conditions, biological activity, and corrosion inhibitors.
Steel is highly prone to corrosion during storage and transportation air borne salinity, micro-
environments and industrial pollution can affect the corrosion efficiency of these steels. Lately,
demands for plated sheet products having even better corrosion resistance are increasing in view
of the requirements for a very long service life, enhanced performance, etc. in housing and other
buildings [8].
1.11. Corrosion Inhibitors
Corrosion Inhibitors are widely used in the steel industry to control corrosion. There are two main
concepts that needs to be addressed in order to understand the observed phenomena. One is
adsorption and the other is micelles in the solution. These two phenomena differentiate corrosion

27
inhibitors from other chemical entities. Corrosion inhibitors are found to protect steel corrosion in
acid solutions by adsorbing themselves on steel surface. Adsorption is a separation process
involving two phases between which certain components can become differentially distributed.
Adsorption can be described by two main types of interaction:
• Physisorption, involves electrostatic forces between ionic charges or dipoles on the adsorbed
species and the electric charge at the metal/solution interface. The heat of adsorption is low and
therefore this type of adsorption is stable only at relatively low temperatures [37].
• Chemisorption, involves charge sharing or charge transfer from the inhibitor molecules to the
metal surface to form a coordinate type bond. In fact, electron transfer is typically for transition
metals having vacant low-energy electron orbital. Chemisorption is typified by a much stronger
adsorption energy than physical adsorption. Such a bond is therefore more stable at higher
temperatures.
1.12. Water based corrosion inhibitors
Water-based corrosion inhibitors rely on modifying the characteristics of the metal surfaces
themselves to decrease their susceptibility to oxidation and corrosion formation. Water-based
inhibitors are typically sold as a concentrate and diluted with water for use, making their cost less
than most oil/solvent-based products. Water-based corrosion inhibitors generally have very
desirable characteristics. The chemical films formed are thin and typically transparent when dry.
Application methods for these coatings include spray, brush or immersion. They are cleaner to use
and eliminate concerns of solvent fumes. The films rarely have to be removed prior to subsequent
operations but if removal is necessary it is done easily with mild water-based cleaners. Water-
based inhibitors can be effective in preventing corrosion for extended periods of time (weeks to

28
months) under reasonable plant storage and protected shipping conditions. Since water-based
products work by decreasing the susceptibility of the metal to oxidation rather than by completely
excluding water and air, these inhibitors often are not as effective as oil/solvent-based coatings in
shipping and outside storage of parts.
1.13. Zinc and Silicates as Corrosion Inhibitors review:
Various zinc rich and silicate based coatings are widely available for corrosion protection in the
industry.
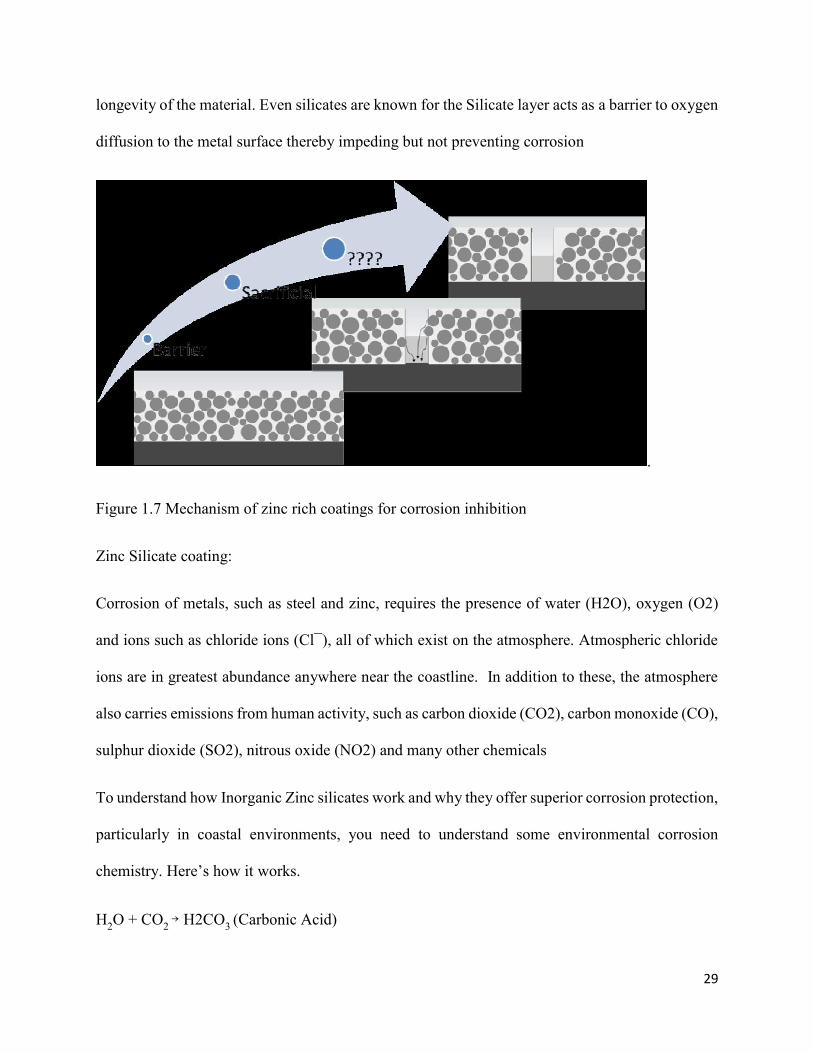
1.13.1 Mechanism of Zinc Silicate primer:
The figure 1.7 gives an idea of the basic mechanism of how a zinc coating works on a substrate.
When the metallic zinc is coated on a substrate it is completely isolated from the environment.
This basically acts as a barrier between the environment and the substrate preventing any kind of
contact between both of them. So far it acted like any other coating causing a barrier effect. But
once a defect is made in the coating the substrate is exposed to the coating and the zinc coating
acts as a sacrificial protection. This protection depends on certain factors like amount and type of
moisture present, the electrical connectivity of the zinc particles to each other and the substrate,
the purity of zinc and thickness of the coating. After some time the zinc layer will be depleted and
the sacrificial protection will cease.
So to protect the steel substrate we have developed a novel corrosion inhibiting pigment using zinc
and silicate ions. Zinc offers threefold protection since it, seals the underlying metal from contact
with its corrosive environment, provides galvanic protection and repairs minor damages in a
coating forming a barrier to further electrochemical action. It really adds to performance and
29
longevity of the material. Even silicates are known for the Silicate layer acts as a barrier to oxygen
diffusion to the metal surface thereby impeding but not preventing corrosion
.
Figure 1.7 Mechanism of zinc rich coatings for corrosion inhibition
Zinc Silicate coating:
Corrosion of metals, such as steel and zinc, requires the presence of water (H2O), oxygen (O2)
and ions such as chloride ions (Cl¯), all of which exist on the atmosphere. Atmospheric chloride
ions are in greatest abundance anywhere near the coastline. In addition to these, the atmosphere
also carries emissions from human activity, such as carbon dioxide (CO2), carbon monoxide (CO),
sulphur dioxide (SO2), nitrous oxide (NO2) and many other chemicals
To understand how Inorganic Zinc silicates work and why they offer superior corrosion protection,
particularly in coastal environments, you need to understand some environmental corrosion
chemistry. Here’s how it works.
H2O + CO
2 → H2CO
3 (Carbonic Acid)

30
And the figure 1.8 explains the mechanism of zinc silicate in corrosion inhibition.
The carbonic acid then reacts with the zinc metal on the surface of the IOZ matrix:
H2CO
3 (Carbonic Acid) + Zn + O
2 → (Zn)
χ (OH) CO
3 (zinc hydroxy carbonate - insoluble).
The insoluble and inert zinc hydroxy carbonate product then gets locked into the surface pores of
the IOZ, creating an effective barrier to further oxidation. The zinc hydroxy carbonate is
symbolised as Zn+.
Figure 1.8 Mechanism of Corrosion inhibition of zinc silicate coatings
The advantages of zinc silicate compounds are:
• It has outstanding mechanical properties and is capable of resisting impact, scratching and
scuffing.
• These coatings are resistant to heat as high as 750°F.
• Some formulations of zinc-rich paint may be immersed in salt water, while others cannot.
• Using zinc-rich paint as a top coat is harder compared with other types of coatings due to
its porous nature.
• Inorganic zinc-rich paint needs to be applied on a totally clean surface for best outcomes.

31
1.13.2. Inhibitor mechanism:
The role of inhibitor pigments in the process of corrosion prevention of a metal is protecting
the surface of the substrate by releasing cathodic and anodic species like calcium, zinc, silicate
and phosphate ions in to the solution there by forming a protective layer on the surface of the
metal [38]. The pigments with these ions are non-toxic and environment friendly since there
are no chromate ions present in it. As per the literature we already know that calcium silicate,
calcium phosphate and zinc phosphate are efficient corrosion inhibitor pigments used for
steels. So the mechanism of these pigments was explained as [59][61].
The figure above describes the release of inhibitor from the silicon calcium cation exchange
pigment in the solution for corrosion protection. With Calcium ions present, reactions proceed to
formation on cathode areas of a diffusion barrier film of unknown structure containing both
calcium and phosphorus ions. Similarly in the zinc silicate system, the zinc ions form a diffusion
barrier film, forming zinc hydroxide by reacting with the hydroxide ions formed due to the free
electrons, water molecules and excess oxygen. This film appreciably reduces the corrosion rate,
with control of corrosion. Prominent early research was also done in 1985 published by Goldie
[40] who studied the silicon/calcium cation exchange pigments for corrosion protection of steel
in chloride corrosive environment with saturated pigment extract. The corrosion protection
action was studied to be a cation exchange between the H+ and Ca 2+ ions ( from the medium
and pigment respectively).In ion exchange process the pigments immobilize the aggressive ions

32
like Cl- (which corrodes the Metal), while the ions from the pigments migrate to form a
protective layer on the metal. So in relation to the calcium and silica system, for zinc silicate
system, the protective film on the surface is formed from zinc and silica particles.
The undergoing reactions would be:
Fe → Fe n+ + n electrons
O2 + 2H2O + 4e- → 4OH –
With the presence of zinc silicate pigment,
2ZnSiO3 + 4OH – → 2Zn(OH)2 + 2SiO2
There by controlling the reaction of ferrous ions reacting with hydroxide ions and forming
corrosion product. The corrosion inhibitive effect of zinc silicate is studied to be due to its
comprised effect of zinc ions and protective film of SiO2 that blocks the anodic reaction, a
barrier effect occurs, due to zinc silicate, depressing oxygen reduction because of zinc chloride
formation [16].
1.13.3. Pigment preparation techniques:
Recent trends in nanotechnology enabled us manipulate particle properties both in atomic and
molecular scale. The nanometer products which are used for super capacitive applications such as
metal oxides can be processed in two different ways, i.e., Top–Down and Bottom–Up approach.
In the top-down approach we start with the bulk material and break it down in to smaller fragments.
In this method we use large structures, which are controlled externally in the development or
production of nanostructures. This method includes ball milling, attrition and lithography.
In the bottom up approach we basically build the structure up from an atomic scale to nano scale.
Some of the examples of this processing technique include Self-assembly, liquid- solid
transformation. The liquid solid transformation can be sub classified in to co precipitation, sol gel

33
processing, micro emulsion technique and solvothermal methods. In the coprecipitaion technique
we dissolve the precursor salt (silicates, sufates) in water or other solvent mixtures to precipitate
the oxohydroxide form using a base. Whereas, solgel processing techniques involve production of
metal oxides via hydrolysis of precursors. Microimmulsion technique is based on the formation of
micelles in a mixture containing water, surfactant and oil. During the production of nano metal
oxide particles using the solvothermal method, the metal complexes are decomposed by applying
thermal energy in an inert atmosphere under application of pressure. Figure 1.9 is the schematic
of the top-down and bottom-up approach with the techniques that are used. [6]
Figure 1.9 Schematic of the top-down and bottom-up approach with the techniques used [6]
34
2. Research Plan
2.1. Objective:
Silicate itself being an effective corrosion inhibitor for Fe-based substrates has been shown to
provide significantly enhanced corrosion efficiency. Preliminary studies has proved that zinc
phosphate and calcium silicate pigments show superior corrosion inhibition of Cold Rolled steel,
with good ability of each individual ions and their combined efficiency to inhibit corrosion that
increases their efficiency. The objective of this work, therefore, was to combine the zinc ions and
silicate ions in the form of sodium silicate and zinc sulfate, which are known to be good corrosion
inhibitors in order to form a mixed corrosion inhibitor for higher inhibition efficiency and explore
in-depth the mechanisms by which this increased efficiency occurs, in terms of: processing with
co-precipitation and heat treatment procedures during the pigment preparation phase. Structural
study of the zinc silicate pigment formed and in what way it effects the inhibition behavior on the
steels. Effect of external factors like temperature, stoichiometry of the precursors, concentration
of the pigment on the corrosion inhibition efficiency of the pigment.
Though there have been patents and papers published on zinc silicate as a good corrosion inhibiting
primer there hasn’t been any electrochemical analysis and characterization analysis provided. Also
the zinc silicate pigment is not commercially available in the market so an optimum method to
make zinc silicate is deduced using experiments. Therefore to explain all these aspects this
particular topic has been chosen.
2.2. Approach:
To realize these objectives, the pigment samples are prepared by co- precipitation and heat
treatment techniques, followed by electrochemical characterization using Linear Polarization

35
resistance and Potentiodynamic techniques for the selection of the efficient inhibiting pigment.
Supported by the Immersion and Optical, SEM micrograph are studied. A major part for pigment
characterization includes XRD and FTIR analysis for crystallite size and bond vibrational energy
changes, to study the cell distortions in the system. A manifestation of this is related to what makes
the pigments more active, with increased release of inhibiting ions in the corrosive environment
and the enhanced inhibitor efficiency. This work bridges the processing of pigment to their
inhibition behavior, facilitating their optimal utility.

36
3. EXPERIMENTAL
This chapter gives the information about the materials, various techniques used in preparation and
characterization of the pigment.
3.1. MATERIALS:
3.1.1. Precursor materials:
Reagent grade Zinc Sulfate and Sodium Metasilicate were used for processing of the pigments.
3.1.2. Substrate
Un-pretreated cold rolled steel sheets (ACT code APR10157;3 × 6 × 032;unpolished) were used
as the substrate material.
3.1.3. Corrosive Environment
The corrosive environment for the electrochemical and immersion testing is 1% sodium chloride
solution.
3.2. Pigment Processing:
The pigment preparation involved co-blending and co-precipitation of zinc sulfate and sodium
metasilicates in different stoichiometric ratios. The goal is to prepare the zinc silicate pigment with
maximum corrosion inhibition capacity by using co-blending, co-precipitation and heat treatment
techniques which leads to enhanced corrosion control for steel. This is achieved by the
collaboration of individual ions (Zn, Si).
3.2.1 Co- Blending:
Ball milling allows for the control of the particle size, structural and morphology changes with
enhanced leaching behavior. Along with the optimum heat treatment this will not allow unwanted

37
expansion of moisture. In this work 60/40 was used as the dispersing agent, with the mixing for
10 hours so there is particle size reduction and uniform mixing is achieved, after milling
the solution was washed and centrifuged in vacuum for 10 hours. Together, with the optimum heat
treatment will not allow unwanted expansion of moisture.
Figure 2.1 Inhibitor Co-Blending Processing Procedure
3.2.2 Co- Precipitation Technique:
Zn2SiO4 powders were produced by co-precipitation of ZnSO4 and Na2SiO3 as precursor solutions.
ZnSO4 and Na2SiO3 precursor solutions were made by dissolving in 95:5 solution (95% De-ionized
water; 5% Iso propyl alcohol) separately. The solution is allowed to stir for few hours for equal
distribution of ions. After the solution was stirred the powders were filtered using filter paper. The
powders were then washed with distilled water and were filtered out again. This process was
repeated several times to obtain purer powders. These powders were further dried in a vacuum
oven at around 60oC overnight. These dried powders were then separated in to batches and were
heat treated in reducing atmospheres at different temperatures fixed as per TGA analysis data.
Batch preparation of co-blending
Ball milling of the batch (10 hours)
Centrifuging (5 rpm)
Vacuum Drying of the Centrifuged
powder (10 hours)
Heat Treatment of the powder at desired temperature (450oC )

38
ZnSO4 + Na2SiO3 → ZnSiO3 ↓ + Na2SO4
3.3. Substrate Preparation:
Cut Panels of cold rolled steel were purchased from ACT Test Panel Technologies, the below
procedure was used to clean and prepare the samples for testing in corrosive environment for
corrosion testing.
3.4. Electrochemical Characterization:
3.4.1 Evaluation of corrosion inhibition of zinc metasilicate
The techniques used to evaluate the corrosion inhibition of zinc metasilicate for cold rolled steel
are DC polarization test and immersion test.
All the electrochemical analysis in the current work is performed in a three electrode setup using
Gamry Potentiostat 300G. The software used in the potentiostat is called the Gamry Framework.
All the analysis done is recorded directly in the computer by this software. A three-electrode cell
system including a working electrode, an auxiliary electrode and a reference electrode was used
for the electrochemical measurements. The auxiliary electrode was platinum and the working
The steel panels were cut into
coupons of 2x4 cm2
Cleaned with 7% alkaline solution
Ultrasonic cleaning with acetone
and methanol
Air dried

39
electrode was made of CRS with exposed area of 1cm2. The corrosive solution with the pigment
was stirred for twelve hour and then left to settle after which the saturated solution was taken for
the electrochemical tests. The working electrode was immersed in the test solution at open circuit
potential for 2 hours before polarization measurement until steady state is achieved. The
potentiodynamic polarization curves were carried out by polarizing in the range between -500 and
500 mV with respect to OCP at a scan rate of 1 mV s-1. Electrochemical measurements i.e.,
polarization resistance and potentiodynamic curves were carried out at the open circuit potential
using Gamry Potentiostat at room temperature in deaerated solution. Icorr is measured which is
directly related to corrosion rate.
3.4.2. Echem Analyst:
Echem analyst is the analysis software used to analyze all the data obtained from Gamry. Charge
discharge potentials, charge stored and specific capacitance can be estimated using this analysis
technique.
3.5. Structural Characterization:
3.5.1: Thermogravimetric Analysis:
TGA measures weight changes in the material as a function of temperature or time in a controlled
environment. It is typically used to understand the compositional and stability of the material with
temperature. The weight loss or gain, with temperature give us understanding of various reaction
temperatures in which reactions like decomposition, dehydration and oxidation be taking place.
For the analysis 10 milligram of powder was placed in a platinum pan, which is placed in an
electrically heated furnace in compressed air and nitrogen atmosphere with a thermocouple for

40
appropriate measurements with heating rate of 100C/min up to 10000C. TA, TGA Q50 was used
to perform the TGA analysis [53][54].
3.5.2: X- Ray Diffraction:
X- Ray diffraction technique is used to do the qualitative and quantitative analysis of the material.
It is also used to understand the crystalline state and size, structure, the amount of phases present
and the lattice parameters of the material. X- Ray diffraction is operated on the basis of Bragg’s
law. A diffraction pattern of the monochromatic beam which hits the sample at different angles is
used to understand materials in this technique.
The diffracted beam will be composed of mutually reinforcing scattered beams. The detectors
detect these x-rays and the signals are processed to get a pattern of intensity versus 2 theta. Pattern
matching (PDF or Powder Diffraction Files database) are used for matching and peak indexing
according to the standard file. More symmetry the easier it is to identify the pattern.
Using the peak of maximum intensity the crystallite size can be calculate for each pigment using
the Scherrer Equation published in 1918
cos2
L
KB
Peak width (B) is inversely proportional to crystallite size (L), the size were calculated from the
Full Width Half Maxima of the high peak intensity. The constant of proportionality, K (the
Scherrer constant) was taken as 0.89.λ l for Cu- Kα used is 1.54 A.
X-Ray analysis was done in X'Pert Pro MPD , using diffractomer at 40 KV and 25mA, Cu Kα =
1.5418 Å. Scans were run from 20 -70o 2theta at a speed 0.4 seconds per step and a step of 0.02o
.The base line or control chosen for XRD was JCPDS of Zinc silicate. The structure of which was
41
identified by fitting it to the standard from PDF (Powder diffraction file). X-ray diffraction was
done for the all the heat treated pigments to see if there are peak shifts from that of the baseline
pigments, Scherrer formula was used to measure the crystallite size. Attempts are made to
understand these changes and relate them to corrosion inhibition behavior [58].
3.5.3 Fourier Transform Infrared Spectroscopy (FTIR)
In FTIR analysis IR radiation (2.5 m to 25 m) is passed through the sample, with some radiation
absorbed by the sample and some passed through or transmitted. This wavelength includes
frequencies corresponding to vibrations of mostly all the organic molecules and some inorganic
compounds, so they can be studied. The resulting spectrum of absorption versus wavelength is a
typical characteristic representation of molecular structure. Like a figure print no two molecular
structure have similar spectrum.
In FTIR the infrared source emits radiation of all wavelengths and selected range is sent to the
interferometer from which reconstructed interference beam is passed through sample and focused
on the detectors. The signal from the detector is an interferogram, which undergoes Fourier
transform through a computer to produce infrared spectra usually presented as intensity versus
wave number.
With the IR figure print of the molecular structure, the absorption peaks represent corresponding
frequencies of vibration between bonds of atoms the material is composed of, making it a valuable
resource for qualitative analysis. The intensity of the peak is indication for the amount of material.
So, FTIR can help us understand the consistency of the powder processed (zinc metasilicate)
[56][57].

42
3.5.4. Scanning Electron Microscopy (SEM) and Energy Dispersive Spectroscopy
(EDS):
SEM is an electron microscopy technique used to study the morphology and surface properties of
the materials. It is a highly sophisticated technique which has a very high resolution and
magnification. Microstructures of heat treated zinc metasilicate pigments were obtained using
SEM. Energy Dispersive Spectroscopy is used to determine the elemental composition of the
material. It helps in obtaining the distribution of elements at a certain region on the sample area.
3.5.5. Immersion and Optical Microscopy:
Immersion tests measure the progress of corrosion damage obtained from the immersion length
within a corrosive environment, as well as other factors that can accelerate the corrosion process.
To carry out the immersion test firstly saturated solutions of 1% Nacl with and without the zinc
silicate inhibitor pigment should be made. Prior to be test the CRS substrates are polished with
100-1000 grade emery paper. The specimens should were washed with distilled water and
degreased with acetone and dried with a cold air blaster. After polishing and cleaning these
substrates, are then immersed in the solutions with inhibitor and without inhibitor for 3 days. Post
immersion test these samples are tested under an optical microscope to see the corrosion product
on the samples, whether the inhibitor in the solution prevents the sample from getting corroded.

43
4. RESULTS
This chapter gives the information about the results of corrosion testing and the pigment
characterization, relating both the aspects and justifying the corrosion inhibition with respect to
structural analysis.
4.1. TGA:
Figure 5.1 shows the thermogravimetric analysis of the processed zinc silicate pigment using co-
precipitation technique (It is a plot between weight loss in mg vs temperature in degrees Celsius).
There is weight loss of about 10% within the temperature range 100°C- 250°C which can be
attributed to the processing routes(coprecipiation), also the formation of willemite (Zn2SiO4)
occurs only after 250C.[Takesue, 2009 #6]. It is observed that there is no weight loss after 300°C
until 900°C since the curve stabilizes until this temperature and there is a phase change after this
temperature. The calcining temperature was chosen to be 450°C, as at a higher temperature the
0 200 400 600 800 1000
80
90
100
Ma
sslo
ss(%
)
Temperature(°C)
TGA ZnSiO3
Figure 4.1. Thermogravimetric analysis of co-precipitated Zinc silicate pigment
44
activity of the pigments starts decreasing. The heating rate for the calcinations was designed to be
10°C/min, which seemed to be the optimum rate according to the TGA results.
4.2. ELECTROCHEMICAL ANALYSIS:
The electrochemical tests were conducted on samples with variations in the powder processing
techniques, temperatures and stoichiometry. All the data is presented and compared to find the
best sample which gives the maximum corrosion inhibition efficiency.
Rate of corrosion and corrosion efficiency are measured with respect to corrosion current denoted
as icorr. For corrosion current (icorr) measurement, potentiodynamic curves are used. From the
corrosion measurement technique discussed in Chapter 1. Tafel extrapolation from
potentiodynamic curve method is used to get the values of icorr. According to corrosion rate
Equation (34) of Chapter 1, more the corrosion current more is the rate of corrosion, resulting in
more damage of the metal. The Potentiodynamic curve analysis is used to study the effectiveness
of pigments prepared using coblending and coprecipitation techniques at different heat treated
temperatures. The individual potentiodynamic curve for each of the samples is shown and the
behavior is explained below.
The Corrosion rate of the inhibitor pigments was calculated from the icorr values obtained from
tafel plots using the equation below
C.R (mpy) = 0.13(icorr)*E.W / d
Where:
C.R = corrosion rate
E.W = Equivalent weight of the metal

45
D = density of the metal
Inhibitor Efficiency (%) = 100*(CRuninhibited - CRinhibited)/CRuninhibited
Where:
CRuninhibited = corrosion rate of the uninhibited system
CRinhibited = corrosion rate of the inhibited system
4.2.1. Electrochemical Results:
The coblended powders of zinc oxide and silica powder in 1:1 molar ratio heat treated at 80°C
were measured for electrochemical tests. From the figure 5.2 it is clearly observed that the icorr
value is above 10μA which proves that pigment corrosion efficiency is low since the icorr value is
linearly related to the corrosion rate. Higher the corrosion current higher is the rate of corrosion.
It is also observed that there is no passivation region in the anodic curve as the electrode potential
is increasing.
Figure 4.2 Potentiodynamic Curve of 1% NaCl + Coblended ZnO:SiO2 at 80°C
icorr= 10µA
E corr=-600mV

46
Further the powders were heat treated at higher temperatures to check for the reactivity, but still
no change is observed in the corrosion inhibition behavior of the sample which shows that the
coblended powders were not good inhibitors.
Figure 4.3 Potentiodynamic curve of 1% NaCl + Coblended pigment at 450°C
Figure 4.4 Potentiodynamic curve of 1%NaCl + Coprecipitated pigment at 80°C

47
Figure 4.5 Potentiodynamic curve of 1% NaCl + coprecipitated powder at 450°C
Figure 4.6 Potentiodynamic curve of 1%NaCl + comparison of Coblended and Coprecipitated
powders

48
The process of coprecipitation was improved fiurther more by adding another step into the
process i.e., stirring the slurry for another day after the precipitate is formed. This helps in the
interaction of the particles, which would help to make the solution homogenous. Also more
interaction of the particles leads to nucleation and grain growth, there by leading to formation of
more prominent grains which can be attrubuted to the activity of the powders. In the figure 5.7 it
is clearly seen that stirring has strongly affected the activity of the powder by decrease in the
corrosion current, also there is a strong passivation region in the anodic region as the potential is
increasing. And further more figure 5.9 shows that at 450°C the powders has reached an
optimum level of activity since the corrosion current for this powders has the minimum value.
Figure 4.7 Potentiodynamic curve of 1%NaCl + coprecipitated pigment with stirring at 80°C

49
Figure 4.8 Potentiodynamic curve of 1%NaCl + coprecipitated pigment with stirring at 300°C
Figure 4.9 Potentiodynamic curve of 1%NaCl + coprecipitated pigment with stirring at 450°C

50
Figure 4.10 Potentiodynamic curve of 1%NaCl + coprecipitated pigment with stirring at 600°C
Figure 4.11 Potentiodynamic curve of 1%NaCl + coprecipitated pigment with stirring at 800°C
51
Figure 4.12 Potentiodynamic curve of 1%NaCl + comparison of all the temperatures of copreciitated
powders
Figure 4.13 Potentiodynamic curve of 1%NaCl + coprecipitated pigment with 1:3 ratio of precursors

52
Table 1 Icorr values for CRS from Potentiodynamic scan with different temperatures
Table 1 Icorr values for CRS from Potentiodynamic scan with different temperatures
Figure 4.14 Potentiodynamic curve of 1%NaCl + coprecipitated pigment with 3:1 ratio of precursors
Figure 4.15 Potentiodynamic curve of 1%NaCl + comparison of different ratios
53
Table 1 Icorr values for CRS from Potentiodynamic scan with different temperatures
Table 2 Polarization resistance for CRS with different temperatures
0.2
2
0.78
0.48 0.5
0.2
0.5
1.1
0
0.5
1
1.5
2
2.5
SrCrO4 NaCl ZS 80°C ZS 300°C ZS 350°C ZS 450°C ZS 550°C ZS 800°C
Ico
rr(µ
A)
Corrosion Current from Tafel Plots
65
0.697
29.26
50.151.95
57.51
48.4
41.22
0
10
20
30
40
50
60
70
SrCrO4 NaCl ZS 80° ZS 300°C ZS 350°C ZS 450°C ZS 500°C ZS 800°C
Rp
(K
oh
ms)
Polarization Resistance from Linear Polarization Resistance Curve

54
Table 3 Corrosion Rate for CRS from Potentiodynamic Scan for different temperatures
Table 4. Icorr values for all the pigments at different temperatures.
ZnSiO3 pigment at different temperatures icorr (µA)
80°C (8th) 0.8-0.9
80°C(6 decant) 0.6-0.7
80°C 0.7-0.8
80°C 0.5-0.6
300°C 0.6
400°C 0.4
400°C 0.6
450°C 0.1-0.2
450°C 0.3
450°C 0.3
500° 0.5-0.6
600° 1.0-2.0
800°C 2.0-3.0
From the above results it can be seen that with increasing temperature up to 450°C and the
stirring time of the coprecipitated solution there is an increase in the corrosion inhibition. The
processing technique can lead to various surface morphology changes like giving more time and
0.09
1.8
0.3510.216 0.225
0.090.225
0.495
0
0.2
0.4
0.6
0.8
1
1.2
1.4
1.6
1.8
2
SrCrO4 NaCl ZS 80° ZS 300°C ZS 350°C ZS 450°C ZS 500°C ZS 800°C
Co
rro
sio
n R
ate(
mp
y)
Sample
Corrosion rate in mpy

55
Table 5. Icorr values for the pigments prepared out of precursors with different stoichiometry
ZnSiO3 with ZnSO4: Na2SiO3 ratio icorr (µA)
1:1 at 450°C 0.2-0.3
1:3 at 450° 0.6-0.7
3:1 at 450°C 0.7-0.8
window for nucleation and grain growth, as is discussed in Chapter1. Increased corrosion
inhibition is due to increased activity of the ions as the temperature is increasing which can be
attributed to the reactivity of the powder and also particle size, to understand further how this
increased availability of inhibiting ions is present, various characterization are performed on the
inhibitors to develop our understanding further. Also the corrosion inhibition of the powders
processed using different molar ratios showed high corrosion current when compared to the
equal molar ratios which proves that the reaction of the precursor materials is in equal molar
ratios.
4.3. FTIR ANALYSIS
In the FTIR spectrum, absorption of the infrared spectrum is plotted versus wavenumber. The
bending, stretching, twisting symmetric and asymmetric vibrations of bonds, or such vibrational
bond deformation in the molecule can also lead to changes in the absorption spectrum. The
structural deformations in terms of changes observed in these vibrations, are studied through
FTIR .It takes more energy for stretching and asymmetric vibration of the bond so these
vibrations are seen at high wavenumber, and conversely bending and symmetric vibrations need
less energy, so are seen at lower wavenumbers [49]
For FTIR, the processed zinc silicate heat treated inhibitor pigments at different temperatures with
variation in the processing are analyzed with the help of standard FTIR peaks for silicates, zinc

56
oxygen and silicon bond peaks, by the concept of elimination. The silicate bonds are seen as a very
complex group of absorption bands in wide range of wavenumbers, with higher wavenumber 700-
1300 cm-1 for stretching vibrations and with lower wavenumber associated with bending
vibration’s absorption bands broadly seen in the range of 400-550 cm-1 and 600-700 cm-1.
The bending vibrations of Si-O-Si, O-Si-O bonds are seen at 458cm-1, asymmetrical vibrations of
the SiO4 tetrahedral chain. The absorption band at 819 cm-1 is due to the stretching of the O-Si-Ο
bond. In 800–1300 cm-1 wavenumber range for the stretching vibrations of the Si–O–Si. At higher
wavenumber value, as mentioned above the asymmetric stretching of Si–O–Si bond and SiO4
tetrahedral occur at higher wavenumber broadly in 800-1300 cm-1 and 900-1100 cm-1 respectively.
The absorption peak at 1080 cm-1 is due to the symmetric stretching vibration of the Si-Ο-Si bonds
[50][51].
Based on the above wavenumber values for specific vibrations, or range of vibration energy
associated, the processed inhibitor can be compared with the baseline to assign the specific peak,
the peak in the 550-570 cm-1 and 640-644 cm-1 can be attributed to Si-O-Si bending vibrations,
Heat treated silicate peaks in the range 890 – 970 cm-1 can be attributed to the stretching vibrations
of Si-O-Si The peak in the range of 1006 – 1030 cm-1 may be indicative of symmetric stretching
of Si-O-Si bonds. The peak in the range 1495- 1508 cm-1 can be attributed to Zn-O-Si bonds. The
peak in 1640 -1670 cm-1 is due to bending vibration of molecular H2O, the vibrations in the range
f 3000-4000 cm-1 is due to hydroxyl in water, which is due to stretching vibrations of O-H group
in H2O, wide range is due to formation of Hydrogen bond in wide range of strengths.
The O-H bonds of water molecules which occur around 1640-1670 cm-1 are not observed in the
pigments since all the powders are vacuum dried and sintered at 80°C to remove any residual
moisture of water from them.

57
Table 6. FTIR peaks for bonds present in the zinc silicate pigment [48]
500 1000 1500 2000 2500 3000 3500 4000 4500
-0.01
0.00
0.01
0.02
0.03
0.04
0.05
0.06
0.07
ZS processes with stirring at 450°C
Ab
so
rba
nce
Wavenumber(cm-1)
without stirring 450°
with stirring 450°C
ZS processes without stirring at 450°C
Figure 4.16 FTIR analysis of the processed ZS powders with change in processing techniques
Group wavenumber(cm-1)
Si-O-Si 460
O-Si-O 800
Si-O-Si 1080
H2O 1640-1670
Zn-O-Si 2400
Zn-O, Zn-O-Si 2800
O-H 3400

58
1000 2000 3000 4000
-0.02
0.00
0.02
0.04
0.06
0.08
0.10
0.12
0.14
0.16
0.18
Ab
so
rba
nce
Wavenumber(cm-1)
ZS at 600°HT
ZS at 450°HT
ZS at 300°HT
ZS at 80°C HT
Figure 4.17 FTIR for ZS inhibitors at different heat treatment temperatures
And for ZnSO4, the absorption peaks were found to be 1190, 1150, 1085, 1075, 1005, 695, 605, 451 [48].
Reports assigned some peaks to ZnO such as 2865-2971 cm-1 and 3419 cm-1 and 3409 cm-1 but the peaks are not
really characteristic to ZnO, and a registration of FTIR spectra between 400-500 cm-1 could have proved the
presence of ZnO. The 2450 cm-1 to 2560 cm-1 can be attributed to the zinc, silicon and oxygen peaks which can
be specific to zinc metasilicate bonds.

59
4.4. XRD ANALYSIS
Figure 4.18 JCPDF of zinc silicate (ZnSiO3)
The baseline xrd for ZnSiO3 were available as PDF (Powder Diffraction File) with the number
PDF- 01-078-5350. The figure 4.23 shows the xrd pattern for the zinc silicate with main peaks
between 30°- 45° 2theta. The powdered pigments at different sintered temperatures were measured
for xrd patterns. The crystallite sizes are measured for the different peaks.

60
20 30 40 50 60 70
0
20
40
60
80
100
120
140
160
80°C HT
inte
nsity
2theta
(2,1,2)
(3,2,2)
Figure 4.19 XRD of coprecipitated pigment with Stirring at 80°C
15 20 25 30 35 40 45 50 55 60
20
40
60
80
100
120
140
160
inte
nsity
2theta
ZnSiO3 No stirring 80°C
Figure 4.20 XRD of coprecipitated pigment without Stirring at 80°C
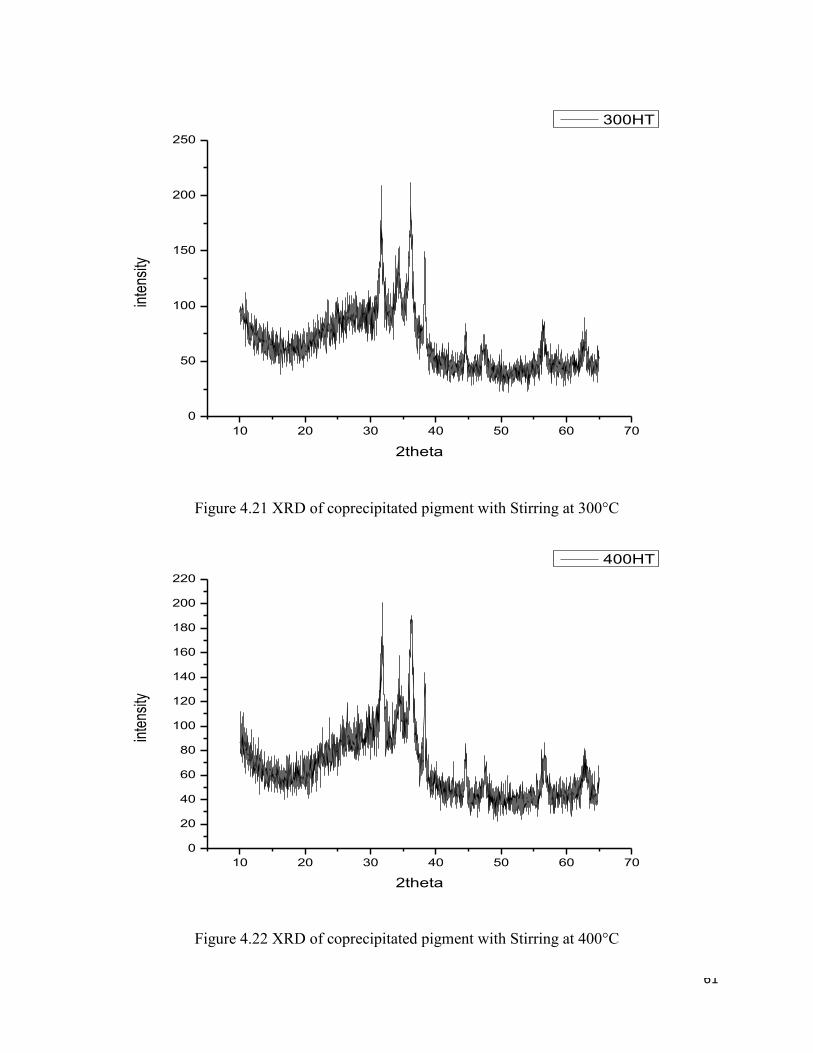
61
10 20 30 40 50 60 70
0
50
100
150
200
250in
tens
ity
2theta
300HT
Figure 4.21 XRD of coprecipitated pigment with Stirring at 300°C
10 20 30 40 50 60 70
0
20
40
60
80
100
120
140
160
180
200
220
inte
nsity
2theta
400HT
Figure 4.22 XRD of coprecipitated pigment with Stirring at 400°C

62
10 20 30 40 50 60
0
50
100
150
200
inte
nsity
2theta
450HT
Figure 4.23 XRD of coprecipitated pigment with Stirring at 450°C
10 20 30 40 50 60
0
50
100
150
200
250
300
350
400
inte
nsity
2theta
550HT
Figure 4.24 XRD of coprecipitated pigment with Stirring at 550°C

63
10 20 30 40 50 60
0
50
100
150
200
250
300in
tens
ity
2theta
600HT
Figure 4.25 XRD of coprecipitated pigment with Stirring at 600°C
10 20 30 40 50 60 70
0
100
200
300
400
500
inte
nsity
2theta
800HT
(4,0,0)
(3,1,1)
(4,2,0)1,3,1)
(3,0,2)
(3,2,2)
(2,3,2)
Figure 4.26 XRD of coprecipitated pigment with Stirring at 800°C

64
The crystallite size can be calculated from Debye – Scherer equation, which is,
𝑑 =𝑛 𝜆
𝛽 𝑐𝑜𝑠𝜃
where,
d – crystallite size
n – shape factor (constant = 0.9)
λ – Wavelength of the X - ray source
β – Full width and half maximum of the 100% intensity peak in radians
θ – Angle between the incident ray and the scattering planes.
Table 7 Crystallite sizes of the zinc silicate pigment at different sintering temperatures
Zinc silicate at temperatures
Peak 1(at 38)(nm)
peak 2 (at 44)(nm)
80° 32.16 21.23
300° 35.71 34.89
400° 42.29 34.16
450° 45.29 37.23
550° 44.4 33.82
600° 35.11 42.13
800° 16.53 10.33
The crystallite sizes are given in the table 5.
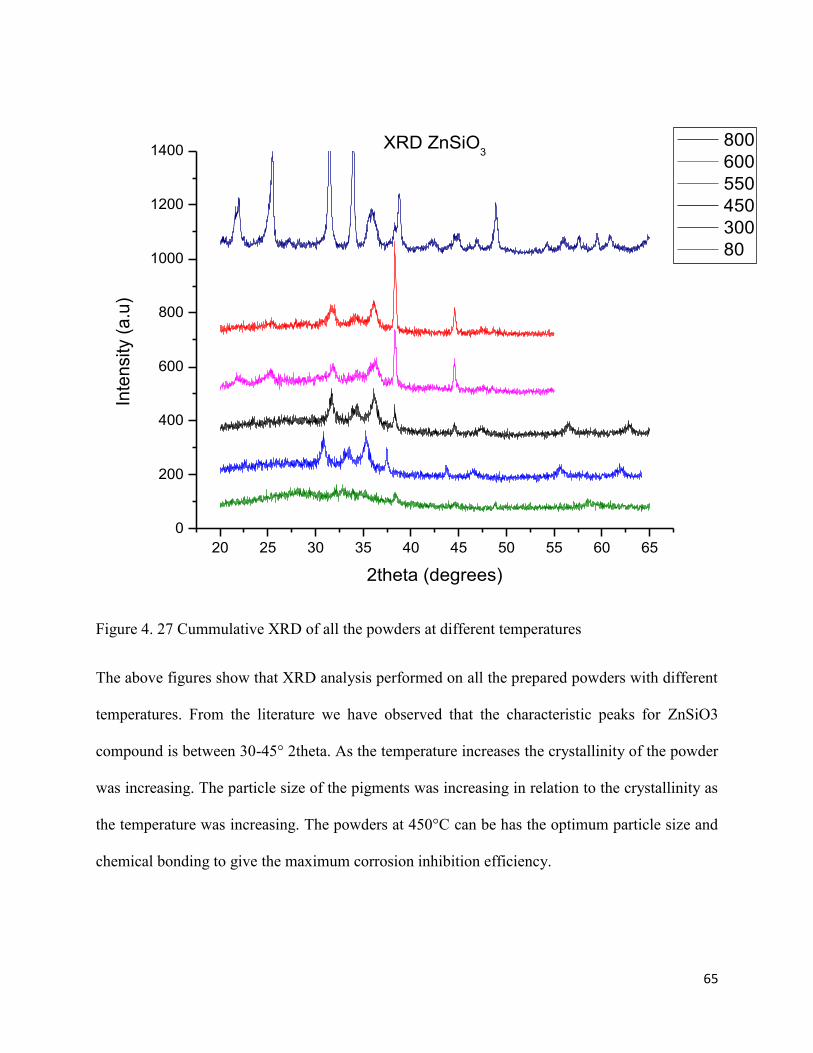
65
20 25 30 35 40 45 50 55 60 65
0
200
400
600
800
1000
1200
1400
Inte
nsity (
a.u
)
2theta (degrees)
800
600
550
450
300
80
XRD ZnSiO3
Figure 4. 27 Cummulative XRD of all the powders at different temperatures
The above figures show that XRD analysis performed on all the prepared powders with different
temperatures. From the literature we have observed that the characteristic peaks for ZnSiO3
compound is between 30-45° 2theta. As the temperature increases the crystallinity of the powder
was increasing. The particle size of the pigments was increasing in relation to the crystallinity as
the temperature was increasing. The powders at 450°C can be has the optimum particle size and
chemical bonding to give the maximum corrosion inhibition efficiency.

66
4.5. SEM:
SEM images of the zinc silicate inhibitors with different calcination temperatures and
magnifications are presented to observe the surface morphology of the inhibitors.
Figure 4.28 Coprecipitated Zinc silicate at 500X magnification for powders sintered at 80°C
Figure 4.29 Coprecipitated Zinc silicate at 12000X magnification for powders sintered at 80°C

67
Figure 4.30 Coprecipitated Zinc silicate at 500X magnification for powders sintered at 300°C
Figure 4.31 Coprecipitated Zinc silicate at 500X magnification for powders sintered at 450°C

68
Figure 4.32 Coprecipitated Zinc silicate at 500X magnification for powders sintered at 600°C
Figure 4.33 Coprecipitated Zinc silicate at 500X magnification for powders sintered at 800°C

69
Figure 4.34 Coprecipitated Zinc silicate at 12000X magnification for powders sintered at 300°C
Figure 4.35 Coprecipitated Zinc silicate at 12000X magnification for powders sintered at 450°C

70
Figure 4.36 Coprecipitated Zinc silicate at 12000X magnification for powders sintered at 600°C
Figure 4.37 Coprecipitated Zinc silicate at 12000X magnification for powders sintered at 800°C

71
As the temperature was increasing the particle size of the powders was increasing. From the SEM
it is observed that as the temperature is increasing there is an increase in the grain size of the
pigments. And that can be attributed to the corrosion activity of these inhibitors.
The powders prepared at 80°C shows active phases and flocks of the particles which can be
attributed that there is a zinc silicate phase forming in the pigment. As the temperature is increasing
slowly the flock size starts decreasing and the growth of nuclei is clearly visible. At the higher
magnification that is 12000X as there is increase in the temperature the size of the crystals become
larger and the coagulation of the flocks is more transparent. And it can be claimed that figure 4
450°C the powders have the optimum level of flocks of grains and crystal size, since as the crystal
size is increasing the surface area decreases. As the surface area decreases the amount of area
present for releasing of the inhibitor species would be low there by reducing the corrosion
inhibition efficiency.
EDS:
EDS gives the information of the elemental composition of the powders. In relation to the SEM
testing the compositional analysis of the pigment can be done. The eds results shown in the figure
that the powder consists of Zinc, silicon and oxygen atoms. So it is evident that the powders
obtained are zinc metasilicate. There is slight amount of gold and platinum visible in the graph
which can be attributed to the sputtering of the pigments to make the powders conductive so as to
increase the electronic interaction to acquire information of the particles.

72
Figure 4.38 EDS of the powder at 80°C where the composition of the pigment is measured
O K 37.95 45.20 384.65 9.59
AlK 0.12 0.09 4.45 67.57
SiK 13.76 9.34 612.47 5.42
AuM 3.97 0.38 64.96 9.91
PdL 0.97 0.17 19.32 35.03
ZnK 18.34 5.35 139.07 5.59
Table 6. The percentage composition of the elements in the pigment
Figure 4.39 Graph showing the elements present in the pigment

73
4.6. Immersion Testing:
The immersion samples show that the inhibitor pigments protected the substrate from getting
corroded by forming a passive layer when comparison to the immersed samples in corrosive
environment without inhibitor.
Figure 4.40 Optical microscopy samples in 1% Nacl solution at 100 μm a) with the inhibitor b)
without inhibitor
Figure 4.41 Optical microscopy samples in 1% Nacl solution at 50 μm a) with the inhibitor b)
without inhibitor

74
Figure 4.42. Optical microscopy samples in 1% Nacl solution at 20 μm a) with the inhibitor b)
without inhibitor
From the figures 4.40, 4.41 and 4.42 it is clearly seen that the zinc silicate pigment acts as a
protection layer on the substrate from corroding.
Since zinc silicate is a mixed inhibitor the mechanism of protection could be attributed to both
anodic and cathodic reaction. There would be a zinc silicate layer forming on the substrate, slowing
down the whole cathodic reaction to prevent the corrosion of substrate. Free zinc ions in the
pigment present in the solution acts as cathodic reaction inhibiting species react with the corrosion
accelerating ions( chlorides in this case) and form zinc chloride. And the silicate ions act as anodic
reaction inhibiting species there by forming a passive layer on the substrate from reacting with the
corrosive environment.

75
5. Discussion:
The electrochemical data , and characterization results of pigments , now it can be clearly related
to that fact that for increased corrosion inhibition processing along with temperature plays a
significant role, from the electrochemical data it is clearly established that zinc metasilicate is an
effective corrosion inhibitor comparable to strontium chromate powders. The powders prepared
with precursor materials zinc sulfate and sodium metasilicate using coprecipitation technique
showed best performance and this performance is enhanced by increasing the stirring time which
yields to added time for nucleation and grain growth in the precipitated solution. So in the
coprecipitation technique the zinc metasilicate which is precipitated becomes more reactive as
there is an increase in the temperature. Also it is important to mention the key step in the
coprecipitation process, the stirring time of the precipitate had a major role in the activity of the
pigment. With increased stirring there is more scope for homogeneity in the system along with
particle interaction, this leads to increase in grain size due to nucleation and grain growth. This
increase in the crystallite size and grain size is seen in the SEM images of the inhibtors. The
increase in the inhibition is noticed until it reaches a temperature of 450°C. At this temperature
there is the optimum crystallite size of the pigment along with the reactivity. These processed
pigments were electrochemically tested to understand their corrosion inhibition behavior.
Along with electrochemical study we have the characterization to prove that the pigments
formed were zinc metasilicate. XRD and FTIR provide deeper understanding regarding the
structural characteristics of the pigment. JCPDF files of zinc metasilicate XRD were taken as
baseline to compare if the pigment had the zinc metasilicate peaks, it is also observed that theer
is increase in the crystallite size which is calculated from then Full width half maximum of the

76
peaks using scherrer’s formula. From the literatures we have known that zinc silicate is an
effective corrosion inhibition primer, so the peaks of zinc metasilicate can be attributed to the
corrosion activity of the pigment. Stirring of the precipitate made the powders more amorphous
leading to more surface area available for leaching and corrosion inhibition. FTIR analysis shows
that there are Si-O-Si peaks and also peaks which can be attributed as Zn-O-Si peaks. Also
distortion are introduced in the silicate system in the form of bond vibration energy. There are
changes in the whole system, and these changes are more specific to Si-O-Si bending and Zn-O-
Si stretching vibrations obtained from the FTIR data. These powder characteristic techniques
show that the basic zinc metasilicate system is confirmed and the phase formed with zinc
metasilicate at lower temperatures also has good activity in relation to corrosion.
The surface morphology changes of the substrate studied through the SEM, optical and EDX
show the presence of inhibitor. This inhibition is provided by the Zn and Silicates.
The inhibition mechanism of these pigments can be related to the zinc silicate primer coatings
which is studied in the literature. Zinc and silicate ions along with the zinc silicate compound
form a protective layer or passivation layer on the substrate to reduce the cathodic and anodic
reaction rates since these are mixed inhibitors. The processing of zinc silicate pigments has been
studied in the literatures there was no technique for making zinc metasilicate pigment with low
temperatures. This thesis provides a unique method of making this pigments along with relating
them to the corrosion inhibition activity, since they have corrosion inhibition efficiency
comparable to chromate inhibitors and can be easily made.

77
6. Conclusions:
1) Zinc metasilicate pigments were successfully developed using co-precipitation and
solution blending techniques from commercially available chemicals. The pigments developed
were characterized using XRD, TGA, SEM and DC-polarization techniques. The principles of
anion-cation exchange behavior were proven by DC-polarization testing, in which the metal
substrates showed corrosion resistance characteristics comparable to that of the chromate solution
2) Zinc metasilicate show the best result for CRS, with further increase in efficiency by heat
treatment process. Electrochemical analysis show corrosion inhibition of the processed pigments
for CRS steel. The corrosion values dropped from 10μA to 0.1μA which is substantial difference.
3) XRD, FTIR, SEM, EDX and Optical characterization provide in-depth understanding of
the pigments, which show that inhibition is due to the presence of zinc silicate bonds and inhibiting
species. These studies showed the structural relationship to the corrosion inhibition of the inhibitor
species.
This works successfully correlates the characterization of the pigments to its processing, providing
us with the understanding of processing of pigment for their optimal utility and corrosion
protection. Overall, this research has demonstrated that alternative corrosion inhibitive pigments
which are non-toxic in nature can be developed. These pigments have the potential to replace
chromate based pigments and can be developed from inexpensive zinc-silicate based compounds.

78
7. Suggestions for Future Work:
1. ICP-MS studies can be performed on the pigment to study the behavior of
inhibitor species over a period of time in a solution. This gives an initial idea
about how the anions and cations are behaving in the solution: a higher
concentration indicates that there is a higher rate of release of these ions which
could then take part in the corrosion inhibition process, whereas a lower
concentration means the ions would be less effective.
2. Different Heat treatment settings can be studies in the coprecipitation technique
of the zinc and silicate compounds with varying time for stirring.

79
8. References:
1. Robert Boyle, The Mechanical Origine or Production of Corrosiveness and Corrosibility, 1675
pages 203-225.
2. Walsh, F. Faraday and his laws of electrolysis, Bulletin of Electrochemical, 7, 11, 481–489 (1991).
3. Edward Ghali, V. S. Sastri, M. Elboujdaini Corrosion Prevention and Protection: Practical
Solutions. Chapter 4, pages 150-185, 225-270.
4. Zaki Ahmad “Principles of Corrosion Engineering and Corrosion Control”, 1997, pages 35- 86.
5. Schönbein, C, Pogg. Ann., 37, 390 (1936)
6. Evans, U.R. An Introduction to Metallic Corrosion, 2nd ed. London: Arnold. (1972) Chapter 7
pages 120- 187.
7. Uhlig, H.H. Corrosion and Corrosion Control, 3rd ed. New York: John Wiley and
Sons. (1985).
8. Fontana, M.G. (1986). Corrosion Engineering, 3rd ed. New York: McGraw-Hill Book
Company.
9. Elliott, Jeannine Chromate-Free Nanoparticle Corrosion Inhibitors for Steel , EPA 2005
10. Corrosion Costs and Preventive Strategies in the United States, NACE 1998
11. Materials Performance, Special National Association of Corrosion Engineers (NACE)
Issue, Houston, Texas USA, July. Jointly with C. C. Technologies and FHWA (2002)
12. ASM International, “Fundamentals of Electrochemical Corrosion “ (#06594G) 2000
13. Davis, Joseph R., ed. Corrosion: Understanding the basics. ASM International, 2000.
14. Newman, John, and Karen E. Thomas-Alyea. Electrochemical systems. John Wiley & Sons, 2012.
15. Kelly, Robert G., et al. Electrochemical techniques in corrosion science and engineering. CRC
Press, 2002.
16. Talbot, David EJ, and James DR Talbot. Corrosion science and technology. CRC Press, 2007.
17. James Denny corrosion science book
18. Fontana, Mars Guy. Corrosion engineering. Tata McGraw-Hill Education, 2005.
19. M. Stern, "A method for determining corrosion rates from linear polarization data," Corrosion, vol.
14, pp. 60-64, 1958.
20. M. Stern and A. L. Geary, "Electrochemical polarization I. A theoretical analysis of the shape of
polarization curves," J. Electrochemical. Soc., vol. 104, pp. 56-63, 1957.

80
21. F. Mansfield, “The Polarization Resistance Technique for Measuring Corrosion Currents”,
Advances in Corrosion Science and Technology, Vol. 6, ed. by M. G. Fontana and R. W. Staehle,
Plenum Press, New York (1976).
22. Princeton Applied Research “Basics of Corrosion Measurements” Application Note CORR-1
23. M. Stern, J. Electrochemical Soc., 102, 609, 663 (1955)
24. D.A Jones, Principles and prevention of corrosion, 1996
25. 8. R. Brandy and D. A. Jones, Corrosion, 32, 126 (1967).
26. MCNEIILL, LAURIE S., and Marc Edwards. "Iron pipe corrosion in distribution systems." Journal
(American Water Works Association) (2001): 88-100.
27. Park, S. A., et al. "Comparative study on the corrosion behavior of the cold rolled and hot rolled
low-alloy steels containing copper and antimony in flue gas desulfurization environment." The
Physics of Metals and Metallography 115.13 (2014): 1285-1294.
28. Liu, Lin-Gun, High-pressure phase transformations and compressions of ilmenite and rutile, I.
Experimental results, 1975
29. Aramaki, Kunitsugu. "The inhibition effects of chromate-free, anion inhibitors on corrosion of zinc
in aerated 0.5 M NaCl." Corrosion Science 43.3 (2001): 591-604.
30. D.R. Lide (Ed.), CRC Handbook of Chemistry and Physics, 80th ed., CRC Press, Boca Raton,
1999,
31. C.V. D'Alkaine, M.N. Boucherit, J. electrochemical. Soc. 144 (1997) 3331.
32. S. Peulon, D. Lincot, J. Electrochem. Soc. 145 (1998) 864.
33. Volkan Cicek,”Corrosion Engineering” John Wiley & Sons,Technology & Engineering , 2014
34. N.I. Sax, R.J. Lewis Sr., Dangerous Properties of Industrial Materials, 7th ed., vol. III, Van
Nostrand Reinhold. New York, 1989, p. 3056.
35. Dariva, Camila G., and Alexandre F. Galio. "Corrosion Inhibitors–Principles, Mechanisms and
Applications." (2014).
36. O. L. Riggs, Jr., in C. C. Nathan (Ed.), Corrosion Inhibitors, NACE, Houston, TX, 1973, p. 11.
37. Noor, Ehteram A., and Aisha H. Al-Moubaraki. "Thermodynamic study of metal corrosion and
inhibitor adsorption processes in mild steel/1-methyl-4 [(-X)-styryl pyridinium
iodides/hydrochloric acid systems." Materials Chemistry and Physics 110.1 (2008): 145-154.
38. Liu, Lin-Gun, The high-pressure phases of MgSiO3, 1976.
39. Armstrong, R. D., and S. Zhou. "The corrosion inhibition of iron by silicate related
materials." Corrosion science 28.12 (1988): 1177-1181.
40. Chang, Yu-Chi, A kinetic model for the anodic dissolution of of zinc in alkaline electrolyte with
sodium metasilicate additions, 1996

81
41. Armstrong, The corrosion inhibition of iron by silicate related materials, 1988
42. Rosenthal, A. B. Garofalini, S. H, Molecular dynamics simulation of amorphous zinc silicate,
Journal of Non-Crystalline Solids, 1986.
43. Liu, Lin-Gun, Post-ilmenite phases of silicates and germinates, 1977.
44. Matsuzaki, Akira, et al. "Self-Healing Effect by Zinc Phosphate and Calcium Silicate Included in
Organic-Inorganic Composite Coating on 55% Al-Zn Coated Steel Sheet." Materials
transactions 52.6 (2011): 1244-1251.
45. G. Meyer: Schweiz. Arch. Angew. Wiss. Tech. 31 (1965) 52–56.
46. Ito, Eiji Matsui, Yoshito, High-pressure synthesis of ZnSiO3 ilmenite, Physics of the Earth and
Planetary Interiors, vol 9, pages 344-352
47. L.G. Berry, B. Mason, Mineralogy – Concepts, descriptions and Determinations, W.H. Freeman
and Company, San Francisco, 1959.
48. Siriwardane, “FTIR Characterization of the Interaction of Oxygen with Zinc
Sulfide" paper 1995.
49. Coates, J. "Interpretation of infrared spectra: A practical approach, 2000."Encyclopedia of
Analytical Chemistry: 10815-10837.
50. International
51. N. Mostafa, E. Kishar and S. Abo-El-Enein, "FTIR study and cation exchange capacity of Fe 3 -
and Mg 2 -substituted calcium silicate hydrates," J. Alloys Compounds, vol. 473, pp. 538-542,
2009.
52. S Shaw, C.M.B Henderson, B.U Komanschek ,” Dehydration/recrystallization mechanisms,
energetics, and kinetics of hydrated calcium silicate minerals: an in situ TGA/DSC and synchrotron
radiation SAXS/WAXS study Original Research ArticleChemical Geology”, Volume 167, Issues
1-2, 5 June 2000, Pages 141-159
53. PerkinElmer.” Thermogravimetric Analysis, A Beginner’s Guide” 2010
54. TA Instruments” Thermogravimetric Analysis”, 2015
55. Thermo Nicolet, “Introduction to Fourier Transform Infrared Spectrometry”, 2001
56. Cullity, B. D. 1978. Elements of X-ray diffraction. 2nd ed. Addison-Wesley, Reading,Mass
57. Tata Steel Construction Knowledge , ” Corrosion protection”
58. J. Chen, H. Chao, Y. Lin, I. Yang, J. Oung and F. Pan, "Studies on carbon steel corrosion in
molybdate and silicate solutions as corrosion inhibitors," Surf. Sci., vol. 247, pp. 352-359, 1991.
59. Surendranath, Arun. Corrosion Inhibiting Non-Toxic Calcium Silicate Based Pigments. Diss.
University of Cincinnati, 2011.
60. International Association for powder diffraction file

82
61. Dumpawar, Shivani, Calcium Silicate/Phosphate Inhibitors for Corrosion Control of Hot Dipped
Galvanized and Cold Rolled Steels, University of Cincinnati, 2015
62. Camila G. Dariva and Alexandre F. Galio, Corrosion Inhibitors – principles, mechanism and
applications.
Copyright © 2022 FDOKUMEN