The Influence of Organic Pigments on Coating Properties
40
e University of Akron IdeaExchange@UAkron Honors Research Projects e Dr. Gary B. and Pamela S. Williams Honors College Spring 2018 e Influence of Organic Pigments on Coating Properties Sarah Medeiros [email protected] Please take a moment to share how this work helps you through this survey. Your feedback will be important as we plan further development of our repository. Follow this and additional works at: hp://ideaexchange.uakron.edu/honors_research_projects Part of the Other Materials Science and Engineering Commons , and the Polymer and Organic Materials Commons is Honors Research Project is brought to you for free and open access by e Dr. Gary B. and Pamela S. Williams Honors College at IdeaExchange@UAkron, the institutional repository of e University of Akron in Akron, Ohio, USA. It has been accepted for inclusion in Honors Research Projects by an authorized administrator of IdeaExchange@UAkron. For more information, please contact [email protected], [email protected]. Recommended Citation Medeiros, Sarah, "e Influence of Organic Pigments on Coating Properties" (2018). Honors Research Projects. 759. hp://ideaexchange.uakron.edu/honors_research_projects/759
-
Upload
khangminh22 -
Category
Documents
-
view
1 -
download
0
Transcript of The Influence of Organic Pigments on Coating Properties

The University of AkronIdeaExchange@UAkron
Honors Research Projects The Dr. Gary B. and Pamela S. Williams HonorsCollege
Spring 2018
The Influence of Organic Pigments on CoatingPropertiesSarah [email protected]
Please take a moment to share how this work helps you through this survey. Your feedback will beimportant as we plan further development of our repository.Follow this and additional works at: http://ideaexchange.uakron.edu/honors_research_projects
Part of the Other Materials Science and Engineering Commons, and the Polymer and OrganicMaterials Commons
This Honors Research Project is brought to you for free and open access by The Dr. Gary B. and Pamela S. WilliamsHonors College at IdeaExchange@UAkron, the institutional repository of The University of Akron in Akron, Ohio,USA. It has been accepted for inclusion in Honors Research Projects by an authorized administrator ofIdeaExchange@UAkron. For more information, please contact [email protected], [email protected].
Recommended CitationMedeiros, Sarah, "The Influence of Organic Pigments on Coating Properties" (2018). Honors Research Projects. 759.http://ideaexchange.uakron.edu/honors_research_projects/759


2
The Influence of Organic Pigments on Coating Properties
Sarah Medeiros
4250:497-003
4/22/2018
Department of Chemical Engineering
Honors Research Project
Submitted to
The Williams Honors College
Approved: Accepted:
______________________ Date ________ __________________ Date _________
Honors Project Sponsor (signed) Department Head (signed)
______________________________ _______________________
Honors Project Sponsor (printed) Department Head (printed)
__________________ Date _______ __________________ Date ________
Reader (signed) Honors Faculty Advisor (signed)
_________________________ _____________________________
Reader (printed) Honors Faculty Advisor (printed)
______________________ Date _______ __________________ Date _________
Reader (signed) Dean, Honors College
_________________________________
Reader (printed)

3
Abstract
The purpose of this project was to identify the qualities of two synthesized organic pigments added
to a coating. These high-performance pigments were benzodipyrrolidone and benzodifuranone,
which are π-conjugated monomers. These pigments were each formulated into two different
pigment concentrations and compared with a control that had no pigment. This project is limited
by time constraints and the number of variables that can be tested in that time. Performance testing
was conducted to evaluate the qualities of these coatings. The results demonstrated that the
coatings were reproducible and most tests had results that were equal to or exceeded the results of
the control. This project was worth doing because it laid the groundwork for future research that
could result in an excellent corrosion and UV resistant coating. The pigments tested have potential
to produce exceptional and desirable qualities to the coating in which it is imparted. This paper is
submitted as part of graduation requirements for the University of Akron Williams Honors
College, 2018.
4
Executive Summary
The purpose of this project was to evaluate two synthesized organic pigments for use in a coating.
The two synthesized pigments, benzodipyrrolidone and benzodifuranone, are π-conjugated
monomers which are a new class of high-performance pigments. These pigments were originally
developed as dyes known for dispersibility, UV resistance, and stability and much research has
been conducted over the past 40 years to enhance these properties. Both pigments make excellent
backbones for building polymers that have uses as organic semiconductors that are cheaper and
easier to manufacture than traditional silicon semiconductors. Due to the considerable research
with these pigments, it was expected that they would carry the qualities seen in dyes and
semiconductors into desirable coating qualities.
These pigments show significant promise for use in coatings. Under UV exposure, the gloss
retention and thickness remain close to unchanged, and the ∆E* color change and FTIR results are
equal to or better than the control results. The pull-off adhesion test results also either met or
exceeded the amount of force required to remove the pull stub on the control. EIS results present
a good corrosion resistance for all testing coatings. For a proof of concept of use of these pigments
in coatings, the results were good and most testing met or exceeded the results of the control.
From conducting this research project, I learned several skills that will be useful in my future
career. In addition to the skills I learned while on co-op, my project and time management skills
have greatly improved because I needed to balance my school life with research, which can be a
challenge. I learned to prioritize my time better and try to be efficient with the time I spent on my
project. I became much more confident and felt a greater independence with leading my own
project and I feel like this will be very useful when beginning my career. I gained better knowledge
and skills in running a QUV chamber and taking gloss, thickness, color, and FTIR measurements.

5
I also became better acquainted with EIS testing, software, and evaluation. All of the things I
learned will help me be a better engineer and a coworker that is capable of completing projects in
a timely, correct, and efficient manner.
There should be future work conducted with these pigments because the results held a lot of
promise. The accumulation of data from several formulations and verifying results via the use of
duplicates sets a ground work for where to begin on a new project. Future work should include
trying different coating types, altering the pigment concentration, investigation of other potential
solvents, trying different curing temperature conditions, and investigating the differences in results
between steel and aluminum as the substrate. With these potential changes, it is likely that several
projects could be developed based around this work in order to find the optimum formulation for
a coating containing these pigments.
My recommendations for future students working on a project similar to this seem straightforward,
but are very useful and simple if they are proactive. I would recommend starting their project
earlier than they think they need to so they have extra time if testing does not go according to plan.
I would also recommend not choosing too many variables. Just changing one variable in a
formulation results in much more work and testing than expected. If multiple variables are
changed, it can be difficult to differentiate what caused the changes in results and increases the
number of coating formulations dramatically. It is worthwhile to conduct a literature review early
on the project so the student has a detailed understanding of the project prior to and during testing,
which can lead to the student learning more from the project.

6
Introduction
The purpose of this project was to determine the effects of synthesized organic pigments on the
properties of a coating. An epoxy resin (EPONTM Resin 828) with no pigment was used as the
control and two synthesized pigments, benzodipyrrolidone (BDP) and benzodifuranone (BDF),
were used and compared when blended into the epoxy resin with two different pigment
concentrations. To evaluate the effects of these pigments on the epoxy coatings, a series of
performance tests were used to understand the differences between each pigment, as described in
the Experimental Methods section. These pigments were chosen because both have unique
electrical properties, excellent UV resistance, and are being researched for use in electronic
devices. Due to their conductive properties, it was expected that this could result in a coating that
would exhibit better corrosion resistance and less yellowing and chalking than epoxy resins under
UV light. This project was used to determine a proof of concept and to determine if these pigments
produce desired qualities in epoxy coatings. Future work will likely include varying coating types,
pigment concentration, choice of solvent, curing temperature conditions, and substrate choice,
either steel or aluminum.
Background
Pigmented Coatings
A pigment is a finely divided solid, which is incorporated into a medium to impart certain
properties. Pigments can be inorganic or organic, colored, colorless, or fluorescent, and are
typically insoluble and unaffected by the medium in which it is incorporated [1, 2]. As of 2005, 97%
of produced pigments were inorganic, primarily consisting of oxides, sulfides, silicates, sulfates,

7
and carbonates [2]. There are several reasons for adding a pigment to a coating, including enhancing
physical properties (e.g. corrosion mitigation), altering costs (e.g. low-cost filler), imparting color,
and affecting appearance [3, 4].
Figure 1: (a) Paint constituents and their function (b) Schematic diagram of a paint system [3].
As seen in Figure 1, the pigment works together with the rest of the coating and can be found in
the finishing, intermediate, and primer coats depending on the purpose of the coating.
Pigments have been used by humans for imparting color for thousands of years. Cave paintings
typically used yellow and red ochre, white chalk, and carbon black from soot of burned animals
[5]. Tyrian Purple was one of the most complicated pigments to make, as it utilized the mucus from
thousands of Murex snails, making it very costly [5]. In 1704, the first chemically synthesized color,
Prussian Blue, was produced by Diesbach, a German color maker [5]. In the late 18th century, newly
isolated elements were able to produce new pigments at a low cost, including zinc oxide and
chrome [5]. The addition of pigments in coating to impart qualities used other than just for visual
appeal began around World War II. DayGlo fluorescent paints would fluoresce under black light
and daylight conditions and were used during WWII for a variety of signaling purposes [5].
Corrosion inhibitive pigments were first fully utilized during WWII on ships [7]. The most widely
8
used pigments were various kind of zinc and lead chromates, which are highly effective corrosion
inhibitors [7]. From WWII to now, pigments have been developed to be extremely versatile and
capable of adding physical properties to produce a more robust coating.
Pigment Synthesis
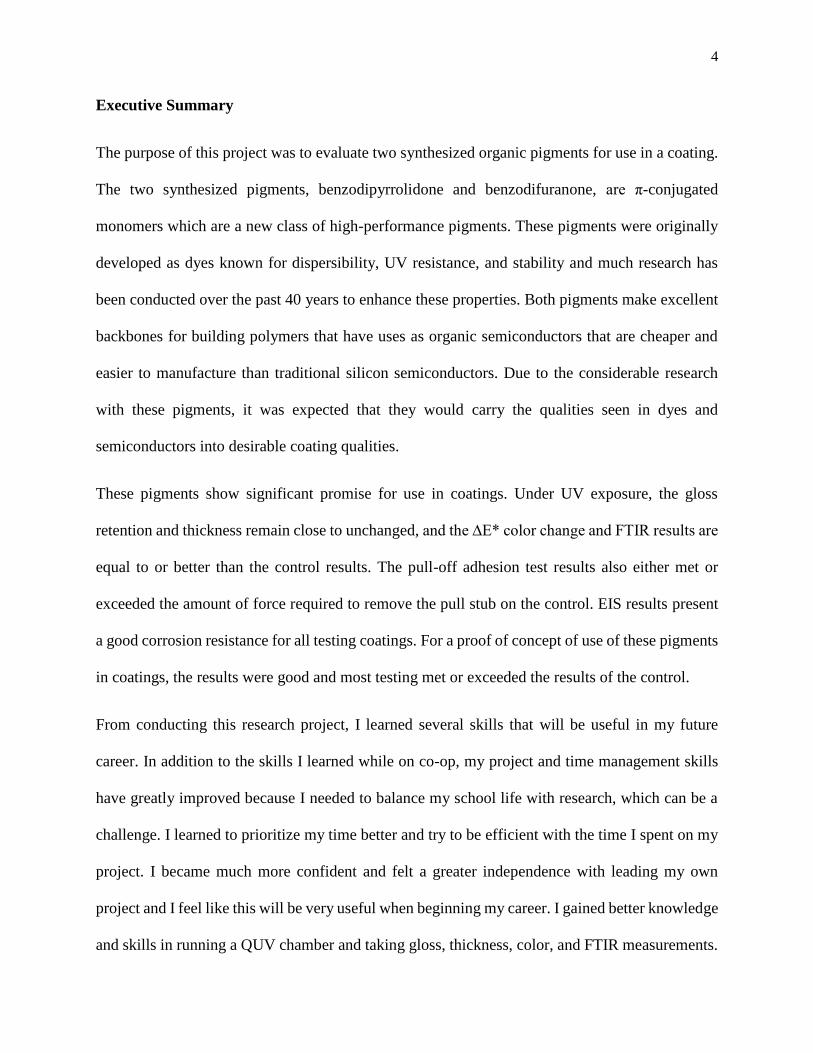
The two synthesized pigments examined in this paper are benzodipyrrolidone (BDP) and
benzodifuranone (BDF), which are π-conjugated monomers and derivatives of
diketopyrrolopyrroles (DPPs), which are a new class of high-performance pigments, obtained from
BASF Corporation [8, 9, 10]. The alternating donor-acceptor architecture of conjugated polymers
allows for many possibilities for desired properties by combining different donors and acceptors
[9]. BDP, BDF, and DPPs are used as backbones in the development of compounds with high
charge mobility to be used in electronic devices and coatings [8, 9]. DPPs are made by reacting
benzonitrile with dialkyl succinate in the presence of alkali metal tertiary alkoxides as bases [11].
A Reformatsky reaction of the succinate with benzonitrile produces a diester, with best results
occurring with the use of succinates of tertiary or secondary alcohols [11]. The rate of reaction is
increased with temperature and succinate concentration [11]. Most DPP derivatives are synthesized
by reacting a succinate ester and benzonitrile derivatives via a cyclization [12]. The chemical
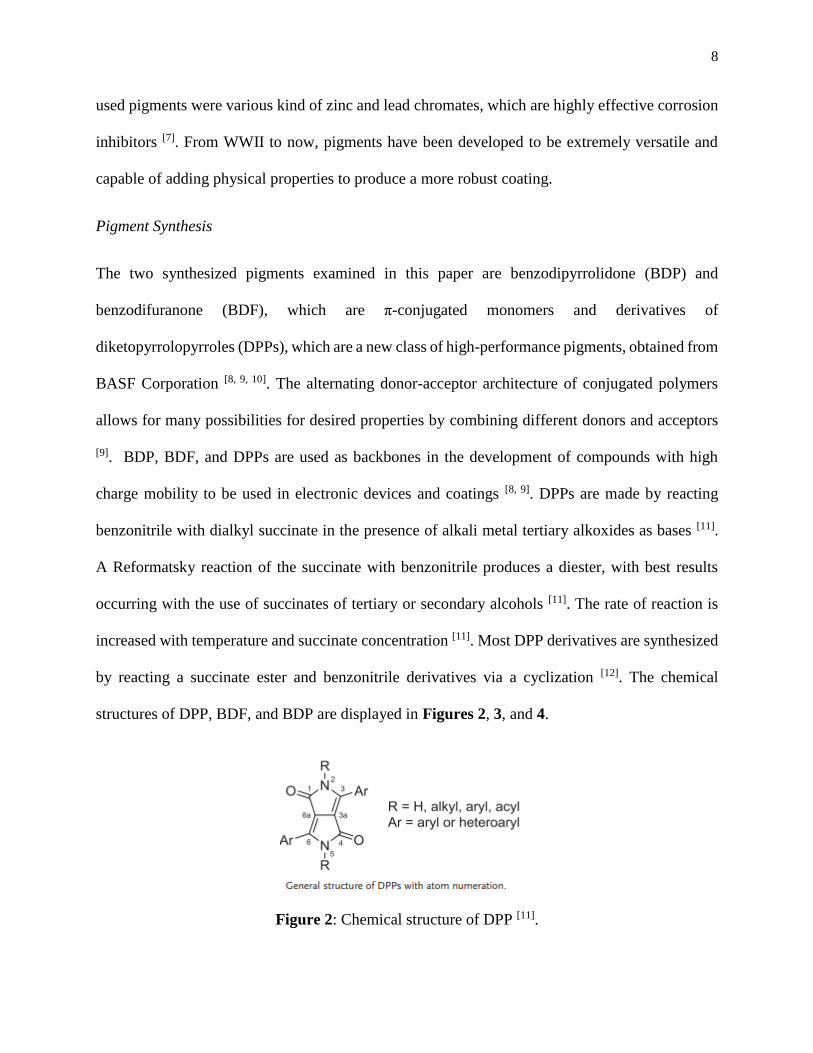
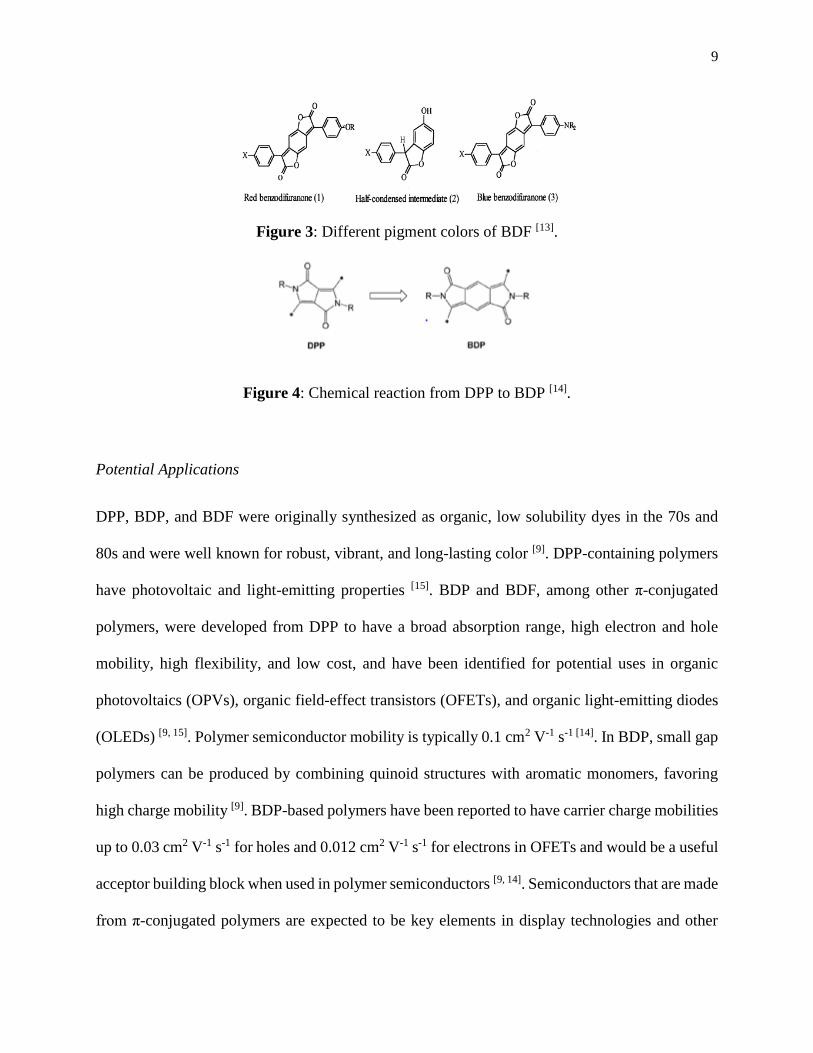
structures of DPP, BDF, and BDP are displayed in Figures 2, 3, and 4.
Figure 2: Chemical structure of DPP [11].
9
Figure 3: Different pigment colors of BDF [13].
Figure 4: Chemical reaction from DPP to BDP [14].
Potential Applications
DPP, BDP, and BDF were originally synthesized as organic, low solubility dyes in the 70s and
80s and were well known for robust, vibrant, and long-lasting color [9]. DPP-containing polymers
have photovoltaic and light-emitting properties [15]. BDP and BDF, among other π-conjugated
polymers, were developed from DPP to have a broad absorption range, high electron and hole
mobility, high flexibility, and low cost, and have been identified for potential uses in organic
photovoltaics (OPVs), organic field-effect transistors (OFETs), and organic light-emitting diodes
(OLEDs) [9, 15]. Polymer semiconductor mobility is typically 0.1 cm2 V-1 s-1 [14]. In BDP, small gap
polymers can be produced by combining quinoid structures with aromatic monomers, favoring
high charge mobility [9]. BDP-based polymers have been reported to have carrier charge mobilities
up to 0.03 cm2 V-1 s-1 for holes and 0.012 cm2 V-1 s-1 for electrons in OFETs and would be a useful
acceptor building block when used in polymer semiconductors [9, 14]. Semiconductors that are made
from π-conjugated polymers are expected to be key elements in display technologies and other

10
electronic devices because they are superior to silicon-based semiconductor materials due to
flexibility, lightweight, low-cost, and processability [17].
Potential Applications in Coatings
BDF and BDP are high class performance pigments that have been developed and improved over
that last 40 years. Both pigments have deep colors, are UV resistant, and have an innate stability
that made them excellent dyes, used specifically for polyesters [10, 14, 16, 18]. For use in dyes, both
pigments were easily dispersible which is important in achieving a uniform color and appearance
in a coating. Pigments that are used in finishing coatings must protect the binder and substrate
from UV radiation, among other things, to ensure the long-term performance of the substrate and
coating [19]. Due to the desirable properties seen in dye formulations, it was expected that BDF and
BDP would carry these properties into an epoxy coating and would resist the yellowing an chalking
commonly seen in epoxy coatings not protected by polyurethanes.
Design
Cost
π-Conjugated polymer semiconductors have applications in organic printable electronics and
commercial pigments because of their stability and cost [10]. Silicon wafers, which are thin slices
of semiconductor material, are currently used in most electronics, including photovoltaics, field-
effect transistors, and light-emitting diodes. There is a shortage of these wafers due to increasing
demands in technology, which leads to increased prices. The current cost of a 2-inch silicon wafer
with a 0.5mm thickness is $421 for 5 wafers on Sigma-Aldrich and these prices are expected to
increase in the foreseeable future [21]. Due to the increasing price of silicon wafers, the use of π-
conjugated polymer semiconductors, like BDF and BDP, in electronics could be a huge cost saver.

11
According to Sigma-Aldrich, the average cost of π-conjugated polymers is roughly $300-$400 per
gallon, which would have a lower cost and less of a limited supply when compared to silicon
wafers [20]. Advantages of BDF and BDP over silicon-based semiconductor materials includes their
flexibility, lightweight, low-cost, and processability [17]. The biggest constrains to using pigments
like BDF and BDP in OPVs, OFETs, and OLEDs is the development of the ideal chemical
additions to the backbone of the π-conjugated polymers, of which there is a large amount of
research but limited industrial implementation.
Epoxy coatings are traditionally used in a two-coat system with epoxy as the base layer and a UV-
resistant polyurethane top coating [22]. Producing a single-coat epoxy coating that has UV-resistant
properties by incorporating pigments such as BDF and BDP can result in significant cost savings
[22]. Epoxy coatings have uses in a variety of applications including military, maritime,
aeronautical, automotive, and general business organizations [23]. Some applications are not
exposed to UV light, but when epoxy is exposed to UV light it can result in yellowing and chalking.
Polyurethane initially costs slightly more than epoxy coatings, but traditionally lasts longer than
epoxy coatings alone [24]. The production of an epoxy that does not need a polyurethane top coating
but results in similar properties would decrease the overall cost of instillation of an epoxy coating
system. For use in floor coatings, polyurethane top coats can cost between $4-$6 per square foot,
where an epoxy coating costs between $2-$4 per square foot [25]. A system that only needed an
epoxy coating could cost at least half as much. The global demand for high performance pigments
is expected to continue to rise through 2022, where the market is expected to be worth $17.58
billion [26]. Due to these increasing market sales, the cost of high performance pigments has
dropped dramatically since 1999. DPP red was $50/lb 19 years ago, where today the cost has
dropped to 20-50% of that price, partly due to the end of patent induced monopolies [26]. The added

12
cost of DPP based pigments relies heavily on the pigment volume concentration (PVC) used in the
coatings, for this study 2% and 4% PVC was tested. As seen in the Data and Results section, the
4% PVC had only slightly better results compared to 2%, indicating that the lower amount of
pigment would be adequate to produce improved UV-resistance. At a cost of $10-$25/lb for the
pigment, the addition of small amounts of pigment to the coating would still cost significantly less
when compared to a two-coat polyurethane-epoxy system.
Safety
DPPs are organic pigments that come in the form of particles and thus pose a risk of inhalation
and are flammable. An animal study compared the health effects of five DPP-based pigments to
inorganic Pigment Red 101 [31]. Rats were exposed to the particles for 6hr/day for 5 days in a row,
with concentrations of 30mg/m3 in order to determine the toxicity of each compound, following a
3-week recovery period using broncho-alveolar lavage fluid (BALF) [31]. At the end of the study,
it was determined that all of the test subjects tolerated the exposure well and did not undergo
significant changes to the DPP pigments [31]. The inorganic pigments saw more pigment deposition
and pigment phagocytosis, but the test subjects also healed completely [31]. In addition to this study,
a MSDS sheet for Verdcol® DPP Red 254 PTR describes the pigment as containing no
ingredients/impurities classified as hazardous to health according to EU and UK chemicals
legislation [32]. Another MSDS sheet for DPP Pigment Orange 71 contains further health and safety
warnings [27]. This pigment may form a combustible dust concentration in the air and could cause
allergic skin reactions [27]. It is advised for this pigment to be decanted into smaller, more
manageable containers under a hood with good ventilation and should be stored in dry, cool,
ventilated areas with measures taken against static discharges because it is classified as dust
explosion class 2 [27]. This pigment is incompatible with strong oxidizing agents, strong bases,

13
and strong acids [27]. According to these three sources, DPPs are reasonably safe, do not pose an
inhalations threat, and should be used with typical laboratory precautions, including gloves, eye
protection, lab coat, and chemical hood.
The largest safety concern with using DPP pigments in epoxy coatings is the EPON™ Resin 828
and curing agent, EPIKURE™ 3164. The EPON™ Resin 828 has been identified to have skin
corrosion/irritation, serious eye damage/ eye irritation, skin sensitization, and specific target organ
toxicity in a single exposure to the respiratory tract [28]. EPIKURE™ 3164 has been identified to
be harmful when in contact with skin or if swallowed, and causes eye burns, respiratory tract and
skin irritation and may cause allergic respiratory and skin reactions [29]. As long as the chemicals
used to make these epoxy coatings with DPP pigments are stored and handled according to the
SDS instructions, there should be little risk to individuals using these chemicals.
Regulations and Environmental
Regulations and environmental risks associated with DPPs are much less than other alternatives
used in coatings and electronics. DPP epoxies have had increasing use in the automotive market
[30]. In recent years, the automotive market has looked towards more sustainable business practices,
which also includes coatings. Traditional inorganic coatings, especially lead chromates and heavy
metal ions, have become less popular due to the risk they pose to humans and the environment
when compared to organic pigments [30]. DPP based pigments can be used in solvent, water, and
powder pigments, which allows for more environmentally friendly coatings to be developed with
lower volatile organic compounds (VOCs) that will be compliant with REACH standards that are
beginning to go into effect [30]. REACH is a new set of regulations set by the European Union to
improve the protection of human health and environment from risks posed by chemicals and stands
for registration, evaluation, authorization, restriction, and communication in the supply chain. Due

14
to the amount of influence the European market has, many US companies are also working on
becoming REACH compliant in order to sell their products in an international market. High
performance organic pigments have become a higher quality product with less environmental
impact than oxide mining, especially iron oxide mined in China [30].
In addition to regulations seen in coatings, the amount of regulation associated with currently used
silicon semiconductors is much more significant when compared to DPP-based electronics,
especially when considering environmental concerns. In the manufacturing process of metallic
semiconductors, approximately thirty air toxics are emitted, 90% of those emissions are
hydrochloric acid, hydrofluoric acid, glycol ethers, methanol, and xylene [33]. The EPA has set
emission regulations to handle the toxins from process vents and storage tanks, with separate vents
for organic and inorganic substances [33]. Organic air toxins must be below 20 ppm by volume and
inorganic air toxins must be below 0.42 ppm by volume [33]. DPPs are regulated by the
Environmental Protection Act 1990 and the Pollution Prevention and Control Act 1999 [32]. These
polymers should not be dumped down drains, waterways, or areas where ground and surface water
would be affected and should be disposed of according to regulations, along with contaminated
packaging [32]. According to OSHA, DPP acceptable limits are total dust of 15 mg/m3 and
respirable amounts of 5 mg/m3 [32].
Experimental Methods
Coating Formulation
The epoxy resin (EPONTM Resin 828) and curing resin (EPIKURETM Curing Agent 3164) were
obtained from Hexion Specialty Chemicals, with the weight ratio of curing agent to resin is 1.36.

15
BDF and BDP were dispersed in acetone by stirring for 5 minutes at 1000 rpm, the EPONTM Resin
828 was added and mixed mechanically for 10 minutes, followed by EPIKURETM Curing Agent
3164 and mixed for an additional 10 minutes. The coating was applied to an aluminum test panel
that was cleaned with acetone and DI water, with a 127µm wet film thickness. The coatings were
dried over night at room temperature, then cured for 2 hours in the oven at 100 °C. The different
coating formulations are displayed in Table 1.
Table 1: Coating formulation table.
Formulation
Name
Pigment Volume
Concentration
E0 0%
EF2 2%
EF4 4%
EP2 2%
EP4 4%
Performance Testing
To evaluate the performance of the pigments and coatings, a series of performance tests were
conducted over the course of 24 to 38 days depending on the test. The primary test conducted was
UV testing performed using a QUV chamber. Each sample was run in duplicate and was exposed
to constant UV light for 24 days. Results were measured initially and after 1, 3, 7, 14, and 24 days.
Gloss, thickness, and color measurements were performed on each sample. Gloss measurements
were taken on three different locations on the panel and 20°, 60°, and 85° measurements were
recorded. The data is presented in gloss retention, which is the average 24-day data divided by the
average initial data to best demonstrate the change over time. Thickness measurements were taken
on ten different locations on each panel, neglecting the outer 1/4”, and an average was calculated
for each panel. Color measurements were taken on one location on each panel and L*, a*, and b*

16
measurements were recorded using CIELAB, which is color space specified by the International
Commission of Illumination to describe all colors visible to the human eye [34]. L* describes the
brightness or lightness going from white to black, a* indicates the colors from green to red, and
b* indicates the colors from blue to yellow, displayed in Figure 5 [34]. These values are used to
obtain ∆E* using the CIELAB 1976 color space equation,
∆𝐸𝑎𝑏∗ = √(𝐿2
∗ − 𝐿1∗ )2 + (𝑎2
∗ − 𝑎1∗)2 + (𝑏2
∗ − 𝑏1∗)2 (1)
where ∆E*≈2.3 is the just noticeable difference to the human eye [34].
Figure 5: CIELAB color space visual model [35].
Fourier transform infrared (FTIR) was the last testing performed on the UV samples and results
were measured initially and after 24 days. The data is displayed with the % transmittance,
indicating which chemical compounds are present in the coating and can help to determine what
part of the pigment is degrading.

17
Pull off adhesion testing was performed five times for each sample. The day prior to testing, a thin
coating of epoxy was applied to the flat face of the pull stub and placed firmly on the sample. After
24 hours, the pull stub is inserted in the mechanical pull off device and the amount of pressure in
psi was recorded and averaged, as displayed in Figure 6.
Figure 6: DeFelsko PosiTest AT-A Automatic Pull-off Adhesion Tester (left) Cross sectional
view of pull stub in pull off actuator (right) [36].
EIS testing was performed on each sample with several duplicates over 38 days. Results were
measured after 30 minutes, 1 day, 3 days, 7 days, 14 days, 24 days, and 38 days. The test set up is
displayed in Figure 7, where the coated substrate has the hollow cylinder filled with electrolyte,
in this case it was 3.5wt% NaCl, clamped to the panel for the duration of the test, which is
conducted with a platinum mesh counter electrode, and results are collected inside a Faraday cage.
The impedance (Zmod) is collected and normalized with the area of the sample.

18
Figure 7: EIS testing set up for a substrate with a coating [37].
Testing intervals throughout Testing after 24 days
Figure 8: Test protocol used for all coating samples.
QUV Aging Test
Continuously UVA light:
0.89 W/m2 irradiance at 340nm, 60 °C
UV Stability Property
• Color difference
• Gloss 20 °, 60 °, and 85 °
• Thickness
Corrosion Resistance Property
• EIS
Optical Microscopy
FTIR
Mechanical Properties: Adhesion

19
Data and Results
Thickness
The change in thickness measurements for both duplicates are displayed in Figures 9 and 10.
Thickness measurements were run in duplicate and averaged over ten different locations on each
panel. The results between duplicates line up closely, showing repeatability between samples. The
BDP formulation EP4 has the biggest difference between initial and 24 days results, with 6µm
change compared to the control with 2µm change.
Figure 9: Coating thickness measurements of all five samples comparing initial and after 24
days UV exposure for duplicate 1.
0
10
20
30
40
50
60
E0-1 EF2-1 EF4-1 EP2-1 EP4-1
Thic
knes
s (µ
m)
Duplicate 1 samples
Initial
Day 24

20
Figure 10: Coating thickness measurements of all five samples comparing initial and after 24
days UV exposure for duplicate 2.
Color Change
∆E* color change results and duplicates are displayed in Figures 11 and 12 and Table 2. Color
measurements L*, a*, and b* were recorded using CIELAB and ∆E* values were calculated
according to Equation 1. The best results are ones that have the smallest change over time.
Similarly to the thickness results, the duplicates line up closely showing repeatability between
samples. The BDP formulations EP2 and EP4 change initially, but level off after about 5 days and
have very little change after that point.
0
10
20
30
40
50
60
E0-2 EF2-2 EF4-2 EP2-2 EP4-2
Thic
knes
s (µ
m)
Duplicate 2 samples
Initial
Day 24

21
Figure 11: ∆E* after UV exposure of all five samples over 24 days for duplicate 1.
Figure 12: ∆E* after UV exposure of all five samples over 24 days for duplicate 2.
0
5
10
15
20
25
0 5 10 15 20 25
ΔE*
UV Exposure Duplicate 1 (days)
E0-1
EF2-1
EF4-1
EP2-1
EP4-1
0
5
10
15
20
25
0 5 10 15 20 25
ΔE*
UV Exposure Duplicate 2 (days)
E0-2
EF2-2
EF4-2
EP2-2
EP4-2

22
Table 2: ∆E* values used to generate Figures 11 and 12, where the bold, italic
values are below the just noticeable difference to the human eye value of 2.3.
Duplicate 1
Coatings ∆E* ∆E* ∆E* ∆E* ∆E*
Day 1 Day 3 Day 7 Day 14 Day 24
E0-1 3.77 7.54 10.48 15.79 23.09
EF2-1 19.47 17.60 17.67 9.70 7.60
EF4-1 16.73 16.73 14.30 8.52 7.64
EP2-1 2.09 6.47 12.54 13.99 14.60
EP4-1 1.10 5.17 7.86 10.05 11.03
Duplicate 2
Coatings ∆E* ∆E* ∆E* ∆E* ∆E*
Day 1 Day 3 Day 7 Day 14 Day 24
E0-2 3.71 7.33 10.62 15.66 22.93
EF2-2 18.87 17.95 16.55 8.72 7.12
EF4-2 16.28 16.04 12.88 7.74 7.07
EP2-2 2.26 7.32 11.74 12.83 13.94
EP4-2 1.13 5.34 8.50 10.76 12.18
Gloss
The gloss data is presented in gloss retention, which is the average 24-day data divided by the
average initial data, is seen in Figures 13 and 14. Gloss retention between the duplicates has
similar results for each sample except for BDP formulation EP2 duplicate 1, which has
significantly lower 20° and 60° gloss. Gloss retentions that were above 90% displayed acceptable
results.

23
Figure 13: Gloss retention measurements of all five samples after 24 days UV exposure for
duplicate 1.
Figure 14: Gloss retention measurements of all five samples after 24 days UV exposure for
duplicate 2.
0.50
0.55
0.60
0.65
0.70
0.75
0.80
0.85
0.90
0.95
1.00
E0-1 EF2-1 EF4-1 EP2-1 EP4-1
Glo
ss R
eten
tio
n
Duplicate 1 samples
20°
60°
85°
0.50
0.55
0.60
0.65
0.70
0.75
0.80
0.85
0.90
0.95
1.00
E0-2 EF2-2 EF4-2 EP2-2 EP4-2
Glo
ss R
eten
tio
n
Duplicate 2 samples
20°
60°
85°

24
FTIR
The FTIR data is displayed with the % transmittance, displayed in Figures 15-19. The change on
transmittance indicates which chemical compounds are present in the coating and can help to
determine what part of the pigment is degrading. FTIR data between duplicates display similar
changes in a transmittance, duplicate data is in the Appendix. The control displayed a larger
change between the initial and 24-day results. The area between 3500-3250nm is the OH region,
3000-2750nm is N-H, 1750-1500nm is N-H and C-OH, and 1250-1000nm is C-O-C. The changes
in these areas could be the results of the degradation of the compounds found in these regions [29].
Figure 15: FTIR data for the control comparing the absorbance data initially and after 24 days of
UV exposure for duplicate 1.
0
0.2
0.4
0.6
0.8
1
500150025003500
% T
ran
smit
tan
ce
Wavelength (nm)
E0-1_24 days
E0-1_0 days

25
Figure 16: FTIR data for BDF formulation EF2 comparing the absorbance data initially and after
24 days of UV exposure for duplicate 1.
Figure 17: FTIR data for BDF formulation EF4 comparing the absorbance data initially and after
24 days of UV exposure for duplicate 1.
0
0.2
0.4
0.6
0.8
1
500150025003500
% T
ran
smit
tan
ce
Wavelength (nm)
EF2-1_24 days
EF2-1_0 days
0
0.2
0.4
0.6
0.8
1
500150025003500
% T
ran
smit
tan
ce
Wavelength (nm)
EF4-1_24 days
EF4-1_0 days

26
Figure 18: FTIR data for BDP formulation EP2 comparing the absorbance data initially and after
24 days of UV exposure for duplicate 1.
Figure 19: FTIR data for BDP formulation EP4 comparing the absorbance data initially and after
24 days of UV exposure for duplicate 1.
0
0.2
0.4
0.6
0.8
1
500150025003500
% T
ran
smit
tan
ce
Wavelength (nm)
EP2-1_24 days
EP2-1_0 days
0
0.2
0.4
0.6
0.8
1
500150025003500
% T
ran
smit
tan
ce
Wavelengthr (nm)
EP4-1_24 days
EP4-1_0 days

27
Adhesion
Pull off adhesion testing is displayed in Figure 20. Each sample was tested before UV exposure
five times per sample and averaged. All samples are in a similar range to the control.
Figure 20: Pull-off adhesion strength value of different formulation samples.
Electrochemical Impedance Spectroscopy
EIS testing was performed on each sample over 38 days, seen in Figures 21-25. The impedance
(Zmod) is collected and normalized with the area of the sample. It is important to take into account
starting impedance and how quickly it takes for it to decline.
0
50
100
150
200
250
300
350
400
450
E0 EF2 EF4 EP2 EP4
Pu
ll-o
ff A
dh
esio
n (
psi
)
Samples

28
Figure 21: Bode plots (impedance modulus) of coating samples before and after different UV
exposure time for the control.
Figure 22: Bode plots (impedance modulus) of coating samples before and after different UV
exposure time for the control BDF formulation EF2.
1E+03
1E+04
1E+05
1E+06
1E+07
1E+08
1E+09
1E+10
1E+11
1E-02 1E-01 1E+00 1E+01 1E+02 1E+03 1E+04 1E+05
|Z|
(Ωcm
2)
frequency (Hz)
E0-1_0.5h
E0-1_1d
E0-1_3d
E0-1_7d
E0-1_14D
E0-1_24D
E0-1_38d
1E+03
1E+04
1E+05
1E+06
1E+07
1E+08
1E+09
1E+10
1E-02 1E-01 1E+00 1E+01 1E+02 1E+03 1E+04 1E+05
|Z|
(Ωcm
2)
frequency (Hz)
EF2-2_0.5h
EF2-2_1d
EF2-2_3d
EF2-2_7d
EF2-2_14d
EF2-2_24d
EF2-2_38d

29
Figure 23: Bode plots (impedance modulus) of coating samples before and after different UV
exposure time for the control BDF formulation EF4.
Figure 24: Bode plots (impedance modulus) of coating samples before and after different UV
exposure time for the control BDP formulation EP2.
1E+03
1E+04
1E+05
1E+06
1E+07
1E+08
1E+09
1E+10
1E+11
1E-02 1E-01 1E+00 1E+01 1E+02 1E+03 1E+04 1E+05
|Z|
(Ωcm
2)
frequency (Hz)
EF4-5_0.5h
EF4-5_1d
EF4-5_3d
EF4-5_7d
EF4-5_14d
EF4-5_24D
EF4-5_38D
1E+03
1E+04
1E+05
1E+06
1E+07
1E+08
1E+09
1E+10
1E+11
1E-02 1E-01 1E+00 1E+01 1E+02 1E+03 1E+04 1E+05
|Z|
(Ωcm
2)
frequency (Hz)
EP2-1_0.5h
EP2-1_1d
EP2-1_3d
EP2-1_7d
EP2-1_14d
EP2-1_24d
EP2-1_38d

30
Figure 25: Bode plots (impedance modulus) of coating samples before and after different UV
exposure time for the control BDP formulation EP4.
The impedance at 0.01Hz normalized to the area helps to display how quickly the impedance drops
off over time and how similar the coatings are, as seen in Figure 26 and 27. The control initially
displayed the best results but became equal with the rest after 3 days.
Figure 26: The impedance modulus at low frequency (0.01 Hz) as a function of UV exposure
time.
1E+03
1E+04
1E+05
1E+06
1E+07
1E+08
1E+09
1E+10
1E+11
1E-02 1E-01 1E+00 1E+01 1E+02 1E+03 1E+04 1E+05
|Z|
(Ωcm
2)
frequency (Hz)
EP2-1_0.5h
EP2-1_1d
EP2-1_3d
EP2-1_7d
EP2-1_14d
EP2-1_24d
EP2-1_38d
-5E+09
0E+00
5E+09
1E+10
2E+10
2E+10
3E+10
3E+10
4E+10
4E+10
0.5 1 1.5 2 2.5 3
|Z|_
0.0
1 (
Ω c
m2 )
Electrolyte Exposure (days)
E0
EF2
EF4
EP2
EP4

31
Figure 27: Relative data where |Z|0.01 HZ_day(t)/|Z|0.01HZ_day (0) as a function of UV
exposure time.
Discussion, Analysis, and Conclusions
Each of the tests displayed in the Data and Results section was purposely run in duplicate or more
in order to obtain more accurate results and to see if there was any reproducibility between the
same samples. For thickness, color, and gloss retention, the duplicates appeared the same or very
close for all samples excluding BDP formulation EP2 duplicate 1 gloss retention, which had
significantly lower 20° and 60° gloss. It would be worth while to repeat that test to see if it was a
random occurrence or if it always has varying results. The thickness measurements were good
overall, where BDP formulation EP4 has the largest difference between initial and 24 days results,
with 6µm change compared to the control with 2µm change. The nearly all the color change results
were above the just visible to the human eye threshold of 2.3 after one day, and all were above that
at the end of testing. Several of the samples began to level off between the middle and end of the
-5E-03
0E+00
5E-03
1E-02
2E-02
2E-02
3E-02
3E-02
4E-02
1 6 11 16 21 26 31 36
|Z|_
0.0
1 (
Ω c
m2
)
UV Exposure (days)
E0
EF2
EF4
EP2
EP4

32
testing, which is a good sign despite the large initial changes in ∆E*. The FTIR data changes were
similar for the BDF and BDP formulations, which had less change than the control. Based on the
comparison between the control and formulations, it would appear that the addition of the pigment
helped to increase the UV stability. The pull-off adhesion results were all in the 300-400 psi range
with all of the samples meeting or exceeding the control. It appears that all of the EIS testing
produced similar results between the coatings. There is a significant drop in impedance between
0.5 hours and 1 day for all samples, showing the breakdown of the barrier properties of the
coatings. It would appear that the addition of the pigments did not affect the barrier properties.
From this experiment, I learned how to develop an effective testing plan, draw conclusions from
the results, and develop a better understanding of the effect that each formulation variable has on
the testing results. This is helpful in fine tuning the formulation of the coating for any future work
involving these pigments or similar work. By accumulating data for a variety of formulations, a
new idea for a future project could be developed based upon the testing completed. From there,
the groundwork for the new project could be laid out, allowing others to develop new coatings for
a potentially different purpose and gaining a better understanding of the synthesized pigments
produced which could lead to their future use. Pigments have come a long way from just adding
color to a coating and are an important aspect in any corrosion mitigation system.

33
Literature Cited
1. CIEC Promoting Science at the University of York, York, UK
http://www.essentialchemicalindustry.org/materials-and-applications/paints.html
(accessed Apr 13, 2017).
2. Gurses, A.; Acikyildiz Metin; Gunes Kubra; Gurses M. Sadi. Dyes and pigments;
Springer: New York, NY, 2016.
3. Paint coatings http://www.steelconstruction.info/Paint_coatings (accessed Apr 13, 2017).
4. Peake, G. T. Pigments for the Coil Coating Industry, 2003.
5. History of Pigments http://www.winsornewton.com/na/discover/articles-and
inspiration/history-of-pigments (accessed Apr 23, 2017).
6. American Chemical Society National Historic Chemical Landmarks. DayGlo®
Fluorescent Pigments.
http://www.acs.org/content/acs/en/education/whatischemistry/ landmarks/
dayglo.html (accessed Apr 23, 2017).
7. National Academy of Sciences - National Research Council. Field Applied Paints and
Coatings, Part 3; 653; Building Research Institute: Washington, D.C., 1959.
8. Greenhalgh, C.; Carey, J.; Newton, D. The Synthesis of Quinodimethanes in the
Benzodifuranone and Benzodipyrrolidone Series. Dyes and Pigments 1980, 1 (2),
103–120.
9. Pruissen, G. W. P. V.; Pidko, E. A.; Wienk, M. M.; Janssen, R. A. J. High Balanced
Ambipolar Charge Carrier Mobility in Benzodipyrrolidone Conjugated
Polymers. J. Mater. Chem. C 2014, 2 (4), 731–735.
10. Zhang, H.; Deng, R.; Wang, J.; Li, X.; Chen, Y.-M.; Liu, K.; Taubert, C. J.; Cheng, S. Z.
D.; Zhu, Y. Crystalline Organic Pigment-Based Field-Effect Transistors. ACS
Applied Materials and Interfaces 2017, 9 (26), 21891–21899.
11. Grzybowski, M.; Gryko, D. T. Diketopyrrolopyrroles: Synthesis, Reactivity, and Optical
Properties. Advanced Optical Materials 2015, 3 (3), 280–320.
12. Kuwabara, J.; Yamagata, T.; Kanbara, T. Solid-State Structure and Optical Properties of
Highly Fluorescent Diketopyrrolopyrrole Derivatives Synthesized by Cross
Coupling Reaction. Tetrahedron 2010, 66 (21), 3736–3741.

34
13. Hallas, G.; Yoon, C. The Synthesis and Properties of Red and Blue
Benzodifuranones. Dyes and Pigments 2001, 48 (2), 107–119.
14. Hong, W.; Guo, C.; Li, Y.; Zheng, Y.; Huang, C.; Lu, S.; Facchetti, A. Synthesis and
Thin-Film Transistor Performance of Benzodipyrrolinone and Bithiophene
Donor-Acceptor Copolymers. Journal of Materials Chemistry 2012, 22 (41),
22282.
15. Zhang, H.; Neudörfl, J.-M.; Tieke, B. Naphthodifuranone-Based Monomers and
Polymers. Macromolecules 2013, 46 (15), 5842–5849.
16. Zhang, H.; Zhang, J.; Tieke, B. A Comparative Study of Polymers Containing
Naphthodifuranone and Benzodifuranone Units in the Main Chain. Polym.
Chem. 2014, 5(2), 646–652.
17. Lee, K. C.; Park, W.-T.; Noh, Y.-Y.; Yang, C. Benzodipyrrolidone (BDP)-Based
Polymer Semiconductors Containing a Series of Chalcogen Atoms:
Comprehensive Investigation of the Effect of Heteroaromatic Blocks on Intrinsic
Semiconducting Properties. ACS Applied Materials & Interfaces 2014, 6 (7),
4872–4882.
18. Rumer, J. W.; Rossbauer, S.; Planells, M.; Watkins, S. E.; Anthopoulos, T. D.;
Mcculloch, I. Reduced Roughness for Improved Mobility in Benzodipyrrolidone
Based, n-Type OFETS. J. Mater. Chem. C 2014, 2 (41), 8822–8828.
19. Exterior Coatings http://nanophase.com/markets/exterior-coatings/ (accessed Apr 23,
2017).
20. π-Conjugated Polymers - Polymers https://www.sigmaaldrich.com/materials
science/material-science-products.html?TablePage=111775702 (accessed Apr 15,
2018).
21. Silicon 646687
https://www.sigmaaldrich.com/catalog/product/aldrich/646687?lang=en®ion=US
(accessed Apr 15, 2018).
22. Zeng, W.; Zhou, Q.; Zhang, H.; Qi, X. One-Coat Epoxy Coating Development for the
Improvement of UV Stability by DPP Pigments. Dyes and Pigments 2018, 151,
157–164.

35
23. Epoxy Coatings Applications and Uses https://www.business.com/articles/epoxy
coatings-applications-and-uses/ (accessed May 2, 2018).
24. Epoxy vs. Polyurethane - Which Will You Choose?
https://www.allthingsflooring.com/2017/06/epoxy-vs-polyurethane-will-choose/
(accessed May 2, 2018).
25. Cost of Concrete Floor Coating - Estimates and Prices at Fixr
https://www.fixr.com/costs/concrete-floor-coating (accessed May 2, 2018).
26. High Performance Pigments https://www.coatingsworld.com/issues/2017-08
01/view_features/high-performance-pigments-834584 (accessed May 2, 2018).
27. MATERIAL SAFETY DATA SHEET for Dongguan Baoxu Chemical Technology®
Pigment Orange 71 https://www.slideshare.net/Huchangfa/pigment-dpp-orange
71-cas-84632-508-safety-data-sheet-msds-sds-baoxu-chemical-83166011
(accessed May 02, 2018).
28. MATERIAL SAFETY DATA SHEET for EPON™ Resin 828
https://www.agilent.com/cs/library/msds/G7426-85001_NAEnglish.pdf (accessed
May 02, 2018).
29. MATERIAL SAFETY DATA SHEET for EPIKURE™ 3164
http://doc.ccc-group.com/msds/english/406465.pdf (accessed May 02, 2018).
30. Pigments Market https://www.coatingsworld.com/issues/2018-01
01/view_features/pigments-market- (accessed May 2, 2018).
31. Hofmann, T.; Ma-Hock, L.; Strauss, V.; Treumann, S.; Moreno, M. R.; Neubauer, N.;
Wohlleben, W.; Gröters, S.; Wiench, K.; Veith, U.; Teubner, W.; Ravenzwaay, B. V.;
Landsiedel, R. Comparative Short-Term Inhalation Toxicity of Five Organic
Diketopyrrolopyrrole Pigments and Two Inorganic Iron-Oxide-Based
Pigments. Inhalation Toxicology 2016, 28 (10), 463–479.

36
32. MATERIAL SAFETY DATA SHEET for Verdcol® DPP Red 254 PTR
http://www.cen.iitb.ac.in/chemical_approval/msds/130_msds.pdf (accessed Apr
15, 2018).
33. Semiconductor Manufacturing Final Air Toxics Rules Fact Sheets
https://www.epa.gov/stationary-sources-air-pollution/semiconductor
manufacturing-final-air-toxics-rules-fact-sheets (accessed Apr 15, 2018).
34. Konica Minolta. Identifying Color Differences Using L*a*b* or L*C*H* Coordinates
https://sensing.konicaminolta.us/blog/identifying-color-differences-using-l-a-b-or
l-c-h-coordinates/ (accessed Apr 15, 2018).
35. Color Space Color Model https://www.colorcodehex.com/color-model.html (accessed
Apr 15, 2018).
36. Dolly Preparation for Pull-Off Adhesion Testing
https://www.defelsko.com/resources/dolly-preparation-for-pull-off-adhesion
testing (accessed Apr 15, 2018).
37. Zhou, Q.; Wang, Y. Comparisons of Clear Coating Degradation in NaCl Solution and
Pure Water. Progress in Organic Coatings 2013, 76 (11), 1674–1682.

37
Appendix
Figure A1: FTIR data for the control comparing the absorbance data initially and after 24 days
of UV exposure for duplicate 2.
Figure A2: FTIR data for BDF formulation EF2 comparing the absorbance data initially and
after 24 days of UV exposure for duplicate 2.
0
0.2
0.4
0.6
0.8
1
500150025003500
% T
ran
smit
tan
ce
Wavelength (nm)
E0-2_24 days
E0-2_0 days
0
0.2
0.4
0.6
0.8
1
500150025003500
% T
ran
smit
tan
ce
Wavelength (nm)
EF2-2_24 days
EF2-2_0 days

38
Figure A3: FTIR data for BDF formulation EF4 comparing the absorbance data initially and
after 24 days of UV exposure for duplicate 2.
Figure A4: FTIR data for BDP formulation EP2 comparing the absorbance data initially and
after 24 days of UV exposure for duplicate 2.
0
0.2
0.4
0.6
0.8
1
500150025003500
% T
ran
smit
tan
ce
Wavelength (nm)
EF4-2_24 days
EF4-2_0 days
0
0.2
0.4
0.6
0.8
1
500150025003500
% T
ran
smit
tan
ce
Wavelength (nm)
EP2-2_24 days
EP2-2_0 days

39
Figure A5: FTIR data for BDP formulation EP4 comparing the absorbance data initially and
after 24 days of UV exposure for duplicate 2.
0
0.2
0.4
0.6
0.8
1
500150025003500
% T
ran
smit
tan
ce
Wavelength (nm)
EP4-2_24 days
EP4-2_0 days