lifetime prediction of organic coating/metal systems - DTIC
97
r "SC5222.FR Copy No. fq LIFETIME PREDICTION OF ORGANIC COATING/METAL SYSTEMS A* I FINAL REPORT FOR THE PERIOD July 1, 1979 through October 31, 1985 00 CONTRACT NO. N0004-79-C-0437 PROJECT NO. NR036-136 (471) Prepared for SMetallurgy & Ceramics Program DTIC Material Sciences Division I Office of Naval Research ýL LECTE 0 Arlington, Virginla 22217 w w F. Mansfeld end M. Kendig ........ Principal Investigators 1 APRIL 1986 Approved for public release; distribution unlimited * I ~Rockwell International 01 Science Center 8 6 120
-
Upload
khangminh22 -
Category
Documents
-
view
0 -
download
0
Transcript of lifetime prediction of organic coating/metal systems - DTIC

r "SC5222.FR
Copy No.
fq
LIFETIME PREDICTION OF ORGANICCOATING/METAL SYSTEMS
A* I
FINAL REPORT FOR THE PERIOD
July 1, 1979 through October 31, 1985
00 CONTRACT NO. N0004-79-C-0437PROJECT NO. NR036-136 (471)
Prepared for
SMetallurgy & Ceramics Program DTICMaterial Sciences Division
I Office of Naval Research ýL LECTE
0 Arlington, Virginla 22217
w w
F. Mansfeld end M. Kendig ........
Principal Investigators
1 APRIL 1986
Approved for public release; distribution unlimited
* I ~Rockwell International
01 Science Center
8 6 120

UNCLASSIFIEDSECURITY CLASSIFICATION OF THIS PAGE
REPORT DOCUMENTATION PAGEiii. REPORT SECURITY CLASSIFICATION 1b. RESTRICTIVE MARKINGS
Unclassified ______________________________2a. SECURITY CLASSIFICATION AUTHORITY 3. DISTRIBUTION/AVAILABILITY OF REPORT
2b, OECLASSIFICATION/OOWNGRAOING SCHEDULE Approved for public release; distribution unlimited.
A. PERFORMING ORGANIZATION REPORT NUMBER(S) 16. MONITORING ORGANIZATION REPORT NUMBER(S)
SC5222.FRI
6&. NAME OF PERFORMING ORGANIZATION b. OFFICE SYMBOL 74. NAME OF MONITORING ORGANIZATIONRockwell International (If applicable)
Science Center I6c. ADDRESS (City. State and ZIP Code) 7b. ADDRESS (City, State and ZIP Code)
1049 Camino Dos RiosThousand Oaks, CA 91360
e.NAME OF FUNDING/SFONSORING 8~b. OFFICE SYMBOL 9. PROCURFEMENT INSTRUMENT IDENTIFICATIO.N NUMBERORGANIZATION (I t applicabitj
Metallurgy & Ceramics Program Contract No. N00014-79-C-0437Off1 ic o Naval Rosearch, Material Scienom Div. I_______ _______________________
Sc. ADDRESS (City, Stote and ZIP Code) 10 SOURCE OF FUINDING NOS __________
* 80 North OQIncy Street PROG RAM PROJECT TASK WOA3F UNITArlington, Virginia 22217 E LE MENT NO. NO, NO. NO.
NR036-13611. TIT LE PJitc~~e~ 40cussty C="I(Ct~cor.o) LIFETIME PREDICTION OF (471)
ORGANIC COATING/METAL SYSTEMS (U) ___________-12. PERSONA.. AUTMORISI
MaNianfeld, F,. and Kendig.9 M 11 b I ECOVEM4ETO FR P )T V .M . D y 5 AG .. N113a, TYPE Of019RPOAT itb TIME OF REOT(r.M.E"y 5 AG iý
SFinal Report FROM 07ZLQ1179...T 1Q/31LUi APRIL 1986 9WO SUIPPi.EUENYARY NOTATION
P I E L CO S AI CJ PS S UB J E C T E R M'S ' C on ti .-l is t o i o w w it A e t u 'Id id en t i f y b y b lo c k n u m b e r)
W0 83TAAC7 C on (inut on rovera it h*cIM*'t' and Won fit) 0)NAbAmbt
lifetime prediction model lhas been developed for polymer coating/metal systems. The elements of the modelfall into the category of system variables that describe the surface of the substrate, the coating or the environment,%)r the citegory of processes that determine the degradation of the coated metal. These processes include forma-tion of defects in the coating and at the metal/coating interface, transport of corrosive species to the metal, loss ofadhesion, corrosion and failure. The causal relationship between system variables and processes has been discussed.
Thel eielme prediction model is based on a series of experimental studies which have been performed during theI" course of this project. A number of new techniques have been developed which can be used to determine the
properties of the coating/metal compound and its changes during interaction with corrosive environments. Electro-chemical impedance spectroscopy (EIS) has been found to be very valuable in providing information concerningthe coating and the metal surf ace and degradation of the coating as corrosion proceeds. An acoustic pulse tech-nique has been used to detect areas of delamination and corrosion. Acoustic emission from coated steel during
'.,. straining of the sample has provided characteristic fingerprints for surface and coating properties and has demon-* " strated the importance of the mechanical properties of the coating. (over)
20 OIST RI OUTIONIAVAILASI LIT Y OF ABSTRACT 2J1. ABSTRACT SECURITY CLASSIFICATION 4
* ~~~UNCLASSIPItD1UNLIMiTEO K.1 SAME AS ROY. 0 OTIC USERS CUc~sfe
22a, NAME OF RESPONSIBLE INDIVIDUAL 22b TELEPHIONE NUMBER 122c OFFICE SYMBOLDr. P hililp A. Clarkin
Ilthd AIaCoe
Or) FORM 1473,83 APR 1011 O A 7 SOS~EE UNCLASSIFIEDSECURITY CLASSIFICATION OF THIS PAGE

UNCLASSIFIEDSECURITY CLASSIFICATION OF THIS PAGE
(Block 19 Continued)
The experimental results have demonstrated convincingly the importance of proper surface preparation. It hasbeen found by a comparison of coated metals and a free film that corrosion products of steel can cause stresses inthe coating which prbduce defects. Surface preparation can also affect the structure of phosphate layers which inturn can change the nature of transport phenomena. Using EIS it has been shown that an anodized surface layer ,..•on Al produces better corrosion protection of the polyurethane coated surface than a conversion coating layer.New insight into reactions at the mnetal/coating interface has been obtained with the use of segmented electrodes '•
which allow-the recording of EIS data under the coating. This new technique has been applied to steei/steel,Cu/steel and Zn/steel electrodes. Analysis of the EIS data allows an estimate of the effective delaminated areaunder t1h coating and the corrosion rate of the surface. Cathodic protection was observed for steel in the Zn/steelcoupli. The role of pigments such as phosphates, chromates and Zn dust and the importance of transport pheno-men'a has also been studied with EIS during exposure of coated steel to NaCI.
tC
.4.
UNCLASSIFPIEDSECURITY CLASSIFICATION OF THIS PAGE

Rockwell InternationalScience Center
SC5222.FR
TABLE OF CONTENTS
Page
* 1.0 INTRODUCTION... .. ,*....... . ...* .* ... 1
2.0 DESCRIPTION OF THE LIFETIME MDEL................................... 3
t 2.1 System V r a l s........................................... .... 3
2.2 Degradation Processes. ........................... .......... 3
3.0 EVALUATION OF DEGRADATION PROCESSES ................................. 6
3.1 Defect Formation ................................................... 6
3.1.1 Electrochemical Impedance Spectroscopy (EIS)... ......... 63.1.2 The Role of Mechanical Stress ........................... 173.1.3 Analysis with the Scanning Impedance Probe.............. 19
3.2 Transport of Corrodents ......... . .. ................. 21
3.3 Loss of Adhesion ... ........... ......... ...... ................ 22
3.3.1 Cathodic Disbonding .......... ...... . 223.3.2 Analysis with the Reflected Acoustic Pulse Technique.... 273.3.3 Analysis with the Acoustic Emission Technique........ .. 35
3.4 Corrosion . . ......... ................. ..... ............. 42
3.4.1 Determination of the Corrosion Rate of the Substrate .... 433.4.2 Investigations of the Metal/Coating Interface...........* 433.4.3 Effects of Surface Modification......................... 573.4.4 The Role of Pigments..... ....... ....................... * 64
4.0 SUMMARY AND CONCLUSION ...... ,,.,....... ............. 78
5.0 RECOMMENDATIONS FOR FUTURE RESEARCH. ,..,,,,.,,................ 80
..ACKNOWLEDGMENT .... ,,...................., 2.... ,...,....... 8
6.0 REFERENCES................. .9999999999999999999999999999999999999999 83
7.0 APPENDIX - DEFINITIONS AND SYMBOLS., ......... ,,,,,,.,............. 86
S- Availability Codes
otIAvailaSDkt ociC7509TC/bJe I,,

01 Rockwell International.Science Center
SC5222.FR
LIST OF FIGURES
Figure Page
I Schematic of the lifetime prediction model...................... 2
2 Electrochemical impedance of polymer coated steel: (a)Circuit analogs, (b) Bode-plots for Model I with parametersin the inset, (c) Nyquist plot (-Z" vs Z') of spectrum in
3 Bode plot for a polymer coating after damaging with a pin ....... 10
4 Bode-plots for coated steel (+AD).. .......................... 12
5 Bode-plots for coated steel(D +HN3 ).......................... 12
6 Bode-plots for coated steel (Initial rust spots not removed).... 13
7 Time dependence of pore resistance R for coated steel withdifferent surface pretreatment proce ures....................... 13
8 Time dependence of the pore resistance Rp. for a free film(polybutadiene) and for the same coating on steel withdifferent pretreatments . ...... .. .................... .. . 16
9 Model for the coating degradation process due to build-up ofcorrosion products .............. 18
10 Pore resistance R vs extension for coupons of polybutadiene-coated steel (P + D)........,..,,..... ........................ 18
11 Pore resistance Rnn vs extension for different coupons
coated with materalss........................................... 20
12 Schematic for the scanning impedance probe technique (SIPT)..... 20
13 SIPT map for polymer coated Al alloy subjected to localizeddegradation by 1.0 M NaOH...................................... 21
14 Impedance spectra for a coating defect before and after" "cathodic disbonding around the defect. .......................... 25
15 Schematic for the electrochemical impedance for a cathodicallydisbonded region, (a) model and (b) Bode-plots .................. 26
ivC7509TC/bje

S% Rockwell InternationalScience Center
SC5222.FR
LIST OF FIGURES (Continued)
Figure Page
16 Schematic of the reflected acoustic pulse technique, (a)reflections and (b) apparatus ................................... 28
17 Reflected 25 MHz acoustic pulses for coatings having different• mthicknesses ...................................................... 29
18 Delay time At between Po and P1 as a function of coatingthickness ....................................................... 30
19 Reflected 25 MHz acoustic pulse at a disbonded region next to adefect .......................................................... 32
20 Phase angle vs frequency for transformed pulse data fromdelaminated and well bonded regions ............................. 32
21 Reflected 25 MHz acoustic pulse near a corrosion spot ........... 32
22 Image enhancement of the data from Fig. 21 ...................... 33
23 (a) Reflected pulses from the same region of epoxy coatedsteel after 0 and 672 h exposure to 0.5 M NaCl. (b) Imageenhanced reflected acoustic pulse of the 672 h data ............. 34
24 Schematic of the acoustic emission apparatus .................... 36
25 AE event rate and cumulative events for polybutadiene-coatedsteel exposed for 70 h to 0.5 M NaCl, pretreatment: (a) P + D,(b) inh. HCI, (c) HA and (d) HN03............................... 37
26 Time dependence of R for PB-coated 1010 steel withdifferent pretreatmehts ....... . ....... . .... ... .... . ............. 39
27 Amplitude distribution for events observed for PB-coated1010 steel with (a) P + D, (b) inh. HCl, (c) HA and (d) HNO 3pret reatments ... .. .......... ... ............... . ......... . 40
28 Bode-plots for coated steel/steel, spectra measured acrosscoating and between plates ...................................... 44
29 As Fig. 28, but with NaCl pretreatment of the steel surface..... 46
30 Model for impedance at the coating/metal interface .............. 46
v07509 IC/b je

SRockwell InternationalScience Center
SC5222.FR
LIST OF FIGURES (Continued)
Figure Page
31 Photograph of coated steel/steel surface after(a) t = 14 days for clean surface and b) tcorr 7 daysfor Na retreatment ............. ....... . ...... 49
32 Bode-plots for coated Cu/steel, spectra measured acrosscoating (Fig. 32(a)) and between plates (Fig.32(b)) ............. 50
33 As for Fig. 32, but for longer exposure times ................... 51
34 Time depende 8ce of pore resistance Rpo, polarizationresistance R , delaminated volume Veff, corrosion potentialEcorr and galvanic current Ig................................... 52
35 Bode-plots for coated Zn/steel, spectra measured acrosscoating (Fig. 35(a)) and between plates (Fig. 35(b))............ 53
36 As for Fig. 35, but for longer exposure times ................... 54
37 As for Fig. 36, but for longer exposure times......... ......... 55
38 Time depende 8ce of coating porosity R-, polarizarionresistance R , delaminated volume VefV, corrosion potentialEcorr and gavanic current Ig................................... 56
39 Bode-plots for phosphated and coated steel (D + AD)..........,.. 58
40 Bode-plots for phosphated and coated steel (D).................. 58
41 Bode-plots for Al 2024, conversion coating with polyurethanecoating . .......... , ..., .. ..... ... ,.. ......... ..... ..... .... ...... 60
42 Bode-plots for Al 2024, sulfuric acid anodized with polyurethanecoating. ........... .. .......... .......... ....... ,,.... .. .......... 61
43 Time dependence of pore resistance Roo, coating capacitanceC and corrosion potential Ecorr for coated Al 2024 (conversion
44 Time dependence of RMo, CC and Ecorr for coated Al 2024(sulfuric acid anodied).. ....... .............................. 62
viC7509TCfbje

Rockwell InternationalScience Center
SC5222.FR
LIST OF FIGURES (Continued)
Figure Page
45 Schematic for the two types of pigment-containing coatedspecimens: (a) two layers of pigment containing polymer(duplex coating), (b) two-layer coating with the layernearest to the substrate not containing pigment ............ ..... 66
46 R0 ,C, corr del and Ecorr for steel with epoxy coatingscgntaining: (a) layer 1-epoxy only (EX); layer 2-epoxyonly (EX); (b) ZnPhos/ZnPhos; (c) EX/ZnPhos; (d) ZnBaP/ZnBaP;(e) EX/ZnBaP; (f) SrChro/SrChro; (g) EX/SrChro; ( EX/Zn;(i) Zn/Zn ........................ , .. ... .. .... o.. ............ 67
47 Bode-plots for epoxy coatings with various wt. % of Zn duston P + D treated steel.....................,................... 75
48 Dependence of R on wt. % of Zn in duplex epoxycoatings for stgel samples (P + D) after 1, 4 and 24 hexposure to 0.5 M NaCl ................ .......................... 75
"49 Dependence of Ecorr on wt fraction of Zn in the epoxy coatingon steel(P + U) after 1 and 24 h exposure to 0.5 M NaCl......... 76
*4
viiC7509TC/bje

SRockwell InternationalScience Center
SC5222.FR
LIST OF TABLES
Table Page
1 Surface Pretreatments .................. ...... ................... 11
2 Cathodic Disbonding Results for Various Pretreatments ........... 23
3 Corrosion Resistance R° and Effective Delaminated VolumeVeff for Coated Steel PACMs Exposed to 0.5 N NaCl ............... 48
4 Pore Resistance and Polarization Resistance (in Q • cm2 )for Polyurethane-Coated Al 2024 with Conversion Coating orSulfuric Acid Anodizing Pretreatment ........... .... ,, ... ...... 63
5 Effective Dielectric Constant and Water Uptake of the Coating... 64
6 Pigment Data .......... ... .......... . .. ............ ...... ........ 66
7 Summary of Pigment Data - Coating Properties, CorrosionBehavior and Pore Resistance,..........., ................. 72
viiiC75OgTC/bje

Rockwell IntemationalScience Center
SC5222.FR
1.0 INTRODUCTION
The objective of this research program has been to develop a method-
ology for predicting the lifetime of polymer coated metals exposed to aggres-
sive environments. A major result of the work is the roadmap introduced inFig.1 showing the steps involved in the degradation of the polymer/coating
compound. Several relatively new concepts have been developed during the
course of this study to evaluate the relative probability for a polymer coatedmetal to proceed to each of the steps in a global model for corrosive degrada-
tion. New experimental techniques such as electrochemical impedance spectro-scopy have been developed for the study of polymer coated metals since it
became obvious very early that traditional techniques such as measurements ofthe cori;,sion potential or the polarization resistance were not suitable to
obtain the information which was thought to be necessary for the developmentand application of a lifetime prediction model. Previous work devoted to the
determination of the corrosion mechanisms of polymer coated metals concen-trated on the bulk transport of corrodents through the polymer coating. While
the importance of the hydrophobic nature and the barrier properties of thepolymer coating in providing protection of the metal substrate against corro-sion should not be ignored, it must be recognized that the initiation andpropagation of corrosion is related to coating defects. Furthermore, the
mechanical strength and adhesive properties of the coating play perhaps a more
important role in the overall integrity of the polymer/metal compound than the
transport of corrodents through the bulk polymer. Based on the information
Senerated during the course of this project it is concluded that a generalmodel of the interaction of the substrate, the coating/metal interface, thecoating and the environment as represented in Fig. I provides the most fruit-
ful means for evaluating the relative lifetime of polymer coated metals.
1C7509TC/bje

01 Rockwell InternationalScience Center
SC5222.FR
2.0 DESCRIPTION OF THE LIFETIME MODEL
The schemnatic in Fig. 1 contains the elements of the lifetime model
which is the result of the research performed during the duration of thisproject. The elements of the model fall into the category of system variables
describing the surface of the substrate, the coating and the environment, or
the category of processes which determine the degradation of the coating/metal
compound. These processes include formation of defects in the coating and at
the metal/coating interface, transport of corrodents to the metal, loss of
adhesion, corrosion and failure. The lines joining the processes and varia-
* bles in Fig. I indicate the causal relationships of the system variables and
processes and their independence.
INVtURNMUT SUM AU CH4IMIS1UT -4 COAT0SSCWMISTRV -
IaemmW ,• €MCANC4 A-
_4kt011 FfolA1,10" 4 GI020 ofCOATtUs,S - =,- . . 7 " --,',, i!
.. ... . . I .. ... . . ..... . . . . . . . . . . . .
ii, Fig. I Schematic of the lifetime prediction model.
'* 2
C7509TC/bje

01% Rockwell InternationalScience Center
SC5222.FR
2.1 System Variables
The environmental variables which may include UV and other radiation,
pH, oxygen concentration, water activity, temperature, electrolytic conductiv-
ity, and the concentration of other corrosive species such as S02 or sulfide
provide the driving force for the penetration of the corrodents (e.g., through
the dependence of the diffusion rate on the activity gradient). The environ-
mental variables may also have an effect on the mechanical properties of the
coating (process 1-5 in Fig. 1). -or example, water may swell the coating and
UV radiation can have an embrittling effect on the coating which may lead to
the formation of defects in the coating via decohesion of the film as shown by
the lines 8-4 and 6-4 in Fig. 1,
The surface chemistry of the substrate is governed by the bulk
chemistry of the metal and can be affected by the method of pretreatment. A"good" or "bad" surface resulting from a certain pretreatment process may lead
directly to loss of adhesion (process 2-8 in Fig.1), corrosion (process 2-9)
and defect formation in the coating as a result of poor wetting of the surface
by the liquid coating (process 2-4).
Coating chemistry governs tie nechanical properties of the coating 5
and the permeation rate of corrodents 7 such as oxygen, water and electro-
lyte. For example during the course of this research it has been found that a
coating which is very hydrophobic, but also very brittle provides poor protec-
tion. Evidence exists to suggest 2 , 5 17 that corrosion itself contributes to
the rupturing of the coating and 4ence the propagation of corrosion as
indicated by the process 9-6 in Fig. 1.
2.2 Degradation Processes
The corrosion of polymer coated metals involves the processes of
defect formation, penetration of corrodents, loss of adhesion and corrosion,
which eventually lead to failure of the coated metal. 2 The defect formation
accelerates the penetration of corrodents and provides initiation sites for
the corrosion reaction. This can produce extensive corrosion leading to
3C7S09TC/bje

4I1 Rockwell InternationalScience Center
SC5222.FR
failure provided a loss of adhesion takes place. Loss of adhesion is, in
fact, promoted by corrosion itself through the formation of cathodic sites
adjacent to the anodic defect. The reaction at the cathode in neutral NaCl:
1/2 02 + H20 + 20H- - 2e-, (1)
produces a local increase in the pH which has a detrimental effect on the
adhesion of the polymer to the substrate. A number of mechanisms could
account for this behavior including alkaline hydrolysis of the polymer, the
oxide interphase or the metal oxide-polymer bond. Most likely a number of
different effects contribute to this process.
The initial stages of the corrosion reaction at the metal/coating
interface depend somewhat upon the surface preparation. 2 "7 Certain surface
preparations can remove metal sulfides from steel substrates which serve as
initiation sites. 3 The presence of unremoved scale on the surface can cause
formation of crevices and lead to poor adhesion or wetting which can provide
sites of rapid initiation of corrosion. 8
Inhibiting pigments placed in the coating slow down the corrosion
rate of the metal and impro~a the lifetime of the coating/metal system.
Experiments performed in this project have shown that chromates that are
slightly soluble produce highly permeable and poorly adhering coatings on
steel, but increase the lifetime of the coated metal if a sufficiently
adhering layer exists next to the coating/metal interface.
The definition of ultimate failure of the coating/metal system de-
pends somewhat on the use of the structure involved and the purpose for which
the coating is applied. In many cases, all that is required of the coating is
that the structural integrity of the system be preserved. In this case the
appearance of small rust spots or filiform corrosion will not define fail-
ure. On the other hand, any corrosion in food containers will define failure
4C7509TC/bje

Rockwell InternationalScience Center
SC5222 .FR
of the coating/metal system. In other cases any corrosion which provides aslight dimensional change defines failure. Coatings often protect against
functional failure. Coated electrical components fail when the component doesnot operate properly despite the possible absence of any gross corrosion
products.
The schematic shown in Fig.1 provides a roadmap to follow in speci-fying the rate determining step and the ultimate lifetime of polymer coatedmetals. For any given system a certain number of the paths shown in Fig.1
will be either active or inactive. The relative probability of a coatingfailure can in principle be determined by evaluating the probabilities for
each of the processes leading to failure. Only a qualitative description ofthe mechanism of corrosion of polymer-coated metal can be made at present,although the relative rates for several of the processes described here havebeen evaluated for certain specific systems (polybutadiene or epoxy coatings
on steel or Al) during the course of this project. The results of this work,however, suggest the validity of the overall mechanism outlined in Fig.1.
Any evaluation of the lifetime of coated metal should endeavor to* •find which of the pathways shown in Fig. I is followed and which process is
rate determining in the failure sequence. The following section descr-besmethods for evaluating the relative rates for each of the processes described
in Fig. 1.
b5
S~C7509TC/bje
--4

SRockwell InternationalScience Center
SC5222.FR
3.0 EVALUATION OF DEGRADATION PROCESSES
As shown in Fig.1 and discussed above, degradation of polymer coat-
ings can occur in several steps which involve formation of defects, transport
of corrodents, loss of adhesion and finally corrosion at the metal/coating
interface. For the evaluation of these degradation processes a number a new
techniques have been developed and applied mainly to coated steel during the
course of this project.
3.1 Defect Formation
The formation of defects can occur during application of the coating,
as a result of reaction of the coating with the corrosive environment and/or
due to the build-up of stresses resulting from the formation of corrosion
products at the coating/metal interface. Defect formation has been studied
mainly with electrochemical impedance spectroscopy (EIS) during exposure to
air-saturated NaCl solution. Some preliminary tests have been performed with
the scanning impedance probe (SIPT). Use of these methods along with mechan-ical testing has demonstrated the importance of the mechanical properties of
polymer coatings in determining the propagation of defects in polymer coated
steel.
3.1.1. Electrochemical Impedance Spectroscopy (EIS)
EIS 4 "12 provides an excellent tool for detemining the presence and
development of defects in polymer coatings on steels and aluminum. The fre-
quency dependence of the electrochemical impedance distinguishes various
properties of the polymer coating from the response of the polymer/metal
interface.
For the evaluation of the impedance of a polymer coated metal, an
equivalent circuit has been found to be most suitable which consists of the
solution resistance Rg of the test electrolyte, the capacitance Cc of the
nondefective portion of the coating layer, a resistance Rpo that shorts the
6C7509TC/bje

0 Rockwell InternationalScience Center
SC5222.FR
coating dielectric, and a general impedance ZI, which characterizes the
reactions at the metal interface (Fig. 2a.). Cc depends on the dielectric
constant and the thickness of the polymer:
Cc = C rA/d, (2)
where
- = the dielectric constant of the coating&0 = týe dielectric constant of free space
A = the cross sectional area of the coated specimen
d = the coating thickness
Typical dielectric constants for polymer coatings range between 2-
4.13 Since the dielectric constant of water equals 80, absorption of even
-s-all quantities of water by a polymer film produces a significant increase.
As a result Cc provides a sensitive measure of the penetration of the coating
by water.14
Rpo is refe.rred to as a pore resistance because it results from the
penetration of electrolyte into defects of the coating which causes a conduc-
tive path to the s,,rfcce. These defects may be actual pores containing bulk
electvolyte or they may be vOrtual pores of heightened ionic conductivity
formed as a result of insufficient cross-linking.13, 1 6
" 1,; for the ýystems studied here, Z, cin be characterized by a polariza-
* tion resistance Rp in paraliel with a double layer capacitance, Cd (Model I in
Fig. 2(a)) or by Rp in series with a Warjurg or pseudo-Warburc impedance Z.
(Model II In Fig. 2(a)). 4 -8 Details of these interfacial nv.Cels will be dis-
cussed in greater det;il in Sec. 3.3 and 3.4, which deal with the interfacial
phenomena of adhesion loss and corrosion, respectively.
7' C75O9TC/bje

'• Rockwell InternationalScience Center
. .- SC5222.FR
GENERAL MODEL SCSI-14045
MODEL I MODEL II
cc C
C * d
RI RS ! , 'R a
o R po p Z2
ii nnRs 10 00 90
\P 100 120o -- ,o" ooooRp = 10 K/\S6 C = 10 nF .
ECd I UF ,d--n C
; 45
2 % IL!\ •,
42000
1000CRO 00
- RP 10 KQ,
2 0 20004. 6000 10 2
(b ).c) Lo w w In r I 0 0 h m6000 I• :10n
0i ana Logs. (b) Bode-ltsfrnoesIwthpraees inth =IseF
o.-- . ---- "N 4000
0 200 4000 0,ooo 9000 1o ootoo 12600(C) V'. ohms
Fig. 2 Electrochemical impedance of pol vmer coated steel: (a) Circuittanalogs, (b) Bode plots for Model I with parameters in the inset,(c) Nyquist plot (-Z" vs Z')of spectrum in Fig. 2(b).
8
C7509TC/bje

01% Rockwell InternationalScience Center
SC5222 .FR
For simple cases, the frequency dependence of the impedance for a
polymer-coated metal allows the different components to be evaluated. For
example, Fig 2(b) shows a Bode-plot (log of the impedance modulus, log IZI(IZI in ohm), vs the log of the measurement frequency, log ((• in rad/s )) for
a hypothetical case of Model I (Fig 2(a)). The dashed lines show the fre-
quency characteristics for each of the elements of Model I. At high frequen-
cies, IZI becomes independent of frequency and equal to Rg. At intermediate
frequencies between w 103 and 105 rad/s, a plateau in the log IZI vs log •
curve occurs as a result of the shorting of the coating capacitance by Rpo.
The impedance IZI for the plateau equals Rpo + Rp. Only at the lowest fre-
quencies does the polarization of the interface become apparent as an increase
of IZI with decreasing w due to the -1 frequency response of the double layer
capacitance Cd. For w +0, a limiting value for IZI is approached which is
the dc limit Rdc = RQ+ Rpo + Rp. In many situations Rp >> Rn+ Rpo, for
which case Rdc - Rp. The phase angle in Fig. 2(b) shows the presence of two
time constants, which is typical for simple cases of filmed electrodesurfaces.
Impedance spectra may also be presented as Nyquist plots (negative
out-of-phase impedance (imaginary component), -Z", vs in-phase impedance (real
component), Z'). The Nyquist presentation of the example of Model i appears
in Fig. 2(c), where two semicircles occur. The small, high frequency semi-
circle intersects the real axis at points equal to Ra and R. + Rpo, respec-
tively, and allows, therefore, an evaluation of Rpo, Bode-plots are preferred
for analysis of impedance spectra, since all frequencies are equally repre-
sented. The phase angle is very sensitive to the existence of additional time
constants and/or deviations from a specific model used for analysis.
The measurement of the electrochemical impedance of polymer-coated
steel has been described in detail in various papers resulting from this
work. 4 "1 2 A number of advances related to enhancing the speed and accuracy of410 the impedance measurement have been made. 17
V.
9C7509TC/bje

"01% "Rockwell InternationalScience Center
SC5222.FR
As a test of the validity of the model, Fig. 3 shows the impedance
for a polymer-coated steel exposed to 0.5 M NaCl after a defect was placed in
the polybutadiene coating with a pin. Very good agreement of the characteris-
itic features with those of model I in Fig,. 2(a) and the typical spectrum in
Fig. 2(b) is observed. Two time constants occur as becomes obvious from the
maxima of the phase angle at frequencies exceeding 2 • 105 Hz and at about
5 Hz. The capacitance Cc determined at the highest frequencies corresponds to
that calculated from Eq. (2) for the exposed area A = 20 cm2 and the coating
thickness d = 8-10 M. The pore resistance Rpo has a value close to
500 0 (10000 9 - cm2 )and Rp is approaches 5 * 104 0. The analysis of this
spectrum is facilitated by the wide separation of the two maxima of the phase
angle.
SC35430
6 ! 1 1 1 1 1 90
POLISHED & DEGREASED/PBSTEEL/O.5N NaCIONE PINHOLE (3 x 10⁻³ cm2 )
Uj
So ' ''.. .
tL 345-z
N<
.j 2
0 II0-1 0 1 2 3 4 5 6 7
LOG ooW In rad/s)
Fig. 3 Bode plot for a polymer coating after damaging with a pin.
S10C7509TC/bje

1 Rockwell InternationalScience Center
SC5222 .FR
EIS was applied to 8-10 pM polybutadiene coated specimens having the
different pretreatments listed in Table 1. The pretreatments in Table 1 were
used as discussed in Federal Specification TT-C-490B. Other pretreatment
processes were selected in an attempt to produce a wide variety of initial
surface structures.
Table 1
Surface Pretreatments
Treatment Description
Degreased (D) Trichloroethylene, 15 minTT-C-490 Met hod II
Polish (P) Wet polish, 600 grit SiC
P + D P followed by D
D + HA Polished (P) followed by 5 min, 1000C hot alkalinetreatment (TT-C-490)
D + AD Degreased followed by alkaline derusting (AD) 10 min,50%, TT-C-490, method V, Type III
P +D +inh. HCL Polished (P) and degreased (D) followed by treatmentfor 5 min in room temperature 42 v/o HCl + 5.8 g/l2-butyne-1,4-diol
D + AE Degreased (D) followed by an anodic etch for 2 min at0.1 A/cm2 in 30 v/o H2S04
D + HN03 Degreased (D) followed by passivation for 30 min inconcentrated HN03 at room temperature.
Examples for the changes of the impedance for coated steel during
exposure to 0.5 M NaCl are given in Figs. 4-7. Figure 4 shows the Bode-plot
for a surface which was degreased and then treated in the alkaline derusting
procedure (Table 1). Deviation from capacitance behavior occurs only for
frequencies below 1 Hz (Fig. 4). This deviation does not change very much
with time. The coating capacitance stays constant at about 0.1 PF, indicating
that the film thickness (about 6 tmn) does not change during the short exposure
time.
11C7509TC/bje

01% Rockwell International
Science Center
SC5222.FR
SCS1-14014
90
2 hr
, " I010 STEEL7 '.2.. DEGREASED
2 9.hr ALKALINE DERUSTED
POLYBUTADIENE
6 -' . . -Wl
45•N 2
4
3 *
2 00 1 2 3 4 5
LOG (w 1 in vodf)
Fig. 4 Bode-plots for coated steel (D + AD).
SC81-14015
.- I - -i - i I .. .i . .
1010 STEELh *DEGREASED
. -hr NITRIC ACID4." ,,POLYBUTADIENE
* 19 h"* 6Q
N.... ...... .. :
* "' t
0 1 2 3 4 6
LOG (w ( In radial
Fig. 5 Bode-plots for coated steel (D + HNO 3 ).
12
C7509TC/bje

'Ok Rockwell InternationalScience Center
SC5222.FRSC81-14016
I I I I I
2 hr A 1010 STEEL." . .. RUSTED SURFACEUNTREATED
3hr C POLYBUTADIENE..................... .....
...................................... .................33hr A ..
"E 23hr C
2
0 1 2 3 4
LOG (w Ini tedisi
Fig. 6 Bode plots for coated steel (initial rust spots not removed).
lei I"
as*.60 Mal4"
'0 1
Fig. 7 Time dependence of pore resistance R 0for coated steel withdifferent surface pretreatment proceoures,
13C75O9TC/bje

i Rockwell International- Science Center
V ~SC5222 .FR
While the coating on the surface which was cleaned by alkaline
derusting stayed very protective, relatively rapid deterioration of the pro-
tective properties of the coating occurred for the treatment of concentrated
HN0 3 (Fig. 5). Already after 2 h exposure, pronounded changes from that of an
intact coating can be observed. After 19 h and 45 h exposure, the impedance
and the phase angle have changed drastically and two semicircles are observed
in the complex impedance plot. Using a curve-fitting procedure for determina-
tion of semicircles in the complex impedance plot, 18 Rpo and Rp were calcu-
lated as Rpo= 12.8 kQ and Rp z 122.2 ko for 19 h exposure and Rpo= 395 ko,
and Rp - 21.3 kQ after 45 h. In both cases, the low frequency circle had itscenter below the real axis in a complex plane plot. After 45 h, the coating
has become thinner or has an increased dielectric constant due to water
Ll-- 1 uptake, 14 as indicated by the increase of the capacitance from 0.012 VF to
0.17 pF. A number of rust spots were observed after the 48 h test. This
pretreatment gave by far the poorest results.
While for most surface pretreatment procedures (with the excpetion of
HNO 3-passivation), very little degradation of the coating properties occurred
as shown by the impedance measurements, relatively rapid changes were observed
for surfaces from which rust particles were not removed before application of
the coating. Figure 6 shows examples for surfaces with a small (A) and a
large amount of rust particles (C). After 7 h exposure for the first case,
Rpo was about 2.3 • 104 Q, while after 5 h, Rpo was about 8.9 • 103 Q for the
second case, Complex impedance plots showed a semicircle at high frequencies
corresponding to the time constant related to Rpo and Cc. The lower frequency
impedance behavior determined by Z could not be accurately resolved into
individual components. These results show that AC impedance measurements can
detect in a very short time the harmful effects of surface contamination on
the protective properties of an organic coating.
The impedance data for the coated steel seem to follow Model I shown
in Fig. 2. Since in most cases very little corrosion occurred in the 48 h ex-
posure period. Rp remained very high and could not be determined at the pres-
14C7509TC/bje

SRockwell InternatonalScience Center
SC5222.FRN
ent low-frequency limit of 20 MHz. The pore-resistance Rpo has been deter-
mined from the experimental Bode-plots for the surface pretreatments in Table
1. Figure 7 shows the time dependence of Rpo for exposure to 0.5 N NaCl. For
the alkaline derusting treatment and the sample which was degreased only, the
impedance at w = 1 rad/s (0.16 Hz) exceeded 107 g, at all times. The impe-
dance for the sample with the hot alkaline treatment initially also exceeded
101 9, but then dropped to lower values with increasing exposure time and
stayed below the values for the anodic etch and the acid pickling treatments.
For polished surface and for passivation in concentrated HN03, R decreased
faster than for the other surface treatments. For the surface from which rust
was not removed before coating, the lowest initial and final (with the excep-
tion of the HN0 3 treatment) Rpo values are observed.
The data in Fig. 7 can be used for a ranking of the effect of surface
pretreatments on corrosion protection by the polybutadiene coating. This
ranking in order of decreasing resistance to environmental effects based on
the values of Rpo at 48 h is the following: degreased - alkaline derusting
>> anodic etch u HCl/Irth. - hot alkaline > polished + degreased u polished >>
low rust t high rust = concentrated HNO 3 .
This ranking results in four groups of different resistance to
corrosion attack.
Figure 8 shows the variation of Rp, "Jith time in the first 7 days of
exposure to 0.5 N naC1, for films formed on steel with different surface pre-
treatments, as compared to Rpo for a free-film surface measured in the Hittorf
cell. Since the exposed areas of the free film and the polymer-coated metalwere different, the data for the free film have been normalized by multiplying
the raw impedance data by the area ratio 5.1/19.7. The thickness of the freefilm was comparable to the thickness of the coating on steel, as determined
from normalized capacitance data. The values of log Rpo for the different
surface pretreatments and the free film extrapolate back to nearly the same
Rpo° 0the value of Rpo at zero time. However, Rpo for the coatings on the
metal substrate decreased in time, while Rpo remains virtually unchanged for
15C7509TC/bje

Rockwell International01 Science Center
SC5222.FRI I I I I I
* POLISHEDo POLHED 0 DEGREASIED0 NOT ALKALINE& ALKALINE DERUSTA CONC. HNO 3
a IN". MCI0 FREE FILM
0
a
To". OAVS
Fig. 8 Time dependence of the pore resistance Rnn for a free film
(polybutadiene) and for the same toating on steel with differentpretreatments.
the free film. Rpo for coatings on the metal substrates decrease by different
amounts, depending on the surface pretreatment. The polished and degreased
. specimen showed only an order of magnitude decrease, but Rpo for the samples
which were polished or treated in concentrated HN0 3 or in the hot alkaline
solution before coating decreased to a much greater extent upon prolong
exposure. For the sample with the hot alkaline treatment (Table 1), Rpo
decreased by more than a factor of 104 after 7 days.
R,, would seem a priori to depend entirely on the nature of the
polymer coating and would have no significant relationship to the surface
preparation. In fact. at initial times before significant exposure to the
electrolyte, Rpo shows little variation with pretreatment (Fig. 8), ,However,
as time progresses, the value for Rpo of the coatings on differently prepared
16C7509TC/bje

1 Rockwell InternationalScience Center
SC5222.FR
substrates decreased at different rates. Significantly, Rpo for the free film
remains essentially constant. Clearly, the presence of the substrate enhances
the short circuiting of the polymer film by the conducting electrolye. Al-
though the chemical or electrochemical gradients across films formed on metals
might provide the driving force which decreases Rpo of coated substrates, it
seems more likely that mechanical stresses produced by growing corrosion pro-
duct films or H2 evolution enlarge defects initially present in the polymer
coating. Hence, for a given polymer coating, the coating/metal interface most
susceptible to corrosion will induce the most rapid decrease in Rpo.
These results emphasize the importance of the mechanical stresses
provided by the generation of corrosion prducts at coating defects and lead to
the model shown in Fig. 9 for the degradation of polymer coated steel. Corro-
sion initiates at critically present defects in the coating (pores or virtual
pores of heightened ionic conductivity). As the corrosion reaction proceeds,
oxide developes at the anodic site of the defect which drives the adjacent
interface cathodic causing cathodic disbondlng. 2 The stresses in the coating
produced by the growing oxide rupture the coating, thereby propagating this
process. Two mechanical processes, coating rupture and adhesive failure, are
important to the propagation process and will be discussed In greater detail
in Sects. 3.1.2 and 3.3.
3.1.2 The Role of Mechanical Stress
The evaluation of Rpo for coatings as a function of coating extension
demonstrates the role of Stresses in propagating the development of coating
defects. Figure 10 shows the dependence of Rpo on strain for a PB-coated
steel as compared to the stress vs strain behavior of the coated coupon. A
* significant decrease in Rpo occurs between the elastic region of the metal and
its yield point. Rpo decreases further with additional strain. The decrease
of Kpo occurs within the elastic limit of the steel and indicates a brittle
coating. A more ductile coating, however, will not show a significant de-
crea-! in Rpo at such a small % strain, as (s the case for the specimens
17
C7509TC/bje

E Rockwell InternationalScience Center
SC82-19420 SC5222.FR
Fig. 9 Model for the coating degradation process due to build-up ofcorrosion products.
COATED STEEL (P + D) - 2mm/min SC82-20360
1 1 .7
-6
-I 4'-
tS
20O0
0 0.
CL
po -3 (2
100- LOG p0 ii
i'.A2'
0-10
0 2 3 4EXTENSION, cm
Fig. 10 Pore resistance R vs extension for coupons of polybutadiene-coated steel (P + 8).
18C7509TC/bje

Rockwell InternationalScience Center
SC5222.FR
coated with epoxy (EPON 1001)/polyamide (Versamide 125), where the epoxy wt.
fractions are 0.6 and 0.7, respectively (Fig. 11). The polyamide component of
the epoxy, a condeansation product of a polyamine with fatty acid, imparts
ductility to the coating. Hence, the coatings having lower epoxy cintent (0.7
and 0.6 wt. fraction epoxy content) contain more polyamide than the 0.9 and 0.
8 wt. fraction materials arid are more ductile. Accordingly, they show no
sharp drop in Rpo upon going from an elastic strain (1.8% or 0.14 cm for the
coupon) to plastic strain at 0.28 cm. Too much polyamide (0.6 wt. fraction
epoxy), however, results in a coating which has an initial Rpo that is toc low
(ca. 1o4-1o5 g) for adequate protection. The more brittle 0.8 wt. fraction
epoxy shows a high initial Rpo which drops rapidly with strain (Fig. 11). The
most brittle material (0.9 wt. fraction epoxy) has a low initial Rpo of 105 9
which drops to a very low value of 100 9 with only 5.2% strain (Fig. 11). The
coating with 0.7 wt. fraction epoxy performs the best having a high initial
Rpo that changes little with up to 5.2% strain. These results demonstrate the
need for a compromise between high initial Rpo and polymer durability under
strain. High polyamide fraction produces sufficient ductility, but lowers the
initial Rpo. Good corrosion protection requires high values of Rpo (low
number of defects or low ionic mobility within the coating), and no mechanism* for Rpo to decrease as a result of stress produced, for example, by growing
{ * corrosion products at the coating/metal interface.
3.1.3 Analysis with the Scanning Impedance Probe 19 , 20
A potentially useful tool for detecting the presence of defects in
coatings is the scanning impedance probe technique (SIPT), a schematic for
which appears in Fig.12. This device evaluates the impedance between the tip
of a porous fiber containing a neutral electrolyte and the substrate. The
measurement is highly localized and the impedance measured at a constant
frequency may be evaluated as a function of positition of the probe tip on the
specimen. For example, drops of concentrated NaOH were placed at one spot on
a coated Al alloy. After a period of time, a point of low resistance appeared
which could be mapped by the probe (Fig. 13). This technique has yet to be
19C7509TC/bje

Alkockwell InternatlonelIFNscience Center
* 6~TF~CTIQ OF SC522 2 ,FR
0 0.S pOLYAMIDE
7 C ) O % D IN Ej O V
4 POLYBUTAIN
E I~.maera6
0T0N I EXT T EN I N f
POTENTIOITAT
Fig. 12 chemati for th 5~~nnilg impeanc rb thfi~
SP)
PHAS 4ASENSIIVE A
2 EECO
4 5,
C7 5 0gTC/bje

Rockwell InternationalScience Center
SPo SC5222.FRPOLYMER COATED AL TREATED FOR1 A WITH H DROP OF 6M MAOH1 5l 5 cu2
Fig. 13 SIPT map for polymer coated Al alloy subjected to localizeddegradation by 1.0 M NaOH.
exploited to its fullest. It will be most useful for evaluating the existence
of defects which are initially present in polymer coatings on metals.
3.2 Transport of Corrodents
Permeation of organic coatings by various constituents of corrosive
electrolyte has been studied extensively. The reader is referred to the
literature covering this subject, in particular, the work by Ruggeri and
Beck. 21
Initially the coating itself represents the major barrier to thetransport of corrodents to the interface. Rpo as described in Sec. 3.1 isrelated to the transport of corrodents to the surface of the metallicsubstrate. The coating capacitance increases with water uptake. With timeand after significant disbonding of the coating from the metallic substrate,significant transport occurs parallel to the coating/metal interface at thedisbonded portion of the metal. Details of this process will be discussed inSec. 3.4.
21C7509TC/bje

1 Rockwell InternationalScience Center
SC5222.FR
3.3 Loss of Adhesion
Once corrosive species have reached the metal/coating interface,
corrosion and disbonding of the coating can occur. In some cases where the
metal surface is quite corrosion resistant, loss of adhesion of the coating
does not lead to corrosion damage. Disbonding of the coating has been studied
in this project with the reflected pulse and the acoustic emission tech-
niques. Some indirect evidence for the degree of disbonding has been obtained
by recording impedance spectra between segmented electrodes under the coating
as will be discussed in Sec. 3.4.2.
3.3.1 Cathodic Disbonding
As discussed above, the cathodic half of the corrosion reaction (Eq.
(1)) is extremely detrimental to the adhesion of the polymer coating to thesubstrate. This fact may be demonstrated by a rather simple test. A scratch
placed in a polymer-coated steel which was then exposed to 0.5 M NaCl and
polarized to potentials more negative than the corrosion potential caused
extensive disbonding of the polymer coating. On the other hand, when the same
scratched surface was polarized to potentials positive to the corrosion poten-
tial, only highly localized anodic dissolution was observed with no signifi-
cant disbonding at the perifery of the scratch.
This simple procedure forms the basis of a test similar to that of
ASTM G8-79 for the relative susceptibility of a coating to undergo cathodic
disbonding. Coated steel specimens were scribed using a silicon carbide chip
to place two 2.5 cm marks bisecting at 9g0. The specimens were polarized at
-1050 mV vs SCE typically for 1 h. The time for the test may be modified for
coating systems which have a high resistance to cathodic disbonding. The
"current and total charge passed during the test were recorded. Following the
polarization, adhesive tape was immediately applied to the coated surface. A
pull of the tape removed the portion of the coating delaminated by the cath-
odic disbonding. The area delaminated Ad was determined by integration from a
photomi .rograph.
22C7509TC/bje

01% Rockwell InternationalScience Center
SC5222.FR
During the polarization of the defect, most of the cathodic current
eminates from the initial defect, and only a small amount of the current comes
from the delaminated region. An estimate of the relative delamination rate
may be made from the delamination efficiency q:
= Ad/Q (3)
where Q is the total cathodic charge that is passed.
Table 2
Cathodic Disbonding Results for Various Pretreatments
Time of Ad QTreatment test (h) (cm 2) (coul.) (cm 2 /Coul.)
1. Polybutadiene
HA 1 34 0.69 20.4
HNO 3 1 34 1.00 29.5
D 1 36 1.13 31.3
P + D 3 138 4.43 32.8
HA1 1 37 1.29 34.8
P 1 41 1.88 46.2
AD2 1 40 2.34 58.8
P + AE 3 140 8.45 60.4
inh.HCl 1 40 2.51 62.6
AD 1 40 1.7 67.9
2. EVA Laminate
No adh. prom. 0.5 55 0.77 14.0
adh. prom. 3 0.5 55 0 0.0
No silicates2 Ending with cathodic cycle
(3) Formulated organosilane - Springborn A11861
23
C7509TC/bje

E1% Rockwell InternationalScience Center
SC5222.FR
Table 2 shows E for specimens with the treatments described in Table 1. The
samples with the hot alkaline treatment showed a significant resintance to
cathodic delamination with ed = 20.4 cm2 /C as compared to the degreased, as
received specimen (D) with Ed = 31.3 cm2 /C. The HNO, treated and the polished
and degreased surfaces (P + D) showed efficiencies similar to the blank
(P + D) with efficiencies of 29.5 and 32.8 cm2 /C, respectively. The alkaline
derusting and inh. HC1 pretreatments apparently enhance the probability for
cathodic disbonding to take place.
Delamination of an inflicted defect does not require mass transport
through the coating. Thick (> 0.1 mm EVA) laminates also exhibited cathodic
delamination from the steel in the absence of a suitable adhesion promoter
(Table 2). The dimensions of these films preclude transport through the film
during the short 0.5 h test. Consequently, the delamination results from
lateral transport of the cathodically generated OH" at the defect.
When the cathodic delamination results are comparted to surfaceproperties obtained previously by Auger electron spectroscopy, 2 , 3 it is found
that the cathodic delamination shows no preference for either substrates with
thick oxide films (> 50A) or thin films (< 50A), nor for degree of hydroxy-lation of surface oxides as indicated by XPS analysis of surface OH" concen-
tration. Further analysis of these surfaces suggests that the presence of
small quantities silicon-containing compounds on the surface improves the
resistance of the coated surface to cathodic disbonding.
A number of methods for evaluating the loss of adhesion of a coating
from the metallic substrate have been investigated. Disbonding about a cath-
odically polarized defect produced a dramatic change in the electrochemical
impedance spectrum (Fig. 14), except for the ohmic resistance of the coatingdefect which remained constant at 11 Q (Fig. 14a). After the polarization, an
approximate 2.5 cm diameter region of delamination appeared around the defect
and the corrosion resistance (approximately equal to the d.c. limit of the
impedance spectrum) decreased from 583 Kohm to 4.6 Kohm. In addition, a large
drop in the maximum of the phase angle and a decrease in the slope of the
24"C7509TC/bje

wN # Rockwell InternationalScience Center
m 'SC5222.FR0.5 ram EPOXY ON STEEL28.5 hr OF POLARIZATION
6 AT -1440 mV vs sCE
SN ".. IEFORE DELAMINATION4 "'
2 AFTER DELAMINATION
so- /0•_ _ EFORE DELAMINATION
' • • 60 /
40 -1 (b)
20 AFTER DELAMINATION
-2 0 2 40
LOG w (w IN PADI
Fig. 14 Impedance spectra for a coating defect before and after cathodicdisbonding around the defect.
logizi vs log w curve in the 10-1000 rad/s region occured after delamina-
tion. This is consistent with the model for the delaminating defect shown in
Fig. 15a which comprises a transmission line analog for the electrochemical
impedance. A pore resistance, Rpore, and a shunt resistance, Rsh, define the
initial defect, where the shunt resistance represents the polarization resis-
tance at the initial defect. However as the disbonding takes place about the
initial defect, parallel elements representing the corrosion resistance and
double layer capacitances of the metal/coating interface (Rpi and Cpi) and a
series resistance, Rsi, representing the series resistance of the creviceformed between the disbonded coating and the metal surface contribute to the
impedance. The development of this transmission line type of impedance lowers
the phase angle. This is illustrated in Figure 15b which shows the Bode plot
for an interface with 10 elements representing the initiation of debonding and
that for 1000 elements representing extensive disbonding. This qualitatively
"models the experimental results shown in Fig. 15a. The dc limit , i.e.,
25C7509TC/bJe

oi% Rockwell InternationalScience Center
SC5222.FR
corrosion resistance, is also lowered as more conducting elements Rpi short
Rsh (Fig. 15b).
IC84-26113
CIRCUIT ANALOG OFA DELAMINATED EFFECT
r--------------------------------------------- I,Rpre R 2 R N
Rh Rl p Rp2 RPi RNC CPNP
*1+
L--------------------------- ------
, * (a)
RS1 = 3 ohm Rsh : tf,Rpi : I Mohm Rpo = 100 ohmCpi = I uF
In #4 10E
C NN10
4 45v~-:
C 2 2C6
0-2 0 2 0
(b) Log w, w In rad/s
Fig. 15 Schematic for the electrochemical impedance for a cathodicallydisbonded region, (a) model and (b) Bode-plots.
Io
26N C7509TC/bje

1 Rockwell InternationalScience Center
SC5222.FR
3.3.2 Analysis with the Reflected Acoustic Pulse Technique
Reflected acoustic pulses provide a another nondestructive method for
assessing the extent of disbonding or loss of adhesion at the coating/metal
interface. Figure 16 a shows a schematic for the use of the reflected acous-
tic pulse technique for evaluating the integrity of the coating/metal inter-face. The time delay between the pulse reflected from the coating/metal
interface (PI) and that from the coating/couplant (water) interface (Po)
depends on the coating thickness and the velocity of sound in the coating
(1.62 times that for water), A pulse P2 also reflects from the back of the
metal substrate, but this may be effectively eliminated by using a very thick
substrate. Figure 16b shows a schematic for the apparatus which consists of a
piezoelectric acoustic transducter mounted on a manipulator. The nominal
center frequency for the pulse is 25 MHz. Signals may be stored on a digital
oscilloscope for later transfer to a VAX 11/780 computer for analysis using
the Interactive Signal Processing programs developed at the Rockwell Interna-
tional Science Center.
Figure 17 shows the reflected acoustic pulses for different thick-
nesses of epoxy (EPON 1001)/polyamide (Versamide 125) coatings containing
0.7 wt fraction of epoxy on a 0.5 cn thick carbon steel plate. The time
difference between Po and P1 for the pulses from the 25 im-thick coating canjust barely be resolved as the time between the two maxima, while a clear
resolution of the time delay between Po and P1 appears for coatings thicker
than 100 iM. The time delay between Po and P1 increases with the thickness of
the coating as is to be expected. Figure 18 shows a linear dependence of the
delay time on the coating thickness as measured by a micrometer. The slope ofthe thickness vs delay time curve (Fig. 18) equals 1.6 • 105 cm/s which is the
* velocity of sound at 25 M4Iz in the coating.
27C1509TC/bje

0 14 Rockwell InternationalScience Center
SC5222.FR
PULSE ECHO TECHNIQUE
PULSEDACOUSTICTRANSDUCER
TOP0
(a) PI
/ POLYMER COATING
P2 METALC SUBSTRATE
DATA GENERAL91200
COMIPUTER
CONTROL&
DATALINES
', PANAMETRICS &6OATION" PUL8ER ,,.-.. |100
STR)URCR AID
S.AXES(b) MANIPULTORAARMýý , SCOPE
"L VWATERFULLEDTANK
•-SAMPLE
SUPPORTPLATE
Fig. 16 Schematic of the reflected acousic pulse technique, (a) reflectionsand (b) apparatus.
28C7509TC/bje

Rockwell InternationalScience Center
ULTRASONIC SIGNAL REFLECTIONS SC5222.FR
Ak40,
c 75um
*1'I mit
Fig. 17 Reflected 25 MHz acoustic pulses for coatings having differentthicknesses.
S0,3
-0.-
0.
0.15 0.1 0.06 0DELAY TIME U (pW
Fig. 18 Delay time At between P0 and P1 as a function of coating thickness.
29C7509TC/bje

OiN Rockwell InternationalScience Center
SC5222.FR
The method can be used to observe gross disbonding of the coating
from the substrate. Figure 19 shows a "waterfall" plot made by placing the
transducer at different points near and over a defect (0.6 cm hole) in a coat-
ing which had been subjected to -1440 mV vs SCE for 30 h (-1.5 V vs Cu/CuSO4 -
see ASTM G8-79). The transducer was translated 1.25 mm before each waveform
shown in Fig. 19 was collected. At the defect only one reflection due to the
metal/water interface occurs, while both Po and P1 appear when the transducer
is over the coating. Where lift-off occurs, Po arrives earlier since the
coating has been raised. The small signal between Po and P1 in the lift-off
region is a reflection from the polymer/water interface. MT" • • DEFECT
(NO COATING)
-hM
44Z_17 PiLAMINATEDw . • ' REGION
1.27mM
24.40 24.80 25.20 25.60 26.00 26.40
TOME (us)
t ItFig. 19 Reflected 25 MHz acoustic pulse at a disbonded region next
to a defect.
30C7509TC/bje

Rockwell IntemationalScience Center
SC5222.FR
In addition to the time delay between Po and P1, the frequency spec-trum of P1 has features which sense disbonding due to acoustical impedancedifferences at the interface when a disbond occurs as compared to when com-plete adhesion exists. The acoustic impedance of a material equals the
density of the material times the velocity of sound in the material. Whn theacoustic impedance of the substrate exceeds that for the coating, as is the
case for a well banded coating/metal interface, then a positive spike in thephase angle spectrum of the frequeticy transform of the pulse appears as shownin Fig. 20b. On the other hand, when disbonding occurs a water layer which
exists between the coating and the metal acts as the acoustic substrate. Inthis case the acoustic impedance of the substrate (i.e., the water layer) isless than that for the coating and thereby produces a negative phase shift as
shown by the negative spike in the phase spectrum (Fig. 20a). This phase{ shift allows the signal from disbond initiation sites to be enhanced with the
proper date transformation. The signal due to the phase shift can be enhancedby performing a transformation on the signal of the initial time domain
signal, Pold into a new signal, Pnew:
Pnew F'I {F(Pold)/F(Pref) ) - Po (4)
where Pnew the transformed signal.
Pref a signal from a well-bonded region.F and F-1 refer to the operations of fourier and inverse fourier
transformation, respectively.
After placing a defect in a 350 pm coating on steel and exposing itto 0.5 H NaCl severe corrosion occured at the defect. In addition several
small corrosion spots appeared at sites several centimeters removed from the
defect. An attempt was made to detect the integrity of the coating at thesmaller corrosion spots removed from the defect. Time domain acoustic pulsedata gave some indication of the initiation of corrosion at these remote sites
as shown for each 1.25 mm translation of the transducer position in Fig. 21.
31C7509TC/bje

Rockwell InternationalScience Center
_US-31046 SC5222.FR
-5
-10- F1 (a)
-15 DELAMINATED -
6L -20
W -25-
z< -C,
4110-,
WELL-BONDED W
0 -- -
0 4 e 12 16 20
FREG (MHz)
Fig. 20 Phase angle vs frequency for transformed pulse data from delaminated
and well bonded regions.
SC84-26988
10--
-- !-
_...._ ___0 __;-- _.... . CORRODEDREGION
I I 1|I|_ - _ __ _ _ _.. ...
0 _ _ _ _ _ _ _
'I
• •, . ... 1.27mm
_________________________,_______________ __ _____ .______________________
24.40 24.80 25.20 25.60 26.00 26.40TIME (jps)
Fig. 21 Reflected 25 MHz acoustic puls.ý near a corrosion spot.
32 •1C7509TC/bJe
,, ,' " .- " . . " .. ' " . " . . , ., ' -. , ' ' , - , .' ' , , ' , ' ,'A, "

wE v Rockwell InternationalScience Center
SC5222.FR
Very little differentiation appears for the time domain pulses shown in
Fig. 21. However, upon transforming the data of Fig. 21 according to Eq. (4),
the resulting signal pinpoints regions of disbonding as minima, shown in
Fig. 22, due to the negative phase shift brought out by the transformation.
"I-.C-b O 0 30
-00
Im~Go -. "|.L
- • 400
L6 ]k CORRODEDREGION
300 -
230 200
100 N_--
23.80 24.00 24.40 24.80 25.20 25.60TIME (as)
Fig. 22 Image enhancement of the data from Fig. 21.
The previously described tests were performed on relatively thick
specimens that contained an artificially produced defect. In order to evalu-
ate the ability of the method for detecting the earliest stages of corrosive
degradation of the polymer/metal interface, a steel coupon coated with a 25 W
epoxy was exposed for over 600 h to 0.5 M NaCl and the electrochemical impe-
dance spectra and reflected acoustic pulses taken from an approximate 6.5 cm2
area were collected at different intervals of the exposure. The electro-
chemical impedance gave values for Rpo which decreased rapidly in the first200 h and then increased slightly after 300 h. Little change in the acoustic
pulse spectra occur until after 672 h at which time a corrosion spot appeared
under the coating which was detected by the reflected acoustic pulse. Figure
23a shows a plot of the transformed signals taken at initial time from the
33C7509TC/bje

Ak ,Rockwell International
-4 sC8S.33097 Science Center
. . :. , .........' -- SCS5222.FR
I..400E /\ . _ __
LL 3 0 0 . . "" . - ,o 0 I -"-- INITIAL
200
lor -
-... . .. ,a~'-• '-
S . . .......,• -/ .. .
-' 0 0.1 0.2 0.3 0.4• TIME (jus)
-- 7 (a)
____-__.____,__.... .__.'____._ .4.,'.4J_-
u• 400 -A.•, LL
• ~~~~~0 300"--"--J, -"
-0---'". " --.---.---.-- '672 HR
100.
* .0 .
0 0.1 0.2 0.3 •03
TITMM (p.)
g200V
0iad 72h epour to 0.-----a-i.-- (b)Im- eenanedre-ete
. -.------.. ---...4 4,,.
-, 0 0.1 0.2 0.3 0.4
• !Fig. 23 (a) Reflected pulses from the same region of epoxy coated steel after
0 and 672 h exposure to 0.5 M NaCI . ?b) Image enhanced reflectedS . acoustic pulse of the 672 h data.
', 34•' C7509TC/bJe

iij Rockwell InternationalScience Center
SC5222.FR
position where the corrosion spot eventually appeared, and after 672 h when
the corrosion spot was initially detected. After enhancing the initial
portion of the signal by a multiplication factor and performing the trans-
formation, a clear indication of the position of corrosion spot appears in
Fig. 23b.
With the application of signal processing techniques the reflected
acoustic pulse method detects the loss of adhesion of polymer coatings from
metallic substrates and the initial growth of corrosion products at the
coating/metal interface. The technique can locate the initiation site(s) of
corrosion at early times which is not possible with EIS. The impedance
spectra suggest that defects in the coating have formed prior to the earliest
detection of corrosion product by the acoustic pulse. The acoustic pulse
method would be of use for evaluating nontransparent coatings and for
assessing the earliest stages of adhesion loss.
3.3.3 Analysis with the Acoustic Emission Technique
A number of investigations have used acoustic emission (AE) emanating
from polymer-coated steel pulled in tension to failure as a method for evalu-
ating the environmental degradation of adhesion and microcracking of the pro-
tective coating. 2 2- 2 1 A number of approaches have been used in this
laboratory for separating the different types of acoustic events observed for
coated steel with different pretreatments and exposure history.
Coupons (17.8 cm x 5.08 cm x 0.05 cm) of carbon steel were pretreated
by 1) polishing (6V0 grit) and degreasing in hot xylene (P&D), 2) pickling in
inhibited HCl (inh. HCI), 3) treating in hot NaOH (HA), or 4) passivating in
HNO 3 (HN0 3 ). 10 Mm polubutadiene coatings were applied to the specimens and
cured for 20 min at 100 0C. From electrochemical impedance spectra Rpo was
determined as a function of time of exposure to 0.5 M NaCl at different inter-vals over a period of 70 h. After the 70 h, the specimens were pulled in
tension at a rate of 2 mm/mln in a 2000 lb Instron machine. Flat jaw grips
were used to grip the specimen firmly. A gauge length of 7.6 cmo was used.
35
C7509TC/bje
'b VC ~ . *. C ''''.*: ***3 **' * * A ~.. '' 3 '

-irmw Rockwell InternationalScience Center
SC5222 .FR
The test set-up along with the AE monitoring system is shown in Fig. 24. The
AE events were continuously monitored as the specimens were pulled to failure.
Figure 25a-d shows the event rate and the integrated event rate vs
time for the coated steels of different pretreatments. For all of the speci-
mens, counts occur when the metal yieldz; however, for the HA and inh HCl
pretreatments which showed superior resistance to degradation, a smaller
fraction of the total counts appeared at or near yield of the steel substrate
as compared to the P&D and HNO 3 pretreated specimens which showed a substan-
tial fraction of the counts in the first half of the total specimen elongation
before rupture. At 50% elongation, the fraction of the total counts for the
specimens with HA, inh. HCI, P&D and HNO 3 pretreatment were 0.13, 0.17,0.25
and 0.54, respectively (Figs. 25a-d). This order correlates inversely with
the Rpo results in Fig. 26. The sample with the greatest fraction of countsin the first half of the total elongation where yield occurs (HN0 3 ) shows the
lowest Rpo at 70 h exposure to the 0.5 M NaCl environment.
SC83-2 1174GRIPS
CCOATING
SPECIMEN
Irs2IICdBTE 75200kz 20 EECTORM
M4L
SCEATIC OP AE TEST SETCUPE
Fig. 24 Schematic of the acoustic emission apparatus.
36C7509TC/bje
S -- , • . . . **- - * S.. .- . •. S *.. . .q%•% . ' . •. .. . . %' w'%r•'
'S - ~ * ****~ S.S~S~'S' I TRAN4* S DUCER ~ . ¾ %, % % S. - * .

0 • Rockwell InternationalScience Center
SC2 21103
20 SC5222.FRP + 0. UNEXPOSED
16I
> 8.
4. 1
> 1.00o (a)au
0.80 P + 0. UNEXPOSED
z a
•0.60
()0.40-
0
TIME (a)
SC93-21179
W P 4 0 INNEXP.EXPSED
20
!1 "> 12 0
":4:4
to 2040 0 00 $000 No200 D 1TIIME (5)
3C11 211.
Fig 25 AE evn raeadcmltv-vnsfrplbtdeeca te
expse for 70 h-o.5 M • .al prtetet (a P.---- (b---h
INH (C), EXPOH(D
: 1
U37
.0 122
HI,(c) A, nd (d) , ENO3E.
9 37'7509TC/b0
,GA
* ,I•• ,• .. ".." .,• •,:• , • • `<`,: :`• • •``` W• .r• ••,•%.,., ,•,•, -,' •

01% Rockwell InternationalScience Center
SC83-211780 o - SC5222.FR
HOT ALKALINE, EXPOSEDIs ;1- 16
0
.2
- I"
0401.0 OT ALK.ALINE, EXPOSED
0.20
200
0 aw 4W0 600 ~ 0 1000 1200TIME (8)
8C83-2 I177
20
HNN3, EXPOSED
II
121-
~4
TIME (5)
Fig. 25 (Continued).
38C7509TC/bje
Yi C8-17

'ik Rockwell InternationalScience Center
SC5222.FR
The P&D (Fig. 25a) and the HN0 3 (Fig. 25d) treated specimens show the
largest number of events before failure of the specimen. This correlates
quite well with the Rpo data appearing in Fig. 26. The amplitude distribution
for the AE of these specimens provides further information. The amplitudes
for the coatings which are least degraded (HA and inh HC1) exhibit higher
amplitude events (see Figs. 27b-c) than the P&D and HN0 3-treated sample
(Figs. 27a and 27d). The two specimens exhibiting the greatest degradation
have amplitude distributions characteristic of brittle failure of the coat-ing. 1 This apparent embrittlement could result from the localized stress
which occurs in corrosion products formed at the coating/metal interface for
the coatings with more advanced degradation (see Fig. 9).
107 IC83-21175
POLYBUTADIENE ON STEEL/0O5 N NaCI PRETREATMENT
* HOT ALKALINE
* INH HCIO P&DAHNO3
106-
105
1041 . I0 20 40 so so
TIME (h)
Fig. 26 Time dependence of Rpo for PB-coated 1010 steel with differentpretreatments.
39C7509TC/bje
S

i f•o Rockwell InternationalScience Center
100SCb3-21180
P D. UNEXPOSED SC5222.FR
z 60I-
.040 .d
20
P *0, UNEXPOSED
0.60
0.40
02 0.20
0 20 40 6so so 100"AMPLITUDE (dB)
_I
100 SC93-21176
INK HQ. EXPOSEDso
40
30
K (b) o.-.•--L10
"" *H 00, EX.OSED ,
&% 0
20 40 s0 o0 100AMiPITUCE (4I)
Fig. 27 Amplitude distribution for events observed for PB-coated 1010 steelwith (a) P + 0, (b) inh. HC1, (c) HA and HN03.
40C7509TC/bje
• •?.• .;.g.•'•.•;•;• ••¢.%.',.¢,.•,.¢'.,y.¢.,.•:.,,rL•.,Lu.....y ,...%. ,..•,., j,; *.•..,_p, .,.j '.J .. ÷

i% Rockwell InternationalScience Center
SC83-21196100-
- .. ,SC5222.FRHOT ALKALINE, EXPOSED80
sooz 60
040
z
.00
.410 NT ALKALINE, EXPOSED
0, 20 40 so gto 100
- AMPLITUDE (Mi)
SC83-21197
"1NNO3, EXPMO
so
!40
20
S* 0*
* 20 40 0 so 18
AMPLITUgE (W)
Fig. 27 (Continued)
A I 41I* C7509TC/bje
-- a..• -. •- ,q ? ,- ,. ,t ,."• , %o ,-t* ,• ,;.• ,,. - ,. . • • , ._ . • . - • • . . • . • . .

01% Rockwell InternationalScience Center
SC5222.FR
The first events in the degradation of the coatings result from
penetration of electrolyte and loss of adhesion. In the later stages of
corrosion, corrosion products precipitate at local defects and locally produce
high stress sites (see Fig. 9). In the early stages, then, AE will result
from loss of adhesion producing the high amplitude, broadly distributed events
(> 50 bB). For specimens in more advanced stages of degradation, more events
will occur with amplitudes between the 40 and 50 dB level which are charac-
teristic of the brittle behavior.
These results demonstrate the role of mechanical events in the degra-
dation of polymee-coated steel. Adhesive failure of the coating interface
during exposure to electrolyte leads to the growth of corrosion products that
act as stress risers in the polymer film. This causes further degradation of
the coating by enhancing the existing porosity and initiating new pores.
Analysis of the amplitude distribution of AE from coated specimens loaded in
tension to failure pinpoints events associated with brittle failure of the
coating and adhesive failure at the interface. Most importantly, the number
of acoustic events which occur near the yield point correlates with the extent
of degradation of the coated coupons as determined from impedance analysis.
3.4 Corrosion
The combined effects of defect formation, transport of corrosive
species to the metal surface and loss of adhesion can lead to corrosion of the
., surface. As discussed above, corrosion products and reaction products of the
electrochemical reactions such as OHN (Eq. (1)) can lead to further destruc-
tion of the coating. For the study of corrosion reactions at the metal sur-
face, which in many cases might be covered by a (hydrated) oxide, impedance
techniques provide again the most promising approach. The use of segmented
electrodes allows to measure the impedance of the surface under the coating
and compare the results with those for measurements across the coating.
Corrosion inhibition by primers in the coating and by surface modification
through phosphating of steel and anodizing or conversion coating of Al has
also been evaluated using EIS.
42C7509TC/bje
%:

Rockwell InternationalScience Center
SC5222.FR
3.4.1 Determination of the Corrosion Rate of the Substrate
As discussed in Sec. 3.1, the electrical analog of the polymer-coated
steel interface contains the polarization resistance, Rp, which is inversely
proportional to the corrosion rate. In principle, the actual corrosion resis-
tance and its changes can, therefore, be evaluated from impedance spectra.
While EIS has provided useful new information concerning reactions in the
coating, as expressed by Cc and Rpo (Fig. 2a), it has been difficult todetermine values of the polarization resistance Rp and double layer capac-
itance Cd for the corroding surface as a function of exposure time. This is
due to the fact that Rp and Cd are accessible only at very low frequencies for
corrosion resistant polymer-coated metals. If Rp is less than RPO, then its
accurate determination becomes difficult, if not impossible.
The changes of the capacitance with increasing porosity and corrosion
rate can be used to determine the area fraction 0 at which active corrosion
occurs. 10 For an experimentally determined value of the capacitance C and the
known values of Cc - 6.2 10-9 F (Eq. (2)) and Cd = 4 i0- 4 F, one can calculate ,
e from Eq. (5):
C I -( ) Cc + Cd (5)
The corroding area fraction 0 and the pore resistance R are two parameters
which can be used to characterize the deterioration of the coated metal.
3.4.2 Investigations of the Metal/Coating Interface
The study of the reactions occurring at the metal/coating iriterface,
such as corrosion and loss of adhesion, is very important from both funda-
mental and practical standpoints. An attempt to evaluate such (iac•ons has
been made using a variation of the experimental technique for 'hiining EISdata in coated metals. Impedance measurements are carried oti!. uv.r the coat-
ing and are compared with those for the more traditional approach of measuring
impedance data across the coating. 1 2 These data have been obtained with an
43C7509TC/bje
S..•: ,.•;,, **. *,,.,/, ,,,* . , • ,. • . •,. :: ,•. . , .... ... .. . . . , • ..... . . ..... , . . .... .. .,.. . .

A .Rockwell InternationalScience Center
SC5222.FR
"electrode system which is used in the atmospheric corrosion monitor (ACM). It
consists of a number of parallel steel plates which are isolated from eachother. 1 2 A steel/steel ACM, which consisted of 20 steel plates 1 mm wide and
6.5 cm long, was used as the substrate. The steel (A366) plates were sepa-rated by a 50 Mz thick mylar foil. Alternate steel plates were connected to
establish a two-electrode system. The epoxy coating was 20 on thick and
consisted of 0.7 weight fraction epoxy and 0.3 weight fraction polyamide.
After curing of the coating, an electrochemical cell, which contained the SCE
reference electrode and a large Pt counter electrode, was attached to the
active part of the ACM. The test electrolyte was aerated 0.5 N NaCl. The
counter and reference electrodes were used for measurement across the coating;the measurement was carried out at the open circuit potential of the coated
steel. The measurement under the coating was carried out at 0 mV appliedpotential. The ac signal was applied between alternate plates. EIS data have
been obtained as a function of exposure time (tcorr) to aerated 0.5 N NaCl forclean steel surfaces and for surfaces which were exposed to diluted NaCl
before coating.
Figure 28 gives a typical result for the changes of the electrode
impedance IzI as a function of tcorr for measurements across the coating and
under the coating, respectively. In the former case, the capacitive behaviorobserved at frequencies f - 4 2n exceeding 10 Hz corresponds to that of a
20 pM epoxy film (Cc in Fig. 24). At lower frequencies, the pore resistance
Rpo becomes apparent. It slowly decreases with tcorr up to 14 days, but re-
mains at the high values observed earlier for 20 M coatings.
For measurements under the coating, a much lower impedance, which
changes significantly with tcorr, is observed. The initial capacitance athigh frequencies corresponds to that of the bare steel/mylar/steel system.
After longer exposure times, a -0.5 frequency dependence of the impedance is
observed at intermediate frequencies which points to transmission line
effects.
44
C7509TC/bje

01% Rockwell International"Science Center
SC5222.FR
0EPOXY COATINO1STEELIO.SN &C
ACROSS COATING
•--• • -UNWRE COATINQG
.5
4 -,
3i
I -1 I in to"
Fig. 28 -6ode-plots for coated steel/steel, spectra measured across coatingand between plates.
As observed earlier with EIS and well-known in practice, contamina-
tion of the steel surface before coating can lead to rapid corrosioIo and loss
of adhesion of the coating. This effect was simulates by covering the ACM
surface with a solution of 1 mM NaC1 containing some ethaiol which was allowed
to dry. The epoxy coating was applied to the resulting surface. As Fig. 29
shows, much more rapid changes of the impedance occur in this case for both
types of measurements. After tcorr a 1 day, Rp0 is already lower than thevalue for tcorr = 7 days for an uncontaminated ACM surface. For measurements
under the coating, rapid changes occur even after R has become constant.
The slope of -0.5 is found at intermediate frequencies. Figure 29 also shows
an impedance spectrum for the bare surface whicih is dominated by the
capacitance of the mylar spacers.
The impedance spectra in Figs. 28 and 29 have been analyzed using the
model in Fig. 30 with the goal of obtaining an estimate of the corrosion rate
at the metal surface and the degree of delamination. A transmission linemodel 16 . 12 has been used to fit the data to
45C7509TC/bje

Rockwell InternationalScience Center
SC5222.FRS• ISC84 .17000
BLANK STEEL/STEEL3h
7 2h ACROSS COATING
74h, 146h
2 -0.C
Log w(iw in iad/s)
Fig. 29 As Fig. 28, but with NaCI pretreatment of the steel surface.
24h COATING
R R
i,'.
1466
3,,-- "",,-,"
•7•I•1I~~~ ~ ~ -1 0• 1 2= -3•,, '4 5 •% . %" • %%•• , -. • -. *• *t' *• •.J.=

Rockwell InternationalScience Center
SC5222.FR
ZJ= R + R + (6)
The polarization resistance R° of the delaminated area is given byp
0- R pCR (7
p 0d
and the effective volume of delamination Veff by
"Veff RCOL (8)
where Co is the specific capacitance (F/cm2 ) for the interface. Equation (8)
4 defines R which is essentially a resistance related to the ionic resistance
within the disbonded region. For the calculation of R and V thep ef
assumption is made that p equals the bulk resistance of the electrolyte
(20 Q0cm) and CO = 30 pF/cm2 . In Eq. (8), x is the thickness of the delami-
nated area, and f is the fraction of the steel plate of length L = 20.6.5 cm
which is delaminated. The values of Rp and Veff in Table 3 are strongly
affected by the surface pretreatment, with a lower Rp and a higher Veff for
the surface which had been exposed to NaCl before coating. The R0 values arep
miauch higher than those determined for corrosion of steel in bulk electrolytes
(< 103 !Dcm2). This suggests that the corrosivity of the electrolyte at the
coating/metal interface is lower. The 2ffective delaminated volume Veff isvery small perhaps because in these experiments much of the corrosion activity
was located along the steel plates, but did not overlap two adjacent plates
and contribute to the measured impedance. Figure 31 shows the appearance ofthe coated steel ACM after tcorr = 14 d for the untreated surface and for
tcorr = 7 d for NaCI pretreatment. For the former case, only a few areas
exist where the corrosion spots cover adjacent plates. In the latter case,
many more such areas have developed despite the shorter tcorr. The
explaiation may be that the assumed values for C0 and p might not be entirelyd0
correct and might contribute to some error in the calculated values of R° and* p
Veff.
47C7509TC/bje

_, _Rockwell InternationalScience Center
SC5222.FR
Table 3
Corrosion Resistance R° and EffectiveDelaminated Volume VPff for CoatedSteel ACMs Exposed Eo 0.5 N NaCl
Time (h) RO (C.cm 2 ) Veff (cm3 )
p
i, Clean Surface
24 2.7 x 15 9.0 x 10⁻⁹
168 6.9 x 10⁵ 9.3 x 10⁻⁸
336 1.1 x 10⁵ 3.1 x 10⁻⁶
II, NaCl Treated Surface
5 1.4 x 10⁵ 4.2 x 10⁻⁹
24 1.7 x 10⁵ 6.9 x 10" 9
72 1.4 x 10⁵ 1.5 x 10⁻⁶
146 1.5 x 10⁴ 3.8 x 10⁻⁶
investigations of the reactions at the metal/coating interface have
* also been carried out with epoxy coated segmented Cu/steel and Zn/steel
electrodes in order to obtain information concerning the role of electrode
"polarization on corrosion and delamination. In addition to the impedance, the
4<."'galvanic current flowing between the plates has been measured continuously as
an additional qualitative indication of the developing corrosion activity.
For Cu/steel corrosion and delamination occurred fairly soon as shown in Figs.
32 and 33. Initially the impedance measured between the Cu/steel plates is
strictly capacitive, kut already after two days deviations occur (Fig. 32b).
From measurements across the coat;ag, Fig. 32a, the deterioration of the coat-
ing becomes apparent after about one week and the impedance spectrum does not
follow any more the simple model in Fig. 2. After two weeks the frequencydependency for measurements under the coating has changed to a -0.5 dependence
as also observed for the steel/steel electrode (Figs. 28 and 29). The,impedance measured across the coating degraded further and showed a similar
48C7509TC/bje
* I
.4

Rockwell International01 Science Center
SC5222.FRSC31477
8TEE9JSrEEL/20 pm EPOXY COATINGt- 14 DAYS
8TFLJ8TIEUS 0 MU 9POXY COATINGNaCI PflETREATMENT
I1 t• -7 DAVS
Fig. 31 Photograph of coated steel/steel surface after (a) t 14 daysfor clean surface and (b) tcorr a 7 days for NaC pretreatment.
frequency dependance at the lowest frequencies as observed for measurements
between the plates (Fig. 33a). Figure 34 gives a summary for the measurements
with coated Cu/stee' alectrodes. As the pore resistance Rpo decreases by a
factor of 100 in an exposure period of two weeks, the effective delaminated
volume Veff increases by a factor of 1000 and the galvanic current I1 by about
the same amount. Veff and 1g show, in fact, a very similar time dependence.
- The corrosion potential Ecorr rises initially to values close to that of Cu,
but then drops sharply to values characteristic of corroding iron. The
corrosion resistace R0 first decreases and then increases again.p
For Zn/steel the time at which corrosion of the metal was first
detected was much longer. Figures 35-37 show selected examples of the impe-
dance spectra measured across the coating and between the plates. While the
impedance spectrum determined across the coating changes fairly rapidly to a
4 49"C7509TC/bje
* * ** . * . ~ j ** *..Z

i1 Rockwell InternationalScience Center
SC5222.FR
1441 33272
so
050
30-
02
logl •.
IL 4113WI3 334ll
.0 t
CU!STEtL... 20 0Ml EPOXY0
* P l ,o 460 1 IIACROS COATINGU,
60b)
30-
500
* 4-
63161hh
7. 7.
* 2 1 0 1 2 3 4
'3 4' 5
P~g.W 32 Boeplt fors coated1 Cusel spetr mesrdacoscaingEOX(i. 3(a)) a0 between plteLATES3(b)
pT
C7S09TC/bje
A 3h
* . , . . . ' . " " ". ' . - , ' . ' , '.1,
MIN77. -
'-731.7h
214

A L Rockwell InternationalScience Center
SC 5222 .FR
60#.346#
0 1
100
-(:2) Go
111thC75--jCIbI

- - •Rockwell International
"Science Center
SC5222.FR
-886-34581
Cu/STEEL - 20gAm EPOXY
100 - 3 -9 7
200- 100 -4-
300- 0 Ecorr - 5 -10 - 6
S400 1 '10 0" Veff & a
500 7 11 1O 0 5
600G- 1.€*-
700 t 9 -12 41 6
800 0.1 1 • I I , I I I I 1 10 .100 .200 300 400 500 600 700 800 900 1000
toorr(h)
Fig. 34 Time dependence of pore resistance R , polarization resistance R0
delaminated volume Veff, corrosion pbtentiali Ecorr and galvanic p
current I.
more or less constant value of 2 . 105 9 at frequencies below 100 Hz, a devia-
tion from strictly capacitive behavior occurs only after about 554 h. This
indicates that after this time some delamination has occurred although it is
% not possible yet to calculate the value of Veff. As can be seen in Fig. 38,
Veff and Rpo could be calculate only for times exceeding 900 h despite the fact
that fairly significant changes occurred in the spectra measured between the
plates (Fig. 37(b)). After about six weeks two time constant dominate these
spectra. The spectra recorded across the coating for steel/Zn are very simi-
lar to those obtained in other investigations for coated galvanized steel.
Ecorr dropped to the value measured for zinc after about 100 h.
52C7509TC/bJe
~A

Rockwell InternationalScience Cente(
SC5222.FR
90 1 1 1 40633271
45-
~30-
0!0.2 .1 0 1 2 3 4 5 6
I I I 32730 S T E E L i Z n - 2 0 u m E P O X Y 9 0 ,, -5
0 [.
'• : -- ROSS COATtNG
N~30ki i i• S•45-
t l • I
-- ( ) 1h30
23h
.1 0 1 a 3 A 5 ®(D
(a) ITIJLzn - 20 San ~xY
Z 6
,90T b 1 12hI
210 11a
Fig. 35 Bode-plots for coated Zn/steel, spectra measured across coating*1 (Fig. 35(a)) and between plates (Fig. 35(b)).
a 53C7509TC/bje

01% Rockwell InternationalScience Center
SC5222.FR
S1434644
•41
60I7
3j4e
* . . . . "I I
81Tfl1Zn - 20 Wm. OXY Se" 4sitACROn COATING to
301
(a) SITWUA1 PlA~ts
_ _ _ _
5444
m .i .�36 so .35bu forlonge"o ti
4il54
ii iii i~r•} tIIltlo Oc IbOe
!4 5!i • i • i 5• *
(D~~ ='•

i•i )Rockwell International
Science Center
SC5222.FR
90 a i i w ' '
030
0 )
S i a I I , I
STEEL/Zn- 2Oom EPOXY COATING so7- ACROSS COATING
445
S627h" 3- $)94 h
iLO (w Io..
I -____-______1_____3_______,_______________-- __________
.4 LOG Lmd/shn
i* *.
3- BIIEL/1B- 20~ EPOXY COATING
S015 N NACI
WoI&ibo/)
Fig. 37 As for Fig. 36, but for longer exposure-times.
".4 55C7509TC/bje
•. ,,- .. . . . . . . . . . . .I ... . . , . ... . `i ` • . . .* .` ** *% • •} . `•`•.e •`*.-•

oi% Rockwell InternationalScience Center
SC5222.FR
5085433858
500 STEEIJZn - 20 pm EPOXY
"600- 100.0 .5N NaC O Vff 4 --4
u 700-P
So 80- -:: .5 T
1000- - T0 -
1200- - -1 -- 7
0 100 200 300 400 500 600 700 800 900 1000t9o0, (h6
•Fig. 38 Time dependence of coating porosity R'4, polarization resistanceR 0delaminated volume Veff, corrosion potential Ecorr and galvanicRp0
L,3 U Icurrent Ig.
Visual observation of the Cu/steel surface tnrought the clear coating
showed rusting along part of the length of three of the steel plates, while
the Cu plates remained bright and shiny. The rest of the steel plates also
remained unattacked. Apparently the adhesion of the coating stayed good
enough in these areas and on the Cu plates to prevent corrosion. For the
Zn/steel assembly all steel plates were as bright and shiny at the end of the_= i test as after polishing. Two Zn plates had developed a corrosion layer which
covered one half of one plate, but did not spread to the neigbouring steel
plates. This suggests that delamination had not occurred to a significant
extent. On the other Zn plate corrosion was more localized over a short
length of the plate.
Important information can be obtained from the measurement of the
galvanic current Ig. After 3 or 4 days sharp spikes of Ig occurred accompanied
by a drop of Ecorr to values characterisitic of Zn. 19 then stayed more or
* less constant at very low values except for another series of spikes close to
5,6C750gTC/bje
a .•, 4 * ,"%t% 4,. a. . * * * .. r i.+ - .% *, , ,'•" '- , " . ," * ,' - .*.. .-"-"" ." "."*. ,." .." " + - "" - °""•"-"""• *" , * *-..+• ' *•-

V 1 Rockwell InternationalScience Center
SC5222.FR
300 h which are probably related to delamination and corrosion occurring for
some time. I, finally increases drastically in the last 300 h of exposure by
a factor of 1000. Again this increase of Ig parallels the drastic changes of
the impedance during this time period (Fig. 37b). While the coating delam-
inates and corrosion occurs, more current can flow between the plates.
A comparison of the results for Cu/steel (Fig. 34) and Zn/steel (Fig.
38) shows that the presence of the Zn plates provides cathodic protection.
The level of Ig = 100 nA is reached after about 500h for Cu/steel, but only
after 900 h for Zn/steel.
3.4.3 Effects of Surface Modification
The corrosion resistance of coated metals can be increased by surface
modification. For steel, phospating improves the adhesion of the polymer
coating. The phosphated surface itself is not more corrosion resistant than
the bare surface as was shown by a few simple immersion tests. For Al alloys
surface modification by anodizing or by conversion coating, which also improve
the corrosion resistance of the uncoated surface, increases the corrosionresistance of the metal/coating compound.
3.4.3.1 Phosphating of Steel
Zinc phosphate coatings were applied on 1010 steel surfaces which had
been cleaned according to the procedures in Table 1. A characteristic differ-
ence of the impedance spectra for phosphated and coated steel with different
surface pretreatments can be seen at longer exposure times when a Warburg-type
impedance occurs with either a slope of -1/2 or -1/4 in the Bode-plot and
corresponding maximum of the phase angle of 45* or 22.50. The former case is
illustrated In Fig. 39 for the alkaline derusting treatment, and the latter
case, which could correspond to Semi-infinite diffusion in pores, can be seen
in Fig. 40 for the surface which was degreased only before phosphating. A
slope of -1/4 was observed only for this sample and the polished sample. For
these two different types of impedance spectra, observation by SEM showed
pronounced differences in the crystal size of the phosphate. 3' 10
57C7509TC/bje

Rockwell InternationalScience Center
S.... SC5222 .FRSC81-14020
1010 STEELDEGREASED
2 hr ALKALINE DERUSTED-... . .* PHOSPHATE
,. te i::. o.*•
3 **
I.. . . . . " .. • - 4
.. . . .. "..'. ..... •.2It . " '*** I
46ht . **.
2 hr
hr I l I 0
0 I 2 3 4 5LOG w
Fig. 39 Bode-plots for phosphated and coated steel (D +AD).
SC81 -14017*nn .
so
220 ht 1010 STEEL' DEGREASED toi• + i - i to P H O S P H A T E ,
I ~ m i n m m + " . .P O L Y O U T A D I E N E ".
•~~o. 4.'I 5,,.
3 t 4N z. ... -2. -- 10
LOG
Fig. 40 Bod-plots for phosphated and coated steel (0) .
58C 1509 TC/b Ie
S,,-, • ".,

wI Rockwell InternationalScience Center
SC5222.FR
As discussed elsewhere, 5 the results for the phosphated and coated
steel can be explained by a generalized Warburg impedance in Model II (Fig. 2)in the form W =k(jw)l. When W behaves as a true diffusion impedance,
a = 0.5, and k =aZ , where a is the Warburg coefficient. The general case
for -1 < a < 0 can result from tangential penetration of electrolyte at the
- coating/metal interface or from heterogeneous penetration which gives rise to
a distribution of time constants. This argument is supported by the observa-
tion that a different frequency dependence was found for two different crystal
structures as discussed above.
3.4.3.2 Anodizing and Conversion Coating of Aluminum
The importance of a proper surface pretreatment can be illustrated bythe case where Al 2024 was pretreated either with a conversion coating (Alo-dine 1200) or anodized (sulfuric acid with dichromate seal) before application
of a 55 01} polyurethane coating which is used in airplane fuel tinks. The
m "impedance spectra obtained during exposure to aerated 0.5 N NaCl for the
-: pretreated and coateo Al samples appear in Figs. 41 and 42. The panel with a
corversion coating pretreatment develops a considerable amount of porosity of
the coating after one week of exposure, resulting in the development of two
time constants as can be scen from the appearance of two maxima in the phase
angle vs frequency curves of Fig. 41. The pore resistance Rpo for the H2SO4
anodized and coated panel, however, does not become sufficiently low for the
observation of the second time constant (Fig. 42). Figures 43 and 44 show the
changes of the pore resistance Rpo, the capacitance Cc and the corrosion
potential Fcorr as a function of exposure tine to 0.5 N NaCl. The much faster
decay of Rpo for the conversion-coated sample and the larger increase of Cc
*) for the conversion-coated sample are readily apparent. The corrosion poten-tial is increased markedly by the inodization treatment.
.5 59m 5

pIr Rockwell InternationalScience CenterSC64 26417
1DAY SC5222.FR1DY
8- A12024CONVERSION COATING
S1 WEEK POLYURETHANE COATING (55 mm)
7
0 6
N (a)
i- 5-
C,J0
4
3-
-2 -1 0 1 2 3 4 5
LOG w(w in rad/s)
I DAY
W60-| w.w
(b(
S30-
2 MONTHS
-5-2 -1 0 1 2 3 4S*- LOG w(w In rmdls)
Fig. 41 Bode plots for Al 2024, conversion coating with polyurethanecoating,
60C7509TC/bje

MI Rockwell International
Science Center9 !$C$4.26419
I DAY SC5222.FR
8 iWEEK .2So4 ANODIZED1 MPOLYURETHANE COATING (55 /nm)
7-
-' -z0 2 MONTHS
_z6-
N ( o)5-
4-
-3-
LOG w(w Irn rad/s)
90
'DA
60--
(b) 2 MONTHS
30-
I1 MONTH
-2 --1 0 1 2 3 4 5
LOG (lw in radia)
Fig. 42 Bode-plots for Al 2024, suluric acid anodized with polyurethanecoating.
*,K
4. 61C7509TC/bje
,.." .. .,';', .v." .i .:,i .:, " " " "'" " ".. . . . . . . . . . .. . . . . . . . . . . . . . . . . . . .".. . . . . . . ...... ... ". .

Rockwell InternationalScience Center
SC5222.FR& $GC4-2"17
11- 4.5, 1 ......
10 4.0 AI20241CONVERSION COATING/0.5N NaCI 0POLYURETHANE COATING (55 anm)
9- 3.5- R pO -- 100
4, 8- 3.0- oE0 -200
7 2.5 - 300 •
8 - 2.0- -400=_.
as 5- 1.5•- -500
4 1.0 -600
3- 0.56 -700
2 0 - 800
S1 0 10 20 30 40 50 60 70 80 90
t (days]
"Fig. 43 Time dependence of pore resistance R coating capacitance C andcorrosion potential Ecorr for coated"91 204 (conversion coating).
11 4.5 1 1 300
10 -4.0 -200
* lllI 8. 3.o .*RoA Cc
8r.- 3. 0- 0
6- 2.0-oo -2
6- 1.5- -- 300
4A20241H 2 SO4 ANOZE/0.N NaCI -400
POLYURETHANE COATING (56rm)
3- o0. - -500
0 10 20 30 40 s0 60 70 so 90t (days)
Fig. 44 Time dependence Rp01 CC and Ecorr for coated Al 2024 (sulfuric acid,* anodized).
"62C7509TC/bje

Rockwell InternationalScience Center
SC5222.FR
Table 4 shows that after exposure for one day, Rpo is nearly equal
for both pretreatments, exceeding 1010 QOcm2 . These high, nearly identical
values for 11o indicate that no differences exist between the specimens with
regard to the presence of initial defects. The specimen pretreated by con-
version coating clearly shows the greatest rate of degradation, as evidenced
by the greater drop in Rpo and Rp throughout the two-month test (Table 4).
After two months of exposure, the porosity of the conversion coated specimen,
as measured by 1/Rpo, is nearly 500 times greater than that for the H2SO4
anodized specimen, and the corrosion rate for the conversion coated Al 2024,
as estimated from 1/Rp is more than 35 times that for the anodized Al 2024.
Table 4
Pore Resistance and Polarization Resistance (in 9.cm2 ) forPolyurethane-Coated Al 2024 with Conversion Coating or
- Sulfuric Acid Anodizing Pretreatment
Pore Resistance R Polarization Resistance RConversion H 2984 Conversion H2SO4
Time Coated Anodized Coated Anodized
1 Day 1.4 x 10¹⁰ 1.2 x 10¹⁰ > o01 1 > 10o
1 Week 1.2 x 10⁷ 2.2 x 10⁹ 3.0 x 10⁸ > 1010
I Month 8.4 x 10⁵ 1.9 x 10⁸ 3.2 x 10⁷ > 109
I Month 1.2 x 10 5 5.2 x 10⁷ 1.6 x 10⁷ > 6 x 10⁷
Additional information can be obtained since Cc is proportional to
the dielectric constant, c, of the coating (Eq. (1)). The capacitance used in
Eq. (1) must be that of the polymer dielectric and must not include faradaic
or double layer components. This may be assured by using sufficiently thick
coatings or by evaluating Cc only from the region in the impedance spectrum
where Z a 4-i . Since c is very sensitive to the uptake of water, a number of
studies have used capacitance measurements to estimate the water uptake by
polymer coatings. Using the equation of Brasher and Kingsbury14
63C7509TC/bje

l Rockwell InternationalScience Center
SC5222 .FR
Cp(t)/Cp(0) = 8 0x (6)
where x = volume fraction of water, Leidheiser and Kendig 1 3 showed that for
sufficiently thick coatings, such that the measured capacitance at 1000 Hz
could be assured as being that of the coating dielectric, the calculated water
content compared well with that observed from gravimetric data. By measuring
the impedance for a coated metal over a sufficiently wide range, the
a'l-region, where the impedance is strictly capacitive, can be determined, and
therefore the polymer capacitance can be extracted with great confidence.
Sufficiently well resolved w'l-regions for the spectra in Figs. 41 and 42
appear above 104 rad/s (1.6 kHz). Cc was readily evaluated using a least
squares fit of the spectra from which the effective dielectric constants were
obtained (d = 55 gn, Area = 20 cm2 ). The volume fractions of water taken up
by the coatings between one day and one week are shown in Table 5 as calcu-
lated from Eq. (6). Equation (6) assumes a uniform distribution of water and
is valid only for low volume fractions. Nevertheless, clearly the polymer
film over the conversion coated surface shows a greater water uptake after one
week despite its initially lower capacitance.
Table 5
Effective Dielectric Constant and Water Uptake of the Coating
Dielectric Constant v/o Water IncreasePretreatment 1 Day 1 Week in 1 Week
Conversion Coating 8.7 19.3 18
Anodized H2S04 10.3 16.5 11
3.4.4 The Role of Pigments
Polymer coatings often contain corrosion inhibiting pigments forlowering the corrosion rate of the substrate. Pigments used for this purpose
can inhibit corrosion by a variety of mechanisms. Phosphates act as buffering
64C7509TC/bje

Rockwell International
Science Center
- ~SC5222 .FR
agents to limit the localized build-up of hydrogen ions formed by the local-
ized concentration and hydrolysis of anodic corrosion products. Chromates are
presumed to inhibit through the formation of a passive film on the surface of
the substrate where local defects in the coating occur. Zn dust may act by
galvanic protection or by enhancing the barrier properties of the coating due
to the growth of a voluminous ZnO which seals defects in the film. The
necessity of transporting the corrosion inhibiting pigment to the interface
has been discussed frequently.
In order to evaluate the role of different types of corrosion
inhibiting pigments and their transport to the metal surface, experiments
using the two types of specimens shown in Fig. 45 were performed. For the
specimen in Fig 45a, two - 13 tm layers of epoxy coating containing 50 v/o of
pigment are spin coated onto a polished and degreased steel substrate and
cured. For the specimen schematically shown in Fig. 45b, a 13 .m layer of
epoxy is first deposited and partially cured followed by a 13 Un layer of
pigment containing coating. For each pigment in Table 6 one of each of the
specimens in Fig. 45 were formed and then exposed to air saturated 0.5 M
NaCl. At intervals during the exposure the electrochemical impedance spectrum
of the exposed surface was collected. An evaluation of the extent of corro-
sion and delamination was also made following the criteria of ASTM D610. The
* A rating is based on a 10 point scale from 1 (50% coverage by corrosion or
delamination ) to 10 ( no corrosion or delamination).
Table 4 and Figs. 46a-i summarize the results for these experiments.
The duplex, unpigmented, 22 um thick epoxy coating (EX/EX) (Fig. 46a) shows
good protective properties and the corrosion rating, corr, does not drop below
a value of 4 (10% coverage by corrosion product) before 2000 h. The general-
ized pore resistance, RPO ,that describes paths of low resistance that short
the coating reaches a steady-state plateau value, Rpt, which is slightly below
. 1 megohm (2 107 S, cm2 ) (Fig. 46a and Table 7).
.4.
65C7509TC/bje
"1% e,\ *. ',4 A! " " I I , , '•'

Rockwell InternationalScience Center
- SC5222.FR
a b.
coating O . .atingsubstrate substrate
.. _i
Pigment containing layer
Epoxy only layer
Fig. 45 Schematic for the two types of pigment-containing coated specimens:(a) two layers of pigment containing polymer (duplex coating), (b)two-layer coating with the layer nearest to the substrate notcontaining pigment.
Table 6
Pigment Data
Density Specific DispersionMaterial gm/cm Resistance .Hegman Microns Source
0/cm
Sr Chromate 3.8 750-1000 5-6 38-25 Davis(SrChro)
Zn Phosphate 3.2 25000 7-8 6 Davis(ZnPhos)
Zn Ba Phosphate 3.6 N/A 7-8 6-8 Davis(ZnBaP)
Zn Dust 7.0 0.0000059 7-8 5 St. Joe
66C7509TC/bje
- ft -• - .444ft*''"\ " - "• "J", ",.' ," . • •, , * , ' ' ' ' 'w,- ,•..•",• .. .'' •v,

S..Rockwell InternationalScience Center
scwum SC5222.FR
10 Ex:Ex -C5008q - 400
2 a- , QECOrr -100
10• V• 10I ~ •Corr
8 odel S
(a) E PO
,- 66-V
4- 48
2- 0 2
0 I00 500 1000
t, h
12 • Cp T ,- 400
0 Zn Pto.:Zn Phos - 5000 p 4008• •- •0 Ecorr
-200
2 100
O*• . ..j
10.1tOdell
OC
* .~0 60 1000
Fig. 46 R C, corr del and Ecorr for steel with eooxy coatingscgoitaining: (a) layer 1-epoxy only (EX); layer 2-epoxy only"A (EX); (b) ZnPhos/ZnPhos; (c) EX/ZnPhos; (d) ZnBaP/ZnBaP; (e)
EX/ZnBaP; (f) SrChro/SrChro; (9) EX/SrChro; (h) EX/Zn and, (i)ZnZn.
C7509TC/bje
. ... . . . . . . . . .. . . . . . .

i •)i~Rockwell InternationalScience Center
SC5222.FR
12 600
10 Ex.Zn Phos 500
8 Cp 4006 -I300•
4 200,
2 1000 0
0
10 0 ¶ "106 Oort
Cc del
14 -400
-- •°•, 00 6o 0
__ -- L 0.
, 100 •0 001 6
-4200
II 300
0 0
d0 )0 00f0o dt
Fig. 46 (continued)
68C7509TC/bJe.,,Fg%6(cn~ud

WIN, Rockwell InternationalScience Center
SC5222.FR
_• 12 G"oo60
10-"• Ex:ZnB&Phtos 50
_ 0 - 2002 1 00 >
10 10* Corro del
,•(e) * 8•
4 S. 6
2
0 0_0 600 10
500'• 400E
-" 200
. .100
0S10 , 10
0f) o0 Cott
a -
FS
A po
SOO0 1000 1
_'Fig. 46 (continued)
69"C7509TC/bje
" ""

Rockwell InternationalScience Center
SC5222.FR14 700
12 - Ex:SrCr0 4 600
10 - 5 Cp 60o
a- a 400
0k 300
4 200
2 100
110 0
1041
(g) . . .
0
4 - 4
-I 2-I
2
0 B00 ¶000
¶6 100004 - Cp -700
12 0colt -600
0 .40,0t,:Zn 2-00
64 200. .00
0 0"'1" 0
(h) 0 - J
I0 GoOff0 t
4 42 2
%0 _ _ _ _ _ _ _ _ _ 0
4% 0 1O 000
4 . Fig. 46 (continued)
70C7509TC/bje
4'

pPIpr Rockwell InternationalScience Center
SC5222,FR
11000I •Znl.Zn -1000
-600
-800
I 7000-600
-400
m~ 10 1
, 4 4
.t.
2
0 'D
* at, Fig. 46 (continued).
.71
71C7509TClbje
..............................................

SHRockwell InternationalScience Center
SC5222.FR
Table 7
Summary of Pigment Data - Coating Properties,Corrosion Behavior and Pore Resistance
d Ecorr Ek ¶corr .del
Coat I Coat 2 (pn) pH Log Rpt trend (mV vs SCE) (h) (h) Corrk Cs/Co
EX EX 2? n. 5.8 v. -260 >2000 250 5.5 1.17
EX ZnPhos 30 4 6.1 i. -35 1500 300 5.0 1.14
ZnPhos ZnPhos 33 4 7.4 i. -50 1100 80 4.4 1.33
EX ZnBaP 27 4 6.8 i. -40 >2000 550 6.0 1.17
ZnBaP ZniaP 20 4 4.7 c. -200 570 >580 <4.0 1.55
EX SrChIro 24 7 8.2 v./i. -25 >1370 n.d 8.9 1.10
SrChro SrChro 27 7 2.5 d. n. 240 n.d. <4.0 n.d.
EX Zn 30 6.0 i./v. -300 720 n.d. 3.2 1.14
Zn Zn 10 1.0 1. -650 >1400 n.d. 7.0 n.d.
d: criting thicknessI.: generally increasing Ek: Fcorr at 1000 h
, c.: constantv,: varies r time to corr - 4 (10%)n.d.: not determined or not applicableZn: Zn dust %del- time to del a 4EX: epoxyZnPhos: Zn Phosphate Corr;: corr value at 1000 hZnBaP: Zn Barium phosphate Eccrr: corrosion potentialSrChro: Strontium ChromateN:t plateau value of the pore resistance(n Q for A - 20 Cm2)
For the case of thp duplex Zn phosphate containing coating (ZnPhos/
ZnPhos), the pigment causes poor adhesion whero in contact with the surface as
can be seen by tie rapid drop in the delamination rating, del, (Fig 46b), but
interacts with corrosion products to form a good barrier film as shown by the
relatively high values of Rpt. Better adhesion is produced when an epoxy
72C7509TC/bje
4

SRockwell InternationalScience Center
SC5222.FR
layer (EX/ZnPhos) separates the pigment porticn from the interface as can be
seen by a slower drop in del (Fig. 46(c)). Both ZnPhos/Zn/Phos and the
EX/ZnPhos coating show relatively high values of Rpt due to the barrier
enhancemne:t produced by the ZnPhos (see Table 7 and Figs. 46(b-c)).
A duplex zinc bariuni phosphate coating (ZnBaP/ZnBaP) shows poor
adhesion and poor corrosion resistance as can be seen by the rapid decrease in
corr, del and Rpo (Fig. 46d). However, the EX/ZnBaP system provides goodprotection as a result of the combined good adhesion afforded by the epoxy and
"good barrier property afforded by the pigment. In fact, the pore resistance
of the EX/ZnBaP increases with time probably due to interaction with corrosionproducts (Fig. 46e).
The slightly soluble SrChro pigment produces a very poor coating when
dispersed throughout the two layers. Rpo drops below 1000 o and corr de-
creases to values below 4 in less than 300 h of exposure (Fig. 46f). When the
soluble chromate is dispersed throughout the coating, the resulting poor
barrier properties due to pigment solubility and poor adhesion allow a corru-
sion rate which is too large to be countered by the slightly soluble chrom.
ate. As a result the chromate accelerates corrosion. When a good barrier andadhesion layer is provided by a first layer of pigment-free epoxy followed by
* a second layer containing the inhibiting chromate pigment, the most corrosion
resistant system of this series results (Fig. 46g). The pore resistance for
I this coating (EX/SrChro) remains above 108 0 for more than 1000 h of exposure
to 0.5 M NaCl (Fig.46g). This system combines the good adherence afforded bythe epoxy and sufficient chromate activity to entirely eliminate corrosion at
any initially present defects,
The results for the Zn pigmented coatings demonstrate the necessity
for the Zn to torm continuous paths to the substrate. For the EX/Zn systemwhere no initial contact of the Zn with the substrate is made, the pore
resistance, Rpo, remains near I Mohm throughout the 1000 h test and the
corrosion potential rises to values as high as -100 mV (Fig. 46h). However,
when the Zn contacts the substrate as in the case of the Zn/Zn specimen
* 73
C7509TC/bje
ft . . L. . .* . _ . . - • .. - , . . . " . . ,, , *. V, • . . • . .. ' . . • . . -' .'. • .. .... " .. . . * \.'X *,

Ala Rockwell InternationalVAN Science Center
SC5222.FR41
(Fig 46i), the effective "pore" resistance remains below 100 0 throughout the
test. For this case (Fig. 46i), Rpo is most likely due to the electronic
conductivity of the coating provided by the metallic Zn rather than due to
the presence of ionically conducting pores. Further evidence of the steel/Zn
contact in the case of the Zn/Zn coating appears in the corrosion potential*, which remains below -600 mV. The conductivity of the Zn particulates
expressed as 1/Rpo correlates inversely with the polarization resistance of
the particulates (see Fig. 46i). As observed by Szauer and Brandt, 2 2 the
increase in Rpo after 100 h coincides with an increase in Ecorr.
Additional evaluation of the role of Zn concentration was made by
forming epoxy coatings containing Zn dust at concentration levels of 10, 20,
30, and 50 wt. % in addition to the 90 wt. %. These specimens were evaluated
using electrochemical impedance spectroscopy after 1, 4 and 24 h exposure to
0.5 M NaCl. Figure 47 shows a Bode plot for 24 h exposure. The 10, 20 and
30 wt. % specimens appear as dielectric coatings with a pore resistances
greater than 105 Mm, while the 90 wt. % containing coating has an entirelydifferent spectrum. The high frequency resistance for the 90 wt. % specimen
of nearly 10 g represents the resistance of the coating and the low frequency
limit relates to the corrosion of the Zn particulates coupled to the steel.
The 50 wt. % material represents a transition between these extremes. A plot
of log Rpo vs time after 1, 4 and 24 h of exposure appears in Fig. 48, where a
dramatic decrease in Rpo occurs for concentrations of Zn above 30 wt. %. This
is also reflected in the mode of protection of the steel substrate by the Zn
as shown in Fig. 49 by the dependence of Ecorr on the wt. % of Zn. Above 30, wt. % Zn galvanic rp. tection by Zn occurs with a significant lowering of the
* potential to that of metallic Zn. However, below 50 wt. % Zn, Ecorr tendstoward more positive values which are typical for the other epoxy coatings
discussed above.
74C7509TC/bje

1i%• Rockwell InternationalScience Center
SC5222.FR
Zn Dust in Epoxg10%,20% Steel Substrate
6
4
- 2* ' . ... I I I , I , l I I
S0-O2 0 24
SLog w (w in rad/s)Fig. 47 Bode-plots for-epoxy coatings with varous wt. % of Zn dust on P + D
treated steel.
I hr"- 4hr
:6 -24 hr
a 4i • _Zn Dust in Epoxy
0 0 L I I I i I I t I
0 20 40 60 80 t0o
Weight 5 Zn
Fig. 48 Dependence of Rpo on wt. % of Zn in duplex epoxy coatings for steelsamples (P + 0) after 1, 4 and 24 h exposure to 0.5 M NaCI.
75C7509TC/bje

Sl Rockwell InternationalScience Center
SC5222.FR-200
- • • l hr-
W -400 o 24-27 hr
Zn in Epoxy on Steel> -600
I.% 2-800
-1000
-1200 i0 20 40 60 80 100
Wt. X Zn
Fig. 49 Dependence of E rr on wt fraction of Zn in the epoxy coating onsteel (P + D) aer 1 and 24 h exposure to 0.5 M NaCl.
The capacitance for all specimens typically increases rapidly to a
plateau value within the first several days (Fig. 46a-i) which suggests that
the water uptake of the coating is very rapid and reaches a steady-state value
at early times relative to the degradation of the coating. The ratio of the
steady-state capacitance, C., to the initial capacitance, Co, provides ameasure of the water uptake (Table 7). It is to be noted that the duplex
ZnPhos and ZnBaP pigmented coatings show the greatest water uptake as evi-
denced by the largest values of Cs/Co. The EX/Zn coating shows a very rapid
rise in capacitance. However, for longer times its capacitance steadily
decreases (Fig. 461).
These results demonstrate that pigments may act by different means(passivation of small defects in the case of the soluble chromates, enhanced
barrier behavior imparted to the film by the ZnBaP), but will only provide
protection as long as a good interfacial bond exists. The Zn containing%;oatings behave in a special way. The impedance shows that the ohmic resis-
tance between the Zn and the substrate increases with exposure to a corrosive
76C7509TC/bje

0 % _Rockwell InternationalScience Center
SC5222.FR
medium and correlates with galvanic protection as determined from Ecorr mea-
surements. The results of this work also show that Zn concentration must
exceed 50 wt. % for galvanic protection to occur at initial times, but
requires a larger concentration of Zn for longer term galvanic protection.
S.
77C7509TC/bje

Rockwell InternationalScience Center
SC5222.FR
4.0 SUMMARY AND CONCLUSIONS
This work shows that the lifetime of polymer coated steel depends on
a number of complex interrelated processes. The relationships between surface
preparation, physical and chemical properties of the coating, adhesion and
corrosion have been established and are summarized in Fig. 1. Severalimportant conclusions can be drawn from this work.
It has been shown that penetration of the coating by the environment
by itself will not cause failure of the coated metal. However, loss of adhe-
sion between the coating and the surface and cohesive failure of the coating
brought about by the corrosion reaction provide the major driving forces for
the propagation of failure. Clearly, efforts to design coating systems which
only minimize the transmission of corrosive electrolyte without attention to
the adhesive or cohesive properties will bring no significant benefits with
respect to corrosion protection. Surface preparation for optimum adhesion and
polymer strength provide perhaps more important factors for the longevity of
polymer coated metals exposed to adverse environments. Proper pretreatments
for steels as well as aluminum have been shown to have a significant influence
on the long term stability of polymer coatings.
The importance of adhesion in determining the corrosion rate has beendemonstrated most dramatically by the simultaneous observation of the measured
electrochemical impedance under the film and across the film. For coated
steel for which corrosion has initiated, ionic and mass transport underneath
the film represent the primary path for the charge transfer reaction to occur
as shown by the fact that the under-film impedance for this corroding surface
is several orders of magnitude less than the across-film impedance. The impe-
dance across the coating reflects the extent of the damage to the coating
caused by corrosion, but it does not characterize the ongoing corrosion
reaction once corrosion has initiated.
Two nondestructive methods have been shown to be useful for the
evaluation and prediction of the corrosion behavior of polymer coated metals.
78C7509TC/bJe

Rockwell International
Science Center
SC5222.FR
These methods include the use of a reflected acoustic pulse to detect the
early stages of adhesion loss, and the application of electrochemical impe-
* dance spectroscopy for the evaluation of the degradation of the polymer
coating. While the electrochemical impedance method has great sensitivity for
*1 the earliest stages of degradation of the coating by the corrosion process,
the reflected acoustic pulse has the ability to locate the regions of disbond-
ing of the polymer from the metallic surface and provides a useful nondestruc-
tive tool for evaluating the kinetics of corrosion induced adhesive failure.
:i
'1.,
V 79C75O9TC/bje

oil% Rockwell InternationalScience Center
4 SC5222.FR
5.0 RECOMMENDATIONS FOR FUTURE RESEARCH
1. Additional EIS-data should be collected for coated segmented elec-
trodes to obtain information concerning the reactions at the metal/
coating interface combined with measurements across the coating which
reveal the changes in the coating during the exposure to corrosive
environments. This novel approach to the evaluation of the corrosive
degradation of coated metals allows a complete analysis of the
changes of the metal/coating compound. In this program, only epoxy
coatings have been evaluated during continuous exposure to aqueous
* NaCl. Other types of coatings containing some of the pigments for
which increased corrosion protection has been observed need to be
studied. Other types of environments should be used in the study of
corrosive degradation such as humid air containing various pollutantssuch as S02, NOx and/or 03. This should be followed by exposure at
environmental test sites where the environmental parameters are
monitored. As corrosion sensors the new atmospheric corrosion rate
monitors (ACRM) and the data loggers for exposure studies (ACRMDL)
should be employed. Such an integrated approach for the evaluation
of coated metals under "real life" conditions is needed to provide
additional inputs to the lifetime prediction model developed in the
present project in laboratory conditions.
2. Stresses produced by growing corrosion products under the coating
have been shown to play a significant role in the degradation of
adhesion and cohesion of polymer coated steel. It is recommended
that the mechanism by which corrosion induced stresses are relieved
by cohesive or adhesive failure be investigated using acoustic
emission. Acoustic events from coated steel coupons exposed to NaCl
solution and pulled to failure have been explained by cohesive and
adhesive failure. Events produced in the absence of tensile exten-
sion from corroding or cathodically polarized coated steel should
80C7509TC/bje

Si L Rockwell InternationalScience Center
SC5222.FR
occur if reaction products induce cohesive or adhesive failure.
Accordingly, acoustic emission from polymer coated steel exposed to
various environmental conditions should be collected and analyzed as
a function of time of exposure, coating chemistry, and surface
preparation.
3. Adhesion appears to function as a major component in the mechanism of
protection of metals by polymer coatings. It is recommended that the
molecular steps involved in adhesion and corrosion itduced adhesion
I loss should be investigated. It should be possible to fom a mono-
layer of an epoxy coating on a steel surface by starting with avail-
able volatile epoxide and polyamide oligomers in an ultra high vacuum
apparatus equipped with Auger and X-ray photoelectron spectroscopic
capability, in addition to an attached electrochemical cell. Spec-
troscopic evaluation of a "monolayer'A or thin layer of a model
polymer interphase as a function of exposure to water, water vapor,
or cathodic and anodic electrochemical polarization, and surfac
pretreatment will give information on the type of adhesive bonding
and the mode of their attack by the corrosion processes. Previous
spectroscopic evaluation of the cathodic disbonding process has been
carried out by examining samples after various treatments in the
laboratory. 29g 3 0 Questions concerning the existence of chemical
changes occurring after the treatment at the disbonded interface have
been raised. 3 1 Experiments performed in a chamber 32 that allows easy
transfer from the electrochemical cell to the spectrometer vacuum
chamber will provide direct evaluation of the chemical changes of thepolymer/metal interface or interphase associated with the cathodic
disbonding process.
Recognizing that adhesion in the presence of water and dissolved ions
is critical to the stability of polymer coatings, the wetting forces
at a model three-phase metal/organic/water interface can be directly
81"C7509TC/bje

Rockwell InternationalScience Center
SC5222.FR
measured as a function of applied potential and electrolyte chemistry
"using the Wilhelmy plate method. 3 3' 34 It is recommended that these
experiments be performed using compour ds in the organic phase having
various organic functionality found in polymer coatings. Results
from these tests could aid in the design of adhesion promoters,
coatings or surface preparation techniques that resist corrosion
enhanced adhesion loss.
4. Quantitative in-situ, nondestructive evaluation of the rate of
cathodic disbonding about a defect should be performed as a function
of environment, potential, surface preparation or modification, and
polymer chemistry. Previously, cathodic disbonding has been studied
only by destructive analysis or qualitatively by visual inspection.
A need for a nondestructive in-situ method for detecting the disbond
front exists.3 5 The development of signal-enhancements for the
ultrasonic reflected pulse techniques in this laboratory now allowsin-situ nondestructive detection of the disbond front. This method
can therefore be used to quantitively and nondestructively follow thedisbonding as a function of time.
ACKNOWLEDGEMENT
The principal investigators gratefully acknowledge the help of their
colleagues in the various tasks. Mrs. Sue Tsai, Sam Jeanjaquet and Art Allenprepared the coatings and perfomed most of the electrochemical tests. Arvin
Arora collected and analyzed the acoustic emission data, Lloyd Ahlberg the
acoustic pulse data. A number of summer students, among them Sheryl Jeanja-
quet, Dan Cher and Daric Wong, provided support during the course of theproject. A successful conclusion of this program would not have been possible
without the enthusiastic support and helpful suggestions of the Project
Officer, Dr. Phillip Clarkin.
82C75O9TC/bje

S Rockw ell InternationalScience Center
SC5222.FR
6.0 REFERENCES
1. M. Kendig, F. Mansfeld and A. Arora, "Evaluation of Protective Coatingswith Acoustic Emission and Impedance Measurements," 9th Int. Congr. onMetallic Corrosion, Toronto, Canada (1984),Vol. 4-73
2. M. Kendig, S. Tsai and F. Mansfeld, "Influence of Surface Preparation ofSteel on Coating Performance and Cathodic Delamination," MaterialsPerformance 23, 37 (1984).
i 3. F. Mansfeld, J.B. Lumsden, S.L. Jeanjaquet and S. Tsai, "Evaluation ofSurface Pretreatment Methods for Application of Organic Coatings,"Corrosion Control by Organic Coatings, H. Leidheiser, ed., NACE (1980),p. 355.
4. F. Mansfeld, M. Kendig and S. Tsai, "Evaluation of Organic Coating/MetalSystems by AC Impedance Techniques," Proc. 8th Int. Congress on MetallicCorrosion, Mainz, West Germany (1981), p. 1014.
5. M. Kendig, F. Mansfeld and S. Tsai, "Determination of the Long-TermBehavior of Coated Steel with AC Impedance Measurements," Corr. Sci. 23,317 (1983)
6. F. Mansfeld and M. Kendig, "Electrochemical Impedance Tests for Protec-tive Coatings," ASTM STP 866, p. 122 (1985).
7. M.W. Kendig , A.T. Allen, S.L. Jeanjaquet and F. Mansfeld, "TheApplication of Impedance Spectroscopy to the Evaluation of CorrosionProtection by Inhibitors and Polymer Coatings," Paper No. 74 , NACE,Corrosion '85.
8. F. Mansfeld, M.W. Kendig and S. Tsai, "Evaluation of Corrosion Behaviorof Coated Metals with AC Impedance," Corrosion 38, 478 (1982).
9. F. Mansfeld and M.W. Kendig, "Electrochemical Impedance Spectroscopy ofProtective Coatings," Werkstoffe und Korrosion 36, 473 (1985).
10. F. Mansfeld and M.W. Kendig, "Evaluation of Protective Coatings with
Impedance Measurements," 9th Int. Cong. on Metallic Corrosion, Toronto,Canada,1984, Vol. 3-74.
11. F. Mansfeld and M.W. Kendig, "Electrochemical Impedance Spectroscopy ofPerfective Coatings," Proc. Symp. "Electrochemical Techniques inCorrosion Research," Toulouse, France, July 1985.
1'
83C7509TC/bje

Oil% Rockwell InternationalScience Center
SC5222 .FR
12. F. Mansfeld, S.L. Jeanjaquet and M.W. Kendig, "An ElectrochemicalImpedance Spectroscopy Study of Reactions at the Metal/CoatingInterface," submitted to Corr. Sci.
13. M. Kendig and H. Leidheiser Jr., J. Electrochem. Soc., 123, 982 (1976).
14. D.M. Brasher and A.H. Kingsbury, J.Appl. Chem 4, 62 (1954).
15. R.E. Touhsaent, and H. Leidheiser, Jr., Corrosion 28,435 (1972).
16. J. E. 0. Mayne, Brit. Corr. J., 5,106 (1970).
17. M. Kendig, A.T. Allen and F. Mansfeld, "Optimized Collection and Analysis, of Impedance Data," J. Electrochem. Soc. 131, 935 (1984).
18. M. Kendig, E.M. Meyer, G. Lindberg and F. Mansfeld, Corr. Sci. 23, 1007(1983).
* i19. H. Isaacs and M. Kendig, Corrosion 36(6), 269 (1980).
20. J. Standish and H. Leidheiser, Jr. Corosion 36(8), 390 (1980).
21. T. Rugeri and T. Beck, "Application of Electrochemical EngineeringMethods and Theory to Solving Corrosion and Adhesion Problems with
"* Organic Coatings," Interim Summary, Contract No. N62299-82-C-0281, Naval*• Air Development Center, Warminster, PA, Report No. NADC-84107-60 (1984),
and references therein.
S22. H. Hansmann, Ind. Eng. Chem. Prod. R&D, 24, 252 (1985).
*23. M.S. Balera, T.A. Strivers and D.E.A. Williams-Wynn, J. Oil and ColourChemists Assoc. (5), 133 (1984).
24. M.S. Balera, T.A. Strivers and D.E.A. Williams-Wynn, ibid, 143 (1984).
25. H. Hansmann, H.G. Mosle, Adhesion 28, 18-21 and 24-26 (1982).
5 26. J.S. Rooun and R.d. Rawlings, J. Mater. Sci. 17, 1745 (1982).
. 27. H.G. Mosle, B. Wellenkotter, Z. Werkstofftech. 9, 265 (1978).
28. T. Szauer and A. Brandt,JOCCA, 1981(l), 13(1981).
29, J.E. Castle and J.F. Watts, I&EC Product R&D, 24, 361 (1985).
30. R.A. Dickie, in "Adhesion Aspects of Pclymeric CoatIngs,u 339-343, K.L.
* Mittal, ed., Plenum, New York (1983).
84C7509TC/bje

Rockwell InternationalScience Center
SC5222.FR
31. H. Leidheiser, W. Wang and L. Igtoft, Prog. Org. Coatings, 1_1, 19 (1983).
32. J. Lumsden and P. Stocker, J. Electrochem. Soc. (to be published),
33. M. Kendig and T.A. Fadner, Ind. and Eng. Chem. Fundamentals 24, 50(1985).
34. R. Bendure, J. Colloid. & Interfacial Sci. 42, 137 (1973).
35. J.S. Thornton, R.E. Montgomery, J.F. Curtier, "Failure Rate Model forlCathodic Delamination of Protective Coatings," Texas Research Institute,NRL Memorandum Report 5584, Contract No. N00014-83-C-2258 (1985).
* mR
* 4r
85C7509TC/bje

O Rockwell Irterrm oruilScience C•,ftir
SC5222.FR
7.0 APPENDIX"I
Definitions and Symbols:
ACM atmospheric corrosion monitor
ACRM =atmospheric corrosion rate monitor
Ad =delaminated area
AD - alkaline derusting
AE = acoustic emission
Cd = double layer capacitance
Cc coating capacitance
corr corrosion rating (ASTM D510)
d coating thickness
del delamination rating (ASTM D510)
* Ecorr * corrosion potential
id a delamination efficiency - Q/Ad
EIS electrochemical impedance spectroscopy
C £ relative dielectric constant
SCO = dielectric 4onstant of free space:2 8.85 (10)" F/c
Ex =epoxy
F fourier transform operator
F"- = inverse fourier transform operator
f 42wHA hot alkaline pretreatment
HN0 3 nitric acid pretreatment
86C7S09TC/bje
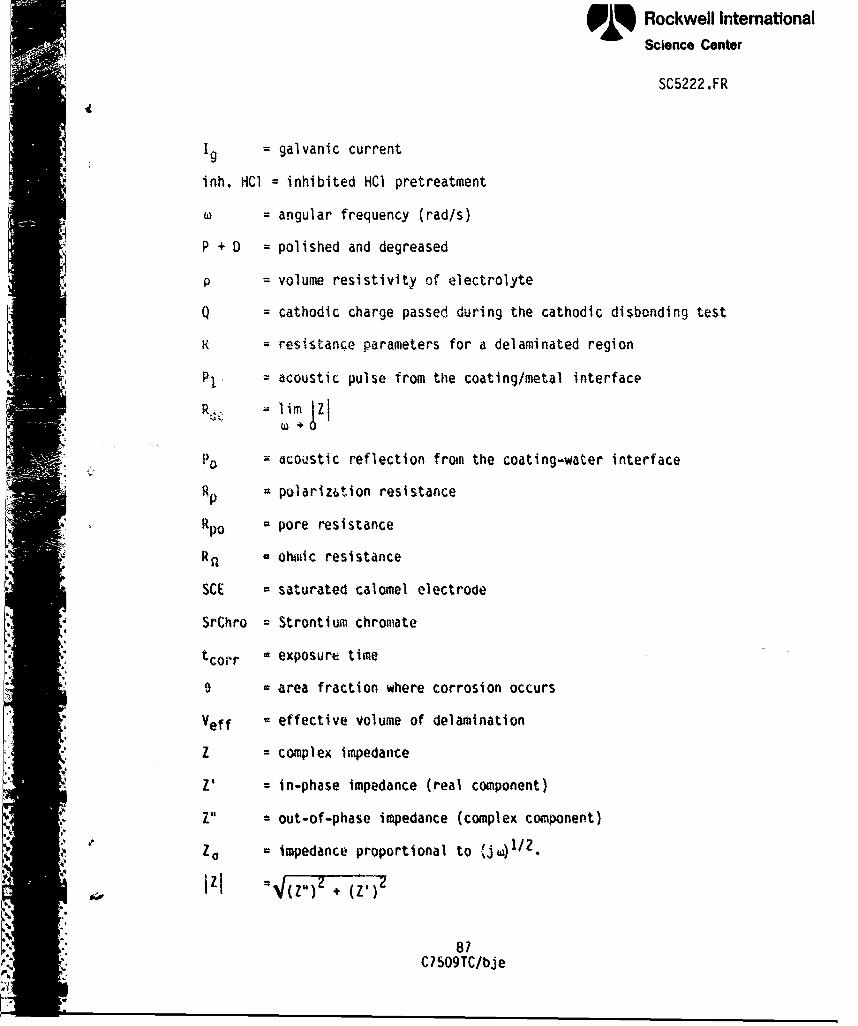
% Rockwell InternationalScience Center
SC5222.FR
Ig = galvanic current
inh. HCM inhibited HCl pretreatment
W• = angular frequency (rad/s)
P + D = polished and degreased
p = volume resistivity of electrolyte
Q = cathodic charge passed during the cathodic disbonding test
R = resistance parameters for a delaminated region
P1. acoustic pulse from the coating/metal interfacp
R a lira Zý
1) = dcoustic reflection from the coating-water interfaceR P polarization resistanceRp
Rpo pore resistance
SRa - ohtic resistance
SCE -saturated calomel electrode
SrChro = Strontium chromate
tco;,r = exposure time
) =area fraction where corrosion occurs
Veff = effective volume of delamination
Z = complex impedance
Z' = in-phase impedance (real component)
Z" out-of-phase impedance (complex component)
Zo impedance proportional to !jw)1/2.
81C7509TC/bje
(

-i% Rockwell InternationalScience Center
SC5222.FR
Z: = interfacial impedance
ZnPhos = Zn phosphate pigment
ZnBaP = Zn barium phosphate
-8I
'44'
A-i
,!O9C/j