Synthesis of polylactide with varying molecular weight ... - CORE
115
Synthesis of Polylactide with Varying Molecular Weight and Aliphatic Content: Effect on Moisture Sorption A Thesis Submitted to the Faculty of Drexel University By Vishesh M. Singh in partial fulfillment of the requirements for the degree of Master of Science in Chemical Engineering September 2008 brought to you by CORE View metadata, citation and similar papers at core.ac.uk provided by Drexel Libraries E-Repository and Archives
-
Upload
khangminh22 -
Category
Documents
-
view
5 -
download
0
Transcript of Synthesis of polylactide with varying molecular weight ... - CORE
Synthesis of Polylactide with Varying Molecular Weight and Aliphatic Content:
Effect on Moisture Sorption
A Thesis
Submitted to the Faculty
of
Drexel University
By
Vishesh M. Singh
in partial fulfillment of the
requirements for the degree
of
Master of Science in Chemical Engineering
September 2008
brought to you by COREView metadata, citation and similar papers at core.ac.uk
provided by Drexel Libraries E-Repository and Archives

ii

iii
Dedications
To my family
iv
Acknowledgements
I would like to express my gratitude to all those who encouraged me and made
it possible for me to complete this thesis.
First and foremost, I would like to thank my advisor, Dr. Richard A.
Cairncross for his support, guidance, and patience throughout my research. Under his
guidance, I was presented with many learning opportunities which I am grateful for.
I owe my sincere thanks to my co-advisor Dr. Giuseppe R. Palmese for his
valuable insight, continues guidance, and encouragement during the past two years. I
am also grateful to my committee member, Dr. Christopher Li, for his constructive
critique which helped me in tying all the loose ends.
This thesis would not have been possible without the help of my colleagues in
the Chemical Engineering Department. I thank Mr. Mohamed Aflal, Dr. Xing Geng,
Mr. Joshua Meisner, Ms. Mary Sullivan, Ms. Amutha Jeyarajasingam and Ms.
Jacquelin Yim for helping with various instruments and techniques. Thank you for
sharing your knowledge and skills. I extend a special thanks to Dr. Feng Jing, from
the University of Minnesota for providing support and facilitation.
I would like to thank my friends for their words of encouragement and
company during the moments of respite. Ms. Shruti Gour, Mr. Sreeram Vissapragada,
Mr. Kevin McPeak, Mr. Harsh Sharma, Ms. Ranjita Bose, Ms. Eleanor Small, Mr.
Harsha Kothapalli, and Mr. Sen Xu, I thank you.

v
I am grateful to my family for being understanding and supportive through
these years and to them, I dedicate my thesis.
vi
Table of Contents
List of Tables................................................................................................................x
List of Figures .............................................................................................................xi
Abstract .....................................................................................................................xiv
1 Introduction………………………………………………………………………...1
1.1 Motivation…………………………………………………………………...…….1
1.2 Bio-Based and Biodegradable Polymers…………………...……………………..2
1.3 Introduction to PLA………………………………………………………...……..3
1.3.1 Advantages/Disadvantages of PLA……………………………...…………..5
1.3.2 Architecture, Characteristics and Properties of PLA………………………...5
1.4 Previous Studies and Research Objective…………………………………………9
1.5 Direct and Indirect Outcomes of Thesis …………………….…………………..12
2 Background……………………………………………………………………….14
2.1 Synthesis of PLA………………………………………………………………...14
2.1.1 Polycondensation………………………………………………………......14
2.1.2 Ring Opening Polymerization………………………………………….......14
2.2 Copolymers of PLA………………………………………………………….......18
2.3 Composites…………………………………….…………………………………19
3 Experimental Procedures: Synthesis of PLA………………………………...…21
3.1 Introduction………………………………………………………………………21
vii
3.2 Experiment………………………………………………………………….........21
3.2.1 Overview of Synthesis Technique………………………………………….21
3.2.2 Recrystallizationof L-lactide …………………...…………………………..22
3.2.3 Glove Box…………………………………………………………………..22
3.2.4 Synthesis of PLA…………………………………………………………...24
3.2.5 Reaction Mechanism………………………………………………………..27
3.3 Materials…………………………………………………………………………28
3.4 Characterization Techniques……………………………………………………..29
3.4.1 Gel Permeation Chromatography (GPC)………….…………………….....29
3.4.2 Differential Scanning Calorimeter (DSC)……………………………........30
3.4.3 Hydrogen Nuclear Magnetic Resonance (1H NMR)………………………30
4 Review of Moisture Permeation…………………………….…………………...31
4.1 Diffusion Models………………………………………………………………...31
4.2 Techniques of Determining Mass Uptake………………………………………..33
4.3 Moisture Transport in PLA………………………………………………………34
5 Experimental Procedures: Moisture Sorption in PLA………………………....37
5.1 Introduction……………………………………………………………………....37
5.2 Sample Preparation………………………………………………………………37
5.2.1 Sample Solution……………………………………………………………37
5.2.2 Quartz Crystal……………………………………………………………...38
5.2.3 Crystal Coating…………………………………………………………….39
5.2.4 Crystal Drying……………………………………………………………...41
viii
5.3.5 Summary for Successful Coating……………………………………...…...42
5.3 Film Thickness and Mass Measurements………………………………………..42
5.4 Instruments Used………………………………………………………………...43
5.4.1 Spin Coater………………………………………………………………...43
5.4.2 QCM……………………………………………………………………….44
5.5 Experiment Setup………………………………………………………………...46
5.5.1 Schematics of Experiment…………………………………………………46
5.5.2 Gas Humidifier……………………………………………………………..48
6 Results and Discussion: Synthesis Experiments…………………………...…...50
6.1 Overview of Synthesis Experiments …………………………………………….50
6.2 Controlling Molecular Weight and GPC Analysis…………...………………….52
6.3 1H NMR Analysis………………………………………………………………..55
6.4 DSC Analysis…………………………………………………………………….59
7 Results and Discussion: Sorption Experiments…………………………………62
7.1 Overview of Sorption Experiments………………………………………….......62
7.2 Analysis / Discussion…………………………………………………………….64
7.2.1 Summary of Sorption Result………………………………………………..64
7.2.2 Comparison of P4K, P6K, P10K…………………………………………...69
7.2.3 Comparison of P10K, D10K, and B10K; P6K and D6K…………………...70
7.2.4 Comparison of Aromatic End Group with Aliphatic End Group..……...….72
7.2.5 Analysis of B4K & P4K…………………………………...…………….....72
ix
8 Conclusions………………………………………………………………………..74
Appendix A: GPC Analysis Graphs……………...………………………………....78
Appendix B: 1H NMR Plots…………..…………………………………………….85
Appendix C: WVP (Water Vapor Pressure) Vs Time Plots………………………...88
Appendix D: Graphs of Sorption Isotherms………………………………..……….91
References…...…………………………………………………………….………...96
x
List of Tables
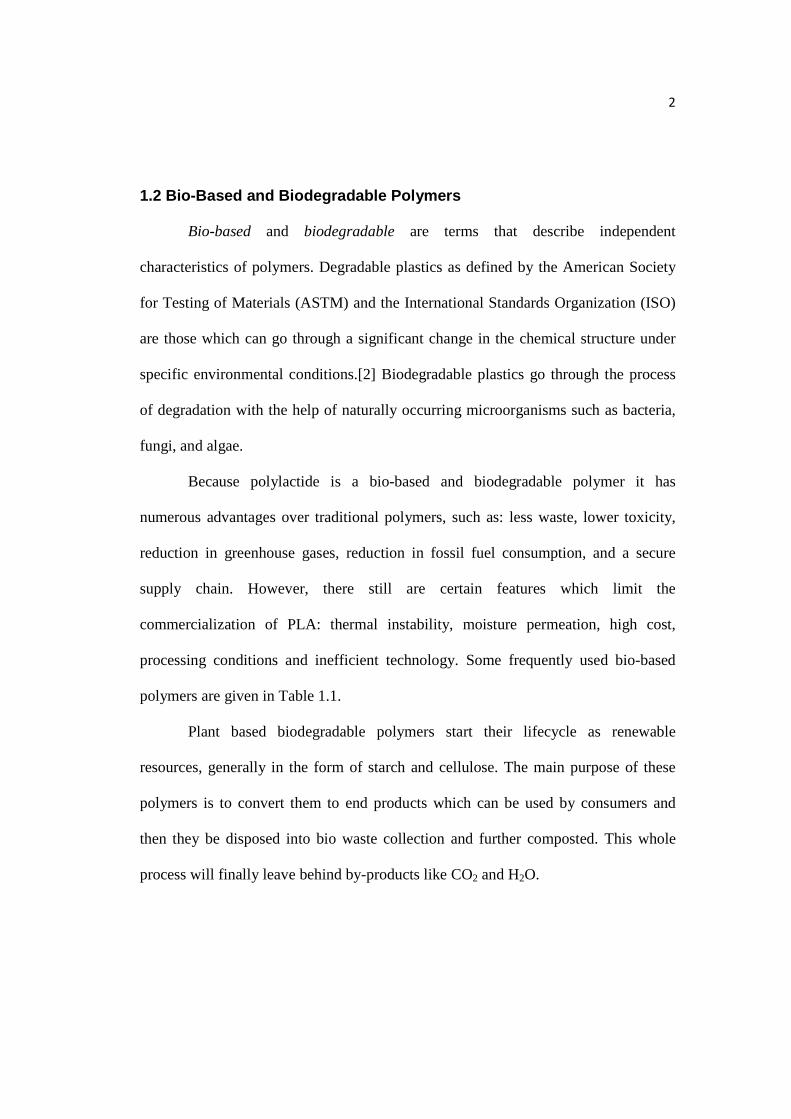
Table 1.1: Structure of widespread bio-based polymers……………………………...3
Table 6.1: Experimental overview: Synthesis of PLA………………………………50
Table 6.2: GPC analysis of PLA synthesized…………………………………...…..53
Table 6.3: Molecular weight by 1H NMR analysis……………………………..…...56
Table 6.4: DSC analysis of PLA synthesized………………………………….…....60
Table 7.1: Samples and thickness of films prepared……………………...…………63
Table 8.1: Summary of all the experiments…………………………………………77
xi
List of Figures
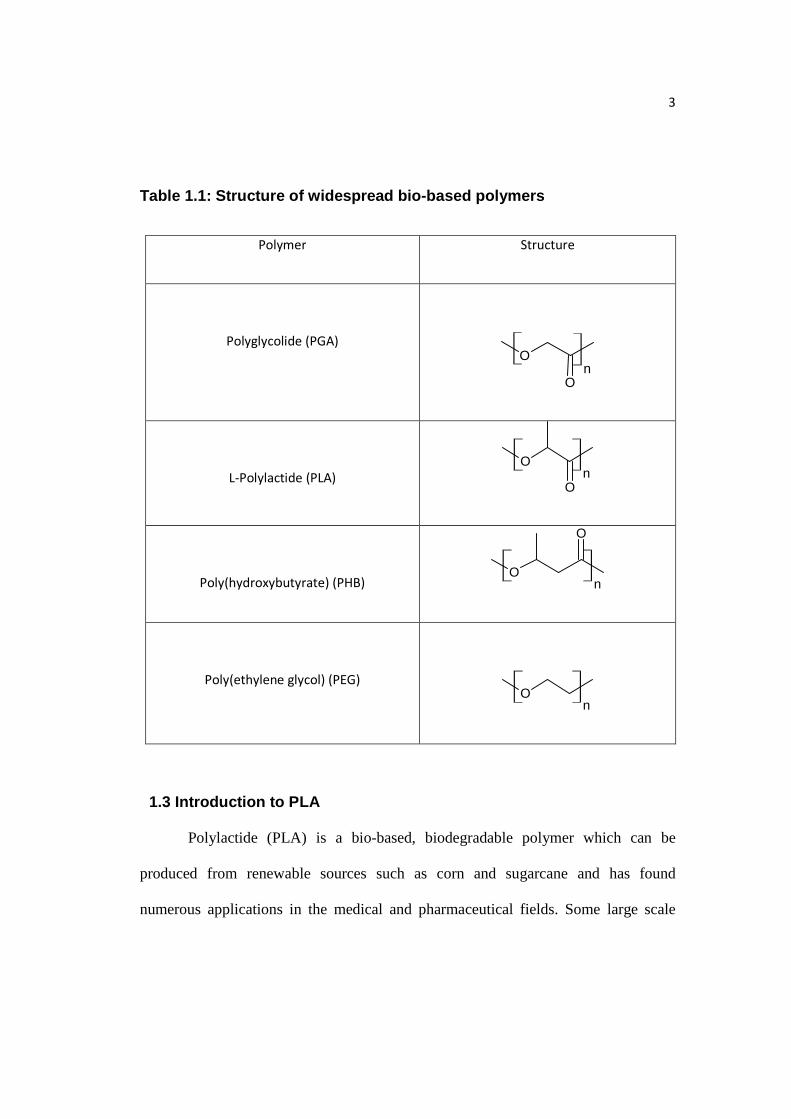
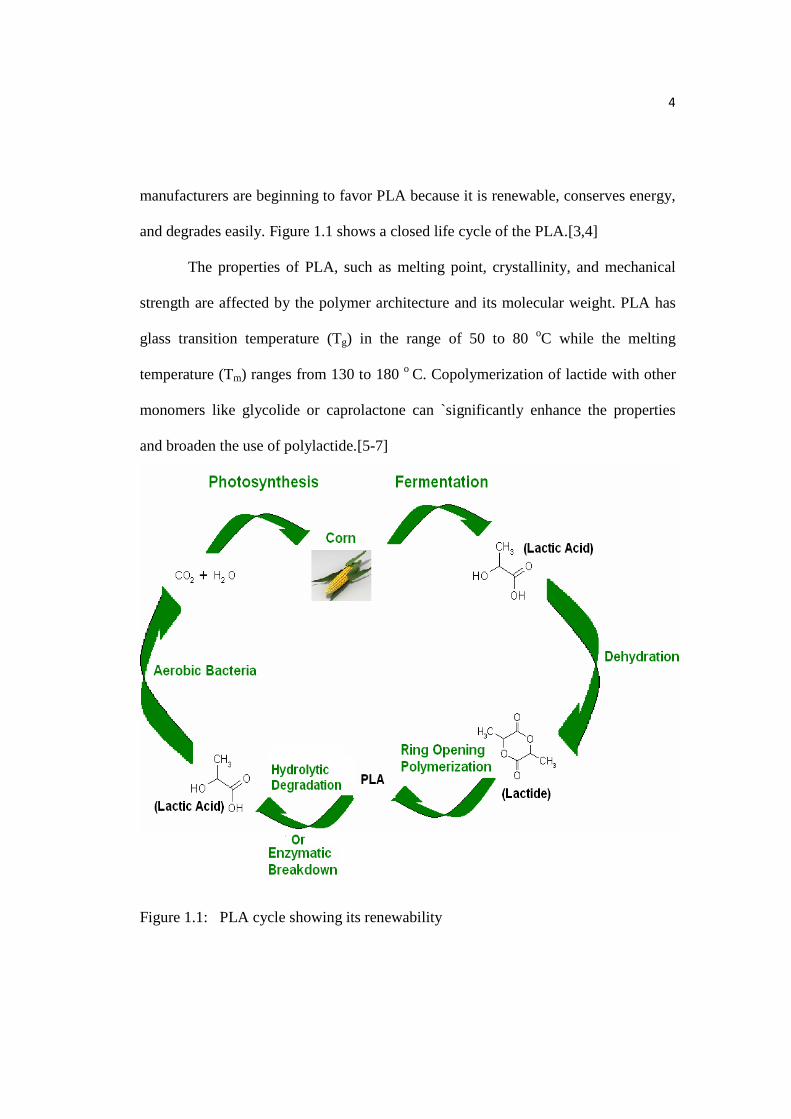
Figure 1.1: PLA cycle showing its renewability………………...……………….…...4
Figure 1.2: Architecture of PLA based on its chirality………………...……………..6
Figure 1.3: Metastable states of high molecular weight semicrystalline polylactide...9
Figure 1.4: Buckling of commercial PLA water bottle……………………………..10
Figure 1.5: Mass loss for PLA water bottle stored at ambient conditions…………..11
Figure 2.1: Polycondensation reaction of lactic acid to give polylactic acid……….14
Figure 2.2: Anionic ROP mechanism for PLA…………...………………………....15
Figure 2.3: Generalized coordination–insertion mechanism of lactide to PLA…….17
Figure 3.1: Setup of Glove Box……………………………………………………..24
Figure 3.2: Schematic of synthesis of PLA………………………………………....26
Figure 3.3: Reaction mechanism of synthesization of PLA with palmityl alcohol…27
Figure 3.4: Chemical structure of the material used…………………………..……29
Figure 5.1: Schematic of experimental set-up………….………………………...…46
Figure 5.2: Humidifier showing Nafion tube immersed in water…………………...49
Figure 6.1: Plot of Table 6.2 ……………….……………...………..………………54
Figure 6.2: 1H NMR analysis of P10K……………………………………...………57
Figure 6.3: 1H NMR spectrum of crude sample showing ratio of lactide and PLA...58
Figure 6.4: The glass transition temperature versus reciprocal N…………………..61
Figure 7.1: Sorption isotherm of P10K and P6K…………………….……………...65
xii
Figure 7.2: Sorption isotherm of P4K………….…………….……………………..65
Figure 7.3: Sorption isotherms of all samples……………………………………....66
Figure 7.4: Summary of slope of sorption isotherm Result………………………....68
Figure 7.5: Comparison of slopes of sorption isotherms of P4K, P6K, & P10K…...69
Figure 7.6: Comparison of slopes of sorption isotherms of P10K, D10K, & B10K..71
Figure 7.7: Comparison of slopes of sorption isotherms of D6K and P6K…………71
Figure A.1: Molecular weight distribution of P3K……………………………….....78
Figure A.2: Molecular weight distribution of P4K……………………………….....78
Figure A.3: Molecular weight distribution of P6K……………………………...…..79
Figure A.4: Molecular weight distribution of P10K……………………………...…79
Figure A.5: Molecular weight distribution of P20K…………………………...……80
Figure A.6: Molecular weight distribution of P21K…………………………...……80
Figure A.7: Molecular weight distribution of D6K……………………………...….81
Figure A.8: Molecular weight distribution of D10K…………………………..……81
Figure A.9: Molecular weight distribution of B4K……………………………...….82
Figure A.10: Molecular weight distribution of B10K……………………………....82
Figure A.11: Molecular weight distribution of Ф6K………………………………..83
Figure A.12: Molecular weight distribution of Ф10K……………………………....83
Figure A.13: Molecular weight distribution of Ф20K………………………...…….84
Figure A.14: GPC calibration curve……………………………...…………………84
Figure B.1: 1H NMR analysis of D10K……………...……………………………...85
xiii
Figure B.2: 1H NMR analysis of B10K…………………………...…….…………..86
Figure B.3: 1H NMR analysis of Ф10K…………………………...……………..….87
Figure C.1: Sorption cycle B10K, equilibrating in 2 hours………...………….……88
Figure C.2: Desorption cycle of B10K, equilibrating in 2 hours…..…………….….88
Figure C.3: Sorption cycle D6K, equilibrating in 2 hours………………...…….…..89
Figure C.4: Desorption cycle D6K, equilibrating in 2 hours………...……………...89
Figure C.5: Sorption cycle P4K, equilibrating in 2 hours……………………..……90
Figure C.6: Desorption cycle P4K, equilibrating in 2 hours…………………..……90
Figure D.1: Sorption isotherm of P6K…………,,,……………………………….....91
Figure D.2: Sorption isotherm of P10K………………………………...…………...91
Figure D.3: Sorption isotherm of D6K……………………………...………………92
Figure D.4: Sorption isotherm of D10K………………………………………...…..92
Figure D.5: Sorption isotherm of B4K…………………………………...…………93
Figure D.6: Sorption isotherm of B10K………………………………...…………..93
Figure D.7: Sorption isotherm of Ф6K………………...……………………………94
Figure D.8: Sorption isotherm of Ф10K………………………………………….....94
Figure D.9: Sorption isotherm of Ф20K………………………………………....….95
xiv
Abstract
Synthesis of Polylactide with Varying Molecular Weight and Aliphatic Content: Effect on Moisture Sorption
Vishesh M. Singh Advisor: Dr. Richard A. Cairncross
Dr. Giuseppe R. Palmese
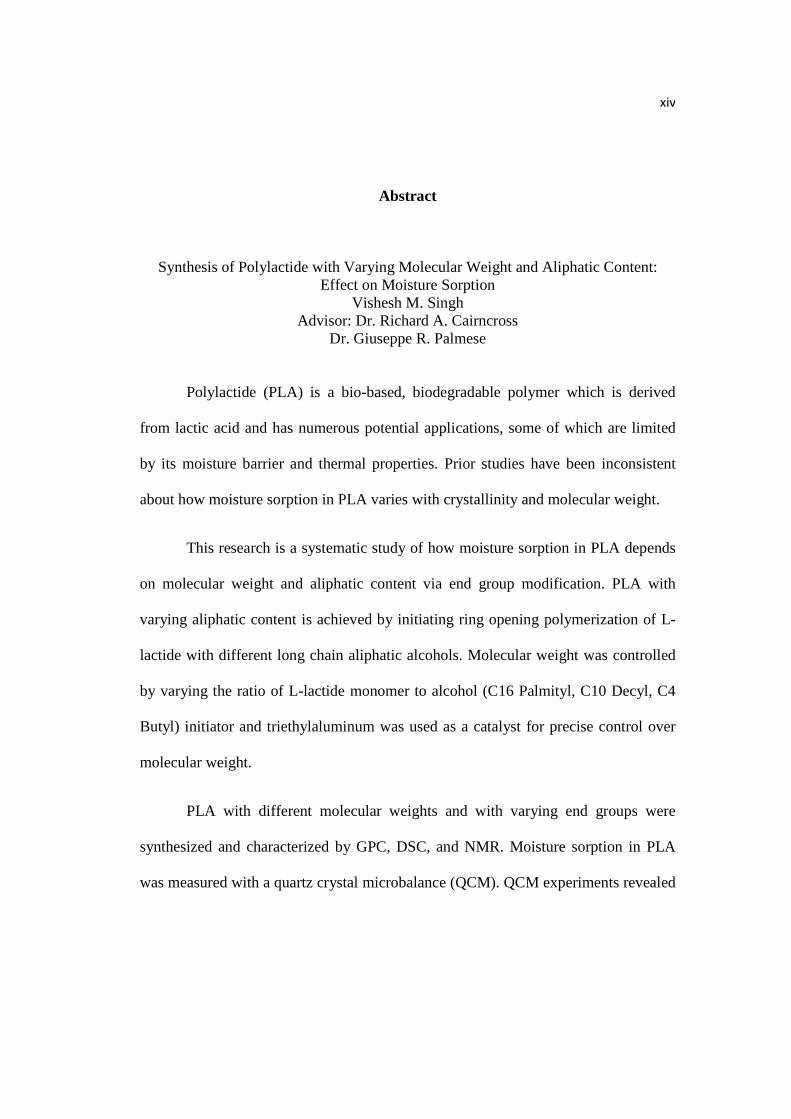
Polylactide (PLA) is a bio-based, biodegradable polymer which is derived
from lactic acid and has numerous potential applications, some of which are limited
by its moisture barrier and thermal properties. Prior studies have been inconsistent
about how moisture sorption in PLA varies with crystallinity and molecular weight.
This research is a systematic study of how moisture sorption in PLA depends
on molecular weight and aliphatic content via end group modification. PLA with
varying aliphatic content is achieved by initiating ring opening polymerization of L-
lactide with different long chain aliphatic alcohols. Molecular weight was controlled
by varying the ratio of L-lactide monomer to alcohol (C16 Palmityl, C10 Decyl, C4
Butyl) initiator and triethylaluminum was used as a catalyst for precise control over
molecular weight.
PLA with different molecular weights and with varying end groups were
synthesized and characterized by GPC, DSC, and NMR. Moisture sorption in PLA
was measured with a quartz crystal microbalance (QCM). QCM experiments revealed

xv
that both molecular weight and aliphatic content contribute to sorption properties of
PLA.
1
1 Introduction
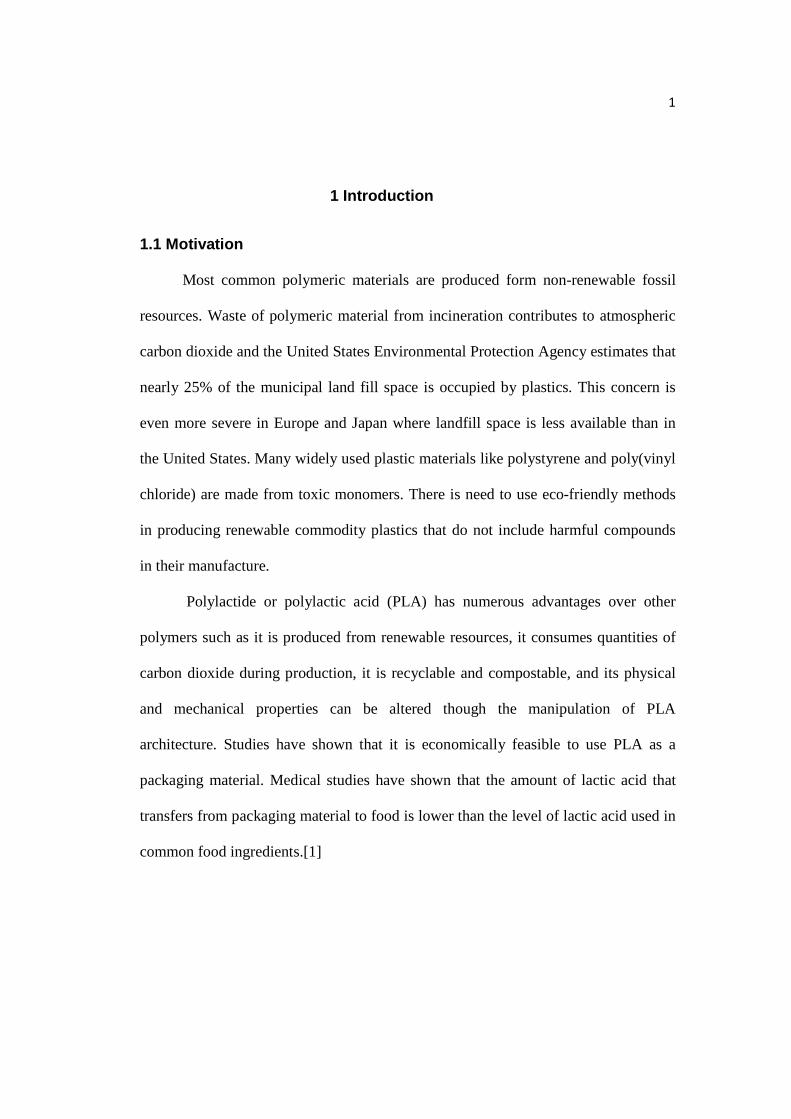
1.1 Motivation
Most common polymeric materials are produced form non-renewable fossil
resources. Waste of polymeric material from incineration contributes to atmospheric
carbon dioxide and the United States Environmental Protection Agency estimates that
nearly 25% of the municipal land fill space is occupied by plastics. This concern is
even more severe in Europe and Japan where landfill space is less available than in
the United States. Many widely used plastic materials like polystyrene and poly(vinyl
chloride) are made from toxic monomers. There is need to use eco-friendly methods
in producing renewable commodity plastics that do not include harmful compounds
in their manufacture.
Polylactide or polylactic acid (PLA) has numerous advantages over other
polymers such as it is produced from renewable resources, it consumes quantities of
carbon dioxide during production, it is recyclable and compostable, and its physical
and mechanical properties can be altered though the manipulation of PLA
architecture. Studies have shown that it is economically feasible to use PLA as a
packaging material. Medical studies have shown that the amount of lactic acid that
transfers from packaging material to food is lower than the level of lactic acid used in
common food ingredients.[1]
2
1.2 Bio-Based and Biodegradable Polymers
Bio-based and biodegradable are terms that describe independent
characteristics of polymers. Degradable plastics as defined by the American Society
for Testing of Materials (ASTM) and the International Standards Organization (ISO)
are those which can go through a significant change in the chemical structure under
specific environmental conditions.[2] Biodegradable plastics go through the process
of degradation with the help of naturally occurring microorganisms such as bacteria,
fungi, and algae.
Because polylactide is a bio-based and biodegradable polymer it has
numerous advantages over traditional polymers, such as: less waste, lower toxicity,
reduction in greenhouse gases, reduction in fossil fuel consumption, and a secure
supply chain. However, there still are certain features which limit the
commercialization of PLA: thermal instability, moisture permeation, high cost,
processing conditions and inefficient technology. Some frequently used bio-based
polymers are given in Table 1.1.
Plant based biodegradable polymers start their lifecycle as renewable
resources, generally in the form of starch and cellulose. The main purpose of these
polymers is to convert them to end products which can be used by consumers and
then they be disposed into bio waste collection and further composted. This whole
process will finally leave behind by-products like CO2 and H2O.
3
Table 1.1: Structure of widespread bio-based polyme rs
Polymer Structure
Polyglycolide (PGA)
O
On
L-Polylactide (PLA)
O
On
Poly(hydroxybutyrate) (PHB) O
O
n
Poly(ethylene glycol) (PEG)
On
1.3 Introduction to PLA
Polylactide (PLA) is a bio-based, biodegradable polymer which can be
produced from renewable sources such as corn and sugarcane and has found
numerous applications in the medical and pharmaceutical fields. Some large scale
4
manufacturers are beginning to favor PLA because it is renewable, conserves energy,
and degrades easily. Figure 1.1 shows a closed life cycle of the PLA.[3,4]
The properties of PLA, such as melting point, crystallinity, and mechanical
strength are affected by the polymer architecture and its molecular weight. PLA has
glass transition temperature (Tg) in the range of 50 to 80 oC while the melting
temperature (Tm) ranges from 130 to 180 o C. Copolymerization of lactide with other
monomers like glycolide or caprolactone can `significantly enhance the properties
and broaden the use of polylactide.[5-7]
Figure 1.1: PLA cycle showing its renewability
5
1.3.1 Advantages / Disadvantages of PLA
PLA has numerous advantages over other polymers such as: (1) produced
from renewable resources, (2) considerable energy savings, (3) to recycle back to
lactic acid which is a non toxic and naturally occurring metabolite through hydrolysis
or alcoholysis, (4) uses quantities of carbon dioxide while its manufacture, (5)
compostable, (6) improvement of farm economics, (7) decline of landfill volumes, (8)
and physical and mechanical properties can be tailored through the modification of its
architecture.[1,8]
The commercialization of PLA has been hindered mainly from three factors:
(1) high cost in comparison to other polymers because of its immature technology, (2)
moisture sorption properties, and (3) need for modified processing conditions. The
primary petroleum based polymers which are derived from alkenes or aromatic
monomers are non-polar while PLA is fairly polar, thus increasing degradability but
also reducing their water resistance property. When the polymer is used in packaging
it can have negative impact on the product inside. Also, when the polymer is used to
make a water bottle, water seeps out of the bottle thus decreasing the amount of water
inside.[9]
1.3.2 Architecture, Characteristics and Properties of PLA
Due to the chiral nature of lactic acid, polylactides exist in distinct forms,
which are poly(L-lactide), poly (D-lactide), and poly(DL-lactide) as shown in Figure
6
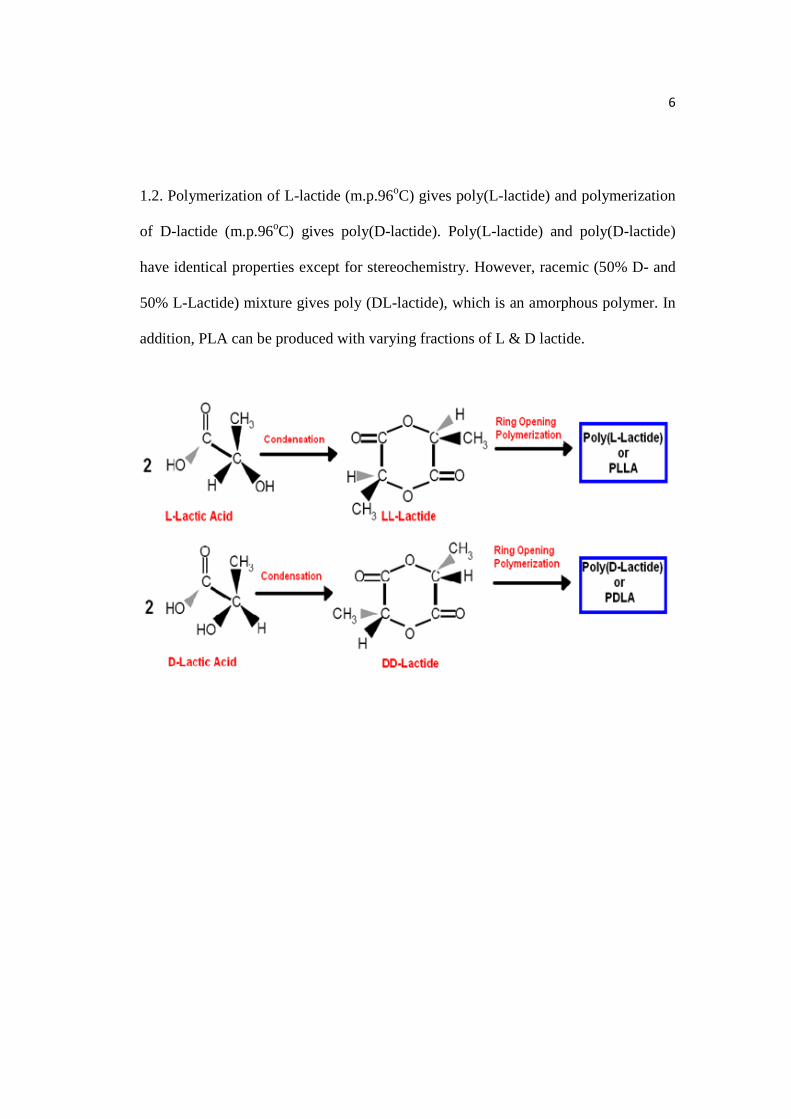
1.2. Polymerization of L-lactide (m.p.96oC) gives poly(L-lactide) and polymerization
of D-lactide (m.p.96oC) gives poly(D-lactide). Poly(L-lactide) and poly(D-lactide)
have identical properties except for stereochemistry. However, racemic (50% D- and
50% L-Lactide) mixture gives poly (DL-lactide), which is an amorphous polymer. In
addition, PLA can be produced with varying fractions of L & D lactide.
7
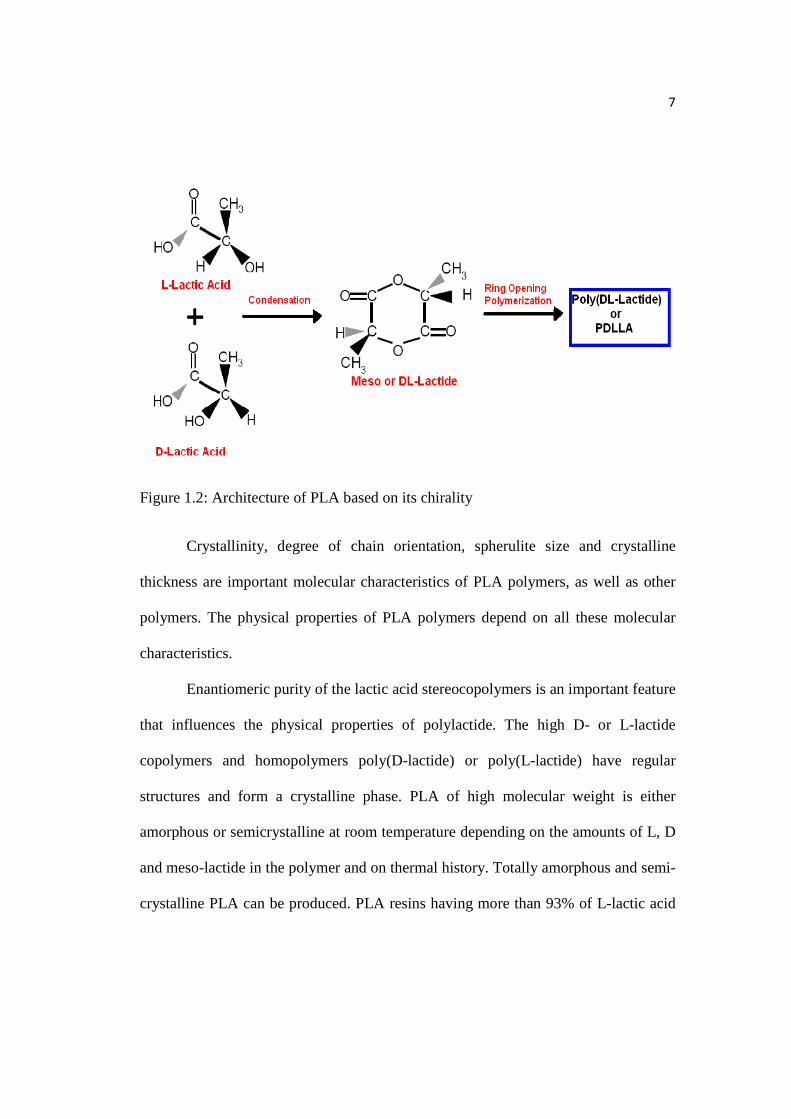
Figure 1.2: Architecture of PLA based on its chirality
Crystallinity, degree of chain orientation, spherulite size and crystalline
thickness are important molecular characteristics of PLA polymers, as well as other
polymers. The physical properties of PLA polymers depend on all these molecular
characteristics.
Enantiomeric purity of the lactic acid stereocopolymers is an important feature
that influences the physical properties of polylactide. The high D- or L-lactide
copolymers and homopolymers poly(D-lactide) or poly(L-lactide) have regular
structures and form a crystalline phase. PLA of high molecular weight is either
amorphous or semicrystalline at room temperature depending on the amounts of L, D
and meso-lactide in the polymer and on thermal history. Totally amorphous and semi-
crystalline PLA can be produced. PLA resins having more than 93% of L-lactic acid
8
are semicrystalline while PLA with 50–93% L-lactic acid is strictly amorphous. The
imperfections in the crystalline structure are produced by the presence of both meso-
and D-lactide which reduce the percent crystallinity.[10,11]
For amorphous PLA, glass transition temperature (Tg) is an important
parameter as dramatic changes in polymer chain mobility occur at or above Tg. For
the prediction of PLA behavior in semicrystalline PLA, both the Tg and melting
temperature (Tm) are important physical parameters. The proportion of different
lactides influences glass transition temperature. The commercial applications of
amorphous polylactide are based on the temperature at which the PLA will be used.
Properties of amorphous PLA depend on how far below Tg the article is used or
stored.[10,11]
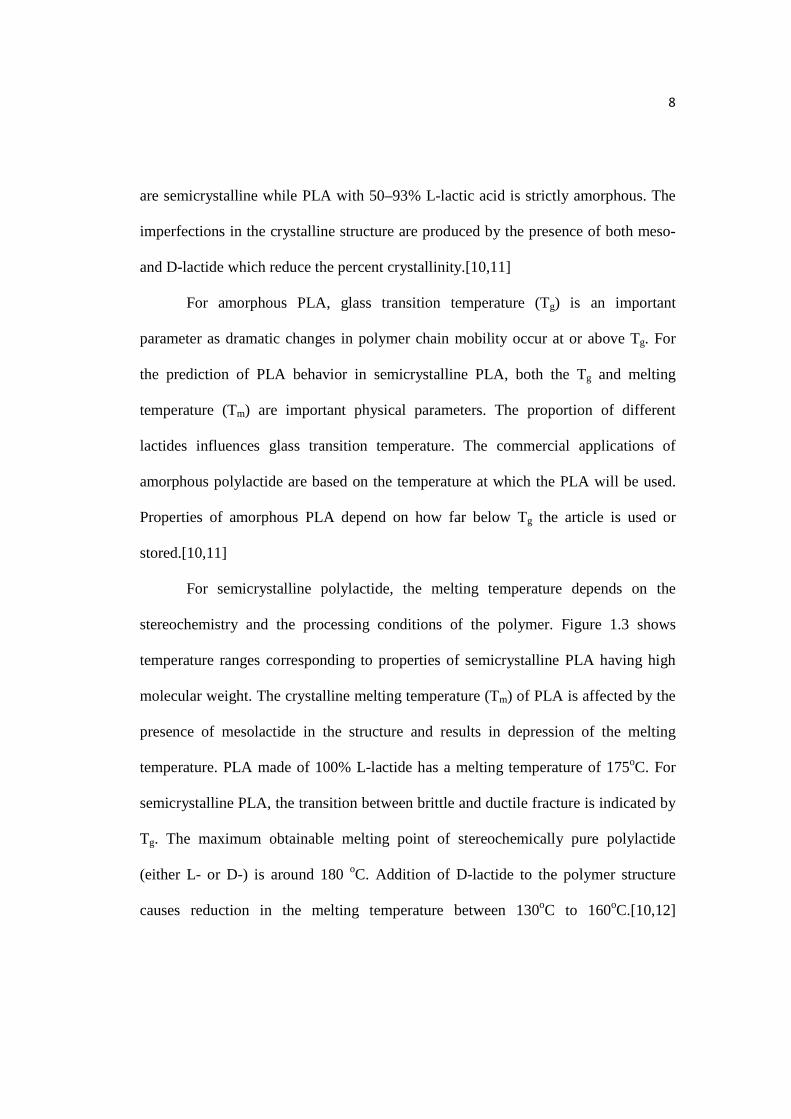
For semicrystalline polylactide, the melting temperature depends on the
stereochemistry and the processing conditions of the polymer. Figure 1.3 shows
temperature ranges corresponding to properties of semicrystalline PLA having high
molecular weight. The crystalline melting temperature (Tm) of PLA is affected by the
presence of mesolactide in the structure and results in depression of the melting
temperature. PLA made of 100% L-lactide has a melting temperature of 175oC. For
semicrystalline PLA, the transition between brittle and ductile fracture is indicated by
Tg. The maximum obtainable melting point of stereochemically pure polylactide
(either L- or D-) is around 180 oC. Addition of D-lactide to the polymer structure
causes reduction in the melting temperature between 130oC to 160oC.[10,12]
9
ProcessingArticle Service
DuctileBrittle
Leathery, Tough Viscous Liquid Decomposition
58-70glass transition temp.
130-170melting temp.
215-285
Temperature in degree C
Figure 1.3: Metastable states of high molecular weight semicrystalline Polylactide,
adapted from Witzke [10]
1.4 Previous Studies and Research Objective
Many studies have been done on the thermal, mechanical, physical and barrier
properties of PLA. One of the major hindrances in the competitiveness in the
marketplace of PLA are its moisture barrier and thermal properties compared to other
conventional synthetic polymers. The major application areas of PLA are cups,
packaging, bottles, food service applications and many other biomedical applications.
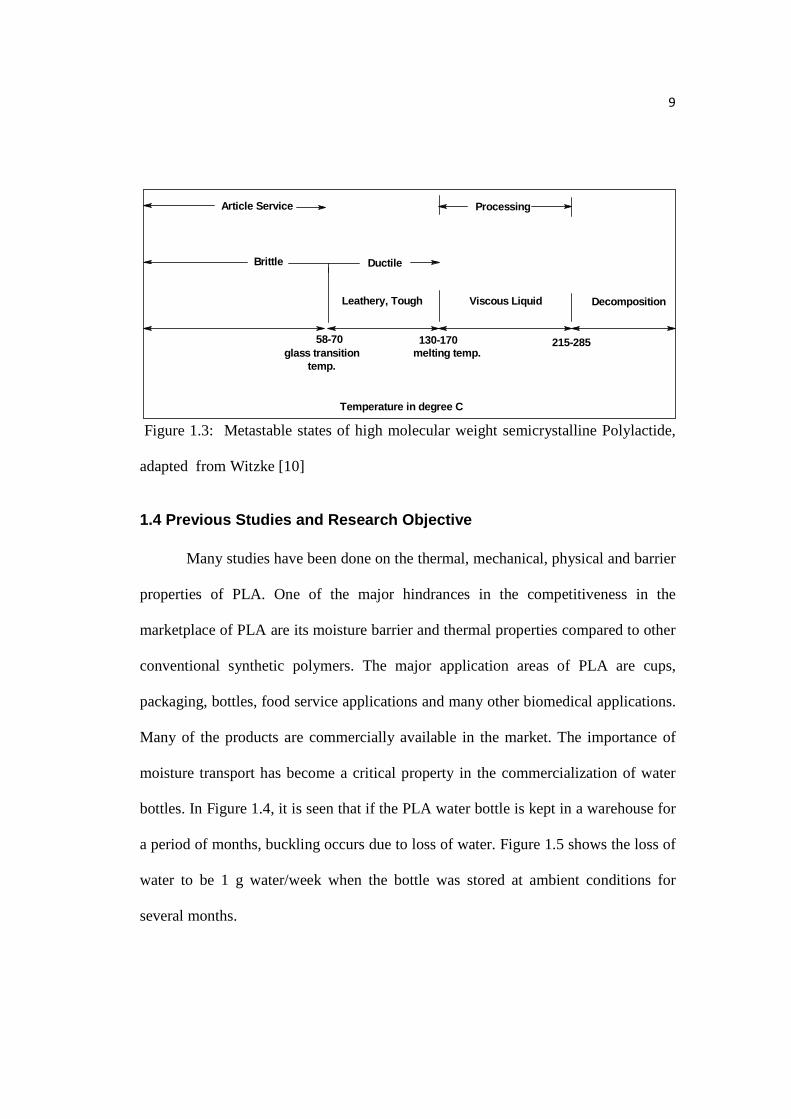
Many of the products are commercially available in the market. The importance of
moisture transport has become a critical property in the commercialization of water
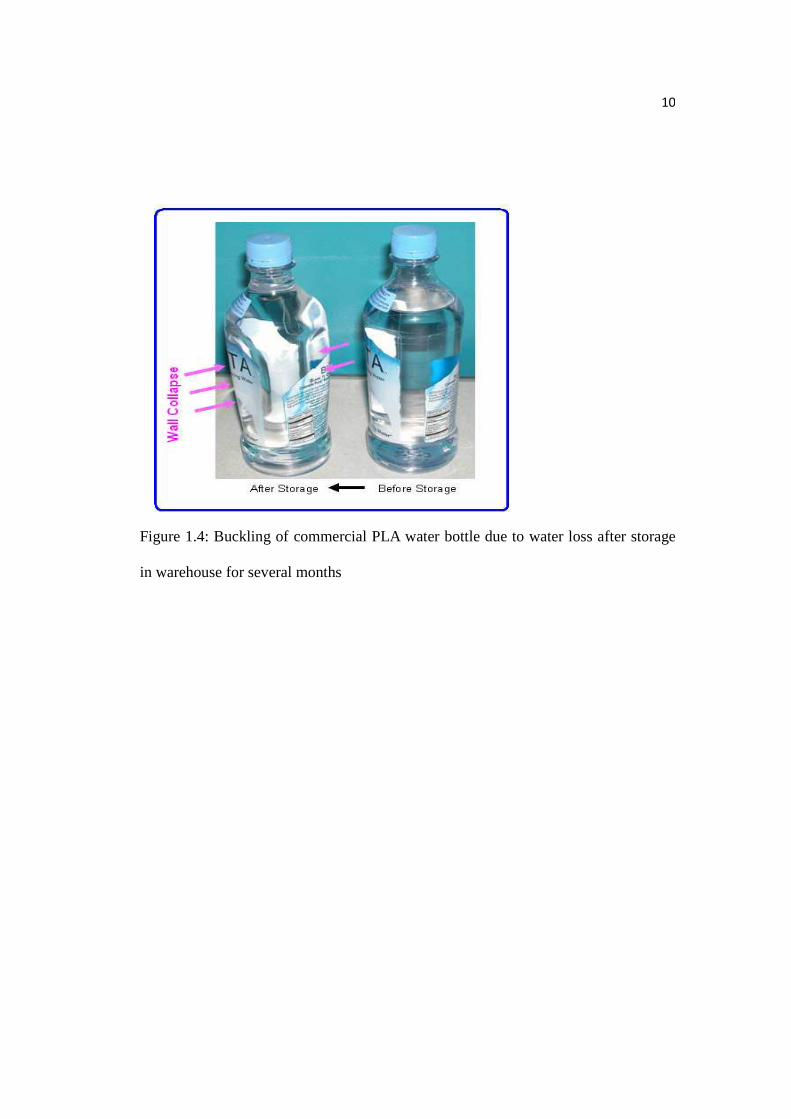
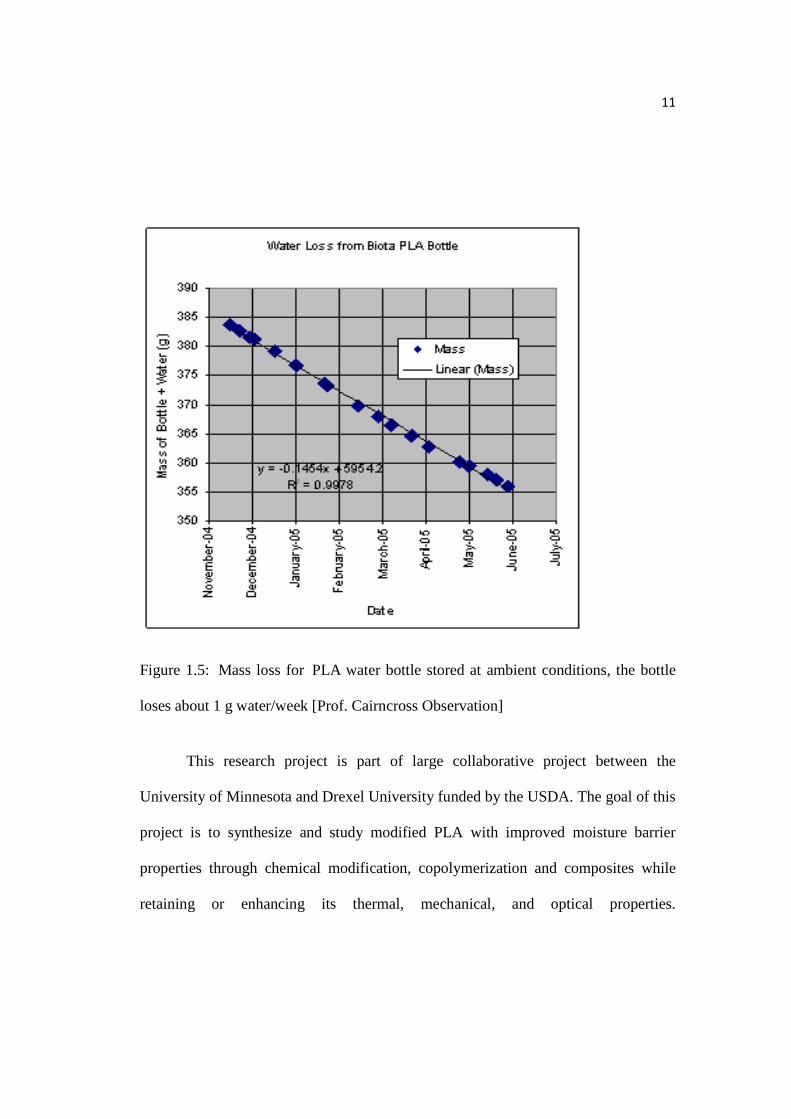
bottles. In Figure 1.4, it is seen that if the PLA water bottle is kept in a warehouse for
a period of months, buckling occurs due to loss of water. Figure 1.5 shows the loss of
water to be 1 g water/week when the bottle was stored at ambient conditions for
several months.
10
Figure 1.4: Buckling of commercial PLA water bottle due to water loss after storage
in warehouse for several months
11
Figure 1.5: Mass loss for PLA water bottle stored at ambient conditions, the bottle
loses about 1 g water/week [Prof. Cairncross Observation]
This research project is part of large collaborative project between the
University of Minnesota and Drexel University funded by the USDA. The goal of this
project is to synthesize and study modified PLA with improved moisture barrier
properties through chemical modification, copolymerization and composites while
retaining or enhancing its thermal, mechanical, and optical properties.
12
Copolymerization is done by collaborators Hillmyer et al. in the chemistry
department and degradability of modified PLA samples is studied by Ramaswamy et
al. in bio-based products department at the University of Minnesota.
The objective of this thesis is a systematic study of how moisture sorption in
PLA depends on molecular weight and aliphatic content via end group modification.
PLA with varying aliphatic content was achieved by initiating ring opening
polymerization of L-lactide with different long chain aliphatic fatty alcohols. Also,
PLA with Benzyl end was synthesized to get better insight about the effect of change
in end group on moisture sorption properties. Molecular weight was controlled by
varying the ratio of L-lactide monomer to alcohol (C16 Palmityl, C10 Decyl, C4
Butyl, Benzyl) initiator and triethylaluminum was used as a catalyst because of the
better control over molecular weight.
PLA with different molecular weight and with varying end groups have been
synthesized and characterized by GPC, DSC, and NMR. Moisture sorption in PLA
was measured with quartz crystal microbalance (QCM).
1.5 Direct and Indirect Outcomes of Thesis
This thesis investigates the prospective methods of making PLA more
hydrophobic and improving its sorption properties. The desired impact of the thesis is
to replace petroleum-based plastic with PLA in commodity applications. Modification
of PLA is done through chemical and physical means in order to produce a polymer
13
that is equivalent or better in physical and thermal properties, biodegradability, and
moisture sorption properties in comparison to conventional plastics derived from non-
renewable sources of energy. Plastic production has been roughly doubling every
decade over last forty years, making environmental issues like energy sustainability
and carbon dioxide emission troublesome. The advancement and commercialization
of PLA with enhanced moisture properties will help in the reduction of fossil fuel
consumption. Also, its direct influence would be less waste, reduction in green house
gases, and secure supply chain.
14
2 Background
2.1 Synthesis Methods of PLA
2.1.1 Polycondensation
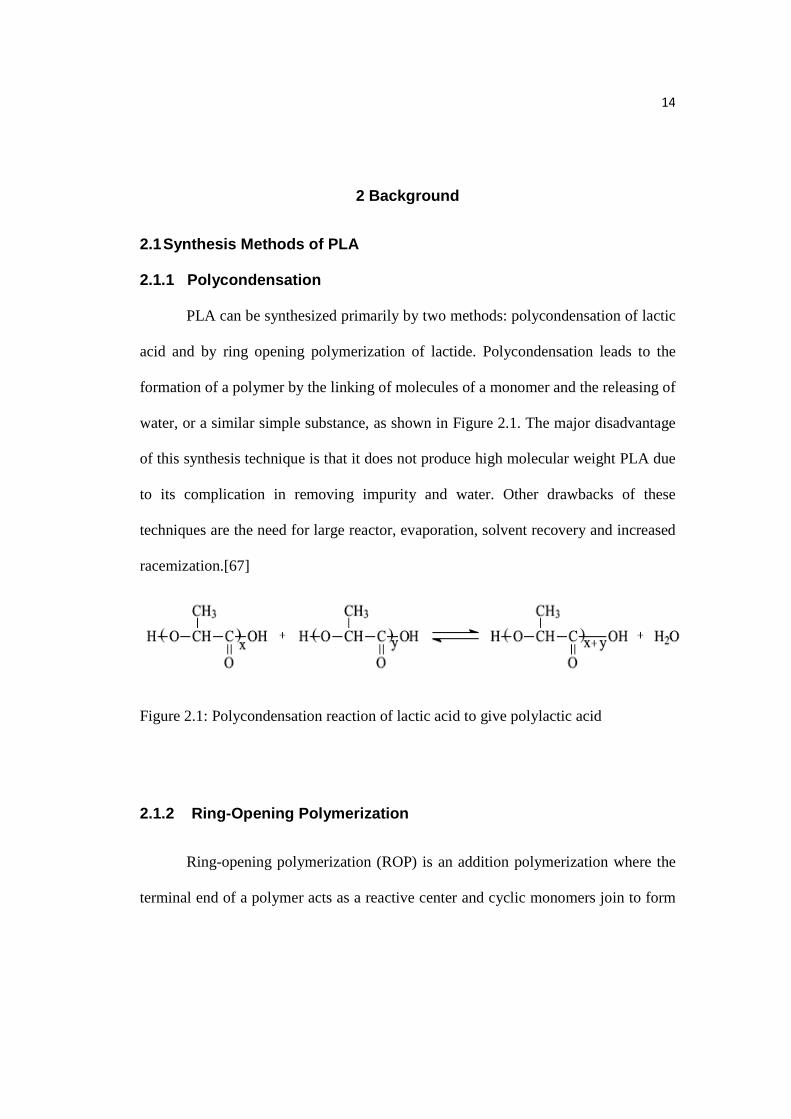
PLA can be synthesized primarily by two methods: polycondensation of lactic
acid and by ring opening polymerization of lactide. Polycondensation leads to the
formation of a polymer by the linking of molecules of a monomer and the releasing of
water, or a similar simple substance, as shown in Figure 2.1. The major disadvantage
of this synthesis technique is that it does not produce high molecular weight PLA due
to its complication in removing impurity and water. Other drawbacks of these
techniques are the need for large reactor, evaporation, solvent recovery and increased
racemization.[67]
Figure 2.1: Polycondensation reaction of lactic acid to give polylactic acid
2.1.2 Ring-Opening Polymerization
Ring-opening polymerization (ROP) is an addition polymerization where the
terminal end of a polymer acts as a reactive center and cyclic monomers join to form
15
a larger polymer chain. In case of polylactide, alkoxide of some metal having d-
orbitals like aluminum and tin are considered to be good initiators for ring opening
polymerization (ROP) of lactide.[13]
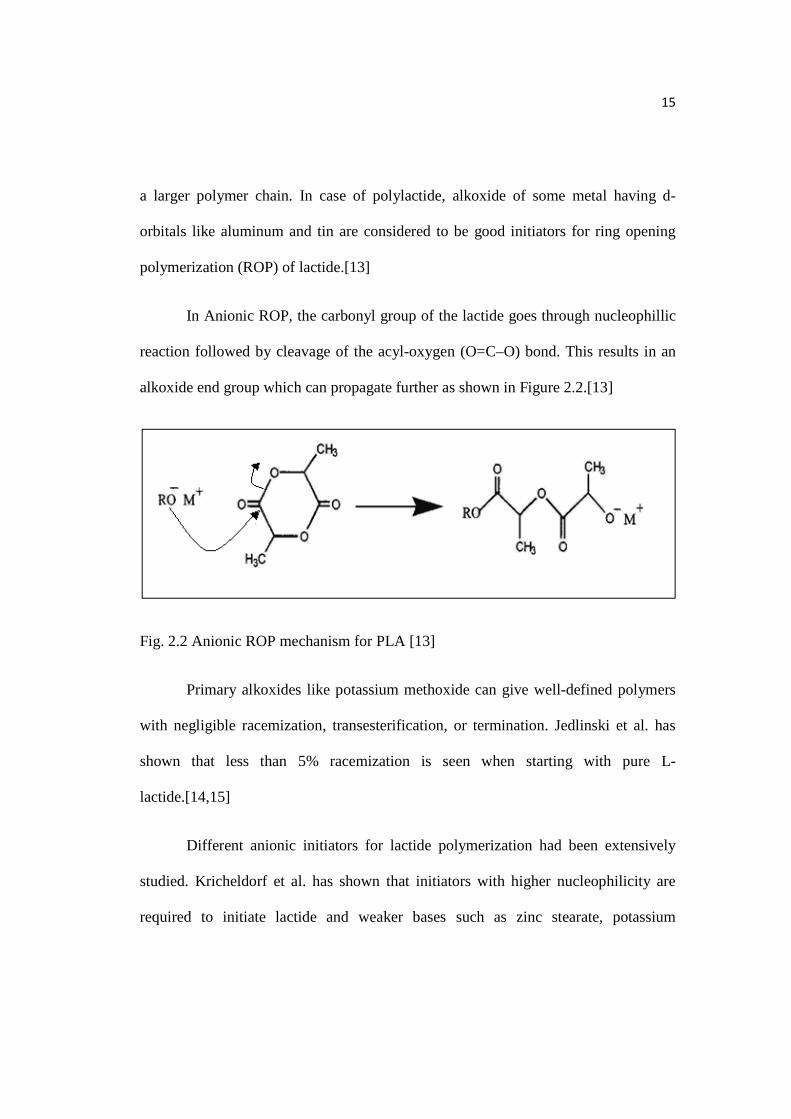
In Anionic ROP, the carbonyl group of the lactide goes through nucleophillic
reaction followed by cleavage of the acyl-oxygen (O=C–O) bond. This results in an
alkoxide end group which can propagate further as shown in Figure 2.2.[13]
Fig. 2.2 Anionic ROP mechanism for PLA [13]
Primary alkoxides like potassium methoxide can give well-defined polymers
with negligible racemization, transesterification, or termination. Jedlinski et al. has
shown that less than 5% racemization is seen when starting with pure L-
lactide.[14,15]
Different anionic initiators for lactide polymerization had been extensively
studied. Kricheldorf et al. has shown that initiators with higher nucleophilicity are
required to initiate lactide and weaker bases such as zinc stearate, potassium
16
phenoxide, and potassium benzoate initiate only at higher temperatures (120oC).
Initiations at high temperature are in bulk but accompanied by racemization and other
side reaction which are obstacle to propagation.[16-19] Normal butyl lithium,
secondary butyl lithium or tertiary butyl lithium or potassium tert-butoxide initiate the
polymerization reaction rapidly at low temperature but are deprotonation reagents. So
deprotonation of lactide takes place and thus results in racemization, inconsistent
polymerization and low molecular weights.[20-22] Lithium initiators have some
issues regarding toxicity but utilizing sodium or potassium metal ions results in less
toxic and biocompatible polymers.[13]
Stannous octoate or tin(II) bis-2-ethylhexanoic acid is the catalyst which has
been researched thoroughly in the past and is generally used for bulk polymerization
for lactide because of its solubility in lactide, catalytic activity and racemization of
the polymer has low rate. This catalyst promises good reaction rate, conversion of
greater than 90%, low levels of racemization, that is less than 1% and providing
higher molecular weight polymer.[23,24]
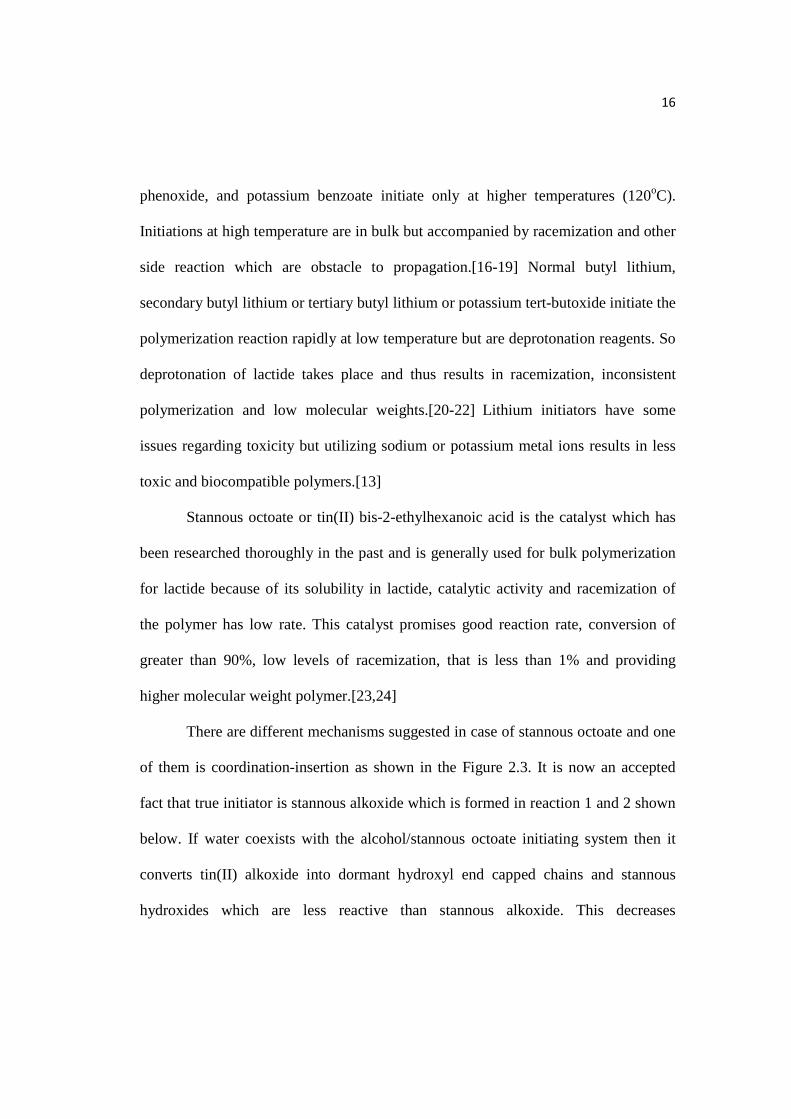
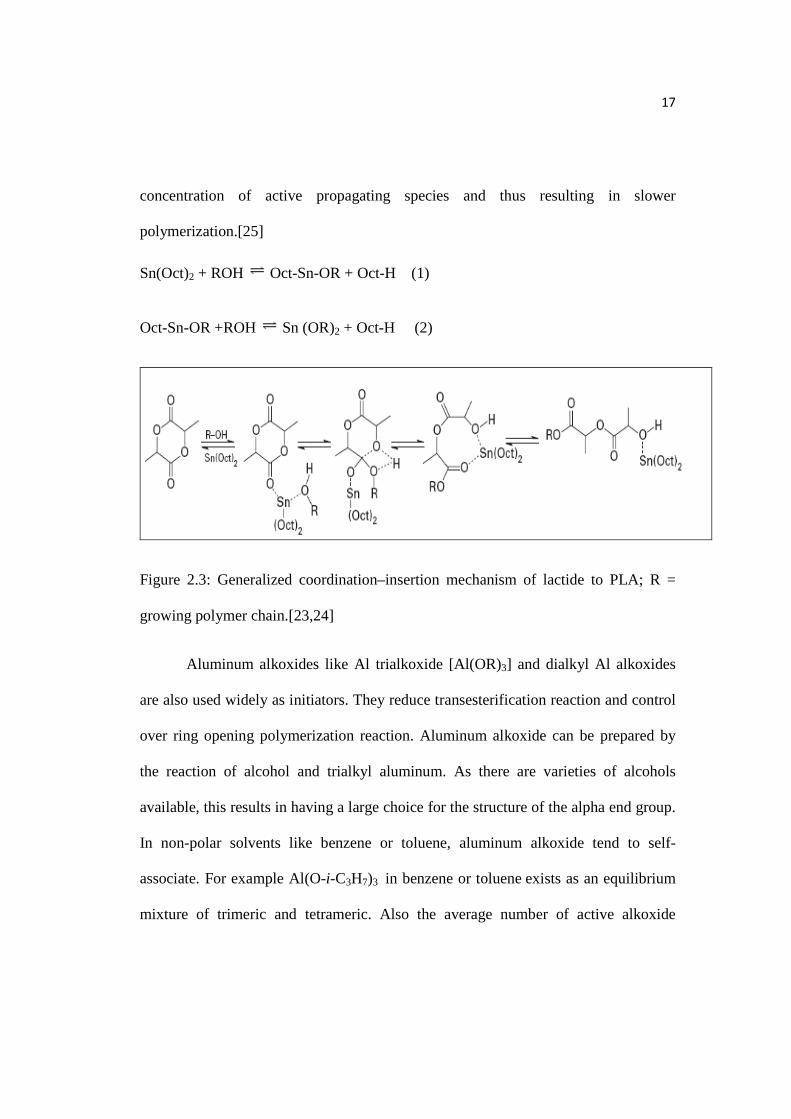
There are different mechanisms suggested in case of stannous octoate and one
of them is coordination-insertion as shown in the Figure 2.3. It is now an accepted
fact that true initiator is stannous alkoxide which is formed in reaction 1 and 2 shown
below. If water coexists with the alcohol/stannous octoate initiating system then it
converts tin(II) alkoxide into dormant hydroxyl end capped chains and stannous
hydroxides which are less reactive than stannous alkoxide. This decreases
17
concentration of active propagating species and thus resulting in slower
polymerization.[25]
Sn(Oct)2 + ROH Oct-Sn-OR + Oct-H (1)
Oct-Sn-OR +ROH Sn (OR)2 + Oct-H (2)
Figure 2.3: Generalized coordination–insertion mechanism of lactide to PLA; R =
growing polymer chain.[23,24]
Aluminum alkoxides like Al trialkoxide [Al(OR)3] and dialkyl Al alkoxides
are also used widely as initiators. They reduce transesterification reaction and control
over ring opening polymerization reaction. Aluminum alkoxide can be prepared by
the reaction of alcohol and trialkyl aluminum. As there are varieties of alcohols
available, this results in having a large choice for the structure of the alpha end group.
In non-polar solvents like benzene or toluene, aluminum alkoxide tend to self-
associate. For example Al(O-i-C3H7)3 in benzene or toluene exists as an equilibrium
mixture of trimeric and tetrameric. Also the average number of active alkoxide
18
available are not three but one.[26,27] In this thesis, diethylaluminum ethoxide and
triethylaluminum were used as catalysts for synthesis of PLA. The latter gave better
control over molecular weight.
2.2 Copolymers of PLA
Polylactide has been copolymerized with a number of different monomers
including other lactone monomers like glycolide and caprolactone. For instance, there
are two ways to prepare block copolymer of polycaprolactone and polylactide. First, a
sequential addition of the required monomer on the living growing chain end of the
first monomer. This method produces diblock copolymers of PCL-PLLA or PCL-
PDLA. However it is not possible to synthesize triblock copolymer with this because
the polylactide end chain can not initiate the caprolactone. Second, a prepolymer with
hydroxyl end group can be developed and then the second monomer can be added in
the presence of a catalyst.[28,29]
The properties of PLA can be considerably improved and broadened when
lactide is copolymerized with other monomers. Development of both block and
random copolymers containing PLA has been done, and PLA block copolymers
containing low glass transition temperature segments are notably tougher than the
naturally brittle homopolymer. PLA can be toughened by a block co-polymer
approach like PLA diblock co-polymers containing polyisoprene (PI) since PI is a
19
low Tg amorphous polymer that has been used to strengthen conventionally brittle
polymers such as polystyrene.[30]
Copolymerization of PLA has been extensively studied but the effect of
copolymer content on the moisture sorption properties of polymer has not been
explored much. Preparing copolymers to reduce permeation of water through the film
is being done by collaborators in the Hillmyer group in the chemistry department at
the University of Minnesota. If they prepare a copolymer of polylactide with some
polymer that is more hydrophobic like polyethene or polyisoprene then it may result
in copolymer with enhanced moisture sorption properties.
2.3 Composites
Recently, polymer/layered silicate nanocomposites have made a significant
impact because of its impressive enhancement of mechanical, optical, thermal, and
physicochemical properties than pure polymer or micro- and macro
composites.[31,32] These improvements in properties also include increased strength,
decreased gas permeability, and heat resistance. Nanocomposites with organically
modified layered silicates have been developed from a number of polymers with
varying degrees of polarity and the chain rigidity like polystyrene, poly(ethylene
oxide), poly(methacrylates), and many others.[33,36] Nature of the polymer, type,
packing density, and the size of the organic modifiers on the silicate surface are the
20
characteristics of a polymer matrix and the OMLS tell us that if their mixture would
be exfoliated of intercalated nanocomposite.[37]
Intercalation of polymer chains in silicate galleries is generally done by two
ways. First is by inserting the desired monomer in the silicate galleries followed by
polymerization. The second way is by inserting polymer chains in to the silicate
galleries from the solution or the melt.[38-41] Vaia et al.[41] were the first to
demonstrate the possibility of direct melt intercalation, and this method is the
mainstream method for preparing intercalated polymer/layered silicate
nanocomposites as it is suitable for industrial use.[42,43] This whole process includes
the annealing and mixture of polymer and OMLS above the softening temperature of
the polymer. During annealing, the polymer chains from the melted bulk diffuse in to
the galleries of silicate galleries. The degree of penetration of these polymer chains in
to the OMLS galleries decides the structure of nanocomposites which ranges from
intercalated to exfoliate. Intercalated nanocomposites are well ordered with an
alternating polymer and silicate layer with a repeating distance of few nanometers.
While disordered structures which is a result of extensive polymer penetration are
exfoliated nanocomposites.[44,45]
Preparation of polylactide with layered silicates nanocomposites has been
successfully done by melt extrusion of organically modified montmorillonite and
polylactide.[46,56] These nanocomposites have shown remarkable improvement in
properties of the material than PLA matrices without clay.
21
3 Experimental Procedures: Synthesis of PLA
3.1 Introduction
This section covers experimental procedures used during the synthesis of
PLA. Section 3.2 discusses the materials used, the synthesis of PLA, the procedure to
recrystallize L-lactide, and the glove box. Sections 3.3 and 3.4 discuss the various
characterization instruments for polymer and its reaction mechanism respectively.
3.2 Experiment
3.2.1 Overview of Synthesis Technique
The basic steps involved in the synthesis of PLA were as follows:
- Recrystallized L-lactide with ethyl acetate.
- Brought moisture level in the glove box to less than 20 PPM.
- Took L-lactide, catalyst, initiator, solvent, stirrer, Teflon stopper inside glove box.
- Measured quantities required for the polymerization reaction.
- Sealed the reaction vessel and took it out of the glove box.
- Placed the reaction vessel in 70oC oil bath for 40 hours.
- After 40 hours, dissolved the content of reaction vessel in chloroform.
- Precipitated PLA in methanol followed by vacuum filtration.
- Dried PLA at 100oC overnight under reduced pressure.
- Obtained dry PLA.
22
3.2.2 Recrystallization of L-lactide
Ethyl acetate (450-500ml) was taken in a 500 ml three neck round bottom
flask and heated to boiling by raising the temperature of the oil bath to 77oC (boiling
point of ethyl acetate). L-lactide (100gm) was taken in a 500ml beaker with a
magnetic stirrer. When ethyl acetate began to reflux, it was added slowly and
carefully with the help of pipette to the monomer beaker with a stirrer and on a hot
plate (around 70oC). The purpose of this was to dissolve L-lactide in the minimum
amount of solvent. Around 450 ml ethyl acetate was used to fully dissolve L-lactide.
The dissolved monomer was removed from heat and allowed to cool at ambient
temperature. The equilibrated monomer solution was placed in to the refrigerator
(0oC) for one hour. Subsequently, it was taken out and the resulting crystals in the
beaker were scrapped with a spatula into a filter funnel and vacuum filtered. The
lactide monomer crystals were dried overnight in the vacuum oven. 1H NMR analysis
was done on recrystallized L-lactide to confirm the absence of a water and ethyl
acetate.
3.2.3 Glove Box
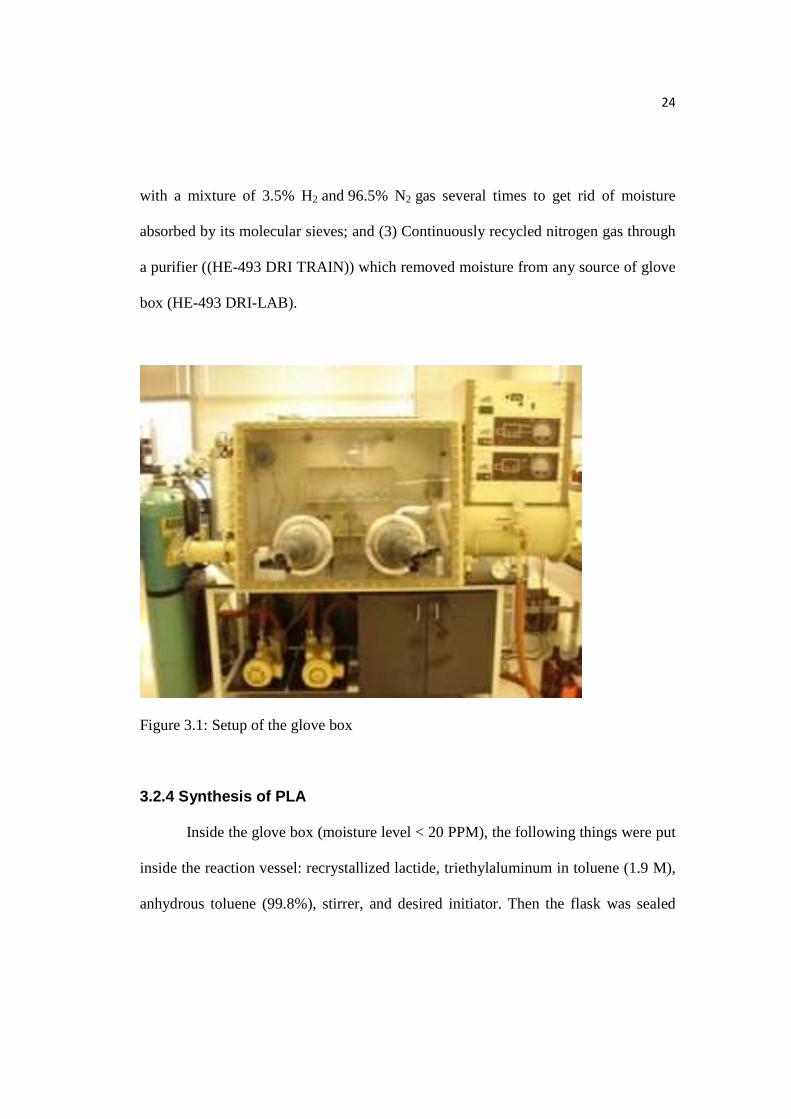
The glove box HE-493 (Vacuum/Atmosphere DRI-LAB) as shown in Figure
3.1 provided a working area of inert atmosphere nearly free of moisture. The
materials like triethylaluminum (pyrophoric), initiators, and L-lactide used in our
synthesis reaction were handled inside the glove box. Nitrogen gas was used as the
23
principal inert gas. Helium, argon, or any combination of these gases could also be
used. There was HE-493 DRI TRAIN (purifier) attached to it where nitrogen gas was
continuously cycled through a purifier which removed moisture from any source,
such as: diffusion through the rubber gloves in the glove box, insertion of
contaminated parts into the glove box, and use of makeup gas which is not
completely free of moisture. The PC-1 Pedatrol was used for pressure control of a
glove box. Because a Dri-Lab is a hermetically sealed system, slight changes in
pressure, caused by volume or temperature changes, will readily affect the gloves by
forcing them out or drawing them in. Also, there was a moisture analyzer which kept
track of moisture content inside the glove box.
Some synthesis experiments were done when the moisture level inside the
glove box was greater than 700 PPM. The molecular weight of those samples came
out to be higher than expected (~260K vs. 85K anticipated and ~240 vs. 50K
anticipated) and polydispersity was greater than 2. Reasons of high molecular weight
may be due to exposure of the initiator (diethylaluminum ethoxide) to moisture and
thus destroying some of the initiator in the beginning. Moisture was detrimental to
our synthesis reactions.
The overall moisture level during operation of the glove box was brought
down to less than 20 PPM from 2200 PPM. It took six months for the moisture level
to be achieved and maintained by following methods: (1) Purged the glove box
numerous times with dry nitrogen; (2) Regenerated purifier (HE-493 DRI TRAIN)
24
with a mixture of 3.5% H2 and 96.5% N2 gas several times to get rid of moisture
absorbed by its molecular sieves; and (3) Continuously recycled nitrogen gas through
a purifier ((HE-493 DRI TRAIN)) which removed moisture from any source of glove
box (HE-493 DRI-LAB).
Figure 3.1: Setup of the glove box
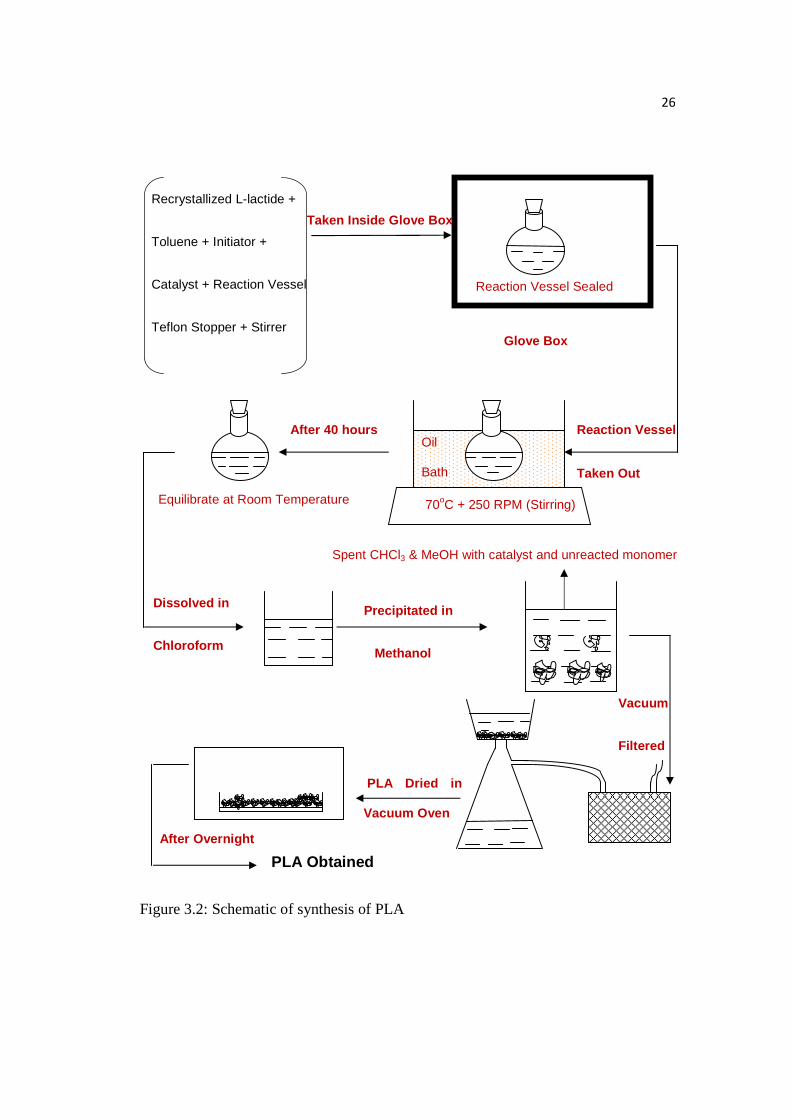
3.2.4 Synthesis of PLA
Inside the glove box (moisture level < 20 PPM), the following things were put
inside the reaction vessel: recrystallized lactide, triethylaluminum in toluene (1.9 M),
anhydrous toluene (99.8%), stirrer, and desired initiator. Then the flask was sealed
25
with a Teflon stopper under nitrogen atmosphere which prevented the whole reaction
from being exposed to moisture. Further, the reaction vessel was taken out from the
glove box and kept in an oil bath at 70oC for 40 hours. Subsequently, the viscous
solution was removed from the oil bath and dissolved in chloroform. Then, the
polymer solution was precipitated in cold methanol. The resultant white spongy
precipitate was vacuum-filtered and dried in the oven at 100oC overnight under
reduced pressure (about 0.5mm Hg). Figure 3.2 shows the schematic of synthesis of
PLA.
26
Figure 3.2: Schematic of synthesis of PLA
Recrystallized L-lactide +
Toluene + Initiator +
Catalyst + Reaction Vessel
Teflon Stopper + Stirrer
Reaction Vessel Sealed
Reaction Vessel
Taken Out
70oC + 250 RPM (Stirring)
Oil
Bath
After 40 hours
Equilibrate at Room Temperature
Dissolved in
Chloroform
Precipitated in
Methanol
Vacuum
Filtered
PLA Dried in
Vacuum Oven
After Overnight
PLA Obtained
Taken Inside Glove Box
Glove Box
Spent CHCl3 & MeOH with catalyst and unreacted monomer
27
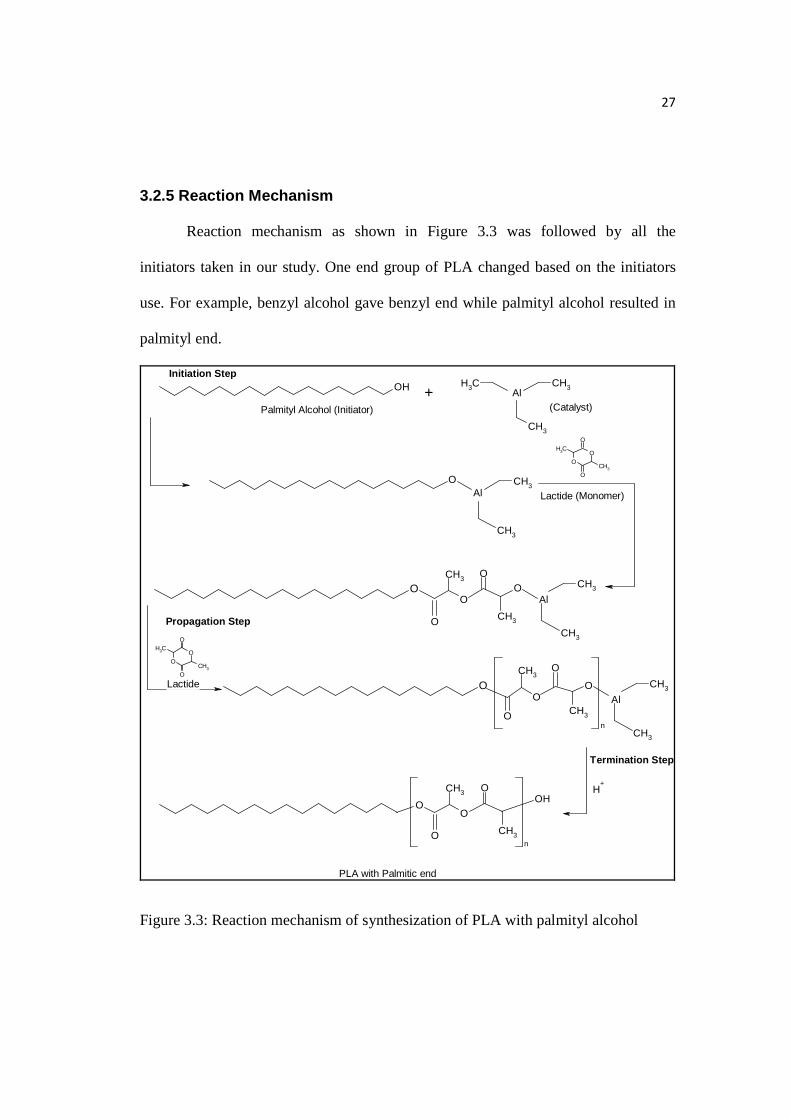
3.2.5 Reaction Mechanism
Reaction mechanism as shown in Figure 3.3 was followed by all the
initiators taken in our study. One end group of PLA changed based on the initiators
use. For example, benzyl alcohol gave benzyl end while palmityl alcohol resulted in
palmityl end.
OH CH3CH3Al
CH3
OAl
CH3
CH3
OO
O
OCH3
CH3
O
O
CH3
O
O
CH3
O CH3
CH3
Al
OO
O
OCH3
CH3
O
CH3
O
n
O
CH3
OCH3
CH3
AlO
H+
O
O
CH3
O
O
CH3n
OH
+Initiation Step
Palmityl Alcohol (Initiator) (Catalyst)
(Monomer)
Propagation Step
Termination Step
PLA with Palmitic end
Lactide
Lactide
Figure 3.3: Reaction mechanism of synthesization of PLA with palmityl alcohol
28
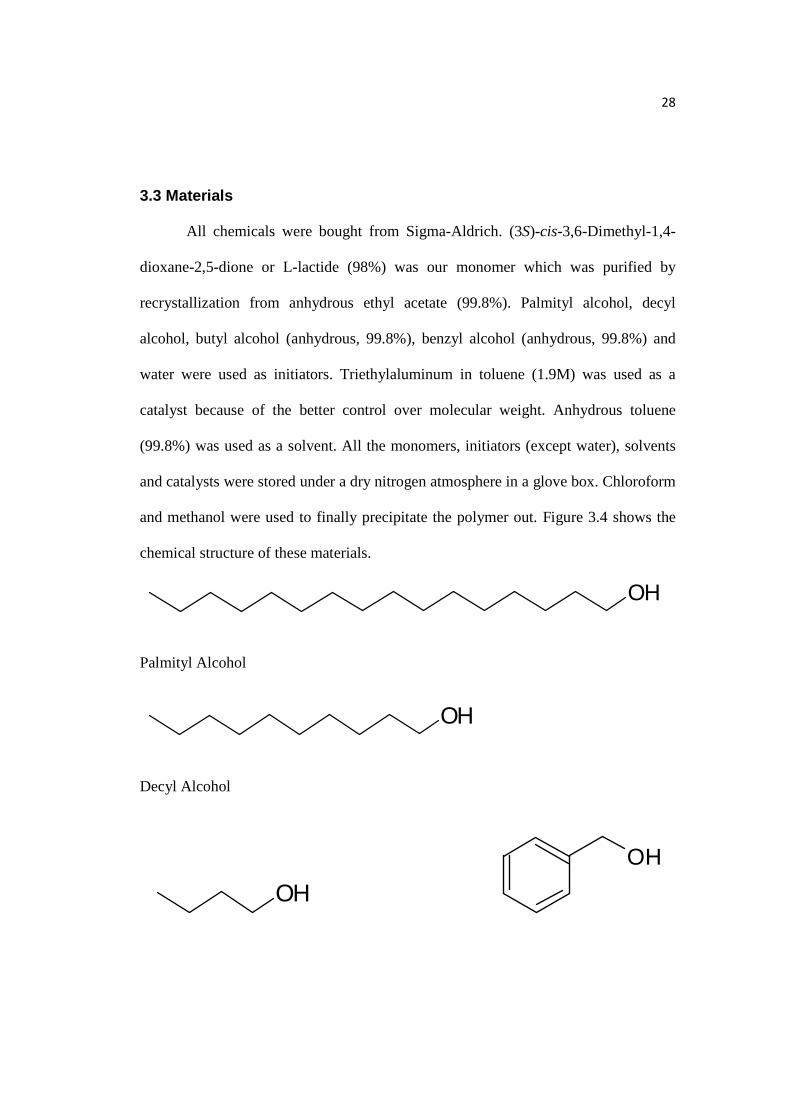
3.3 Materials
All chemicals were bought from Sigma-Aldrich. (3S)-cis-3,6-Dimethyl-1,4-
dioxane-2,5-dione or L-lactide (98%) was our monomer which was purified by
recrystallization from anhydrous ethyl acetate (99.8%). Palmityl alcohol, decyl
alcohol, butyl alcohol (anhydrous, 99.8%), benzyl alcohol (anhydrous, 99.8%) and
water were used as initiators. Triethylaluminum in toluene (1.9M) was used as a
catalyst because of the better control over molecular weight. Anhydrous toluene
(99.8%) was used as a solvent. All the monomers, initiators (except water), solvents
and catalysts were stored under a dry nitrogen atmosphere in a glove box. Chloroform
and methanol were used to finally precipitate the polymer out. Figure 3.4 shows the
chemical structure of these materials.
OH
Palmityl Alcohol
OH
Decyl Alcohol
OH
OH
29
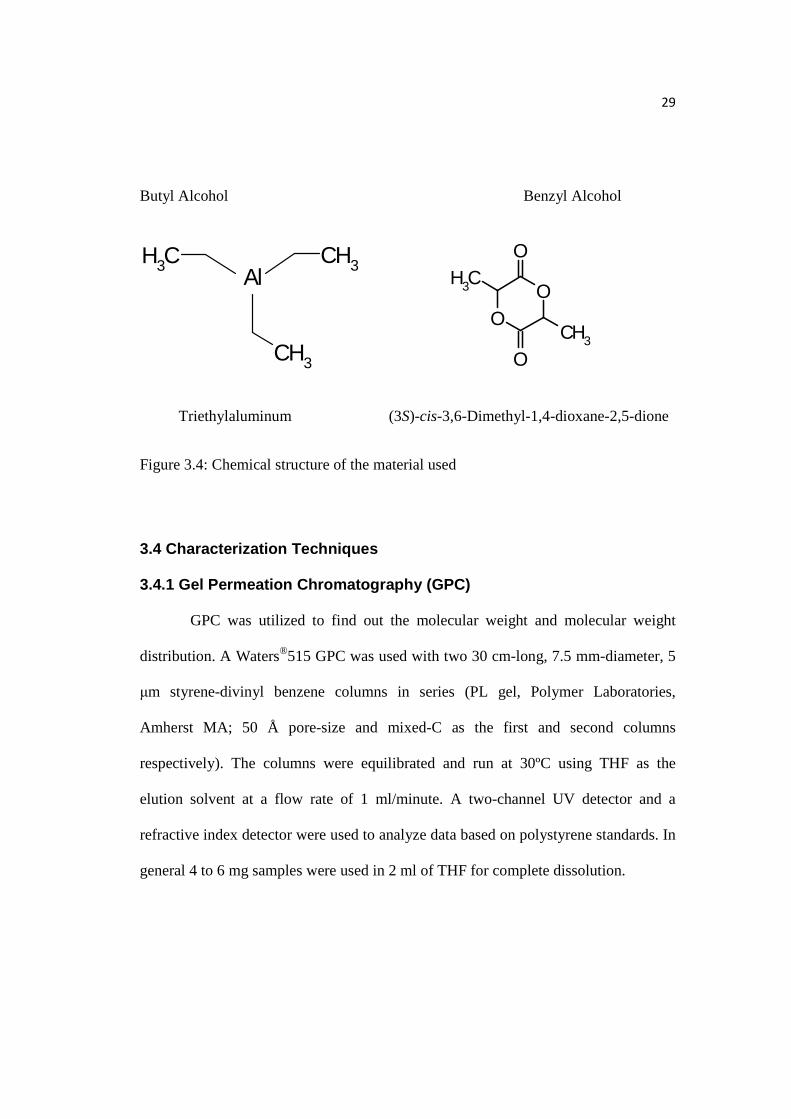
Butyl Alcohol Benzyl Alcohol
CH3CH3Al
CH3
OO
O
OCH3
CH3
Triethylaluminum (3S)-cis-3,6-Dimethyl-1,4-dioxane-2,5-dione
Figure 3.4: Chemical structure of the material used
3.4 Characterization Techniques
3.4.1 Gel Permeation Chromatography (GPC)
GPC was utilized to find out the molecular weight and molecular weight
distribution. A Waters®515 GPC was used with two 30 cm-long, 7.5 mm-diameter, 5
µm styrene-divinyl benzene columns in series (PL gel, Polymer Laboratories,
Amherst MA; 50 Å pore-size and mixed-C as the first and second columns
respectively). The columns were equilibrated and run at 30ºC using THF as the
elution solvent at a flow rate of 1 ml/minute. A two-channel UV detector and a
refractive index detector were used to analyze data based on polystyrene standards. In
general 4 to 6 mg samples were used in 2 ml of THF for complete dissolution.
30
3.4.2 Differential Scanning Calorimeter (DSC)
The glass transition temperature, Tg, and the melting temperature, Tm, of the
polymers synthesized was obtained by differential scanning calorimetry (DSC, TA
Instruments Q2000) based on the second heating scan of 5°C/min. Samples ranged in
weight from 5 to 12 mg and were placed in sealed aluminum pans; at least 3 scans per
samples were taken.
3.4.3 Hydrogen Nuclear Magnetic Resonance ( 1H NMR)
Varian 500 MHz 1H NMR in chemistry department (Drexel University) was
used by the help of Ms. Radisic Dunja to confirm the structure of polymer prepared.
Solvent used was d-chloroform and temperature 25OC. The number of scans taken
was between 8 to 64 with a recycle delay of five seconds.
31
4 Review of Moisture Permeation
4.1 Diffusion Models
Fickian diffusion is the simplest form of transport of sorbate in-to substrate
where concentration gradient is the driving force for the transport phenomena. Fick’s
First Law states that:
x
CDJ s
xs ∂∂
−=, (4.1)
Where, diffusion flux (Js,x) whose unit is mole time-1 area-1 is directly
proportional to the concentration gradient of the substance in the diffusing medium.
The proportionality constant is the mutual diffusion coefficient of the substance and
the medium. The variation of diffusion coefficient is due to several factors,
particularly through the plasticization of the polymer chains due to effect of moisture
sorption.[47]
Fick’s law does not always give exact description of the diffusion behavior
within polymers. One factor that can cause such an inconsistency is the relaxation
behavior of the polymer chains parallel with the diffusion. Several academicians
argue that deviation from Fickian behavior must be considered for systems where
polymer relaxation happens at a much slower pace than the diffusion of the penetrant.
Also, if the polymer chains are inflexible, like in the case where temperature is lower
than glass transition temperature of polymers, correction factor must be taken in to
32
account to study systems effectively for the obstruction that the chains cause to the
solute.[48] Vrentas proposed an another decisive factor for the applicability of Fick’s
laws, bringing in the idea of a diffusion Deborah number to relate the characteristic
times of relaxation of polymer chains and diffusion to each other. The material can be
estimated as an elastic solid at large values of the diffusion Deborah number, where
polymer relaxation is much slower than the rate of diffusion, and a Fickian
approximation give reasonable precision. Similarly, for low values of the diffusion
Deborah number, the material behaves as a viscous liquid. Based on this view, non-
Fickian diffusion exists between these two extreme conditions, where neither route
can be assumed to be insignificant with respect to the other.[49]
Deviation from Fick’s law in a system can be articulated in a system’s
diffusion kinetics in various ways. In Fickian diffusion, the mass uptake from the
bulk vapor phase to the surface of the solid substrate is at the start proportional to the
square root of time elapsed, eventually equilibrating to some value of mass uptake. A
few systems have shown two different time regimes of sorption, where the graph of
mass vs. the square root of time does not come to some constant equilibrium or
saturation value but continue to extend through a non-Fickian region, until it reaches
a next saturation level. Berens et.al. theorized that mass uptake in the sorption pattern
depends on two factors, first is Fickian diffusion and second is due to polymer
relaxation over time which increases free volume, thus allowing extra moisture to
penetrate through the polymer past its original saturation value.[50] A sorption
33
system in which the mass vs. square root of time curve gives sigmoidal shape was
observed by Long and Richman, where mass uptake rate reaches to a maximum
value before leveling off to some saturation value. De Wilde et. al. recognized that
the sigmoidal shape can also be pursued by a second non-Fickian stage originated
from polymer relaxation similar to simple Fickian sorption. The sigmoidal shape can
be explained by a variable surface concentration model.[51] Case II sorption is an
additional class of sorption which was observed by Crank et.al., Petropoulos et.al. and
others.[52,53] This sorption pattern shows a Fickian induction period followed by
linear kinetics due to swelling induced by a sharp diffusion front of constant velocity.
Westing explained that the induction period is because of the initial entry of water
molecules inside the pre-existing pores which do not perturb the polymer structure.
Here, although these pores are filled up, the interaction among the water molecule
and the polymer chains causes the material to swell and hence changes its rate of
mass uptake.[54]
4.2 Techniques of Determining Mass Uptake
The moisture sorption in-to polymer films has been done various times in
different types of studies. There are many ways to record the amount of water
transferred from the bulk atmosphere in-to the polymer. The majority of these
methods include gravimetric means in determining the advancement of this process.
One of the techniques is dynamic vapor sorption (DVS) analysis. In this technique,
34
working with very small sizes combined together with a dynamic flow of required
vapor significantly reduces time to measure moisture sorption isotherms from weeks
or months to hours or days. Another set of method utilizes relationship connecting
frequency change of an oscillator and its mass load like quartz crystal microbalance
(QCM). Moisture sorption in the polymer causes changes in the interaction between
the atoms within polymer that can be calculated through a multiple ways of
spectroscopic ways including FTIR, NIR, NMR.[55-58]
4.3 Moisture Transport in PLA
The initial study on the permeability of water in PLA was done by Siprsky et
al. in the late 1990s. To study this, polymer films were molded into bags and they
were filled with molecular sieves and then sealed. As a result, the gravimetric
measurement of the mass raised would give values for the permeability. The series of
individual films were used to determine the solubility of water in to the polymer, and
the pairs of values were compared to generate a diffusion coefficient. For systems at
lower temperatures, the solubility of water was larger in polymers, since the partial
pressure of water in the atmosphere is a strongly increasing function with temperature
than the equilibrium water uptake. While crystallinity was expected to give less mass
uptake of water in the polymer because of the organized polymer chains hindering the
penetration of water, nothing happened as predicted. This indicated the presence of
clustering of water in the film which delivers water-polymer interaction trivial
35
relative to cohesive water interaction. Alternatively, diffusion coefficients were seen
to be powerfully increasing functions with respect to temperature.[48]
Sharp et al. compared the water uptake of poly(DL-lactide) and a 50:50
copolymer of PLA with glycolic acid by means of QCM, relative humidity was
controlled within the sample chamber by using saturated salt solution. It was revealed
that the solubility of water in a homopolymer is considerably higher than the
copolymer, and that, with an increase in average molecular weight, there is a slightly
higher sorption in the polymer. One probable justification for this result is that a PLA
with a higher molecular weight has a lower proportion of hydrophilic end group to
hydrophobic chain units. Nevertheless, this justification is contradicted by
Cairncross’ finding that change in the end groups of the polymer does not have an
effect on the sorption properties. Sharp also witnessed that increase in vapor activity
causes an enhancement in the initial rate of sorption, but on the other hand, also
causes an increase in the time desired to reach equilibrium. This is interesting in
terms of DSC studies which showed a decrease in glass transition temperature of the
polymer film with an increase in the moisture sorption due to plasticization, which
should increase the rate of diffusion through the film, thus reducing the decrease in
the sorption rate over time. While, kinetic measurements demonstrated major
negative deviations from the Fickian behavior, representing that rate limiting step of
the process is the swelling kinetics, and that the rate of diffusion is nominal.[59]
36
Yoon compared solubility of water and diffusion coefficient in PLA to their
values in various other polymers. While in the other polymers, crystallinity had a
major impact on the sorption and diffusion properties, no such relationship was found
in PLA, which supported Siparsky’s findings. Interestingly, polyhydroxybutyrate
(PHB), which is more hydrophobic than PLA, showed a crystallinity effect, thus
questioning the explanation of PLA and its non-effect of crystallinity through water
cluster mode of transport through the film.
37
5 Experimental Procedures: Moisture Sorption of PLA
5.1 Introduction
This chapter includes the experimental procedure adopted during the moisture
sorption study of the PLA synthesized. Section 5.2 contains sample preparation
methods, section 5.3 incorporates discussion of film thickness and mass
measurements, and sections 5.4 and 5.5 comprise of instrument setup and
experimental setup respectively.
5.2 Sample Preparation
5.2.1 Sample Solution
Sample solutions were prepared by dissolving the synthesized PLA in
chloroform. Here, chloroform is used as a solvent because the polymer is soluble in it.
The solution was heated in a sealed vial at low temperature (~ 40oC) and stirred
overnight to speed up the dissolution. The caps of the solution’s vials were tightly
sealed with parafilm to prevent any evaporation of chloroform. Avoiding solvent
evaporation is important because loss of any solvent will change the concentration of
the solution. Once the prepared solutions are completely clear and uniform, they can
be further coated on to the quartz crystals.
38
5.2.2 Quartz Crystal
The usual preparation for quartz crystals used for QCM applications is AT-
cut, where the crystals are cut into slices at a 35o10’ angle from the vertical axis and
of few hundred microns thickness. The benefit of this type of geometry is that it gives
steady oscillation. The crystal goes through thickness shear mode (TSM) oscillation,
which generates motion lateral to the surface with lateral amplitude on the order of 1-
2 nm.
Earlier, when the QCM was initially developed, natural quartz was harvested,
chosen for its quality and finally cut in the lab. But, today most of the crystals are
grown using seed crystals in the lab. The seed crystals act as an anchoring point for
the growth of crystal; promoting growth in two directions and restraining growth in
another. The crystals, AT or SC used in majority applications run in the thickness
shear mode at a frequency in the 1-30 MHz range.
The resonance frequency of acoustic resonators depends on pressure,
temperature, and bending stress. Temperature frequency coupling can be reduced by
using special crystal cuts. A commonly used temperature-compensated cut of quartz
is the AT-cut. These types of crystal are singularly rotated Y-axis cuts where the top
and the bottom half of the crystal move in reverse directions during oscillation. The
AT-cut crystal is easily manufactured. But, it has limitations at high and low
temperature because it is easily disturbed by internal stresses due to temperature
gradients in these temperature extremes in comparison to room temperature. These
39
internal stress points create unwanted frequency shifts in crystal, thus decreasing its
precision. Stress-compensated (SC) crystals minimize the frequency changes due to
temperature gradient because they have a doubly-rotated cut (quartz crystals cut on an
angle relative to two of the three crystallographic axes). However, they have more
difficult manufacturing process and thus they are more expensive and are not
extensively commercially available.[60]
In this study mass detectors used were 5MHz, AT-cut quartz crystal
microbalances, having thickness of 0.33 mm, and diameter of 2.45 cm. The electrodes
on both sides of the crystal consisted of a 15 nm layer of chromium, upon which a
gold electrode of 160 nm thickness was vacuum deposited. The electrode on the top,
which is 1.29 cm in diameter, serves as an active surface of the QCM, while the
smaller electrode of 0.66 cm diameter at the bottom completes the electric circuit.
5.2.3 Crystal Coating
The major decisive factors of a good coating are: completely dry,
homogeneous, and of uniform thickness throughout the crystal surface. Once the
sample solution is prepared, the quartz crystals are cleaned to get rid of any deposit
from prior experiments. It is important to know the history of the crystal to clean the
crystal. It is often adequate to dip the crystal for 4-5 minutes in a solvent which is
known to dissolve the earlier-coated polymer. If normal solvents are unsuccessful
then a piranha solution can be used, which is 1:3 volume ratios of hydrogen peroxide
40
and sulfuric acid. It is used for cleaning organic residues off substrates, as this
mixture is a strong oxidizer that removes most organic matter, and it hydroxylates
most surfaces making them extremely hydrophilic.[12] Care must be taken while
using piranha solution, because it is explosive and mixing the solution is exothermic.
Once the crystals are clean and dry, it is weighed by gravimetric balance and their
resonant frequency is measured with the help of quartz crystal microbalance probe.
If the surface of the film is non-uniform then Sauerbrey equation which relates
change in mass and change in frequency as a linear function will not hold true
because of effects related to the pattern of the polymer which is on the electrode.[62]
There are two common methods for creating uniform polymer films on QCM
crystals: spin coating and drop coating. Drop coating is the easiest method: a sample
of coating solution is applied to the quartz crystal by micropipette, it spreads by
gravity and the solvent is allowed to evaporate. Drop coating often leads to
unacceptable coating due to the non-uniformity by the side of edges.
For samples in this thesis research, crystals were coated through spin coating.
In spin coating, an excess amount of solution is placed on the top of the crystal, which
is then rotated at high speed so as to spread the solution by centrifugal force. As the
spinner rotates, the solvent spreads towards the edge of the crystal and excess solution
falls of the substrate with the drying of the solution on top of the crystal occurring
simultaneously. The outcome is a solid film which is not completely dry. The
thickness of the film depends on the viscosity of the solution used and viscosity
41
depends on the polymer taken and its concentration in preparing the solution. In some
situations, the films produced from spin coating are not as transparent as expected,
and they come out to be translucent even when the liquid solution used was clear. The
cause of this is considered due to formation of small bubbles. It is supposed that
condensation of water vapor on the surface of the film from the atmosphere is the
result of these bubbles. The problem of this translucency can be avoided by either
spin coating the crystal in dry atmosphere or raising the temperature of the solution
before applying it on the crystal.
5.2.4 Crystal Drying
When the spin coating of the samples is done, the next step is to completely
remove the solvent to get a fully-dried polymer film. Residual solvent in the film can
affect diffusion and sorption properties of the water on the film. Furthermore, traces
of any solvent left will lead to the inconsistency of sorption results of polymer due to
evaporation of solvent, thus producing mass changes over the period of experimental
runs. Air drying of the polymer films can be done but it can be time consuming and
complete evaporation of the residual solvent is not assured. In our case, drying in an
oven is done as it is more efficient method.
42
5.2.5 Summary for Successful Coating
In this thesis, conditions for successful coating were as follows:
- Prepared 250 µg/µl concentration solution (750 mg of PLA in 3 ml of Chloroform).
- Stirred solution in sealed vial at 40oC for 12 hours.
- Cleaned QCM crystal & mounted on spin coater.
- Deposited ~ 1 ml of solution on crystal.
- Spinned at 3000 rpm for 60 seconds.
- Dried in ambient condition for one hour and then placed inside 70o oven for 12
hours.
5.3 Film Thickness and Mass Measurement
Once the polymer film of the crystal was dried, the mass and thickness were
measured with the quartz crystal microbalance probe. Resonant frequency by a QCM
probe and weight by gravimetric balance of the bare and coated crystal were noted.
By taking the difference of coated crystal mass and bare crystal mass, the gravimetric
mass of the film was calculated. Though, for calculating the mass of film, the
resonant frequency of the bare crystal was subtracted from the coated crystal. The
resulting change in frequency gave mass of the film by the known Sauerbrey equation
(5.2) which is relationship of change in frequency and mass. This method for
calculating mass of film was preferred over gravimetric method. Since, the mass of
43
the film directly over the electrodes is more important, as sorption only in this region
has an effect on the resonant oscillation frequency.
Once the mass of the film was known, the thickness of the film was
determined by the relation:
l=ρA
m (5.1)
Here, m is mass of the polymer film calculated through the Sauerbrey equation. A is
the area of crystal, ρ is the density of polymer and l is the thickness of the polymer
film. The only unknown variable is l , thus we can determine the thickness of the
film. In perfect coating the mass calculated through the Sauerbrey equation should be
equivalent to the calculated gravimetric mass of the polymer. If the mass calculated
through the Sauerbrey equation is less than the gravimetric mass. Then, it may be due
to the enhanced thickness around the border of the crystal which will decrease the
mass density of the polymer over the electrode in comparison to the total crystal.
5.4 Instruments Used
5.4.1 Spin Coater
A SCS1G3P-12 (Cookson Electronics Equipment) spin coater was used for
coating the polymer film. It is a method used to apply uniform thin films to quartz
crystal. Coating was done at 3000 rpm for 60 seconds. Here, excess amount of
44
solution is placed on the top of the crystal, which is then rotated at high speed so as to
spread the solution by centrifugal force.
5.4.2 QCM
The quartz crystal microbalance is a device that measures changes in mass
through variations in the oscillation frequency of a quartz crystal from its resonance
frequency. So, in our study, it is used to determine the effect of relative humidity on
sorption phenomena within polymer films. QCM is a highly mass sensitive measuring
device which can determine as low as 1 ng/cm2. The piezoelectric effect discovered
by Pierre and Jacques Curie in 1880 is the mechanism which is involved in mass
sensing in QCM. Here, an applied, alternating electric field induces oscillations inside
the crystal. The gold electrodes are vacuum-deposited on the quartz crystal detector.
There is a smaller electrode at the bottom whereas the top part has a larger electrode.
An alternating electric potential is applied to the two electrodes that causes electrodes
to oscillate at a rate which decays while moving outward from the center. The
function of the phase lock oscillator is to examine the crystal current using an internal
oscillator and adjust its frequency to the point where crystal voltage is in phase with
the current. This point is known as resonant frequency, where the crystal current is
directly proportional to the crystal’s conductance.[61]
45
The absorption of mass onto the quartz crystals surface causes the change in
mass, which is proportional to change in frequency, ∆f, as stated by Sauerbrey equation
[62]:
A
m
c
ff
∆−=∆
ρ
202
(5.2)
Where ∆m is the mass change over the piezoelectric active area (A), f0 is the bare
crystal’s resonant frequency, ρq is the density (2.65 g/cm3) of quartz, and cq is the
elastic constant (2.95 X 10¹¹ dyn/cm2) of quartz. After simplifying the above
expression, the equation becomes:
fCA
m ∆−=∆, (5.3)
where C is a constant whose value is 56.6 ng cm-2 Hz-1 for an AT-cut crystal with
resonant frequency 5MHz, this constant depends on the properties and intrinsic
properties of the quartz slab. This equation demonstrates that an increase in mass due
to liquid sorption causes decline of the frequency of the crystal.
46
Mass Flow Controller 1
Mass Flow Controller 2
Valve
A B
A
5.5 Experimental Set Up
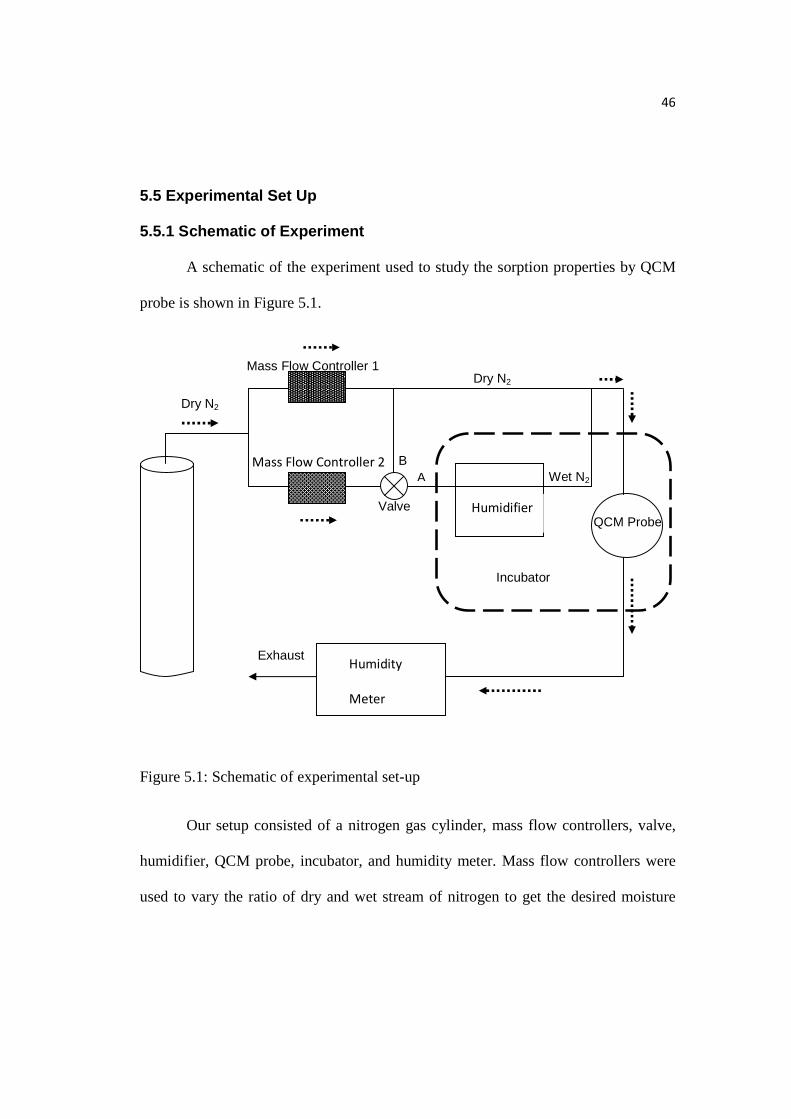
5.5.1 Schematic of Experiment
A schematic of the experiment used to study the sorption properties by QCM
probe is shown in Figure 5.1.
Figure 5.1: Schematic of experimental set-up
Our setup consisted of a nitrogen gas cylinder, mass flow controllers, valve,
humidifier, QCM probe, incubator, and humidity meter. Mass flow controllers were
used to vary the ratio of dry and wet stream of nitrogen to get the desired moisture
Humidifier
Incubator
Dry N2
Dry N2
Wet N2
QCM Probe
Humidity
Meter
Exhaust
47
level. The valve was to bypass the system with mixture of wet + dry stream (Position
A) or completely dry stream (Position B). The humidifier transformed dry stream to
wet stream of N2. The temperature of the system was controlled by the incubator
based on our requirements. The QCM probe was to detect the mass change of the
polymer film due to variation in moisture content by measuring the difference
between the registered frequencies. The humidity meter was downstream and
revealed the most closely water vapor pressure or relative humidity in the system.
The stream of nitrogen left the cylinder at a pressure of 35 psi and then it was
passed through two mass flow controllers with a rate of 10 sccm (standard cubic
centimeters per minute) from each. Opening of valve’s position A gave 10 sccm of
dry stream + 10 sccm of wet stream and opening of valve’s position B gave 20 sccm
of dry stream. The polymer film was dried by opening valve’s position B and
measured the frequency when the polymer film was dried and equilibrated (negligible
change in relative humidity and frequency with time). Further, we opened the valve’s
position A which increased the moisture content or relative humidity of the system.
Subsequently, we noted the frequency at some humidity once the system came in
equilibrium. The difference in the frequency gave the mass uptake of water by
polymer film. The experiment was repeated several times by opening the valve’s
position A and B or sorption and desorption respectively to get picture of sorption
isotherm. Relative humidity could also be varied by changing the temperature of the
incubator or by varying the ratio of wet and dry stream with mass flow controller.
48
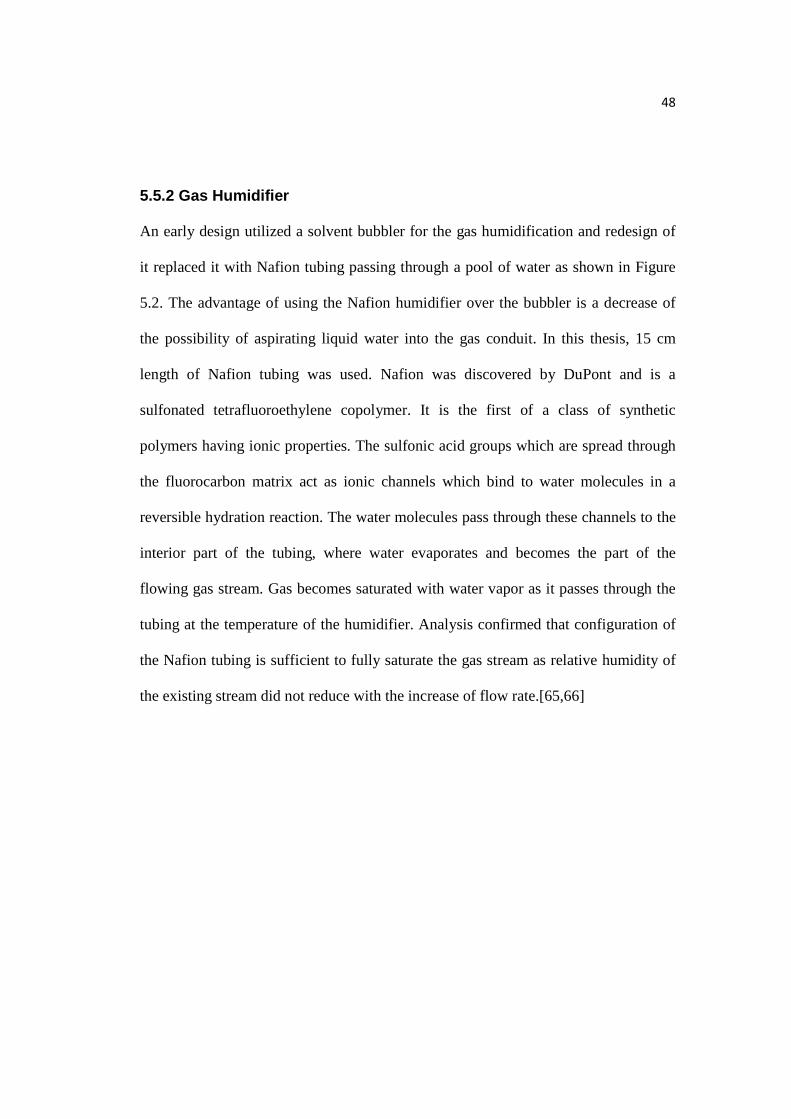
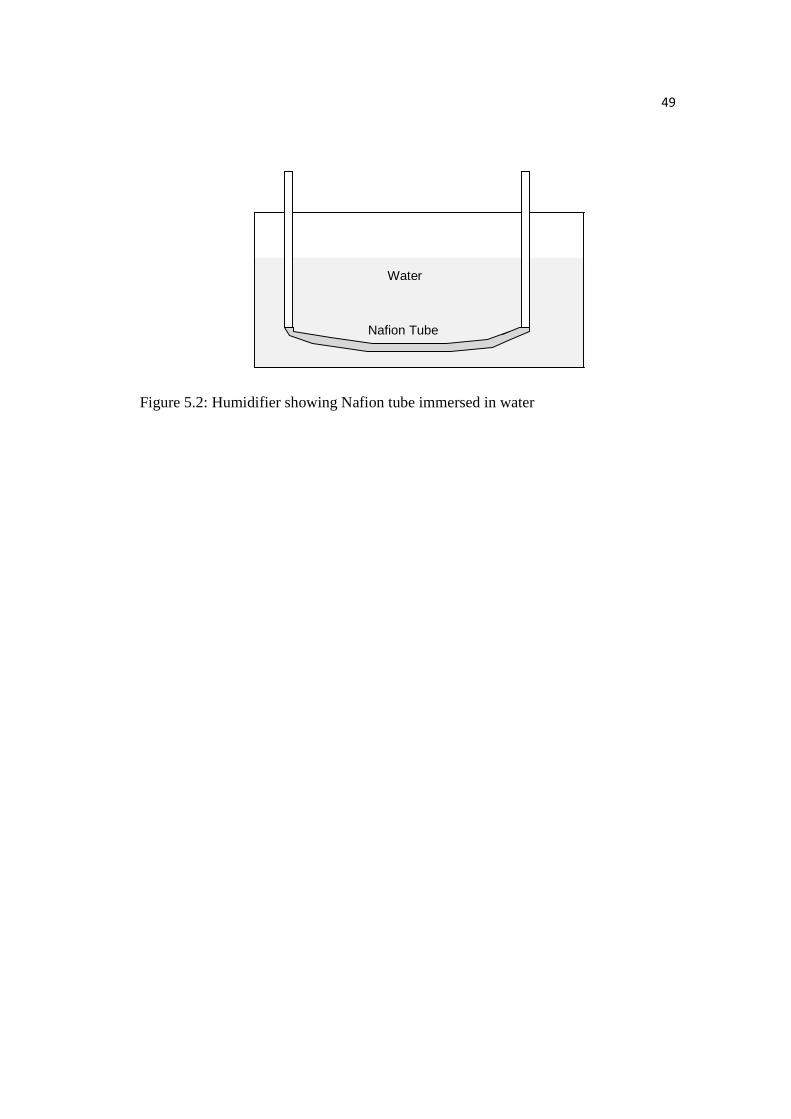
5.5.2 Gas Humidifier
An early design utilized a solvent bubbler for the gas humidification and redesign of
it replaced it with Nafion tubing passing through a pool of water as shown in Figure
5.2. The advantage of using the Nafion humidifier over the bubbler is a decrease of
the possibility of aspirating liquid water into the gas conduit. In this thesis, 15 cm
length of Nafion tubing was used. Nafion was discovered by DuPont and is a
sulfonated tetrafluoroethylene copolymer. It is the first of a class of synthetic
polymers having ionic properties. The sulfonic acid groups which are spread through
the fluorocarbon matrix act as ionic channels which bind to water molecules in a
reversible hydration reaction. The water molecules pass through these channels to the
interior part of the tubing, where water evaporates and becomes the part of the
flowing gas stream. Gas becomes saturated with water vapor as it passes through the
tubing at the temperature of the humidifier. Analysis confirmed that configuration of
the Nafion tubing is sufficient to fully saturate the gas stream as relative humidity of
the existing stream did not reduce with the increase of flow rate.[65,66]
49
Figure 5.2: Humidifier showing Nafion tube immersed in water
Nafion Tube
Water
50
6 Results and Discussion: Synthesis Experiments
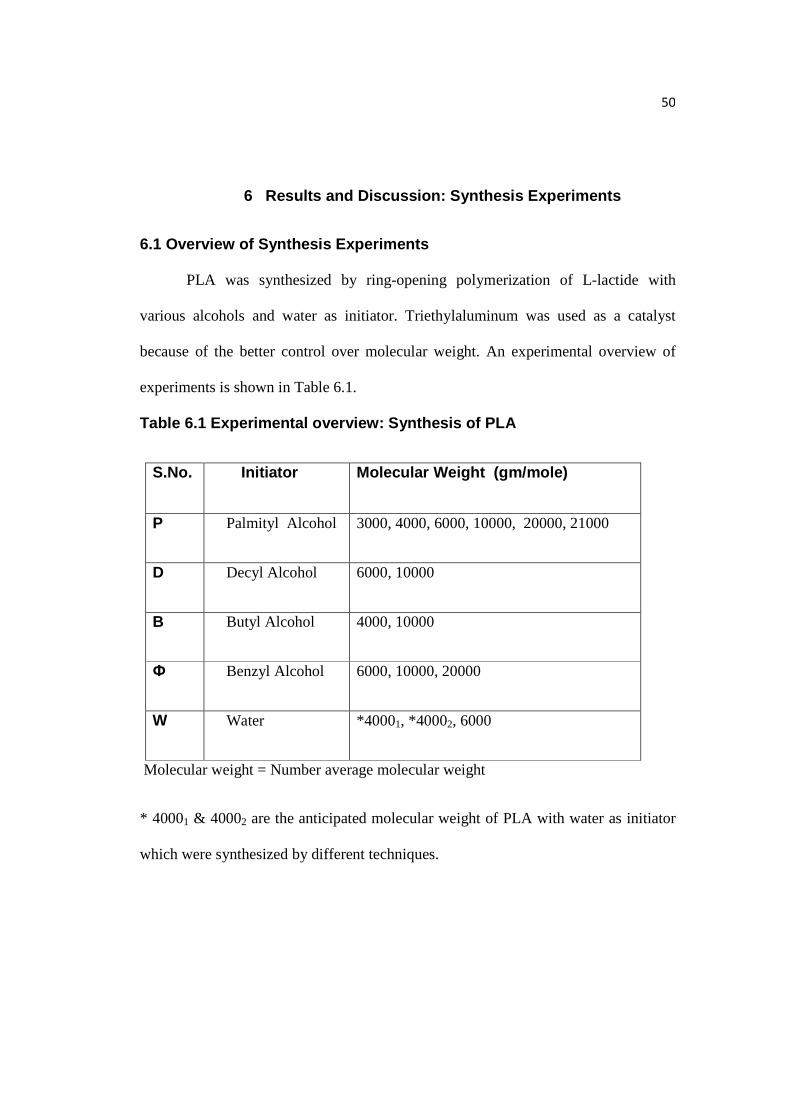
6.1 Overview of Synthesis Experiments
PLA was synthesized by ring-opening polymerization of L-lactide with
various alcohols and water as initiator. Triethylaluminum was used as a catalyst
because of the better control over molecular weight. An experimental overview of
experiments is shown in Table 6.1.
Table 6.1 Experimental overview: Synthesis of PLA
S.No. Initiator Molecular Weight (gm/mole)
P Palmityl Alcohol 3000, 4000, 6000, 10000, 20000, 21000
D Decyl Alcohol 6000, 10000
B Butyl Alcohol 4000, 10000
Ф Benzyl Alcohol 6000, 10000, 20000
W Water *40001, *40002, 6000
Molecular weight = Number average molecular weight
* 40001 & 40002 are the anticipated molecular weight of PLA with water as initiator
which were synthesized by different techniques.
51
A variety of alcohols were used as initiators like Palmityl (C16), Decyl (C10),
Butyl (C4) and Benzyl (C6H5) alcohols. One end group of PLA changed based on the
initiators used, taking benzyl alcohol and not Palmityl alcohol gives benzyl end
instead of Palmityl end. The use of alcohol initiators and Triethylaluminum as
catalyst produced PLA with molecular weight as lower as 4000 and having good
polydispersity (<1.5) index.
Synthesis of PLA with water as an initiator did not give good results. Here,
water was directly added to the monomer as was previously done with other initiators.
A reaction was run to prepare PLA with molecular weight 40001 and 6000 but the
polymer did not precipitate in methanol. This was due to formation of oligomers and
a very low molecular weight polymer which were probably formed due to
transesterification (exchanging the alkoxy group of an ester compound with another
alcohol) reactions. To better control water concentration, toluene was saturated with
water and then a known volume of it was added to L-lactide in the reaction vessel so
as to give the desired amount of water to initiate the reaction. Synthesis of PLA of
molecular weight 40002 was done using this technique. But, this method also did not
yield any polymer. Probably, a low molecular polymer was formed which remain
dissolved in methanol.
52
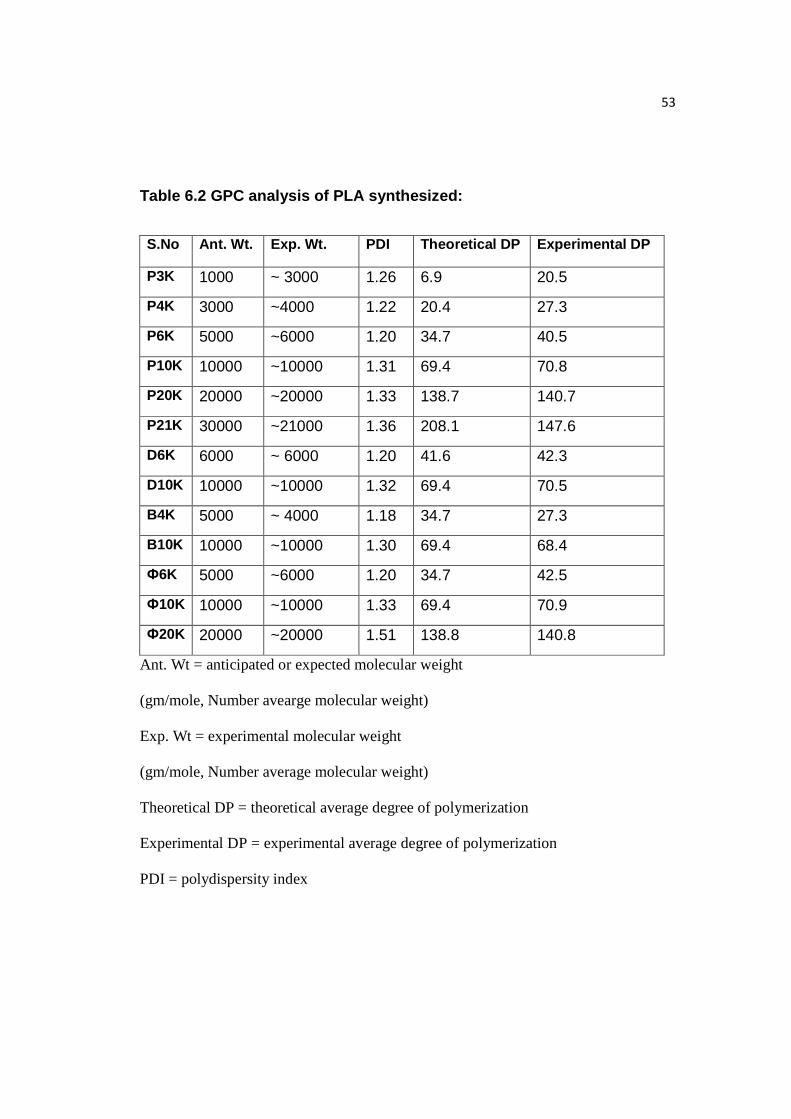
6.2 Controlling Molecular Weight & GPC Analysis
Molecular weight was controlled by varying the ratio of L-lactide monomer to
Alcohol (C16 Palmityl, C10 Decyl, C4 Butyl, C6H5 Benzyl) as shown in Table 6.2
and the plot denoted by Figure 6.1. Polydispersity (PDI) index is the ratio of weight
average molecular weight to the number average molecular weight. DP is the average
degree of polymerization of the PLA. GPC analysis of all the PLA samples
synthesized is attached in Appendix A.
53
Table 6.2 GPC analysis of PLA synthesized:
S.No Ant. Wt. Exp. Wt. PDI Theoretical DP Experimental DP
P3K 1000 ~ 3000 1.26 6.9 20.5
P4K 3000 ~4000 1.22 20.4 27.3
P6K 5000 ~6000 1.20 34.7 40.5
P10K 10000 ~10000 1.31 69.4 70.8
P20K 20000 ~20000 1.33 138.7 140.7
P21K 30000 ~21000 1.36 208.1 147.6
D6K 6000 ~ 6000 1.20 41.6 42.3
D10K 10000 ~10000 1.32 69.4 70.5
B4K 5000 ~ 4000 1.18 34.7 27.3
B10K 10000 ~10000 1.30 69.4 68.4
Ф6K 5000 ~6000 1.20 34.7 42.5
Ф10K 10000 ~10000 1.33 69.4 70.9
Ф20K 20000 ~20000 1.51 138.8 140.8
Ant. Wt = anticipated or expected molecular weight
(gm/mole, Number avearge molecular weight)
Exp. Wt = experimental molecular weight
(gm/mole, Number average molecular weight)
Theoretical DP = theoretical average degree of polymerization
Experimental DP = experimental average degree of polymerization
PDI = polydispersity index
54
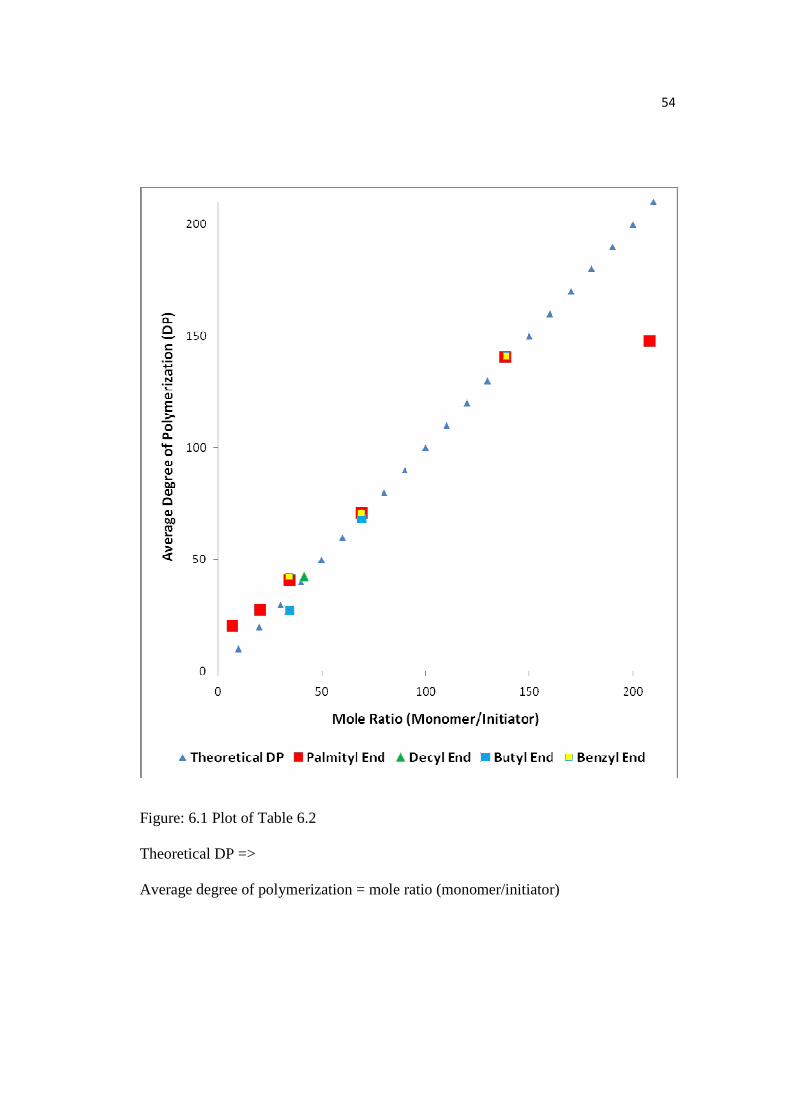
Figure: 6.1 Plot of Table 6.2
Theoretical DP =>
Average degree of polymerization = mole ratio (monomer/initiator)
55
The blue triangle shows theoretical DP in the graph as shown in Figure 6.1
and was calculated assuming that all the alcohol groups participated in L-lactide
initiation and all monomer was consumed. The experimental DP coincided well with
the theoretical DP. This showed that the above assumption were convincing under the
polymerization conditions. This results indicated that alcohols used were true
initiators for lactide polymerization and triethylaluminum acted as a catalyst.
Furthermore, the low PDI (<1.5) represented minimal transesterification.
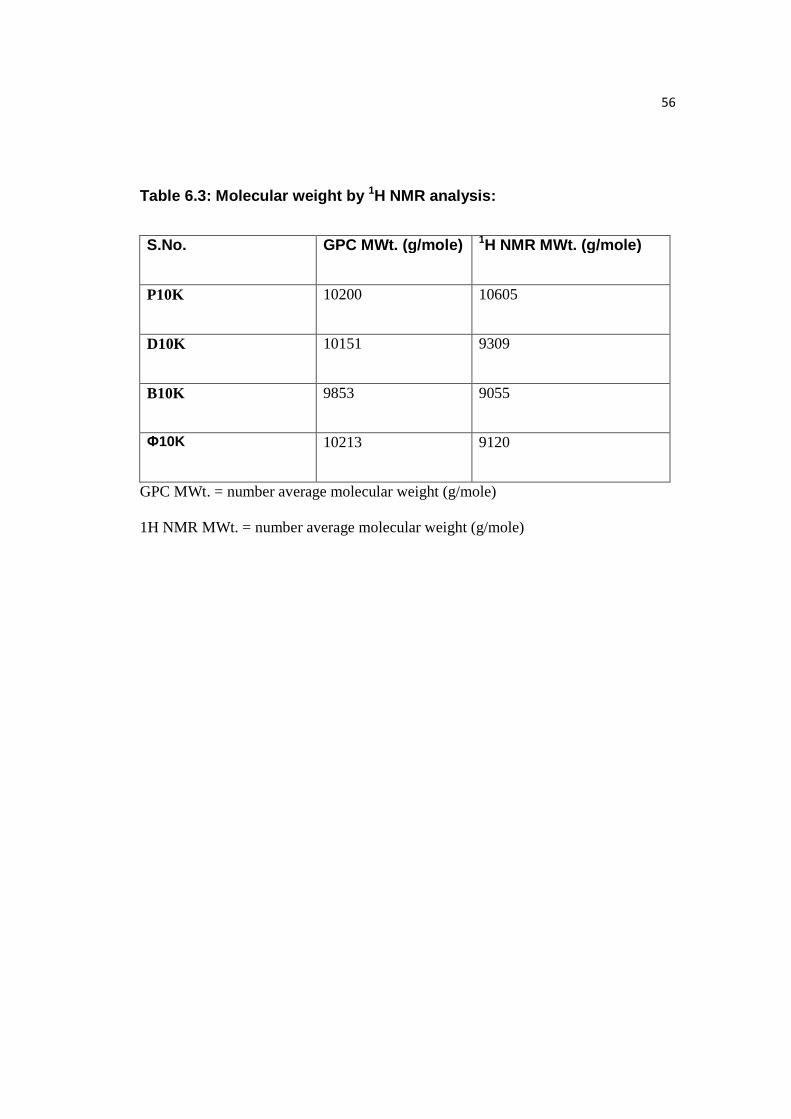
6.3 1H NMR Analysis
Palmityl, decyl, butyl, and benzyl end groups were confirmed by Varian 500
MHz 1H NMR analysis of the PLA samples. As seen in Figure 6.2, P10K is shown,
and the number average molecular weight was calculated to be 10,605 by comparing
‘a’ and ‘c1’ peak’s area, which is close to what was obtained through GPC (10,200).
Similarly, comparison of molecular weight of B10K, D10K, and Ф10K samples
through 1H NMR and GPC was done, given in Table 6.3. 1H NMR analysis of PLA
with decyl (D), butyl (B), and benzyl (Ф) ends is given in Appendix B and it showed
that molecular weight calculated by 1H NMR was comparable to GPC molecular
weight.
56
Table 6.3: Molecular weight by 1H NMR analysis:
S.No. GPC MWt. (g/mole) 1H NMR MWt. (g/mole)
P10K 10200 10605
D10K 10151 9309
B10K 9853 9055
Ф10K 10213 9120
GPC MWt. = number average molecular weight (g/mole)
1H NMR MWt. = number average molecular weight (g/mole)
57
Figure 6.2: 1H NMR analysis of P10K
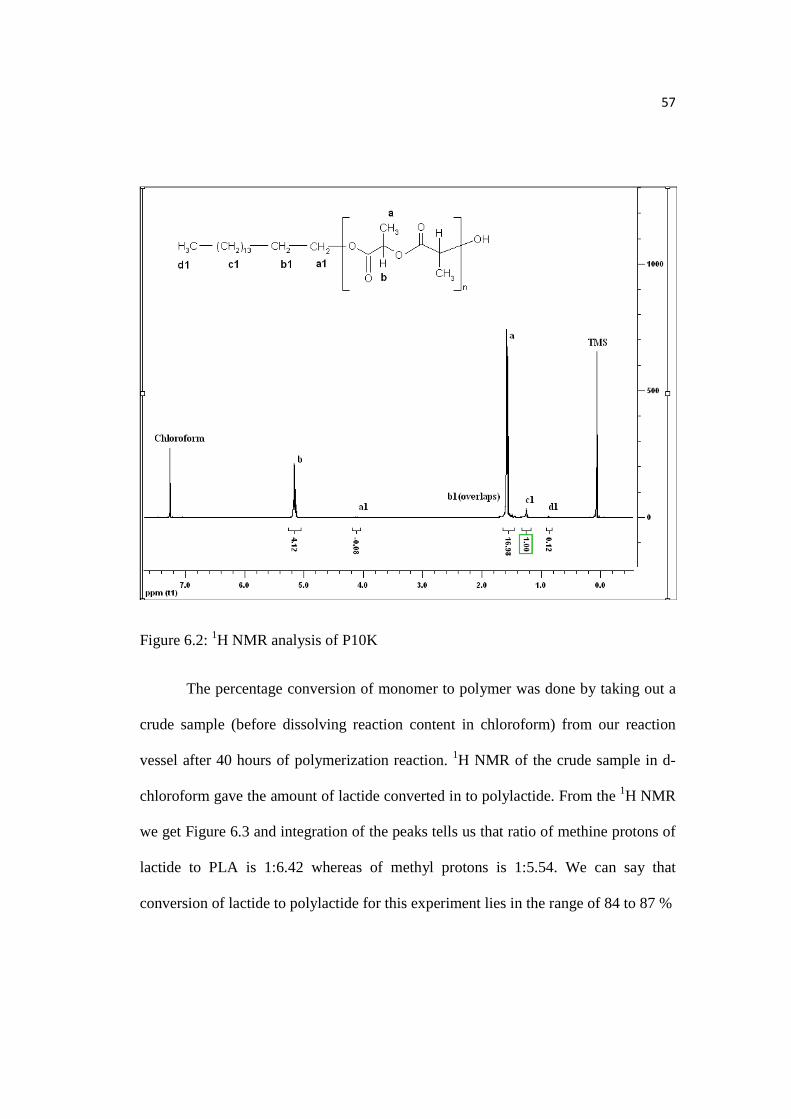
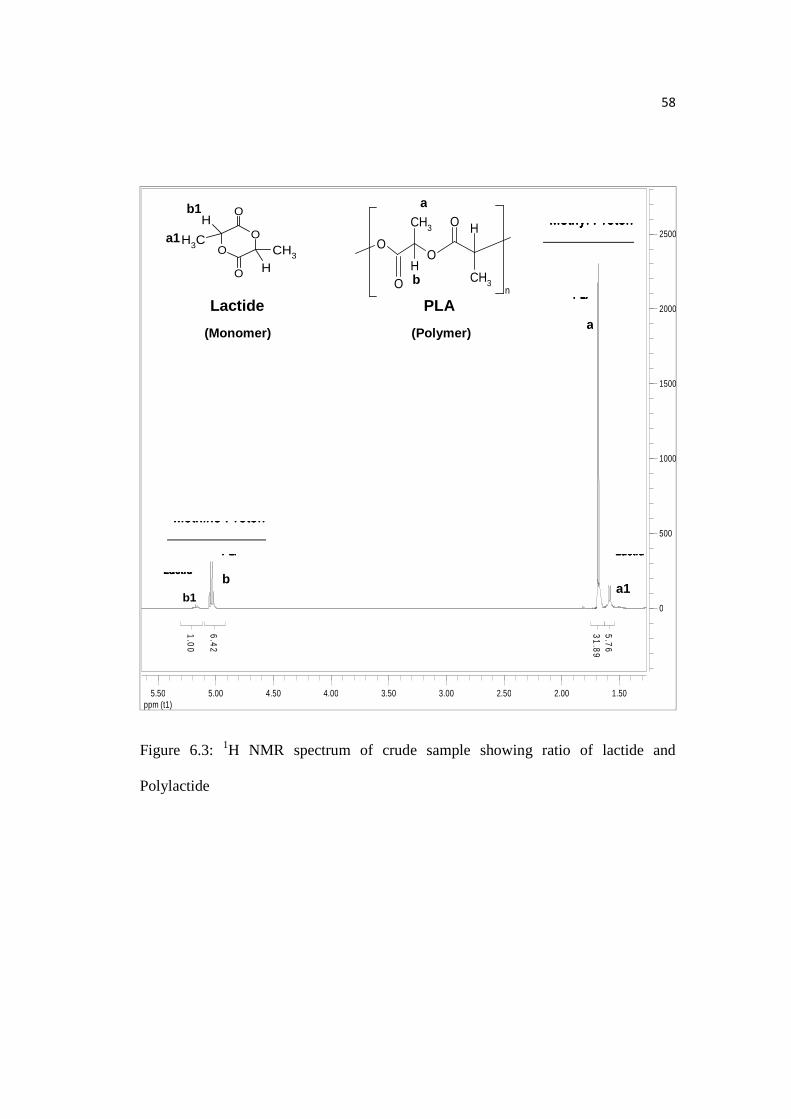
The percentage conversion of monomer to polymer was done by taking out a
crude sample (before dissolving reaction content in chloroform) from our reaction
vessel after 40 hours of polymerization reaction. 1H NMR of the crude sample in d-
chloroform gave the amount of lactide converted in to polylactide. From the 1H NMR
we get Figure 6.3 and integration of the peaks tells us that ratio of methine protons of
lactide to PLA is 1:6.42 whereas of methyl protons is 1:5.54. We can say that
conversion of lactide to polylactide for this experiment lies in the range of 84 to 87 %
58
ppm (t1)1.502.002.503.003.504.004.505.005.50
0
500
1000
1500
2000
2500
1.00
6.42
31.89
5.76
PLAPLAPLAPLA
Methine ProtonsMethine ProtonsMethine ProtonsMethine Protons
LactideLactideLactideLactide
Methyl ProtonsMethyl ProtonsMethyl ProtonsMethyl Protons
PLAPLAPLAPLA
LactideLactideLactideLactide
Figure 6.3: 1H NMR spectrum of crude sample showing ratio of lactide and
Polylactide
OO
O
O
CH3
H
H
CH3
Lactide
(Monomer)
PLA
(Polymer )
b1
b a1
a
b O
O
CH3
OH
O
CH3
H
n
a b1
a1
59
6.4 DSC Analysis
Thermal behavior, that is, glass transition temperature (Tg) and melting
temperature (Tm ) of the PLA synthesized were analysed with DSC. Tg and Tm of
PLA with Palmityl, Decyl, Butyl, and Benzyl end is shown in Table 6.4. It is
observed that when molcular weight increases, the Tg and Tm of PLA increases
simultanously. This fits with the existing concept of polymers that when molecular
weight increases, chain entanglement increases and therefore Tg & Tm increases.
The results for PLA with same molecular weight but with different end groups
show that there is not significant difference between Tg & Tm. This is likely due to
highest weight fraction of end group is ~7.5%, that is, in PLA with Palmityl end with
molecular weight 3,000 and this fraction is not high enough to show the thermal
behavior changes with different end groups.
The percentage crystallinity c) of the samples was calculated by the
following equation[67,68]:
% c = Hm / 93) X 100 (6.1)
where Hm is the melting enthalpy and 93 (J/g) the melting enthalpy of totally
crystallized PLA. Hm was calculated from the first heating (5oC/min) cycle of DSC.
Percentage crystallinity varied form 44% to 73% as shown in Table 6.4 and increased
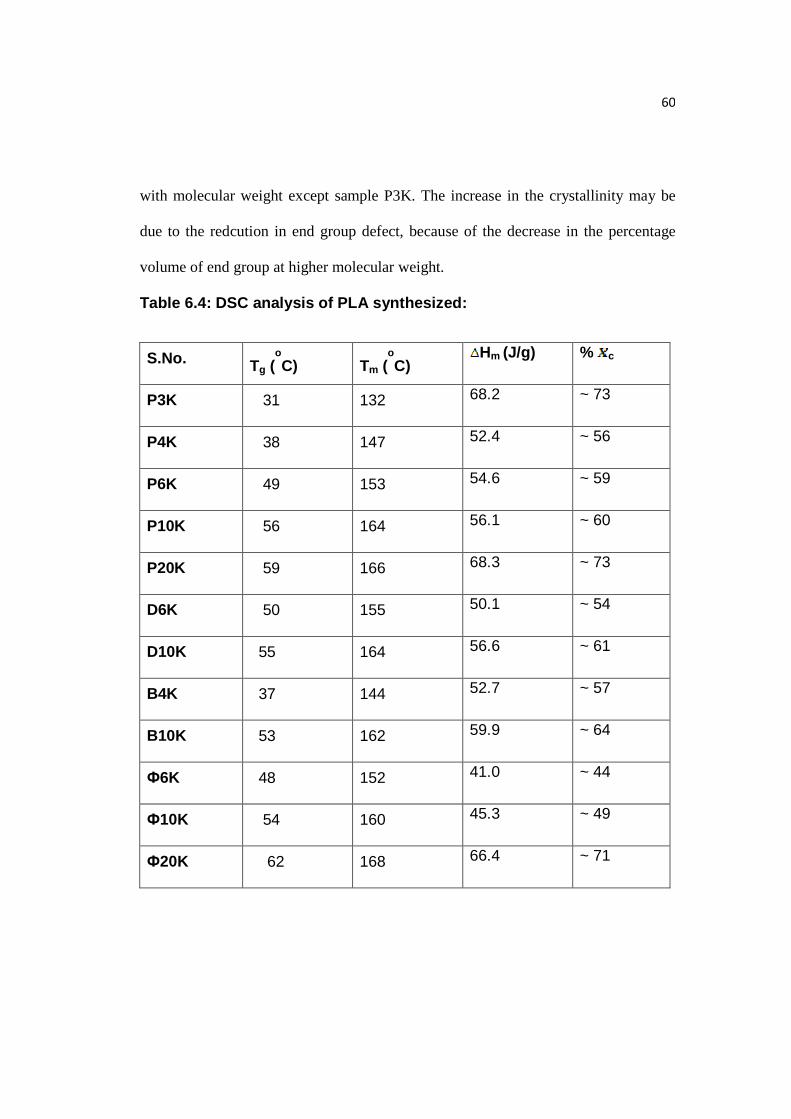
60
with molecular weight except sample P3K. The increase in the crystallinity may be
due to the redcution in end group defect, because of the decrease in the percentage
volume of end group at higher molecular weight.
Table 6.4: DSC analysis of PLA synthesized:
S.No. Tg (oC) Tm (
oC)
Hm (J/g) % c
P3K 31 132 68.2 ~ 73
P4K 38 147 52.4 ~ 56
P6K 49 153 54.6 ~ 59
P10K 56 164 56.1 ~ 60
P20K 59 166
68.3 ~ 73
D6K 50 155 50.1 ~ 54
D10K 55 164 56.6 ~ 61
B4K 37 144 52.7 ~ 57
B10K 53 162 59.9 ~ 64
Ф6K 48 152 41.0 ~ 44
Ф10K 54 160 45.3 ~ 49
Ф20K 62 168 66.4 ~ 71
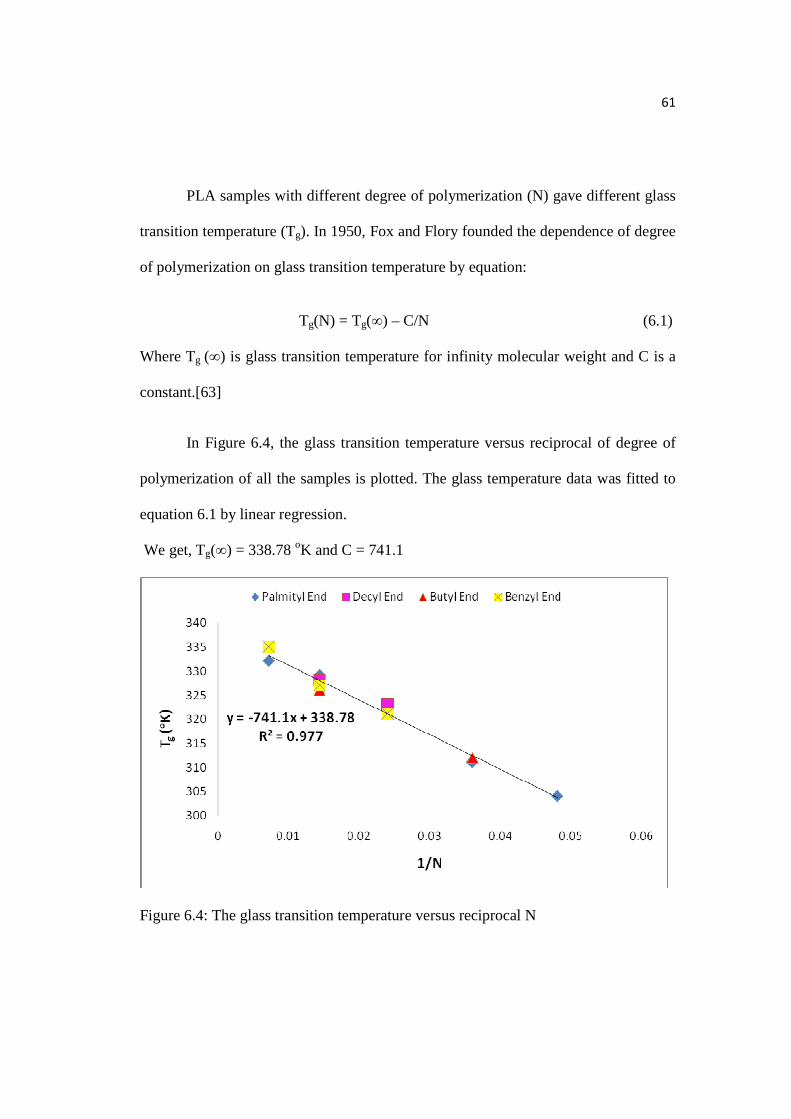
61
PLA samples with different degree of polymerization (N) gave different glass
transition temperature (Tg). In 1950, Fox and Flory founded the dependence of degree
of polymerization on glass transition temperature by equation:
Tg(N) = Tg(∞) – C/N (6.1) Where Tg (∞) is glass transition temperature for infinity molecular weight and C is a
constant.[63]
In Figure 6.4, the glass transition temperature versus reciprocal of degree of
polymerization of all the samples is plotted. The glass temperature data was fitted to
equation 6.1 by linear regression.
We get, Tg(∞) = 338.78 oK and C = 741.1
Figure 6.4: The glass transition temperature versus reciprocal N
62
7 Results and Discussion: Sorption Experiments
7.1 Overview of Sorption Experiments
Sorption experiments were run on the synthesized modified PLA samples.
Ten different PLA samples were chosen for sorption experiments (listed in Table
7.1). For each sample, three replicas of crystal were preapared and at least three
sorption/desorption experiments were performed.
Film thickness of the samples is listed in Table 7.1. Thickness was determined
as previously described in section 5.3. Thickness of all the samples varies from 4.5 to
5.3 µm except Ф20K. Thickness of Ф20K is ~6.9 µm, which is considerably higher
than other samples and may be due to its high molecular weight.
Each poymer film sorption experiment lasted 12 hours and had three
sorption/desorption cycles. WVP (water vapor partial pressure) and corresponding
frequency was recorded every two hours. Prior experiments measuring water vapor
pressure showed that two hours were sufficent for the polymer to equilibrate in the
sorption and desorption cycles, as shown in Appendix C. Ambient temperature in all
the runs was maintained at 21.9oC in an incubator.
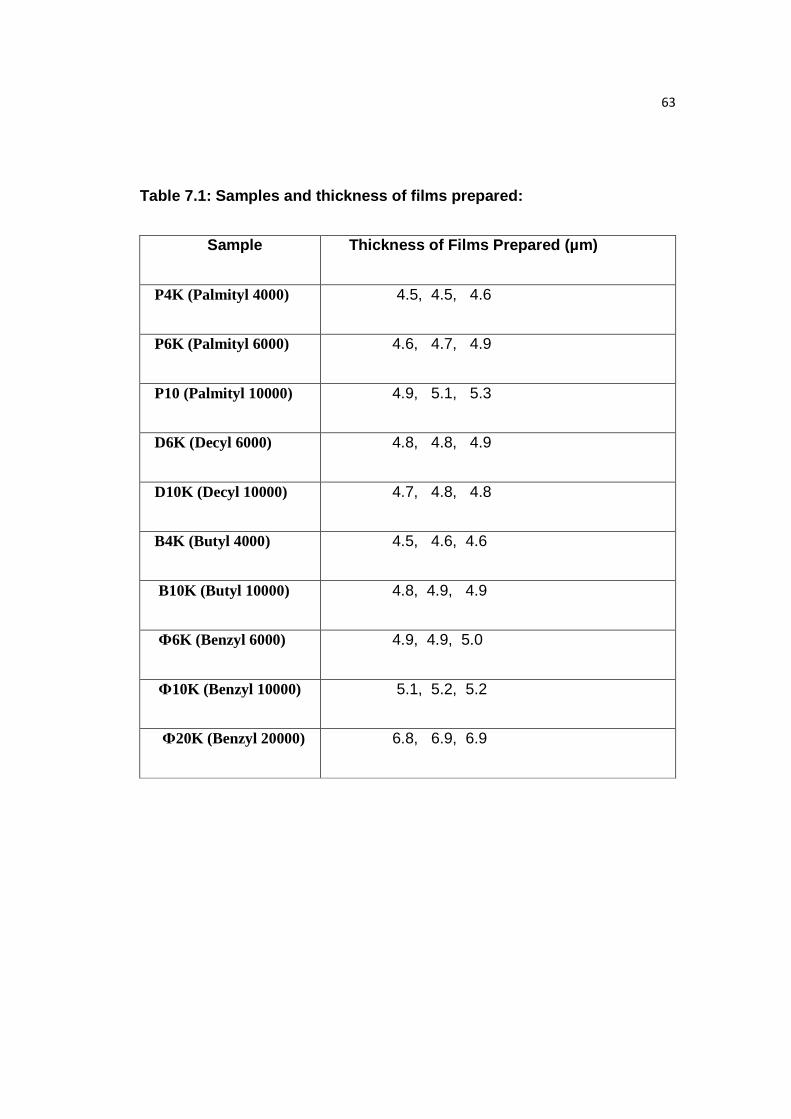
63
Table 7.1: Samples and thickness of films prepared:
Sample Thickness of Films Prepared (µm)
P4K (Palmityl 4000) 4.5, 4.5, 4.6
P6K (Palmityl 6000) 4.6, 4.7, 4.9
P10 (Palmityl 10000) 4.9, 5.1, 5.3
D6K (Decyl 6000) 4.8, 4.8, 4.9
D10K (Decyl 10000) 4.7, 4.8, 4.8
B4K (Butyl 4000) 4.5, 4.6, 4.6
B10K (Butyl 10000) 4.8, 4.9, 4.9
Ф6K (Benzyl 6000) 4.9, 4.9, 5.0
Ф10K (Benzyl 10000) 5.1, 5.2, 5.2
Ф20K (Benzyl 20000) 6.8, 6.9, 6.9
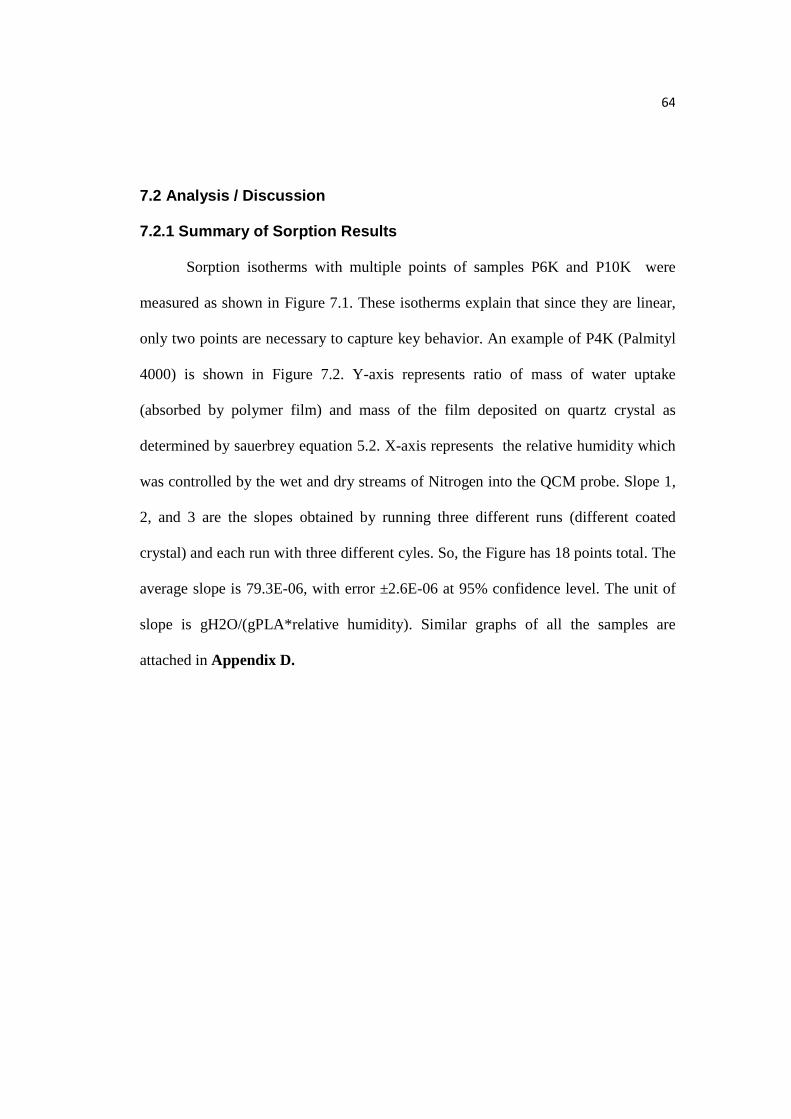
64
7.2 Analysis / Discussion
7.2.1 Summary of Sorption Results
Sorption isotherms with multiple points of samples P6K and P10K were
measured as shown in Figure 7.1. These isotherms explain that since they are linear,
only two points are necessary to capture key behavior. An example of P4K (Palmityl
4000) is shown in Figure 7.2. Y-axis represents ratio of mass of water uptake
(absorbed by polymer film) and mass of the film deposited on quartz crystal as
determined by sauerbrey equation 5.2. X-axis represents the relative humidity which
was controlled by the wet and dry streams of Nitrogen into the QCM probe. Slope 1,
2, and 3 are the slopes obtained by running three different runs (different coated
crystal) and each run with three different cyles. So, the Figure has 18 points total. The
average slope is 79.3E-06, with error ±2.6E-06 at 95% confidence level. The unit of
slope is gH2O/(gPLA*relative humidity). Similar graphs of all the samples are
attached in Appendix D.
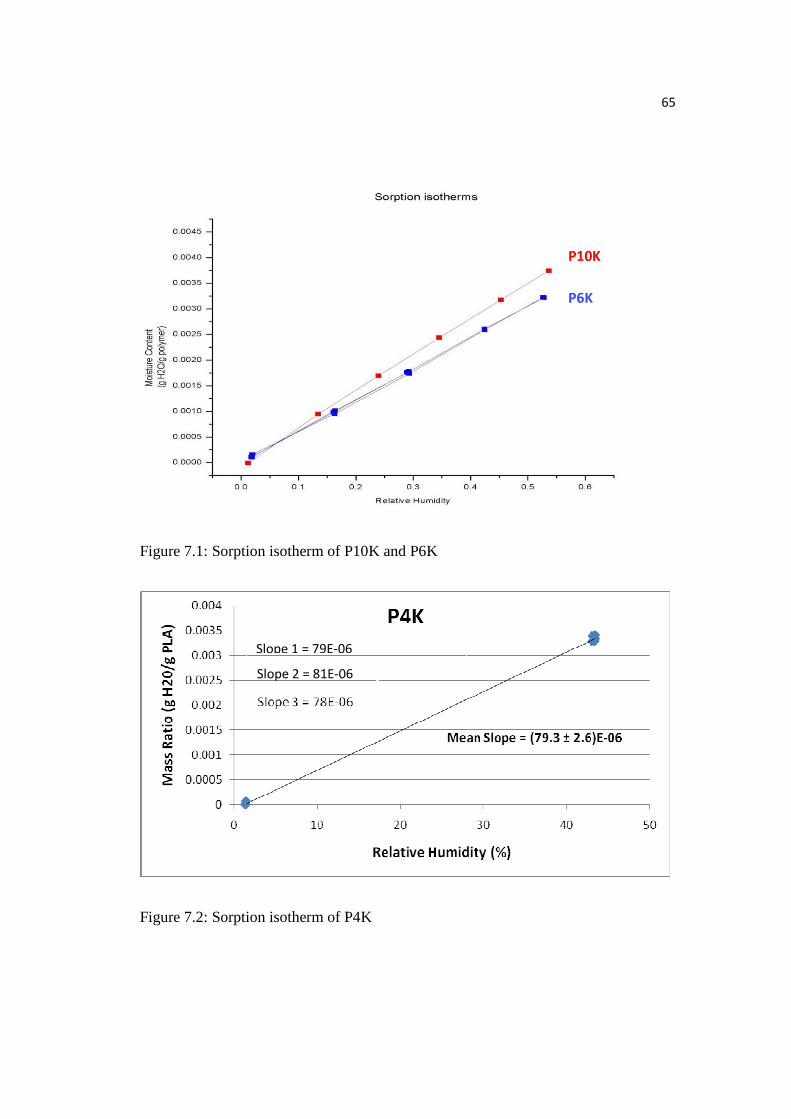
65
Figure 7.1: Sorption isotherm of P10K and P6K
Figure 7.2: Sorption isotherm of P4K
P6K
P10K
Slope 1 = 79E-06
Slope 2 = 81E-06
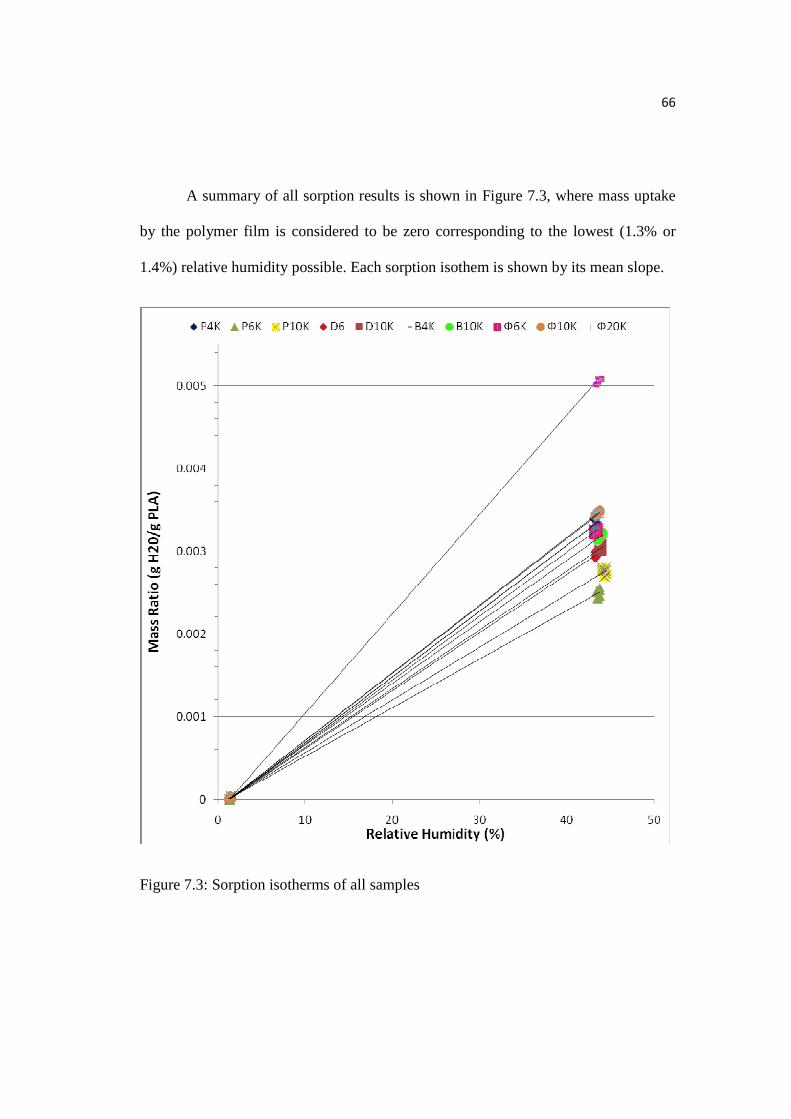
66
A summary of all sorption results is shown in Figure 7.3, where mass uptake
by the polymer film is considered to be zero corresponding to the lowest (1.3% or
1.4%) relative humidity possible. Each sorption isothem is shown by its mean slope.
Figure 7.3: Sorption isotherms of all samples
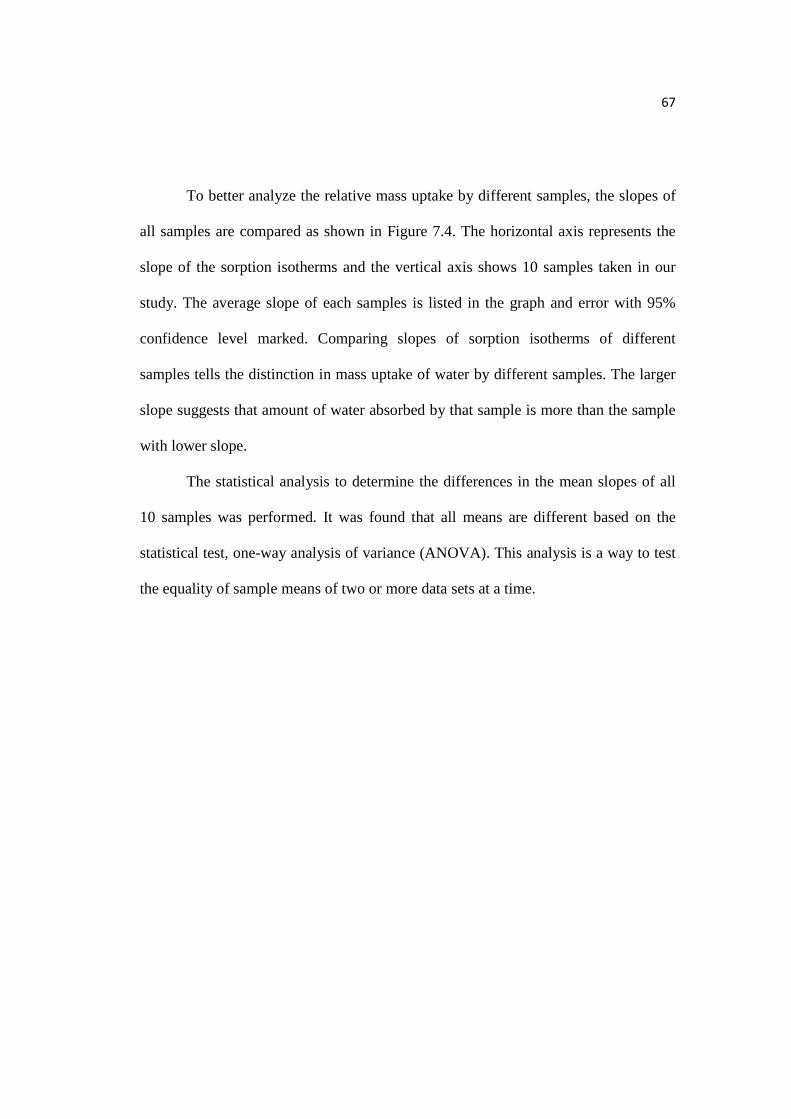
67
To better analyze the relative mass uptake by different samples, the slopes of
all samples are compared as shown in Figure 7.4. The horizontal axis represents the
slope of the sorption isotherms and the vertical axis shows 10 samples taken in our
study. The average slope of each samples is listed in the graph and error with 95%
confidence level marked. Comparing slopes of sorption isotherms of different
samples tells the distinction in mass uptake of water by different samples. The larger
slope suggests that amount of water absorbed by that sample is more than the sample
with lower slope.
The statistical analysis to determine the differences in the mean slopes of all
10 samples was performed. It was found that all means are different based on the
statistical test, one-way analysis of variance (ANOVA). This analysis is a way to test
the equality of sample means of two or more data sets at a time.
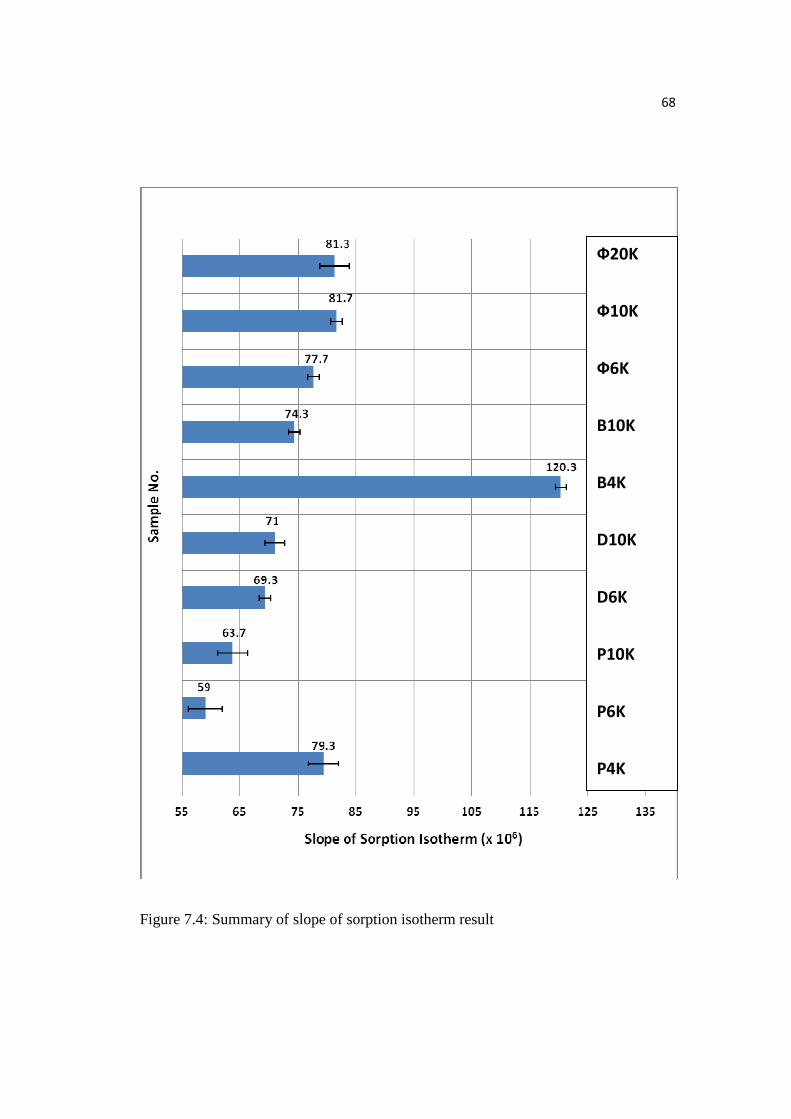
68
Figure 7.4: Summary of slope of sorption isotherm result
Ф20K
Ф10K
Ф6K
B10K
B4K
D10K
D6K
P10K
P6K
P4K
69
7.2.2 Comparison of P4K, P6K, P10K
One-way ANOVA statistical analysis showed that the differences in the
sample means of P4K, P6K, and P10K was statistically significant at 95% confidence
level, shown in Figure 7.5.
Figure 7.5: Comparison of slopes of sorption isotherms of P4K, P6K, and P10K
As molecular weight decreases, aliphatic content at the end group increases
from ~2.3% (P10K) to ~5.7% (P4K) by mass. There is a decrease in mass uptake of
water from P10K to P6K but it again increases if the molecular weight is decreased
further. Possibly, molecular weight and aliphatic content both contributed towards
sorption properties. Where, increase in aliphatic content (hydrophobic end group) of
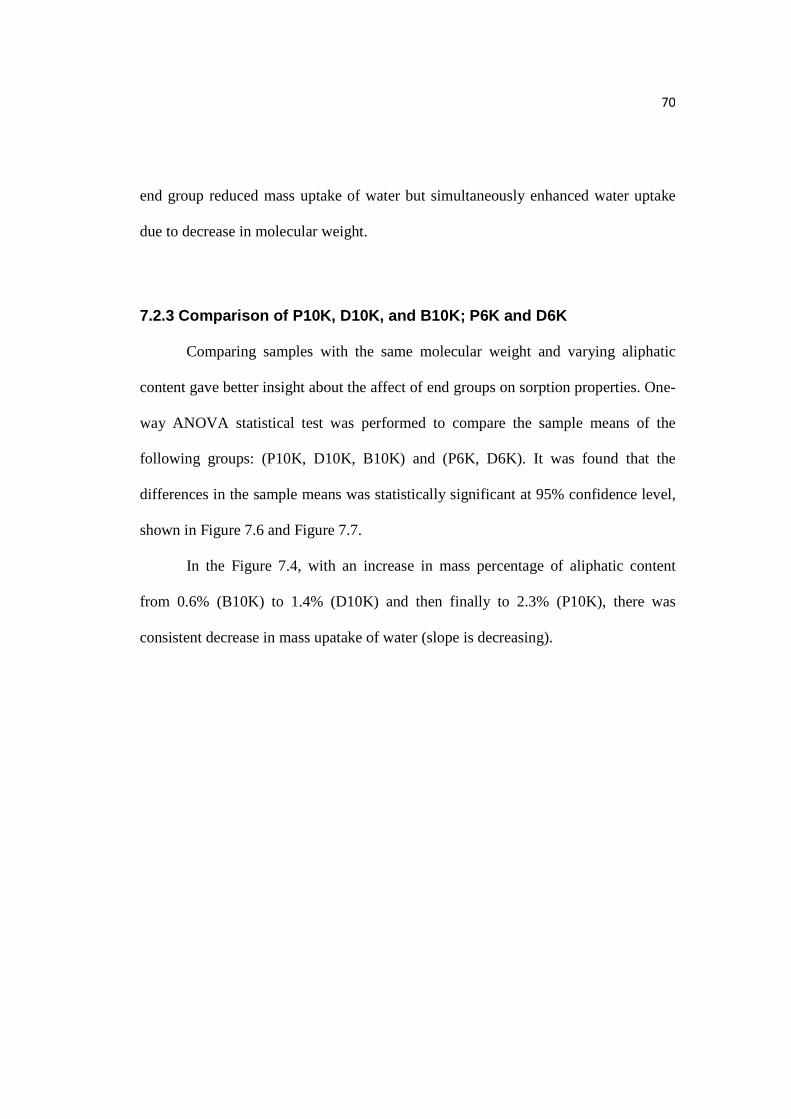
70
end group reduced mass uptake of water but simultaneously enhanced water uptake
due to decrease in molecular weight.
7.2.3 Comparison of P10K, D10K, and B10K; P6K and D 6K
Comparing samples with the same molecular weight and varying aliphatic
content gave better insight about the affect of end groups on sorption properties. One-
way ANOVA statistical test was performed to compare the sample means of the
following groups: (P10K, D10K, B10K) and (P6K, D6K). It was found that the
differences in the sample means was statistically significant at 95% confidence level,
shown in Figure 7.6 and Figure 7.7.
In the Figure 7.4, with an increase in mass percentage of aliphatic content
from 0.6% (B10K) to 1.4% (D10K) and then finally to 2.3% (P10K), there was
consistent decrease in mass upatake of water (slope is decreasing).
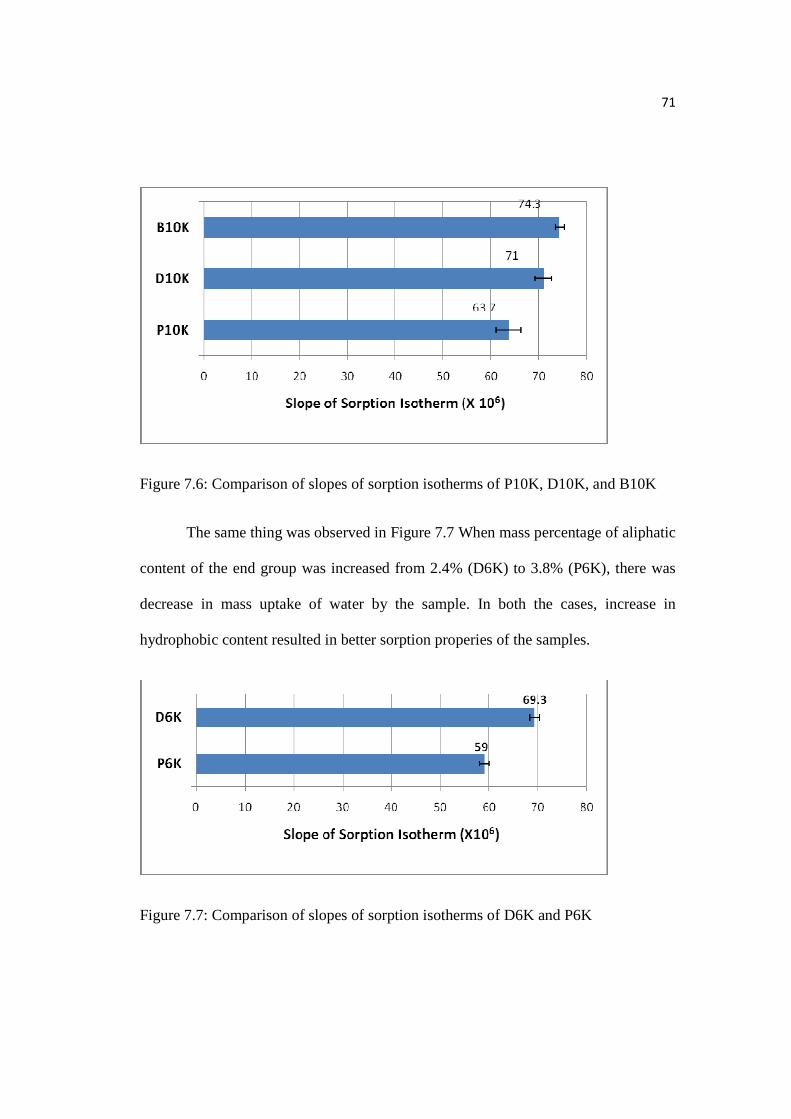
71
Figure 7.6: Comparison of slopes of sorption isotherms of P10K, D10K, and B10K
The same thing was observed in Figure 7.7 When mass percentage of aliphatic
content of the end group was increased from 2.4% (D6K) to 3.8% (P6K), there was
decrease in mass uptake of water by the sample. In both the cases, increase in
hydrophobic content resulted in better sorption properies of the samples.
Figure 7.7: Comparison of slopes of sorption isotherms of D6K and P6K
72
7.2.4 Comparison of Aromatic End Group with Aliphat ic End Group
At first, samples Ф20K, Ф10K, and Ф6K were compared, where Ф20K and
Ф10K were not statistically different ,so they could not be compared. Though, Ф6K
was statistically different than Ф20K and Ф10K as shown in Figure 7.2. When slopes
were compared, mass uptake of water in Ф6K was found to be less than Ф20K and
Ф10K. More samples were needed to draw any conclusion based on aromatic end
content.
Samples Ф6K, P6K, and D6K were compared and the amount of mass uptake
of water was highest in Ф6K. Similarly, Ф10K, P10K, D10K, and B10K were
compared, again mass uptake of water in Ф10K was highest. This comparison
showed that the aromatic end content (Benzyl end) had the highest mass uptake of
water when compared to any aliphatic end content sample of the same molecular
weight.
7.2.5 Analysis of B4K & P4K
Mass uptake of water in B4K was highest among all the samples studied. As
shown by Figure 7.4. It had a slope of 120.3 ± 1 (Appendix D). The mass uptake of
water was second highest among aliphatic end content end group samples. High mass
uptake of water in B4K and P4K could be due to the low molecular weight of the
samples. Whereas, mass uptake of water of B4K is higher than P4K. This could be
73
due to the higher aliphatic end group content of P4K than B4K, which reduces its
mass uptake of water.
The glass transition temperatures (Tg) of B4K and P4K are 37oC and 38oC,
respectively, which is close to the temperature at which moisture sorption studies
were done (21.9oC). The properties of the polymer change near Tg which may result
in unusual behavior of the mass uptake of B4K and P4K.
74
8 Conclusions
The overall goal of this thesis was synthesis of polylactide with varying
molecular weight and aliphatic content and its effect on moisture sorption. PLA with
varying aliphatic content was achieved by initiating ring-opening polymerization of
an L-lactide with different long chain aliphatic fatty ((C16 Palmityl, C10 Decyl, C4
Butyl) alcohols. PLA with Benzyl ends of different molecular weight were also
synthesized to compare sorption properties of aliphatic and aromatic end groups. A
summary of all the experiments is given in Table 8.1.
Initial synthesis experiments produced PLA of higher molecular weight than
expected (~260K vs. 85K anticipated and ~240K vs. 50K anticipated) with a
polydispersity index greater than two due to high moisture level inside the glove box
(>700 PPM). The moisture level in the glove box changed slowly; after ~6 months
the moisture level dropped to 20 PPM and remained steady for the rest of the
experiments. Also, the polymerization catalyst was changed to triethylaluminum from
diethylaluminum ethoxide because of the better control over molecular weight.
GPC results showed that the experimental DP coincided well with the
theoretical DP. These results indicated that alcohols used were true initiators for
lactide polymerization and triethylaluminum acted as catalyst. Furthermore, the low
PDI (<1.5) showed minimal transesterification. PLA synthesized with palmityl, decyl,
butyl, and benzyl end groups were confirmed by 1H NMR. The percentage conversion
of L-lactide to PLA came out to be ≥ 85% as determined from some crude samples
75
during synthesis experiments. DSC analysis showed, when molcular weight increased
then Tg and Tm of PLA increased simultanously which fits with the existing concept.
The results for PLA with same molecular weight but with different end group showed
that there is no significant variation in Tg and Tm of the samples. This is likely due to
the highest weight fraction of end group was ~7.5%, that is, in PLA with palmityl end
with molecular weight 3,000 and this fraction was not high enough to show the
thermal behavior changes with different end groups.
Moisture sorption of the samples synthesized indicated that the aliphatic
content of the end group contributed towards sorption properties. With the increase in
mass percentage of aliphatic content from 0.6% (B10K) to 1.4% (D10K) and then
finally to 2.3% (P10K), there was a consistent decrease in mass uptake of water.
Similarly, when mass percentage of aliphatic content of the end group was increased
from 2.4% (D6K) to 3.8% (P6K), there was a decrease in mass uptake of water by the
sample. Also, mass uptake of water of B4K (~1.5% aliphatic content) is higher than
P4K (~5.7% aliphatic content). This study confirmed our hypothesis that with the
increase in aliphatic content of the end group there is decrease in the mass uptake of
water.
Varying molecular weight of the PLA backbone also affected the sorption
characteristics. D6K (2.4% aliphatic content) and D10K (1.4% aliphatic content)
films did not have statistically different mass uptake of water. According to aliphatic
content percent, sorption in D6K should be less but it was not. Similarly, P6K (3.8%
76
aliphatic content) and P4K (5.7% aliphatic content) were compared and the mass
uptake of water was more in P4K which contradicts aliphatic content hypothesis. So,
this indicated that the increase in molecular weight decreased the mass uptake of
water.
It can be concluded that molecular weight and aliphatic content both
contribute towards sorption properties of the PLA synthesized. Where the decrease in
aliphatic content (hydrophobic) of end group caused increase in the mass uptake of
water; and increase in molecular led to decrease in mass uptake of water.
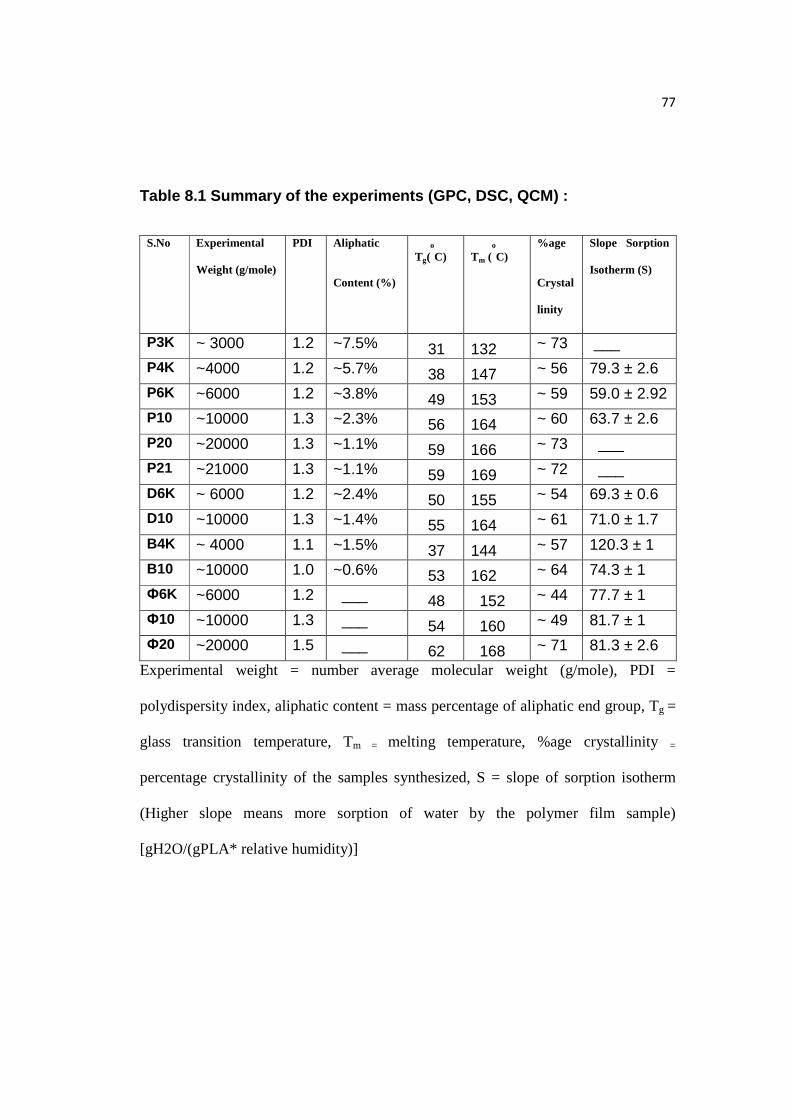
77
Table 8.1 Summary of the experiments (GPC, DSC, QCM ) :
S.No Experimental
Weight (g/mole)
PDI Aliphatic
Content (%)
Tg(o
C)
Tm (o
C)
%age
Crystal
linity
Slope Sorption
Isotherm (S)
P3K ~ 3000 1.2 ~7.5% 31 132 ~ 73 ___
P4K ~4000 1.2 ~5.7% 38 147 ~ 56 79.3 ± 2.6
P6K ~6000 1.2 ~3.8% 49 153 ~ 59 59.0 ± 2.92
P10 ~10000 1.3 ~2.3% 56 164 ~ 60 63.7 ± 2.6
P20 ~20000 1.3 ~1.1% 59 166 ~ 73 ___
P21 ~21000 1.3 ~1.1% 59 169 ~ 72 ___
D6K ~ 6000 1.2 ~2.4% 50 155 ~ 54 69.3 ± 0.6
D10 ~10000 1.3 ~1.4% 55 164 ~ 61 71.0 ± 1.7
B4K ~ 4000 1.1 ~1.5% 37 144 ~ 57 120.3 ± 1
B10 ~10000 1.0 ~0.6% 53 162 ~ 64 74.3 ± 1
Ф6K ~6000 1.2 ___ 48 152 ~ 44 77.7 ± 1
Ф10 ~10000 1.3 ___ 54 160 ~ 49 81.7 ± 1
Ф20 ~20000 1.5 ___ 62 168 ~ 71 81.3 ± 2.6
Experimental weight = number average molecular weight (g/mole), PDI =
polydispersity index, aliphatic content = mass percentage of aliphatic end group, Tg =
glass transition temperature, Tm = melting temperature, %age crystallinity =
percentage crystallinity of the samples synthesized, S = slope of sorption isotherm
(Higher slope means more sorption of water by the polymer film sample)
[gH2O/(gPLA* relative humidity)]
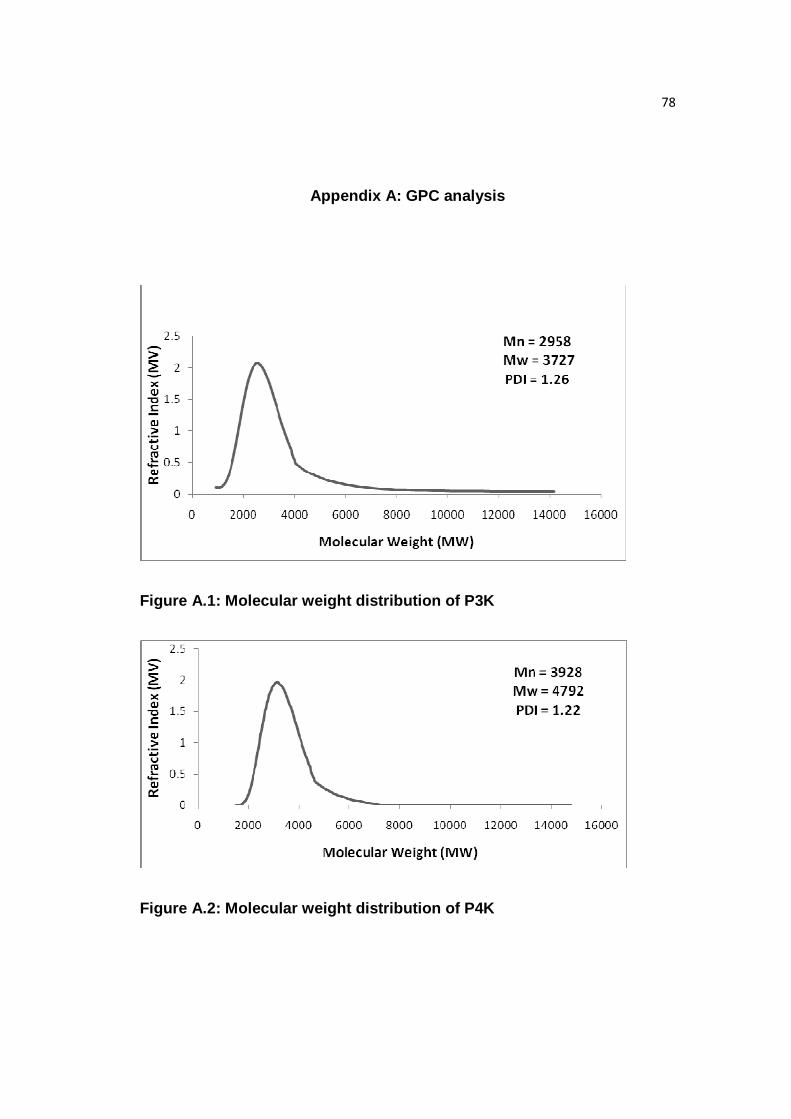
78
Appendix A: GPC analysis
Figure A.1: Molecular weight distribution of P3K
Figure A.2: Molecular weight distribution of P4K
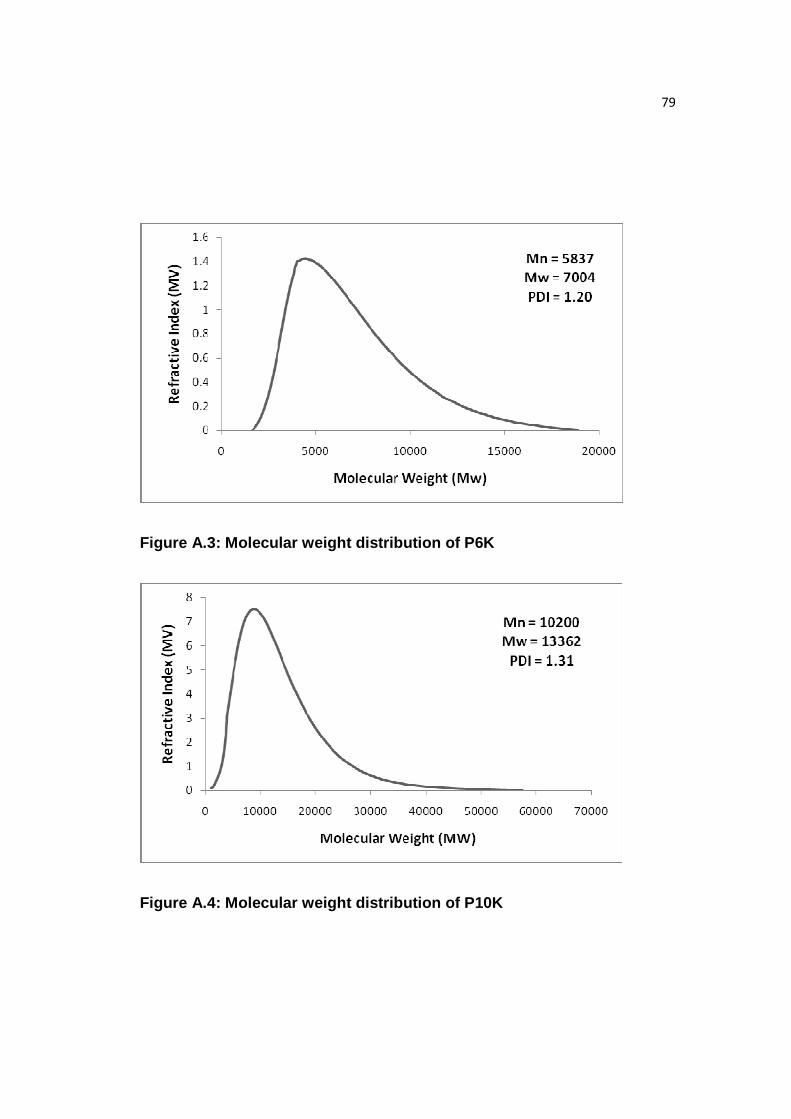
79
Figure A.3: Molecular weight distribution of P6K
Figure A.4: Molecular weight distribution of P10K
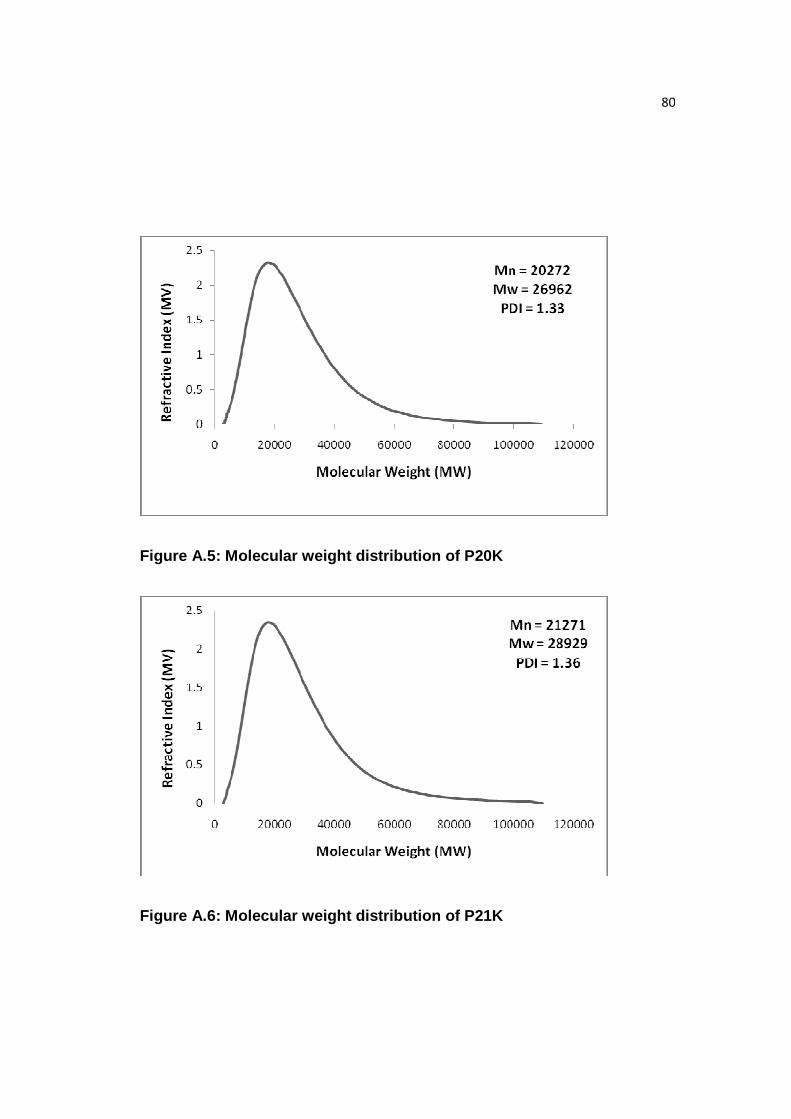
80
Figure A.5: Molecular weight distribution of P20K
Figure A.6: Molecular weight distribution of P21K
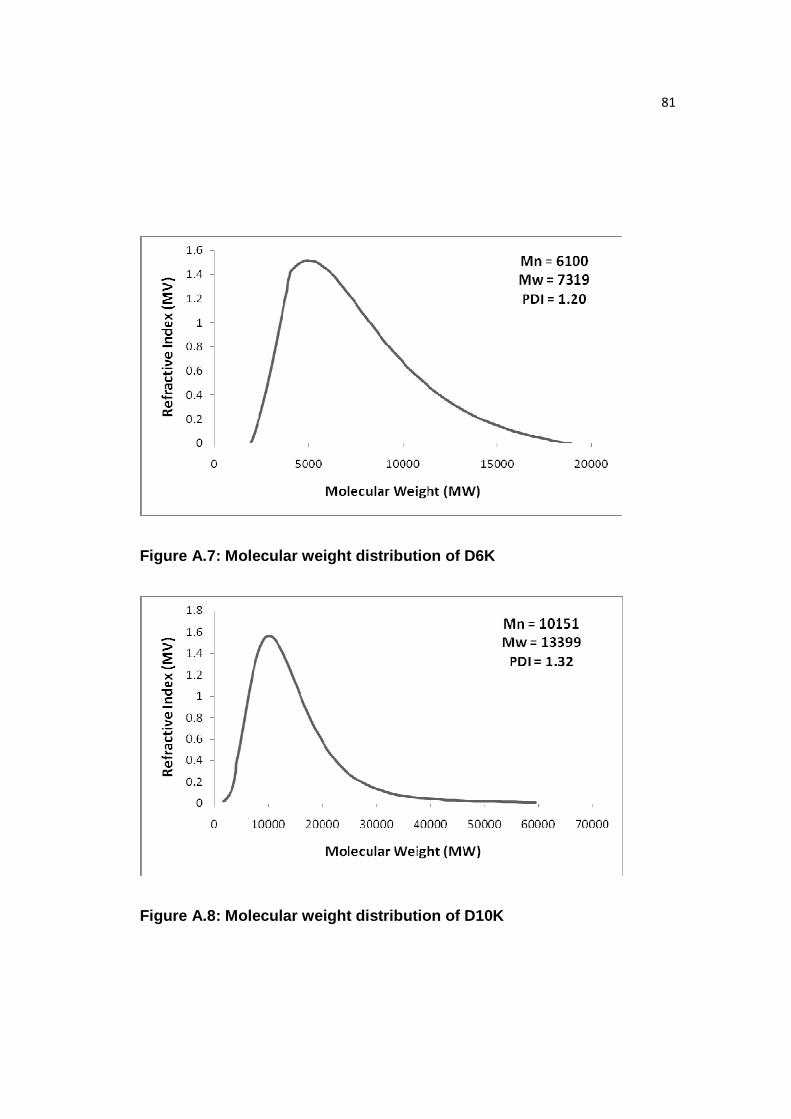
81
Figure A.7: Molecular weight distribution of D6K
Figure A.8: Molecular weight distribution of D10K

82
Figure A.9: Molecular weight distribution of B4K
Figure A.10: Molecular weight distribution of B10K
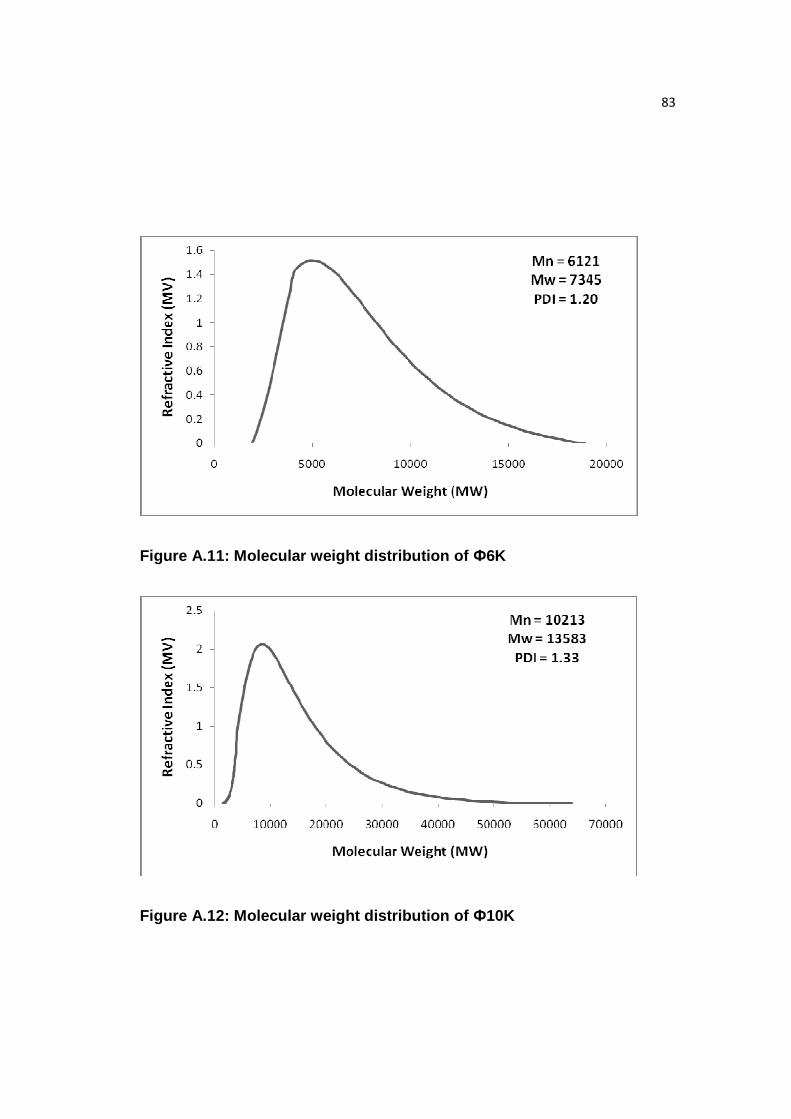
83
Figure A.11: Molecular weight distribution of Ф6K
Figure A.12: Molecular weight distribution of Ф10K
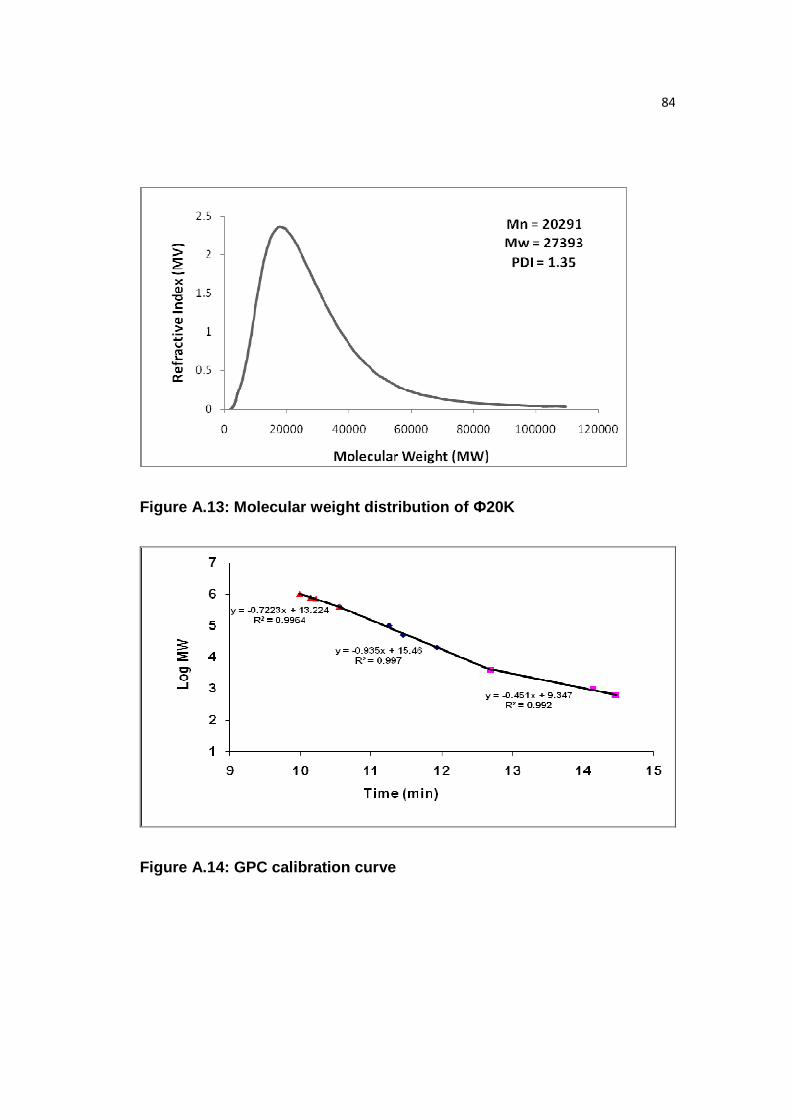
84
Figure A.13: Molecular weight distribution of Ф20K
Figure A.14: GPC calibration curve
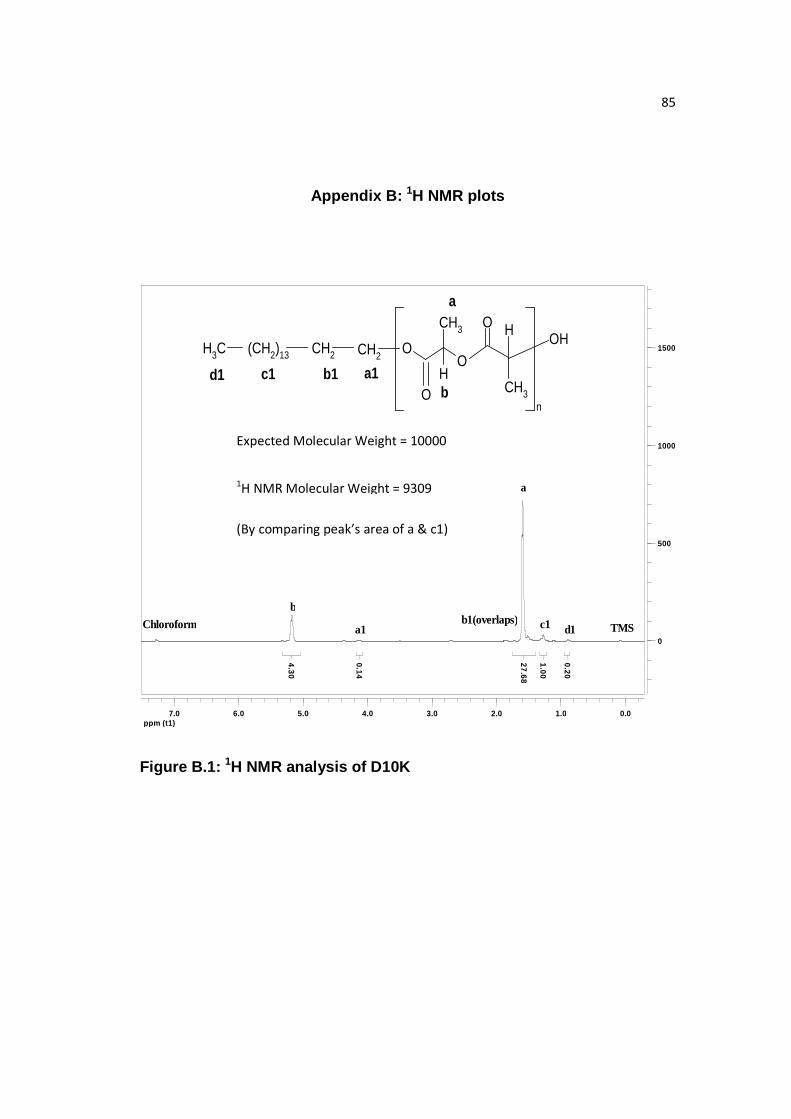
85
Appendix B: 1H NMR plots
ppm (t1)0.01.02.03.04.05.06.07.0
0
500
1000
1500
1.00
27.68
4.30
0.14
0.20
d1c1a1
a
b
TMSChloroform b1(overlaps)
Figure B.1: 1H NMR analysis of D10K
Expected Molecular Weight = 10000
1H NMR Molecular Weight = 9309
(By comparing peak’s area of a & c1)
O
O
CH3
OH
O
CH3
H
n
CH2
OHCH2(CH2)13CH3
a1b1c1d1b
a
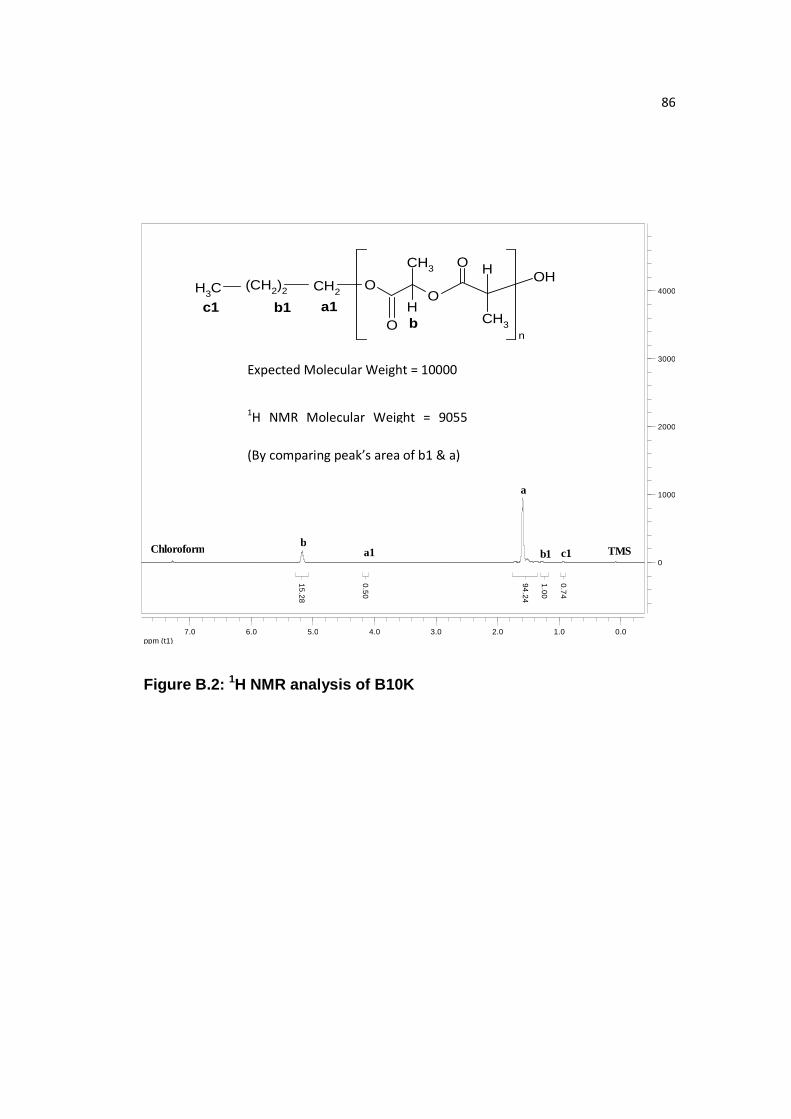
86
ppm (t1)0.01.02.03.04.05.06.07.0
0
1000
2000
3000
4000
1.0
0
0.7
4
94
.24
0.5
0
15
.28
a1 b1 c1Chloroform TMS
a
b
Figure B.2: 1H NMR analysis of B10K
O
O
CH3
OH
O
CH3
H
n
CH2
OH(CH2)2CH3
a1b1c1b
Expected Molecular Weight = 10000
1H NMR Molecular Weight = 9055
(By comparing peak’s area of b1 & a)
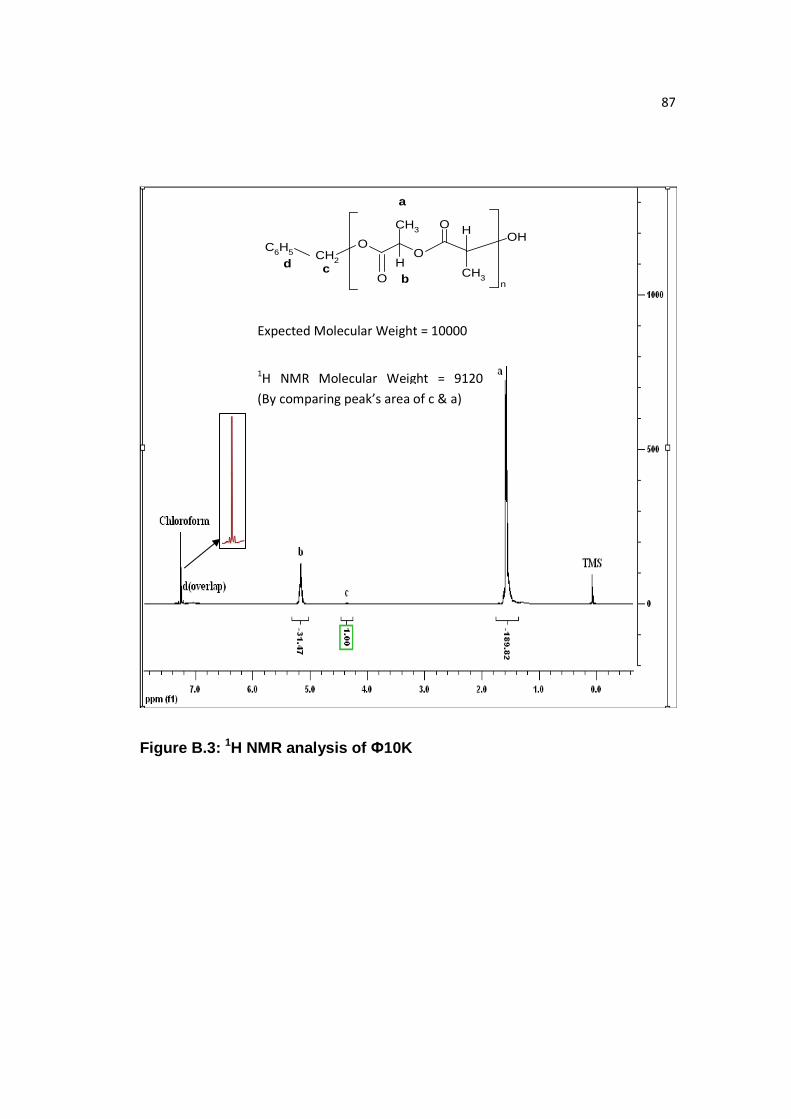
87
Figure B.3: 1H NMR analysis of Ф10K
Expected Molecular Weight = 10000
1H NMR Molecular Weight = 9120
O
O
CH3
OH
O
CH3
H
n
CH2
OHC6H5
a
bcd
(By comparing peak’s area of c & a)
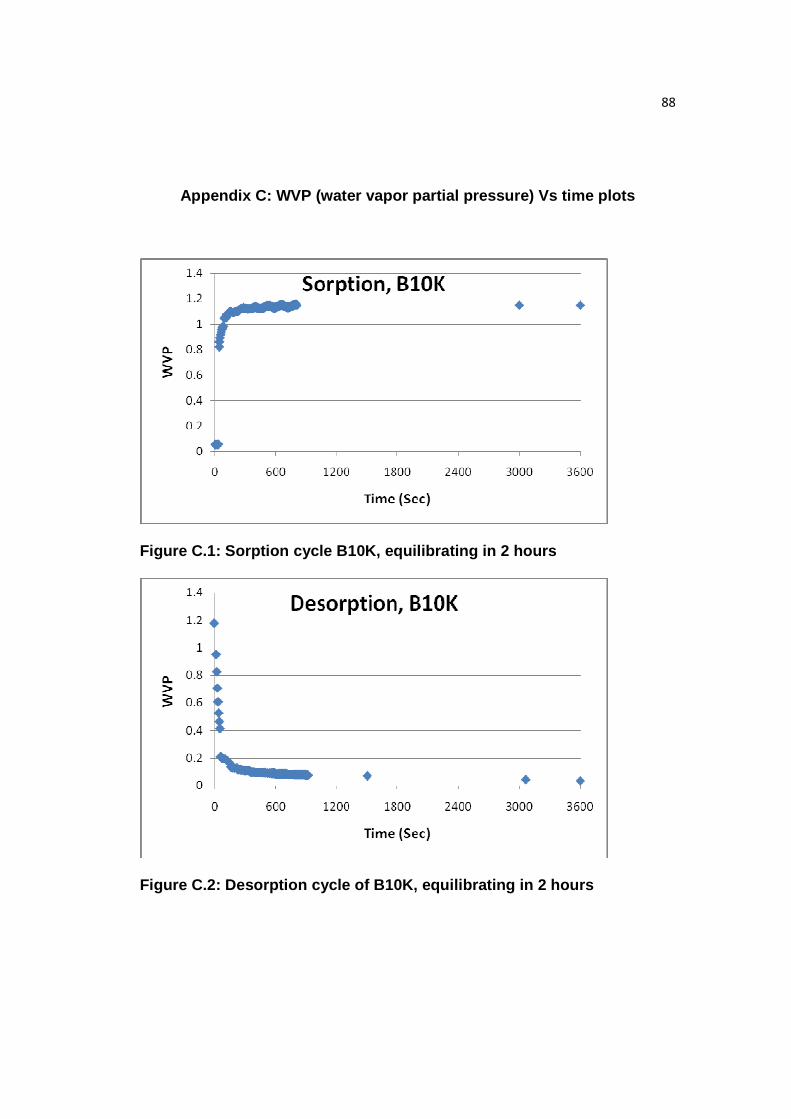
88
Appendix C: WVP (water vapor partial pressure) Vs t ime plots
Figure C.1: Sorption cycle B10K, equilibrating in 2 hours
Figure C.2: Desorption cycle of B10K, equilibrating in 2 hours
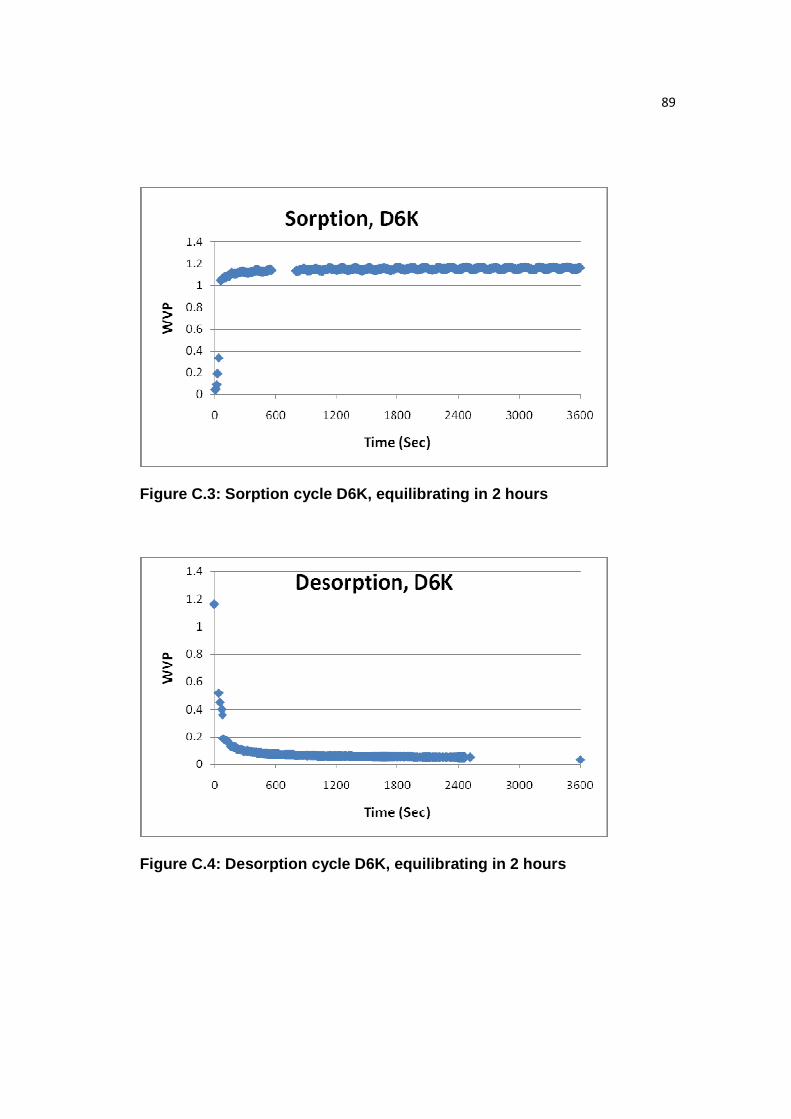
89
Figure C.3: Sorption cycle D6K, equilibrating in 2 hours
Figure C.4: Desorption cycle D6K, equilibrating in 2 hours
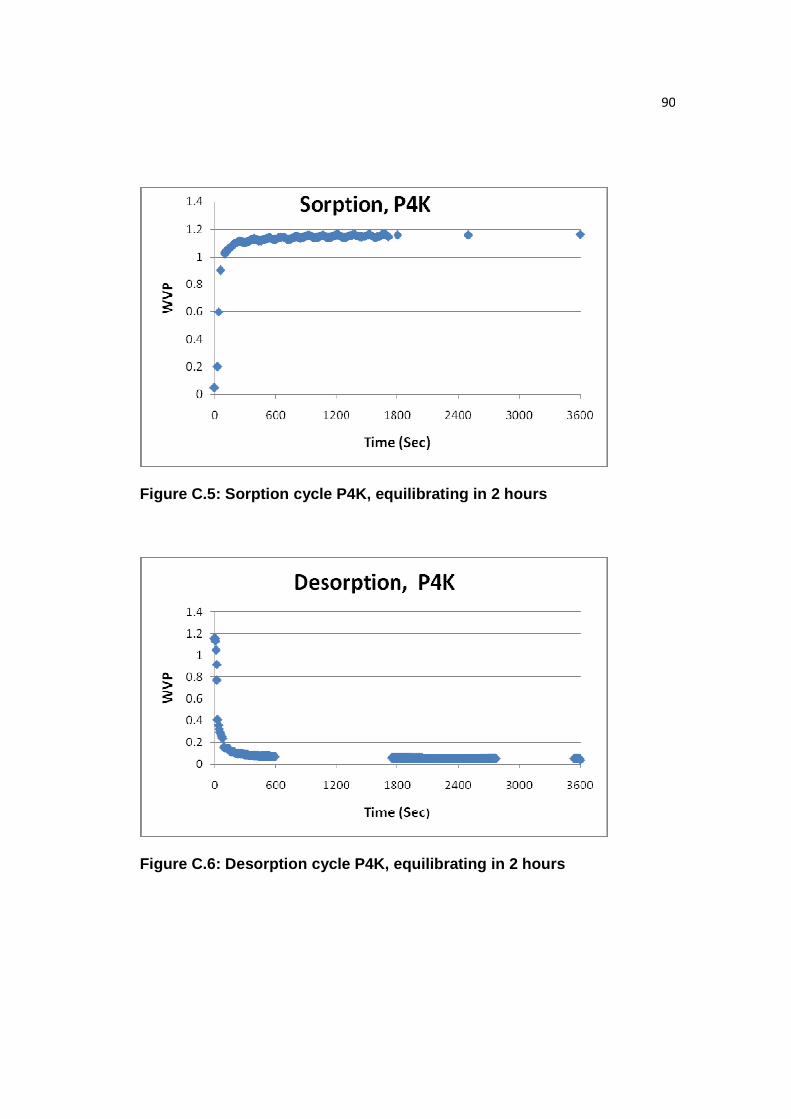
90
Figure C.5: Sorption cycle P4K, equilibrating in 2 hours
Figure C.6: Desorption cycle P4K, equilibrating in 2 hours
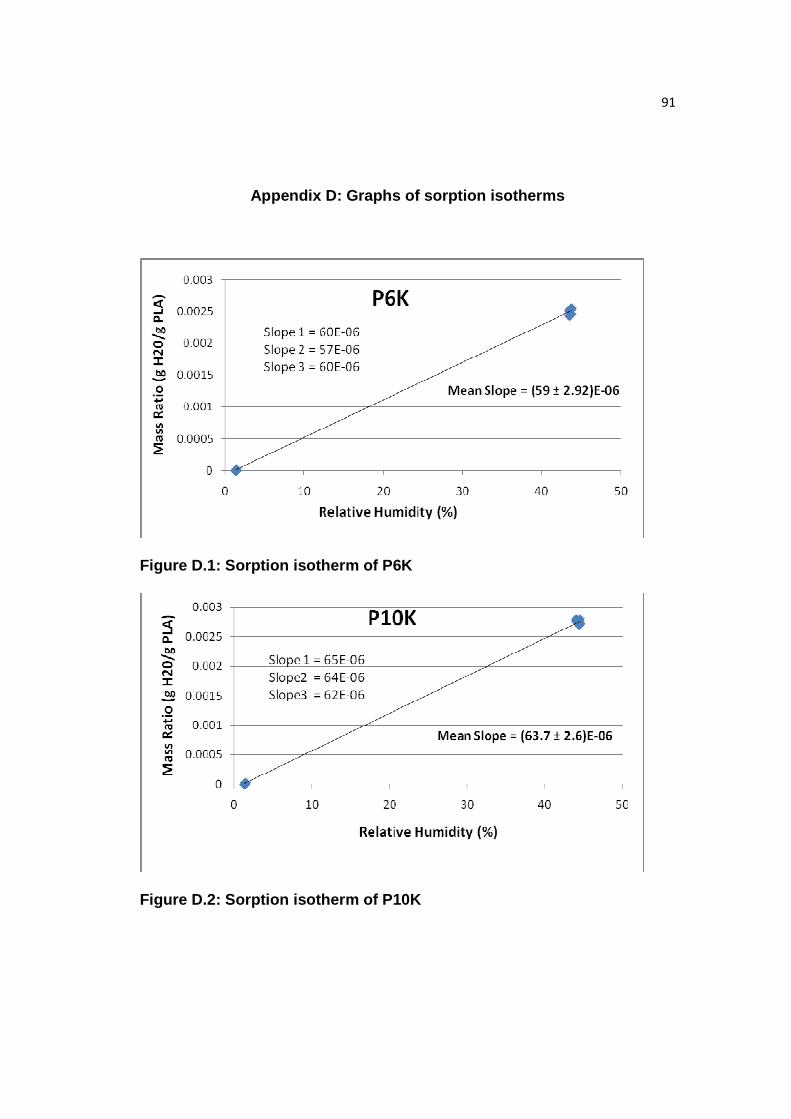
91
Appendix D: Graphs of sorption isotherms
Figure D.1: Sorption isotherm of P6K
Figure D.2: Sorption isotherm of P10K
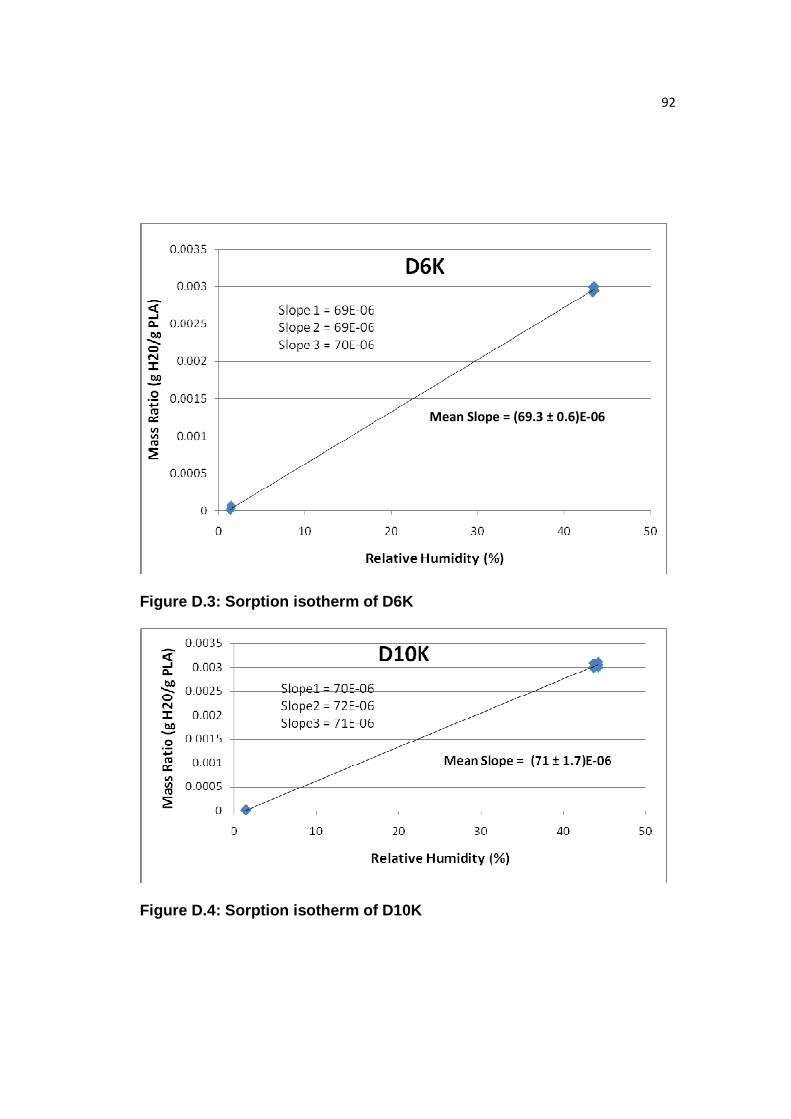
92
Figure D.3: Sorption isotherm of D6K
Figure D.4: Sorption isotherm of D10K
Mean Slope = (69.3 ± 0.6)E-06
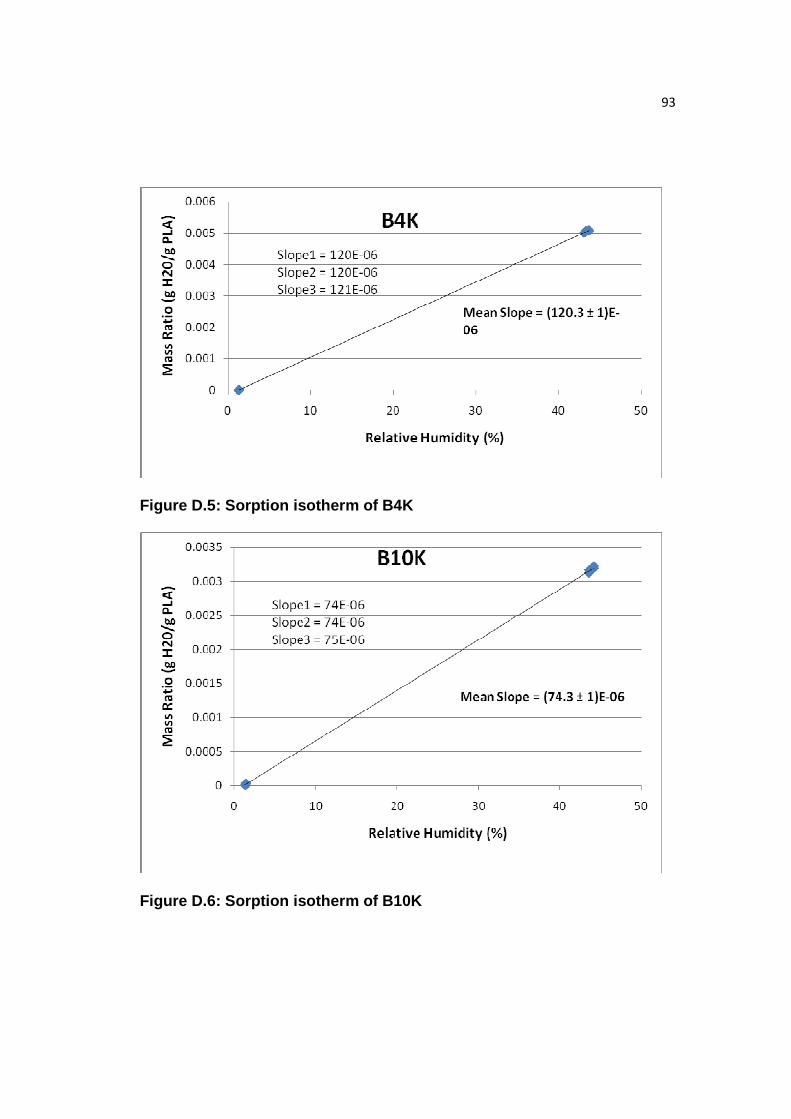
93
Figure D.5: Sorption isotherm of B4K
Figure D.6: Sorption isotherm of B10K
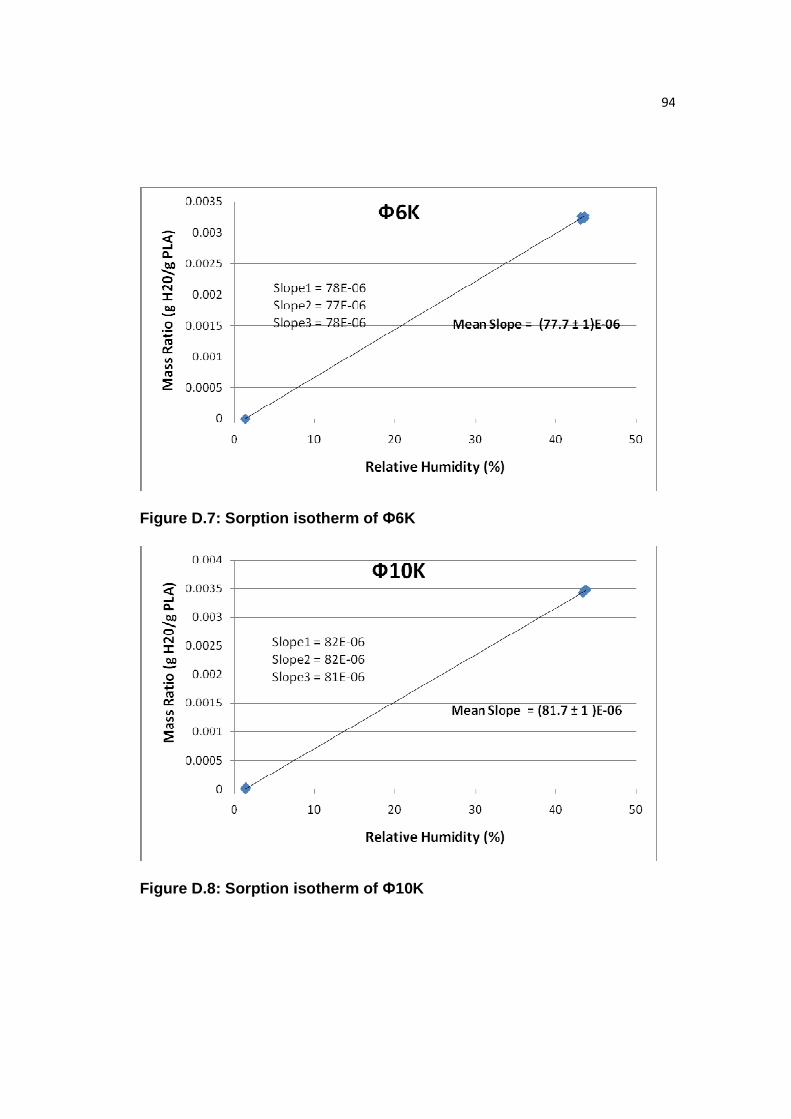
94
Figure D.7: Sorption isotherm of Ф6K
Figure D.8: Sorption isotherm of Ф10K
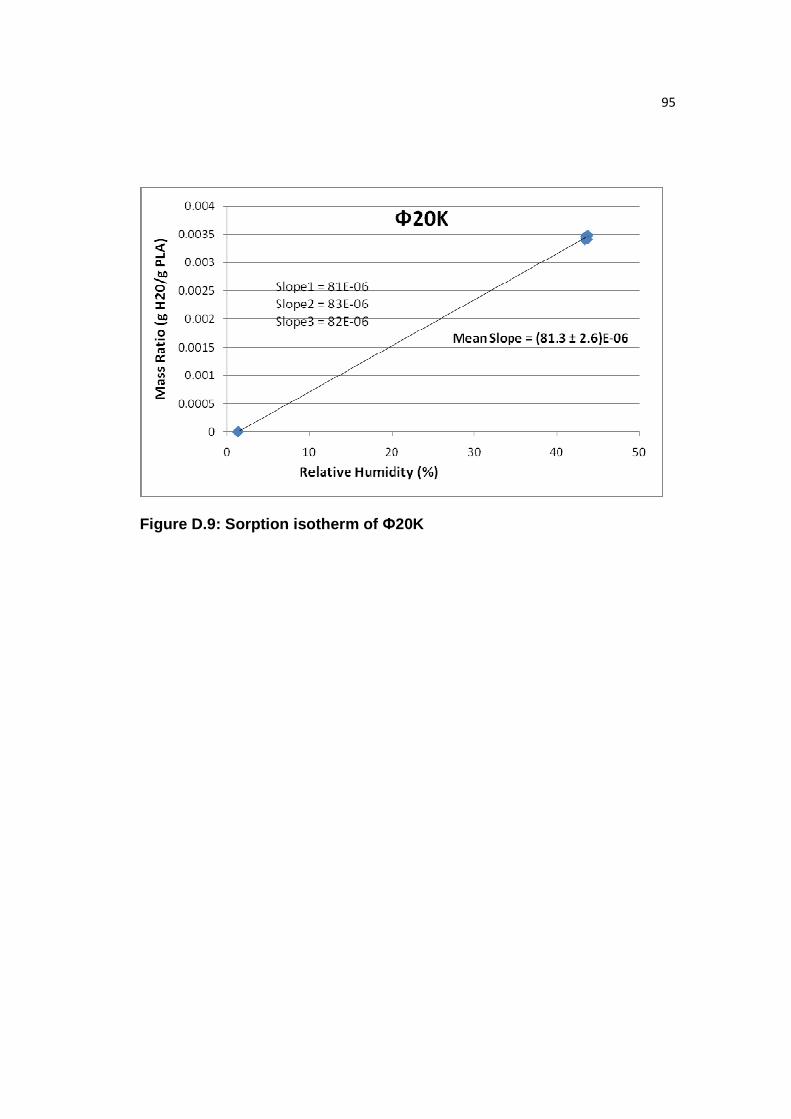
95
Figure D.9: Sorption isotherm of Ф20K
96
References
[1] R. Auras, B. Harte, S. Selke, Macromolecular Biosciences, 4, 835–864 (2004) [2] M. Kolybaba et al., Biodegradable Polymers: Past, Present, and Future, presentation at the CSAE/ASAE Annual Intersectional Meeting (2003) [3] A. Tullo, Chem. Eng. News, 78 (2000) [4] Y. Ikada, H. Tsuji, Macromol. Rapid Commun., 21, 117 (2000) [5] S.C. Schmidt, M.A. Hillmyer, Macromolecules, 32,4794 (1999) [6] C.D. Xiong, L.M. Cheng, R. P. Xu, X. M. Deng, J. Appl. Polym. Sci., 55, 865 (1995) [7] X. Chen, S.P. McCarthy, R.A. Gross, Macromolecules 31, 662 (1998) [8] J.R. Dorgan, H.J. Lehermeier, L.I. Palade, J. Cicero, Macromol. Symp. 175, 55–66 (2001) [9] R.A. Auras, B. Harte, S. Selke, R.J. Hernandez, School of Packaging, MSU, East Lansing, MI. 48824-1223. USA [10] H. Tsuji, Y. Ikada, Macromol. Chem. Phys., 197, 3483 (1996) [11] D.R. Witzke, Ph.D. Thesis, Michigan State University, East Lansing, MI p.389 (1999) [12] R. Auras, Bruce Harte, Susan Selke, Macromol. Biosci., 4, 835–864 (2004) [13] M.H. Hartmann in D. L. Kaplan (Ed.), Biopolymers from Renewable Resources, Springer-Verlag, Berlin, pp. 367–411 (1998) [14] Z. Jedlinski, W. Walach, P. Kurcok, G. Adamus, Die Makromolekulare Chemie 192(9), 2051–2057 (1991) [15] P. Kurcok, A. Matuszowicz, Z. Jedlinski, H.R. Kricheldorf, Ph. Dubois, and R. Jerome, Macromolecular Rapid Communications 16, 513–519 (1995)
97
[16] H.R. Kricheldorf, I.K. Saunders, Die Makromolekulare Chemie 191(5), 1057–1066 (1990) [17] H.R. Kricheldorf, C. Boettcher, Journal of Macromolecular Science—Pure and Applied Chemistry A30, 441–448 (1993) [18] H.R. Kricheldorf , A. Serra, Polymer Bulletin 14, 497–502 (1985) [19] J. Kleine, H. Kleine, Die Makromolekulare Chemie (1959) [20] H.R. Kricheldorf , C. Boettcher, Die Makromolekulare Chemie, Macromolecular Symposia 73, 47–64 (1993) [21] R. Dunsing, H. R. Kricheldorf, Polymer Bulletin 14,491-495 (1985) [22] H.R. Kricheldorf, I.K. Saunders, N. Scharnagl, Die Makromolekulare Chemie, Macromolecular Symposia 32, 285-298 (1990) [23] Y.J Du, P.J. Lemestra, A.J. Nijenhuis, H.A.M. Vanaert, C. Bastiaansen, Macromolecules, 28 (7), 2124 (1995) [24] H.R. Kricheldorf, N. Scharnagl, Z. Jedlinski, Polymer, 37 (8), 1405 (1996) [25] X. Zhang et al., Journal of polymer science Part A:Polymer chemistry, Vol32 2965-2970 (2003) [26] S. Penczek, A. Duda, and J. Libiszowski, Macromol. Symp. 128, 241–254 (1998) [27] N. Ropson, Ph. Dubois, R. J´erˆome, Ph. Teyssi´e, Macromolecules 28, 7589–7598 (1995) [28] M. Bero, G. Adamus, J. Kasperczyk, Polym Bull 31:9 (1993) [29] P.J.A Veld, E.M. Velner, P. V. Witte, J. Hamhuis, P.J Dijkstra, J. Feijen, J Polym Sci Part A Polym Chem 35:219 (1997)
[30] E.M. Frick, M. A. Hillmyer, Macromol. Rapid Commun., 21, 1317–1322 (2000) [31] P.B. Messersmith, E.P. Giannelis, Chem. Mater., 6, 1719 (1994)
98
[32] A. Usuki, M. Kawasumi, Y. Kojima, A. Okada, T. Kurauchi, O.J. Kamigaito, Mater. Res., 8, 1174 (1993) [33] M. Alexander, P. Dubois, Mater. Sci. Eng., 28, 1 (2000) [34] M. Okamoto, P.H. Nam, P. Maiti, T. Kotaka, N. Hasegawa, A. Usuki, Nano Lett., 1, 295 (2001) [35] M. Okamoto, P.H. Nam, P. Maiti, T. Kotaka, T. Nakayama,M. Takada, M.Ohshima, A. Usuki, N. Hasegawa, H. Okamoto, Nano Lett., 1, 503 (2001) [36] R.A. Vaia, E.P. Giannelis, Macromolecules, 30, 8000 (1997) [37] S. S. Ray et al., Macromolecules, 35, 3104-3110 (2002) [38] G. Cao, T.E.J. Mallouk, Solid State Chem., 94, 59 (1991) [39] P. Aranda, E.R. Hitzky, Chem. Mater., 4, 1395 (1992) [40] P.B. Messersmith, S.I.J. Stupp, Mater. Res., 7, 2599 (1992) [41] R.A. Vaia, H. Ishii, E.P. Giannelis, Chem. Mater. 1993, 5 (1994) [42] N. Hasegawa, H. Okamoto, M. Kato, A. Usuki, J. Appl. Polym. Sci., 78, 1981 (2000) [43] N. Hasegawa, H. Okamoto, M. Kato, A. Tsukigase, A. Usuki, Macromol. Mater. Eng., 280/281, 76 (2000) [44] E.P .Giannelis, R. Krishnamoorti, E. Manias, Adv. Polym. Sci. 138, 107 (1999) [45] P.H. Nam, P. Maiti, M. Okamoto, T. Kotaka, N. Hasegawa, A. Usuki, Polymer, 42, 9633 (2001) [46] S.S. Ray et al., Polymer 44, 6633-6646 (2003) [47] M.A. Del Nobile, G.G. Buonocore, L. Palmieri, A. Aldi, D. Acierno, J Food Eng. 53:287 (2002) [48] G.K. van der Wel, O.C.G. Adan, Prog Org Coatings 37:1 (1999)
99
[49] J.S. Vrentas, C.M. Vrentas, W.J. Huang, J Appl Polym Sci 64:2007 (1997) [50] A.R. Berens, H.B. Hopfenberg, Polymer 19:489 (1978) [51] W.P. de Wilde, P.J. Shopov, Composite Structures 27:243 (1994) [52] J. Crank, J Polym Sci 11:151 (1953) [53] J.H. Petropoulos, P.P. Roussis, J Chem Phys 47:1201 (1967) [54] E.P.M. Westing, G.M. Ferrari, J.H.W. de Wit, Corrosion Sci 36:957 (1994) [55] A.M. Agrawal, R.V. Manek, W.M. Kolling, S.H. Neau, J Pharm Sci. 93:1766 (2004) [56] L.T Lim, I.J. Britt, M.A. Tung, J Appl Polym Sci 71:197 (1999) [57] W. Camacho, M.S. Hedenqvist, S. Karlsson, Polym Int. 51:1366 (2002) [58] W. Camacho, W. Valles-Lluch, A. Ribes-Greus, S. Karlsson, J Appl Polym Sci. 87:2165 (2003) [59] J.S. Sharp, J.A. Forrest, R.A.L. Jones, Macromolecules 34:8752 (2001) [60] A. Ballato, T. J. Lukaszek, and E. P. Eernisse, 26, 163 (1979) [61] J. Tian, Comparative Solubility Study of C60 and C60-Piperazine and applications on Quartz Crystal Microbalance/Heat Conduction Calorimeter. Ph.D. thesis, Drexel University (2002) [62] G.Z. Sauerbrey, Z Phys 155:206 (1959) [63] T.G Fox, P.J. Flory, Journal of Applied Physics, 21:581e91 (1950) [64] S. Dutkiewicz, D. Grochowska-Łapienis, W. Tomaszewski, Fibres & Textiles in Eastern Europe, Vol. 11, No. 4 (43) (2003) [65] A. Smith, Masscal Inc., Personal Communication (2007) [66] J.A. Meisner, MS Thesis Draft (2008)

100
[67] E.W. Fisher, H. J. Sterzel, G. Wegner, Kolloid Z. Z.Polym., 251, 980 (1973) [68] S. Li, S. McCarthy, Macromolecules, 32, 4454-4456 (1999)