Flow-induced crystallization regimes and rheology of isotactic polypropylene
Upload
independentCategory
view
3download
0
ORIGINAL PAPER
Environmental and Cost Assessment of a PolypropyleneNanocomposite
A. L. Roes Æ E. Marsili Æ E. Nieuwlaar ÆM. K. Patel
Published online: 19 August 2007
� Springer Science+Business Media, LLC 2007
Abstract This paper describes a study on the use of a
polypropylene (PP)/layered silicate nanocomposite as
packaging film, agricultural film, and automotive panels.
The study’s main question was ‘‘Are the environmental
impacts and costs throughout the life cycle of nanocom-
posite products lower than those of products manufactured
from conventional materials?’’ The conventional (bench-
mark) materials studied were pure polypropylene as
packaging film, pure polyethylene as agricultural film, and
glass fiber-reinforced polypropylene as automotive panels.
In all three cases, the use of the PP nanocomposite resulted
in a reduction of the amount of material used, while
ensuring the same functionality. Material reduction was
estimated using Ashby’s material indices and amounted to
�9% for packaging film, �36.5% for agricultural film, and
�1.25% for automotive panels. It goes without saying that
a product’s impact on the environment will decrease when
less material is used. The production and incorporation of
nanoparticles, however, may have additional impacts. We
found clear environmental benefits throughout the entire
life cycle when the PP nanocomposite is used in the
manufacture of agricultural film. We noted some cost
benefits when the nanocomposite is used in the production
of agricultural film and automotive panels. If the price of
nanoclay is at most €5,000 tonne then the cost of nano-
composite packaging film is also lower than that of the
conventionally produced product.
Keywords Life cycle assessment � Life cycle costing �Nanotechnology � Polypropylene nanocomposite
Introduction
Nanotechnology is a very promising field for industrial
applications. In fact, several products are already on the
market for certain niche sectors with high added value, e.g.,
biomedical materials and analytic devices. The real revo-
lution in nanomaterial applications, however, is expected to
involve widely used bulk products. Polymers like poly-
olefins and polyvinylchloride (PVC), for example, are good
candidates in this respect because of their large-scale use
and versatility. Indeed, one of the first applications of
nanotechnology was the production of nanofillers for the
improvement of the mechanical properties of polymers [1–
3]. Polypropylene (PP) is particularly interesting because
of its low cost and good mechanical properties. This
polymer has been used in conventional composites for a
long time and, in combination with nanofillers, shows
better mechanical properties with even low amounts of
filler. The main nanofillers used today are nanoclay (natural
product) and carbon nanotubes (synthetic). Synthetic car-
bon nanotubes are very expensive. Nanoclays (layered
silicates), in contrast, are especially interesting for bulk
applications because they are relatively inexpensive and
they cause an improvement in the mechanical properties of
polymers. Commonly used nanoclays include montmoril-
lonite, hectorite, and saponite, all of which belong to the
same general family of 2:1 layered or phyllosilicates [4].
The addition of nanoclay increases not only the elasticity
and strength of PP, but also its barrier and fire-retardant
properties. In applications such as structural elements and
films, these improved mechanical properties allow a reduc-
tion of the quantity of material in a specific product. As a
result of the material reduction, the environmental impact of
PP nanocomposite products can be expected to be lower than
that of products made out of conventional material unless the
A. L. Roes (&) � E. Marsili � E. Nieuwlaar � M. K. Patel
Department of Science, Technology and Society (STS), Utrecht
University, Heidelberglaan 2, 3584 CS Utrecht, The Netherlands
e-mail: [email protected]
123
J Polym Environ (2007) 15:212–226
DOI 10.1007/s10924-007-0064-5

production of the nanoparticles is accompanied by particu-
larly high environmental impacts. The overall effect of
nanocomposite products needs to be evaluated by means of a
methodology that includes all of the steps of the life cycle:
life cycle assessment (LCA).
Analogous to the environmental effects, a reduction in
mass is also likely to affect the overall cost of nanocom-
posite products. Life cycle costing (LCC) is a methodology
similar to LCA that allows the assessment of product costs
throughout the life cycle.
Since this study deals with products that are still in the
research or early production stage, a comprehensive evalu-
ation of all environmental impacts and costs was not
possible. Prospective forms of LCA and LCC can, however,
be used to arrive at indicative results. These outcomes can
then be used to make any necessary alterations in the pro-
duction phase and to improve the efficiency of the processes.
The goal of the present study was to conduct prospective
LCA and LCC of PP/layered silicate nanocomposite prod-
ucts. Three representative products were investigated: thin
film for packaging, thick film for agricultural use, and
injection-molded panels used in cars. Data from both the
literature and industry were used to estimate the reduction
in mass of the nanocomposite products, compare it to that of
conventional products, and evaluate the environmental and
cost (dis-)advantages. In 2003, Lloyd and Lave [5] studied
nanocomposite automotive panels. We believed that we
could significantly enhance their work using a different
approach. Lloyd and Lave used steel and aluminum car
panels as a reference, while we focused on PP panels. Both
studies used Ashby material indices [6] to estimate mass
reduction. However, our estimates for the Young modulus
that are used in Ashby’s material indices, were derived from
experimental data, while Lloyd and Lave used an idealized
model from Brune and Bicerano [7] that is subject to sub-
stantial uncertainty by assuming perfect adhesion between
the clay platelets and the matrix. In the LCA part of the
study, we used LCA databases (e.g., Ecoinvent) that are
based on measured inputs and emissions of discrete indus-
trial processes (e.g., per kg or MJ of product). Lloyd and
Lave, in contrast, applied a hybrid method which derives
environmental impacts from the economic output of the
respective sector or subsector and is hence less accurate.
Life Cycle Assessment (LCA)
Methodology
LCA Fundamentals
Life cycle assessment (LCA) is a standardized method for
the compilation and evaluation of the inputs, outputs, and
potential environmental impacts of a product system
throughout its life cycle. LCA methodology was stan-
dardized in 1997 by the International Standardization
Organization (ISO) in their ISO-14040 series [8]. This
standard distinguishes the following steps:
1. Goal definition and scoping. This step defines the
purpose and the methodology of the LCA. Frequently,
this is a comparison between two or more product
alternatives. The product systems to be evaluated are
defined together with the geographical and the tempo-
ral scopes. This phase also includes the definition of
the functional unit, which then acts as a reference for
the following steps. Finally, it determines which
environmental impacts must be taken into account
(the choice should be as comprehensive as possible).
2. Inventory analysis. In this phase, a flow diagram is
developed and all energy and material requirements,
emissions to air, water, and soil, and other environ-
mental releases are quantified.
3. Impact assessment. This assessment determines the
(potential) environmental impacts caused by the envi-
ronmental releases analyzed in the inventory analysis.
4. Interpretation. In this final step, the results of the
inventory analysis and the impact assessment are
discussed, conclusions are drawn, and recommenda-
tions are made.
Goal Definition and Scoping
The purpose of the LCA in the present study was to
investigate whether the use of a polypropylene nano-
composite has environmental advantages over the use of
conventional polyolefins. To this end, we studied three
product systems, namely packaging film, agricultural film,
and automotive panels. The three conventionally produced
products are all made of different materials: the packag-
ing film is made out of neat PP, the agricultural film out
of neat polyethylene (PE), and the automotive panels out
of glass fiber-reinforced PP. A prospective LCA was
performed (cradle-to-grave) that covers a wide range of
environmental impacts. Using the LCA databases from
SimaPro [9], we conducted an impact assessment on non-
renewable energy use (NREU), climate change (Global
Warming Potential, GWP100), abiotic depletion, ozone
layer depletion, photochemical oxidant formation, acidi-
fication, and eutrophication. We did not take into account
human toxicity, terrestrial ecotoxicity, marine aquatic
ecotoxicity, or fresh water aquatic ecotoxicity, because
the existing methods do not yield comparable results and
because they are incomplete with regard to the emissions
studied [10].
J Polym Environ (2007) 15:212–226 213
123

Characteristics of the Functional Units. A functional
unit was defined for each of the products studied. They
are listed below together with the weights of the con-
ventional products. The weights of the nanocomposite
products are discussed in section ‘‘Weight Saving Using
Nanocomposites’’.
Packaging film. As the functional unit, we chose the
amount of packaging film needed for 1,000 bags of 200 g
‘‘Fruitfante’’ candies produced by Schuttelaar B.V. (Wad-
dinxsveen, The Netherlands). The function of these bags is
to provide sufficient physical protection and to act as a
barrier in order to preserve the candies. Pure PP is the
conventional material used to produce such a bag. We
compared it with film produced from a PP nanocomposite.
Product characteristics of conventional packaging film:
– Weight of one bag:1 3.66E-03 kg
– Film requirement for functional unit: 3.66 kg
Agricultural film. The functional unit is the amount of
plastic film needed to cover a standard tomato greenhouse
with a volume of approximately 650 m3. The purpose of
this film is to provide thermal insulation and UV stability,
combined with the necessary mechanical strength. We
considered polyethylene (PE) to be the conventional
material. It is compared with an agricultural film made out
of a PP nanocomposite.
Product characteristics of conventional agricultural film:
– Film requirement for functional unit:2 2.38 t.
Automotive panel. Body panels of a low-weight family
car that runs 150,000 km during its entire lifetime were
chosen as the functional unit. A PP-glass fiber composite
was assumed to be the conventional material and is com-
pared with panels produced from a PP nanocomposite.
Product characteristics of conventional body panels:
– Panel requirement for functional unit: 20 kg [13].
Weight Saving Using Nanocomposites. When a polymer
(PP, PE) is blended with a nanoclay, the nanoclay silicate
platelets exfoliate and bind with the polymer strands to form a
nanoclay–polymer composite. This new nanocomposite
structure exhibits improved material properties. The silicate
layers have a labyrinthine effect on the diffusing gas and/or
liquids, which leads to improved barrier properties. This
makes nanocomposites an interesting class of materials for the
packaging industry and for all applications in which low
permeability is required. Moreover, the labyrinthine effect is
supposedly involved in the improvement of fire-retardant
properties [14]. Several studies have shown that mixing a
polymer with nanoclay also improves its elasticity (Young
modulus-E) and strength (tensile strength-rf) [3, 15–21].
When material properties like barrier properties, strength, and
elasticity improve, less material is needed to fulfill the same
function. This means that the weight of the nanocomposite
product will be lower than that of the conventional material.
In order to estimate the amount of nanocomposite material
required for a given function, its properties must be compared
with those of conventional materials. To do this, Ashby [6]
defined material indices for different product functions (e.g.,
beam or panel) which have to comply with certain require-
ments, e.g., stiffness, strength, and tolerance to vibration. He
based these material indices on material properties like the
Young modulus (E), tensile strength (rf), and density (q).
Using these indices, a nanocomposite material can be com-
pared with conventional material with regard to mechanical
properties. This allows estimation of material (weight)
reduction. We chose the following equations from the various
material indices distinguished by Ashby:
Packaging film and agricultural film: M ¼ rf=q ð1Þ
We assumed:
– Strength-limited (the material should not tear)
– Tie (tearing is caused by a force parallel to surface of
the film).
Automotive panels: M ¼ E1=3=q ð2Þ
We assumed:
– Stiffness-limited (the material should not bend, it
should be stiff)
– Panel.
Ashby’s material indices are inversely proportional to
the amount of material needed for a given function: i.e., the
higher the index, the less material is needed for the same
function. Weight saving as a result of nanocomposite use
can now be estimated.
For packaging film and agricultural film, weight saving
was calculated using:
Change of weight (%) ¼ rf=q½conv�rf=q½nano� � 1
� ��100 ð3Þ
For automotive panels, weight saving was calculated using:
Change of weight (%) ¼ E1=3=q½conv�E1=3=q½nano�
� 1
!�100 ð4Þ
Ashby’s method allows one to compare materials for a
given purpose on the basis of their mechanical properties.
1 Weight of a packaging bag was based on: thickness of film = 6.00
E-05 m; length of bag = 0.214 m; width of bag = 0.157 m; density of
PP = 0.91 t/m3; 2 sheets per bag.2 Weight of agricultural film was based on: thickness of film =
0.006 m; length of greenhouse = 29.26 m; width of greenhouse:
7.00 m; width of greenhouse roof film = 8.00 m; height of green-
house = 2.44 m; density of film = 0.92 t/m3 [11, 12].
214 J Polym Environ (2007) 15:212–226
123

When studying packaging film, this is not, however, the
only aspect that must be taken into account. The barrier
properties of this material are of major importance because
the food that it envelops must be preserved. An additional
index, therefore, is necessary: the oxygen transmission rate
(OTR). This index reflects oxygen permeability. In order to
have optimal properties, the OTR must be minimized. We
estimated the material reduction due to the use of
nanocomposite film by assuming that the thickness of the
film is proportional to the OTR (the higher the OTR, the
thicker the film must be). That is, we calculated the weight
saving using:
Change of film thickness (t, %) ¼ OTR[nano]
OTR[conv]� 1
� ��100
ð5Þ
Change of weight (%) ¼t
100þ 1
� ��q½nano�
q½conv� � 1
!�100
ð6Þ
The values for tensile strength (rf), Young modulus (E),
oxygen transmission rate (OTR), and specific weight (q)
used in this study are listed in Table 1.
Inserting these values in Eqs. 3–6 resulted in the esti-
mates for weight saving listed in Table 2. Applying this
weight reduction to the functional units based on conven-
tional material yielded the weight of the products made
with the polypropylene nanocomposite.
Table 2 shows that the weight-saving estimation for
packaging film is �17.5% based on OTR. However,
because its mechanical properties (rf) do not allow a
weight saving of this magnitude, the maximum weight
saving for packaging film is �9%. This value was used
in further calculations of packaging film. The weight
saving for agricultural film is four times higher than for
packaging film. This is caused by the large difference in
tensile strength between the nanocomposite and low-den-
sity polyethylene (LDPE, conventional material used). The
weight reduction for automotive panels is more or less
negligible (�1.25%). Although there is no improvement in
the Young modulus when nanocomposites are used, there
is a large improvement in density. The lower density is also
the reason for the weight reduction. Calculating weight
savings by hand using the values in Table 1 gave slightly
different values than reported in Table 2. This was due to
rounding-off errors.
Inventory Analysis
The Life Cycle Figure
Figure 1 shows the process chain for the production of
polypropylene nanocomposite products, i.e., packaging
film, agricultural film, and automotive panels. To the
authors’ knowledge, the production process shown in the
figure has not yet been operated on a commercial scale.
Since we studied the process in an early stage, there is
room for optimization. In fact, our assumptions may be too
conservative, i.e., more substantial progress than assumed
might be possible with regard to material properties (see
below). Moreover, other process configurations, possibly
involving other types of nanoparticles, may turn out to be
more attractive.
The life cycle process of a nanocomposite comprises
five major steps: the preparation of the nanoclay, the
preparation of polypropylene, the mix/dilution step, the use
phase, and the waste treatment phase. In the nanoclay part
of the process, raw clay (Ca-bentonite) is extracted and
Table 1 Parameter values (LDPE: Low-density polyethylene, Nanocomp: Nanocomposite, PP/GF comp: Polypropylene/glass fiber composite)
Parameter Value Unit Reference
rf—PP 33.5 MPa [22]
rf—LDPE 24 MPa [12]
rf—nanocomp 3% clay (for packaging film and agricultural film) 37.4 MPa [22]
E—PP/GF comp (30% GF) 5.76 GPa [23]
E—nanocomp 5% clay (for automotive panels) 1.8 GPa [22, 23]
OTR—PP 95 (cc mm)/(m2 24 h 1 Atm) [23]
OTR—nanocomp 3% clay 76.9 (cc mm)/(m2 24 h 1 Atm) Expert estimation and [23]
q—PP 0.91 t/m3
q—LDPE 0.923 t/m3
q—nanocomp 3% clay 0.928 t/m3
q—nanocomp 5% clay 0.94 t/m3
q—PP/GF comp 1.402 t/m3
J Polym Environ (2007) 15:212–226 215
123

subjected to an ion exchange to replace divalent calcium
ions with monovalent sodium ions. This results in an
increase in the interlayer distance between the clay plate-
lets. After separation (‘‘hydrocyclone’’) and a drying step
(‘‘spray drying’’), another ion exchange is performed
(‘‘organic modification’’) in which sodium ions are
replaced by alkyl quaternary ammonium salts (delivered by
tallow), which increases the interlayer distance even more.
The distance between the platelets is a crucial factor during
composite preparation since it helps achieve a sufficient
degree of dispersion of the nanoclay in the PP matrix. This
dispersion is accomplished during the preparation of the
so-called masterbatch in an extruder (the shearing force
applied leads to dispersion) after the clay particles have
been filtered (‘‘filter press’’), dried (‘‘heating’’), and ground
to reduce particle size to about 30 lm (‘‘milling’’).
The preparation of polypropylene starts with crude oil.
Crude oil is refined after its extraction and one of the
products is naphtha, which is steam-cracked. One of the
main outputs of this steam-cracking process is propylene,
which is then polymerized to polypropylene.
In the mix/dilution step the polypropylene is first grafted
with maleic anhydride. This compound acts as a compati-
bilizer that helps blend the polypropylene and the clay, and
lead to better mechanical properties [15, 18]. Then, in the
masterbatch, the grafted polypropylene is mixed with the
modified nanoclay to obtain the nanocomposite. To acquire
the desirable nanoclay concentration, extra polypropylene
is added in the dilution step. The final product is achieved
by either film extrusion (packaging film), blow molding
(agricultural film), or injection molding (automotive
panel).
The next step of the life cycle is the use phase. In the
case of automotive panels, the use phase allows for the
amount of fuel that is combusted in a car based on the
weight of the panels. The nanocomposite automotive panel
is lighter in weight than the conventional panel and
therefore results in lower petrol consumption in the use
Table 2 Estimated weight saving when polymer nanocomposites are used
Weight of functional
unit with conventional
material
Weight saving
(%)
Formula
used
Weight of functional
unit with nanocomposite
Packaging film, based on OTR 3.66 kg �17.5 Eq. 6 3.02 kg
Packaging film, based on mechan. properties 3.66 kg �9 Eq. 3 3.33 kg
Agricultural film 2.38 t �36.5 Eq. 3 1.51 t
Automotive panels 20.00 kg �1.25 Eq. 4 19.75 kg
Organic modification
Tallow
Water
Filter press
Milling
Heating
Energy Water
Energy
Energy
Water
Modified NC
Energy
Cattle industry
N, K, P fertilizers
Manure
Water loss
Beef
Byproduct
Ion exchange
Extractionand
purificationEnergy
Other minerals
Ca-bentoniteNa-bentonite
Na2CO3
CaCO3
Water
Hydrocyclon
Slurry
Spray drying
Water
Energy
Energy
Energy
Grafting
Styrene
Peroxides
Maleicanhydride
Polymerization
Propylene
Catalyst
Water
Alcohol
Additives
Masterbatch Dilution
Film extrusion
Energy
Energy
Energy
Packaging film
Energy
Steam cracking
Oil refining
Crude oil
Oil extraction
Other products(ethylene,
aromatics, etc.)
Naphtha
Energy
Other fuel
AgricultureEnergy
Injectionmoulding Car
panels
Energy
Wastewatertreatment Sludge
Water
Synthetic MMT
Polypropylene
Energy
Use in car
Use
Waste incineration
Fuel
ElectricityHeat
Emissions
Blow molding Agriculturalfilm
Bentonite
Crude oil
Emissions
Fig. 1 Process chain for the
production and use of
polypropylene nanocomposite
products
216 J Polym Environ (2007) 15:212–226
123

phase and therefore lower emissions. There are no analo-
gous considerations for packaging films and agricultural
films. Because the conditions in the use phase for both the
nanocomposite and the conventional products are identical,
the use phase was not considered in the LCA. The final step
of the life cycle is waste treatment. We assumed that, after
disposal, the products are burned in a waste incinerator in
which part of the released energy (the reaction is exo-
thermic) is recovered for the generation of heat and power.
Life Cycle Inventory Data
Table 3 presents an overview of the material and energy
inputs needed for nanocomposite production and the use
phase. Data for product forming are given separately in
Table 7. Tables 4–6 show the energy and material require-
ments of the products in more detail (per tonne product). The
values for film represent the input data for both packaging
and agricultural film (identical assumptions). Data for PP
came from APME Ecoprofiles [24], while data on the pro-
duction of nanoclay (Table 4) and nanocomposite (Table 5)
were provided by the Institute for Polymer Research (IPF,
Dresden, Germany). The latter energy and material data
came from a pilot plant that produces polypropylene/nano-
clay-composite film. The amount of electricity needed for
extrusion (used for grafting, masterbatch, dilution, and glass
fiber/polypropylene composite production) was estimated
from data from the Energy Efficiency Office [25]. The
energy and material inputs for the production of polypro-
pylene–glass fiber composite are listed in Table 6. The
material requirements were taken from Qiu et al. [26].
Silane-grafted polypropylene (PP-g-Si) was replaced by
maleic anhydride-grafted polypropylene (PP-g-Ma, as for
nanocomposite) because better life cycle inventory data
were available for the latter compound. Table 7 lists the
inputs for the production of the final products.
All of the nanocomposite products are produced from
polypropylene nanocomposites and processed the same
way as the conventional products.
When an automotive panel is used in a car, part of the
car fuel use and the emissions can be assigned to the panel.
We used the following data for our environmental and
economic assessment:
– Weight of the car without panels: 1,222 kg (including
1.6 passengers, which is an average)
– Weight of polypropylene–glass fiber panels: 20 kg
– Weight of nanocomposite panels: 19.75 kg (1.25%
weight reduction)
– Droven distance in life of the car: 150,000 km
– Fuel use during the life of the car (150,000 km) with
PP/GF panels: 9915.0 kg [28]
– Fuel use during the life of the car (150,000 km) with
nanocomposite panels:3 9,913.6 kg
– Fuel use assigned to PP/GF panels:
1� 12421222
� ��0:72�9; 915:0 kg = 115.2 kg fuel
– Fuel use assigned to the conventional panels: 5.7609 t
fuel/t panel
– Fuel use assigned to nanocomposite panels (analogous
to PP/GF panels): 5.7610 t fuel/t panel.
After use, the products are disposed of in a waste
incinerator. Energy is released during waste incineration. It
is assumed that for every joule of waste (calorific value),
0.12 joules of electricity and 0.12 joules of heat are
regained [29]. The calorific values of the products (the
waste fractions) are listed in Table 8.
Using the material inputs from Tables 4–6 yields the
energy credits listed in Table 9. Note that they are valued
negatively because electricity and heat are produced and
the impacts of conventionally generated electricity and heat
are avoided. (A representative mix of European electricity
was obtained using the weighed average of UCTE, NOR-
DEL, and CENTREL electricity. See Table 10.)
The incineration process produces not only energy
credits, but also emissions. These were taken into account
using data from Doka4 [30] (see Table 10).
The impact assessment of all the material and energy
inputs and outputs listed above was calculated using
SimaPro 7 software and the data sources listed in
Table 10.
Results: Life Cycle Impact Assessment
The life cycle impact assessment was carried out using the
impact categories defined by Guinee et al. [38] and the
non-renewable energy use (NREU; this is total fossil and
nuclear energy). The results are presented in Table 11 and
Figs. 2–4. Note that relative results have been included in
the figures and that they represent the difference between
the conventional product and the nanocomposite product.
This form of presentation was chosen, because the different
units of the impact categories make it impossible to show
absolute results in one graph.
Figure 2 shows that both product alternatives are more
or less equal for all but the ozone layer-depletion impact
(the differences are less than 6%). The impact of the
ozone layer depletion differs from those of the other
impacts in that it is negative. The reason for this is that
the credits from waste incineration outbalance the impacts
3 According to Sedan equation: f2 ¼ f1 � W1
W2
� �0:72
; where f = car
efficiency (km/kg fuel) and W = weight of the car.4 Doka [30] assumes 15.9% water in the polymer waste. We
corrected for this assuming 100% PP.
J Polym Environ (2007) 15:212–226 217
123

of the other life cycle stages. Due to its lower PP content,
the nanocomposite packaging film has fewer credits than
the conventional product. One can conclude, therefore,
that the conventional product is somewhat better for the
environment with regard to the ozone layer depletion
impact.
Table 3 Energy and material inputs for production and use of products (f.u.: functional unit, nanocomp.: nanocomposite, conv.: conventional
material)
Input Unit Packaging film Agricultural film Automotive panel
Nanocomp.
f.u.: 3.33 kg
Conv.
f.u.: 3.66 kg
Nanocomp.
f.u.: 1,510 kg
Conv.
f.u.: 2380 kg
Nanocomp.
f.u.: 19.75 kg
Conv.
f.u.: 20.0 kg
Polypropylene kg 3.21 3.66 1457 – 18.6 –
Polyethylene kg – – – 2380 – –
PP/GF composite kg – – – – – 20.0
Nanoclay kg 0.1 – 45.3 – 0.99 –
Styrene kg 0.01 – 4.53 – 0.099 –
Maleic anhydride kg 0.005 – 2.27 – 0.049 –
Electricity for nanoclay production MJ 2.12 – 963.5 – 21.01 –
Fuel oil for nanoclay kg 0.010 – 4.68 – 0.10 –
Electricity for nanocomposite production MJ 9.1 – 4146 – 57.2 –
Fuel kg – – – – 113.8 115.2
Table 4 Energy and material
inputs for the production of
nanoclay for 1 tonne of film and
1 tonne of panels
Inputs for production
of nanoclay
Unit Amount for 1 tonne
of film
Amount for 1 tonne
of panel
Bentonite tonne 0.0195 0.0325
Soda tonne 0.002 0.0032
Tallow tonne 0.0105 0.0175
Fuel oil
For spray drying kg 3.1 5.17
Electricity
For ion exchange MJe 0 0
For hydrocyclone MJe 18.7 31.2
For spray drying MJe 7.66 12.7
For organic modification MJe 442 737
For filter press MJe 2.2 3.67
For heating MJe 152.1 253.6
For milling MJe 15.42 25.7
Table 5 Energy and material
inputs for the production of
1 tonne of nanocomposite for
film and 1 tonne of
nanocomposite for panel
(without production of
nanoclay—see Table 4)
Inputs for production of
nanocomposite
Unit Amount for
1 tonne of film
Amount for
1 tonne of panel
Polypropylene resin
For grafting tonne 0.025 0.042
For dilution tonne 0.94 0.90
Maleic anhydride tonne 0.0015 0.0025
Styrene tonne 0.003 0.005
Peroxides tonne 0.0006 0.001
Electricity
For grafting MJe 75.6 126
For masterbatch MJe 151.2 252
For dilution MJe 2520 2520
218 J Polym Environ (2007) 15:212–226
123

Figure 3 shows that nanocomposite agricultural film has
a lower impact for most of the categories. With regard to
photochemical oxidant formation, however, the impact of
the nanocomposite is somewhat higher. Credits with regard
to waste incineration are higher for the conventional
product than for the nanocomposite (due to the higher
weight of the conventional product). Nonetheless, the
overall conclusion is that the nanocomposite performs
better in environmental terms than the conventional
product.
It can be concluded from Fig. 4 that both product
alternatives of automotive panels perform more or less
equally for all impacts (between �3.5% and + 0.5%
difference).
Table 6 Energy and material
inputs for the production of
1 tonne polypropylene–glass
fiber composite (the electricity
requirements cover the grafting
of PP and the extrusion needed
to produce the composite)
Inputs for production of
polypropylene–glass fiber composite
Unit Amount for
1 tonne of panel
Polypropylene resin t 0.688
Maleic anhydride t 0.0035
Styrene t 0.007
Peroxides t 0.0014
Glass fiber t 0.3
Electricity MJe 2696.4
Table 7 Inputs for the production of the products
Product Inputs for the production of the products Unit Amount for 1 tonne
of product
Reference
Packaging film—conventional Polypropylene-oriented film tonne 1.0 [24]
Agricultural film—conventional Low-density polyethylene film tonne 1.0 [24]
Automotive panel—conventional Polypropylene–glass fiber composite tonne 1.0 [26]
Injection molding—Electricity GJe 9.11 (According to [27], but excluding
space heating)
Table 8 Calorific values (higher heating values) of the waste
fractions
Material Calorific value (higher
heating value) (GJ/tonne)
PP 48.9
PE 50.3
Tallow 41.88
Table 9 Energy credits from product incineration
Product Electricity
(GJ/tonne)
Heat
(GJ/tonne)
Nanocomposite packaging film �5.71 �5.71
Conventional packaging film �5.87 �5.87
Nanocomposite agricultural film �5.71 �5.71
Conventional agricultural film �6.04 �6.04
Nanocomposite automotive panel �5.61 �5.61
Conventional automotive panel �4.04 �4.04
Table 10 Input and output references
Data source
Input
Bentonite [31]
Soda [32]
Tallow [33]
PP resin [24]
Glass fiber [34]
Maleic anhydride [32]
Styrene [27]
Natural gas [35]
Electricity: weighed average of 74.4%
UCTE Electricity, 15.1% NORDEL
Electricity, and 10.5% CENTREL
Electricity (All medium voltage)
[36]
Fuel oil [37]
Fuel combustion in use phase [28]
Polypropylene incineration [30]
Polyethylene incineration [30]
Output
Heat (natural gas) [35]
Electricity (as above) [36]
J Polym Environ (2007) 15:212–226 219
123

Discussion and Conclusions: Life Cycle Interpretation
The main differences in life cycle impact between con-
ventionally produced products and products made from a
polypropylene nanocomposite could be the result of (1) the
production of nanoclay in the nanocomposite products and
(2) the reduced weight of the nanocomposite products.
Although the use of nanoclay in nanocomposite prod-
ucts might be expected to cause a major difference, it is
generally of minor importance due to the very low clay
load of the composites. The fact that uncertainties in life
cycle inventory (LCI) data of nanoclay production are high
(they are based on estimates and pilot plant laboratory data)
Table 11 Impact results for nanocomposite and conventional packaging film, agricultural film, and automotive panels
Impact category Unit Packaging film Agricultural film Automotive panel
Nanocomp Conventional Nanocomp Conventional Nanocomp Conventional
NREU GJ 0.284 0.283 107.1 155.9 8.21 8.23
Climate change kg CO2-eq 15.7 15.9 5642 9242 570 569
Abiotic depletion kg Sb-eq 0.135 0.139 52.8 79.4 3.62 3.60
Ozone layer depletion kg CFC-11-eq �1.83E-7 �2.81E-7 �8.32E-5 �1.88E-4 5.34E-5 5.54E-5
Photochem oxidant form kg ethene 3.83E-3 3.88E-3 1.21 1.16 0.587 0.595
Acidification kg SO2-eq 0.116 0.12 36.5 38.7 2.33 2.36
Eutrophication kg PO43�-eq 8.62E-3 9.19E-3 2.78 4.37 0.338 0.340
Relative impact-1.5 -1.0 -0.5 0.0 0.5 1.0 1.5
Ozone layer depl
NREU
Photo-ox form
Climate change
Abiotic depl
Acidification
EutrophicationNanocompConventional
Fig. 2 Relative results of the impact assessment of packaging film
Relative impact
-1.5 -1.0 -0.5 0.0 0.5 1.0 1.5
Ozone layer depl
Photo-ox form
Acidification
NREU
Abiotic depl
Eutrophication
Climate change NanocompConventional
Fig. 3 Relative results of the impact assessment of agricultural film
Relative impact0.0 0.5 1.0 1.5 2.0
Abiotic depl
Climate change
NREU
Eutrophication
Acidification
Photo-ox form
Ozone layer depl
NanocompConventional
Fig. 4 Relative results of the impact assessment of automotive panels
-1
0
1
2
3
4
5
6
7
8
9
10
Nano-panel Conv-panel
GJ
Glass fiber
Nanoclay
Polymer production
Composite preparation
Forming process
Use phase
Waste phase
Fig. 5 NREU of one functional unit of automotive panels (cradle-to-
grave)
220 J Polym Environ (2007) 15:212–226
123
does not, therefore, impair the robustness of the results.
The real impacts of nanoclay production are probably even
lower than estimated in this study, because the energy use
in the pilot plant considered here is probably higher than
the energy use in commercial-scale industrial plants.
Besides the nanoclay production, further impacts are
related to composite preparation, polymer production,
product forming, waste incineration, and, in the case of
automotive panels, fuel combustion in the use phase.
Overall, fuel consumption and combustion in the use phase
is an important contributor to the life cycle impacts of the
automotive panel. Figure 5 shows that, with respect to non-
renewable energy use, fuel consumption is the main con-
tributor. The same holds for the other impacts, where the
consumption and combustion of fuel are dominant over the
other lifecycle stages.
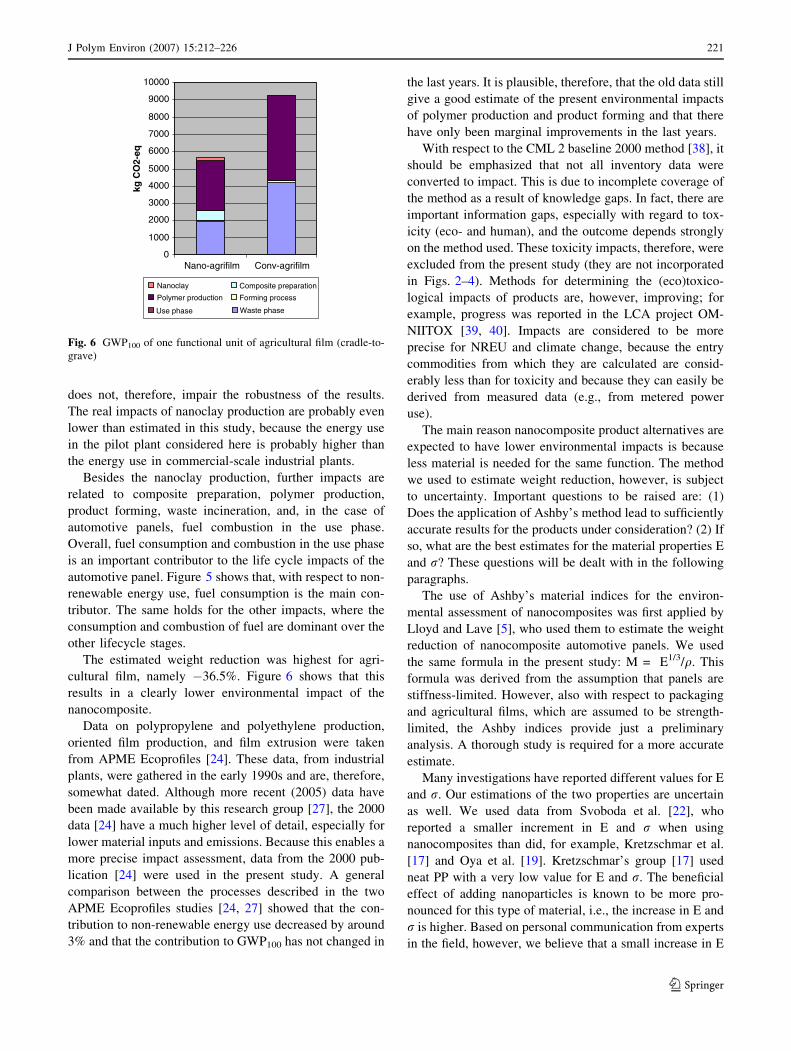
The estimated weight reduction was highest for agri-
cultural film, namely �36.5%. Figure 6 shows that this
results in a clearly lower environmental impact of the
nanocomposite.
Data on polypropylene and polyethylene production,
oriented film production, and film extrusion were taken
from APME Ecoprofiles [24]. These data, from industrial
plants, were gathered in the early 1990s and are, therefore,
somewhat dated. Although more recent (2005) data have
been made available by this research group [27], the 2000
data [24] have a much higher level of detail, especially for
lower material inputs and emissions. Because this enables a
more precise impact assessment, data from the 2000 pub-
lication [24] were used in the present study. A general
comparison between the processes described in the two
APME Ecoprofiles studies [24, 27] showed that the con-
tribution to non-renewable energy use decreased by around
3% and that the contribution to GWP100 has not changed in
the last years. It is plausible, therefore, that the old data still
give a good estimate of the present environmental impacts
of polymer production and product forming and that there
have only been marginal improvements in the last years.
With respect to the CML 2 baseline 2000 method [38], it
should be emphasized that not all inventory data were
converted to impact. This is due to incomplete coverage of
the method as a result of knowledge gaps. In fact, there are
important information gaps, especially with regard to tox-
icity (eco- and human), and the outcome depends strongly
on the method used. These toxicity impacts, therefore, were
excluded from the present study (they are not incorporated
in Figs. 2–4). Methods for determining the (eco)toxico-
logical impacts of products are, however, improving; for
example, progress was reported in the LCA project OM-
NIITOX [39, 40]. Impacts are considered to be more
precise for NREU and climate change, because the entry
commodities from which they are calculated are consid-
erably less than for toxicity and because they can easily be
derived from measured data (e.g., from metered power
use).
The main reason nanocomposite product alternatives are
expected to have lower environmental impacts is because
less material is needed for the same function. The method
we used to estimate weight reduction, however, is subject
to uncertainty. Important questions to be raised are: (1)
Does the application of Ashby’s method lead to sufficiently
accurate results for the products under consideration? (2) If
so, what are the best estimates for the material properties E
and r? These questions will be dealt with in the following
paragraphs.
The use of Ashby’s material indices for the environ-
mental assessment of nanocomposites was first applied by
Lloyd and Lave [5], who used them to estimate the weight
reduction of nanocomposite automotive panels. We used
the same formula in the present study: M = E1/3/q. This
formula was derived from the assumption that panels are
stiffness-limited. However, also with respect to packaging
and agricultural films, which are assumed to be strength-
limited, the Ashby indices provide just a preliminary
analysis. A thorough study is required for a more accurate
estimate.
Many investigations have reported different values for E
and r. Our estimations of the two properties are uncertain
as well. We used data from Svoboda et al. [22], who
reported a smaller increment in E and r when using
nanocomposites than did, for example, Kretzschmar et al.
[17] and Oya et al. [19]. Kretzschmar’s group [17] used
neat PP with a very low value for E and r. The beneficial
effect of adding nanoparticles is known to be more pro-
nounced for this type of material, i.e., the increase in E and
r is higher. Based on personal communication from experts
in the field, however, we believe that a small increase in E
0
1000
2000
3000
4000
5000
6000
7000
8000
9000
10000
Nano-agrifilm Conv-agrifilm
kg C
O2-
eq
Nanoclay
Polymer production
Composite preparation
Forming process
Use phase Waste phase
Fig. 6 GWP100 of one functional unit of agricultural film (cradle-to-
grave)
J Polym Environ (2007) 15:212–226 221
123

and r is more realistic. Whatever the case, our approach
leaves room for the possibility that our weight-reduction
estimate is too pessimistic and that the advantages of using
nanocomposites are better than what we report here.
We assumed the uncertainty to be smaller for agricul-
tural film because the r value of polyethylene came from a
greenhouse film supplier [12] and the value of the nano-
composite was in line with other sources.
There was a large variation among the data sources with
respect to the oxygen transmission rate (OTR). We used
field data in combination with data from MatWeb [23] to
study this factor. According to our calculations, the limit-
ing factor for weight reduction comprises mechanical not
barrier properties. The uncertainties with regard to the
oxygen transmission rate, therefore, are less relevant as
long as the mechanical properties are the limiting factor.
Using the assumptions we made in this study, we were
able to conclude that the use of a polypropylene nano-
composite can have clear environmental advantages over
conventional material in certain cases.
• Our results were best for agricultural film since the use
of a nanocomposite showed a lower impact for five out
of seven environmental categories. This was the result
of the high weight saving.
• The impact of the nanocomposite on packaging film
was similar to that of neat polypropylene. The nano-
composite did, however, have a higher impact on
ozone-layer depletion.
• The nanocomposite automotive panel and conventional
automotive panel performed equally well.
Effect of Free Nanoparticles
Nanoparticles can be released into the atmosphere during
the manufacture, use, and disposal of engineered nanom-
aterials and can thus end up in the environment or come in
contact with humans. The effects that they might have are
not yet fully understood, although research on the topic is
underway. It is unfortunate that there is only some general
knowledge currently available on fine particles since the
specific size and shape of the particles determine the real
danger for man and the environment [41–43].
The risks that nanoparticles form for the environment,
and indirectly for human health, are determined by their
toxicity, persistence in the environment, and bioaccumu-
lation. In general, humans can uptake nanoparticles by
means of inhalation, ingestion, or, in some cases, absorp-
tion through the skin. When nanoparticles are inhaled, they
can affect the human body in two major ways: (1) they can
induce inflammation of the respiratory tract and cause tis-
sue damage and subsequent systemic effects or (2) they can
be transported through the bloodstream to other vital
organs or tissues in the body where they may cause car-
diovascular and extrapulmonary complications. Normally,
uptake via the skin rarely occurs although the risk may be
higher for individuals whose skin is damaged by, for
example, the sun or eczema. Penetration through the skin
can lead to cell damage, since nanoparticles can facilitate
the production of reactive molecules.
The composition, size, and surface characteristics of the
nanoparticles determine their distribution in the body.
Durable, biopersistent nanoparticles may accumulate in the
body, in particular in the lungs, brain, and liver. More
research is required on the mobility of different types of
nanoparticles [42].
Life Cycle Costing (LCC)
Methodology
In contrast to LCA methodology, life cycle costing (LCC)
has not yet been standardized. The Society for Environ-
mental Toxicity and Chemistry (SETAC) is, however,
currently working on the matter [44]. Like those described
above for LCA, the following phases can be defined for
LCC:
• Goal and scope definition
• Cost calculations
• Interpretation of the results.
Goal and Scope Definition
Although the focus is on economic aspects, the goal and
scope of the LCC in this study are similar to those of the
environmental assessment reported in the first part of the
article. The coverage is also cradle-to-grave.
Cost Calculations
The costs of manufacturing the products under consider-
ation were estimated using the market prices of all material
and energy inputs. The relevant inputs are listed in Table 3.
Peroxides were not taken into account due to a lack of price
data. Moreover, the amount of peroxides in the final
product is negligible (no more than 0.1%).
Life cycle costs were calculated from the material and
energy inputs and their costs. Note that the prices vary over
the years and differ per source. The price of polypropylene,
for example, is closely correlated to that of crude oil due to
the use of oil-based feedstocks, the process energy
222 J Polym Environ (2007) 15:212–226
123

necessary for the production, and the limited number of
process steps. As a consequence, the polypropylene price
was higher in 2005 than in 2000. We assumed the same
relationship for the prices of the other petrochemical inputs
(LDPE, styrene, and maleic anhydride). As a result, we
defined the price ranges shown in Table 12.
The price range for nanoclay was based on estimates
from various sources, while the price range for the PP-glass
fiber composite was an estimate from Wageningen Uni-
versity and Research Centre [45].
The costs for the conversion of plastic granules to the
final product were estimated on the basis of information
from a plastics processor (Landre Werkmetaal b.v., Via-
nen, The Netherlands) and are given in Table 13. It should
be noted that these are very rough estimates. The uncer-
tainty has, nevertheless, been neutralized to a large extent,
because a comparative assessment was performed and the
Table 12 Price estimates for material and energy inputs in the life cycle of the products
Low price High price Unit Source
Nanoclay 4400 10000 €/tonne [5] and personal communication with
Crystal Nanoclay and Sud Chemie
Polypropylene 787 1191 €/tonne Industry sources
Polyethylene 926 1401 €/tonne Industry sources
GF/PP composite 1550 2000 €/tonne [45]
Styrene 1060 1604 €/tonne Industry sources
Maleic anhydride 694 1050 €/tonne Industry sources
Electricity 18.3 – €/tonne [46]
Car fuel 1.82 – €/kg Price in March 2007 in NLa
Incineration 100 – €/tonne [47]
a This price is the weighted average of 19 wt% Diesel (1.17 €/tonne/kg) and 81 wt% petrol (unleaded): 1.97 €/kg This ratio is a representative
mix of fuel used by cars in Europe [28]
Table 13 Cost estimates of product forming methods
Production method Costs (€/tonne)
Film extrusion 870
Blow molding 180
Injection molding 420
Table 14 Results life cycle
costingLife cycle costs
conventional product
(€/functional unit)
Life cycle costs
nanocomposite product
(€/functional unit)
Difference (%)
Case 1
Packaging film 6.44 6.39 �0.8
Agricultural film 2877 1857 �35.5
Automotive panel 251 237 �5.4
Case 2
Packaging film 7.92 7.70 �2.8
Agricultural film 4007 2448 �38.9
Automotive panel 260 245 �5.8
Case 3
Packaging film 6.44 6.95 +7.9
Agricultural film 2877 2111 �26.6
Automotive panel 251 242 �3.2
Case 4
Packaging film 7.92 8.26 +4.2
Agricultural film 4007 2702 �32.6
Automotive panel 260 250 �3.6
J Polym Environ (2007) 15:212–226 223
123

conventional polymers and the nanocomposites for each
product were processed in the same way.
In order to account for the price range given in Table 12,
we calculated the production costs for four cases:
1. Low nanoclay price—Low price other material inputs
2. Low nanoclay price—High price other material inputs
3. High nanoclay price—Low price other material inputs
4. High nanoclay price—High price other material inputs
The price ranges of the input data could be accounted
for by performing a cost analysis for these four cases.
Interpretation of the Results
Table 14 shows that, in the cases with high nanoclay costs,
the life cycle costs of nanocomposite packaging film are
higher than those of conventional packaging film. In con-
trast, the life cycle costs of the nanocomposite agricultural
film and automotive panels are consistently lower than
those of the conventional products. The differences are
largest between the nanocomposite and the conventional
agricultural film. This can be explained by the fact that
weight reduction was highest for the nanocomposite agri-
cultural film. Although the weight reduction was only
1.25% for the automotive panels, the nanocomposites have
lower life cycle costs due to the relatively high costs of the
PP–glass fiber composite (=conventional material).
Nanocomposite packaging film has higher life cycle
costs in Cases 3 and 4 because its production requires many
more production steps and material inputs than the con-
ventional packaging film, which consists only of neat
polypropylene. The 9% weight reduction could not com-
pensate for this. A reduction of the nanoclay cost could,
however, make the nanocomposite competitive with con-
ventional packaging film in all cases. Table 15 shows the
required nanoclay cost reduction. In the worst-case sce-
nario, the nanoclay price must be lowered by 51%, if the
initial price level is € 10,000/tonne This means that the
nanoclay price can be at most € 4,900/tonne. In conclusion,
all nanocomposite applications (packaging film, agricul-
tural film, and automotive panels) are economically viable
at a maximum nanoclay price of around € 5,000/tonne. At
this price, the use of nanoclay in agricultural film offers
very considerable cost savings.
Conclusions
The production of nanoclays and their incorporation in
nanocomposites have an impact on the environment that
may be compensated for if the weight reduction resulting
from the use of nanocomposites is large enough. When a
polypropylene nanocomposite is used for agricultural film,
for example, there are clear environmental benefits due to
the high estimated weight reduction. The use of a nano-
composite for packaging film and automotive panels,
however, has no obvious environmental benefit.
From an economic point of view, the use of a nano-
composite in packaging film is advantageous if the
nanoclay price is not higher than € 5,000/tonne Depending
on which material and energy prices are assumed, the life
cycle costs can be reduced by 26–39% when a polypro-
pylene nanocomposite is used for agricultural film. We
estimated the economic advantage of using nanocompos-
ites in automotive applications to be 3–6%.
Based on the results of this study, we can conclude that
the use of nanocomposite polypropylene can have clear
environmental advantages over conventional material in
certain circumstances. These advantages are mainly caused
by a reduction in the amount of material needed, which
depends on material properties like the Young modulus and
tensile strength. We found, for example, a high increase in
these properties compared to those of LDPE, which
explains the large reduction in material. There were only
small improvements (12% improvement in tensile strength)
compared to neat polypropylene. Compared to glass fiber-
reinforced polypropylene, the only improvement was
reduced density. The Young modulus was even worse.
The use of polypropylene nanocomposites, therefore,
only has advantages when it replaces polymers with less
favorable material properties, e.g., LDPE.
It should, however, be stated that there are no disad-
vantages in using nanocomposites. In general, the
nanocomposites do not have a higher environmental impact
than conventional products. Moreover, they show some
economic benefits when used in agricultural film and
automotive panels and definite environmental benefits in
the case of agricultural film. One exception to the use of
nanocomposites may be the toxic effects of free nanopar-
ticles: more research is required on this topic. Provided the
potential release of free nanoparticles from polymer
nanocomposites can be excluded as source of concern for
human health and the environment, the outcomes of the
Table 15 Required nanoclay price reduction to make nanocomposite
packaging film competitive
Nanoclay price
(€/tonne)
Required reduction
in nanoclay price (%)
Case 1 4400 0
Case 2 4400 0
Case 3 10000 50.9
Case 4 10000 33.6
224 J Polym Environ (2007) 15:212–226
123
three PP nanocomposite cases clearly support further
polymer research and technology development.
Acknowledgements This study has been supported by the EU-
Network of Excellence NANOFUN-POLY ‘‘Nanostructured and
Functional Polymer-based Materials and Nanocomposites’’. We thank
Dr. Andreas Leuteritz and Dr. Bernd Kretzchmar from the Institute of
Polymer Research (Dresden, Germany) for their kind cooperation in
generating life cycle inventory data for the production of nanoclay.
References
1. Hong CH, Lee YB, Jho JY, Nam BU, Hwang TW (2005) Int J
Autom Technol 6:665–670
2. Chen L, Wong S-C, Liu T, Lu X, He C (2004) Deformation
mechanisms of nanoclay-reinforced maleic anhydride-modified
polypropylene. Published online in Wiley InterScience (
http://www.interscience.wiley.com)
3. Leuteritz A, Pospiech D, Kretzschmar B, Willeke M, Jehnichen
D, Jentzsch U, Grundke K, Janke A (2003) Adv Eng Mater
5:678–681
4. Sinha Ray S, Okamoto M (2003) Prog Polym Sci 28:1539–1641.
Available online at: http://www.elsevier.com/locate/ppolysci
5. Lloyd SM, Lave LB (2003) Environ Sci Technol 37:3458–3466
6. Ashby MF (2005) Materials selection in mechanical design, 3rd
ed. Elsevier Butterworth-Heinemann, Burlington
7. Brune DA, Bicerano J (2002) Polymer 43:369–387
8. ISO 14040 (1997) Environmental management – life cycle
assessment – principles and framework. International standard
organization report. ISO 14040:1997(E)
9. PRe Consultants (2006) SimaPro 7, Multi User 7.0.1
10. Dreyer CM, Niemann AL, Hauschild Z (2003) Int J LCA
8(4):191–200
11. Gothic Arch Greenhouses, Tomato Greenhouse.
http://www.gothicarchgreenhouses.com/Tomato_House.htm,
accessed 10/03/2006
12. ExxonMobil (2003) ExxonMobil LDPE, LD 166BA Blown Film
Resin. http://www.exxonmobilpe.com, accessed 10/03/2006
13. Association of Plastics Manufacturers in Europe (APME), Brus-
sels, Belgium. A material of choice for the automotive industry.
http://www.plasticseurope.org/Content/Default.asp?pageid=89,
(1999), accessed 07/07/2006
14. Center for the plastics engineering. Nanocomposite materials,
http://www.cdcmp.it/englishversion/ricerca_eng.html, accessed
20/12/2005
15. Reichert P, Nitz H, Klinke S, Brandsch R, Thomann R, Mulhaupt
R (2000) Macromol Mater Eng 275:8–17
16. Kato M, Matsushita M, Fukumori K (2004) Polym Eng Sci
44:1205–1211
17. Kretzschmar B, Pospiech D, Leuteritz A, Jehnichen D, Janke A,
Tandler B (2003) Process design for melt compounding of PP/
clay-nanocomposites. Third world congress nanocomposites
2003, San Francisco 10–12.11.2003
18. Manias E, Touny A, Wu L, Strawhecker K, Lu B, Chung TC
(2001) Chem Mater 13:3516–3523
19. Oya A, Kurokawa Y, Yasuda H (2000) J Mater Sci 35:1045–1050
20. Dell’Anno G (2004) Development of a new class of hybrid
reinforced thermoplastic composites based on nanoclays and
woven glass fibers. Master thesis, University of Pisa,
http://etd.adm.unipi.it/theses/available/etd-02052004-113442/,
accessed 27/10/2006
21. Hasewaga N, Kawasumi M, Kato M, Usuki A, Okada A (1998) J
Appl Sci 67:87–92
22. Svoboda P, Zeng C, Wang H, Lee LJ, Tomasko DL (2001) J Appl
Polym Sci 85:1562–1570
23. MatWeb, material property data. Available at
http://www.matweb.com, accessed 31/03/2006
24. APME Ecoprofiles (2000) Data collected by Boustead consulting:
ecoprofiles of chemicals and polymers. Published by APME
Brussels
25. Energy Efficiency Office (1993) Energy consumption guide 31;
the moulding of thermo-plastic containers by the extrusion-blow
moulding process, p 11
26. Qiu W, Mai K, Zeng H (1998) J Appl Polym Sci 71:1537–1542
27. APME Ecoprofiles (2005) Data collected by Boustead consulting:
ecoprofiles of the European plastics industry.
http://www.plasticseurope.org/Content/Default.asp, accessed 27/
10/2006
28. Spielmann M, Kagi T, Stadler P, Tietje O (2004) Life cycle
inventories of transport services. Ecoinvent report No 14. Swiss
Centre for Life Cycle Inventories, Dubendorf, p 63
29. Phylipsen D, Kerssemeeckers M, Blok K, Patel M, de Beer J
(2002) Clean technologies in the materials sector – current and
future environmental performance of material technologies.
Report Commissioned by European Commission’s Institute for
Prospective Technological Studies (IPTS), Ecofys, Department of
Science, Technology and Society, Utrecht University, Utrecht
30. Doka G (2003) Life cycle inventories of waste treatment services.
Ecoinvent report No 13, Swiss Centre for Life Cycle Inventories,
Dubendorf, December 2003. Part II – Waste incineration, p 50
31. Kellenberger D, Althaus H-J, Jungbluth N, Kunniger T (2003)
Life cycle inventories of building products. Final report ecoinvent
2000 No 7. EMPA Dubendorf, Swiss Centre for Life Cycle
Inventories, Dubendorf, CH, Online-Version under:
http://www.ecoinvent.ch. Part XIX, p 23
32. Althaus H-J, Chudacoff M, Hellweg S, Hischier R, Jungbluth N,
Osses M, Primas A (2004) Life cycle inventories of chemicals.
Ecoinvent report No 8. Swiss Centre for Life Cycle Inventories,
Dubendorf, pp 412–414, 636–640
33. Nemecek T, Heil A, Huguenin O, Meier S, Erzinger S, Blaser S,
Dux D, Zimmermann A (2004) Life cycle inventories of agri-
cultural production systems. Final report ecoinvent 2000 No 15.
Agroscope FAL Reckenholz and FAT Taenikon, Swiss Centre for
Life Cycle Inventories, Dubendorf, CH, retrieved from:
http://www.ecoinvent.ch, pp 145–146
34. Jungbluth N (2003) In: Kellenberger D, Althaus H-J, Jungbluth
N, Kunniger T (eds) Life cycle inventories of building products.
Final report ecoinvent 2000 No 7. EMPA Dubendorf, Swiss
Centre for Life Cycle Inventories, Dubendorf, CH, Online-Ver-
sion under: http://www.ecoinvent.ch, pp 16–18
35. Faist Emmenegger M, Heck T, Jungbluth N (2003) In: Dones R
et al (eds) Sachbilanzen von Energiesystemen: Grundlagen fur
den okologischen Vergleich von Energiesystemen und den
Einbezug von Energiesystemen in Okobilanzen fur die Schweiz.
Final report ecoinvent 2000 No. 6-V, Paul Scherrer Institut Vil-
ligen, Swiss Centre for Life Cycle Inventories, Dubendorf, CH.
Online: http://www.ecoinvent.ch, p 116
36. Frischknecht R, Faist Emmenegger M (2003) In: Dones R (ed)
Sachbilanzen von Energiesystemen: Grundlagen fur den okolo-
gischen Vergleich von Energiesystemen und den Einbezug von
Energiesystemen in Okobilanzen fur die Schweiz. Final report
ecoinvent 2000 No. 6, Paul Scherrer Institut Villigen, Swiss
Centre for Life Cycle Inventories, Duebendorf, CH. Online-
Version under: http://www.ecoinvent.ch, pp 35, 44, 52, 88, 89
37. Jungbluth N (2004) In: Dones R (ed) Sachbilanzen von Ener-
giesystemen: Grundlagen fur den okologischen Vergleich von
Energiesystemen und den Einbezug von Energiesystemen in
Okobilanzen fur die Schweiz. Final report ecoinvent 2000
J Polym Environ (2007) 15:212–226 225
123
No. 6-IV, Paul Scherrer Institut Villigen, Swiss Centre for Life
Cycle Inventories, Duebendorf, CH, pp 187, 216
38. Guinee JB, Gorree M, Heijungs R, Huppes G, Kleijn R, de
Koning A, van Oers L, Wegener Sleeswijk A, Suh S, Udo de
Haes HA, de Bruijn H, van Duin R, Huijbregts MAJ (2001) LCA
– an operational guide to the ISO-standards – part 2a. Center of
Environmental Science, Leiden, pp 16, 26, 48, 80
39. Pennington DW (2004) Int J LCA OMNIITOX Special Edition
9(5):281–342
40. Pant R, van Hoof G, Schowanek D, Feijtel TCJ, de Koning A,
Hauschild M, Pennington DW, Olsen SI, Rosenbaum R (2004)
Int J LCA 9(5):295–306
41. US Environmental Protection Agency (2005) Nanotechnology
white paper, external review draft. Science Policy Council, US
Environmental Protection Agency, Washington, DC 20460, pp
35–38
42. Lauterwasser C (2005) Opportunities and risks of nanotechnol-
ogies. Report in cooperation with the OECD International Futures
Programme. Allianz Center for Technology, London/Ismaning,
pp 30–32
43. Oberdorster G, Oberdorster E, Oberdorster J (2005) Environ
Health Persp 113(7):823–839
44. Rebitzer G, Seuring S (2003) Int J LCA 8(2):110–111
45. Wageningen UR (2004) Patent on natural fiber composites.
http://www.agrofibrecomposites.com/patent.htm, accessed 13/04/
2006
46. Eurostat. Electricity prices industrial users, 1995–2005 average.
http://epp.eurostat.ec.europa.eu, accessed 27/10/2006
47. Kosten storten en verbranden van afval, 1985–2005. In: Milieu-
en Natuurcompendium. MNP, Bilthoven, CBS, Voorburg en de
WUR Wageningen, 14 September 2005
226 J Polym Environ (2007) 15:212–226
123
Copyright © 2022 FDOKUMEN