Void content measurements in commingled E-glass/polypropylene composites using image analysis from...
25
VOID CONTENT MEASUREMENTS IN COMMINGLED E- GLASS/POLYPROPYLENE COMPOSITES USING IMAGE ANALYSIS FROM OPTICAL MICROGRAPHS C. Santulli*, R.Garcia Gil**, A.C. Long**, M. J. Clifford** * Department of Engineering University of Reading - Whiteknights - P.O. Box 225 Reading, Berks. RG6 6AY, UK ** School of Mechanical, Materials, Manufacturing Engineering & Management University of Nottingham - University Park - Nottingham NG7 2RD, UK ABSTRACT The principal interest of measuring the level of internal porosity in composite materials lies in the possibility of relating void content with macro and micro-structural properties and hence with composite manufacturing quality. In the particular case of commingled E-glass/polypropylene composites, processing parameters, such as moulding pressure and material temperature, have been demonstrated to influence void content, which is in turn affecting mechanical and impact properties of the material. It is of paramount importance therefore to dispose of a simple and reliable method for void content determination on these composites, which are increasingly used e.g., in automotive industry, for their energy absorbing properties and their low cost. In this paper, void measurements in E-glass/polypropylene commingled laminates are performed by analysing images from optical micrographs. Voids were classified, due to their size and orientation, as microvoids, intratow voidage, coplanar voids and extensive voids. In practice, optical microscopy of specimens was able to detect void contents of less than 1% using a statistical point-counting technique. Computerised analysis of the micrographs was also possible, based on the grey scale difference existing between voids and the rest of the composite image (matrix, reinforcement). Possibilities and limitations of this approach are highlighted by discussing the relation between the sample of the material considered and the obtained accuracy, which depends also on image filtering and appropriate 1
Transcript of Void content measurements in commingled E-glass/polypropylene composites using image analysis from...

VOID CONTENT MEASUREMENTS IN COMMINGLED E-
GLASS/POLYPROPYLENE COMPOSITES USING IMAGE ANALYSIS
FROM OPTICAL MICROGRAPHS
C. Santulli*, R.Garcia Gil**, A.C. Long**, M. J. Clifford**
* Department of Engineering
University of Reading - Whiteknights - P.O. Box 225 Reading, Berks. RG6 6AY, UK
** School of Mechanical, Materials, Manufacturing Engineering & Management
University of Nottingham - University Park - Nottingham NG7 2RD, UK
ABSTRACT
The principal interest of measuring the level of internal porosity in composite materials lies in the
possibility of relating void content with macro and micro-structural properties and hence with
composite manufacturing quality. In the particular case of commingled E-glass/polypropylene
composites, processing parameters, such as moulding pressure and material temperature, have been
demonstrated to influence void content, which is in turn affecting mechanical and impact properties of
the material. It is of paramount importance therefore to dispose of a simple and reliable method for
void content determination on these composites, which are increasingly used e.g., in automotive
industry, for their energy absorbing properties and their low cost.
In this paper, void measurements in E-glass/polypropylene commingled laminates are performed by
analysing images from optical micrographs. Voids were classified, due to their size and orientation, as
microvoids, intratow voidage, coplanar voids and extensive voids. In practice, optical microscopy of
specimens was able to detect void contents of less than 1% using a statistical point-counting technique.
Computerised analysis of the micrographs was also possible, based on the grey scale difference
existing between voids and the rest of the composite image (matrix, reinforcement). Possibilities and
limitations of this approach are highlighted by discussing the relation between the sample of the
material considered and the obtained accuracy, which depends also on image filtering and appropriate
1

image thresholding. Due to the complex structure of Twintex laminates and to consequent large
deviation in void content values, not less than 80% of any cross-section (20 mm. long) removed from
the laminate should be examined to obtain a measurement of the void content percent with an error of
0.15. With void contents ranging from 0.6 to 15%, this corresponds to an accuracy of void content
measurement variable from ±0.1 to ±2%. In practice, this accuracy can only be obtained, if a significant
number of cross-sections are removed from different regions of the laminate.
INTRODUCTION
Voids are among the most common manufacturing induced defects in polymer matrix
composites. Void formation can be due to a number of reasons, including air
entrapment during the formulation of the resin system, moisture absorption during
material storage or processing and incorrect tow placement during moulding (1). The
detrimental effect of void content on mechanical properties of composite laminates is
well known for thermosetting composites (2-5). In thermoplastic composites, a recent
study has clarified the link between the application of optimised moulding parameters,
the reduction in void content and the improvement in some properties of the laminate,
such as interlaminar shear strength and Charpy impact results (6). In the case of
commingled E-glass/polypropylene laminates, including both E-glass and
polypropylene fibres in a polypropylene matrix, void content can be influenced by a
number of processing parameters, including time at pressure and press temperature
(7). In addition, their mechanical and impact properties seem to be affected by void
content levels exceeding 3-4% (8). This contrasts with results obtained on GMT
materials, where the influence of void content has been found to be much more
dubious (9). An explanation for this can be that void content (i.e., manufacturing
defects) is able to reduce the beneficial effect of commingling on impact resistance.
2

Techniques most commonly identified so far for the determination of void content in
composites can be divided into three large groups: methods based on density
measurements, non-destructive methods and microscopy based methods.
As reported in ASTM D1505-98, void content accurate to ±2.5% by volume can be
determined by comparison of the theoretical density based upon constituent
proportions and densities. On a similar principle, burn-off is probably the most widely
used technique for void content measurement in composite materials and is
standardised in ASTM D2734-94. Burn-off results are accurate at levels of ± 1% void
content, if the effect of ignition on the materials is known and assuming that the
density of the resin is the same in the composite as it is in a large cast mass. However,
differences in curing, heat and pressure, and molecular forces from the reinforcement
surface change the composite resin density from the bulk resin density.
Other methods for void measurement in composites have also been proposed, which
involve pore filling, such as measurement of the limiting moisture content (10) and
acid digestion techniques (11). These methods are only suitable in the case that the
volume of closed porosity, which does not allow moisture to enter the material, is
negligible compared to the total void content. This is often the case with natural fibre
composites, but it is not a general rule for all polymeric matrix composites.
Among methods based on non-destructive investigation techniques, void content
measurement is possible using ultrasound, since a high void content (exceeding 10%)
gives appreciable variations of ultrasound attenuation coefficient (12-14). Nuclear
magnetic resonance imaging (NMRI) has also been used to detect voids with diameter
of more than 100 µm, assuming that water collects at defects and acquiring an image
of water absorbed by the composite (15).
3

From the above considerations, a number of limitations are apparent, which leave a
considerable margin of interest for alternative techniques, such as those based on
microstructural image analysis, a review of which has been provided in (16). Accurate
void content measurements at low levels of porosity (less than 1%) can be carried out
using a statistical point-counting technique from optical or electron microscopy
images (17). The morphology of voids has been analysed under a microscope, mainly
for carbon fibre reinforced composites (18-21). In some cases, the complex geometry
profile of the microvoids in composites was resolved from micrographs with the
support of fractal geometry (22-23).
This paper concentrates on the use of microscopy and image analysis to determine
void content in commingled E-glass/polypropylene composites. It analyses first the
morphology of voids present, then discusses the difficulties in carrying out void
content measurements in these laminates. It finally provides a statistical analysis of
the relation between the representative number of photomicrographs to be analysed
and the consequent accuracy of the obtained measurement. The discussion compares
the obtained results in the light of existing literature on microscopy measurement of
void content for composite materials.
4

EXPERIMENTAL
1. Material
The material used for the experiments is a balanced twill weave fabric of density 1.5
g/cm³ consisting of a yarn of 60% by mass commingled E-glass and polypropylene
supplied by Vetrotex International under the trade name Twintex®.
Twintex laminates were manufactured to a thickness from 2 to 4 mm using two
different methods, both based on melting of the polypropylene matrix: compression
moulding and vacuum moulding. In each case the procedures that yielded the best
manufacturing quality and hence the lowest void content were:
• Non-isothermal compression moulding with material preheating at a temperature
of 200ºC for 3 minutes and then compaction under a press for 70 seconds at a
pressure of 30 bar with oven-press transfer time not exceeding 15 seconds
• Vacuum moulding with placement of the fabric layers over a single aluminium
flat plate and sealing in a vacuum bag. This arrangement is placed in a hot air oven
and a vacuum pressure of 950 mbar is applied until the material temperature reaches
180°C (less than 300 seconds). Finally, the laminate (still sealed within the vacuum
bag) is quenched in cold water until the temperature falls below 120°C.
2. Sample preparation
Square samples (20 mm side) were cut with an angle of 45° to allow the observation
of the fibre sections in both the longitudinal and transverse orientations. After that, the
samples were cast in polyester resin in 40-mm mounting rings with 2-5 % of Butanox
5

catalyst. After removing the cured specimen from the mounting ring, this was cut on
the two faces using a diamond saw to a thickness not exceeding 14 mm, and then
polished mechanically. For polishing, SiC paper disks were used, with abrasive 240,
600, 1200 and 2500 grit, using every paper for 2 minutes, and then with 1 µm alumina
paste consisting of 20% volume of powder and 80% volume of water. The grinding
operation was carried out on a Struers® DAP-7 machine equipped with an automatic
holder (Struers® Pedemin-S), using 240-rpm motor speed. To remove dust from
polishing, a final cleaning stage was carried out in an ultrasonic bath. This level of
polishing allowed the use of 50 times magnification to highlight voids and impact
damage under the optical microscope. However, higher levels of magnification were
also used, to highlight some particular features (e.g., microvoids) in the laminates.
3. Image treatment
Void content measurement was carried out from the images acquired from a Zeiss
microscope, using Aphelion ™ software. Aphelion ™ has an adjustable image frame
that can be sized to an area of 280000 pixels (700x400) maximum. Image analysis
software allows one to identify 256 grey levels (0=black, 255=white). These grey
levels are used to discriminate between objects in an image using a process called
thresholding, which separates objects on the basis of their grey level or brightness and
creates a resulting binary image. The main problem in microscope image analysis is to
set a correct range of image threshold, in order to individuate the voids. To do this,
the grey level of voids in the image must be known. Aphelion software provides an
operator, which is able to show pixel intensity across an image. This can be obtained
by drawing a line over the area of interest and measuring the grey level along the line.
6

After thresholding the image, the number of pixels of the highlighted region can be
counted and the void percent can be measured by comparing the area of the
highlighted region with the total image area. However, in some cases the thresholded
image also includes other features of comparable grey levels, such as cracked fibres.
To account for such features a filter can be applied to the image to exclude regions
with an area smaller than a given number of pixels.
RESULTS
1. General considerations
The optimisation of the moulding process in commingled yarn composites allows
void content to be reduced to values close to zero, the only voidage remaining being
matrix dispersed microvoids. In practice, the lowest value measured in a microscopy
image for vacuum moulded Twintex was equal to 0.5%, whilst in the compression-
moulded material it was equal to 0.3%. However, even a higher void content may not
result in a reduction of mechanical properties. As a consequence, correct
manufacturing of commingled yarn composites is aimed to the reduction of void
content below a value able to ensure that satisfactory mechanical properties are
obtained.
Composite moulding quality is indicated not only by the minimum void content value
measured, but also by void distribution across the material: therefore an analysis of
the confidence value needs also to be carried out. As an example, on a set of
compression moulded materials, including five plaques obtained with the optimal
moulding procedure described above, a total of twenty specimens for microscope
7

analysis were removed from different locations. Five images were obtained for each
side were obtained, giving a total of ten images per specimen. In Figure 1, the values
of the average void content obtained on each image are plotted to highlight the
distribution of void content values in the material. It may also be observed that the
statistical mean value, highlighted in bold in the histogram, does not correspond to the
most frequent value in the distribution (statistical mode). In addition the distribution
of values is subject to significant scatter, with void contents considerably higher than
the mean obtained from some images.
2. Morphology and origin of voids present in the material
Void morphology can be analysed from the optical microscopy images. A number of
possible void geometries and locations can be highlighted. A useful reference is
comparing void dimensions with fibre diameters: these are shown in Figure 2. Here,
the presence of some dark regions is also apparent at fibre edges. These represent
broken fibre edges and can be confused with composite voids (unless a filter is used
as described above).
From microscopy observations, four types of voids can be distinguished. These were
defined as microvoids, intratow voidage, coplanar voids and extensive voids. Whilst
the first are likely not to have a large influence on mechanical properties of Twintex,
coplanar and extensive voids are likely to have a significant effect. Below, the origin
and location of these voids are discussed and images of each type are shown (Figures
3-6).
8

Microvoids. Microvoids were found to be mainly dispersed in the matrix, as can be
observed in Figure 3. Usually large voids are dissolved in the matrix, as an effect of
the application of a sufficiently high temperature and pressure (24). Microvoids may
persist throughout the matrix due to temperature variations across the laminate and
undulations on the tool surface resulting in variations in applied pressure, their
common effect being to reduce thermal expansion coefficient in the composite (25).
Differential contraction of glass and polypropylene appears to be a less important
factor, although voids created by such processes have to be taken into account (26).
The dimension of microvoids that it was possible to detect in the microscopy images
using a 200x magnification was around 1 µm. However, such detection proved
difficult and in some cases uncertain, as it is possible to observe in Figure 3. Here,
microvoids are hardly apparent in the matrix between the polypropylene fibres (top)
and glass fibres (bottom): for an improved detection of microvoids on Twintex,
electron microscopy should therefore be used.
Intratow voids. The consolidation mechanism of commingled yarn composites proved
to be dominated by impregnation of the fibre agglomerations by the resin. This can be
modelled through a number of consecutive stages, including onset of yarn
consolidation and impregnation of fibre agglomerations, leading finally to complete
consolidation (24).
An insufficient impregnation, more often due to the application of a pressure lower
than required or for a period not sufficiently long, may result in the presence of
intratow voids. These may have the aspect of approximately square voids between the
fibres (Figure 4: left) or of cracks diffused in the fibre bundle (Figure 4: right).
9

Coplanar voids. Voids that lie along the same plane, often corresponding to an
interlayer boundary, can be defined as coplanar voids (21). In cases where the quality
of consolidation obtained was satisfactory, very few coplanar voids were usually
found at interfaces. These were mainly present in compression-moulded specimens
and were usually related to insufficient preheating or to longer oven-press transfer
time, resulting in a non-uniform cooling rate of the material. In addition, coplanar
voids were more likely to be detected when resin rich areas corresponded with the
interface between the layers. This may be a result of shrinkage of the polypropylene
fibres during preheating, due to the complex temperature distribution present in the
commingled laminate. Coplanar voids were irregularly edged if close to fibre bundles,
but most generally oblong if in the matrix. In the worst cases, coplanar voids were
found to coalesce along considerable lengths, up to a few millimetres (Figure 5b).
Extensive voidage. Extensive voidage can be present in cases where either an
insufficient pressure is applied or a vacuum is not applied, so that air is trapped into
the material, as it is shown in Figure 6a. Another possibility for the creation of
extensive voidage can be incorrect tow placement of fabric layers in the tool, resulting
in some cases in severe ply wrinkling or folding. In the latter case, high void contents,
generated by non-uniform heating, are also coupled with the presence of disruptions
in the fibre architecture. These are particularly apparent in the external layers of the
laminates, mainly at a depth not exceeding 0.5 mm. from the surface of the composite.
In this context, to obtain a sufficiently clear optical microscopy image in this region
proved difficult for the non-flatness of the cross-section, owed to the architecture
disruptions mentioned above. The best option to obtain a picture of the voids was to
obtain a negative image after correcting the background by improving via software
10

fibre edge sharpness. It this way, as can be observed in Figure 6b, a sufficiently clear
image of the void regions (uniformly coloured in the picture) was obtained.
3. Problems in void content measurement
A number of issues were encountered in measuring void content on Twintex from
optical microscopy images. One of these issues concerns the grade of polishing. As
mentioned above, the procedure adopted allowed the use of 50x magnification, which
gives a pixel dimension of approximately 4.9 µm. This sets a theoretical limit for the
minimum void size that can be observed. In practice, this does not allow the
observation of matrix-dispersed microvoids and makes it very difficult to observe
inter-tow voidage. However, 50x magnification is useful to have an indication of the
level of void content in the material, since the dimensions of the micrographs obtained
are considerably larger than the maximum dimensions of Twintex layers adopted. In
this way, regions at the interface between two layers should be present in every single
image. In addition, the number of images one needs to examine is considerably
smaller than at higher magnification. Consider also that the contribution of the
microvoids and of inter-tow voidage to the total void content may in many cases be
neglected, so that a higher magnification is not needed for void content measurement.
A subsequent problem concerns the correct thresholding of images, able to yield an
accurate void content measurement. It is noteworthy that fibre edges, as observed in
Figure 2, may in some cases affect the measurement. This problem is usually
eliminated with polishing. If this is not the case, its effect on the accuracy of the
measurement may be considerable. In Figure 7 a histogram of grey levels for a
glass/polypropylene specimen is shown. Here, whilst grey level intervals relative to
11

fibres and matrix are clearly apparent, in the lower grey level region it is possible to
discern voids and cracked fibre ends. However, the boundary between void and fibre
end grey levels can be controversial and uncertain. A division is proposed in Figure 7,
which corresponded to the thresholding typically applied to images in this study.
A more accurate method to carry out image thresholding is represented in Figure 8.
Here, a profile line is traced throughout a number of coalescent voids in the image.
After this, the histogram of grey levels across the profile line is traced: grey level
values corresponding to the voids are shown in the histogram on the lower plateaux
and the threshold is established accordingly.
4. Statistical analysis
A principal difficulty in setting a standard for microscopy void content measurements
is that the measurement can depend on the magnification employed. Conversely, the
use of different magnifications may be necessary to pick up different void geometries
and locations. In addition, the presence of different types of voids across the material
may require analysing a great number of images to obtain an area representing the real
void level in the composite material.
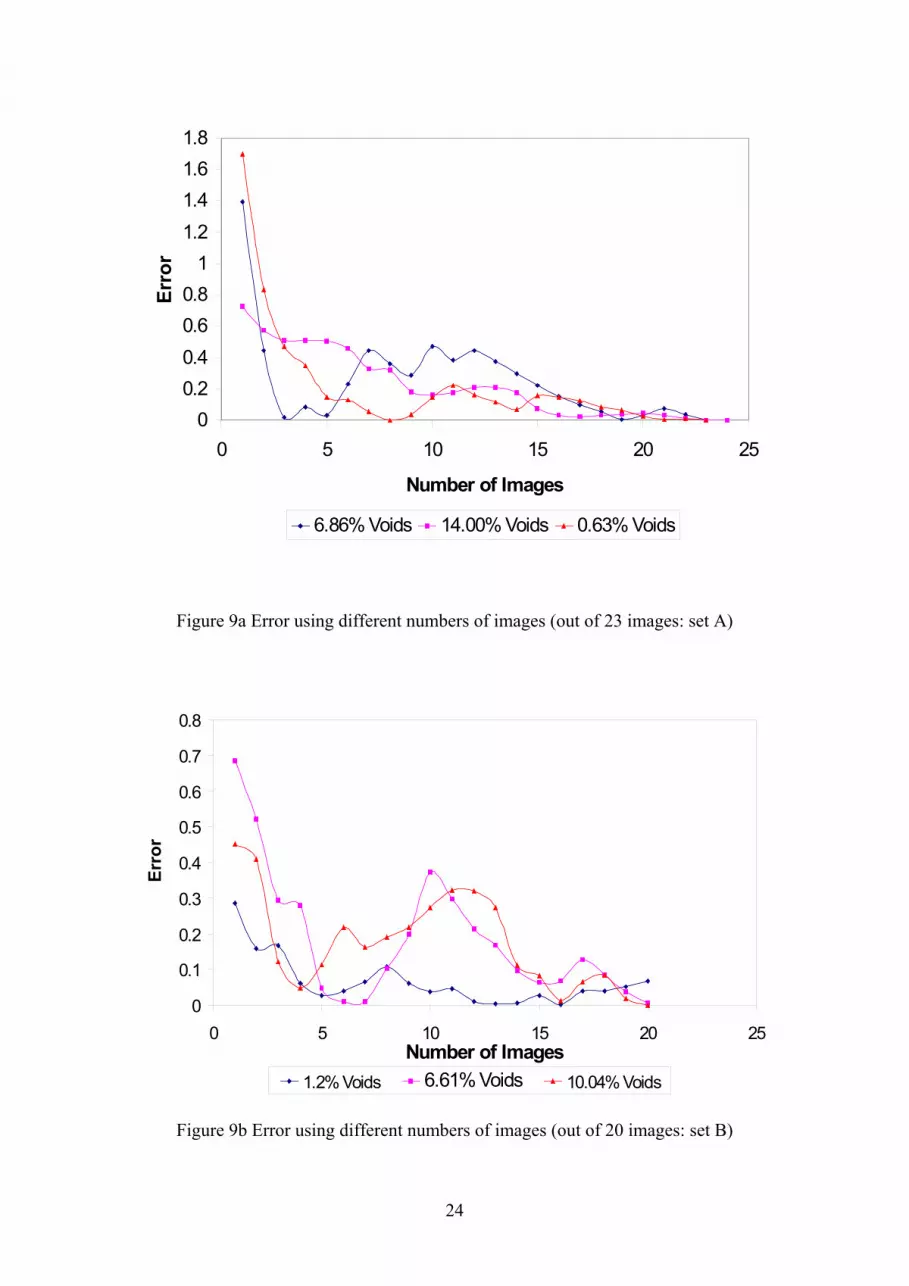
To determine the number of images required from a single sample to obtain an
accurate measure of void content, error analysis has been carried out. Six specimens
(approximate dimension 25 mm x 1 mm) removed from different laminates, with void
contents ranging from 0.63% to 14.00%, have been analysed. On three specimens (set
A), obtained by compression moulding, 23 images were captured at 100x
magnification for each specimen (Figure 9a). On other three specimens (set B),
12

produced by vacuum consolidation, 20 images were captured at the same
magnification (Figure 9b).
Equation 1 shows the definition of error, where is the void content estimated after
analysing only a number of images in a cross-section and
m
µ is the measured void
content determined after analysing all the images in a cross-section removed from the
specimen. For the purpose of this analysis, the measured void content µ is taken to be
the average void content of the entire cross section that was analysed
µµ−
=m
error (1)
Figures 9a and 9b show the number of images required to estimate the mean void
content with a given error. These figures demonstrate that not less than 18 images
have to be analysed to obtain an error less than 0.15. This means that not less than
80% of the specimen cross-section should be analysed to obtain this level of accuracy.
Further statistical analysis was also carried out to measure the relation between the
number of polished cross-sections removed from the material and the error in void
content measurement obtained. With this aim, 20 cross-sections were cut from a
single Twintex laminates, dimensions 260x120 mm, manufactured by compression
moulding. This was the maximum number of cross-sections obtainable from the
specimen with this technique. All of these cross-sections were entirely examined and
void content was measured, being equal to 3.4 %. Results of error analysis, reported
in Figure 10, show that with the examination of only a half of the cross-sections of the
laminate, an error of less than 0.05 is obtained. However, in laminates with higher
13

void content, due to manufacturing defects, these are likely to be more concentrated in
some parts of the laminate (e.g., close to the surfaces) than in other. If this is the case,
cross-sections from all the regions of the laminate need to be examined to obtain this
accuracy in void content measurement.
DISCUSSION
The results show that microscopy analysis of void content is able to offer a
compromise between adequate accuracy of the observation and sufficient resolution,
provided that the polishing procedure is optimised. Microscopy analysis has
demonstrated that the void content can be minimised in commingled materials: in the
region showing the lowest void content, mainly matrix-dispersed microvoids were
observed. Microvoids are not usually reported to be influential on static properties of
composite materials (2), and are often the effect of phenomena associated with tow
impregnation, such as polymer devolatilization (28). However, microvoids can have a
detrimental effect on dynamic properties, in particular in the case of impact, where the
effect of local properties on the laminate performance has been emphasised (29).
In the case of the presence of manufacturing induced defects, microscopy observation
was able to provide indications on the relation between defect morphology and
manufacturing problems. As an example, it has been pointed out that non-uniform
material heating results in extensive voids, such as those observed in Figure 6b, and
thereby reduces composite strength (30). In addition, the large dispersion of void
content values, apparent from microscopy analysis, can be related to the complex
structure of laminates based on commingled glass fibre and polypropylene yarns.
More precisely, a relation can be established between non-uniform void content and
14

dispersion of fibre bundle diameters (27). The scatter of void content values is likely
to be increased in case of imperfect manufacturing (31).
The consequence of this diverse distribution of void content values across a cross-
section in commingled laminates is that a large part of the specimen must be
examined if an accurate value of the void content is to be obtained. Problems with
representative sample are a well-known limitation of microscopy void content
measurement techniques (32). However, for most practical purposes the coverage of a
smaller, but significant percentage of the sample (not less than 25%) can be sufficient,
in that it will indicate the presence of an alarming void content level (exceeding 5%),
as a consequence of manufacturing problems. This reduced scope analysis may be
even more indicative, if the composite is divided into several regions: surface, intra-
layer and inter-layer, and images from the different regions are selected proportionally
to the respective areas of these regions.
To improve the method it may be necessary to use an increased image magnification,
so not to exclude microvoids and intra-tow voids. In addition, broken fibre fragments
should be filtered from the image with the recognition of the image contour, as it has
been used for the measurement of fibre orientation in short-fibre composites (33).
CONCLUSIONS
A simple optical microscopy analysis of commingled E-lass/polypropylene laminates,
from polished cross-section specimens, allowed the morphology of voids to be
established and the void content to be measured. Void content measurements yielded
in best cases values close to zero. However, these values cannot be assumed to be
typical. In contrast, void content was shown to be variable, due to the commingled
15

structure of Twintex and to a number of processes occurring during composite
manufacturing, such as air trapping, insufficient pressure and incorrect tow
placement. Voids were classified by their size and orientation as microvoids, inter-
tow voidage, coplanar voids and extensive voids. The large deviation in void content
values requires that not less than 80% of any cross-section be examined in order to
measure the void content percentage with an error of less than 0.15. In addition, a
number of cross-sections need to be removed from every laminate, to obtain void
content measurement with an accuracy of ±0.1%.
This method can be recommended for its simplicity and the accuracy obtained is
suitable for the practical purpose of studying material moulding quality. It can also be
noted that results obtained with this method for the complex structure of commingled
composites are promising for its application to other composite materials. However,
improvements are still needed, such as image filtering of extraneous features (e.g.,
broken fibre fragments), to create an automated system with random selection of a
significant number of images for void content measurement.
REFERENCES
1. Svensson N., Shishoo R., Gilchrist M., “Manufacturing of thermoplastic composites from
commingled yarns - A review”, Journal of Thermoplastic Composite Materials 11, 1998, pp. 22-56
2. Kurek K., Bledzki A.K., “The effect of micropores on mechanical properties of laminates”,
Polimery 45, 2000, pp.271-281
3. Kang M.K., Lee W.I., Hahn H.T., “Formation of microvoids during resin-transfer molding
process”, Composites Science and Technology 60, 2000, pp. 2427-2434
4. Bowles, K.J., Frimpong, S., “Void Effects on the Interlaminar Shear Strength of Unidirectional
Graphite-Fibre-Reinforced Composites”, Journal of Composite Materials 26, 1992, pp. 1487-1509.
16

5. Varna J., Joffe R., Berglund L.A., and Lundstrom T.S., “Effect of voids on failure mechanisms
in RTM laminates”, Composites Science and Technology 53, 1995, pp.241-249.
6. Bernhardsson J., Shishoo R., “Effect of processing parameters on consolidation quality of GF/PP
commingled yarn based composites”, Journal of Thermoplastic Composite Materials 13, 2000, pp. 292-
313.
7. Wakeman M.D., Cain T.A., Rudd, C.D., Brooks R., Long A.C., “Compression moulding of glass
and polypropylene composites for optimised macro- and micro-mechanical properties. 1. Commingled
glass and polypropylene”, Composites Science and Technology 58, 1998, pp.1879-1898.
8. C. Santulli, R. Brooks, A.C. Long, C.D. Rudd, Influence of micro-structural voids on the
mechanical and impact properties in commingled E-glass/polypropylene thermoplastic composites,
Journal of Materials: Design and Applications Part L 216, pp. 85-100.
9. Nilsson G., Fernberg S.P., Berglund L.A., “Strain field inhomogeneities and stiffness changes in
GMT containing voids”, Composites Part A 33, 2002, pp. 75-85
10. Perov Y.Y., Kruzhkova E.Y., Express determination of polymer composite porosity, Mechanics
of Composite Materials 31, 1995, pp. 585-587.
11. Salvado C., Wai M., and Hunter A., “Simultaneous Determination of Matrix and Porosity
Content by Non-destructive Method”, Society of Plastics Engineers, Proceedings of the 47th Annual
Technical Conference and exhibits, New York, 1989, pp. 1048-1050.
12. Jeong H., “Effects of voids on the mechanical strength and ultrasonic attenuation of laminated
composites”, Journal of Composite Materials 31, 1997, pp. 276-292.
13. Mouritz A.P., “Ultrasonic and interlaminar properties of highly porous composites”, Journal of
Composite Materials 34, 2000, pp. 218-239.
14. McRae, K.I., Zala, C.A., "Attenuation and porosity estimation using the frequency-independent
parameter Q", Review of Progress in Quantitative Nondestructive Evaluation, Vol.14, 1995, pp. 703-
710.
15. Clayden N.J., “Non Destructive testing of Thermoplastic Composites by NMR Imaging”, IEE
Colloquium (digest), IEE, No.33, pp. 3/1, 3/2, February 1994
16, Guild F.J., Summerscales J., Microstructural Image-Analysis applied to fiber-composite materials
- A review, Composites 24, 1993, pp. 383-393.
17

17. Frost J.D., Kuo C.Y., “Automated Determination of the Distribution of Local Void Ratio from
Digital Images”, Geotechnical Testing Journal 19, 1996, pp. 107-117
18. Ghiorse, S.R., “A comparison of Void Measurement Methods for Carbon/Epoxy Composites”,
Materials Laboratory, US Army Laboratory Command, 91-00671, 1991
19. Gao F., Patrick J.W., Walker A., "The Characterisation of Cracks and Voids in 2-D
Carbon/Carbon Composites", Carbon 31, 1993, pp. 103-108
20. Marr D.W.M., Wartenberg M., Schwartz K.B., Agamalian M.M., Wignall G.D., “Void
morphology in polyethylene carbon black composites”, Macromolecules 30, 1997, pp. 2120-2124
21. Matzinos P. D., Patrick J. W., Walker A., “The efficiency and mechanism of densification of 2-
D C/C composites by coal-tar pitch impregnation”, Carbon 38, 2000, pp. 1123-1128.
22. Pearce N.R.L., Guild F.J., Summerscales J., “The use of automated image analysis for the
investigation of fabric architecture on the processing and properties of fibre-reinforced composites
produced by RTM”, Composites Part A 29A, 1998, pp. 829-837
23. Summerscales J., Guild F.J., Pearce N.R.L., Russell P.M., “Voronoi cells, fractal dimensions
and fibre composites”, Journal of Microscopy-Oxford 201, 2001, pp. 153-162
24. Leterrier Y., G'Sell C., “Formation and elimination of voids during the processing of
thermoplastic matrix composites”, Polymer Composites 15, 1994, pp. 101-105
25. Hatta H., Takei T., Taya M., “Effects of dispersed microvoids on thermal expansion behaviour of
composite materials”, Materials Science & Engineering A285, 2000, pp. 99-110
26. Ismail Y.S., Richardson M.O.W., Olley R.H., “Optimizing impact properties of PP composites
by control of spherulitic morphology”, Journal of Applied Polymer Science 79, 2001, pp. 1704-1715
27. Bernet N., Michaud V., Bourban P.E., Manson J.A.E., “An impregnation model for the
consolidation of thermoplastic composites made from commingled yarns”, Journal of Composite
Materials 33, 1999, pp. 751-772
28. Roychowdhury S, Gillespie J.W., Advani S.G., “Volatile-induced void formation in amorphous
thermoplastic polymeric materials: I. Modeling and parametric studies”, Journal of Composite
Materials 35, 2001, pp. 340-366
29. Santulli C., Brooks R., Long A.C., Rudd C.D., “Impact properties of compression moulded
commingled E-glass/polypropylene composites”, Accepted for publication in Plastics, Rubber and
Composites, February 2002
18

30. Akermo M., Astrom B.T., “Experimental investigation of compression molding of glass/PP-PP
foam core sandwich components”, Journal of Thermoplastic Composite Materials 12, 1999, pp. 297-
316
31. Wakeman M.D., “Non-isothermal Compression Moulding of Glass fibre Reinforced
Polypropylene Composites”, PhD Thesis, University of Nottingham, 1997
32. Green, Jr., R.E. "Physical Techniques for Non-destructive Materials Characterization", in New
Perspectives on Problems in Classical and Quantum Physics, P.P. Delsanto and A.W. Saenz (Eds.),
Gordon and Breach, The Netherlands, 1998, pp. 139-156.
33. Eberhardt C., Clarke A., Fibre-orientation measurements in short-glass-fibre composites. Part I:
automated, high-angular-resolution measurement by confocal microscopy, Composites Science and
Technology 61, 2001, pp. 1389-1400.
Figure 1 Frequency of void content values on a sample of 200 images
from optimally moulded Twintex specimens
19

Figure 2 Polypropylene and glass fibres in a commingled yarn laminate
Figure 3 Microvoids in the matrix
Figure 4 Intratow voidage
20

Figure 5a Coplanar void
Figure 5b Coalescence of coplanar voids
Figure 6a Extensive voidage (insufficient pressure)
21

Figure 6b Extensive voidage, due to incorrect tow placement during moulding
Figure 7 Grey level histogram for a Twintex specimen image
22

Figure 8 Photomicrograph before and after thresholding (left)
and grey level across the profile line (right)
23
00.20.40.60.8
11.21.41.61.8
0 5 10 15 20 25
Number of Images
Erro
r
6.86% Voids 14.00% Voids 0.63% Voids
Figure 9a Error using different numbers of images (out of 23 images: set A)
0
0.1
0.2
0.3
0.4
0.5
0.6
0.7
0.8
0 5 10 15 20 25Number of Images
Erro
r
1.2% Voids 6.61% Voids 10.04% Voids
Figure 9b Error using different numbers of images (out of 20 images: set B)
24

0.00
0.05
0.10
0.15
0.20
0.25
0.30
0 2 4 6 8 10 12 14 16 18 2Number of cross-sections
Erro
r
0
Figure 10 Error using different numbers of cross-sections from the same laminate
25