synthesis of silica nano particles from rice husk ash and their ...
77
T.R. EGE UNIVERSITY Graduate School of Applied and Natural Science Chemical Engineering Department İzmir 2019 Açelya ÇALIŞKAN SYNTHESIS OF SILICA NANO PARTICLES FROM RICE HUSK ASH AND THEIR CHARACTERIZATIONS MSc THESIS
-
Upload
khangminh22 -
Category
Documents
-
view
0 -
download
0
Transcript of synthesis of silica nano particles from rice husk ash and their ...

T.R.
EGE UNIVERSITY
Graduate School of Applied and Natural Science
Chemical Engineering Department
İzmir
2019
Açelya ÇALIŞKAN
SYNTHESIS OF SILICA NANO PARTICLES
FROM RICE HUSK ASH AND THEIR
CHARACTERIZATIONS
MSc THESIS


T.R.
EGE UNIVERSITY
Graduate School of Applied and Natural Science
SYNTHESIS OF SILICA NANO PARTICLES
FROM RICE HUSK ASH AND THEIR
CHARACTERIZATIONS
Açelya ÇALIŞKAN
Supervisor : Prof. Dr. Şerife Şeref HELVACI
Chemical Engineering Department
Chemical Engineering Second Cycle Programme
İzmir
2019


vi

vii
ÖZET
PİRİNÇ KABUĞU KÜLÜNDEN SİLİKA NANO TANELERİNİN
SENTEZİ VE SENTEZLENEN TANELERİN
KARAKTERİZASYONU
ÇALIŞKAN, Açelya
Yüksek Lisans Tezi, Kimya Mühendisliği Anabilim Dalı
Tez danışmanı: Prof. Dr. Şerife Şeref HELVACI
Aralık 2019, 76 sayfa
Son yıllarda nano taneler yüksek gözeneklilikleri, yüzey alanları, biyo
uyumlulukları ve kimyasal koruyuculukları nedeni ile ilaç iletim sistemlerinde
sıklıkla kullanılmaktadır. Bu malzemeler yüzey özellikleri sayesinde ilaçların uzun
sürede kontrollü salımına olanak sağlamaktadır. İlaç deposu olarak kullanılan nano
malzemelerin şekil, boyut, kristal yapı ve yüzey özelikleri ilaç yüklemesi ve
kontrollü salımı için önem taşımaktadır.
Projede biyosilika (S) ve fonksiyonelleştirilmiş biyosilika (S-APTES) nano
taneleri sentezlenmiş, karakterizasyonları yapılmıştır. Çalışmada silika taneleri
pirinç kabuğu külünden elde edilmiş böylece hem tarımsal bir atık değerlendirilmiş,
hem de doğal kaynaklar kullanılarak güvenilir, ekonomik ve çevre dostu
malzemeler üretilerek literatüre ve ülke ekonomisine katkı sağlanmaya çalışılmıştır.
Sentezlenen malzemelerin yükleme ve kontrollü salım profillerinin
belirlenebilmesi için daha önce literatürde çalışması pek bulunmayan sefdinir
(CFD) seçilmiştir.
SiO2 taneleri, sahip oldukları yüksek yüzey alanı ve gözeneklilik nedeni ile
CFD’nin kontrollü salımı için uygun bir davranış göstermiştir.
Anahtar kelimeler: SiO2, pirinç kabuğu külü, fonksiyonelleştirilmiş nano silika,
ilaç yükleme, kontrollü salım, sefdinir.

viii

ix
ABSTRACT
SYNTHESIS OF SILICA NANO PARTICLES FROM RICE HUSK
ASH AND THEIR CHARACTERIZATIONS
ÇALIŞKAN, Açelya
MSc in Chemical Engineering
Supervisor: Prof. Dr. Şerife Şeref HELVACI
December 2019, 76 pages
Recently nanoparticles have been found widely used in drug delivery systems
due to their high porosity, surface area, bio-compatibility and chemical protection.
These type of materials provide controlled release based on their surface properties.
The shape, size, crystalline structure and surface properties of the materials are
important properties for drug storage, which are important for drug loading and
controlled release.
In the study, pure nano silica (S) and functionalized nano silica particles (S-
APTES) were synthesized. Silica particles were extracted from rice husk ash which
provided both utilization of agricultural waste and usage of natural sources. The
findings of the study will contribute literature and economics since the synthesis
method is safe, economic and environmentally friendly. The loading and controlled
release were studied using cefdinir (CFD) as a model drug which was not very much
studied drug in the literature.
SiO2 nanoparticles exhibited a suitable behavior in the controlled release of
CFD due to its high surface area and porosity.
Key words: SiO2, rice husk ash, functionalized nano silica, drug loading, controlled
release, cefdinir.

x
PREFACE
The main purpose of this study was converting an agro-chemical waste into a
valuable product for pharmaceutical industry. It has been written to fulfill the
graduation requirements of Chemical Engineering’s Second Cycle Programme at
Ege University. I was engaged in researching and writing this dissertation from
2016 to 2019.
The scope of the thesis was determined by my supervisor, Prof. Dr. Şerife Şeref
HELVACI. Research Assistant Dr. Huriye Banu YENER taught me how to use all
equipment/devices in the laboratory and helped me during the experiments. Both
Prof. Dr. Şerife Şeref HELVACI and Research Assistant Dr. Huriye Banu YENER
were always ready to answer all the questions I was curious about. In the second
year of study, Prof. Dr. Şerife Şeref HELVACI supported me to work at Center of
Polymer Systems (CPS) in Tomas Bata University in Zlín through the Erasmus
Programme, in order to give me a different vision and perspective. This center is a
R&D center affiliated to university, that carries out joint projects with the industry
and it has many advanced laboratories. In the laboratories at this center, I had the
opportunity to characterize the nano particles I produced with the methods we
developed together with Prof. Dr. Şerife Şeref HELVACI and Research Assistant
Dr. Huriye Banu YENER. Prof. Dr. Vladimír Sedlařík, the rector of Tomas Bata
University in Zlín, guided me during this period. I also met many researchers from
all over the world. It was a great experience for me and made me discover the
potential of being an international engineer in me.
I gladly present my thesis.
Dedicated to contributing to life.
İZMİR
06/12/2019
Açelya ÇALIŞKAN

xi
TABLE OF CONTENTS
Page
ÖZET ..................................................................................................................... vii
ABSTRACT ........................................................................................................... ix
PREFACE ................................................................................................................ x
TABLE OF CONTENTS ....................................................................................... xi
LIST OF FIGURES .............................................................................................. xiii
LIST OF TABLES ................................................................................................. xv
1. INTRODUCTION .............................................................................................. 1
1.1 Properties of Silica ........................................................................................... 2
1.2 Sources of Silica ............................................................................................... 3
1.3 Application Fields of Silica .............................................................................. 3
1.4 Preparation of Sodium Silicate Solution .......................................................... 4
1.5 Synthesis Methods of Silica ............................................................................. 4
1.5.1 Sol-gel method: Stöber 4
1.5.2 Sol-gel method: Precipitation 5
1.5.3 Sol-gel method: Micro-emulsion 5
1.5.4 Thermal method 6
1.5.5 Literature survey on the methods of silica production 7
1.6 Surface Functionalization of Silica................................................................. 12
1.6.1 Methods of surface functionalization……………………………………...12
1.6.2 Literature survey on surface modification…………………………………13
1.7 Literature Survey on Drug Loading................................................................ 15
1.8 Release Kinetics ............................................................................................. 16
2. EXPERIMENTAL STUDY .............................................................................. 18
2.1 Materials ......................................................................................................... 18
2.2 Characterization of Gels and Particles............................................................ 19
2.2.1 Atomic Absorption Spectrophotometer……………………………………20
2.2.2 Surface Area and Porosity…………………………………………………21
2.2.3 Dynamic Light Scattering………………………………………………….22
2.2.4 Fourier Transform-Infrared Spectrophotometer…………………………...23
2.2.5 Inductive Coupled Plasma Mass Spectrophotometer……………………...23

xii
TABLE OF CONTENTS (continued)
Page
2.2.6 Transmission Electron Microscope………………………………………..24
2.2.7 Thermal Gravimetric Analyzer…………………………………………….25
2.2.8 Ultra-Violet Visible Spectrophotometer…………………………………...25
2.2.9 X-Ray Photoelectron Spectrophotometer………………………………….27
2.2.10X-Ray Diffractometer……………………………………………………..27
2.3 Methods........................................................................................................... 28
2.3.1 Synthesis of silica alcogel from rice husk ash (S)…………………………28
2.3.2 Functionalization of silica alcogel surfaces by APTES (S-APTES)………30
2.3.3 Loading of cefdinir………………………………………………………...30
2.3.4 In-vitro cefdinir release…………………………………………………….31
3. RESULTS AND DISCUSSION .......................................................................33
3.1 Determination of the Content of Rice Husk Ash ............................................ 33
3.2 Size Distribution of Silica Particles ................................................................ 33
3.3 Effect of Solvent Change on Surface Properties of Hydro and Alcogels ....... 34
3.4 X-Ray Diffraction Pattern of S and S-APTES Particles ................................. 35
3.5 FT-IR Spectra of S Particles ........................................................................... 35
3.6 Thermal Analysis of S and S-APTES Particles .............................................. 36
3.7 Characterization of S and S-APTES Particles using XPS Analysis ............... 38
3.8 Particle Morphology of Hydrogel, Alcogel and S-APTES ............................. 40
3.9 Characterization of S and S-APTES Particles using TEM ............................. 41
3.10 Zeta potential measurements of CFD, S and S-APTES particles ................... 42
3.11 Loading of cefdinir ......................................................................................... 43
3.12 Release Experiments and Kinetic Models ...................................................... 44
4. CONCLUSION AND RECOMMENDATIONS ..............................................47
REFERENCES.......................................................................................................48
ACKNOWLEDGEMENT .....................................................................................55
CURRICULUM VITAE ........................................................................................56
APPENDIX ............................................................................................................58

xiii
LIST OF FIGURES
Figure Page
Figure 1.1 Chemical structure of cefdinir……………………………………....2
Figure 1.2 Chemical structure of TEOS (Acros organics) ……………………..3
Figure 2.1 The chemical structure of sulfuric acid and APTES used ..…….....19
Figure 2.2 Calibration curve of standard solutions for Na+ion at 25°C ..…..…21
Figure 2.3 Calibration curve of standard solutions for Si4+ion at 25°C …..…..21
Figure 2.4 Photograph of AAS device used .………………………….……....21
Figure 2.5 Photograph of BET analysis device used …………………..……..22
Figure 2.6 Photograph of DLS device used .…………………………….…....22
Figure 2.7 Photograph of FT-IR device used .…………………………...........23
Figure 2.8 Photograph of ICP-MS device used ..……………………………..24
Figure 2.9 Photograph of TEM device used ..………………………………...25
Figure 2.10 Photograph of TGA device used ..………………………….........25
Figure 2.11 Calibration curve of standard solutions for CFD in DDW at pH 1.2
……………………………………………………………………....................26
Figure 2.12 Calibration curve of standard solutions for CFD in DDW at pH 2
…………………………………………………………………………………26
Figure 2.13 Photograph of UV-Vis device used ..……………………….........27
Figure 2.14 Photograph of XPS device used .………………………………...27
Figure 2.15 Photograph of XRD device used ………………………….......... 28
Figure 2.16 The extraction process …………………........................................29
Figure 2.17 The filtration step ………………………………………………...29
Figure 2.18 Schematic representation of extraction of silica from RHA by TH
method ………………………………………………………………............... 29
Figure 2.19 Experimental set-up for release experiment ……………………....32
Figure 3.1 Size distribution by intensity of the SSSs ………………………....34
Figure 3.2 XRD patterns of S and S-APTES silica nanoparticles ……………35
Figure 3.3 FT-IR spectra of S nanoparticles ….……………………………... 36
Figure 3.4 TGA thermograms of S and S-APTES nps functionalized at 25°C (a),
50°C (b) and 70°C (c) ………………………………………….........................37
xiv
LIST OF FIGURES (continued)
Figure Page
Figure 3.5 The wide scan XPS spectra of the S nanoparticles .………………39
Figure 3.6 The enlarged regions of XPS spectra of Si 2p (a), C 1s (b), N 1s (c),
O 1s (d) and Na 1s (e) at 25°C ………….................…………………………..39
Figure 3.7 The wide scan XPS spectra of the S-APTES nanoparticles
functionalized at nAptes/nSiO2= 0.6 (a) and nAptes/nSiO2= 1.2 (b) …..…………….40
Figure 3.8 SEM images of hydrogel, alcogel and S-APTES nps …………......41
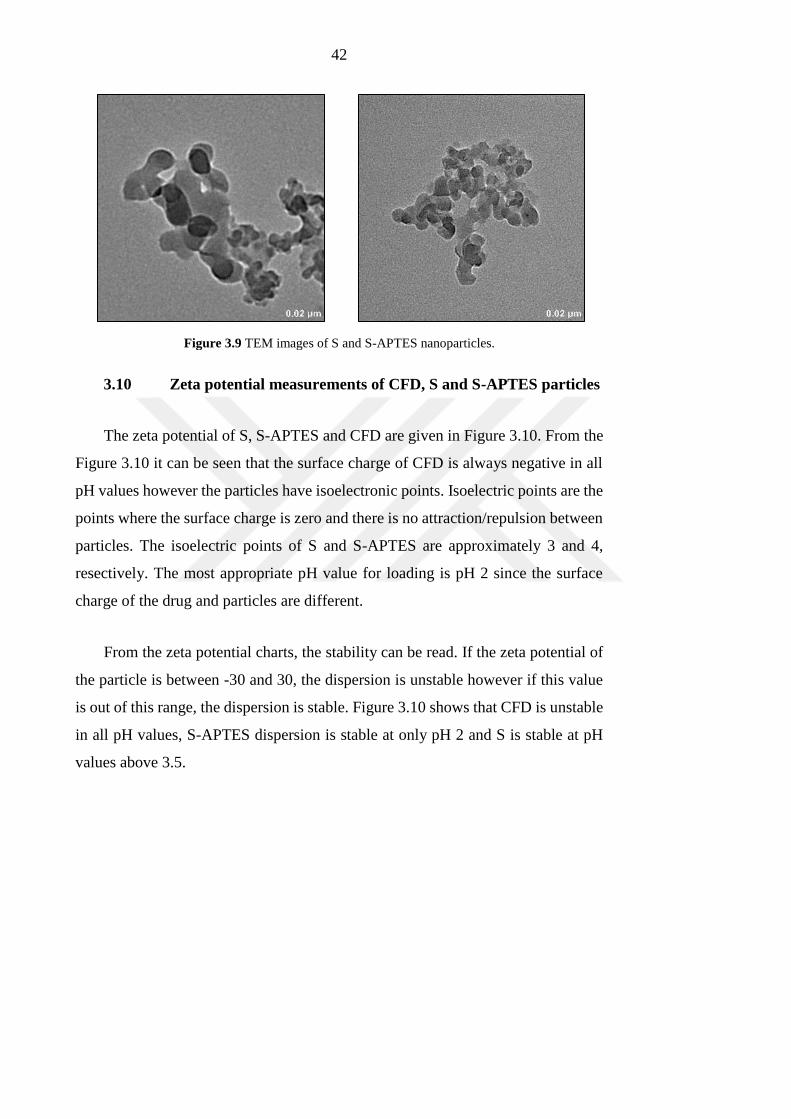
Figure 3.9 TEM images of S and S-APTES nanoparticles ...…………............42
Figure 3.10 Zeta potential of S, S-APTES and CFD at different pH values 2, 4,
6, 8 and 10 ...…………………………………………………………………...43
Figure 3.11 CFD loading onto S and S-APTES nps at 25°C ...…………….....43
Figure 3.12 Release profiles of CFD loaded S and S-APTES nps at pH 1.2 and
37°C …………………………………………………………………………...44
Figure 3.13 Zeroth order kinetics of CFD loaded S and S-APTES nps ...….....45
Figure 3.14 First order kinetics of CFD loaded S and S-APTES nps .………..45

xv
LIST OF TABLES
Table Page
Table 1.1 Experimental conditions of Stöber method ……………………...........8
Table 1.2 Experimental conditions of precipitation method …………….............9
Table 1.3 Experimental conditions of micro-emulsion method ………………...10
Table 1.4 Experimental conditions and silica properties synthesized by using
thermal methods ………………………………………………………………...11
Table 1.5 Literature survey of surface modification methods ………………….14
Table 1.6 Literature survey of drug loading ……………………………...........15
Table 2.1 Properties of the chemicals/materials used in the experiments ………19
Table 2.2 Analysis methods used during experiments ………………………....20
Table 2.3 Experimental conditions of post functionalization method ………….30
Table 2.4 The list of the amount of S nps ………………………………………31
Table 2.5 The list of the amount of S-APTES nps ……………………………..31
Table 3.1 Composition of rice husk ash ………………………………………..33
Table 3.2 Results of DLS measurements ………………………………………34
Table 3.3 BET Analysis results of hydrogel and alcogel ……………………....35
Table 3.4 The mass losses at TGA thermograms ……………………………....38
Table 3.5 Atomic composition of S nps ………………………………………..39
Table 3.6 Data of release experiments ………………………………………….44
Table 3.7 Results of release experiments ……………………………………....45
Table 3.8 Data of release kinetics ……………………………………………...45
Table 3.9 Results about release kinetics of CFD loaded S and S-Aptes nps…...46

xvi

1
1. INTRODUCTION
In recent years, nanotechnology has been investigated for many research fields
such as biomedical, electronics, food, energy and environment. Controlled drug
release practices have gained increasing interest and the quick development in the
improved materials has resulted in a significant progress in their development
(Trewyn et al., 2008; Kortesuo et al., 2000). The purpose of controlled drug delivery
is to administer the requested amount of drug to the relevant areas in the human
body and to adjust the drug delivery profile to achieve the best possible therapeutic
benefits (De Muth et al., 2011). The advantages of controlled drug delivery systems
(Szegedi et al., 2011; Manzano et al., 2008) are improvement of patient
convenience, reduction in flunctuation in steady state level, increasing safety
margin of high potency drug and reduction in total health care cost.
Particles for the drug release practise are generally designed at the nanoscale
level. Nanoporous materials are characterized by large surface area and high pore
size and their surface chemical properties can be changed. These properties make
them suitable drug delivery carriers.
Among these materials, silica is one of the most studied nano particle in drug
delivery applications owing to having mesoporous structure, high specific surface
area, large pore volume, adjustable nano pore sizes, nontoxic properties a
hydrophilic surface feature and being convenient for surface modification that gives
an opportunity of use in advanced drug delivery studies (Chandrasekhar et al., 2003;
Herna’ndez et al., 2014).
There are two kinds of sources for silica synthesis: natural or synthetic. The
production of materials from natural sources such as agricultural wastes is very
common to reduce environmental pollution and cost. Rice husk is one of these
agricultural wastes owing to silica content (Azmi et al., 2016; Sankar et al., 2016).
Beside the natural sources, synthetic sources are also used for production of silica
since this method is relatively easy comparing with synthesis of silica from natural
sources. For the production of silica, it was aimed to achieve a production easy and
efficient in this study. For this reason, precipitation method were chosen.

2
Silica nano particles are often used as functionalized form as well.
Functinalization effectuates changing hydrophilic property of surface to
hydrophobic property so that the hydrophobic material can be compatible with
human body for example (Alshatwi et al., 2015; Björkegren et al., 2017; Liou and
Yang, 2011). Surface functionalization of silica nano particles were carried out by
post-modification method. As functionalization agent, aminopropyl triethoxy silane
(APTES) were used. Unfuntionalized and functionalized samples of silica were
used for application of drug delivery.
Different types of drugs were studied for release applications in the literature.
Among them cefdinir, which chemical structure is given in Figure 1.1, is a
cephalorin antibiotic often used for the treatment of community-acquired
pneumonia, acute chronic bronchitis, sinusitus and skin-structure infections in adult
and paediatric patients (Selvi et al., 2015). In this study, unfunctionalized and
functinalized silica nano particles were used in the release of CFD, which was
selected as the model drug. The loading and controlled release are defined using
CFD which is not very much studied drug in the literature. So, it is thought that this
study is going to contribute to the literature.
Figure 1.1 Chemical structure of cefdinir.
1.1 Properties of Silica
Silica is the name of a chemical compound consisting of two oxygen and one
silicon atom that generally exist in polymorphous forms which are quartz, topaz
and amethyst. (Sawe, B.E., 2018). Amorphous silica is more reactive than the
crystalline silica. At the same time, amorphous silica has controllable size
distribution and high surface area (Chandrasekhar et al., 2003). That is the reason
of being preferred in different application fields.

3
1.2 Sources of Silica
Silica can be synthesized chemically from synthetic materials or obtained from
natural sources.
Tetra ethyl ortho silicate (TEOS), whose chemical structure is given in Figure
1.2, is the most commercially used chemical in silica production. The reason of
being used of this material is the high size control of the final product and being
easy of production. In addition, silanes are used both in production and surface
functionalization of silica (Murray et al., 2010).
Figure 1.2 Chemical structure of TEOS (Acros organics).
In the past, studies on the production of silica from agricultural waste have used
more than one method (Adam et al., 2011; Bergna and Roberts, 2006; Jal et al.,
2004). Bark of the plants and the agricultural wastes such as rice husk (RH), sugar
cane and peanut shells have become cheap raw material used in silica production.
RH contains %71-87 by mass of organic structures such as cellulose and lignin and
%13-29 by mass of inorganic elements (Okutani et al., 2009). That is why it is most
preferred natural source in silica production.
1.3 Application Fields of Silica
Silica particles in various sizes have many uses. These uses can be customized
as catalyst, drug delivery, dental applications, tissue engineering, gene therapy and
molecular imaging by reducing the silica particle size to nano level (An et al., 2010;
Chen et al., 2017; Gutowska et al., 2001; Liou and Yang. 2011; Yener and Helvacı,
2015; Zulkifli et al., 2013). The nano silica to be produced from rice husk ash

4
(RHA) is thought to be very useful in some application areas. It can be seen in the
literature that the production of nano silica, which is necessary for the production
of biomaterials in biological application field, from rice husk ash is so little (Chen
et al., 2017). The nano-sized silica granules that will be extracted from rice husk by
appropriate method are thought to solve the environmental and economical
problems that arise when the old production methods are applied (Tolba et al.,
2015).
1.4 Preparation of Sodium Silicate Solution
Firstly the silica is needed to be extracted from the rice husk ash. Silicate
solutions are obtained as a results of extraction. Type of silicate changes due to the
chemicals used in the extraction process. The extraction process used is called as
alkali leaching (Liou and Yang, 2011). In alkali leaching, an alkali solution is used
and this alkali solution is generally sodium hydroxide (NaOH) solution. The silica
content changes according to the location where the rice husk grows. Conditions
(stirring rate, reaction time and temperature) of alkali leaching can vary due to raw
material. The reaction occurring during alkali leaching is given in equation below:
SiO2,RHA(s) + NaOH(aq) → Na2SiO3(s) + H2O(l)
The resulting mixture (sodium silicate and ash) is filtered with the aid of filter
paper to separate the ash and sodium silicate solution. The solution is kept in the
refrigerator.
1.5 Synthesis Methods of Silica
1.5.1 Sol-gel method: Stöber
Two methods are mainly used in silica synthesis: sol-gel and thermal methods.
Commonly used sol-gel methods are precipitation and Stöber methods (Zhang et
al., 2016; Zulfiqar et al., 2016). Sol-gel methods using different surfactants are
called microemulsion method (Le et al., 2013).

5
In this technique, uniformly dispersed silica particles are obtained by spraying
silicon alkoxide dissolved in an alcohol solution. By using sol-gel method with a
commercial source such as TEOS, production of silica particle in spherical and
micro dimensions is quite common (Stöber and Fink, 1968). In this work, particle
diameters range from 0.05 to 3 μm. It has been determined that this method poses
a safety problem and creates environmental problems when it was used on a
commercial scale due to its usage of heavy chemicals and harmful organic solvents
(Dubey et al., 2015; Edrissi et al., 2011; Misran et al., 2013; Park et al., 2002).
1.5.2 Sol-gel method: Precipitation
Precipitation method is second method of the most used production methods
(Hieu et al., 2015; Le et al., 2013; Yuvakkumar et al., 2014). This physicochemical
method involves two steps: alkali dissolution and acidic precipitation. Acidic
chemicals are used to precipitate the rice husk ash solution treated with different
alkaline chemicals. In this process, the sensitivity of the silica surface is utilized. At
pH=10 and lower, the solubility of the amorphous silica in water is low and its
solubility increases with increasing pH. So, the silica is dissolved in alkali and
precipitated at a low pH. Silica is then obtained after washing and drying (Liou and
Yang, 2011).
Silica syntheses, which are studied intensively today, are mostly carried out by
the methods mentioned above. Liu and coworkers (2016) conducted a study of heat
treatment and gelation together. In their study, the silica source treated with an
alkali chemical was heat treated at 600-900 oC under atmospheric conditions. They
produced silica nano particles in spherical, amorphous structure and submicron
dimensions by acid precipitation.
1.5.3 Sol-gel method: Micro-emulsion
In the micro-emulsion process, the reaction medium consists of two phases as
oil and water phases. Depending on the solubility of the raw material used, the raw
material is distributed in one of these two phases. The starting material is dispersed
in the other phase. The reaction starts when the two phases are mixed.

6
Surface active agents are generally used in this method. The surfactant acts as
a nano reactor while surround the materials dispersed in two phases. In this way,
the size and shape of the silica can be controlled due to the micelle size formed by
the surfactant and the swelling capacity of the micelle formed (Misran et al., 2013).
Alkoxy silanes such as TEOS or silicate solutions are also used as raw materials.
1.5.4 Thermal method
In the direct heating method, the rice husk/rice husk ash is directly burned
without any preprocessing in this method (James and Rao, 1986; Kapur, 1985; Luan
and Chou, 1990; Nakata et al., 1989; Wang and Low, 1990). The percentage of
silica purity increases together with the burning of the organic part of the rice husk
heat treated under various gases or atmospheric conditions. It was determined in a
study that the phase composition and the surface area of silica produced were
changed according to the combustion temperature (Kapur, 1985). Chandrasekhar
and coworkers (2003) shown that silica particles synthesized is in amorphous
structure when calcined in air at 800oC or lower and crystalline structure when
calcined at temperatures higher than 900oC.
In some studies pretreatment is used before heating process. Xiong et al. (2009)
concluded that the washing of the rice husk with HCl (hydrochloric acid) before the
burning process results in a purity (99.5%) and a higher surface area of silica (260
m2/g). This pretreatment removes all metallic impurities such as Na, K, Ca, Mg, Fe
and Cu. After acid pretreatment, carbonization is carried out in air or inert gas
atmosphere. In Real and coworkers’ study (1996), it has been shown that if acid
washing is done prior to incineration, the specific surface area of the silica increases
while this pretreatment occurs after incineration, on the contrary. In another study,
the rice husk was pre-washed with acid to remove metal impurities in it and then
calcined at 700oC and then spherical particles in amorphous structure and average
60 nm size were obtained (Liou et al., 2004).
Treatment can also be done with alkali materials other than acid. Javed and
coworkers (2010) used KMnO4 (potassium permanganate) as a pretreatment
chemical for preparing high purity amorphous silica and this alkali solution reduced

7
the cellulose and organic content of the rice husk and acted as an oxidizing agent
during thermal decomposition.
Deionized water can be used for pretreatment process as well. A relatively
small-sized silica particle was obtained from rice husk which was washed with
deionized water and calcined (Shen et al., 2011).
In many studies, it has been figured out that the silica obtained with
prepurification processes influences the purity (Alshatwi et al., 2015; Carmona et
al., 2013; Palanivelu et al., 2016).
1.5.5 Literature survey on the methods of silica production
The reaction conditions, important parameters and product characteristics for
each method are given in Table 1.1 to 1.4.

8
Table 1.1 Experimental conditions of Stöber method.
Ref. TEOS
(M)
H2O
(M)
NH3
(M)
Solvent
(M) nTEOS/nH2O nTEOS/nNH3 Solvent
Temperature
(oC)
Time
(h)
Particle size
(nm)
Liu et al.,
2017 0.47 1.11 0.05 x 0.42 9.32 Ethanol x x 20
Ren et al.,
2017 0.14 x 2.65 17.12 x x Ethanol 60 12 20
Arantes et al.,
2012 0.20 x 0.3 17.12 x 0.67 Ethanol 25 24 19
Milly et al.,
2010 0.14 2.14 0.32 17.12 0.06 0.42 - 30 0.03 27

9
Table 1.2 Experimental conditions of precipitation method.
Ref. Silica
source Pre treatment
Precipitation
agent Post treatment
Results
(Size (nm) /
Shape)
Mor et. al.,
2017 RHA
Alkali Leaching
(2 M NaOH / 100 °C / 2 h) 1 N HCl Drying (50 °C)
5-10 /
Spherical agglomerated
Zulfiqar et. al.,
2015 RH
Acid leaching (HCl)
Calcination (600 °C / 4 h)
Alkali leaching (2M NaOH / 2 h)
H3PO
4 Aging (25- 65 °C / 30 min.)
180-200 /
Spherical agglomerated
Vaibhav et.al.,
2014 RH
Calcination (900 °C / 7 h)
Alkali leaching (1 M NaOH) 3 N H2SO4
Aging (12 h)
Washing
Drying(80oC / 24 h)
20-40 /
Fiber like
Yuvakkumar et. al.,
2014 RH
Calcination (700°C / 3 h)
Acid leaching (3 M HCl / 1.5 h)
Alkali leaching (0.5-2.5 N NaOH / 80°C / 1.5 h)
Conc. H2SO4 Calcination (700 and 1100 °C / 3 h) 25 /
Spherical agglomerated

10
Table 1.3 Experimental conditions of micro-emulsion method.
Ref. Silica source Surfactant/
Surfactant type Oil phase Precipitation agents Post treatments
Particle size
(nm)
Narayanan et al.,
2008
Na2SiO3
(commercial)
Tween 80 and Span 80
Non-ionic n-hexane NH4HCO3
Washing (water)
Drying (100oC / 12 h) 1000-10000
Jesionowski et al.,
2008
Na2SiO3
(commercial)
Rokafenols N3 and N6
Non-ionic cyclohexane 5 w % HCl
Washing (water/methanol/ethanol)
Drying (105 oC / 48 h) 393
Lee et. al.,
2006
Na2SiO3
(commercial)
Triton N57
Non-ionic cyclohexane (NH4)2SO4
Washing (water/acetone)
Drying (100 oC / 24 h) 810
Chattopadhyay and Gupta,
2003
Na2SiO3
(commercial)
AOT
Anionic n-heptane or isooctane Supercritical CO2
Washing (water)
Ultrafiltration
20-800

11
Table 1.4 Experimental conditions and silica properties synthesized by using thermal methods.
Ref. Silica source Pre-treatment Thermal treatment
method
Temperature
(oC)
Time
(h)
Results
Size (nm) Acid leaching Drying
Chen et. al.,
2017 RH
2.5 w %
CH3COOH, HCl,
H2SO4
105 oC, 2 h Calcination 600, 700, 800, 900 0.5 50
Palanivelu et. al.,
2016 RH 10 w % HCl 100 °C, 1 h Pyrolysis 750 3.0 10-100
Sankar et. al.,
2016 RHA 10 w % HCl 150 oC, 24 h Calcination 700 2.0 3-10
Alshatwi et. al.,
2015 RH 1 N HCl 85 oC, 5 h Calcination 500, 600, 700 1.0 100-120
Wang et. al.,
2014 RH 5 w % C6H8O7 100 oC, 24 h Calcination 800 0.5 60
Carmona et. al.,
2013 RH
C6H8O7,
CH3COOH
H3PO4
60 oC, 18 h Calcination 650 1.0 180-290

12
1.6 Surface Functionalization of Silica
Silica is used in many different areas, but it is used commonly as a filler or
reinforcing additive in advanced composite materials (Rahman et al., 2012). In
order to achieve a homogenous distribution with silica and different materials and
to turn silica into an effective additive, it can be dispersed uniformly in many
different solvents. For this purpose, silica is functionalized by surface modification
methods. Generally silanes are used to modification of silica surface (Ayad et al.,
2016; Mahmoodi et al., 2011). Silanes have an organofunctional and a hydrolyzable
groups in their structure. There is a hydrocarbon chain linking these two groups.
Silanes are commonly called hydrophobic or hydrophilic, depending on the
organofunctional group that is in its structure. The silanes commonly used in
hydrophilic surface modification of silica are amino, polyethylene oxide and epoxy
silanes with hydrophilic functionality. For hydrophobic surface modification, alkyl
silanes are often used (Petchu et. al., 2017).
1.6.1 Methods of surface functionalization
Surface functionalization methods basically consists of two groups which are
co-condensation (CC) and post functionalization (PF). In the co-condensation
method, the modification agent is present in the reaction medium during the
synthesis of the silica particle. During the silica particle formation, the
functionalizing agent works also in the condensation step with the silica source,
resulting the surface modified silica. In the post funcitonalization method, silica is
synthesized before the particle functionalization step. The silica is dispersed in the
suitable solvent for functionalizing agent, and then the functionalization agent is
added to the medium to perform surface functionalization. In some cases, especially
where the Stöber method is used, the functionalization agent is added to the reaction
medium without removing the silica produced at the end of the reaction. The
functionalized particle is obtained after the required time of reaction. In both
methods, the excess agent is removed by the help of various washing operations.

13
1.6.2 Literature survey on surface modification
There are many literature examples in both methods used for surface
functionalization of silica. These examples can be seen in Table 1.5.

14
Table 1.5 Literature survey of surface modification methods.
Ref. Method Silica
Source Functionalization agent
Experimental conditions
Area of study Temp.
(°C)
Time
(h) Medium
Wang et al.,
2016 CC TEOS Aminopropyltriethoxy silane
ice-
bath 2
Acetonitrile
/water Adsorption
Björkegren
et al.,.
2015
PF
Colloidal
nano silica
particles
(commercial)
Methylpolyethyleneglycol silane 25, 70 - Silica suspension at
pH 9 Colloidal stability
Yong et al.,
2014 CC TEOS
Triaminopropyltrimethoxy silane
Triisobutyltrimethoxy silane
Octyltriethoxy silane
25 18 Ethanol-water
Surface coating and
bioanalytical
applications.
Lee et al.,
2011 PF
TEOS
derived silica
particles
Methyltriethoxy silane
Vinyltrimethoxy silane
Triamino(propyl)trimethoxy silane
Trimercapto(propyl)trimethoxy silane
40 - Ethanol-water Hydrophobicity of
different silanes
Park et al.,
2009 CC Na2SiO3
Aminopropyltriethoxy silane
Mercaptopropyltriethoxy silane
Chloropropyltriethoxy silane
Pyrrolidine silane
40 1 Water Catalyst
CC: Con-condensation
PF: Post-funtionalization

15
1.7 Literature Survey on Drug Loading
The literature survey regarding to drug loading is given in Table 1.6.
Table 1.6 Literature survey of drug loading.
Ref. Drug Drug carrier
Drug loading conditions
Drug uptake
(w%)
Drug
loading
medium
Drug carrier
amount
(g)
Drug
conc.
(g/L)
Loading
time
(h)
Yılmaz et al.,
2016 Flurbiprofen
Silica
Trimethylmethoxysilane modified silica ethanol - 700
24
24
24
24
27.09
16.96
13.59
9.19
Arean et al.,
2013 Cisplatin
Silica
Aminopropyltriethoxysilane modified silica
Carboxylic acid modifed silica
H2O
0.0087
0.0614
0.0147
1
1
1
24
24
24
8.7
61.4
14.7
Maria et al.,
2012
Cefotaxime
Cefuroxime
Cefaloxime
Silica
Aminopropyltriethoxysilane modified silica
Triethoxyvinylsilane modified silica
H2O
54.4-68.5
54.7
54.6
10.6-10.9/6.82/6.64
10.6-10.9/6.82/6.64
10.6-10.9/6.82/6.64
24
24
24
28.9-40.1/34.0/21.4
27.8/-/-
23.9/-/-
Maria et al.,
2012 Irinotecan
Silica
Aminopropyltriethoxysilane modified silica
Triethoxyvinylsilane modified silica
H2O
0.1
0.1
0.1
6.6
6.6
6.6
24
48
48
35.8
34.9
36.3
Zhang et al.,
2010 Telmisartan
Silica
Aminopropyltriethoxysilane modified silica
acetic
acid -
100
100
10
10
48.9/59.1/59.7
50.2
Song et al.,
2005 Ibuprofen Silica hexane
0.2
0.2
30
30
72
72
25.6/20.6/29.9/37.2
1.7/4.8/6.3/8.2

16
1.8 Release Kinetics
There are many models for release kinetics. Among them, the featured models
are zero order, first order, Higuchi and Korsmeyer-Peppas. The best way to figure
out the most convenient model to the release process is to proceed the fit test
(Korsmeyer et al., 1983; Liu et al., 2016).
Korsmeyer-Peppas model is generally used to describe release kinetics for
polymeric systems. The other model for the release kinetics is Higuchi model. This
system describes the release by Fickian diffusion (Dash et al., 2010; Kalu et al.,
2007; Kalam et al., 2007).
General function of rate equation is given by equation below:
−𝑑𝑀
𝑑𝑡= 𝑘𝑀𝑛
By rearranging the equation,
𝑑𝑀
𝑀𝑛 = −𝑘𝑑𝑡 (1.1)
where M is the amount of drug inside the dialysis tubing at a time t and n is the
order of the rate equation (Yoo et al., 2003; Singhvi and Singh, 2011; Dash et al.,
2010).
By taking n=0, zeroth order rate equation can be obtained as below:
𝑑𝑀 = −𝑘𝑑𝑡
∫ 𝑑𝑀𝑀
𝑀0
= −𝑘 ∫ 𝑑𝑡𝑡
0
𝑀 − 𝑀0 = −𝑘𝑡
𝑀 = 𝑀0 − 𝑘𝑡 (1.2)

17
By taking n=1, first order rate equation can be obtained as below:
𝑑𝑀
𝑀= −𝑘𝑑𝑡
∫𝑑𝑀
𝑀
𝑀
𝑀0
= −𝑘 ∫ 𝑑𝑡𝑡
0
ln 𝑀 − ln 𝑀0 = −𝑘𝑡
ln𝑀
𝑀0= −𝑘𝑡 (1.3)
where M is the amount of drug inside the dialysis tubing at a time t, M0 is the initial
amount of drug inside of the dialysis tube and k is the rate constant.

18
2. EXPERIMENTAL STUDY
The experimental section consists of four parts, synthesis of silica alcogel from
rice husk ash, functionalization of silica alcogel surfaces by APTES, loading of
CFD and in-vitro release of CFD, which gives detailed information about these
parts.
Firstly the materials used for the synthesis of S and S-APTES nanoparticles
were explained. Then the analysis techniques used during the parts were given in
detail.
The following part after explaining the materials and analysis techniques used
during the experiments contains the parametric study of synthesis of functionalized
silica nanoparticles.
The loading method of CFD onto S and S-APTES nanoparticles and the
materials used for the loading process were told after the part of production of
nanoparticles.
The in-vitro release of CFD from S and S-APTES nanoparticles is the
subsequent part of the experimental section. The detailed information about the in-
vitro release were given in this section.
2.1 Materials
The raw materials/chemicals utilized in the experiments and some properties
of them contaning formula, mission, brand/supplier, molecular weight and density
are tabulated in Table 2.1 and chemical structure of some of them are shown in
Figure 2.1. In all experiments, double treated water with a pH and conductivity of
5-7 and 1.1 μS cm-1, respectively, was used for the solutions. Except rice husk ash,
no pre-treatment was done before using raw materials/chemicals and they were used
as they were received. Rice husk ash, which is an output of burning process of rice
husk at 700°C for 6 hours under atmospheric conditions, had different sizes of
particles so it was used after grinding process.

19
Table 2.1 Properties of the chemicals/materials used in the experiments.
Materials Formula Mission Brand/Supplier
Molecular
weight
(g/mol)
Density
(g/cm3)
Rice husk ash RHA Silica
source
Erdoğanlar
Food Industry
and Business
Company
- 1.97
Sodium
hydroxide
(>97%)
NaOH Activating
agent Merck Milipore 39.997 2.13
Sulfuric acid
(95%) H2SO4
Precipitating
agent Merck Milipore 98.079 1.84
Ethanol
(>96%) C2H5OH
Washing
solvent Merck Milipore 46.07
0.79
(20OC)
3-aminopropyl
triethoysilane
H2N(CH2)3Si(OC2H5)3
(APTES)
Functionalizing
agent Momentive 221.372
0.95
(25OC)
(a) Sulfuric acid (b) Aptes
Figure 2.1 The chemical structure of sulfuric acid and APTES used.
2.2 Characterization of Gels and Particles
The characterization methods performed during experiments, equipments’
brands/models and the purpose of using these analysis methods are given in Table
2.2.

20
Table 2.2 Analysis methods used during experiments.
Equipment Brand/Model Purpose of use
Atomic Absorption
Spectrophotometer
(AAS)
Agilent Duo
240240Fs/240Fs Ultra
Determination of ion
concentration in liquids
Brunauer-Emmett-Teller
(BET) Analysis Device ASAP 2010 Micrometrics
Determination of surface area
and porosity of the materials.
Dynamic Light
Scattering Device
(DLS)
Malvern Zeta-nanosizer S90
equipped with He-Ne laser
Determination of zeta
potentials and size of the
materials
Fourier Transform
Infrared
Spectrophotometer
(FT-IR)
Thermo Scientific Nicolet iS5,
iD1 Transmission (ATR
Apparatus), Scan number: 32,
Resolution: 4
Determination of the
characteristic bonds and
organic groups
Inductively Coupled
Plasma Mass
Spectrometer
(ICP-MS)
Agilent 7500e Determination of elements of
particles
Scanning Electron
Microscope
(SEM)
Philips XL-30S FEG Determination of shape and
size of the particles’ surface
Transmission Electron
Microscope
(TEM)
TEM-MSC JEOL 2100 Determination of inner
structure of the particle
Thermogravimetric
Analysis Device
(TGA)
TA Q500 Analyzing of the weight
change of materials
UV-Visible
Spectrophotometer
(UV-Vis)
UV-2600 20V EN, 50-60 Hz, 170
VA, Shimadzu
Evaluation of the drug
concentration in the liquid
phase
X-Ray Diffractometer
(XRD)
Philips X-pert PRO-45W, 40 mA
using λ=0.1541, 2θ between 5
and 80°
Determination of the
characteristic bonds
X-Ray Photoelectron
Spectroscopy Device
(XPS)
Thermo Nexsa XPS
Determination of the chemical
bonds of the atoms on the
solid surface
2.2.1 Atomic Absorption Spectrophotometer
Atomic absorption spectrophotometry is an analytical technique that
determines the concentrations of elements. The brand/model of AAS used in the
experiment is given in Table 2.2. The calibration curves for Na+ and Si4+ ions are
listed in Figure 2.2 and Figure 2.3, respectively. Figure 2.4 represents the image of
AAS device used. For both ions, acetylene was used as fuel in the experiments.
Lamp current is fixed as 5 mA and 10 mA, support is air and nitrous oxide for Na
and Si ion. For Na+ ion, the wavelength and slid width worked in atomic absorption
is 330.2 nm and 0.5 nm, respectively. For Si4+ ion, the wavelength and slid width
worked in atomic absorption is 251.6 nm and 0.2 nm, respectively.
21
Figure 2.2 Calibration curve of standard solutions for Na+ion at 25°C.
Figure 2.3 Calibration curve of standard solutions for Si4+ion at 25°C.
Figure 2.4 Photograph of AAS device used.
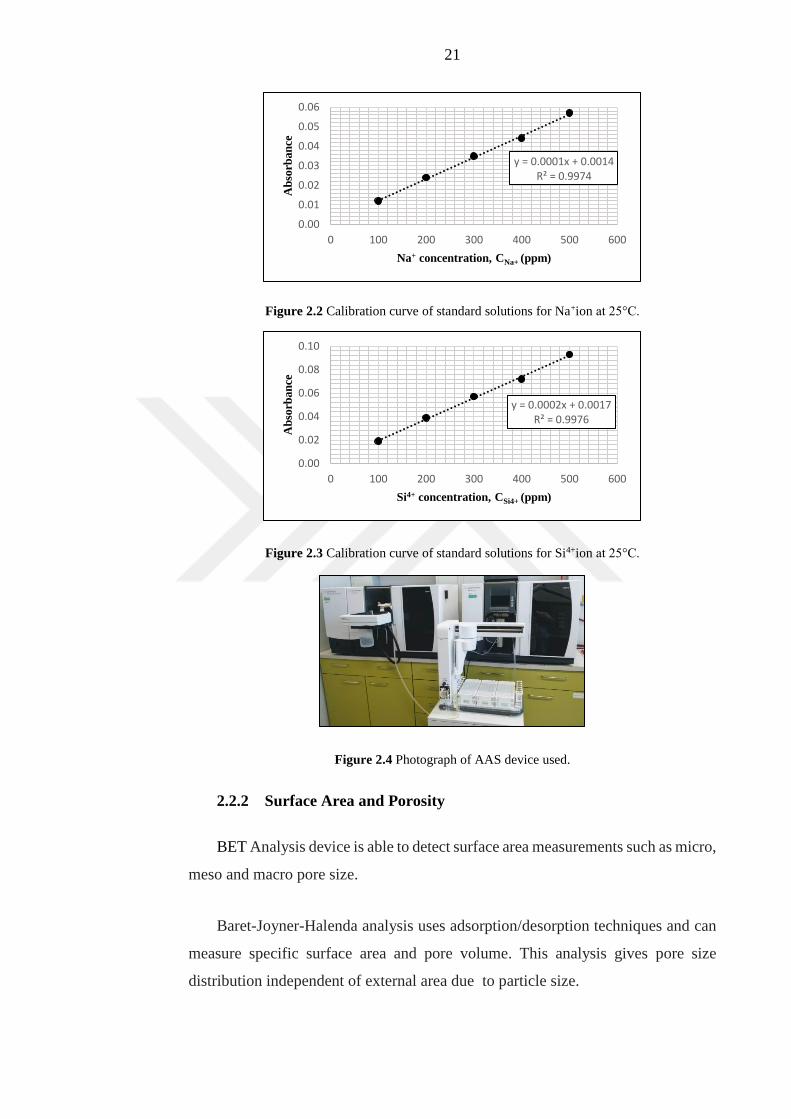
2.2.2 Surface Area and Porosity
BET Analysis device is able to detect surface area measurements such as micro,
meso and macro pore size.
Baret-Joyner-Halenda analysis uses adsorption/desorption techniques and can
measure specific surface area and pore volume. This analysis gives pore size
distribution independent of external area due to particle size.
y = 0.0001x + 0.0014R² = 0.9974
0.00
0.01
0.02
0.03
0.04
0.05
0.06
0 100 200 300 400 500 600
Ab
sorb
an
ce
Na+ concentration, CNa+ (ppm)
y = 0.0002x + 0.0017R² = 0.9976
0.00
0.02
0.04
0.06
0.08
0.10
0 100 200 300 400 500 600
Ab
sorb
an
ce
Si4+ concentration, CSi4+ (ppm)

22
The image of BET analysis device used is shown in Figure 2.5.
Figure 2.5 Photograph of BET analysis device used.
2.2.3 Dynamic Light Scattering
DLS device uses electrophoretic light scattering technology to measure zeta
potential. The speed of movement in the dispesion of a solution or particles by
creating an electrical field is the zeta potential. Figure 2.6 shows the image of the
DLS device used.
DLS device also determines Brownian motion and relates this to the size of the
particles by assuming that the samples contains of spherical particles. Brownian
motion is the random movement of particles due to the bombardment by the solvent
molecules that surround them. It should be noted that the diameter that is obtained
in DLS shows how a particle diffuses within a fluid so it is calledas a hydrodynamic
diameter.
Figure 2.6 Photograph of DLS device used.
A collection of objects is called monodisperse if the objects have the same size,
shape or mass. A sample of objects that have an inconsistent size, shape and mass
distribution is called polydisperse. The PDI is an indication of variance in the

23
sample, a low PDI (usually less than 0.2) indicates that the sample is
monodispersed.
The procedure for size and zeta potential measurement is as follows: 27 mg of
S/S-APTES nano particles are dissolved in 30 ml of double distilled water and
stirred for 3 hours. Immediately after stopping stirring, the sample is taken from the
middle of the solution and the size measurement is performed for once. Amount of
run is adjusted to 6 and the cuvette, solvent and particle type is chosen in the
settings. If the particle type is not present in the list, refractive index of the particle
should be found in the literature and added to the list. The solutions are kept without
stirring for 24 hours in the room temperature. During this time, electrostatic
attraction/repulsion balance between particles is achieved and then, zeta potential
of the particles are measured.
2.2.4 Fourier Transform-Infrared Spectrophotometer
The functional groups in the structure of organic compounds in any phase. Also
amino acids and proteins’s structure biochemically. Figure 2.7 gives the image of
the FT-IR device that was used in the study.
Figure 2.7 Photograph of FT-IR device used.
2.2.5 Inductive Coupled Plasma Mass Spectrophotometer
ICP-MS is an analysis technique that allows the accurate measurement of a
large number of elements in solid and liquid samples. With ICP-

24
MS technology, 77 elements can be analyzed simultaneously solid/liquid particles.
Analysis of up to 35 elements in a single sample by ICP-MS can be determined in
a few minutes.
The procedure for ICP-MS measurement is as follows: The grinded rice husk
ash (0.2 g), the lithium tetra borate (1 g) and lithium meta borate (1 g) were mixed
and put into the platinum crucible. This mixture was calcined in the preheated
muffle furnace at 1000oC for 1h. After calcination process the entire base of the
platinum crucible is quickly rinsed with cool double distilled water so that the
transparent solid in the crucible is broken. Then the magnetic bar is placed in the
crucible and the crucible is put in the beaker which was filled with 125 ml of nitric
acid in weight percentage of 5. At the end of the mixing the crucible is thoroughly
washed and separated from this solution. The resulting solution is poured into a 250
ml volumetric flask and it is filled with double distilled water until the volume is
250 ml. This final solution is kept in the cold medium and the elemental analysis is
performed in ICP-MS instrument (Figure 2.8).
Figure 2.8 Photograph of ICP-MS device used.
2.2.6 Transmission Electron Microscope
Transmission electron microscope is a microscopic device. The main
difference between SEM and TEM is that SEM creates an image by detecting
reflected electrons while TEM uses transmitted electrons to create an
image. Obtained information from TEM is more valuable about inner structure
whereas SEM gives information on the sample’s surface and its composition
(Manual of Thermo Fischer’s TEM, Figure 2.9).

25
Figure 2.9 Photograph of TEM device used.
TEM measurements were performed in the laboratories of Centre of Polymer
Systems in Tomas Bata University in Zlín in Czech Republic.
2.2.7 Thermal Gravimetric Analyzer
Thermal gravimetric analyzer is generally used to determine mass loss in
materials as a function of temperature/time. In the analysis performed in this study,
temperature was chosen as the function parameter. The test sample is heated at a
constant heating rate (10 °C/min) and the mass change of the sample is measured
and recorded as a function of temperature (room temperature to 1000 °C). In
general, reactions that cause the mass of the sample can be either
degradation/oxidation reaction or evaporation of a component.
Figure 2.10 Photograph of TGA device used.
2.2.8 Ultra-Violet Visible Spectrophotometer
The ultraviolet-visible (UV-Vis) spectrophotometer is an instrument
commonly used in the laboratory that analyzes compounds in the ultraviolet (UV)

26
and visible (Vis) regions of the electromagnetic spectrum. Unlike infrared
spectroscopy (which looks at vibrational motions), ultraviolet-visible spectroscopy
analyze the electronic transitions. It allows one to determine the wavelength and
maximum absorbance of compounds. From the absorbance information and using
a relationship known as Beer’s Law one is able to determine either the concentration
of a sample if the molar extinction coefficient is known, or the molar absorptivity,
if the concentration is known:
A=εbc (Miller et al., 2009)
where A is absorbance, ε molar extinction coefficient, b path length, and c
concentration.
The drug concentration of CFD in the liquid phase was determined by UV-Vis
spectrophotometer at its characteristics wavelength of 272 nm. The calibration
curves for CFD in double distilled water (DDW) at pH=1.2 and pH=2 are given in
Figure 2.11 and Figure 2.12, respectively.
Figure 2.11 Calibration curve of standard solutions for CFD in DDW at pH 1.2.
Figure 2.12 Calibration curve of standard solutions for CFD in DDW at pH 2.
y = 0.0562x - 0.0065
R² = 0.9989
0.00
0.20
0.40
0.60
0.80
1.00
0.00 5.00 10.00 15.00 20.00
Ab
sorb
an
ce
CFD concentration, CCFD (ppm)
y = 0.018x + 0.0544
R² = 0.9993
0.00
0.20
0.40
0.60
0.80
1.00
0 10 20 30 40 50 60
Ab
sorb
an
ce
CFD concentration, CCFD (ppm)

27
Figure 2.13 Photograph of UV-Vis device used.
2.2.9 X-Ray Photoelectron Spectrophotometer
X-ray photoelectron spectroscopy is a quantitative spectroscopic technique that
measures the elemental composition, empirical formula, chemical state and
electronic state of the elements that exist within a material (Figure 2.14).
Figure 2.14 Photograph of XPS device used.
2.2.10 X-Ray Diffractometer
XRD analysis investigates crystalline material structure, including atomic
arrangement, crystalline size and imperfections. It is a non-destructive technique
for analyzing a wide range of materials including metals, minerals, polymers,
catalysts, plastics and pharmaceuticals. The done analysis is spot scanning and the
number of the scanning is 3. X-ray light source is Al Kα monochromatic (1486.68
eV) and X-ray point dimension is 300 μm. The analyzer is 180 ° semispherical type
analyzer which has a sensor with 128 channels and it works with an energy of 30
eV. Figure 2.15 displays the image of XRD device.

28
Figure 2.15 Photograph of XRD device used.
2.3 Methods
2.3.1 Synthesis of silica alcogel from rice husk ash (S)
The pathway followed for the production of silica alcogel from rice husk ash
is represented figuratively in Figure 2.18. Particle synthesis is performed by
physicochemical method involving two steps: alkali dissolution with precursor rice
husk ash and acidic precipitation with sulfuric acid (Thuadaji and Nuntija, 2008).
20 grams of milled rice husk ash approximately in the size of 0.2 mm are mixed
with the 160 mL of NaOH solution in molar ratio of 2.5 N at 550 rpm in 500 mL
reactor for 30 min and then boiled under reflux at 120oC for 3 h at mixing speed of
450 rpm. At the end of the reaction period two phases are formed. One of them is
undissolved black solid impurities settled at the bottom of the reactor and the other
is supernatant above it. The solid impurities settled and the supernatant are
separated from each other for further treatments. Later precipitation is carried out
by adding sulfuric acid in molar ratio of 5 N into the supernatant (sodium silicate
solution) in 2 h until the pH of the solution becomes neutral. At the end of the
precipitation two phases are formed. White precipitate is silica gel. After separating
these two phases, the silica gel is aged for 3 h at room temperature and then washed
for several times with boiling double distilled water to remove Na+ ions. Rinsing of
the silica gel was repeated until pH of the washing waters become neutral. The
white neutral silica gel is called as hydrogel. The hydrogel is mixed with ethanol
for 8 h at 80°C to change solvent from water to organic phase and dried at 110 °C
for 24 h. During the rinsing process and the solvent change, the stirring duration
was fixed as 30 min.

29
The efficiency of sodium silicate and extraction were controlled with AAS
technique. The images of the extraction process and the filtration step are shown in
Figure 2.6 and 2.17.
Figure 2.16 The extraction process. Figure 2.17 The filtration step.
Figure 2.18 Schematic representation of extraction of silica from RHA by TH method.
Drying AAS
Alcogel
Stirring of RHA with 2.5 N aqueous NaOH solution
Boiling of RHA solution under reflux
Filtration of the solution
Residue: Black solid Filtrate: Transparent solution (pH=13)
Precipitation of silica gel by addition of 5 N H2SO4 until pH=7 uuntilcşkmfdklfuuntiluntilsolution until pH=7
Aging at room temperature for 3 h
Rinsing with boiling water
Rinsing with ethanol for 8 h
Hydrogel
AAS
BET, SEM, XRD, TEM
Drying
BET, SEM, XRD, TGA,XPS

30
2.3.2 Functionalization of silica alcogel surfaces by APTES (S-APTES)
Post-grafting method was used for functionalization of silica alcogel. Ethanol
and APTES were chosen as reaction medium and functionalization agent,
respectively. Experiments were carried out in jacketed glass reactors and spiral
condensers were used to avoid evaporation of reaction medium. Effect of
temperature and silane/SiO2 molar ratio were investigated (Table 2.3). These
parameters were determined after literature survey. In the literature, the most
studied temperatures are 25, 40 and 70°C (Table 1.5) and the most studied molar
ratio of APTES/SiO2 is between 0.2 and 0.6.
Firstly silane and silica alcogel were dispersed in separate 30 ml of ethanol
solutions and mixed well for 30 min (Appendix). After obtaining well dispersed
suspensions, silane dispersed mixture and 70 mL of ethanol is added into silica
alcogel dispersed mixture and the final mixture was refluxed for 24 h to achieve
functionalization at varying temperatures. After functionalization, the suspension is
centrifuged at 6000 rpm for 5 min and washed with ethanol twice. The resulting
precipitates (S-APTES) are vacuumed dried overnight at 110 °C. The experimental
conditions are given in Table 2.3.
Table 2.3 Experimental conditions of post functionalization method.
Experiment no. T (°C) nAptes/nSiO2 VEtOH (ml) VAptes (ml)
1 25 0.2 130 2.34
2 25 0.4 130 4.68
3 25 0.6 130 7.02
4 50 0.2 130 2.34
5 50 0.4 130 4.68
6 50 0.6 130 7.02
7 70 0.2 130 2.34
8 70 0.4 130 4.68
9 70 0.6 130 7.02
2.3.3 Loading of cefdinir
For a good loading, the surface charge of the drug and particle should be
different and in this study it presents only at pH 2. So pH 2 was chosen as loading
medium after determining the zeta potentials of CFD, S and S-APTES nanoparticles
at pH 2, 4, 6, 8 and 10. CFD has the highest solubility at pH 8 (Cho et al., 2017) so
it is dissolved in double distilled water at pH 8 for 24 h. The pH of the CFD solution
was adjusted to pH 2 by addition of 0.1 N HCl. For all loading studies, CFD solution
at pH 2 was used. Experiments were carried out in jacketed glass reactors and spiral

31
condensers were used to avoid evaporation of reaction medium. The stirring rate
was kept as 450 rpm.
During the CFD loading process, different amount of silica nanoparticles was
weighed and 276 ppm CFD solution was prepared (This is the maximum
concentration amount of CFD which could be dissolved in double distilled water).
The particles were poured into 30 ml of CFD solution and stirred for 40 h at 37°C.
CFD loading procedure was performed by using four different amount of S and S-
APTES nanoparticles (CCFD/CS) to control whether the amount influences drug
loading or not. These concentration amounts were listed in Table 2.4 and 2.5 below.
Table 2.4 The list of the amount of S nanoparticles.
CCFD (ppm) mS (mg) CCFD / CS
276 13.5 0.61
276 27 0.31
276 54 0.15
276 108 0.08
Table 2.5 The list of the amount of S-APTES nanoparticles.
CCFD (ppm) mS-APTES (mg) CCFD / CS
276 27 0.31
276 54 0.15
276 108 0.08
276 216 0.04
2.3.4 In-vitro cefdinir release
The in-vitro CFD diffusion from the pure and functionalized silica alcogel
nanoparticles is examined by dialysis membrane (Membra-cell MD34, MWDO:
14000 Da) to separate the dissolution and nanoparticle suspension medium. The
dissolution medium used is 0.1 M HCl solution (pH 1.2). The 10 mg/10 ml of CFD
loaded pure and functionalized silica nanoparticle suspension was immerged into
dialysis membrane in 200 ml HCl solution. The temperature was kept at 37°C in
order to stimulate the temperature of the human body. The dissolution medium was
stirred at speed of 450 rpm using magnetic stirrer. As time increases, 1 ml were
taken out from the dissolution medium at predetermined time intervals and UV-Vis
was used to quantify the amount of CFD released. Figure 2.19 represents the image
of release experiment.

32
Figure 2.19 Experimental set-up for release experiment.

33
3. RESULTS AND DISCUSSION
3.1 Determination of the Content of Rice Husk Ash
The contents of rice husk ash used for silica production are determined by ICP-
MS as described in Section 2.2.5. The results obtained from ICP-MS
characterization are given in Table 3.1.
Table 3.1 Composition of rice husk ash.
Elements Rice husk ash (%)
SiO2 52.83
Al2O3 0.1
Fe2O3 0.03
CaO 0.8
MgO 0.25
Na2O 0.24
K2O 3.26
TiO2 0
MnO 0.17
C 42.32
ICP-MS analysis indicated that rice husk ash consists of small amounts of
elements such as Al, Fe, Ca, Mg, Na, K, Ti. It can also be seen from this table that
rice husk ash contains high amount of silicon and carbon element as expected from
the literature.
3.2 Size Distribution of Silica Particles
Seven sodium silicate solutions (SSS) were produced to see the
reproducubility. The size distributions of silica in SSSs are given in Figure 3.1 in
terms of intensity. As it can be seen from Figure 3.1, SSSs are reproducible since
all the dispersions gave peaks in the same range. The first of these peaks is located
at around 2-3 nm in size, and the second peak is mostly around 100-400 nm and the
third peak is seen around the range of 1500-5000 nm (Figure 3.1). The dispersions
were directly measured without being dissolved in a solvent.

34
Figure 3.1 Size distribution by intensity of the SSSs.
The results of DLS measurements are tabulated in Table 3.2. It can be observed
from Table 3.2 that the majority of the particle size distributions consist of 2-3 nm.
PDI values varies between 0.2 and 1 which means that the silica particles in the
SSSs were agglomerated.
Table 3.2 Results of DLS measurements.
Sample PDI
Peak 1 Peak 2 Peak 3
dmean
(nm)
Int.
(%)
St.
Dev.
(nm)
dmean
(nm)
Int.
(%)
St.
Dev.
(nm)
dmean
(nm)
Int.
(%)
St.
Dev.
(nm)
SSS 1 0.46 2.0 19.3 0.24 - - - 1895 80.7 211.7
SSS 2 0.44 2.4 23.5 0.38 - - - 2219 76.5 337.6
SSS 3 0.93 1.9 57.7 0.51 230.0 42.3 29.8 - - -
SSS 4 1.00 1.9 61.3 0.36 338.7 38.7 28.7 - - -
SSS 5 0.96 1.8 53.2 0.35 - - - 1170 46.8 245.7
SSS 6 0.78 2.5 42.9 0.57 251.7 24.2 10.2 - - -
SSS 7 0.25 2.0 44.2 0.44 - - - 2130 50.9 329.7
3.3 Effect of Solvent Change on Surface Properties of Hydro and Alcogels
It can be seen from the Table 3.3 that S and S-APTES particles are reproducible
because the surface area and the pore diameter values gives very close values. In
drug loading, the particle must be enough large to intake the drug. In this study,
pore diameters of hydrogels is around 6.2 nm which is a good value because
diameter of a CFD molecule is 2.2 nm. If ethanol is used as solvent, pore diameter
decreases however surface area increases around 50 m2/g averagely in case of
solvent change. Surface area is also quite important parameter in drug loading.

35
Table 3.3 BET Analysis results of hydrogel and alcogel.
Solvent type Sample
BET
surface area
(m2/g)a
External
surface area
(m2/g)b
dpore
(nm)c
Boiling water 1
2
3
190.3
208.7
194.9
183.1
199.4
186.5
6.1
6.3
6.2
EtOH 1
2
3
248.2
244.8
145.0
228.4
230.8
136.0
5.9
6.1
5.4
a: BET surface area was derived from adsorption data.
b: External surface area was derived from t plots.
c: Mesopore average diameter was derived using BJH method.
3.4 X-Ray Diffraction Pattern of S and S-APTES Particles
Figure 3.2 indicates the XRD patterns of pure and functionalized silica
powders. Amorphous silica was confirmed with the broad peak at 25-30° (Chen et
al., 2017; Ghorbani et al., 2015). There is no significant change in XRD spectrums
of particles functionalized at different conditions. All peaks could not be observed
clearly due to instrumental limitations.
Figure 3.2 XRD patterns of S and APTES modified nanoparticles.
3.5 FT-IR Spectra of S Particles
The FT-IR spectra of pure silica sample produced is given in Figure 3.3. There
is a small band in 3000-3500 cm-1 referring to the stretching vibrations of silanol
groups (Si-OH) and a small peak at 1639 cm-1 which refers to bending vibrations of
silanol groups. There is a very strong peak at 1082 cm-1 due to asymmetric Si-O-Si
10 20 30 40 50 60 70
Inte
nsi
ty
2θ (°)
SiO2
25 0.2
25 0.4
25 0.6
50 0.2
50 0.4
50 0.6
70 0.2
70 0.4
70 0.6

36
stretching and a smaller peak at 790 cm-1 belonging to the symmetric vibrations of
the Si-O-Si stretching. Silica formation was approved by these characteristic bands
and supported by the literature researches (Liou and Lin, 2012; Sankar et al., 2016).
Figure 3.3 FT-IR spectra of S nanoparticles.
3.6 Thermal Analysis of S and S-APTES Particles
The thermogravimetric analysis was performed to investigate the amount of
grafted APTES. For comparison purposes also unmodified hydrogel and alcogel
samples were exposed to thermal analysis. For functionalization, the highest mass
loss shows the highest coverage. It can be seen from the Figure 3.4 that the mass
loss in the temperature ranges 25-150 °C about 12.96% for alcogel and 9 % for
hydrogel. This loss is attributed to desorption of water in the pores and H-bonded
to silanol groups of silica surface. Additonally, there is a rapid decrease in the range
of 200-650 °C that belongs to the the decomposition of organic functionalities
which was also confirmed by literature research of the post modification of silica
(Malhis et. al., 2017).
Figure 3.4 show that there is a direct relation between molar ratio and the mass
loss. Except one point, as the molar ratio increases at each temperature, the mass
loss increases. The point which does not obey these tendency: (50°C,
nAptes/nSiO2=1.2). It means that after a certain amount of APTES, the molecular
650900115014001650190021502400265029003150340036503900
Tra
nsm
itta
nce
(%)
Wavenumber (cm-1)
asymmetric
Si-O-Si
streching
Si-OH strechingSi-OH bending Symmetric
S-O-Si
streching

37
interactions between APTES molecules is so high that the functionalization
efficiency decreases. The mass increases from 25°C to 50°C but at 70°C the mass
loss decrease. The maximum mass losses were seen at 50°C (Table 3.4). The
biggest amount of mass loss occurred at 50°C for the ratio nAptes/nSiO2=0.6. This was
the optimum condition for functionalization. Table 3.4 shows the mass losses at
each point.
Figure 3.4 TGA thermograms of S and S-APTES nps modified at 25°C(a), 50°C (b) and 70°C (c).
75
80
85
90
95
100
0 200 400 600 800 1000
Wei
gh
t (%
)
Temperature (°C)
Hydrogel
Alcogel
S-APTES 25°C 0.2
S-APTES 25°C 0.4
S-APTES 25°C 0.6
a) 25°C
75
80
85
90
95
100
0 200 400 600 800 1000
Wei
gh
t (%
)
Temperature (°C)
Hydrogel
Alcogel
S-APTES 50°C 0.2
S-APTES 50°C 0.4
S-APTES 50°C 0.6
b) 50°C
75
80
85
90
95
100
0 200 400 600 800 1000
Wei
gh
t (%
)
Temperature (°C)
Hydrogel
Alcogel
S-APTES 70°C 0.2
S-APTES 70°C 0.4
S-APTES 70°C 0.6
c) 70°C

38
Table 3.4 The mass losses at TGA thermograms.
Sample The mass loss (%)
Hydrogel 9.00
Alcogel 12.96
S-Aptes at 25°C 0.2 15.99
S-Aptes at 25°C 0.4 17.15
S-Aptes at 25°C 0.6 18.68
S-Aptes at 50°C 0.2 17.16
S-Aptes at 50°C 0.4 20.81
S-Aptes at 50°C 0.6 22.91
S-Aptes at 50°C 1.2 21.38
S-Aptes at 70°C 0.2 16.39
S-Aptes at 70°C 0.4 18.09
S-Aptes at 70°C 0.6 19.22
3.7 Characterization of S and S-APTES Particles using XPS Analysis
The chemical state of the pure silica and the samples which shown the highest
two mass loss in TGA results (nAptes/nSiO2=0.6 and 1.2) after APTES
functionalization were examined by high resolution XPS measurements which was
represented in Figure 3.5 and 3.7. The wide XPS scan displays signals due to
carbon, oxygen, silicon, nitrogen and sodium. Figure 3.6 shows the enlarged
regions of XPS spectra of S particles. The prominent peaks for Si 2p, O 1s, C 1s
and N 1s are consistent with the formation of silica nanoparticles bearing
hydrolyzed APTES molecules on their surface. The Si 2p spectra (Figure 3.6a)
consists of a distinct peak centered at 102.98 eV, characteristic of Si-O bonds. The
C 1s peaks peak (Figure 3.6b) centered at 284.58 eV supports the existence of the
C-C bonds of the hydrolyzed APTES molecules. The N 1s spectra at 399.28 eV
(Figure 3.6c) confirms the presence of primary amine N-H bonds (Chandra et al.,
2017). 532.38 eV (Figure 3.6d) shows the presence of O and finally Na 1s spectra
at 1072.08 eV (Figure 3.6e) proves the presence of Na atoms, which means that the
Na ions could be removed from the hydrogel very well in washing step after
precipitation of sodium silicate solution however the percentages of Na atom (Table
3.5) is very low which shows there is a trace amount of Na inside of the alcogel. It
can be also conclude from Table 3.9 and 3.10 that as the ratio of silane increases
presence of N atoms increase and the atom O increased by increasing the ratio from
0.6 to 1.2.

39
Figure 3.5 The wide scan XPS spectra of the S nanoparticles.
Table 3.5 Atomic composition of S nps.
Element Atomic content (%)
Pure silica nAptes/nSiO2= 0.6 nAptes/nSiO2= 1.2
Si 31.92 26.38 26.14
C 10.63 24.79 19.36
N - 4.96 5.83
O 56.23 42.79 45.03
Na 1.22 1.08 -
Figure 3.6 The enlarged regions of XPS spectra of Si2p(a), C1s (b), N1s (c), O1s (d) and Na1s (e).
0.E+00
1.E+05
2.E+05
3.E+05
4.E+05
5.E+05
6.E+05
0200400600800100012001400
Co
un
ts/
s
Binding Energy (eV)
98100102104106108Inte
nsi
ty (
a.u
)
Binding Energy (eV)282283284285286287288289290
Inte
nsi
ty (
a.u
)
Binding Energy (eV)
394396398400402404406408
Inte
nsi
ty (
a.u
)
Binding Energy (eV)528530532534536538
Inte
nsi
ty (
a.u
)
Binding Energy (eV)
1064106610681070107210741076
Inte
nsi
ty (
a.u
)
Binding Energy (eV)
(a) (b)
(c) (d)
(e)

40
Figure 3.7 The wide scan XPS spectra of the S-APTES nanoparticles functionalized at
nAptes/nSiO2= 0.6 (a) and nAptes/nSiO2= 1.2 (b).
When we compare the ratios 0.6 ad 1.2, it is thought that the reason for biggest
mass loss at nAptes/nSiO2=0.6 in TGA analysis is the bulky attached APTES
molecules onto these S-APTES particles. Thanks to XPS that, this method proves
the chemical bonds in the molecules and fixed this complexity.
As a result nAptes/nSiO2=1.2 was the best ratio among the all parameters. Please
note that, here in this study nAptes/nSiO2= 0.6 was used as the chosen S-APTES since
the time was limited to produce S-APTES particles enough at nAptes/nSiO2= 1.2.
3.8 Particle Morphology of Hydrogel, Alcogel and S-APTES
The SEM images of hydrogel, alcogel and best S-APTES nanoparticles were
given in Figure 3.8. All of the particles have irregular shapes. Hydrogel looks like
a cloud and there is no shape of it. The silica particles in hydrogel are apparently
1.E+00
5.E+04
1.E+05
2.E+05
2.E+05
3.E+05
3.E+05
4.E+05
0200400600800100012001400
Co
un
ts/
s
Binding Energy (eV)
a) nAptes/nSiO2= 0.6
0.E+00
5.E+04
1.E+05
2.E+05
2.E+05
3.E+05
3.E+05
0200400600800100012001400
Co
un
ts/
sBinding Energy (eV)
b) nAptes/nSiO2= 1.2

41
agglomerated and size cannot be measured. Alcogel particles also agglomerated
however the agglomeration clusters’ surface looks harder and like having more
certain borders with each other. Lastly it can be seen from the Figure 3.8 that the
grains begin to disintegrate.
.
Figure 3.8 SEM micrograph of hydrogel (a), alcogel (b) and S-APTES with the ratio of 0.6.
3.9 Characterization of S and S-APTES Particles using TEM
TEM images of dried alcogel and best S-APTES powder are given in Figure
3.9. It can be easily seen from the figure that the particle diameter decreased after
functionalization. Before functionalization, the diameter of the particles was
between 5-20 nm whereas the diameter after functionalization was around 10 nm.
In both cases the particles agglomerated but it seems that the functionalization made
the pure silica nanoparticles to have a more uniform distribution.
The particle sizes in TEM images are smaller than that of SEM images. The
reason of this is that acetone was used to disperse the powders before taking TEM
images and this helped to have a better image by TEM. On the contrary in analysis
of SEM, solutions were directly used without any dispersion in any solvent.
a) hydrogel b) alcogel
c) S-APTES
42
Figure 3.9 TEM images of S and S-APTES nanoparticles.
3.10 Zeta potential measurements of CFD, S and S-APTES particles
The zeta potential of S, S-APTES and CFD are given in Figure 3.10. From the
Figure 3.10 it can be seen that the surface charge of CFD is always negative in all
pH values however the particles have isoelectronic points. Isoelectric points are the
points where the surface charge is zero and there is no attraction/repulsion between
particles. The isoelectric points of S and S-APTES are approximately 3 and 4,
resectively. The most appropriate pH value for loading is pH 2 since the surface
charge of the drug and particles are different.
From the zeta potential charts, the stability can be read. If the zeta potential of
the particle is between -30 and 30, the dispersion is unstable however if this value
is out of this range, the dispersion is stable. Figure 3.10 shows that CFD is unstable
in all pH values, S-APTES dispersion is stable at only pH 2 and S is stable at pH
values above 3.5.

43
Figure 3.10 Zeta potential of S, S-APTES and CFD at different pH values 2, 4, 6, 8 and 10.
3.11 Loading of cefdinir
Different amounts of adsorbents (S and S-APTES) were studied in the drug
loading part. Concentration of CFD solution was fixed as 276 ppm. All loading
experiments were studied three times to see the repeatability. Average loading
percentages are plotted in Figure 3.11.
Figure 3.11 CFD loading onto S and S-APTES nanoparticles at 25°C.
Loading process was more successful in S particles compared to S-APTES
particles. 39% of CFD could be loaded into S particles however only 31% of CFD
could be loaded into S-APTES particles. For the pure silica samples, the best
-70
-50
-30
-10
10
30
50
70
0 2 4 6 8 10 12 14Ze
ta P
ote
nti
al (
mV
)
pH
S
S-APTES
CFD
0
20
40
60
80
100
120
140
0 0.05 0.1 0.15 0.2 0.25
mg
CF
D/g
sil
ica
mS (g silica)
CFD loading
CFD adsorbed onto S
CFD adsorbed onto S-APTES

44
loading was achieved with the ratio CCFD/CS=0.31. As the amount of drug carrier
increased, the loading percentage increased for loading of CFD into S particles. For
the S-APTES particles instead, a better loading was succeeded as the amount of
drug carrier decreased. The most appropriate loading was seen at the ratio CCFD/CS-
Aptes=0.08.
3.12 Release Experiments and Kinetic Models
Among the pure silica and APTES functionalized nanoparticles, only the S and
the most appropriate S-APTES nanoparticle were subjected to in vitro release
experiments. These studies were carried out using dialysis tubing (Membra-cell
MD34, MWDO: 14000 Da) method, in double distilled water with a pH 1.2 at 37°C.
Release profiles of the CFD loaded S and S-APTES nanoparticles were plotted in
Figure 3.12 using the data given in Table 3.6.
Table 3.6 Data of release experiments.
Time
(h)
Amount of CFD
released Mt (mg)
Amount of remaining CFD
M (mg) Release of CFD (%)
S S-APTES S S-APTES S S-APTES
0 0 0 3.23* 2.57* 0 0
2 0.53 0.278 2.70 2.29 16.5 10.8
4 0.43 0.14 2.80 2.42 13.2 5.6
6 0.47 0.29 2.76 2.28 14.4 11.2
8 0.69 0.36 2.54 2.21 21.5 13.9
10 0.74 0.39 2.49 2.18 23.0 15.0
12 0.82 0.39 2.41 2.18 25.5 15.0
24 0.82 0.39 2.41 2.18 25.5 15.0
*Initial amount of drug in dialysis tubing (M0).
Figure 3.12 Release profiles of CFD loaded S (a) and S-APTES (b) nps (pH 1.2 and 37°C).
0
5
10
15
20
25
30
0 2 4 6 8 10 12 14 16 18 20 22 24
Cum
ula
tive
Rel
ease
(%
)
Time (h)
S
0
5
10
15
20
25
30
0 2 4 6 8 10 12 14 16 18 20 22 24
Cum
ula
tive
Rel
ease
(%
)
Time (h)
S-APTES

45
The release of CFD was characterized by initial fast release with 16.5% and
10.8% of the total amount of CFD detected during the first 2 hours for S and S-
APTES particles, respectively. The reason of this initial fast release was the
unloaded CFD molecules that were absorbed on the nanoparticle surface. After 10
hours, almost no CFD released from S-APTES particles and this duration was 12
hours for S particles.
Release experiments were repeated twice. Results of release experiments are
listed in Table 3.7.
Table 3.7 Results of release experiments.
Particle Release of CFD
(%) after 2 h
Release of CFD
(%) after 10 h
Release of CFD
(%) after 12 h
Release of CFD
(%) after 24 h
S 16.5 23.0 25.5 25.5
S-Aptes 10.8 15.0 15.0 15.0
The release kinetics of CFD loaded S and S-APTES nanoparticles were
calculated according to zeroth order and first order. The data for release kinetics of
CFD and the plots for the first 8 h are given in Table 3.8.
Table 3.8 Data of release kinetics.
t M0-M ln(M0/M)
S S-APTES S S-APTES
0 0.00 0.00 0.00 0.00
2 0.32 0.14 0.11 0.09
4 0.41 0.15 0.16 0.04
6 0.49 0.33 0.16 0.12
8 0.69 0.37 0.24 0.17

46
Figure 3.13 Zeroth order kinetics of CFD loaded S and S-APTES nanoparticles.
Figure 3.14 First order kinetics of CFD loaded S and S-APTES nanoparticles.
Results of release kinetics of CFD loaded S and S-APTES nanoparticles are
given in Table 3.9. As we can see from the regression analysis that Zeroth Order is
more fitted to S and S-APTES release profile comparing to First Order. Between S
and S-APTES profiles for Zeroth Order, S-APTES shows a better fitting to Zeroth
Order Kinetics.
Table 3.9 Results about release kinetics of CFD loaded S and S-Aptes nps.
Particle
Zeroth order First order
k
(mg/h) R2
k
(mg/h) R2
S 0.0898 0.9026 0.0311 0.855
S-APTES 0.0486 0.9393 0.0201 0.7621
y = 0.0898xR² = 0.9026
y = 0.0486xR² = 0.9393
0.0
0.1
0.2
0.3
0.4
0.5
0.6
0.7
0.8
0 2 4 6 8 10
M0-M
t
Zeroth order
S
S-Aptes
Linear (S)
Linear (S-Aptes)
y = 0.0311xR² = 0.855
y = 0.0201xR² = 0.7621
0.0
0.1
0.1
0.2
0.2
0.3
0.3
0 2 4 6 8 10
ln(M
0/M
)
t
First order
S
S-Aptes
Linear (S)
Linear (S-Aptes)

47
4. CONCLUSION AND RECOMMENDATIONS
Sodium silicate solutions were prepared from RHA by extraction process and
amorphous silica was produced from rice husk by precipitation method
successfully. The surfaces of the produced silica were functionalized using Aptes
by post-grafting method. The surface functionalized samples were used as drug
carriers in drug delivery. All samples had potential for future studies. To conclude:
Silica particles were functionalized succesfully and the optimum condition
was 50°C and nAPTES/nS=0.6 amount the parameters tried. More parameters
can be tried to have a better coverage.
XRD results indicated the synthesis of amorphous SiO2.
FTIR result of S particles confirms the presence of Si-O bonds.
TGA and XPS results show a moderate coverage of silica surface at 50°C
and nAPTES/nS=0.6 in functionalization step.
In contrast to the pure samples, generally after the functionalization the
surface area, pore size and pore volume became smaller.
SEM images gave information about the morphology of the particles.
TEM images presented the spherical nano S and S-APTES particles.
The CFD release from S and S-APTES particles was obtained. An initial
fast release during 1-2 h and subsequent slow CFD release until 10 h and
then a stop in release. The release of CFD from the S nano particles is faster
than the S-APTES particles.
For understanding the particle formation mechanism, the structure of silicate
solution can be investigated. More parameters can be tried to have a higher coverage
of silica surfaces by silane and to explain loading profile. More experiments can be
performed to see the repeatibility of the release process better.

48
REFERENCES
Adam, F., Chew, T.S. and Andas, J., 2011, A simple template-free-sol-gel
synthesis of spherical nanosilica from agricultural biomass, J Sol-gel Science
Technol 59, 580-583p.
Alshatwi, A.A., Athinarayanan, J. and Periasamy, V.S., 2015, Biocompatibility
assessment of rice husk-derived biogenic silica nanoparticles for biomedical
applications, Material Science of Engineering 47, 8–16p.
An, D., Guo, Y., Zhu, Y. and Wang, Z., 2010, A green route to preparation of
silica powders with rice husk ash and waste gas, Chem. Eng. J. 162, 509-514p.
An, D., Guo, Y., Zou, B., Zhu, Y. and Wang, Z., 2011, A study on the consecutive
preparation of silica powders and active carbon from rice husk ash. Biomass
Bioenergy 35, 1227-1234p.
Arean, C.O., Vesga, M.J., Parra, J.B. and Delgado, M.R., 2013, Effect of amine
and carboxyl functionalization of sub-micrometric MCM-41 spheres on
controlled release of cisplatin, Ceramics International 39, 7407-7414p.
Azmi, M.A., Ismail, N.A.A. and Rizamarhaiza, M., 2016, Characterization of
silica derived from rice husk (Muar, Johor, Malaysia) decomposition at
different temperatures, 2nd Internetional Conference of Functional Material
Metal.
Bergna, H.E. and Roberts, W.O., 2006, Colloidal silica: Fundamentals and
applications, Boca Raton: Taylor&Frands, 9-37p.
Björkegren, S., Nordstierna, L., Törncrona, A. and Palmvist, A., 2017,
Hydrophilic and hydrophobic modifications of colloidal silica particles for
pickering emulsions, J Colloid Interface Sci 487, 250-257p.
Carmona, V.B., Oliveira, R.M., Silva, W.T.L., Mattoso, L.H.C. and
Marconcini, J.M., 2013, Nanosilica from rice husk: Extraction and
characterization, Industrial Crops and Products 43, 291-296p.
Chandrasekhar, S., Satyanarayana, K.G., Pramada, P.N. and Raghavan, P.,
2003, Processing, properties and applications od reactive silica from rice husk-
an overview, Journal of Material Science 38, 3159-3168p.

49
REFERENCES (continued)
Chen, S., Chou, P., Chan, W. and Lin, H., 2017, Preparation and characterization
of mesoporous bioactive glass from agricultural waste rice husk for targeted
anticancer drug delivery, Ceramics International 43, 2239-2246p.
Dash, S., Murthy, N., Nath, L. and Chowdhury, P., 2010, Kinetic modelling on
drug release from controlled drug delivery systems, Acta Poloniae
Pharmaceutica-Drug Research, 67 3, 217223p.
Demuth, P., Hurley, M., Wu, C., Galanie S., Zachariah, M.R. and Deshong, P.,
2011, Mesoscale porous silica as drug delivery vehicles aand pH-sensitive
release profiles, Microporous Mesoporous Mater. 141, 128-134p.
Dubey, R.S., Rajesh, Y.B.R.D. and More, M.A., 2015, Synthesis and
characterization of SiO2 nanoparticles via sol-gel method for industrial
applications, Materials Today: Proceedings 2, 3575 – 3579p.
Edrissi, M., Soleymani, M. and Adinehnia, M., 2011, Synthesis of silica
nanoparticles by ultrasound-assisted sol-gel method: optimized by taguchi
robust design, Chemical Engineering Technology 34, 1813-1819p.
Gutowska, A., Jeong, B. and Jasionowski, M., 2001, Injectable gels for tissue
engineering, The Anatomical record 263 4.
Herna’ndez, M.S., Herna’ndez, C.S., Fuentes, A.G., Elorza, F., Carrera-
Rodri’guez, M. and Alquiza, M.J., 2014, Efficacy from different extraction
for chemical profile and biological activities of rice husk, J Sol-Gel Sci
Technol 71, 514-521p.
Hieu, N.M., Korobochkin, V.V. and Tu, N.V., 2015, A study of silica separation
in the production of activated carbon from rice husk in Viet Nam, Procedia
Chemistry 15, 308-312p.
Jal, P.K., Sudarshan, M. and Saha, A., 2004, Synthesis and characterization of
nanosilica prepared by precipitation method, Colloids Surf. Physicochem.
Eng. Aspect 240, 173-178p.

50
REFERENCES (continued)
Javed, S., Naveed, S., Feroze, N., Zafar, M. and M. Shafaq, 2010, Crystal and
amorphous silica from KMnO4 treated and untreated rice husk, J. Qual.
Technol. Manage. 6, 81–90p.
James, J. and Rao, M. S. 1986, Characterization of silica in rice husk ash, Am.
Ceram. Soc. Bull. 65, 1177p.
Kalam, S.U., Humayun, M., Parvez, N., Yadav, S., Garg, A., Amin, S.,
Sultanaand Y. and Ali, A., 2007, Release kinetics of modified pharmaceutical
dosage forms: a review, Continental J. Pharmceutical Sciences 1, 30-35p.
Kalu, V.D, Odeniyi, M.A. and Jaiyeoba, K.T, 2007, Matrix properties of a new
plant gum in controlled drug delivery, Archieves of Pharmacal Research 30 7,
884-889p.
Kapur, P.C., 1985, Production of reactive bio-silica from the combustion of rice
husk in TiB burner, Powder Technol. 44, 63p.
Korsmeyer, R.W., Gurny, R., Doelker, E., Buri, P. and Peppas, N.A, 1983,
Mechanisms of solute release from porous hydrophilic polymers, Intrnational
Journal of Pharmaceutics 15, 25-35p.
Kortesuo, P., Ahole, M., Karlsson, S., Kangasniemi, I., Yli-Urpo, I. and
Kiesvaara, J., 2000, Silica xerogel as an implantable carrier for controlled
drug delivery evaluation of drug distribution and tissue effects after
implantation, Biomaterials 21 2, 193-198p.
Le, V.H., Nhan, C., Thuc, H. and Thuc, H.H., 2013, Syhthesis of silica
nanoparticles from Vietnamese rice husk by sol-gel method. Nanoscale
Research Letter 8 1, 58-68p.
Lin, Y.S. and Haynes, C.L., 2009, Synthesis and characterization of biocompatible
and size-tunable multifunctional porous silica nanoparticles, Chem. Mater. 21,
3979-3986p.
Liou, T.H., 2004, Preparation and characterization of nanostructured silica from
rice husk, Materials Science and Engineering A 364, 313-323p.

51
REFERENCES (continued)
Liou, T.H. and Yang, C.C., 2011, Synthesis and surface characteristics of
nanosilica produced from alkali-extracted rice husk ash. Mater. Sci. Eng. B
176, 521-529p.
Liu, D., Zhang, W., Lin, H., Li, Y., Lu, H. and Wang, Y., 2016, A green
technology for the preparation of high capacitance rice husk-based activated
carbon, Journal of Cleaner Production 112, 1190-1198p.
Luan, T.C. and Chou, T.C., 1990, Recovery of silica fromt he gasification of rice
husk/coal in the presence of a pilot flame in a modified fluidized bed, Ind.
Eng. Chem. Res. 29, 1922p.
Manzano, M., Aina, V., Arean, C.O., Balasa, F., Cauda, V., Colilla, M.,
Delgado, M.R. and Vallet-Regi, M., 2008, Studied on MCM-41 mesoporous
silica for drug delivery: effect of particle morphology and amine
functionalization, Chem Eng J 137, 30-37p.
Maria, G., Berger, D., Nastase, S. and Luta, I., 2012, Kinetic studies on the
irinotecan release based on structural properties of functionalized
mesoporous-silica supports, Microporous and Mesoporous Materials 149, 25-
35.
Maria, G, Stoica, A., Luta, I., Stirbet, D. and Radu, G., 2012, Cephalosporin
release from funcitonalized MCM-41 supports interpreted by various models,
Microporous and Mesoporous Materials 162, 80-90p.
Mehta, A. and Ugwekar, R.P., 2015, Extraction of silica and other related
products from rice husk, Int. J. Eng. Res. App. 5 8, 2248-9622, 43-48p.
Misran, H., Yarmo, M.A. and Ramesh, S., 2013, Synthesis and characterization
of silica nanospheres using nonsurfactant template, Ceramics International 39,
931-940p.
Mor, S., Manchanda, C.K. and Ravindra, K., 2016, Nanosilica extraction from
processed agricultural residue using green technology, Journal of Cleaner
Production.

52
REFERENCES (continued)
Nakata, Y., Suzuki, M., Okutani, T., Kikuchi, M. and Akiyama, T., 1989,
Preparartion and properties of SiO2 from rice hulls, J. Ceram. Soc. Jpn. 97,
842p.
Park, S.K., Kim, K.D. and Kim, H.T., 2002, Preparation of silica nanoparticles:
determination of the optimal synthesis conditions for small and uniform
particles, Colloids and Surfaces A: Physicochemical and Engineering Aspects
197, 7-17p.
Rahman, I. and Padavettan, V., 2012, Sythesis of silica nanoparticles by Sol-
Gel: Size dependent properties, surface modification and applications in silica
polymer nanocomposites – A review, Journal of Nanomaterials 2012.
Real, C., Alcala, M.D. and Criado, C.M., 1996, Preparation of silica from rice
husks, J. Am. Ceram. Soc. 79, 2012–2016p.
Sankar, S., Sharma, S. K. and Kim, D. Y., 2016, Synthesis and characterization
of mesoporous SiO2 nanoparticles synthesized from biogenic rice husk ash for
optoelectronic applications, International Journal of Engineering 17.
Selvi, A., and Das, N., 2015, Remediation of cefdinir from aqueous solution using
pretreated dead yeast Candida sp. SMN04 as potential adsorbent: an
equilibrium, kinetics and thermodynamic studies, Scholars Research Library 7
4, 74-81p.
Shen, J., Liu, X., Zhu, S., Zhang, H. and Tan, J., 2011, Effects of calcination
parameters on the silica phase of original and leached rice husk ash, Mater.
Lett. 65, 1179–1183p.
Singhvi, G. and Singh, M., 2011, Review: In-vitro drug release characterization
models, International Journal of Pharmaceutical Studies and Research 2, 77-
84p.
Song, S.W., Hidajat, K. and Kawi, S., Functionalized SBA-15 materials as
carriers for controlled drug delivery: Influence of surface properties on Matrix-
Drug Interactions, Langmuir 21, 9568-9575p.

53
REFERENCES (continued)
Stöber, W. and Fink, A., 1968, Controlled growth of monodisperse silica spheres
in the micron size range, Journal of Colloid and Interface Science 26, 62-69p.
Szegedi, A., Popova, M., Goshev, I. and Mihaly, J., 2011, Effect of amin
functionalization of spherical MCM-41 and SBA-15 on controlled drug
release, J Solid Stat Chem 184, 1201-1207p.
Thuadaij, N. and Nuntiya A., 2008, Preparation of nanosilica powder from rice
husk ash by precipitation method. Chiang Mai J. Sci. 35 1, 206-211p.
Tolba, G.M.K., Barakat, N.A.M., Bastaweesy, A.M., Ashour, E.A., Abdelmoez,
W., El-Newehy, M.H., Al-Deyab, S.S. and Kim, H.Y., 2015, Effective and
highly recyclable nanosilica produced from the rice husk for effective removal
of organic dyes, J. Ind. Eng. Chem. 29, 134–145p.
Trewyn, B.G, Nieweg, J.A., Zhao, Y. and Lin, V.S.Y., 2008, Biocompatible silica
nanoparticles with different morphologies for animal cell membrane
penetration, Chemical Engineering Journal 137, 23-29p.
Vaibhav, V., Vijayalakhmi, U. and Roopan, S.M, 2014, Agricultural waste as a
source for the production of silica nanoparticles, Spectrochimica Acta Part A:
Molecular and Biomolecular Spectroscopy 139, 515-520p.
Wang, N. and Low, M.J.D., 1990, Spectroscopic studies of carbons XVIII: The
charring of rice hulls, Mater. Chem. Phys. 26, 117p.
Xiong, L., Sekia, E.H., Sujaridworakun, P., Wada, S., and Saito, K., 2009,
Burning temperature dependence of rice husk ashes in structure and property,
J. Metals Mater. Miner. 19, 95–99p.
Yener, H.B. and Helvacı, Ş.Ş., 2015, Effect of synthesis temperature on the
structural properties and photocatalytic activity of TiO2/SiO2 composites
synthesized using rice husk ash as a SiO2 source, Separation and Purification
Technology 140, 84-93p.
Yılmaz, M.S, Palantoken, A. and Piskin, S., 2016, Release of flurbiprofen using
of SBA-15 mesoporous silica: Influence of silica source and functionalization,
Journal of non-crystalline solids 437, 80-86p.

54
REFERENCES (continued)
Yoo, Y., Shin, H.W. and Nam, B.G., 2003, Effect of hydrophilic-lipophilic
balance of drugs on their release behavior from amphiphilic matrix,
Macromolecular Research 11 4, 283-290p.
Yuvakkumar, R., Elango, V., Rajendran, V. and Kannan, N., 2014, High-
purity nano silica powder from rice husk using a simple chemical method,
Journal of Experimental Nanoscience 9 3, 272-281p.
Zhang, Y., Zhuangzhi, Z., Jiang, T., Zhang, J., Wang, Z. and Wang, S., 2010,
Spherical mesoporous silica nanoparticles for loading and release of the
poorly water-soluble drug telmisartan, Journal of Controlled Release 145, 257-
263p.
Zulfiqar, U., Subhani, S.W and Husain, S.W, 2015, Synthesis of silica
nanoparticles from soduim silicate under alkaline conditions, J Sol-Gel
Technol 77, 753-758p.
Zulkifli, N.SC., Ab Rahman, I., Mohamed, D. and Husein, A., 2013, A green
sol-gel route for the synthesis of structurally controlled silica particles from
rice husk for dental composite filler. Ceram. Int. 39, 4559-4567p.

55
ACKNOWLEDGEMENT
I would like to extend my sincerest gratitude towards my research supervisor
Prof. Dr. Şerife Şeref HELVACI for her valuable guidance through her MSc
studies. I express my thankfulness to my advisor Res. Assist. Dr. H. Banu YENER
for her support during the thesis. My sincere thanks also goes to my fellow lab
mates Gizem TUFANER and Pelin ÖZ for stimulating discussions during the all
year.
This work was supported by the Ministry of Education, Youth and Sports of
the Czech Republic Program NPU I (LO1504). The XRD data was measured due
to the support of Operational Program Research and Development for Innovations
co-funded by the European Regional Development Fund (ERDF) and national
budget of the Czech Republic, within the framework of the project CPS
strengthening research capacity (reg. number: CZ.1.05/2.1.00/19.0409). Thanks to
Prof. Dr. Vladimír SEDLAŘÍK for his guidance during period in Czech Republic
and also allowing me to use all the devices/equipments I needed in the laboratories.
I would also like to thank Erdoğanlar Food Industry and Kansai Altan Paint
Industry and Trade Incorporation for supplying rice husk ash and APTES,
respectively, required for the experiments.
Lastly, I am deeply indebted to my father Erdoğan ÇALIŞKAN, mother Belkıs
ÇALIŞKAN and dear Alper ÖZCEL who provided me the greatest support and
encouragement.

56
CURRICULUM VITAE
Contact
information : Açelya Çalışkan
İzmir, Karşıyaka, Örnekköy Mah., 7539 Sokak, No:5/1
+90 539 889 6029 / +90 535 946 3651
TR – Female - 12/06/1990
Education : 2016-2019 Graduate Ege Uni. Turkey Chemical Eng. 3.6/4
2008-2015 Bachelor Ege Uni. Turkey Chemical Eng. 2.6/4
2011-2012 Bachelor Porto Uni. Portugal Chemical Eng. LLP
2004-2008 High school Atakent Anatolian Turkey Science 95/100
Language skills : Turkish Native
English Advanced
German Intermediate
Computer skills : Microsoft Office Excellent
Matlab Intermediate
Intellicad Intermediate
Experience : 2019 Molkim R&D Engineer 8 m
2018 Tomas Bata University in Zlín Temporary Project Officer 6 m
2012 Maxion Wheels Intern Engineer 2 m
2010 İnci GS Yuasa Intern Engineer 2 m
Seminars and
courses :
2011 Creative Drama TEGV 144 h
2011 Portuguese Language Porto University 60 h
2010 German Language Tömer 384 h
Scholarships : 2016-2018 Cevdet İnci Educational Foundation – Success scholarship
2008-2013 Cevdet İnci Educational Foundation – Success scholarship
Projects and
presentations :
2018 ‘Calcination method in the presence of activating chemicals: effective
parameters in silica production from rice husk ash’, 13th National
Congress of Chemical Engineering (oral ppt)
2013 ‘Stability and release behavior of drug loaded nanoemulsions’
Advanced Materials World Congress (oral ppt)
2009-2010 1th UKMOP (National Student Platform of Chemical Engineering).
My mission was finding expert academicians, public and firm
representatives to make presentations on the platform.
Interests : Discovering science, psychology, spiritual awakening, exploring new cultures
Memberships : KMO, TEGV

57
References : Didem Tunç, Senior Quality Engineer at Hayat Chemicals
[email protected] (+90 536 968 69 99)
Prof. Dr. Şerife Şeref Helvacı, Ege University Chemical Engineering Department
[email protected] (+90 544 576 38 06)

58
APPENDIX
Method of silanation
The amount of silica (S) for each experiment (g): 3
The weight percentage of S in alcogel (w %): 8.25
The amount of alcogel required (g):
3g ∗100
8.25= 36.3636 g alcogel
Parameters: T and nAPTES/nS
Calculation of the amount of solvent (ethanol) (for 3% EtOH solution):
3g S
xg EtOH= 0.03 → x = 100gEtOH
VEtOH = 100g ∗mol
0.789gEtOH~130mL
Calculation of the amount of APTES:
nS =3g
60g
mol
= 0.05mol
For nAPTES/nS=0.2: nAPTES
nS= 0.2 →
nAPTES
0.05 mol= 0.2 → nAPTES = 0.01 mol
VAPTES = 0.01 mol ∗mL
0.946g∗
221.372 g
mol= 2.34 mL
For nAPTES/nS=0.4: nAPTES
nS= 0.4 →
nAPTES
0.05 mol= 0.4 → nAPTES = 0.02 mol
VAPTES = 4.68 mL

59
For nAPTES/nS=0.6: nAPTES
nS= 0.6 →
nAPTES
0.05 mol= 0.6 → nAptes = 0.03 mol
VAPTES = 7.02 mL