Study of Mechanical Characteristics for Polymer Composite Reinforced by Particles of (Al2O3) or (Al)
Upload
independentCategory
view
1download
0
Relationship Between the Polymer/Silica Interaction andProperties of Silica Composite Materials
AURELIEN GUYARD,1 JACQUES PERSELLO,2 JEAN-PHILIPPE BOISVERT,1 BERNARD CABANE3
1CRPP, Universite du Quebec a Trois-Rivieres, C.P.500,Trois-Rivieres, Quebec, G9A5H7, Canada
2LCMI, Universite de Franche-Comte, 16 route de Gray, 25030 Besancon, France
3PMMH, ESPCI, 10 rue Vauquelin, 75231 Paris, France
Received 29 August 2005; revised 5 January 2006; accepted 13 January 2006DOI: 10.1002/polb.20768Published online in Wiley InterScience (www.interscience.wiley.com).
ABSTRACT: Cast film composites have been prepared from aqueous polymer solutionscontaining nanometric silica particles. The polymers were polyvinyl alcohol (PVA),hydroxypropylmethylcellulose (HPMC) and a blend of PVA-HPMC polymers. In theaqueous dispersions, the polymer–silica interactions were studied through adsorptionisotherms. These experiments indicated that HPMC has a high affinity for silica sur-faces, and can adsorb at high coverage; conversely, low affinity and low coverage werefound in the case of PVA. In the films, the organization of silica particles was investi-gated through transmission electron microscopy (TEM) and small-angle neutron scat-tering (SANS). Both methods showed that the silica particles were well-dispersed inthe HPMC films and aggregated in the PVA films. The mechanical properties of thecomposite films were evaluated using tensile strength measurements. Both polymerswere solid materials, with a high-elastic modulus (65 MPa for HPMC and 291 forPVA) and a low-maximum elongation at break (0.15 mm for HPMC and 4.12 mm forPVA). In HPMC films, the presence of silica particles led to an increase in the modu-lus and a decrease in the stress at break. In PVA films, the modulus decreased butthe stress at break increased upon adding silica. Accordingly, the polymer/silica inter-action can be used to tune the mechanical properties of such composite films. VVC 2006
Wiley Periodicals, Inc. J Polym Sci Part B: Polym Phys 44: 1134–1146, 2006
Keywords: polyvinylalcohol; hydroxypropylmethylcellulose; neutron scattering; silica;structure; mechanical properties; nanocomposite
INTRODUCTION
A growing interest is directed toward the develop-ment of high-performance composite materials inwhich nanosize inorganic particles are used toreinforce, instead of just fill, the organic matrix.
The addition of solid particles deeply modifiesand can significantly enhance the mechanicalproperties of the composite material, compared tothe polymer material alone. Numerous studieshave been published in recent years focusing onthe use of carbon black and silica as reinforcingagents in elastomers.1–5 Much less have beenpublished on glassy or semicrystalline polymerfilms.
The reinforcing efficiency of fillers is a directfunction of their volume fraction in the polymermatrix. For instance, the Guth and Gold approxi-mation6 relates the elastic modulus E of the com-
This work used the neutron beam of the Institut Laue-Langevin
Correspondence to: J.-P. Boisvert (E-mail: [email protected])
Journal of Polymer Science: Part B: Polymer Physics, Vol. 44, 1134–1146 (2006)VVC 2006 Wiley Periodicals, Inc.
1134

posite to the volume fraction / of nondeformablefiller particles:
E=Eo ¼ 1þ 2:5/þ 14:1/2 ð1Þ
The first-order term is equivalent to the relativeviscosity increase of a dilute suspension of spheri-cal particles. The second-order term refers to theelastic interparticle interaction in the isotropi-cally averaged stress field. This approximationremains valid, in the best case, for low to moder-ate deformations and typical loadings of filler upto / � 0.35.7,8 It is then expected that high-vol-ume fractions of particles will lead to compositeswith higher modulus, compared with the unfilledmaterial. Equation 1 also implicitly assumes ahomogeneous particle distribution within the or-ganic matrix, maximizing direct contact with thefiller surface.9 In such conditions, it has beenshown that the composite modulus and strengthcan increase.10 On the other hand, heterogeneousfiller distribution creates discontinuities wherefractures are more likely to initiate.11 Other pa-rameters are also important. The mechanicalproperties depend on the particle geometry,shape, size distribution, and porosity, as well ason the nature of the polymer/filler interaction.12–14
The porosity of fillers can allow interpenetrationof the filler and the matrix and significantly re-inforce composite materials.15–17 Finally, thenumber and nature of additional reticulationpoints created by the introduction of fillers havealso been identified as important parametersregarding tensile properties of composites.4,15,18,19
However, it is not always clear in the literaturewhether the improvement is directly related tobetter polymer/filler interaction or whether to bet-ter distribution homogeneity of the filler due tobetter interaction. These interactions are often de-scribed by the so-called wettability of the filler bythe matrix and are connected to the adhesionbetween the moieties. Poorly wetted filler surfa-ces lead to the creation of voids around the par-ticles. These voids are weak points where failuresinitiate, as the material is under stress, then re-ducing its strength.20,21 To increase the fillerwettability, coupling agents can be used. Over theyears, many coupling agents have been commer-cialized for specific composites and applications,showing how important wetting is for the devel-opment of high-performance composites.
The aim of this work was to determine how themechanical properties of glassy composite materi-als can be related to their structure and to the
polymer/surface interaction. For composite filmsthat are made by solvent evaporation from mixeddispersions, the polymer surface interaction caninfluence the film properties directly, or indirectlythrough its effect on the organization of particlesin the film. To decouple these effects, compositefilms were made with the same particles andthree different polymers: polyvinylalcohol (PVA),hydroxypropylmethylcellulose (HPMC) and amixture of HPMC and PVA where HPMC is pre-adsorbed on the particles. The polymer/surfaceinteraction was investigated through measure-ments of adsorption isotherms in dilute disper-sions. Composite films were then preparedthrough evaporation of the mixed dispersions,yielding filler volume fractions up to 30%. Thestructures of these composite films were studiedwith transmission electron microscopy (TEM)and small-angle neutron scattering (SANS).Finally, their mechanical properties were eval-uated through uniaxial tensile measurements.The comparison of the properties of films with dif-ferent polymer/surface interactions provides in-sights into the mechanisms by which compositefilms may become either softer or harder and brit-tle upon increasing the volume fraction of dis-persed particles.
EXPERIMENTAL
General
All experiments were conducted in distilled anddeionized water. The chemical reagents are all ofanalytical grade and were used without furtherpurification. The solutions and suspensions wereadjusted to pH 9 with NaOH.
Synthesis and Characterization of Silica
The method of synthesis is fully described ear-lier.22 Basically, silica particles were grown fromaqueous silicate solutions neutralized by nitricacid, as described by Iler.23 According to thetransmission electron micrograph (not reportedhere, see Ref. 22), the particle hard sphere diame-ter is 27 nm. This value is consistent with the ra-dius computed from the BET specific surface area(100 m2/g). The hydrodynamic diameter has beenmeasured by dynamic light scattering (MalvernZetasizer 4) and is 30 nm, and the polydispersityindex is 1.07. The hydrodynamic size has also
POLYMER/SILICA INTERACTION AND PROPERTIES 1135
Journal of Polymer Science: Part B: Polymer PhysicsDOI 10.1002/polb

been measured by viscosimetry through the Ein-stein relation:
g=go ¼ 1þ 2:5/ ð2Þ
where / is the volume fraction of silica particles.The latter two methods lead exactly to the samehydrodynamic size (30 nm).
The suspension pH was set to 9 with NaOH,and the salt content was adjusted to 0.003 M withNaNO3.
Polymer Characterization
The polyvinylalcohol (PVA) used in this work waspurchased from Fluka (cat. number 9002-89-5).According to the supplier, this polymer has a mo-lecular weight (MW) of 100 kg/mol and a degreeof purity of 99% and hydrolysis of more than 99%.In the present study, the polymer was used with-out further purification. Viscosity measurementsshowed a MWof 107 kg/mol and a gyration radiusRG ¼ 15 nm. The MW found by gel-permeationchromatography (GPC) is also 85.6 kg/mol, andthe polydispersity index (PI) is 1.25. The overlapconcentration for this polymer is 8 g/L in water.The Flory parameter (v) in semidilute conditionwas measured by osmometry. The experimen-tal value was 0.499, which agrees well with v
¼ 0.494 reported elsewhere.24 The glass-transi-tion temperature is around 75 8C.
The (hydroxypropyl)methylcellulose (HPMC)was purchased from Fluka (cat. number 9004-65-3) with 64% of H, 29% of methoxy, and 7% ofpropylene oxide. The MW measured by viscosime-try is 1,275 kg/mol and RG ¼ 65 nm. The overlapconcentration calculated from RG is estimated tobe 1.9 g/L. The Flory parameter for HPMC is0.46,25 and the PI is 6.12 according to GPC.
The chemical structure of both polymers is pre-sented in Figure 1. For convenience, their mainproperties are grouped together in Table 1.
Adsorption Isotherms
SiO2 dispersions at initial pH 9 were mixed withincreasing concentrations of polymer solutions atsame pHs. Five days were allowed for equilibriumat the end of which the suspensions were centri-fuged and the total organic carbon (TOC) of thesupernatant was measured with a Carbon ana-lyzer instrument (Dohrmann). Only experimentaldata with (initial TOC-equilibrium TOC)/initialTOC > 0.2 were taken as significant. Calibrationcurve was established with known concentrationsof polymer. The standard deviation for three con-secutive measurements was lower than 5%.
Film Formation
Films about 80–100-lm thick were prepared bymixing SiO2 suspensions (/ ¼ 0.02, pH 9) withthe corresponding polymer solution (5% w/w, pH 9)in appropriate proportion to end up with solidmean volume fractions (SiO2/(SiO2þpolymer))ranging from /mean ¼ 0.03 to 0.3 once the solventhas been evaporated. The evaporation was achievedat room temperature and free atmosphere andcompleted within 8–10 h. Before evaporation, thepolymer surface coverage of the SiO2 is wellabove saturation.
Composite films were also prepared with ablend of both polymers. They were prepared intwo steps. First, SiO2 suspensions (pH 9) were
Figure 1. Chemical structure of the polymer unitsfor HPMC and PVA. For HPMC, R ¼ 64% ��H, 29%��CH3, and 7% ��CH2��C(OH)H��CH3.
Table 1. Main Characteristics of the PolymersUsed in this Study
RG
(nm)c*
(g/L) vMW
(kg/mol) PI
HPMC 65 1.9 0.46 1275 6.12PVA 15 8.0 0.494 107 1.25
1136 GUYARD ET AL.
Journal of Polymer Science: Part B: Polymer PhysicsDOI 10.1002/polb

mixed with HPMC polymer solution (pH 9) asdescribed earlier. The HPMC concentration wasadjusted in such a way that the surface coveragereached saturation but still keeping the equilib-rium concentration close to zero. These two condi-tions are found on the isotherm (see later) wherethe data are simultaneously high on the y-axisand close to zero on the x-axis. A few days wereallowed to ensure complete adsorption. Second,the PVA polymer solution (pH 9) was added to theHPMC-SiO2 suspension to finish with the same/mean as mentioned earlier, once evaporation wascompleted.
Electron Microscopy
Transmission electron microscopy (TEM) samplepreparation consisted of immobilizing the films ina resin and slicing the film with an ultramicro-tome. The cross section was fixed onto a coatedcarbon grid. TEM examination was performedusing a Philips instrument operating at 120 kV.
Neutron Scattering
The neutron scattering experiments were per-formed at the ILL institute (Grenoble, France) onthe D11 instrument. The neutron wavelengthwas 6 A (610%). Detector distance was 5 and20 m providing an experimental range of 0.002A�1 < Q < 0.075 A�1, where Q is the modulus ofthe scattering wavevector. The raw data werenormalized and corrected for background with anunfilled polymer film.
Tensile Strength Measurements
Stress–strain measurements of dumbbell-shapedsamples in uniaxial extension were carried out onan Instron testing machine at extensions lowerthan 6%. The nondeformed thickness of eachsample was measured with a micrometer. At leastfive measurements per sample were performedwith a crosshead speed of 5 cm/min in a climateroom (23 8C and 50% humidity). Slipping of sam-ples from the clamps was avoided using adhesiveon the clamps. From values of nominal stress (r)and elongation (k), the modulus (E) was calcu-lated with26:
r ¼ E
3½k� 1
k2� ð3Þ
where k ¼ L/L0, L0, and L being the initial andfinal length of the sample, respectively. E was cal-
culated with eq 3 by the linear regression of atleast 10 data points. The stress at break (rb) andstrain at break (eb ¼ k � 1) were measured, andaverage and standard deviation were calculated.The elongation at break of the neat polymer filmsis 0.15 for HPMC and 4.12 for PVA.
RESULTS
Adsorption Isotherms
In aqueous dispersions, the interaction of poly-mers with particle surfaces can be determinedthrough measurements of adsorption isotherms.The adsorption isotherms of HPMC and PVA onthe nanometric silica particles are presented inFigure 2.
They are strikingly different. The adsorptionisotherm of HPMC has a very sharp rise at low-polymer concentrations, indicating that the mac-romolecules have a high affinity for the silica sur-faces at pH 9. The plateau coverage is 0.3 mg/m2,which corresponds to nearly full coverage. Theadsorption isotherm of PVA shows that the mac-romolecules have a very low affinity for the silicasurfaces at pH 9. The plateau coverage is below0.01 mg/m2, which corresponds to 0.16 macromol-ecule, or 400 monomers per silica particle. This isan extremely low coverage; as a comparison, pol-y(ethylene oxide), which has monomers of thesame size, would bind 20,000 monomers to thesame surface area.27
In film-forming solutions, before evaporation,the concentration of polymers was at least twodecades above the condition for surface satura-tion. Moreover, the polymer concentration wasalso at least four times above the overlap concen-
Figure 2. Adsorption isotherms of HPMC and PVAon silica particles at pH 9.
POLYMER/SILICA INTERACTION AND PROPERTIES 1137
Journal of Polymer Science: Part B: Polymer PhysicsDOI 10.1002/polb

tration, that is the polymers crossed from thesemidiluted to the concentrated regime duringthe process of solvent evaporation.
Observations of Film Structure
TEM was used to investigate the effect of poly-mer type and volume fraction of SiO2 (on a drybasis) on the structure of the composite. For con-venience, only the micrographs of the films atvolume fraction /mean ¼ 0.054 are reported inFigures 3(A–C).
According to Figure 3, important differences ofcomposite structures are observed with the differ-ent polymer matrices. With the HPMC matrix,
the silica particles are mostly dispersed eventhough some doublets are present, while the pri-
mary particles have clearly collapsed into large,spherical, and dense clusters with the PVA and
HPMC-PVA matrices. However, great care mustbe taken when interpreting two-dimension imagesresulting from the projection of a three-dimension
object. This is especially true when high-silicacontents are involved and when the objects ob-
served are smaller than the thickness of theultramicrotome slice. To support TEM observa-
tions, the composite structure at increasing meanvolume fractions (/mean) has been investigatedwith small-angle neutron scattering (SANS). This
technique gives access to the mean structuralproperties of the material in the three dimensions
and is a good complement to electron microscopy.The SANS data for the silica-HPMC compo-
sites made with three volume fractions of silicaare presented in Figure 4. The three spectra havebeen shifted vertically, so that they have the sameintensities at high Q, where the scattering resultsfrom intraparticle interferences only. With thisadjustment, the intensity scattered at low Q bythe dispersions with higher volume fractions isdepressed with respect to that of the dispersionwith the lowest volume fraction. This depressionresults from interparticle interferences; it is aclassical feature of dispersions with repulsiveinteractions. Consequently, the spectra were fit-ted with the calculated scattering curves forrepelling hard spheres.
For monodispersed spherical particles, it iswell-known that the scattered intensity I(Q) canbe expressed as the product of a single particleform factor, P(Q), and an interparticle structurefactor, S(Q):
IðQÞ � PðQÞSðQÞ ð4Þ
The structure factor S(Q) is determined by thepair correlation function of the particles, g(r), and
Figure 3. TEM micrographs of (A) silica particlesembedded in HPMC film matrix, (B) silica particlesembedded in PVA film matrix, (C) HPMC-coated silicaembedded in PVA film matrix. The bar is 500 nm and/mean is 0.054. Films are prepared at pH 9.
1138 GUYARD ET AL.
Journal of Polymer Science: Part B: Polymer PhysicsDOI 10.1002/polb

by the number of particles per unit volume, n :
SðQÞ ¼ 1þ 4pnZ 1
0
½gðrÞ � 1�r2 sinðQrÞQr
dr ð5Þ
Liquid-state theory provides an analytical expres-sion for S(Q), in the case of hard spheres, throughthe Wertheim solution of the Percus-Yevick clo-sure approximation for the Ornstein-Zernikeequation.28 In this calculation, the variables arethe volume fraction / and the hard-sphere parti-cle radius R. The latter has been estimated fromTEM micrographs and BET to be R ¼ 13.5 nm.
Moreover, the single particle form factor P(Q)of monodisperse spheres is:
PðQÞ � 3j1ðQRÞQR
� �2ð6Þ
where ji(QR) is the first-order Bessel function:
J1ðQRÞ ¼ ðsinðQRÞ �QR cosðQRÞÞ=ðQRÞ2 ð7Þ
The intensity calculated in this way does not fitthe experimental spectra, because the silica par-ticles are actually not monodisperse in size.
For polydisperse hard spheres, eq 4 is no lon-ger valid. However, an approximate expression ofthe scattered intensity can still be obtained by
replacing the form factor P(Q) with an averageform factor, Pav(Q), calculated by summing theform factors of all the particles in the distribu-tion. An analytical expression of Pav(Q) exists inthe case of the Schultz distribution (Appendix).The intensity calculated in this way provides agood fit to the spectra of the dispersions withsilica volume fractions / � 0.095 (Fig. 4). How-ever, for / ¼ 0.287, the model cannot fit the ex-perimental data at small angles: the actualdepression of the intensity at small Q is muchless than predicted. This is a clear indication thatthe interparticle correlations are not those ofmonodisperse hard spheres. There are two possi-ble explanations for this: either the particles donot repel (they are partly aggregated) or theirsize distribution is such that small particles canbe located within the spaces that separate largerones.
The silica-PVA films have also been investi-gated by neutron scattering. The spectra are pre-sented in Figure 5. They all show a – 4 slope atlow Q values, followed by a strong correlationpeak positioned at a Q value corresponding to theparticle diameter. As described elsewhere,22,29,30
Figure 4. SANS data for SiO2-HPMC films at /mean
¼ 0.054 (*), /mean ¼ 0.095 (~) and / mean ¼ 0.287.(�).The lines are the theoretical spectra for a liquid ofrepelling hard spheres at the same volume fraction.
Figure 5. SANS data for SiO2-PVA films at / mean
¼ 0.054 (*), / mean ¼ 0.095 (l) and / mean ¼ 0.287(*). The straight line indicates a –4 slope in log–logscales.
POLYMER/SILICA INTERACTION AND PROPERTIES 1139
Journal of Polymer Science: Part B: Polymer PhysicsDOI 10.1002/polb

these features indicate that dense clusters arepresent within the polymer matrix. It has beenconcluded in previous work31 that the primaryparticles aggregate to form dense clusters.
Finally, the influence of preadsorption ofHPMC prior to mixing with the PVA on the finalcomposite structure has been examined. Accord-ing to the results presented in Figure 6, the pres-ence of preadsorbed HPMC on the silica surfaceis not sufficient to prevent the microphase sepa-ration to occur at some stage after mixing withPVA. The SANS data are similar to those ob-served in the silica-PVA composite and typical ofliquid-like finite-size clusters.
A quantitative analysis of the results pre-sented in Figures 5 and 6 can be derived by con-sidering large clusters of silica particles dispersedwithin the polymer matrix. These clusters havetwo length scales: the first one for the primaryparticles inside the clusters and the second onefor the overall size of the clusters. The model canthen be described by eq 831,32:
IðQÞ � PðQÞ½ðN � 1ÞPcðQÞ þ SðQÞ� ð8Þ
where N is the number of particles per cluster,S(Q) is the structure factor related to the localvolume fraction (/local) of the primary particlesinside the clusters, Pc(Q) is the form factor forclusters with a radius Rc. In eq 8, /local is takenas an adjustable parameter in the analytical solu-tion of the Percus-Yevick model to fit the experi-mental data. The other parameters needed tosolve eq 8 are estimated by TEM (the radius ofclusters (Rc) and the average radius of the pri-mary particles (R ¼ 13.5 nm)). An example ofsuch modeling is presented in Figure 7 for theSiO2-HPMC-PVA composite. The best fitted /local
values for the SiO2-PVA and SiO2-HPMC-PVAare reported in Table 2. The data show that thecluster structure in the PVA matrix can be modi-fied by the presence of preadsorbed HPMC. It ap-pears that HPMC makes the clusters more open(lower /local) for a given /mean compared to thesituation with PVA only.
The cluster size can also be computed from theSANS curves shown in Figures 5 and 6 by the
Figure 6. SANS data for SiO2-HPMC-PVA filmsat /mean ¼ 0.054 (*), /mean ¼ 0.095 (l) and /mean
¼ 0.287 (þ). The straight line indicates a –4 slope inlog–log scales.
Figure 7. Fit of SANS data (symbols) for the SiO2-HPMC-PVA film (/mean ¼ 0.095) using eq 8 (full line).The local volume fraction in the clusters (/l) is takenas an adjustable parameter. The concordance betweenthe correlation peaks (fit vs. experimental) is possibleonly when /l is set to 0.50. The data reported in Table 2were found by the same procedure applied to corre-sponding films.
1140 GUYARD ET AL.
Journal of Polymer Science: Part B: Polymer PhysicsDOI 10.1002/polb

method described previously.31 The results arepresented in Table 2. At a given /mean, the clus-ters are larger when formed in the HPMC-PVAsystem, compared with PVA only.
Tensile Properties
When perfectly dispersed and wetted in the ma-trix, filler particles can maximize the possibleattachment points with the polymer, that is theapparent crosslink density of the matrix, and thenmaximize the hardness and modulus.10,18,20,33
The surface interaction with the polymer matrixis critical with these fillers since their high-sur-face area can lead to a very large number ofattachment points with the matrix, and the ten-sile properties are expected to increase with thefiller volume fraction. Such an improvement hasbeen reported elsewhere.15,17,18,34 On the otherhand, studies on silica fillers have also shown amonotonous reduction of strain and stress atbreak.20 In the latter case, a bad wetting of thesurface by the polymer is expected to create voidsin the vicinity of the particles and acts as weakpoints.
A typical stress–strain curve is reproduced foreach composite in Figure 8. The failure modeappears to be ductile for PVA and PVA-HPMCcomposites, while it is fragile for HPMC compos-ite (insert in Fig. 8). This interpretation is sup-ported by SEM images of the stretched ends notshown here (see Ref. 22 for PVA composites).Curves at higher /mean keep the same failuremode but with a shorter elongation at break,except at very high /mean where the failure modebecomes fragile. The modulus and stress at breakwere determined from these stress–strain curves.It is noteworthy that tensile tests can be verysensitive to randomly distributed surface defectsof the film. Accordingly, the measurements whererepeated at least five times (most of the time, upto 10 times) for each sample. According to thestandard deviations reported on the following
figures, the background noise on tensile testscoming from such random defects is not too im-portant.
Having this in mind, the influence of the silicavolume fraction on the tensile modulus of thethree composites has been calculated from eq 3As shown in Figure 9, the modulus follows quitenicely the Guth and Gold relation (eq 1) at low tointermediate /mean. However as /mean reach acritical value, the modulus falls down to valuesthat can be even lower than the unfilled polymer.
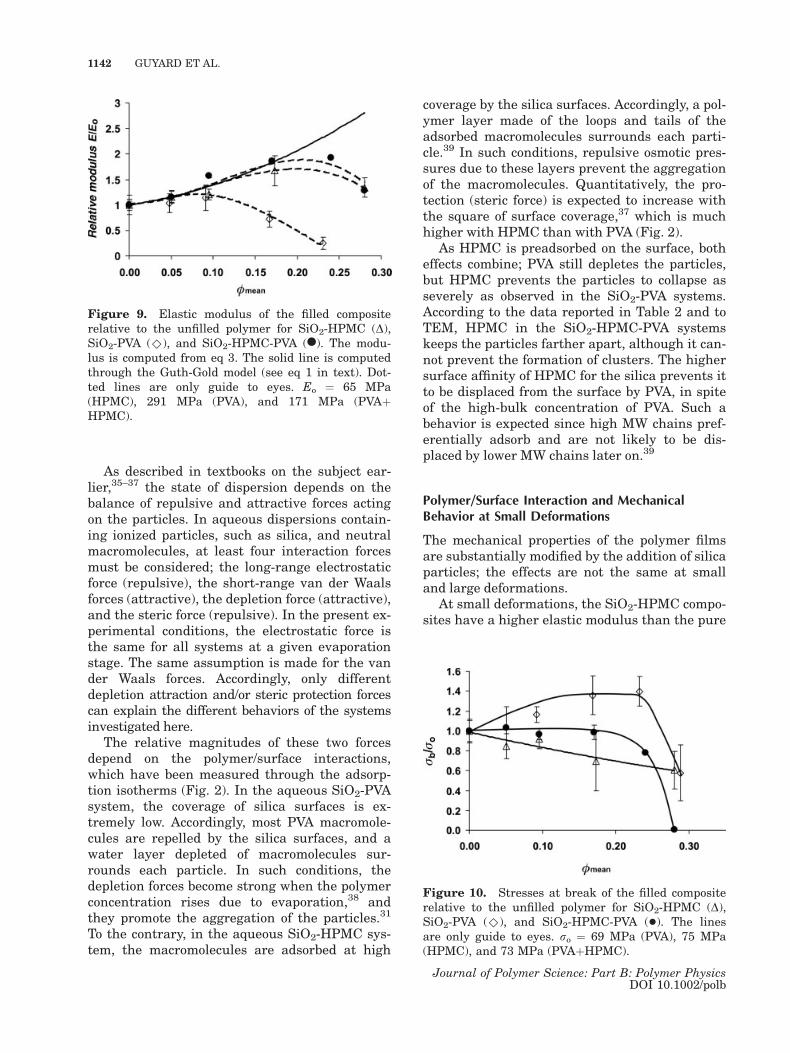
Apparently, there is no direct relationshipbetween the behavior of the stress at break (rb)against /mean and the surface interaction withthe polymers. As reported in Figure 10, rb canincrease (PVA), remain constant (HPMC-PVA) ordecrease (HPMC) with /mean. The relationshipsbetween the surface properties and structuraland tensile properties are debated below.
DISCUSSION
Polymer/Surface Interaction and CompositeStructure
According to SANS and TEM, a phase separationoccurs upon evaporation in the case of aqueousSiO2-PVA dispersions, while the particles remainwell dispersed in the HPMC solutions [Figs.3(A,B)].
Table 2. Local Volume Fraction in Clusters (/local)for Different Mean Volume Fractions of SilicaParticles in the Composite
/mean 0.054 0.095 0.287
SiO2-HPMC No clusters No clusters NDSiO2-PVA 0.50 0.60 0.74SiO2-PVA-HPMC 0.35 0.50 0.60
Figure 8. Typical stress–strain curves of the filledcomposites (/mean ¼ 0.095) used for the determinationof the failure stresses and elongations. SiO2-HPMC(D), SiO2-PVA (^), and SiO2-HPMC-PVA (�). The stressat break for the neat polymers are ro ¼ 69 MPa (PVA),75 MPa (HPMC), and 73 MPa (PVAþHPMC).
POLYMER/SILICA INTERACTION AND PROPERTIES 1141
Journal of Polymer Science: Part B: Polymer PhysicsDOI 10.1002/polb
As described in textbooks on the subject ear-lier,35–37 the state of dispersion depends on thebalance of repulsive and attractive forces actingon the particles. In aqueous dispersions contain-ing ionized particles, such as silica, and neutralmacromolecules, at least four interaction forcesmust be considered; the long-range electrostaticforce (repulsive), the short-range van der Waalsforces (attractive), the depletion force (attractive),and the steric force (repulsive). In the present ex-perimental conditions, the electrostatic force isthe same for all systems at a given evaporationstage. The same assumption is made for the vander Waals forces. Accordingly, only differentdepletion attraction and/or steric protection forcescan explain the different behaviors of the systemsinvestigated here.
The relative magnitudes of these two forcesdepend on the polymer/surface interactions,which have been measured through the adsorp-tion isotherms (Fig. 2). In the aqueous SiO2-PVAsystem, the coverage of silica surfaces is ex-tremely low. Accordingly, most PVA macromole-cules are repelled by the silica surfaces, and awater layer depleted of macromolecules sur-rounds each particle. In such conditions, thedepletion forces become strong when the polymerconcentration rises due to evaporation,38 andthey promote the aggregation of the particles.31
To the contrary, in the aqueous SiO2-HPMC sys-tem, the macromolecules are adsorbed at high
coverage by the silica surfaces. Accordingly, a pol-ymer layer made of the loops and tails of theadsorbed macromolecules surrounds each parti-cle.39 In such conditions, repulsive osmotic pres-sures due to these layers prevent the aggregationof the macromolecules. Quantitatively, the pro-tection (steric force) is expected to increase withthe square of surface coverage,37 which is muchhigher with HPMC than with PVA (Fig. 2).
As HPMC is preadsorbed on the surface, botheffects combine; PVA still depletes the particles,but HPMC prevents the particles to collapse asseverely as observed in the SiO2-PVA systems.According to the data reported in Table 2 and toTEM, HPMC in the SiO2-HPMC-PVA systemskeeps the particles farther apart, although it can-not prevent the formation of clusters. The highersurface affinity of HPMC for the silica prevents itto be displaced from the surface by PVA, in spiteof the high-bulk concentration of PVA. Such abehavior is expected since high MW chains pref-erentially adsorb and are not likely to be dis-placed by lower MW chains later on.39
Polymer/Surface Interaction and MechanicalBehavior at Small Deformations
The mechanical properties of the polymer filmsare substantially modified by the addition of silicaparticles; the effects are not the same at smalland large deformations.
At small deformations, the SiO2-HPMC compo-sites have a higher elastic modulus than the pure
Figure 9. Elastic modulus of the filled compositerelative to the unfilled polymer for SiO2-HPMC (D),SiO2-PVA (^), and SiO2-HPMC-PVA (l). The modu-lus is computed from eq 3. The solid line is computedthrough the Guth-Gold model (see eq 1 in text). Dot-ted lines are only guide to eyes. Eo ¼ 65 MPa(HPMC), 291 MPa (PVA), and 171 MPa (PVAþHPMC).
Figure 10. Stresses at break of the filled compositerelative to the unfilled polymer for SiO2-HPMC (D),SiO2-PVA (^), and SiO2-HPMC-PVA (�). The linesare only guide to eyes. ro ¼ 69 MPa (PVA), 75 MPa(HPMC), and 73 MPa (PVAþHPMC).
1142 GUYARD ET AL.
Journal of Polymer Science: Part B: Polymer PhysicsDOI 10.1002/polb

polymer film. For composites with a silica volumefraction /mean < 0.20, the variation of relativemodulus with /mean follows the Guth and Goldrelation quite nicely (Fig. 8). Accordingly, nonde-formable particles that are well dispersed andhave strong interactions with the polymer doreinforce the glassy polymer matrix, in a way thatmatches the theoretical predictions. For compo-sites with higher silica volume fractions (/mean >0.20), the reinforcement is less than predicted,presumably because the particles are no longerwell dispersed. Indeed, the SANS spectrum of thecomposite made at /mean ¼ 0.287 has a higher in-tensity at low Q than the theoretical spectrum forrepelling particles (Fig. 4).
The SiO2-HPMC-PVA composites show thesame reinforcement of the modulus, despite thefact that the particles are partly aggregated.According to the analysis of SANS spectra (Table2), the silica clusters in the composites made at/mean < 0.20 still contain some polymer (/local �0.50), and therefore all particles in a cluster dointeract with the matrix. Consequently, the rein-forcement of the elastic modulus depends mainlyon proper mechanical interactions between theparticles and the matrix; aggregated particles doprovide the same reinforcement, provided thatthe aggregates are not dense. Conversely, thesmaller reinforcement obtained at the highestsilica volume fraction (/mean ¼ 0.287) resultsfrom the fact that the aggregates are nearlydense (/local ¼ 0.60), and therefore not all par-ticles interact with the matrix.
The SiO2-PVA composites only show a modestreinforcement up to /mean ¼ 0.09. At higher vol-ume fractions, they are softer than the pure poly-mer matrix. Therefore, the addition of silica cre-ates some weak regions in the PVA matrix. Thereare three possible explanations for this softeningas the particle content increases. These possibil-ities are either related to modification of thedegree of crystallinity of the polymer, or relatedto the formation of weak regions in the vicinity ofthe silica/PVA interface.
PVA is a semicrystalline polymer at room tem-perature, with small crystallites immersed in aglassy matrix. The crystallites cause a crosslink-ing of the polymer, and contribute to its mechani-cal strength. Any modification of this crystallinityis therefore likely to change the tensile proper-ties. As reported elsewhere, the crystallinity ofPVA can be significantly deteriorated by the pres-ence of fillers, such as Montmorillonite,34 andalso silica that has been precipitated in situ
through a sol–gel process.40–42 The gradual disap-pearance of polymer crystallites as the filler con-tent increases could lead to degradation of themechanical properties of the polymer matrix. Toexamine this possibility, X-ray diffraction hasbeen conducted on the PVA-SiO2 composites.According to results not shown here for the sakeof simplicity, no significant difference in crystal-linity was found between the neat polymer andthe composites, regardless of silica content. Con-sequently, the reduction of the modulus at high-silica volume fraction (/mean ˜ 0.09) cannot beexplained by arguments related to the crystallin-ity of PVA.
The second explanation would involve thepresence of weak regions in the vicinity of thesilica/PVA interfaces. Indeed, during the forma-tion of PVA films, each silica particle maintainsnear its surface an aqueous layer that isdepleted of PVA macromolecules. At high-watercontents, this is demonstrated by the adsorptionisotherm, which indicates a very low coverage ofthe surfaces by the macromolecules. At low-water content, this depletion is the driving forcefor the aggregation of the particles. At the end ofthe film-formation process, the films are in equi-librium with ambient humidity, and thereforeeach silica surface must retain a layer ofadsorbed water molecules. During strain, theweak PVA/surface interaction and coveragewould make it easy for the macromolecules todesorb from the surface. Consequently, the silica/polymer interfaces are weak regions of the mate-rial, which can cause the elastic modulus to fallbelow that of the neat polymer.
A third possible explanation would involve fail-ure of the silica/silica interfaces within a cluster.Indeed, the depletion of PVA macromoleculesfrom the vicinity of silica surfaces may cause theparticles within a cluster to be either in directcontact, or separated by a water layer only. Theseparticle–particle contacts may be weaker thanthe glassy polymer matrix. As the silica volumefraction is increased above /mean ¼ 0.09, the localsilica volume fraction within a cluster reaches/local ¼ 0.60, and the clusters may be full of suchweak interparticle contacts. In this case, even asmall deformation of the matrix would be enoughto split a cluster apart. Some evidence of suchcluster failure has been presented previously.22 Ifthe clusters are no longer nondeformable fillers,then the Guth and Gold relation does not apply,and the modulus of the composite can fall belowthat of the neat polymer.
POLYMER/SILICA INTERACTION AND PROPERTIES 1143
Journal of Polymer Science: Part B: Polymer PhysicsDOI 10.1002/polb

Polymer/Surface Interaction and MechanicalBehavior at Large Deformations
At large deformations, the effects of the fillers arein opposite directions to those observed at smalldeformations. An inverse dependence between rband / is usually taken as an indication of a poorsurface wetting of the filler particles by the ma-trix. In such a situation, a decohesive failure islikely to occur at the interface. This behaviorcould have been expected in PVA composites, dueto the low surface coverage of silica by PVA. How-ever, just the reverse has been observed: thestress at break increases with silica content inthe case of PVA, and it decreases in the case ofHPMC, which has a high affinity for silica.Hence, other explanations must be sought.
The failure properties in a composite materialare the result of a balance between two effects:the heterogeneous stress distribution within thesample and the disorder that decreases the crackpropagation within the sample. The first contri-bution seems to be dominant for samples havinggood particle dispersion state (i.e., there is highpolymer/silica affinity). The second contributioncould explain the higher rb values measured forpoorly dispersed samples. (i.e., when there is lowaffinity between the polymer chains and the silicasurface).43
In the case of the SiO2-HPMC composites, themagnitude of the stress at break is below that ofthe neat polymer, and it falls regularly when thesilica volume fraction rises. This is caused by adecrease in the maximum extension at break,indicating that cracks propagate more easily.According to the Griffith criteria for crack propa-gation, there are two possible explanations forthis: either the material has become less ductileor the size of defects at the surface of the film hasincreased.
The SiO2-PVA composites show a very differentbehavior: at small silica volume fractions, thestress at break rises slowly with silica content;and then, at the highest volume fraction, it dropswell below that of the pure polymer. The initialrise indicates that the material has become moreductile, making crack propagation more difficult.This is in line with the decrease in the elasticmodulus at intermediate volume fractions. An al-ternative explanation would be similar to themechanism proposed by Witten in the case ofelastomers: as the matrix in the loaded area isstretched thin, the clusters are pushed closer to-gether in the cross-direction and reach the point
where the silica particles get in contact with eachother. From then on, the material resists to fur-ther stretching, which keeps rb high. The suddendrop at the highest volume fractions is presum-ably caused by the presence of very large defectsin the material. Indeed, SANS measurementsindicate that the average cluster sizes havebecome much larger (670 nm) at this volume frac-tion. Moreover, transmission electron micro-graphs22 show that in this condition the clustersspan all over the composite volume and create aninfinite three-dimensional network. In thisextreme situation, the material may not be silica-embedded into a PVA matrix anymore, but ratherPVA-embedded in a silica network, which exp-lains the strong reduction of rb.
Finally, the SiO2-PVA-HPMC composites showan intermediate behavior: at small silica volumefractions, the stress at break remains the same asthat of the polymer mixture; this may be due to acompensation of the effects operating in the purepolymers. At large silica volume fractions, thereis a catastrophic drop in the stress at break,which is clearly caused by the presence of verylarge defects. Indeed, SANS measurements indi-cate that the average cluster sizes have becomequite large (1000 nm) at this volume fraction.
CONCLUSIONS
Polymer/particle interactions have a direct effecton the structures of glassy or semicrystallinecomposites: favorable interactions prevent parti-cle aggregation and lead to a good dispersion ofthe filler particles inside the polymer matrix,whereas poor interactions cause the filler par-ticles to aggregate during the evaporation of thepolymer-filler-solvent mixture.
Polymer/particle interactions also have a directeffect on the mechanical behavior of compositesat small deformations: favorable interactionsincrease the elastic modulus above that of thepure polymer, because well-dispersed, nonde-formable particles reinforce the matrix; con-versely, poor interactions produce weak layersnear the polymer/particle interfaces, which causethe elastic modulus to drop below that of the purepolymer.
On the other hand, there is no direct relationbetween polymer/particle interactions and themechanical behavior of the composites at largedeformations. Composites with poor interactionscan have a stress at break that exceeds that of
1144 GUYARD ET AL.
Journal of Polymer Science: Part B: Polymer PhysicsDOI 10.1002/polb

the matrix, and conversely. The relations areprobably indirect, as the polymer/particle interac-tions determine the structures of the composites,and the way in which these structures changeupon deformation.
The authors would like to acknowledge Peter Lindnerand Joanes Zipfel (Institut Laue-Langevin, Grenoble)for technical support on the D11 instrument andAgnes Lejeune from UQTR for supplying the TEMmicrographs. NanoQuebec is acknowledged for finan-cial support. Finally, J.-P. Boisvert expresses its grati-tude to Reviewer #2 for constructive comments.
APPENDIX
The analytical equation for the weighted aver-age P(Q)S is given by44,45:
PðQÞs � R6ðZþ 1Þ�6aZþ7GðQÞ ðA1Þ
where
a¼ Zþ 1
QR;
GðQÞ ¼ a�ðZþ1Þ � ð4þ a2Þ�ðZþ1=2Þ
� cos½ðZþ 1Þ arctan ð2=aÞ� þ ðZþ 2ÞðZþ 1Þ� fa�ðZþ3Þ þ ð4þ a2Þ�ðZþ3Þ=2
� cos ½ðZþ 3Þ arctan ð2=aÞ�g � 2ðzþ 1Þ� ð4þ a2Þ�ðZþ2Þ=2 sin½ðZþ 2Þ arctan ð2=aÞ�
REFERENCES AND NOTES
1. Donnet, J. B.; Voet A., Carbon Black Physics,Chemistry and Elastomer Reinforcement; MarcelDekker, New York, 1976.
2. Leblanc, J. L. Prog Polym Sci 2002, 27, 627–687.3. Boonstra, B. B.; Cochrane, H.; Dannenberg, E. M.
Rubber Chem Tech 1976, 48, 558–576.4. Voet, A.; Morawski, J. C.; Donnet, J. B.; Rubber
Chem Tech 1977, 50, 342–355.5. Kelly, A. A Concise Encyclopedia of Composite
Materials, New York, 1994.6. Guth, E.; Gold, O. Phys Rev 1938, 53, 322–328.7. Christensen, R. M. Mechanics of Composite Mate-
rials; Wiley: New York, 1979.8. Chen, H.-S.; Acrivos, A. Int J Solids Struct 1978,
14, 331.9. Wu, C. L.; Zhang, M. Q.; Rong, M. Z.; Friedrich,
K. Compos Sci Technol 2002, 62, 1327–1340.
10. Westerman, S.; Kreitschmann, M.; Pyckhout-Hintzen, W.; Richter, D. Macromolecules 1999, 32,5793–5802.
11. Bokobza, L.; Garbaud, G.; Mark, J. E. ChemMater 2002, 14, 162–167.
12. Berthelot, J. M. Materiaux composites, Comporte-ment mecanique et analyse des structures, 3e edi-tion,Editions Tec & Doc 1999.
13. Berriot, J.; Montes, H.; Martin, F.; Mauger, M.;Pyckhout-Hintzen, W.; Meier, G.; Frielinghaus, H.Polymer 2003, 44, 4909–4919.
14. Nakamura, Y.; Okabe, S.; Yoshimoto, N.; Iida, T.Polym Polym Compos 1998, 6, 407–414.
15. Jianfen, J.; Salovey, R. J Mater Sci 1999, 34,4719–4726.
16. McCarthy, D. W.; Mark, J. E.; Schaeffer, D. W.J Polym Sci 1998, 36, 1167–1189.
17. Deng, Q.; Hahn, J. R.; Stasser, J.; Preston, J. D.;Burns, G. T. Rubber Chem Technol 2000, 73, 647–665.
18. Osman, M. A.; Atallah, A.; Muller, M.; Suter, U.W. Polymer 2000, 42, 6545–6556.
19. Donnet, J. B. Compos Sci Technol 2003, 63, 1085–1088.
20. Nunes, R. C. R.; Fonseca, J. L. C.; Pereira, M. R.Polym Test 2000, 19, 93–103.
21. Nakamura, Y.; Okabe, S.; Iida, T.; Nagata, K.;Nigo, H. Polym Polym Compos 1999, 7, 33–40.
22. Boisvert, J.-P.; Persello, J.; Guyard, A. J PolymSci 2003, 41, 3127–3138.
23. Iler, R. K. The Chemistry of Silica;Wiley, NewYork, 1979.
24. Lewandowska, K.; Staszewska, D. U.; Bohda-necky, M. Eur Polym J 2001, 37, 25–32.
25. Polymer Data Handbook, Oxford University Press,1999.
26. Ferry, J. D. Viscosielastic Properties of Polymers;Wiley: New York, 1970.
27. Lafuma, F.; Wong, K.; Cabane, B. J Colloid Inter-face Sci 1991, 143, 9–21.
28. Ornstein ???29. Pontoni, D.; Narayanan, T.; Petit, J.-M.; Grubel,
G.; Beysens, D. Phys Rev Let 2003, 80, 188301-1–4.
30. Pontoni, D.; Narayanan, T. J Appl Cryst 2003, 36,787–790.
31. Persello, J.; Boisvert, J.-P.; Guyard, A.; Cabane,B. J Phys Chem-B 2004, 108, 9678.
32. Wong, K.; Lixon, P.; Lafuma, F.; Lindner, P.;Aguerre Charriol, O.; Cabane, B. J Colloid Inter-face Sci 1992, 153, 55–68.
33. Bokobza, L. Macromol Symp 2001, 171, 163–170.34. Strawhecker, K. E.; Manias, E. Chem Mat 2000,
13, 2943.35. Russel, W. B.; Saville, D. A.; Schowalter, W. R. In
Colloidal Dispersions, Cambridge University Press:Cambridge, UK, 1989; Ch. 4–5.
36. Evans, D. F.; Wennerstrom, H. The Colloidal Do-main, 2nd ed.; Wiley-VCH: New York, 1999.
POLYMER/SILICA INTERACTION AND PROPERTIES 1145
Journal of Polymer Science: Part B: Polymer PhysicsDOI 10.1002/polb

37. Israelachvili, J. Intermolecular and Surfaces Forces,2nd ed.; Academic Press: London, UK, 1991;Ch. 11.
38. Haw, M. D.; Gillie, M.; Poon, W. C. K. Langmuir2002, 18, 1626.
39. Fleer, G. J.; Cohen Stuart, M. A.; Scheutjens, J. M.;Cosgrove, T.; Vincent, B. Polymers at Interfaces;Chapman &Hall: London, 1993.
40. Suzuki, F.; Nakane, K.; Piao, J.-S. J Mat Sci1996, 31, 1335–1340.
41. Nakane, K.; Yamashita, T.; Iwakura, K.; Suzuki,F. J Appl Polym Sci 1999, 74, 133–138.
42. Kotoky, T.; Dolui, S. K.; J Sol–Gel Sci Technol2004, 29, 107–114.
43. This paragraph has been quoted from reviewer’s#2 comments.
44. Schultz, G. V. Z Phys Chem B 1935, 30, 379–384.
45. Pontoni, D.; Finet, S.; Narayanan, T.; Rennie, A. R.J Chem Phys 2003, 119, 6157–6165.
1146 GUYARD ET AL.
Journal of Polymer Science: Part B: Polymer PhysicsDOI 10.1002/polb
Copyright © 2022 FDOKUMEN