
Structure-property relationships of rubber/silica ...
178
Structure-property relationships of rubber/silica nanocomposites via sol-gel reaction Citation for published version (APA): Miloskovska, E. (2013). Structure-property relationships of rubber/silica nanocomposites via sol-gel reaction. Technische Universiteit Eindhoven. https://doi.org/10.6100/IR739216 DOI: 10.6100/IR739216 Document status and date: Published: 01/01/2013 Document Version: Publisher’s PDF, also known as Version of Record (includes final page, issue and volume numbers) Please check the document version of this publication: • A submitted manuscript is the version of the article upon submission and before peer-review. There can be important differences between the submitted version and the official published version of record. People interested in the research are advised to contact the author for the final version of the publication, or visit the DOI to the publisher's website. • The final author version and the galley proof are versions of the publication after peer review. • The final published version features the final layout of the paper including the volume, issue and page numbers. Link to publication General rights Copyright and moral rights for the publications made accessible in the public portal are retained by the authors and/or other copyright owners and it is a condition of accessing publications that users recognise and abide by the legal requirements associated with these rights. • Users may download and print one copy of any publication from the public portal for the purpose of private study or research. • You may not further distribute the material or use it for any profit-making activity or commercial gain • You may freely distribute the URL identifying the publication in the public portal. If the publication is distributed under the terms of Article 25fa of the Dutch Copyright Act, indicated by the “Taverne” license above, please follow below link for the End User Agreement: www.tue.nl/taverne Take down policy If you believe that this document breaches copyright please contact us at: [email protected] providing details and we will investigate your claim. Download date: 30. May. 2022
-
Upload
khangminh22 -
Category
Documents
-
view
1 -
download
0
Transcript of Structure-property relationships of rubber/silica ...

Structure-property relationships of rubber/silicananocomposites via sol-gel reactionCitation for published version (APA):Miloskovska, E. (2013). Structure-property relationships of rubber/silica nanocomposites via sol-gel reaction.Technische Universiteit Eindhoven. https://doi.org/10.6100/IR739216
DOI:10.6100/IR739216
Document status and date:Published: 01/01/2013
Document Version:Publisher’s PDF, also known as Version of Record (includes final page, issue and volume numbers)
Please check the document version of this publication:
• A submitted manuscript is the version of the article upon submission and before peer-review. There can beimportant differences between the submitted version and the official published version of record. Peopleinterested in the research are advised to contact the author for the final version of the publication, or visit theDOI to the publisher's website.• The final author version and the galley proof are versions of the publication after peer review.• The final published version features the final layout of the paper including the volume, issue and pagenumbers.Link to publication
General rightsCopyright and moral rights for the publications made accessible in the public portal are retained by the authors and/or other copyright ownersand it is a condition of accessing publications that users recognise and abide by the legal requirements associated with these rights.
• Users may download and print one copy of any publication from the public portal for the purpose of private study or research. • You may not further distribute the material or use it for any profit-making activity or commercial gain • You may freely distribute the URL identifying the publication in the public portal.
If the publication is distributed under the terms of Article 25fa of the Dutch Copyright Act, indicated by the “Taverne” license above, pleasefollow below link for the End User Agreement:www.tue.nl/taverne
Take down policyIf you believe that this document breaches copyright please contact us at:[email protected] details and we will investigate your claim.
Download date: 30. May. 2022

Structure-property relationships of rubber/silica
nanocomposites via sol-gel reaction
PROEFSCHRIFT
ter verkrijging van de graad van doctor aan de
Technische Universiteit Eindhoven, op gezag van de
rector magnificus, prof.dr.ir. C.J. van Duijn, voor een
commissie aangewezen door het College voor
Promoties in het openbaar te verdedigen
op woensdag 29 mei 2013 om 16.00 uur
door
Elena Miloskovska
geboren te Skopje, Macedonië

Dit proefschrift is goedgekeurd door de promotor:
prof.dr. G. de With
Copromotoren:
dr. D.G. Hristova-Bogaerds
en
dr.ir. M. van Duin
A catalogue record is available from the Eindhoven University of Technology
Library
ISBN: 978-90-386-3278-0
Copyright2012 by Elena Miloskovska
The Research described in this thesis is part of the Research Program of the Dutch
Polymer Institute ((DPI), Eindhoven, the Netherlands, project #652

Za mojata Majka i Baba…

Table of contents
Contents
Summary
i
Chapter 1 Introduction
1.1. Polymers 2
1.1.1. Natural rubber (NR) 4 1.1.2. Ethylene-propylene copolymer (EPM) and
ethylene-propylene-diene terpolymer (EPDM)
6
1.1.3. Styrene-butadiene rubber (SBR) 7
1.2. Fillers in rubber technology 9
1.2.1. Silica as reinforcing filler 10
1.3. Conventional rubber/silica nanocomposites 13
1.3.1. In-situ rubber/silica nanocomposites via sol-gel reaction 15
1.3.2. Sol-gel chemistry for silica formation 16
1.4. Mechanical properties of rubber/silica nanocomposites 18
1.4.1. Static mechanical properties of rubber 18
1.4.2. Dynamic mechanical properties of rubber 20
1.5. Aim of thesis 22
1.6. Outline of thesis 22
1.7. References
25
Chapter 2 Influence of reaction parameters on structure of in-situ rubber/silica
nanocomposites synthesized via sol-gel reaction
2.1. Introduction 29
2.2. Experimental section 31
2.2.1. Materials 31
2.2.2. Characterization 35
2.3 Results and Discussion 35
2.3.1. Effect of TEOS amount on in-situ NR nanocomposites 35
2.3.2. Effect of reaction time on in-situ NR nanocomposite structure 38
2.3.3. Silica gradient in in-situ NR nanocomposites 41
2.3.4. Effect of rubber matrix on in-situ nanocomposite structure 44
2.3.5. Bound rubber in NR, EPDM and SBR in-situ nanocomposites 48
2.3.5.1. Introduction of bound rubber 48
2.3.5.2. Bound rubber in in-situ NR nanocomposites 50
2.3.5.3. Effect of rubber type on bound rubber content 51
2.3.5.4. Bound rubber content of in-situ vs. Conventional nanocomposites 52
2.4. Conclusions 54
2.5. References
55
Chapter 3 Growth mechanism of in-situ silica and kinetics of sol-gel reaction in a
rubber matrix as followed by real-time SAXS and Solid-State NMR
3.1. Introduction 58
3.2. Experimental section 60
3.2.1. Materials 60
3.2.2. Characterization 60
3.3 Results and Discussion 65
3.3.1. Chemistry of silica formation via sol-gel reaction 65
3.3.2. Mechanism of in-situ silica formation in rubber via sol-gel reaction 68

Table of contents
3.3.3. Kinetics of sol-gel reaction as determined by time-resolved solid-
state NMR
75
3.3.4.
Silica formation in the rubber matrix via the sol-gel reaction as
followed with real-time SAXS
83
3.4. Conclusions 89
3.5. References
90
Chapter 4 The structure of silica nano-particles synthesized via sol-gel reaction in
relation to the mechanical properties of the in-situ nanocomposites
4.1. Introduction 93
4.2. Experimental section 96
4.2.1. Materials 96
4.2.2. Characterization 99
4.3 Results and Discussion 103
4.3.1. Chemical structure of in-situ silica particles with FTIR 103
4.3.2. Solid-state NMR for silica structure determination 105
4.3.3. Mapping in-situ silica surface by X-ray photoelectron spectroscopy
(XPS)
111
4.3.4. Time-resolved thermal treatment of in-situ silica with FTIR-TGA-
MS
113
4.3.5. Payne effect and reinforcing mechanism of in-situ silica
nanocomposites
119
4.3.5.1. Comparison of in-situ and conventional EPDM nanocomposite 119
4.3.5.2. Effect of rubber type and silica loading on in-situ nanocomposites 123
4.4. Conclusions 126
4.5. References
127
Chapter 5 Preparation of in-situ nanocomposites via sol-gel reaction in rubber
matrix under dynamic conditions: one-step reactive extrusion
5.1. Introduction 130
5.2. Experimental section 131
5.2.1. Materials 131
5.2.2. Characterization 137
5.3 Results and Discussion 138
5.3.1. Comparison of in-situ nanocomposites prepared under dynamic
(batch mixer) and static conditions
138
5.3.2. In-situ nanocomposites prepared in dynamic conditions via batch
mixing vs. conventional nanocomposites
144
5.3.3. Effect of amount of water on the sol-gel reaction during dynamic
mixing
147
5.3.4. Reactive extrusion 148
5.3.4.1. Structure of the extruded in-situ nanocomposite and the effect of
mixing
150
5.4. Conclusions 155
5.5. References
157
Chapter 6 Technology assessment
6.1. Surface chemistry of the in-situ silica particles 159
6.1.2. Future outlook and optimization 159
6.2. Sol-gel reaction in rubber via reactive extrusion 160

Table of contents
6.2.1. Future outlook and optimization 161
6.2.2. Side-feeding extruder 161
6.3. References 164
Acknowledgments
Curriculum vitae
List of publications

Summary
i
Summary
Up to date conventional mixing of rubber with silica is a time and energy
consuming process where silica aggregates are dispersed throughout the rubber
matrix. A way to avoid silica aggregation and to improve dispersion is to grow
silica particles directly into the rubber matrix using the sol-gel chemistry. This idea
triggered a PhD project where the main goal is to gain a clear understanding about
the structure, the formation mechanism and the resulting properties of in-situ
prepared rubber/silica nanocomposites. The gained knowledge will be then used to
obtain in-situ nanocomposites via a reactive extrusion process.
In Chapter 1 of the thesis the current state of art in the field of nanocomposites is
given, with emphasis on the preparation and properties of nanocomposites
produced via sol-gel reaction. Outlined are also the objectives of the study to
provide deep understanding of the mechanism and the kinetics of the sol-gel
reaction in rubber matrix and to correlate the structure of the in-situ synthesized
silica to the properties of the nanocomposites.
Rubber/silica nanocomposites were prepared via sol-gel reaction, using TEOS as
precursor and hexylamine as catalyst. The effect of different reaction
parameters-amount of precursor, reaction time, temperature and type of rubber on
the morphology of the prepared in-situ nanocomposites (loading, size and
dispersion of silica) is shown in Chapter 2. The TEM images of the
nanocomposites indicated excellent dispersion of the silica particles. The amount of
the bound rubber was evaluated and correlated to the rubber-silica interaction.
The kinetics and the mechanism of the sol-gel reaction in a rubber matrix were
studied in detail by performing time-resolved solid-state NMR and SAXS
experiments. The results presented in Chapter 3 indicate that the sol-gel process in
rubber matrix adopts the emulsification process behaviour, where hexylamine, used
as catalyst, behaves as surfactant forming inverse micelles with enclosed water in
TEOS-swollen rubber matrix. The growth of the silica particles with time was
probed via SAXS and a comparison is made between the growth rate of different
type of rubbers and at different temperatures.

ii
The structural investigation of the in-situ synthesized silica particles, presented in
Chapter 4, was performed using solid state NMR and MS-TGA-IR. For the first
time we show that via the sol-gel process so called ‘hairy’ silica particles are
formed, with hexylamine and remnant ethoxy groups residing predominantly on the
silica surface. This “hairy” silica surface resulted in a more hydrophobic nature of
the silica particles and thus to improved rubber-silica interaction.
In Chapter 5 the properties of the in-situ nanocomposites produced in both-static
and dynamic conditions (batch mixer) are discussed and compared to those of the
conventionally prepared rubber/silica nanocomposites. The RPA measurements of
the in-situ nanocomposites indicated a strong reinforcement effect, at much lower
silica loadings in comparison to the conventional rubber/silica nanocomposites. We
explain this strong reinforcement in the in-situ prepared rubber/silica
nanocomposites with the improved rubber-silica interactions (caused by the
specific surface topology of the in-situ silica) and by the presence of trapped
entanglements and bound rubber. The in-situ rubber/silica nanocomposites were
successfully produced also via reactive extrusion, which was one of the targets of
the thesis. As shown in Chapter 5, the nanocomposite obtained in this way with
maximum loading of 3.2 wt% silica, possessed a uniform dispersion of the silica
particles and very good properties. Chapter 6 contains the technological assessment
of this study. The importance and the possibilities for industrial application of the
sol-gel process to obtain rubber-silica nanocomposites with excellent properties are
discussed.

Introduction
Silica is used as reinforcing filler in the rubber industry for preparation of the
rubber/silica nanocomposites. The preparation of these materials requires several
mixing steps to disperse the silica aggregates throughout the rubber matrix. An
alternative approach is the sol-gel process for silica formation. The sol-gel reaction
allows growth of the silica particles directly into the rubber matrix, possibly with a
different surface chemistry. It is believed to result in improved rubber-silica
interactions and thus improved mechanical properties of the obtained rubber/silica
nanocomposites.

Chapter 1
2
1.1. Polymers
Polymers are long-chain molecules composed of chemically linked building
blocks, called monomers. Polymers show visco-elastic properties and have the
possibility to exhibit rubbery-like behaviour above their glass transition
temperature (Tg). The Tg is determined by the chemical structure of the polymer,
chain flexibility and the inter-chain interactions. Based on their chemical structure
and thermal behaviour polymers can be divided into three main classes, namely
thermoplastics (amorphous and crystalline), rubbers and thermosets. The difference
in the mechanical properties with temperature of these materials is shown in
Figure 1.1.
Figure 1.1. Thermo-mechanical curves behaviour of amorphous, crystalline and rubber
(crosslinked and non-crosslinked) materials.
It is noted that thermosets are not included in Figure 1.1. The reason is that
they possess very high Tg, close or in some cases equal to the degradation
temperature thus resulting in very small changes of the mechanical properties with
temperature. The thermal behaviour of polymers is divided into three regions, i.e.
the glassy region below Tg, the rubbery region above Tg and the flow region at
higher temperatures. Each of these regions is related to specific types of molecular
motions of the polymer chain as the temperature increases and is characteristic for
Log E
[MP
a]
Rubber (R1)
Temperature
4
2
3
1
0
Tg(R1) Tg (AP) Tm (CP)
semi-crystalline polymer (CP)
amorphous polymer (AP)
Tg(CP)
cross-linked rubber (R)
Tg(R)

Chapter 1
3
each class of polymers depending on their chemical structure, thus the Tg of the
material. Above Tg amorphous polymers are in the ‘rubbery’ state with usually Tg
being their limiting application temperature, while crystalline polymers above Tg
are in the so-called ‘flexible-crystalline’ state with the melting temperature (Tm) as
their limiting application temperature.1,2 In general, rubbers have flexible, long
chain molecules and glass transition temperatures (Tg) below room temperature.
They can exist in two states, as non-crosslinked and crosslinked. In Figure 1 the
non-crosslinked rubber shortly after reaching Tg starts to flow, while the
crosslinked rubber due to the presence of chemical bonds has limited possibility to
flow and it maintains a rubbery plateau at higher temperatures until it eventually
degrades. Interestingly, the modulus of the crosslinked rubber slightly increases
with temperature which can be explained by the following equation:
(1.1)
where, - density of rubber, R - gas constant, T - temperature and Mc - the
molecular weight between crosslinks.
Cross-linking is a method during which chemical bonds are formed between
the polymer chains. The two main cross-linking techniques for rubber are sulphur
vulcanization and peroxide curing.3,4 Charles Goodyear discovered the sulphur
vulcanization in 1839 opening many new applications for rubber materials. It is
believed that he discovered the effect by accidental dropping a mixture of rubber
and sulphur on a hot stove where instead of melting, the mixture turned into a hard
vulcanized material. Sulphur vulcanization is limited to rubbers with un-saturation,
while the peroxide method can be performed even on rubbers that do not possess
un-saturations. Rubber crosslinking results in the formation of a 3D network of
polymer chains connected by sulphur bridges in sulphur vulcanization and by C-C
bonds in peroxide curing.1,5
According to the ASTM D1566 standards rubber is defined as a material that
can be extended to twice its original length (2 L0) and when released it can recover
to less than 1.5 L0 within 1 minute at room temperature. It is crosslinked and cannot

Chapter 1
4
be dissolved in a boiling solvent, but can swell. In the following chapters of this
thesis the term rubber will be used for all non-crosslinked polymers (natural rubber
(NR), ethylene-propylene diene monomer (EPDM) and styrene-butadiene rubber
(SBR)) that fulfil the requirements to be rubber (low Tg, amorphous, flexible
chains). Only when these polymers are crosslinked the term crosslinked rubber will
be additionally used to emphasize that the rubber is crosslinked. Therefore, in this
thesis the rubber is a polymer which has only physical cross-links between the
chains that upon stress begin to disentangle leading to a permanent deformation
with no possibility, upon release of stress, to retract back to its initial state, thus
limited elastic properties. It has no solvent resistance and exhibits very low
mechanical properties. The cross-linked rubber has permanent chemical cross-links
between the chains that gives the material dimensional stability and higher
stiffness. The crosslinked rubber posses elastic properties which means that it can
be stretched substantially beyond its original length and retract rapidly to its almost
original dimensions.4
In general both, natural and synthetic sources can be used to produce rubbers.
The first material known as rubber is obtained in the form of latex from the tree
Hevea Braziliensis and is called natural rubber (NR). The NR latex is known since
the year 1500, when it was used in the Inca civilization for making water proofed
clothing, shoe soles and rubber balls for a ball game. The word rubber comes from
the ability of this material to rub off pencil marks from paper as observed by
Priestley in 1770.6 The first attempts for the production of synthetic rubber on
commercial scale (methyl rubber) were initiated by Germany, due to lack of NR
during the First World War. During the Second World War, due to shortage of NR,
two synthetic types of rubber butadiene and styrene-butadiene rubber were
produced in USA and Germany. In the 1950/60’s other synthetic rubbers were
developed, with EPDM becoming the most important non-tire rubber.3
1.1.1. Natural rubber (NR)
NR is collected from a tree in the form of latex, an emulsion of small rubber

Chapter 1
5
particles with sizes in the range of 0.1 - 1 m in a watery liquid. The rubber content
in the latex is 30 - 38 %. The rubber particles are stabilized with proteins residing
on their surface and preventing them from coagulating. The chemical structure of
NR consists of isoprene units which arrangement results in two different types of
natural rubber, viz. the flexible cis - polyisoprene (Figure 1.2) and the more rigid
trans - polyisoprene. The first one is the widely used natural rubber, the later is
called gutta-percha and is hard material with a more thermoplastic behaviour.6,7
Figure 1.2. Chemical structure of isoprene in cis-configuration as building block in NR.
NR is available in many commercial grades, depending on the polymer viscosity
and the product purity. The non-rubber content (proteins, dust and other organic
components) can vary and might significantly influence the price. Since the NR has
tendency to harden upon storage, hydroxylamine salts are added for stabilization of
the viscosity. Crosslinked NR has excellent mechanical and elastic properties
which originate from the possibility to crystallize upon deformation and to obtain a
high crosslink density upon vulcanization. The strain-induced crystallization of the
NR is unique. It gives extra strength upon mechanical loading (Figure 1.3) and
upon release of the stress, the NR snaps back to its initial state causing the formed
crystallites during the deformation to disappear.

Chapter 1
6
Figure 1.3. Tensile properties of NR ( ) are superior to most synthetic rubbers ( ) due to
the strain-induced crystallization (low hysteresis) of NR.
The high network density gives good rebound properties and low hysteresis. NR
has poor oil resistance and it is sensitive to ozone oxygen and UV radiation, due to
its large amount of unsaturated bonds in the main chain. It has a good abrasion
resistance that allows applications in slurry pump liners, impellers and tank linings
and due to its good dynamic mechanical properties it is used in tires, rubber springs
and vibration mounts. The low Tg (- 65 C) provides good low temperature
elasticity.2,3
1.1.2. Ethylene-propylene copolymer (EPM) and ethylene-propylene-diene
terpolymer (EPDM)
EPM is a copolymer of ethylene and propylene and can be cross-linked only
by means of peroxides, due to the absence of unsaturation. On the other hand,
EPDM (Figure 1.4) is a ter-polymer of ethylene and propylene with a diene
monomer that provides residual unsaturation in the pendant side groups and allows
crosslinking via sulphur vulcanization.

Chapter 1
7
Figure 1.4. Chemical structure of ethylene-propylene diene rubber (EPDM).
The properties of EPDM strongly depends on several characteristics such as ratio
of the ethylene and propylene monomers, the distribution of these monomers in the
main chain and the amount and type of the diene monomer.8 These structural
parameters are determined by the catalyst structure and the polymerization
conditions. The ethylene/propylene ratio in commercial products generally ranges
from 45:55 to 80:20 (w/w). At higher propylene contents the thermal and oxidative
stability of the polymer are negatively affected. At higher ethylene contents the
polymer becomes too crystalline and loses its rubbery properties. Some crystallinity
is beneficial because it gives EPDM a higher strength making the polymer easier to
handle in the un-vulcanized state and better tensile properties in the crosslinked
state. EPDM is synthesized mostly via solution polymerization using Ziegler-Natta
catalysts which contain mainly vanadium compounds. It is a commercially
attractive product, because it displays excellent heat, oxygen, and ozone resistance
due to the low level of un-saturation (diene monomer content is only
4 - 8% present). On the other hand, the low content of un-saturation introduces
certain disadvantages, such as a low crosslink density and slow vulcanization.3,8
EPDM is mostly used for automotive sealing systems, roof membrane linings and
extruded windows gaskets. It has an excellent electrical resistance and is used for
the production of high voltage cable covers.2
1.1.3. Styrene-butadiene rubber (SBR)
SBR was the most important rubber in the Second World War, when it was
produced on a large scale in USA and Germany for the purpose of replacing NR in

Chapter 1
8
tires. The possibility to vary the structure of SBR by changing the styrene and
butadiene content during polymerization, offers great opportunities to construct tire
treads with very good properties.3 SBR is a copolymer of styrene and butadiene
(Figure 1.5).
Figure 1.5. Chemical structure of styrene-butadiene rubber (SBR).
The butadiene monomer provides flexibility, rubbery properties and unsaturation
for the vulcanization reaction, while the styrene reduces the damping. Different
SBR grades are obtained not only by varying the styrene/butadiene ratio, but also
by the way the butadiene monomer (cis, trans or vinyl) configuration is
incorporated in the chain. Thus, butadiene in the cis-configuration results in more
flexible SBR, while the trans and vinyl configurations result in SBR grades with
lower flexibility. The polymerization can proceed via emulsion and solution routes,
resulting in two general types of SBR (emulsion and solution SBR). The emulsion
polymerization involves emulsifiers, organic peroxides as initiator, stabilizers and
coagulants in order to allow formation of less branched SBR. In emulsion
polymerization the butadiene and styrene have equal tendency to add to the
growing chain, forming highly random copolymers. The other polymerization route
for SBR production is in solution using lithium-alkyls as catalysts in non-polar
solvents. The SBR obtained via solution polymerization has a more blocky

Chapter 1
9
copolymer structure with butadiene and styrene sequences randomly distributed
throughout the chain. The reason for the block-like structure is the higher tendency
of butadiene to add to the growing chain and it can even form a homopolymer
instead of copolymer, if not controlled. Different polar substances like ethers and
amines are added to promote more randomized polymerization.
Despite the efforts the structure of solution SBR always resembles more to a
blocky copolymer. SBR exhibits a poorer crosslink network when compared to NR
and as a result shows lower tensile strength and elasticity. SBR does not undergo
strain-induced crystallization and requires much higher filler loadings for achieving
good mechanical properties. In general, solution SBR is the cleaner grade with a
narrower molecular weight distribution and less branching than emulsion SBR and
is usually the preferred grade for the tire industry. It improves the skid resistance
because of its poorer network and provides better heat and ozone resistance when
compared to NR because of less un-saturation in the main chain.3,6 Other
applications of SBR are in the area of belting, molded rubber goods, cable
insulation and sealing’s.
1.2. Fillers in rubber technology
The crosslinked rubber materials have low mechanical properties and addition
of fillers is necessary for achieving certain degree of reinforcement that leads to
significant improvement of the mechanical properties. The reinforcement depends
to a large extent on the polymer properties, filler characteristics (particle size or
specific surface area, structure and surface activity), filler loading and processing
conditions.9-11 In general, there are two types of fillers, non-active and active. This
classification normally relates to the influence of the filler on the compound
viscosity and on the mechanical properties of the final product, such as tensile
strength, abrasion, tear resistance, hardness and elongation at break. The improved
mechanical properties of the rubber nanocomposites are not solely based on the
incorporation of hard fillers but also on the interactions developed between the
filler and the matrix. These interactions can vary from strong (chemical bonds) to

Chapter 1
10
intermediate (hydrogen bonding, dipole interactions) to weak (van der Waals).
Well known active fillers, such as carbon black4,12 and silica13-15 have a greater
influence on the physical properties of a rubber material than inactive fillers, like
clay or calcium carbonate.16
Moreover, the active fillers depending on their particle size can have
reinforcing (0.01 - 0.1 m), semi-reinforcing (0.1 - 1 m) and non-reinforcing
(1 - 10 m) effect on the rubber material. The particle size is important because it
represents the area available for interaction between the rubber and the filler, thus
smaller size particles will have larger surface available for interacting with the
rubber. Carbon black is one of the most exploited fillers in the rubber industry for
more than hundred years already, particularly used for reinforcement of tires. In
general, based on the production process we can distinguish three types of carbon
black: furnace, channel and thermal, respectively. The furnace carbon black is by
far the most important type, participating with 95 % of the total amount of carbon
black used in the rubber industry for production of tires. Different grades of carbon
black are produced varying mainly in the size of the primary particle. Carbon black
is widely used as black pigment for toners, as filler that provides electric
conductivity and almost 70 % of the total amount of carbon black is used in the tire
industry. The application of the carbon black in the tire industry is predetermined
by the reinforcing effect imparted to the rubber matrix, which in turn is strongly
determined by the size of the primary particle where smaller size primary particles
lead to higher reinforcement. 3,17,32
1.2.1. Silica as reinforcing filler
From the non-black fillers silica provides the highest reinforcement to rubber
products which is ascribed to the small particle size of the silica. Silica is an
amorphous material, consisting of silicon and oxygen atoms connected in a non-
regular 3D network of Si-O-Si bonds with silanol groups (Si-OH) present inside
and on the surface (Figure 1.6).18,19

Chapter 1
11
Figure 1.6. Structure of amorphous silica containing three types of silanol (Si-OH) groups.
Three different types of silanol groups can be distinguished on the silica surface: i)
isolated silanol that has only one hydroxyl group, ii) vicinal that contains hydroxyl
group’s close enough to develop hydrogen interactions and iii) geminal silanol
where two hydroxyl groups are linked to one silicon atom. The silanol groups are
directly responsible for the high polarity of the silica and the strong affinity to
absorb water on its surface (~ 6 % for precipitated silica).20 The silanol groups have
a strong tendency to form hydrogen bonds with the silanol groups from the
neighboring particles, resulting in aggregates with various sizes. Three structures of
silica at different length scales are distinguished, such as primary particles
(10 - 50 nm), aggregates (primary particles fused together via hydrogen
bonding: 100 - 500 nm) and agglomerates (aggregates are held together with
van der Waals forces: > 1 m) (Figure 1.7).19,21,22
Figure 1.7. Structural organization of primary silica particles into aggregates and
agglomerates. 23

Chapter 1
12
There are two types of commercially available silica: precipitated and fumed. The
precipitated silica is prepared by the reaction of sodium silicate and sulphuric acid
under alkaline conditions and the fumed silica is prepared by oxidation of silicon
tetrachloride vapour at high temperatures (~ 1000 C).16,19 The physical properties
of these two amorphous silica grades are determined by the production route and
the reaction parameters (Table 1.1). In the rubber industry the precipitated silica is
the preferred type of silica used because of the lower price and better mixing with
the rubber material. The more expensive fumed silica has very low bulk density
(very fluffy white powder) due to which is mainly used in silicon rubber.
Table 1.1. Physical properties of amorphous silica 24
Silica is also used in shoe soles for improving the resistance to wear and tearing. It
is also used to improve the tear strength and heat aging resistance in a wide variety
of manufactured rubber goods, including conveyor and power transmission belts,
hoses, motor and dock mounts, bumper pads and rubber rolls. Nowadays, the
application of rubber depends on finding the optimum balance between type and
amount of filler needed for achieving maximum improvement in mechanical
properties.25,26 Mixing of inorganic silica and organic rubber yields conventional
rubber/silica nanocomposites with the silica dispersed in 10 - 100 nm range.
These nanocomposites are also called hybrid nanocomposites, because they
combine the advantages of both materials: rigidity, thermal stability and barrier
properties from the filler and flexibility, ductility and processability from the
rubber.27-31
Property Type of silica
Precipitated Fumed
Surface area [m2/g] 60-300 50-400
Moisture [%] <6 <1.5
Silanol groups [nm-2
] 8-10 2-4
Primary particle size [nm] 10-50 7-50

Chapter 1
13
1.3. Conventional rubber/silica nanocomposites
The process of producing rubber products is a complex process involving
several production steps such as mixing or compounding, shaping and
vulcanization. The mixing of the rubber material with other additives (silica,
plasticizers/oil, coupling agent, vulcanization agents, antioxidants etc) is the crucial
step, where an optimal balance between the rubber material and the additives must
be achieved in order to meet the final product requirements.32 For conventional
rubber/silica nanocomposites one of the challenges is to achieve good silica
dispersion, required for achieving good mechanical properties of the rubber, which
is difficult due to the high polarity of the silica and its strong tendency to
aggregate.13,14,33
The polarity of a material is characterized by the Hildebrand solubility
parameter, as listed for several types of rubbers and fillers in Table 1.2. The
solubility parameter can be used to predict the compatibility between the rubber
and the filler, where closer values of the solubility parameters are expected to
provide better compatibility, thus mixing. There is a large discrepancy between the
solubility parameters of silica and the rubbers, indicating difficult mixing of these
two materials. Insufficient mixing between these two materials usually results in
large aggregates, non-uniformly dispersed throughout the matrix, leading to
formation of rubber/silica nanocomposites with weak mechanical properties.13
Table 1.2. Solubility parameters of rubbers and fillers.34
PE: poly (ethylene)
EPM: ethylene-propylene rubber
EPDM: ethylene-propylene
diene terpolymer
NR: natural rubber
BR: butadiene rubber
IIR: isobutylene isoprene rubber
SBR: styrene-butadiene rubber
NBR: Acrylonitrile -butadiene rubber
The mixing of rubber and silica is greatly improved by the addition of a coupling
Material
Hildebrand
solubility parameter
(MPa1/2
)
PE, EPM, EPDM 16
NR, BR, IIR 16-16.6
SBR 16.6-18
NBR 19-20
Silica 28-36
Carbon black 24-30

Chapter 1
14
agent.35,36 The role of the coupling agent is to chemically modify the silica surface
by forming a hydrophobic layer, which allows easier breakage of the agglomerates
into smaller aggregates during the mixing stage and their better dispersion in the
rubber matrix. Additionally, coupling agents (bis (triethoxysilylpropyl)
tetrasulphide - TESPT) have the ability to chemically bridge the silica surface and
the rubber chains by forming sulphur bonds with the rubber and Si-O-Si bonds with
the silica surface (Figure 1.8). Silica in combination with a coupling agent is
superior when compared to carbon black because it provides a stronger reinforcing
effect which allows the use of lower filler content in the rubber without any
negative consequences on the mechanical properties. This additionally improves
the elasticity of the rubber/silica nanocomposites resulting in reduction of the
rolling resistance. Moreover, the chemical bonds between the silica and the rubber
results in a more stabile silica-rubber network that during cyclic deformation of the
nanocomposite results in lower degree of breaking and reforming of the silica-
rubber network. This results in lower loss modulus and consequently lower tan
values which additionally reduces the rolling resistance.
Figure 1.8. Schematic representation of silane coupling agent (e.g. TESPT) chemically
bridging the silica surface and the rubber chain.
This behaviour of the rubber/silica nanocomposites enabled tire manufacturers to
achieve simultaneous improvement in the three properties of the ‘Magic triangle’

Chapter 1
15
i.e. skid resistance, abrasion and rolling resistance. The balance between the
properties of the ‘Magic triangle’ is considered important and silica improves this
balance.37,38
There have been numerous efforts to improve silica dispersion, for example
by varying the chemistry and content of the coupling agents, improving the mixer
rotor design,14 ultrasound pre-treatment of the silica particles and different methods
for chemical modification39-41 of the silica surface, but dispersion still remains a
serious issue not only for rubber materials but also for thermoplastics.
In an industrial environment, rubber/silica compounds typically require three
subsequent mixing/cooling steps in order to provide optimal size of the silica
aggregates and their relatively uniform distribution throughout the rubber matrix.
An alternative approach is considered where silica particles are directly grown in
the rubber matrix by using the sol-gel reaction. In this way the obtained in-situ
nanocomposites are prepared in a simpler one step method, instead of three, by
growing the silica in the rubber matrix. Additionally, this represents also a more
cost-effective production approach because no intensive subsequent mixing
(for break-up and distribution of the aggregates) or addition of coupling agents is
needed for achieving good dispersion of the silica particles.
1.3.1. In-situ rubber/silica nanocomposites via sol-gel reaction
The sol-gel reaction has been extensively used to create novel (hybrid)
nanocomposites.42-46 The first to exploit the sol-gel reaction was J.E. Mark in 1981
who produced silica particles in (dimethylsiloxane) rubber.47 Three routes can be
distinguished for the synthesis of these materials via the sol-gel process. The first is
the solution method where the rubber is dissolved in a suitable solvent and the sol-
gel reaction proceeds in the obtained rubber solution.48 The second is in-situ
polymerization where the polymerization and the sol-gel reaction are performed
simultaneously.49,50 The third method is the swelling method performed in two
steps: in the first step the rubber is swollen in an alkoxide precursor and in the
second step the swollen rubber is immersed in the catalyst solution where the

Chapter 1
16
sol-gel reaction may proceed via basic or acid conditions for obtaining in-situ
silica.18 Several factors such as the water/silane ratio, the type and amount of
catalyst, the type of precursor, the temperature and the nature of solvent/rubber
matrix have a significant effect on the sol-gel reaction and, consequently, result in
silica with different physical and chemical properties.51-55
Sol-gel reaction via the swelling method was extensively applied in different
rubbers such as NR,56,57 SBR,58 epoxy resin,59 poly (dimethylsiloxane)60 and
thermoplastics like polypropylene61 and poly(methylmethacrylate)62 on lab-scale
only, with no attempts for industrial production of the in-situ nanocomposites. In
general, there are several reasons we might consider responsible for the non-
commercialization of the silica in-situ nanocomposites, such as: long reaction times
(24 - 48 h) required to obtain silica, relatively low conversion of TEOS and
possibly high amounts of alcohol (by-product of the sol-gel reaction) to be
removed.
1.3.2. Sol-gel chemistry for silica formation
The production of amorphous silica via the sol-gel reaction was for the first
time reported in 1968 by Stober et al.,63 who prepared silica particles in a aqueous
solution using tetraethoxysilane (TEOS) as precursor and ammonia as catalyst. In
this process, the alkoxide silane precursors undergo hydrolysis and
polycondensation reactions (Figure 1.9) in the presence of acid or base catalysts to
form silica particles.64,65

Chapter 1
17
Figure 1.9. Hydrolysis and condensation reactions of the sol-gel reaction.19
The sol-gel reaction proceeds via several simultaneous chemical reactions,
resulting in the formation of various intermediate compounds. Under acidic
conditions the hydrolysis reaction begins with protonation of an alkoxy group
which decreases the electron density around the silicon atom, allowing an easier
attack by water molecules. The water molecule approaching the alkoxide will
acquire a partially positive charge allowing easier detachment of the alkoxy group
leading to formation of the first hydrolyzed intermediate18,19 (Figure 1.10). The
hydrolysis rate increases with additional substitution of alkoxy groups from the
precursor, due to decreased steric hindrance around the silicon atom. Under acidic
conditions the condensation reaction is slower than the hydrolysis and it
additionally slows down upon an increasing number of siloxane linkages to the
central silicon atom in the intermediate compounds and eventually results in the
formation of weakly branched silica networks.
Figure 1.10. Reaction mechanism for acid-catalyzed sol-gel reaction.18
Under basic conditions hydroxyl ions start the hydrolysis by substituting an alkoxy
group at the silicon atom with a hydroxyl group (Figure 1.11). The substitution of
alkoxy groups with hydroxyl groups will reduce the electron density around the

Chapter 1
18
silicon atom because the hydroxyl group is a strongly electron withdrawing group
and increases the reactivity of the alkoxide. Thus, the rate of hydrolysis will
increase with each subsequent substitution of the alkoxy groups.18,19
Figure 1.11. Reaction mechanism for base-catalyzed sol-gel reaction.18
Under basic conditions the condensation reaction proceeds faster than the
hydrolysis and it increases with the number of siloxane linkages on the
intermediate compounds, resulting in particles with larger sizes than observed
under acidic conditions. The sol-gel reaction under basic condition proceeds via an
anionic mechanism during which negatively charged species are formed that tend
to repel each other. Thus single particles will rather grow more individually into
larger particles than form silica networks, as under acid conditions.66,67
1.4. Mechanical properties of rubber/silica nanocomposites
1.4.1. Static mechanical properties of rubber
Some of the factors which determine the physical and mechanical behaviour
of a rubber are the size and flexibility of the chemical groups in the polymer chain
backbone, the susceptibility to deformation of inter-atomic bonds and the strength
of inter-chain interactions.1 Values for some typical mechanical properties of
non-filled, crosslinked rubber materials, such as tensile strength, hardness, modules
and elongation at break, are shown in Table 1.3.

Chapter 1
19
Table 1.3. Physical properties of non-filled crosslinked NR, SBR and EPDM.32,68
When a stress-strain test is performed on rubber samples the three most important
properties tested are the Young’s modulus, the tensile strength and the elongation at
break. The tensile strength corresponds to the force needed to break the rubber
specimen and the elongation at break is the maximum elongation the sample can
undergo before breaking. The measurement of Young’s modulus in rubber materials
is very difficult, because the stress needed to deform a rubber sample is small and
usually special load cells are needed for a very precise measurement. Therefore, in
most cases the ‘modulus’ is measured as the stress at a particular strain and it
represents the stiffness of the material. Other mechanical properties used to
characterize the rubber materials are hardness, compression set and abrasion
resistance.1,2,3
Rubber materials are rarely used in their pure form because they have weak
mechanical properties and therefore usually are reinforced by fillers.1,23 The
improvement in mechanical properties by addition of fillers is commonly called
reinforcement. The type and amount of filler will have a large impact on the
physical properties of the rubber (Figure 1.12).
Material Specific
density [g/m3]
Hardness
(Shore A)
Tensile strength
[MPa]
Elongation
at break [%]
NR 0.92-1.03 30-100 ~ 17.2 300-800
SBR 0.94 30-90 ~ 20.7 450-500
EPDM 0.86 30-90 ~ 24.1 100-700

Chapter 1
20
Figure 1.12. The influence of active ( ) and non-active fillers ( ) on the physical
properties of a rubber material.69
Active and non-active fillers have a different impact on the mechanical properties
of the rubber material. The addition of a certain amount of active fillers
(silica or carbon black) increases the hardness of the rubber compound, improves
its tensile strength (to a certain amount of filler) and the abrasion resistance.
However, with the addition of filler the viscosity of the rubber composite is
significantly increased which can seriously limit the processing. The compression
set increases with filler content significantly, which corresponds to lower elasticity.
The tuning of the properties of the final rubber material in correlation to the filler
type and amount are fully related to the application requirements.
1.4.2. Dynamic mechanical properties of rubber
For polymers dynamic mechanical properties generally refer to the responses
of a material under periodically varying strains.3,4 They are strongly dependent on
temperature, frequency, presence of fillers and the extent of deformation. The
dynamic mechanical properties are expressed with the storage G’, loss modulus G”
com
po
un
d v
isco
sity
ML(
1+4
)[M
U]
Filler content [phr]
0
100
50
150 100
Filler content [phr]
80
60
40
Ha
rdn
ess
[Sh
ore
A]
Filler content [phr]
30
20
10
0
Ten
sile
str
engt
h [
Mp
a]
Filler content [phr]
60
40
20
0
Co
mp
ress
ion
set
[%
]
Filler content [phr]
600
400
200
0
Ab
rasi
on
[mm
3]
Filler content [phr]
1000
500
0Elo
nga
tio
n a
t bre
ak
[%]

Chapter 1
21
and the loss angle determined from their ratio (tan = G”/G’),
. The
elastic modulus measures the elasticity of the material, i.e. its ability to store energy
whereas the loss (viscous) modulus measures the lost of energy as heat, i.e. its
ability to dissipate energy. The ratio of the two moduli is a measure of the
dissipated energy relative to the stored energy during deformation. A schematic
representation of the dynamic mechanical properties is given in Figure 1.13.
Figure 1.13. Dynamic mechanical properties of non-filled rubber compound.
The storage modulus is not strain dependant in the low strain region (< 10 % strain)
showing a linear plateau, whereas for higher strains (> 10 % strain) it shows non-
linear dependence slowly approaching another lower plateau. The Payne effect is
designated as the difference between the low-strain modulus and the high-strain
modulus. The particle (aggregate) size, dispersion, type and amount of filler are
considered to influence mostly the modulus at low strain, while the rubber-filler
interactions usually play a major role in the modulus at high strain.70-76 The Payne
effect77-85 is usually explained by the breaking of the filler-filler network. However,
new insights into this phenomenon86-88 show that rubber-filler interaction play also
very important role via the so-called trapped entanglements. The loss angle (tan )
is lower for filled than for unfilled compounds at low strains while at higher strains
the opposite is valid. The strain dependence of the loss angle is usually related to
the breakage and reformation of the filler network in the filled compound.77,89

Chapter 1
22
1.5. Aim of thesis
In summary, the silica dispersion (aggregate form) within a polymer matrix,
which is an extensively time and energy consuming process, can be improved by
applying the sol-gel reaction as an alternative approach. The sol-gel reaction is
expected to surpass the dispersion issues enabling improvement of the mechanical
properties. The rubber/silica nanocomposites prepared via a sol-gel reaction show
significantly improved mechanical properties, usually ascribed to improved
rubber-filler interactions. However, due to the scarce availability of information
tackling the nature of the rubber-silica interactions when silica is prepared by
sol-gel reaction, we conducted a more detailed study regarding the silica structure
and surface. This study is expected to provide a better understanding of the type of
interactions between the silica and the polymer matrix and thus the improved
mechanical properties. In addition, the thesis also aims to gain fundamental
understanding of the mechanism of the silica formation via sol-gel reaction in
rubber materials considered directly responsible for the unique structure (and
surface) of the formed silica. Moreover, a kinetic study of the sol-gel reaction at
higher temperatures (up to 120 C) is conducted in order to reveal the possibilities
of continuous production of the in-situ nanocomposites via a reactive extrusion
process.
1.6. Outline of thesis
In Chapter 1 of this thesis the current state of the art in the field of
nanocomposites is given, with emphasis on the preparation and properties of
nanocomposites produced via the sol-gel reaction. Outlined are also the objectives
of the study, i.e. to provide a thorough understanding of the mechanism and the
kinetics of the sol-gel reaction in a rubber matrix and to correlate the structure of
the in-situ synthesized silica to the properties of the rubber nanocomposites. To that
purpose, the in-situ rubber/silica nanocomposites were prepared via the sol-gel
reaction, using TEOS as precursor and hexylamine as catalyst.

Chapter 1
23
The effects of different reaction parameters, i.e. amount of precursor, reaction
time, temperature and type of rubber, on the structure of the prepared in-situ
nanocomposites (content, size, and dispersion of silica) are shown in Chapter 2.
Transmission electron microscopy (TEM) was used to study the dispersion of the
silica particles in the in-situ nanocomposites. The amount of bound rubber was
evaluated and it was correlated to the rubber-silica interaction.
The kinetics and the mechanism of the sol-gel reaction in a rubber matrix were
studied in detail by performing time-resolved solid-state NMR and SAXS
experiments. The results presented in Chapter 3 indicate that the sol-gel process in
a rubber matrix adopts the emulsification process behaviour, where hexylamine
used as catalyst, behaves as surfactant forming inverse micelles with enclosed
water in a TEOS-swollen rubber matrix. In addition, in this chapter the kinetics of
silica growth is followed by time-resolved SAXS and solid state NMR.
The structural investigation of the in-situ synthesized silica particles, presented in
Chapter 4, was performed using solid state NMR and MS-TGA-IR. For the first
time it is shown that so-called ‘hairy’ silica particles, with hexylamine and remnant
ethoxy groups residing predominantly on the silica surface, are obtained via this
process. This ‘hairy’ silica surface results in a more hydrophobic nature of the
silica particles and in stronger rubber-silica interactions.
In Chapter 5 the properties of the in-situ nanocomposites produced in both static
and dynamic conditions (mixer) are discussed and compared to those of the
conventionally prepared rubber/silica nanocomposites. The measurements with a
Rubber Process Analyzer (RPA) indicated a strong reinforcement of the rubber
matrix by the in-situ silica at much lower silica loadings in comparison to the
conventional rubber/silica nanocomposites. This strong reinforcement of the in-situ
prepared nanocomposites can be ascribed to the stronger interactions between the
in-situ made silica particles and the rubber matrix, the presence of trapped
entanglements and bound rubber content.
In-situ nanocomposites were successfully produced via reactive extrusion,
which was one of the goals in this thesis. The in this way obtained in-situ
nanocomposite had a maximum loading of 3.2 wt% silica and possessed a uniform

Chapter 1
24
particle dispersion and very good properties. Chapter 6 contains the technological
assessment of this study. The possibilities for industrial application of the sol-gel
process to obtain rubber-silica nanocomposites with excellent properties are
discussed.

Chapter 1
25
1.7. References
[1] McGraw-Hill,‘Rubber Engineering’,Tata McGraw-Hill Company;New Delhi;1998
[2] A.Ciesielski,‘A introduction to Rubber Technology’;Rapra Technology Limited-UK;1999
[3] J.W.M.Noordermeer,‘Elastomeric Technology’;Twente University;2007
[4] J.E. Mark et al.,‘Science and Technology of Rubber’;Academic Press Limited-UK;
Second Edition;1994
[5] M.van der Mee,PhD thesis:‘Thermoreversible Cross-linking of Elastomers’;Technical
University of Eindhoven;2007
[6] L.R.G.Treloar,‘The Physics of Rubber Elasticity’;Oxford University Press;Third
Edition;2009
[7] A.K.Bhowmick,‘Current Topics in Elastomers Research’;Taylor&Francis group;2008
[8] B.Rodgers et al.,’Rubber Compounding’;Kirk-Othmer Encyclopedia of Chemical
Technology;John Wiley & Sons;NewYork;December;2004
[9] M.Ito et al.,Polymer;42;9523-9529;2001
[10] C.G.Robertson et al.,Macromolecules;41;2727-2731;2008
[11] T.Mahrholz et al.,Composites: Part A;40;235-243;2009
[12] G.B.Ouyang et al.,Kautschuk Gummi Kunststoffe;59;332-343;2006
[13] A.E.M.Reuvekamp,PhD thesis:‘Reactive mixing of silica and rubber for tyres and engine
mounts’;Twente University;2003
[14] W.K.Dierkes,PhD thesis:‘Economic Mixing of Silica-Rubber compounds’;Twente
University;2005
[15] W.Jincheng et al.,Journal of Elastomers and Plastics;37;169-180;2005
[16] W.H.Waddell and L.R. Evans.,‘Amorphous Silica’;Kirk-Othmer Encyclopedia of
Chemical Technology;John Wiley & Sons;New York; December;2000
[17] W.Hofmann,Rubber Technology Handbook;Hanser Publishers;1989
[18 ] C.Jeffrey Brinker et al.,‘Sol-gel Science’;Academic Press;1990
[19] R.K.Iler,‘The chemistry of silica’;Chichester&Wiley-Interscience;1979
[20] W.Kim et al.,Ceramics International;35;1015-1019;2009
[21] S.Mihara,PhD thesis:‘Reactive processing of silica-reinforced tire rubber’;Twente
University;2009
[22] E.F.Vansant et al.,‘Characterization and chemical modification of the silica
surface’;Elsevier;1995
[23] Li,Y.et al.,Rubber Chemistry and Technology;67;693;1994
[24] G.Rakesh K,‘Polymer nanocomposites handbook’;CRC Press;2010
[25] A.K.van der Vegt,‘From polymers to plastics’;Delft University Press;1999
[26] L.Bokobza, Journal of Applied Polymer Science;85;2301-2316;2002
[27] P.M.Ajayan et al.,‘Nanocomposite Science
and Technology’;Wiley-VCH;Weinheim,Germany;2003
[28] L.S.Schadler et al.,MRS Bulleting;32;335;2007
[29] D.W.Schaefer et al.,Macromolecules;40;8501;2007
[30] J.Shen et al.,Chemical Review;108;3893-3957;2008
[31] R.A.Vaia et al.,Journal of Polymer Science Part B:Polymer Physics;45;3252;2007
[32] J.Noordermeer,’Ethylene-Propylene-Diene monomer’,Kirk-Othmer Encyclopedia of

Chapter 1
26
Chemical Technology;John Wiley & Sons;New York;December;2000
[33] L.Bokobza et al.,Chemistry of Materials;14;162-167;2002
[34] R.F.Grossman,’The Mixing of Rubber’;Chapman&Hall;25;43;1997
[35] A.ten Brinke,PhD thesis:‘Silica reinforced tyre rubbers’;Twente University;2002
[36] A.Turturro et al.,Journal of Physical Chemistry;111;4495-4502;2007
[37] M.Maiti et al.,Rubber Chemistry and Technology;81;384-469;2008
[38] Y.Ikeda et al.,Journal of Material Science;38;1447-1455;2003
[39] T.I.Suratwala et al.,Journal of Non-Crystaline Solids;316;349-363;2003
[40] H.E.l. Rassy et al.,Journal of Non-Crystaline Solids;351;1603-1610;2005
[41] L.Q.Zhang et al.,Journal of Applied Polymer Science;108;112-118;2008
[42] J.Pietrasik et al.,Polymer International;54;1119-1125;2005
[43] Z.Zhang et al.,Acta Materialia;54;1833-1842;2006
[44] Y.Ikeda et al.,Kautschuk Gummi Kunststoffe;58;2005
[45] S.Kohjiya et al.,Rubber Chemistry and Technology;73;534;2000
[46] Y.Ikeda et al.,Journal of Sol-Gel Science and Technology;31;137-142;2004
[47] J.E.Mark et al.,Macromolecular Rapid Communications;3;681-685;1982
[48] A.Bandyopadhyayc et al.,Journal of Applied Polymer Science;93;2579-2589;2004
[49] I.Zhong-Ma et al.,European Polymer Journal;43 (10);4169-4177;2007
[50] J.Jang et al.,Journal of Applied Polymer Science;85;2074-2083;2002
[51] J.H.Zhang et al.,Journal ofMaterial Research;18(3);2003
[52] A.van Blaaderen et al.,Journal of Colloidal and Interface Science;156;1-18;1993
[53] P.A.Buining et al.,Journal of Colloidal and Interface Science;179;318-321;1996
[54] A.Bandyopadhyay et al.,Journal of Applied Polymer Science;95;1418-1429;2005
[55] A.Bandyopadhyay et al.,Journal of Material Science;40(1);53-62;2005
[56] Y.Ikeda et al.,Kautschuk Gummi Kunststoffe (KGK);58(9);455-460;2005
[57] Y.Ikeda et al.,Journal of Sol-Gel Science and Technology;26;495-498;2003
[58] Y.Ikeda et al.,Journal of Material Chemistry;7(3);455-458;1997
[59] Z.Zhang.,Acta Materialia;54;1833-1842;2006
[60] L.Bokobza et al.,Polymer;42(12);4135-4143;2005
[61] S.H.Jain,PhD thesis:‘Nano scale events with macroscopic effects in PP/silica
nanocomposites’;Eindhoven University;2005
[62] C.J.T.Landry et al.,Polymer;33(7);1486;1992
[63] W.Stober et al.,Journal of Colloidal and Interface Science;26;62;1968
[64] T.Kim et al.,Journal of American Ceramical Society;85;1107;2002
[65] G.H.Bogush et al.,Journal of Non-Crystaline Solids;104;95-106;1988
[66] C.G.Pereira et al.,Journal of Physical Chemistry A;103;3252-3267;1999
[67] A.P.J.Jansen et al.,Journal of American Chemical Sociaety;133;6613-6625;2011
[68] J.R.Davis,Tensile testing;ASM International;2nd
edition;2004
[69] R.Panenka et al.,International Annual Review;42;86-93;2001
[70] J.Sun et al.,Journal of Polymer Science:Part B;45;2594-2602;2007
[71] L.Ladouce-Stelandre et al.,Rubber Chemistry and Technology;76;145-159;2003
[72] D.R.long et al.,Macromolecules;41;8252-8266;2008
[73] J.M.Yeh et al.,Journal of Nanoscience and Nanotechnology;8;3040-3049;2008

Chapter 1
27
[74] M.Ito et al.,Polymer Journal,;34;332-339;2002
[75] L.Chazeau et al.,Rubber Chemistry and Technology;80;183;2007
[76] K.P.Vijayamohanan et al.,Journal of Colloid and Interfacial Science;318;372-379;2008
[77] J.Frohlich et al.,Composites:Part A;36;449-460;2005
[78] J.Sun et al.,Journal of Polymer Science: part B;45;2594-2602;2007
[79] L.Bokobza et al.,Kautschuk Gummi Kunststoffe;62;23-27;2009
[80] J.Frohlich et al.,Rubber world;April;4;28;2001
[81] B.Jang et al.,Rubber division;174;October;14-16;2008
[82] M.Brindha E.A et al.,Rubber world;239;28-32;2008
[83] S.Merabia et al.,Macromolecules;41(21);8252-8266;2008
[84] C.Wrana et al.,Kautschuk Gummi Kunststoffe;61;647-655;2008
[85] P.Konecny et al.,Polymers for Advanced Technologies;18;122-127;2007
[86] S.S.Sternstein et al.,Composite Science and Technology;63;1113-1126;2003
[87] S.Thomas at al.,Journal of Physical Chemistry: Part C;113;17997-18002;2009
[88] Maier.P.G. et al.,Kautschuk Gummi Kunststoffe;49;18-21;1996
[89] G.Heinrich et al.,Kautschuk Gummi Kunststoffe;57;2003

Influence of reaction parameters on structure of in-situ rubber/silica
nanocomposites synthesized via sol-gel reaction
Abstract
In-situ silica was synthesized in non-vulcanized rubber such as NR (natural rubber),
SBR (styrene-butadiene rubber) and EPDM (ethylene-propylene-diene ter-polymer)
using the sol-gel method with tetraethylorthosilicate (TEOS) as silica precursor and
hexylamine as catalyst. The effect of the reaction parameters, such as the amount of
TEOS, the reaction time (15 - 120 min) and the type of rubber were explored.
Transmission electron microscopy (TEM) is used to study the gradient in silica
content and particle size over the sample thickness. An excellent dispersion of silica
was obtained for all rubbers, even for the very apolar EPDM, without the use of any
additives to improve the dispersion. The excellent dispersion and the larger surface
area (small particle size) of the silica provided higher bound rubber contents of the
in-situ nanocomposites as compared to the conventional nanocomposites where pre-
synthesized silica was mixed with rubber.

Chapter 2
29
2.1. Introduction
Driven by the demands for a stronger, tougher and lighter-weight material,
a new group of nanocomposite materials was developed, composed of an inorganic
filler and an organic polymer matrix where the filler size is in nanometer range
(10 - 100 nm). These nanocomposites are also called hybrid nanocomposites,
because they combine the advantages of both materials: rigidity, thermal stability
and barrier properties from the filler and flexibility, ductility and processability
from the polymer. The particulate nano-fillers have a high surface area-to-volume
ratio, resulting in a significant improvement of the mechanical properties of the
composite. In the rubber industry a wide variety of particulate nano-fillers are used,
among which most popular are carbon black and silica 1,2,3
In the rubber industry silica is increasingly being used, because of the
improved balance of abrasion, wet grip and rolling resistance, also known as the
magic triangle of properties which is particularly useful for high-performance tires
(green tires).4,5 Conventional mixing of silica and rubber is a serious challenge,
when a uniform silica particle dispersion needs to be achieved. The hydroxyl
groups residing on the surface result in highly polar nature of the silica.6 Strong
hydrogen bonds are developed between the silica particles resulting in silica
agglomerates with various sizes. The difficult mixing of rubber and silica usually
results in large silica aggregates, non-uniformly distributed throughout the rubber
matrix, yielding conventional rubber/silica nanocomposites with non-optimum
mechanical properties. Industrial mixing requires several steps and is commonly
accommodated by using a coupling agent (e.g. TESPT), which provides a better
dispersion of the aggregates through the matrix.7-10
An alternative way to prepare hybrid nanocomposites is offered by the sol-gel
reaction, which can be performed under mild conditions via three routes: the
solution method, the swelling and the in-situ polymerization.11-15 The sol-gel
reaction avoids the mixing steps and the formation of silica aggregates and
provides instead in-situ nanocomposites with single silica particles, uniformly
distributed through the rubber matrix. The sol-gel reaction consists of two basic

Chapter 2
30
reactions i.e. hydrolysis of the tetraalkoxysilane, followed by condensation
reactions. These reactions occur in the presence of water and catalyst, resulting
eventually in the formation of silica particles.16 From a practical point of view the
swelling method is most convenient where the silica formation via the sol-gel
reaction occurs directly in the rubber matrix. The sol-gel reaction consists of
complex reaction sequences influenced by several parameters, such as pH, reaction
temperature, reaction time, catalyst type and concentration, water content, structure
and concentration of the tetraalkoxy silane and the type of rubber.17-20 Variations in
these reaction parameters will result in various morphologies of the prepared
rubber/silica nanocomposites and consequently, in different mechanical properties.
The improved mechanical properties reported for in-situ rubber/silica
nanocomposites,21,22,23 as compared to conventional nanocomposites has been
ascribed to the uniform silica particle dispersion without any pronounced
aggregation and the possibility of having stronger rubber-silica interactions due to
the specific structure of the formed in-situ silica.24,25 Various studies have
suggested, but not yet prove that the stronger rubber-silica interactions may be a
consequence of the lower amount of silanol groups present on the in-situ silica
surface. The strength of the silica/rubber interactions can to a certain extent be
estimated by the bound rubber content26-28 which is defined as the remaining rubber
on the filler surface after a thorough extraction of the free rubber in an uncured
rubber sample using an appropriate solvent.
So far, the sol-gel reaction has been studied extensively in aqueous solution
and solution of rubber using different reaction parameters. However, limited
information is available on the influence of the different reaction parameters on the
sol-gel reaction when performed in the rubber matrix and on the morphology of the
in-situ nanocomposites produced. This study aims to show the influence of the
reaction conditions i.e. the amount of TEOS, the reaction time and the type of
rubber on the nanocomposite structure and on the bound rubber content for in-situ
nanocomposites prepared via the swelling method.

Chapter 2
31
2.2. Experimental section
2.2.1. Materials
The silica precursor, TEOS and the (n-hexylamine) catalyst were purchased
from Aldrich and used as received. The characteristics of the three rubbers, namely
natural rubber (NR; Tun Abdul Razak Research Centre), styrene-butadiene rubber
(SBR; Lanxess) and ethylene-propylene-diene rubber (EPDM; Lanxess), are shown
in Table 2.1. The type of silica used for conventional mixing is Zeosil 1165 MP
produced by Rhodia, known as a highly dispersible (HD) silica commonly used in
the rubber industry for the production of ‘green’ tires. It has a BET surface area of
150 m2/g and an average particle size of 10 - 20 nm.
Table 2.1 Characteristics of rubber materials used.
Rubber type NR
SMR L
EPDM
Keltan 512
SBR
VSL 5025-0
Composition [wt%]
Isoprene (1,4-cis) Ethylene/Propylene/ENB
55/41/4.3
1,2-vinyl/1,4-styrene
47.5/28/24
Impurity [wt%] 0.5 / /
Mw [kg/mol] ~ 800 260 450
Mooney viscosity
ML (1+4)
50-60 (100C) 46 (125C) 69 (100C)
Tg [C] -65 -54 -20
It was difficult to determine the exact molecular weight of the NR using gel
permeation chromatography (GPC), because there was always residual gel.
Literature 29 suggests an approximate Mw value of 8x10⁵ g/mol and Mw/Mn = 2.3.
Preparation of conventional NR nanocomposite
The conventional nanocomposites were prepared in an internal mixer
(V = 390 cm3) with tangential rotors and a fill factor of ~ 70 vol%. The starting
temperature was 50 C and the rotor speed was adjusted to reach temperatures
above 140 C. Usually for 10 to 15 wt% silica, a rotor speed of 110 rpm was
enough to achieve the desired temperature (140 - 170 C). However, for mixture
with 1 wt% silica the rotor speed was increased up to 130 rpm, because this small

Chapter 2
32
amount of silica does not significantly contribute to a torque increase. The actual
temperature of mixing was kept at 140 - 160 C for all compounds, regardless
whether a coupling agent was used or not, in order to maintain equal processing
conditions for all samples. In the presence of TESPT coupling agent the
temperature must be above 140 C to start the silanization reaction but below
170 C to prevent crosslinking of the rubber due to sulphur release from the
coupling agent.
The mixing was performed in two steps. In the first step ZnO, stearic acid, half the
amount of silica and half the amount of TESPT (if used) were added to the rubber
and in the second step the remaining components were added. The mixing time of
all components in the internal mixer was approximately 6 min. At the end, the so
called ‘dump’ temperature of the mixture was measured. The dump temperature
should be always above or equal to 140 C to ensure that the silanization reaction is
completed. The compound formulations used are shown in Table 2.2.
Table 2.2 Mixing parameters for conventional NR nanocomposites with ~1 and 15 wt% silica.
Silica content
Components [phr] 2 phr
(0.95 wt%)*
2 phrc
(0.88 wt%)*
30 phr
(16 wt%)*
30 phrc
(15.5 wt%)*
NR/SMR L (0.5 %
non rubber content)
100 100 100 100
Silica/ZEOSIL 1165
MP
2 2 30 30
Zinc oxide 5 5 5 5
Oil/Sunpair 2280 5 5 5 5
Stearic acid 2 2 2 2
Silane/TESPT 0 0.08 0 2.4
Total 114 114.8 142 144.4
c Coupling agent (TESPT)
* Silica content of conventional nanocomposites as determined by TGA
It should be noted, that the silica content as measured by TGA was lower than
when calculated from Table 2.2. In the rubber industry, phr (parts per hundred
rubber) is the commonly used unit for quantity, because it simplifies the

Chapter 2
33
formulations for the preparation of the conventional rubber/silica nanocomposites.
Further in the text reference is always made to wt% silica instead of phr. It is noted
that the content of inorganics (silica and ZnO) in the conventional nanocomposites
was determined by TGA (averaged over two measurements) and the silica content
was obtained after subtraction of the known ZnO content. The amount of TESPT
was 8 wt% with respect to the amount of silica added to the rubber. Even though
the rubber compounds were not intended for vulcanization, stearic acid and ZnO
were additionally added in order to approximate the preparation conditions of
industrial rubber/silica mixtures. ZnO is used as an activator and stearic acid as a
plasticizer and a co-activator for sulphur vulcanization (when performed).
Preparation of in-situ rubber/silica nanocomposite by swelling sol-gel method
The in-situ rubber/silica nanocomposites were prepared as described by Ikeda
et al.18 for NR, SBR and EPDM. Compression moulded rubber sheets with
dimensions of 10 x 10 x 1.5 mm3 were swollen in TEOS at 40 C until a certain
swelling degree was reached and then immersed in a catalyst solution at 40 C for a
particular reaction time. The obtained in-situ nanocomposites were finally dried for
72 h at 50 C under vacuum. A catalyst concentration in water of 0.096 mol/l and a
weight ratio H2O:TEOS (5:1) were chosen to provide a maximum amount of silica,
as suggested by Ikeda et al.18 For the three types of rubber the amount of TEOS
was varied by varying the swelling time. In addition, the reaction time was also
varied between 15 - 120 min for a constant amount of TEOS.
The TEOS content (in wt%) after swelling was determined according to the
following equation:
(2.1)
where is the mass of TEOS swollen in the rubber matrix in (g) and
is the weight of the rubber sample before swelling in (g).
The theoretical silica yield was calculated assuming that 1 mol of TEOS
corresponds to 1 mol of silica (SiO2) as shown in the following equation:

Chapter 2
34
Si(OC2H5)4 +2 H2O SiO2 + 4 C2H5OH (2.2)
(2.3) (2)
where, is the molar mass of SiO2, 60.08 g/mol and is the molar mass
of TEOS, 208.33 g/mol. The conversion of TEOS (in %) is defined as following:
(2.4)
where,
is the silica content as determined by TGA.
Bound rubber determination
In-situ and conventional rubber/silica nanocomposites with various silica
amounts were immersed in THF, which is good solvent for the three rubbers. The
ratio between the rubber/silica nanocomposites and the solvent was kept constant
(2 % w/v) and the samples were immersed in the solvent for 48 h at room
temperature while shaking. The residues were dried for 72 h at 50 C under
vacuum. The bound rubber content was calculated as following:
(2.5)
where, is the weight of the sample after solvent treatment in (g),
is the weight of sample before solvent treatment in (g) and the is the weight
of silica in (g) in the nanocomposite.

Chapter 2
35
2.2.2. Characterization
Thermo-gravimetric analysis (TGA)
A Q500 TGA from TA Instruments was used for the quantitative
determination of the silica content in the rubber/silica nanocomposites. Samples
were heated in an air atmosphere with 10 C/min up to 900 C to provide complete
oxidation of the hydrocarbon rubber. The residue after this thermal treatment is
assumed to be composed of silica only. All measurements were repeated at least
twice and an average of the results was used.
Transmission Electron Microscopy (TEM)
Morphological studies were performed using a Tecnai 20 transmission
electron microscopy (TEM), operated at 200 kV. It should be noted, that later in the
text it will be referred to structure and not morphology of the nanocomposites.
Ultrathin sections (~ 70 nm) were prepared using a Leica Ultracut S/FCS
microtome at - 110 °C using DMSO. Chemical staining was not required, since the
electron density of silica is much higher than that of the rubber matrix. For easier
handling while cryo-cutting, some of the samples were treated with gamma
irradiation (100 kGy) at Gammaster International BV, Ede. This provided extra
stiffness to the material as a result of crosslink formation. Details on sectioning will
be explained extensively later in this chapter.
2.3. Results and Discussion
2.3.1. Effect of TEOS amount on in-situ NR nanocomposites
The amount of TEOS is one of the reaction parameters of the sol-gel reaction
studied extensively for alcoholic30-32 and rubber solutions.33,34 A significantly larger
particle size was shown for higher TEOS contents. However, a correlation between
the particle size and the TEOS amount has not been found so far for the swelling
method. For that purpose, in-situ NR/silica nanocomposites have been prepared
with various amounts of TEOS (and constant reaction time of 2 h) as

Chapter 2
36
depicted in Table 2.3.
Table 2.3. Preparation of in-situ NR nanocomposites for 2 h reaction time at 40 C for
various amounts of TEOS.
Swelling
time [h]
wt % TEOS
Conversion
TEOS [%]
1 50 22.5 6.5 29
3 60 30 14 46
5 67 37 20 57
10 74 45 28 63
24 77 49 40 82
The conversion of TEOS during the sol-gel reaction will be always less than 100 %
because the theoretical silica is always higher than the experimentally determined
silica content. The TEM images of the in-situ NR nanocomposites with 6 - 28 wt%
silica are shown in Figure 2.1. The sample with 40 wt% silica is not considered,
because it was too brittle to handle. This amount of silica corresponds well with the
silica content obtained by Ikeda et al.18 for significantly shorter reaction time. The
in-situ NR nanocomposites show a relatively uniform silica dispersion with the
occasional appearance of particle aggregates (marked with red circles).
Figure 2.1. Effect of TEOS content on morphology of NR/silica nanocomposites for 2 h
reaction at 40 °C time: (a) 50 wt%, (b) 60 wt%, (c) 67 wt% and (d) 74 wt% TEOS. Presence
of silica aggregates indicated with the circles.
Figure 2.1 and the results in Table 2.3 show that by increasing the TEOS content
from 50 to 74 wt% an increase in silica content from 6.5 to 28 wt% is obtained,
accompanied with an increase in the average particle size from 27 to 40 nm and
100 nm 100 nm100 nm100 nm
6.5 % silica, 27 3 nm 14 % silica, 32 4 nm 28 % silica, 40 5 nm20 % silica, 33 4 nm
(a) (b) (c) (d)

Chapter 2
37
higher conversion of TEOS (see Table 2.3). The increase of the particle size with
the TEOS content is explained as follows: in order to preserve the ratio of
TEOS:H2O (1:5), the higher TEOS concentration in the rubber consequently
requires a higher amount of aqueous catalyst solution. As a side effect the amount
of the hydroxyl ions is increased and as a consequence the hydrolysis and the
condensation reactions are enhanced.35 In addition, the higher amount of TEOS
(and hydroxyl ions) will provide a higher concentration of available hydrolyzed and
non-hydrolyzed TEOS in the vicinity of the growing particles. This is particularly
important when the sol-gel reaction is performed in a rubber, where serious
limitations in the mobility of the reactants (TEOS and catalyst solution) are
imposed by the rubber network of chains.
It must be noted that by rubber network we are referring only to a physical
network of chains because the NR is not crosslinked and therefore no chemical
bonds exist between the rubber chains. The availability of more molecules allows
the silica particles to grow to a larger particle size for same reaction time. However,
despite the evident effect on the particle size, it is not clear whether the higher
availability of hydrolyzed TEOS molecules will also promote the formation of new
silica particles. For that purpose, the particle number density was determined of the
in-situ NR nanocomposites by manually counting the particles from the TEM
images in a volume of 0.1 m3 and section thickness of 70 nm (set value on the
cutting instrument). The number of particles (averaged over 3 images) indicates no
significant change with increasing TEOS content, as shown in Figure 2.2.

Chapter 2
38
0
100
200
300
400
500
600
700
800
403332
28 wt%
20 wt%14 wt%
Pa
rtic
le n
um
be
r
Average particle size [nm]
6.5 wt%
27
69 45
29
50
Figure 2.2. Particle number per V = 0.1 m
3 versus average particle size for in-situ NR
nanocomposites with different amounts of TEOS (50, 60, 67 and 74 wt%) at 40 C for 2 h
reaction time.
Figure 2.2 suggests that by the increase in TEOS content the particle size is
predominantly affected and not the particle number density. It should be noted that
for the sample with 74 wt% TEOS (28 wt% silica) a somewhat lower particle
number was obtained. This can be ascribed to the error introduced while counting
the particles, due to enhanced presence of silica aggregates. The individual particles
in the aggregate cannot be easily distinguished and precisely counted. These
aggregates are more predominant for the samples with higher silica contents
(> 14 wt%) and are not taken into account during counting.
2.3.2. Effect of reaction time on in-situ NR nanocomposite structure
The reaction time studied extensively only in solutions.30,31,34 is another
parameter which has an effect on the size of the silica particles and the structure of
the in-situ nanocomposites obtained via sol-gel reaction. In order to study this
parameter for our particular system, where the rubber is swollen in the silica
precursor in-situ nanocomposites were prepared with a constant TEOS content of
50 wt% and a constant amount of catalyst solution (TEOS:H2O = 1:5) varying only
the reaction time from 15 - 120 min at 40 C, as shown in Table 2.4.

Chapter 2
39
Table 2.4. Silica content obtained for in-situ NR nanocomposites prepared at different
reaction times at 40 C with 50 wt% TEOS.
Table 2.4 shows a clear increase in the silica content with the reaction time.
Usually, the sol-gel reaction is performed at very long reaction times in order to
achieve the highest possible silica content. However, our primary interest was not
to achieve the highest silica content, but to study the structural changes (silica
content, particle size, shape and silica dispersion) in the obtained in-situ
nanocomposites, as a function of reaction time as shown with the TEM images in
Figure 2.3.
Figure 2.3. Effect of reaction time at 40 C with 50 wt% TEOS on the morphology of in-situ
NR nanocomposites: (a) 15 min, (b) 30 min, (c) 60 min and (d) 120 min.
The TEM images in Figure 2.3 show an increase of the average particle size from
16 to 27 nm with an increase of reaction time. It is noted that at low silica contents
(1.8 wt%) the spherical shape of the particles is not fully developed. However, at
longer reaction time the particles tend to develop a fully spherical shape and
become more monodispersed. This effect was also observed in previous studies
when silica particles were formed in solution. It seems typical for the early stages
of silica formation, that the particle shape is still somewhat fuzzy. This is ascribed
to the addition of the relatively larger silica species in the early stages of the silica
100 nm 100 nm100 nm100 nm
1.8 % silica, 16 3 nm 3 % silica, 23 3 nm 6.5 % silica, 27 3 nm2.3 % silica, 20 3 nm
(a) (d)(c)(b)
Reaction
time [min]
Particle size
[nm]
15 1.8 16 ± 3
30 2.3 20 ± 3
60 3 23 ± 3
120 6.5 27 ± 3

Chapter 2
40
growth.35,36 The increase of the particle size and the particle number density with
the reaction time is shown in Figure 2.4.
Figure 2.4. (a) Average particle size as function of reaction time and (b) particle number
(per V = 0.1 m3) vs. average particle size as function of reaction time (15, 30, 60 and 120
min) at 40C with 50 wt% TEOS.
Figure 2.4 (a) shows initially very fast increase of the particle size that later
continues to increase with a slower growth rate. Similar observations were reported
in earlier studies37,35 of the silica growth only in solution, where the particle size
after longer reaction times approached a plateau. The reason for the decrease in
growth rate (sol-gel under basic conditions) might be due to the reduction of
available silica reactive intermediates, hence less negative charges on the growing
silica particles. The amount of charge depends on the degree of condensation which
is highest at the beginning of the silica formation resulting in fast particle growth
and lower towards the end resulting in slower growth. The time required for the
particle size to reach a plateau (in rubber or solution) varies for each system,
because it strongly depends on the reaction parameters (water and catalyst
concentration, temperature, type of solvent or rubber matrix). The fast silica growth
in the initial stages of the reaction (16 nm in 15 min) may be useful for the
industrial application of the sol-gel reaction in rubber. Figure 2.4 (b) shows that the
particle number density does not change significantly within the first 60 min
reaction time, while a clear increase is observed for a reaction time of 120 min. A
(a) (b)
0.0 0.5 1.0 1.5 2.0 2.50
5
10
15
20
25
30
Ave
rag
e p
art
icle
siz
e [
nm
]
Reaction time [h]
(a)
0
100
200
300
400
500
600
700
6.5 wt%
3 wt%2.3 wt%
Pa
rtic
le n
um
be
rAverage particle diameter [nm]
1.8 wt%
16 20 23 27
(b)
85 31 45
69

Chapter 2
41
longer reaction time allows more catalyst solution to diffuse into the rubber matrix
and, thus, to contribute not only to the particle growth, but also to the formation of
new particles. Interestingly, in the in-situ NR nanocomposites the silica particles
are formed preferentially at the edges of large spherical domains (0.2 nm - 1.5 m)
as shown in Figure 2.5. This phenomenon has been observed earlier in NR
conventional nanocomposites prepared with HD silica38,39 and was assigned to the
original NR-latex particles present in the NR matrix.
Figure 2.5. Spherical domains in in-situ NR nanocomposite with 1.8 wt% silica, reaction
time of 15 min at 40 C with 50 wt% TEOS.
The rubber particles in the original NR latex are stabilized with proteins, which
reside on the surface and prevent them from coagulating. The proteins are usually
difficult to remove and some of them remain in the rubber after its coagulation into
the solid material. The residual proteins on the edges of the rubber particles locally
increase the polarity of the NR matrix, attracting more catalyst solution that
promotes silica formation on the edges of these domains.
2.3.3. Silica gradient in in-situ NR nanocomposites
The sol-gel reaction, used to prepare the in-situ nanocomposites under static
conditions, is a diffusion dependent process, where TEOS and the catalyst solution
diffuse in the rubber matrix and initiate hydrolysis and condensation reactions
resulting in silica formation. In principle, the diffusion of the catalyst solution
occurs from all sides of the sample, but here only the diffusion occurring from the
0.2 m

Chapter 2
42
top and bottom of the sample will be considered, since this is truly limiting for the
1.5 mm thick samples. The sol-gel reaction first starts on the sample surface and
progresses further along the sample thickness. Therefore, it is expected that in the
centre of the rubber sample silica formation begins with a certain delay determined
by the diffusion path of the catalyst solution. The actual silica gradient was studied
in an in-situ NR nanocomposite prepared with 50 wt% of TEOS for a reaction time
of 2 h at 40 C. For this purpose the sample was cryo-cutted as displayed in Figure
2.6.
Figure 2.6. Schematic drawing of cutting procedure of rubber sample for determination of
silica gradient ( - - - ) cube cutted from middle of in-situ NR nanocomposite.
The silica gradient was studied with both techniques, TGA and TEM, in each
particular layer as shown schematically in Figure 2.6. The silica content was
determined for each layer separately as designated with the TGA area. Three layers
from the specimen were prepared for TEM observation: a surface layer, an
intermediate and a centre layer. The results in Figure 2.7 confirm a gradient in
silica content and particle size, varying from 7.4 wt% and 35 nm at the surface to
4.4 wt% and 16 nm in the centre of the sample, respectively.
10 mm
Top view of rubber sample
diffusion
4 mm
4 mm
2 - Intermediate layer3 - Center layer
1 - Surface layer
TGA area
0.25 mm1
32
TEM area
1.5
mm

Chapter 2
43
Figure 2.7. Silica gradient for in-situ NR nanocomposite (2 h reaction time at 40 C with
50 wt% TEOS).
Two reasons for the observed variation in particle size and silica content along the
sample thickness can be suggested: the possible non-uniform concentration profile
of the TEOS along the sample thickness and the physically and chemically retarded
diffusion of the catalyst solution. The rubber sample after swelling in TEOS is
immediately immersed into the catalyst solution. It is expected that the amount of
TEOS is the highest on the surface where the sample is directly exposed to TEOS
and to gradually decrease towards the centre.
Additionally, the sol-gel reaction in the surface layer of the sample will start
almost immediately when the catalyst solution enters the sample, while in the
centre layer the effective reaction time will be shorter. In the centre layer the
reaction starts with a certain delay, i.e. only when the catalyst reaches the centre of
the sample. The diffusion of the catalyst towards the centre of the sample is
additionally retarded by the sol-gel chemistry occurring along the way. Considering
the effect of TEOS amount and reaction times, elaborated earlier in the text, one
could expect particles with larger size in the surface layer due to higher availability
of the TEOS and the catalyst solution. In addition, Figure 2.7 shows that the silica
particles in the centre and the intermediate layer are relatively monodispersed in
size, whereas a somewhat broader size distribution is observed for the surface
layer. The particle number is shown in Table 2.5.
centreintermediatesurface
100 nm 100 nm 100 nm
4.4 % silica, 16 ± 2 nm6.4 % silica, 25 ± 3 nm7.4 % silica, 35 ± 5 nm

Chapter 2
44
Table 2.5. Particle number (per V = 0.1m3) for each layer in in-situ NR nanocomposite
(2 h reaction time at 40 C with 50 wt% TEOS).
Layer Particle
size
Standard
deviation
Particle number Standard
deviation
centre 16 2 490 45
intermediate 25 3 480 50
surface 35 5 460 65
Table 2.5 shows no significant difference in the particle number density for each
layer of the in-situ NR nanocomposite. The reasons for the similar particle number
density could be found in the very nature of the NR. The amount of proteins and
water in NR are in the range of 1 - 3 wt% and 0.1 - 0.8 wt%, respectively. In
addition, in order to prevent hardening of NR during storage hydroxylamine
hydrochloride (NH2OHHCl) is added.40,29 The polar amino groups present in the
proteins and in the NH2OHHCl molecules may attract more strongly the diffusing
catalyst solution and, in addition, can themselves serve as potential nucleation
points for the silica formation. This can result in a large number of relatively
monodispersed particles uniformly distributed in the NR matrix. The gradient in
silica particle size observed in the in-situ nanocomposites has not been pointed out
so far and its importance is immense when reliability and consistency of the TEM
and TGA results are concerned. Therefore, in this study the cryo-cutting of all
samples for TEM and TGA measurements was performed approximately in the
intermediate layer. The gradient in silica particle size is also expected to influence
the mechanical properties which will be discussed more extensively in the
chapter 5.
2.3.4. Effect of rubber matrix (NR, EPDM and SBR) on in-situ nanocomposite
structure
So far the effect of the reaction parameters on the structure of the in-situ
nanocomposites was only considered for NR. However, since the type of the rubber
matrix may also influence silica formation and the final structure of the

Chapter 2
45
nanocomposite, two additional rubbers, (ethylene-propylene diene monomer)
EPDM and (styrene-butadiene rubber) SBR were studied. Unlike the NR, these
materials are synthetic rubbers. NR, EPDM and SBR were used to prepare the
corresponding in-situ nanocomposites at identical reaction conditions, i.e. TEOS
amount of 33 wt% and a reaction time of 15 min at temperature of 80 C. The
chosen temperature is higher than previously used (40 C for NR) because EPDM
is not able to reach 33 wt% TEOS at 40 C. The TEM images in the Figure 2.8
represent the resulting morphologies obtained for each rubber type.
Figure 2.8. Morphology of NR, EPDM and SBR in-situ nanocomposites, SBR morphology and
particle size distribution.
Figure 2.8 shows the variation in the silica content for each rubber type, with the
highest amount obtained for the SBR (5.5 wt%, TEOS conversion: 43.6 %), the
lowest for the EPDM (1.5 wt%, TEOS conversion: 12 %) and for the NR
nanocomposite somewhat in-between (3 wt%, TEOS conversion: 24 %) The TEM
images show the different morphologies of the three NR, EPDM and SBR in-situ
nanocomposites with differences in particle size, silica content (as measured
with TGA) and particle number. The in-situ NR nanocomposite consists of
monodisperse silica particles with a small average size of 18 nm. The EPDM
nanocomposite contain somewhat larger silica particles while the SBR
0
2
4
6
8
1121059688 9282
Part
icle
num
ber
Particle size [nm]
77
SBR
SBR
1.5 % silica, 22 5 nm3 % silica, 18 3 nm
NR EPDM
100 nm 100 nm 0.5 m
EPDM (0.5m)
100 nm
5.5 % silica, 95 15 nm

Chapter 2
46
nanocomposite shows enhanced polydispersity with particle sizes ranging between
85 and 112 nm. The particle number density obtained by manual counting of the
particles from the TEM images resulted in different values for each of the three in-
situ nanocomposites, as shown in Figure 2.9.
NR EPDM SBR0
100
200
300
400
500
Pa
rtic
le n
um
be
r
Rubber type
Figure 2.9. Particle number (per V = 0.1 m3) as obtained from TEM images of the NR,
EPDM and SBR in-situ nanocomposites.
In summary, the in-situ NR nanocomposites show the smallest silica particles but
the largest number density silica particles, while the opposite is observed for SBR.
EPDM is in-between though more similar to NR. The difference in the final
morphologies of the three nanocomposites can possibly be explained by the
polarity (chemical structure) of the rubber and the presence of impurities that may
promote or suppress silica formation via the sol-gel reaction. The polarity of
rubbers is assessed via the Hildebrand solubility parameter, shown in Table 2.6.

Chapter 2
47
Table 2.6. Hildebrand solubility parameters ( [MPa1/2
]) for NR, EPDM, SBR (as compared
to the polar NBR) and chemicals used in sol-gel reaction.41,42
The solubility parameter can be used to assess the compatibility between two
different components .i.e. more similar values indicate better compatibility. The
more polar the component is, the higher will be the solubility parameter, reaching a
very high value of 48 MPa1/2 for the very polar water. The same TEOS amount
(33 wt%) in the three rubbers is obtained for different swelling times, 16 h, 25 min
and 15 min for EPDM, NR and SBR, respectively. Despite the similar solubility
parameters of the three rubber types and TEOS, each rubber showed a distinctive
swelling behaviour. EPDM and SBR represent the two extremes, where EPDM
requires a long swelling time while SBR begins to significantly dissolve after
absorbing only 50 wt% of TEOS. After swelling in TEOS the three rubbers
obtained a whitish colour, which indicated that TEOS is possibly dispersed in the
form of droplets that are large enough to scatter the visible light and change the
colour of the sample. The size of these droplets may vary depending on the rubber
type.
Regarding SBR, we don’t understand the reasons behind the particular
morphology (small number density of large particles), but one possible explanation
could be that TEOS droplets might be larger and more non-uniformly distributed
throughout the rubber matrix. The contact between these droplets and the catalyst
solution can result in silica formation and growth which is more localized in that
particular area until all TEOS is exhausted, resulting eventually in larger silica
particles.
In addition, SBR also has higher polarity (closer to the polar NBR rubber type
in Table 2.6) when compared to NR and EPDM, which possibly promotes faster
Hexylamine 16.2
TEOS 16.4
water 48
EPDM 15.4
NR 16.2
SBR 17.8
NBR 19

Chapter 2
48
diffusion of the catalyst solution resulting in a higher silica content (5.5 wt%). Due
to the absence of polar impurities (e.g. proteins) in EPDM and SBR, the ‘nucleation
effect’ as observed in NR is expected to be suppressed, giving larger emphasis on
the particle growth and resulting in the formation of less silica particles with larger
sizes. It should be noted that an excellent dispersion of in-situ silica particles in
EPDM was obtained, which is very difficult due to the very low polarity of this
rubber. Earlier studies43 required the use of a coupling agent during the sol-gel
reaction to achieve good silica dispersion, while here it was accomplished without
the use of any additional chemicals (see Figure 2.8, EPDM with 0.5 m
magnification).
The reason for the good dispersion of silica particles in all in-situ prepared
nanocomposites originates most probably from the mechanism of the sol-gel
reaction. Ikeda et al.18 proposed the possibility that the hexylamine catalyst can also
behave as a surfactant, resulting in inverse water micelles in the TEOS-swollen
rubber matrix. The hydrophobic alkyl chains of the hexylamine that reside on the
interface of the inverse micelle are expected to provide steric stabilization for the
growing silica particles and prevent them from aggregating.
2.3.5. Bound rubber in NR, EPDM and SBR in-situ nanocomposites
2.3.5.1. Introduction of bound rubber
Bound rubber is formed by the physical adsorption of rubber chain segments
on the filler surface,44,45 forming a glassy-like immobilized layer around the
particle, as schematically shown in Figure 2.10.

Chapter 2
49
Figure 2.10. Schematic drawing of bound rubber in rubber/silica nanocomposite.
Bound rubber is the rubber that remains on the filler surface after solvent extraction
with the non-bound rubber being dissolved. Earlier studies46 showed that the bound
rubber layer actually consists of two types of layers, namely a tightly and a loosely
bound layer. The tightly bound layer is in direct contact with the filler surface and
consists of strongly adhering chain segments on the particle surface, while the
chains of the loosely bound layer are either connected directly to the surface of the
particle or tightly entangled with the chains extending from the tightly bound layer.
The existence of these layers was additionally confirmed by 1H NMR relaxation
measurements47,48 where three separate regions with different chain mobility were
distinguished. The region with the lowest mobility originates from the tightly
bound layer closest to the silica surface, the second region from the loosely bound
layer with somewhat higher mobility and the third region is the bulk rubber
network with the highest mobility, where the rubber chains are not restricted and
may freely move. These layers were detected in both, silica and carbon black
nanocomposites. The rubber-silica interactions play an important role in the bound
rubber content. Stronger interactions are expected to enhance chain segment
adsorption on the silica surface and result in higher bound rubber content. The
strength of the rubber-silica interactions is strongly dependent on the polarity of the
rubber and the silica characteristics, such as the particle size and surface
chemistry.28,27
rubber chain
Silica particle
Bound layer
Loosely bound layer
Tightly bound layer

Chapter 2
50
2.3.5.2. Bound rubber in in-situ NR nanocomposites
Usually, the bound rubber content increases with silica content. However, for
the in-situ NR nanocomposites a decrease in the bound rubber content was
observed with increase in silica content, as shown in Figure 2.11.
Figure 2.11. Bound rubber content (Troom, THF) vs. silica content for in-situ NR
nanocomposite with silica particle size as running parameter. In-situ NR nanocomposites
were prepared for different amounts of TEOS (50, 60, 67 and 74 wt%) and reaction time of
15 min (first point) and 2 h at 40 C.
The decrease in the bound rubber content with increasing silica amount can be
ascribed to the increase in the particle diameter from 16 to 40 nm, leading to a
decrease of available surface area of the particles for interaction with the rubber.
The very high bound rubber content at very low silica content (1.8 wt%) may be
explained by the presence of very small silica particles (see Figure 2.1) providing a
very large surface area and enough inter-particle distance (~ 50 - 200 nm) to allow
full formation of the bound layer around the particle with reduced interruptions or
overlap from the neighbouring particles. However, as the silica content increases,
particle size also increases resulting in a decrease of the inter-particle distance
(10 - 100 nm) (see Figure 2.1) and a possible overlap of the bound layers resulting
in a lower bound rubber content. It should be noted, that both, the silica content and
the particle size will have an effect on the bound rubber content in nanocomposites.
While in the conventional nanocomposites these two parameters are easily
0 10 20 30 40 5030
40
50
60
70
80
D = 40 nm
D = 33 nm
D = 32 nm
D = 27 nm
Bou
nd
rubbe
r conte
nt [ w
t %
]
Silica content [wt %]
D = 16 nm

Chapter 2
51
controlled by selecting the pre-synthesized type of silica, for the in-situ
nanocomposites the situation becomes rather complicated because the silica content
and the particle size cannot be separately controlled.
2.3.5.3. Effect of rubber type on bound rubber content
A series of in-situ nanocomposites were prepared for each rubber type under
same reaction conditions. Different silica content and bound rubber contents were
obtained, as shown in Table 2.7.
Table 2.7. Bound rubber content for NR, EPDM and SBR in-situ nanocomposites (various
reaction times at 40 C with 50 wt% TEOS).
The NR and SBR nanocomposites were prepared (swelling and sol-gel reaction) at
40 C, while the EPDM nanocomposite was swollen at 80 C in TEOS in order to
obtain somewhat comparable amount of TEOS (33 wt% being the maximum
at 80 C) while the reaction was performed at 40 C.
The NR nanocomposite exhibits a high bound rubber content at relatively low silica
content which decreases with increase in silica content. The SBR nanocomposite
dissolved completely regardless of the silica content showing no bound rubber at
all. The EPDM behaviour is somewhere in-between, showing no bound rubber for
low silica content (< 1.7 wt% silica) and an increase in bound rubber content with
further increase of silica content. There might be several assumptions explaining
the behaviour of SBR in THF. One of the reasons can be found in the similar
solubility parameters of these two components, namely 17.8 MPa1/2 for SBR and
NR EPDM SBR
Reaction
time
[min]
Silica [wt%]
[50 wt% TEOS]
Bound
rubber
[wt%]
Silica [wt%]
[33 wt% TEOS]
Bound
rubber
[wt%]
Silica [wt%]
[50 wt% TEOS]
Bound
rubber
[wt%]
15 1.8 77 0.8 0 2.8 0
30 2.3 76 1.0 0 6.3 0
60 3.0 74 1.7 2.0 8.0 0
120 6.5 71 2.3 6.0 10.0 0

Chapter 2
52
19 MPa1/2 for THF, leading to a more intensive dissolution of SBR as compared to
NR and EPDM. The absence of bound rubber for the SBR nanocomposite can be
ascribed to the larger particle size and the much smaller number of particles
(see Figure 2.8). This may results in smaller surface area, leading possibly to the
formation of a thinner bound layer around the particles.
2.3.5.4. Bound rubber content of in-situ vs. conventional nanocomposites
The structure of in-situ and conventional nanocomposites was compared at
approximately the same silica contents (1 and 15 wt% silica), as shown in Figure
2.12. The conventional and in-situ nanocomposites are prepared as described in
Table 2.2 and Table 2.3, respectively.
Figure 2.12. Structure of conventional nanocomposite with coupling agent (a) and
(b) compared with in-situ NR nanocomposites (c) and (d) at approximately same
silica contents of 1 wt% and 15 wt%.
100 nm 100 nmAggregates
100 nm100 nmSingle particles
(a) (b)
(c) (d)
~ 1 % silica ~ 15 % silica
~ 1 % silica ~ 15 % silica

Chapter 2
53
Figure 2.12 shows a significant difference in the morphology between these two
types of nanocomposites. Uniformly dispersed single particles are observed in the
in-situ nanocomposites, whereas silica aggregates in the conventional
nanocomposites. This difference resulted consequently in different bound rubber
contents, as shown in Table 2.8. When compared at the same silica content the
amount of bound rubber determined for the in-situ nanocomposites was larger than
that of the conventional nanocomposites, even when a coupling agent was used.
The difference was more pronounced at lower silica content where the in-situ NR
nanocomposites showed a very high bound rubber content. This difference can be
ascribed to the single-particle morphology of the in-situ nanocomposites, providing
a much larger surface area available for contact with the rubber matrix and to
possibly stronger rubber-silica interactions caused by the different surface
chemistry of the in-situ silica particles. It should be noted that the bound rubber
content in the conventional nanocomposites is not only a result of the immobilized
layer around the silica aggregates, but also due to the so-called occluded rubber
which represents the rubber trapped between and within the aggregates.46
Table 2.8. Bound rubber contents (wt%) for in-situ and conventional NR nanocomposites.
Silica [wt%]
(in-situ)
In-situ Silica [wt%]
(conventional)
Conventional
Conventional
+CA*
1.8 77 1 24 31
14 66 15 57 61
* Coupling agent (TESPT)
It has been suggested that in-situ silica formed via the sol-gel reaction in a rubber
matrix may contain less silanol groups on the surface than the HD silica, thus
resulting in a lower polarity of the in-situ silica.49,25 This will result in a better
compatibility with the rubber and, consequently, in a higher bound rubber content
leading to improved mechanical properties of the in-situ nanocomposites. A
detailed study of the surface structure of the silica particles prepared via sol-gel
reaction is presented in Chapter 4.

Chapter 2
54
2.4. Conclusions
It has been shown that the reaction parameters such as the amount of TEOS,
the reaction time and the rubber type have great impact on the morphology (particle
size and silica content) of the obtained in-situ nanocomposites. An important
observation is the existence of a gradient along the sample thickness in in-situ NR
nanocomposites, where particle size and silica content depend on the diffusion of
TEOS and catalyst solution available along the sample thickness. Good silica
dispersion was obtained in EPDM, which is highly apolar rubber for which it is
difficult to achieve good silica dispersion. In contrast to the usual increase in bound
rubber content with silica content, the in-situ NR nanocomposites showed the
highest amount of bound rubber (BR = 77 wt%) for the lowest silica content of
1.8 wt% and then continued to decrease with increasing silica content. Finally, the
bound rubber content of the in-situ nanocomposites was larger than that of the
conventional nanocomposites (with a coupling agent) at equal silica loadings. This
is probably due to the unique single-particle morphology of the in-situ
nanocomposites and the different surface character of the in-situ synthesized silica.
Chapter 2
55
2.5. References
[1] A.K.Bhowmick,‘Current Topics in Elastomers Research’;Taylor&Francis group;2008
[2] H.Zou et al.,Chemical Review;108(9);3893-3957;2008
[3 ] A.D.Pomogailo et al.,Journal of Colloidal Chemistry;67;658-677;2005
[4] L.Bokobza,Kautschuk Gummi Kunststoffe;62;23-27;2009
[5] Y.Ikeda et al.,Journal of Sol-Gel Science and Technology;26;495-498;2003
[6] K.Sahakaro et al.,Journal of Applied Polymer Science;109;3839-3848;2008
[7] Y.Ikeda,Journal of Material Chemistry;7;455-458;1997
[8] S.K.E.A,Rubber Chemistry and Technology;73;534;2000
[9] A.K.Bhowmick,Journal of Material Science;40;53-62;2005
[10] S.Kohiya E.A,Rubber Chemistry and Technology;74;16;2001
[11] M.S.Sreekala et al.,Polymer Composites;91-105;2005
[12] H.Zhang et al.,Acta Materialia;54;1833-1842;2006
[13] J.Chrusciel et al.,Materials Science;21(4);461;2003
[14] M.Sarwar et al.,Journal of Sol-Gel Science and Technology;45,;89-95;2008
[15] M.Ito et al.,Polymer International;48;1035-1041;1999
[16] C.Jeffrey Brinker et al.,‘Sol-gel Science’,Academic Press;1990
[17] A.Bandyopadhay et al.,Journal of Applied Polymer Science;95;1418-1429;2005
[18] Y.Ikeda et al.,Journal of Sol-Gel Science and Technology;45;299-306;2008
[19] K.Yoshikai et al.,Journal of Applied Polymer Science;85;2053-2063;2002
[20] Y.Ikeda,Journal of Material Chemistry;7;455-458;1997
[21] J Sun et al.,Journal of Polymer Science: Part B;45;2594-2602;2007
[22] S.Kohjiya E.A,Rubber Chemistry and Technology;73;534-550;2000
[23] D.R.long et al.,Macromolecules;41;8252-8266;2008
[24] S.Kohiya E.A et al.,Rubber Chemistry and Technology;74;16;2001
[25] Y.Ikeda et al.,Journal of Material Science;38;1447-1455;2003
[26] S.Choi,Korea Polymer Journal;9;45-50;2001
[27] N.Suzuki et al.,Journal of Applied Polymer Science;95;74-81;2005
[28] J.Leblanc et al.,Journal of Applied Polymer Science;78;1541-1550;2000
[29] McGraw-Hill,‘Rubber Engineering’,Tata McGraw-Hill company;New Delhi;1998
[30] I.A.M.Ibrahim et al.,Journal of American Science;11(6);2010
[31] Z.Wang et al.,Journal of Colloid and Interfacial Science;341;23-29;2010
[32] G.H.Bogush et al.,Journal of Non-Crystaline Solids;104;95-106;1988
[33] A.Bandyopadhyay et al.,Journal of Applied Polymer Science;95;1418-1429;2005
[34] A.Bandyopadhyay et al.,Rubber Chemistry and Technology;77(5);830-846;2004
[35] A.Van Blaaderen et al.,Journal of Non-Crystaline Solids;149;161-178;1992
[36] A.Van Blaaderen et al.,Journal of Colloid and Interfacial Science;154;482;1992
[37] G.H.Bogush et al.,Journal of Colloid and Interfacial Science;142(1);1991
[38] E.W.Engelbert van Bevervoorde-Meilof et al.,Kautschuk Gummi Kuntstoffe;53;7-8;2000
[39] L.A.E.M.Reuvekamp,PhD thesis:‘Reactive mixing of silica and rubber for tyres and
engine mounts’;2003
[40] J.W.M.Noordermeer,course:‘Elastomeric Technology’;Twente University;2007
[41] R.F.Grossman,‘The Mixing of Rubber’,Chapman&Hall;25;1997

Chapter 2
56
[42] M.M.Coleman et al.,’Specific Interactions and the Miscibility of Polymer Blends’;1995
[43] A.Das et al.,Journal of Material Science:Part A;45;101-106;2008
[44] J.Frohlich et al.,Composites:Part A;36;449-460;2005
[45] Ph.Cassagnau et al.,Polymer;44;6607-6615;2003
[46] A.K.Bhowmick,‘Current Topics in Elastomers Research’;Taylor&Francis group;2008
[47] V.Litvinov,Macromolecules;35;10026-10037;2002
[48] V.Litvinov,Macromolecules;32;8476-8490;1999
[49] S.Kohiya E.A,Rubber Chemistry and Technology;74;16;2001

Growth mechanism of in-situ silica and kinetics of sol-gel reaction in
a rubber matrix as followed by real-time SAXS and solid-state NMR
Abstract
Silica formation in a rubber matrix possibly proceeds via inverse emulsion process
where the hexylamine being a catalyst, also behaves as a surfactant. The kinetics of
the sol-gel reaction in the rubber matrix, as followed by the MAS-NMR method, was
studied as a function of the reaction temperature (40 - 120 C). The development of
the particle size during the silica formation in the rubber matrix, as followed by the
real-time SAXS revealed an initial fast increase in particle size (15 min) that decreased
gradually for longer reaction times, eventually reaching a plateau. Moreover, single
pulse MAS-NMR measurements showed no significant change in the structure of the
silica particles after 15 and 60 min reaction time at 100 C indicating good silica
quality for short reaction time.

Chapter 3
58
3.1. Introduction
In 1968 Stӧber et al.,1 introduced a method for the preparation of
monodispersed spherical silica particles from aqueous solutions using silicon
alkoxides as precursor and ammonia as a catalyst.1 However, even after several
decades the mechanism for the silica formation via the sol-gel reaction is still not
well understood.2-4 The knowledge of how the silica particles are formed in the
nanocomposites is very important because it allows a better understanding and thus
control over the morphology of the in-situ nanocomposites.5-7
So far, two hypotheses have been proposed for the silica formation in aqueous
solutions, namely monomer addition (hydrolyzed or non-hydrolyzed TEOS) and
controlled aggregation. The monomer addition model proposed by Matsoukas and
Gulari8,9 suggests a mechanism where, after an initial burst of nucleation, growth
continues through the addition of hydrolyzed silica intermediates on the particle
surface. The monodispersity of the size distribution of the silica particles was then
explained via a so-called ‘self-sharpening’ mechanism, assuming that smaller
particles grow faster than the bigger ones.10,11 The controlled aggregation model
suggested by Bogush and Zukoski12-14 suggests a continuous nucleation throughout
the reaction and aggregation of primary particles or nuclei yielding the final silica
particles. Van Blaaderen11 suggested that both mechanisms, i.e. monomer addition
and controlled aggregation are responsible for the silica formation during the
sol-gel reaction where initially silica particles are formed via aggregation and
further growth continues by addition of small hydrolyzed silica intermediates.
Another approach for the formation of silica nanoparticles via the sol-gel
reaction is the use of inverse emulsions in non-aqueous solvents, commonly called
water-in-oil emulsions.15 An emulsion is a mixture of two or more immiscible
liquids in the presence of a surfactant. An inverse emulsion is obtained when polar
water droplets are dispersed in a non-polar phase and stabilized by a surfactant.16-18
Surfactants are organic compounds that are amphiphilic in nature because their
chemical structure consists of a hydrophilic and a hydrophobic part that allows the
surfactant to remain on the interface between the polar and the non-polar phase.

Chapter 3
59
The particular arrangement of the surfactant at the water-oil interface above a
certain concentration, called the critical micelle concentration (CMC)19,20 leads to
the formation of micelles. The shape and the size of the micelle is a function of the
molecular geometry of the surfactant molecules and the surfactant concentration,
temperature, pH, and ionic strength.21-24 Two types of micelles can be
distinguished, normal micelles where the polar group of the surfactant is facing the
polar phase and the non-polar part facing the centre of the micelle (e.g. oil-in-water
emulsions) and inverse micelles where the polar groups are arranged on the water
interface pointing towards the centre of the micelle and the non-polar part is facing
the non-polar phase (e.g. water-in-oil emulsion)25-27
The inverse emulsion is of particular interest for our study due to the
possibility to synthesize a variety of inorganic particles (SiO2, TiO2 and ZrO2) with
well-controlled size using the sol-gel method.28-32 The main advantage of the
emulsion process is that it enables a better controlled microstructure and size of the
silica particles. The particle size is influenced by the water-to-surfactant ratio R,
where for a higher ratio i.e. above 1, the inverse micelle consists of bound and free
water resulting in larger size particles and for a smaller ratio, i.e. below 1, the
opposite is valid. In the latter case the water in the micelle is mostly bounded, thus
with a limited mobility, resulting in a retardation of the TEOS hydrolysis and
condensation reactions leading to smaller particle sizes.33
So far, the mechanism for silica formation via sol-gel reaction has been
studied only in aqueous solutions using techniques such as small-angle X-ray
scattering (SAXS)34-37 and liquid NMR.38-41 In this chapter, for the first time, an
attempt is made to study the mechanism of silica formation directly in the rubber
matrix. Real-time SAXS and 1H-MAS NMR measurements were performed on
rubbers to gain additional insight into the kinetics of the sol-gel reaction and
possibly the silica intermediates. In addition, the possibility to perform sol-gel
reactions in a rubbery material (NR and EPDM) at higher temperatures up to
120 C will be demonstrated in order to explore future industrial applications of
this process, such as reactive extrusion.

Chapter 3
60
3.2. Experimental section
3.2.1. Materials
The silica precursor, TEOS and the (n-hexylamine) catalyst were purchased
from Aldrich and used as received. The characteristics of the two rubbers, namely
natural rubber (NR; Tun Abdul Razak Research Centre) and ethylene-propylene-
diene rubber (EPDM; Lanxess), are shown in Table 3.1.
Table 3.1 Characteristics of rubber materials used.
Rubber type NR
SMR L
EPDM
Keltan 512
Composition [wt%]
Isoprene (1,4-cis) Ethylene/Propylene/ENB
55/41/4.3
Impurity [wt%] 0.5 /
Mw [kg/mol] ~ 800 260
Mooney viscosity
ML (1+4)
50-60 (100C) 46 (125C)
Tg [C] -65 -54
It was difficult to determine the exact molecular weight of the NR using gel
permeation chromatography (GPC), because there was always residual gel.
Literature42 suggests an approximate Mw value of 8x10⁵ g/mol and Mw/Mn = 2.3.
3.2.2 Characterization
Solid-state NMR
Solid-state NMR spectroscopy is used to follow the kinetics of the sol-gel
reaction directly inside the rubber matrix at different temperatures. The NMR
measurements were performed in collaboration with Dr. M. R. Hansen and C. at the
Max Planck Institute for Polymer Research in Mainz, Germany. Single-pulse 1H
magic-angle spinning (MAS) NMR spectra were recorded on a Bruker Avance I
spectrometer with a Larmor frequency of 700.25 MHz for 1H by using a 4.0 mm
probe.
Sample preparation: The sol-gel reactions were performed in small capillaries

Chapter 3
61
(Pyrex MAS Rotor Insert by Wilmad LabGlass) with a diameter of 2 mm, fitting
exactly in a 4.0 mm rotor. 2.5 mg of the natural rubber compound was placed in the
capillary and swollen with 2.5 µl tetraethoxysilane (TEOS, with 1% chromium
acetylacetonate as relaxation agent) in an oven at 80 °C. After 30 min, the swelling
of 50 wt% was completed and the catalyst (0.096 mol/l water-catalyst solution)
(TEOS: H2O in 1:2 ratio) was injected into the glass capillary which was finally
sealed by using a flame. The capillary was then placed into the rotor and the free
volume on top was filled with Teflon tape to ensure stable magic angle spinning
(MAS) of the rotor. The probe was preheated to the reaction temperatures of 40 C,
60 C, 80 C, 100 C and 120 C, respectively. The rotor was placed in the probe, a
MAS frequency of 5.0 kHz was applied after temperature equilibration and the
acquisition of data during the reaction was started. The whole process of sealing the
capillary until the start of the acquisition took up to 5 min. For the experiments a
dwell time of 40.0 µs was used. For every minute 16 spectra with a repeating time
of 1 s were recorded and averaged to form one spectrum. Depending on the
reaction speed the total recording time was between 64 and 1024 min.
Single pulse measurements (29Si MAS): The single pulse measurements were
performed for quantitative determination of the silica structure (Q4, Q3 and Q2).
The single-pulse 29Si MAS experiments were carried out on a Bruker Avance I
spectrometer operating at a Larmor frequency of 700.25 MHz and 139.12 MHz for
1H and for 29Si, respectively, using a 4.0 mm probe. A MAS frequency of 10.0 kHz
and proton decoupling (TPPM) were used to remove anisotropic interactions. In all
experiments a relaxation delay of 10 s and a radio frequency power of 50.0 kHz
were used corresponding to a 5.0 µs 90 degree pulse. The in-situ nanocomposites
used for the single pulse measurements were prepared in advance as follow: the
rubber samples with dimensions (10 x 10 x 1 mm3) were swollen in TEOS until an
amount of 50 wt% was achieved followed by immersion in the catalyst solution at
100 C for 15 and 60 min. The sol-gel reaction was stopped by fast immersion of
the material in liquid nitrogen. The frozen samples were transferred into a Christ
Alpha 2 - 4 freeze dryer, operated at 0.2 mbar for 2 days at 20 C, for fast removal
of the organics and minimizing the possibility for the sol-gel reaction to continue
Chapter 3
62
during the drying process.
Dynamic light scattering (DLS)
The average diameter of the inverse micelles was measured with Malvern
Zetasizer Nano ZS dynamic light scattering apparatus with a He-Ne laser as the
light source (wavelength of 632.8 nm). This apparatus was used at a scattering
angle of 173 and a temperature of 25 C. DLS measures the Brownian motion of
the particles assuming they are spherical in shape and relates this to the size of the
particles. The larger the particle, the slower the Brownian motion will be. In order
to estimate the size of the inverse micelles we used a model system based on
toluene to mimic the non-polar nature of the rubber. The toluene and water phase
(0.096 mol/l catalyst solution) were kept for 2 - 3 days to allow diffusion of
possible micelles from the water into the toluene phase. Prior to the measurement
the toluene phase was filtrated with a 100 nm filter to remove any impurities that
might influence the measurement.
Transmission electron microscopy (TEM)
Cryogenic transmission electron microscopy (cryo-TEM): measurements were
performed on a FEI Tecnai 20, type Sphera TEM instrument (operating voltage of
200 kV) The sample vitrification procedure was performed using an automated
vitrification robot (FEI Vitrobot Mark 3). A 3 l sample is applied to a Quantifoil
grid within the environmental chamber of the Vitrobot and the excess toluene was
blotted away for 2 - 3 sec. The temperature in the Vitrobot was adjusted to 4 C to
prevent evaporation of the toluene. A thin film was formed and the sample was shot
into liquid nitrogen. Liquid ethane cannot be used because toluene dissolves quite
easily in ethane. The grid containing the vitrified film was immediately transferred
to a cryo-holder (Gatan 626) and observed under low dose conditions at - 170 C. It
should be noted, that later in the text it will be referred to structure and not
morphology of the nanocomposites.
TEM Ultramicrotomy: ultrathin sections (70 - 100 nm) were obtained using a
Reichert-Jung Ultracut E microtome equipped with a diatome diamond knife for

Chapter 3
63
dry cutting for trimming (45 angle) and sectioning (35 angle) at temperature of
-140 C. The sections were placed on 200 mesh copper grid with a carbon
supportive layer. The sections were examined with the TEM Sphera instrument,
FEI Tecnai 20 (operating voltage of 200 kV).
Small-angle scattering (SAXS)
In-situ small angle X-ray scattering (SAXS) was used to allow real-time
observation of the silica growth via the sol-gel reaction in rubber as a function of
time at different temperatures. The SAXS measurements were performed at beam
line BM26/DUBBLE of the European Synchrotron Radiation Facility (ESRF) in
Grenoble, France. Time-resolved SAXS patterns were recorded with a two-
dimensional gas-filled detector (512 x 512 pixels with a 260 m pixel size) placed
at 3.5 and 7 m detector-to-sample distance. The wavelength used was = 1.033 Å.
Scattering and absorption from air were minimized by a vacuum chamber placed
between sample and detector. SAXS images were acquired every 15 sec resulting
in 240 frames during the reaction time of 60 min. Each SAXS image was corrected
for the intensity of the primary beam, absorption, sample thickness and
background. The background signal was recorded at t = 0 min for each separate
sample before the start of the sol-gel reaction.
The non-crosslinked rubber samples (NR, EPDM and SBR) were swollen to
50 wt% TEOS (NR and SBR) and 33 wt% TEOS (EPDM) in an oven at 80 C
directly into a glass capillary (d = 2 mm). The catalyst solution with ratio
TEOS/H2O = 1:2 was injected into the capillary surrounding the sample from all
sides. After the injection of the catalyst solution the capillary was sealed and
immediately placed in a specially designed pre-heated pressure cell43 that allowed
enough pressure to keep the catalyst solution in the capillary in its liquid state. A
small volume of the capillary was exposed to the X-ray beam. The time between
the addition of the catalyst solution in the capillary and the start of the sol-gel
reaction was approximately 3 min. The reaction was performed for 60 min at three
different temperatures 80, 100 and 120 C, respectively.

Chapter 3
64
Surface tension
The surface tension method provides information on the change of the surface
tension of the water (CMC determination) due to the addition of a certain chemical
compound and helps identifying whether this compound behaves as a surfactant.
The surface tension measurements were carried out at 20 C on a DCAT 11
tensiometer (Data Physics Instruments GmbH), employing a PT11 Wilhelmy plate
made of platinum-iridium equipped with automatic liquid dosing and refill unit
(LDU) for automatic dosing of the surfactant. The surfactant concentration was
gradually increased up to a final concentration in the water of 4 g/l. The decrease in
the surface tension of the water was followed.
Conductivity
The change in the conductivity as a function of the hexylamine concentration
was followed with a PW9571/60 four-point electrode cell in combination with a
PW9527 digital conductivity meter at 4000 Hz. The measurement was performed at
room temperature. Initially the conductivity of pure water was measured and later
the catalyst was gradually added in a glass vessel equipped with a magnetic stirrer
to provide better homogenization of the solution. Between each measurement the
electrode was carefully cleaned with deionised water to prevent any errors in the
measurement.
Degree of swelling
The degree of swelling of the rubber in pure water and in the catalyst solution
was determined by the following equation:
(3.1)
where M1 is the initial mass of the rubber and M2 is the mass of the swollen rubber
in TEOS after 30 min swelling time.

Chapter 3
65
3.3. Results and Discussion
3.3.1. Chemistry of silica formation via sol-gel reaction
The sol-gel reaction under either acid- or base-catalyzed conditions proceeds
in two steps: 1) hydrolysis and 2) condensation. In our case the reaction is
performed under basic conditions using hexylamine as catalyst. So far the sol-gel
reaction was performed in aqueous solutions under basic conditions in presence of
ammonia, as initially proposed by Stӧber in 1968.1 In order to synthesize the silica
particles directly inside the rubber matrix, a certain amount of the ammonia catalyst
needs to diffuse into the non-polar rubber phase to initiate the silica formation.
However, due to the large difference in polarity between the ammonia solution and
the rubber it is expected that the diffusion in the rubber is strongly retarded,
resulting in lower silica content in the obtained nanocomposite and preferred
concentration of the formed silica on the surface of the nanocomposite. Therefore,
a different type of catalyst was used, namely hexylamine, consisting of a polar
amino group and a non-polar alkyl chain (amphiphilic molecule), that is expected
to have a stronger affinity towards the rubber matrix and to lead to a higher final
silica content. Aliphatic amines are derivatives of the ammonia obtained by
substitution of the hydrogen atoms with alkyl groups. It is well known that the alkyl
groups elevate the basicity of the amines which generally increases with the
number of alkyl groups substituted.44,45 Hexylamine is a stronger base than
ammonia as reflected by its Pk value,46 and therefore a higher concentration of
hydroxyl ions will be obtained during the hydrolysis reaction, which together with
the amphiphilic properties makes hexylamine the preferred choice of catalyst for
the sol-gel reaction in the rubber matrix (NR and EPDM). The combination of good
basicity and amphiphilic properties of the hexylamine leads to in-situ
nanocomposites with higher silica content as already shown by Ikeda et al.47
The silica formation under basic conditions proceeds via an ionic mechanism where
the hydroxyl ions are used to start the hydrolysis and the condensation reaction, as
shown in Figure 3.1.

Chapter 3
66
Hydrolysis: (2) and (3) silica intermediates
Condensation: a) (1), (2) or (3) +OH- remove CH3CH2OH (or H2O)
ionic intermediates (4) and (5)
b) (4) or (5) + (1-red), (2-red) or (3-red) (6) and (7)
remove CH3CH2OH (or H2O) (8) and (9)
Figure 3.1. Chemistry of silica formation under basic conditions via an anionic mechanism.
The hydrolysis begins with the exchange of the ethoxy groups from the TEOS
molecule with hydroxyl ions, leading to formation of several partially hydrolyzed
TEOS intermediates such as: Si (OEt)3(OH) (2), Si (OEt)2(OH)2, Si (OEt)(OH)3
Dimer species Penta-coordinated complex
Ionic silica species Ionic silica species
Cyclization Linear silica species
Chapter 3
67
and the fully hydrolyzed form of TEOS, the silicic acid Si(OH)4 (3), when all
ethoxy groups are exchanged by hydroxyl groups. The substitution of the ethoxy
with hydroxyl groups results in an increase of the positive charge on the silicon
atom (hydroxyl groups are strong electron withdrawing groups) increasing the
reactivity of the hydrolyzed species and allowing each subsequent substitution to
proceed faster. This results in an increase in the hydrolysis rate with each
substituted hydroxyl group in the TEOS molecules via a so-called self-accelerating
mechanism.48
The condensation reaction is initiated by the attack of the hydroxyl ion to one
of the hydrolyzed intermediates forming a negatively charged silica intermediates
(4 and 5) and a leaving water or ethanol molecule. These intermediates are highly
reactive and very quickly react with other molecules (indicated 1 to 3 in red)
forming a penta-coordinated complex and negatively charged silica intermedaites.49
A similar self-accelerating mechanism is present for the condensation reaction as
well. The reactivity of the condensed intermediates will depend on the number of
Si-O-Si bonds formed, more Si-O-Si bonds lead to a higher reactivity. Therefore,
the larger silica intermediates consisting of more Si-O-Si bonds will be more
reactive than the smaller ones and will preferentially consume the products from
the hydrolysis reaction and grow faster into solid silica particles.50 Since
condensation may begin after the first exchange of the ethoxy with hydroxyl
groups, occurring almost instantly after the hydrolysis reaction, some ethoxy
groups may remain non-hydrolyzed due to steric hindrance and end-up trapped
inside the silica network or on the silica surface.51
This final step of the condensation is the cyclization reaction that begins with
the formation of the smallest cyclic structure, 3-ring, and later continues to produce
larger ring structures. The ring structures are favoured under stronger alkaline
conditions and particularly at higher temperatures.49 Moreover, the formation of a
ring requires breakage of the intra-molecular hydrogen bonding in the linear silica
intermediates.52-54 The presence of remnant ethoxy groups in the linear species may
lead to formation of less hydrogen bonding which can allow easier re-structuring of
the linear intermediates into a ring structure and in this way promote the cyclization

Chapter 3
68
reaction leading eventually to formation of 3D silica structure.
The reaction path of the sol-gel chemistry schematically presented in
Figure 3.1 has been documented in literature, but the role of hexylamine during the
sol-gel reaction and particularly its interaction with the growing silica intermediates
formed during reaction is unknown.
An attempt was made to explain the possible role of the cations during the
silica formation via a simulation study.55 The study was conducted under basic
conditions in the presence of two positively charged ions NH4+ and Li+. The cations
may affect the organization of the water molecules involved in the silica
condensation and increase the barrier for Si-O-Si formation due to charge
stabilization of the negatively charged silica intermediates. Moreover, the effect of
the cation is strongly dependent on its size and nature. In our case, hexylamine is a
relatively large molecule and its involvement in the silica formation is not very
clear at this moment. It is possible that it initially interacts with the negative
charges on the silica species via electrostatic interactions and in the later stages due
to the decrease of these negative charges (consumed in the silica growth) starts
interacting with the silanol groups via hydrogen bonding. Further elaboration on
the possible interactions between the hexylamine and the silica surface will be
presented in Chapter 4.
3.3.2. Mechanism of in-situ silica formation in rubber via sol-gel reaction
Ikeda et al.47 were the first to propose the hypothesis according to which the
sol-gel reaction in the TEOS-swollen rubber proceeds via the formation of inverse
micelles stabilized by hexylamine, in which hexylamine behaves not only as a
surfactant but also as catalyst. Unfortunately, no evidence was provided to support
this hypothesis. In order to explore the possibilities of this hypothesis, one must
begin by determining whether hexylamine has the potential to behave as surfactant.
Therefore, the surface tension and the conductivity were measured as a function of
hexylamine concentration. The results are shown in Figure 3.2.

Chapter 3
69
Figure 3.2: (a) Surface tension and (b) conductivity of hexylamine-water solution as a
function of hexylamine concentration.
Figure 3.2 shows initially a steep decrease of the surface tension of the water by the
addition of hexylamine (Figure 3.2 (a)) indicating indeed that hexylamine acts also
as a surfactant. At approximately - 1.25 g/l concentration of hexylamine the curve
shows a weak shoulder. The origin of this shoulder is not quite clear at the moment,
however, it might be a result of possible re-organization of the hexylamine
molecules. After a certain concentration a plateau is reached that corresponds to the
so-called critical micelle concentration (CMC). The CMC of the hexylamine, was
determined from the intercept of the two straight lines for both measurements
(surface tension and conductivity) and showed a CMC value of 0.323 g/l.
The conductivity measurement revealed the existence of charged micelles where a
clear increase in conductivity with increasing hexylamine concentration was
observed. Ions in the solution can certainly be expected because hexylamine is a
relatively strong base which deprotonates the water by accepting a proton and
forming OH- ions.
For preparing the in-situ nanocomposites the used concentration of the
hexylamine in the catalyst solution was always 9 g/l (0.096 mol/l) which is close to
the maximum solubility of hexylamine in water. Clearly, this value is much higher
than the obtained value of the CMC = 0.323 g/l and it can be said that at the
concentration hexylamine is used in the sol-gel reaction it indeed forms charged
micelles in the water.56 Upon diffusion of the catalyst solution in the TEOS swollen

Chapter 3
70
rubber, most probably the micelles convert into inverse micelles in order to allow
easier penetration of the water into the apolar rubber matrix. Direct observation of
these inverse micelles in the rubber is extremely difficult with TEM due to their
small size57 and the weak electron density contrast between the rubber matrix and
the water (and hexylamine).58
It is believed that the inverse micelles shield the polar water in their interior, by
positioning the non-polar alkyl chains of the hexylamine on the outer side of the
micelles, thus facilitating easier diffusion into the non-polar rubber phase. To check
this, the uptake of water and catalyst solution was measured by the NR matrix
(no TEOS), expressed in terms of swelling degree, as shown Figure 3.3.
0 5 10 15 20 25 30 35
0
2
4
6
8
10
12
14
16
pure water (slope: 0.138)
catalyst solution (slope: 0.443)
Sw
ellin
g d
egre
e [%
]
Time [h]
Figure 3.3. Absorption of pure water and water-catalyst solution in NR at 80 C as a function
of swelling time.
The results in Figure 3.3 indicate indeed faster of water in the presence of
hexylamine (11 % swelling degree) as compared to the absorption of pure water
(3% swelling degree) in the rubber. This means that hexylamine indeed promotes
water diffusion inside the rubber matrix possibly via the formation of inverse
micelles. Therefore we assume that the preparation of the in-situ nanosilica
particles via a sol-gel reaction in the rubber matrix proceeds via the mechanism, as
shown schematically in Figure 3.4.

Chapter 3
71
Figure 3.4.Schematic drawing of silica particle formation via sol-gel reaction in rubber
matrix.
The process of silica formation starts with the swelling of the rubber with the silica
precursor (TEOS) and immersion of the swollen rubber into the catalyst solution at
a certain temperature T and reaction time t, determined by the amount of silica
required in the final in-situ nanocomposite. The inverse micelles are expected to act
as small nano-reactors hosting the sol-gel reaction for the silica formation.27 Due to
the similar apolar nature of TEOS and hexylamine (based on the Hildebrand
parameters, 16.4 and 16.2 MPa1/2 for TEOS and hexylamine, respectively) TEOS
should diffuse easily through the alkyl chains of the hexylamine and reach the
micelle interface where hydrolysis starts. The hydrolysis of the TEOS is initiated
by the hydroxyl ions present in the water phase, via the exchange of the ethoxy
groups (see Figure 3.1). The partially hydrolyzed TEOS will have a higher polarity
than the pure TEOS due to the presence of the hydroxyl groups. As the hydrolysis
proceeds further, more ethoxy groups from the TEOS are converted leading to
further increase in polarity of the hydrolyzed TEOS. This eventually leads to
migration towards the interior of the inverse micelle where condensation preferably
continues until solid silica particles are formed.
In general, the inverse micelles are dynamic systems with tendency to
interchange and coalesce during the emulsion process. This is determined from the
nature of the surfactant which provides electrostatic or steric stabilization to the
inverse micelles.56 However, in our case the degree of interchange and coalescence
between the inverse micelles in the rubber is expected to be additionally restricted
Inverse micelle
TEOS
H2O-catalyst
solution
RubberT, time T, time
Normal micelle
H2O-catalyst
H2O
TEOS-swollen rubber
Swollen
rubber 50 nm
NR in-situ nanocomposite

Chapter 3
72
by the rubber chains that significantly impart micelle mobility. It is expected the
hexylamine to provide good stabilization due to the ionic interactions existing on
the interface between the polar amino group of the hexylamine and the water in the
micelle. The ethanol produced during the reaction, is expected initially to migrate
towards the water in the interior of the micelle due to its polar nature. In the later
stages of the reaction as silica particles grow and become denser, it can be pushed
outwards in the rubber phase.
In order to provide further evidence for the existence of the inverse micelles in
the rubber matrix, a model system using toluene (with similar apolar nature) was
prepared to mimic the rubber matrix. The model system is prepared in such a way
that the toluene and the catalyst solution were added together and left for 2 - 3 days
at room temperature to allow diffusion of the micelles from the catalyst solution
into the toluene phase. As mentioned above, these micelles are expected to convert
into inverse micelles enclosing water with the hexylamine residing on the interface,
as shown schematically in Figure 3.5 (a).
0 10 20 30 40 50
0
5
10
15
20
25
30
Pa
rtic
le n
um
be
r [%
]
Particle size [nm]
~ 5 -10 nm
H2O
(a) (b)
Figure 3.5. (a) Schematic drawing of the toluene model system and (b) size of the inverse
micelles inside the toluene phase as determined by dynamic light scattering (DLS).
The toluene phase was extracted and DLS measurements were performed in order
to detect possible inverse micelles. The DLS measurement revealed structures in
size range of 5 - 10 nm (as indicated with the lines in Figure 3.5 (b)) that can be

Chapter 3
73
attributed to inverse micelles. An attempt is made to observe the inverse micelles
also with cryo-TEM by preparing thin films of toluene with the Vitrobot under
cryo-conditions (described in section 3.2.3.). However, the TEM images could not
reveal anything conclusive, possibly due to the low electron density contrast of the
water and the toluene at cryo-conditions (- 170 C). In a next step to confirm the
presence of inverse micelles, TEOS was added only to the toluene phase
(see Figure 3.6) and allowed the system to react for 60 min at 40 C for possible
silica formation.
Figure 3.6. Schematic representation of formation of silica particles via sol-gel reaction via
a model system using toluene to mimic rubber matrix.
Figure 3.6 showed that indeed the sol-gel reaction occurred in the toluene phase
and silica particles and aggregated structures are formed as can be observed in the
TEM image. This can be used as an additional evidence for the existence of inverse
micelles in the toluene phase, because the sol-gel reaction cannot proceed in the
absence of water. The most probable way the water enter the toluene phase is via
the inverse micelles and not via spontaneous emulsification,59 because of the very
low solubility of toluene in water (approximately 0.051 %).60 The TEM image in
Figure 3.6 shows that both individual particles and aggregates are formed in the
TEOS-toluene-catalyst solution system. In order to confirm the nature of these
aggregates, an elemental analysis was performed with TEM-EDX through the
whole grid, and the results from this analysis are shown in Figure 3.7.
Toluene
H2O-catalyst
Mic
elle
diffu
sio
n
TEOS
Toluene part Silica formation
SiO2
2m

Chapter 3
74
Figure 3.7. Elemental analysis performed by TEM-EDX on (a) area of TEM copper (Cu) grid
and (b) silica aggregate extracted from toluene phase.
For the TEM-EDX an aggregate was selected because it was very difficult to focus
on one single particle. Two positions are identified in Figure 3.7, i.e. position 1 that
corresponds to the area in the near vicinity of the aggregate (the grid) and
position 2 which is located on the aggregate itself. The results from position 1
(see Figure 3.7 (a)) clearly show strong signals from the carbon (C) and the copper
(Cu) that are the building elements of the TEM grid (Cu mesh coated on one side
with carbon film). The low intensity peaks corresponding to oxygen (O) and silicon
(Si) probably originate from the remnant TEOS present on the grid. The peaks in
position 2 clearly suggest that the aggregate structure is composed of silica
particles, as indicated by the very strong peaks of the silicon (Si) and the oxygen
(O) assigned to the Si-O-Si network in the formed silica (see Figure 3.7 (b)).
Interestingly, an increase in the C peak is also observed, indicating the possible
presence of the ethoxy groups or alkyl chains of the hexylamine inside or on the
surface of the silica particles.
It is well known from emulsion polymerization processes30,61 that the
surfactant molecules usually remain on the particle surface and are removed after a
thermal treatment (calcination) at 400 C. However, in the functionalization of the
inorganic particles this is considered beneficial because it converts the usually
hydrophilic surface into a more hydrophobic one via the process of inverse
emulsion.62 In analogy, it is expected the hexylamine as surfactant to remain on the
Energy [keV]
Co
un
ts
1 2
Co
un
ts
Energy [keV]
21
(a) (b)

Chapter 3
75
surface and contribute to the hydrophobic character of the silica. The objective in
this section was to investigate how the silica nanoparticles are formed in the rubber
matrix when using hexylamine as catalyst. The results showed that hexylamine can
also behave as surfactant, thus forming inverse micelles which are used as
nano-reactors hosting the sol-gel reaction for silica formation. The sol-gel reaction
via inverse emulsion might be considered as a unique way to prepare in-situ
nanocomposites, combining in one step excellent silica dispersion and surface
functionalization.
3.3.3. Kinetics of sol-gel reaction as determined by time-resolved solid-state NMR
Many efforts have been made to understand the reaction mechanism of the
sol-gel reaction.63,64
Figure 3.8. (a) Assignments of the Q2, Q
3 and Q
4 peaks (b) reaction steps of the sol-gel
reaction. Every single grey arrow stands for a specific reaction rate constant. Quaternary
silicon tetrahedra are symbolized by Q. , , and are the numbers of ethoxy groups
(-OEt), siloxane bonds (– OSi) and hydroxy groups (– OH), respectively.
Figure 3.8 shows a schematic representation of the possible reaction steps of the
sol-gel reaction occurring during the transformation of the liquid TEOS into a solid
particle showing that there are many reaction pathways possible until a certain
condensation degree of the silica is reached. The reaction rates of each particular
(a) (b)

Chapter 3
76
pathway can vary as a result of steric and mobility hindrance of the silica
intermediates formed along the condensation reaction. This results in a non-linear
time-dependent behaviour of the sol-gel reaction in the rubber matrix, thus no rate
constants were obtained. Therefore, the complexity of the sol-gel reaction prevents
obtaining one reaction rate and, although much progress has been made in this
field, the precise reaction kinetics of the silica formation still remains unclear.
It has to be noted that, up to now the kinetics of the sol-gel reaction has only
been studied in aqueous solutions. In this study, an attempt is made to determine
the reaction kinetics directly in the rubber matrix as a function of different
temperatures (40 - 120 C) by using the proton (1H) NMR spectroscopy.
The sol-gel process in the rubber was performed in a specially designed capillary
filled with TEOS-swollen rubber and catalyst solution, placed in the NMR rotor as
described in Section 3.2.2. Both liquid and solid-state NMR signals were probed
and the results are shown in Figure 3.9.
Figure 3.9. Comparison of the 1H NMR spectra performed in the liquid-state at 7.05 T
(dashed line) and in the solid-state at 16.45 T using a HR-MAS probe and 5.0 kHz spinning
frequency.
The two 1H NMR spectra in Figure 3.9 clearly show the enhancement in resolution
using the solid-state 1H-MAS NMR technique as compared to the solution 1H NMR

Chapter 3
77
spectroscopy. The NR matrix in the reaction system leads to broad resonances that
cannot be averaged out by the common spinning frequency of 20 - 30 Hz in
solution NMR. In contrast 1H-MAS at a moderate MAS spinning frequency of
5.0 kHz is eligible to provide sharp resonance lines, which can be analyzed
quantitatively. The decrease of the ethoxy groups (TEOS) and the increase in the
ethanol peak during the sol-gel reaction was used to follow the kinetics, as shown
in Figure 3.10.
Figure 3.10. 2D reaction profiles of sol-gel reaction in NR as followed by 1H-MAS NMR
showing decrease of ethoxy groups (TEOS) and increase of ethanol. See Figure 3.9 for colour
assignments of the peaks.
The position of the characteristic protons in the TEOS (ethoxy groups), in the
ethanol and in the NR are indicated with the coloured circles shown in the
2D reaction profile in Figure 3.10. The decrease in TEOS amount during the sol-gel
reaction occurs as a result of the hydrolysis and condensation reaction during which
the ethoxy groups become hydrolyzed and incorporated in the growing silica
intermediates building the silica structure. This might result in their complete
immobilization which makes them non-detectable by NMR. Thus, one is able to
follow the ethoxy groups from the TEOS as long as the TEOS is mobile enough. In
the remainder of this chapter the TEOS molecules will be termed ethoxy groups as
being the more chemically correct term. Consequently, the amount of ethanol

Chapter 3
78
produced during each reaction pathway (see Figure 3.8) results in an increase of the
intensity of the ethanol peak with time. The increase in the ethanol peak and the
decrease in the TEOS peak reach a plateau, after a certain reaction time when no
ethanol is formed and no TEOS is consumed anymore. This indicates the end of the
sol-gel reaction in rubber and thus of the silica formation.
The resonances of the NR at 1.63 ppm (CH3) and 2.01 ppm (CH2) are clearly
separated from the signals of both the ethanol and ethoxy groups. Ethanol shows
signals at 1.16 ppm (CH3) and 3.62 ppm (O-CH2) and the ethoxy groups at
1.14 ppm (CH3) and 3.73 ppm (O-CH2).65 The O-CH2 signals can be distinguished
well enough for a quantitative analysis, while the CH3 resonances of ethanol and
ethoxy are too close to each other to be de-convoluted. The spectra were fitted with
a MATLAB algorithm to give the relative intensities of the O-CH2 signals of the
ethanol, the ethoxy groups and the intensity of the CH2 signal of the NR. Since the
signals of the NR do not change during the reaction, they are used as internal
standard for the normalization of the peak intensities of the ethanol and the ethoxy
according to the equation:
(3.2)
where ni are the moles of the ethanol and the ethoxy groups calculated from the
peak intensities, Ii and INR are the peak intensities of the ethoxy groups (and
ethanol) and the NR, Ni is the number of protons in the ethoxy groups and the
ethanol, two protons for each originating from the O-CH2 group, NNR is the number
of protons for the NR, thus four protons (CH2-CH2) and the nNR is the amount of
NR in mol which was constant in all experiments. The absolute amounts of
ethoxy and ethanol, in mol, were calculated from eq. 3.2 at each reaction
temperature. The obtained reaction curves at different temperatures in Figure 3.11
show the time dependent progression of the amount of (a) the ethoxy groups and
(b) the ethanol.

Chapter 3
79
0 200 400 600 800 1000
0
10
20
30
40
50
60
70
80
90
100
0 200 400 600 800 10000
10
20
30
40
50
60
70
80
90
100
40C
60C
80C
100C
120C
Eth
oxy [
mol]
Time [min]
(a) (b)
40C
60C
80C
100C
120C
Eth
an
ol [
mol]
Time [min]
Figure 3.11. Time-dependent progression of the amounts of (a) the ethoxy groups and (b) the
ethanol at 40, 60, 80, 100 and 120 C as recorded by 1H HR-MAS NMR during silica
formation via sol-gel reaction in the rubber matrix.
From Figure 3.11 it can be seen how the absolute amount [mol] of the ethoxy
group and of the ethanol changes with time at each temperature. As observed in
Figure 3.11 (b), the final ethanol content (the plateau level) is not the same at
higher temperatures (> 80 C) as compared to the plateau at lower temperatures.
This can be ascribed to the loss of signal intensity from the ethanol during the
NMR measurement because above 80 C the ethanol starts to evaporate. It is
known that the relaxation time of the gas molecules can be much longer as
compared to the same molecules in a liquid. The repeating time of 1 s is therefore
not enough for the gaseous ethanol molecules to relax to their initial magnetic
equilibrium state which eventually results in loss of signal intensity.
This means that the signal of the gas molecules cannot be measured during the
reaction, and will decrease with increase in temperature. It is obvious that the
end-reaction time which corresponds to the time needed for the ethanol and the
ethoxy groups to reach a plateau, is strongly dependent on temperature. Higher
reaction temperatures resulted in a significant increase in the reaction rate, thus a
shorter time to reach a plateau as shown in Figure 3.12 (a).

Chapter 3
80
Figure 3.12. (a) Time for ethanol to reach a plateau value as function of temperature, (b)
ethanol formation as a function of temperature for three different reaction times (15, 30 and
60 min).
Figure 3.12 (a) shows that the time needed for the ethanol to reach a plateau
decreased with increasing the reaction temperature from approximately 400 min at
60 C to only 40 min at 120 C. A 10 fold decrease in reaction time with the
temperature suggests that the reaction rate accelerates strongly with increasing
reaction temperature. This result is important, particularly when silica formation
needs to be done on an industrial scale via reactive extrusion, where high
temperatures and very short reaction times are required. Due to the non-linear
behaviour of the sol-gel reaction in rubber the data were not compliant to the
standard Arrhenius analysis and the activation energies were not obtained. Another
comparison between the reaction kinetics at different temperatures can be done by
following the ethanol formation (normalized to the plateau value). In Figure 3.12
(b) the results of this comparison at 15, 30 and 60 min reaction time are shown. The
ethanol content produced from the hydrolysis and condensation reaction during the
silica formation increases with the reaction temperature at equal reaction time. The
conversion of TEOS during the sol-gel reaction can be estimated using the
following equation:
60 80 100 120
20
40
60
80
100
120
60 80 100 1200
100
200
300
400
500
(b)
Am
ou
nt
of
eth
ano
l [%
]
Temperature [C]
Reaction time
15 min
30 min
60 min
T
ime
to
re
ach
a p
late
au
[m
in]
Temperature [C]
(a)

Chapter 3
81
(3.3)
where,
is the amount of silica determined from the TGA at the
end of the reaction and the is the theoretical amount of silica
(22.3 wt% for 50 wt% TEOS) calculated from the stoichiometric ratio of TEOS and
SiO2 where 1 mol of TEOS corresponds to 1 mol of formed silica (SiO2) as shown
in the following equation:
Si (OC2H5)4 +2H2O SiO2 + 4C2H5OH (3.4)
The amount of the produced silica measured with TGA after the NMR
measurements and the TEOS conversion at different reaction temperatures are
shown in Table 3.2.
Table 3.2. Conversion of the ethoxy groups (TEOS) during the sol-gel reaction in NR
nanocomposite as determined by 1H HR-MAS NMR.
The amount of silica produced at lower temperatures (60 and 80 C) is high and
close to the theoretically possible silica production (TEOS conversion is close to
90 %). For the higher reaction temperatures the amount of silica is less. This is
probably due to the partial evaporation of the TEOS and/or the catalyst at these
high temperatures (in the capillary).
Next to the kinetics of silica formation, as a next step, the quality of the silica
produced during different reaction times was determined. However, on-line
recording of 29Si NMR spectra in order to follow the development of the silica
structure is extremely difficult, due to the long relaxation times of the silicon.
Therefore, two nanocomposites were prepared ex-situ under same reaction
conditions (T = 100 C, same TEOS/catalyst ratio), varying only the reaction time.
A short reaction time of 15 min and a longer time of 60 min were chosen in order
T [C] 60 80 100 120
[wt%] 19.4 20.6 14 12.8
TEOS conversion [%] 87.1 92.3 63 57.5
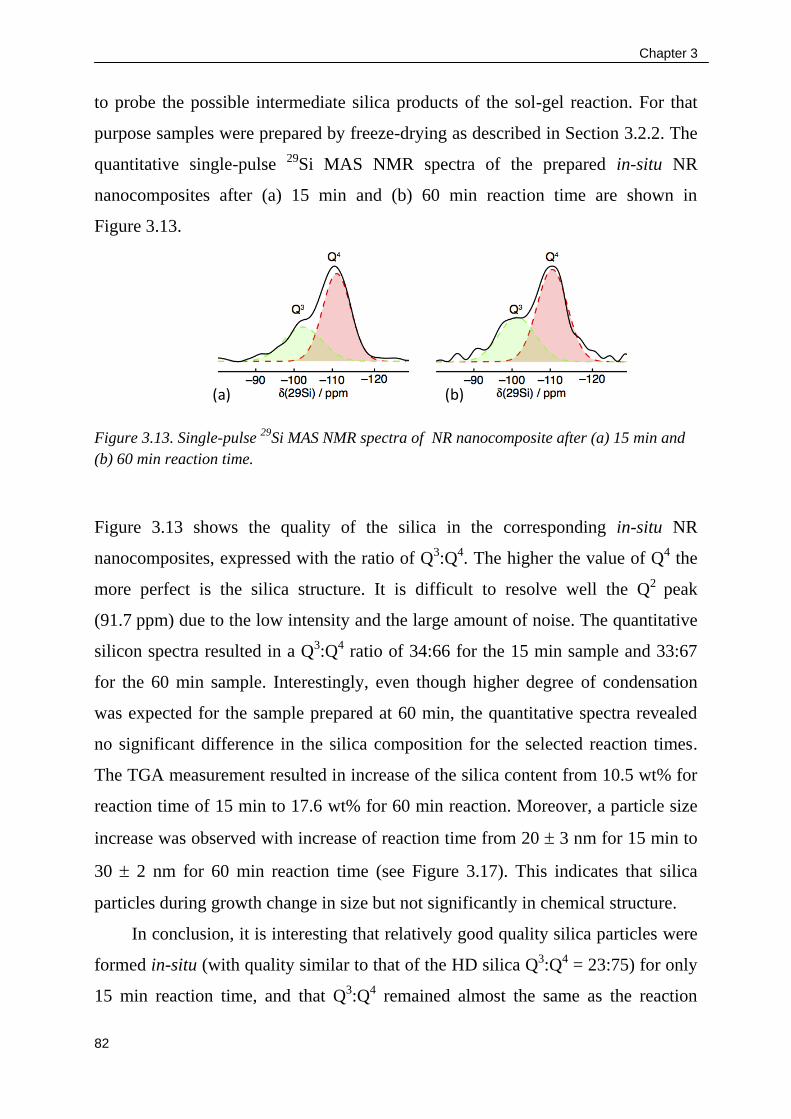
Chapter 3
82
to probe the possible intermediate silica products of the sol-gel reaction. For that
purpose samples were prepared by freeze-drying as described in Section 3.2.2. The
quantitative single-pulse 29Si MAS NMR spectra of the prepared in-situ NR
nanocomposites after (a) 15 min and (b) 60 min reaction time are shown in
Figure 3.13.
Figure 3.13. Single-pulse 29
Si MAS NMR spectra of NR nanocomposite after (a) 15 min and
(b) 60 min reaction time.
Figure 3.13 shows the quality of the silica in the corresponding in-situ NR
nanocomposites, expressed with the ratio of Q3:Q4. The higher the value of Q4 the
more perfect is the silica structure. It is difficult to resolve well the Q2 peak
(91.7 ppm) due to the low intensity and the large amount of noise. The quantitative
silicon spectra resulted in a Q3:Q4 ratio of 34:66 for the 15 min sample and 33:67
for the 60 min sample. Interestingly, even though higher degree of condensation
was expected for the sample prepared at 60 min, the quantitative spectra revealed
no significant difference in the silica composition for the selected reaction times.
The TGA measurement resulted in increase of the silica content from 10.5 wt% for
reaction time of 15 min to 17.6 wt% for 60 min reaction. Moreover, a particle size
increase was observed with increase of reaction time from 20 3 nm for 15 min to
30 2 nm for 60 min reaction time (see Figure 3.17). This indicates that silica
particles during growth change in size but not significantly in chemical structure.
In conclusion, it is interesting that relatively good quality silica particles were
formed in-situ (with quality similar to that of the HD silica Q3:Q4 = 23:75) for only
15 min reaction time, and that Q3:Q4 remained almost the same as the reaction
(a) (b)

Chapter 3
83
proceeded further. The results in this paragraph suggest a significant increase (up to
10 fold) of the kinetics of the sol-gel reaction with increase in reaction temperature.
The silica obtained via the sol-gel reaction showed remarkable good quality
(Q3:Q4) after only 15 min reaction time (at 100 C).
This result is very important because it indicates the possibility of performing
the sol-gel reaction in rubber via industrial route such as reactive extrusion (T up
to ~ 150 C and reaction time 1 - 5 min) and at the same time obtaining good
quality silica.
3.3.4. Silica formation in the rubber matrix via the sol-gel reaction as followed
with real-time SAXS
For the first time an attempt is made to follow the growth of the silica
particles directly in the rubber matrix using real time SAXS measurements. The
goal of this study is to obtain information on the development of the silica particle
size with time in two different rubber matrices. Thus EPDM and NR matrices were
used at three different temperatures, i.e. 80, 100 and 120 C during the SAXS
measurement. The increase in intensity with reaction time may be due to the
densification of the silica particles or increase in particle number during the sol-gel
reaction. SAXS covers the intensity of the scattered X-rays at small angles and is
used to study particle sizes between 5 - 100 nm depending on the detector-to-
sample distance. In our case two distances, 3.5 and 7 m, were used that enabled
study of particle sizes in the range of 5 - 50 nm. For this kind of system
synchrotron radiation is necessary because it provides a more intense
monochromatic X-ray beam that allow studies of low density objects (growing
silica) in the early stages of formation.66,67
3.3.4.1 SAXS analysis
The X-ray scattering intensity is experimentally determined as a function of
the scattering vector q which is defined as follow:
(3.5)

Chapter 3
84
where is the wavelength of the radiation and 2 is the scattering angle. The
scattering profile is measured between two extremes, qmin and qmax between which,
in general, two regimes can be established: the Porod power law regime and the
Guinier regime. The Porod regime occurs at higher q-values (usually between
0.5 < q < 2 nm-1), while the Guinier region occurs at low q-values (usually
q < 0.3nm-1). The Porod regime gives information for the surface structure of the
particle67 where I(q) and q follow a power-law relationship expressed as:
(3.6)
where the exponent has non-integer values between 1 and 4 which defines the
sharpness of the interface between the silica and the rubber matrix. Information for
the particle size can be derived from the Guinier regime. The radius of gyration Rg
can be determined from the slope of the linear dependence between I(q) and q2 in
the so-called Guinier plot (Guinier 1939). For spherical particles the relationship
between Rg and the intensity is given by eq. 3.7.68
(3.7)
(3.8)
where I0 is the intensity at q = 0. It should be noted that for spherical particles the
q-range over which the Guinier approximation is valid is qRg < 1.3.69,70 Therefore
this analysis to obtain Rg can use only a limited q-range, which usually lacks
enough points for a good fit.
For this reason another approach was considered in order to obtain the values for
the radius of gyration Rg, namely using the pair distribution function (PDF) P(r).
The main advantage of the PDF is that it provides a more reliable value for the Rg
because it takes into account the whole curve and is not limited to a small q region.
The shape of the PDF can also give an indication for the shape of the particles, as
spherical particles give a bell-shaped Gaussian curve. The PDF can be calculated
by assuming monodispersed particles with no inter-particle interactions.71,66

Chapter 3
85
(3.9)
In theory the calculation of P(r) from the intensity is simple, however, I(q) is only
known over the experimental q-range [qmin, qmax] and calculation of the Fourier
transform of sometimes incomplete and noisy data (especially at q-range in the
vicinity of qmin and qmax) requires (hazardous) extrapolation to lower and higher
angles. A solution for this could be the indirect Fourier Transform, first proposed
by Glatter in 1977 and now commonly used in SAXS software’s to calculate P(r).
The basic hypothesis is that the particles have a finite size Dmax, therefore:
(3.10)
In a next step P(r) is parameterized on [0, Dmax] by a linear combination of
orthogonal basis functions (eq. 3.10):72
(3.11)
The coefficients Cn are found by least-squares methods.66 In practice, the
estimation of Dmax by the inverse Fourier transformation involves choosing
multiple Dmax values and evaluation of the resulting P(r) functions for their fit to
the experimental scattering. The radius of gyration Rg can be determined from:
(3.12)
(3.13)

Chapter 3
86
By using equation (3.7) we can calculate the average radius of particles. The
scattering spectrum of the sample as a function of time (log-log) scale is shown in
Figure 3.14.
Figure 3.14. Log-log plot of scattering intensity as a function of scattering angle and reaction
time for sol-gel reaction in NR at 100 C.
Figure 3.14 shows the increase in the intensity with time which is related to a
change in the electron density contrast between the matrix and the newly formed
particles and to a change in the total scattering volume (particle size and/or the
number of silica particles). The same trend was observed for all reaction
temperatures in both the in-situ NR and EPDM nanocomposites. The sharpness of
the interface between the growing silica particle and the rubber matrix is
determined by the slope at high-q (Porod region) which can vary between 1 (rough
interface) and 4 (sharp interface). As shown in Figure 3.14, the slope α increased
from 3.2 at 5 min reaction time to 4 from 10 min and remained 4 until the end of
the measurement. This can indicate that silica particles reach densification
relatively fast. The size of the silica particles was determined using the pair
distribution function approach. The reliability of this method was supported by the
good fitting data between the model and the experimental results as shown in
Figure 3.15.
0.1 1
1E-8
1E-7
1E-6
1E-5
1E-4
1E-3
NR at 1000C
I (a
.u.)
q (nm-1 )
60 min
45 min
30 min
15 min
10 min
05 min
01 min

Chapter 3
87
Figure 3.15. Intensity vs. q showing the fit between the calculated from the PDF data (solid
lines) and the experimental data (symbols) for 5 and 60 min reaction time in NR and EPDM
matrix at 100 C.
The calculated pair distribution function is presented in Figure 3.16 for the NR and
EPDM nanocomposites prepared at 100 C as a function of time.
Figure 3.16. Pair distribution function (P(r)) of NR and EPDM at 100 C.
The bell-shape of the P(r) function shown in Figure 3.16 is usually characteristic
for spherical particles. However, it has to be remarked that the P(r) for NR has
slightly distorted shape (more pronounced at longer reaction times). The distortion
of the curve can originate from either not fully spherical particles (somewhat
elongated) or particles touching each other or slightly overlapping. Since from the
TEM micrographs in Figure 3.17 (c) it can be observed that the silica particles are
(a) (b)
0 5 10 15 20 25 30
0.0
5.0x10⁻⁷
1.0x10⁻⁶
1.5x10⁻⁶
2.0x10⁻⁶
2.5x10⁻⁶
3.0x10⁻⁶
3.5x10⁻⁶
EPDM at 100C
P(r
)
r (nm)
01 min
05 min
15 min
30 min
45 min
60 min
(b)
0 5 10 15 20 25 30 35
0.0
1.0x10⁻⁶
2.0x10⁻⁶
3.0x10⁻⁶
4.0x10⁻⁶
5.0x10⁻⁶
6.0x10⁻⁶
NR at 1000
C
P(r
)
r (nm)
01 min
05 min
15 min
30 min
45 min
60 min
(a)
0.1 11E-8
1E-7
1E-6
1E-5
1E-4
1E-3
NR at 100C
05 min
60 min
I (a
.u.)
q (nm-1 )
Fit
(a)
0.1 11E-9
1E-8
1E-7
1E-6
1E-5
1E-4
1E-3
0.01
EPDM at 100C
I (a
.u.)
q (nm-1
)
5 min
60 min
Fit
(b)

Chapter 3
88
indeed spherical, we might assume that the curve distortion in the NR
nanocomposite is due to touching or overlap of some particles.
Figure 3.17. Particle size development with reaction time at three different temperatures (80,
100 and 120 C) for (a) NR at 100 C and (b) EPDM, the numbers on the plot indicate the
growth rate. (c) TEM images of NR and EPDM nanocomposites at 100 C for 60 min.
Figure 3.17 presents the change in particle size with time at different temperatures.
For the EPDM and NR system it can be clearly observed that at 120 C a plateau is
reached after approximately 30 min, indicating small further change in particle size
with time. In the EPDM rubber the particle size at 100 C starts to approach a
plateau at approximately 60 min while at 80 C a longer reaction time is required.
The plateau at 80 and 100 C in the NR is reached sooner (~ 30 min) than in the
EPDM system. The growth rate (as determined from the slope of the linear part) in
the NR changes more gradually with increase in temperature, while in the EPDM a
50 nm 50 nm
EPDMNR(c)
0 10 20 30 40 50 600
5
10
15
20
0.19 nm/min
0.78 nm/min
0.17 nm/min
Pa
rtic
le r
ad
ius [
nm
]
Reaction time [min]
EPDM
80C
100C
120C
(b)
0 10 20 30 40 50 600
5
10
15
20
NR
80C
100C
120C
(a)
0.26 nm/min
0.23 nm/min
Pa
rtic
le r
ad
ius [
nm
]
Reaction time [nm]
0.18 nm/min

Chapter 3
89
sudden increase is observed at 120 C (0.78 nm/min). This can be considered as a
possible threshold at which the high temperature (120 C) promotes rather an
exponential increase in the particle growth rate. As observed from Figure 3.17 the
growth rate at each particular temperature losses its intensity for longer reaction
times until eventually a plateau is reached and particle size does not change
anymore. The reason for this behaviour can be found in the availability of the
reactive intermediates, thus negative charges available for particle growth. The
charge level depends on the degree of condensation which is the highest at the
beginning of the silica formation, resulting in fast particle growth, and lowest
towards the end, resulting in slower growth. The TEM images in Figure 3.17 (c)
show an average particle size of 27 nm for EPDM while for the NR in-situ
nanocomposite 30 nm is obtained with a discrepancy of approximately 2 nm from
the particle size obtained from the SAXS analysis. This is an excellent match
confirming further the accuracy of our method for particle size determination.
3.4. Conclusions
The complementary results from the NMR and SAXS analysis provide additional
inside into the silica formation showing the changes in the silica structure (probed
with NMR) and the silica size (probed with SAXS) changing with time and
temperature. The increase in temperature from 40 to 120 C resulted in a 10 fold
increase in the reaction rate leading to almost complete formation of the silica
particles for only 10-15 min from the beginning of the reaction. Moreover, the
structure of the silica based on the Q3:Q4 ratio as obtained from the solid-state NMR
measurements showed that the silica structure is almost fully formed and for longer
reaction times it does not change significantly, indicating that silica particles
continue to increase only in particle size. This is valuable information particularly
during the reactive extrusion where silica formation proceeds under relatively short
reaction times (the higher is the temperature, the shorter reaction times are
expected) providing a good basis for potential use under extreme reaction
conditions.

Chapter 3
90
3.5. References
[1] W.Stober et al.,Journal of Colloid and Interface Science;26;62;1968
[2] C.R.A.Catlow et al.,Angewandte Chemie International Edition;44;3082-3086;2005
[3] E.Jan Meijer et al.,Physics and Chemistry;10;1775-1782;2009
[4] T.T.Trinh et al.,Journal of Physics and Chemistry:part B;110;23099-23106;2006
[5] Jin Sun et al.,Journal of Polymer Science: part B;45;2594-2602;2007
[6] L.Ladouce-Stelandre;Rubber Chemistry and Technology;76;145-159;2003
[7] S.Choi,Korea Polymer Journal;9;45-50;2001
[8] E.Gulary et al.,Journal of Colloid and Interface Science;132(1);1989
[9] V.M.Masalov et al.,Nanotechnology;22;275718;2011
[10] G.H.Bogush et al.,Journal of Non-Crystaline Solids;104;95-106;1988
[11] A.van Blaaderen et al.,Journal of Colloid and Interface Science;154(2);1992
[12] G.H.Bogush et al.,Journal of Colloid and Interface Science;142(1);1-18;1991
[13] J.H.Zhang et al.,Journal of Material Research;18;649653;2003
[14] G.H.Bogush et al.,Journal of Non-Crystaline Solids;104;95-106;1988
[15] K.Osseo-Asare et al.,Colloids and Surfaces A;154;311-326;1999
[16] K.Mullen et al.,Polymer International;57;181-202;2008
[17] C.J.Barbe et al.,Journal of Sol-Gel Science and Technology;46;393-409;2008
[18] F.J.Arriagada et al.,Colloids and Surfaces; 69;105-115;1992
[19] E.Fuguet et al.,Analytica Chimica Acta;548;95-100;2005
[20] S.K.Hait et al.,Journal of Physical Chemistry:Part B;107;3650-3658;2003
[21] K.Landfester,Angewandte Chemie International Edition;48;4488-4507;2009
[22] C.J.Barbe et al.,Journal of Sol-Gel Science and Technology;46;393-409;2008
[23] Y.Xu et al.,Materials Enginering;293;149-154;2008
[24] K.Osseo-Asare et al.,Journal of Colloid and Interface Science;218;68-76;1999
[25] C.Guizard et al.,Materials Research Society Symposium;121;1988
[26] K.S.Finnie et al.,Langmuir;23;3017-3024;2007
[27] K.Osseo-Asare et al.,Journal of Colloid and Interface Science;211;210-220;1999
[28] F.Debuigne et al.,Langmuir;16;7605-7611;2000
[29] K.Osseo-Asare et al.,Colloids and Surfaces A;154;311-326;1999
[30] K.Landfester et al.,Chemistry of Materials;20;5768-5780;2008
[31] S.Oh et al.,Journal of Colloidal and Intrefacial Science;266;107-114;2003
[32] T.Jesionowski,Materials Chemistry and Physics;113;839-849;2009
[33] C.Guizard et al.,Materials Research Society Symposium;121;1988
[34] W.L.Vos;Langmur;13;6120-6129;1997
[35] G.Sankar et al.,Microporous and Mesoporous Materials;101;134-141;2007
[36] Y.Xu et al.,Colloids and Surfaces A: Physicochemical and Engineering
Aspects;305;97-104;2007
[37] Y.Xu et al.,Journal of Sol-Gel Chemistry;36;327-344;2007
[38] J.C.Pouxviel et al.,Journal of Non-Crystaline Solids;89;345-360;1987
[39] Y.Xu et al.,Journal of Non-Crystaline Solids;42;13-20;2007
[40] M.T.Harris et al.,Journal of Non-Crystaline Solids;315;166-179;2003
[41] J.A.Martens et al.,Journal of Physical Chemistry C;115;3562-3571;2011

Chapter 3
91
[42] McGraw-Hill,‘Rubber Engineering’,Tata McGraw-Hill company;New Delhi;1998
[43] E.Vinken,PhD thesis:‘Polyamides:Hydrogen bonding, the Brill transition, and
superheated water’;2008
[44] R R.Taft,‘Steric effects in Organic chemistry’;Chapter 13;New York;Wiley;1956
[45] F.H.Van Cauwelaert et al., Discussions of the Faraday Society;52;66-76;1971
[46] http://www.zirchrom.com/organic.htm
[47] Y.Ikeda at al.,Journal of Sol-Gel Science and Technology;45;299-306;2008
[48] C.Jeffrey Brinker et al.,‘Sol-gel Science’;Academic Press;1990
[49] A.P.J.Jansen et al.,Journal of American Chemical Society;133;6613-6625;2011
[50] R.K.Iler,‘The chemistry of silica’;Chichester;Wiley-Interscience;1979
[51] A.van Blaaderen et al.,Journal of Non-Crystaline Solids;149;161-178;1992
[52] T.T.Trinh et al.,Journal of Physical Chemistry B;110;23099-23106;2006
[53] E.J.Meijer et al.,Physical Chemistry;11;5092-5099;2009
[54] J.C.G.Pereira et al.,Journal of Physical Chemistry A;103;3252-3267;1999
[55] E.Jan Meijer, et al.,Physical Chemistry;10;1775-1782;2009
[56] H.S.Fogler et al.,Langmuir;13;3295-3307;1997
[57] M.Smaihi et al.,Polyhedron;25;1763-1770;2006
[58] K.R.Harris,Journal of Chemical Engineering Data;45;893-897;2000
[59] K.Tauer et al.,Journal of Colloidal and Interfacial Science;312;432-438;2007
[60] http://www.chemical-ecology.net/java/solvents
[61] K.Landfester et al.,Angewandte Chemie International Edition;48;4488-4507;2009
[62] V.Khrenov et al.,Macromolecular Chemistry and Physics;206;95-101;2005
[63] L.W.Kelts et al.,Journal of Non-Crystaline Solids;83;353-374;1986
[64] Y.Hui et al.,Journal of Non-Crystaline Solids;112;449-453;1989
[65] T.I.Suratwala et al.,Journal of Non-Crystaline Solids;316;349-363;2003
[66] C.D.Putnam et al.,Quarterly Reviews of Biophysics;40(3);191-285;2007
[67] O.Kratky and O.Glater,‘Small angle X-ray scattering’;Academic press;1982
[68] D.J.Tobler et al.,Geochimica et Cosmochimica Acta;73;5377-5393;2009
[69] A.F.Craievich,Materials Research;5(1);1-11;2002
[70] M.T.Harris et al.,Journal of Colloidal and Interfacial Science;266;346-358;2003
[71] M.H.J.Koch et al.,Quarterly Review of Biophysics;36;147-227;2003
[72] S.Hansen,Journal of Applied Crystallography;24;541-548;1991

The structure of silica nano-particles synthesized via sol-gel
reaction in relation to the mechanical properties of the in-situ
nanocomposites
Abstract
This chapter offers a possible explanation for the improved mechanical properties of
in-situ rubber nanocomposites. These properties are strongly related to the
rubber-silica interactions, as determined by the surface chemistry of the silica. The
structure of the in-situ silica, mapped by MAS- NMR, indicated the presence of
remnant ethoxy groups inside and on the silica surface and hexylamine residing only
on the silica surface. This resulted in formation of so-called ‘hairy’ silica particles
with a more hydrophobic nature. Different mechanisms responsible for the Payne
effect of the in-situ nanocomposites (than commonly known for the conventional
nanocomposites) are discussed in view of the obvious absence of a filler-filler
network. The particular surface chemistry of the silica and morphology of the in-situ
nanocomposites resulted in very high bound rubber content and excellent mechanical
properties (as determined by RPA measurements).

Chapter 4
93
4.1. Introduction
Commercially available silica (precipitated, fumed, etc) is an amorphous
material consisting of silicon and oxygen atoms connected in a non-regular 3D
network of Si-O-Si bonds with silanol groups (Si-OH) present inside the structure
and on the surface. The chemical composition and the physical properties such as
pore size, surface area, density and number of silanol groups are largely responsible
for the utility of this material in various applications such as catalysis, separations
operations and composite materials. The silanol groups are considered responsible
for the high polarity of the silica.1,2,3 The distance and the arrangement of the
silanol groups on the silica surface can differ depending on the production route,
but in general three different types of silanol groups can be distinguished: isolated
silanols that have only one OH group not hydrogen-bonded to neighbouring
silanols, vicinal silanols that contains hydroxyl groups close enough to develop
hydrogen interactions and geminal silanols where two OH groups are located on
one silicon site. Several extensive studies were conducted using NMR4-7 and
FTIR9-12 techniques for complete mapping of the surface of highly dispersible (HD)
silica.
A similar structure of amorphous silica is expected to be obtained with the
sol-gel process, where by means of hydrolysis of alkoxy silanes and subsequent
condensation in the presence of catalyst, silica particles can be obtained.13,14 During
the hydrolysis reaction the alkoxy silane is not always fully hydrolyzed into a
silicic acid but some alkoxy groups may remain un-hydrolyzed. These groups can
be trapped during the sol-gel reaction in the silica structure or on the surface. The
possible presence of alkoxy groups in the in-situ silica was briefly reported
earlier 15,16 indicating, for the first time, a possible different chemical structure of
the silica obtained via the sol-gel reaction. The sol-gel reaction can be used as an
alternative technique for silica formation in rubber materials for the purpose of
reinforcing. Improved reinforcement by incorporation of fillers is reflected in the
improvement of the mechanical properties (tensile strength, abrasion resistance,
tear resistance and static and dynamic moduli). The reinforcement is commonly
expressed via the Payne effect which is assumed to be related to the breakdown of

Chapter 4
94
the filler-filler network in the rubber nanocomposite, observed as a drop in the
modulus (the elastic modulus G’ or the complex modulus G*) with increase in
strain. The difference between the modulus at low strain and the modulus at high
strain is often used as a measure of the Payne effect. By comparing different types
of filler it was found that the Payne effect is directly related to several properties of
the filler, such as surface area, amount of filler, dispersion and surface chemistry of
the filler.17-25
The in-situ nanocomposites reinforced with silica formed via the sol-gel
reaction, showed better mechanical properties as compared to the conventional
nanocomposites.26-28 The in-situ nanocomposites consist of uniformly distributed
single silica particles for which no particle-particle network formation is observed.
Thus, the commonly accepted belief that the Payne effect originates only from the
filler-filler network breakdown can be doubted, particularly since the effect was
observed for rubber nanocomposites with low amount of filler (~ 5 wt%),29
supported with additional electrical conductivity measurements done by Funt,30
showing that the Payne effect may even exist in the absence of a filler-filler
network. This was accompanied by a study from Sternstein and Zhu31,32 who
claimed that the origin of the Payne effect is not only in the filler structure
formation-destruction but also in the nature of the matrix. Based on this the authors
proposed the so-called theory of trapped entanglements. The trapped entanglements
are formed as a result of temporary bonding of rubber chains to the filler surface.
These entanglements are not only expected to impede the mobility of the polymer
segments in direct contact with the silica surface but also the mobility of other
polymer chains leading to a change in the overall entanglement density of the
matrix.
The improved rubber-silica interactions strongly depending from the polarity
of the rubber (discussed in chapter 2) most probably will allow more intensive
anchoring of rubber chains on the silica surface resulting in a larger number of
trapped entanglements and consequently a greater effect on the overall
entanglement density of the matrix.33 The rubber-silica interactions were considered

Chapter 4
95
to be the key parameter for the improved reinforcement in rubber nanocomposites
that triggered an extensive number of studies34-36 emphasizing their importance in
the mechanisms responsible for the rubber reinforcement.
The improved mechanical properties of the in-situ nanocomposites when
compared to the conventional were ascribed to the uniform particle dispersion,
existence of single particles instead of aggregates and the possible stronger rubber-
silica interactions. The stronger rubber-silica interactions expected in the in-situ
nanocomposites were assigned to possibly less silanol groups present on the silica
surface, resulting in lower hydrophilicity of the silica. Up to now, several studies
37-39 have suggested, but never proved that there might be indeed less silanol groups
on the in-situ silica surface responsible for the improved rubber-silica interactions
in the in-situ nanocomposites. Usually the bound rubber40 is used as an indirect tool
to estimate the intensity of these rubber-silica interactions, because it is directly
related to the surface chemistry of the filler. The importance of the silica surface
can also be seen in the various modification techniques41,42 for converting the silica
surface into more hydrophobic and in that way improving the rubber-silica
interactions and the compatibility with the rubber matrix.
Another disadvantage the rubber/silica conventional nanocomposites are
facing in the current rubber industry is the ethanol produced during the silanization
reactions. Removal of ethanol is very difficult because it has tendency to hydrogen
bond with the silanol groups on the silica surface.43 Particularly for the in-situ silica
this might represent a problem because large amounts of ethanol are produced
during the sol-gel reaction. For that reason in this chapter an effort will be made to
detect the possible presence of ethanol. Moreover, there is a serious lack of
information regarding the chemical structure of the obtained silica via the sol-gel
reaction and consequently little or no understanding of the rubber-silica
interactions, and therefore of the nature of the interface between the silica particle
and the rubber matrix. Therefore, the focus in this chapter will be on a detailed
chemical mapping of the silica made via sol-gel reaction in rubber matrix and its
effect on the dynamic mechanical properties of the in-situ silica nanocomposites.

Chapter 4
96
4.2. Experimental section
4.2.1. Materials
The silica precursor, TEOS and the (n-hexylamine) catalyst were purchased
from Aldrich and used as received. The characteristics of the two rubbers, namely
natural rubber (NR; Tun Abdul Razak Research Centre), and ethylene-propylene-
diene rubber (EPDM; Lanxess), are shown in Table 4.1. The type of silica used for
conventional mixing is Zeosil 1165 MP produced by Rhodia, known as a highly
dispersible (HD) silica commonly used in the rubber industry for the production of
‘green’ tires. It has a BET surface area of 150 m2/g and an average particle size of
10 - 20 nm.
Table 4.1 Characteristics of rubber materials used.
Rubber type NR
SMR L
EPDM
Keltan 512
Composition
[wt%]
Isoprene (1,4-cis) Ethylene/Propylene/ENB
55/41/4.3
Impurity [wt%] 0.5 /
Mw [kg/mol] ~ 800 260
Mooney viscosity
ML (1+4)
50-60 (100C) 46 (125C)
Tg [C] -65 -54
It was difficult to determine the exact molecular weight of the NR using gel
permeation chromatography (GPC), because there was always residual gel.
Literature 44 suggests an approximate Mw value of 8x10⁵ g/mol and Mw/Mn = 2.3.
Preparation of conventional EPDM nanocomposite (~10 wt% silica)
The conventional nanocomposites were prepared in an internal mixer
(V = 390 cm3) with tangential rotors and a fill factor of ~ 70 vol%. The starting
temperature was 50 C and the rotor speed was adjusted to reach temperatures
above 140 C. Usually for 10 wt% silica, a rotor speed of 110 rpm was enough to
achieve the desired temperature (140 - 170 C). The actual temperature of mixing

Chapter 4
97
was kept at 140 - 160 C, regardless whether a coupling agent was used or not, in
order to maintain equal processing conditions for all samples. In the presence of
TESPT coupling agent the temperature must be above 140 C to start the
silanization reaction but below 170 C to prevent crosslinking of the rubber due to
sulphur release from the coupling agent.
The mixing was performed in two steps. In the first step ZnO, stearic acid, half the
amount of silica and half the amount of TESPT (if used) were added to the rubber
and in the second step the remaining components were added. The mixing time of
all components in the internal mixer was approximately 6 min. At the end, the so
called ‘dump’ temperature of the mixture was measured. The dump temperature
should be always above or equal to 140 C to ensure that the silanization reaction is
completed. The compound formulations used are shown in Table 4.2.
Table 4.2. Mixing parameters for EPDM conventional nanocomposites.
c Coupling agent (TESPT)
* Silica content of conventional nanocomposites as determined by TGA
It should be noted, that the silica content as measured by TGA was lower than
when calculated from Table 4.2. In the rubber world the unit phr (parts per
hundred rubber) is a commonly used measure because it simplifies the preparation
of the formulations for the production of the conventional rubber/silica
nanocomposites. In this text we will always refer to wt% of silica instead of phr. It
should be noted that the content of inorganics (silica and ZnO) in the conventional
nanocomposites was determined by TGA (averaged over two measurements) and
the silica content was obtained after subtraction of the ZnO. The amount of silane
Components [phr] 15 phr
(10 wt%)*
15 phrc
(11 wt%)*
EPDM/Keltan 512 100 100
Silica/ZEOSIL 1165 MP 15 15
Oil/Sunpair 2280 10 10
Stearic acid 1 1
ZnO 5 5
Silane/TESPT 0 1.2
Total 131 132.2

Chapter 4
98
(TESPT) used was 8 wt% with respect the amount of silica added to the sample.
Even though the rubber compounds were not intended for vulcanization, stearic
acid and ZnO were additionally added in order to approximate the same preparation
conditions for the nanocomposites on an industrial scale. The ZnO is used as
activator and the stearic acid as plasticizer and co-activator in the curing reaction
(when performed).
Preparation of in-situ (EPDM and NR) nanocomposites
The target was to prepare NR and EPDM in-situ nanocomposites with fixed
amount of silica of ~ 1 and ~ 10 wt% (see Table 4.3). The in-situ nanocomposites
were prepared as described by Ikeda et al.55 Compression moulded rubber sheets
with dimensions of 10 x 10 x 1.5 mm3 were swollen in TEOS and then immersed in
a hexylamine solution at 80 C. The in-situ nanocomposites were dried for 72 h at
50 C under vacuum. A catalyst concentration in water of 0.096 mol/l and a
constant weight ratio of H2O:TEOS (5:1) was used.55
Table 4.3. Preparation of in-situ NR and EPDM nanocomposites with 1 and 10 wt% silica
at 80 C.
It should be noted, that maximum swelling of EPDM rubber in TEOS at 80 C was
33 wt%.
Preparation of in-situ silica powder
In-situ silica powder was prepared in the absence of rubber using 50 ml of
TEOS mixed with 250 ml of an aqueous solution of hexylamine (0.096 mol/l),
corresponding to 5:1 weight ratio of H2O:TEOS. The sol-gel reaction proceeded
in-situ NR nanocomposite
Silica [wt%] TEOS amount
[wt%]
Reaction time
[min]
1 23 3
10 50 60
in-situ EPDM nanocomposite
1 23 15
10 33 600

Chapter 4
99
under intense stirring for 2 h at 40 C until a milky mixture was obtained. The
mixture was allowed to evaporate overnight in the fume-hood and then dried in an
oven for 72 h at 50 C under vacuum. The dried silica powder was additionally
heated for 48 h at 110 C under vacuum and a nitrogen flow in order to remove any
remnant solvent. The HD silica was also dried for 48 h at 110 C under vacuum and
a nitrogen flow.
Bound rubber determination
In-situ and conventional rubber/silica nanocomposites with various silica
amounts were immersed in THF, which is good solvent for the three rubbers. The
ratio between the rubber/silica nanocomposites and the solvent was kept constant
(2 % w/v) and the samples were immersed in the solvent for 48 h at room
temperature while shaking. The residues were dried for 72 h at 50 C under
vacuum. The bound rubber content was calculated as following:
(4.1)
where, is the weight of the sample after solvent treatment in (g),
is the weight of sample before solvent treatment in (g) and the is the weight
of silica in (g) in the nanocomposite.
4.2.2. Characterization
Thermogravimetric analysis - Infrared spectroscopy - Mass spectroscopy
(TGA-FTIR-MS)
The TGA-FTIR-MS measurements were performed in collaboration with
Prof. Dr. Olivier Persenarie at the MateriaNova Institute in Mons, Belgium. The
purpose of the measurements was to determine the organic components released
from the in-situ silica at a particular temperature. The thermo-gravimetric analyses
were performed on a TGA Q5000 from TA Instruments using nitrogen as purge
gas. The analysis of the gases evolved during the thermal degradation was carried

Chapter 4
100
out with a Bruker Tensor 27 FTIR spectrometer. Spectra were recorded (4000 to
600 cm-1) owing to a gas cell heated at 225 °C and a mercury cadmium telluride
(MCT) detector. The MCT detector is a photon (or quantum) detector that depends
on the quantum nature of radiation and also exhibits very fast response. The MCT
detectors must be maintained at liquid nitrogen temperature to be effective. In
general, the MCT detector is faster and more sensitive than the deuterated
triglycinesulfate (DTGS) detector. The evolved gases were also analyzed by mass
spectrometry on a Thermostar quadrupolar apparatus from Balzers Instruments
covering a mass range from 0 to 300 amu. Evolved gases were ionized by electron
impact (70 eV). The simultaneous analysis of evolved gases by FTIR and MS
spectrometers were made possible by a double coupling device. It consists of a
Teflon-coated stainless steel « T » connexion which was heated at 225 °C thus
avoiding any condensation of evolved gases. To this connexion the mass
spectrometer is connected via a one-meter long quartz capillary
(inner diameter = 150 µm) heated at 200 °C, and the gas cell of the FTIR
spectrometer is connected through a one-meter long stainless steel tube
(inner diameter: 2 mm) heated at 225 C (N2 flow of 25 ml/min, heating rate
20 /min).
X-ray photoelectron spectroscopy (XPS)
The XPS technique is a surface analysis method that provides information for
the chemical composition of the material surface based on the obtained binding
energies (eV). The measurements are carried out with a Thermo Scientific K-
Alpha, equipped with a monochromatic small-spot X-ray source and a 180° double
focusing hemispherical analyzer with a 128-channel detector. Spectra were
obtained using an aluminium anode (Al Kα = 1486.6 eV) operating at 72 W and a
spot size of 400 µm. Survey scans were measured at a constant pass energy of
200 eV. The background pressure was 2 x 10⁻⁹ mbar and during measurement
4 x 10⁻⁷ mbar of Argon was used for the charge compensation as dual beam source.
Dual beam source means that electrons and ions are present in the beam and since
electrons are leaving there is charging of the sample. These low energy ions (no

Chapter 4
101
sample damage) should compensate for the charging, because otherwise we might
expect a shift in the values of the obtained binding energies and incorrect
assignment of the appearing peaks.
Magic angle spinning (MAS) Solid-state NMR
The purpose of this technique was to provide in-depth knowledge for the
chemical structure of the in-situ silica. The NMR measurements were performed in
collaboration with Dr. M. R. Hansen and Cornelius Friedrich at the Max Planck
Institute for Polymer Research in Mainz, Germany. The single-pulse 1H
magic-angle spinning (MAS) NMR spectra were recorded on a commercial Bruker
Avance I spectrometer with a Larmor frequency of 700.25 MHz for 1H using
25.0 kHz MAS in a 2.5 mm probe. 2D 1H-1H double quantum-single quantum
(DQ-SQ) correlation spectra were performed on a Bruker Avance III with a 1H
resonance frequency of 850.27 MHz using a 2.5 mm probe and 25 kHz MAS
spinning. For dipolar recoupling, excitation and reconversion of DQ coherences,
we have used the Back-to-Back (BaBa) pulse sequence with a recoupling and
reconversion time of 2 rotor periods, i.e. 80 µs. Both single-pulse 29Si and 29Si{1H}
cross-polarization/magic-angle spinning (CP/MAS) experiments were carried out
on a Bruker Avance I spectrometer operating at a Larmor frequency of
700.25 MHz and 139.12 MHz for 1H and for 29Si, respectively, using a 4.0 mm
probe. A MAS frequency of 10.0 kHz and proton decoupling (TPPM) were used to
remove anisotropic interactions. In all experiments an r.f. frequency of 50.0 kHz
was used corresponding to a 5.0 µs 90 degree pulse. For the single-pulse 29Si MAS
NMR spectra a relaxation delay of 10 s was used, while for the 29Si{1H} CP/MAS
measurements we used a delay of 1.5 s. The CP contact time was set to 4.0 ms. In
the 29Si{1H} heteronuclear correlation experiments (HETCOR) the indirect
dimension was sampled in 128 steps using a dwell time of 30.0 µs. The 13C{1H}
HETCOR spectrum was recorded on the same NMR spectrometer with a resonance
frequency of 176.08 MHz for 13C in a 4.0 mm probe. A MAS frequency of 5.0 kHz
and 1H TPPM decoupling during acquisition were applied. A relaxation delay of 3 s
was used and the indirect dimension had 64 steps for a dwell time of 50.0 µs. The

Chapter 4
102
CP contact time was set to 3.0 ms. The 15N{1H} CP/MAS experiment was
performed on a Bruker Avance II operating at a 15N Larmor frequency of
30.43 MHz and 300.23 MHz for 1H. A relaxation time of 3 s, 5.0 kHz MAS, 1H
TPPM decoupling, and a CP contact time of 5.0 ms were used. The 13C{1H} WISE
NMR experiment was also carried out on that spectrometer with a Larmor
frequency of 75.49 MHz for 13C. The spectrum was recorded at 4.0 kHz MAS
using a 7.0 mm probe with a CP contact time of 3 ms. To prevent spinning
sidebands in the 13C dimension the TOSS technique (total suppression of spinning
sidebands) was applied.
Infrared spectroscopy (FT-IR)
Infrared spectra were recorded on conventional and in-situ silica powder
samples using an Infrared EX Calibur spectrometer equipped with a Ge/KBr beam-
splitter and a wide-band DTGS detector, in reflection mode at room temperature.
The spectra were recorded in the range of 4500 - 650 cm-1 and 100 scans were co-
added for each measurement to have sufficient signal-to-noise ratio.
Rubber process analyzer (RPA)
The RPA is a specially designed rheometer for studying the dynamic
mechanical properties of rubber materials. It contains a grooved die that prevents
slippage of the material during the measurements at high strains (> 100 %). It
generally measures the torque in the testing sample caused by the applied
deformation. By applying a Fourier transformation the torque is divided into an
elastic and viscous component that characterizes the dynamic mechanical
properties of the material. Measurements were performed using RPA 2000 tester
from Alpha technologies at 100 °C and a frequency of 0.50 Hz. The strain sweep
was performed in the range of 0.56 to 1250 % strain.
Transmission Electron Microscopy (TEM)
The morphology of the nanocomposites was studied using the TEM. Ultrathin
sections (70 - 100 nm) were obtained using a Reichert-Jung Ultracut E microtome
equipped with a diatome diamond knife for dry cutting for trimming (45 angle)

Chapter 4
103
and sectioning (35 angle) at temperature of - 140 C. The sections were placed on
200 mesh copper grid with a carbon supportive layer. The sections were examined
with the TEM Sphera instrument, FEI Tecnai 20 (operating voltage of 200 kV). It
should be noted, that later in the text it will be referred to structure and not
morphology of the nanocomposites.
4.3. Results and Discussion
4.3.1. Chemical structure of in-situ silica particles with FTIR
The in-situ silica in powder form used for the measurement was prepared as
elaborated in Section 4.2.1. Infrared spectroscopy is well-known technique that can
provide chemical mapping of the various structural units on the silica surface using
their corresponding vibration bands. Infrared spectra of the in-situ and HD silica
were recorded as shown in Figure 4.1.
4500 4000 3500 3000 2500 2000 1500 1000 500 0
0.00
0.05
0.10
0.15
0.20
0.25
0.30
0.35
0.40
(b)5
43
2
Ab
so
rba
nce
Wavenumber [cm-1]
Conventional silica
In-situ silica
1
Assignments [cm-1
] In-situ
silica
Conventional
silica
(1) as Si-O-Si 1084.5 1063.5
(2) as Si-OH/Si-O 950.4 962.3
(3) as Si-O-Si 800.4 800.5
(4) Si-O-Si 3300-3500 3300-3500
(5) O-H streching ~1200 ~1200
(a)
Figure 4.1. (a) FTIR spectra of in-situ and HD silica, (b) table with assignments of 1-5 peaks.
The FTIR spectra of in-situ and HD silica in Figure 4.1 show several characteristic
peaks, indicated as 1 to 5 in Figure 4.1, (b). The vibrations of the asymmetric
stretching of the Si-O-Si bonds are mainly in the range of 1000 - 1200 cm-1. The
very intense broad band, appearing at 1063 cm-1 for the in-situ silica and 1084 cm-1
(a)

Chapter 4
104
for the HD silica (peak 1) is assigned to a vibration perpendicular to the Si-O-Si
bond while the weak shoulder appearing around 1200 cm-1 (peak 4) is assigned to a
vibration parallel to the Si-O-Si bond.45, 46 The symmetric stretching vibration of
Si-O-Si appears at 800 cm-1 (peak 3) and the Si-O in-plane stretching vibration
from the silanol (Si-OH) groups appears at 950 cm-1 for the HD silica and at
962 cm-1 for the in-situ (peak 2). 47
The Si-O-Si network has another particular vibration in its bending mode appearing
in the range of 465 - 469 cm-1 which in our case was not observed due to the
limiting wavelength range of the FTIR instrument (650 cm-1).48 It should be noted
that the same vibration bands for both silica’s exhibit slightly different values. This
might originate from the unequal concentrations of the corresponding chemical
groups in both silica materials. Of our particular interest is peak 2, assigned to the
Si-OH groups. This peak for the in-situ silica resembles more a low intensity
shoulder than a well resolved peak when compared to the HD silica, indicating a
possible lower presence of silanol groups on the in-situ silica surface.
Unfortunately, from the spectra in Figure 4.1, (a) it was difficult to distinguish the
individual presence of each type of silanol group, isolated, geminal and vicinal
assigned to the following vibrations 3749 cm-1, 3736 cm-1 and 3745 cm-1,
respectively.2 Another indication for possible less silanol groups present on the in-
situ silica could be the intensity of water peak (peak 5), appearing in the range of
3300 - 3500 cm-1 and assigned to the O-H stretching. For the in-situ silica, the
water band seems too weak and broad to be clearly observed, while for the HD
silica it shows a somewhat higher intensity indicating a possibly higher water
content. This might indeed suggest a more hydrophobic nature of the in-situ silica
as compared to the conventional.
It can be expected the FTIR spectra of in-situ silica to reveal also the presence
of ethoxy groups, due to the incomplete hydrolysis of the alkoxide precursor
(TEOS), remnant TEOS and ethanol that is released as by-product during the
sol-gel reaction. The ethanol can be either trapped inside the silica structure or be
hydrogen bonded to the silanol groups on the surface.49,1 The characteristic peak

Chapter 4
105
assignments for these components are shown in Table 4.4.
Table 4.4. Assignments of TEOS, ethanol and silica.50-53
As can be seen in Figure 4.1, since some of the ethanol (1050 and 1089 cm-1) and
TEOS (1102 and 1168 cm-1) peaks appear in the same region as the Si-O-Si
vibrations, conclusions based solely on the FTIR results cannot be made. For the
inverse emulsion the surfactant usually remains on the particle surface and is
removed by calcination.54 In analogy, assuming in-situ silica is formed via inverse
micelles in the rubber matrix, as suggested by Ikeda et al.,55 one may expect to
observe in the FTIR spectra of the in-situ silica also hexylamine with the
characteristic vibration of the C-N bond (1000 - 1250 cm-1).56 However, no trace of
a C-N bond was found in the recorded spectra.
4.3.2. Solid state NMR for silica structure determination
From physical and chemical perspective the structure of the in-situ silica is
very important because it is indicative for the successfulness of the sol-gel reaction
(full hydrolysis of the TEOS with no remnant ethoxy groups) and it significantly
influences future applications of this material. For that reason detailed analysis of
the chemical structure of in-situ silica was performed by Solid-state NMR using
HD silica as reference material. A D2O treatment is applied on the in-situ and HD
silica in order to be able to distinguish between the silanol groups and the water
present on the surface or/and inside the silica particles. This can be indicative for
the possible higher hydrophobicity of the in-situ silica, as shown in Figure 4.2. The
powder silica used in the measurements is prepared as elaborated in Section 4.2.1
TEOS [cm-1
] Assignments EtOH [cm-1
] Assignments
1102 Si-O as 882 (C-C+C-O) s
1168 CH3 rock 1050 C-C-O s
1299 CH2 twist 1089 (C-C+ C-O)as
1400 CH2 wag 1274 C-C-O as
1086 C-O as 1457 HCH as bend
960 CH3 rock 2975 CH3 as

Chapter 4
106
Figure 4.2. Single-pulse 1H MAS NMR spectra of (a) HD silica and (b) in-situ silica dried at
120 °C under vacuum. Red lines show spectra of similar compounds after exchange with D2O.
In Figure 4.2 (a) and (b), single-pulse 1H MAS NMR spectra of HD silica and
in-situ silica (black lines), respectively are compared to their deuterated analogs
(red lines). Exchange of protons with deuterons was obtained by stirring the pure
compounds in D2O overnight followed by drying under vacuum at 120 °C.
Figure 4.2, (a) clearly shows that the OH groups at the HD silica surface can be
exchanged by deuterons as indicated with the lower intensity of the D2O exchanged
peak (red line), whereas bulk-OH (hydrogen bonded silanol groups) as well as both
germinal (OH)2 and isolated OH species, do not show any effect which is consisted
with their presence inside the silica. The bulk-OH and the water signals do not
occur as sharp single resonances, but are spread out over a chemical shift range of
up to 6 ppm (see Figure 4.2 (a)) and the isolated OH groups at the silica surface
appear at a chemical shift range between 1.8 and 2.0 ppm.57 An additional signal at
1.1 ppm was assigned to trapped isolated OH groups inside the silica particles.58,59
For the in-situ silica shown in Figure 4.2, (b) the isolated OH (on the surface
and trapped inside) and (OH)2 groups were not observed, possibly due to the strong
hexylamine resonances dominating the spectrum in that particular region. The
signals assigned to hexylamine show a significant intensity decrease after the D2O
treatment indicating that the hexylamine molecules are adsorbed on the silica
surface and probably due to the treatment, some are removed or washed away by
(a)
(a)
(a) (b)

Chapter 4
107
D2O. The most interesting feature between in-situ and HD silica is the difference in
the water peak. The presence of possibly less OH groups (more hydrophobic
surface) on the in-situ silica can cause lower presence of physically bounded water
on the surface, hence lower intensity of the water peak as observed in
Figure 4.2 (b). In order to understand better this behaviour of the in-situ silica,
further chemical mapping of the in-situ silica was provided by performing 2D 29Si
{1H} HETCOR NMR in comparison to HD silica, as shown in Figure 4.3.
Figure 4.3. 2D 29
Si{1H} HETCOR NMR spectra of (a) in-situ silica and (b) HD silica (c) schematic
drawing of the possible silicon tetrahedra Qn, with n = 2, 3, 4, corresponding to the number of
siloxane bonds.
Figure 4.3 (a), shows the 29Si {1H} HETCOR spectrum for the in-situ silica as
compared to the HD silica. The spectrum reveals strong correlation between the Q3
and the OH groups in the in-situ silica, as also observed for the HD silica in
Figure 4.3 (b), showing evidence for the existence of OH groups on the silica
(a) (b)
(c)

Chapter 4
108
surface. Interestingly, the remaining features observed for the in-situ silica in the
NMR spectra are very different when compared to the ones observed for the HD
silica. In the Figure 4.3 (a), the N-CH2 (hexylamine) appears at 2.5 ppm and the
CH3 (methyl) group at 0.8 ppm. The ethoxy groups show correlations to both Q3
and Q4, indicating their presence not only on the surface (predominant presence of
Q3) but also inside the silica particles (predominant presence of Q4). The correlation
between the N-CH2 group of the hexylamine and the Q3 sites suggests that this
polar group is possibly only located on the surface of the particles. Also, the strong
bulk-OH or hydrogen bonded OH groups observed with the broad peak (3 - 8 ppm)
in the HD silica are not observed for the in-situ silica. The reason can be that
ethoxy groups and hexylamine on the silica surface might shield the OH groups
from each other preventing them from forming hydrogen bonds.
In addition, to confirm the presence of hexylamine and ethoxy groups
13C {1H} HETCOR was performed, as shown in Figure 4.4 (a). This spectrum
primarily shows the intra-molecular correlations of hexylamine (numbers 1 - 6)
with its directly bonded alkyl protons. Correlation peaks originating from ethoxy
groups are very weak (A and B), reflecting the low abundance of these groups. The
presence of hexylamine in both in-situ silica and the in-situ NR nanocomposites is
verified by the 15N {1H} CP/MAS NMR spectra, showing a single 15N resonance
at - 347 ppm (Figure 4.4 (b) and (c)). For both of these samples 15N-labelled
hexylamine was used during the synthesis. The reason for the use of 15N is the very
low abundance of the nitrogen (0.37 %) thus low sensitivity during NMR
measurement. The use of labelled 15N enabled detection of the hexylamine on the
silica surface in the silica powder and the in-situ NR nanocomposite. This showed
that indeed, in one step, a synthesis and modification on the in-situ silica was
performed with no use of additional chemical compounds.

Chapter 4
109
Figure 4.4.(a) 2D 13
C{1H} HETCOR NMR spectrum of in-situ silica. 1D
15N{
1H} CP/MAS
NMR spectra of (b) in-situ silica and (c) NR in-situ nanocomposite.
Another evidence for the presence of hexylamine only on the silica surface is
provided via a measurement that gives an estimation for the mobility, as shown
with the 13C{1H} WISE NMR spectrum in Figure 4.5.
Figure 4.5. 2D 13
C{1H} WISE NMR spectrum for mobility determination of hexylamine.
It is estimated that the hexylamine dynamics observed for the in-situ silica belongs
to an intermediate regime (~ 20 - 50 kHz)60 indicating a mobility which is
somewhere between rigid and mobile. A rigid hexylamine (trapped inside the silica
structure) would appear as a broad signal with a spectral width of up to 100 kHz,
while mobile hexylamine (free non-bounded) would give rise to a sharp and narrow
lines. Based on these results it seems that hexylamine molecules are trapped inside
(a)
(b)
(c)
(a)

Chapter 4
110
the silica particles. It is likely that the hexylamine molecules are attached to the
silica surface in neither a fully rigid nor a fully mobile state, but in an intermediate
state. In addition, the quality of the in-situ and the HD silica is determined with the
ratio of Q4 : Q3 : Q2 as shown in Figure 4.6.
Figure 4.6. Quantitative single-pulse 29
Si MAS NMR spectra of (a) HD silica, (b) in-situ
silica, and (c) the in-situ NR nanocomposite.
Figure 4.6 shows the quantitative single-pulse 29Si MAS NMR spectra of (a) HD
silica, (b) in-situ silica, and (c) the in-situ silica in the in-situ NR nanocomposite. In
general, three different peaks are observed: at - 91.7 ppm, at - 101.4 ppm, and
at -110.9 ppm, corresponding to Q2, Q3, and Q4 silicon tetrahedra, respectively.5,6
As shown in Figure 4.3 (d), Q2 might correspond to a silicon atom carrying two
hydroxyl groups, two ethoxy groups, or one of each group, Q3 is connected to
either one hydroxyl or one ethoxy group, and Q4 has only siloxane bonds.
While with the FTIR analysis it was difficult to distinguish between the
different silanol groups existing in the in-situ silica, here there is an evidence for
their existence in a possibly somewhat modified form. The quality of the in-situ
silica (1.4:23.9:74.7) when compared to the HD silica (1.4:23.2:75.4) is very
similar, while slightly different quality (1.8:30.0:68.2) is obtained for the silica in
the in-situ NR nanocomposite. The results show that the quality of the silica made
via sol-gel reaction is almost the same as the one of the HD silica. The reason for
the lower quality of the in-situ silica inside the rubber matrix can be ascribed to the
diffusion limitations of the reactants inside the rubber matrix resulting in lower
degree of condensation.
(a) (b) (c)
(a) (a)
(d)

Chapter 4
111
Interestingly, the ratio between Q2 and Q3 for in-situ and HD silica is very
similar. The only difference is that the in-situ silica contains not only Si-OH but
also ethoxy (Si-OCH2CH3), which indicates less presence of OH groups on the
in-situ silica as compared to the HD silica. This finally resolves a piece of the
puzzle for the chemical structure of the in-situ silica where indeed it may be said
that not only it contains less Si-OH groups, but also residual ethoxy groups from
the TEOS and hexylamine that contributes additionally to its hydrophobic nature.
The NMR study provided indeed a more detailed analysis of the chemical
structure of the in-situ silica detecting the presence of ethoxy groups and
hexylamine. Figure 4.4 in Section 4.3.2 suggests a good correlation between the
N-CH2 and the Q3 sites indicating close proximity (~ 4 angstroms) of the polar
amino head of the hexylamine and the silanol groups on the silica surface.
However, it cannot provide information for the type of interactions existing
between these two chemical groups. For that purpose, X-ray photoelectron
spectroscopy (XPS) was used to provide better insight into the type of interactions
existing on the in-situ silica surface.
4.3.3. Mapping in-situ silica surface by X-ray photoelectron spectroscopy (XPS)
XPS is a spectroscopic technique used for mapping the elemental composition
of a particular material. The sample is irradiated with X-rays that can travel until
about 10 nm depth into the material and result in the ejection of electrons from the
orbitals of the analysed sample. The parameters measured are the kinetic energy,
used to obtain the binding energy of a particular bond, and the number of electrons
released during the measurement, used for the calculation of the atomic
concentrations. XPS was performed on in-situ silica in powder form (as elaborated
in Section 4.2.1) and HD silica. The chemical components detected are presented in
Table 4.5.

Chapter 4
112
Table 4.5. XPS assignments of in-situ and HD silica.
In-situ silica HD silica
Atomic
orbitals
Type of
bond
Binding
energy [eV]
Atomic conc.
[%]
binding
energy [eV]
Atomic
conc. [%]
C1s C-C/C-H 284.4161 5.36 284.8 1.33
C1s C-O 285.8187 1.42 286.2 0.5
C1s C=O 287.3389 0.35 287.7 0.16
N1s NH2-free 399.1666 0.42 405.2 /
N1s NH2-H.B 401.4041 0.28 401.6 /
Na1 Na 1078.427 / 1072.7 0.37
O1s O-(Si, H,C) 532.6263 64.4 532.6 68.5
Si2p SiO 103.3001 27.8 103.3 29.1
The XPS data presented in Table 4.5 additionally confirm the difference in the
surface chemistry between the in-situ and HD silica. The first difference originates
from the total carbon content which for in-situ silica is ~ 7.15 % and for the HD is
~ 2 %. The higher carbon content for in-situ silica can be ascribed to the presence
of remnant ethoxy groups, hexylamine and absorbed air. The carbon observed for
the HD silica can be assigned only to the absorbed air (CO2). This was proven by
removing a layer (10 - 15 nm) from the surface of the HD silica with argon and
performing the XPS measurement again, which showed no presence of carbon.
Three types of carbon peaks are shown in Table 4.5 and assigned to C-C/C-H, C-O
and C=O bonds appearing at 284.4 eV, 285, 8 eV and 287.3 eV binding energy,
respectively. Particularly, the higher concentration of the C-O bond (1.42 %) for
the in-situ silica additionally is consistent with the presence of ethoxy groups on the
surface. The C-O bond can also originate from the ethanol which is a by-product of
the sol-gel reaction and may be located on the silica surface. Unfortunately, with
XPS we cannot make a clear distinction between the ethoxy groups and the ethanol.
Moreover, the amino group of the hexylamine (NH2) resulted in two characteristic
peaks, at 401.4 eV, assigned to a hydrogen bonded amine, and at 399.16 eV. Earlier
studies suggested two different origins of the peak appearing at 399.16 eV, thus to
a free amine61,2 and to a chemisorbed amine.62,63 It is believed that the chemisorbed
hexylamine bonds to the silica surface via formation of a Si-N bond. Since in our

Chapter 4
113
case, even at 500 C (see Figure 4.10 (a)) release of hexylamine is still observed,
the presence of chemisorbed type of amine is more likely to be present than the free
amine.
Moreover, since the in-situ silica is formed via a sol-gel reaction that proceeds via
an ionic mechanism where the hexylamine, becomes protonated by accepting a
proton from the water, it was expected to observe an ionic interactions between the
positively charged hexylamine and remnant negatively charged silica intermediates
on the in-situ silica surface. The ionic interactions should result in a peak at
402.8 eV 2,61 which here was not observed. This shows that hexylamine is attached
to the silica surface only via hydrogen bonding and chemisorption. The O(1s)
binding energy for the in-situ and HD silica appears at 532.6 eV and corresponds to
all components bonded to the oxygen such as O-Si, O-H and O-C, that in principal
have very close binding energies and are difficult to distinguish. The Si (2P)
binding energy is in the range of 103.3 eV corresponding to a Si-O-Si network.
Since NMR and XPS cannot distinguish well between the ethoxy groups
present from the partially hydrolyzed alkoxy precursor (TEOS) and possible
present ethanol molecules, additional information is obtained by utilizing three
techniques at the same time. These techniques combine the advantages of the
thermo-gravimetric analysis, infrared spectroscopy and mass spectroscopy
(TGA-FTIR- MS) which allows real time detection of the chemical compounds
released during the thermal treatment of the silica. The detection of ethanol is very
important because it can accumulate around the particle surface and prevent good
compatibility between the silica and the rubber matrix, which consequently can
have a negative effect on the mechanical properties of the in-situ nanocomposites.
4.3.4. Time-resolved thermal treatment of in-situ silica with FTIR-TGA-MS
The physical and chemical changes of the HD silica during a thermal
treatment are well reported in earlier studies while the information available for the
in-situ silica is still very limited.1 The purpose of using a combinatory
TGA-FTIR-MS is to be able to estimate whether ethanol is present in the silica

Chapter 4
114
particle and to approximate the way it is bonded to the silica surface (physical or
chemical interactions) by using the temperature at which it starts to evolve. It
should be noted that precise determination of the exact temperature at which one
compound begins to evolve is difficult because there is always certain delay
between the evaporation of the compounds in the TGA instrument and their
detection by the FTIR and the MS instrument. For that reason when assigning a
temperature, at which certain compound evolves, one must consider narrow
temperature region instead of one particular temperature. Spectra of the thermal
treatment of in-situ (as elaborated in Section 4.2.1) and HD silica with
simultaneous use of TGA-FTIR-MS are presented in Figure 4.7.
Figure 4.7. 3D time resolved spectra of a heat treatment of HD (a) and in-situ (b) silica as
followed by combinatory TGA-FTIR-MS during heating until 1000 C with a rate of 20 /min.
Figure 4.7 shows the evolution of chemical compounds at particular temperature
regions during heating of HD and in-situ silica. On both spectra, mainly water
peaks are observed in the range of 1300 - 1800 cm-1 and 3200 - 3800 cm-1 and the
carbon dioxide (CO2) peak at 2350 cm-1 indicated accordingly with the black
dashed lines to guide the eye.56 The extensive carbon dioxide evolution is assigned
to the intensive decomposition of organics evolving from the in-situ silica at these
high temperatures while in the HD silica possibly due to absorption of air, as
already confirmed by XPS (Section 4.3.3). In addition, the FTIR spectrum of
in-situ silica in Figure 4.7, (b) also suggests the presence of other smaller peaks
H2O
H2O
CO2
(a) (b)

Chapter 4
115
appearing at different wavelengths, which can be ascribed to an evolution of other
compounds besides water and CO2. The magnitude of the chemical changes
occurring in the in-situ and the HD silica during the thermal treatment is illustrated
by the weight loss shown in the four temperature regions in Figure 4.8. The total
weight loss for the in-situ silica as summarized from each region (15.3 %) is higher
than for the HD silica (9.48 %), indicating a higher concentration of organic
compounds present in this material.
Figure 4.8. DTG thermograms of in-situ silica and conventional obtained during thermal
treatment until 1000 C.
In region 1 (25 - 150 C) of Figure 4.8, weight losses were caused only by the
removal of physical water from both materials. For the in-situ silica FTIR and MS
confirmed that only water (no other organics) was removed in this interval. Even
though the two silica materials were dried under the same conditions the in-situ
silica shows presence of less adsorbed physical water (1 %) than the HD silica
(2 %), indicating again a lower affinity towards water. This we might assign to the
more hydrophobic nature of the in-situ silica due to the ethoxy groups and the
hexylamine residing on the surface, as shown earlier in this chapter. In regions 2
(150 - 330 C) and 3 (330 - 490 C) more intensive chemical changes occur in the
in-situ and HD silica resulting in release of chemically bonded water, rapid
condensation of the silanol groups in both materials and for the in-situ silica
additional release of organic components, as indicated by the FTIR spectra
1 2 4
490-650C330-490C24-150C 150-330C
Conventional silicaIn-situ silica
3
Temperature [C]
De
riv.
We
igh
t (%
/C
)
0.10
0.00
0.10
-0.05
0.05
- 0.10
3002001000 500400 700600 800

Chapter 4
116
shown in Figure 4.9.
Figure 4.9. (a) FTIR spectra of in-situ silica at different temperatures and (b) comparison of
HD and in-situ silica at approximately 330 C.
In Figure 4.9, (a) the FTIR spectra of in-situ silica suggests presence of hexylamine
(1121 cm-1) and ethanol (1055 cm-1) that begin to evolve at approximately 300 C,
indicating their presence on the silica surface via formation of hydrogen bonds. It
was already shown from the XPS results (see Table 4.5) that hexylamine is
hydrogen bonded and we expect ethanol to be also hydrogen bonded to the OH
groups on the silica surface. The hexylamine and ethanol in the in-situ silica were
assigned from the corresponding absorption bands of the pure components
determined in their gas phase (FTIR-TGA), as shown in Table 4.6. Another peak
that shows a similar trend with temperature as the other two peaks appears in the
range of 1220 - 1225 cm-1 is difficult to assign because it does not correspond to
any of the components mentioned in Table 4.6. However, this absorption peak is
close to the one of ethanol (1242 cm-1) and since MS does not suggest the presence
of other relevant compounds, we might assume that it originates from the ethanol.
The difference between the in-situ and HD silica for the same temperature
conditions ( ~ 330 C) is clearly observed in Figure 4.9 (b), where the HD silica
does not show presence of organics, as indicated by the absence of any peaks in the
particular region (600 - 1400 cm-1).
(a)
1200 1000 800 600
0.025
0.030
0.035
0.040
0.045
0.050
0.055
1400 1200 1000 800 600
0.020
0.025
0.030
0.035
0.040
(b)
Ab
so
rba
nce
Wavelength [cm-1]
Ab
so
rba
nce
Wavelength [cm-1]
In-situ silica
~ 200C
~ 330C
~ 400C
~ 500C
(a)
Conventiona silica (~330C)
In-situ silica (~330C)

Chapter 4
117
Table 4.6. FTIR assignments of pure hexylamine, ethanol and TEOS in their gas phase
determined with TGA-FTIR.
It should be noted that presence of non-reacted TEOS in the in-situ silica powder
and the in-situ nanocomposite was not observed, suggesting good conversion
and/or proper drying conditions. Three possible sources can be distinguished for
the organics (hexylamine and ethanol) released from the in-situ silica: i) residuals
from the sol-gel reaction strongly bounded on the silica surface, ii) trapped inside
the silica particles and iii) released during a post-condensation reaction triggered by
the extreme temperature conditions. Possible evidence for the post-condensation
reaction is provided by the MS spectra recorded during the thermal treatment of the
in-situ silica as shown in Figure 4.10. The hexylamine, ethanol and water were
followed by the ionization species with 30, 31 and 18 mass-to-charge ratios (m/z),
respectively as a function of time and temperature. These particular ionized species
are selected because in the MS spectra of their pure components (hexylamine,
ethanol and water), give the highest abundance.
Hexylamine
[cm-1
]
Ethanol
[cm-1
]
TEOS
[cm-1
]
1124 1055 1393
1408 1116
1242 961
793

Chapter 4
118
Figure 4.10. Hexylamine, ethanol and water as detected by MS during thermal treatment of
in-situ silica up to 1000 C.
Figure 4.10, suggests relatively low presence of ethanol and hexylamine with
intensities ranging between 10-11 - 10-10 when compared to the water that is
significantly higher 10-8 - 10-7. There are several reasons for the higher amount of
water, such as: condensation of silanol groups, strong hydrogen bonded water on
the surface or in the small micropores in the silica surface and possibly trapped
water molecules in the in-situ silica structure that can be released at high
temperatures. Additionally, in this temperature region (region 4: 490 - 650 C)
maxima in the intensities for all three components (hexylamine, ethanol and water)
are observed. These maxima possibly originate from the post-condensation
reaction, during which an additional amount of ethanol and water is formed.
However, we cannot also exclude the possibility that ethanol molecules might be
also trapped inside the silica particles and become suddenly released in this
temperature region.
It should be noted that the ethanol amount is surprisingly low. A possible
reason can be the hydrophobic surface on the in-situ silica which limits the number
of ethanol molecules that interact via hydrogen bonds with the Si-OH groups. In
addition, the presence of residual ethoxy groups inside the silica particles also
creates unfavourable environment for the ethanol to remain trapped during the
sol-gel reaction. The temperature region of the observed maxima in Figure 4.10
500 1000 1500 2000 2500 30000.0
3.0x10⁻¹⁰
6.0x10⁻¹⁰
9.0x10⁻¹⁰
1.2x10⁻⁹
2.0x10⁻⁸
4.0x10⁻⁸
6.0x10⁻⁸
8.0x10⁻⁸
Hexylamine (30m/z)
Ethanol (31m/z)
Water (18 m/z)
Inte
nsity [A
.U]
Time [sec]

Chapter 4
119
corresponds well to the extensive evolution of CO2 in the same temperature range
(see Figure 4.7, (b)), related to intensive decomposition of the high amount of
organics released.
The conducted study suggests that in-situ silica formed via the sol-gel reaction
has a chemical structure very different from the HD silica. The presence of the
ethoxy groups has been confirmed inside and on the silica surface accompanied by
the hexylamine molecules. This provides a unique chemical structure of so-called
‘hairy’ silica particles, schematically represented in Figure 4.11.
Figure 4.11. Schematic drawing of in-situ silica particle as formed via sol-gel reaction using
TEOS as precursor and hexylamine as catalyst.
These ‘hairy’ silica particles are expected to develop a better compatibility with the
rubber matrix and consequently improve the mechanical properties of the in-situ
rubber/silica nanocomposites.
4.3.5. Payne effect and reinforcing mechanism of in-situ silica nanocomposites
4.3.5.1. Comparison of in-situ and conventional EPDM nanocomposite
In general, reinforcement is defined as the improvement in the mechanical
properties by addition of fillers and is commonly expressed by the Payne effect.17,64
Reinforcement is a complex phenomenon for which not one, but several

Chapter 4
120
mechanisms can be considered responsible. For the in-situ nanocomposites three
important parameters are known to be crucial for achieving excellent
reinforcement, such as: small particle size (~ 30 - 50 nm), their uniform dispersion
throughout the rubber matrix and the hydrophobic nature of these particles. In order
to evaluate the effect of these parameters on the reinforcement at 10 wt% silica
loading, RPA measurements were conducted on in-situ and conventional (with and
without coupling agent) EPDM nanocomposites, as shown in Figure 4.12.
The in-situ and the conventional nanocomposites are prepared as described earlier
in this chapter.
Figure 4.12. Elastic moduli (G’) vs strain for (a) in-situ, (b) conventional nanocomposites
and (c) conventional nanocomposites with coupling agent (CA) for silica loading of 10 wt%,
(left) TEM images (scale 0.2 m) representing the structure of the three
nanocomposites,respectively.
Figure 4.12 shows the change of the dynamic elastic modulus with strain for the
three nanocomposites. A higher modulus at low (2 %) and high (200 %) strain is
obtained for the in-situ nanocomposite as compared to the conventional ones, even
when prepared in presence of coupling agent, as shown in Figure 4.13
0.1 1 10 100 10000
50
100
150
200
250
G' [
KP
a]
Strain [%]
EPDM nanocomposite (~ 10 wt%)
In-situ
Conventional
Conventional+CA
a.

Chapter 4
121
Figure 4.13. (a) Elastic moduli ( G’) for in-situ and conventional (with coupling agent)
nanocomposites at 2 and 200 % strain.
The modulus of the in-situ nanocomposite is 50 - 60 % higher as compared to the
ones of the conventional nanocomposites (with and without coupling agent). In the
case of the conventional nanocomposites, it is generally accepted that the high
modulus at low strain are ascribed to several parameters such as: larger size of the
silica aggregates (> 150 nm), their non-uniform dispersion and the strong degree of
filler networking formed as a result of strong silica-silica interactions.65 By
improving the rubber-silica interactions via chemical modification of the silica
surface or use of coupling agents these parameters can be improved resulting in a
lower modulus at low strain, thus a smaller Payne effect and better reinforcement,
shown in Figure 4.12. The modulus at high strain is commonly related to the
strength of the rubber-silica interactions resulting in a higher modulus for stronger
interactions (see Figure 4.13).
Interestingly, the in-situ nanocomposite with excellent dispersion of small
single particles and no filler-filler network formation (see Figure 4.12, (a)), instead
of lower modulus, showed higher modulus as compared to the conventional
nanocomposites. There are two possible reasons that can contribute to this
interesting behaviour: the large number of small size (40 5 nm) silica particles
and their unique surface chemistry.
The small single particles provide a large surface area for interaction with the
0
30
60
90
120
150
180
210
240
In-situ
Conventional
Conventional+CA
G' [M
Pa
]
Strain [%]2 % 200 %
(a)

Chapter 4
122
rubber, acting as additional crosslink66 that influences the entanglement density of
the entire rubber matrix causing stiffening. The more hydrophobic surface of the
in-situ silica plays an important role in the intensity of the rubber-silica interactions
and the tendency of the rubber chains to anchor on the silica surface, forming the
so-called trapped entanglements.
In the absence of a filler-filler network, the drop in the modulus (Payne effect)
in the in-situ nanocomposite can be ascribed to the disentanglement of these
trapped entanglements that begin to slip and detach from the silica surface,
resulting in overall softening of the rubber matrix.67,68 The process of
disentanglement and slippage is expected to intensify with increase of strain until a
strain of 1000 % is reached. At this high strain all moduli end-up in one single
point indicating that possibly most of the trapped entanglements are disentangled
and only the effect of the matrix remains. An indirect estimation for the strength of
the rubber-silica interactions can be obtained from the bound rubber content, where
stronger interactions promote higher bound rubber content, as shown in Table 4.7.
Table 4.7. Bound rubber of in-situ EPDM nanocomposite as compared to EPDM
conventional nanocomposites (Troom, THF).
*CA-coupling agent
Table 4.7 shows a higher bound rubber obtained for the in-situ nanocomposite
(33 wt%) as compared to the conventional nanocomposites, even when prepared
with a coupling agent. This additionally supports the high moduli obtained at low
and high strain for the in-situ nanocomposite (see Figure 4.13).
In order to understand the reinforcement mechanisms acting in the in-situ and the
conventional nanocomposites, one must consider the essentially different
morphologies existing in these two materials: uniformly dispersed single silica
particles in the in-situ nanocomposites and silica aggregates building a filler-filler
Type of EPDM nanocomposite
(10 wt% silica)
Bound rubber
[wt%]
In-situ 33
Conventional No CA* 18.5
CA* 23

Chapter 4
123
network in the conventional nanocomposites. Thus, the same principles for
understanding the reinforcement mechanisms cannot be applied in both materials
and two different approaches should be considered: the network approach for the
conventional nanocomposites, where indeed the filler-filler network has a major
effect and the filler-particle approach, where the particle size and nature of the
rubber-silica interface plays a crucial role.
4.3.5.2. Effect of rubber type and silica loading on in-situ nanocomposites
It is expected the silica content and rubber type in the in-situ nanocomposites
also to have an effect on the modulus. Therefore, the modulus of in-situ NR and
EPDM nanocomposites at 1 and 10 wt% silica, are shown in Figure 4.14.
Figure 4.14. Elastic moduli (G’) of in-situ NR and EPDM nanocomposites for silica loading
of ~ 1 and 10 wt% as determined from the RPA measurements (TEM images are at 100 nm
scale).
Figure 4.14 shows an increase in the modulus at low and high strain in both
nanocomposites with increase in silica content. The magnitude of this increase,
varies in both materials. In-situ NR nanocomposite shows a higher modulus at low
strain as compared to the modulus for the EPDM nanocomposite for the same silica
content, as shown in Figure 4.15.
0.1 1 10 100 10000
50
100
150
200
250
300
350
0.1 1 10 100 10000
50
100
150
200
250
G' [
kP
a]
Strain [%]
NR
Pure
1% silica
10% silica
(a) (b)
G' [k
Pa]
Strain [%]
EPDM
Pure
1% silica
10% silica

Chapter 4
124
0
50
100
150
200
250
300
350
10% silica1 % silica
G' [k
Pa
]
Strain [%]
NR_2% strain
NR_200% strain
EPDM_2% strain
EPDM_200% strain
pure rubber
Figure 4.15. Elastic moduli (G’) of EPDM and in-situ NR nanocomposites at silica loading of
1 and 10 wt% compared to their pure rubber matrix at 2 and 200 % strain.
The higher silica loading of 10 wt% results in a significant improvement of the
modulus for both materials with a somewhat higher modulus at low strains for the
in-situ NR nanocomposite. The reason for the different moduli at low strain
between the in-situ NR and EPDM nanocomposites can be due to the different
morphology, as illustrated with the TEM images in Figure 4.14. The images
suggest that for same silica content more particles with smaller size (23 3 nm) are
observed for the NR as compared to the EPDM (40 5 nm) nanocomposite. This
difference in particle size is expected to have a high impact on the overall
entanglement density of the matrix resulting in higher stiffening. In addition, the
higher amount of bound rubber obtained for the in-situ NR nanocomposite
(see Table 4.8) is expected to additionally increase the modulus at low strain.
Table 4.8. Bound rubber content (Troom, THF, shaking) of NR and EPDM in-situ
nanocomposites.
Silica [wt%] Bound rubber [wt%]
EPDM NR
~ 1 10 75
~ 10 33 66
As an additional indication for good rubber-silica interactions, the change in the
glass transition temperature (Tg) between the pure rubber and the nanocomposite

Chapter 4
125
with different silica content is commonly used. It is expected Tg to shift towards
higher temperatures for stronger rubber-silica interactions as a result of the reduced
mobility of the polymer chains around the silica particle.23 In our case, the change
between the Tg of the pure rubber and the nanocomposite was only (~ 2 - 3 C).
This indicates that the high moduli at high strain are not only due to the stronger
rubber-silica interactions but also due to other parameters (large surface area and
change in the entanglement density of the matrix) that together have a cumulative
effect strongly influencing the reinforcement in the in-situ nanocomposites.
Another possible explanation for the improved mechanical response of the
in-situ nanocomposites is the possibility of having a rubber chain trapped inside the
silica particle. This hypothesis was supported by the MAS-NMR measurements as
shown in Figure 4.16.
Figure 4.16.
29Si (
1H) HETCOR spectra of (a) EPDM conventional and (b) in-situ
nanocomposite with ~ 10 wt% silica (c) schematic representation of a trapped chain inside
in-situ silica particle.
Figure 4.16, shows the 29Si (1H) HETCOR spectrum of the in-situ EPDM and the
conventional nanocomposite. The most surprising feature in Figure 4.16 (a) is the
large peak appearing at ~ 0.8 ppm due to strong correlation between the CH3 group
Rubber chainSilica
Q4
Q3
(a) (b)
(c)Silica
Rubber chain

Chapter 4
126
and Q4 in the in-situ EPDM nanocomposite.
The CH3 group can be easily assigned to the ethoxy groups or the hexylamine,
as we observed previously from the 29Si (1H) HETCOR for the in-situ silica
(see Figure 4.3). In this case, a possible explanation for this rather unexpected
behaviour is that the CH3 group originates from the EPDM (the propylene unit)
rubber itself and the only way to strongly correlate with Q4, which is mainly
present in the interior of the silica representing the Si-O-Si network, is by being
trapped inside the silica particles (see Figure 4.16 (c)). The absence of the CH3
peak in the EPDM conventional nanocomposite (Figure 4.16 (b)) additionally
contributes to our hypothesis for a rubber chain trapped inside silica particle. The
same correlation is also observed in the in-situ NR nanocomposite, which means
this may occur regardless of the rubber type.
It can certainly be expected that these trapped chains can additionally explain
the good mechanical properties of the in-situ nanocomposites.
4.4. Conclusions
The sol-gel gel reaction in rubber resulted in formation of naturally modified
silica particles with hexylamine and ethoxy groups residing on the surface as was
shown using several characterization techniques. It was shown that ethoxy groups
are present inside the silica as well as on the silica surface, while hexylamine
resides particularly on the surface contributing additionally to the hydrophobicity
of the in-situ silica. In addition, it has been shown that the composition of the
in-situ silica expressed with Q2, Q3 and Q4 is very similar to the composition of the
HD silica indicating good quality. Moreover, the excellent dispersion of the in-situ
silica particles and their hydrophobic surface, combined with a possibly trapped
rubber chains provided good basis for achieving excellent mechanical properties.
The interpretation of the Payne effect in the in-situ nanocomposites showed to be
somewhat different than commonly known for the conventional nanocomposites.
This can be ascribed to the essentially different structure of these two materials,
hence silica aggregates versus single-particle morphology in the conventional and
in-situ nanocomposites, respectively.

Chapter 4
127
4.5. References
[1] R.K.Iler,‘The chemistry of silica’;Chichester:Wiley-Interscience;1979
[2] E.F.Vansant et al.,’Characterization and chemical modification of the silica
surface’;Elsevier;1995
[3] C.Jeffrey Brinker and George W. Scherer,‘Sol-gel science’; London:Academic Press;1990
[4] G.E.Maciel et al.,Journal of Physical Chemistry;87;5516-5521;1983
[5] G.E.Maciel et al.,Journal of American Chemical Society;115;6786-6794;1993
[6] G.E.Maciel et al.,Journal of American Chemical Society;115; 8695-8705;1993
[7] G.E.Maciel et al.,Journal of American Chemical Society;118;401-406;1996
[8] A.K.Bhowmick,‘Current Topics in Elastomers Research’;Taylor&Francis group;2008
[9] A.Aboshi et al.,Physical Review B;69;155409;2004
[10] M.C.Matos et al.,Journal of Non-Crystaline Solids;147;232-237;1999
[11] A.Bertoluzza et al.,Journal of Non-Crystaline Solids;48;117-128;1982
[12] M.Zaharescu et al.,Revue Roumanie de Chemie;52;93-99;2007
[13] I.A.M.Ibrahim et al.,Journal of American Science;6(11);2010
[14] M.T.Harris et al.,Journal of Colloid and Interface Science;266;346-358;2003
[15] A.van Blaaderen et al.,Journal of Non-Crystaline Solids;149;161-178;1992
[16 ] G.H.Bogush et al.,Journal of Non-Crystaline Solids;104; 95-106;1988
[17] J.Frohlich et al.,Composites:Part A;36;449-460;2005
[18] J.Sun et al.,Journal of Polymer Science:part B;45;2594-2602;2007
[19] L.Bokobza et al.,Kautschuk Gummi Kunststoffe;62;23-27;2009
[20] J.Frohlich et al.,Rubber world;April 28;2001
[21] B.Jang et al.,Rubber division;174;October 14-16;2008
[22] M.Brindha E.A et al.,Rubber world;239;28-32;2008
[23] S.Merabia et al.,Macromolecules;41(21);8252-8266;2008
[24] C.Wrana et al.,Kautschuk Gummi Kunststoffe;61;647-655;2008
[25] P.Konecny et al.,Polymers for Advanced technologies;18;122-127;2007
[26] Y.Ikeda et al.,Chemistry Letters;34;5;672-673;2005
[27] Y.Ikeda et al.,Rubber Chemistry and Technology;74;16;2001
[28] A.Ansarifar et al.,Rubber Chemistry andTechnology;78;793-805;2005
[29] G.B.Ouyang,Kautschuk Gummi Kunststoffe;59;332-343;2006
[30] F.Yatsuyanagi et al.,Rubber Chemistry and Technology;4;657;1999
[31] S.S.Sternstein et al.,Composites Science and Technology;63;1113-1126;2003
[32] S.S.Sternstein et al.,Macromolecules;35;7262-7273;2002
[33] S.Thomas et al.,Journal of Physical Chemistry C;113;17997-18002;2009
[34] J.L.Leblanc et al.,Journal of Applied Polymer Science;78;1541-1550;2000
[35] K.Sahakaro et al.,Journal of Applied Polymer Science;109;3839-3848;2008
[36] R.Joseph et al.,Rubber world;232;16-18;2005
[37] Y.Ikeda et al.,Journal of Sol-Gel Science and Technology;26;495-498;2003
[38] A.Bandyopadhay et al.,Journal of Applied Polymer Science; 95;1418-1422;2005
[39] Y.Ikeda et al.,Journal of Material Science;38;1447-1455;2003
[40] J.L.Leblanc et al.,Kautschuk Gummi Kunststoffe;44;1119;1991
[41] T.I.Suratwala et al.,Journal of Non-Crystaline Solids;316;349-363;2003

Chapter 4
128
[42] B.K.Mishra et al.,Talanta;62;1005-1028;2004
[43] W.K.Dierkers,PhD thesis: ‘Economic Mixing of Silica-Rubber compounds’;Twente
University;2005
[44] McGraw-Hill,‘Rubber Engineering’,Tata McGraw-Hill company;New Delhi;1998
[45] M.Muroya et al.,Colloids and Surfaces A;157;147-155;1999
[46] A.Aboshi et al.,Physical Review B;69;155409;2004
[47] A.Jitianu et al.,Journal of Non-Crystaline Solids;319;263-279;2003
[48] H.El Rassy et al.,Journal of Non-Crystaline Solids;351;1603-1610;2005
[49] R.M.Almeida,Journal of Non-Crystaline Solids;121;193-197;1990
[50] B.Tan et al.,Journal of Physical Chemistry B;110;22353-22364;2006
[51] X.Wang et al., Industrial & Engineering Chemistry Research;45;8617-8622;2006
[52] P.Dhamelincourt et al.,Journal of Non-Crystaline Solids; 208;247-258;1996
[53] L.Rehspringer et al.,Journal of Non-Crystaline Solids;180;191-196;1995
[54] K.Lanfaster,Angewandte Chemie International Edition;48;4488-4507;2009
[55] Y.Ikeda et al.,Journal of Sol-Gel Science and Technology;48;299-306;2008
[56] R.A.Nyquist,‘Interpreting infrared, Raman, and nuclear magnetic resonance
spectra’;Academic Press, London ;2001
[57] B.C.E.Zeigler et al.,Journal of American Chemical Society;110(7);2023-2026;1988
[58] C.d’Espinose et al.,Journal of Colloid and Interface Science;194(2);434-439;1997
[59] G.Maciel et al.,Journal of Colloid Chemistry;234;269-282;1994
[60] K.Schmidt-Rohr,Macromolecules;25;3273-3277;1992
[61] K.M.R Kallury et al.,Langmuir;10;492-499;1994
[62] R.J.Hamers et al.,Journal of Physical Chemistry B;105;3759-3768;2001
[63] R.J.Hamers et al.,Journal of Vaccum Science and Technology B;20(4);Jul/Aug;2002
[64] C.Wrana et al.,Kautschuk Gummi Kunststoffe;61;647-655;2008
[65] A.E.M.Reuvekamp,PhD thesis:‘Reactive mixing of silica and rubber for tyres and engine
mounts’;Twente University;2003
[66] C.Creton et al.,Macromolecules;43;2554-2564;2010
[67] P.Cassagnau et al.,Polymer;44; 6607- 6615;2003
[68] L.Bokobza,Kautschuk Gummi Kunststoffe;62;23-27;2009

Preparation of in-situ nanocomposites via sol-gel reaction in
rubber matrix under dynamic conditions: one-step reactive
extrusion
Abstract
The processing of the in-situ nanocomposites via batch mixer and reactive extrusion is
addressed. The materials produced via batch mixing showed significantly higher silica
contents for the same reaction time as compared to the in-situ nanocomposites
prepared under static conditions. The structure of the obtained nanocomposites was
significantly different, hence consisting not only of single silica particles but also
aggregates and silica regions. In-situ nanocomposites were also successfully produced
via reactive extrusion. The nanocomposites obtained in this way had a maximum
loading of 3.2 wt% silica, possessed a uniform dispersion of silica particles (higher
particle size polydispersity) and very good properties, even when compared to
conventional nanocomposite with 10 wt% silica and a coupling agent (CA).

Chapter 5
130
5.1. Introduction
The requirements for various properties of nanocomposite materials,
composed usually from an organic matrix and inorganic filler, are imposed by their
increasing application in a widely different areas as reinforcing materials,
bio-inspired hybrid materials, protective and decorative coatings, micro-electronics
and optics. In order to satisfy the application requirements the need for increased
productivity is the biggest challenge which technology is facing at the moment.1
The most efficient way to continuously produce nanocomposites would be via melt
processing, using one of the common techniques known to industry, namely
extrusion and injection moulding. However, the reason these techniques are not
well exploited so far is the difficult dispersion of the nano-sized particles in the
polymer due to their very small size and strong tendency to agglomerate. These
properties of the particles, in combination with the large difference in compatibility
with the polymer matrix, result in very difficult mixing.2 Nevertheless, a small
particle size and good dispersion throughout the matrix are essential for good
reinforcement and mechanical properties.3-6 There are several ways reported in
literature regarding the possibilities to improve the compatibility between the
polymer and the filler, such as: in-situ polymerization,7 filler surface
modification8-12 and the use of so-called organic/inorganic concentrates.2
The in-situ polymerization method involves dispersion of (modified) silica
particles into a monomer solution followed by polymerization of the mixture. It is
expected that the in-situ polymerization diminishes the agglomeration problem
associated with traditional mixing via extrusion but still cannot meet the demands
for industrial production.2 The goal of the surface modification is to modify the
surface of the hydrophilic filler (e.g. silica) into a more hydrophobic surface by
attaching different chemicals, usually with long hydrophobic tails. An example is
the modification of silica with vinyl trimethoxysilane (VTMS) that was mixed with
polyethylene (PE) via single screw extrusion.13 The use of the organic/inorganic
concentrates of modified silica and polymethylmethacrylaat (PMMA)2 or

Chapter 5
131
polystyrene (PS)2 is another way to improve the production of the nanocomposites
via extrusion. The concentrate is actually the polymer loaded with a high silica
content. These concentrates can be prepared prior to extrusion via solution blending
and in-situ polymerization. The concentrate is used in the extrusion as a starting
material, instead of the pure particles, which significantly decreases the problem
with particle agglomeration. In addition, the compatibility with the matrix is
improved, so that the mixing results in better silica dispersion and increased
productivity of the nanocomposites with higher silica content.2
Another possibility that has great potential to become industrially applicable is
the preparation of in-situ nanocomposites via sol-gel reaction using a
pre-hydrolyzed silica precursor, called hyperbranched polyalkoxysilane (PAOS),
instead of pure alkoxysilane via reactive extrusion using water vapor instead of
liquid water.14-16 So far, the sol-gel reaction was performed only on laboratory scale
and appreciated for its mild reaction conditions under which it proceeds.17-19
However, this process almost always resulted in very long reaction times needed
for the silica formation, which is unacceptable for industrial production where very
short reaction times are required.
Therefore, the need for a method of producing in-situ inorganic/organic
nanocomposites via industrial processes still remains. For that purpose in this
chapter, the transition from laboratory scale to dynamic production of in-situ
nanocomposites and reactive extrusion is shown. The target was to produce in one
step in-situ nanocomposites with certain silica loading and properties comparable
to the conventional nanocomposites, while at the same time eliminating the
problems associated with the extensive mixing and agglomeration of the silica
particles.
5.2. Experimental section
5.2.1. Materials
The silica precursor, TEOS and the (n-hexylamine) catalyst were purchased
from Aldrich and used as received. The characteristics of the three rubbers, namely

Chapter 5
132
natural rubber (NR; Tun Abdul Razak Research Centre), styrene-butadiene rubber
(SBR; Lanxess) and ethylene-propylene-diene rubber (EPDM; Lanxess), are shown
in Table 5.1. The type of silica used for conventional mixing is Zeosil 1165 MP
produced by Rhodia, known as a highly dispersible (HD) silica commonly used in
the rubber industry for the production of ‘green’ tires. It has a BET surface area of
50 m2/g and an average particle size of 10 - 20 nm.
Table 5.1 Characteristics of rubber materials used.
Rubber type NR
SMR L
EPDM
Keltan 512
SBR
VSL 5025-0
Composition [wt%]
Isoprene (1,4-cis) Ethylene/Propylene/ENB
55/41/4.3
1,2-vinyl/1,4-
styrene
47.5/28/24
Impurity [wt%] 0.5 / /
Mw [kg/mol] ~ 800 260 450
Mooney viscosity
ML (1+4)
50-60 (100C) 46 (125C) 69 (100C)
Tg [C] -65 -54 -20
It was difficult to determine the exact molecular weight of the NR using gel
permeation chromatography (GPC), because there was always residual gel.
Literature 20 suggests an approximate Mw value of 8x10⁵ g/mol and Mw/Mn = 2.3.
Preparation of conventional EPDM nanocomposite (~ 10 wt% silica)
The conventional nanocomposites were prepared in an internal mixer
(V = 390 cm3) with tangential rotors and a fill factor of ~ 70 vol%. The starting
temperature was 50 C and the rotor speed was adjusted to reach temperatures
above 140 C. Usually for 10 to 15 wt% silica, a rotor speed of 110 rpm was
enough to achieve the desired temperature (140 - 170 C). However, for mixture
with 1 wt% silica the rotor speed was increased up to 130 rpm, because this small
amount of silica does not significantly contribute to a torque increase. The actual
temperature of mixing was kept at 140 - 160 C for all compounds, regardless
whether a coupling agent was used or not, in order to maintain equal processing
conditions for all samples. In the presence of TESPT coupling agent the

Chapter 5
133
temperature must be above 140 C to start the silanization reaction but below
170 C to prevent crosslinking of the rubber due to sulphur release from the
coupling agent.
The mixing was performed in two steps. In the first step ZnO, stearic acid, half the
amount of silica and half the amount of TESPT (if used) were added to the rubber
and in the second step the remaining components were added. The mixing time of
all components in the internal mixer was approximately 6 min. At the end, the so
called ‘dump’ temperature of the mixture was measured. The dump temperature
should be always above or equal to 140 C to ensure that the silanization reaction is
completed. The compound formulations used are shown in Table 5.2.
Table 5.2. Mixing parameters for EPDM conventional nanocomposites.
c Coupling agent (TESPT)
* Silica content of conventional nanocomposites as determined by TGA
It should be noted, that the silica content as measured by TGA was lower than
when calculated from Table 5.2. In the rubber industry, phr (parts per hundred
rubber) is the commonly used unit for quantity, because it simplifies the
preparation of the conventional rubber/silica nanocomposites. Further in the text
reference is always made to wt% silica instead of phr. It is noted that the content of
inorganics (silica and ZnO) in the conventional nanocomposites was determined by
TGA (averaged over two measurements) and the silica content was obtained after
subtraction of the known ZnO content. The amount of TESPT was 8 wt% with
respect to the amount of silica added to the rubber. Even though the rubber
compounds were not intended for vulcanization, stearic acid and ZnO were
Components [phr] 15 phr
(10 wt%)*
15 phrc
(11 wt%)*
EPDM/Keltan 512 100 100
Silica/ZEOSIL 1165 MP 15 15
Oil/Sunpair 2280 10 10
Stearic acid 1 1
ZnO 5 5
Silane/TESPT 0 1.2
Total 131 132.2

Chapter 5
134
additionally added in order to approximate the preparation conditions of industrial
rubber/silica mixtures. ZnO is used as an activator and stearic acid as a plasticizer
and a co-activator for sulphur vulcanization (when performed).
Bound rubber determination
In-situ and conventional rubber/silica nanocomposites with various silica
amounts were immersed in THF, which is good solvent for the three rubbers. The
ratio between the rubber/silica nanocomposites and the solvent was kept constant
(2 % w/v) and the samples were immersed in the solvent for 48 h at room
temperature while shaking. The residues were dried for 72 h at 50 C under
vacuum. The bound rubber content was calculated as following:
(5.1)
where, is the weight of the sample after solvent treatment in (g),
is the weight of sample before solvent treatment in (g) and the is the weight
of silica in (g) in the nanocomposite.
Preparation of in-situ nanocomposites (NR, EPDM and SBR) in dynamic
conditions via batch mixing
Dynamic mixing was performed using a Haake Rheomix OS kneader with a
60 cm3 volume mixing chamber. The (NR, EPDM and SBR) in-situ
nanocomposites were prepared at 80 C in three subsequent steps, as shown in
Figure 5.1.
Figure 5.1. Schematic representation of the preparation of in-situ nanocomposites under
dynamic conditions in a batch mixer.
Rubber Mixing of rubber
+ TEOSReaction
t = 5 min
T= 80 C
RS = 50 rpm
t = 2 - 5 min
T= 80 C
RS = 40 rpm
t = 2 -15 min
T= 80 C
RS = 30 - 40 rpm t=13 - 25 min
In-situ
nanocomposite

Chapter 5
135
Prior to the reactive mixing, the chamber was isolated with a Teflon foil in order to
prevent leakage of the liquid chemicals (TEOS and catalyst solution) during the
sol-gel reaction. In the first step indicated in Figure 5.1, the rubber is pre-cut in
smaller pieces (2 x 2 cm) and mixed in the mixer for approximately 5 min at a rotor
speed (RS) of 50 rpm and a temperature of 80 C, until a homogeneous rubber
mass is obtained, as indicated by the stabile torque value (15 - 18 Nm). In the
second step the TEOS is added drop-wise to the rubber in order to provide better
mixing and prevent any possible leakage of the non-mixed TEOS. The time needed
to obtain a homogenized rubber-TEOS mixture varied between 2 - 5 min,
depending on the amount of TEOS added. The homogenized mixture of rubber and
TEOS had a stabile torque value of 5 - 7 Nm. The addition of higher TEOS
amounts required a longer mixing time (~ 5 min) until stabile conditions were
reached. The last step is the addition of the catalyst solution needed to conduct the
sol-gel reaction for silica formation. The catalyst solution (concentration
0.096 mol/l) was added in the same weight ratio 1:5 (TEOS:H2O) as in the static
conditions in order to preserve the same reaction conditions. This allows us to
follow the changes occurring in the structure of the in-situ nanocomposites only as
a result of the dynamic mixing.
Since the reactive mixing proceeded in the presence of a large amount of
catalyst solution, the largest problem was the leakage of the solution despite the
Teflon isolation. Therefore the rotor speed needed to be reduced and maintained in
the range of 30 to 40 rpm in order to minimize leakage (2 - 7 wt% of the initial
amount) of the catalyst solution. After the addition of catalyst solution the torque
dropped to 2 Nm and remained constant during the mixing process.
The targeted three different silica contents (~ 3, 10 and 15 wt%) in the in-situ
(NR, EPDM and SBR) nanocomposites were obtained by varying the reaction time
between 2 - 15 min. The composition of the system used to prepare the in-situ
nanocomposites with three different silica contents is shown in Table 5.3

Chapter 5
136
Table 5.3. Composition of reaction mixture for obtaining in-situ (NR, EPDM and SBR)
nanocomposites with various silica contents using 1:5 ratio of (TEOS:H2O) at 80 C.
Amount of TEOS
[wt %]
Reaction
time [min]
Silica content
[wt%]
16 2 ~ 3
33 10 ~ 10
50 15 ~ 15
Preparation of EPDM in-situ nanocomposite via reactive extrusion
The continuous one-step preparation of the in-situ nanocomposites via
reactive extrusion was performed in a 30 mm diameter co-rotating twin screw
extruder at Materials Science Center DSM Ahead (Geleen). The rubber used in the
extrusion was EPDM Keltan 512. Prior to the processing it was ground into small
flakes (~ 5 x 5 mm2) and added continuously to the extruder using a gravimetric
dosing unit at a constant throughput (Q) of 1 kg/h. A specific screw was specially
designed to match the requirements for (i) performing the sol-gel reaction in
extruder, (ii) efficient mixing between the rubber and the low viscous reactive
liquids (TEOS and catalyst solution) particularly in the reaction zone, and (iii)
longer reaction time for the silica formation. The extruder consisted of three
essential zones, the rubber mixing zone, the TEOS mixing zone and the reaction
zone as indicated in Figure 5.2.
Figure 5.2. Schematic representation of the reactive extruder used in DSM for conducting a
sol-gel reaction in EPDM.
Two injection points were used for the dosing of the TEOS and the catalyst
solution, respectively. The flow rate of both components was controlled
individually and adjusted accordingly during the sol-gel reaction. The barrel
Rubber TEOS Catalyst solution Volatiles
Reaction zoneTEOS mixing zone

Chapter 5
137
temperature was controlled via an external system and an additional thermocouple
was placed at the exit of the reaction zone in order to measure the actual reaction
temperature. The extruder barrel was divided into several temperature zones each
provided with individual temperature control system which allowed gradual
decrease of the temperature towards the reaction zone (T = 150 C) in order to
prevent possible evaporations of the reactants.
The processing parameters of the sol-gel reaction in the extruder were:
- Reaction temperature (T = 150 C)
- Reaction time ~ 6 min
- TEOS amount: 25 wt% (500 g/h)
- Amount of water: 60, 120, 240 and 360 g/h
The processing parameters that are kept constant throughout the reaction are the
feed rate Q, the screw speed N per experiment, and the TEOS amount. The only
varying parameter was the amount of catalyst solution controlled by the injection
system.
5.2.2. Characterization
Transmission Electron Microscopy (TEM)
The structure of the nanocomposites was studied using the TEM. Ultrathin
sections (70 - 100 nm) were obtained using a Reichert-Jung Ultracut E microtome
equipped with a diatome diamond knife for dry cutting for trimming (45 angle)
and sectioning (35 angle) at a temperature of -140 C. The sections were placed on
a 200 mesh copper grid with a carbon supportive layer. The sections were
examined with the TEM Sphera instrument, FEI Tecnai 20 (operating voltage of
200 kV). It should be noted, that later in the text it will be referred to structure and
not morphology of the nanocomposites.
Rubber process analyzer (RPA)
The RPA is specially designed rheometer for studying the dynamic
mechanical properties of rubber materials. It contains a grooved die that prevents

Chapter 5
138
slippage of the material during the measurements at high strains (> 100 %). It
generally measures the torque in the testing sample caused by the applied
deformation. By applying a Fourier transformation the torque is divided into an
elastic and viscous components that characterize the dynamic mechanical
properties of the material. Measurements were performed using RPA 2000 tester
from Alpha technologies at 100 °C and a frequency of 0.50 Hz. The strain sweep
was performed in the range of 0.56 to 1250 % strain.
Thermo-gravimetric analysis (TGA)
A Q500 TGA from TA Instruments was used for the quantitative
determination of the silica content in the prepared rubber/silica nanocomposites.
Samples were heated in air atmosphere with 10 /min up to 900 C to provide
complete oxidation of the carbon. The residue after this thermal treatment is
assumed to be composed only of silica. All measurements were repeated at least
twice and an average of the results was used.
5.3. Results and Discussion
5.3.1. Comparison of in-situ nanocomposites prepared under dynamic (using an
batch mixer) and static conditions
The conditions under which the sol-gel reactions proceed in rubber, static or
dynamic, are very important in determining, i.e. the structure of the in-situ
nanocomposites. The structure influences to a large extent the mechanical
properties of the nanocomposite materials. In this part a comparison is made
between the structure and the properties of the in-situ nanocomposites prepared
under static and dynamic conditions. Therefore, in-situ nanocomposites were
prepared employing both mixing and using the same reaction conditions, such as
temperature, amount of TEOS, TEOS:H2O ratio and reaction time of 15 min
(Table 5.4).

Chapter 5
139
Table 5.4. Silica content for the in-situ (NR, EPDM and SBR) nanocomposites under dynamic
(and static) conditions with 1:5 ratio of (TEOS:H2O) at 80 C.
Table 5.4 shows that significantly higher silica content is obtained during dynamic
mixing (~ 15 w%) as compared to the static mixing (~ 1.5 - 5.5 wt%) for the same
reaction time of 15 min. The increase in silica content for the dynamically prepared
in-situ nanocomposites is ~ 400, ~ 800 and ~ 200 % for NR, EPDM and SBR,
respectively. It should be noted, that there is discrepancy in the amount of TEOS in
the EPDM in-situ nanocomposite prepared under dynamic and static conditions.
The reason is that 33 wt% is the maximum amount of TEOS in EPDM at 80 C
under static conditions. This may represent an advantage for the dynamic mixing
because it allows the use of a higher amount of TEOS than possible under static
conditions.
Achieving higher silica content under dynamic conditions for the same
reaction time can be ascribed to the mixing effect that allows formation of so-called
renewable interfaces. These interfaces enable more frequent interaction between
the TEOS-swollen rubber and the catalyst solution during the sol-gel reaction. Thus
for the same reaction time under dynamic conditions in-situ nanocomposites with
higher silica content are obtained. Depending on the mixing efficiency, the
frequency and the thickness of these interfaces is expected to significantly
influence the silica content, particle size and dispersion throughout the matrix.
While under static conditions the sol-gel reaction is strongly affected by the
diffusion of the TEOS and the catalyst solution through the sample, under dynamic
Dynamic mixing - silica content [wt%]
TEOS amount
[wt%]
Reaction time
[min]
NR
EPDM
SBR
50 15 14.5 14 15
33 10 9 8.5 9.5
16 2 3 2.4 4
Static mixing - silica content [wt%]
Reaction
time [min]
NR
(50 wt% TEOS)
EPDM
(33 wt% TEOS)
SBR
(50 wt% TEOS)
15 3 1.5 5.5

Chapter 5
140
conditions this problem can be surpassed by the formation of these interfaces. The
structures of the obtained NR, EPDM and SBR in-situ nanocomposites under
dynamic conditions are shown in Figure 5.3.
Figure 5.3. Structure of in-situ NR, EPDM and SBR nanocomposites prepared under dynamic
conditions (reaction time of 15 min at 80 C with 50 wt% TEOS) with 14.5, 14 and 15 wt%
silica, respectively. The silica regions and aggregates are indicated with the arrows and the
area with only single particles indicated in the frame.
Figure 5.3 shows a non-uniform distribution of the silica particles throughout the
rubber matrix indicating regions in which silica particles are tightly packed, silica
aggregates and single particles. The silica regions have irregular spherical shapes
with approximate sizes ranging from 0.2 to 6 m and sometimes even larger. These
regions are observed in all in-situ (NR, EPDM, and SBR) nanocomposites also at
lower silica contents (~ 3 wt%) but strongly emphasized at higher silica loadings
(~ 15 wt%).
The non-uniform structure of the dynamic in-situ nanocomposites can be
ascribed to the inefficient mixing between the swollen rubber and the catalyst
solution during the sol-gel process. The very low shear forces in the batch mixer
are not able to provide good mixing during the sol-gel process, as a result of which
silica regions and aggregates are formed. The silica regions resemble to trapped
catalyst droplets inside the swollen rubber matrix in which silica preferably forms.
This structure is rather different than the one observed in the in-situ
nanocomposites prepared under static conditions (see Figure 2.8 in Chapter 2) and
0.2m 0.2m 0.2m
EPDM SBRNR
0.2m0.2m 0.2m

Chapter 5
141
also no silica gradient is expected under dynamic conditions as diffusion is no
longer a controlling factor for the sol-gel reaction. Therefore, RPA measurements
were performed and the moduli (G’) of the EPDM in-situ nanocomposites prepared
under static and dynamic conditions are determined, as shown in Figure 5.4.
0.1 1 10 100 1000
0
50
100
150
200
250
(b)
G' [k
Pa]
Strain [%]
In-situ nanocomposite
Dynamic (8.5% silica)
Static (~10% silica)
(a)
0
50
100
150
200
250
200 %
G' [k
Pa
]
Strain [%]
In-situ nanocomposite
Static (~10 % silica)
Dynamic (~ 8.5 % silica)
2 %
Figure 5.4. (a) Comparison of the G’ modulus at ~ 10 % silica content between EPDM in-situ
nanocomposites prepared under static (reaction time of 10 h with 33 wt% TEOS) and
dynamic conditions ( reaction time of 10 min and 33 wt% TEOS) at 80 C and (b) the G’ at
low (2%) and high (200 %) strain.
The results in Figure 5.4 show that the G’ modulus of the in-situ nanocomposites
prepared under dynamic conditions has somewhat lower value at low and higher
strain, as compared to the in-situ nanocomposite prepared under static conditions.
As discussed in Chapter 4, the in-situ nanocomposites prepared under static
conditions show an interesting behaviour (when compared to the conventional
nanocomposites) which contradicts the common belief that a higher modulus at low
strain is as a result of non-uniform dispersion of the silica aggregates in the
rubber.21-24 The in-situ nanocomposites prepared under static conditions showed
higher modulus at low strain and this was ascribed to several factors: (1) uniform
dispersion of small size silica particles which provides a large surface area
available for interaction with the rubber matrix, (2) the hydrophobic surface of the
in-situ silica caused by the presence of ethoxy groups and hexylamine, which
promotes stronger rubber-silica interactions, (3) the formation of trapped
entanglements25,26 by anchoring of the rubber chains on the silica surface that

Chapter 5
142
ultimately is responsible for modification of the entanglement density of the entire
rubber matrix resulting in higher stiffness and (4) the higher bound rubber
content.27
On the other hand, the modulus at high strain was mainly assigned to the
strength of the rubber-silica interactions.28,29 In the absence of filler-filler network,
the drop in the modulus (Payne effect) in the in-situ nanocomposite is due to the
disentanglement of the trapped entanglements that begin to slip and detach from the
silica surface, intensifying further with the increase in strain.
In the case of the dynamic in-situ nanocomposites a contribution of all factors
mentioned to the modulus at low and high strain is expected. As compared to the
static in-situ nanocomposites, lower modulus at low and high strain are obtained for
the dynamically prepared nanocomposites, which is probably due to the
non-uniform silica dispersion (see Figure 5.3) and the relatively low surface area
available for interaction with the rubber matrix. This consequently results in a
decreased particle effect on the entanglement density of the rubber network leading
to lower stiffness. Additionally, the bound rubber content for the in-situ
nanocomposite under dynamic conditions is also lower (see Table 5.5), being only
7.7 wt% as compared to the one obtained for the static in-situ nanocomposites
(33 wt%) (see Table 4.8 in Chapter 4). Moreover, the particle size, known to have
significant influence on the reinforcement, is somewhat larger for the dynamic
in-situ nanocomposites as compared to the static in-situ nanocomposites
(Figure 5.5).
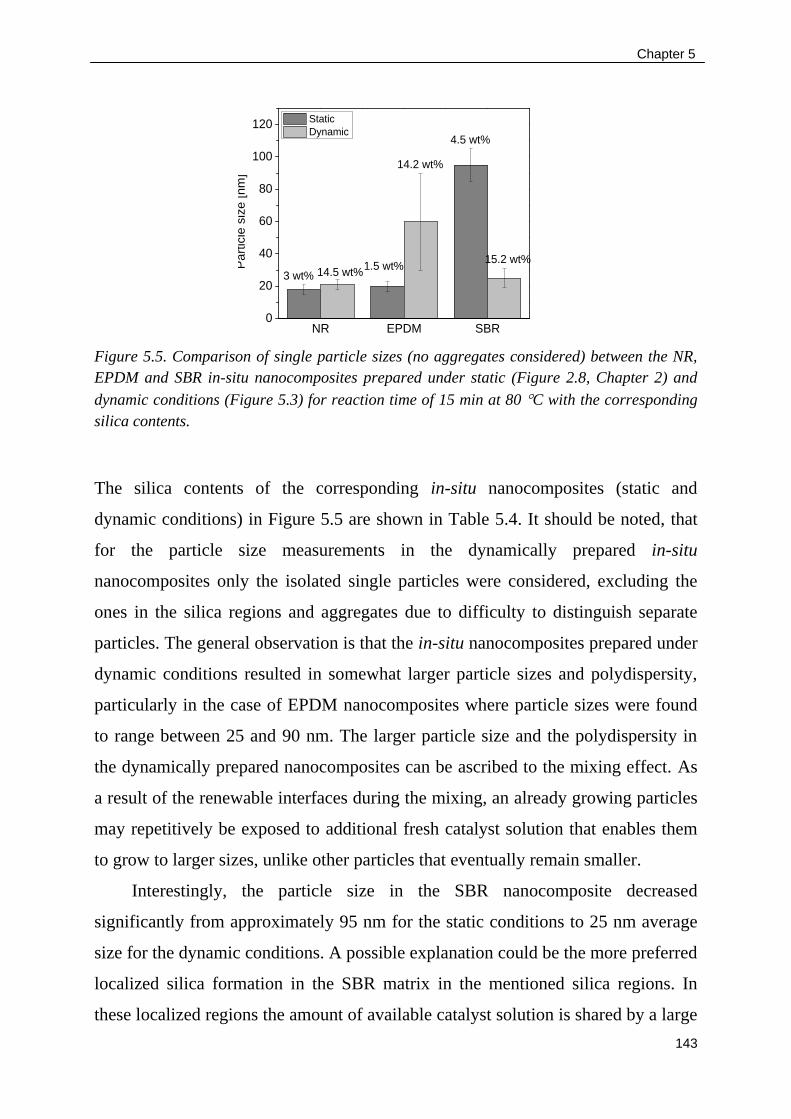
Chapter 5
143
Figure 5.5. Comparison of single particle sizes (no aggregates considered) between the NR,
EPDM and SBR in-situ nanocomposites prepared under static (Figure 2.8, Chapter 2) and
dynamic conditions (Figure 5.3) for reaction time of 15 min at 80 C with the corresponding
silica contents.
The silica contents of the corresponding in-situ nanocomposites (static and
dynamic conditions) in Figure 5.5 are shown in Table 5.4. It should be noted, that
for the particle size measurements in the dynamically prepared in-situ
nanocomposites only the isolated single particles were considered, excluding the
ones in the silica regions and aggregates due to difficulty to distinguish separate
particles. The general observation is that the in-situ nanocomposites prepared under
dynamic conditions resulted in somewhat larger particle sizes and polydispersity,
particularly in the case of EPDM nanocomposites where particle sizes were found
to range between 25 and 90 nm. The larger particle size and the polydispersity in
the dynamically prepared nanocomposites can be ascribed to the mixing effect. As
a result of the renewable interfaces during the mixing, an already growing particles
may repetitively be exposed to additional fresh catalyst solution that enables them
to grow to larger sizes, unlike other particles that eventually remain smaller.
Interestingly, the particle size in the SBR nanocomposite decreased
significantly from approximately 95 nm for the static conditions to 25 nm average
size for the dynamic conditions. A possible explanation could be the more preferred
localized silica formation in the SBR matrix in the mentioned silica regions. In
these localized regions the amount of available catalyst solution is shared by a large
NR EPDM SBR0
20
40
60
80
100
120
Part
icle
siz
e [n
m]
Static
Dynamic
3 wt% 14.5 wt%1.5 wt%
14.2 wt%
4.5 wt%
15.2 wt%

Chapter 5
144
number of surrounding particles which renders growth of the silica particles to
larger sizes (see Figure 5.3). It was noted earlier that the swelling of SBR in TEOS
under static conditions is limited to 50 wt% of TEOS because beyond this amount
SBR starts to dissolve significantly. No such problem was encountered during the
dynamic mixing (no leakage of TEOS or dissolved SBR).
5.3.2. In-situ nanocomposites prepared in dynamic conditions via batch mixing
vs. conventional nanocomposites
The properties of the obtained in-situ nanocomposites under dynamic
conditions were evaluated in comparison to the conventional nanocomposites (with
and without coupling agent) at approximate 10 wt% silica loading, by conducting
RPA measurements, of which the results are shown in Figure 5.6.
0.1 1 10 100 10000
50
100
150
200
G' [k
Pa
]
Strain [%]
in-situ (8.5% silica)
conventional (10% silica)
conventional +CA (10.9 % silica)
Figure 5.6. Comparison of the modulus (G’) of in-situ EPDM (reaction time of 10 min at
80 C with 33 wt% TEOS) and conventional (with and without coupling agent)
nanocomposites at approximate silica loading of 10 wt%.
Figure 5.6 suggests a higher modulus (G’) of the in-situ EPDM nanocomposite at
high and low strain (~ 30 % increase) as compared to the conventional
nanocomposite (with and without coupling agent). However, despite the
non-uniform silica dispersion, the in-situ NR, EPDM and SBR nanocomposites
prepared under dynamic conditions showed a higher modulus at low (2 %) and high
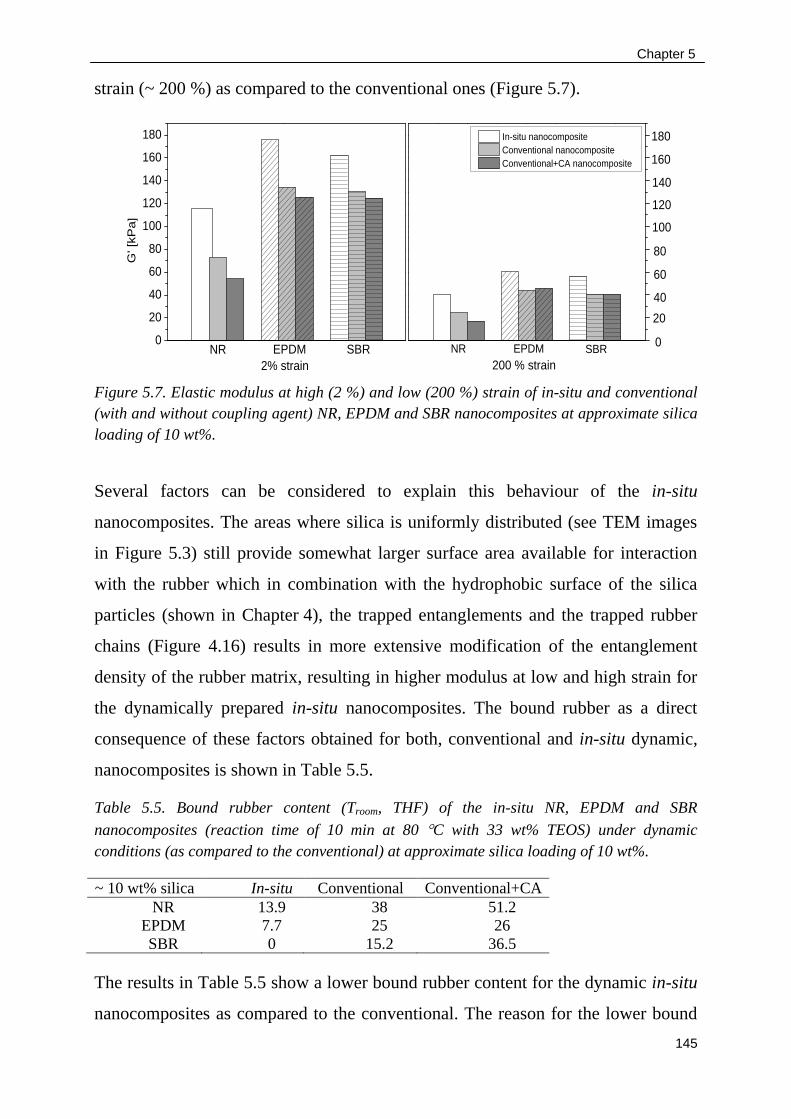
Chapter 5
145
strain (~ 200 %) as compared to the conventional ones (Figure 5.7).
Figure 5.7. Elastic modulus at high (2 %) and low (200 %) strain of in-situ and conventional
(with and without coupling agent) NR, EPDM and SBR nanocomposites at approximate silica
loading of 10 wt%.
Several factors can be considered to explain this behaviour of the in-situ
nanocomposites. The areas where silica is uniformly distributed (see TEM images
in Figure 5.3) still provide somewhat larger surface area available for interaction
with the rubber which in combination with the hydrophobic surface of the silica
particles (shown in Chapter 4), the trapped entanglements and the trapped rubber
chains (Figure 4.16) results in more extensive modification of the entanglement
density of the rubber matrix, resulting in higher modulus at low and high strain for
the dynamically prepared in-situ nanocomposites. The bound rubber as a direct
consequence of these factors obtained for both, conventional and in-situ dynamic,
nanocomposites is shown in Table 5.5.
Table 5.5. Bound rubber content (Troom, THF) of the in-situ NR, EPDM and SBR
nanocomposites (reaction time of 10 min at 80 C with 33 wt% TEOS) under dynamic
conditions (as compared to the conventional) at approximate silica loading of 10 wt%.
~ 10 wt% silica In-situ Conventional Conventional+CA
NR 13.9 38 51.2
EPDM 7.7 25 26
SBR 0 15.2 36.5
The results in Table 5.5 show a lower bound rubber content for the dynamic in-situ
nanocomposites as compared to the conventional. The reason for the lower bound
0
20
40
60
80
100
120
140
160
180
SBREPDM
G' [k
Pa
]
NR
2% strain
180
160
140
120
100
80
60
20
40
In-situ nanocomposite
Conventional nanocomposite
Conventional+CA nanocomposite
SBREPDMNR
200 % strain
0

Chapter 5
146
rubber content can be ascribed to the non-uniform silica distribution (localization in
particular regions) and the relatively large silica particles. It should be noted, that
the SBR in-situ nanocomposite always resulted in complete extraction of the rubber
and no bound rubber content was obtained. A few possible reasons that can explain
this phenomenon were elaborated in Chapter 2. However, for the SBR conventional
nanocomposites (with and without coupling agent) a certain bound rubber content
was obtained. It is expected that the occluded rubber contributes additionally to the
bound rubber content and consequently to the modulus.
The so-called occluded rubber30 is commonly observed in conventionally
prepared nanocomposites. It is a rubber that is trapped in the voids of the silica
aggregates or between the aggregates and behaves as immobilized, adopting the
behaviour of the solid particles. This is valid not only for SBR but also for the NR
and EPDM conventional nanocomposites.
While for the static in-situ nanocomposites it was easy to separate the effect of
the single particles and the aggregates, and to clearly define the high modulus at
low and high strain, in the dynamic in-situ nanocomposites this is not so
straightforward, because not only silica particles but also aggregates and silica
regions are observed. This makes the interpretation of the factors responsible for
the modulus at low strain rather ambiguous. As observed from the previous results,
both the single particle effect and the non-uniform silica dispersion increase the
modulus at low strain.
In summary, we believe that the single silica particles in the dynamically
prepared in-situ nanocomposites and the trapped entanglements caused by the good
rubber-silica interactions contribute to the high modulus (G’) at low strain, as
compared to the conventional nanocomposites. At high strain the modulus of the
in-situ nanocomposites remains higher due to the unique surface chemistry of the
in-situ silica and the possibility of having trapped rubber chains in the silica
structure.

Chapter 5
147
5.3.3. Effect of amount of water on the sol-gel reaction during dynamic mixing
The large amount of water (catalyst solution) used during the dynamic mixing
is always a problem when efficient mixing is concerned. Therefore, different
TEOS:H2O ratios were probed and their effect on the structure of the obtained
nanocomposites announced. Stoichiometricaly, the sol-gel reaction does not require
high amounts of water as shown by the overall reaction:
(1)
The theoretical amount of water and silica content is calculated from the
stoichiometric ratio of these two components with TEOS, where 1 mol of TEOS
corresponds to 2 mol of water and 1 mol of silica. From the calculation, full
conversion of 50 wt% of TEOS into 22.3 wt% theoretical silica can be achieved
with only 14 wt% water. We varied the ratio TEOS:H2O from 1:5 to 1:0.25 and
obtained nanocomposites via dynamic mixing, with different silica contents, as
shown in Figure 5.8.
Figure 5.8. (a) Silica content of in-situ EPDM nanocomposite (reaction time of 15 min at
80 C with 50 wt% TEOS) for different TEOS:H2O ratio, (b) conversion of TEOS during the
dynamic mixing.
Figure 5.8 suggests that decreasing the catalyst solution from 1:5 (used until now
for all experiments) to 1:0.25 of TEOS:H2O, the silica content decreased from 15 to
7 wt%. A higher concentration of catalyst solution enhances both, the hydrolysis
(a)
(b)
wt% silicaTheoretical
[wt%]
TEOS:H2O [wt%]
wt%silica Experimental
TEOS [%] conversion
22.3 14 22.3 100
22.3 250 (1:5) 15 67 22.3 50 (1:1) 12 54 22.3 25 (1:0.5) 10 45 22.3 12.5 (1:0.25) 7 31.4
1:5 1:1 1:0.5 Theoretical 1:0.250
4
8
12
16
20
24
Sili
ca
co
nte
nt
[%]
TEOS:H2O
(a)

Chapter 5
148
and the condensation reaction resulting in a higher silica content and thus a higher
TEOS conversion (see Figure 5.8 (b)). This was also reported by earlier studies 31,32
where a similar behaviour was observed with the increase of water amount and the
catalyst concentration. The reason for the large discrepancy between the
theoretically predicted and the experimentally obtained silica content, even for the
highest catalyst amount, can be partially ascribed to the poor mixing between the
TEOS-swollen rubber and the catalyst solution in the batch mixer and the relatively
short reaction time of 15 min.
In summary, the disadvantages of the in-situ nanocomposites prepared in a
batch mixer are the particle polydispersity and the non-uniform silica dispersion
caused by the inefficient mixing. The reaction temperature of maximum 80 C is
limited by the boiling temperature of the water. However, the greatest advantages
of the dynamic mixing are the significantly increased silica content (as compared to
in-situ static nanocomposites) obtained for the same reaction time and also the
possibility to use lower amount of water. This suggests that industrial production of
the in-situ nanocomposites under dynamic conditions, such as in extrusion, under
high reaction temperatures, lower water content and extensive mixing would be
possible.
5.3.4. Reactive extrusion
In general, twin-screw extruders provide improved mixing as compared to the
single-screw extruders. Twin-screw extruders are commonly used in the industry
for performing reactive extrusions, such as polymerizing of new polymers,
modifying polymers by graft reactions and blending different polymers.2 Therefore,
in the following paragraph a reactive extrusion for preparation of in-situ
nanocomposites via sol-gel reaction will be elaborated.
After obtaining homogenized rubber melt in the first zone (see Figure 5.1), the
TEOS was injected at a constant flow rate of ~ 500 g/h. The mixing of TEOS and
the rubber melt is successfully performed for a (residence) time of 2 min with no
back flow evaporation. The addition of TEOS reduced the rubber viscosity and

Chapter 5
149
enabled better temperature control in this zone. Since the sol-gel reaction generally
involves the use of large amounts of water (catalyst solution), the control of the
amount of water and its maintenance in a liquid state inside the extruder
represented the largest challenge in this process. In order to keep the water in liquid
state at T = 150 C, the pressure had to be kept between 5 - 10 bar to prevent water
evaporation in the extruder. The high pressure in the extruder was achieved with
melt seals at several locations in the extruder. It is important to keep the water in
liquid state because of the mechanism according to which we believe the sol-gel
reaction proceeds. Namely, via inverse micelles formed in the rubber matrix where
hexylamine (catalyst) encloses the water in the inverse micelle and behaves also as
surfactant. If the water is in gas state, the transformation of water into the swollen
rubber (via inverse micelles) would be impeded with no clear effect on the silica
formation.
During the present experiments, the optimal screw speed was found to be
150 rpm. Decreasing the screw speed affected the pressure inside the extruder,
causing evaporation of the water (catalyst solution) due to failing of the melt seals,
and by increasing the screw speed the temperature and the pressure also increased,
leading to destabilization of the system. For a constant amount of TEOS of
~ 500 g/h, the amount of catalyst solution was gradually increased from 60, 120,
240 to 360 g/h avoiding destabilization of the system and allowing the process
always to adjust to the new conditions for approximately 20 - 30 min before the
water content was increased again. The highest amount of water achieved with
stable conditions was 360 g/h (see Figure 5.9).

Chapter 5
150
Figure 5.9. Stable dosing of chemicals (TEOS and catalyst solution) during extrusion process
of sol-gel reaction in rubber with 360 g/h catalyst solution dosing and 500 g/h TEOS.
The pressure in the TEOS mixing zone and the reaction zone was monitored via the
injection systems used for dosing of these liquids. The reaction temperature
measured from the thermocouple was always in the range of 150 - 160 C which
corresponded to the set temperature of the barrel in that zone. The reaction time of
the sol-gel reaction time was approximately 6 min and for 360 g/h it resulted in
formation of 3.2 wt% silica in the EPDM rubber (as determined by TGA). During
the reactive extrusion no distinct odour from the ethanol removed during the sol-gel
reaction was detected, probably because the amount of silica formed was relatively
low.
5.3.4.1. Structure of the extruded in-situ nanocomposite and the effect of mixing
The structure of the in-situ nanocomposite obtained via reactive extrusion is
shown in Figure 5.10.
0 10 20 30 400
200
400
600
800
1000
TEOS
Catalyst solution
Do
sin
g liq
uid
s [g
/h]
Time [min]
T = ~ 155 C
Torque: 60 %

Chapter 5
151
Figure 5.10. Structure of (a) extruded nanocomposite , t = 6 min in comparison to (b)
nanocomposite in static condition, t = 15 min for TEOS amount of 50 wt% TEOS at 150 C
and (c) particle size distribution in extrusion and static conditions.
The TEM image of the extruded nanocomposite in Figure 5.10 (a) suggests a
relatively uniform dispersion of the silica particles throughout the rubber matrix
with no pronounced aggregation or presence of silica regions (see Figure 5.3),
indicating a significantly more efficient mixing than in the batch mixer. The
extruded nanocomposite showed enhanced particle polydispersity and very large
particle sizes reaching more than 300 nm.
Triggered by this interesting result, initially it was expected the high
temperature (150 C) to be responsible for the large particle sizes in the extruded
nanocomposite. In order to support this hypothesis the same experiment was
performed under static conditions keeping the temperature and the TEOS amount
same as in the extrusion. The TEOS:H2O ration was 1:2 instead of the one used
during the extrusion (1:0.72) because from practical reasons the amount of catalyst
solution was too low and could not cover the swollen rubber sample. The reaction
time was extended to 15 min, instead of the 6 min for extrusion, to make sure that
particles have enough time to grow. To our surprise, despite the longer reaction
time and larger amount of catalyst solution, the average particle size in the
nanocomposite prepared under static condition was 45 nm with very low
polydispersity (see Figure 5.10 (b) and (c)).
Due to the high reaction temperature the sample was prepared in special glass
vial that can sustain pressures until approximately 3 bar. The temperature - pressure
0
50
100
150
200
250
300
350
Static
Pa
rtic
le s
ize
[n
m]
Processing method
Extrusion
(c)
0.2m 0.2m
EPDM-extrusion EPDM-static
(a) (b)

Chapter 5
152
diagrams33 suggest minimum 5.5 bar pressure in order to keep the water liquid at
temperatures of 150 C. A possible explanation for the smaller particle size in the
in-situ static nanocomposite might be the partial evaporation of the catalyst solution
in the vial, thus reducing the amount of water and catalyst available for silica
formation in the rubber. The particles in the extruded nanocomposite grew almost
10 fold larger when compared to the static experiment. To explain this the
following three reasons were consider: the renewable interfaces caused by the
extensive mixing, the very high pressure inside the extruder and the melted rubber
mass. The intensive shear forces between the swollen rubber and the catalyst
solution caused by the screws can enable formation of interfaces with very small
thickness which to some extent removes the diffusion limitations present for the
static conditions.
In order to show that diffusion limitations may be neglected for very small
thicknesses an experiment was performed, where the sol-gel reaction proceeded in
EPDM samples with different thickness (0.12, 0.8 and 2 mm). The conditions were
approximated to the ones during the extrusion: 25 wt% of TEOS, TEOS:H2O = 1:2
for all samples at T = 150 C and reaction time of 6 min. The reaction was
performed in special pressure vials (Pmax ~ 3 bar). The particle size determined on
the surface and the centre in the in-situ nanocomposites, as observed by TEM is
shown in Figure 5.11.

Chapter 5
153
Figure 5.11. In-situ EPDM nanocomposites with different thickness (0.12, 0.8 and 2 mm)
prepared in static conditions for 6 min reaction time at 150 C with 25 wt% TEOS.
Figure 5.11 shows that for very small thicknesses (0.12 mm) there is no gradient in
silica particle size which indicates that the diffusion of the TEOS and the catalyst
solution under such extreme temperature conditions (150 C) proceeds fast. As the
thickness is increased to 0.8 and 2 mm, gradient is observed, resulting from the
non-uniform distribution of the TEOS and the catalyst solution along the sample
thickness during the sol-gel reaction. The small average particle size for the three
in-situ nanocomposites on the surface (13 - 14 nm) is probably due to the partial
evaporation of the catalyst solution preventing them to grow to larger sizes.
This might indicate that indeed the efficient mixing during the extrusion
provides thin interfaces between the swollen rubber and the catalyst solution that
surpasses the diffusion limitations. During the mixing process it is expected that
these interfaces are continuously renewed with fresh catalyst solution which may
explain the large silica particles. In addition, the large particle size can be also
ascribed to the relatively high pressures in the extruder required to keep the catalyst
solution in liquid state. It was suggested by earlier studies 34,35 that higher pressures
might accelerate the polycondensation rate without altering the mechanism of the
silica formation. It is believed that the increase in the polycondensation rate is a
direct consequence of the volume contraction caused by the increased pressure that
might ultimately lead to larger particle sizes.
0.12 0.8 20
2
4
6
8
10
12
14
16
18
Part
icle
siz
e [nm
]
Thickness [mm]
Surface
Center

Chapter 5
154
Moreover, the growing silica particles during the extrusion process are
expected to have less (if any) restrictions from the rubber chains. The intensive
mixing in the extruder stretches and loosens the rubber chains in the molten
TEOS-swollen rubber, allowing the particles to possibly grow to larger sizes
without much spatial restrictions. Under static conditions, the particle size could be
to some extent limited by the entangled chains in the rubber network, because the
silica particles must push the rubber chains away while growing.
The effect of the particle size and the polydispersity on the reinforcement of
the extruded nanocomposite, as compared to the in-situ nanocomposite prepared in
the batch mixer and the conventional nanocomposite (with coupling agent) for
same silica content is shown in Figure 5.12.
Figure 5.12. Comparison between the (a and b) extruded nanocomposite, (a) the in-situ
nanocomposite prepared in batch mixer and (b) the conventional nanocomposite with
coupling agent (CA) (10 wt % silica), (c) Moduli (G’) at low and high strain and (d) Structure
of the extruded, in-situ and conventional (+ CA) nanocomposite, respectively.
Figure 5.12 (a), shows lower modulus at low strain for the extruded nanocomposite
as compared to the in-situ nanocomposite prepared under dynamic conditions and
0.2m0.2m 0.2m
In-situ extrusion Conventional+CAIn-situ internal mixer
(a)
(b)
(d)
0.1 1 10 100 10000
20
40
60
80
100
120
140
EPDM
Extrusion (~3.2 wt%)
Conventional + CA (~ 10 wt%)
(b)
G' [k
Pa
]
Strain [%]
0.1 1 10 100 10000
20
40
60
80
100
120
140
160
180
G' [k
Pa]
EPDM
Extrusion (~3.2 wt%)
Internal mixer (~ 2.4 wt%)
(a)
Strain [%]
0
20
40
60
80
100
120
140
160
180
200%
G' [k
Pa]
Strain [%]
Extrusion (3.2 wt%)
Internal mixer (2.4 wt%)
Conventional+CA (~10 wt%)
2%
(c)

Chapter 5
155
comparable modulus at high strain for both materials, in-situ and conventional. The
silica dispersion in the in-situ EPDM nanocomposite prepared in an batch mixer, at
low silica content of 2.4 wt%, is noticeably better than at higher silica contents
(see Figure 5.3), showing a higher presence of single particles and significantly less
aggregates or silica regions. This resulted in a higher modulus at low and high
strain (see Figure 5.12 (c)).
To our surprise, the modulus of the extruded sample (3.2 wt% silica) was
found to be similar to that of the conventional nanocomposite with three times
more silica (10 wt%) including coupling agent. This indicates that the in-situ
nanocomposites, produced via a continuous industrial process like reactive
extrusion, are able to provide similar or even better reinforcement at much lower
silica loadings, acknowledging the effect of the single silica particles. Moreover,
their enhanced hydrophobic nature is also expected to give additional rise to the
modulus, particularly at high strain when rubber-silica interactions play important
role.
5.4. Conclusions
The preparation of the in-situ nanocomposites under dynamic conditions
provided significant increase in silica content for the same reaction time. The
obtained nanocomposites consisted of somewhat larger silica particles with
pronounced polydispersity and aggregation. Due to the mixing a gradient in particle
size was not observed, as under static conditions. It was shown that the sol-gel
reaction in rubber via reactive extrusion is possible and that it has potential to allow
a one-step production of in-situ nanocomposites with promising mechanical
properties. By changing the reaction conditions (mixing, higher T) a significant
improvement in the reaction time of the sol-gel reaction we achieved, from
24 - 72 h reported in literature to 6 min in extruder. One must be aware, that
nanocomposites with higher silica content are required for better performance. The
reactive extrusion is a complex process that involves many aspects that need to be
further addressed. Some of those are: tuning of the screw design to provide good

Chapter 5
156
mixing and longer reaction time, better control over the pressure and the amount of
water used during the reaction and larger throughput which will eventually enable
production of nanocomposites for various applications via reactive extrusion.
Chapter 5
157
5.5. References
[1] C.Sanchez et al.,Journal of Material Chemistry;15;3559-3592;2005
[2] G.L.Nelson and F.Yang,‘Organic-inorganic nanocomposites obtained by reactive
extrusion’;United States Patent;February;2005
[3] J.Qian et al.,Journal of Sol-gel Science and Technology;56;300-309;2010
[4] N.Suzuki et al.,Journal of Applied Polymer Science;95;74-81;2005
[5] S.Kohjiya E.A.,Rubber Chemistry and Technology;73;534-550;2000
[6] R.Joseph,Rubber World;232;16-18;2005
[7] A.Bandyopadhyayc et al.,Journal of Applied Polymer Science;93;2579-2589;2004
[8] T.I.Suratwala et al.,Journal of Sol-gel Science and Technology;316;349-363;2003
[9] H.E.l.Rassy et al.,Journal of Sol-gel Science and Technology;351;1603-1610;2005
[10] L.Q.Zhang et al.,Journal of Applied Polymer Science;108;112-118;2008
[11] M.Ito et al.,Polymer Journal;34;332-339;2002
[12] K.P.Vijayamohanan et al.,Journal of Colloid and Interfacial Science;318;372–379;2008
[13] W.Cheng et al.,Iranian Polymer Journal;20 (8);681-687;2011
[14] Q.Dou et al.,Journal of Sol-Gel Science and Technology;48;51-61;2008
[15] X.Zhu et al.,Polymer Preprints;47(2);1133;2006
[16] W.Bahloul et al.,American Institute of Chemical Engineers;57(8);2174-2184;2011
[17] Z.M.O.Rzaev et al.,Advanced Polymer Technology;26 (1);41-55;2007
[18] J.Pietrasik et al.,Polymer International;54;1119-1125;2005
[19] Y.Ikeda et al.,Journal od Sol-Gel Science and Technology;31;137-142;2004
[20] McGraw-Hill,‘Rubber Engineering’,Tata McGraw-Hill company,New Delhi;1998
[21] J.Frohlich et al.,Composites:Part A;36;449-460;2005
[22] L.Bokobza,Kautschuk Gummi Kunststoffe;62;23-27;2009
[23] H.D.Luginsland et al.,Rubber World;April 28;2001
[24] C.Wrana,Kautschuk Gummi Kunststoffe;61;647-655;2008
[25] S.S.Sternstein et al.,Macromolecules;35;7262-7273;2002
[26] S.S.Sternstein et al.,Composites Science and Technology;63;1113-1126;2003
[27] J.L.Leblanc.,Journal of Applied Polymer Science;78;1541-1550;2000
[28] L.Chazeau et al.,Rubber Chemistry and Technology;80;183;2007
[29] G.Heinrich,Kautschuk Gummi Kunststoffe;57;452;2003
[30] S.Mihara,PhD thesis:‘Reactive processing of silica-reinforced tire rubber’;2009
[31] K.D.Kim et al.,Journal of Sol-gel Science and Technology;25;183-189;2002
[32] A.van Blaaderen et al.,Journal of Non-Crystaline Solids;149;161-178;1992
[33] http://www.engineeringtoolbox.com/boiling-point-water-d_926.html
[34] I.Artaki et al.,Journal of Sol-gel Science and Technology;72;391-402;1985
[35] M.Grant Nortona et al., Journal of Material Resolution;20(1);2005

Technology assessment
The 21th century gave birth to the nano-science as one of the fields
contributing to a high level of scientific and technological development. Hybrid
organic-inorganic materials play a major role in the development of advanced
functional materials. In addition to the high versatility in chemical and physical
properties, hybrid nanocomposites present paramount advantage because they can
combine integration and miniaturization, therefore opening promising applications
in many fields: optics, electronics, ionic’s, mechanics, membranes, coatings and
medicine.1
So far conventional rubber nanocomposites are produced via a time and
energy consuming process of mixing rubber and silica. The transformation into a
continuous process such as the extrusion will enable bulk production of
conventional nanocomposites.2 However, the use of extrusion to produce
nanocomposites is difficult due to the agglomeration of the inorganic phase
(particularly for nano-size fillers), rendering good dispersion into the rubber phase.
Therefore, it remains a need for a method capable of increasing the compatibility

Chapter 6
159
and productivity of conventional nanocomposites by overcoming the current
limitations. Two possible approaches are considered as a possibility to improve the
compatibility and the productivity of the future rubber/silica nanocomposites.
6.1. Surface chemistry of the in-situ silica particles
So far the greatest challenge in the rubber industry was the improvement in
compatibility between the silica, being strongly polar and the rubber, being strongly
apolar. In Chapter 4 with the help of Solid-state NMR a unique structure of the
in-situ silica was revealed, made via sol-gel reaction using hexylamine as catalyst.
The NMR study revealed so-called ‘hairy’ silica particles with enhanced
hydrophobic character due to the presence of remnant ethoxy groups and
hexylamine residing on the silica surface.
Unlike the, conventional nanocomposites where the use of coupling agents is a
necessity, the in-situ silica with its unique surface chemistry has better
compatibility with the rubber in the absence of coupling agents and has
consequently improved mechanical properties.
6.1.2. Future outlook and optimization
An interesting approach to further explore and tune the surface chemistry, thus
the hydrophobicity of the ‘hairy’ silica particles, is by changing the silica precursor
(e.g. from tetramethyl-ortosilicate-TMOS to tetrabutyl-orthosilicate-TBOS), as
schematically shown in Figure 6.1.
Figure 6.1 Schematic drawing of possible different surface chemistry of the silica particles
formed via sol-gel reaction as function of the silica precursor, (a) TMOS, (b) TEOS and
(c) TBOS, respectively.
(a) (b) (c)

Chapter 6
160
The schematic representation of the three possible silica surfaces for TMOS, TEOS
and TBOS can possibly result in silica particles with different hydrophobicity,
likely the lowest for the TMOS and the highest for the TBOS precursor. This can
be ascribed to the different length of the alkoxide group residing on the silica
surface, where longer chains (TBOS) are expected to provide better shielding of the
hydroxyl groups and consequently increase the hydrophobic character of the in-situ
silica.
The particular surface chemistry obtained for the in-situ silica is expected to
provide better compatibility with the rubber matrix and to lead to easier and more
efficient dispersion of the silica particles without the addition of coupling agent.
The in-situ silica particles can possibly be mixed not only with rubber materials but
also with thermoplastics such as: polyethylene (PE), polypropylene (PP),
poly (methyl-methacrylate) (PMMA) and many others, thereby broadening its
application areas.
6.2. Sol-gel reaction in rubber via reactive extrusion
Reactive extrusion can be a way to do synthesis, dispersion and
functionalization of the silica particles in the prepared nanocomposites in a one-
step via the sol-gel reaction.
In Chapter 5 the possibilities of performing the sol-gel reaction in rubber via
one - step extrusion were discussed. The attempt to perform the sol-gel reaction
(in rubber) via reactive extrusion was successful and an in-situ EPDM
nanocomposite with 3.2 wt% silica was obtained. The kinetic study in Chapter 4
performed with time-resolved SAXS and MAS-NMR showed that indeed the
reaction rate increases significantly with temperature leading to fast formation of
the silica structure (high Q3:Q4) in only 15 min. Showing the possibilities for
performing the sol-gel reaction via reactive extrusion at extreme reaction
conditions (high temperature and short reaction times) without really compromising
the structure of the formed silica particles. The reactive extrusion has certainly its
own advantages and disadvantages, such as:

Chapter 6
161
Advantages:
- Easy transport of the polymer mass
- No evaporation of volatile chemicals (ethanol, TEOS and catalyst solution)
- Short residence time and mass production of the in-situ nanocomposites
- Good silica dispersion without time/energy consuming mixing steps
Disadvantages:
- Rather complicated process that still requires optimization (screw design,
temperature, extruder configuration and dozing)
- Relatively low TEOS conversion
- High silica precursor costs
- Additional drying step of the produced in-situ nanocomposites to remove the
remnant chemicals (ethanol, non-reacted TEOS and water)
6.2.1. Future outlook and optimization
The extrusion process shows great potential for production of the in-situ
nanocomposites. However, future optimization is important for achieving higher
silica content and improving the overall stability of the process.
There are several parameters that can be tuned for better optimization, such as:
screw speed, temperature and screw design. In general, by increasing the screw
speed the mixing efficiency between the TEOS swollen rubber and the catalyst
solution is increased, however one must realize that, in that case, the system is
prone to destabilization.
The screw design plays an essential role in the mixing efficiency between the
high viscosity rubber material and the low viscosity catalyst solution. A proper
screw design should prevent back-flow evaporation and be able to maintain
sufficiently high pressure in the extruder to keep the water liquid.
6.2.2. Side-feeding extruder
A longer reaction time is important for providing higher silica content. This

Chapter 6
162
can be achieved by assembling an additional side-feeding extruder that can provide
mixing of the rubber and the TEOS (short mixing time) and continuously feed this
material into the second extruder used for conducting the sol-gel reaction. This
allows individual controlling of each reaction parameter (temperature, screw
design, screw speed and chemistry) and provides much longer reaction time
required for achieving higher silica content. It should be noted that the greatest
challenge in performing the sol-gel reaction in rubber via reactive extrusion is the
high amount of water used during the silica formation. Two possible options are
considered to surpass this problem, i.e. the use of latex in the case of NR and the
use of pre-hydrolyzed TEOS (PAOS).
- NR latex
One way to avoid the problems with the use of high amounts of water is to use a
NR latex instead of solid rubber. This can be advantageous because the rubber latex
usually consists of approximately 35% solid rubber and the rest is water. Therefore,
the use of additional water is not necessary which provides excellent opportunity
for performing the sol-gel reaction.3
- Pre-hydrolyzed TEOS poly (ethoxyorthosilicate) (PEOS)
Another possibility to increase the silica content in the in-situ nanocomosites and to
simplify the processing conditions is the use of a pre-hydrolyzed form of the TEOS
(PAOS),5 as shown in Figure 6.2.
Oligomeric precursors are desirable when it is necessary to increase the silica
Figure 6.2. Pre-hydrolyzed form of TEOS (PAOS).

Chapter 6
163
content.4,5,6 It would be very interesting to conduct a study of the sol-gel reaction in
presence of PAOS and hexylamine, as catalyst, for variety of thermoplastic and
rubber materials.

Chapter 6
164
6.3. References
[1] C.Sanchez et al.,Journal of Materials Chemistry;15;3559-3592;2005
[2] G.L.Nelson,U.S. Patent Nr. US 0027040 A1;2005
[3] J.Oberdisse, Macromolecules;35;9441-9450;2002
[4] C.Jeffrey Brinker et al.,’Sol-gel Science’;Academic Press;1990
[5] X.Zhu et al.,Polymer Preprints;47(2);1133;2006
[6] Q.Dou et al.,Journal of Sol-Gel Science and Technology;48;51-60;2008

Acknowledgments
The completion of this thesis marked an end of my academic era at TU/e including not only
the PhD but also the Master studies and thanks to many people this period is successfully
ended.
My first greatest thanks to Prof. de With, for the time and effort invested in giving valuable
comments that greatly contributed to the quality of the thesis. Thank you Bert.
I would also like to thank to my whole committee for giving their comments that contributed
significantly to the final quality of the thesis: Prof. Christian Hopmann, Prof. Wilma Dierkes,
Prof. Rene Janssen, Prof. Han Goossens, Dr. Martin van Duin and Dr. Denka Hristova-
Bogaerds.
I need to thank many people for finalizing my thesis but one that has the pedestal is certainly
my supervisor Denka Hristova-Bogaerds. It already sounds rather strange when I write
supervisor, because throughout the years (Master and PhD) she has become much more than
that, a friend, that supported and guided me not only through my research but also privately. I
will always remember all the fun we had together traveling to conferences and companies
trying not to get lost, which is one of my best times ever, Merci Dence.
I would also like to thank my other supervisor Martin van Duin for all the long discussions
we had revealing the mysterious path of silica formation in rubber. Great thanks to Roger
Timmerman for the RPA measurements at DSM and also the Materials Science group (DSM),
especially to Frank Houtvast for all the help with the reactive extrusion. It was a struggle to
make it happen and all the effort was worthwhile when finally the last two days everything
went just perfect.
To Michael R. Hansen and Cornelius Friedrich from the Max Planck Institute in Mainz,
Germany for the Solid-state NMR measurements. You guys helped to resolve a 30 year old
mystery and I am very thankful for that. I enjoyed our long working hours and I will certainly
never forget the two weeks we spend with Cornelius trying to study the kinetic of the sol-gel
reaction in a capillary…it was a challenge to remember. To Olivier Persenarie from the
MateriaNova research institute in Mons, Belgium for the FTIR-TGA-MS measurements and
to all the nice people in his group that made my stay much more pleasant.
My thanks also to Anne Spoelstra for the TEM images, for the brainstorming around our
occasional strange discoveries on the images and the patience she had with all my questions
throughout these years. To Paul Bomans for its support with the cryo-TEM experiments, I am
sure he misses the radio and my singing in the lab during the long hours of cryo cutting I
would also like to thank Erik Niels from the SKT group for all the advice and pleasant talks

we had regarding the Fix’s laws of diffusion. Many thanks to his contribution in the first
paper (Chapter 2) published from this thesis. To Bob Fiefild, I will not mention all the help
during this period because with Bob that comes by default, but I will mention the interesting
conversations we had regarding history and origin of languages, he is probably ‘surviving’ at
the moment.
A special thanks to my two officemates, Gizka and Ivi (+Gabi), in the so-called ‘Eastern
European’ office that we shared all this time. Thank you for putting up with all the food smell
in the office and my occasional singing. Luckily the strict food regime started only in the last
two years otherwise I think you would left (or kick me out) long time ago. Special thanks to
Gizka who is also my good friend, I enjoyed our private talks and jokes that definitely is a
part of great 4 years in the office, a friendship that still continues.
I would like to thank the whole SKT group lead by Prof. Piet Lemstra: Han Goossens,
Pauline, Marjolijn Pessers, Tamara, Benny, Pim, Karel, Yogesh, Roy, Maurizio, Martijn,
Cees, Jules, Rafiq, Bjorn, Peter Koets, Christina, Wouter and also to my SPC (especially
Yingyuan and Monique) and SFD colleagues and friends (especially to Natalia, Paul and Me)
for their unselfish help and great time together.
The long stay in Netherlands resulted in developing wonderful friendships that maybe not
directly but certainly indirectly had their contribution to the finishing of this thesis. One
person that deserves most of the credits is my ‘dear’ housemate Andrey. He patiently put up
with me in my down moments (by hiding in his room or sneaking out of the house) and
high moments. Enlightening me every day before work at breakfast with new alternative
music choice that eventually (after heavy compromising) came down to anything else but
Nina Simon.
To my friend Carina, for being there when I needed to complain, laugh and just have
someone to listen. I enjoyed our talks usually spiced with reasonable dose of sarcasm.
Since this thesis is finalized while enrolling in my current job position as product developer in
the HPP team in Sabic-IP, I would also like to thank my new colleagues and greatest thanks to
my manager Kapil Sheth and mentor Edward Venema for their understanding and support in
the last finalizing months.
To my family: Familijo moja, vi blagodaram najmnogu od se na svetot nemam nisto posveto
od vas, posebno tebe majce. Nisto od ova ne bi bilo da ne si bila ti pokraj mene pozrtvuvana
kako I sekogas, da me razberes I da mi se najdes koga si mi najpotrebna. Jas sum najsreknata
licnost na svetot sto ve imam site vas zaedno. Dade, fala ti za ohrabruvackite zborovi koi
mnogu gi cenam, bidejki znam kolku si tezok na zborovi
Tetic znaejki deka si tuka sekogas mi bilo polesno, za celata podrska dodeka sum tuka I za

nasite dolgi razgovori na telefon. Juki src ti definitivno mi go razubavuvas denot, nikogas ne
zaboravas da mi pises I da me potsetis da kupam shejk Fala mnogu na site sto ve imam vo
mojot zivot, najmili moi! Golemo fala na mojata najdobra drugarka Stance I na Annce vo
Skopje, za prekrasniot provod sekogas koga ke se vratam I za vasat podrska da istraam vo se
sto ke naumam.

Curriculum Vitae
Elena Miloskovska was born on 3 April 1980 in Skopje, Macedonia. After finishing her
secondary education at the Chemistry school, ‘Marija Kiri-Skolodovska’ in 1998, she
received her BSc degree in Polymer Engineering at the University of Technology and
Metallurgy in Macedonia on February 2004. From March 2004 until July 2006 she was
working in a Printed Circuit Board (PCB) company, Hi-Tech Corporation, as process
engineer and later as a shift production manager in Skopje, Macedonia. In August 2006 the
author received full scholarship from the Eindhoven University of Technology for pursuing
the Master program in Polymers and Composites. She obtained Master’s degree in 2008 after
completion of her thesis: ‘Structure-Property relationships of (poly)pentadecalactone (PPDL)’
in the ‘Polymer Technology’ group of prof.dr. P.J. Lemstra. In September 2008, she started
her PhD study in the same group. During the PhD study, she completed three modulus of the
course ‘registered Polymer Scientist’ (RPK), organized by the ‘National Dutch Graduate
School of Polymer Science and Technology’ (PTN), which includes Polymer Physics,
Polymer Properties, and Rheology & Polymer Processing.

List of publications
1. E. Miloskovska, D. G. Hristova-Bogaerds, C. Friedrich, M. R. Hansen, M. van
Duin, G.de With
’Growth mechanism of in-situ silica and kinetics of sol-gel reaction in rubber matrix
using SAXS and Solid-State NMR’, in submission for Macromolecules
2. E. Miloskovska, D. G. Hristova-Bogaerds, C. Friedrich, M. R. Hansen, M. van
Duin, G.de With
’Novel ‘hairy’ silica particles with hydrophobic surface’, in submission for
Advanced Materials
3. E. Miloskovska, D. G. Hristova-Bogaerds, C. Friedrich, M. R. Hansen, M. van
Duin, G.de With
‘Structure of the in-situ silica and its effect on the properties of rubber/silica
nanocomposites’, in submission for Macromolecules
4. E. Miloskovska, D. G. Hristova-Bogaerds, M. van Duin, A. Spoelstra, E. Niels, G.de With
‘Influence of sol-gel reaction parameters on structure of in-situ natural rubber/silica
nanocomposites’, in submission for Journal of Polymer Physics:Part B
5. E. Miloskovska, D. G. Hristova-Bogaerds, M. van Duin, P. Elemans, G.de With
‘Rubber/silica nanocomposites via reactive extrusion’, in preparation for Nanotechnology