Thermoplastic elastomers from rubber and recycled polyethylene: chemical reactions at interphases...
11
Polymer International Polym Int 53:1693–1703 (2004) DOI: 10.1002/pi.1530 Thermoplastic elastomers from rubber and recycled polyethylene: chemical reactions at interphases for property enhancement Olga Grigoryeva, 1 Alexander Fainleib, 1 Olga Starostenko, 1 Alexander Tolstov 1 and Witold Brostow 2,3∗ 1 Institute of Macromolecular Chemistry of the National Academy of Sciences of Ukraine, 48 Harkivske shose, 02160 Kyiv, Ukraine 2 Department of Materials Science and Engineering, University of North Texas, PO Box 305310, Denton, TX 76203-5, USA 3 Center for Applied Physics and Advanced Technology (CFTA), National University of Mexico, Querataro, Mexico Abstract: Recycled low density polyethylene (R-LDPE) has been reactively compatibilized with butadiene rubber (BR) by using small additions of reactive polyethylene copolymers and reactive BRs to produce thermoplastic elastomers (TPEs). TPEs were characterized by thermogravimetric analysis (TGA), differential scanning calorimetry (DSC), dynamic mechanical analysis (DMA), rheology measurements, wide-angle X-ray scattering (WAXS) and mechanical testing. WAXS results show that the presence of BR and reactive modifiers does not completely prevent the crystallization of R-LDPE during the TPE formation. Depression of the melting point has been found in all cases. Also in all cases, compatibility is provided by formation of interfacial layers. The best mechanical characteristics are obtained for R-LDPE + BR blends compatibilized with poly(ethylene-co-acrylic acid) (PE-co-AA) and polybutadiene terminated with isocyanate groups (PB-NCO) for PB-NCO = 7.5 wt% per PB and COOH/NCO ratio = 1/1. The stress at break and elongation at break are respectively improved by 31 % and 63 %. The PB-NCO modifier participates in co-vulcanization with BR in the rubber phase and reacts at the interface with the PE-co-AA dissolved in the polyolefin phase. As a result, the amorphous phase of R-LDPE is dissolved by the rubber phase and a morphology with dual phase continuity is formed, assuring an improvement of mechanical properties of TPEs. 2004 Society of Chemical Industry Keywords: recycling; dynamic vulcanization; reactive compatibilization; LDPE; BR; TPE INTRODUCTION It is known that thermoplastic elastomers (TPEs) can be produced from polymer blends consisting of non-vulcanized virgin rubber and thermoplastic polymers such as polyolefins. 1–9 The TPE properties can be much improved by a dynamic or in situ curing. 2–5,7,9 During dynamic vulcanization, carried out by intense mixing above the melt temperature of the thermoplastic polymer, the rubber phase will be crosslinked (vulcanized) and finely dispersed (mean particle size of a few microns) in the thermoplastic. The latter takes the role of the matrix. 4 The resulting TPE exhibits rubbery characteristics while maintaining the thermoplasticity of the matrix. As a consequence, the TPE is melt (re)processable. A further benefit of TPEs is that they provide high value-added products if the components are derived from waste sources (‘upcycling’). Preliminary results show that the TPEs can be adopted for certain post-consumer goods. 10–12 Since thermoplastic and rubber are usually incompatible, providing component compatibility via an enhancement of interfacial adhesion is needed. 13–16 The reactive compatibilization can be realized by several ways. 13,15 In this work, we introduce reactive polyethylene copolymer into a thermoplastic phase and reactive polybutadiene rubber into a rubber phase. 17,18 The functional groups of polymer additives used should be reactive with each other. During intensive mixing of components at an elevated temperature a chemical reaction occurs at the interface, leading to increased adhesion between thermoplastic and rubber phases. The morphology of such compatibilized TPEs should result in a reinforcement of their mechanical properties. EXPERIMENTAL Materials The virgin butadiene rubber (BR) (weight-average molecular weight M w = 21 000 g mol −1 was SKD-2 ∗ Correspondence to: Prof Witold Brostow, Department of Materials Science, University of North Texas, Denton, TX 76203-5310, USA E-mail: [email protected] Contract/grant sponsor: European Union INCO-Copernicus project; contract/grant number: ICA2-CT-2001-10003 Contract/grant sponsor: US Department of Commerce, Washington, DC (SABIT Program) (Received 19 July 2003; revised version received 4 September 2003; accepted 10 October 2003) Published online 30 July 2004 2004 Society of Chemical Industry. Polym Int 0959–8103/2004/$30.00 1693
Transcript of Thermoplastic elastomers from rubber and recycled polyethylene: chemical reactions at interphases...

Polymer International Polym Int 53:1693–1703 (2004)DOI: 10.1002/pi.1530
Thermoplastic elastomers from rubber andrecycled polyethylene: chemical reactionsat interphases for property enhancementOlga Grigoryeva,1 Alexander Fainleib,1 Olga Starostenko,1 Alexander Tolstov1
and Witold Brostow2,3∗1Institute of Macromolecular Chemistry of the National Academy of Sciences of Ukraine, 48 Harkivske shose, 02160 Kyiv, Ukraine2Department of Materials Science and Engineering, University of North Texas, PO Box 305310, Denton, TX 76203-5, USA3Center for Applied Physics and Advanced Technology (CFTA), National University of Mexico, Querataro, Mexico
Abstract: Recycled low density polyethylene (R-LDPE) has been reactively compatibilized with butadienerubber (BR) by using small additions of reactive polyethylene copolymers and reactive BRs to producethermoplastic elastomers (TPEs). TPEs were characterized by thermogravimetric analysis (TGA),differential scanning calorimetry (DSC), dynamic mechanical analysis (DMA), rheology measurements,wide-angle X-ray scattering (WAXS) and mechanical testing. WAXS results show that the presence ofBR and reactive modifiers does not completely prevent the crystallization of R-LDPE during the TPEformation. Depression of the melting point has been found in all cases. Also in all cases, compatibilityis provided by formation of interfacial layers. The best mechanical characteristics are obtained forR-LDPE + BR blends compatibilized with poly(ethylene-co-acrylic acid) (PE-co-AA) and polybutadieneterminated with isocyanate groups (PB-NCO) for PB-NCO = 7.5 wt% per PB and COOH/NCO ratio = 1/1.The stress at break and elongation at break are respectively improved by 31 % and 63 %. The PB-NCOmodifier participates in co-vulcanization with BR in the rubber phase and reacts at the interface with thePE-co-AA dissolved in the polyolefin phase. As a result, the amorphous phase of R-LDPE is dissolved bythe rubber phase and a morphology with dual phase continuity is formed, assuring an improvement ofmechanical properties of TPEs. 2004 Society of Chemical Industry
Keywords: recycling; dynamic vulcanization; reactive compatibilization; LDPE; BR; TPE
INTRODUCTIONIt is known that thermoplastic elastomers (TPEs)can be produced from polymer blends consistingof non-vulcanized virgin rubber and thermoplasticpolymers such as polyolefins.1–9 The TPE propertiescan be much improved by a dynamic or in situcuring.2–5,7,9 During dynamic vulcanization, carriedout by intense mixing above the melt temperature ofthe thermoplastic polymer, the rubber phase will becrosslinked (vulcanized) and finely dispersed (meanparticle size of a few microns) in the thermoplastic.The latter takes the role of the matrix.4 Theresulting TPE exhibits rubbery characteristics whilemaintaining the thermoplasticity of the matrix. Asa consequence, the TPE is melt (re)processable. Afurther benefit of TPEs is that they provide highvalue-added products if the components are derivedfrom waste sources (‘upcycling’). Preliminary resultsshow that the TPEs can be adopted for certainpost-consumer goods.10–12 Since thermoplastic and
rubber are usually incompatible, providing componentcompatibility via an enhancement of interfacialadhesion is needed.13–16
The reactive compatibilization can be realizedby several ways.13,15 In this work, we introducereactive polyethylene copolymer into a thermoplasticphase and reactive polybutadiene rubber into arubber phase.17,18 The functional groups of polymeradditives used should be reactive with each other.During intensive mixing of components at an elevatedtemperature a chemical reaction occurs at theinterface, leading to increased adhesion betweenthermoplastic and rubber phases. The morphologyof such compatibilized TPEs should result in areinforcement of their mechanical properties.
EXPERIMENTALMaterialsThe virgin butadiene rubber (BR) (weight-averagemolecular weight Mw = 21 000 g mol−1 was SKD-2
∗ Correspondence to: Prof Witold Brostow, Department of Materials Science, University of North Texas, Denton, TX 76203-5310, USAE-mail: [email protected]/grant sponsor: European Union INCO-Copernicus project; contract/grant number: ICA2-CT-2001-10003Contract/grant sponsor: US Department of Commerce, Washington, DC (SABIT Program)(Received 19 July 2003; revised version received 4 September 2003; accepted 10 October 2003)Published online 30 July 2004
2004 Society of Chemical Industry. Polym Int 0959–8103/2004/$30.00 1693

O Grigoryeva et al
from Voronezhsintezkauchuk, Voronezh, Russia. ItsMooney viscosity ML (1 + 4) at 130 ◦C is 46. Recy-cled low density polyethylene (R-LDPE) was madefrom greenhouse films containing 65–70 % LDPE,12–17 % linear LDPE, 12–15 % poly(ethylene-co-vinyl acetate), additives (kaolin, talc, silica, short-termantioxidant for processing, long-term antioxidant forstability) ≈500 ppm, UV stabilizers (amine, benzophe-none) ≈2500 ppm. The melt flow index (MFI) valuesare: MFI190/2.16 = 0.29 g/10 min and MFI230/2.16 =0.95 g/10 min. Post-consumer greenhouse films werecollected in the province of Ragusa (Sicily, Italy) afternearly one year of exploitation, and were washed, driedand cut to pieces by an industrial-scale machine.
As a standard sample, a virgin LDPE (V-LDPE), Riblene FC30 from Polimeri Europe,Rome, Italy, was used. This polymer is usedfor greenhouse film applications and has the fol-lowing characteristics: number-average molecularweight) Mn = 31 100 g mol−1, Mw = 179 200 g mol−1,Mz = 487 200 g mol−1, Mw/Mn = 5.76, Mz/Mw =2.72; the melt flow index values are: MFI190/2.16 =0.28 g/10 min and MFI230/2.16 = 0.8 g/10 min.
Reactive compatibilization and TPE preparationThe reactive thermoplastics and reactive rubbers usedare defined in Table 1. All polyethylene copolymersand polybutadienes terminated with epoxy, amineand carboxyl groups were from Aldrich Chemicals.Polybutadiene with terminal isocyanate groups wasKrasol LBD from Kaucuk, a.s.—Unipetrol Group,Prague, Czech Republic. Materials were used asreceived. The compositions used are listed in Table 2.
Polymers were mixed in a twin-rotor mixer of theBrabender type at 180 ◦C at 100 rpm for 10 min. Inall cases, BR with reactive polybutadiene rubber, ZnOand stearic acid were mixed first for 2 min beforethe addition of LDPE with a reactive polyethylene
Table 1. Reactive thermoplastics and reactive rubbers used
Name Code
Content ofreactive
groups (wt%)
Reactive thermoplastics:Poly(ethylene-co-acrylic acid) PE-co-AA 5.0Poly(ethylene-co-glycidyl
methacrylate)PE-co-GMA 8.0
Poly(ethylene-co-vinylacetate-co-acrylic acid)
PE-co-VA-co-AA 1.0
Poly(ethylene-graft-maleicanhydride)
PE-g-MAH 3.0
Reactive rubbers:Polybutadiene, terminated
with epoxy groupsPB-E 16.0
Polybutadiene, terminatedwith amine groups
PB-NH2 1.2
Polybutadiene, terminatedwith carboxyl groups
PB-COOH 1.9
Polybutadiene, terminatedwith isocyanate groups
PB-NCO 2.6
Table 2. Compositions
Additivesa Component content (wt%)
Recycled R-LDPE 60Butadiene rubber, BR 40Stearic acid 1Sulfur 3Bis-(2-benzothiazolyl)disulfide 1Zinc oxide 5Reactive couples:
Reactive rubbers 1.5:15.0Reactive thermoplastics Variableb
a All additive (excluding R-LDPE) concentrations are with respectto BR.b The stoichiometric ratio of functional groups of reactive rubbers andthermoplastics = 1:1 for all compositions.
copolymer. For dynamic vulcanization, curing agentswere added after 2 min of mixing BR with moltenLDPE and mixed for a further 6 min. We relied onresults of torsion torque vs time determination whichgave us 10 min as the time of the maximum valueof torsion torque. The TPE sheets with thicknessof 1 mm were produced by compression molding at180 ◦C under a pressure of 10 MPa.
Characterization techniquesThermogravimetric analysis (TGA) was performedusing the Q-1500D Derivatograph system developedby F Paulik, J Paulik and L Erdey from MagyarOptikai Muvek Vevoszolgalat, Budapest, Hungary. Weinvestigated the temperature range from 290 to 875 Kat a heating rate 10 K min−1 in air with evacuation ofgaseous products of degradation. The sample weightwas around 50 mg.
Wide-angle X-ray scattering (WAXS) curves wererecorded with an X-ray DRON-4-07 diffractometerfrom Orelnauchpribor, Orel, Russia, using Cu-Kα
radiation monochromatized by a Ni filter. The meansize of the crystallites 〈D〉 was calculated usingthe Scherer equation,19 the crystal lattice spacing〈d〉 (ie the distance between reflecting planes) wascalculated from the Bragg equation,19 and the degreeof crystallinity 〈X〉 was calculated using the Matthewsmethod.20
Differential scanning calorimetry (DSC) thermo-grams were obtained using a calorimeter with diather-mic cells under nitrogen in the temperature rangefrom 293 to 413 K and a heating rate of 2 K min−1.The sample weight was 15–20 mg. The temperaturedependence of heat capacity Cp was determined andthe degree of crystallinity was calculated using theLupolen standard from Hoechst AG, Frankfurt/Main,Germany, assumed to have 100 % crystallinity and theenthalpy of melting Hm = 290 J g−1.
Rheological measurements were performed usingan MV-2 capillary microviscosimeter of the meltindexer type21 (the capillary diameter and length arerespectively 1.26 and 8.3 mm) at temperatures of 413,433, 453 and 473 K. The wall shear stress τw, wall
1694 Polym Int 53:1693–1703 (2004)
Thermoplastic elastomers from rubber and recycled polyethylene
shear rate γw, and shear viscosity η were calculatedusing standard equations.3
Dynamic mechanical thermal analysis (DMA) mea-surements in the tensile mode were performed with aviscoelastometer of the Rheovibron type with temper-ature scans from 173 to 445 K at frequency 100 Hzand a heating rate of 2.0 K min−1. Dimensions of sam-ples were 5.0 cm × 0.5 cm × 0.1 cm. The temperaturecorresponding to the maximum of the loss modulusE′′ was taken as the glass transition temperature Tg.21
In order to estimate the crosslinking degree of bothLDPEs, the residual gel content was determined viaSoxhlet extraction using o-xylene. The extraction wascarried out for 8 h (≈10 times circulation of solventper hour) followed by drying the samples in an airoven (50 ◦C for 24 h) prior to weighing. The o-xyleneinsoluble fraction was considered to correspond to theresidual gel content.
Mechanical testing was performed with an Instron1122 machine at the ambient temperature at theelongation rate (the speed of upper cross-arm)50 mm min−1; averages for 6–7 specimens werecalculated to obtain the stress at break σb and theelongation at break εb.
COMPARISON OF VIRGIN AND RECYCLEDLDPES
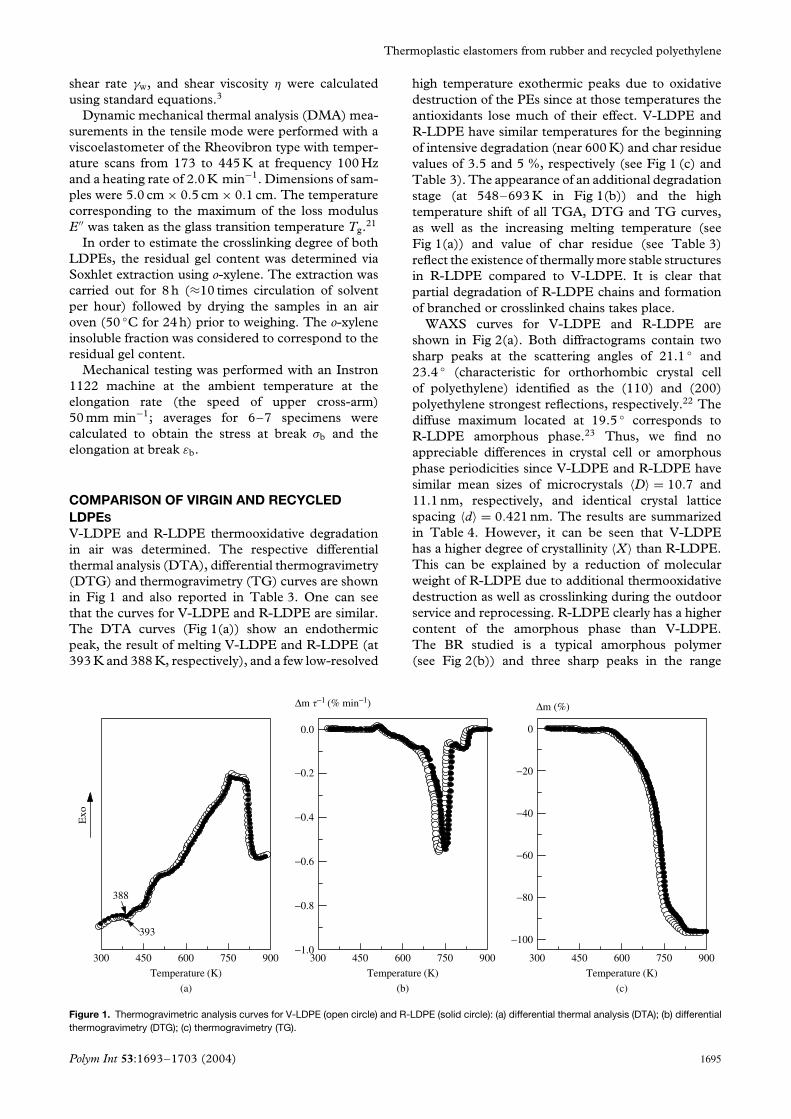
V-LDPE and R-LDPE thermooxidative degradationin air was determined. The respective differentialthermal analysis (DTA), differential thermogravimetry(DTG) and thermogravimetry (TG) curves are shownin Fig 1 and also reported in Table 3. One can seethat the curves for V-LDPE and R-LDPE are similar.The DTA curves (Fig 1(a)) show an endothermicpeak, the result of melting V-LDPE and R-LDPE (at393 K and 388 K, respectively), and a few low-resolved
high temperature exothermic peaks due to oxidativedestruction of the PEs since at those temperatures theantioxidants lose much of their effect. V-LDPE andR-LDPE have similar temperatures for the beginningof intensive degradation (near 600 K) and char residuevalues of 3.5 and 5 %, respectively (see Fig 1 (c) andTable 3). The appearance of an additional degradationstage (at 548–693 K in Fig 1(b)) and the hightemperature shift of all TGA, DTG and TG curves,as well as the increasing melting temperature (seeFig 1(a)) and value of char residue (see Table 3)reflect the existence of thermally more stable structuresin R-LDPE compared to V-LDPE. It is clear thatpartial degradation of R-LDPE chains and formationof branched or crosslinked chains takes place.
WAXS curves for V-LDPE and R-LDPE areshown in Fig 2(a). Both diffractograms contain twosharp peaks at the scattering angles of 21.1 ◦ and23.4 ◦ (characteristic for orthorhombic crystal cellof polyethylene) identified as the (110) and (200)polyethylene strongest reflections, respectively.22 Thediffuse maximum located at 19.5 ◦ corresponds toR-LDPE amorphous phase.23 Thus, we find noappreciable differences in crystal cell or amorphousphase periodicities since V-LDPE and R-LDPE havesimilar mean sizes of microcrystals 〈D〉 = 10.7 and11.1 nm, respectively, and identical crystal latticespacing 〈d〉 = 0.421 nm. The results are summarizedin Table 4. However, it can be seen that V-LDPEhas a higher degree of crystallinity 〈X〉 than R-LDPE.This can be explained by a reduction of molecularweight of R-LDPE due to additional thermooxidativedestruction as well as crosslinking during the outdoorservice and reprocessing. R-LDPE clearly has a highercontent of the amorphous phase than V-LDPE.The BR studied is a typical amorphous polymer(see Fig 2(b)) and three sharp peaks in the range
300 450 600 750 900
Exo
393
388
300 450 600 750 900−1.0
−0.8
−0.6
−0.4
−0.2
0.0
Temperature (K) Temperature (K) Temperature (K)
∆m (%)∆m t−1 (% min−1)
300 450 600 750 900
−100
−80
−60
−40
−20
0
(a) (b) (c)
Figure 1. Thermogravimetric analysis curves for V-LDPE (open circle) and R-LDPE (solid circle): (a) differential thermal analysis (DTA); (b) differentialthermogravimetry (DTG); (c) thermogravimetry (TG).
Polym Int 53:1693–1703 (2004) 1695

O Grigoryeva et al
of approximately 32–36 ◦ can be attributed to lowmolecular weight additives used in the curing process(see Table 2).
The WAXS data agree with DSC results (Fig 3(a)).It is confirmed that the BR studied is amorphous.Two relaxations at 203–249 K and 319–383 K areevidence of some heterogeneity of the BR structure.The first transition has to be assigned to the α-relaxation process, ie the glass transition temperatureTg of flexible (uncrosslinked) BR chains, Tg = 226 K.Note that the value of the heat capacity jump �Cp
at the Tg is small, namely �Cp = 0.1 J g−1 K−1. Thus,the number of segments of BR chains not limitedby crosslinking bonds (uncured molecules) is notsignificant. The second high temperature transitionreflects the mobility of BR segments limited byintermolecular crosslinking (cured structure); thehigher value of �Cp = 0.24 J g−1 K−1 is evidence ofa considerable proportion of such segments.
The Cp (T) plots of both LDPEs are shown inFig 3. One can see that both V-LDPE and R-LDPEhave typical curves for semicrystalline polyolefins
Table 3. Thermal behavior of V-LDPE and R-LDPE
Samplestudied
Charresidue (%)
Interval of weight loss(Tonset/Tend) (K)
Tmax
rate (K)Weightloss (%)
V-LDPE 3.5463/498 478 −2503/573 553 2673/773 743 70753/833 803 91
R-LDPE 5463/498 483 −2498/568 533 2548/693 633 10683/773 748 75773/833 813 95
with a ‘solid–liquid’ phase transition at 310–391 Kand 322–389 K, respectively. These values and the
5 10 15 20 25 30 35 40
0
30
60
90
I (10
00 p
ulse
s)I (
1000
pul
ses)
2Q (°)
2Q (°)
5 10 15 20 25 30 30 40
3
6
9
(b)
(a)
oooo
R -L D P E V -L D P E21.1°
19.5°23.4°
20.3°24.3°
36.4°
36.6°31.9°
Figure 2. WAXS curves for: (a) V-LDPE (open circle) and R-LDPE(solid circle); (b) BR cured.
200 250 300 350 400 4500.5
1.0
1.5
2.0
2.5
3.0
203
249
319
383
Cp
(J g
−1 K
−1)
Temperature (K)
(a)
275 300 325 350 375 400 425
5.0
5.5
6.0
6.5
389
Temperature (K)
350
310
338
322
391
373
Cp
(J g
−1 K
−1)
(b)
Figure 3. Temperature dependence of specific heat capacity Cp of: (a) cured BR; (b) V-LDPE (open circle) and R-LDPE (solid circle).
1696 Polym Int 53:1693–1703 (2004)
Thermoplastic elastomers from rubber and recycled polyethylene
melting peak temperature, Tm = 389 K, for R-LDPEare quite similar to the values reported for otherpost-consumer LDPEs.24 In contrast to V-LDPE,the melting of the crystalline phase of R-LDPEconsists of melting low molecular weight crystallites(probably with defects) at 322–338 K followed bymelting high molecular weight crystallites at 389 K;25
we note that R-LDPE contains some linear LDPE andethylene-vinylacetate copolymer (EVA). We assumethe shoulder at 338–350 K without any visible changesin the values of Cp reflects recrystallization of the lowmolecular weight crystallites of R-LDPE into highmolecular weight ones. The common decrease ofvalues of Cp between 322 and 373 K observed forR-LDPE in comparison with V-LDPE is evidenceof increasing packing density of the former due toformation of branched or crosslinked polymer chainsalready mentioned. It can be seen that V-LDPE hasa higher degree of crystallinity X than R-LDPE,supporting the WAXS results.
Tensile properties and residual gel content valuesfor V-LDPE and R-LDPE samples are presented inTable 4. Increasing residual gel content value andsome reduction in tensile properties observed for R-LDPE confirm the above conclusions.
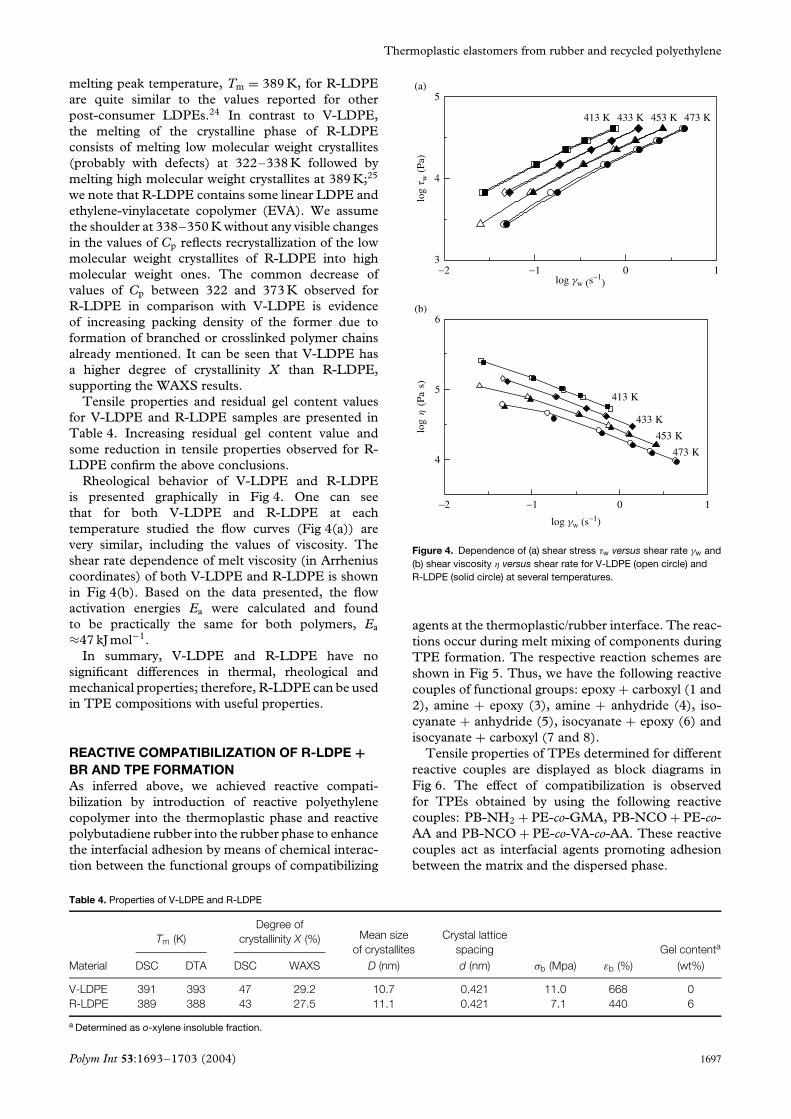
Rheological behavior of V-LDPE and R-LDPEis presented graphically in Fig 4. One can seethat for both V-LDPE and R-LDPE at eachtemperature studied the flow curves (Fig 4(a)) arevery similar, including the values of viscosity. Theshear rate dependence of melt viscosity (in Arrheniuscoordinates) of both V-LDPE and R-LDPE is shownin Fig 4(b). Based on the data presented, the flowactivation energies Ea were calculated and foundto be practically the same for both polymers, Ea
≈47 kJ mol−1.In summary, V-LDPE and R-LDPE have no
significant differences in thermal, rheological andmechanical properties; therefore, R-LDPE can be usedin TPE compositions with useful properties.
REACTIVE COMPATIBILIZATION OF R-LDPE +BR AND TPE FORMATIONAs inferred above, we achieved reactive compati-bilization by introduction of reactive polyethylenecopolymer into the thermoplastic phase and reactivepolybutadiene rubber into the rubber phase to enhancethe interfacial adhesion by means of chemical interac-tion between the functional groups of compatibilizing
log
t w (
Pa)
−2 −1 0 13
4
5
473 K453 K433 K413 K
log gw (s−1
)
log gw (s−1)
−2 −1 0 1
4
5
6
473 K
453 K
433 K
413 K
log
h (
Pa s
)
(a)
(b)
Figure 4. Dependence of (a) shear stress τw versus shear rate γw and(b) shear viscosity η versus shear rate for V-LDPE (open circle) andR-LDPE (solid circle) at several temperatures.
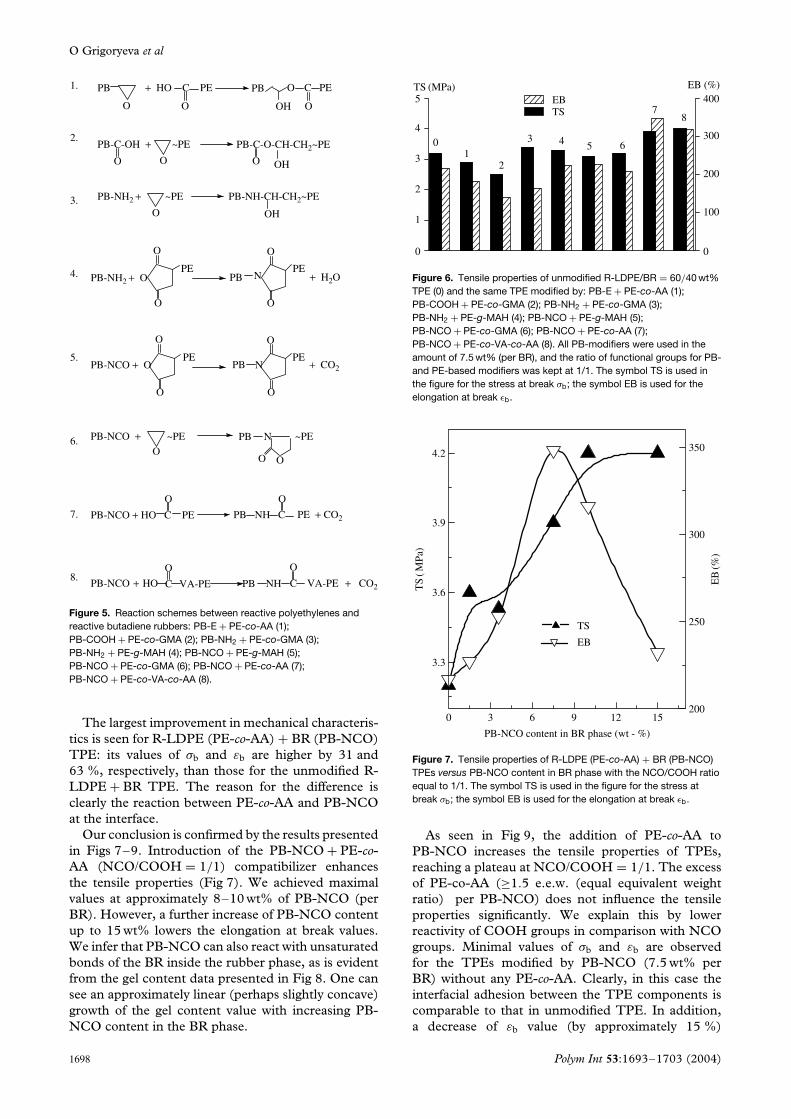
agents at the thermoplastic/rubber interface. The reac-tions occur during melt mixing of components duringTPE formation. The respective reaction schemes areshown in Fig 5. Thus, we have the following reactivecouples of functional groups: epoxy + carboxyl (1 and2), amine + epoxy (3), amine + anhydride (4), iso-cyanate + anhydride (5), isocyanate + epoxy (6) andisocyanate + carboxyl (7 and 8).
Tensile properties of TPEs determined for differentreactive couples are displayed as block diagrams inFig 6. The effect of compatibilization is observedfor TPEs obtained by using the following reactivecouples: PB-NH2 + PE-co-GMA, PB-NCO + PE-co-AA and PB-NCO + PE-co-VA-co-AA. These reactivecouples act as interfacial agents promoting adhesionbetween the matrix and the dispersed phase.
Table 4. Properties of V-LDPE and R-LDPE
Tm (K)Degree of
crystallinity X (%) Mean sizeof crystallites
Crystal latticespacing Gel contenta
Material DSC DTA DSC WAXS D (nm) d (nm) σb (Mpa) εb (%) (wt%)
V-LDPE 391 393 47 29.2 10.7 0.421 11.0 668 0R-LDPE 389 388 43 27.5 11.1 0.421 7.1 440 6
a Determined as o-xylene insoluble fraction.
Polym Int 53:1693–1703 (2004) 1697
O Grigoryeva et al
OHO
PB-C-O-CH-CH2~PE
O
PB-C-OH +
O
~PE
O
PB
O OH
O C PEPB
O
+ HO C PE
OHO
PB-NH2 + ~PE PB-NH-CH-CH2~PE
PE
O
O
+ CO2PB-NCO + O
O
PEPB N
O
PE
O
O
+ H2OPB-NH2 + O
O
O
PEPB N
PB N
O O
~PE
O
PB-NCO + ~PE
PB-NCO + HO C PE
O
PB NH C
O
PB-NCO + HO C VA-PE
O
PB NH C VA-PE + CO2
O
1.
2.
3.
4.
5.
6.
7.
8.
PE + CO2
Figure 5. Reaction schemes between reactive polyethylenes andreactive butadiene rubbers: PB-E + PE-co-AA (1);PB-COOH + PE-co-GMA (2); PB-NH2 + PE-co-GMA (3);PB-NH2 + PE-g-MAH (4); PB-NCO + PE-g-MAH (5);PB-NCO + PE-co-GMA (6); PB-NCO + PE-co-AA (7);PB-NCO + PE-co-VA-co-AA (8).
The largest improvement in mechanical characteris-tics is seen for R-LDPE (PE-co-AA) + BR (PB-NCO)TPE: its values of σb and εb are higher by 31 and63 %, respectively, than those for the unmodified R-LDPE + BR TPE. The reason for the difference isclearly the reaction between PE-co-AA and PB-NCOat the interface.
Our conclusion is confirmed by the results presentedin Figs 7–9. Introduction of the PB-NCO + PE-co-AA (NCO/COOH = 1/1) compatibilizer enhancesthe tensile properties (Fig 7). We achieved maximalvalues at approximately 8–10 wt% of PB-NCO (perBR). However, a further increase of PB-NCO contentup to 15 wt% lowers the elongation at break values.We infer that PB-NCO can also react with unsaturatedbonds of the BR inside the rubber phase, as is evidentfrom the gel content data presented in Fig 8. One cansee an approximately linear (perhaps slightly concave)growth of the gel content value with increasing PB-NCO content in the BR phase.
0
1
2
3
4
5TS
EB (%)
0
87
6543
21
0
100
200
300
400TS (MPa)
EB
Figure 6. Tensile properties of unmodified R-LDPE/BR = 60/40 wt%TPE (0) and the same TPE modified by: PB-E + PE-co-AA (1);PB-COOH + PE-co-GMA (2); PB-NH2 + PE-co-GMA (3);PB-NH2 + PE-g-MAH (4); PB-NCO + PE-g-MAH (5);PB-NCO + PE-co-GMA (6); PB-NCO + PE-co-AA (7);PB-NCO + PE-co-VA-co-AA (8). All PB-modifiers were used in theamount of 7.5 wt% (per BR), and the ratio of functional groups for PB-and PE-based modifiers was kept at 1/1. The symbol TS is used inthe figure for the stress at break σb; the symbol EB is used for theelongation at break εb.
0 3 6 9 12 15
3.3
3.6
3.9
4.2
TS
TS
( MPa
)
EB
(%)
200
250
300
350
EB
PB-NCO content in BR phase (wt - %)
Figure 7. Tensile properties of R-LDPE (PE-co-AA) + BR (PB-NCO)TPEs versus PB-NCO content in BR phase with the NCO/COOH ratioequal to 1/1. The symbol TS is used in the figure for the stress atbreak σb; the symbol EB is used for the elongation at break εb.
As seen in Fig 9, the addition of PE-co-AA toPB-NCO increases the tensile properties of TPEs,reaching a plateau at NCO/COOH = 1/1. The excessof PE-co-AA (≥1.5 e.e.w. (equal equivalent weightratio) per PB-NCO) does not influence the tensileproperties significantly. We explain this by lowerreactivity of COOH groups in comparison with NCOgroups. Minimal values of σb and εb are observedfor the TPEs modified by PB-NCO (7.5 wt% perBR) without any PE-co-AA. Clearly, in this case theinterfacial adhesion between the TPE components iscomparable to that in unmodified TPE. In addition,a decrease of εb value (by approximately 15 %)
1698 Polym Int 53:1693–1703 (2004)

Thermoplastic elastomers from rubber and recycled polyethylene
00 3 6 9 12 15
10
20
30
40
50G
el c
onte
nt (
%)
PB- NCO content in BR phase (wt %)
Figure 8. Gel content of TPEs versus PB-NCO content in the BRphase. R-LDPE/BR = 60/40 wt% for all TPEs and the ratio offunctional groups for PB- and PE-based modifiers = 1/1.
0.0 0.5 1.0 1.5 2.01
2
3
4
5
TS
TS
(MPa
)
0
100
200
300
400
EB
EB
(%
)
PE-co-AA content in R-LDPE(PE-co-AA)/BR(PB-NCO) TPES (per PB-NCO, e.e.w.)
Figure 9. Tensile properties of R-LDPE (PE-co-AA) + BR (PB-NCO)TPEs versus PE-co-AA e.e.w. per PB-NCO (at 7.5 wt% PB-NCOcontent per BR). The symbol TS is used in the figure for the stress atbreak σb; the symbol EB is used for the elongation at break εb.
for this sample in comparison with unmodified R-LDPE + BR TPE shows that PB-NCO indeed reactswith unsaturated bonds of BR inside the rubber phase.
The absence of a compatibilizing effect for theother reactive couples used is probably related tokinetic/diffusion peculiarities. Apparently, for these
5 10 15 20 25 30 35 400
20
40
21.6°
19.5°23.9°
4
3
2
1I (1
000
puls
es)
2Q (°)
Figure 10. Experimental WAXS curves for unmodified R-LDPE + BRTPE (1) and R-LDPE (PE-co-AA)/BR (PB-NCO) with PB-NCO in theBR phase = 1.5 wt% (2), 7.5 wt% (3) and 10 wt% (4).PB-NCO/PE-co-AA ratio = 1/1. Beginning from the second curvefrom the bottom, each next curve was shifted upwards by 5 units.
couples the reactions of the functional groups at theinterphase are not effective; the reagents might nothave had enough time to react to a sufficient extent.
R-LDPE (PE-co-AA) + BR (PB-NCO) TPE wasselected for more detailed investigation of the influenceof reactive couple content on changes in phasestructure, glass transition behavior and degree ofcrystallinity of polyolefin matrix, as well as on thermaland mechanical properties of TPEs.
STRUCTURE–PROPERTY RELATIONSHIPS INR-LDPE (PE-co-AA) + BR (PB-NCO) TPES
WAXS diffractograms of unmodified and of allmodified TPEs (Fig 10) show two sharp peaks locatedat the scattering angles of 21.6 ◦ and 23.9 ◦ (scatteringof crystalline phase of polyethylene) as well as adiffuse maximum located at 19.5 ◦ (scattering of theamorphous phase of polyethylene).22,26 As mentionedabove, three sharp peaks in the region 31–36 ◦ can beattributed to low molecular weight additives used forTPE curing.
The WAXS results show that, in comparison toR-LDPE, the introduction of BR into the R-LDPEmatrix leads to changes in the angular positions of theWAXS diffraction peaks of the R-LDPE component.The peaks with angular positions 2 = 21.1 ◦ and2 = 23.4 ◦ move to 2 = 21.6 ◦ and 2 = 23.9 ◦,respectively. The positions of the diffraction peaksdo not change by introduction and further increaseof content of reactive couples in modified TPEs.The respective calculations show that the mean sizeof microcrystals 〈D〉 ≈ 11.4–11.5 nm and the crystallattice spacing 〈d〉 = 0.411 nm. One can see a certain
Polym Int 53:1693–1703 (2004) 1699

O Grigoryeva et al
increase of the mean size of R-LDPE microcrystalsand a decrease of crystal lattice spacing in comparisonto R-LDPE.
As mentioned above, the angular positions ofdiffraction peaks are constant for all TPEs studied,but some changes of intensity of the peaks do occur.This fact is reflected in the change of degree ofcrystallinity 〈X〉, and the data are summarized inTable 5. The value of 〈X〉 represents the overallcrystallinity of blend material and can be comparedwith the theoretical (additive) value, 〈X〉add, calculatedby assuming for R-LDPE its original value of〈X〉 = 27.5 % and the additivity of components’contribution. The experimental 〈X〉 is higher than〈X〉add, and this implies that the rubber componentchanges the polyethylene crystallization conditions andthat its introduction in crystallizable R-LDPE matrixpromotes the phase separation between the crystalline(polyethylene) and amorphous (polyethylene/rubber)phases. It can be seen that the unmodified TPEhas the highest value of 〈X〉. The introduction ofreactive couples in TPEs causes destruction of somecrystallites. This is reflected in a decrease of onset ofmelting temperature of crystallites and a depression ofthe melting temperature Tm –as will be shown belowby DSC data. The downward trend of 〈X〉 can beattributed to reduced phase separation of componentsin modified TPEs.
The experimental crystallinity values differ fromtheoretical (additive) ones as a result of interactionsbetween the phases, so that each component affectsthe microphase structure of the other. This alsoindicates partial reactively induced compatibilizationof BR and R-LDPE. However, the distinctions are notvery significant, indicating the existence of regionsconsisting of individual components in all TPEs.The TPEs modified by PB-NCO + PE-co-AA arecharacterized by higher compatibility of componentsin comparison to the unmodified TPE and theoptimal content of the PB-NCO + PE-co-AA modifiercorresponds to 7.5 % PB-NCO per BR. These resultswere confirmed by DSC and DMA data below.
Table 5 shows the experimental values of crys-tallinity degree calculated from DSC data. The sametendencies are seen as in the WAXS data. Some dif-ferences in absolute values occur; the two techniquesare known not to give identical results.21
Figure 11 shows the Cp (T) plots. Lowering of themelting temperature Tm is observed for all TPEs,and the data are summarized in Table 6. The meltingpeak corresponds to crystallizable long polyethylenesequences with few chain defects (branching, graftings,etc).26 Thus, the depression of the melting peakoccurs due to increasing defective crystallites content,here mainly because of grafting amide bridges at thethermoplastic/rubber interface. The largest depressionof the melting peak is observed for TPE with thecontent of reactive couple = 7.5 wt%.
The DMA data provide information about relax-ation processes.21 The temperature dependencies ofthe storage modulus E′, the loss modulus E′′ and thetan δ are shown in Fig 12. There are significant dif-ferences in relaxation behaviour of R-LDPE, BR andTPEs, as well as between modified and unmodifiedTPEs with the same R-LDPE/BR ratio.
200 250 300 350 4001.6
2.0
2.4
2.8
3.2
Temperature K
Cp
(J g
−1K
−1)
388 K
Figure 11. Temperature dependence of the specific heat capacity Cp
of TPEs based on: R-LDPE + BR (�);R-LDPE (PE-co-AA) + BR(PB-NCO) TPEs with 1.5 wt% (�), 7.5 wt% (°) and 10 wt% (�) ofPB-NCO in the BR phase. PB-NCO/PE-co-AA ratio = 1/1.
Table 5. The crystalline structure parameters of the TPEs produced
Mean size of Crystal latticeWAXS
DSCComposition crystallites D (nm) spacing d (nm) X (%) Xadd
a (%) X (%)
R-LDPE + BR = 60/40 (unmodified)b 11.4 0.411 19.3 16.5 28R-LDPE (PE-co-AA) + BR (PB-NCO):c
PB-NCO = 1.5 wt% 11.4 0.411 18.5 16.4 26PB-NCO = 7.5 wt% 11.5 0.411 18.0 16.3 17PB-NCO = 10.0 wt% 11.5 0.411 18.7 16.2 19
a 〈X〉add is the theoretical (additive) degree of crystallinity: 〈X〉add = X(R−LDPE)• wi, where wi is the polyethylene fraction in TPEs.
b R-LDPE/BR = 60/40 (wt%) (ratio kept the same for all samples studied).c NCO/COOH ratio = 1/1.
1700 Polym Int 53:1693–1703 (2004)
Thermoplastic elastomers from rubber and recycled polyethylene
Table 6. Phase transition temperatures for R-LDPE, BR and TPEs
DSC DMA
Tm (for Onset ofα-relaxation peak temperaturea (K)
Composition R-LDPE) (K) Tm (K) BR-rich phase (Tg) R-LDPE-rich phase (Tg1)
R-LDPE 389 322 — 353BR — — 253 —R-LDPE/BR = 60/40 (unmodified)b 388 246 258 333R-LDPE (PE-co-AA) + BR (PB-NCO):c
PB-NCO = 1.5 wt% 387 243 266 332PB-NCO = 7.5 wt% 385 220 262 328PB-NCO = 10.0 wt% 387 250 265 337
a The value taken from the E′′ peak.b R-LDPE/BR = 60/40 ratio for all samples.c NCO/COOH ratio = 1/1.
200 250 300 350 400 450
1
10
100
BR
R-LDPE
E′′
(MPa
)
200 250 300 350 400 4500
9
18
BR
R-LDPE
0
2
4
6
8
200 250 300 350 400 4500.0
0.1
0.2
Temperature (K)Temperature (K)
R-LDPE
BR
tan
d
Temperature (K)
E ′
(MPa
)
b a
a
(a) (b) (c)
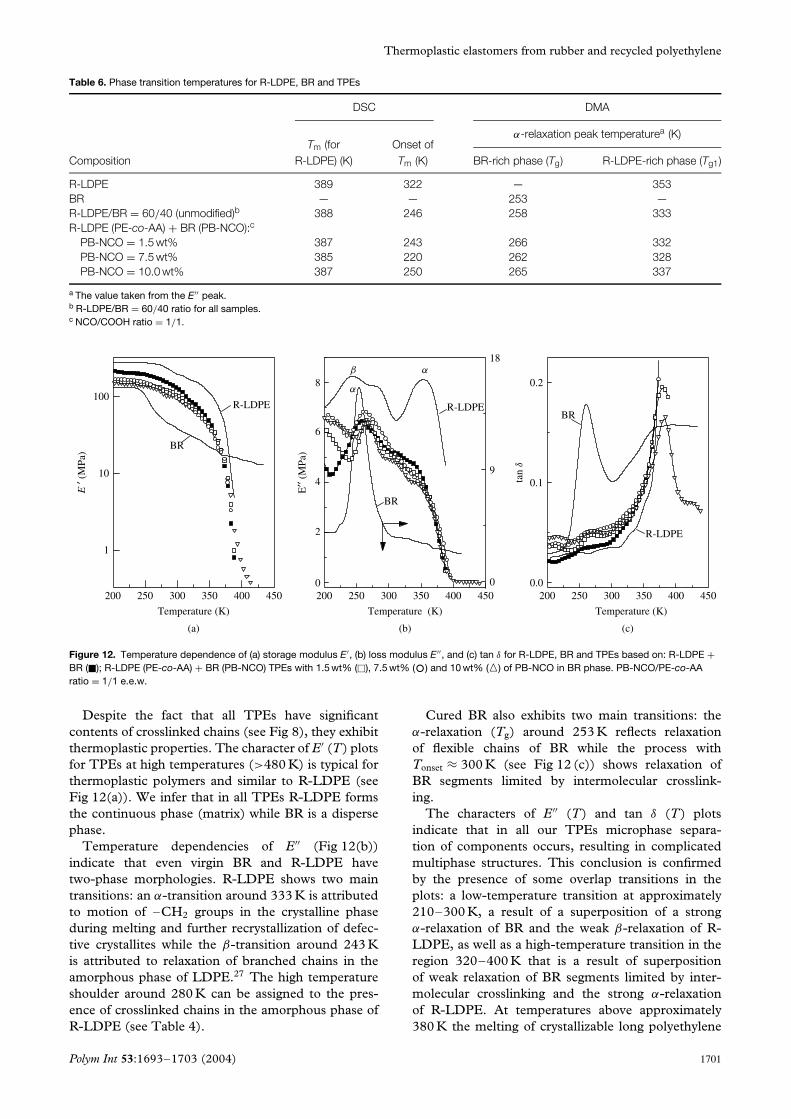
Figure 12. Temperature dependence of (a) storage modulus E′, (b) loss modulus E′′, and (c) tan δ for R-LDPE, BR and TPEs based on: R-LDPE +BR (�); R-LDPE (PE-co-AA) + BR (PB-NCO) TPEs with 1.5 wt% (�), 7.5 wt% (°) and 10 wt% (�) of PB-NCO in BR phase. PB-NCO/PE-co-AAratio = 1/1 e.e.w.
Despite the fact that all TPEs have significantcontents of crosslinked chains (see Fig 8), they exhibitthermoplastic properties. The character of E′ (T) plotsfor TPEs at high temperatures (>480 K) is typical forthermoplastic polymers and similar to R-LDPE (seeFig 12(a)). We infer that in all TPEs R-LDPE formsthe continuous phase (matrix) while BR is a dispersephase.
Temperature dependencies of E′′ (Fig 12(b))indicate that even virgin BR and R-LDPE havetwo-phase morphologies. R-LDPE shows two maintransitions: an α-transition around 333 K is attributedto motion of –CH2 groups in the crystalline phaseduring melting and further recrystallization of defec-tive crystallites while the β-transition around 243 Kis attributed to relaxation of branched chains in theamorphous phase of LDPE.27 The high temperatureshoulder around 280 K can be assigned to the pres-ence of crosslinked chains in the amorphous phase ofR-LDPE (see Table 4).
Cured BR also exhibits two main transitions: theα-relaxation (Tg) around 253 K reflects relaxationof flexible chains of BR while the process withTonset ≈ 300 K (see Fig 12 (c)) shows relaxation ofBR segments limited by intermolecular crosslink-ing.
The characters of E′′ (T) and tan δ (T) plotsindicate that in all our TPEs microphase separa-tion of components occurs, resulting in complicatedmultiphase structures. This conclusion is confirmedby the presence of some overlap transitions in theplots: a low-temperature transition at approximately210–300 K, a result of a superposition of a strongα-relaxation of BR and the weak β-relaxation of R-LDPE, as well as a high-temperature transition in theregion 320–400 K that is a result of superpositionof weak relaxation of BR segments limited by inter-molecular crosslinking and the strong α-relaxationof R-LDPE. At temperatures above approximately380 K the melting of crystallizable long polyethylene
Polym Int 53:1693–1703 (2004) 1701

O Grigoryeva et al
sequences with a low number of chain defectsbegins.
The temperature positions of α-relaxation peakstaken from corresponding peaks of the E′′ (T) plot (seeFig 12(b)) of the BR-rich and R-LDPE-rich phasesare listed in Table 6. Clearly α-relaxation peaks ofBR and R-LDPE are shifted towards one anotherin modified TPEs. This can be explained by theinteraction between BR and R-LDPE phases dueto the formation of the interface layer mainly basedon PB-NCO + PE-co-AA grafting from rubber andpolyethylene phases, respectively.
The relaxation processes in amorphous phases arehampered by the presence of R-LDPE crystallites.3
However, Fig 12 (c)) indicates some increase ofintensity of relaxation transitions at 230–295 K formodified TPEs in comparison to unmodified TPE orpure R-LDPE. This implies higher chain mobility inamorphous phases at the expense of the crystallinephase of R-LDPE. These results are supported byboth WAXS and DSC data.
Thus, DMA results show that the TPEs aremultiphase systems with at least one crystalline andtwo amorphous phases of individual componentsand regions of mixed compositions. We presumethat the R-LDPE crystalline phase consists ofmicroregions formed by ‘perfect’ crystallites and by‘defective’ crystallites, while the R-LDPE amorphousphase consists of microregions formed by crosslinkedchains and by branched chains. The BR amorphousphase consists of microregions formed by crosslinkedsegments and also one formed by flexible linear BRchains. The mixed microphase consists of both thecomponents grafted by reactive compatibilizers. Thus,the final properties of TPEs are determined by theheterogeneity of the individual components, as well asby the heterogeneity caused by the thermodynamicimmiscibility of the components. The degree ofcompatibilization is affected to a large extent bythe grafting reaction of PB-NCO + PE-co-AA reactivecompatibilizer and by the formation of the extensiveinterfacial layer that leads to improved interfacialadhesion between rubber and polyethylene phases.
CONCLUSIONSNeedless to say, a broader perspective of the presentpaper is protection of the environment from the fastgrowth of waste originating from synthetic polymericmaterials. Several options exist here. One is thecombination of synthetic polymers with natural ones,such as the work of Albano and her coworkers onmixing high density PE (HDPE) and polypropylenewith wood flour and sisal fibers.28,29 Somewhatrelated is regeneration of cellulose in controlled mediaresulting in environmentally friendly cellulose fibers.30
A different approach is the use of synthetic polymerswhich can be degraded by natural means, such as thework of Lopez and her colleagues on biodegradationof copolymers of PE and vinyl alcohol by a fungus.31
A further different route is the one we have followed:recycling combined with compatibilization. There is avariety of compatibilizers, such as an olefinic ionomerapplied to an HDPE + polyurethane system.32 Weachieved compatibilization by relatively simple means.While our resulting phase structures are complicated,the objective of protection of the environment isachieved along with an improvement of mechanicalproperties.
ACKNOWLEDGEMENTSThe authors are grateful to the Robert A WelchFoundation, Houston (Grant B-1203), the EuropeanUnion, Brussels (INCO-Copernicus project–ContractNo: ICA2-CT-2001-10003) and to the US Depart-ment of Commerce, Washington, DC (SABIT Pro-gram) for partial financial support of this work. Con-structive comments of the referees on the manuscriptof this paper are appreciated.
REFERENCES1 Adhikari B, De D and Maiti S, Prog Polym Sci 25:909 (2000).2 George J, Varughese KT and Thomas S, Polymer 41:1507
(2000).3 Nevatia P, Banerjee TS, Dutta B, Jha A, Naskar AK and
Bhowmick AK, J Appl Polym Sci 83:2035 (2002).4 Karger-Kocsis J, in Polymer Blends and Alloys, ed by
Shonaike GO and Simon GP, Marcel Dekker, New York,pp 125–153 (1999).
5 Michael H, Scholz H and Menning G, Kautschuk und Gummi,5:510 (1999).
6 Bhattacharya SN and Sbarski I, Plast Rubber Compos Process Appl27:317 (1998).
7 Yang Y, Chiba T, Saito H and Inoue T, Polymer 39:3365(1998).
8 Spontak RJ and Patel NP, Curr Opin Colloid Interface Sci 5:334(2000).
9 Kim Y, Cho W-J and Ha C-S, Polym Eng Sci 35:1592 (1995).10 Fainleib A, Grigoryeva O, Starostenko O and Brostow W, Proc
Halle Internat Conf Polym Mater 159 (2002).11 Grigoryeva O, Chem Listy Symp 237 (2002).12 Fainleib A, Grigoryeva O, Starostenko O, Brovko A and Vilen-
sky V, Proc IUPAC World Polymer Congress MACRO2002–Beijing, 1000 (2002).
13 Radusch H-J, Corley B and Hai LH, Proc 14th Bratislava InternatConf Modified Polymers, 27 (2000).
14 Corley B and Radusch H-J, J Macromol Sci, Phys B37:265(1998).
15 Orr, CA, Cernohous JJ, Guegan P, Hirao A, Jeon HK andMacosko CW, Polymer 42:8171 (2001).
16 Bray T, Damiris S, Grace A, Moad G, O’Shea M, Rizzardo Eand Diepen GV, Macromol Symp 129:109 (1998).
17 Fainleib A, Grigoryeva O, Starostenko O, Danilenko I andBardash L, Macromol Symp 202:117 (2003).
18 Fainleib A, Grigoryeva O and Starostenko O, Proc IUPAC WorldPolymer Congress MACRO 2002–Beijing, 998 (2002).
19 Campbell D and White JR, Polymer Characterization, Chapman& Hall, London (1989).
20 Matthews JL, Peiser HS and Richards RB, Acta Crystallogr 2:85(1949).
21 Menard KP, Dynamic Mechanical Analysis—An Introduction,CRC Press, Boca Raton, FL (1999); Menard KP, Ch 8 inPerformance of Plastics, ed by Brostow W, Hanser, Munich-Cincinnati (2000).
22 Krimm S and Tobolsky A, J Polym Sci 7:57 (1951).
1702 Polym Int 53:1693–1703 (2004)

Thermoplastic elastomers from rubber and recycled polyethylene
23 Hermans PH and Weidinger A, Makromol Chem 44–46:24(1961).
24 Radonjic G and Gubeljak N, Macromol Mater Eng 287:122(2002).
25 Mark JE editor, Physical Properties of Polymers Handbook,American Institute of Physics Press, Woodbury, NY (1996).
26 Greco R, Musto P, Riva F and Maglio G, J Appl Poly Sci 37:789(1989).
27 Akovali G and Torun TT, Polym Int 42:307 (1997).28 Albano C, Ichazo M, Gonzalez J, Delgado M and Poleo R,
Mater Res Innovat 4:284 (2001).
29 Reyes J, Albano C, Davidson E, Poleo R, Gonzalez J, Ichazo Mand Chipara M, Mater Res Innovat 4:294 (2001).
30 Kreze T, Strnad S, Stana-Kleinschek K and Ribitsch V, MaterRes Innovat 4:107 (2001).
31 Mejia G, Lopez BL and Sierra L, Mater Res Innovat 4:148(2001).
32 Papadopoulou CP and Kalfoglou NK, Polymer 40:905 (1999).
Polym Int 53:1693–1703 (2004) 1703