Synthesis and characterization of novel citric acid-based polyester elastomers
11
This article appeared in a journal published by Elsevier. The attached copy is furnished to the author for internal non-commercial research and education use, including for instruction at the authors institution and sharing with colleagues. Other uses, including reproduction and distribution, or selling or licensing copies, or posting to personal, institutional or third party websites are prohibited. In most cases authors are permitted to post their version of the article (e.g. in Word or Tex form) to their personal website or institutional repository. Authors requiring further information regarding Elsevier’s archiving and manuscript policies are encouraged to visit: http://www.elsevier.com/copyright
Transcript of Synthesis and characterization of novel citric acid-based polyester elastomers

This article appeared in a journal published by Elsevier. The attachedcopy is furnished to the author for internal non-commercial researchand education use, including for instruction at the authors institution
and sharing with colleagues.
Other uses, including reproduction and distribution, or selling orlicensing copies, or posting to personal, institutional or third party
websites are prohibited.
In most cases authors are permitted to post their version of thearticle (e.g. in Word or Tex form) to their personal website orinstitutional repository. Authors requiring further information
regarding Elsevier’s archiving and manuscript policies areencouraged to visit:
http://www.elsevier.com/copyright
Author's personal copy
Synthesis and characterization of novel citric acid-basedpolyester elastomers
Ivan Djordjevic, Namita Roy Choudhury*, Naba K. Dutta, Sunil KumarIan Wark Research Institute, University of South Australia, Mawson Lakes Campus, Mawson Lakes, SA 5095, Australia
a r t i c l e i n f o
Article history:Received 2 October 2008Received in revised form19 January 2009Accepted 20 January 2009Available online 24 January 2009
Keywords:p(OCS) elastomersPolyesterificationCitric acid
a b s t r a c t
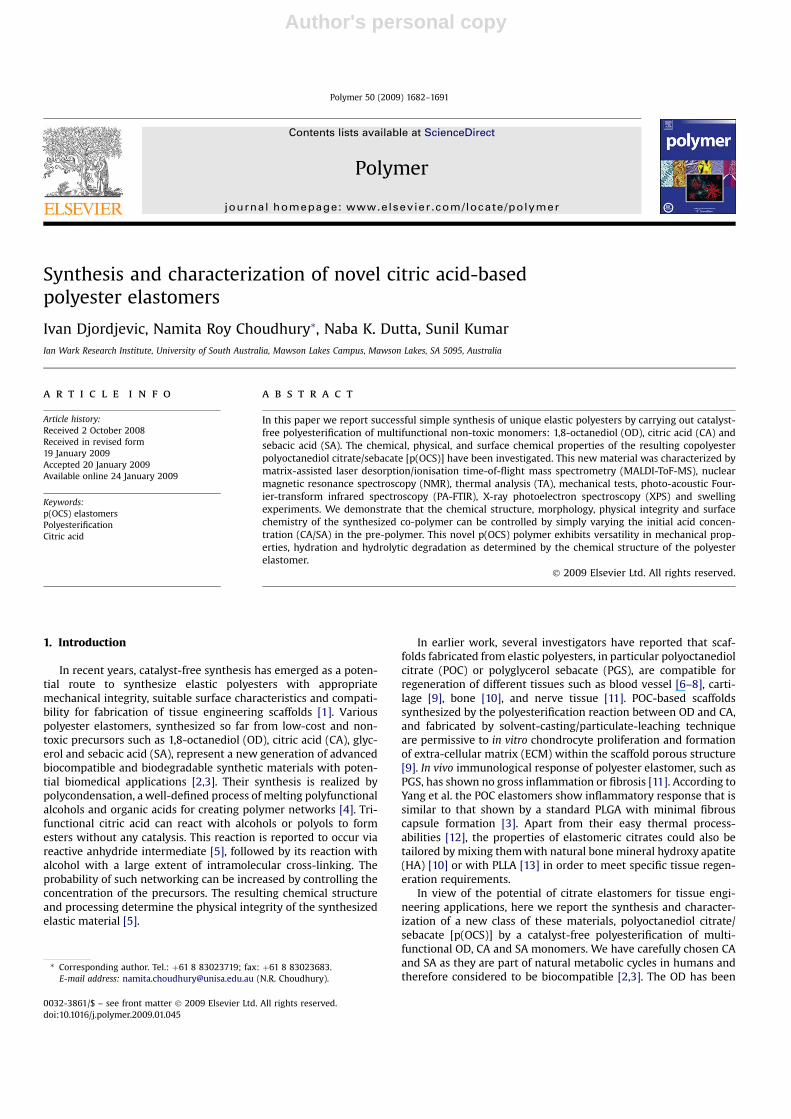
In this paper we report successful simple synthesis of unique elastic polyesters by carrying out catalyst-free polyesterification of multifunctional non-toxic monomers: 1,8-octanediol (OD), citric acid (CA) andsebacic acid (SA). The chemical, physical, and surface chemical properties of the resulting copolyesterpolyoctanediol citrate/sebacate [p(OCS)] have been investigated. This new material was characterized bymatrix-assisted laser desorption/ionisation time-of-flight mass spectrometry (MALDI-ToF-MS), nuclearmagnetic resonance spectroscopy (NMR), thermal analysis (TA), mechanical tests, photo-acoustic Four-ier-transform infrared spectroscopy (PA-FTIR), X-ray photoelectron spectroscopy (XPS) and swellingexperiments. We demonstrate that the chemical structure, morphology, physical integrity and surfacechemistry of the synthesized co-polymer can be controlled by simply varying the initial acid concen-tration (CA/SA) in the pre-polymer. This novel p(OCS) polymer exhibits versatility in mechanical prop-erties, hydration and hydrolytic degradation as determined by the chemical structure of the polyesterelastomer.
� 2009 Elsevier Ltd. All rights reserved.
1. Introduction
In recent years, catalyst-free synthesis has emerged as a poten-tial route to synthesize elastic polyesters with appropriatemechanical integrity, suitable surface characteristics and compati-bility for fabrication of tissue engineering scaffolds [1]. Variouspolyester elastomers, synthesized so far from low-cost and non-toxic precursors such as 1,8-octanediol (OD), citric acid (CA), glyc-erol and sebacic acid (SA), represent a new generation of advancedbiocompatible and biodegradable synthetic materials with poten-tial biomedical applications [2,3]. Their synthesis is realized bypolycondensation, a well-defined process of melting polyfunctionalalcohols and organic acids for creating polymer networks [4]. Tri-functional citric acid can react with alcohols or polyols to formesters without any catalysis. This reaction is reported to occur viareactive anhydride intermediate [5], followed by its reaction withalcohol with a large extent of intramolecular cross-linking. Theprobability of such networking can be increased by controlling theconcentration of the precursors. The resulting chemical structureand processing determine the physical integrity of the synthesizedelastic material [5].
In earlier work, several investigators have reported that scaf-folds fabricated from elastic polyesters, in particular polyoctanediolcitrate (POC) or polyglycerol sebacate (PGS), are compatible forregeneration of different tissues such as blood vessel [6–8], carti-lage [9], bone [10], and nerve tissue [11]. POC-based scaffoldssynthesized by the polyesterification reaction between OD and CA,and fabricated by solvent-casting/particulate-leaching techniqueare permissive to in vitro chondrocyte proliferation and formationof extra-cellular matrix (ECM) within the scaffold porous structure[9]. In vivo immunological response of polyester elastomer, such asPGS, has shown no gross inflammation or fibrosis [11]. According toYang et al. the POC elastomers show inflammatory response that issimilar to that shown by a standard PLGA with minimal fibrouscapsule formation [3]. Apart from their easy thermal process-abilities [12], the properties of elastomeric citrates could also betailored by mixing them with natural bone mineral hydroxy apatite(HA) [10] or with PLLA [13] in order to meet specific tissue regen-eration requirements.
In view of the potential of citrate elastomers for tissue engi-neering applications, here we report the synthesis and character-ization of a new class of these materials, polyoctanediol citrate/sebacate [p(OCS)] by a catalyst-free polyesterification of multi-functional OD, CA and SA monomers. We have carefully chosen CAand SA as they are part of natural metabolic cycles in humans andtherefore considered to be biocompatible [2,3]. The OD has been
* Corresponding author. Tel.: þ61 8 83023719; fax: þ61 8 83023683.E-mail address: [email protected] (N.R. Choudhury).
Contents lists available at ScienceDirect
Polymer
journal homepage: www.elsevier .com/locate/polymer
0032-3861/$ – see front matter � 2009 Elsevier Ltd. All rights reserved.doi:10.1016/j.polymer.2009.01.045
Polymer 50 (2009) 1682–1691

Author's personal copy
chosen as the difunctional monomer because it is the largestaliphatic diol that is water soluble with no reported toxicity (afeature beneficial to the degradation process) [6,14]. The design andcontrol over the chemical composition of p(OCS) is based on thehypotheses: (i) the variation in the initial CA/SA monomerconcentration would yield copolyesters with varying number of CAsegments present in the final polymer chains; and (ii) the ratioOD:(SAþCA) when kept 1:1 would lead to a complete poly-esterification reaction, where all the OD monomer has reacted withboth the SA and CA monomers. The tuning of the final compositionhas the potential to provide a simple but elegant method to controlthe final properties of this material [2,15].
2. Experimental
2.1. Synthesis of p(OCS) elastomers and sample preparation
High purity citric acid (CA; molecular weight(Mw)¼ 192.13 g mol�1; melting temperature (Tm)¼ 153 �C), sebacicacid (SA; Mw¼ 202.24 g mol�1; Tm¼ 134 �C), 1,8-octanediol (OD;Mw¼ 146.23 g mol�1; Tm¼ 58–61 �C), dioxane, ethanol (EtOH),sodium iodide (NaI), 2,5-dihydroxybenzoic acid (DHB), deuterateddimethyl sulfoxide (DMSO-d6) and phosphate buffer pellets werepurchased from Sigma–Aldrich and used as received. Poly-octanediol citrate/sebacate p(OCS) polymers were synthesizedusing the following procedure.
Equimolar amounts of both the OD and acids [OD:(CAþ SA)¼1:1] were mixed together to form the pre-polymer mixtures thatwere then used for further polyesterification reaction. Threedifferent compositions of the monomers were undertaken toproduce pre-polymers as depicted in Table 1. The pre-mixed reac-tants (OD, CA and SA) were placed in a three-necked round-bottomflask and the monomer mixture was first heated up to 160–165 �Cfollowed by mixing at 140–145 �C for 1 h under a constant streamof nitrogen.
The pre-polymers thus obtained were dissolved in dioxane [20%(w/w) solution] and the resulting pre-polymer solutions of all thep(OCS) compositions (Table 1) were used for both scaffold and filmpreparation without further purification [16]. Scaffold wasprepared by particulate-leaching method. Yang et al. used similarapproach for the production of porous scaffolds of similar elasto-meric polyester material [3]. Films for structural analyses were castinto Teflon� petri dishes and left in an oven at 80 �C for 7 days forsolvent evaporation and further polyesterification of the pre-polymers. The final product, p(OCS) polyester, was prepared in theform of a thin sheet of w1 mm thickness (thin sheet chosen due tothe complexity of characterization of 3D scaffold by many tech-niques). This sheet was then compression-molded to obtain a sub-millimetre thickness film in a window mold maintained at 150 �Cand 15 MPa. While both the pre-polymers and the films weresubsequently analysed for their structural properties, no attemptwas made to investigate the effect of possible compression-inducedphysico-chemical changes. Synthesized and processed p(OCS)polyesters exhibit thermoplastic behaviour as confirmed by the
repeated moldability. All the films were produced under samereaction conditions and the samples were stored in a desiccator forsubsequent tests.
2.2. Nuclear magnetic resonance (NMR) spectroscopic analysis
The p(OCS) pre-polymers for NMR analysis were purified byprecipitation in water followed by constant mixing, filtering andfreeze-drying. The reaction yield was calculated by comparingmasses of both non-purified and purified pre-polymers and it wasfound to be w80% for all three compositions. The yield appears tobe low due to some material loss during filtering process. Smallportions of purified pre-polymer mixtures were sampled and dis-solved in DMSO-d6. The 1H NMR spectra were recorded usinga Bruker NMR spectrometer (350 MHz). The pre-polymers of threedifferent compositions (Table 1) were dissolved in DMSO-d6 andthe solutions were placed in NMR tubes with 5 mm outer diameter.The chemical shifts were measured relative to the solvent peak assecondary standard.
2.3. Matrix-assisted laser desorption/ionisation (MALDI)time-of-flight mass spectrometry (ToF-MS) analysis
Purified p(OCS) pre-polymers were prepared for MALDI-ToF-MSanalysis by dissolving 10 mg of p(OCS) pre-polymers in 1 ml ofEtOH. Matrix (DHB) was prepared by dissolving 20 mg in 10 ml ofEtOH and the ionising agent NaI (100 mg in 10 ml of EtOH) wasused. After optimisation and careful choice of appropriate samplepreparation technique, pre-polymers were deposited on MALDIplate by using the layer-by-layer method developed by Meier andSchubert [17]. In brief, the 1.5 ml of EtOH solution of matrix was firstdeposited and dried on the sample plate. A subsequent layer ofprepared NaI solution (1.5 ml) was added on the top of dried matrix.After second drying, the 1.5 ml of polymer solutions was added onthe top of the crystallised DHB–NaI mixture. Samples were driedagain and placed in MALDI-ToF-MS (Micromass M@LDI LR Instru-ment from Waters, UK) equipped with a pulsed (4 ns) nitrogenlaser emitting at 337 nm. The detector was operated in positive ionmode. The pulse voltage was set to 750 V. At least 20 spectra werecollected and combined.
2.4. Scanning electron microscopy (SEM) of citrate scaffold and film
The porous structure and surface morphology of p(OCS) scaf-folds and films was analysed using scanning electron microscopy(SEM). The instrument used for analysis was a CamScan SEM(Model CS44FE) equipped with a field emission gun, which wasoperated at an accelerating voltage of 15 kV. The samples weremounted on a stub with double-sided conductive tape and coatedwith carbon to avoid surface charging, which affects the secondaryelectron imaging. The images were recorded in secondary electronmode.
2.5. Thermal analyses of p(OCS) films: thermogravimetric analysis(TGA) and differential scanning calorimetry (DSC)
The thermal properties of p(OCS) elastomers were characterizedusing TA Instruments (Delaware, USA) TGA (model 2950) and DSC(model 2920). TGA thermograms were obtained under the flow ofnitrogen (70 ml min�1) at a scanning rate of 10 �C min�1 in therange of 25–500 �C. The onset of degradation temperature (TOD)was determined from the TGA curve at 5% weight loss.
Glass-transition temperature (Tg), crystallisation temperature(Tc) and melting temperature (Tm) of the p(OCS) films were evalu-ated using DSC at a heating/cooling rate of 10 �C min�1. The sample
Table 1Initial molar ratio of the monomers in polyesterification reaction and the p(OCS) pre-polymer mixture composition calculated from deconvolution of 1H NMR spectra.
Monomer ratio (OD:CA:SA) Nomenclature NMR peaks (%)
Hj1 Hj
2 Hk1 Hk
2
1:1:0 p(O1C1S0) 28.5 71.5 0 01:0.75:0.25 p(O1C0.75S0.25) 28.1 71.9 69.4 30.61:0.5:0.5 p(O1C0.5S0.5) 28.4 71.6 73.1 26.9
I. Djordjevic et al. / Polymer 50 (2009) 1682–1691 1683

Author's personal copy
film (w10 mg) placed on the aluminium pan was first heated from40 �C to 150 �C and then cooled from 150 �C to �80 �C, followed bya second heating cycle from �80 �C to 150 �C. All the data from thesecond heating cycle were used for the analysis of Tg, Tc and Tm. Thep(OCS) polymers were also analysed with DSC in their hydratedstate. Sample films were soaked in water until they reached equi-librium percentage swelling (as described in Section 2.9) prior tothe DSC experiment. Glass transition was evaluated on a small pieceof hydrated sample (carefully wiped with KimwipeTM to removesurface water) by heating in one cycle (�50 �C to 170 �C; heatingrate of 10 �C min�1). The reason for higher temperature in thisexperiment is for an observation of presence of any unreactedmonomers within polymer network after curing process.
2.6. Tensile tests
Physical properties of the p(OCS) films were measured usinga Hounsfield tensiometer (model: K10KS-0128) equipped with100 N load cell at room temperature. Briefly, the film samplesprepared according to the ASTM standard D 882-01(45� 5� 0.2 mm, length�width� thickness) were tested at a rateof 10 mm min�1. Young’s modulus was calculated from the linearpart of the initial slope. For each composition (Table 1), the test wasperformed 5 times. The result was averaged and a standard devi-ation is reported. The cross-linking density (n) was calculatedaccording to the rubber elasticity theory using the expression:n¼ E0/3RT¼ r/Mc; where n represents the number of activenetwork chain segments per unit volume (mol m�3), Mc representsthe molecular weight between cross-links (g mol�1), E0 representsYoung’s modulus (MPa), R is the universal gas constant(8.314 J mol�1 K�1), T is the absolute temperature (T¼ 298 K) and r
is the density. Stress relaxation experiment on the samples was alsoperformed on the same instrument to examine the relaxationcharacteristics. The experimental procedure involved application ofconstant strain (60%) followed by relaxation period. All the sampleswere tested in triplicate at room temperature.
2.7. Photo-acoustic Fourier-transform infrared spectroscopy(PA-FTIR) analysis
The p(OCS) films were analysed by a Nicolet Magna� IR spec-trometer (model 750) equipped with an MTEC (model 300) PA cell.The spectra were collected in the mid-infrared region with 100scans at a resolution of 8 cm�1 and a mirror velocity of 0.158 cm s�1.Carbon black was used as a reference and the system was purgedwith helium gas at a flow rate of 10 cm3 s�1.
2.8. X-ray photoelectron spectroscopy (XPS) analysis
The XPS spectra of the p(O1C1S0) films were recorded usinga Kratos AXIS Ultra DLD spectrometer equipped with a mono-chromatic Al Ka radiation source (hn¼ 1486.7 eV) operating at13 kV and 10 mA. The elements present in the sample surface wereidentified from a survey spectrum recorded over the energy range0–1100 eV with a pass energy of 160 eV and a resolution of 0.5 eV.High-resolution (0.1 eV) spectra were then recorded for pertinentphotoelectron peaks at a pass energy of 20 eV to identify thechemical state of each element. All the binding energies (BE) werereferenced to the C 1s neutral carbon peak at 285 eV, to compensatefor the effect of surface charging. The analysis area was700� 300 mm. The processing and curve-fitting of the high-reso-lution spectra were performed using the CasaXPS� software.
2.9. Swelling experiment
The percentage swelling of the p(OCS) polyester in Milli-Q waterand in dioxane was measured as follows: 10 mm diameter discs ofthe p(OCS) films were punched out from the film and soaked into15 cm3 of liquid at room temperature. The discs were taken out ofthe water and the solvent at various time intervals and theirweights measured after wipe-cleaning their surfaces with a lint-free paper. The percentage swelling of the discs was calculatedusing the expression [(Mw�M0)/M0]� 100%, where M0 and Mw
represent the disc masses in dry and wet conditions, respectively.Each measurement was performed in triplicate and appropriatestandard deviations calculated. After the swelling experiments, thediscs were dried to constant weight and sol content was calculatedusing the expression [(M0�Md)/Md]� 100%, where M0 and Md
represent the disc masses in pre- and post-swelling (dried) states.
2.10. Hydrolytic degradation
The hydrolytic degradation examined by measuring thepercentage degradation in phosphate buffer solution (PBS) at 37 �Cwas evaluated by the following procedure: The 10 mm diameterdiscs, punched from the p(OCS) films, were soaked in 10 ml of PBSand kept in a water bath at constant temperature. Samples weretaken out on one week intervals and dried to their constant weight.The PBS was replaced upon sampling each week. The percentagedegradation was calculated using the expression: [(M0�Md)/M0]� 100%, where M0 is a sample mass prior to degradation and Md
is a sample mass after drying to a constant weight. Eachmeasurement was performed in triplicate and appropriate stan-dard deviations calculated.
3. Results and discussion
3.1. Chemical structure by NMR spectroscopic analysis
Fig. 1 shows the 1H NMR spectra of representative purifiedp(OCS) pre-polymers with varying initial molar ratios of CA/SA. Aproposed structural formula for the resulting copolyester in Fig. 1shows the correlation between the various structural componentsand the observed NMR peaks. Similar assignment has also beenreported by others [3,14,18]. In brief, peak ‘‘a’’ is assigned to ester-ified –OH group from OD which is shifted towards lower values(triplet at 3.3–3.4 ppm) in comparison to the NMR spectrum of pureOD (triplet peak at 4.3 ppm). In this experiment we could notidentify terminal OD segments that are expected to appear towardshigher chemical shifts [19]. However, other peaks that correspondto CA (peaks ‘‘i’’ and ‘‘j’’) and SA segments (peak ‘‘k’’) in pre-polymerchains show splitting that is most likely a consequence of existingCA and SA terminal groups [19]. Both peaks are composite of 2triplets and the deconvolution of those peaks is shown as insets inFig. 1 (calculated values from peak areas are reported in Table 1).Our NMR results indicate the existence of both terminal and fullyesterified acid groups in p(OCS) pre-polymers. The triplets shifttowards higher values corresponds to terminal acid (CA and SA)segments and this observation is in line with MALDI-ToF-MS resultsdiscussed in the following section.
3.2. Molecular weight and structural compositionanalysis by MALDI-ToF-MS
The molecular weights (Mw) of p(OCS) pre-polymers weredetermined by MALDI-ToF-MS analysis and the spectra corre-sponding to the different CA/SA ratios are shown in Fig. 2. Eachspectrum shows unimodal distribution of ions characteristic for
I. Djordjevic et al. / Polymer 50 (2009) 1682–16911684

Author's personal copy
a step-growth polymerization such as polyesterification reaction[20]. The molecular weights of [p(OCS)þNa]þ ions, in the rangebetween 947 and 1409, were calculated from MALDI spectra andthe corresponding theoretical and experimental m/z values arereported in Table 2. In Fig. 2, the p(O1C1S0) composition is consis-tent with CA/OD alternating segments with increasing number ofmonomer units from 6 (m/z¼ 947) to 9 (m/z¼ 1379). The differ-ences between each m/z value of this particular composition are128 and 174 which are dehydrated monomers OD and CA respec-tively. Other compositions shown in Fig. 2, that involve SA mono-mers [p(O1C0.75S0.25) and p(O1C0.5S0.5)], also form polyester linearchains with alternating SA/OD/CA units (6–9) distributed asrandom blocks. Our results indicate that the ratio between CA andSA can vary within formed polymer, maintaining the same numberof overall OD/CA/SA units in citrate/sebacate pre-polymer. Here, forthe first time we report MALDI-ToF-MS analysis for such polymers,which clearly shows exclusion of side chain formation reported byothers [18]. Free carboxyl groups from CA segments are also likelyto exist on p(OCS) surface after curing of the pre-polymers in bothfilm and scaffold form, which is a feature of significant importancefor their future biomaterial application [21].
3.3. Surface morphology of scaffold and films by SEM
Fig. 3(a and b) shows the optical photograph of the represen-tative p(OCS) elastomer scaffold and film obtained after compres-sion molding. The elastic nature of the porous scaffold can beclearly evident from the figure as it bounces back against the notchtest (Fig. 3(a)). It must be pointed out that both the film and thescaffold have been produced from the same pre-polymer solution.
Fig. 3c and d show the SEM images of the representativep(O1C1S0) scaffold and film respectively (other polymer composi-tions can be fabricated in the same fashion). The surface of p(OCS)elastomer (Fig. 3(d)) shows micro-wrinkled pattern characteristicof elastomeric surfaces [22]. The average pore diameter in thescaffold ranges from 200 to 300 mm (Fig. 3(c)) and the pores arehomogeneously dispersed in the scaffold [6–8]. This study showsthat our synthesis method can be used to produce elastic scaffoldsfor further tissue engineering applications. Detailed analysis ofscaffolds and their compatibility in tissue cultures will be reportedin a separate study.
3.4. Thermal transitions and degradation of polymers
Thermal stability of the elastomer films synthesized was charac-terized using TGA (results available in supporting Section 1). Theshape of the TGA curves reveals a two-step degradation process for allthe examined samples; and indicates high stability and high degreeof polymerization without any low Mw residue. Other importantstructural feature is that the thermal stability of the p(OCS) increaseswith increasing the concentration of SA in the polymer.
Thermograms of the p(OCS) films were recorded by DSC (Fig. 4)in order to analyse the influence of the pre-polymer composition(determined by NMR and MALDI-ToF-MS) on the morphology ofthe final product. Glass-transition temperatures (Tg) are deter-mined for all the samples, which is considered to be an importantcharacteristic and reveals the molecular dynamics of polymerchains within a given temperature range. As shown in Fig. 4, all thesynthesized p(OCS) polyesters show Tg below room temperature,a characteristic feature that determines their elastomer-like
PPM 3.8 3.6 3.4 3.2 3.0 2.8 2.6 2.4 2.2
PPM 3.8 3.6 3.4 3.2 3.0 2.8 2.6 2.4 2.2
3.94.04.1
2.3 2.2 2.1
j
j
j
i
i
i
ik
k
a
a
a
O
OO
OO
OO OH
HOO
OO
Fig. 1. 1H NMR spectra of p(OCS) pre-polymers: (top) p(O1C1S0); (bottom) p(O1C0.75S0.25).
I. Djordjevic et al. / Polymer 50 (2009) 1682–1691 1685

Author's personal copy
behaviour [16]. Elasticity is caused by high mobility of the macro-molecules at temperatures above Tg [23]. In the case of p(OCS), Tg
progressively increases with increasing initial concentrations of CAin the reaction mixture. Polymer chains formed from the pre-polymers with higher number of CA segments (Fig. 2) are expectedto have strong intermolecular interaction, resulting in reducedmolecular segmental dynamics and increasing Tg [3]. Fig. 4 showsa thermogram of the p(O1C0.5S0.5) sample that exhibits the lowestTg value. When temperature is increased above the Tg, molecularmotion in this particular sample allows further molecular organi-zation and exhibits a cold crystallisation [24] at Tc z�18 �C. Thisparticular sample displays a crystalline melting at Tm z 28 �C,which is also confirmed by visual observation. When held at roomtemperature within the range of 20–25 �C, the p(O1C0.5S0.5) sampleappears as a cloudy, non-transparent white film, which retains its
elastic integrity similar to the other sample films (Fig. 3). However,on heating over 28 �C, the sample instantly becomes transparent,indicating a transition from partially crystalline to amorphous state.The semi-crystalline morphology of p(O1C0.5S0.5) is most likelya result of the formation of longer aliphatic segments generated bypolyesterification between OD and SA. In order to confirm that nounreacted monomers are present, we have performed the DSCexperiment in one heating cycle (25–170 �C) for all synthesizedpolymers. No new peaks due to the presence of monomers havebeen detected.
Thermograms of hydrated p(OCS) samples were also recordedby DSC. All polymer compositions showed consistently lower glasstransitions with the decrease in Tg of �40 �C (Fig. 5), �25 �C and�3 �C for p(O1C1S0), p(O1C0.75S0.25) and p(O1C0.5S0.5) respectively.Thermogram displayed in Fig. 5 (inset) also shows the melting peak
Fig. 2. MALDI-ToF-MS spectra of p(OCS) pre-polymers.
I. Djordjevic et al. / Polymer 50 (2009) 1682–16911686

Author's personal copy
between �10 �C and 0 �C which indicates the presence of waterwithin the p(O1C1S0) polymer network. The shift in glass-transitiontemperature indicates an increase in molecular motion and there-fore, increased elasticity due to a presence of water molecules thatact as a plasticizer [25,26]. Such behaviour is well described byCouche-Retszner treatment [27] for polymer–diluent systemswhich also applies for hydrated elastomeric polymers [28].
3.5. Mechanical properties
Fig. 6(a) shows the tensile stress–strain curves of the p(OCS)films which exhibit typical characteristics of elastic materials [16].
The highest value of Young’s modulus was recorded for thep(O1C0.5S0.5) sample as displayed in Table 3. This particular struc-ture also exhibits highest elongation during tensile stretching(230%). Due to the semi-crystalline nature of this particular poly-mer composition, the p(O1C0.5S0.5) represents boundary conditionsbetween elastomeric and crystalline polymers. For that reason,results in Table 3, calculated for p(O1C0.5S0.5), represent anapproximation to rubber elasticity theory that is used to describeall three structural compositions. According to the rubber elasticitytheory, the p(O1C0.5S0.5) film shows the highest number of active
Table 2Assignment of molecular weights of Na-cationised p(OCS) pre-polymers detected byMALDI-ToF-MS.
Polymer Composition m/z [MþNa]þ
Experimental Theoretical
p(O1C1S0) (CA–OD)3a 947 947
OD–(CA–OD)3 1075 1075(CA–OD)4 1250 1249OD–(CA–OD)4 1379 1377
p(O1C0.75S0.25) CA–OD–SA–OD–CA–OD 957 957OD–SA–OD–(CA–OD)2 1085 1085OD–CA–OD–(SA–OD)2–SA 1282 1279
p(O1C0.5S0.5) (SA–OD)3 977 977OD–(SA–OD)2–CA–OD 1096 1095OD–(SA–OD)2–CA–OD–SA 1282 1279OD–(SA–OD)3–CA–OD 1409 1407
a CA¼ citric acid segment; OD¼ 1,8-octanediol segment; SA¼ sebacic acidsegment.
Fig. 3. Photographs and SEM images of representative p(O1C1S0) elastomer: a) porous scaffold produced by particulate-leaching technique (not to scale); b) film obtained bycompression molding (not to scale); c) SEM image of the scaffold; d) SEM image of the film (scale bar: 1 mm).
Temperature (°C)
-37 °C
-18 °C
-7 °C
Ex
o
a
b
c
-50 -30 -10 10 30 50
Tc =-18 °CTm =28 °C
Fig. 4. Glass-transition temperatures (Tg) determined by DSC: a) p(O1C1S0); b)p(O1C0.75S0.25); c) p(O1C0.5S0.5).
I. Djordjevic et al. / Polymer 50 (2009) 1682–1691 1687

Author's personal copy
chain segments (n) and therefore the lowest molecular weightbetween cross-links (Mc). Increase in Young’s modulus is charac-teristic of an increase in intermolecular bonding within theexamined material. In case of p(O1C0.5S0.5) polyester, the high levelof intermolecular bonding is most likely a result of close packing ofmolecules within crystalline segments.
These mechanical testing results show that pre-determinedchemical structure of the p(OCS) thermoplastic elastomers could beused to tailor their mechanical stiffness for future biomedicalapplications. Fig. 6(b) shows the time dependent stress relaxationbehaviour of all the samples at room temperature. The plot displaysgeneral viscoelastic behaviour typical of elastomeric material. Twozones of relaxation are visible in all cases: an initial period, whererelaxation is linear and rapid with time followed by a gradualsteady zone of equilibrium plateau. Thus, all the samples showa similar shape in stress relaxation pattern. During early stage, rateof relaxation is high as the material continues to recover and rea-ches a steady state. The percentage relaxation values lie within therange of 10–20% for all samples regardless of their tunablecomposition. Such behaviour indicates that all studied p(OCS)copolyesters are not only chemically cross-linked elastic material,but also low relaxation is primarily due to greater degree of asso-ciation and entanglement. Strong level of interaction preventsmolecules from sliding over one another effectively. As such
primary covalent bonds are difficult to break and are not likely tocontribute to the stress relaxation property. This result alsodemonstrates that these p(OCS) materials possess both chemicaland physically cross-linked chains imparting thermoplastic elas-tomeric characteristics and the relaxation behaviour [28].
3.6. Surface analysis by PA-FTIR
The infrared spectrum of the representative p(OCS) films,obtained using the PA-FTIR instrument, is shown in Fig. 7. The1735 cm�1 peak corresponding to the –C]O vibration of esterbonds confirms the formation of the polyester [3,14,29,30]. Broadbands centred at 3440 cm�1 and 3295 cm�1 are assigned tohydrogen-bonded hydroxyl groups stretching vibration and the O–H vibration (nO–H) of the hydrogen-bonded carboxyl groups fromCA segment, respectively [3]. Inset spectra in Fig. 7 show increasedintensity of the hydroxyl peaks with increase in the number of CAsegments in the p(OCS) chains. These results suggest that thedensity of the hydrogen-bonded hydroxyl groups in the p(OCS)polymers is determined by the CA/SA concentration ratio, whichprimarily determines the interaction of the p(OCS) with water. Thisis also supported by our swelling results (Section 3.8). Therefore,the p(O1C1S0) composition with the highest number of CAsegments is expected to be most hydrated.
3.7. Surface analysis by XPS
The XPS analysis was performed in order to investigate thepresence, in general, of pendant carboxyl groups in the p(OCS)elastomers. Only one of the four types of samples [p(O1C1S0)] hasbeen investigated as a representative material for the XPS study. Asurvey photoelectron spectrum of the p(O1C1S0) sample isdisplayed in Fig. 8(a), showing the carbon (C 1s) and oxygen (O1s)photoelectron signals with small quantities of impurities (1.4 at. %Si; 0.4 at. % F; 0.3 at. % N and; 0.1 at. % Ag). A high-resolution C 1sspectrum of this sample, when curve fitted, can be seen asconsisting of three major components, as shown in Fig. 8(b). Thefirst component at w285 eV is attributed to the aliphatic carbon(–C–C–) bonds and carbon–hydrogen bonds (–C–H–). Chemicalshifts were calculated relative to the aliphatic peak. The C 1scomponent shifted by 1.7 eV is attributed to the ester bonds (–C–O–C]O) and the component shifted by 4.3 eV is assigned to thecarboxyl groups (–COOH) [31]. It is estimated from the variouspeak areas of the C 1s curve-fitted spectrum [Fig. 8(b)] that thechemical functionalities at the surface of the p(O1C1S0) sample are
-50 -40 -30 -20 -10 0 10
-60 -40 -20 0 20
-7 °C
-47 °C
Ex
o
-37 °C
-40 °C
Temperature (°C)
c
d
a
b
Fig. 5. Thermal behaviour upon hydration measured by DSC for p(O1C0.5S0.5): a) dry;b) hydrated [inset showing a Tg depression upon hydration of p(O1C1S0): c) dry;d) hydrated].
Time, min
0 5 10 15 20 25 30
Stress R
elaxatio
n, P
ercen
t
75
80
85
90
95
100
p(O1C0.5S0.5)p(O1C1S0)p(O1C0.75S0.25)
00 50 100
Tensile strain (%)
Ten
sile stress (M
Pa)
150 200 250
0.1
0.2
0.3
0.4
0.5
0.6
0.7a b
ab
c
Fig. 6. (a) Stress–strain curves for p(OCS) films: (a) p(O1C1S0); (b) p(O1C0.75S0.25); (c) p(O1C0.5S0.5); (b) Stress relaxation characteristics of the P(OCS) copolyesters.
I. Djordjevic et al. / Polymer 50 (2009) 1682–16911688

Author's personal copy
mainly composed of aliphatic segments (w65%), with polyesterand carboxyl groups contributing w21% and w13%, respectively.This estimation is in good agreement with the other structuralinvestigations we have carried out. Presence of carboxyl groups islikely to originate from CA, which has two primary and onetertiary carboxyl acid groups, which is less reactive than primaryacid groups [5]. In addition, it has also a tertiary hydroxyl group insterically hindered position. A combination of all these freefunctional groups eventually influences the hydrogen bondinteractions, swelling and hydration of p(OCS) elastomers.
3.8. Swelling characteristics
The swelling behaviour of the p(OCS) samples in water is shownin Fig. 9. Samples soaked in water reach their swelling equilibriumwithin hours with maximum swelling degree up to 14% for p(O1C1
S0). Sol content has been calculated to be 2–5% for all the samples(data not shown). Since no unreacted monomers have beendetected in thermal analysis, the sol content evaluated in thisexperiment can only be attributed to the possible formation ofshort oligomers soluble in water. Although no such formation couldbe detected in our DSC analysis, the relatively small amount of thesol content, detected in swelling experiment, provides a clearindication of successful polymer network formation from the pre-polymer mixtures.
Our swelling experiments illustrate how equilibrium percentageswelling drops with decreasing concentration of CA (Fig. 9). Thisparticular result suggests that in the case of p(OCS) polyesterelastomers, hydration is dependent on the number of hydrophilicfunctionalities such as carboxyl and hydroxyl groups (as we havedetermined from PA-FTIR, and XPS) present. The swelling experi-ment also reveals that the samples with longer hydrophobicaliphatic chains have less percentage swelling in water. The sample
with composition p(O1C0.5S0.5) shows lowest hydration due to thestrong presence of aliphatic hydrophobic segments generated frompolyesterification between OD and SA. This finding is consistentwith the results reported in the DSC experiment. Polyester withstructure p(O1C0.5S0.5) exhibits semi-crystalline behaviour, whichdoes not allow water to penetrate causing low percentage swelling(Fig. 9). Although our results show disappearance of crystallisationupon swelling (Fig. 5), the p(O1C0.5S0.5) composition is consistent oflonger aliphatic chains and is expected to express lowest hydro-philicity. In the present case, replacing CA with SA as a buildingblock in copolyester formation leads to increased swelling in water,that is, by simply varying the CA/SA ratio in the pre-polymercomposition (Table 1). With our synthesis method and materialprocessing technique, we are able to successfully control both
Table 3Physical and mechanical properties of p(OCS) polymer films.a
Polymer Density (g cm�3) Young’s modulus (MPa) Elongation (%) Tensile strength (MPa) n (mol m�3) Mc (g mol�1)
p(O1C1S0) 1.09 {0.01} 0.19 {0.01} 168 {11} 0.24 {0.02} 26 {1} 41,923 {1999}p(O1C0.75S0.25) 1.11 {0.02} 0.20 {0.02} 127 {15} 0.20 {0.02} 27 {4} 41,111 {4239}p(O1C0.5S0.5) 1.12 {0.02} 1.10 {0.30} 231 {11} 0.63 {0.09} 148 {36} 7568 {1976}
a Mean values are reported with the standard deviation in brackets.
1
2
3
4
5
6
7
1000 2000 3000
Ab
so
rb
an
ce (a. u
)
Wavenumbers (cm-1
)
a
b
c
2500 3000 3500
32953440 1735
Fig. 7. Representative PA-FTIR spectrum of p(OCS) elastomer [inset showing anincrease of 3440 cm�1 and 3295 cm�1 peaks corresponding to hydrogen-bonded –OHfunctionalities: (a) p(O1C1S0); (b) p(O1C0.75S0.25); (c) p(O1C0.5S0.5)].
x 104
5
10
15
20
25
No
rm
alised
In
ten
sity
1000 800 600 400 200 0Binding Energy (eV)
O 1s
C 1s
2
4
6
8
10
12
14x 103
No
rm
alised
In
ten
sity
292 291 290 289 288 287 286 285 284 283Binding Energy (eV)
C
O
HO C O C
O
CH
*
(shift = 4.3) (shift = 1.7)
a
b
Fig. 8. XPS spectra of a p(O1C1S0) film sample: (a) survey spectrum; (b) high-resolu-tion C 1s region.
I. Djordjevic et al. / Polymer 50 (2009) 1682–1691 1689

Author's personal copy
mechanical properties, processability and hydration of the p(OCS)elastomers. In general, the material can be made elastic throughcovalent cross-links, 3D networks of random coil via the hydroxyland carboxyl groups attached to the backbone (Fig. 2). Extensivehydrogen bonding between adjacent chain hydroxyl and carboxylgroups also plays a crucial role to attribute unique elastomericproperties. By cumulative hydrogen bond interactions, it is possibleto create strongly bound supramolecular polymer and threedimensional structures. In such system, the monomeric units areheld together by non-covalent interactions (labile crosslink), thusproviding unique opportunities for designing tunable materials[32]. Thus extensive hydrogen bonding prevalent in these copo-lyesters makes them versatile for use in biomedical field. It isnoteworthy that the hydration is an important feature for interac-tion of biomaterials with biological systems. Another importantfeature of this material is that the samples retain their physicalintegrity upon swelling in water.
In order to confirm the nature of interaction in the final poly-mers, equilibrium swelling experiment was performed usingdioxane (same solvent used for making pre-polymer solutions). Adisk was made from each sample, and kept in the solvent at roomtemperature for 7 days. It is interesting to note that all 3 p(OCS)compositions show equilibrium swelling in the range of 250–290%with sol content of 5–7% (data not shown). Such a high percentageswelling not only indicates the close matching of the solubilityparameter of the solvent (20.2 J1/2 cm�3/2) and the polymer(21.5 J1/2 cm�3/2) [33] but also the fact that there is a degree ofintermolecular interaction in these polymers in addition to chem-ical cross-links. Although dioxane does dissolve shorter copolyesterp(OCS) chains (pre-polymers), the final (post-polymerised) p(OCS)samples do not dissolve in dioxane even after soaking for severaldays. Relatively small sol content indicates that there is very littlepresence of small oligomers trapped within p(OCS) network. As thepolymer–polymer intermolecular forces are high due to cross-linking and strong hydrogen bonding, the samples do notcompletely dissolve. However, if these forces are overcome by theintroduction of strong polymer–solvent interactions, then disso-lution can take place. The process of swelling thus results from thebalance of repulsive and attractive forces, which also takes intoaccount the thermodynamic mixing between the net polymer andthe solvent; the hydrogen bond interaction between functionalgroups and the elastic force of the polymer and also inter-chainattractive forces. The expansion of the polymer takes place due tothe entropic diffusion of its constituent chains and the solvent. On
the other hand, swelling is counterbalanced by elastic forces withinthe polymer chain and inter-chain attractive forces. As a result,polymer–solvent systems tend to reach the minimum of the Gibbsenergy of mixing, which is the driving force of the process. Hence,high percentage swelling in dioxane reveals weakening of inter-molecular interactions and physical cross-links between the poly-mer chains that are disrupted during swelling process. The solventis able to disrupt extensive hydrogen bonds that are formedbetween residual functional groups (–OH and –COOH) as well ashydrophobic interactions between aliphatic OD–SA segments thuscausing swelling almost 3 times of the original sample mass. Thisresult is consistent with the findings of surface analysis performedby PA-FTIR and XPS, which reveal presence of residual free –OH and–COOH functionalities. It is widely known that non-covalentphysical cross-links can be disrupted either by solvent interactionor by heating. The formation of physical cross-links is characteristicof thermoplastic elastomers in general [23]. This class of polymerscan be defined as materials that have the performance of the cross-linked elastomers at room temperature and processability of thethermoplastic materials at elevated temperature [28]. In case of ourp(OCS) thermoplastic elastomer, all three chemical compositionsshow consistent swelling behaviour in dioxane and thermal proc-essability as the synthesized p(OCS) films can be recycled andthermally remolded a number of times. Similar type of polyesterbioelastomer with thermal processing ability has been reported byLiu et al. [12].
3.9. Hydrolytic degradation
All p(OCS) polymers were degraded in PBS solution at 37 �C.Samples exhibit dry weight loss of 70.1�8.3%, 64.1�5.8% and8.6�1.6% for p(O1C1S0), p(O1C0.75S0.5) and p(O1C0.5S0.5) respec-tively (degradation profile available in supporting Section 2). Thisresult corresponds to the swelling data recorded for p(OCS) poly-mers. As expected, the p(O1C0.5S0.5) displays the slowest degrada-tion rate due to the existence of longer hydrophobic chains that donot allow molecules of water to penetrate into the structure thuscausing the cleavage of ester bonds. However, the detailed studysuch as one performed by Tatai et al. is necessary in order tooptimise the polymer for future biomedical applications [34].Similar to the p(OCS) material studied here, PGS and POC elasto-mers have been studied by other investigators for their potentialuse in tissue engineering applications [2,11,13,15,35]. Synthesis ofall these materials is via catalyst-free polyesterification, and theirstructural properties are also similar and potentially suitable forfabrication of tissue engineering scaffolds. Wang et al. [35] havemonitored in vivo degradation of PGS and results show that thedegradation is caused by surface erosion. Since our p(OCS) elasto-mers have structural properties and equilibrium percentageswelling comparable to PGS elastomers [2], we expect that thep(OCS) elastomers would degrade in vivo in a fashion similar to thatobserved for PGS [35]. The key advantage of our p(OCS) elastomerover PGS is its tuneable elastic properties, mechanical strength andhydration characteristics.
4. Conclusion
A new type of copolyesters has been synthesized by a simplecatalyst-free polyesterification process with 1,8-octanediol (OD),citric acid (CA) and sebacic acid (SA) as starting monomers. Thedeveloped material is elastomeric in nature, which is evident fromthermal and mechanical analysis. The thermoplastic behaviour andthermal stability enable the p(OCS) polyesters to be prepared at anyrequired geometry. The chemical, physical, and physico-chemicalcharacteristics such as chemical structure, strength and elasticity,
00 100 200 300 400
12
10
8
6
4
2
14
16
Time (min)
Percen
tag
e sw
ellin
g
a
b
c
Fig. 9. Percentage swelling of the p(OCS) elastomer films in water: a) p(O1C1S0); b)p(O1C0.75S0.25); c) p(O1C0.5S0.5).
I. Djordjevic et al. / Polymer 50 (2009) 1682–16911690

Author's personal copy
morphology, and hydration of p(OCS) elastomers can be easily andprecisely controlled to suit applications in tissue engineering anddrug delivery. The presence of carboxyl and hydroxyl groups at theelastomeric surface can be exploited further for imparting bio-functionality to the polymer, for example attaching biomoleculessuch as proteins. We believe that this new material will significantlyimprove the ease of fabrication and performance of biocompatibleelastomers for future tissue engineering applications.
Acknowledgement
The authors wish to acknowledge the funding from AustralianResearch Council, ARC for part support of this work.
References
[1] Webb AR, Yang J, Ameer GA. Expert Opinion on Biological Therapy2004;4(6):801–12.
[2] Wang Y, Ameer GA, Sheppard BJ, Langer R. Nature Biotechnology2002;20(6):602–6.
[3] Yang J, Webb AR, Pickerill SJ, Hageman G, Ameer GA. Biomaterials2006;27(9):1889–98.
[4] Nagata M, Tanabe T, Sakai W, Tsutsumi N. Polymer 2008;49(6):1506–11.[5] Noordover BAJ, Duchateau R, van Benthem RATM, Ming W, Koning CE. Bio-
macromolecules 2007;8(12):3860–70.[6] Yang J, Webb AR, Ameer GA. Advanced Materials 2004;16(6):511–6.[7] Gao J, Crapo PM, Wang Y. Tissue Engineering 2006;12(4):917–25.[8] Yang J, Motlagh D, Webb Antonio R, Ameer Guillermo A. Tissue Engineering
2005;11(11–12):1876–86.[9] Kang Y, Yang J, Khan S, Anissian L, Ameer GA. Journal of Biomedical Materials
Research, Part A 2006;77A(2):331–9.[10] Qiu H, Yang J, Kodali P, Koh J, Ameer GA. Biomaterials 2006;27(34):5845–54.[11] Sundback CA, Shyu JY, Wang Y, Faquin WC, Langer RS, Vacanti JP, et al.
Biomaterials 2005;26(27):5454–64.[12] Liu Q, Tian M, Ding T, Shi R, Zhang L. Journal of Applied Polymer Science
2005;98(5):2033–41.
[13] Webb AR, Kumar VA, Ameer GA. Journal of Materials Chemistry2007;17(9):900–6.
[14] Lei L, Ding T, Shi R, Liu Q, Zhang L, Chen D, et al. Polymer Degradation andStability 2007;92(3):389–96.
[15] Bettinger CJ, Orrick B, Misra A, Langer R, Borenstein JT. Biomaterials2006;27(12):2558–65.
[16] Nijst CLE, Bruggeman JP, Karp JM, Ferreira L, Zumbuehl A, Bettinger CJ, et al.Biomacromolecules 2007;8(10):3067–73.
[17] Meier MAR, Schubert US. Rapid Communications in Mass Spectrometry2003;17(7):713–6.
[18] Barroso-Bujans F, Martinez R, Ortiz P. Journal of Applied Polymer Science2003;88(2):302–6.
[19] Chikh L, Tessier M, Fradet A. Polymer 2007;48(7):1884–92.[20] Adamus G, Rizzarelli P, Montaudo MS, Kowalczuk M, Montaudo G. Rapid
Communications in Mass Spectrometry 2006;20(5):804–14.[21] Li B, Ma Y, Wang S, Moran PM. Biomaterials 2005;26(24):4956–63.[22] Ohzono T, Matsushita SI, Shimomura M. Soft Matter 2005;1(3):227–30.[23] Sperling LH. Introduction to physical polymer science. 3rd ed. John Wiley &
Sons, Inc.; 2001.[24] Nagata M, Kiyotsukuri T, Minami S, Tsutsumi N, Sakai W. European Polymer
Journal 1997;33(10–12):1701–5.[25] Ellis TS, Karasz FE. Polymer 1984;25:664–9.[26] Bettinger CJ, Bruggeman JP, Borenstein JT, Langer RS. Biomaterials
2008;29(15):2315–25.[27] Couchman PR, Karasz FE. Macromolecules 1978;11(1):117–9.[28] Costa FR, Dutta NK, Choudhury NR, Bhowmick AK. In: Bhowmick AK, editor.
Current topics in elastomers research. Boca Raton, FL: CRC Press; 2008.[29] Liu Q, Tian M, Ding T, Shi R, Feng Y, Zhang L, et al. Journal of Applied Polymer
Science 2007;103(3):1412–9.[30] Liu Q, Tian M, Shi R, Zhang L, Chen D, Tian W. Journal of Applied Polymer
Science 2007;104(2):1131–7.[31] Briggs D, Grant JT. Surface Analysis by Auger and X-ray Photoelectron Spec-
troscopy. Manchester: IM Publications and Surface Spectra Ltd; 2003.[32] Chino K, Ashiura M. Macromolecules 2001;34(26):9201–4.[33] Deslandes N, Bellenger V, Jaffiol F, Verdu J. Journal of Applied Polymer Science
1998;69(13):2663–71.[34] Tatai L, Moore TG, Adhikari R, Malherbe F, Jayasekara R, Griffiths I, et al.
Biomaterials 2007;28(36):5407–17.[35] Wang Y, Kim YM, Langer R. Journal of Biomedical Materials Research, Part A
2003;66A(1):192–7.
I. Djordjevic et al. / Polymer 50 (2009) 1682–1691 1691