Laboratory tests of thermoplastic piping assemblies subjected ...
Upload
independentCategory
view
1download
0
ORI GIN AL PA PER
Strong thermoplastic elastomers created using nickelnanopowder
Witold Brostow • Martina Brozynski •
Tea Datashvili • Oscar Olea-Mejıa
Received: 15 February 2011 / Revised: 30 June 2011 / Accepted: 30 June 2011 /
Published online: 22 July 2011
� Springer-Verlag 2011
Abstract We have decided to investigate whether addition of nickel (Ni) to a
thermoplastic elastomer (TPE) will make TPE properties better for demanding
applications. We have found that Ni particles moved well during low (100 �C)
temperature blending, with the polymer providing more uniform particle dispersion.
In contrast, at 160 �C, lower viscosity prevented particle dispersion and supported
Ni agglomerations. All samples processed at low temperatures showed increased
(by &10 �C) melting temperatures, higher crystallinity, and a 1.5 times higher
Young’s modulus E. While addition of Ni increases brittleness B of the blends, and
so does vulcanization, a combination of both treatments lowers B. Some Ni particles
go into existing free volume spaces in vulcanized materials thus enhancing
mechanical properties including the storage modulus E0; some other filler particles
create new free volume pockets increasing the elongation at break; thus, Ni particles
at both kinds of locations provide lower values of brittleness. The addition of
0.5 wt% Ni particles to the uncured TPE matrix decreases the amount of extracted
W. Brostow (&) � M. Brozynski � T. Datashvili
Laboratory of Advanced Polymers & Optimized Materials (LAPOM), Department of Materials
Science and Engineering, Center for Advanced Research and Technology (CART),
University of North Texas, 1150 Union Circle # 305310, Denton, TX 76203-5017, USA
e-mail: [email protected]
URL: http://www.unt.edu/LAPOM/
M. Brozynski
e-mail: [email protected]
T. Datashvili
e-mail: [email protected]
O. Olea-Mejıa
Centro Conjunto de Investigacion en Quımica Sustentable, Facultad de Quımica,
Universidad Autonoma del Estado de Mexico, Toluca, Mexico 50120, Mexico
e-mail: [email protected]
123
Polym. Bull. (2011) 67:1671–1696
DOI 10.1007/s00289-011-0571-3
gel by 68.0 wt%. We used both Ni and oxidized Ni; they bestow similar properties
on the TPE while providing stronger and less brittle materials than neat TPE.
Keywords Thermoplastic elastomer � Nickel filler � Brittleness � Oxidation �Nanocomposite
Introduction
Modern technology continuously needs new materials with special combinations of
properties. The advances in technology are connected to a widening application of
engineering polymeric materials (engineering plastics) in the automotive, aviation,
construction and petroleum industries, manufacture of consumer goods, and
medicine [1–4].
Strength, lighter weight, versatility, ease of processing, and low cost have been
the motives to replace traditional metals and ceramics with polymer-based materials
(PBMs). Unlike metals or ceramics, PBMs allow to lower the weight and to increase
the output of parts—along with increase resistance to chemically hostile conditions.
The ability to tailor structure—by adding fillers [5–21] and thus affecting the
strength/stiffness when required—means that polymer composite structures can be
more efficient and effective than other materials. In recent years, polymer
nanocomposites (PNCs) have become more and more attractive [6, 9, 22–28].
Embedded nanoparticles can profoundly affects important properties of the
polymers and thus enlarge the range of potential applications of polymers. Through
control or alteration of the additives at the nanoscale level, one is able to enhance
the properties of selected polymer systems to meet or exceed the requirements of
current military, aerospace, and commercial applications [29].
Thermoplastic elastomers (TPEs) are an important class of polymers. Car tires,
rubber bands, and many other products are made from elastomers—that is,
polymeric materials in which lack of rigidity is the main advantage. TPE-based
nanocomposites containing clay have been studied in some detail. Thus, Naderi
et al. [30] investigated materials containing polypropylene (PP), ethylene-propyl-
ene-diene rubber (EPDM), a clay, and a compatibilizer. They have found
differences in properties between materials prepared with low viscosity PP or else
with high viscosity PP. Ho et al. [31] developed a novel class of insulating materials
using thermoplastic polyurethane elastomers (TPUs) filled with nanoclays and
carbon nanofibers. We recall that PUs have a large variety of structures [32–34].
The nanofillers most often used in plastics are carbon nanomaterials (including
fullerene or its derivatives) [7, 22] or layered clay minerals [9, 16]; ceramic particles
have also been used [26]. Like ceramic or carbon-filled polymers, metal-filled PNCs
have the potential to combine both performance and processability [35–37].
Given the advantages of elastomers noted above and a very large amount of
elastomers produced annually [38, 39], we have decided to synthesize dynamic
vulcanized blends of PP and EPDM [40, 41] filled with 0.5 wt% nickel
nanoparticles. We have studied before [35] properties of hybrids containing low
density polyethylene (LDPE) and in turn Ag, Al, and Ni. Values of dynamic friction
1672 Polym. Bull. (2011) 67:1671–1696
123
of the hybrids against polytetrafluoroethylene (PTFE) show that addition of Ni to
LDPE results in instantaneous lowering of the friction; for the other two metals,
there are maxima on the dynamic friction versus metal concentration diagrams. We
expected that nano-sized nickel might significantly change the properties of the
thermoplastic vulcanized elastomer (TPV) products. Furthermore, TPV-based
nanocomposites are good candidates for the development of new types of
lightweight and high-performance solar absorbing roofing laminates for increased
solar energy conversion. Moreover, a combination of nickel particles with TPV
matrix is one way to stabilize the Ni particle to avoid problems of oxidation and
lower the danger of corrosion. In order to evaluate the effects of nickel nanopowder
on thermal and mechanical behavior of TPV composites, we have taken into
account extant results of studies on oxidation of nickel nanoparticles [42–44]. The
sample size dispersion and elemental composition of the nickel powder before and
after oxidation were characterized using transmission electron microscopy (TEM),
energy dispersive X-ray spectroscopy (EDS), and thermogravimetric analysis
(TGA). For TPV ? nickel and TPV ? oxidized nickel nanocomposites, we have
studied relationships between the glass transition temperature Tg, crystallinity,
swelling, morphology, and mechanical properties. The experiments for uncross-
linked EPDM ? PP ? 0.5 wt% Ni blends were performed and compared with
those of the crosslinked composites. In order to achieve homogenous dispersion of
nanopowder inside TPV matrix, two different techniques were pursued. Composites
were prepared using nickel powder (Method 1—loading temperature 160 �C) and
nickel powder suspension in methanol (Method 2—loading temperature 100 �C), as
detailed below.
Experimental part
Materials
Ethylene-propylene-diene rubber and modified metallic diacrylate co-agent (SR633)
were received as a gift from Dow Chemical Company and Sartomer Company, Inc.,
respectively. PP pellets were supplied by Huntsman Co. Table 1 lists some
properties of the polymers used.
A silane coupling agent (SCA) namely vinyltrimethoxysilane (VTMOS) was
received as a gift from Struktol Company of America. Dycumyl peroxide (DCP),
Table 1 Properties of the
polymersMaterial PP EPDM
23 �C density/(g cm-3) 0.917 0.882
Mooney viscosity/ML 1 ? 4 at 125 �C – 25
Degree of crystallinity/vol.% 39.7 0.0
Molecular weight 232.000 135.000
Ethylidenenorbornene content/mass% – 4.9
Polym. Bull. (2011) 67:1671–1696 1673
123

methanol, cyclohexane, and nickel powder were from Sigma Chemicals Co. The
reagents were analytically pure and were used as-received.
Characterization techniques
Differential scanning calorimetry (DSC)
The DSC technique is well described by Lucas and her colleagues [45], Menard [46],
and Gedde [47]. DSC measurements were performed on a Perkin Elmer (DSC-7)
instrument. The temperature range from 0 to 200 �C was covered under a nitrogen
atmosphere at 10 �C/min heating and cooling rates. The melting temperatures Tm,
crystallization temperature Tc, and enthalpies of fusion Hf were obtained by analyzing
the DSC thermograms. Volumetric degree of the crystallinity Xc was calculated as
Xc %½ � ¼ 100 Hf=HfPP: ð1Þ
Here HPPf = 209 J/g is the enthalpy of fusion of extrapolated 100% crystalline PP
[47, 48].
Dynamic mechanical analysis (DMA)
The tests were carried out using a DMA7e apparatus from Perkin Elmer Co. The
DMA technique has also been described by the same authors [45–47]. Specimens
were analyzed in rectangular form using the three point bending fixture in the
temperature scan mode at the heating rate of 5 �C/min. The frequency applied was
1.0 Hz. We registered the storage (solid-like) modulus E0, the loss (liquid-like)
modulus E00, and tan d as a function of temperature
tan d ¼ E00=E0: ð2Þ
Thermogravimetric analysis (TGA)
A Perkin Elmer TG-7 instrument was used to determine a temperature profile of the
powder. Five milligrams of each dried sample was placed on a balance and heated
over the temperature range from ?50 to 700 �C at the heating rate of 10 �C/min.
Environmental scanning electron microscopy (ESEM) and energydispersive spectroscopy (EDS)
Energy dispersive spectroscopy of all powder samples were taken using a FEI Quanta
Environmental Scanning Electronic Microscope (ESEM) configured with EDS.
Transmission electron microscopy (TEM)
The particles before and after oxidation were characterized under a JEOL 2100
TEM at 200 kV of acceleration voltage to determine their shape and size
distribution.
1674 Polym. Bull. (2011) 67:1671–1696
123

Focused ion beam/scanning electron microscope (FIB/SEM)
The FEI Nova 200 NanoLab [a dual column ultra high-resolution field emission
scanning electron microscope (SEM) and focused ion beam (FIB)] were used to
study the morphology of the composites [37]. In this technique, we use both beams
(electrons and ions) without removing the sample from the analysis chamber. First,
an area for milling is selected with the electron beam, and then the milling is made
with the Ga? ion beam. The two beams are at 52� from each other; this allows
observing one side of the milled parallelepiped with the electron beam. The
composites were milled with 0.5 nA Ga? ion beam current at an accelerating
voltage of 30 kV. The observed inner region of the cross-sectional area was
polished (cleaned) with the same beam current 0.5 nA.
A small fraction of the samples was mounted on a copper stub and coated with a
thin layer of gold and palladium to avoid electrostatic charging during examination.
Tensile testing
The static tensile behavior of the samples was determined at room temperature with
a MTS tester (model QTEST/5) according to ASTM D-638. The tests were
performed in a controlled environment in order to determine the elongation at break,
strain at break, and modulus. The cross-head speed was 100 mm/min; five
specimens of each sample were tested and average values are reported.
Gel content
Rectangular sample pieces with dimensions 15 9 7 9 2 mm3 were used for testing.
Cyclohexane was used to immerse the samples at 23 �C in the liquid. After 24 h, the
cyclohexane was refreshed to remove the extracted components. After another 24 h,
the swollen samples were weighted, dried, and weighed again. The drying of the
samples was performed at 50 �C for 48 h in order to remove the solvent. Swelling
behavior is related to the bulk modulus (the reciprocal of isothermal compressibil-
ity) and also to diffusivity [49]. The relative gel content mg with respect to the initial
mass m0 was calculated from the difference between m0 and md, where md is the
mass after drying the sample. The gel amount in the composites was determined as:
gel %ð Þ ¼ m0 � md
m0
100%: ð3Þ
Oxidation and modification of nickel powder
Nickel powder was oxidized for a period of 19 h in a Burnsted Thermolyne furnace
at a constant temperature of 400 �C. The initial nickel powder, after oxidation,
gained approximately 22 wt%.
Chemical treatment of nickel powder was performed using a vinyltrimethoxysi-
lane (VTMOS) and a suspension of aluminum oxyhydroxide (AlOOH). A typical
example can be described as follows. The reaction mixture contained 3.0 g
VTMOS, 3.0 g of methanol, and 20 g & 3.0 wt% AlOOH (Boehmite) suspension
Polym. Bull. (2011) 67:1671–1696 1675
123

in methanol. 2.0 g of nickel powder was added slowly under thorough stirring of the
mixture. After another 3 h of stirring, the resulting mixture was refluxed at 70 �C
for 2 h. The final product was collected by centrifugation, washed with fresh
methanol, and then vacuum dried for 24 h at 110 �C. The classic Yoldas process
[50] was used to prepare the AlOOH (Boehmite) suspension in methanol (Fig. 1).
Aluminum isopropoxide (Al(OC3H7)3) from Sigma-Aldrich was chosen to be the
precursor of Boehmite. In order to achieve complete hydrolysis, the molar ratio of
aluminum isopropoxide to water was kept 1:150. Hydrolysis occurs according to the
reaction:
2 Al CH3ð Þ2CHO� �
�3 þ 3 þ nð ÞH2O ! Al2O3 � nH2O þ 6 CH3ð Þ2CHOH:
During the subsequent evaporation of approximately half the amount of H2O under
constant stirring, HNO3 is added in order to clear the solution and to maximize the
Al content at the gelling point. After cooling down to room temperature, a clear gel
is obtained. This gel is then mixed with an appropriate amount of methanol to obtain
&3.0 wt% Boehmite suspension in CH3OH (Fig. 1). Thus, Ni particles are coated
with Boehmite gel so that hydroxide groups of Boehmite facilitate grafting.
VTMOS has two types of reactive groups. One of the groups (methoxysilane) reacts
with inorganic constituents, while the other one (vinyl) reacts with organic
constituents present.
Sample preparation
The composites were prepared by melt mixing in a C.W. Brabender D-52
Preparation Station. EPDM was added first and softened at 160 �C (Method 1) and/
or at 100 �C (Method 2) with a blade rotation speed of 60 rpm during 2 min,
followed by the addition of 0.5 wt% nickel powder (Method 1) and/or 0.5 wt%
nickel powder suspension in methanol (Method 2). After 2 min of mixing, PP was
Fig. 1 TGA diagram: boehmite suspension in methanol
1676 Polym. Bull. (2011) 67:1671–1696
123

added. Immediately afterward, 1.0 wt% of the curing agent (DCP) and 0.5 wt% of
SR633 (for minimizing the PP degradation) were added, and temperature and
mixing speed were increased and kept for 2 min at 190 �C and 90 rpm. The amount
of peroxide was calculated on the basis of EPDM ? PP weight.
The resulting samples were pelletized, and the blends were then molded in an
AB-100 injection machine (AB Machinery, Montreal, QC, Canada) at 175 �C with
an injection pressure of 830 kPa.
Characterization of nickel particles
The particles before and after oxidation were characterized with a TEM in order to
determine their shape and size distribution. TEM images are shown in Fig. 2.
Nickel particles are approximately spherical with a wide diameter distribution
between 10 and 120 nm. The average particle size estimated from TEM images is
41.5 nm, which is higher than an average particle size of 28.0 nm stated by the
provider. As oxygen is incorporated via oxidation of Ni particles, they tend to grow
in size. The particle shape becomes irregular after oxidation (Fig. 2b). The particles
are in the form of aggregates or even sintered clusters—an implication of melting
occurring during the oxidation experiments. The average size of oxidized Ni
particles is 45.3 nm. Song et al. have reported that oxidation of Ni nanoparticles is
accompanied by early melting, far below nickel’s bulk melting temperature
Tm & 1450 �C [42].
When the particles are modified, their size remains practically the same, namely
45.5 nm, see Fig. 2c. It is important to note that the oxidized and modified particles
are better dispersed than untreated Ni, as seen in the TEM images. The particle size
histograms are shown in Fig. 3.
In order to quantitatively investigate the oxidation behavior, the elemental
composition of nickel nanoparticles (as-received) and particles after oxidation and
modification experiments were analyzed by energy dispersive EDS (Fig. 4).
The EDS results confirm the high purity of nickel particles; &99.9 wt% of the
metallic components is nickel, which is consistent with the data from the
manufacturer. The EDS analysis also identified the presence of 0.4–1.3 wt%
oxygen at different scanned areas of the nickel particles prior to the oxidation
experiments. This implies that different levels of initial oxidation of nickel particles
occurred during the production or storage period. This might be caused by a non-
uniform distribution of defects in nickel crystal structures, i.e., areas with large
defects could cause high oxidation levels and vice versa. Statistical oxygen weight
concentration in these five areas was 0.85 wt%; this equals a nickel oxide
concentration of 3.96% by weight. EDS also shows us a high degree of oxidation for
the nickel nanopowder and the signs of the Ni powder treatment. Identified Si and
Al peaks are the evidence of the modification progress (Fig. 4c).
Diffraction patterns of Ni particles were recorded using the TEM diffraction
mode to study the crystallography of the samples (Fig. 5).
As expected, Ni nanoparticles have a face-centered cubic (FCC) crystal structure,
the same as the metallic Ni (Fig. 5). In the diffraction pattern of oxidized Ni
Polym. Bull. (2011) 67:1671–1696 1677
123
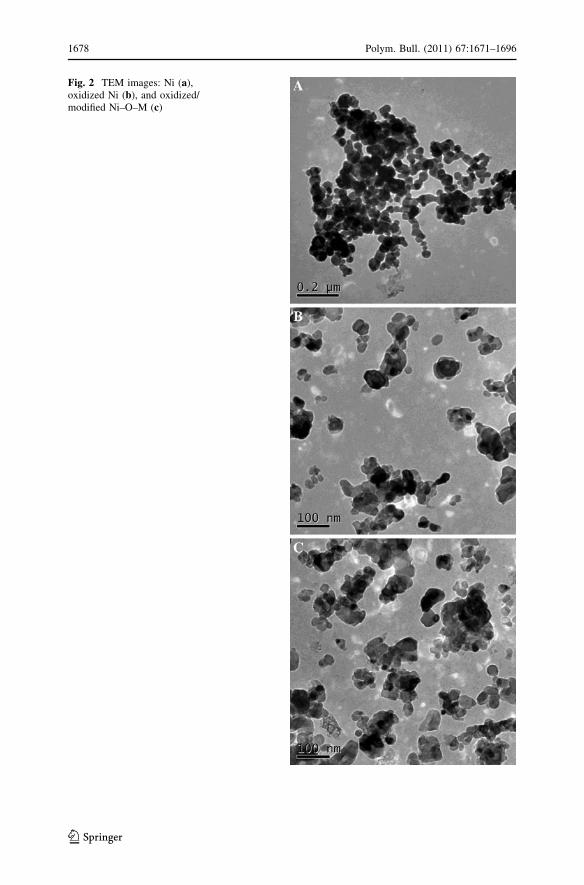
Fig. 2 TEM images: Ni (a),oxidized Ni (b), and oxidized/modified Ni–O–M (c)
1678 Polym. Bull. (2011) 67:1671–1696
123

Fig. 3 The particle sizehistograms: Ni (a), oxidizedNi (b), and oxidized/modifiedNi–O–M (c)
Polym. Bull. (2011) 67:1671–1696 1679
123

Fig. 4 EDS: Ni (a), oxidized Ni (b), and oxidized/modified Ni–O–M (c)
1680 Polym. Bull. (2011) 67:1671–1696
123

Fig. 5 Diffraction patterns: Ni(a), oxidized Ni (b), andoxidized/modified Ni–O–M (c)
Polym. Bull. (2011) 67:1671–1696 1681
123

nanoparticles, we observe NiO phase (an FCC rock salt structure). The rings here
are smaller and they correspond to larger distance between the planes (the lattice
parameter of Ni is 0.352 nm, while for NiO it is 0. 41 nm).
From the high-resolution TEM (HRTEM) image of a Ni nanoparticle, we
determined a planar distance of 0.23 nm that corresponds to the planes {111} of
NiO with the lattice parameter of 0.41 nm (Fig. 6).
Finally, for the modified Ni particles, we observe the same crystalline structure as
for the oxidized particles.
Thermogravimetric analysis was chosen to evaluate the oxidation process. TGA
diagrams of the samples (Ni, oxidized Ni, and oxidized/modified Ni) are shown in
Fig. 7.
Thermograms of the modified samples show two regions of characteristic weight
loss at &100 and 250 �C. This can be explained by absorbed residues such as water
and solvent as well as by the decomposition of the organic constituent of the grafted
VTMOS. The weight of the oxidized powder remains constant; we infer that Ni
nanoparticles were fully oxidized. Significant differences in thermal behavior
between the unoxidized and oxidized samples are associated with the oxidation
reaction. The Ni nanoparticles begin to show a gain in weight at 200 �C in the
thermogravimetric curve, suggesting that oxidation occurs at this temperature.
Compared to the typical initial oxidation temperature of bulk nickel materials,
&600 �C, the oxidation of nanoparticles occurs at a much lower temperature. A
pronounced change in oxidation kinetics occurs around 490 �C—as observed from
the slope decrease of the TGA curve. The decreased oxidation rate extends toward
higher temperatures before approaching an asymptotically constant value: an
indication of full oxidation of the specimen. The final weight increase of this sample
material is 20.8%, which is somewhat lower than the ideal weight increase of 27.3%
for a completely pure nickel oxidation. As observed from the EDS analysis, typical
Fig. 6 HRTEM image of singleoxidized Ni particle
1682 Polym. Bull. (2011) 67:1671–1696
123

nanoparticle samples contain some initial oxides, presumably a thin layer of
amorphous oxide.
Dispersion of nickel particles
One of the main objects of our work was evaluation of effects of nickel particles
dispersion on the overall material properties. Thermal and mechanical character-
istics depend to a great extent on the matrix–filler interactions at the molecular
scale; as noted by Kopczynska and Ehrenstein, properties of multiphase composites
are to a large extent decided by interfaces [51].
Since a homogeneous dispersion of nickel nanoparticles would be a key factor to
improve the properties of the TPV composites, we decided to investigate the Ni
particles dispersion inside the polymer matrix using the FIB/SEM method [37]. This
technique combines a scanning Ga? focused ion beam (FIB) column with high-
resolution field emission scanning electron microscope (FESEM). FIB/SEM images
of the composites are presented in Fig. 8.
We recall that for controlling Ni nanoparticles dispersion in the TPV matrix, we
used two different blending temperatures. Moreover, in Method 1 (160 �C) we used
dry Ni powder, while in Method 2 (100 �C) we had Ni suspension in CH3OH.
It can be seen from SEM images that morphology of the samples from Method 1
and Method 2 are very different. The first approach did not seem to ensure uniform
dispersion of isolated nanoparticles. From the SEM images, we can see agglom-
eration of Ni particles and formation of &250 nm size clusters for the most of the
samples. However, more uniform particle dispersion was noticed inside the
unvulcanized EPDM ? PP matrix compared to other samples from the same group
in Method 1 (Fig. 9a). The particle agglomerations and formation of Ni clusters can
be observed even for this sample but they are homogeneously distributed inside the
unvulcanized specimen. For the vulcanized composites (Method 1), it was
Fig. 7 TGA scans and derivative curves for the powder
Polym. Bull. (2011) 67:1671–1696 1683
123

challenging to locate particles inside the milled segment; when we found one, it was
a big cluster of the Ni particles. It needs to be noted that the volume of milled
material (10 9 5 9 5 lm) was kept constant for all the samples.
Let us return to the samples from Method 2. Particle dispersion in the TPV matrix
became uniform when filler was added into the molten phase of the EPDM at lower
temperature (100 �C). This fact could be explained by the viscosity of the EPDM
matrix. From the FIB/SEM images of frozen structures, it can be clearly observed
that Ni particles have dispersed better in a more viscous EPDM matrix (lower T),
while lower viscosity (higher T) prevents particle detachment and dispersion—
resulting in an obstacle against their uniform distribution. All the samples from
Method 2 show better particle dispersion compared to the same samples from
Method 1. For the vulcanized samples, it is hard to see that we obtained samples
Fig. 8 FIB/SEM images of thecomposites from Method 1(a) and Method 2 (b):PP/EPDM ? 0.5 wt% Ni (a),PP/EPDM ? 0.5 wt% Ni(CH3OH) (b)
1684 Polym. Bull. (2011) 67:1671–1696
123

where individual &45 nm size particles are interacting with TPV matrix but still
significant improvement was observed.
It was nice to see perfectly dispersed particles inside unvulcanized matrix from
Method 2. In Fig. 9b, we see a homogeneous individual particle dispersion inside
PP ? EPDM matrix.
We plan to do more work to understand the role of viscosity (or rheology and
processing conditions in general) on the nanoparticles dispersion in a various
Fig. 9 FIB/SEM images of the composites from Method 1 (a) and Method 2 (b): PP/EPDM ? 0.5 wt%Ni (a), PP/EPDM ? 0.5 wt% Ni (CH3OH) (b)
Polym. Bull. (2011) 67:1671–1696 1685
123

polymeric phases. There might be other factors affecting particle dispersion; free
volume has been already noted in a different context. The decrease of the free
volume during vulcanization might prevent particle detachment and promote
formation of clusters.
Thermal and mechanical properties and gel content
The DMA and DSC techniques have been used to study the components miscibility
and to determine the effects of the blend composition and Ni particles dispersion on
the properties of our TPV ? Ni hybrids.
EPDM ? PP and their composites were subjected to a controlled sinusoidal
oscillation force, and the resultant mechanical response was measured. The storage
modulus E0, loss modulus E00, and mechanical loss factor (tan d) curves versus
temperature for 1.0 Hz are presented in Fig. 10a–c (symbols and colors are the same
in all figures).
Two separate transitions from a glassy to a rubbery state are visible in the
temperature range from -50 to ?40 �C, corresponding to relaxations of the
individual components. Two distinct peaks indicate the immiscibility of the EPDM
and PP components. After vulcanization of PP with EPDM, the storage and loss
moduli of the system went down while tan d increased. The temperature at which
tan d rapidly increases shifted upwards after curing. This indicates that the EPDM
was crosslinked and the interaction between the EPDM and PP has improved.
EPDM ? PP matrix displays well-known behavior characteristic for immiscible
thermoplastic ? elastomer blends. Below Tg, both polymers are in the glassy state
with a roughly constant modulus. After Tg is reached, a strong decrease in E0 can be
noticed. DMA experiment with 3-point bending fixture fails above Tg due to the
bending of the specimen. By definition, above Tg the material is in the rubbery state
until the material starts to flow; then it behaves as a viscous fluid. In this respect,
DMA technique was helpful to understand the performance of each material in the
glass transition region.
As shown in Fig. 10a, all the composites from Method 2 and uncrosslinked
PP ? EPDM composite from Method 1 maintain higher value of E0 above Tg of PP.
Furthermore, the temperature range in which creep deformation occurred is
increased up to 25 �C for all nanocomposites from Method 2. This phenomenon is
due to the formation of a connective network of Ni particles within the polymer
matrix. The entanglement level of this network and the interactions between the
polymer chains and the nanoparticle surfaces can explain the delay of the material
flowing and the existence of such a wide modulus plateau. Overall, the highest value
of E0 above Tg of PP is seen for unvulcanized PP ? EPDM ? 0.5 wt% Ni sample
from Method 2. For instance, at 40.0 �C, the E0 of this material is 1.6 times higher
than that of the unfilled PP ? EPDM and 1.3 times higher than for the same
composition from Method 1.
As discussed in ‘‘Dispersion of nickel particles’’ section, filler agglomeration and
inhomogeneous dispersion were seen for the composites prepared via Method 1.
1686 Polym. Bull. (2011) 67:1671–1696
123

Fig. 10 DMA diagrams: storage modulus E0 (a), loss modulus E00 (b), and tan d (c)
Polym. Bull. (2011) 67:1671–1696 1687
123

Particles agglomeration decreases material performance because of formation of
voids that act as preferential sites for crack initiation and failure [36].
In terms of thermophysical properties, Tg is one of the most important and useful
material characteristics. Glass transition temperature can be used to determine a
material’s maximum temperature of use. For both fundamental and practical
reasons, it was recommended [52] to define the glass transition temperature (Tg) as
the midpoint of the rapid decrease in the storage modulus E0. Since glass transition
is so important, we used a peak in the loss modulus E00, a peak in tan d as well as the
midpoint of the rapid decrease in the storage modulus E0 to evaluate effects of Ni on
the Tg values of PP and EPDM (Fig. 11).
Among the three methods used, two have shown good and mutually consistent
results. Broad peaks in the loss modulus E00 did not lend themselves to provide
accurate locations of the glass transitions.
Let us return to analyze the effect of Ni content on the transitions. Figure 11 tells
us that Tg values of PP go up in the presence of Ni. The effect is larger when Ni
particles are incorporated at lower temperature in the form of suspension in CH3OH
(Method 2). In the same manner, it can be observed that the Tg of PP in vulcanized
PP ? EPDM system shifted toward higher temperatures. On the other hand, loading
Ni powder at a high temperature (Method 1) in vulcanized matrix of PP ? EPDM
gives rise to a displacement of the Tg peak of PP to lower temperatures. This effect
was more evident when oxidized ? modified Ni powder is incorporated at high
temperature to the vulcanized PP/EPDM system. These results seem to indicate that
during high-temperature blending the chemical (VTMOS) groups of the treated Ni
powder surface underwent decomposition—in turn causing creation of shorter
Fig. 11 Glass transition temperatures from DMA
1688 Polym. Bull. (2011) 67:1671–1696
123

chains by scission. The scission apparently overwhelmed the crosslinking process;
hence, lower Tg values of the polymers.
Since mechanical properties of semicrystalline polymers are influenced by their
crystalline structures, it is pertinent to determine effects of Ni content on
thermophysical properties of the composites. Melting temperatures (Tm), crystal-
lization temperatures (Tc), heats of fusion (Hf), and the percentages of crystallinity
(Xc) were determined in non-isothermal crystallization experiments. The results are
reported in Table 2.
Dynamic crystallization behavior shows the positive effect of the Ni content on
the crystallization kinetics of PP. DSC data confirmed earlier observation [40] about
nucleation ability of cured EPDM. Compared to the neat PP ? EPDM blend, higher
crystallization temperatures were found for all vulcanized PP/EPDM samples and
composites. This phenomenon can be explained by an interaction of the amorphous
portion of the PP with the EPDM. Moreover, a marked increase of the
crystallization peak temperature can be observed when Ni particles are incorporated
in the PP ? EPDM matrix at the lower temperature (Method 2). This effect is more
pronounced when the fillers are oxidized and chemically treated. The results can be
explained by a nucleation ability of the well-dispersed Ni and Ni–O–M particles on
the PP crystallization.
From DSC results, it can be easily noticed that the nanoparticles dispersion
was a key factor to determine the materials thermal properties. Namely, PP/
EPDM ? 0.5 wt% Ni sample from Method 2 was not even crosslinked; however,
compared to other crosslinked or blended samples from Method 1, it showed higher
crystallization and melting point. These results are in an agreement with those
obtained in a morphological study where improved nonoparticles dispersion was
demonstrated by the samples from Method 2. Furthermore, the melting temperature
of the PP phase increased by about 10 �C for the composites from Method 2, while
no changes in the melting point were detected in the samples from Method 1.
As shown in Table 2, values of the crystallinity decrease with the crosslinking.
This can be understood as a result of decreased PP chain mobility due to
crosslinking and increased viscosity of the blends caused by the curing agent. In
addition, we did not observe any remarkable effect of the Ni content on the
Table 2 Thermal properties of the materials
Sample name Tc/�C Hcf/J g-1 Xc/% Tm/�C Hm
f /J g-1 Xc/%
PP/EPDM 84.9 37.9 18.1 143.7 32.0 15.3
PP/EPDM ? 0.5 wt% Ni 86.6 34.5 16.5 143.7 12.6 6.0
VULC PP/EPDM 92.6 29.5 14.1 142.3 12.7 6.1
VULC PP/EPDM ? 0.5 wt% Ni 92.3 31.8 15.2 141.3 11.3 5.4
VULC PP/EPDM ? 0.5 wt% Ni–O–M 91.6 39.2 18.7 142.3 13.4 6.4
VULC PP/EPDM ? 0.5 wt% Ni (CH3OH) 102.6 35.5 17.0 154.7 19.6 9.4
VULC PP/EPDM ? 0.5 wt%
Ni–O–M (CH3OH)
103.6 40.8 19.5 152.7 26.8 12.8
PP/EPDM ? 0.5 wt% Ni (CH3OH) 99.9 42.6 20.4 159.3 25.9 12.4
Polym. Bull. (2011) 67:1671–1696 1689
123

crystallinity of the crosslinked composites from Method 1. All these samples
maintained a crystallinity value similar to the unfilled and crosslinked PP ? EPDM
sample. However, the same composites from Method 2 showed a somewhat
higher crystallization degree of the PP phase. In fact, it can be noticed that two
uncured PP/EPDM blends with 0.5 wt% Ni (from Methods 1 and 2) filler gave
completely different values of the crystallinity. Decreased crystallization of the
PP/EPDM ? 0.5 wt% Ni sample (Method 1) was directly associated with the
dilution effect of the agglomerated Ni particles.
We now return to the strain at break Cb- which is an important parameter and
appears in the definition of material brittleness B [53]; see more on B below.
Young’s modulus E and the strain-at-break values obtained from tensile testing are
summarized in Fig. 12a and b.
Compared to uncured blends, lower moduli E can be seen for all cured
composites. Young modulus value for the vulcanized PP ? EPDM blend is about
2.2 times lower than for unvulcanized PP ? EPDM blend. However, the samples
prepared using DCP as the curing agent provide higher values of Cb- relative to the
uncured PP ? EPDM blends. Clearly, crosslinked compositions should be consid-
ered as thermoplastic rubbers more than as a toughened thermo-
plastic. Uncrosslinked samples exhibit definite plastic behavior and high Young’s
moduli.
The increase in the modulus after filler loading in vulcanized PP ? EPDM
blend shows the same trend as observed from the DMA storage modulus curves.
Young modulus E values of the VULC PP ? EPDM ? 0.5 wt% Ni and VULC
PP ? EPDM ? 0.5 wt% Ni–O–M composites from Method 1 are about 1.2 and
1.4 times higher than E value of the vulcanized PP ? EPDM. Higher modulus
E values are seen for all the composites. However, vulcanized Ni composites
prepared via Method 2 displayed the highest modulus. Moreover, any given
oxidized/modified Ni containing sample (Method 2) had the highest modulus
increment, equal to 195.0 MPa. It can be seen clearly that the treatment of the
nickel powder induced the enhancement of tensile strength from 298 MPa of
VULC PP ? EPDM to 403 and 493 MPa for VULC PP ? EPDM ? 0.5 wt%
Ni–O–M composite from Method 1 and Method 2, respectively. These results can
be explained by improved adhesion between the filler and the polymer interfaces.
The strain at break Cb- value of the vulcanized PP ? EPDM sample increases with
Ni content (Fig. 12b). This can be explained by new free volume pockets in the
material created by the Ni particles added. Brittleness B of materials is defined
[53] as
B ¼ 1= E0Cb-
h ið4Þ
Here E0 pertains to the frequency of 1.0 Hz and the temperature of interest, in the
present case 25 �C. Thus, B takes into account repetitive loading (fatigue in service)
as well as one-time large deformation. A group in Sichuan has shown for multiphase
composites that low B corresponds to high structural integrity [54]. Brittleness can
be connected to several mechanical or tribological properties [55]. We present
B values for our materials in Fig. 13.
1690 Polym. Bull. (2011) 67:1671–1696
123
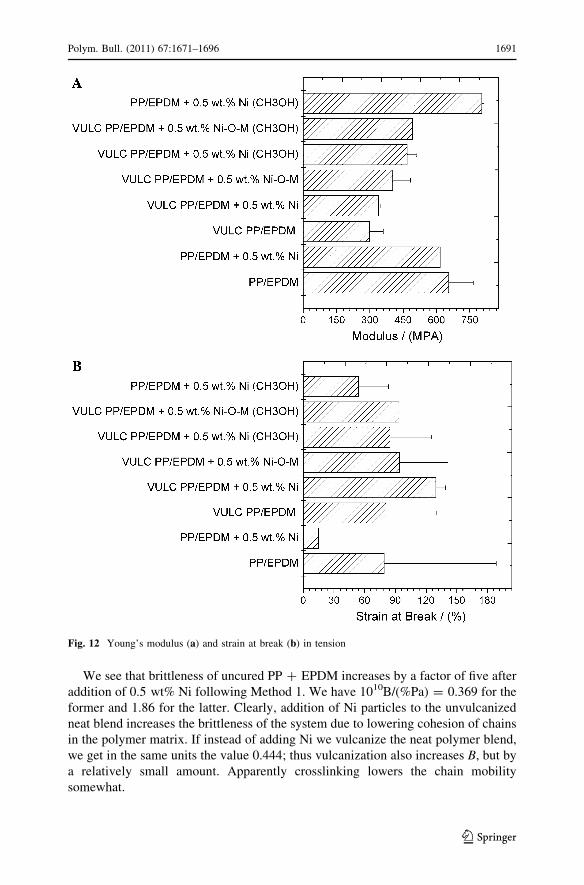
We see that brittleness of uncured PP ? EPDM increases by a factor of five after
addition of 0.5 wt% Ni following Method 1. We have 1010B/(%Pa) = 0.369 for the
former and 1.86 for the latter. Clearly, addition of Ni particles to the unvulcanized
neat blend increases the brittleness of the system due to lowering cohesion of chains
in the polymer matrix. If instead of adding Ni we vulcanize the neat polymer blend,
we get in the same units the value 0.444; thus vulcanization also increases B, but by
a relatively small amount. Apparently crosslinking lowers the chain mobility
somewhat.
Fig. 12 Young’s modulus (a) and strain at break (b) in tension
Polym. Bull. (2011) 67:1671–1696 1691
123

Consider now the process of adding Ni combined with vulcanization and with
nickel modification. We thus achieve the lowest value of all, 1010B/(%Pa) = 0.271,
that is 27% less than the original unvulcanized blend without nickel. We recall that
the same material has the largest elongation at break Cb- : Mechanical properties of
PBMs are strongly dependent on free volume [2]. Filler particles added can go into
existing free volume spaces between chains thus reinforcing the material and
resulting in higher values of mechanical properties—as seen in the values of the
tensile modulus E and the storage modulus E0. On the other hand, our Ni particles
can locally ‘‘push aside’’ some fragments of crosslinked chains—thus creating new
free volume pockets as already noted above. It is this second scenario which seems
to provide an enhanced capability of the crosslinked chains to extend—reflected in
an increase of the elongation at break Cb- : Thus, both types of locations of incoming
filler particles contribute to lowering the brittleness.
We recall now the results of Khumalo et al. [56]: well-dispersed Boehmite has
increased Cb- of high density polyethylene (HDPE). Addition of Boehmite clearly
lowers brittleness of HDPE since both Cb- and E0 increase with respect to the neat
polymer.
As noted above, mechanical properties of the composites are strongly dependent
on the materials composition, the particles dispersion and the interaction (or
adhesion) between the filler–matrix interfaces. Another important parameter
determining performance of dynamic vulcanized thermoplastic-elastomer-based
composites is the crosslink density. Modulus, hardness, tear, tensile strength, creep,
and relaxation all depend strongly on the crosslink density n.
We have performed equilibrium swelling measurements in cyclohexane. In
principle, n should be independent of the solvent. In practice, minor variations are
observed [57]. We have calculated n from swelling results as follows:
n ¼ � ln 1 � fps
� �þ fps þ cfps
� �= V1 fps � wf 5=3
ps
� �h i: ð5Þ
Fig. 13 Brittleness
1692 Polym. Bull. (2011) 67:1671–1696
123

Here fps is the volume fraction of the polymer at swelling equilibrium; clearly in the
dry state fps = 1; c the Flory–Huggins–Staverman (polymer ? liquid) interaction
parameter; V1 the molar volume of the solvent; w an entropic volume factor = 2/f,where f is the functionality. The functionality of a monomer molecule is the number
of functional groups which participate in the polymerization. Monomers with
functionality greater than two will introduce branching into a polymer, and the
degree of polymerization will depend on the average functionality per monomer
unit.
We have used c = 0.420, a value for PP ? cyclohexane, assuming that the
presence of EPDM does not significantly affect this value. V1 = 108.10 cm3 mol-1
for cyclohexane; f = 4.
The gel content and adsorbed solvent of the samples are shown in Fig. 14.
Fig. 14 (a, b) Gel content and absorbed solvent
Polym. Bull. (2011) 67:1671–1696 1693
123

It can be seen from Fig. 14 that the DCP curing agent exhibits good chemical
activity for all vulcanized blends. Almost fully crosslinked composites
(&98.0 wt%) were obtained using 1.0 wt% DCP as a crosslinking agent. The gel
content analysis revealed a higher degree (&99.0 wt%) of crosslinking for the
composites from Method 2. A decreased value of the solvent uptake indicates also
an increase of crosslink density for the vulcanized samples from Method 2. The gel
content and adsorbed solvent amount are related to the crosslinking degree. Both
parameters demonstrated significant differences between two sets of the samples
from Methods 1 and 2, respectively. All the samples from Method 1 show higher
amount of gel content and increased amount of adsorbed solvent. Furthermore, we
noticed that, after the addition of nickel particles into PP ? EPDM matrix, the
amount of the extracted gel decreased from some 12.0 wt% (uncured PP ? EPDM)
to 6.0 wt% (uncured PP ? EPDM ? 0.5 wt% Ni) (Fig. 14b). These results indicate
that nickel particles act as compatibilization sites. The role of a compatibilizer in a
polymer alloy or blend is to improve interfacial adhesion between two immiscible
polymers, resulting in the formation of miscible blends. The addition of the
compatibilizers results in a decreased domain size of the dispersed phase,
stabilization of the dispersed phase during melt mixing, and an improved interfacial
adhesion in the solid state. In our PP ? EPDM polymers, the nanosized Ni particles
provide stabilization energy for compatibilization. Also the intercalation of the
polymers with the Ni particles, along with a very high surface area per unit weight
of the Ni particles, further helped in compatibilization. The addition of Ni particles
also helped to increase the melt viscosity, which further reduced the size of the Ni
agglomerates. New multifunctional TPE ? 0.5 wt% Ni nanocomposites eliminate
oxidation and corrosion problems—while providing much stronger and less brittle
materials than neat TPE.
Acknowledgments We appreciate discussions with Olena Astahova, Michael Bratychak, Volodymyr
Donchak, and Olena Shyshchak, all at Lvivska Politechnika National University; with Georg Broza and
Karl Schulte, Technical University of Hamburg; with Victor Castano and J. Rogelio Rodriguez, National
Autonomous University of Mexico, Queretaro; with Helena Janik, Technical University of Gdansk; with
Aglaia Vassilikou-Dova and Ioannis Kalogeras, University of Athens; and also with Tomasz Sterzynski,
Poznan University of Technology.
References
1. Friedrich K, Lu Z, Hager AM (1995) Recent advances in polymer composites tribology. Wear
190:139–144
2. Brostow W (2009) Reliability and prediction of long term performance of polymer-based materials.
Pure Appl Chem 81:417–420
3. Bobadilla-Sanchez EA, Martınez-Barrera G, Brostow W, Datashvili T (2009) Effects of polyester
fibers on gamma irradiation on mechanical properties of polymer concrete containing CaCO3 and
silica sand. Express Polym Lett 3:615–620
4. Brostow W (ed) (2000) Performance of plastics. Hanser, Munich/Cincinnati
5. Rabello M (2000) Aditivacao de Polimeros. Artliber, Sao Paulo
6. El-Tayeb NSM, Yousif BF (2007) Evaluation of glass fibre reinforced polyester composite for multi-
pass abrasive wear applications. Int J Wear 262:1140–1151
7. Vu YT, Mark JE, Pham LH, Engelhardt M (2001) Clay nanolayer reinforcement of cis-1,4-poly-
isoprene and epoxidized natural rubber. J Appl Polym Sci 82:1391–1403
1694 Polym. Bull. (2011) 67:1671–1696
123

8. Brostow W, Keselman M, Mironi-Harpaz I, Narkis M, Peirce R (2005) Effects of carbon black on
tribology of blends of poly(vinylidene fluoride) with irradiated and non-irradiated ultrahigh molec-
ular weight polyethylene. Polymer 46:5058–5064
9. Briscoe BJ, Yao LH, Stolarski TA (1986) The friction and wear of polytetrafluoroethylene poly(ether
ether ketone) composites: an initial appraisal of the optimum composition. Wear 108:357–374
10. Carrion FJ, Arribas A, Bermudez MD, Guillamon A (2008) Physical and tribological properties of a
new polycarbonate-organoclay nanocomposite. Eur Polym J 44:968–977
11. Gatos KG, Thomann R, Karger-Kocsis J (2004) Characteristics of ethylene propylene diene mono-
mer rubber/organoclay nanocomposites resulting from different processing conditions and formu-
lations. Polym Int 53:1191–1197
12. Chow WS, Mohd Ishar ZA, Karger-Kocsis J (2005) An atomic force microscopy study on the blend
morphology and clay dispersion in polyamide-6 polypropylene/organoclay system. J Polym Sci B
43:1198–1204
13. Karger-Kocsis J, Shang PP, Mohd Ishak ZA, Rosch M (2007) Melting and crystallization of in situ
polymerized cyclic butylene terephthalates with and without organoclay: a modulate DSC study.
Express Polym Lett 1:60–68
14. Gatos KG, Kameo K, Karger-Kocsis J (2007) On the friction and sliding wear of rubber/layered
silicate nanocomposites. Express Polym Lett 1:27–31
15. Pegoretti A, Dorigato A, Penati A (2007) Tensile mechanical response of polyethylene-clay nano-
composites. Express Polym Lett 1:123–131
16. Varghese S, Karger-Kocsis J, Gatos KG (2003) Melt compounded epoxidized natural rubber/layered
silica nanocomposites: structure–properties relationships. Polymer 44:3977–3983
17. Wang K, Zhao P, Yang S, Liang S, Zhang Q, Du R, Fu Q, Yu Z, Chen E (2002) Unique clay
orientation in the injection-molded bar of isotactic polypropylene/clay nanocomposite. Polymer
47:7103–7110
18. Brostow W, Pietkiewicz D, Wisner SR (2007) Polymer tribology in safety medical devices:
retractable syringes. Adv Polym Technol 26:56–64
19. Brostow W, Bujard B, Cassidy PE, Venumbaka S (2004) Epoxy ? fluoropolymer systems: nanoscale
surface organization and scratch resistance. Int J Polym Mater 53:1045–1050
20. Brostow W, Datashvili T (2007) Miscibility and thermal properties of blends of melamine–form-
aldehyde resin with low density polyethylene. Mater Res Innovat 11:127–130
21. Kalogeras M, Roussos M, Christakis I, Spanoudaki A, Pietkiewicz D, Brostow W, Vassilikou-Dova
A (2005) Dielectric properties of cured epoxy resin ? poly (ethylene oxide) blends. J Non-Cryst
Solids 351:2728–2734
22. Nogales A, Broza G, Roslaniec Z, Schulte K, Sics I, Hsiao BS, Sanz A, Garcia-Gutierrez MC, Rueda
DR, Domingo C, Ezquerra TA (2004) Low percolation threshold in nanocomposites based on oxi-
dized single wall carbon nanotubes and poly(butylene terephthalate). Macromolecules 37:7669–7673
23. dos Santos DS Jr, Goulet PJG, Pieczonka NPW, Oliveira ON Jr, Aroca JR (2004) Gold nanoparticle
embedded, self-sustained chitosan films as substrates for surface-enhanced Raman scattering.
Langmuir 20:10273–10277
24. Koo JH (2006) Polymer nanocomposites: processing, characterization, and applications. McGraw-
Hill, New York, NY, pp 19–26
25. Giraldo LF, Brostow W, Devaux E, Lopez BL, Perez LD, Leon D (2008) Scratch and wear resistance
of polyamide 6 reinforced with multiwall carbon nanotubes. J Nanosci Nanotechnol 8:3176–3183
26. Luo ZP, Koo JH (2008) Quantification of the layer dispersion degree in polymer layered silicate
nanocomposites by transmission electron microscopy. Polymer 49:1841–1852
27. Broza G, Schulte K (2008) Melt processing and filler/matrix interphase in carbon nanotube reinforced
poly(ether-ester) thermoplastic elastomer. Polym Eng Sci 48:2033
28. Brostow W, Chonkaew W, Datashvili T, Menard KP (2009) Tribological properties of
epoxy ? silica hybrid materials. J Nanosci Nanotechnol 9:1916–1922
29. Blanksi R, Koo JH, Ruth P, Nguyen H, Pittman C, Phillips S (2004) Polymer nanostructured
materials for solid rocket motor insulation—ablation performance. In: Proceedings of the 52nd
JANNAF propulsion meeting (CPIAC’04), Columbia, MD
30. Naderi G, Lafleur PG, Dubois C (2008) The influence of matrix viscosity and composition on the
morphology, rheology, and mechanical properties of thermoplastic elastomer nanocomposites based
on EPDM/PP. Polym Compos 29:1301–1309
31. Ho WK, Koo JH, Ezekoye OA (2010) Thermoplastic polyurethane elastomer nanocomposites:
morphology, thermophysical, and flammability properties. J Nanomater doi:10.1155/2010/583234
Polym. Bull. (2011) 67:1671–1696 1695
123

32. Foks J, Janik H (1989) Microscopic studies of segmented urethanes with different hard segment
content. Polym Eng Sci 29:113–119
33. Rutkowska M, Krasowska K, Heimowska A, Steinka I, Janik H (2002) Degradation of polyurethanes
in sea water. Polym Degrad Stabil 76:233–239
34. Janik H, Pałys B, Petrovic ZS (2003) Multiphase-separated polyurethanes studied by micro-Raman
spectroscopy. Macromol Rapid Commun 24:265–268
35. Brostow W, Buchman A, Buchman E, Olea-Mejıa O (2008) Micro hybrids of metal powder incor-
porated in polymeric matrices: friction, mechanical behavior, and microstructure. Polym Eng Sci
49:1977–1981
36. Brostow W, Simoes R (2005) Tribological and mechanical behavior of metals and polymers simu-
lated by molecular dynamics. J Mater Educ 27:19–28
37. Brostow W, Gorman BP, Olea-Mejia O (2007) Focused ion beam milling and scanning electron
microscopy characterization of metal ? polymer hybrids. Mater Lett 61:1333–1336
38. Coran AY (1987) Thermoplastic rubber-plastic blends. In: Bhowmick AK, Stephens HL (eds)
Handbook of elastomer-new development and technology. Marcel Dekker, New York, pp 249–313
39. Brostow W, Datashvili T, Strate GW, Lohse DJ (2009) Ethylene-propylene-diene monomer elasto-
mers. In: Mark JE (ed) Polymer data handbook, 2nd edn. Oxford University Press, Oxford,
pp 155–162
40. Brostow W, Datashvili T, Hackenberg KP (2010) Effect of different types of peroxides on properties
of vulcanized EPDM ? PP blends. Polym Compos 31:1678–1691
41. Brostow W, Datashvili T, Geodakyan J, Lou J (2011) Thermal & mechanical properties of EPDM/
PP ? thermal shock-resistant ceramic composites. J Mater Sci 46:2445–2455
42. Song P, Wen D, Guo ZX, Korakianitis T (2008) Oxidation investigation of nickel nanoparticles. Phys
Chem Chem Phys 10:5057–5065
43. Karmhag R, Niklasson G, Nygren M (2001) Oxidation kinetics of nickel nanoparticles. J Appl Phys
89:3012–3017
44. Niklasson G, Karmhag R (2003) Oxidation kinetics of metallic nanoparticles. Surf Sci
532–535:324–327
45. Menard KP (2000) Thermal transitions and their measurement. In: Brostow W (ed) Performance of
plastics, Chap. 8. Hanser, Munich/Cincinnati
46. Lucas EF, Soares BG, Monteiro E (2001) Caracterizacao de Polımeros. e-papers, Rio de Janeiro
47. Gedde UW (2001) Polymer physics. Springer, Dordrecht/Boston
48. Mandelkern L, Alamo RG (2007) Thermodynamic quantities governing melting. In: Mark JE (ed)
Physical properties of polymers handbook, 2nd edn. Springer, New York, pp 165–186
49. Hedenqvist MS, Gedde UW (1999) Parameters affecting the determination of transport kinetics data
in highly swelling polymers above Tg. Polymer 40:2381–2393
50. Yoldas BE (1975) Alumina sol preparation from alkoxides. Ceram Bull 54:289–290
51. Kopczynska A, Ehrenstein GW (2007) Polymeric surfaces and their true surface tension in solids and
melts. J Mater Educ 29:325–340
52. Brostow W, Deshpande S, Pietkiewicz D, Wisner SR (2009) Accuracy in locating glass transitions:
aging and gamma sterilization of vulcanized thermoplastic elastomers. e-Polymers 109
53. Brostow W, Hagg Lobland HE, Narkis M (2006) Sliding wear, viscoelasticity, and brittleness of
polymers. J Mater Res 21:2422–2428
54. Shen J, Wang M, Li J, Guo S, Xu S, Zhang Y, Li T, Wen M (2009) Simulation of mechanical
properties of multilayered propylene–ethylene copolymer/ethylene 1-octene copolymer composites
by equivalent box model and its experimental verification. Eur Polym J 45:3269–3281
55. Brostow W, Hagg Lobland HE, Narkis M (2011) The concept of materials brittleness and its
applications. Polym Bull 59. doi:10.1007/s00289-011-0573-1
56. Khumalo VM, Karger-Kocsis J, Thomann R (2011) Polyethylene/synthetic boehmite alumina
nanocomposites: structure, mechanical, and perforation impact properties. J Mater Sci 46:422–428
57. Flory PJ (1953) Principles of polymer chemistry. Cornell University Press, Ithaca, NY
1696 Polym. Bull. (2011) 67:1671–1696
123
Copyright © 2022 FDOKUMEN