Crosslinkable polyester/isocyanate compositions suitable for ...
Upload
khangminh22Category
view
5download
0
Fashion Industry Charter for Climate Action | Raw Materials Working Group | Fashion Industry Charter for Climate Action | Raw Materials Working Group
Fashion Industry Charter for Climate Action | Raw Materials Working Group | Fashion Industry Charter for Climate Action | Raw Materials Working Group
1
PHASE 1 (PART I): Identifying Low Carbon Sources of Cotton and Polyester Fibers
FASHION INDUSTRY CHARTER FOR CLIMATE ACTION
Global Climate Action

Fashion Industry Charter for Climate Action | Raw Materials Working Group | Fashion Industry Charter for Climate Action | Raw Materials Working Group
Fashion Industry Charter for Climate Action | Raw Materials Working Group | Fashion Industry Charter for Climate Action | Raw Materials Working Group
2
Acknowledgements:
We would like to express our thanks to those who contributed in this report with their time and expertise.
Karla Magruder, Accelerating Circularity, Textile Exchange Christian Schuster, Lenzing Thomas Matiz, Lenzing Umar Faruk Chowdhury, Sateri Jeremy Lardeau, Sustainable Apparel Coalition Kate Riley, adidas Heinz Zeller, Hugo Boss Alex Carlson, New Balance Georgia Parker, Fashion for Good Debra Guo, Stella McCartney Liesl Truscott, Textile Exchange Kathleen Rademan, Fashion for Good Cyndi Rhoades, Worn Again Harald Cavalli-Björkman, Renewcell Amanda Carr, Canopy Maurizio Crippa, Gr3n
Report Authors:
Aditi Suresh | Life Cycle Assessment Practitioner II| SCS Global Services Lila Taheraly | Life Cycle Assessment Associate | SCS Global Services UN FICCA Raw Material Working Group
Reviewers:
Keith Killpack | Technical Director | SCS Global Services Claire Bergkamp | COO | Textile Exchange Karla Magruder | CEO | Fabrikology Matilde Faria | Aquitex Diana Rosenberg | Gap Inc.
Special Thanks for Contributions:
Raw Material Working Group of the Fashion Industry Charter for Climate Action Fashion Charter Signatories and Supporting Organizations
The opinions expressed and arguments employed herein do not necessarily reflect the official views of UN Climate Change, as convener of the Fashion Industry Charter for Climate Action. This document and any map included herein are without prejudice to the status of or sovereignty over any territory, to the delimitation of international frontiers and boundaries and to the name of any territory, city or area.
This publication is issued for public information purposes and is not an official text of the Convention in any legal or technical sense. Unless otherwise noted in captions or graphics all matter may be freely reproduced in part or in full, provided the source is acknowledged.
In this publication, “UN Climate Change” refers to the secretariat to the United Nations Framework Convention on Climate Change (UNFCCC or Convention), the Kyoto Protocol and the Paris Agreement, and their bodies, institutional arrangements and organs.

Fashion Industry Charter for Climate Action | Raw Materials Working Group | Fashion Industry Charter for Climate Action | Raw Materials Working Group
Fashion Industry Charter for Climate Action | Raw Materials Working Group | Fashion Industry Charter for Climate Action | Raw Materials Working Group
3
PHASE 1 (PART I): Identifying Low Carbon Sources of Cotton and Polyester Fibers
Fashion Industry Charter for Climate Action

Fashion Industry Charter for Climate Action | Raw Materials Working Group | Fashion Industry Charter for Climate Action | Raw Materials Working Group
Fashion Industry Charter for Climate Action | Raw Materials Working Group | Fashion Industry Charter for Climate Action | Raw Materials Working Group
4
Table of Contents
List of Figures 06
List of Tables 08
Terminology Used in this Report 10
Acronyms 12 Executive Summary – 15 Cotton and Polyester, Part I Introduction 18
Appendices 138
A.1 Methodology for Literature Review 138
A.2 Literature Review Criteria 139
A.3 Data Sources and References 143

Fashion Industry Charter for Climate Action | Raw Materials Working Group | Fashion Industry Charter for Climate Action | Raw Materials Working Group
Fashion Industry Charter for Climate Action | Raw Materials Working Group | Fashion Industry Charter for Climate Action | Raw Materials Working Group
5
Scope01 21
Collected Information
Key Gaps
Recommendations Based on Current Knowledge
Next Steps with Existing Materials
Potential for New Fibers
Request from Industry/ How to Partecipate
02 25
03 105
04
05
06
07
113
132
134
136

Fashion Industry Charter for Climate Action | Raw Materials Working Group | Fashion Industry Charter for Climate Action | Raw Materials Working Group
Fashion Industry Charter for Climate Action | Raw Materials Working Group | Fashion Industry Charter for Climate Action | Raw Materials Working Group
6
Figure 1. System boundary of assessment for different types of cotton and polyester (PET).
Figure 2. Top seven (7) cotton producing countries in 2017/2018, by cotton type.
Figure 3. Cotton lint production and yield statistics for top seven (7) cotton producing countries from 2012-2018.
Figure 4. Organic cotton production based on review of existing LCA studies. Note that the X-axis shows the magnitude of variation and does not represent the GHG impact values. This chart shows the regional variability of organic cotton production within India. Section 3.2.1.2 illustrates the key process contributors to GHG emissions. It can be inferred that the impacts of Tajikistan seem higher compared to other regions due to the modeling choice of assigning burden to compost production. All other organic cotton LCA studies treat compost as a waste product irrespective of whether the farmer owns the cattle or purchases it off-site. Refer to Section 3.2.2.6.1 and Section 2.1.5 for more details on modeling organic fertilizers. Table 32 provides the list of data sources included in the scope.
Figure 5. Conventional cotton production based on review of existing LCA studies. Note that the X-axis shows the magnitude of variation and does not represent the GHG impact values. This chart shows the regional variability of conventional cotton production within countries like USA, Australia and India. Table 32 provides the list of data sources included in the scope.
Figure 6. Better Cotton production (BCI) based on review of existing LCA studies. Note that the X-axis shows the magnitude of variation and does not represent the GHG impact values. This chart shows the regional variability of BCI cotton production within India. Section 3.2.1.2 illustrates the key process contributors to GHG emissions. Table 32 provides the list of data sources included in the scope.
Figure 7. Mechanically recycled cotton production based on review of existing LCA studies. Note that the X-axis shows the magnitude of variation and does not represent the GHG impact values. Table 32 provides the list of data sources included in the scope.
Figure 8. CmiA cotton production based on review of existing LCA studies. Note that the X-axis shows the magnitude of variation and does not represent the GHG impact values. Section 3.2.1.2 illustrates the key process contributors to GHG emissions. Table 32 provides the list of data sources included in the scope.
Figure 9. Examples of Soil Organic Carbon Sequestration potential per hectare per year for regenerative cotton farming practices in USA. Refer to Section 3.2.5.2 for more details.
Figure 10. GHG impacts correlated with yields, based on water requirements, by region and cotton type.
Figure 11. PET producing countries. China, India, Taiwan, USA, Japan and Germany are the leading producers of virgin PET. Mechanically recycled PET is produced on a commercial scale in China, India, Japan, South Korea, USA and Europe (Italy, Spain, Ireland and Germany). Chemically recycled PET is commercially produced in China, Japan, USA, Taiwan and India.
Figure 12. This chart is based on Higg MSIv3.0 scores currently made available for different types of PET. Note that this chart does not represent the GHG impact results.
Figure 13. This chart illustrates the GHG profile of three forms of PET: chips, staple fiber and filament yarn for varying grades and disaggregated by type of feedstock (oil based and recycled) and region. Data is also reported for alternative feedstock of PET such as steel mill waste gas and bio-based. The GHG performance depends on the synthesis pathway, feedstock properties and the location of processing PET. Table 33 provides a list of data sources reviewed for PET.
Figure 14. This chart was created based on the data published in Masnadi et.al; (2018). The global volume-weighted average GHG intensity of refined crude oil estimate is ~17 g CO2eq./MJ refined crude oil, with country-level emissions ranging from 7 to 35 g CO2eq./MJ. The chart accounts for global volume-weighted average
23
28
29
31
32
32
33
33
42
62
76
76
78
81
List of Figures

Fashion Industry Charter for Climate Action | Raw Materials Working Group | Fashion Industry Charter for Climate Action | Raw Materials Working Group
Fashion Industry Charter for Climate Action | Raw Materials Working Group | Fashion Industry Charter for Climate Action | Raw Materials Working Group
7
estimates for four types of refineries listed in Table 23. The GHG intensity is calculated using IPCC (2013) GWP-100. Assuming an average input of 1.1 kg crude oil input per kg of naphtha and a yield of 7% of naphtha at the oil refinery, the GHG intensity of naphtha is likely to range between 0.24 kg CO2e/kg naphtha to 1.4 kg CO2e/kg naphtha depending on the origin of crude oil extraction. The country-level emissions of crude oil extraction and transport varies by a factor of 7 ranging from 3.3 to 20.3 g CO2eq./MJ crude oil due to the following factors: crude oil compostition (sweet/sour), age and location of refinery, feedstock intake flexibility and differences in refinery configurations. Gas flaring practices have a considerable influence on the emissions. Crude oil producers with above-average GHG intensity, such as Algeria, Iraq, Nigeria, Iran, and the U.S., have higher GHG intensities due to gas flaring. Refer to Section 3.3.2.2.1 for detailed discussion on factors affecting GHG impacts in the upstream value chain of PET production.
Figure 15. Key stages involved in virgin PET, mechanical PET and chemically recycled PET.
Figure 16. Process flow chart for virgin PET chip production (pre-spinning stage).
Figure 17. Process flow chart depicting melt spinning process for PET fibers.
Figure 18. GHG intensity of terephthalic acid (PTA) and key process contributors to Purified Terephthalic Acid (PTA). Data for Europe is based on Plastics Europe (2016 dataset) and Chinese manufacturer. PTA production in USA is based on NAPCOR’s 2020 LCA report on PET production and data is modeled using primary data representing 2018 calendar year production. The regional differences in PTA production can be attributed to the differences in crude oil and natural gas market mix.
Figure 19. GHG intensity of ethylene glycol production and key process contributors to Monoethylene Glycol (MEG). Data for Europe is based on Plastics Europe (2014 dataset) and European manufacturer. MEG production in USA is based on NAPCOR’s 2020 LCA report on PET production and MEG is modeled using primary data representing 2018 calendar year production. The regional differences in MEG production can be attributed to the differences in crude oil and natural gas market mix. USA has a higher share of ethylene produced via fractionation of natural gas liquids, which is lower in GHG impacts compared to crude-oil based steam cracker products.
Figure 20. Global oil and gas basins, and oil production (Adapted from: <https://maps.fractracker.org/3.13/?appid=8e72a974af4c4fe9ba6875cee03078ee>). EIA estimates that 49% of crude oil reserves are located in the Middle East, followed by South America (20%), Canada (10%), Africa (8%) and Russia (7%).
Figure 21. 2018crude oil flows representing nearly 65% of the market volume [Adapted from Resource Trade.Earth]. Saudi Arabia, Russia, UAE, Iraq and Canada were the top 5 exporters of crude oil in 2018 while China, USA, India and Japan were the top importers of crude oil.
Figure 22. This chart was created based on the data published in Masnadi et.al; (2018). The global volume-weighted average GHG intensity estimate is 10.3 g CO2eq./MJ crude oil extracted, with country-level emissions ranging from 3.3 to 20.3 g CO2eq./MJ crude oil. It accounts for GHG emissions from exploration, drilling and development, production and extraction, surface processing, and transport to the refinery inlet. The GHG intensity is calculated using IPCC (2013) GWP-100. Gas flaring practices have a considerable influence on the emissions. Crude oil producers with above-average GHG intensity, such as Algeria, Iraq, Nigeria, Iran, and the U.S., have higher GHG intensities due to gas flaring.
Figure 23. This chart was created based on the data published in Masnadi et.al; (2018). The global volume-weighted average GHG intensity estimate is ~7 g CO2eq./MJ refined crude oil, with country-level emissions ranging from 3 to 10 g CO2eq./MJ. It accounts for global volume-weighted average estimates for four types of refineries listed in Table 23. The GHG intensity is calculated using IPCC (2013) GWP-100. Assuming an average input of 1.1 kg crude oil input per kg of naphtha and a yield of 7% of naphtha at the oil refinery, the GHG intensity of naphtha is likely to range between 0.24 kg CO2e/kg naphtha to 1.4 kg CO2e/kg naphtha depending on the origin of crude oil extraction.
Figure 24. Key process contributors to GHG impacts from p-xylene production (used for PTA production) and ethylene production (used for MEG production). This contribution charts presents the petrochemical feedstock for steam cracker utilizing naphtha for both p-Xylene (around 86% naphtha) and ethylene (at least 74% naphtha) production.
Figure 25. Global PET bottle recycling rates based on data availability. 2016 recycling statistics are based on data reported in literature and 2017 statistics are based on data reported by National Association of PET Container Resources (NAPCOR).
82
83
84
86
87
89
91
91
93
95
97

Fashion Industry Charter for Climate Action | Raw Materials Working Group | Fashion Industry Charter for Climate Action | Raw Materials Working Group
Fashion Industry Charter for Climate Action | Raw Materials Working Group | Fashion Industry Charter for Climate Action | Raw Materials Working Group
8
Table 1. Scope of literature review for cotton and polyester.
Table 2. Scope of literature review for cotton and polyester. Table 30 and Table 31 in the Appendix summarize the literature review criteria in detail.
Table 3. Scope of assessment for cotton, by type and country
Table 4. Qualitative Cotton Matrix evaluating the effects of various environmental and agronomic factors on yield, fiber quality, soil health, water use efficiency and GHG impacts, by country and cotton type. (CC: Conventional cotton; OC: Organic cotton; BCI: Better Cotton Initiative; CmiA: Cotton made in Africa, RA: Regenerative Agriculture; RC: Mechanically Recycled Cotton)
Table 5. Yield statistics by region and cotton type (CC: Conventional cotton; OC: Organic cotton; BCI: Better Cotton Initiative; CmiA: Cotton made in Africa).
Table 6. List of cotton species and cultivars grown by type and by country and region. (CC: Conventional cotton; OC: Organic cotton; BCI: Better Cotton Initiative; CmiA: Cotton made in Africa).
Table 7. Cotton farm size, by country. [Small: <5hectares; Medium: 5-20 hectares; Large: >20 hectares).
Table 8. Comparison of soil types and properties.
Table 9. Soil conditions by region and cotton type. (CC: Conventional cotton; OC: Organic cotton; BCI: Better Cotton Initiative; CmiA: Cotton made in Africa).
Table 10. Land preparation/tillage practice by country, region and cotton type. (CC: Conventional cotton; OC: Organic cotton; BCI: Better Cotton Initiative; CmiA: Cotton made in Africa).
Table 11. Seed planting method and seed application rate, by country and cotton type. (CC: Conventional cotton; OC: Organic cotton; BCI: Better Cotton Initiative; CmiA: Cotton made in Africa).
Table 12. National average nitrogen fertilizer application rates based on country and region.
Table 13. Comparison of different irrigation systems and efficiencies
Table 14. Water requirements specified by country and cotton type. (CC: Conventional cotton; OC: Organic cotton; BCI: Better Cotton Initiative; CmiA: Cotton made in Africa).
Table 15. Cropping system by cotton type and country (CC: Conventional cotton; OC: Organic cotton; BCI: Better Cotton Initiative; CmiA: Cotton made in Africa).
Table 16. Typical harvesting practice, by country and cotton type. (CC: Conventional cotton; OC: Organic cotton; BCI: Better Cotton Initiative; CmiA: Cotton made in Africa).
Table 17. Ginning technology and average electricity consumption per metric ton of ginned fiber.
Table 18. Ginning technology and average electricity consumption per metric ton of ginned fiber.
Table 19. Soil health and land management practices defined in the Regenerative Organic Certification process.
List of Tables
22
26
28
38
43
45
47
49
49
52
55
57
59
60
63
66
68
68
70

Fashion Industry Charter for Climate Action | Raw Materials Working Group | Fashion Industry Charter for Climate Action | Raw Materials Working Group
Fashion Industry Charter for Climate Action | Raw Materials Working Group | Fashion Industry Charter for Climate Action | Raw Materials Working Group
9
Table 20. Summary of studies on Soil Organic Carbon (SOC) sequestration potential
Table 21. Scope of assessment for PET, by type and region.
Table 22. Plastics Europe upstream value chain modeling assumptions for crude oil and natural gas extraction.
Table 23. Average GHG intensity by refinery type (adapted from Masnadi, M.S et.al (2018)), in order of complexity. Note that not all processes are applicable to naphtha production.
Table 24. Feedstock for PET feedstock production.
Table 25. Typical yields of steam cracker products from naphtha and ethane feedstocks.
Table 26. Overview of methods to evaluate field emissions from fertilizer application and improve on existing methods used in LCA.
Table 27. Overview of methods to evaluate soil organic carbons stocks emissions and improve on existing methods used in LCA.
Table 28. Comparison of product biogenic carbon storage reporting requirements of three common product carbon footprint standards/guidance documents for cradle-to-gate scope.
Table 29. Precision technologies used in 2015.
Table 30. Literature review criteria for Cotton LCA studies.
Table 31. Literature review criteria for PET LCA studies.
Table 32. Data sources reviewed for Cotton. (CC: Conventional Cotton; OC: Organic Cotton; BCI: Better Cotton; RC: Mechanically recycled cotton; RA: Regenerative Agriculture; X: data is included in the scope of the review).
Table 33. Data sources reviewed for PET
73
75
89
92
94
102
115
117
120
123
135
137
139
145

Fashion Industry Charter for Climate Action | Raw Materials Working Group | Fashion Industry Charter for Climate Action | Raw Materials Working Group
Fashion Industry Charter for Climate Action | Raw Materials Working Group | Fashion Industry Charter for Climate Action | Raw Materials Working Group
10
Term Definition
Allocation Partitioning the inputs to or emissions from a shared process or a product system between the product
system under study and one or more other product systems
Background Unit
Processes (or Background
System)
Unit processes not specific to the product system under study, including those processes upstream and/or
downstream where many suppliers are involved.
Carbon dioxide
equivalent (CO2e)
Unit for comparing the radiative forcing of a GHG to that of carbon dioxide (ISO 14067: 2018)
Category Indicator Quantifiable representation of an impact category [Ref. ISO-14044] (Also referred to as “Impact Category Indicator,” or simply, “Indicator.”)
Comparative Assertion Environmental claim regarding the superiority or equivalence of one product versus a competing product
that performs the same function. [Ref: ISO 14044]
Cradle-to-gate A scope which includes the life cycle stages from raw material extraction through production of a product.
Cradle-to-grave A scope which includes all life cycle stages from raw material extraction through end-of-life.
Data Quality Characteristics of data that relate to their ability to satisfy stated requirements [Ref: ISO 14044].
Deforestation The conversion of forest to other land use or the permanent reduction of the tree canopy cover below a
defined minimum canopy cover threshold (FAO 2016)
Deficit irrigation Deficit Irrigation is defined as deliberate and systematic under-irrigation of crops
Effect A change to human health or the environment.
Emission Factor A factor that converts activity data into GHG emissions data
Functional Unit Quantified performance of a product system for use as a reference unit. [Ref. ISO 14044].
GHG Emission Release of a GHG into the atmosphere
GHG Removal Withdrawal of GHG from the atmosphere
GHG Sink Any physical unit or process that stores GHGs; usually refers to forests and underground/deep sea
reservoirs of CO2 [GHG Procotol]
GHG Source Any physical unit or process which releases a greenhouse gas into the atmosphere. [GHG Procotol]
Global Warming
Potential (GWP)
Index or characterization factor, based on radiative properties of GHGs, measuring the radiative forcing
following a pulse emission of a unit mass of a given GHG in the present-day atmosphere integrated over a
chosen time horizon, relative to that of carbon dioxide (CO2) (ISO 14067: 2018)
Greenhouse gas (GHG) Gaseous constituent of the atmosphere, both natural and anthropogenic, that absorbs and emits radiation
at specific wavelengths within the spectrum of infrared radiation emitted by the Earth’s surface, the
atmosphere and clouds (ISO 14067: 2018)
Hotspot Within an LCA study a hotspot is a relevant environmental aspect and its position in the life cycle.
Impact An effect on human health or the environment.
Impact Category Class representing environmental issues of concern to which life cycle inventory analysis results may be
assigned [Ref: ISO-14044]. The issues of concern are represented in a distinct environmental mechanism,
which can be modeled with a stressor-effects network made up of observable stressors, midpoints, and
endpoints.
Terminology Used in this Report

Fashion Industry Charter for Climate Action | Raw Materials Working Group | Fashion Industry Charter for Climate Action | Raw Materials Working Group
Fashion Industry Charter for Climate Action | Raw Materials Working Group | Fashion Industry Charter for Climate Action | Raw Materials Working Group
11
Term Definition
Indicator See Category Indicator.
Input Product, material or energy flow that enters a unit process. [Ref. ISO 14044].
Key processes A unit process (or unit operation) contributing over 10-15% to any indicator result.
Life Cycle Consecutive and interlinked stages of a product system, from raw material acquisition or generation from
providing environment to final disposal.
Life Cycle Assessment
(LCA)
Compilation and evaluation of the inputs, outputs and the environmental and human health impacts of a
product system throughout its life cycle. [Based on ISO 14044]
Life Cycle Impact
Assessment (LCIA)
Phase of life cycle assessment aimed at determining the magnitude and significance of the environmental
and human health impacts for a product system throughout the life cycle of the product. [Based on ISO
14044]
Life Cycle Interpretation Phase of life cycle assessment in which findings of either the inventory analysis or the impact assessment,
or both, are evaluated in relation to the defined goal and scope in order to reach conclusions and
recommendations. [Ref: ISO 14044]
Life Cycle Inventory (LCI) Phase of a life cycle assessment involving the compilation and quantification of inputs and outputs for a
product throughout its life cycle. [Ref: ISO 14044]
Midpoint A distinct node in a stressor-effects network representing an observed chemical, physical, radiological or
biological impact that is linked to the final category endpoint(s).
Output Product, material or energy flow that leaves a unit process. [Ref. ISO 14044].
Post-consumer Material generated by households, commercial, or institutional, facilities in their role as end-users of the
product which can no longer be used for its intended purpose.
Primary Data Quantitative measurement of activity from a product’s life cycle that, when multiplied by the appropriate
emission factor, determines the GHG emissions arising from a process
Primary Forest Naturally regenerated forests of native tree species, where there are not clearly visible
indications of human activities and the ecological processes are not significantly disturbed.
They are sometimes referred to as old-growth forests. These forests are of irreplaceable value for
their biodiversity, carbon storage and other ecosystem services, including cultural and heritage values.
Natural, mature forests that have not been cleared and regrown in recent history (i.e. the past 30–50
years). Consisting of native species, these forests are largely free from industrial-scale land uses and
infrastructure, and ecological processes have not been significantly disturbed. (FAO)
Product Any goods or service. [Ref: ISO 14025].
Product system Collection of unit processes with elementary and product flows, performing one or more defined
functions, and which models the life cycle of a product. [Ref. ISO 14044]
Secondary Data Data obtained from sources other than direct measurement of the emissions from processes included in
the life cycle of the product
System See product system.
Time Horizon A specified timeframe.
Unit Process Smallest element considered in the life cycle assessment for which input and output data are quantified
[Ref: ISO 14044].
Fashion Industry Charter for Climate Action | Raw Materials Working Group | Fashion Industry Charter for Climate Action | Raw Materials Working Group
Fashion Industry Charter for Climate Action | Raw Materials Working Group | Fashion Industry Charter for Climate Action | Raw Materials Working Group
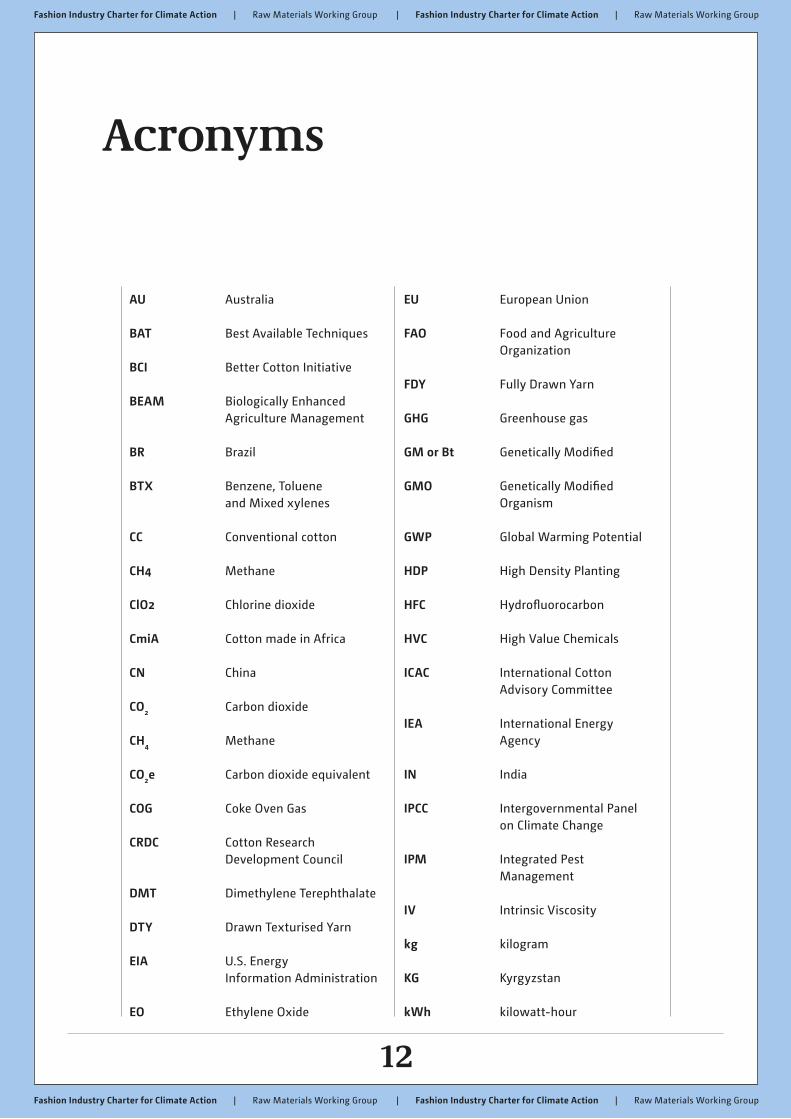
12
AU Australia
BAT Best Available Techniques
BCI Better Cotton Initiative
BEAM Biologically Enhanced Agriculture Management
BR Brazil
BTX Benzene, Toluene and Mixed xylenes
CC Conventional cotton
CH4 Methane
ClO2 Chlorine dioxide
CmiA Cotton made in Africa
CN China
CO2 Carbon dioxide
CH4 Methane
CO2e Carbon dioxide equivalent
COG Coke Oven Gas
CRDC Cotton Research Development Council
DMT Dimethylene Terephthalate
DTY Drawn Texturised Yarn
EIA U.S. Energy Information Administration
EO Ethylene Oxide
EU European Union
FAO Food and Agriculture Organization
FDY Fully Drawn Yarn
GHG Greenhouse gas
GM or Bt Genetically Modified
GMO Genetically Modified Organism
GWP Global Warming Potential
HDP High Density Planting
HFC Hydrofluorocarbon
HVC High Value Chemicals
ICAC International Cotton Advisory Committee
IEA International Energy Agency
IN India
IPCC Intergovernmental Panel on Climate Change
IPM Integrated Pest Management
IV Intrinsic Viscosity
kg kilogram
KG Kyrgyzstan
kWh kilowatt-hour
Acronyms

Fashion Industry Charter for Climate Action | Raw Materials Working Group | Fashion Industry Charter for Climate Action | Raw Materials Working Group
Fashion Industry Charter for Climate Action | Raw Materials Working Group | Fashion Industry Charter for Climate Action | Raw Materials Working Group
13
LCA Life Cycle Assessment
LCI Life Cycle Inventory
LCIA Life Cycle Impact Assessment
m3 cubic meter
MEG Monoethylene Glycol
MJ Megajoule
MSI Materials Sustainability Index
N Nitrogen
N2O Nitrous oxide
NOx Nitrogen oxides
OC Organic cotton
PAN Pesticide Action Network
PEF Product Environment Footprint
PET Polyester
PFC Perfluorocarbon
PK Pakistan
POY Partially Oriented Yarn
PTA Purified Terephthalic Acid
RA Regenerative Cotton
RAF Africa (Burkina Faso, Cameroon, Zambia, Ivory Coast, Benin, Mozambique, Malawi)
RAW Readily Available Water
RC Mechanically Recycled Cotton
SAC Sustainable Apparel Coalition
SLCP Short-lived climate pollutants
SOC Soil Organic Carbon
tC/ha metric ton carbon per hectare
TJ Tajikistan
TU Turkey
UNEP United Nations Environmental Programme
UNFCCC United National Framework Convention on Climate Change
US United States

Fashion Industry Charter for Climate Action | Raw Materials Working Group | Fashion Industry Charter for Climate Action | Raw Materials Working Group
Fashion Industry Charter for Climate Action | Raw Materials Working Group | Fashion Industry Charter for Climate Action | Raw Materials Working Group
14

Fashion Industry Charter for Climate Action | Raw Materials Working Group | Fashion Industry Charter for Climate Action | Raw Materials Working Group
Fashion Industry Charter for Climate Action | Raw Materials Working Group | Fashion Industry Charter for Climate Action | Raw Materials Working Group
15
This report was developed by the Fashion Industry Charter for Climate Action (FICCA) Raw Material Working Group with the primary goal of identifying the key processes which contribute to lower carbon intensive raw materials for cotton and polyester. The work was carried out through engagement with industry experts, textile and apparel organizations, and working group members with SCS Global Services (SCS) as the neutral technical lead.
The report reviews different methods for the production of materials e.g. organic farming as compared to conventional, or virgin polyester as compared to mechanically recycled polyester. However, the report does not aim to make comparisons between fiber types e.g. cotton compared to polyester. The Raw Materials Working Group would encourage anyone reading the report to avoid comparing one material to another as the intention of the report is to provide insight into how to reduce GHGs for an individual material through changing methods of production rather than promote the use of one material over another.
A more detailed outline of the objectives can be found in Section 2. The scope of the report covers raw material production starting with the cultivation or extraction of a raw material (Tier 4) through to raw material processing and fiber creation (Tier 3). The interdependence of all processes in the overall GHG profile of a fiber was remarkable. For example, whether manure is a by-product of a farm or purchased for cotton has an effect throughout the supply chain on GHG emissions.
For cotton, the qualitative matrix in Table 4 provides a better understanding of the influence of different farming practices by climate, by region and by cotton type. There can be significant variability between individual farm management practices and even similar farming systems can have notable variations within a region, due to inherent variation and exogenous influences such as soil type, precipitation patterns and farming activities. Polyester is similar in that the GHG profile depends on where and what raw materials are sourced. This report was developed in sections and can be used as a tool to understand individual fibers or taken in its entirety to create a raw material strategy for lowering GHG emissions.
The report includes a short section on potential new materials and systems targeted to lower GHG emissions of raw materials. These materials will be reviewed as they commercialize and their GHG profile is clarified. High level findings and recommendations on cotton and polyester are outlined in the next paragraphs. To get the most out of this report we recommend getting into the details that provide the most useful insights for decision making.
Key Findings - Cotton
Cotton is the most used natural fiber and second most used fiber in the textile industry with a share of approx. 23% of the total volume of the fiber market produced globally.
Cotton is grown around the world and can be grown and farmed using a range of different systems and input methods, some of which are certified as more sustainable.
Executive Summary – Cotton and Polyester, Part I

Fashion Industry Charter for Climate Action | Raw Materials Working Group | Fashion Industry Charter for Climate Action | Raw Materials Working Group
Fashion Industry Charter for Climate Action | Raw Materials Working Group | Fashion Industry Charter for Climate Action | Raw Materials Working Group
16
Table 3 details the regions and methods for producing cotton.
• Yield is the determinat factor driving GHG emission of cotton farming. Yields vary from country to country (region to region within a country, producer to producer and year to year), depending upon factors such as farming practices, climatic conditions, water availability, soil quality, pest pressure, and farmer resources. Section 2.2.1 summarizes the influence of these factors on cotton yields in detail.
• The calculation and modelling of field emissions is complex and vary greatly from region to region. Existing LCAs assume a default – 1% of nitrogen applied to fields is released as nitrous oxide emissions. However, this can vary drastically from region to region on soil conditions and weather. Generally, more nitrous oxide is released in wetter climates and less in dryer climates. Textile Exchange ran a sensitivity analysis on using different emissions factors in their organic cotton LCA and found that application of nitrous oxide emission factor of 0.3% and 3% can result in up to 21% of reduction in impacts or increase the impact by 59% respectively. It is necessary to
incorporate site specificity to accurately model field emissions from cotton farming. It is necessary to incorporate site specificity to accurately model field emissions from cotton farming.
• Fertilizers vs compost and type of compost are key drivers in GHG release on farms. On farm fertilizer (manure) derived as a waste product (passive fertilizer application from owned cattle) is the best solution to bringing down impact.
• Burning of crop residues also has a significant climate impact.
• Implementation of improved crop management practices (e.g. conservation and no-till) has the potential to mitigate climate impacts over time due to increase in soil carbon. It is to be noted that if land is tilled every 2-3 years then all the carbon stored is released, limiting the potential of no-till practices. The data points cited in the current study exclude soil carbon fluxes.
• Pesticides are not shown to drive climate impacts. GHG impacts from pesticide production is negligible; however, yield losses due to pest damage can have a negative effect on the GHG emissions and any correlation between pesticides, soil health, and soil carbon are unexamined in present LCA’s.
Polyester
Polyester (PET) is the most widely used fiber, making up 52% of the total fiber market volume produced globally. As of 2019 ~14% of total PET produced was derived from recycled feedstocks primarily post-consumer PET bottles. PET’s GHG profile is heavily influenced by the source of feedstock used for PET precursor (PTA, or DMT and MEG) production, which can include either crude oil or natural gas based on naphtha or ethane, PET waste materials or alternative sources such as sugarcane or corn derived feedstocks or waste gases from the iron and steel sector. Based on current knowledge and LCA research:
Mechanically recycled PET from post-consumer bottles has the potential to reduce GHG emissions by:
• 66% for recycled chips/pellets compared to virgin PET chips
• 27% for DTY production compared to virgin PET filament DTY
Chemically recycled PET can achieve 5-27% GHG reductions by shifting from virgin PET to chemically recycled PET, depending on the source of feedstock and region of PET production.

Fashion Industry Charter for Climate Action | Raw Materials Working Group | Fashion Industry Charter for Climate Action | Raw Materials Working Group
Fashion Industry Charter for Climate Action | Raw Materials Working Group | Fashion Industry Charter for Climate Action | Raw Materials Working Group
17
Other important strategies for reducing GHG emissions from PET include:
• Accelerate scale of recycling technology providers
• Improve recycling infrastructure
• Invest in automated sorting technologies• Invest in alternative feedstocks for PET
production• Scale of Carbon Capture, utilization and
storage technologies to mitigage GHG emission from petrochemical production
Next Steps recommended
The next steps for the Fashion Industry Charter’s Raw Material Working Group will be to work with industry to fill in gaps uncovered in our work for the in-scope fibers. This work will focus on establishing data that is geographically and time relevant as well as consistent in methodology. Key gaps are bulleted below.
Key Gaps:
• Inconsistencies in LCA modeling approaches
• Hidden and bundled data sources + issues with different LCA software systems providing very different results due to quality of background data
• Inconsistent time period of data collection and lack of geographic variability in LCA modeling
• Lack of harmonization of reporting requirements for biogenic carbon content in products and lack of transparency in reporting value of credits applied for biogenic carbon stored in the products.
• Lack of standardized LCA modeling of land use impacts
• Use of different LCA software and different LCA databases
• Use of inconsistent LCA methodology• Cotton: inconsistent modeling of
organic fertilizer (manure) production• Cotton: use of inconsistent
methodology to model field emissions• PET: use of inconsistent allocation
approach to model petrochemical production used in Virgin PET production
• PET: inconsistent allocation approach for modeling recycled PET
• Lack of clear and transparent
documentation on data gaps and limitations.
This report is part one of a series of reports the Raw Materials Working Group intends to produce. Following this report, part two will be published in the coming months which will provide similar insights into the product and GHG reduction opportunities for Manmade Cellulosic Fibers (MMC), fibers such as viscose and lyocell. Additionally, we will continue to produce reports such as this, looking at other key materials used by the industry such as nylon, wool and leather.
While there is much to learn, the report outlines 8 steps brands can start taking today to transition to lower GHG emission raw materials.
• Build internal consensus and buy-in for transition materials.
• Develop and adopt evaluation and preferred fiber designation
• Partner internally to train and educate sourcing and design teams
• Collect internal sourcing data• Set product and material-based goals• Provide guidance on purchasing and
claims support• Measure adoption, and more widely
build support to measure total sourcing of materials
Ultimately this report is a tool to be used to make change in how raw materials are selected. It provides the most accurate detailed information on raw material choice for lowering GHG emissions the Working Group could gather. It too will change as new information becomes available and is updated.

Fashion Industry Charter for Climate Action | Raw Materials Working Group | Fashion Industry Charter for Climate Action | Raw Materials Working Group
Fashion Industry Charter for Climate Action | Raw Materials Working Group | Fashion Industry Charter for Climate Action | Raw Materials Working Group
18
The Raw Materials Working Group, convened by the UN Fashion Industry Charter for Climate Action (FICCA), is developing a roadmap for reducing the GHG emissions related to raw material extraction, production and processing, which for some companies can be the most carbon-intensive part of the fashion value chain. The roadmap started by covering the most used materials (cotton and polyester) and will progress to looking at some of the highest impact materials used in the fashion industry to allow signatories to identify the necessary actions to reduce GHG emissions in line with a 1.5°C target pathway. The roadmap will provide guidance on ways to reduce the GHG impact within a single fiber type only, and does not attempt to compare across fiber types and comparisons should not be made between regions for sourcing fibers. For example, using recycled polyester instead of virgin polyester, and climate beneficial farming methods. The focus is on identifying areas to improve over time on a regional basis for different fiber types rather than comparing between regions for sourcing purposes.
The Phase I focus materials are cotton, polyester, and MMCF. According to the Textile Exchange’s Preferred Fiber & Materials Market Report 2019, cotton, polyester and man-made cellulosic fibers made up over 80% of the global fiber market in 2018. Materials for future consideration will likely include wool, leather, nylon, polyurethane, and silk. The Phase I report is split into two parts: PART I covers cotton and polyester (this study) and PART II will cover MMCF.
For the purpose of this roadmap, the Working Group has defined the scope of raw material production to start with the cultivation or extraction of a raw material (Tier 4) through to raw material processing and fiber creation (Tier
3). For example, for cotton this includes farming, harvesting and ginning; for virgin polyester this includes oil extraction, refining, polymerization, extrusion, and fiber/filament creation.
All raw materials come with a carbon footprint and we acknowledge that raw materials have significant environmental impacts. Estimates on raw materials range from 15% (Quantis 2018. Note: this report did not include animal fibers and materials) to 65% (as reported in Kering’s 2019 Environmental Profit and Loss) of a fashion companies’ GHG emissions (the percentage will vary based on the types of materials used).
Measuring the footprint of raw materials is complicated. The contributing factors that should be included are all of the processes used to grow or manufacture raw materials as well as the location in which this happens. One of the most used methodologies to measure impacts is a <Life Cycle Assessment (LCA)>. Although these scientific studies have produced credible and industry recognized results, they have their own challenges.
LCAs are either calculated using industry averages that are not applicable to specific regions or factory settings or they are created using geographic or manufacturing-specific data that cannot be used easily for comparison. LCA practitioners must review the following factors before determining the comparability of the environmental profile of multiple products:
• Scope of assessment and function of the products should be the same
• Inclusions and exclusions of the processes should be consistent across all the products
• Time period of data collection should
Introduction

Fashion Industry Charter for Climate Action | Raw Materials Working Group | Fashion Industry Charter for Climate Action | Raw Materials Working Group
Fashion Industry Charter for Climate Action | Raw Materials Working Group | Fashion Industry Charter for Climate Action | Raw Materials Working Group
19
match for the products. When the LCA was produced can also influence the outcome.
• Modeling assumptions should be consistent across all the products
• Consistent databases/data sources, LCA software, and metrics should be used for modeling processes
To manage these challenges, the Raw Materials Working Group has engaged SCS Global Services, experts in the field of LCA development and research as well as collaborated with industry organizations who have pertinent tools and information.
This report summarizes the meta-analysis of 73 existing LCA reports (36 cotton LCAs and 21 PET LCAs) and research on modeling parameters used to develop the LCA data, analysis of the main contributors to climate impacts, results of the LCA, and highlights of key findings. With a goal to identify key processes that contribute to lower carbon intensive raw materials for the fashion industry, the objectives of this report are to:
• Identify low carbon sources of cotton and polyester based on current knowledge and findings from existing LCA research and analysis
• Provide detailed background information (to the extent available) on cotton and polyester production on a country/regional level and map out regional differences in climate impacts for different types of cotton and polyester
• Outline the key LCA modeling parameters, data gaps and inconsistencies in the existing LCA landscape, and identify areas of improvement to calculate climate impacts on a more consistent basis
• Provide insights into the implications of various cotton farming practices and PET production pathways, across diverse geographies (subject to data availability)
• Provide a foundation for stakeholders to define a harmonized approach for climate accounting of cotton and polyester.

Fashion Industry Charter for Climate Action | Raw Materials Working Group | Fashion Industry Charter for Climate Action | Raw Materials Working Group
Fashion Industry Charter for Climate Action | Raw Materials Working Group | Fashion Industry Charter for Climate Action | Raw Materials Working Group
20

Fashion Industry Charter for Climate Action | Raw Materials Working Group | Fashion Industry Charter for Climate Action | Raw Materials Working Group
Fashion Industry Charter for Climate Action | Raw Materials Working Group | Fashion Industry Charter for Climate Action | Raw Materials Working Group
21
01 Scope
1.1 Goal and Scope of Assessment
1.2 Review

22Fashion Industry Charter for Climate Action | Raw Materials Working Group | Fashion Industry Charter for Climate Action | Raw Materials Working Group
Fashion Industry Charter for Climate Action | Raw Materials Working Group | Fashion Industry Charter for Climate Action | Raw Materials Working Group
1.1 Goal and Scope of Assessment
The primary goal of the study is to identify low carbon sources of cotton and polyester fibers, by geographic region (subject to data availability) based on a literature review of existing LCA studies and research. Table 1 below outlines the scope of assessment for cotton and polyester.
Table 1. Scope of literature review for cotton and polyester.
The system boundary of the current assessment is illustrated for the two fiber types (cotton and polyester) in Figure 1.
Scope Cotton Polyester (PET)
Raw material Sub-Type/Sources• Conventional
• Organic
• CmiA cotton
• Better Cotton
• Recycled Cotton
• Regenerative Cotton
• Virgin PET
• Chemically recycled PET
• Mechanically recycled PET
• Biobased PET
Geographic regions under consideration India, China, USA, Pakistan, Turkey,
Australia, Brazil, Tanzania, Kyrgyzstan,
Tajikistan, Africa (Burkina Faso, Ivory Coast,
Zambia, Mozambique, Benin, Malawi)
China, USA, Japan, Taiwan, India, Europe
(Germany, Italy, Ireland, Spain), South
Korea
System boundary/Scope Cradle-to-gin gate Cradle-to-gate (filament yarn)
Climate Impact Results reported Kilogram CO2e per metric ton of ginned
cotton fiber
Kilogram CO2e per metric ton of polyester
filament yarn
CottonFarming
MechanicalRecycling
Crude OilExtraction &Processing/
Recycling*/Farming**
Recycled Cotton Fiber:Mechanically Recycled Cotton
Ginned Cotton Fiber:Conventional CottonOrganic CottonBCI CottonCmiA CottonRegenerative Cotton
Recycling*
Pulpwood orcotton linter
harvest/
GinningPET
�akes/chips/pellets
MeltExtrusion/Spinning
DissolvingPulp
MMCFProduction
PET Filament Yarn:Virgin PET*Mechanically Recycled PET*Chemically Recycled PET**Bio-based PET
MMC Staple Fibers:Viscose*Recycled viscoseModalLyocellAcetate
Scope

23Fashion Industry Charter for Climate Action | Raw Materials Working Group | Fashion Industry Charter for Climate Action | Raw Materials Working Group
Fashion Industry Charter for Climate Action | Raw Materials Working Group | Fashion Industry Charter for Climate Action | Raw Materials Working Group
1.1 Goal and Scope of Assessment
The primary goal of the study is to identify low carbon sources of cotton and polyester fibers, by geographic region (subject to data availability) based on a literature review of existing LCA studies and research. Table 1 below outlines the scope of assessment for cotton and polyester.
Table 1. Scope of literature review for cotton and polyester.
The system boundary of the current assessment is illustrated for the two fiber types (cotton and polyester) in Figure 1.
Scope Cotton Polyester (PET)
Raw material Sub-Type/Sources• Conventional
• Organic
• CmiA cotton
• Better Cotton
• Recycled Cotton
• Regenerative Cotton
• Virgin PET
• Chemically recycled PET
• Mechanically recycled PET
• Biobased PET
Geographic regions under consideration India, China, USA, Pakistan, Turkey,
Australia, Brazil, Tanzania, Kyrgyzstan,
Tajikistan, Africa (Burkina Faso, Ivory Coast,
Zambia, Mozambique, Benin, Malawi)
China, USA, Japan, Taiwan, India, Europe
(Germany, Italy, Ireland, Spain), South
Korea
System boundary/Scope Cradle-to-gin gate Cradle-to-gate (filament yarn)
Climate Impact Results reported Kilogram CO2e per metric ton of ginned
cotton fiber
Kilogram CO2e per metric ton of polyester
filament yarn
CottonFarming
MechanicalRecycling
Crude OilExtraction &Processing/
Recycling*/Farming**
Recycled Cotton Fiber:Mechanically Recycled Cotton
Ginned Cotton Fiber:Conventional CottonOrganic CottonBCI CottonCmiA CottonRegenerative Cotton
Recycling*
Pulpwood orcotton linter
harvest/
GinningPET
�akes/chips/pellets
MeltExtrusion/Spinning
DissolvingPulp
MMCFProduction
PET Filament Yarn:Virgin PET*Mechanically Recycled PET*Chemically Recycled PET**Bio-based PET
MMC Staple Fibers:Viscose*Recycled viscoseModalLyocellAcetate
Figure 1. System boundary of assessment for different types of cotton and polyester (PET).
1.2
Review
The UN FICCA Raw Materials Working Group provided access to data and input on the report. In addition, the meta-analysis of the cotton LCAs was external reviewed by subject matter experts. The reviewers for the cotton meta-analysis include:
• Dr. Allan Williams, General Manager, Cotton Research and Development Corporation (CRDC) for Australian cotton
• Jens Soth, Senior Advisor Value Chains & Sustainable Commodities, Helvetas
The polyester section was reviewed by:
• Maurizio Crippa, CEO, Gr3n

Fashion Industry Charter for Climate Action | Raw Materials Working Group | Fashion Industry Charter for Climate Action | Raw Materials Working Group
Fashion Industry Charter for Climate Action | Raw Materials Working Group | Fashion Industry Charter for Climate Action | Raw Materials Working Group

02 Collected information
2.1 Meta-Analysis of LCA Studies
2.2 Cotton
2.3 Polyester (PET)
2.2.1 Cotton Results
2.2.2 Factors influencing variability in climate impacts for the cotton cultivation phase
2.2.3 Soil Carbon Balance
2.2.4 Ginning
2.2.5 Regenerative Cotton
2.3.1 Polyester Results
2.3.2 Key factors influencing climate impacts
2.3.3 Allocation Principles Relevant to PET Production
Fashion Industry Charter for Climate Action | Raw Materials Working Group | Fashion Industry Charter for Climate Action | Raw Materials Working Group
Fashion Industry Charter for Climate Action | Raw Materials Working Group | Fashion Industry Charter for Climate Action | Raw Materials Working Group

Fashion Industry Charter for Climate Action | Raw Materials Working Group | Fashion Industry Charter for Climate Action | Raw Materials Working Group
Fashion Industry Charter for Climate Action | Raw Materials Working Group | Fashion Industry Charter for Climate Action | Raw Materials Working Group
26
2.1 Meta-Analysis of LCA Studies
This section provides an overview of the scope of the literature survey conducted for cotton and polyester. Table 2 below outlines the criteria used to review existing LCA research and reports on cotton and polyester and retrieve climate data to provide informed conclusions and guidance to the industry on sourcing raw materials.
Table 2. Scope of literature review for cotton and polyester. Table 30 and Table 31 in the Appendix summarize the literature review criteria in detail.
Collected Information
Review Criteria Cotton Polyester (PET)
Raw material Sub-Type/Sources • Conventional
• Organic
• CmiA cotton
• Better Cotton
• Recycled Cotton
• Regenerative Cotton
• Virgin PET
• Chemically recycled PET
• Mechanically recycled PET
• Biobased PET
Geographic regions under
consideration
India, China, USA, Pakistan, Turkey, Australia,
Brazil, Tanzania, Kyrgyzstan, Tajikistan,
Africa (Burkina Faso, Ivory Coast, Zambia,
Mozambique, Benin, Malawi)
China, USA, Japan, Taiwan, India, Europe
(Germany, Italy, Ireland, Spain), South
Korea
System boundary/Scope Cradle-to-gin gate Cradle-to-gate (filament yarn)
Climate Impact Results reported Kilogram CO2e per metric ton of ginned cotton
fiber
Kilogram CO2e per metric ton of polyester
filament yarn
Key processes driving climate
impacts• Fertilizer production
• Field emissions
• Machinery use
• Ginning
• Irrigation
• Transport
(Refer to Section 2.2.1)
• Oil extraction & processing
• Precursor production
• Polymerization
• Melt Extrusion/Spinning
• Waste collection and processing
• Depolymerization
• Crop farming (for biobased PET)
(Refer to Section 2.3.1)

Fashion Industry Charter for Climate Action | Raw Materials Working Group | Fashion Industry Charter for Climate Action | Raw Materials Working Group
Fashion Industry Charter for Climate Action | Raw Materials Working Group | Fashion Industry Charter for Climate Action | Raw Materials Working Group
27
Review Criteria Cotton Polyester (PET)
Factors influencing variability in
climate impacts across various
geographic regions
• Yield
• Cultivars/species
• Tillage practices
• Harvest practices (hand-picked v/s
mechanical)
• Water requirements: Irrigation v/s rainfed
• Irrigation systems
• Seed inputs (GMO v/s non-GMO)
• Crop residue management
• Soil health improvement: crop rotation,
intercropping
• Fertilizer inputs
• Pesticide inputs
• Land transformation/field clearing practices
• Soil carbon fluxes
• Fiber length
(Refer to Section 2.2.2 for more details)
• Feedstock type: pre/post-consumer
textiles, bottles, ocean waste,
petrochemicals (DMT, PTA, MEG),
corn, sugarcane, etc.
• Production technology
• Feedstock conversion efficiency
• Fiber/Filament grade
• Waste collection region/transport
(Refer to Section 2.3.2 for more details)
Calculation Methodology IPCC 2007, IPCC 2013 (GWP20), IPCC 2013 (GWP100), CML, Recipe, ILCD, etc.
Primary and Secondary Datas Proportion of primary and secondary data used for modeling and data sources used for filling
data gaps
Data collection period Review data collection period of primary data for each process and fiber type
LCA software Ecoinvent, GaBi, IDEMAT, USLCI, Plastics Europe, etc.
LCA databases used for modeling • Allocation of impacts to fiber versus seed
during ginning process
• Emission factors used for modeling field
emissions at cotton farms
• Modeling of compost/manure production
• Modeling soil carbon fluxes
• Allocation of burden of recycling process
• Allocation of petrochemical products
• Credits for biogenic carbon stored in bio-
based PET
Key modeling assumptions/data
gaps/inconsistencies
(Refer to Section 3 for more details)
Identify key processes and factors excluded from the model
Limitations Note limitation of models and data sources applied in the studies
(Refer to Section 3)
Table 32 through Table 33 in the Appendix provides a detailed list of data sources and references reviewed for cotton and polyester respectively.

Fashion Industry Charter for Climate Action | Raw Materials Working Group | Fashion Industry Charter for Climate Action | Raw Materials Working Group
Fashion Industry Charter for Climate Action | Raw Materials Working Group | Fashion Industry Charter for Climate Action | Raw Materials Working Group
28
2.2 Cotton
Cotton fiber accounted for approximately 23% of the global fiber market share in 2019, ranking second in terms of volume of global fiber production1. In 2017/2018, around 83% of cotton was produced in seven countries, with India leading the cotton production (23.7%), closely followed by China (22.4%) and United States (16%)2. Table 3 outlines the six different types of cotton covered in the current study.
Table 3. Scope of assessment for cotton, by type and country
Cotton Type
(Percent of 2017/2018 global cotton production)3
Country
(Percent of production within the cotton type)4 Description of Cotton Type
Conventional (77%)* India (27%)
China (23%)
USA (20%)
Pakistan (5%)
Australia (4%)
Turkey (4%)
Brazil (2%)
Conventional cotton is overarching terms for cotton typically grown
outside of sustainable certification programs. Conventional cotton
typically allows for GMO seeds, synthetic pesticides and fertilizers
and is grown with the goal of boosting production outputs. In many
countries, conventional cotton is subject to regulations limiting
pesticide use or implementation of Better Management Practices
and there are some national sustainability programs and certification
schemes.
Organic (1%) India (48%)
China (22%)
Kyrgyzstan (12%)
Turkey (7%)
Tajikistan (5%)
USA (3%)
Tanzania (3%)
Organic cotton is cotton produced and certified according to organic
agriculture standards. Use of synthetic agrochemicals (fertilizers and
pesticides) and genetically modified (GM) seeds is prohibited.
CmiA (2.3%) Burkina Faso (44%)
Ivory Coast (24%)
Zambia (6%)
Mozambique (3%)
Benin (2%)
Malawi (0.15%)
Cotton made in Africa (CmiA) is a voluntary standard for sustainable
cotton farmed in Africa with a goal to improve the living and working
conditions of smallholder farmers in Africa and to protect our
environment.
1 Textile Exchange Preferred Fiber & Materials Market Report 2020.2 ICAC Cotton: World Statistics (May 2020).3 2025 Sustainable Cotton Challenge Second Annual Report 20204 For Conventional Cwotton: ICAC Production Statistics; Organic Cotton: 2019 Textile Exchange Organic Cotton Market Report; CmiA and BCI: 2025
Sustainable Cotton Challenge Second Annual Report 2020

Fashion Industry Charter for Climate Action | Raw Materials Working Group | Fashion Industry Charter for Climate Action | Raw Materials Working Group
Fashion Industry Charter for Climate Action | Raw Materials Working Group | Fashion Industry Charter for Climate Action | Raw Materials Working Group
29
Cotton Type
(Percent of 2017/2018 global cotton production)3
Country
(Percent of production within the cotton type)4 Description of Cotton Type
Better Cotton Initiative (BCI)
(11%)***Current LCA scope
of assessment excludes BCI
equivalents ABRAPA, CmiA and
myBMP.
China (23%)
India (18%)
Pakistan (14%)
The Better Cotton Initiative (BCI) is a voluntary standard with a
holistic approach to sustainable cotton production which covers all
three pillars of sustainability: environmental, social and economic.
This requires cotton growers to adopt and follow specific crop
management guidance and criteria and encourages farmers to
continuously improve their production practices over time.
Recycled cotton** Spain, China, India,
Pakistan
Cotton produced by mechanical recycling of pre-consumer or post-
consumer cotton textiles.
Regenerative cotton** USA Cotton grown and certified according to Regenerative Organic
Agriculture certification standards which focus on building soil health
and land management, animal welfare and improving the livelihood
of farmers.
*Conventional cotton production statistics estimated by excluding sustainability schemes such as myBMP, ABRAPA, REEL, BASF e3, Cleaner Cotton, FairTrade and ISCC. **Emerging developments so there is no official data on production statistics
Figure 2 maps out the geographical scope of the current study, by cotton type and region and Figure 3 presents the trend of cotton lint production and yield statistics for the top seven cotton producing countries from 2012-2018.
Figure 2. Top seven (7) cotton producing countries in 2017/2018, by cotton type.
Mechanically Recycled CottonConventional Cotton (CC) Organic Cotton (OC) Better Cotton Initiative (BCI) Cotton made in Africa (CmiA)

Fashion Industry Charter for Climate Action | Raw Materials Working Group | Fashion Industry Charter for Climate Action | Raw Materials Working Group
Fashion Industry Charter for Climate Action | Raw Materials Working Group | Fashion Industry Charter for Climate Action | Raw Materials Working Group
30
Figure 3. Cotton lint production and yield statistics for top seven (7) cotton producing countries from 2012-2018.
In general, there is lack of transparency regarding the background life cycle inventory (LCI) data used to model LCAs, and in many cases, there is also a lack of transparency regarding the methodological assumptions applied while undertaking the LCA. An extensive literature review of over 35 LCA studies was conducted with a focus on understanding the methodology, assumptions and background data collected to model cotton fiber production. Table 30 and Table 32 in the Appendix specifies the detailed literature review criteria and the data sources reviewed for cotton.
A meta-analysis of cotton studies found that LCAs in use today are, in general:
• Not effectively capturing the variability of impacts (especially field related emissions) due to differences in geographical locations, climatic conditions, soil conditions, diversity of farming practices and possibility of neighboring farms using diverse methods. In some cases, global averages are reported for cotton fiber production and this can obscure the true impact of cotton farming, which is highly variable by geographic location and farm size.
• Modeled with farming data which is predominantly over 10 years old. Climate conditions change over time and changes in temperature and rainfall could affect cotton yields, pest levels, irrigation requirements, soil conditions, etc.
• Not directly comparable due to differences in
– Time period of data collection (refer to Section 3.1.1 for more details) – Application of inconsistent calculation methodologies (refer to Section 3.1.4 for more details) – Use of different LCA software (refer to Section 3.1.3 for more details) – Use of different data sources and LCA databases to model cotton farming (refer to
Section 3.1.3 for more details) – Use of inconsistent methodology to model field emissions and calculate climate
change results (refer to Section 3.1.6 for more details) – Modeling choices for parameters including organic fertilizer production (compost,
manure), attribution of impacts to fiber during ginning, assigning credits for carbon storage in cotton, soil carbon fluxes, etc. (refer to Section 3.1.5 for more details)
1000
Met
ric
Tons
8,000
7,000
6,000
5,000
4,000
3,000
2,000
1,000
2012/13 2013/14 2014/15 2015/16 2016/17 2017/180
3,000
2,500
2,000
1,500
1,000
500
0
Australia Production
Australia Yield
Brazil Production
Brazil Yield
China Production
China Yield
India Production
India Yield
Pakistan Production
Pakistan Yield
Turkey Production
Turkey Yield
United States Production
United States Yield

Fashion Industry Charter for Climate Action | Raw Materials Working Group | Fashion Industry Charter for Climate Action | Raw Materials Working Group
Fashion Industry Charter for Climate Action | Raw Materials Working Group | Fashion Industry Charter for Climate Action | Raw Materials Working Group
31
• Excluding soil carbon balances from change in land management
Refer to Section 5 for detailed description of the key gaps and overarching inconsistencies in the current LCA landscape.
2.2.1 Cotton Results
The existing LCA research conducted on cotton fiber production more often reports results as global averages and lacks regionality. For example, databases such as Higg MSI, provide scores for global averages of cotton production. There is an inherent variability of both natural conditions and cotton farming systems: soil types, seasons, pest outbreaks, weather conditions, farm practices, etc. This variability makes it imperative to look at cotton farming impacts on a site-specific level. Due to inconsistencies in modelling choices and factors stated in the above section, existing LCA data cannot be used to determine the environmental performance of one cotton type over another and it is inappropriate to compare LCA results across the seven cotton types assessed in this report.
Based on a meta-analysis of 27 LCA studies, an attempt is made to showcase the regional variability of LCA results within a particular cotton type in Figure 4 through Figure 8.
Results show how impacts can vary across different regions or even within a country. It is important to consider the farming practices and conditions used to model cotton farming. Highly variable results are observed across studies (e.g., 2 to 3-fold difference in results) for even a homogenous and relatively stable cotton production systems such as USA, China and Australia. The inconsistencies in climate accounting methodology, data sources, time period of data collection, modeling choices and exclusion of soil carbon fluxes makes it difficult to understand the variability and get a true picture of the environmental profile of cotton.
Figure 4. Organic cotton production based on review of existing LCA studies. Note that the X-axis shows the magnitude of variation and does not represent the GHG impact values. This chart shows the regional variability of organic cotton production within India. Section 2.2.1.2 illustrates the key process contributors to GHG emissions. It can be inferred that the impacts of Tajikistan seem higher compared to other regions due to the modeling choice of assigning burden to compost production. All other organic cotton LCA studies treat compost as a waste product irrespective of whether the farmer owns the cattle or purchases it off-site. Refer to Section 2.2.2.6.1 and Section 3.1.5 for more details on modeling organic fertilizers. Table 32 provides the list of data sources included in the scope.
0 0.5 1 1.5 2 2.5 3 3.5
Organic Cotton Cultivation Ginning
Org
anic
Cot
ton
Tajikistan
Turkey
India; Odisha
Kyrgyzstan
USA; Lubbock, Texas
China; Xinjiang
India; Madhya Pradesh
Tanzania; Meatu and Mwasa District
India
Global; India, Turkey, China, Tanzania & USA
India; Akola, Vidharba region in Maharashtra
Turkey; Aegean and South East Anatolia
China; Hutubi, Xinjiang
Madhya Pradesh,Maharashtra, Odisha, Andhra Pradesh, Rajasthan

Fashion Industry Charter for Climate Action | Raw Materials Working Group | Fashion Industry Charter for Climate Action | Raw Materials Working Group
Fashion Industry Charter for Climate Action | Raw Materials Working Group | Fashion Industry Charter for Climate Action | Raw Materials Working Group
32
Figure 5. Conventional cotton production based on review of existing LCA studies. Note that the X-axis shows the magnitude of variation and does not represent the GHG impact values. This chart shows the regional variability of conventional cotton production within countries like USA, Australia and India. Table 32 provides the list of data sources included in the scope.
Figure 6. Better Cotton production (BCI) based on review of existing LCA studies. Note that the X-axis shows the magnitude of variation and does not represent the GHG impact values. This chart shows the regional variability of BCI cotton production within India. Section 2.2.1.2 illustrates the key process contributors to GHG emissions. Table 32 provides the list of data sources included in the scope.
0
Pakistan; PunjabTurkey
India; GujaratUSA; California
USA; GeorgiaUSA; Alabama
USA; ArizonaUSA; Texas
USA; TenesseeUSA; USA-Average
USA; South CarolinaUSA; North Carolina
USA; LouisianaChina
USA; MississippiUSA; ArkansasUSA; Missouri
India North (16% of production), Central (56% of production) & South (26% of production)
USA, China and India for cotton production (67% of the worlds production in 2010)
Xinjiang or Northwest (52% of production), Yellow River (27% of production) & Yang Tse (21% of production)
Australia; Queensland and New South WalesIndia; Akola, Vidharba region in Maharashtra
India; Madhya PradeshAustralia; Central Queensland
Australia; Darling DownsAustralia; Southern Queensland
Australia; Nothern NSWAustralia; Macquarie
Australia; Southern NSWAustralia; North West NSW
GlobalChina; Xinjiang
AustraliaUSA; Far West, SOuthwest, Mid-south & Southeast
China; XinjiangChina
USA; ArkansasAustralia; Namoi valley
1 2 3 4 5 6 7 8 109
Conventional Cotton Cultivation Ginning
Conv
enti
onal
Cot
ton
0 0.5 1 1.5 2 2.5 3 3.5
BCI Cotton Production Ginning
Bet
ter
Cott
on
India; Madhya Pradesh
India; Andhra Pradesh
India; Akola, Vidharba region in Maharashtra

Fashion Industry Charter for Climate Action | Raw Materials Working Group | Fashion Industry Charter for Climate Action | Raw Materials Working Group
Fashion Industry Charter for Climate Action | Raw Materials Working Group | Fashion Industry Charter for Climate Action | Raw Materials Working Group
33
Figure 7. Mechanically recycled cotton production based on review of existing LCA studies. Note that the X-axis shows the magnitude of variation and does not represent the GHG impact values. Table 32 provides the list of data sources included in the scope.
Figure 8. CmiA cotton production based on review of existing LCA studies. Note that the X-axis shows the magnitude of variation and does not represent the GHG impact values. Section 2.2.1.2 illustrates the key process contributors to GHG emissions. Table 32 provides the list of data sources included in the scope.
Note that currently, there are no LCA studies on regenerative cotton, as it is an emerging development in this sector and has not been adopted on a wide scale. Section 2.2.2 provides an overview of regenerative cotton farming practices and Figure 9 depicts the carbon sequestration potential of practices recommended in the regenerative cotton farming systems.
Section 2.2.1.1 illustrates the process-level breakdown of ginned cotton fiber for four cotton types including Conventional, Organic, CmiA and BCI cotton, based on existing LCA research on cotton. Section 2.2.1.2 depicts the process-level breakdown of the four cotton types (Conventional, Organic, CmiA and BCI), on a regional level, based on data retrieved from existing cotton LCAs. It is not appropriate to compare the results of the process level breakdown across different cotton types. The results are presented to illustrate the regional differences in farming practices and reflect the need to consider regionalized LCA modeling for cotton farming.
In general, the following key hotspots of cotton fiber production are mapped in decreasing order of importance:
• Field emissions: Nitrous oxide emissions from fertilizer application and crop residue management are the main source of field emissions.
• Fertilizer production: Production of synthetic fertilizer is the main source of GHG emissions for fertilizer.
• Irrigation: Pumping energy for water is the main source of GHG emissions related to irrigation.
• Fuel use in machinery: Main GHG source is the combustion of fuel in mechanical equipment such as tractors, mechanical harvesters, etc. for land preparation, fertilizing and harvesting activities.
• Ginning: Electricity used for operating ginning equipment is the main source of GHG emissions.
This report builds upon the data retrieved from existing LCAs and aims to provide a foundation for modeling cotton on a regional level, by cotton type.
0 0.5 1 1.5 2 2.5 3 3.5
Mechanically Recycled Cotton
Spain
India
China
Spain
Pakistan
0 0.5 1 1.5 2 2.5 3 3.5
CmiA Cotton Cultivation Ginning
CmiA
Africa; Zambia (Eastern/Southern Africa)& Ivory coast (West)
Africa; Benin, Burkina Faso, Ivory Coast,Malawi, Mozambique, Zambia, Cameroon

Fashion Industry Charter for Climate Action | Raw Materials Working Group | Fashion Industry Charter for Climate Action | Raw Materials Working Group
Fashion Industry Charter for Climate Action | Raw Materials Working Group | Fashion Industry Charter for Climate Action | Raw Materials Working Group
34
2.2.1.1 Percent Breakdown of key sub-processes contributing to greenhouse gases,
by cotton type (based on review of existing LCA data)
2.2.1.2 Percent breakdown of key sub-processes contributing to greenhouse gas emissions, by
cotton type, by region (based on review of existing LCA data) (NOTE: results should NOT be used to compare across different cotton types)
Organic Cotton Conventional Cotton
CmiABCI
Machinery
Fertilizer production
Field emissions
Reference system
Pesticide production
Ginning
Irrigation
Transport to gin/factory0.43%
15%
6%
45%
24%
6%4%
11%
19%
1%
30%1.92%
10%
25%
1%
14%
4%
66%
12%
4%
13%
29%
3%27%
0.92%
10%
19%
0.36%1%
Tajikistan
USA; Lubbock, Texas
India; Madhya Pradesh
Tanzania; Meatu and Mwasa District
India; Madhya Pradesh,Maharashtra,Odisha, Andhra Pradesh, Rajasthan
Global*
Turkey;Aegean and South East Anatolia
China; Hutubi, Xinjiang
Pakistan; Punjab
Turkey; Aegean and South East Anatolia
India; Madhya Pradesh
Global; USA, China and Indiafor cotton production
Australia
Global; USA, India, China & Australia
Africa**
India; Madhya Pradesh
-10% 0 20%10% 30% 40% 50% 60% 70% 80% 100%90%
Machinery Fertilizer production Pesticide production Field emissions
Conv
enti
onal
Cot
ton
CmiA
BCI
Cott
onO
rgan
ic C
otto
n
Other
*India, Turkey, China, Tanzania & USA (67% of the worlds production in 2010)**Zambia (Eastern/Southern Africa) & Ivory coast (West)
Crop rotation Reference system Ginning Irrigation Transport to gin/factory

Fashion Industry Charter for Climate Action | Raw Materials Working Group | Fashion Industry Charter for Climate Action | Raw Materials Working Group
Fashion Industry Charter for Climate Action | Raw Materials Working Group | Fashion Industry Charter for Climate Action | Raw Materials Working Group
35
2.2.1.3 Qualitative Cotton Matrix Highlighting Influence of Key Factors on the Climate
Table 4 presents a qualitative matrix which maps out the various farming practices on a region level, by cotton type and interprets the effects of nine key factors (e.g. tillage, irrigation, cultivars, fertilizer and pesticide inputs, farming systems, crop residue management, harvest practices and ginning technology) on the following:
• Cotton yields• Soil health• Fiber quality• Water use efficiency• GHG emissions
This matrix was created by examining variables such as growing practices by region, technology, and the relationship between dependent variables such as yields, energy use efficiency, water use efficiency, nutrient use efficiency, etc. and attempts to define cotton growing practices which reduce the impact to the climate. Quantitative LCA results could not be provided by country due to the reasons cited in Section 2.2.1.
Yield is the key determinant factor for GHG emissions and is influenced by a combination of nine key factors. Yields vary from country to country (region to region within a country, producer to producer and year to year), depending upon factors such as farming practices, climatic conditions, water availability, soil quality, pest pressure, and farmer resources.
The following conclusions can be drawn for each factor, from the qualitative matrix presented in Table 4.
1. Species/Cultivars: There is no clear distinction regarding the environmental performance of GM and non-GM cotton varieties, and it is not possible to determine a low carbon cotton source
5 https://textileexchange.org/feature/obepab-2019/
based on this factor. In theory, selection of suitable cultivars/cotton varieties can ensure stable yields or enhance yield in some cases, reduce application rates of herbicide/pesticide/insect thereby, thereby reducing the GHG emissions. However, practical field application of genetically modified (GM or Bt) varieties has not reduced the consumption of insecticides and herbicides universally. Due to inconsistent trends in yield improvements related to GMO cotton/ GM cotton adoption, it is not possible to determine whether GM/Bt hybrid cotton varieties have had a positive or negative impact on the climate. Refer to Section 2.2.2.1 for more details on regional practices by cotton type.
2. Water Requirements: Rainfed cotton (approximately constitutes 40% of the global cotton production) is a low carbon source only under the following scenario: if rainfall is consistent, soil conditions are favorable, and yield is consistent. However, with increasing global temperatures, the rainfall can be erratic and drive lower yields, thereby increasing the GHG emissions to produce a metric ton of cotton lint. This increase in global temperatures could also lead to a shift in where cotton is grown and changes in the harvest cycles. There are some studies5 that show organic farming may be more resilient and perform better in times of drought and flood (if investments in soil are made). Energy for operating irrigation pumps are a key contributor to GHG emissions but this could be offset if higher yields are achieved. Furrow irrigation enhances yield only if optimum water is supplied. Irrigated cotton can be a low carbon source if drip irrigation method is deployed. Drip irrigation is one of the most water efficient irrigation methods and with the support of latest

Fashion Industry Charter for Climate Action | Raw Materials Working Group | Fashion Industry Charter for Climate Action | Raw Materials Working Group
Fashion Industry Charter for Climate Action | Raw Materials Working Group | Fashion Industry Charter for Climate Action | Raw Materials Working Group
36
technologies such as drones and AI, cotton yields can be optimized, thereby lowering field emissions. While deficit irrigation has a negative impact on soil health, it can be a climate smart method to grow cotton in water stressed regions. Excess water supply results in soil salinization and exacerbates soil health. Refer to Table 4 for regional distribution by cotton type and Section 2.2.2.8 for more details on regional practices by cotton type.
3. Crop Residue Management: Open burning of cotton stalks has a negative effect on the climate (practiced in parts of North India and Africa). Best practice is to incorporate crop residues into the field instead of burning cotton stalks. While decomposition of residues releases nitrous oxide emissions, contributing to field GHG emissions, the incorporation of cotton stalks can help improve soil health if practiced consistently over a longer-term period and increase yields under optimal conditions. Cotton sustainability programs including organic, BCI, CmiA prohibit farmers from burning cotton stalks. Refer to Table 4 and Section 2.2.2.5.1 for more details on regional practices by cotton type.
4. Fertilizer Inputs: Fertilizer production is one of the most relevant GHG hotspots in the cotton farming phase. Synthetic fertilizer production is likely to be more GHG intensive compared to production of organic fertilizers. Field emissions from fertilizer application is the single largest GHG contributor, due to release of nitrous oxide emissions from the field. Excessive application of fertilizer does not necessarily increase cotton yield, but it releases more nitrous oxide emissions and has a negative impact on the soil health. Best practice is to conduct soil testing to assess nutrient requirements and apply optimal doses of organic fertilizer, based on crop requirements. Improving nutrient use efficiency can reduce GHG impacts.
Application of organic fertilizers has a positive impact on soil health and can contribute towards building soil carbon when combined with no-till, cover cropping or intercropping and crop rotation practices. Refer to Table 4 and Section 2.2.2.6 for more details on regional practices by cotton type.
5. Pesticide/Herbicide/Insecticide inputs: GHG impacts from pesticide production is negligible; however, yield losses due to pest damage can have a negative effect on the GHG emissions. Best practice is to implement Integrated Pest Management (IPM) strategies to reduce pest incidence and use biocontrol measures that reduces need for synthetic pesticides. Certification schemes such as CmiA, Organic, BCI and country level sustainability programs for cotton such as myMBP, REEL, ABRAPA, etc. have integrated IPM strategies for pest management. Refer to Table 4 and Section 2.2.2.7 for more details on regional practices by cotton type.
6. Cropping Systems: Although monocropping ensures consistently high cotton yields, driving low GHG emissions, monocropping over a prolonged period can have a negative effect on the soil health if crop rotation and crop diversification practices are absent and soil carbon and fertility loss will eventually reduce cotton yields. Best practice to grow low carbon cotton is to implement crop rotation, intercropping or cover cropping to increase yields; reduce pest instances, improve soil health and mitigate soil organic carbon losses. Refer to Table 4 and Section 2.2.2.9 for more details on regional practices by cotton type.
7. Tillage Practices: Conventional tillage has a negative effect on climate and soil health compared to conservation and no-till practices, due to soil erosion, loss of organic matter in soils, increased energy use and higher rate of field emissions. Best practice is to

Fashion Industry Charter for Climate Action | Raw Materials Working Group | Fashion Industry Charter for Climate Action | Raw Materials Working Group
Fashion Industry Charter for Climate Action | Raw Materials Working Group | Fashion Industry Charter for Climate Action | Raw Materials Working Group
37
implement no-till consistently over a prolonged period as it drives lower GHG impacts from reduced field fuel usage, improved soil health and potential increase in soil carbon storage. GHG savings from no-till may be negated if fields are ploughed once every few years and if yields are low due to inefficient use of water and fertilizer inputs. Refer to Table 4 and Section 2.2.2.5.2 for more details on regional practices by cotton type.
8. Harvest Practice: Traditional harvest practice is to hand-pick cotton (prevalent in smallholder farms), so there are no energy requirements and the trash content is lower, which leads to no GHG impacts compared to the GHG intensive mechanized harvest operations. Excessive use of mechanical equipment can result in soil compaction and have a negative effect on soil health. Refer to Table 4 and Section 2.2.2.10 for more details on regional practices by cotton type.
9. Ginning Process: Roller ginning has lower lint yields compared to saw ginning, so more energy is required to process seed cotton. However, roller ginning is more suitable for smallholder
farms and preserves fiber quality and is used for long staple fibers. Saw gin is preferred for upland cotton and short length fibers. Electricity use is the main hotspot in the ginning process and climate impacts can vary depending on the electricity grid mix of a region. From a climate perspective, ginning impacts can be reduced by upgrading roller gin technologies in India and Africa (e.g. installing automatic feeders) and sourcing electricity from renewable energy resources. Refer to Table 4 and Section 2.2.4 for more details on regional practices by cotton type.
The matrix in Table 4 is a first step towards identifying low carbon farming practices for the current cotton landscape and is intended to provide stakeholders with a qualitative perspective to better understand the differences in cotton farming practices on a regional level. The matrix has been developed based on review of existing LCA data and other literature, so results should be interpreted carefully, as cotton farming conditions are very site specific and there are many variables that can affect the field performance. Individual farm management practices influence GHG emissions and even similar systems can have significant variations between farms.

Fashion Industry Charter for Climate Action | Raw Materials Working Group | Fashion Industry Charter for Climate Action | Raw Materials Working Group Fashion Industry Charter for Climate Action | Raw Materials Working Group | Fashion Industry Charter for Climate Action | Raw Materials Working Group
Fashion Industry Charter for Climate Action | Raw Materials Working Group | Fashion Industry Charter for Climate Action | Raw Materials Working Group Fashion Industry Charter for Climate Action | Raw Materials Working Group | Fashion Industry Charter for Climate Action | Raw Materials Working Group
3938
COTTON MATRIX
KEY
?
Variable (positive or negative)
Positive effect
Negative effect
Lack of data to report on effects
No effect: This outcome does not change the status quo or direct causal relationship has not been established.
Inconclusive Medium effect
Positive under certain conditions
Negative under certain conditions
Table 4. Qualitative Cotton Matrix evaluating the effects of various environmental and agronomic factors on yield, fiber quality, soil health, water use efficiency and GHG impacts, by country and cotton type. (CC: Conventional cotton; OC: Organic cotton; BCI: Better Cotton Initiative; CmiA: Cotton made in Africa, RA: Regenerative Agriculture; RC: Mechanically Recycled Cotton)
Factor Sub-type What the effects on Countries by Cotton Type (US: United States, AU: Australia, BR: Brazil, CN: China, IN: India, PK: Pakistan, TU: Turkey, TZ: Tanzania, KG: Kyrgyzstan, TJ: Tajikistan, RAF: Africa (Burkina Faso, Cameroon, Zambia, Ivory Coast, Benin, Mozambique, Malawi)
Inference
1. Yield
2. Soil Health
3. Fiber quality
4. Water use efficiency
5. GHG Impact? CC OC BCI CmiA RA RC
1. Species/ Cultivars
a. GMO
?
US; AU; BR; IN; CN; PK IN; CN; PK Eliminates or delays application of insecticides; promotes natural predation; and reduces water/soil pollution. While GMO cotton has been effective in Australia and US, the cotton productivity was low in India as it was not suited to rainfed and high input fertilizer conditions.
b. Non-GMO? ?
TU IN; CN; US; TU; TZ; KG; TJ
IN; CN; PK RAF US Highly variable. Depends on agronomic factors.
2. Water requirements
a. Rainfed IN (65-67%): [Maharashtra (~90%), Gujarat (~40%), Madhya Pradesh (<20%), Punjab & Haryana (<10%), Karnataka (100%), Tamil Nadu & Andhra Pradhesh (up to 70%)] ;BR (~95%), CN (up to 40%):[Yellow river (up to 30%); CN-Yangtze river (up to 44%)]; US (60%): [Southeast (up to 70%), Mid-South (up to 40%), Southwest (up to 40%)]; PK (<10%); AU (<25%)
CN (up to 40%),US (60%): [Southeast (up to 70%), Mid-South (up to 40%), Southwest (up to 40%)], TZ, KG (few areas), TJ
IN (at least 70%); CN (up to 40%); PK (<10%)
RAF US No energy requirements as pumping energy for irrigation is not required, so lower GHG emissions. Erratic rainfall patterns can affect yields and may have some minimal effects on fiber length.
b. Furrow/Flood irrigation
IN (33-35%); US (15%); CN (60-100% in some areas); PK (~90%); AU; TU (80-90%); BR (<5%)
IN (33-35%); TU (80-90%); CN-Xinjiang; US (15%); TJ (few areas); KG (most areas)
IN (<30%); CN; PK (~90%) Yield increases only if optimal water is applied, otherwise there is no change. Soil salinization if excess water is applied, high water losses due to evaporation, deep percolation (plant nutrients infiltrate below root zone). Energy for operating irrigation pumps are a key contributor to GHG emissions but this could be offset if higher yields are achieved.
c. Drip irrigation
AU, US (1.2%), CN-Xinjiang (some parts), TU (few areas), IN-Central (~3-4%): [Gujarat (30%), Andhra Pradesh, Madhya Pradesh]
US (1.2%), TU (few areas)
CN (few areas) Most efficient irrigation and maximizes water use efficiency but energy requirements are higher. Higher GHG emissions could be offset by increasing the yields. Minimizes losses to evaporation and reduced weed growth. Can cause localized soil salinity if excess water is applied. Suitable for light textured soils.
d. Sprinkler irrigation
AU; US (24%); TU (few areas) US (24%); TU (few areas)
CN (few areas) Yield increases only if optimal water is applied, otherwise there is no change. Water efficient but energy requirements are higher, resulting in GHG emissions. Higher GHG emissions could be offset by increasing the yields. Localized soil salinization if excess water is applied, water losses from drift.
e. Deficit irrigation
No data No data No data Relieves pressure on water supplies; and preferable for regions with low water availability as it minimizes negative impacts to yield or quality if used optimally. Soil salinization could be an issue.
3. Crop residue management
a. Left on field
?
IN; CN; US; AU; BR; PK; TU US; CN; TZ; TU; PK; IN (some parts)
IN; CN; PK RAF (~75%) US Benefits long term soil health; builds more resilient systems; potential to increase yields under optimal conditions; and reduces usage of synthetic fertilizers. Decomposition of residues releases nitrous oxide emissions, contributing to field GHG emissions.
b. Burning of stalks ?
IN-North (Punjab/Haryana) IN-North (Punjab/Haryana)
RAF (25% farmers burn residues)
Burning of cotton stalks results in release of GHG emissions from the field.
c. Use as animal feed
IN IN IN Prevalent in some areas in India.
d. Used as cooking fuel, firewood
IN IN; KG IN Prevalent in some areas in India.

Fashion Industry Charter for Climate Action | Raw Materials Working Group | Fashion Industry Charter for Climate Action | Raw Materials Working Group
Fashion Industry Charter for Climate Action | Raw Materials Working Group | Fashion Industry Charter for Climate Action | Raw Materials Working Group
4140
Factor Sub-type What the effects on Countries by Cotton Type (US: United States, AU: Australia, BR: Brazil, CN: China, IN: India, PK: Pakistan, TU: Turkey, TZ: Tanzania, KG: Kyrgyzstan, TJ: Tajikistan, RAF: Africa (Burkina Faso, Cameroon, Zambia, Ivory Coast, Benin, Mozambique, Malawi)
Inference
1. Yield
2. Soil Health
3. Fiber quality
4. Water use efficiency
5. GHG Impact? CC OC BCI CmiA RA RC
4. Fertilizer
a. Synthetic?
US; AU; BR; IN; CN; PK; TU IN; CN; PK RAF GHG emissions from production of synthetic fertilizers and field emissions from fertilizer application. Higher yields could offset the overall GHG impacts.
b. Organic
?
IN;TU;CN;PK; US IN; CN; US; TU; TZ; KG; TJ
IN; CN; PK RAF US Improves soil health; and reduces reliance on synthetic fertilizer, field emissions from compost/manure application. Lower GHG emissions if self-generated compost/manure is applied and if soil has high organic matter and there is minimal soil organic carbon loss.
5. Pesticide/Herbicide/Insecticides
a. Synthetic ? US; AU; BR; IN; CN; PK; TU IN; CN; PK RAF GHG impacts from pesticide production is negligible, yields is the key determinant.
b. Organic?
IN IN; CN; US; TU; TZ; KG; TJ
IN; CN; PK RAF US Reduces pest incidence; and reduces need for synthetic pesticides.
6. Cropping System
a. Monocropping ?
IN; US; BR; AU; CN-Xinjiang; TU; PK IN; US-Southwest; CN-Xinjiang; TU; TZ; KG; TJ
IN; CN;PK Soil degradation; fertilizer and pesticide overuse; higher yields achieved under optimal conditions but GHG emissions are higher due to field emissions from higher fertilizer application and fertilizer production impacts
b. Crop rotation
?
IN; US; CN IN-Central (Madhya Pradesh); IN-North (Punjab & Haryana) ; CN; US; TU; TZ; KG; TJ
IN; CN;PK RAF US Increases yields; improves soil health; mitigates losses of soil organic carbon resulting from cultivation; and stimulates beneficial insects and soil microbes. Practice subject to water availability. Rainfed areas with supplemental irrigation could practice crop rotation.
c. Intercropping/cover cropping
Intercrops: IN (few areas); AU (<10%) Intercrops: IN-Central (Madhya Pradesh); US-Southwest; TU
Intercrops: IN-Central: Maharashtra (10%)+Madhya Pradesh (65%);IN-South
US Subject to water availability and resources. Reduces incidence of pests; reduces insecticide use; protects other species; and maintains ecological productivity.
7. Tillage practices
a. Conventional tillage
?IN; US (35%); AU; BR; TU; PK; CN IN; US; TU; TZ; KG;
TJ; CNIN; CN;PK RAF Affects long term soil productivity due to erosion and loss of organic matter in
soils, and increasing field emissions.
b. Conservation tillage
?US(19%); BR; AU (some areas) RAF Reduced field fuel usage, Potential to reduce soil organic carbon losses, reduced
GHG emissions under optimal conditions. GHG savings may be negated if yields are low and if fields are ploughed every few years.
c. No-till?
US(45%) US US Reduced field fuel usage, improves soil health, builds soil organic carbon, thereby reducing field emissions. GHG savings from no-till may be negated if yields are low due to inefficient use of water and fertilizer inputs.
8. Harvest
a. Traditional-hand picked
?IN; CN (some parts); PK; TU IN; CN; TU; TZ;
KG; TJIN; PK RAF Small holder farms in India and Africa. Hand-picked cotton so no energy
requirements and lower trash content. Lower GHG emissions.
b. Mechanical?
US;AU; BR; CN-Xinjiang US;CN CN Use of defoliant; High field fuel usage, results in higher GHG emissions; Ginning equipment requires higher trash removal capability; Excessive use of mechanical equipment can result in soil compaction.
9. Ginning
a. Saw ginning CN; US (90%); BR; AU; PK CN; US (90%) CN; PK RAF-Mozambique, Burkina Faso, Benin, Malawi
Roller ginning has lower lint yields compared to saw ginning so more energy is required to process seed cotton. Roller ginning preserves fiber quality and is used for long staple fibers. Saw gin is preferred for upland cotton. Main barrier for adopting saw gin is high capital cost for ginning equipment. Roller ginning more suitable for small holder farms
b. Roller ginning
IN; US (10%); TU IN; US (10%); TU; KG; TZ
IN RAF-Zambia, Ivory Coast
Section 2.2.2 provides details on the data and conditions used to determine positive and negative effects of nine key factors on the climate impacts for the scope defined in this study.
Section 2.2.1.4 shows the potential Soil Organic Carbon (SOC) sequestration for certain regenerative farming practices highlighted in the above matrix for one season of cotton cultivation on one hectare, by estimating the GHG mitigation potential
in metric ton CO2e per hectare per year from published literature (refer to Table 20 for details on the data sources). Data for the farm management practices are geographically limited to USA and are based on a combination of soil measurements
and estimations. Regenerative agriculture has tremendous mitigation potential but it is necessary to invest in research and data collection over a prolonged period to determine the benefits of this farming system accurately.
Fashion Industry Charter for Climate Action | Raw Materials Working Group | Fashion Industry Charter for Climate Action | Raw Materials Working Group
Fashion Industry Charter for Climate Action | Raw Materials Working Group | Fashion Industry Charter for Climate Action | Raw Materials Working Group

Fashion Industry Charter for Climate Action | Raw Materials Working Group | Fashion Industry Charter for Climate Action | Raw Materials Working Group
Fashion Industry Charter for Climate Action | Raw Materials Working Group | Fashion Industry Charter for Climate Action | Raw Materials Working Group
42
2.2.1.4 Soil Organic Carbon Sequestration Potential
Figure 9. Examples of Soil Organic Carbon Sequestration potential per hectare per year for regenerative cotton farming practices in USA. Refer to Section 2.2.5.2 for more details.
*The categories of agricultural practices shown above include the following:
• Improved Agronomy practices: cropping frequency, high-residue crops selection, soil tillage reduction, water use maximization, mulch application, perennial grass, grass/legume mix.
• Crop Management: crop variety improvement, crop rotations, perennial crop additions, bare soil reduction.
• Nutrient Management: application rates adjustment, preference for slow-release fertilizers and nitrification inhibitors, time delay reduction between application and uptake, fertilizers placement, excess prevention.
• Tillage & residue management: minimal tillage, no tillage, crop residue retention, no residue burning.
• Agroforestry (growing trees on crop land): implementation of shelter belts, riparian areas, and buffer zones with trees.
2.2.2 Factors influencing variability in climate impacts for the cotton
cultivation phase
Data from existing cotton LCAs presented in Section 2.2.1 indicate that climate impacts can vary two to three fold within the same country, depending on the region and method of cotton cultivation. Regions which deploy intensive crop production systems including
mechanization of harvest and other field operations, irrigation pumps, fertilizer and pesticide application, are likely to consume more fuel and energy resources, thus improving the crop productivity. Although increasing the energy and resource inputs will
BEAM compost application,New Mexico, USA
Conservation tillage andcover crop, Southeastern USA
Conservation tillage,Southeastern USA
No-till with crop rotation,Southeastern USA
No-till cotton with covercropping, Southeastern USA
No-till cotton without cover-cropping, Southeastern USA
USA
Crop residue incorporation,USA
Improved nutrientmanagement, USA
Impreved cropmanagement, USA
Improved agronomypractices, USA
0 -5 -10 -15 -20 -25 -30 -40-35
Tillage*
Agroforesty*
Agronomic/CropManagement Practices*
Tillage & Residuemanagement*
Compostapplication
MT Co2e per ha per year

Fashion Industry Charter for Climate Action | Raw Materials Working Group | Fashion Industry Charter for Climate Action | Raw Materials Working Group
Fashion Industry Charter for Climate Action | Raw Materials Working Group | Fashion Industry Charter for Climate Action | Raw Materials Working Group
43
also drive higher GHG emissions per unit of area, the increase in GHG emissions per unit of area is potentially offset when accounting for increased yield. More intensive cotton production systems may in some instances have lower GHG impacts on a mass basis (per kg of cotton), as more cotton is produced on the same area of land.
The subsequent sections provide an overview of the landscape of cotton cultivation in the top cotton producing countries and highlights the key pivotal factors that influence climate impacts associated with cotton farming for seven different cotton types.
Yield is a key determining factor
Cotton productivity is the main factor influencing the climate impact of ginned cotton lint. In 2019, India, the world’s leading cotton producer, accounted for 36.5% of the global planted cotton area, but Indian cotton
6 International Cotton Advisory Committee (ICAC); March 2020.7 Harvest index is the proportion of harvestable cotton bolls versus the total plant biomass.8 The lint yield from ginning process.9 International Cotton Advisory Committee (ICAC); March 2020.10 2025 Sustainable Cotton Challenge Second Annual Report 202011 ICAC Cotton Yield Statistics; For Conventional US: Based on 2017-2018 USDA survey; For Organic cotton: Textile Exchage Organic Cotton
Market Report; For CmiA: Estimated from ICAC 2019 graph (Figure 1 cotton yields 2018); https://icac.org/Content/PublicationsPdf%20Files/e88a55db_6faf_417d_aeb8_4bdfb04cfe9a/e-cotton-recorder2_2019.pdf.pdf
yields were nearly half those of China, Brazil, USA and Australia6. Table 5 provides the yields, by country, region and cotton type. Countries such as Australia, Brazil, China and USA exhibit higher yields due to the adoption of High-Density Planting (HDP) system, a practice of growing cotton for a short duration, thereby reducing exposure to pests and diseases. The cotton harvest index7 and ginning turnout8 is also higher for these countries (0.4-0.5 harvest index and 38-45% ginning) compared to India and Africa, which has a harvest index of 0.2-0.3 and a poor ginning turnout of 32%-34%9. It should be noted that productivity can vary significantly within a country/region. For example, in USA, the productivity of Far West region is nearly 40% more than Southwest region. In China, northwest region has the highest yields compared to Yellow river and Yangtze river regions. Yields are low in Africa due to poor regulation and weak infrastructure management (supply of illegal and counterfeit agricultural inputs).
Table 5. Yield statistics by region and cotton type (CC: Conventional cotton; OC: Organic cotton; BCI: Better Cotton Initiative; CmiA: Cotton made in Africa).
CountryRegion (reported based on data availability)
Cotton Type
Production
(1000 MT) (as of 2017/2018)10
Percent of Production
Yield (kg/ha) (2017/2018)11
Global TOTAL 26,664 100% of OC, CC,
BCI and CmiA
778 (Average
130-2088)
India North + Central + South CC 5,664 27% of Global CC 506
India Central: Maharashtra CC 1,252 22% of Indian CC 326
India Central: Gujarat CC 1,765 28% of Indian CC 672
India Central: Madhya Pradesh CC 310 6% of Indian CC 624
India North: Punjab, Rajasthan, Haryana CC 858 15% of Indian CC 628
India South: Andhra
Pradesh,Telangana,Karnataka,
Tamil Nadu
CC 1,287 20% of Indian CC 559
India North + Central + South OC 86 48% of Global OC 378
India North + Central + South BCI 572 18% of Global BCI 632
China Northwest (Xinjiang), Yellow River
Basin, Yangtze River Basin
CC 4768 23% of Global BCI 1,558

Fashion Industry Charter for Climate Action | Raw Materials Working Group | Fashion Industry Charter for Climate Action | Raw Materials Working Group
Fashion Industry Charter for Climate Action | Raw Materials Working Group | Fashion Industry Charter for Climate Action | Raw Materials Working Group
44
CountryRegion (reported based on data availability)
Cotton Type
Production
(1000 MT) (as of 2017/2018)10
Percent of Production
Yield (kg/ha) (2017/2018)11
China Xinjiang OC 39 22% of Global OC 1,927
China BCI 1188 23% of Global BCI 2,267
USA Far West + Southwest + Mid-South
+ Southeast
CC 4036 20% of Global CC 999
USA Far West:
California, Arizona, New Mexico
CC 323 8% of USA CC 1,612
USA Southeast: Alabama, Georgia, North
Carolina, South Carolina, Virginia
CC 888 22% of USA CC 934
USA Mid-South: Louisiana, Mississippi,
Tennesse, Arkansas, Missouri
CC 928 23% of USA CC 1,230
USA Southwest: Texas, Oklahoma, Kansas CC 1897 47% of USA CC 914
USA Southwest + FarWest +S outheast OC 5.4 3% of Global OC 510
Pakistan Punjab & Sindh CC 1087 5% of Global CC 717
Pakistan Punjab & Sindh BCI 701 14% of Global BCI 864
Brazil Matto Grosso & Bahia CC 468 2% of Global CC 1,561
Australia Queensland & New South Wales CC 796 4% of Global CC 1,737
Turkey CC 819 4% of Global CC 1,685
Turkey Aegean and South East Anatolia OC 12 7% of Global OC 2,151
Kyrgyzstan Jala-Abad OC 22 12% of Global OC 1,525
Tajikistan Fergana Valley, Northern Tajikistan,
Khujand
OC 8.9 5% of Global OC 1,123
Tanzania Meatu and Mwasa District OC 4.9 3% of Global OC 120
Zambia Southern, Central, Eastern, Lusaka,
North-Western
CmiA 34.3 6% of total CmiA 350
Mozambique Nampula, Niassa, Zambezia CmiA 16.4 3% of total CmiA 200
Malawi Central Lilongwe, Northern Mzuzu CmiA 0.863 0.6% of total CmiA 220
Ivory Coast Denguele, Zanzan, Vallee Du Bandama,
Lacs, Woroba, Savanes
CmiA 140.8 24% of total CmiA 452
Burkina Faso Hauts-bassins, Boucle Du Mouhoun CmiA 258 44% of total CmiA 274
Benin Alibori, Sub-ouest, Atakora CmiA 11.2 2% of total CmiA 415
12 The average staple length of fiber obtained from G. hirsutum (upland cotton) varieties lies in the range of 29-31mm.
Yields vary from country to country (region to region within a country, producer to producer and year to year), depending upon factors such as farming practices, climatic conditions, water availability, soil quality, pest pressure, and farmer resources. The sections below address the genetic, agronomic and environmental factors that play a key role in influencing cotton yields and climate impacts on a regional level.
2.2.2.1 Genetic composition: Cultivars/Species
Cultivar/species selection determine the fiber quality12 and influence the crop productivity. There are four main species grown commercially:
• Gossypium hirsutum (upland cotton): Species planted on nearly 98% of global cotton area.

Fashion Industry Charter for Climate Action | Raw Materials Working Group | Fashion Industry Charter for Climate Action | Raw Materials Working Group
Fashion Industry Charter for Climate Action | Raw Materials Working Group | Fashion Industry Charter for Climate Action | Raw Materials Working Group
45
• Gossypium barbadense (Egyptian cotton): Extra-long staple length cotton grown in western region of USA, South India, Egypt, smaller areas of Peru, China and Uzbekistan.
• Gossypium arboretum (Desi cotton): Cultivated on about 1-3% of planted cotton area in India, some parts of Pakistan.
• Gossypium herbaceum: Cultivated in India (Gujarat and Karnataka region).
Cultivars/varieties (i.e., GMO cotton) were introduced by genetic modification (GM) via biotechnology to increase cotton yields by developing important traits such as plant protection or herbicide-tolerance. According to a 2018 report published by the Pesticide Action Network (PAN)13, introduction of GMO cotton has had a positive impact in Australia, where the insecticide use dropped by 89%
13 Pesticide Action Network (2018). A Review of Pesticide Use in Global Cotton Production, Is Cotton Conquering Its Chemical Addiction?. pan-uk.14 ICAC Recorder March 2020: Special Issue: Cotton in India: Long-term trends and way forward.15 Based on data provided by Laudes Foundation: Ankur-3028, Ankur-3224, Bhakti, Bond, Bunny, Daftari 29, Daftari 81, Daftari Hira, DS-258,
Durga, Green Gold Namaskar-81, Partech28, SuperAarti, LRA 5166, Mahalaxmi, NCH-207, NCS 9015, NH 615, Nirmal 996, Padma, Padma-131, Padma-141, Padma-151, Padma 161, PARSAHV 101, PARSAHV 909, Partech 28, Partech 29, Partech 30, Partech 32, Partech 61, Raja, Rasi 2
16 Based on data provided by Laudes Foundation: Suvin, Surabhi, GCOT 8, GCOT 11, GCOT 12, GCOT 13, GCOT 15, GCOT, 16, GCOT 17, GCOT 19, GCOT 2117 Same as Maharashtra18 Based on data provided by Laudes Foundation : Extra long staple DCH types (mostly DCH32) in Karnataka. In other regions: NA247, NA920, LRA
5166, Ankur-3028, Ankur-3224, Bhakti, Bond, Bunny, Daftari 29, Daftari 81, Daftari Hira, DS-258, Durga, Green Gold Namaskar-81, LRA 5166, NCH-207, NCS 9015, NH 615, Nirmal 996, Rasi 2, Rasi 134, RCH 569, RCH 314, RCH 515, RCH 530
19 Central India: Ambika 12, Green Gold Namaskar-81, Partech28, SuperAarti, PARSAHV 101, Partech 28, Partech 29, Partech 30, Partech 32, Surabhi, Suraj, Swadeshi-5, Tapti-29, Vasudha 1318 Tamil Nadu: SVPR1, SVPR2, MCU5, MCU6, MCU7, MCU 10 (in the Rice fallows), LRA 5166, Varalakshmi, Suvin, CO2, CO4, Suguna in the
from 1998 to 2013, and the farmers have consistently delivered the highest cotton yields in the world. In India, between 2002 and 2014, the GMO cotton planted acreage increased by 95%. For the initial few years (up to 2006), pesticide use in India fell to half, but the secondary pest problems increased significantly from 45% in 2006 to 95% of cotton fields in 2013, thereby reducing the yields. While Australia, China and USA have had success in adopting GMO cotton, GMO cotton has had little impact on cotton productivity in India. International Cotton Advisory Council (ICAC)14 reports suggest that the GMO variety is not suited to India’s rainfed conditions and is designed to perform under high input conditions of irrigation, fertilizer and pesticides. Table 6 provides a detailed list of species/cultivars grown, by cotton source and region.
Table 6. List of cotton species and cultivars grown by type and by country and region. (CC: Conventional cotton; OC: Organic cotton; BCI: Better Cotton Initiative; CmiA: Cotton made in Africa).
Country Cotton TypeRegion (reported based on data availability) Cotton Cultivar/Species
India CC, BCI Central: Maharashtra GM varieties15 (82%-95% area) of Gossypium
arboreum+Gossypium herbaceum
India CC, BCI Central: Gujarat GM varieties16 79.3% to 96.4% area) of Gossypium
herbaceum (for short and coarse fibers)
India CC, BCI Central: Madhya Pradesh GM varieties17 (80-95% area) of Gossypium
arboreum+Gossypium herbaceum
India CC, BCI North: Punjab, Rajasthan, Haryana GM varieties (>90% area) of Gossypium
hirsutum+Gossypium arboretum
India CC, BCI South: Andhra
Pradesh,Telangana,Karnataka,
Tamil Nadu
Andra Pradesh/Telangana: GM varieties18: 98-99%| Tamil
Nadu: 50.8%
India OC North+Central+South Non-GM varieties of Gossypium arboreum+Gossypium
herbaceum19

Fashion Industry Charter for Climate Action | Raw Materials Working Group | Fashion Industry Charter for Climate Action | Raw Materials Working Group
Fashion Industry Charter for Climate Action | Raw Materials Working Group | Fashion Industry Charter for Climate Action | Raw Materials Working Group
46
Country Cotton TypeRegion (reported based on data availability) Cotton Cultivar/Species
China CC, BCI Northwest (Xinjiang), Yellow River
Basin, Yangtze River Basin
GM varieties of Gossypium hirsutum+Gossypium
barbadense
China OC Xinjiang Gossypium hirsutum+Gossypium barbadense
USA CC Far West: California, Arizona, New
Mexico
GM varieties of Gossypium hirsutum (upland
cotton)+Gossypium barbadense
USA CC Southeast: Alabama, Georgia, North
Carolina, South Carolina, Virginia
Mid-South: Louisiana, Mississippi,
Tennesse, Arkansas, Missouri
Southwest: Texas, Oklahoma, Kansas
GM varieties of Gossypium hirsutum (upland cotton)
USA OC Southwest + FarWest + Southeast Non-GM varieties of Gossypium hirsutum (upland
cotton)+Gossypium barbadense
USA OC Southwest (Texas) Non-GM varieties of Gossypium hirsutum (upland cotton)
USA OC Far West (New Mexico) Non-GM varieties of Gossypium hirsutum (upland
cotton)+Gossypium barbadense
USA OC Southeast (North Carolina) Non-GM varieties of Gossypium hirsutum (upland cotton)
Pakistan CC, BCI Punjab & Sindh GM varieties20 of Gossypium hirsutum+Gossypium
arboreum
Brazil CC Matto Grosso & Bahia GM varieties
Australia CC Queensland & New South Wales GM varieties
Turkey CC - Non-GM varieties
Turkey OC Aegean and South East Anatolia Non-GM varieties
Kyrgyzstan OC Jala-Abad Non-GM varieties
Tajikistan OC Fergana Valley, Northern Tajikistan,
Khujand
Non-GM varieties
Tanzania OC Meatu and Mwasa District Non-GM varieties
Zambia CmiA - Non-GM varieties
rainfed drylands20 Based on data provided by Laudes Foundation: NS-121, Ali Akbar-703, FH, Lalazar, FH-142, NMH-886, IUB-12, BS-15, FH-14221 ICAC Recorder March 2020: Special Issue: Cotton in India: Long-term trends and way forward.
The key takeaways are highlighted below.
• Use of GMO seeds is strictly prohibited in CmiA and Organic certification schemes. However, conventional cotton and BCI cotton permit the use of GMO seeds, which accounts for at least 87% of the global volume of cotton production.
• India is the only country that grows all four cultivated species of cotton and more than 95% of the cotton area in India is covered by F-1 Bt-cotton hybrids (GM varieties).
• India uses Bt hybrid while other
countries use open-pollinated varieties. According to the ICAC 2020 report21, Bt hybrid is a poor choice for rainfed cotton in India and it is better suited for irrigated regions only. Introduction of GMO cotton has not significantly improved India’s cotton yields.
• Turkey is one of the few countries which uses non-GMO seed for conventional cotton farming and is consistently able to maintain high cotton yields.
• Appropriate selection of high yielding cotton varieties with high nutrient

Fashion Industry Charter for Climate Action | Raw Materials Working Group | Fashion Industry Charter for Climate Action | Raw Materials Working Group
Fashion Industry Charter for Climate Action | Raw Materials Working Group | Fashion Industry Charter for Climate Action | Raw Materials Working Group
47
use efficiency, and drought and pest tolerance can improve crop productivity, thereby reducing the GHG emissions.
2.2.2.2
Climatic Conditions
Cotton is grown mainly in the longitudinal band between 37°N and 32°S, in predominantly semi-arid, sub-tropical, tropical regions, but cultivation has been extended to 45°N in China (colder climate in northwest region). It has high tolerance for stress and can sustain high temperatures, with mean temperature ranging from 28°C in China to 37-40°C in India and Pakistan. According to ICAC, the basic conditions for cotton boll formation is a long frost-free period 18-32°C and 600-1200mm of water during the 125-175 day crop cycle22. While the crop can tolerate higher temperatures, boll formation is sensitive to excessively high temperatures over 41°C and could
22 FAO. 2012. Crop yield response to water. FAO Irrigation and Drainage Paper No. 66. Rome.23 Ton, Peter. “Cotton and climate change: impacts and options to mitigate and adapt.” International Trade Centre (2011): 1-17.24 Estimated from ICAC World Cotton Production Statistics (2017/2018). Includes all types of cotton.25 ICAC Statistics 2016-201726 2019 CRDC Australian Grower Survey
negatively affect the yields23, thereby increasing the GHG emissions.
2.2.2.3
Farm Size
Farm size could influence the efficiency of inputs (fertilizers, pesticide, fuel, irrigation, etc.) depending on the farming systems (mechanized versus traditional) and determines the feasibility for farmers to adopt certain field practices. Intensively mechanized farming systems require larger amount of energy and resource inputs and are prevalent in larger farms, as opposed to traditional farming systems (e.g. manual harvest) in smallholder farms. Data presented in Table 7 shows that majority of the countries except Australia, Brazil, USA, Turkey and Kyrgyzstan are smallholder farms with an average farm size of less than 1.2 hectares. Nearly 70% of cotton production occurs on small holder farms (based on Table 7).
Table 7. Cotton farm size, by country. [Small: <5hectares; Medium: 5-20 hectares; Large: >20 hectares).
Country Region (reported based on data availability)
Approximate Percent of Global Production24
Farm size
National Farm Size Statistics(ha)25
India North + Central + South 22.8% Small 1-5 (average 1.2ha)
China Northwest (Xinjiang), Yellow River Basin,
Yangtze River Basin
18.6% Small -
Medium
Small <1 (0.4)
Medium: no data available
USA Far West + Southwest +Mid-South+
Southeast
16.6% Large 313 ha
Pakistan Punjab & Sindh 7.2% Small 1.3 ha
Brazil Matto Grosso & Bahia 5.8% Large > 3,000 (average 757 ha)
Australia Queensland & New South Wales 3.7% Large Up to 5,000 (average 4,404 ha)26
Turkey Aegean and South East Anatolia 2.9% Medium
Small
10-25 ha (conventional cotton)
5 ha (organic cotton)
Kyrgyzstan Jala-Abad 0.041% Medium 10-20 ha
Tajikistan Fergana Valley, Northern Tajikistan, Khujand 0.34% Small No data available
Tanzania Meatu and Mwasa District 0.25% Small 0.9 ha

Fashion Industry Charter for Climate Action | Raw Materials Working Group | Fashion Industry Charter for Climate Action | Raw Materials Working Group
Fashion Industry Charter for Climate Action | Raw Materials Working Group | Fashion Industry Charter for Climate Action | Raw Materials Working Group
48
Zambia Southern, Central, Eastern, Lusaka, North-
Western
0.17% Small 0.7 ha
Mozambique Nampula, Niassa, Zambezia 0.09% Small 0.7 ha
Malawi Central Lilongwe, Northern Mzuzu 0.08% Small 0.6 ha
Ivory Coast Denguele, Zanzan, Vallee Du Bandama,
Lacs, Woroba, Savanes
0.65% Small 3.6 ha
Burkina Faso Hauts-bassins, Boucle Du Mouhoun 1.1% Small 1.2 ha
Benin Alibori, Sub-ouest, Atakora 0.73% Small 1.4 ha
27 i.b.id.28 Calculated based on 2019 CRDC Australia Grower Survey29 Ullah, Asmat, Sylvain R. Perret, Shabbir H. Gheewala, and Peeyush Soni. “Eco-efficiency of cotton-cropping systems in Pakistan: an integrated
approach of life cycle assessment and data envelopment analysis.” Journal of Cleaner Production 134 (2016): 623-632.30 FAO http://www.fao.org/land-water/databases-and-software/crop-information/cotton/en/
The 2019 CRDC Australia grower farm survey27 compares energy (diesel and electricity) and resource use (fertilizer, irrigation) data for small (defined as <1000 ha), medium (1000-5000 ha) and large size farms (>5000 ha) covering New South Wales and Queensland region in Australia. The survey found that large size farms (irrigated farms) required 6% more fertilizer input per ha (kgN/ha), 20% more irrigation water per ha, approximately 40% lower energy requirements compared to small size farms (<1000 hectares). The average yield of large size farms was 19% higher than small and medium size farms so although large farms use more fertilizer inputs and release more nitrous oxide emissions, the increase in inputs in negated by the higher cotton yields28.
Ullah et.al29 evaluated the potential influence of farm size on climate impacts for cotton grown in Pakistan and found that overall, due to lower yields, small size farms had 10% higher GHG impacts compared to medium size farms and 9.7% higher GHG impacts compared to large size farms. The GHG impacts are not significantly higher for small farms as the farming systems in Pakistan are traditional across all the farm sizes
considered in the study. The study found that yields were more variable in small size farms and homogeneous in medium size farms.
2.2.2.4 Soil Conditions
Cotton is cultivated on a wide range of soils but medium and heavy textured, deep soils with good water retention capacities are preferred. Acid or dense subsoils have the potential to limit root penetration so a soil pH range between 5.5 to 8, with 7 to 8, is regarded as optimum30. The soil type determines water intake, storage, and availability to the plant and can also influence the level of field emissions. Table 8 provides an overview of the various soil types and compares the key soil characteristics for each soil type such as water intake rate and Readily Available Water (RAW). The water intake rate of the soil under irrigation is affected by many factors such as soil texture, soil structure, compaction, organic matter, salts, water quality etc. Readily Available Water (RAW) is the amount of water in the soil that plants can easily take up before severe water stress occurs.

Fashion Industry Charter for Climate Action | Raw Materials Working Group | Fashion Industry Charter for Climate Action | Raw Materials Working Group
Fashion Industry Charter for Climate Action | Raw Materials Working Group | Fashion Industry Charter for Climate Action | Raw Materials Working Group
49
Table 8. Comparison of soil types and properties.
Soil Type Clay content % Soil Texture Water Intake Rate Water Retention
RAW
(mm or l per m2) 31 Drainage
Sand <10% (often <5%) Coarse Very high Very low 40 Very good
Loamy sand 5-10% Coarse High Low 60 Good
Sandy loam 10-20%Moderately
coarseModerately high Moderately low 70 Good
Loam ~25% Medium Medium Moderately high 90 Moderate
Sandy clay loam >=25% Fine Moderately low High 80 Moderate
Clay loam 20-30%Moderately
fineModerately low High 80 Poor
Light clay 35-40% Fine Low High 70 Very poor
31 RAW: Readily Available Water is the amount of water in the soil that plants can easily take up before severe water stress occurs 32 FiBL (2020);Good Agricultural Practices in Irrigation Management.33 Data source for India: Laudes Foundation and for other regions: based on review of background data cited in LCA studies.
The available water is lower in sandy soils compared to clay and loamy soils as sandy soils have larger particles and pores that hold the water less tightly. However, water intake is very high so water is readily available for cotton crops in sandy soils. Conversely, clay soils have high water retention capacity, but the particles are finer and bind the soil more tightly, so less water is available to the plant. Loamy soils have good pore space to hold moisture and do not bind the soil water tightly enough to prevent plants from
extracting the water. As a result, loamy soils have more water available to the plant and have good water retention capacity32. For optimum cotton growing conditions, deep soils (Vertisols/black cotton, clay loam, sandy clay loam) and medium textured soils (loamy) are preferred. Table 9 summarizes the soil type on a country and regional level, by cotton source. Cotton cultivated in soils with high organic matter minimizes soil carbon loss, contributing to reduced GHG emissions.
Table 9. Soil conditions by region and cotton type. (CC: Conventional cotton; OC: Organic cotton; BCI: Better Cotton Initiative; CmiA: Cotton made in Africa).
Country Region/State/Province Cotton Type Most Common Soil Type/Conditions33
India Central: Maharashtra CC, OC, BCI Deep black cotton soil
India Central: Gujarat CC, OC, BCI Deep black cotton soil
India Central: Madhya Pradesh CC, OC, BCI Deep black cotton soil, shallow sandy loam
soil found in tribal districts
India North: Punjab, Rajasthan, Haryana CC, OC, BCI Alluvial, black cotton and clay loam soil
India South: Andhra Pradesh,Telangana,Karnataka,
Tamil Nadu
CC, OC, BCI Andhra Pradesh: deep clay or black cotton soil
Telangana: shallow red loam
Karnataka: clay loam, red sandy loam and
light clay soil
Tamil Nadu: deep black cotton, clay loam
sandy loam

Fashion Industry Charter for Climate Action | Raw Materials Working Group | Fashion Industry Charter for Climate Action | Raw Materials Working Group
Fashion Industry Charter for Climate Action | Raw Materials Working Group | Fashion Industry Charter for Climate Action | Raw Materials Working Group
50
Country Region/State/Province Cotton Type Most Common Soil Type/Conditions33
China Northwest (Xinjiang), Yellow River Basin, Yangtze
River Basin
CC, OC, BCI Sandy loam, sandy loam, brown/grey desert soil
China Xinjiang CC, OC, BCI Lt4 (default)34
USA Far West:
California, Arizona, New Mexico
CC, OC Aridisols
USA Southeast: Alabama, Georgia, North Carolina,
South Carolina, Virginia
CC, OC Ultisols
USA Mid-South: Louisiana, Mississippi, Tennesse,
Arkansas, Missouri
CC, OC Alfisol
USA Southwest: Texas, Oklahoma, Kansas CC, OC Mollisols
Pakistan Punjab & Sindh CC, BCI Punjab: clay loam soil, loamy and very fine
sandy loam
Sindh: alluvial, clay and loamy
Brazil Matto Grosso & Bahia CC No data
Australia Queensland & New South Wales CC Medium or heavy clay (Vertisols)
Turkey CC, OC Lts 35
Kyrgyzstan Jala-Abad OC No data
Tajikistan Fergana Valley, Northern Tajikistan, Khujand OC Gelisol
Tanzania Meatu and Mwasa District OC Lt436
Africa CmiA No data
34 Retrieved from background data cited in Textile Exchange LCA on organic cotton (specified using the World Soil Database v 1.2 (IIASA 2012)).35 Retrieved from background data cited in Textile Exchange LCA on organic cotton (specified using the World Soil Database v 1.2 (IIASA 2012)).36 Retrieved from background data cited in Textile Exchange LCA on organic cotton (specified using the World Soil Database v 1.2 (IIASA 2012)).37 PE International AG (2014); Life Cycle Assessment of Cotton Made in Africa (CmiA).38 Data provided by Laudes Foundation. 39 Central Institute for Cotton Research (2015); https://www.cicr.org.in/40 Soil and More (February 2018); Feasibility study and strategy development of agricultural emission reduction measures within Rare’s pilot area
in China.
2.2.2.5 Land preparation
Before planting the crop, land needs to be prepared to facilitate favorable seed germination, allow roots of the cotton plant to penetrate the soil and promote healthy growth. The following sections describe the key land preparation activities required for cotton cultivation.
2.2.2.5.1
Crop residue management
In general, the best practice for managing crop residues is to leave on the field as it adds nutrients back into the soil, protects the soil from erosion and retains moisture in the soil. Crop residues are mostly left on the field and
incorporated in the soil in all countries except India and CmiA. Approximately 25-30% crop residue burning occurs in CmiA countries37. In Northern India, some parts of Punjab and Haryana practice open burning of cotton stalks. In other parts of India, stalks are used as cooking fuel or for animal feed38. In Central India, it was found that cotton stalk and wheat straw shredded and incorporated in the soil after crop harvest improved soil fertility and the productivity of cotton- wheat system under irrigated conditions39. Incorporation of crop residue improves soil health and has the potential to increase the crop yields if practiced over a prolonged period of time.
A study conducted by Soil and More40 reported the carbon sequestration potential
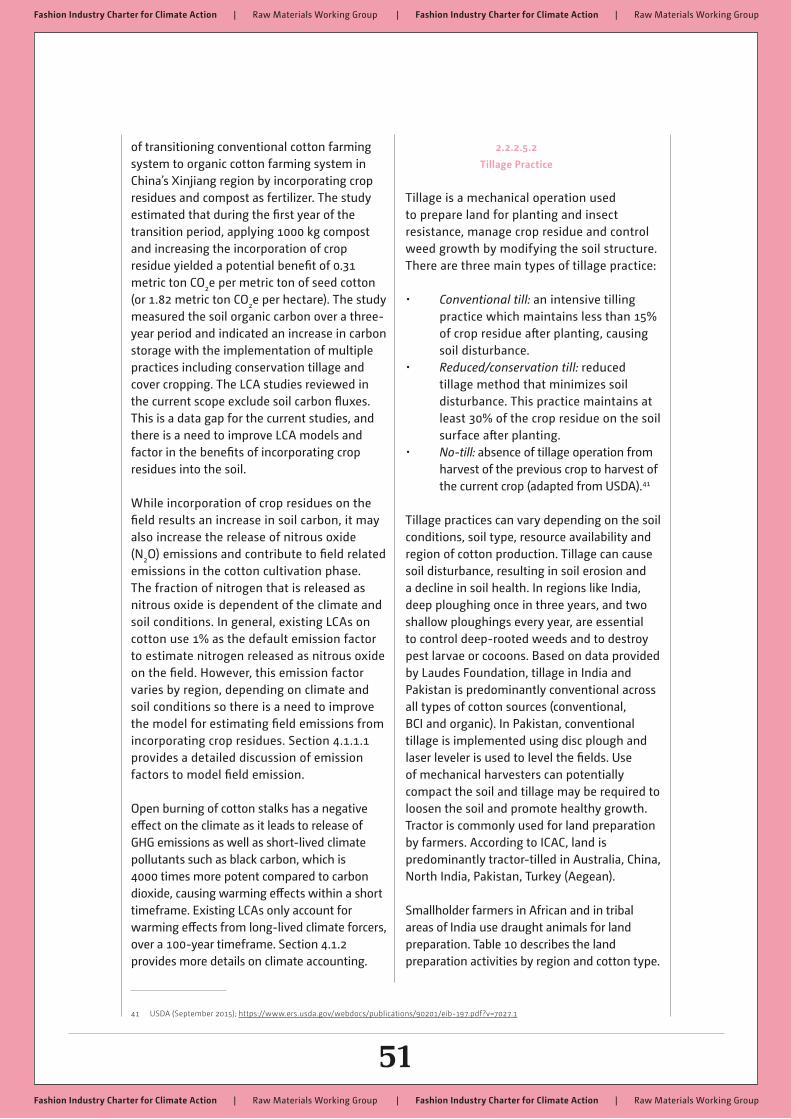
Fashion Industry Charter for Climate Action | Raw Materials Working Group | Fashion Industry Charter for Climate Action | Raw Materials Working Group
Fashion Industry Charter for Climate Action | Raw Materials Working Group | Fashion Industry Charter for Climate Action | Raw Materials Working Group
51
of transitioning conventional cotton farming system to organic cotton farming system in China’s Xinjiang region by incorporating crop residues and compost as fertilizer. The study estimated that during the first year of the transition period, applying 1000 kg compost and increasing the incorporation of crop residue yielded a potential benefit of 0.31 metric ton CO2e per metric ton of seed cotton (or 1.82 metric ton CO2e per hectare). The study measured the soil organic carbon over a three-year period and indicated an increase in carbon storage with the implementation of multiple practices including conservation tillage and cover cropping. The LCA studies reviewed in the current scope exclude soil carbon fluxes. This is a data gap for the current studies, and there is a need to improve LCA models and factor in the benefits of incorporating crop residues into the soil.
While incorporation of crop residues on the field results an increase in soil carbon, it may also increase the release of nitrous oxide (N2O) emissions and contribute to field related emissions in the cotton cultivation phase. The fraction of nitrogen that is released as nitrous oxide is dependent of the climate and soil conditions. In general, existing LCAs on cotton use 1% as the default emission factor to estimate nitrogen released as nitrous oxide on the field. However, this emission factor varies by region, depending on climate and soil conditions so there is a need to improve the model for estimating field emissions from incorporating crop residues. Section 4.1.1.1 provides a detailed discussion of emission factors to model field emission.
Open burning of cotton stalks has a negative effect on the climate as it leads to release of GHG emissions as well as short-lived climate pollutants such as black carbon, which is 4000 times more potent compared to carbon dioxide, causing warming effects within a short timeframe. Existing LCAs only account for warming effects from long-lived climate forcers, over a 100-year timeframe. Section 4.1.2 provides more details on climate accounting.
41 USDA (September 2015); https://www.ers.usda.gov/webdocs/publications/90201/eib-197.pdf?v=7027.1
2.2.2.5.2
Tillage Practice
Tillage is a mechanical operation used to prepare land for planting and insect resistance, manage crop residue and control weed growth by modifying the soil structure. There are three main types of tillage practice:
• Conventional till: an intensive tilling practice which maintains less than 15% of crop residue after planting, causing soil disturbance.
• Reduced/conservation till: reduced tillage method that minimizes soil disturbance. This practice maintains at least 30% of the crop residue on the soil surface after planting.
• No-till: absence of tillage operation from harvest of the previous crop to harvest of the current crop (adapted from USDA).41
Tillage practices can vary depending on the soil conditions, soil type, resource availability and region of cotton production. Tillage can cause soil disturbance, resulting in soil erosion and a decline in soil health. In regions like India, deep ploughing once in three years, and two shallow ploughings every year, are essential to control deep-rooted weeds and to destroy pest larvae or cocoons. Based on data provided by Laudes Foundation, tillage in India and Pakistan is predominantly conventional across all types of cotton sources (conventional, BCI and organic). In Pakistan, conventional tillage is implemented using disc plough and laser leveler is used to level the fields. Use of mechanical harvesters can potentially compact the soil and tillage may be required to loosen the soil and promote healthy growth. Tractor is commonly used for land preparation by farmers. According to ICAC, land is predominantly tractor-tilled in Australia, China, North India, Pakistan, Turkey (Aegean).
Smallholder farmers in African and in tribal areas of India use draught animals for land preparation. Table 10 describes the land preparation activities by region and cotton type.

Fashion Industry Charter for Climate Action | Raw Materials Working Group | Fashion Industry Charter for Climate Action | Raw Materials Working Group
Fashion Industry Charter for Climate Action | Raw Materials Working Group | Fashion Industry Charter for Climate Action | Raw Materials Working Group
52
Table 10. Land preparation/tillage practice by country, region and cotton type. (CC: Conventional cotton; OC: Organic cotton; BCI: Better Cotton Initiative; CmiA: Cotton made in Africa).
CountryRegion (reported based on data availability)
Cotton Type Land preparation/Tillage practice
India North + Central + South CC Ploughing once in two years (by use of tractors and
draught animals in some parts)
India Central: Maharashtra CC Deep ploughing every 2 years
India Central: Gujarat CC Ridge tillage
India Central: Madhya Pradesh CC Every 2-3 years: Ploughing 85% farms and Tillage 15%
farms
India North: Punjab, Rajasthan, Haryana CC Deep ploughing once in two years before sowing
(irrigated cotton-wheat system)
India North + Central + South OC Minimized tillage (use of cattle/buffalo for farm work)
India Central: Madhya Pradesh OC Every 2-3 years: Ploughing 92% farms and Tillage 8%
farms
India North + Central + South BCI Ploughing every 2 years, tractor till and sometimes oxen
used for tilling
India Central: Maharashtra BCI 12% of farms apply mulching
India Central: Madhya Pradesh BCI Every 2-3 years: Ploughing 80% farms and Tillage 20%
farms
China Northwest (Xinjiang), Yellow River Basin,
Yangtze River Basin
CC Mostly tractor till
China Xinjiang OC Ridge tillage
China BCI Mostly tractor till
USA Far West + Southwest + Mid-South +
Southeast
CC 35% Conventional till+19% Conservation Till till+45%%
No till/strip till
USA Southwest + FarWest + Southeast OC Reduced till/No till
Pakistan Punjab & Sindh CC, BCI Ploughing, Mostly tractor till/rotary till
Brazil Matto Grosso & Bahia CC Mostly tractor till
Australia Queensland & New South Wales CC Conventional Tractor till is most areas and minimized till
in some areas
Turkey Aegean and South East Anatolia CC, OC Tractor till
Kyrgyzstan Jala-Abad OC Tractor till
Tajikistan Fergana Valley, Northern Tajikistan,
Khujand
OC fall plow, spring plow, mulch tillage (conventional), zone
tillage (reduced till)
Tanzania Meatu and Mwasa District OC Minimized tillage (use of cattle/buffalo for farm work)
Zambia CmiA Medium-conventional (use of oxen and donkeys)
Mozambique CmiA Medium-conventional (use of oxen and donkeys)
Malawi CmiA Medium-conventional (use of oxen and donkeys)
Ivory Coast CmiA Medium-conventional (use of oxen and donkeys)
Burkina Faso CmiA Medium-conventional (use of oxen and donkeys)
Benin CmiA Medium-conventional (use of oxen and donkeys)

Fashion Industry Charter for Climate Action | Raw Materials Working Group | Fashion Industry Charter for Climate Action | Raw Materials Working Group
Fashion Industry Charter for Climate Action | Raw Materials Working Group | Fashion Industry Charter for Climate Action | Raw Materials Working Group
53
Relationship between tillage practice and cotton yields
According to a field-level survey of USA cotton farmers conducted by USDA in 2015, 45% of the cotton farmers deploy no-till/strip tillage practice, 35% of farmers use conventional tillage and 19% of the farmers use conservation tillage42. Cotton Incorporated43 correlated cotton yields based on the tillage practices (conventional till, conservation or reduced till and no-till) applied by cotton farmers in USA, by region from the 2015 USDA Natural Resource Survey. The results of the survey found that the Far West region44 in USA reported the highest cotton yield under conventional tillage, Mid-south45 and Southwest46 regions reported highest yields using conservation/reduced till and Southeast47 region reported the highest yield for no till/strip till practice.
In India, conventional tillage (one-time disc + two-time cultivator) for irrigated wheat was found beneficial in increasing the yield of irrigated cotton-wheat system. Deep ploughing once in two years before cotton sowing was found effective in increasing the yield of irrigated cotton wheat system. In Central India (Gujarat, Maharashtra and Madhya Pradesh regions), reduced tillage comprising pre-plant herbicide application and one pass of harrow and two interrow cultivation for early and late season weed control, respectively, was found to be a viable practice to improve yields.48
Potential benefits of implementing no-till or conservation tillage practices over conventional till
Long term conventional tillage can have a negative impact on the soil structure, causing soil compaction, increased runoff and soil
42 Daystar, J. S., Barnes, E., Hake, K., & Kurtz, R. (2017). Sustainability trends and natural resource use in US cotton production. BioResources, 12(1), 362-392.
43 Ibid.44 Includes cotton growing states of California, Arizona and New Mexico45 Includes cotton growing states of Mississippi, Louisiana, Tennessee, Missouri, and Arkansas46 Includes cotton growing states of Texas, Oklahoma and Kansas47 Includes cotton growing states of Virginia, North Carolina, South Carolina, Georgia, Alabama and Florida48 Central Institute for Cotton Research (2015); https://www.cicr.org.in/49 Daystar, J. S., Barnes, E., Hake, K., & Kurtz, R. (2017). Sustainability trends and natural resource use in US cotton production. BioResources, 12(1),
362-392.
erosion. Loosening the soil structure increases the release of nitrous oxide emissions from soil, resulting in a significant increase in field emissions, which is the biggest climate hotspot in the cotton production system.
Benefits of conservation tillage include reduced soil erosion, increase in moisture retention, lower fuel usage in tillage machinery and potential to store more carbon in the soil resulting in positive effects on the climate. Daystar et.al49 compared the fuel usage by tillage practice for four regions (Far West, Mid-south, Southwest and Southeast) in USA based on a field survey conducted by USDA in 2015. The analysis found that conservation tillage used 18% less energy compared to conventional till and no-till operations required 49% less energy compared to conventional till. The results highlight the cost and energy savings for cotton farmers, however, when comparing the GHG emissions of cotton, the reduced fuel usage for no-till and conservation till operations did not correlate with reduced GHG emissions.
This indicates that yield is the determinant factor driving GHG emissions of cotton farming. It is to be noted that the limitation of this study is that it did not account for soil carbon and conservation and no-till operations have the potential to mitigate climate impacts due to increase in soil carbon over time.
Although there are benefits of reduced tillage methods, the cotton productivity depends on other variables so there is no clear trend that currently shows an increase in cotton yield due to no-till and reduced till practices. CRDC Australia determined that transitioning towards reduced tillage systems has not only reduced fuel use and increased soil carbon

Fashion Industry Charter for Climate Action | Raw Materials Working Group | Fashion Industry Charter for Climate Action | Raw Materials Working Group
Fashion Industry Charter for Climate Action | Raw Materials Working Group | Fashion Industry Charter for Climate Action | Raw Materials Working Group
54
and moisture retention, but also increased herbicide (glyphosate in particular) use by 20% since 1994.
The recent IPCC report on Land and Climate50 states the soil health benefits of no-till operation implemented consistently over a long-term period as a climate mitigation strategy. However, scientists debate51 that farmers who practice no-till, plough up fields once every few years, which releases the soil carbon that was built over time. This finding is also corroborated in World Resources Institute (WRI)’s latest report52, which states that the potential of no-till is limited if the farmers plough the field every two to three years. Another research article53 notes that soil measurements need to be taken deeper than 30 cm to determine the accuracy of soil carbon storage. The study finds that soils sampled at less than 30 cm depth can bias the results and portray an incorrect trend that shows an increase in soil carbon profile for no-till practice and the authors did not find any evidence of carbon sequestration due to no-till practices.
Modeling reduced till or no-till benefits in LCA
Field emissions are the main contributor to climate impacts in the cotton cultivation phase, so it is very critical to consider the differences in tillage practices to model field emissions. Existing LCAs do not account for the differences in field emissions from tillage practices. For example, in the Cotton Inc LCA, although 45% of cotton farmers in the US practice “no-till” and detailed background data was available for different regions with US, the cotton farming impacts calculated in Cotton Inc’s LCA study54 does not factor the affect to field emissions from tillage practice.
50 IPCC, 2019: Climate Change and Land: an IPCC special report on climate change, desertification, land degradation, sustainable land management, food security, and greenhouse gas fluxes in terrestrial ecosystems [P.R. Shukla, J. Skea, E. Calvo Buendia, V. Masson-Delmotte, H.-O. Pörtner, D. C. Roberts, P. Zhai, R. Slade, S. Connors, R. van Diemen, M. Ferrat, E. Haughey, S. Luz, S. Neogi, M. Pathak, J. Petzold, J. Portugal Pereira, P. Vyas, E. Huntley, K. Kissick, M. Belkacemi, J. Malley, (eds.)]
51 Powlson, D. S., Stirling, C. M., Jat, M. L., Gerard, B. G., Palm, C. A., Sanchez, P. A., & Cassman, K. G. (2014). Limited potential of no-till agriculture for climate change mitigation. Nature Climate Change, 4(8), 678-683.
52 Searchinger, T., Waite, R., Hanson, C., Ranganathan, J., Dumas, P., & Matthews, E. (2018). World resources report: Creating a sustainable food future. Nairobi: UNEP, 1-97.
53 Baker, J. M., Ochsner, T. E., Venterea, R. T., & Griffis, T. J. (2007). Tillage and soil carbon sequestration—What do we really know?. Agriculture, ecosystems & environment, 118(1-4), 1-5.
54 Cotton Inc (2017); LCA update of cotton fiber and fabric life cycle inventory. 55 Based on communication with Cotton Inc.56 Soil and More (February 2018); Feasibility study and strategy development of agricultural emission reduction measures within Rare’s pilot area
in China.
The potential benefits of no-till practices were not accounted in this study55. The soil carbon fluxes are excluded from LCA studies.
The study conducted by Soil and More56 reported the carbon sequestration potential of transitioning conventional cotton farming system to organic cotton farming system in China’s Xinjiang region. The study estimated that over a 4-year transition period, implementing reduced tillage and cover crops could potentially reduce the GHG emissions of cotton farming by 0.77 metric ton CO2e per metric ton of seed cotton (or 3.5 metric ton CO2e per hectare). However, as stated above, caution should be taken while using this result as this is specific to a farm site and it is not appropriate to extrapolate this to other regions due to regional variation in climate, soil conditions and agronomic factors.
It is important to reflect the influence of tillage practices on soil carbon and field emissions while modeling cotton in LCAs in order to make a credible comparison across various cotton sources. Refer to Section 4.1 for more details on improving LCA modeling of cotton.
2.2.2.5.3
Seed planting
Seeds are either planted by hand (in small-holder farming systems) or with precision planters (in large sclae farms in USA, Brazil and Australia). Table 11 provides the average rate of seeds sown per hectare for the top cotton growing countries, by cotton type. India has the lowest seed rate of 2-2.5 kg per hectare due to the use of Bt hybrid seeds which are planted at much lower density compared to other regions. Countries (Australia, USA, China,

Fashion Industry Charter for Climate Action | Raw Materials Working Group | Fashion Industry Charter for Climate Action | Raw Materials Working Group
Fashion Industry Charter for Climate Action | Raw Materials Working Group | Fashion Industry Charter for Climate Action | Raw Materials Working Group
55
and Brazil) practicing high density planting (HDP) report higher yields compared to India
57 Mix of LCA studies ICAC 2018; https://icac.org/Content/PublicationsPdf%20Files/749840fd_cadb_45e0_b8f0_0769abae8edd/erec1_18.pdf.pdf58 Hedayati, M., Brock, P. M., Nachimuthu, G., & Schwenke, G. (2019). Farm-level strategies to reduce the life cycle greenhouse gas emissions of
cotton production: An Australian perspective. Journal of Cleaner Production, 212, 974-985.59 Safaya, S., G. Zhang and R. Mathews (2015) Improving the sustainability of cotton production - An assessment of the Water Footprint of
agricultural practices in C&A’s supply chain, Water Footprint Network, Enschede, The Netherlands.
and Africa, and increased yields leads to reductions in GHG emissions.
Table 11. Seed planting method and seed application rate, by country and cotton type. (CC: Conventional cotton; OC: Organic cotton; BCI: Better Cotton Initiative; CmiA: Cotton made in Africa).
Country Cotton Type Region (reported based on data availability) Seed Rate (kg/ha)57
Australia CC Queensland & New South Wales 1358
Africa CmiA Zambia, Ivory Coast, Burkina Faso, Benin, Mozambique, Malawi 15-38
Brazil CC Matto Grosso & Bahia No data
China CC, BCI Northwest (Xinjiang), Yellow River Basin, Yangtze River Basin 13-35
China OC Xinjiang 35
India CC, BCI North + Central + South 2-2.5
India OC North + Centra + South 2
Kyrgyzstan OC Jala-Abad 40-60
Pakistan CC, BCI Punjab & Sindh 6-10
Tajikistan OC Fergana Valley, Northern Tajikistan, Khujand 100
Tanzania OC Meatu and Mwasa District 13
Turkey CC 51
Turkey OC Aegean and South East Anatolia 35
USA CC Far West + Southwest + Mid-south+ Southeast 13-35
USA OC Southwest (Texas) 13
2.2.2.5.4
Mulching
Mulching is the practice of applying natural or synthetic material such as hay, manure, compost, vermicompost, wood, bark, plastic films, geotextiles, etc. to retain soil moisture by reducing evaporation from the soil surface, prevent weed growth and control erosion. A 2015 study conducted by Safaya et. al59 found that synthetic and organic mulching had the potential to reduce water requirements and achieve potential increases in yields.
Plastic mulch is used widely in arid and semi-arid regions of northern China and in coastal saline-alkali soil type in other countries. Use of synthetic plastic mulch can have a negative
influence on the climate impacts due to the production of plastic films which can be GHG intensive and the disposal of synthetic mulches can often lead to soil pollution.
2.2.2.6 Fertilizer Inputs
Nitrogen (N) is the most important nutrient required for cotton, followed by potassium and either synthetic or organic fertilizer inputs are required to maintain or enhance cotton yields. Nitrogen is applied before planting, during growth and boll formation. Fertilizer production and nitrous oxide emissions from fertilizer application are the

Fashion Industry Charter for Climate Action | Raw Materials Working Group | Fashion Industry Charter for Climate Action | Raw Materials Working Group
Fashion Industry Charter for Climate Action | Raw Materials Working Group | Fashion Industry Charter for Climate Action | Raw Materials Working Group
56
key contributors to GHG impacts in the cotton cultivation phase.
In USA, fertilizer application methods comprise of 33% injection of N into the soil, 14% band application to the surface; 36% broadcasting; and 14% broadcasting followed by incorporation60. In arid regions, it is more efficient to inject or incorporate N into the soil in order to minimize nitrogen oxide emissions through nitrogen volatilization.
CmiA and Organic cotton certification schemes, prohibit the use of synthetic fertilizer inputs in the crop production system and require the farmers to only use organic fertilizer inputs. Organic fertilizer (compost, manure) application (in form of liquid, semi-dry or solid waste) has the potential to improve the soil health and the potential to improve soil organic matter depends on its carbon-nitrogen (C:N) ratio, which is influenced by animal source and diet, as well as the duration and type of storage. Based on field studies, CICR found that for cotton grown in vertisols under rainfed conditions in India, supplementing half of the recommended dose of nitrogen (N) inputs with farmyard manure increased the seed cotton yields61.
Three groups of cotton farmers which apply manure-based compost are identified: 1) Own cattle and allow them to graze freely on cotton fields at the end of the season, resulting in passive fertilizer application; 2) Own cattle and collect manure which is transported to cotton fields by third parties for fertilizer application; and 3) Do not own cattle and purchase organic fertilizers. Kyrgyzstan uses 100% organic fertilizers and regions including China, India, and Tanzania use organic manure on around 30% of farm area62. In regions like Africa and India, smallholder farmers use manure generated by owned cattle as nutrient
60 Daystar, J. S., Barnes, E., Hake, K., & Kurtz, R. (2017). Sustainability trends and natural resource use in US cotton production. BioResources, 12(1), 362-392.
61 Central Institute for Cotton Research (2015); https://www.cicr.org.in/62 ICAC 201863 2019 CRDC Australia Grower Survey Report64 International Cotton Advisory Committee (ICAC); Update on Cotton Production Research (September 2016).65 International Cotton Advisory Committee (ICAC); Update on Cotton Production Research (September 2016).66 2019 CRDC Australia Grower Survey Report67 CRDC (May 2020), Australian Cotton Sustainbility Report; https://www.crdc.com.au/publications/australian-cotton-sustainability-report
inputs for cotton. However, in countries such as Tajikistan, farmers do not own cattle and hence compost and manure is purchased and applied on the farm. In regions like Australia, only one out of three growers have ready access to an economic source of manure (cattle feedlots, poultry lots etc.) or compost and thus organic manure/compost is only used by 36% of farmers as part of their nutrition program in Australia63.
Cotton growing countries including Brazil, India, Pakistan, Turkey and the USA, apply nitrogen synthetic fertilizer at doses of no more than 200 kg of nitrogen per hectare. China and Brazil are one of the leading users of fertilizers for cotton farming. Nitrogen application for cotton farming increased in Brazil over the last 16 years due to two factors: increased cotton yields and the displacement of cotton farms from the north to Cerrado region in Matto Grasso64. According to ICAC’s statistics, the data reveals that fertilizer use per hectare is lower in USA and India compared to China, Brazil and Pakistan65. According to the 2019 cotton grower survey in Australia, an average of 325 kg/ha of nitrogen was used on fully irrigated areas and rainfed cotton used an average of 92.5 kg/ha66. Australia’s 2020 CRDC report indicates that the GHG emissions of irrigated cotton increased by 12.6% over the last five years due to an increase in the application of fertilizers per hectare67.
The majority of the existing LCAs on cotton model impacts use background data collected over a decade ago (2010-2012). As mentioned above, the trend of fertilizer use has been an increasing trend. Table 12 summarizes the national average fertilizer application rates based on the latest available statistics for the top cotton growing nations.

Fashion Industry Charter for Climate Action | Raw Materials Working Group | Fashion Industry Charter for Climate Action | Raw Materials Working Group
Fashion Industry Charter for Climate Action | Raw Materials Working Group | Fashion Industry Charter for Climate Action | Raw Materials Working Group
57
Table 12. National average nitrogen fertilizer application rates based on country and region.
Country Region (reported based on data availability)National Avg N fertilizer use (kgN/ha) based on most recently available data68
India North + Central + South 2013/2014: 120-150kgN/ha
187kg/ha
India Central: Maharashtra 2016: 191kg/ha
India Central: Gujarat 2016: 189kg/ha
India Central: Madhya Pradesh 2016: 128kg/ha
India North: Punjab, Rajasthan, Haryana 2016: Punjab: 181kg/ha| Haryana: 126kg/ha
India South: Andhra
Pradesh,Telangana,Karnataka,Tamil Nadu
2016: Andhra Pradesh: 200kg/ha| Karnataka: 139kg/ha|Tamil
Nadu: 240kg/ha
China Northwest (Xinjiang), Yellow River Basin,
Yangtze River Basin
2013/2014: 300 kgN/ha
USA Far West + Southwest+ Mid-south + Southeast 2017: 107kgN/ha (2017) and
2013/2014: 170-200kgN/ha
USA Far West: California, Arizona, New Mexico California: 109|Arizona: 135
USA South East: Alabama, Georgia, North Carolina,
South Carolina, Virginia
Alabama: 117|Georgia: 126
USA Mid-South: Louisiana, Mississippi, Tennesse,
Arkansas, Missouri
Arkansas: 179|Mississippi, Missouri: 130
USA South West: Texas, Oklahoma, Kansas Texas: 86|Oklahoma: 114
Pakistan Punjab & Sindh 2013/2014: 220-250kgN/ha
Brazil Matto Grosso & Bahia 2013/2014: 180 kgN/ha
Australia Queensland (QLD) & New South Wales (NSW) 2013/2014 National average:191 kgN/ha
Central QLD69: 212 kgN/ha
Darling Downs69: 187 kgN/ha
Southern QLD69: 279 kgN/ha
Northern NSW69: 231 kgN/ha
Macquarie69: 276 kgN/ha
Southern NSW69: 217 kgN/ha
Northwest NSW69: 255 kgN/ha
Turkey 2013/2014: 160-240kgN/ha
Turkey Aegean and South East Anatolia 140-160kgN/ha
Kyrgyzstan Jala-Abad No data
Tajikistan Fergana Valley, Northern Tajikistan, Khujand No data
Tanzania Meatu and Mwasa District No data
Zambia 40kgN/ha
Burkina Faso 44kgN/ha
68 International Cotton Advisory Committee (ICAC); Update on Cotton Production Research (September 2016).69 Hedayati, M., Brock, P. M., Nachimuthu, G., & Schwenke, G. (2019). Farm-level strategies to reduce the life cycle greenhouse gas emissions of
cotton production: An Australian perspective. Journal of Cleaner Production, 212, 974-985.

Fashion Industry Charter for Climate Action | Raw Materials Working Group | Fashion Industry Charter for Climate Action | Raw Materials Working Group
Fashion Industry Charter for Climate Action | Raw Materials Working Group | Fashion Industry Charter for Climate Action | Raw Materials Working Group
58
The main challenge is to deliver the nutrients precisely in an efficient manner; however, farmers tend to apply excessive fertilizer inputs, which results in nutrient run-off and nitrogen losses from the soil. Best practice is to conduct soil testing and assess the nutrient needs of the crop and apply precise amount of fertilizer required by the root system, thereby improving nutrient use efficiency. Regions like USA, Australia have a high rate of soil sampling, with over 80% of the producers sampling soil at least once every two years.
Farmers should be trained to assess nutrient requirements and only apply fertilizer in appropriate quantities. Certification schemes such as CmiA, Organic and Better Cotton focus on training farmers to improve nutrient use efficiency. GHG impacts can be reduced by improving nutrient use efficiency per hectare.
2.2.2.6.1
Modeling fertilizer application in LCA
A review of existing cotton LCAs found the following issues:
• System boundary of organic fertilizers: Majority of the LCAs assume farmyard manure or compost to be burden free, irrespective of whether the farmer purchases manure or owns cattle. As manure and compost has market value, if a farmer is purchasing manure, then the LCA practitioner must assign a burden for producing organic fertilizers. Currently, only the synthetic fertilizer inputs are penalized and all the manure in the product system is assigned zero impact. Refer to Section 3.1 for more guidance on modeling organic fertilizers.
• Modeling nitrous oxide (N2O) emissions: Existing LCAs modeled N2O field emissions using Tier 1 emission factors from IPCC 2006 guidelines are used, which assumes that a default percentage of nitrogen applied (1-1.2%) is released as nitrous oxide emissions.
70 ICAC 2018 data; https://icac.org/Content/PublicationsPdf%20Files/749840fd_cadb_45e0_b8f0_0769abae8edd/erec1_18.pdf.pdf71 De Blécourt, M., Lahr, J., & Van den Brink, P. J. (2010). Pesticide use in cotton in Australia, Brazil, India, Turkey and USA.72 Pesticide Action Network (2018). A Review of Pesticide Use in Global Cotton Production, Is Cotton Conquering Its Chemical Addiction?. pan-uk.
However, this does not account for regional differences in soil, climate and fertilizer types. Since field emissions are the single largest contributors to GHG impacts for the cotton fiber production life cycle, it is necessary to consider the regional variations in soil characteristics, climatic conditions and refine the IPCC 2006 model. Section 4.1.1.1 provides more guidance on modeling nitrous oxide emissions from fertilizer application.
2.2.2.7 Herbicide/Pesticide/Insecticide Inputs
Glyphosate, Pendimethalin and Diuron are the most commonly used herbicides across cotton growing countries. Hand operated sprayers are used in Central India, Pakistan and Africa, whereas motorized manual sprayers are used in more than 70% of the area in South India, China and Kyrgyzstan. Tractor mounted sprayers are used in North India, Turkey, Brazil, Australia and USA70.
Excessive pesticide application, wrong timing of application and inappropriate selection of pesticide has caused pests to develop resistance to insecticides. The best practice for reducing pest pressure is to implement Integrated Pest Management (IPM), a strategy to manage pests with a range of practices to promote natural control from beneficial insects while suppressing pests. IPM strategies include crop rotations, weed control, and native vegetation and refuge crops to house ‘beneficial’ insects, birds, bats and other predators. Certification schemes such as CmiA, Organic, BCI and country level sustainability programs for cotton such as myMBP, REEL, ABRAPA, etc. have integrated IPM strategies for pest management.
Australian cotton growers have reduced the amount of insecticides used in cotton by 95 percent per hectare since 1993, or 97% per bale71. This coincides with the introduction of Bt transgenic cotton and strong uptake by growers of IPM. Pesticide Action Network (PAN)72 found

Fashion Industry Charter for Climate Action | Raw Materials Working Group | Fashion Industry Charter for Climate Action | Raw Materials Working Group
Fashion Industry Charter for Climate Action | Raw Materials Working Group | Fashion Industry Charter for Climate Action | Raw Materials Working Group
59
that use of GMO cotton has had a positive impact in Australia, where the insecticide use dropped by 89% from 1998 to 2013, and the farmers have consistently delivered the highest cotton yields in the world. Brazil increased the rate of pesticide application over a 12-year period from 1994 to 2006, and this was accompanied by increases in cotton yields73.
From an LCA perspective, the impact to climate from pesticide/herbicide/insecticide production is negligible. However, yield losses due to pest damage can have a negative influence on the GHG emissions for cotton. For example, in 2011, cotton yields reduced by 3% due to pest damage in USA74.
2.2.2.8
Water requirements: Rainfed v/s Irrigated farms
While cotton is a fairly drought resistant crop, ICAC’s research indicates that cotton crops require 600-675 mm of water during the entire crop cycle, of which nearly 60% of the water is required during the last 60 days of the crop cycle (i.e., boll formation stage)75. Moisture stress during boll development can cause a significant
73 De Blécourt, M., Lahr, J., & Van den Brink, P. J. (2010). Pesticide use in cotton in Australia, Brazil, India, Turkey and USA.74 Panel, ICAC Expert. “Measuring Sustainability in Cotton Farming Systems—Towards a Guidance Framework.” (2014).75 ICAC 2018 data; https://icac.org/Content/PublicationsPdf%20Files/749840fd_cadb_45e0_b8f0_0769abae8edd/erec1_18.pdf.pdf
decrease in lint yields. Rainfed cotton in some parts of India and Africa are subject to drought patterns. Rainfed cotton yields are lower due to erratic and uneven rainfall. Forty percent (40%) of global area is rainfed and the remaining sixty percent (60%) of the water requirements are met via irrigation. Irrigation is required to ensure crop maturity, to boost cotton yields and ensure good consistent quality fiber.
There are three major types of irrigation systems:
• Sprinkler irrigation: center pivots are most commonly used systems
• Surface irrigation: applying water down a furrow either through tubes or flooding an irrigation basin
• Drip irrigation: surface or subsurface
Irrigation systems must be selected based on irrigation efficiency (higher efficiency is better), crop water needs and optimal wetting pattern. Wetting pattern of irrigation system is influenced by the soil type. The irrigation system can influence the crop productivity. Table 13 provides a comparison of key metrics such as yield, energy use and water use efficiency by type of irrigation method.
Table 13. Comparison of different irrigation systems and efficiencies
Water Requirements
Water use efficiency
Energy Requirements
Water losses
Soil Salinization Yield
Rainfed Variable None Variable Variable Variable
Furrow/Flood
irrigation
25-60% Low High High ↑, if optimal
water is
applied.
Otherwise no
change
Soil salinization, high water
losses due to evaporation,
deep percolation (plant
nutrients infiltrate below
root zone)
Drip irrigation 80-95% High Low Localised ↑ Most efficient water use
Sprinkler
irrigation
60-90% High Medium Localised ↑, if optimal
water is
applied.
Otherwise no
change
Water losses can occur
through drift and
evaporation
Deficit irrigation Depends on
the irrigation
system
Low-High Low-
Medium
Variable Variable
(could be
higher)

Fashion Industry Charter for Climate Action | Raw Materials Working Group | Fashion Industry Charter for Climate Action | Raw Materials Working Group
Fashion Industry Charter for Climate Action | Raw Materials Working Group | Fashion Industry Charter for Climate Action | Raw Materials Working Group
60
Flood irrigation demands more water to reach the crops’ roots and therefore is left on the soil longer before it drains, causing a higher rate of evaporation and thus more accumulation of salts. Water losses are higher in surface irrigation compared to drip and sprinkler irrigation. Typically, drip irrigation only wets part of the soil root zone compared to flood and sprinkler irrigation.
Soil salinization occurs in soils with limited or poor drainage and it is a common issue in semi-arid regions. Salt accumulation can be controlled by the volume of irrigation water.
Table 14 provides an overview of the type of irrigation systems and the distribution of rainfed and irrigated cotton on a regional level, by cotton type.
Table 14. Water requirements specified by country and cotton type. (CC: Conventional cotton; OC: Organic cotton; BCI: Better Cotton Initiative; CmiA: Cotton made in Africa).
CountryRegion (reported based on data availability) Cotton Type Rainfed v/s Irrigation
Irrigation System Type: furrow/drip/sprinkler
India North + Central + South CC
BCI,
OC
65-67% irrigated+
33-35% rainfed
Flood/Furrow (most common)+
drip
India Central: Maharashtra CC, BCI,
OC
Mostly rainfed
(<10% irrigation)
Furrow. Drip irrigation is
practiced in the Marathwada
region
India Central: Gujarat CC Mostly irrigated
(up to 40% rainfed)
Flood/Furrow (most common)+
Drip irrigation adoption has
increased
India Central: Madhya Pradesh CC, BCI,
OC
95% irrigation+
5% rainfed
90% Flood irrigation & less
than 10% drip irrigation
(Groundwater from bore-well)
used
India North: Punjab, Rajasthan, Haryana CC
OC
Mostly irrigated
(<10% rainfed)
Mostly flood/furrow, very less
drip irrigation
India South: Andhra
Pradesh,Telangana,Karnataka,Tamil
Nadu
CC, BCI
OC
Mostly rainfed; up to 30-
40% irrigation
Andhra Pradesh/Telangana:
Furrow irrigation
India Central: Odisha OC Mostly rainfed
China Xinjiang CC 100% Irrigation Furrow+drip
China Yellow river basin CC Mostly irrigated
(up to 30% rainfed)
Furrow
China Yangtze river basin CC Mostly irrigated
(up to 44% rainfed)
Furrow
China Xinjiang OC Irrigation Surface furrow
USA Far West + Southwest + Mid-south
+ Southeast
CC
OC
Up to 60% Irrigated+ Up
to 40% Rainfed
60% Sprinkler (center
pivot)+37% Furrow
(surface)+3% Drip (subsurface)
USA Far West: California, Arizona, New
Mexico
CC 100% Irrigated Furrow+Drip + sprinkler

Fashion Industry Charter for Climate Action | Raw Materials Working Group | Fashion Industry Charter for Climate Action | Raw Materials Working Group
Fashion Industry Charter for Climate Action | Raw Materials Working Group | Fashion Industry Charter for Climate Action | Raw Materials Working Group
61
CountryRegion (reported based on data availability) Cotton Type Rainfed v/s Irrigation
Irrigation System Type: furrow/drip/sprinkler
USA Southeast: Alabama, Georgia,
North Carolina, South Carolina,
Virginia
CC Irrigated (<30%)+Rainfed Furrow+Drip + sprinkler
USA Mid-South: Louisiana, Mississippi,
Tennesse, Arkansas, Missouri
CC Irrigated
(Up to 60%)+Rainfed
Furrow+Drip + sprinkler
USA Southwest: Texas, Oklahoma,
Kansas
CC Irrigated
(Up to 60%)+Rainfed
Furrow+Drip + sprinkler
Pakistan Punjab & Sindh CC
BCI
Mostly irrigated
(<10% rainfed)
Furrow
Brazil Matto Grosso & Bahia CC 95% Rainfed+5%
Irrigated
Australia Queensland & New South Wales CC Mostly irrigated
(<20% rainfed)
Furrow+subsurface/
drip+Sprinkler (highly efficient
overhead microirrigation)
Turkey CC 100% Irrigated 80-90% Flood/Furrow + some
drip and sprinkler
Turkey Aegean and South East Anatolia OC Mostly irrigated
Kyrgyzstan Jala-Abad OC Mostly irrigated
(<30% rainfed)
Mostly furrow
Tajikistan Fergana Valley, Northern
Tajikistan, Khujand
OC Mostly rainfed
Tanzania Meatu and Mwasa District OC Mostly rainfed
Africa Zambia, Ivory Coast, Burkina Faso,
Benin, Malawi, Mozambique
CmiA 100% Rainfed
76 2019 CRDC Australia Grower Survey Report77 Hedayati, M., Brock, P. M., Nachimuthu, G., & Schwenke, G. (2019). Farm-level strategies to reduce the life cycle greenhouse gas emissions of
cotton production: An Australian perspective. Journal of Cleaner Production, 212, 974-985.
Figure 10 qualitatively illustrates the correlation between GHG impacts (on the X-axis) and the yield (on the Y-axis) considering two parameters: (1) distribution of rainfed and irrigation systems and (2) harvest practice, on a regional level for the top cotton growing countries, by cotton type. This figure was created based on review of LCAs and an attempt is made to analyze multiple variables that can affect the GHG impacts, by cotton source.
Irrigation has a higher energy requirement due to pumping energy costs. Diesel usage and electricity usage (for irrigation and pumps) are observed to be higher
for mechanized farming systems in USA, Australia and Xinjiang, China, compared to hand harvested cotton in other countries. In Australia, irrigation pumps use an average use of 140 liters of diesel/ha for pumping water76 and 37-77kWh of electricity per hectare for irrigation77. Although higher fuel usage leads to higher GHG emissions, the increase in GHG emissions is negated by the increase in cotton productivity.
In USA, Southwest and Mid-south regions are predominantly rainfed due to higher levels of precipitation compared to the Southwest and Far West regions. In India’s rainfed cotton region, due to inefficient water management
GHG Impact: Water Inputs

Fashion Industry Charter for Climate Action | Raw Materials Working Group | Fashion Industry Charter for Climate Action | Raw Materials Working Group
Fashion Industry Charter for Climate Action | Raw Materials Working Group | Fashion Industry Charter for Climate Action | Raw Materials Working Group
62
and rising soil salinity, cotton suffers from water stress during the crucial boll development phase, resulting in lower yields. North India predominantly relies on irrigation (up to 90%), so yields are higher compared to Central India (Maharashtra).
Drip irrigation is the most water efficient irrigation method, but pumping energy
78 IPCC, 2019: Climate Change and Land: an IPCC special report on climate change, desertification, land degradation, sustainable land management, food security, and greenhouse gas fluxes in terrestrial ecosystems [P.R. Shukla, J. Skea, E. Calvo Buendia, V. Masson-Delmotte, H.-O. Pörtner, D. C. Roberts, P. Zhai, R. Slade, S. Connors, R. van Diemen, M. Ferrat, E. Haughey, S. Luz, S. Neogi, M. Pathak, J. Petzold, J. Portugal Pereira, P. Vyas, E. Huntley, K. Kissick, M. Belkacemi, J. Malley, (eds.)]
79 Sanchez-Martin, L., Meijide, A., Garcia-Torres, L., Vallejo, A., 2010a. Combination of drip irrigation and organic fertilizer for mitigating emissions of nitrogen oxides in semiarid climate. Agric. Ecosyst. Environ. 137, 99–107.
costs are high. According to IPCC, in India, drip irrigation reduced the amount of water consumed in the production of cotton by 45%, while enhancing yields by up to 29%78. The amount of nitrous oxide (N2O) emissions released can vary depending on type of irrigation system. Drip irrigated soils have lower N2O fluxes compared to surface furrow79 due to reduced nutrient run-off and soil erosion.
Figure 10. GHG impacts correlated with yields, based on water requirements, by region and cotton type.
Higher Yield
Average Yield(918 kg/ha)
Lower Yield
Low Medium High
Yiel
d
Conventional Cotton Organic Cotton CmiA Conventional and BCI
Country Abbreviations:AU: Australia; BR: Brazil; CN: China; IN: India; KG: Kyrgyzstan; PK: Pakistan; TJ: Tajikistan; RAF: Africa (Zambia, Ivory Coast, Mozambique, Malawi, Burkina Faso, Benin); US-FW: United States Far West (California, Arizona, New Mexico); US-MS: Mid-South; US-SW: United States Southwest; US-SE: United States Southeast
Rainfed Irrigated
RAF, IN-Central (Maharashtra),IN, TZ
IN-South (~70%)
US-SW (40%),US-SE (70%)
US-MS (40%),
TJ, KG, CN
BRAU
US
CN (60%), TU (80-90%), KG
US-FW (100%), US-MS (60%)
US-SW (60%), US-SE (30%)
IN-Central (60-70%),IN-North (90%), PK (90%)
IN-Central (60-70%),IN-North (90%)
95% Rainfed77% Irrigated
60% Irrigated
90-100% Rainfed
US

Fashion Industry Charter for Climate Action | Raw Materials Working Group | Fashion Industry Charter for Climate Action | Raw Materials Working Group
Fashion Industry Charter for Climate Action | Raw Materials Working Group | Fashion Industry Charter for Climate Action | Raw Materials Working Group
63
In USA and Australia, the trend has been to improve water use efficiencies and precisely operate efficient irrigation methods such as drip or sprinkler irrigation, rather than surface/furrow/flood irrigation. Improved irrigation efficiency results in decreased pumping energy, increased yields, and optimual fuel use.
CmiA cotton is 100% rainfed and is low in GHG impact for irrigation due to zero resource and energy requirements for pumping water. Rainfed organic cotton grown in Tajikistan, Kyrgyzstan, Turkey and China obtain above average yields, which are on par or higher than yields of conventional cotton grown in regions like India, Pakistan, and Africa. Furthermore, energy requirements are low due to traditional harvest practices and these conditions drive low GHG impacts and makes this organic cotton a potentially low carbon source in comparison to CmiA, BCI and conventional cotton grown in low yielding regions.
Deficit irrigation and supplemental irrigation are climate-smart irrigation techniques. Deficit Irrigation is defined as deliberate and systematic under-irrigation of crops. Deficit irrigation can cause yield reductions but can be practiced in regions with low water availability. Supplemental irrigation is
80 Pahlow, M., Krol, M. S., & Hoekstra, A. Y. (2015). Assessment of measures to reduce the water Footprint of cotton farming in india. Value of water research report series, (68), 1-14.
the application of limited amount of water to rainfed cotton. It is to be noted that the selection of the cotton cultivar/varieties determines whether the crop will benefit from deficit irrigation. For example, late-maturing cotton or drought tolerant varieties do not show any increase in crop productivity under deficit irrigations. Thus, selection of appropriate varieties (typically early maturing varieties) by cotton grower is very critical in order to benefit from deficit irrigation techniques80.
2.2.2.9 Cropping Systems
Cotton cropping systems range from low input rainfed conditions, using traditional methods to highly mechanized intensive monocropping systems in regions like Australia, China, USA and Brazil. Cotton is predominantly monocropped across the major cotton producing nations. This section reviews three key cropping systems for cotton production, and its effects on GHG emissions: (1) Monocropping; (2) Intercropping and cover cropping; and (3) Crop rotation. Table 15 provides an overview of the most common cropping systems prevalent on a country and regional level, by cotton type.
Table 15. Cropping system by cotton type and country (CC: Conventional cotton; OC: Organic cotton; BCI: Better Cotton Initiative; CmiA: Cotton made in Africa).
Country
Region (specified based on data availability)
Cotton Type
Cropping System: 1.Monocropping
Cropping system: 2. Intercropping/Cover Cropping
Cropping System: 3. Crop rotation
India Central: Maharashtra CC,
OC
Yes Irrigated farms
(around 5%) practice
intercropping with
blackgram, greengram,
soyabean, groundnut
and redgram
Yes, cotton-pigeon
pea;/cotton-jowar (2
year rotation);/ cotton-
wheat
India Central: Gujarat CC,
OC
Yes Irrigated farms
(around 40%) practice
intercropping with
bengalgram,
Yes, cotton-pigeon
pea;/cotton-jowar (2
year rotation);/ cotton-
wheat

Fashion Industry Charter for Climate Action | Raw Materials Working Group | Fashion Industry Charter for Climate Action | Raw Materials Working Group
Fashion Industry Charter for Climate Action | Raw Materials Working Group | Fashion Industry Charter for Climate Action | Raw Materials Working Group
64
Country
Region (specified based on data availability)
Cotton Type
Cropping System: 1.Monocropping
Cropping system: 2. Intercropping/Cover Cropping
Cropping System: 3. Crop rotation
India Central: Madhya Pradesh CC,
OC
Yes, in some parts Yes, wheat and gram Yes, cotton-soybean or
cotton-maize
India North: Punjab, Rajasthan,
Haryana
CC,
OC
Yes Yes, rice-cotton-
wheat; cotton-wheat;
cotton-mustard;
cotton-berseem
India South: Andhra Pradesh,
Telangana, Karnataka, Tamil
Nadu
CC,
OC
Yes, in some parts Intercropping with
onion/chilli, blackgram,
greengram and
groundnut
Yes, cotton-tobacco(2
year rotation); cotton-
rice (1 year rotation)
India Central: Maharashtra BCI 10% farmers
intercropping with
sorghum, maize & red
gram
Yes
India Central: Madhya Pradesh BCI 65% farms
intercropping with
gram
Yes, cotton-wheat
India South: Andhra Pradesh,
Telangana
BCI Yes, legumes
China Xinjiang CC Yes
China Yellow river basin CC Yes, cotton-wheat
China Yagtze river basin CC Yes, cotton-wheat
China Xinjiang OC Yes, many areas Yes
USA Far West + Southwest + Mid-
south + Southeast
CC Yes Yes, some areas Yes, some areas
USA Southwest + FarWest +
Southeast
OC Yes, some areas Yes Yes
USA Far West: New Mexico
Southeast :North Carolina
OC Yes
Pakistan Punjab & Sindh CC, BCI Yes, maize, bhajra Yes, cotton-wheat
Brazil Matto Grosso & Bahia CC Yes
Australia Queensland & New South
Wales
CC Yes, most areas Less than 10% of
farmed area is cover
cropped/double
cropped
Turkey CC No data
Turkey Aegean and South East
Anatolia
OC Yes Yes
Kyrgyzstan Jala-Abad OC Yes, grains
Tajikistan Fergana Valley, Northern
Tajikistan, Khujand
OC Yes, wheat and beans
Tanzania Meatu and Mwasa District OC Yes
Africa Zambia, Ivory Coast, Burkina
Faso, Benin, Mozambique,
Malawi
CmiA Yes, legumes ,
soybeans or peanuts

Fashion Industry Charter for Climate Action | Raw Materials Working Group | Fashion Industry Charter for Climate Action | Raw Materials Working Group
Fashion Industry Charter for Climate Action | Raw Materials Working Group | Fashion Industry Charter for Climate Action | Raw Materials Working Group
65
The following sections describes some of the key cropping systems in further detail, based on review of existing literature.
Monocropping
Monocropping systems are highly intensive cropping systems with good crop productivity, however, when practiced on a large scale, it can cause loss of biodiversity, soil nutrients, and degradation of ecosystems. Extensive monocropping of cotton increases the potential for soil erosion, soil compaction and soil fertility loss. Conventional cotton is monocropped in Brazil and China (Xinjiang), where farm sizes are large and cotton production is highly mechanized. In India, cotton is mostly grown as a monocrop in most areas except in tribal districts and rainfed zones. CmiA, Organic and BCI cotton certifications schemes encourage farmers to diversify and adopt crop rotation, intercropping and cover cropping practices.
Intercropping and Cover cropping
Intercropping and cover cropping systems help build soil organic matter, suppress weeds and improve soil fertility. USDA defines cover cropping as planting two crops in 1 year but harvesting only one crop, although cover crops may be grazed or harvested for silage but not grain or seed.81 According to USDA’s 2015 survey of cotton farmers in USA, cover cropping is practiced in smaller farm areas, where no-till or strip-till is practiced consistently over a 4-year crop history. In Australia, less than 1% of cotton area is cover cropped. Incorporating legumes in the cropping system can reduce the nitrogen requirements and suppress pest outbreaks. According to cotton experts at Laudes Foundation in India, cover cropping is not practiced in India within the cotton ecosystem. However, intercropping is practiced in tribal districts and rainfed cotton
81 USDA-NRCS, 2014c82 Daystar, J. S., Barnes, E., Hake, K., & Kurtz, R. (2017). Sustainability trends and natural resource use in US cotton production. BioResources, 12(1),
362-392.83 CICR (2015) Crop production, Central Institute for Cotton Research, Nagpur, India. www.cicr.org.in/CropProduction.html84 IDH (May 2019); Towards doubling cotton farmer incomes in Maharashtra.
regions in India, where multiple crops (e.g., pigeon pea, cowpea, green gram) are grown.
Crop rotation
Crop rotation can help reduce pests and weed growth, thereby improving soil health and crop productivity and lower pesticide use. In the cotton offseason, farmers can grow crops to earn revenue and rotation crops can benefit the soil. In Africa and India, crop rotation and organic fertilizer application is the main source of maintaining soil fertility. A 2015 survey of cotton farmers in USA indicates that cultivating winter crops and cover cropping increased cotton yields by 4-5.2% compared to bare fields in the offseason.82 According to recommendations provided by CICR in 201583, cotton-sorghum crop rotations achieved 38% higher yield compared to monocropped cotton in India.
Lack of precipitation or access to irrigation is the main barrier for adopting crop rotation in rainfed cotton regions. Bare soil conditions are common in regions like India, Africa, and Far West region in USA, where there is lack of water availability in the offseason. Data from a 2019 survey of Indian cotton farmers in Maharashtra (Central India) reveals that although farmers are interested in implementing intercropping, lack of access to water is the main barrier of adoption of crop rotation and intercropping84.
In India, cotton is grown in rotation (1-year rotation) with corn, wheat, sorghum, soybean, cowpea and pulses. In the long term, cotton is rotated generally with corn, wheat, sorghum, soybean, cowpea, pulses, rice, sunflower, alfalfa, turmeric, fodder, papaya, lentils, castor, sugarcane, sesame and banana.
Section 2.2.5.2 discusses the carbon sequestration potential of crop rotation and cover cropping.

Fashion Industry Charter for Climate Action | Raw Materials Working Group | Fashion Industry Charter for Climate Action | Raw Materials Working Group
Fashion Industry Charter for Climate Action | Raw Materials Working Group | Fashion Industry Charter for Climate Action | Raw Materials Working Group
66
2.2.2.10 Harvesting: Traditional (hand-picked) v/s
Mechanized
Cotton is harvested either by hand picking or by using mechanical harvesters. Farm size plays a role in determining the harvest practice. Typically, medium-large size farms deploy mechanical harvesters and small holder farms use traditional methods of harvest as fragmented farmland hinders the ability to operate mechanical harvesting equipment. Hand harvested cotton is cleaner (lower trash content) compared to mechanically harvested cotton. It does not require any energy or resource inputs so traditionally harvested
85 2019 CRDC Australia Grower Survey Report
cotton is low in carbon and has a positive effect on the climate. As opposed to traditional harvesting practices, mechanically harvested cotton has high diesel fuel or electricity requirements for operating the harvesters, resulting in GHG emissions from burning of fossil fuels. In addition to fuel and electricity inputs, defoliants are nearly always used in mechanized farming systems to remove leaves and reduce trash in harvested cotton. It is common practice to apply defoliants in Australia, Brazil, Turkey and USA. Cotton is completely hand harvested in other countries, so defoliants are not applied in traditionally harvested cotton. Table 16 specifies the harvest practices by country and cotton type.
Table 16. Typical harvesting practice, by country and cotton type. (CC: Conventional cotton; OC: Organic cotton; BCI: Better Cotton Initiative; CmiA: Cotton made in Africa).
Country Region (specified based on data availability) Cotton Type Harvest: Traditional v/s Mechanized
India North + Central + South CC, OC, BCI Traditional-hand picked
China Northwest (Xinjiang), Yellow River Basin, Yangtze River
Basin
CC, OC, BCI Mechanization: Xinjiang; Traditional:
Yagtze and Yellow river basin
USA Far West + Southwest + Mid-south + Southeast CC, OC Mechanized
Pakistan Punjab & Sindh CC, BCI Traditional-hand picked
Brazil Matto Grosso & Bahia CC Mechanized
Australia Queensland & New South Wales CC Mechanized
Turkey CC Mostly mechanized
Turkey Aegean and South East Anatolia OC Traditional-hand-picked
Kyrgyzstan Jala-Abad OC Traditional-hand-picked
Tajikistan Fergana Valley, Northern Tajikistan, Khujand OC Traditional-hand-picked
Tanzania Meatu and Mwasa District OC Traditional-hand-picked
Africa CmiA Traditional-hand-picked
From an LCA perspective, traditional (hand-picked cotton) harvesting practice is lower in carbon compared to mechanically harvested cotton. CmiA and organic cotton is grown in small holder farms and is traditionally harvested compared to conventional cotton,
which is highly mechanized in countries like Australia, Brazil and USA. According to the 2019 CRDC Australia Grower Survey, diesel is the primary energy source for field operations, with average use of 223 liters/ha for in-field operations85.
Fashion Industry Charter for Climate Action | Raw Materials Working Group | Fashion Industry Charter for Climate Action | Raw Materials Working Group
Fashion Industry Charter for Climate Action | Raw Materials Working Group | Fashion Industry Charter for Climate Action | Raw Materials Working Group
67
2.2.3 Soil Carbon Balance
86 Long Term Effects of Organic Amendments on Soil Fertility. A review. Diacono et al, 2009.87 Long Term Effects of Organic Amendments on Soil Fertility. A review. Diacono et al, 2009.88 Bajaj, L., Sharma, M.K., 2012. Future Trends in Cotton Ginning and PressingTechnologies. Bajaj Steel Industries Limited, Nagpur, India http://
www.bajajngp.com/images/technical/5th.pdf.89 International Cotton Advisory Committee (ICAC); June 2018. Special Issue: Sustainable, better practices in the processing of cotton fibers and
by-products.
Soil organic matter helps to create a soil structure, increases water retention capacity, allows uninhibited root growth and enhances water uptake. Increasing the carbon sequestration of soil organic matter would have benefits from mitigating greenhouse gas emissions. Common current agricultural practices including practices such as annual monocropping, application of organic or synthetic fertilizers, herbicides, insecticides and fungicides, irrigation, tillage, all contribute to decreasing soil productivity and increasing soil erosion rates86. Soil designates
the thin layer between the atmosphere and the bedrock necessary for plants to grow. Soil, via land degradation and soil erosion, has been disappearing in alarming rates, and its formation rates are very slow87. Rate of accumulation of soil carbon can vary significantly by region and land management activities such as tillage and cropping systems can determine with it is a source of greenhouse gas emission or a sink of carbon. Land degradation and soil erosion through loss of soil organic matter are one of the major sources of greenhouse gas emissions.
2.2.4 Ginning
Ginning is the process of separating and cleaning seed cotton to yield cotton lint and cotton seeds. Type of ginning technology could influence the energy consumption, lint yields and fiber quality parameters, so it is necessary to select the appropriate ginning technology. The selection of a ginning technology should depend upon factors such as harvesting practices, trash content, moisture content, fiber length, fuzziness, strength, etc. Ginning technology
constitutes about 55% saw ginning and 45% roller ginning (35% double roller ginning, 5% rotary knife roller gin, and 5% single roller ginning)88. Saw ginned lint is more suitable for spinning coarse yarn, and roller ginned lint more suitable for finer yarns. Lint yield varies from 32% to 43%, with saw gins providing higher yields compared to roller gins. A qualitative comparison of two main ginning technologies (saw gin and roller gins) are provided in the table below89.

Fashion Industry Charter for Climate Action | Raw Materials Working Group | Fashion Industry Charter for Climate Action | Raw Materials Working Group
Fashion Industry Charter for Climate Action | Raw Materials Working Group | Fashion Industry Charter for Climate Action | Raw Materials Working Group
68
Table 17. Ginning technology and average electricity consumption per metric ton of ginned fiber90.
Parameter Roller Ginning Saw Ginning
Operational requirements Easy to operate, less efficient in trash removal so more suited for traditionally harvested cotton in regions like India and Africa. Slower and labor intensive.
Close supervision is required. High trash removal rates so well suited for mechanically harvested cotton in regions such as Australia, USA, China, etc. More productive but higher capital and operational costs.
Yield Lower lint yields Higher lint yields
Capacity Lower processing capacity
Double Roller/Single Roller: 40-110kg lint/hr
Rotary gin: 175-1000 kg lint/hr
Higher throughput
1800-3400 kg lint/hr (could be upto five times higher for regions like Australia)
Average Electricity 85-135 kWh/ metric ton lint 60-70 kWh/metric ton lint
Fiber Quality Preserves fiber quality. Suited for Extra-long Fiber (Gossypium barbadense). Contains fewer short fibers and neps.
Appropriate for short staple fiber length. Preferred for upland cotton. Can cause fiber breakage while processing longer staple fibers.
Labor Higher labor costs Lower labor costs
Seed Quality No delinting required (cleaner seeds) More linters on seeds
90 Estur, Gerald, and Nicolas Gergely. The economics of roller ginning technology and implications for African cotton sector. World Bank, 201091 From Table 1 of Hedayati, M., Brock, P. M., Nachimuthu, G., & Schwenke, G. (2019). Farm-level strategies to reduce the life cycle greenhouse gas
emissions of cotton production: An Australian perspective. Journal of Cleaner Production, 212, 974-985.
Most of the existing cotton LCA studies use secondary data for modeling the ginning process, so there is low confidence in the electricity consumption data used for modeling the climate impacts of
ginning. Table 18 outlines the geographical distribution of ginning technologies in the top cotton producing countries and provides the average electricity consumption estimates by type of ginning technology.
Table 18. Ginning technology and average electricity consumption per metric ton of ginned fiber.
Country Ginning Technology Average Electricity Consumption (kWh per metric ton of ginned fiber)
India Double roller gin 140
China Saw gin 300 (Saw gin: 115 kWh/tonne; press: 185 kWh/tonne)
USA 90% Saw gin+10% Single Roller gin Saw gin: 168; Single roller gin: 225
Pakistan Saw gin No data
Brazil Saw gin No data
Australia Saw gin 14891
Turkey Double roller gin No data
Kyrgyzstan Double roller gin No data
Tajikistan 88

Fashion Industry Charter for Climate Action | Raw Materials Working Group | Fashion Industry Charter for Climate Action | Raw Materials Working Group
Fashion Industry Charter for Climate Action | Raw Materials Working Group | Fashion Industry Charter for Climate Action | Raw Materials Working Group
69
Country Ginning Technology Average Electricity Consumption (kWh per metric ton of ginned fiber)
Tanzania Mostly double roller 130
Zambia Roller gin 11092
Mozambique Saw gin 11084
Malawi Saw gin 9084
Ivory Coast Roller gin 10084
Burkina Faso Saw gin 11084
Benin Roller gin 9084
92 PE International A.g. (2014); Life Cycle of Assessment of Cotton Made in Africa (CmiA).93 Regenerative Agriculture, Identifying the impact; Enabling the Potential. Report for Systemiq. School of Water, Energy and Environment, 2019.
The data indicates that saw ginning in countries such as Australia and USA have lower energy requirements compared to roller ginning in India and Africa. Electricity use is the main hotspot in the ginning process and climate impacts can vary depending on the electricity grid mix of a region. From a climate perspective, ginning impacts can be reduced by upgrading roller gin technologies in India and Africa (e.g. installing automatic feeders) and sourcing electricity from renewable energy resources.
From an LCA perspective, as ginning yields cottonseed as a co-product to cotton lint, an economic allocation is applied to allocate electricity to cotton lint production. Majority of the data collected for cotton LCA studies are
at least 5 to 10 years old, and on an average, 84% of the ginning impacts are attributed to cotton lint and 16% are attributed to cottonseed. Overall, ginning process has a relatively small contribution to the cotton fiber production impacts, accounting for 11-20% of the total ginned cotton fiber GHG emissions. Historically the market value of cottonseed has not fluctuated significantly, so the economic allocation factors used to attribute ginning process impacts are stable and these allocation factors do not have a significant influence on the overall climate impact.
As most LCAs of cotton rely on secondary data for the ginning process, future LCA work should seek to collect primary data on the ginning process.
2.2.5 Regenerative Cotton
There is not one single definition for how to apply regenerative agriculture. Some of definitions view regenerative agriculture as a set of practices prohibiting the use of synthetic fertilizers and chemicals. Some others highlight the necessity for agriculture to have a positive impact on the environment, as opposed to an absence of negative impacts93.
Some of the most common practices fostered by regenerative agriculture are:
• Reduced tillage or no tillage,• Absence of bare soil with cover crops,
intercropping, mulching,• Crop rotations and crop diversity,• Use of compost,• Rotational grazing for livestock
production.
While some regenerative farms do use synthetic fertilizers and chemicals, regenerative organic farms practice organic

Fashion Industry Charter for Climate Action | Raw Materials Working Group | Fashion Industry Charter for Climate Action | Raw Materials Working Group
Fashion Industry Charter for Climate Action | Raw Materials Working Group | Fashion Industry Charter for Climate Action | Raw Materials Working Group
70
farming (absence of synthetic fertilizers and synthetic herbicides, insecticides and fungicides) in addition to regenerative practices.
The Regenerative Organic Alliance is developing a Regenerative Organic Agriculture certification. The pilot version of the program “Regenerative Organic Certification (ROC)” was published in October 201994. It describes the mandatory practices and the certification process. The practices revolve around three general themes:
• Soil Health and Land Management: practices to increase soil organic matter
94 Framework for Regenerative Organic Certification. October 2019: Pilot Program Version.
over time and sequester carbon below and above ground.
• Animal Welfare: practices to ensure humane practices in the raising and/or handling of animals.
• Farmer and Worker Fairness: guidelines to provide economic stability for farmers, ranchers, and workers.
The soil health and land management practices are organized around seven subcategories. Table 19 below presents a simplified compilation of the practices by subcategory to give an overview of the regenerative organic practices for soil health and land management.
Table 19. Soil health and land management practices defined in the Regenerative Organic Certification process.
Subcategory Practices Example
Operation management
1.1. Existing certifications Operation has proof of USDA organic certification or equivalent […]
1.2. Regenerative practices Operation incorporate practices to improve overall ecosystem:
agroforestry, cover crops, crop rotations, mulching, perennial planting,
grassed waterways […]
1.3. Natural waterways Operations conserve and restore natural bodies of water, wetland, riparian
areas […]
1.4. Deforestation Operations do not clear primary or gold growth secondary forest or convert
high conservation value ecosystems.
1.5. Extractive practices Fracking, mining, and other extractive practices are not conducted on land
[…]
Soil & crop management 2.1. Cover crop Land maintains adequate cover year-round […]
2.2. Crop rotations Use of crop rotations for to provide for pest management. […]
2.3. Tillage Should be infrequent and never deeper than 10 inches […]
2.4. Rotational grazing Animals are used in high concentrations for brief periods of time (i.e. mob
grazing) […] The number of animals per acre should follow Stocking Rates
outlined in Demeter’s Biodynamic Farm Standard […]
2.5. Soilless practices Aquaponics, hydroponics and other soilless practices are not eligible for RO
certification.
Compost & manure
fertilizers
3.1. General The operation should aim for self-sufficiency in its manures and fertilizers.
[…]
3.2. Synthetic fertilizers Operation does not use any synthetic fertilizers […]
3.3 Imported nitrogen and
phosphorous
In general, an operation does not import more than 36 lbs. N per acre and
31 lbs P/ acre annually […]
Biodiversity 4.1. Invasive Species Monitor and manage the infestation of unwanted or invasive species […]
4.2. Endangered plant and
animals
Operation does not allow hunting […]

Fashion Industry Charter for Climate Action | Raw Materials Working Group | Fashion Industry Charter for Climate Action | Raw Materials Working Group
Fashion Industry Charter for Climate Action | Raw Materials Working Group | Fashion Industry Charter for Climate Action | Raw Materials Working Group
71
Subcategory Practices Example
Facilities 5.1. Wastewater Operation does not directly discharge wastewater into natural waterways
or soil […]
5.2. Waste Operation does not illegally dump waste […]
Use of prohibited
substances
6.1. Synthetic chemicals Operation does not use any substances not permitted under USDA Organic
or equivalent standard for pest control […]
6.2. Genetically modified
inputs & cloning
Operation does not use any genetically modified additives or processing
aids, such as fertilizers, pesticides, herbicides, seeds or crops derived from
genetically modified sources […]
Measurement 7.1. Soil Health Lab Test Producers conduct regenerative Organic Certification Soil Health Lab Test
[…]
7.2. Soil Health In-Field
Test
Producers conduct soil health in-field tests and follow regenerative organic
certification Soil Health In-Field Test instructions […]
7.3. Computer Models Operators utilize computer-based modeling tools (e.g. COMET-Farm
voluntary Carbon Reporting tool, Cool Farm tool, etc.) to determine annual
GHG emissions and sequestrations […].
95 Regeneration of our Lands: A Producer’s Perspective, Gabe Brown. TEDx Grand Forks. 2016.96 Soil Organic Carbon Sequestration in Cotton Production Systems of the Southeastern United States: A Review. Causarano et al, 2006.
Overall, regenerative agriculture is meant to be specific to each farm and to rebuild soil health gradually one practice at a time to increase soil organic matter95.
From an LCA perspective, regenerative agriculture is a systems approach, so it is more complex to model and requires on-site measurements as there is high uncertainty associated with modeling soil carbon fluxes. Currently, regenerative cotton farming is an emerging farming system and there is no LCA data available to measure the impacts of these farming practices. However, Section 2.2.5.1 and 2.2.5.1.1 provides an overview of the carbon sequestration potential from regenerative farming practices.
2.2.5.1 Regenerative cotton farming in USA
In 2006, Causarano et. al96 reviewed 20 studies on soil organic carbon sequestration in Southeastern US cotton production systems (i.e., Texas, Arkansas, Louisiana, Mississippi, Tennessee, Alabama, Georgia, Florida, South Carolina, North Carolina and
Virginia). The review analyzed the carbon sequestration related to four distinct regenerative practices:
• Conservation tillage;• Crop rotation and cover crops;• Fertilizers and manure; and• Pasture based crop rotation.
The conclusions of the study affirmed and quantified the potential for regenerative practices to help mitigate greenhouse gas emissions by sequestering carbon in the soil through increasing soil organic matter at the rate of 1.76 to 2.46 metric ton CO2e per hectare per year (refer to Table 20 for more details).
Conservation tillage, defined in the study as any system leaving behind more than 30% residue cover on the surface after planting, in contrast with conventional tillage which buries residues and leaves, leaving the soil uncovered. In 2004, 24% of the cropland studied in Southeastern US cultivated cotton, of which, 34% practiced conservation tillage, 17% reduced tillage, and the remainder 49% conventional tillage. Over the past decade, the adoption of conservation/reduced tillage has

Fashion Industry Charter for Climate Action | Raw Materials Working Group | Fashion Industry Charter for Climate Action | Raw Materials Working Group
Fashion Industry Charter for Climate Action | Raw Materials Working Group | Fashion Industry Charter for Climate Action | Raw Materials Working Group
72
increased by 14%, indicating a positive shift in grower practices.
Cotton produces little residue post-harvest, so incorporating residue from other additional crops through rotations or cover crops can have a big impact on the soil organic carbon (SOC) sequestration. Fertilizer or manure applications are expected to increase SOC. In the Southeastern region of the US, chicken litter application is a particularly overlooked fertilizer option with great SOC potential.
Pasture based crop rotation consists in rotation of crop with a pasture grass, over several years. This rotation practice was tested in Alabama with peanut / Bahia grass rotations and showed great results for SOC sequestration (increase of 1.3 g of carbon per kg of soil compared with continuous cotton), however no data were available for a cotton/ pasture grass rotation system.
2.2.5.1.1
Soil carbon sequestration potential
of BEAM compost
Dr David C. Johnson, Adjunct Professor at New Mexico State University Institute developed a pioneering body of research on regenerative agriculture by incorporating BEAM compost (for ‘Biologically Enhanced Agriculture Management’), an aerobic compost with a high fungal profile to improve the soil restoration process through enhancing the soil microbiology. The BEAM compost application was shown to increase the soil organic carbon content, the soil water retention capacity, and the soil microbiology diversity. Dr. Johnson defines rebuilding the soil as increasing the soil microbiology -especially in terms of higher ratio of fungi to bacteria, restoring photosynthetic capacity, diversifying the bacteria and fungi species, and implementing a different soil structure to promote fungi.
In 2010, BEAM compost was applied in a cotton system on sandy/clay soils in New
97 Based on direct communication with Dr. David C. Johnson (05/26/2020). Johnson et al, (2015); Development of Soil Microbial Communities for Promoting Sustainability in Agriculture and a Global Carbon Fix.
Mexico (Far West region in USA). Prior to introducing BEAM compost, the initial cropping system produced 1,170 lbs of cotton per acre (1,300 kg per ha) with an application of 168 kg per acre of synthetic fertilizer (190 kg per ha). On the same plot for a subsequent cycle, the yield increased by around 52% to 2,472 lbs of cotton per acre (2,800 kg per ha) with a 2 lbs per acre application of BEAM compost (2.2 kg per ha) without any other additives (fertilizers and chemicals). The research monitored microbial respiration activity, efficiency of carbon flows to plant biomass, soil carbon content, etc. and found that over a 4.5-year period, the soil organic matter increased by 0.24% per year (10tC/hectare/year). Dr. Johnson’s work demonstrated that the crop productivity can be increased by nearly five times when bacteria and fungi are properly restored in the soil97, with a potential to increase soil organic carbon content up to 0.5% per year.
BEAM compost can be applied to any type of soil, in any region, and Dr. Johnson’s research at 60-acre farms in California and Arizona have shown improvements in soil health in arid soil types.
2.2.5.2 Soil organic carbon (SOC) sequestration
potential based on reviewed studies
Table 20 summarizes the soil organic carbon sequestration potential values published in literature for different crop management practices in the United States. The studies typically measure or estimate the soil organic carbon (SOC) content of different agronomic practices over a period of time and calculate the increase in SOC content after implementing specific practices on a plot of land. These studies did not account for any other GHG fluxes and did not calculate the loss of soil organic carbon or emissions; rather these studies have focused on quantifying the increase in soil organic carbon content over time.

Fashion Industry Charter for Climate Action | Raw Materials Working Group | Fashion Industry Charter for Climate Action | Raw Materials Working Group
Fashion Industry Charter for Climate Action | Raw Materials Working Group | Fashion Industry Charter for Climate Action | Raw Materials Working Group
73
Table 20. Summary of studies on Soil Organic Carbon (SOC) sequestration potential
Practice Scope
Soil Organic Carbon sequestration (in metric ton of CO2 eq per hectare per year)
Measurements or estimates Data Source
Agroforestry • USA
• Agricultural land
(not crop specific)
0.35 t CO2e ha-1 y-1 Estimates Greenhouse Gas Mitigation
in Agriculture
Smith, 2007
BEAM compost
application over 4.5
years of 0.25t per acre
of BEAM compost
application every
year, no fertilizers, no
chemicals, no tillage,
on multi-species
crops and continuous
cropping.
• New Mexico,
United States
• Continuous and
multi-species
cropping
Annual increase of soil organic
carbon:
37.7 t CO2 ha-1 y-1
Measurements.
Annual increase
calculated by
dividing the
total soil organic
carbon increase
by the number
of years of the
experiment.
Development of Soil
Microbial Communities for
Promoting Sustainability
in Agriculture and a Global
Carbon Fix.
Johnson et al, 2015
Conservation tillage• Southeastern
region, USA
• Cotton agricultural
systems
• Impact of
Conservation
tillage compared
to conventional
tillage over 9.5
years
1.76 +/- 2.05 t CO2e ha-1 y-1 Measurements Soil Organic Carbon
Sequestration in Cotton
Production Systems of the
Southeastern United States:
A Review.
Causarano, Franzluebbers
et al, 2006
Conservation tillage
and cover cropping • Southeastern
region, USA
• Cotton agricultural
systems
• Impact of
Conservation
tillage with cover
crop compared
to conventional
tillage and cover
crop over 8 years.
2.46 +/- 2.31 t CO2e ha-1 y-1 Measurements Soil Organic Carbon
Sequestration in Cotton
Production Systems of the
Southeastern United States:
A Review.
Causarano, Franzluebbers
et al, 2006
Improved agronomy
practices (cropping
frequency, residue
management, tillage,
water use, mulch,
crop selection…)
• USA
• Agricultural land
(not crop specific)
0.37 to 3.7 t CO2e ha-1 y-1 Review combining
observed
measurements
and estimates.
Carbon Sequestration in
Agricultural Lands of the
United States
Morgan, Follett et al, 2010
Improved crop
management in warm
and dry conditions
• USA
• Agricultural land
(not crop specific)
0.39 t CO2e ha-1 y-1 Estimates Greenhouse Gas Mitigation
in Agriculture
Smith, 2007

Fashion Industry Charter for Climate Action | Raw Materials Working Group | Fashion Industry Charter for Climate Action | Raw Materials Working Group
Fashion Industry Charter for Climate Action | Raw Materials Working Group | Fashion Industry Charter for Climate Action | Raw Materials Working Group
74
Practice Scope
Soil Organic Carbon sequestration (in metric ton of CO2 eq per hectare per year)
Measurements or estimates Data Source
Improved nutrient
management• USA
• Agricultural land
(not crop specific)
0.33 t CO2e ha-1 y-1 Estimates Greenhouse Gas Mitigation
in Agriculture
Smith, 2007
No-till with cover
cropping • Southeast region,
USA
• Cotton agricultural
systems
• Impact of
conservation
tillage compared
to conventional
tillage in cotton.
1.65+/- 0.55 t CO2e ha-1 y-1 Estimates based
on the model
soil conditioning
index
Evaluating soil organic
carbon sequestration
potential in the Cotton Belt
with the soil conditioning
index.
Franzluebbers et al, 2012
No-till with crop
rotation • Southeast region,
USA
• Cotton agricultural
systems
• Impact of
conservation
tillage compared
to conventional
tillage in cotton.
1.58+/- 0.51 t CO2e ha-1 y-1 Estimates based
on the model
soil conditioning
index
Evaluating soil organic
carbon sequestration
potential in the Cotton Belt
with the soil conditioning
index.
Franzluebbers et al, 2012
No-till without cover
cropping • Southeast region,
USA
• Cotton agricultural
systems
• Impact of
conservation
tillage compared
to conventional
tillage in cotton.
(1) No-till without cover-
cropping:
1.43+/- 0.51 t CO2e ha-1 y-1
(2) No-till with cover cropping:
1.65+/- 0.55 t CO2e ha-1 y-1
(3) No-till with crop rotation:
1.58+/- 0.51 t CO2e ha-1 y-1
Estimates based
on the model soil
conditioning index
Evaluating soil organic carbon
sequestration potential in
the Cotton Belt with the soil
conditioning index.
Franzluebbers et al, 2012
Tillage and residue
management • USA
• Agricultural land
(not crop specific)
0.35 t CO2e ha-1 y-1 Estimates Greenhouse Gas Mitigation in
Agriculture
Smith, 2007

Fashion Industry Charter for Climate Action | Raw Materials Working Group | Fashion Industry Charter for Climate Action | Raw Materials Working Group
Fashion Industry Charter for Climate Action | Raw Materials Working Group | Fashion Industry Charter for Climate Action | Raw Materials Working Group
75
2.3 Polyester (PET)
Polyester (PET), which is the most widely used fiber, accounts for 52 percent of the total volume of fibers produced globally. PET is produced by condensing monoethylene glycol (MEG) and purified terephthalic acid (PTA) or dimethyl terephthalate (DMT) derived from primary petrochemical sources, or recycled feedstocks such as post-consumer PET bottles, ocean waste, pre-consumer or post-consumer textile scraps. As of 2019, 14% of the total PET produced is derived from recycled feedstock, predominantly from post-consumer PET bottles98. Closed-loop textile-to-textile recycling processes are still under development and are yet to reach commercial maturity and market penetration on a large scale. These technologies have not become part of the mainstream of recycling due to several factors:
• Cost and energy intensive compared to mechanically recycling facilities and virgin PET sources. • Lack of infrastructure to collect feedstocks including PET bottles, containers, and waste
textiles through materials recovery facilities (“MRFs”). • Lack of regulations or policies to incentivize collection and recycling of PET waste. • Low prices for crude oil and natural gas hinders the ability for recyclers to compete
economically with virgin PET.
PET is produced globally across many countries (as illustrated in Figure 11) and is available in solid state resin or amorphous forms. Amorphous PET is used for textile applications and is available in the form of pellets/chips, staple fibers and filament yarns in various grades (partially oriented yarn (POY), fully drawn yarn (FDY), drawn texturized yarn (DTY)). The current scope of the study covers virgin PET and recycled PET filament yarns produced on a commercial scale using feedstocks and technologies specified in the table below.
Table 21. Scope of assessment for PET, by type and region.
PET Filament Yarn Type Feedstock Technology Region
Virgin PET
Crude oil/natural gas derived MEG (monoethylene glycol) and DMT (dimethylene terephthalate)
Crude oil/natural gas derived MEG (monoethylene glycol) and PTA (purified terephthalic acid)
Esterification Germany, USA, India, Japan, China
Transesterification
Mechanically Recycled PET Post-consumer PET bottlesMechanical Recycling
(“bottle-to-fiber”)
China, Japan, India, South Korea, USA, Ireland, Taiwan, Italy, Germany, Spain
Chemically Recycled PET*
Post-consumer PET bottles, post-consumer and pre-consumer textile scraps, ocean waste
Chemical Methanolysis
(“bottle-to-fiber”; “textile-to-textile”)
Chemical Glycolysis
(“bottle-to-fiber”; “textile-to-textile”)
China, India, Japan
USA, Japan
Bio-based PET**Bio-MEG from sugarcane, bio-PTA from sugarcane and corn
Esterification Japan, China, USA
*Only includes technologies that have been commercialized (chemical hydrolysis, aminolysis have been excluded from the scope).**Limited data available
98 Textile Exchange Preferred Fiber & Materials Market Report 2020.

Fashion Industry Charter for Climate Action | Raw Materials Working Group | Fashion Industry Charter for Climate Action | Raw Materials Working Group
Fashion Industry Charter for Climate Action | Raw Materials Working Group | Fashion Industry Charter for Climate Action | Raw Materials Working Group
76
Figure 11. PET producing countries. China, India, Taiwan, USA, Japan and Germany are the leading producers of virgin PET. Mechanically recycled PET is produced on a commercial scale in China, India, Japan, South Korea, USA and Europe (Italy, Spain, Ireland and Germany). Chemically recycled PET is commercially produced in China, Japan, USA, Taiwan and India.
2.3.1 Polyester Results
99 Higg Co.v3.0 (August 2020); https://apparelcoalition.org/higg-product-tools/
An extensive review of the current PET LCA landscape indicates that the main determinant for the environmental performance of PET is the choice of feedstock, the selection of the
production pathway, and product grades, which varies substantially between regions. Figure 12 presents the current Higg MSI (v3.0) Global Warming scores for PET fibers.
Figure 12. This chart is based on Higg MSIv3.099 scores for Global Warming indicator, currently made available for different types of PET. Note that this chart does not represent the GHG impact results.
Production VolumeLow High
0 0.5 1 1.5 2 2.5 3 3.5
Mechanically recycled PET ake
Chemically recycled PET- glycolysis
Chemically recycled PET- methanolysis
Partially bio-based PET
Virgin PET
Mechanically recycled Ground-to-Good PET ake

Fashion Industry Charter for Climate Action | Raw Materials Working Group | Fashion Industry Charter for Climate Action | Raw Materials Working Group
Fashion Industry Charter for Climate Action | Raw Materials Working Group | Fashion Industry Charter for Climate Action | Raw Materials Working Group
77
A meta-analysis of over 21 LCA studies (refer to Table 31 and Table 33 for list of data sources) found that PET LCA data in use today are, in general:
1. Not directly comparable due to inconsistencies in the functional unit of PET which varies from chips, fiber to different grades of filament yarn. The functional unit of LCAs vary by grade such as partially oriented yarn (POY), fully drawn yarn (FDY) or drawn textured yarn (DTY), which can have significant variation in impacts.
2. Majority of the reported LCA data are aggregated from cradle-to-finished product gate (e.g., chip/fiber/filament) and lack transparency on a process level, which makes it difficult to identify the key GHG drivers for the product. For example, it was not possible to identify the contribution of key processes such as polymerization, feedstock production, and depolymerization.
3. Not effectively capturing the geographic variability of feedstock production. For example, petrochemical feedstocks and intermediate chemicals are produced and transported across diverse geographies, which can have a significant influence on the results.
4. Modeled with background data that is outdated and is not representative of the current feedstock mix. For example, for virgin PET, the background data (Plastics Europe dataset100) used
100 Boustead I (March 2005); Eco-profiles of the European Plastics Industry
to model feedstock production data is based on an outdated market mix of crude oil and natural gas imports. While the oil refinery operations are not likely to change significantly, the market share of crude oil imported by EU has changed significantly over the past decade and as the environmental profile of crude oil extraction varies by location (GHG impacts of crude oil extraction and refinery can vary by a factor of seven depending on the location), it could have a significant influence on impact of PET production.
5. Not directly comparable due to differences in time period of data collection, application of inconsistent calculation methodologies, use of different LCA software, data sources and databases to model PET production, inconsistent allocation approach for modeling recycled PET.
Refer to Section 5 for detailed description of the key gaps and overarching inconsistencies in the current LCA landscape.
Figure 13 illustrates the GHG data collated from existing PET LCA studies, by type of PET and feedstock. It is not appropriate to compare the results between different PET types as the functional unit is not equivalent. The results are presented to illustrate the inconsistencies in the functional unit and reflect the need to consider a harmonized approach to LCA modeling for PET.

Fashion Industry Charter for Climate Action | Raw Materials Working Group | Fashion Industry Charter for Climate Action | Raw Materials Working Group
Fashion Industry Charter for Climate Action | Raw Materials Working Group | Fashion Industry Charter for Climate Action | Raw Materials Working Group
78
Figure 13. This chart illustrates the GHG profile of three forms of PET: chips, staple fiber and filament yarn for varying grades and disaggregated by type of feedstock (oil based and recycled) and region. Data is also reported for alternative feedstock of PET such as steel mill waste gas and bio-based. The GHG performance depends on the synthesis pathway, feedstock properties and the location of processing PET. Table 33 provides a list of data sources reviewed for PET.
The overarching influence on the GHG profile of PET is (a) the selection of feedstock for PET precursor production, which can include either crude oil or natural gas based petrochemical, PET waste materials or alternative sources such as sugarcane or corn derived feedstocks or waste gases from the iron and steel sector; and (b) the selection of production route (e.g., esterification, transesterification). The main determinant for feedstock selection is the production location as feedstock availability varies by location, process energy configurations, synthesis pathway and process yields. Note that while
some of the major Asian polyester producers are vertically integrated with oil refinery and oil exploration operations, depending on the economics, manufacturers may purchase feedstock from the market and crude oil is often shipped across the globe. The choice of synthesis pathway depends on the process yields per unit of feedstock consumed and regional factors such as feedstock availability, labor costs and environmental regulations.
In general, recycling PET reduces the demand for fossil fuel extraction and primary chemical production, thereby saving energy and GHG
3.4
2.0
3.7
2.9
2.0
2.4
1.3
0.7
7.1
2.0
3.2
3.8
3.7
Western Europe; 2010
Taiwan; 2010
Taiwan; 2010
North America; 2018
USA; 2014
USA; 2014
Italy; 2017
India; 2018
China; 2017
China; 2017
China; 2017
China; 2017
China; 2017
China; 2017
China; 2019
Japan; 2015
Recycled PET
Other-PET
Bio-PET
Virgin PET Virgin:Esteri�cation
Chemical glycolysis:back to oligomer BHET
Semi-mechanical
Mechanical
Chemical methanolysis:back to DMT recycling
CarbonSmart
Bio-PET
TPA+MEG
bottle-to-chips-DTY
�ber-to-chips(100-0 allocation)�ber-to-chips(50-50 allocation)�ber-to-DTY(100-0 allocation)�ber-to-POY(100-0 allocation)�ber-to-DTY(50-50 allocation)
bottle-to-�ber
bottle-to-�ber
bottle-to-�ber
bottle-to-peelets/POY
bottle-to-POY
bottle-to-�ber
steel mill waste gas-to-MEG
bio-TPA+bio-MEG
pre-consumer �ber+bottle-to-pe6lets/POY
0 1 2 3 4 5 6 108 97
Polyester chips Polyester staplePolyester �lament yarn
�ber-to-POY(50-50 allocation)
USA; 2020 2.2
2.2Japan; 2015
2.7North America; 2011
3.0Europe; 2012
2.1China; 2017
1.0Japan; 2019
3.5 8.6India; 2018
2.7 5.2USA; 2014
Western Europe; 2010 1.2 6.3
5.0
3.7
2.6
3.4
2.7

Fashion Industry Charter for Climate Action | Raw Materials Working Group | Fashion Industry Charter for Climate Action | Raw Materials Working Group
Fashion Industry Charter for Climate Action | Raw Materials Working Group | Fashion Industry Charter for Climate Action | Raw Materials Working Group
79
emissions. Mechanical recycling has the lowest GHG profile compared to virgin PET as the GHG impacts of waste collection and sorting is much lower in comparison to the GHG intensive crude oil exploration and extraction operations. The purity and quality of the waste stream has an influence on the type of recycling technology that can be deployed to effectively produce PET. The GHG intensity of mechanical recycling depends on the contaminant level, which determines the degree of cleaning required before recycling, and it is more GHG intensive to clean post-consumer garments and ocean waste, compared to post-consumer bottles.
Chemical recycling is also a low-carbon technology compared to virgin PET production, but it is more energy and GHG intensive in comparison to mechanical recycling. However, this technology can produce PET with higher intrinsic viscosities and allows for “upcycling” of PET waste with higher contaminant levels compared to mechanical recycling.
As mentioned above, most LCA datasets of PET aggregate GHG impacts from raw material extraction up to the polymerization or spinning stages and do not allow for a process-level comparison of GHG impacts associated with PET produced in different regions. In general, the following key processes contribute to GHG impacts of PET production (listed in decreasing order of importance):
• Oil/gas extraction & processing: The crude oil and natural gas exploration and refining GHG impacts can vary by a factor of seven, depending on the region of sourcing refined crude oil or natural gas products (refer to Figure 14 and Section 2.3.2.2.1 for more detail). Natural gas extraction has a lower GHG profile compared to crude oil extraction, but petrochemical production from natural gas is subject to cost and feedstock
101 NAPCOR (2020): Cradle to resin Life Cycle Analyis of Polyethylene Terephthalate Resin; https://napcor.com/wp-content/uploads/2020/05/Final-Revised-Virgin-PET-Resin-LCA.pdf
availability. Crude oil is the most widely used feedstock which directly influences the GHG impacts associated with polymer precursor production, so it is important to investigate the regional variation in GHG impacts of petrochemicals. Refer to Figure 14 and Section 2.3.2.2.1 for detailed assessment on country-level GHG intensities of oil and gas production.
• Precursor production (MEG and PTA or DMT): The GHG impacts are mainly driven by process energy requirements in steam cracking/catalytic reforming operations in the upstream of the value chain to produce intermediate chemicals such as ethylene and p-xylene. Steam cracking of naphtha yields ethylene for MEG production and catalytic reforming of naphtha yields p-xylene for PTA production. A recent LCA study101 on virgin PET chips produced in North America indicates PTA and MEG precursors account for the bulk of GHG impacts, contributing to 60% and 24% of GHG impacts respectively. Figure 24 illustrates that crude oil extraction and refining impacts are the main drivers of the GHG profile of ethylene and p-xylene production (the chemicals used for precursor production) accounting for approximately 36% and 50% of total production impacts, respectively.
• Melt Extrusion/Spinning: Melt extrusion/spinning operations are energy intensive and GHG impacts are highly variable depending on the grade of PET filament. Based on current knowledge, spinning processes for partially oriented filament yarns (POY) can range from 30-50% of GHG impacts depending on the fineness of yarns. DTY yarns are more GHG intensive compared to FDY and POY filaments due to additional process energy requirement for texturization.

Fashion Industry Charter for Climate Action | Raw Materials Working Group | Fashion Industry Charter for Climate Action | Raw Materials Working Group
Fashion Industry Charter for Climate Action | Raw Materials Working Group | Fashion Industry Charter for Climate Action | Raw Materials Working Group
80
• Crop farming (for biobased PET): It is not possible to estimate the contribution of agricultural feedstocks due to lack of transparency in existing datasets and limited data availability on bio-based PET. However, impacts of sugarcane and corn farming can vary depending on the region of sourcing and farming practices. Use of agricultural crops can also contribute to GHG emissions from direct and indirect land use change.
• Polymerization: this process contributes measurably to the GHG profile of PET chips, accounting for 14-18% of the GHG impacts and varies depending on the energy source used for production.
• Depolymerization (for chemically recycled PET): Due to limited data availability, it is was not possible to estimate the degree of contribution to GHG emissions from depolymerization for chemically recycled PET. However, depolymerization is an energy intensive operation and the bulk of the chemically recycled PET impacts are attributed to process energy and chemicals used in production (methanol or ethylene glycol depending on the type of chemical recovery process).
• Waste collection and processing (for recycled PET): Waste collection depends on the sourcing location and can vary
102 Middle East crude oil reserves: 16% Saudi Arabia, 9.5% Iran, 9% Iraq, 6% UAE, 1.5% Qatar103 Top three South American countries with crude oil reserves include Venezuela (~18%), Brazil (~0.78%) and Ecuador (~0.5%).104 Top 3 countries in Africa with crude oil reserves include Libya (~2.89%), Nigeria (~2.23%) and Algeria (~0.72%)
based on the transportation modes and distances. The GHG impacts of waste collection can be negligible if sourced within the vicinity of the manufacturing facility. However, globally, waste materials are shipped from Europe and North America to Asia, which contribute measurably (up to 20%) to the GHG profile of recycled PET. GHG intensity of waste processing depends on the purity of waste stream. The waste processing is less GHG intensive for homogenous waste streams such as post-consumer PET bottles compared to next generation technologies, such as recycling of ocean waste or post-consumer textile waste.
Currently, plastic production consumes about 4–8% of the global gas and oil supply, half of which is used for petrochemical feedstock production and other half is used for process energy generation. As of 2018, EIA estimates that 49% of crude oil reserves are located in Middle East102, followed by South America103 (20), North America (10% Canda and 2.5% USA), Africa104 (8%) and Russia (5%). Crude oil is transported to over 600 refineries globally and refined to produce naphtha and ethane, which are the basic feedstocks required for PET precursor production. Figure 14 provides country-level GHG intensity values for crude oil extraction and refining. It accounts for GHG emissions from exploration, drilling and development, production and extraction, surface processing, transport to the refinery inlet and refining.
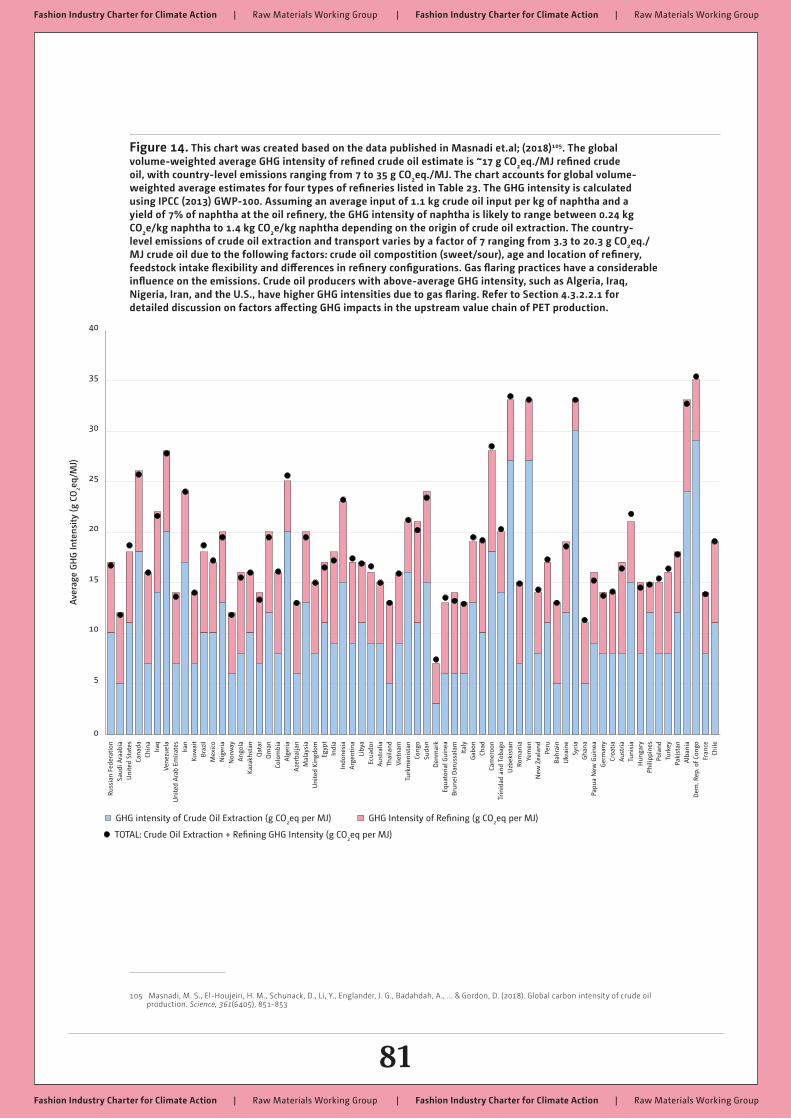
Fashion Industry Charter for Climate Action | Raw Materials Working Group | Fashion Industry Charter for Climate Action | Raw Materials Working Group
Fashion Industry Charter for Climate Action | Raw Materials Working Group | Fashion Industry Charter for Climate Action | Raw Materials Working Group
81
Figure 14. This chart was created based on the data published in Masnadi et.al; (2018)105. The global volume-weighted average GHG intensity of refined crude oil estimate is ~17 g CO2eq./MJ refined crude oil, with country-level emissions ranging from 7 to 35 g CO2eq./MJ. The chart accounts for global volume-weighted average estimates for four types of refineries listed in Table 23. The GHG intensity is calculated using IPCC (2013) GWP-100. Assuming an average input of 1.1 kg crude oil input per kg of naphtha and a yield of 7% of naphtha at the oil refinery, the GHG intensity of naphtha is likely to range between 0.24 kg CO2e/kg naphtha to 1.4 kg CO2e/kg naphtha depending on the origin of crude oil extraction. The country-level emissions of crude oil extraction and transport varies by a factor of 7 ranging from 3.3 to 20.3 g CO2eq./MJ crude oil due to the following factors: crude oil compostition (sweet/sour), age and location of refinery, feedstock intake flexibility and differences in refinery configurations. Gas flaring practices have a considerable influence on the emissions. Crude oil producers with above-average GHG intensity, such as Algeria, Iraq, Nigeria, Iran, and the U.S., have higher GHG intensities due to gas flaring. Refer to Section 4.3.2.2.1 for detailed discussion on factors affecting GHG impacts in the upstream value chain of PET production.
105 Masnadi, M. S., El-Houjeiri, H. M., Schunack, D., Li, Y., Englander, J. G., Badahdah, A., ... & Gordon, D. (2018). Global carbon intensity of crude oil production. Science, 361(6405), 851-853
Russ
ian
Fede
rati
on
0
20
15
10
5
25
30
35
40
Saud
i Ara
abia
Uni
ted
Stat
esCa
nada
Chin
aIr
aqVe
nezu
ela
Uni
ted
Ara
b Em
irat
esIr
anKu
wai
tB
razi
lM
exic
oN
iger
iaN
orw
ayA
ngol
aKa
zakh
stan
Qat
arO
man
Colo
mbi
aA
lger
iaA
zerb
aija
nM
alay
sia
Uni
ted
King
dom
Egyp
tIn
dia
Indo
nesi
a
Fran
ceCh
ile
Ave
rage
GH
G In
tens
ity
(g C
O2e
q/M
J)
Arg
enti
naLi
bya
Ecua
dor
Aus
tral
iaTh
aila
ndVi
etna
mTu
rkm
enis
tan
Cong
oSu
dan
Den
mar
kEq
uato
rial
Gui
nea
Bru
nei D
arus
sala
mIt
aly
Gab
onCh
adCa
mer
oon
Trin
idad
and
Tob
ago
Uzb
ekis
tan
Rom
ania
Yem
enN
ew Z
eala
ndPe
ruB
ahra
inU
krai
neSy
ria
Gha
naPa
pua
New
Gui
nea
Ger
man
yCr
oati
aA
ustr
iaTu
nisi
aH
unga
ryPh
ilipp
ines
Pola
ndTu
rkey
Paki
stan
Alb
ania
Dem
. Rep
. of C
ongo
GHG intensity of Crude Oil Extraction (g CO2eq per MJ) GHG Intensity of Re�ning (g CO2eq per MJ)
TOTAL: Crude Oil Extraction + Re�ning GHG Intensity (g CO2eq per MJ)

Fashion Industry Charter for Climate Action | Raw Materials Working Group | Fashion Industry Charter for Climate Action | Raw Materials Working Group
Fashion Industry Charter for Climate Action | Raw Materials Working Group | Fashion Industry Charter for Climate Action | Raw Materials Working Group
82
2.3.2 Key factors influencing climate impacts
There are two major chemical pathways for production of PET, as shown in the diagram below. Purified Terephthalic acid (PTA) and Dimethyl Terephthalate (DMT) are major building blocks for manufacture of PET filament yarns and staple fibers. Approximately 850-900 kg of Purified Terephthalic Acid (PTA) and 300-400 kg of monoethylene glycol (MEG)
is required to produce 1 metric ton of PET flakes. The GHG impacts of PET production is influenced by the amount of precursor inputs and the feedstock used for precursor production. Figure 15 illustrates the key stages involved in PET production. Detailed process flow diagrams are illustrated in Figure 16 and Figure 17.
Figure 15. Key stages involved in virgin PET, mechanical PET and chemically recycled PET.
Crude Oil &ExtractionRe ning
Natural GasExtraction &Fractionation
Post-consumer
PET bottles
WasteTextiles
Recycled PET�akes
OceanWaste
Naphtha
Steamcracking
Waste collection& sorting
Washing, cleaning,grinding, crushing,oat separation
(a) Esteri�cation
(b) Transesteri�cation
Steam cracking
Steam cracking/Catalyticreforming
Pathway (a) Esteri cation
Pathway (b) Transesteri cation
(1)Glycolysis
(2)Hydrolysis
(3)Methanolysis
+
+
Ethane
Ethylene
EthyleneOxide
p-XylenePTA
(TerephthalicAcid)
MEG(Monoethylene
Glycol)
DMT(Dimethyl
terephthalate)
MEG(Monoethylene
Glycol)
Recovered PTA(Terephthalic Acid)
+ MEG
Recovered DMT(Dimethyl
terephthalate) + MEG
BHET(bishydroxyethyl
terephthalate)
BHET(bishydroxyethyl
terephthalate)
Recovered BHET(bishydroxyethyl
terephthalate)
BHET(bishydroxyethyl
terephthalate)
MeltSpinning/Extrusion
MeltSpinning/Extrusion
MeltPolymerization
Virgin PETFilamentYarn
Mechanicallyrecycled PETFilament Yarn
MeltSpinning/Extrusion
RepolymerizationChemicallyrecycled PETFilament Yarn
Feedstock Production Petrochemical Production Precursor Production PET chips/ake Production Filament/Fiber Formation Scope

Fashion Industry Charter for Climate Action | Raw Materials Working Group | Fashion Industry Charter for Climate Action | Raw Materials Working Group
Fashion Industry Charter for Climate Action | Raw Materials Working Group | Fashion Industry Charter for Climate Action | Raw Materials Working Group
83
Figure 16. Process flow chart for virgin PET chip production (pre-spinning stage).

Fashion Industry Charter for Climate Action | Raw Materials Working Group | Fashion Industry Charter for Climate Action | Raw Materials Working Group
Fashion Industry Charter for Climate Action | Raw Materials Working Group | Fashion Industry Charter for Climate Action | Raw Materials Working Group
84
Figure 17. Process flow chart depicting melt spinning process for PET fibers.

Fashion Industry Charter for Climate Action | Raw Materials Working Group | Fashion Industry Charter for Climate Action | Raw Materials Working Group
Fashion Industry Charter for Climate Action | Raw Materials Working Group | Fashion Industry Charter for Climate Action | Raw Materials Working Group
85
The following section discusses two relevant factors that contribute measurably to the GHG profile of PET production:
• Production pathway of PET: Section 2.3.2.1 explores the two pathways of PET production by reviewing the GHG profile of PET precursors in detail.
• Feedstock selection for PET precursor production: Section 2.3.2.2 explores the GHG intensity of crude oil and natural gas extraction and refining to produce petrochemical feedstocks and reviews alterative feedstocks and its effects on the GHG profile of PET precursor production
2.3.2.1
Selection of PET production pathway
PET can be produced via two chemical pathways depending on the precursor selected for polymerization:
• (a) Transesterification of DMT with ethylene glycol, producing methanol as a by-product, or
• (b) Esterification of PTA with monoethylene glycol (MEG).
Over the years, the development of purified terephthalic acid (PTA) stimulated the replacement of dimethyl terephthalate (DMT) in the production of polyester due to the following advantages of PTA over DMT:
• PET yields from PTA are reported to be higher, on a mass basis, compared to DMT
• Elimination of methanol recovery equipment
• Potentially lower MEG requirements during preliminary stages of reaction, results in lower energy consumption for MEG recovery equipment
• Transesterification of DMT requires a catalyst whereas no catalyst is required for PTA.
106 IHS Markit (2019); DMT and PTA Chemical Economic Handbook
During 2008 to 2018, the consumption of PTA increased 6% per year, and the global PTA consumption is only expected to see a slight slowdown over the next five years. In contrast, the DMT market has been on a declining trend and contracted significantly in the last decade. Asian countries including Japan, South Korea and China dominate the PTA and DMT market demand and while the consumption of DMT is expected to decrease, the consumption of PTA is expected to grow over the next five years106.
Most life cycle assessments of PET report aggregated GHG impacts of PET precursor production and polymerization, and more often, the LCA datasets are aggregated from raw material extraction up to the spinning stage and lack granularity. Due to limited data availability, the current PET LCA landscape does not allow for a process-level comparison of GHG impacts associated with PET production. Thus, it was challenging to determine a low carbon production pathway between transesterification and esterification processes.
However, an attempt has been made to review the PET precursor production of PTA, DMT and MEG in the sections below and identify the main GHG hotspots in the precursor production value chain.
2.3.2.1.1
Purified Terephthalic Acid (PTA) used in
Esterification Pathway
Crude terephthalic acid (CTA) is synthesized by oxidizing p-xylene in an acetic acid solution. A subsequent purification step leads to purified terephthalic acid (PTA). Traditionally, p-xylene is derived from petrochemical feedstock by catalytic reforming of naphtha. As shown in Figure 18, p-xylene production is the most significant contributor to GHG impacts at a PTA production facility and these impacts are influenced by crude oil extraction and refining of crude oil to produce naphtha. The origin of crude oil or natural gas

Fashion Industry Charter for Climate Action | Raw Materials Working Group | Fashion Industry Charter for Climate Action | Raw Materials Working Group
Fashion Industry Charter for Climate Action | Raw Materials Working Group | Fashion Industry Charter for Climate Action | Raw Materials Working Group
86
extraction can have a big influence on the GHG profile of p-xylene production (refer to Section 2.3.2.2.1 and 2.3.2.2.2 for more detail on country-level GHG intensities of crude oil extraction and refining). Currently, efforts are underway to shift away from fossil derived
107 Anonymous due to confidentiality reasons.108 NAPCOR (2020): Cradle to resin Life Cycle Analyis of Polyethylene Terephthalate Resin; https://napcor.com/wp-content/uploads/2020/05/Final-
Revised-Virgin-PET-Resin-LCA.pdf
chemicals and produce bio-based p-xylene for bioPTA production from sugarcane derived bioethanol in Japan. However, due to insufficient data, it is not yet possible to determine the impacts of bio-based p-xylene compared to fossil-based p-xylene.
Figure 18. GHG intensity of terephthalic acid (PTA) and key process contributors to Purified Terephthalic Acid (PTA). Data for Europe is based on Plastics Europe (2016 dataset) and Chinese manufacturer107. PTA production in USA is based on NAPCOR’s 2020 LCA report on PET production108 and data is modeled using primary data representing 2018 calendar year production. The regional differences in PTA production can be attributed to the differences in crude oil and natural gas market mix.
2.3.2.1.2.
Dimethylene Terephthalate (DMT) used in
Transesterification Pathway
DMT was the first material to be used as a precursor in manufacturing PET. Similar to PTA, it is produced by the oxidation of p-xylene and esterified using methanol and is traditionally produced from fossil-based naphtha. While there is no GHG data available for DMT production, as DMT is produced from the same petrochemical feedstock (p-xylene) as PTA, it is expected that crude oil extraction and naphtha production are the key hotspots associated with DMT production.
Currently, the technology to produce recycled DMT from feedstock such as waste bottles, waste textiles (pre-consumer and post-
consumer), etc. has been commercialized by some manufacturers, by deploying chemical methanolysis technology. Chemical recycling via methanolysis is a low-carbon source of DMT compared to DMT derived from petrochemical feedstock such as p-xylene.
2.3.2.1.3
Monoethylene Glycol (MEG)
Steam cracking of naphtha yields ethylene, which is the primary chemical used for ethylene glycol production. Ethylene is oxidized to produce ethylene oxide (EO), an intermediate chemical in ethylene glycol production. This is subsequently hydrolyzed to produce ethylene glycols including monoethylene glycol (MEG), diethylene glycol and tri-ethylene glycol.
1.45
1.50
1.55
1.60
1.65
1.75
1.70
0
20%
40%
60%
100%
80%
PTA
pro
duct
ion
(kg
Co2e
/kg
PTA
)
Europe USA China
p-xyleneproduction60.5%
acetic acidproduction5.0%
CTAproduction11.6%
Electricity + Thermal Energyfor chemical plant10.7%
Other12.2%
Puri�ed Terephthalic Acid(PTA)

Fashion Industry Charter for Climate Action | Raw Materials Working Group | Fashion Industry Charter for Climate Action | Raw Materials Working Group
Fashion Industry Charter for Climate Action | Raw Materials Working Group | Fashion Industry Charter for Climate Action | Raw Materials Working Group
87
Although EG and MEG can be produced separately, in practice the majority of the chemical plants are integrated to produce both chemicals on-site. Approximately 700-850 kg of ethylene is reacted with 600-1100 kg of oxygen to produce 1 metric ton of EO. Carbon dioxide (CO2) is the main by-product of EO production, with around 220-860 kg CO2 generated per metric ton of EO109. Although CO2 recovery systems are installed on-site to capture carbon dioxide, there is a possibility of venting a fraction of CO2 from
109 EU BAT (2017); Production of Large Volume Chemicals; https://eippcb.jrc.ec.europa.eu/sites/default/files/inline-files/JRC109279LvocBref.pdf110 Anonymous due to confidentiality reasons.111 NAPCOR (March 2020): Cradle to resin Life Cycle Analyis of Polyethylene Terephthalate Resin; https://napcor.com/wp-content/uploads/2020/05/
Final-Revised-Virgin-PET-Resin-LCA.pdf
this process which can contribute to GHG emissions.
Figure 19 depicts the GHG hotspots associated with MEG production and it is evident that process energy demand at EO and EG production site is the most significant contributor to the GHG profile of MEG. The source of energy required to produce on-site electricity and thermal energy are also very crucial and can differ depending on the resource availability and energy mix of a country.
Figure 19. GHG intensity of ethylene glycol production and key process contributors to Monoethylene Glycol (MEG). Data for Europe is based on Plastics Europe (2014 dataset) and European manufacturer110. MEG production in USA is based on NAPCOR’s 2020 LCA report on PET production111 and MEG is modeled using primary data representing 2018 calendar year production. The regional differences in MEG production can be attributed to the differences in crude oil and natural gas market mix. USA has a higher share of ethylene produced via fractionation of natural gas liquids, which is lower in GHG impacts compared to crude-oil based steam cracker products.
2.3.2.2 Choice of Feedstock for Precursor Production
The GHG profile of PET precursors (PTA, DMT and MEG) is influenced by the feedstock composition and its environmental profile. The environmental profile of feedstock can vary depending on the origin of feedstock, energy demand of the process, location of feedstock production, feedstock yields and the source of energy for feedstock production. This section explores the following in detail:
• Environmental profile of crude oil and natural gas extraction, by country (Section 2.3.2.2.1)
• Petrochemical feedstock production from crude oil and natural gas extraction (Section 2.3.2.2.2)
• Recycled feedstock (Section 2.3.2.2.3)• Alternative feedstock such as waste
gases from steel mills and bioethanol (Section 2.3.2.2.4)
1.45
1.50
1.55
1.60
1.65
1.75
1.70
0
20%
40%
60%
100%
80%
MEG
pro
duct
ion
(kg
Co2e
/kg
MEG
)
Europe USA China
Crude Oil & NGextraction &transport13.7%
Re�nery4.9%
On-site EO/EGproduction53.5%
Electricity + Thermal Energyfor chemical plant27.6%
Otherraw materials0.1%
Monoethylene Glycol(MEG)

Fashion Industry Charter for Climate Action | Raw Materials Working Group | Fashion Industry Charter for Climate Action | Raw Materials Working Group
Fashion Industry Charter for Climate Action | Raw Materials Working Group | Fashion Industry Charter for Climate Action | Raw Materials Working Group
88
2.3.2.2.1
Crude Oil and Natural Gas Extraction
and Refining
The environmental profile of feedstock differs based on the raw material type (crude oil or natural gas) and characteristics, location, refinery characteristics and environmental regulations. Crude oil is the main feedstock used in the chemicals sectors, where over 90% of crude oil produced is converted into high value petrochemical products (e.g., naphtha, ethylene, etc.)112 and is the most widely used feedstock to manufacture precursors for virgin PET. Crude oil is extracted and processed in petroleum (oil) refineries which are complex systems involving multi-stage processes to produce various petrochemical products. The environmental performance of a refinery can vary depending on the following factors:
• Feedstock (composition of crude oil) and origin (crude oil composition varies by location): The composition of the crude oil is the most important parameter in determining the range of outputs from a refinery. Sulfur is the main impurity in crude oil (1-5% of total) and the sulfur content determines the type and yields of petrochemical products. Crude oil containing more than 0.5 % sulfur are commonly referred to as ‘sour’ and crude oil containing <0.5% sulfur is known as “sweet” crude. Lower levels of sulfur content requires less resources and energy to refine so sweet crude is desirable for lower GHG petrochemical production.
• Location and age of refinery: While there are over 600 refineries worldwide, crude oil and natural gas reserves are concentrated in few regions including Middle East, North America, North
112 IEA (2018); The Future of Petrochemicals; https://www.iea.org/reports/the-future-of-petrochemicals113 Ibid.
Sea and Russia, so the crude oil is transported across continents, adding to climate impacts from transportation. The refineries are sensitive to costs associated with feedstock as well as transportation. Although it is desirable to process “sweet” crude, it may not always be economically viable for a refinery to procure sweet crude. For example, low-sulfur crude oil from North Sea are rarely processed in the Mediterranean area due to high freight costs.
• Market situation: The primary determinant for the choice of pathway to produce a petrochemical (naphtha and ethylene used for PET) is the cost and availability of feedstocks, which varies substantially between regions. While price of crude oil is fairly similar across the globe, natural gas tends to be more expensive (can increase by a factor of four113). For example, ethylene, which is the used to make MEG for PET production, can be produced from either crude oil or natural gas. The yield of ethylene from natural gas is much higher than crude oil,and can be lower in climate impact compared to crude oil derived ethylene, but it is not always economically viable for refineries to import natural gas.
• Differences in configurations and design of control systems: The feedstock intake flexibility differs by refinery and not all refineries are equipped to deal with high-sulfur/sour crudes due to insufficient desulfurization capacity. Refineries located close to oil fields and equipped with integrated operations to produce multiple products from naphtha (xylenes, ethylene) can be more energy efficient and lead to lower GHG impacts.

Fashion Industry Charter for Climate Action | Raw Materials Working Group | Fashion Industry Charter for Climate Action | Raw Materials Working Group
Fashion Industry Charter for Climate Action | Raw Materials Working Group | Fashion Industry Charter for Climate Action | Raw Materials Working Group
89
Figure 20. Global oil and gas basins, and oil production (Adapted from: <https://maps.fractracker.org/3.13/?appid=8e72a974af4c4fe9ba6875cee03078ee>). EIA estimates that 49% of crude oil reserves are located in the Middle East, followed by South America (20%), Canada (10%), Africa (8%) and Russia (7%).
114 Plastics Europe (2013); Benzene, Toluene, and Xylenes (Aromatics, BTX); https://www.plasticseurope.org/en/resources/eco-profiles#115 Adapted from Table 2 Plastics Europe (2013); Benzene, Toluene, and Xylenes (Aromatics, BTX); https://www.plasticseurope.org/en/resources/
eco-profiles#116 Applied heating value of 45MJ/kg to convert CO2 emissions per kg of crude oil to per MJ of crude oil.
In the current LCA landscape, Plastics Europe’s Eco-profile of PET is the most widely used, publicly available LCA dataset for virgin PET production and is also integrated into commercial LCA databases such as GaBi and ecoinvent. It is therefore important to investigate the locations of crude oil
extraction and the GHG intensity of crude oil extraction impacts in the dataset. Table 22 provides the market mix of crude oil and natural gas extraction modeled to represent European Union’s value chain and specifies the carbon intensity (only CO2 pollutant) of crude oil and natural gas extraction.
Table 22. Plastics Europe114 upstream value chain modeling assumptions for crude oil and natural gas extraction.
Feedstock Country% Volume
ModeledEfficiency
(%)
g CO2 emission per kg crude
oil115g CO2 emission per
MJ crude oil116
Cru
de O
il
Libya, Algeria, Angola 11.1% 97.26 0.289 6.4
Middle East, Azerbaijan, Kazakhstan 22.9% 95.32 0.290 6.4
Netherlands 0.3% 99.82 0.0304 0.66
Nigeria 4.3% 98.78 0.4468 9.9
Norway, Denmark 15.7% 99.63 0.0692 1.5
Russia 32.8% 96.78 0.2014 4.5
United Kingdom 10.1% 99.19 0.1980 4.4
Venezuela 2.8% 91.35 0.4580 10.1
Average mix modeled in Plastic Europe
datasets
97.13 0.2278 5.04

Fashion Industry Charter for Climate Action | Raw Materials Working Group | Fashion Industry Charter for Climate Action | Raw Materials Working Group
Fashion Industry Charter for Climate Action | Raw Materials Working Group | Fashion Industry Charter for Climate Action | Raw Materials Working Group
90
Feedstock Country% Volume
Modeled Efficiency (%)g CO2 emission per
kg crude oil117g CO2 emission per MJ
natural gas118
Nat
ural
Gas
Algeria, Qatar 16.5% 88.44 0.2888 5.93
Germany 6.4% 95.12 0.1462 3.02
Netherlands 23.2% 98.76 0.0274 0.57
Norway 23.6% 96.74 0.0779 1.61
Russia 22.7% 85.41 0.3487 7.2
United Kingdom 7.6% 94.36 0.1533 3.18
Average mix modeled in Plastic Europe
datasets
92.98 0.1727 3.5
117 Adapted from Table 3 Plastics Europe (2013); Benzene, Toluene, and Xylenes (Aromatics, BTX); https://www.plasticseurope.org/en/resources/eco-profiles#
118 Applied heating value of 48.5MJ/kg to convert CO2 emissions per kg of gas to per MJ of natural gas.119 Eurostat (2018); https://ec.europa.eu/eurostat/cache/infographs/energy/bloc-2c.html120 Masnadi, M. S., El-Houjeiri, H. M., Schunack, D., Li, Y., Englander, J. G., Badahdah, A., ... & Gordon, D. (2018). Global carbon intensity of crude oil
production. Science, 361(6405), 851-853
The background data used to model feedstock production data is based on crude oil and natural gas derived from countries listed in Table 22 for the year 2009; with a maximum temporal validity of 5 years (until 2014). The mix of crude oil import modeled in Plastics Europe, is not representative of the current EU scenario. In 2018, 30% of crude oil imports into the EU came from Russia, (8.7% from Iraq, and 7% each from Saudi Arabia, Norway, Kazakhstan and Nigeria). A similar analysis shows that almost three quarters of the EU’s imports of natural gas came from Russia (40%), Norway (18 %) and Algeria (11 %)119. While the refinery operations are not likely to change significantly, the market share of crude oil imported by EU has changed significantly over the past decade and as the environmental profile of crude oil extraction varies by location, it could have a significant influence on impact of PET production.
Figure 21 illustrates the latest available data on crude oil import and export flows globally. It is evident that the crude oil supply chain has shifted over the past decade and the background data in Plastics Europe is not representative of the current market mix. It
is also not appropriate to use the background data from Plastics Europe to model upstream crude oil supply chain for PET produced in Asian countries including China, India, Taiwan and Japan.
A recent LCA study published in 2018120, quantified the crude oil well-to-refinery GHG emission intensities by conducting field-by-field life-cycle analysis (LCA) of nearly 9,000 global oilfields representing ~98% of 2015 worldwide crude oil production. Figure 22 presents country level GHG intensity for crude oil extraction and transportation. The global volume-weighted average of crude oil extraction and processing is 10.3 g CO2e/MJ crude oil, with country-level intensities ranging from 3.3 (Denmark) to 20.3 (Algeria) g CO2e/MJ crude oil. Gas is often a co-product of crude oil extraction and is either flared, reinjected, or vented (directly emitting methane), if it is not sold to consumers. Countries with gas flaring practices have high GHG intensities and it is estimated that flaring can result in approximately 8-10 kg CO2/barrel. Installation of flare gas recovery units help eliminate the release of methane and reduce GHG emissions. *

Fashion Industry Charter for Climate Action | Raw Materials Working Group | Fashion Industry Charter for Climate Action | Raw Materials Working Group
Fashion Industry Charter for Climate Action | Raw Materials Working Group | Fashion Industry Charter for Climate Action | Raw Materials Working Group
91
Figure 21. 2018 crude oil flows representing nearly 65% of the market volume [Adapted from Resource Trade.Earth].121 Saudi Arabia, Russia, UAE, Iraq and Canada were the top 5 exporters of crude oil in 2018 while China, USA, India and Japan were the top importers of crude oil.
Figure 22. This chart was created based on the data published in Masnadi et.al; (2018)122. The global volume-weighted average GHG intensity estimate is 10.3 g CO2eq./MJ crude oil extracted, with country-level emissions ranging from 3.3 to 20.3 g CO2eq./MJ crude oil. It accounts for GHG emissions from exploration, drilling and development, production and extraction, surface processing, and transport to the refinery inlet. The GHG intensity is calculated using IPCC (2013) GWP-100. Gas flaring practices have a considerable influence on the emissions. Crude oil producers with above-average GHG intensity, such as Algeria, Iraq, Nigeria, Iran, and the U.S., have higher GHG intensities due to gas flaring.
121 https://resourcetrade.earth/data?year=2018&category=138&units=weight122 Masnadi, M. S., El-Houjeiri, H. M., Schunack, D., Li, Y., Englander, J. G., Badahdah, A., ... & Gordon, D. (2018). Global carbon intensity of crude oil
production. Science, 361(6405), 851-853
GHG Intensity of Re�ning (g CO2eq per MJ)3
1030
Scale
Exporter Importer
45m t90m t180m t
USA
Canada
Mexico
Norway
Belgium
Brazil
Area,nes
Europe,nes
UKNld Poland
Belarus
Ger
Russia
Oman
UAE
KwtIraq Iran
China Japan
Asia,nes
Korea
India
SaudiArabia
Angola
NigeriaVenezuela

Fashion Industry Charter for Climate Action | Raw Materials Working Group | Fashion Industry Charter for Climate Action | Raw Materials Working Group
Fashion Industry Charter for Climate Action | Raw Materials Working Group | Fashion Industry Charter for Climate Action | Raw Materials Working Group
92
Naphtha and ethane are the main petrochemical feedstocks for PET precursor production and are primarily derived from crude oil and natural gas respectively. Crude oil refining comprises two key phases: (1) Desalting of crude oil and (2) Atmospheric distillation, which is the main process that yields naphtha (the main raw material for PET precursors) as well as the many other products such as kerosene, oils, LPG, etc. The yields of refinery products are determined by the crude oil composition and the refinery configurations can vary depending on the level of sulfur impurities. Key climate hotspots associated with crude oil refining operations are summarized:
• As shown in the table below, refinery operations are energy intensive and at
123 IEA (2018); The Future of Petrochemicals; https://www.iea.org/reports/the-future-of-petrochemicals124 Masnadi, M. S., El-Houjeiri, H. M., Schunack, D., Li, Y., Englander, J. G., Badahdah, A., ... & Gordon, D. (2018). Global carbon intensity of crude oil
production. Science, 361(6405), 851-853
least 60% of refinery air emissions are linked to energy production for various process units.
• Carbon dioxide (CO2), carbon monoxide, particulates, nitrogen oxides and sulfur oxides emissions from power plants, boilers, hydrotreaters and catalytic cracking are the main sources of emissions to the atmosphere.
According to IEA, the average refinery naphtha yields are around 7% of an average barrel of crude oil123. Table 23 provides the GHG intensity for four major refinery types and also identifies the process contributors for each refinery. Note that naphtha is only one of the several products produced at the refinery so not all unit processes defined in the table are applicable to naphtha.
Table 23. Average GHG intensity by refinery type (adapted from Masnadi, M.S et.al (2018)124), in order of complexity. Note that not all processes are applicable to naphtha production.
Refinery Type
Input Crude Process Unit Emissions Contribution (%)
ComplexitySulfur (wt%)
GHG Intensity
(kg CO2eq bbl-1)
AT: atmospheric
tower+
VT: vacuum tower
FCC: fluid catalytic cracking
GO-HC: gas oil hydrocracker
Coker/ RH: residue
hydrocracker Hydrotreater Others*
Hydroskimming Low 0.8 17.3 18% 0 0 0 51% 31%
Medium
ConversionModerate 1.1 36.3 14% 17% 15% 0 40% 14%
Deep
Conversion
(Coking)
High 1.4 47.7 14% 19% 15% 4% 39% 9%
Deep
Conversion
(Hydrocracking)
Very High 1.3 52.1 8% 1% 16% 26% 20% 29%
Global Average 32 1.2 40.7 14% 15% 13% 3% 40% 15%
* including desalter, kerosene merox unit, alkylation unit, catalytic naphtha reformer, isomerization unit, and fuel gas treatment unit.
The above table reflects the differences in refinery operations based on the sulfur content. It can be inferred that low complexity hydroskimming refineries are
lower in impact compared to deep conversion refineries, which consists of several supporting operations to further process petrochemicals.

Fashion Industry Charter for Climate Action | Raw Materials Working Group | Fashion Industry Charter for Climate Action | Raw Materials Working Group
Fashion Industry Charter for Climate Action | Raw Materials Working Group | Fashion Industry Charter for Climate Action | Raw Materials Working Group
93
The appropriate modelling of the petroleum refinery as part of the upstream chain is a key factor influencing polymer precursor production impacts. The Eco-profile of naphtha production is estimated to be 0.34 kg CO2e per kg of naphtha (calculated using IPCC 2007 GWP 100 method) according to Plastics Europe, assuming crude oil input of 1.1 kg per kg of naphtha. The data was collected in 2005 so it is nearly 15 years old and is not representative of the current market situations.
125 Masnadi, M. S., El-Houjeiri, H. M., Schunack, D., Li, Y., Englander, J. G., Badahdah, A., ... & Gordon, D. (2018). Global carbon intensity of crude oil production. Science, 361(6405), 851-853
Figure 23 presents country-level GHG intensity for oil refining operations based on data collected from over 600 refineries in 2015. The impact of naphtha production will vary depending on the location of refinery and origin of crude oil. Only a fraction of the refinery outputs yield naphtha (average of 7%) but the trend of GHG impacts related to naphtha production would correlate with the GHG impacts of crude oil refining. Naphtha produced in Europe is likely to be lower in GHG impact compared to naphtha produced in Asia (mainly India and China).
Figure 23. This chart was created based on the data published in Masnadi et.al; (2018)125. The global volume-weighted average GHG intensity estimate is ~7 g CO2eq./MJ refined crude oil, with country-level emissions ranging from 3 to 10 g CO2eq./MJ. It accounts for global volume-weighted average estimates for four types of refineries listed in Table 23. The GHG intensity is calculated using IPCC (2013) GWP-100. Assuming an average input of 1.1 kg crude oil input per kg of naphtha and a yield of 7% of naphtha at the oil refinery, the GHG intensity of naphtha is likely to range between 0.24 kg CO2e/kg naphtha to 1.4 kg CO2e/kg naphtha depending on the origin of crude oil extraction.
GHG Intensity of Re�ning (g CO2eq per MJ)3 10

Fashion Industry Charter for Climate Action | Raw Materials Working Group | Fashion Industry Charter for Climate Action | Raw Materials Working Group
Fashion Industry Charter for Climate Action | Raw Materials Working Group | Fashion Industry Charter for Climate Action | Raw Materials Working Group
94
2.3.2.2.2
Petrochemical production for PET precursors
Petrochemicals are chemicals derived from crude oil (petroleum) products, such as ethane and naphtha, or from fractionated natural gas liquids and processed in steam crackers or catalytic reformers. These chemicals are called “high-value chemicals (HVCs)” and typically include light olefins (ethylene and propylene) and aromatics (benzene, toluene and mixed
xylenes [BTX]). Table 24 outlines the main feedstocks used to produce PET precursors including MEG, PTA and DMT. MEG is produced from oxidizing ethylene to form ethylene oxide, followed by hydrolysis. PTA is produced by oxidizing p-xylenes, synthesized from naphtha. Ethane is the principal feedstock for ethylene production in North America and Middle East, whereas naphtha is the main feedstock for ethylene production in Europe and Asia.
Table 24. Feedstock for PET feedstock production.
PET Precursor
Raw Material for Precursor
Petrochemical Feedstock to produce Raw Material Process
Primary Petrochemical Producing Regions
Monoethylene Glycol
(MEG)
Ethylene Ethane from naphtha (crude-oil based)
Ethane from natural gas liquids
Steam cracker
Steam cracker
Europe and Asia
North America &
Middle East
Purified Terephthalic
Acid (PTA)
p-xylenes Naphtha from crude oil Catalytic
Reformer
Europe and Asia
Dimethylene
Terephthalate (DMT)
p-xylenes Naphtha from crude oil Catalytic
Reformer
Europe and Asia
The environmental profile of processing petrochemical feedstock in a steam cracker or catalytic reformer is influenced by the following:
• The feedstock mix, which differs depending on the source and location of production. For example, ethylene is synthesized from ethane, which can be derived from either naphtha (crude oil) or natural gas. The GHG profile of ethane will vary not only based on the impacts of crude oil or natural gas extraction, but also the location and characteristics of the refinery. Natural gas extraction has a lower GHG profile compared to crude oil extraction, but petrochemical production from natural gas is subject to cost and feedstock availability. Figure 24 illustrates that crude oil extraction and refining impacts contributes significantly to the GHG profile of ethylene and p-xylene production, accounting for approximately 36% and 50% of total production impacts, respectively.
China, the world’s leading PET producer, has very limited availability of natural gas liquids feedstocks and more than 90% of the HVC production is dependent on naphtha as the primary feedstock. In contrast, USA is one of the leading producers of ethane from natural gas liquids due to abundant natural gas resources. In the European Union, crackers are fed with at least 70% naphtha and remaining feed is based on natural gas liquids (NGL). Ethane is mainly processed from North Sea gas fields, whereas other feedstock gases come from refineries. Thus, the GHG profile of ethylene can vary depending on the origin and location of production.
• Energy demand for steam cracker and catalytic reformer. Majority of the thermal energy demand is needed to heat the feedstock and operate the steam cracker for ethylene, and catalytic reformers for p-xylenes (as shown in the figure below).

Fashion Industry Charter for Climate Action | Raw Materials Working Group | Fashion Industry Charter for Climate Action | Raw Materials Working Group
Fashion Industry Charter for Climate Action | Raw Materials Working Group | Fashion Industry Charter for Climate Action | Raw Materials Working Group
95
Figure 24. Key process contributors to GHG impacts from p-xylene production (used for PTA production) and ethylene production (used for MEG production). This contribution charts presents the petrochemical feedstock for steam cracker utilizing naphtha for both p-Xylene (around 86% naphtha) and ethylene (at least 74% naphtha) production.
126 IEA (2018); The Future of Petrochemicals; https://www.iea.org/reports/the-future-of-petrochemicals
• Process yields: Higher process yields driver lower feedstock input and energy consumption. In case of MEG, use of ethane as a feedstock for ethylene production offers higher yields compared to naphtha, with ethane steam cracker yields about 50% higher ethylene yields compared to naphtha. In contrast, naphtha feedstock delivers higher xylene yields, which is the main chemical required for PTA production. Use of catalyst in steam cracking process can result in a 20% yield gain in HVCs when using naphtha as a feedstock.
The following practices have the potential to lower the GHG profile of petrochemical feedstock production (naphtha and ethane) and chemical production (xylene and ethylene):
• Refineries with integrated petrochemical production: Integrating petrochemical feedstock and chemical production with refineries or natural gas fractionation plants has the potential to lower GHG impacts due to reduced transportation impacts, reduced energy consumption by recovering heat energy from the refinery and redirecting it towards
chemical production and efficient use of other utilities and logistics. Refineries also produce certain amounts of HVCs, such as propylene and BTX aromatics including xylene, directly from catalytic cracking and reforming processes, accounting for average of 1-2% of refinery yields. The level and type of integration between refining and petrochemical operations varies by region. Europe and Asia have good potential for integrating operations as both regions depend on crude oil feedstock imports and have limited local availability of natural gas liquids. China has the highest level of refining and petrochemical integration globally. About 40% of European naphtha steam cracking capacity is located within integrated refinery petrochemical complexes. In USA, less than 20% of total US naphtha cracking capacity is integrated with refineries. However, due to availability of natural gas, upstream natural gas extraction can be integrated up to ethane production.
• Adopting naphtha catalytic cracking (NCC) technology: According to IEA126,
0
20%
40%
60%
100%
80%
Crude Oil & NGextraction &transport26.4%
Re�nery9.5%
Ethylene57.9%
Electricityfor chemical plant5.9%
Ethylene
0
20%
40%
60%
100%
80%
Crude Oil & NGextraction &transport26.4%
Re�nery24.6%
Steam Cracking9.8%
Electricity for chemical plant)37.0%
Aromatics Complex(BTX extraction0.1%
p-xylene

Fashion Industry Charter for Climate Action | Raw Materials Working Group | Fashion Industry Charter for Climate Action | Raw Materials Working Group
Fashion Industry Charter for Climate Action | Raw Materials Working Group | Fashion Industry Charter for Climate Action | Raw Materials Working Group
96
naphtha catalytic cracking (NCC) is 15% more energy efficient compared to the world’s best performing naphtha steam cracker, and the process requires nearly 25% less naphtha feedstock per unit of HVC produced. Upgrading existing infrastructure to produce HVCs can drive lower GHG profiles. However, this is an emerging technology, as currently only one commercial plant is operating in Korea. The high investment costs to upgrade the existing infrastructure is the main barrier for adopting this technology.
2.3.2.2.3
Recycled feedstock for PET precursors
Recycling PET reduces the demand for fossil fuel extraction and primary chemical production, thereby saving energy and GHG emissions. For example, 1 metric ton of PET waste recycled (post-consumer PET bottles, pre/post-consumer textiles, ocean waste) can displace the demand for approximately 1 metric ton of ethylene, which is the feedstock for MEG production. Current recycling technologies are promising as a low carbon alternative compared to fossil-based PET. The sections below describe the relevant factors affecting the GHG profile of precursor production from recycled feedstock.
Quality of Feedstock
The quality of recycled feedstock is determined by the ability of the feedstock to meet the performance requirements and intrinsic viscosities of end products, which is influenced by the physical properties of waste material inputs and the quality of recycled feedstocks. The feedstock costs to recyclers is governed by market demand and typically influenced by the quality of the inputs and the scale, efficiency and profitability of their recycling operations. The grades of PET polymers differ qualitatively based on their molecular weight or intrinsic viscosity, optical
127 “The Importance of Intrinsic Viscosity Measurement.” AMETEK Sensors, Test & Calibration. http://www.ametektest.com/learningzone/library/articles/ the-importance-of-intrinsic-viscosity-measurement.
appearance and the common additive profiles. It is the melting point, crystallinity and tensile strength of the material that reflects the intrinsic viscosity of a polymer. The intrinsic viscosity (IV) required is dictated by the intended application of the polymer, so higher IV is required for producing products with higher tensile strength specification. Typically, PET bottle grade resin, which is a more crystalline form of PET, have higher IV compared to amorphous form of PET which is used for fiber applications that require lower degree of performance compared to bottles127.
Waste Collection and recycling rates
The GHG profile of waste collection and sorting is much lower in comparison to GHG intensive crude oil exploration and extraction operations. In the context of PET production, three main type of wastes are used to produce recycled feedstocks:
• Post-consumer PET bottles for “bottle-to-fiber” recycling
• Pre-consumer waste from the manufacture of textiles (e.g., garments, carpets, automotive interiors, office furniture, etc.), for “fiber-to-fiber” recycling
• Ocean waste
While multiple technologies can be used to recycle PET waste, this section focuses on the waste collection methods and recycling rates of PET input materials. The recycling rate is key to maintaining a stable supply of feedstock for recycled PET production. Out of the three types of wastes listed above, post-consumer PET bottles are the most widely recovered waste streams and bottle-to-fiber recycling is commercialized via mechanical recycling methods.
Global trade in plastic waste has declined since 2014 and decreased sharply in 2017, when global plastic waste trade volumes almost halved, compared to the previous
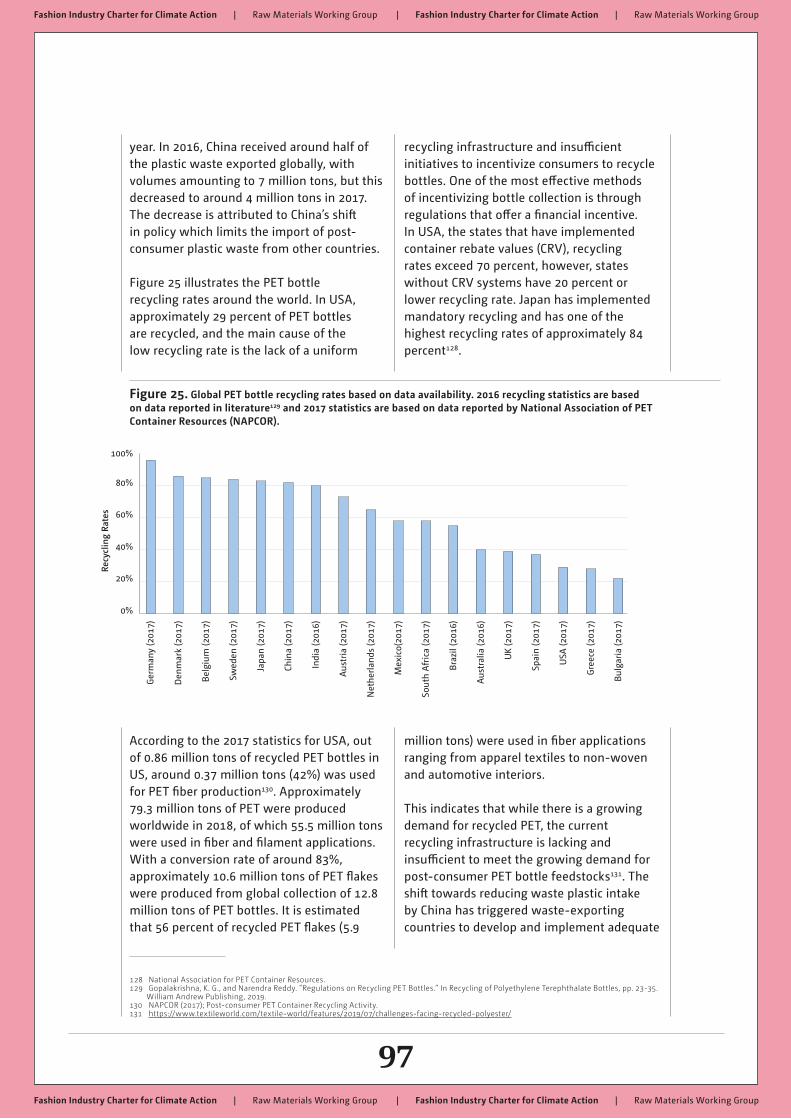
Fashion Industry Charter for Climate Action | Raw Materials Working Group | Fashion Industry Charter for Climate Action | Raw Materials Working Group
Fashion Industry Charter for Climate Action | Raw Materials Working Group | Fashion Industry Charter for Climate Action | Raw Materials Working Group
97
year. In 2016, China received around half of the plastic waste exported globally, with volumes amounting to 7 million tons, but this decreased to around 4 million tons in 2017. The decrease is attributed to China’s shift in policy which limits the import of post-consumer plastic waste from other countries.
Figure 25 illustrates the PET bottle recycling rates around the world. In USA, approximately 29 percent of PET bottles are recycled, and the main cause of the low recycling rate is the lack of a uniform
128 National Association for PET Container Resources.129 Gopalakrishna, K. G., and Narendra Reddy. “Regulations on Recycling PET Bottles.” In Recycling of Polyethylene Terephthalate Bottles, pp. 23-35.
William Andrew Publishing, 2019.130 NAPCOR (2017); Post-consumer PET Container Recycling Activity.131 https://www.textileworld.com/textile-world/features/2019/07/challenges-facing-recycled-polyester/
recycling infrastructure and insufficient initiatives to incentivize consumers to recycle bottles. One of the most effective methods of incentivizing bottle collection is through regulations that offer a financial incentive. In USA, the states that have implemented container rebate values (CRV), recycling rates exceed 70 percent, however, states without CRV systems have 20 percent or lower recycling rate. Japan has implemented mandatory recycling and has one of the highest recycling rates of approximately 84 percent128.
Figure 25. Global PET bottle recycling rates based on data availability. 2016 recycling statistics are based on data reported in literature129 and 2017 statistics are based on data reported by National Association of PET Container Resources (NAPCOR).
According to the 2017 statistics for USA, out of 0.86 million tons of recycled PET bottles in US, around 0.37 million tons (42%) was used for PET fiber production130. Approximately 79.3 million tons of PET were produced worldwide in 2018, of which 55.5 million tons were used in fiber and filament applications. With a conversion rate of around 83%, approximately 10.6 million tons of PET flakes were produced from global collection of 12.8 million tons of PET bottles. It is estimated that 56 percent of recycled PET flakes (5.9
million tons) were used in fiber applications ranging from apparel textiles to non-woven and automotive interiors.
This indicates that while there is a growing demand for recycled PET, the current recycling infrastructure is lacking and insufficient to meet the growing demand for post-consumer PET bottle feedstocks131. The shift towards reducing waste plastic intake by China has triggered waste-exporting countries to develop and implement adequate
Ger
man
y (2
017)
0%
20%
40%
60%
80%
100%
Den
mar
k (2
017)
Bel
gium
(201
7)
Swed
en (2
017)
Japa
n (2
017)
Chin
a (2
017)
Indi
a (2
016)
Aus
tria
(201
7)
Net
herl
ands
(201
7)
Mex
ico(
2017
)
Sout
h A
fric
a (2
017)
Bra
zil (
2016
)
Aus
tral
ia (2
016)
UK
(201
7)
Spai
n (2
017)
USA
(201
7)
Gre
ece
(201
7)
Bul
gari
a (2
017)
Recy
clin
g Ra
tes

Fashion Industry Charter for Climate Action | Raw Materials Working Group | Fashion Industry Charter for Climate Action | Raw Materials Working Group
Fashion Industry Charter for Climate Action | Raw Materials Working Group | Fashion Industry Charter for Climate Action | Raw Materials Working Group
98
domestic infrastructure to manage and increase the PET recycling rates.
In comparison to the bottle collection rates, garment collection rates are much lower. In 2017, USA generated 16.9 million tons of discarded clothing132, Europe discarded around 5.8 million metric tons of textile133 and China disposed nearly 26 million tons of clothing134.
Sorting
Sorting of PET waste from mixed plastic waste, ocean waste, post-consumer bottles or post-consumer textiles is a key determinant of the purity, quality and cost of the recycled feedstock. Generally, sorting is predominantly manual in countries like India, which not only increases the cost of feedstock but also hinders the ability to control the quality and contaminant levels of the waste stream. From a GHG perspective, while manual sorting does not have any impact on the climate, the main constraint is the heterogeneity of the PET waste and challenges of producing high quality PET that is equivalent to virgin PET.
In this regard, Fibersort, a sophisticated automated sorting technology is being developed for mechanical and chemical reprocessing of PET textiles. This technology uses NIRS (near infrared spectroscopy) to automatically sort out large volumes of the textiles used by consumers, based on their fiber types and has the potential to reduce contamination to the lowest degree possible. Currently, Interreg North-West Europe has invested to commercialize Fibersoft technology135.
Type of Recycling Technology
As PET is a thermoplastic, it can be reprocessed into new fibers. PET waste can be recycled using multiple technologies including chemical and mechanical methods. The purity and quality of the waste stream has an influence
132 US Environmental Protection Agency, Municipal Solid Waste Statistics (2017).133 European Environmental Agency, 2019.134 https://www.acceleratingcircularity.org/insights135 Chemical Recycling: Making Fiber-to-Fiber Recycling a Reality for Polyester Textiles: https://greenblue.org/work/chemical-recycling/
on the type of recycling technology that can be deployed to effectively produce PET. The GHG intensity of recycled feedstock depends on the contaminant level which determines the degree of cleaning required before recycling. For example, post-consumer PET bottles are commonly recycled using mechanical or chemical technologies as it is less complex and more homogenous waste stream to process, compared to post-consumer textile and ocean waste. It is more challenging to remove contaminants and impurities and difficult to control the quality of post-consumer textile (e.g. clothing, carpet, automotive interiors, office furniture, etc.) and ocean waste. Generally, it is more GHG intensive to clean post-consumer garments and ocean waste, compared to post-consumer bottles.
This section provides an overview of the key recycling technologies for PET.
Mechanical Recycling
Mechanical recycling typically involves collection, sorting and separation of PET waste, followed by cleaning for removal of contaminants and impurities, size reduction by grinding/crushing/shredding, heating and re-melting into PET pellets, and melt extrusion into filament yarn. Mechanical recycling of PET is predominantly achieved through the reprocessing of post-consumer PET bottles and has the lowest GHG profile compared to virgin PET and other PET recycling technologies. The PET bottles with higher intrinsic viscosity value are often downcycled into lower intrinsic value PET yarns (bottle-to-fiber recycling). The heterogeneity of the PET waste is the main challenge for mechanical recycling because degradation of mechanical properties can cause product quality and performance issues. Filament yarns for apparels require high-quality feedstock, and postconsumer PET flakes used for these fibers should have consistent intrinsic viscosity around 0.7 dL/g.

Fashion Industry Charter for Climate Action | Raw Materials Working Group | Fashion Industry Charter for Climate Action | Raw Materials Working Group
Fashion Industry Charter for Climate Action | Raw Materials Working Group | Fashion Industry Charter for Climate Action | Raw Materials Working Group
99
Chemical Recycling
Chemical recycling enables the transformation of the PET polymer chain by depolymerizing the PET polymer into eithers its monomers (DMT or PTA) or oligomers (BHET) which are re-used to produce PET products by applying polycondensation (transesterification or esterification pathways) processes. As illustrated in Figure 15, chemical recycling can be performed either by (1) Hydrolysis; (2) Glycolysis; (3) Methanolysis and (4) Aminolysis. In the current PET landscape, glycolysis and methanolysis pathways have reached commercial maturity and the demand for chemically recycled PET is projected to grow further as the industry shifts towards a circular economy.
Methanolysis is an alcoholysis treatment which yields DMT and MEG. In comparison to the three chemical recycling pathways, the methanolysis pathway has the potential to treat lower quality feedstocks with higher rates of contaminants, without impacting the quality of the end product. The cost associated with purifying DMT is lower compared with BHET and PTA, making this pathway economically feasible.
The advantage of the glycolysis process is that the recovered BHET oligomer can be incorporated into virgin BHET and the mixture can be utilized in either transesterification (DMT+MEG) or esterification (PTA+MEG) PET pathways. However, as the glycolysis process is a partial depolymerization method to derive BHET oligomer, the colorants and other impurities may not be completely removed so this can cause deterioration of the physical properties.
The hydrolysis pathway can be carried out in either acidic medium (using sulfuric acid) or alkaline medium (sodium hydroxide) to yield PTA. The main challenge is that this is a cost intensive process due to the costs associated with sulfuric acid recovery and purification of PTA.
136 Chemical Recycling: Making Fiber-to-Fiber Recycling a Reality for Polyester Textiles: https://greenblue.org/work/chemical-recycling/
Chemical recycling is agnostic to the type of feedstock, and is the preferred technology for recycling waste textiles, facilitating the separation of PET from blended garments (e.g., elastane or cotton) or dyes and chemical finishes via the chosen depolymerization pathway. A recent study estimates that chemical recycling technologies are economically feasible when the purity level is around 70-80% PET content by weight136. As illustrated in Figure 14, 5-27% GHG reductions can be achieved by shifting from virgin PET filament to chemically recycled PET filament yarn. While chemical recycling is more energy and GHG intensive in comparison to mechanical recycling, it addresses some of the challenges of mechanical recycling by meeting higher intrinsic viscosities and allowing for upcycling of PET feedstock.
2.3.2.2.4
Alternative feedstock for PET precursors
The PET manufacturing sector is currently developing innovative technologies to adopt alternative feedstocks such as waste gases from steel mills, sugarcane and corn derived precursors. This section provides a brief overview of two alternative feedstocks. Section 8 discusses the emerging technologies and fibers in the textile and apparel sector.
Waste gases
Gases generated as a by-product of coke oven plants in the coal power and iron and steel industry (e.g., coke oven gas, or COG) contain components that can be captured and reprocessed for suitable use as feedstock. COG primarily contains hydrogen, methane, carbon monoxide and carbon dioxide. Lanzatech has a proprietary process (CarbonSmart) that biologically converts COG to ethanol and this technology is currently being commercialized. Although the gases originate from fossil fuels, they reduce the demand for process energy generation on-site and have the potential for lower environmental impact. Based on the current landscape, PET fiber produced using

Fashion Industry Charter for Climate Action | Raw Materials Working Group | Fashion Industry Charter for Climate Action | Raw Materials Working Group
Fashion Industry Charter for Climate Action | Raw Materials Working Group | Fashion Industry Charter for Climate Action | Raw Materials Working Group
100

Fashion Industry Charter for Climate Action | Raw Materials Working Group | Fashion Industry Charter for Climate Action | Raw Materials Working Group
Fashion Industry Charter for Climate Action | Raw Materials Working Group | Fashion Industry Charter for Climate Action | Raw Materials Working Group
101
CarbonSmart technology has the potential to offset GHG reductions up to 30% in compared to virgin PET fiber production (based on existing LCA data reported in Figure 14).
Bio-based feedstock
Bio-MEG and bio-PTA are produced on a commercial scale by dehydrating bioethanol derived from fermentation of sugarcane, corn and other energy crops. According to IEA, the economic viability of bioethanol is based on availability of raw materials137. Currently, Brazil is the largest bioethanol producer with 50% of global bioethylene capacity. Bio-based MEG and bio-PTA are currently being produced in India and Japan respectively, and while the carbon footprint of bio-based PET is reported as 3.4 kg CO2e/kg material in Figure 14, it only presents a single data
137 IEA (2018); The Future of Petrochemicals; https://www.iea.org/reports/the-future-of-petrochemicals
point for one facility and lacks granularity. Lack of standardized accounting approach of biogenic carbon and carbon fluxes from land use change and management makes it challenging to compare results of bio-based PET with virgin and recycled PET.
PTT (polytrimethylene terephthalate), a bio-based polymer derived from corn is produced in China and USA and is used as a precursor for bio-based PET production. Due to lack of detail regarding the LCA modeling parameters and background data, it makes it challenging to draw definitive conclusions regarding the GHG performance of bio-based PET. There is a need to improve the data collection effort and harmonize GHG measurement practices for PET production in order to draw fair comparisons between the GHG profile of bio-based PET with virgin and recycled PET fibers.
2.3.3 Allocation Principles Relevant to PET Production
This section discusses the key allocation principles relevant to scope of PET filament production. Two types of allocation are discussed: 1) allocation of production processes with multiple inputs and outputs (Section 2.3.3.1), and 2) recycling allocation procedures for partitioning environmental impacts between multiple useful lives of PET material (Section 2.3.3.2).
2.3.3.1 Allocation approach for modeling
petrochemical feedstock
It is critical for LCA practitioners to apply a consistent allocation approach to create LCA data for steam cracker/catalytic reforming processes and ensure comparability of petrochemical datasets. Oil refineries are complex operations with many multioutput processes and products. The method of allocation for petrochemical products derived
from oil refineries can directly influence the GHG profile of downstream products. The proportion of resource and energy inputs and emission outputs attributed to petrochemical products can vary depending on the basis of allocation- physical relationships (mass-based, calorific heating value) or other relationships such as economic allocation.
In the context of polyester filament production, the precursors PTA and MEG are primarily synthesized from chemicals (p-xylene and ethylene) derived from naphtha and ethane respectively. Catalytic reforming and steam cracker processes at refineries are used to convert naphtha and ethane into different petrochemical products such as ethylene, xylene, propylene, benzene, hydrogen, butenes, etc. Table 25 shows the typical yields of a steam cracker process using naphtha and ethane as feedstocks. Ethylene is used in MEG production and pyrolysis gas (pygas) is further refined to produce p-xylene, which is used in PTA production.

Fashion Industry Charter for Climate Action | Raw Materials Working Group | Fashion Industry Charter for Climate Action | Raw Materials Working Group
Fashion Industry Charter for Climate Action | Raw Materials Working Group | Fashion Industry Charter for Climate Action | Raw Materials Working Group
102
Table 25. Typical yields of steam cracker products from naphtha and ethane feedstocks138.
Steam Cracker Products 1. Ethane (% yields) 2. Naphtha (% yields)
Ethylene 81 36
C4 frac (58%) 0 10
Propylene 5 15
Pygas (30% benzene) 0 18
Fuel oil 0 4
H2 rich gas (51%) 2 1
CH4 rich gas 12 16
Total 100 100
138 Adapted from WBCSD(2014); https://docs.wbcsd.org/2014/09/Chemical_Sector_Life_Cycle_Metrics_Guidance.pdf139 Plastics Europe (2018); https://www.plasticseurope.org/application/files/9615/4756/5366/PlasticsEurope_recommendation_on_Steam_
Cracker_allocation-_Juillet_2018.pdf140 Plastics Europe (2012); Eco-profiles and Environmental Product Declarations of the European Plastics Manufacturers141 NAPCOR (2020): Cradle to resin Life Cycle Analyis of Polyethylene Terephthalate Resin; https://napcor.com/wp-content/uploads/2020/05/Final-
Revised-Virgin-PET-Resin-LCA.pdf
The type and yield of main products and co-products can vary by refinery type, location and feedstock. When modeling multi-output processes at a refinery, there is a need to clearly distinguish the HVC products from the co-products generated. As shown in the table above, when steam cracker is fed with ethane, ethylene is the main product (81%) and the remaining fractions are considered to be co-products. In contrast, when naphtha is used as feedstock for steam cracking, it yields multiple main products such as ethylene, propylene, butenes in addition to fuel oil and hydrogen rich gases which are co-products.
The standard approach is to apply mass-based allocation approach universally, in which all the co-products share environmental burdens of the steam cracker. Plastics Europe139 LCA datasets use a selective mass-based allocation approach (“henceforth known as mass-based, HVC”), which allocates environmental burden for select high value chemicals from the steam cracker process and the remaining co-products do not carry any burden. For example, for steam cracker processes using naphtha as feedstock (refer to Table 25), energy and resources will be allocated to ethylene, propylene, 30 percent of benzene in the pygas and 58 percent of butadiene (C4) fraction, which are HVCs. Methane rich off-gas and hydrogen will not carry any burden as
these products are used internally to meet on-site energy demand. Using the mass-based HVC approach, pygas will be assigned 5.4% of steam cracker process impacts; in contrast to the standard mass-based allocation approach, which would allocate 18% of steam cracker process impacts to pygas.
Applying the standard mass-based allocation resulted in a 20 percent increase in the GHG intensity of pygas production, compared to mass-based HVC allocation approach140. The allocation factor used for pygas will impact the modeling of PTA precursor production.
A recent study141 on North American PET resin production used a different allocation approach in which co-products were treated as an avoided fuel product and were given credits based on the type of fuel displacement. The application of different allocation schemes makes it challenging to compare existing LCA datasets on PET.
2.3.3.2 Allocation approach
for modeling PET recycling
In the context of PET LCA, allocation refers to the process of partitioning environmental impacts between multiple useful lives of PET

Fashion Industry Charter for Climate Action | Raw Materials Working Group | Fashion Industry Charter for Climate Action | Raw Materials Working Group
Fashion Industry Charter for Climate Action | Raw Materials Working Group | Fashion Industry Charter for Climate Action | Raw Materials Working Group
103
material: virgin PET material production and subsequent recovery and recycling of PET for reuse. Mechanically recycled PET may technically only have two or three useful lives at the most due to degradation of physical properties. However, chemically recycled PET can be recycled multiple times, but the technology is still emerging and too nascent at the moment to determine the precise number of lives for PET material that is chemically recycled. The following approaches can be applied to the PET material production:
Cut-off (100-0) approach: This approach considers the environmental impacts of only one life cycle of the product (i.e., each product is assigned impacts directly caused by that product). In the cut-off approach, the environmental burden associated with PET waste material collection, recovery and reprocessing are assigned to the recycled material on the input side. This is the most widely applied method for evaluating recycled PET production impacts and majority of the recycled PET LCA data use this approach to quantify climate impacts. This method builds on a value judgment that encourages the reuse of recycled materials in product design, generating higher value for the recycled material, which can increase the recycling rates of PET waste.
Open loop allocation: In this method, the burdens for virgin PET production, recovery, and disposal are shared among the useful lives of the material, thereby reducing the burdens allocated to each use of the material. For example, bottle grade PET can have two useful lives: 1) Virgin PET material used for bottle or fiber production; and 2) Collection, recovery, mechanical recycling of post-consumer bottles/textiles into fiber. This approach assigns credits to both recyclers
142 Product Environmental Footprint Category Rules (PEFCR) Guidance version 6.3 (May 2018).143 Product Environmental Footprint Category Rules (PEFCR) Version 1.0 (February 2019).
and producers, encouraging recyclability of a product. However, the open loop recycling methodology makes assumptions about previous and subsequent life cycles, embedding a certain degree of uncertainty.
50/50 approximation: This is a type of open loop allocation approach which credits the user of recycled material, but the recycler only receives a partial credit due to the assumption that recycled feedstock is limited in supply. The environmental burdens and recycling benefits are divided in equal proportion (50/50). A 50/50 approximation is applied due to lack of precise data on market supply and demand. The market-based model is dynamic, and markets can shift rapidly, adding a certain degree of uncertainty to the results.
The latest EU PEF pilot guidance142 proposes the use of Circular Footprint Formula (CFF) which divides burdens and benefits of recycled materials from a supplier and user perspective. In the context of PET filament production, the PEF guidance developed for T-shirts143 provides default allocation factors for the textile sector.
In general, each recycling allocation approach incorporates certain value judgments that affect the quantification of environmental burdens between the lives of the material. Based on review of existing PET LCAs, mechanically recycled PET exhibits the lowest GHG profile, irrespective of the type of allocation approach applied. However, in case of chemically recycled PET, current data suggests that the difference in GHG impacts between virgin and chemically recycled PET is small (less than 10%) when cut-off approach is applied. This demonstrates the need for consistent allocation approaches for comparability of different PET sources.

Fashion Industry Charter for Climate Action | Raw Materials Working Group | Fashion Industry Charter for Climate Action | Raw Materials Working Group
Fashion Industry Charter for Climate Action | Raw Materials Working Group | Fashion Industry Charter for Climate Action | Raw Materials Working Group
104

Fashion Industry Charter for Climate Action | Raw Materials Working Group | Fashion Industry Charter for Climate Action | Raw Materials Working Group
Fashion Industry Charter for Climate Action | Raw Materials Working Group | Fashion Industry Charter for Climate Action | Raw Materials Working Group
105
03 Key Gaps
3.1 Inconsistencies/Factors influencing LCA modeling
3.2 Data gaps and limitations
3.1.1 All Fibers: Inconsistent time period of data collection
3.1.2 All Fibers: Credits applied for biogenic carbon stored in the product
3.1.3 All Fibers: Implication of choice of LCA software and use of different LCA databases
3.1.4 All Fibers: Use of different LCA methodology
3.1.5 COTTON: Modeling organic fertilizer (manure) production
3.1.6 COTTON: Use of inconsistent methodology to model field emissions
3.1.7 PET: Use of inconsistent allocation approach to model petrochemical products used in Virgin PET production
3.1.8 PET: Inconsistent allocation approach for modeling recycled PET

Fashion Industry Charter for Climate Action | Raw Materials Working Group | Fashion Industry Charter for Climate Action | Raw Materials Working Group
Fashion Industry Charter for Climate Action | Raw Materials Working Group | Fashion Industry Charter for Climate Action | Raw Materials Working Group
106
3.1 Inconsistencies/Factors influencing
LCA modeling
The mapping of current LCA landscape for cotton and polyester (PET) revealed key data gaps, inconsistent modeling approaches and lack of standardized methodology, which makes it inappropriate to compare the environmental performance of one fiber over the other. Overall, datasets lack geographic variability and transparency. In general, existing LCAs on cotton and polyester are not comparable due to the following overarching issues:
3.1.1 All Fibers: Inconsistent time period of data collection
144 Product Environmental Footprint Category Rules (PEFCR) Guidance version 6.3 (May 2018).145 ISO 14067:2018 Greenhouse gases — Carbon footprint of products — Requirements and guidelines for quantification
Existing LCAs are modeled with foreground data which is predominantly over 10 years old. LCAs only present a snapshot in time of a specific location and farm site. As conditions change from season to season, variations in
climate, soil, farming practices, etc., it may not be appropriate to extrapolate results calculated over a decade ago to inform current policies.
3.1.2 All Fibers: Credits applied for biogenic carbon
stored in the product
Some cotton LCAs assign 1540 kg CO2e/metric ton ginned cotton fiber credit based on the biogenic carbon content of cotton. The Product Environmental Footprint (PEF) guidance144 and ISO 14067145 standard states that biogenic carbon content of an intermediate product at factory gate shall be
reported separately and cannot be included in the net GHG emissions. Furthermore, ISO 14067 and PEF guidance specifies that for final products, credits can only be accounted when the carbon is stored beyond 100 years in a product.
Key Gaps

Fashion Industry Charter for Climate Action | Raw Materials Working Group | Fashion Industry Charter for Climate Action | Raw Materials Working Group
Fashion Industry Charter for Climate Action | Raw Materials Working Group | Fashion Industry Charter for Climate Action | Raw Materials Working Group
107
3.1.3 All Fibers: Implication of choice of LCA software
and use of different LCA databases
146 Sandin, G., Roos, S., & Johansson, M. (2019). Environmental impact of textile fibers–what we know and what we don’t know: Fiber Bible part 2.
The background LCA databases and selection of LCA software can influence the overall LCA results. It is important to review the LCA software and background data sources and databases used to model LCAs when interpreting data. For example, in case of cotton, Sandra Roos et. al146, modeled the Cotton Inc 2012 inventory data using both ecoinvent and GaBi LCA databases and calculated the LCA results in SimaPro and Gabi LCA software to test the differences in databases and LCA software.
The study concluded that though all the data sources were modeled based on the same original source (the study underlying the Cotton Inc 2012 LCA report) and the same life cycle impact assessment method was used for calculation, the climate impact results are very different, ranging from 1.4 kgCO2e/kg ginned fiber to 3.4 kgCO2e/kg ginned fiber (see results presented by source):
• Cotton Inc 2012 LCA: 1.8 kg CO2e/kg ginned cotton fiber
• Ecoinvent v3.3 dataset on conventional cotton processed in GaBi software: 3.4 kgCO2e/kg ginned fiber
• Ecoinvent v3.4 dataset on conventional cotton processed in SimaPro software: 2.4 kgCO2e/kg ginned fiber
• Gabi dataset processed in GaBi software: 1.4 kgCO2e/kg ginned fiber
It is evident that choice of LCA databases to model the background processes and LCA software induces a significant degree of variability in LCA results. LCA results can also vary when different versions of the same LCA database are used. For example, the electricity datasets in ecoinvent LCA database (version 2) were updated to version 3.0, with the update having a significant influence on the LCIA results of almost all products.
3.1.4 All Fibers: Use of different LCA methodology
LCAs apply different climate impact assessment methods including IPCC 2007 GWP 100, IPCC 2013 GWP 100, GWP-20, CML, Recipe, and ILCD, which may make them incomparable due to differences in the characterization factors. For example, the current Global Warming Potential (GWP) of nitrous oxide (N2O) is 265 (based on the latest IPCC 2013 GWP-100 method) but majority of the existing LCA studies used values of
either 310 (IPCC 2007) or 298 (older CML method). Nitrous oxide emissions is the single biggest contributor to GHG impacts from field emissions from cotton farming, so using different LCA methods can have a relevant influence on the climate impacts of cotton. Similarly, the GWP of methane has increased from 21 kgCO2e (IPCC 1995), to 25 (IPCC 2007) and 28-34 (IPCC 2013).

Fashion Industry Charter for Climate Action | Raw Materials Working Group | Fashion Industry Charter for Climate Action | Raw Materials Working Group
Fashion Industry Charter for Climate Action | Raw Materials Working Group | Fashion Industry Charter for Climate Action | Raw Materials Working Group
108
3.1.5 COTTON: Modeling organic fertilizer (manure) production
147 Product Environmental Footprint Category Rules (PEFCR) Guidance version 6.3 (May 2018).148 Textile Exchange (2014); Life Cycle Assessment of Organic Cotton.149 Grace, P., Shcherbak, I., Macdonald, B., Scheer, C., & Rowlings, D. (2016). Emission factors for estimating fertiliser-induced nitrous oxide
emissions from clay soils in Australia’s irrigated cotton industry. Soil Research, 54(5), 598-603.
Most organic cotton LCAs assume that manure is a waste product and does not carry any burden (this is observed in Figure 2.2.1.2). If manure enters the product system burden free (i.e., waste product), then organic farming systems seem favorable compared to conventional. But if manure has market value at the farm gate, then it should be treated as a co-product from livestock management. If impacts are attributed to the manure, then the impacts of organic farming are much higher and could be on par or more than that of conventional farming system. As
seen in Figure 2.2.1.2, organic cotton grown in Tajikistan with purchased compost was shown to contribute to nearly half of the climate impacts of Tajik organic cotton when the impacts of compost production are taken into account.
PEF provides guidance for manure exported to other farms and it is recommended to align with the PEF approach (refer to Section 5.11.2 of PEF147) and assign upstream burdens to manure if it has market value.
3.1.6 COTTON: Use of inconsistent methodology
to model field emissions
Majority of existing LCA studies assume that on an average, about 1% of the nitrogen applied to cropland is directly emitted as nitrous oxide, based on default IPCC Tier 1 emission factor recommended in 2006, and do not account for differences in crop management practices, climate and soil conditions. IPCC 2006 guidance reports that N2O emission factors vary from 0.3%-3% and a default of 1% of N is applied across most regions. For example, Textile Exchange LCA on organic cotton148 assessed the influence of N2O emission factors on climate and found that field emissions increased by 59%. When an emission factor of 3%, compared
to 1% was applied, field emissions reduced by 21% when a best case emission factor of 0.3% of N was applied in the LCA model. Recent evidence suggests that this factor is too high for crop that are optimally fertilized and too low for crops excessively fertilized. For example, published research for the N2O emission factor under Australian conditions indicates that the base emission rate is 0.55% of N149. It is necessary to refine the nitrous oxide emission factors and incorporate site specificity to accurately model climate impacts of cotton farming. Section 4.1.1.1 provides some recommendations on modelling field emissions.

Fashion Industry Charter for Climate Action | Raw Materials Working Group | Fashion Industry Charter for Climate Action | Raw Materials Working Group
Fashion Industry Charter for Climate Action | Raw Materials Working Group | Fashion Industry Charter for Climate Action | Raw Materials Working Group
109
3.1.7 PET: Use of inconsistent allocation approach to model petrochemical products used in Virgin PET production
Current LCA datasets on virgin PET production are not comparable due to application of different allocation principles for modeling the petrochemical based precursor chemicals in the upstream of the PET value chain. For example, Plastics Europe uses a mass-based HVC allocation approach for the main steam cracker/catalytic reforming products (xylene and ethylene in the context of PET) and does not assign any environmental burden to the co-products. In contrast, the North American PET production dataset assigns a credit for the co-products generated from the steam cracker/catalytic reformate.
As described in detail in Section 2.3.3.1, allocation of petrochemical products derived from oil refineries can directly influence the GHG profile of PET and other downstream products. As precursor chemical production is the single largest GHG contributor to PET production, it is critical for data providers and LCA practitioners to apply a consistent allocation method to ensure comparability of environmental profile of fibers.
3.1.8 PET: Inconsistent allocation approach
for modeling recycled PET
As discussed in Section 2.3.3.2, there are different allocation modeling approaches (e.g., 100-0, 50/50, open loop recycling and Circular Footprint Formula) for dividing environmental burdens and benefits of recycled materials from a supplier and user perspective. Existing LCAs on PET are modeled using different allocation approaches, which makes it challenging to compare the GHG profile of different types of PET filaments. Mechanically
recycled PET exhibits the lowest GHG profile, irrespective of the type of allocation approach applied. However, in the case of chemically recycled PET, the difference in magnitude between virgin PET and chemically recycled PET is smaller, and it is necessary to harmonize the allocation approach in order to compare the environmental performance of PET filaments.

Fashion Industry Charter for Climate Action | Raw Materials Working Group | Fashion Industry Charter for Climate Action | Raw Materials Working Group
Fashion Industry Charter for Climate Action | Raw Materials Working Group | Fashion Industry Charter for Climate Action | Raw Materials Working Group
110
3.2 Data gaps and limitations
Overall, there is a lack of standardized accounting methodology for modeling which makes it inappropriate to compare LCA studies, including biogenic carbon from land use change and management, changes in soil organic carbon, and allocation approaches for multi-output processes. There is a need for more transparency in documentation of background data sources, assumptions and modeling parameters, and scope of system boundaries while disclosing LCA data to enable users to understand the nuances of impacts associated with fiber production.
The following are specific limitations for comparability of LCA results, by fiber type:
• Cotton: Conditions will vary from year to year, region to region, and farm to farm, these variances within farming systems (soil types, pest outbreaks, weather conditions, farm practices, etc.) can be obscured when LCAs are presented as a global average even if volume-based weightings are applied. Small sample sizes are fraught with risk as to their representativeness.
• Cotton: Data should always be taken as an average across 3-5 years to account for the variances in climatic conditions, water availability and various farm inputs.
• Cotton: Economic allocation in the ginning process: Ginning energy and resources are allocated on an economic basis including 84% for lint and 16% to cotton seed. However, the data used to estimate factors is at least 5-10 years old and market demands can fluctuate over an annual basis, so the allocation factors used for cotton lint production need to be updated.
• Cotton: Poor data quality for ginning in existing LCAs: Most LCAs use secondary data for modeling ginning and apply a generic energy figure across different regions. It is not appropriate to apply a global figure for gin turn-out, which varies between 35%-42%.
• Cotton: Existing LCAs do not capture the differences between the various cultivar species used (e.g., fiber quality, GM varieties, non-GM varieties, etc.), other than yield.
• Cotton: Experimenting with different regenerative agriculture practices for growing cotton in different settings while measuring soil health over time (SOC, N/C, TN, compaction) is essential to collect data to determine how to grow the lowest carbon cotton fiber possible by sequestering carbon in the soil where the cotton grows.
• Cotton: Studies exclude soil carbon balances: Rate of soil carbon accumulation is influenced by changes in land management150 activities, or land use change activities, and can play a significant role in the environmental profile of cotton and bio-based polyester. Existing LCAs do not capture the benefits of crop rotation, reduced till or no-till practices. To capture benefits of crop rotations, there is a need to collect data over multiple seasons and to measure SOC.
• PET datasets are aggregated so lack transparency: Majority of the reported LCA data are aggregated from cradle-to-finished product gate (e.g., chip/fiber/filament) and lack transparency on a process level, which makes it difficult to identify the key GHG drivers for the product. For example, it was not possible to identify the contribution of key processes such as polymerization, feedstock production, and depolymerization.
• PET: Current PET LCAs are not comparable due to differences in the functional unit and system boundaries used to model PET. PET LCAs are available for PET chips/pellets/
150 Land management changes are changes in crop management practices which do not involve a permanent change in land cover

Fashion Industry Charter for Climate Action | Raw Materials Working Group | Fashion Industry Charter for Climate Action | Raw Materials Working Group
Fashion Industry Charter for Climate Action | Raw Materials Working Group | Fashion Industry Charter for Climate Action | Raw Materials Working Group
111
flakes, PET staple fibers and PET filament yarns varying by grade such as partially oriented yarn (POY), fully drawn yarn (FDY) or drawn textured yarn (DTY) but the LCA results are aggregated and not reported by life cycle stage. Inconsistencies in system boundaries make it challenging to determine GHG performance of different types of PET.
• PET datasets lack geographic variability and are modeled with outdated background datasets: Some of the background datasets used for modeling PET LCAs are outdated and do not represent the current crude oil mix. While the oil refinery operations are not likely to change significantly, the market share of crude oil imported by countries has changed significantly over the past decade and as the environmental profile of crude oil extraction varies by location (GHG impacts of crude oil extraction and refinery can vary by a factor of seven depending on the location), it could have a significant influence on impact of PET production. For example, Plastics Europe’s Eco-profile of PET is the most widely used, publicly available LCA dataset for virgin PET production and is also integrated into commercial LCA databases such as GaBi and ecoinvent. The background data used to model feedstock production data is based on crude oil and natural gas derived from countries listed in Table 22 for the year 2009; with a maximum temporal validity of 5 years (until 2014). The mix of crude oil import modeled in Plastics Europe, is not representative of the current scenario in Europe. Background data from Europe is often used to represent Asian PET production, which is not truly reflective of the crude oil mix of refineries operating in Asia.
• Bio-based PET: Current LCAs exclude soil organic carbon changes and biogenic carbon fluxes from land use change and management associated with feedstock farming.

Fashion Industry Charter for Climate Action | Raw Materials Working Group | Fashion Industry Charter for Climate Action | Raw Materials Working Group
Fashion Industry Charter for Climate Action | Raw Materials Working Group | Fashion Industry Charter for Climate Action | Raw Materials Working Group
112

Fashion Industry Charter for Climate Action | Raw Materials Working Group | Fashion Industry Charter for Climate Action | Raw Materials Working Group
Fashion Industry Charter for Climate Action | Raw Materials Working Group | Fashion Industry Charter for Climate Action | Raw Materials Working Group
113
04 Recommendations Based on Current Knowledge
4.1 LCA Modeling4.1.1 Incorporating geographic variability in LCA modeling
4.1.2 Inclusion of Short-Lived Climate Pollutants in Climate Impact Assessment
4.1.3 Reporting of product biogenic carbon content for cradle-to-gate studies
4.2.1 Improving yields in India & Africa
4.2.2 Precision Farming
4.2.3 Soil health is the key
4.2.4 Training Farmers
4.3.1 Accelerate scale of recycling technology providers
4.3.2 Improve recycling infrastructure
4.3.3 Invest in automated sorting technologies
4.3.4 Invest in alternative feedstocks for PET production
4.3.5 Scaling of Carbon Capture, Utilization and Storage (CCUS) technologies to mitigate GHG emissions from petrochemical production
4.2 COTTON
4.3 POLYESTER

Fashion Industry Charter for Climate Action | Raw Materials Working Group | Fashion Industry Charter for Climate Action | Raw Materials Working Group
Fashion Industry Charter for Climate Action | Raw Materials Working Group | Fashion Industry Charter for Climate Action | Raw Materials Working Group
114
The diversity and variability in conditions to produce cotton and polyester makes it difficult to provide a uniform, fixed set of universal recommendations to source low carbon fibers. There is no one-size fits all approach and the purpose of this report is to serve as an important starting point for harmonizing LCA data collection and improve climate modeling to better inform low carbon sourcing decisions. Due to inconsistencies in LCA modelling and comparability issues associated with existing LCA studies on cotton and polyester, based on consultation with experts, it was determined that it would be inappropriate to provide quantitative GHG emission data for each fiber type on a regional level. The recommendations provided in this report are only based on current knowledge of the LCA landscape of cotton and polyester fibers and is intended to serve as a foundational piece of work for the textile and apparel sector stakeholders to work towards harmonizing climate accounting and policy through improved data collection, consistent methodology, and reporting metrics. Section 4.1 provides an overview of recommendations for improving climate accounting. Section 4.2 and Section 4.3 discusses the low carbon sources and actions that could be undertaken to reduce GHG emissions for cotton and PET fibers respectively.
4.1 LCA Modeling
The following sections are intended to provide stakeholders with recommendations for improving climate accounting of fibers.
4.1.1 Incorporating geographic variability in LCA modeling
The current landscape of cotton LCA data lacks coverage and geographical representativeness, in which the global cultivation of cotton is modeled using few data points from USA, China, Australia and India. For example, Sustainable Apparel Coalition (SAC)’s Higg MSI dataset on cotton represents a global average of cotton production based on country level LCA data. Sections 2.2.2.1 through 2.2.4 provides the regional differences in farming inputs for each cotton type and a significant variation
in practices is observed across the top cotton growing countries. It is important to account for the spatial differences in existing farming systems and agricultural practices and consider the influence of site-specific characteristics including climate, soil type, water availability, etc. on the climate impacts. The section below, provides a brief summary of a potential approach to improve LCA modeling of field emissions.
Recommendations Based on Current Knowledge

Fashion Industry Charter for Climate Action | Raw Materials Working Group | Fashion Industry Charter for Climate Action | Raw Materials Working Group
Fashion Industry Charter for Climate Action | Raw Materials Working Group | Fashion Industry Charter for Climate Action | Raw Materials Working Group
115
4.1.1.1 Modeling field emissions
The modeling of field emissions including nitrous oxide from fertilizer application and loss or gain of soil carbon from crop management practices has a great influence on the climate impacts. Thus, it is essential to accurately model cotton cultivation and refine existing approaches in LCA by accounting for regional variations while applying emission factors. Table 26 presents an overview of three methods available to improve current methods of assessing field emissions based on the level of data available for LCA modeling:
• IPCC 2019 Guidance: This is a supplemental guidance published to refine the default emission factors provided in 2006. Emission factors are disaggregated by climate type and fertilizer type.
• Region specific: Albanito et.al (2017)151 provides regional emission factors using IPCC Tier 2 methodology for tropical and sub-tropical countries.
• DNDC model152: This model
151 Albanito et al (2017), Direct nitrous oxide emissions from tropical and sub-tropical agricultural systems.152 The DNDC Model. University of New Hampshire; https://www.dndc.sr.unh.edu//153 IPCC 2019 Refinement to 2006 IPCC Guidelines. Volume 4: Agriculture, Forest, Other Land Use > Chapter 11: N2O Emissions from Managed Soils,
and CO2 Emissions from Lime and Urea application154 Albanito et al (2017), Direct nitrous oxide emissions from tropical and sub-tropical agricultural systems.155 IPCC groups climates by distinguishing dry climates from wet climates. Wet climates occur in temperate and boreal zones where the ratio of
annual precipitation: potential evapotranspiration>1, and tropical zones where annual precipitation>1000mm. Dry climates occur in temperate and boreal zones where the ratio of annual precipitation: potential evapotranspiration<1, and tropical zones where annual precipitation <1000mm.
simulates soil carbon and nitrogen biogeochemistry on a regional as well as site-specific level and provides the amount of CO2, methane and nitrous oxide emissions from the soil. The DNDC model is recommended because it can be applied globally and is linked to the soil properties, climate and precipitation. A key strength of this model is the ability to simulate soil carbon changes at different depths (0-10cm, 10-20cm, 20-30cm, 30-40cm and 40-50cm). While this model requires more data than the first two methods, based on review of current models, this is best suited to measure the benefits of various crop management practices and can be potentially used to model regenerative organic farming practices.
The suggested methods should be applied in the following order of preference:
3.DNDC model (dynamic site-specific model)>2. Region specific (Albanito 2017)>1. IPCC 2019 Tier 1 emissions
Table 26. Overview of methods to evaluate field emissions from fertilizer application and improve on existing methods used in LCA.
Parameter Default IPCC 2019 Guidance153Region specific: Albanito et.al (2017)154
Site-specific: Denitrification-Decomposition (DNDC) model
Spatial scale Global: Climate specific (Tier 1
emission factors for dry versus
wet climate)
Regional and country level
emission factors (Tier 2
emission factors)
Site-specific (Tier 3 emissions
factors)
Data required Climate type (wet and dry)155,
precipitation and fertilizer type
Region or country of
production
Site-level data on climate,
precipitation, soil (bulk density,
pH initial soil organic carbon
stock, soil texture), crop
management activities (tillage,
fertilizer input, irrigation, cover
crops, etc.)

Fashion Industry Charter for Climate Action | Raw Materials Working Group | Fashion Industry Charter for Climate Action | Raw Materials Working Group
Fashion Industry Charter for Climate Action | Raw Materials Working Group | Fashion Industry Charter for Climate Action | Raw Materials Working Group
116
Parameter Default IPCC 2019 Guidance153Region specific: Albanito et.al (2017)154
Site-specific: Denitrification-Decomposition (DNDC) model
Direct nitrous oxide (N2O)
Emissions
(kg N2O-N/kg N)
Synthetic fertilizer in wet
climate=1.6% of N
Other N-inputs in wet
climates=0.6% of N
All N-inputs in dry
climate=0.5% of N
Cattle, pig and poultry manure
in wet climate=0.6% of N
Cattle, pig and poultry manure
in dry climate=0.2% of N
Sheep manure=0.4% of N
Regional Emission Factors
Africa: 1.4% of N
Australia156:0.55% of N
Central & South America:
1.3% of N
India: 1% of N
China: 0.7% of N
Asia: 1.1% of N
Run DNDC model online:
<https://www.dndc.sr.unh.edu/
model/onlinehelp.html>
Indirect nitrous oxide (N2O)
Emissions: N volatilization and
redeposition
[kg N2O-N/(kg NH3-N+NOx-N
volatilized)]
N volatilization and
redeposition in wet
climate=1.4%
N volatilization and
redeposition in dry
climate=0.5%
No data provided Same as IPCC Tier 1 method
Indirect nitrous oxide (N2O)
Emissions: N leaching and
run-off
[kg N2O–N /(kg N leaching/
runoff)]
N leaching and run-off=0.11% No data provided Same as IPCC Tier 1 method
Carbon dioxide (CO2) emissions
from urea fertilizer application
(kg CO2-C/kg urea)
0.2 No data provided Same as IPCC Tier 1 method
Carbon dioxide (CO2) emissions
from liming
(kg CO2-C/kg lime)
0.12 No data provided IPCC Tier 2 method is used to
estimate CO2 emissions and US
specific emission factors are
provided
156 Grace, P., Shcherbak, I., Macdonald, B., Scheer, C., & Rowlings, D. (2016). Emission factors for estimating fertiliser-induced nitrous oxide emissions from clay soils in Australia’s irrigated cotton industry. Soil Research, 54(5), 598-603.
157 Baldock and Nelson, 2000158 A Global Meta-Analysis of Grazing Impacts on Soil Health Indicators. Byrnes et al, 2018.
Soil organic carbon
Soil organic matter is difficult to measure directly. While some studies measure the soil organic carbon level and then multiply it with conversion factors157, some others assess multiple indicators simultaneously158:
• Soil Organic Carbon,• Total Nitrogen, • Carbon/Nitrogen Ratio.
These chemical measurements can be associated with physical assessments (depth of soil layer, color, compaction, texture) and

Fashion Industry Charter for Climate Action | Raw Materials Working Group | Fashion Industry Charter for Climate Action | Raw Materials Working Group
Fashion Industry Charter for Climate Action | Raw Materials Working Group | Fashion Industry Charter for Climate Action | Raw Materials Working Group
117
biological assessments (species diversity, bacteria/fungi ratio, worm density…) to further the assessment of the soil. Only by measuring the soil organic matter through these indicators over time can a system demonstrate its ability to sequester carbon in its soil. The time horizon of the assessment should be at least 20 years for large-scale assessment and 10 years for small scale site-specific assessment with soil C observations. The timeline should be extended if soil C dynamics and climate conditions suggest that a longer period is necessary to reach soil C equilibrium.159
159 Goglio, P., Smith, W. N., Grant, B. B., Desjardins, R. L., McConkey, B. G., Campbell, C. A., & Nemecek, T. (2015). Accounting for soil carbon changes in agricultural life cycle assessment (LCA): a review. Journal of Cleaner Production, 104, 23-39.
160 https://ghgprotocol.org/sites/default/files/GHG%20Protocol%20-%20Carbon%20Removals%20and%20Land%20Sector%20Initiative%20-%20Overview.pdf
The IPCC methodology differentiates between climate, soil characteristics, and crop management but only coarsely assesses their effects on soil C dynamics. The DNDC model is a viable approach to assess soil carbon dynamics. Soil carbon dynamics should be assessed based on data availability and the calculation approach should be selected based on the order of preference:
Measurements> DNDC model (dynamic site-specific model)>IPCC Tier II method>IPCC Tier 1 emissions
Table 27. Overview of methods to evaluate soil organic carbons stocks emissions and improve on existing methods used in LCA.
Parameter Default IPCC 2019 Guidance Site-specific: Denitrification-Decomposition (DNDC) model
Spatial scale Global: Climate specific (Tier 1
emission factors for dry versus
wet climate)
Site-specific (Tier 3 emissions factors)
Data required Climate type and precipitation Site-level data on climate, precipitation, soil (bulk density,
pH initial soil organic carbon stock, soil texture), crop
management activities (tillage, irrigation, cover crops, etc.)
Soil organic carbon stocks for
organic soils
Differentiates between climate,
soil characteristics, and crop
management
Estimated using IPCC Tier 2 method and region-specific
emission factors from Ogle et. al
Soil organic carbon stocks for
mineral soils
Differentiates between climate,
soil characteristics, and crop
management
IPCC Tier 3 method is used to estimate the soil organic
carbon at the beginning and end of the year with DAYCENT
process-based model
The Greenhouse Gas (GHG) Protocol is currently developing new standards and
guidance for accounting for carbon emissions and removals in GHG inventories160.
4.1.2 Inclusion of Short-Lived Climate Pollutants
in Climate Impact Assessment
Current LCAs use a 100-year time horizon to report climate impacts and account for long-lived greenhouse gases (GHGs) such
as carbon dioxide, nitrous oxide, PFCs and short-lived GHGs such as methane, and HFCs but do not account for short-lived climate

Fashion Industry Charter for Climate Action | Raw Materials Working Group | Fashion Industry Charter for Climate Action | Raw Materials Working Group
Fashion Industry Charter for Climate Action | Raw Materials Working Group | Fashion Industry Charter for Climate Action | Raw Materials Working Group
118
pollutants like black carbon. This section summarizes the need to integrate short-lived climate pollutants into climate accounting to enable a comprehensive and more accurate assessment of global warming impacts based on the latest climate science.
Short-lived climate pollutants (SLCPs) include methane, black carbon, hydrofluorocarbons (HFCs), and tropospheric ozone and contribute to about 45% of current global warming161. These pollutants remain in the atmosphere for a relatively short timeframe, with the duration depending on the pollutant (a few days to about a decade), but they can be significantly more potent than carbon dioxide, which can stay in the atmosphere and contribute to further warming for hundreds of years. For example, over a 20-year period, black carbon is estimated to be nearly 4,000 times162 more potent compared to carbon dioxide (CO2) and methane is estimated to be 84 times more potent compared to CO2
163.
According to the latest IPCC report on Climate Change and Land164, short-lived climate pollutants (SLCPs) such as ozone and black carbon play an important role as they affect agricultural production through damage to cellular metabolism that can affect a crop’s photosynthesizing ability. Crops such as cotton are found to be sensitive to higher ozone concentrations.
Although CO2 dominates long-term warming, the reduction of warming from short-lived climate pollutants, such as methane and black carbon is essential to limiting warming to 1.5°C above pre-industrial levels and for achieving the goals of the Paris Agreement
161 Zaelke, D., & Borgford-Parnell, N. (2013). Primer on short-lived climate pollutants. IGSD.162 Environmental and Energy Study Institute (2013); https://www.eesi.org/files/FactSheet_SLCP_020113.pdf163 US EPA; https://www.epa.gov/ghgemissions/understanding-global-warming-potentials164 IPCC, 2019: Climate Change and Land: an IPCC special report on climate change, desertification, land degradation, sustainable land management,
food security, and greenhouse gas fluxes in terrestrial ecosystems [P.R. Shukla, J. Skea, E. Calvo Buendia, V. Masson-Delmotte, H.-O. Pörtner, D. C. Roberts, P. Zhai, R. Slade, S. Connors, R. van Diemen, M. Ferrat, E. Haughey, S. Luz, S. Neogi, M. Pathak, J. Petzold, J. Portugal Pereira, P. Vyas, E. Huntley, K. Kissick, M. Belkacemi, J. Malley, (eds.)]
165 Ross, K., Damassa, T., Northrop, E., Waskow, D., Light, A., Fransen, T., & Tankou, A. (2018). Strengthening Nationally Determined Contributions to Catalyze Actions That Reduce Short-Lived Climate Pollutants.
166 IPCC, 2018: Summary for Policymakers. In: Global Warming of 1.5°C. An IPCC Special Report on the impacts of global warming of 1.5°C above pre-industrial levels and related global greenhouse gas emission pathways, in the context of strengthening the global response to the threat of climate change, sustainable development, and efforts to eradicate poverty [Masson-Delmotte, V., P. Zhai, H.-O. Pörtner, D. Roberts, J. Skea, P.R. Shukla, A. Pirani, W. Moufouma-Okia, C. Péan, R. Pidcock, S. Connors, J.B.R. Matthews, Y. Chen, X. Zhou, M.I. Gomis, E. Lonnoy, T. Maycock, M. Tignor, and T. Waterfield (eds.)]. World Meteorological Organization, Geneva, Switzerland, 32 pp.
167 Shindell, D., N. Borgford-Parnell, M. Brauer, A. Haines, J.C. Kuylenstierna, S.A. Leonard, V. Ramanathan, A. Ravishankara, M. Amann, and L. Srivastava. 2017. “A Climate Policy Pathway for Near- and Long-Term Benefits.” Science 356 (6337): 493-94. https://doi.org/10.1126/science.aak9521.
168 Ramanathan, V., et al., (2008), Atmospheric Brown Clouds: Regional Assessment Report with Focus on Asia. Published by the United Nations Environment Programme, Nairobi, Kenya.
169 EMEP-EEA Guidebook (2019); https://www.eea.europa.eu/publications/emep-eea-guidebook-2019/#additional-files
and the Sustainable Development Goals165.
The IPCC report166 emphasizes the need to reduce black carbon emissions by 35% or more by 2050 and it is estimated that without significant reductions in SLCPs, global temperature increases are likely to exceed 1.5°C during the 2030s and exceed 2°C by mid-century167.
Since SLCPs have an atmospheric residence time of a few weeks or less, they are not evenly distributed in the global atmosphere and concentrations vary regionally, depending on the local degree of emission and ambient atmospheric conditions. The same mass of SLCPs emitted from different locations can have markedly different climate effects. The United Nations Environment Programme (UNEP)168 has identified five regional hotspots which contain plumes of black carbon, sulfates, carbon monoxide, nitrogen oxides, and other gases:
• East Asia• Indo-Gangetic Plain in South Asia• Southeast Asia• Southern Africa• Amazon Basin
Black carbon emissions are estimated to be the third largest contributor to current climate warming, after CO2 and methane. Key sources of black carbon include:
• Stationary combustion of fuels for energy generation: The EMEP/EEA Guidebook169 provides emission factors for black carbon for different sources. For example, 2.6%-28% of particulate

Fashion Industry Charter for Climate Action | Raw Materials Working Group | Fashion Industry Charter for Climate Action | Raw Materials Working Group
Fashion Industry Charter for Climate Action | Raw Materials Working Group | Fashion Industry Charter for Climate Action | Raw Materials Working Group
119
matter (PM) from industrial boilers are estimated to be released as black carbon according to EMEP/EEA guidelines.
• Open burning of crop residues: Some cotton farming regions in Africa and North India burn crop residues, which results in release of black carbon emissions
• On and off-road transportation: The Global Logistics Emissions Council (GLEC) framework170 has developed a framework to estimate black carbon emissions for different modes of transport.
Current LCA methodologies amortize the heating from greenhouse gases over a 100-year period. The choice of time horizon markedly affects the global warming potential (GWP) weighting of SLCPs. Although the United Nations Framework Convention on Climate Change (UNFCCC) adopts the 100-year GWP metric, given the required timeframe of mitigation (before 2030, according to UNEP), and the timeframe of mitigation policies agreed to by Paris Agreement signatories, LCAs should considering reporting climate impacts over a 20-year timeframe, in addition to a 100-year
170 Smart Freight Centre. Black Carbon Methodology for the Logistics Sector. Global Green Freight Project, 2017. 171 Verones, F., Henderson, A. D., Laurent, A., Ridoutt, B., Ugaya, C., & Hellweg, S. (2016). LCIA framework and modelling guidance [TF 1 Crosscutting
issues]. In Global guidance for life cycle impact assessment indicators (Vol. 1, pp. 40-57). UNEP
time horizon. The GWP time horizon affects the timing and emphasis placed on mitigating short- and long-lived climate pollutants.
The Global Guidance for Life Cycle Impact Assessment Indicators (Volume 1) published by UNEP/SETAC Life Cycle Initiative in 2016171, recommends the adoption of two complementary impact categories for climate change: 1) accounting for long-lived GHGs (traditional metrics currently used in LCAs) and 2) accounting for short-lived climate pollutants based on the latest IPCC AR5 metrics. This guidance provides characterization factors required for modeling short-lived climate pollutants in LCAs, based on the latest available climate science published by IPCC. The adoption of two complementary viewpoints, one focused on the shorter timeframe of global warming (over next few decades) and the other on long-term temperature rise (over the next century), will improve the capacity of LCA to help stakeholders make informed decisions and is a potential step towards bridging the gap between LCIA methods and latest climate science.
4.1.3 Reporting of product biogenic carbon content
for cradle-to-gate studies
Many LCAs assign a credit for storage of biogenic carbon in the product, based on stoichiometric evaluations or measurements of the biogenic carbon content in a product, and aggregate the biogenic carbon content with climate change results for a cradle-to-fiber gate scope. The datasets lack transparency on a process level and it makes it difficult to determine the value of credits assigned for temporary or permanence of carbon storage in the product. Accurate and transparent accounting of biogenic
carbon embedded in products is essential while conducting LCAs. Currently, there are many standards (ISO 14067, PAS 2050, EU PEF, GHG Protocol) available for developing product carbon footprint assessments and as shown in the table below, there are some discrepancies between these standards in terms of reporting requirements for biogenic carbon storage in products. The table below summarizes the reporting requirements for biogenic carbon stored in the product for a cradle-to-gate scope.

Fashion Industry Charter for Climate Action | Raw Materials Working Group | Fashion Industry Charter for Climate Action | Raw Materials Working Group
Fashion Industry Charter for Climate Action | Raw Materials Working Group | Fashion Industry Charter for Climate Action | Raw Materials Working Group

Fashion Industry Charter for Climate Action | Raw Materials Working Group | Fashion Industry Charter for Climate Action | Raw Materials Working Group
Fashion Industry Charter for Climate Action | Raw Materials Working Group | Fashion Industry Charter for Climate Action | Raw Materials Working Group
121
Table 28. Comparison of product biogenic carbon storage reporting requirements of three common product carbon footprint standards/guidance documents for cradle-to-gate scope.
Parameter ISO 14067: 2018172 EU PEFv6.3173 PAS 2050174
Biogenic carbon storage in
product
To be reported as additional
information only
To be reported separately
as additional information if
product carbon storage>100
years
Mandatory to include carbon
storage in the net GHG
calculations when product
carbon storage >100 years
172 ISO 14067, Greenhouse gases — Carbon footprint of products — Requirements and guidelines for quantification. International Organization for Standardization, August 2018
173 Product Environmental Footprint Category Rules (PEFCR) Guidance version 6.3 (May 2018).174 PAS 2050:2011. Specification for the assessment of the life cycle greenhouse gas emissions of goods and services. BSI 2011
While the ISO 14067 and EU PEF standards do not allow the inclusion of temporary or permanent carbon storage in the main cradle-to-gate GHG profile of the fibers, the PAS 2050 standard allows for reporting net GHG results if the product carbon storage is longer than 100 years. There is a need to build consensus and align the reporting requirements for
biogenic carbon storage in products and ensure consistent application of the approach across all products and sectors to enable a relevant comparison. In line with ISO 14067 and EU PEF, for a cradle-to-fiber gate scope, it is recommended to report the biogenic carbon content of a product at the factory gate separately, as additional information.
4.2 COTTON
The qualitative matrix in Table 4 provides a better understanding of the influence of different farming practices on the climate, by region and by cotton type. There can be significant variability between individual farm management practices and even similar farming systems can have notable variations within a region, due to inherent variation and exogenous influences such as soil type, precipitation patterns and farming activities. The following conclusions can be drawn from Table 4:
• Mechanically recycled cotton is the most favorable low carbon source. • Cotton grown using low carbon farming practices identified below can be a favorable
option in additional to mechanically recycled cotton:
– Optimum soil conditions (medium or heavy textured soils with 7-8 pH) – High density planting system – Rainfed areas with supplemental irrigation run on solar power – Incorporation of crop residues on the field, no-till, crop rotation, intercropping or cover
cropping (based on water availability) – Optimal dosing of organic fertilizers generated by owned cattle – Traditional harvest – Roller ginning with automatic feeder run on renewable energy
• Organic agriculture tends to be seen positively in terms of soil health and carbon soil sequestration, but in absence of soil indicator test results over a prolonged period, there is uncertainty so one cannot assume that organic agriculture equates to carbon

Fashion Industry Charter for Climate Action | Raw Materials Working Group | Fashion Industry Charter for Climate Action | Raw Materials Working Group
Fashion Industry Charter for Climate Action | Raw Materials Working Group | Fashion Industry Charter for Climate Action | Raw Materials Working Group
122
sequestration. However, organic cotton can appear more favorable compared to BCI, CmiA and conventional cotton and may be potentially lower in greenhouse gas emissions under the following conditions:
– Regions with high cotton yields (above average yields or on par with conventional cotton yields), and
– Traditional harvest practices under rainfed conditions (requires low energy input), and – Use of farmyard manure as fertilizer from owned cattle.
• Regenerative cotton: long term monitoring and measurements are necessary to definitively determine the effects of regenerative farming practices on soil. While experiments and data for regenerative cotton are limited (especially geographically), regenerative agriculture has tremendous potential. The potential of regenerative practices come from the focus on soil health. Soil health not only provides an increase in soil organic carbon, thereby sequestering carbon, but also increases crop productivity, which mitigates GHG emissions.
Sections 4.2.1 through 4.2.4 describes the various measures that can be undertaken to mitigate GHG emissions and improve the environmental profile of cotton fiber.
4.2.1 Improving yields in India & Africa
175 International Cotton Advisory Committee. The ‘ICAC Recorder’, June 2019 Volume XXXVII.
Section 2.2.2 diagnosed the critical factors responsible for low yields and found that yields in Africa and India have been consistently lower than average over the past few decades in comparison to regions like Australia, Turkey, Brazil and USA. Yield enhancement has a significant potential in mitigating GHG emissions. The following approaches are recommended for improving yields and significantly reducing GHG emissions in India and Africa:
4.2.1.1 Optimize planting density
ICAC175 identified the need for changing the plant geometry and recommends high density planting (HDP) in Africa and India for yield enhancement. For example, India plants hybrid cotton varieties at a low density of 11,000-16,000 plants per hectare with 40-100 bolls harvested per plant over a duration of 180-240 days. Countries such as Australia, Brazil, China, Turkey and USA plant open pollinated varieties
at more than 110,000 plants per hectare with 8-12 bolls harvested per plant over a shorter duration of 140-160 days. High density planting has the capacity to produce higher yields over a shorter duration of time, thereby reducing nutrient use, reducing the potential of crop damage or loss from pests and diseases, and makes the crop less vulnerable to droughts.
4.2.1.2 Invest in high yielding seed varieties
Cotton yields are determined by the genetic potential of a variety and the appropriate growing conditions and agronomic practices implemented for the chosen variety. Section 2.2.2.1 highlights the importance of selecting suitable varieties and why Bt hybrid is a poor choice for rainfed cotton in India. It is imperative to invest in cotton research to develop new high yielding cotton varieties to suit rainfed conditions, with high nutrient use efficiency, and drought and pest tolerance under prevailing growing conditions in India and Africa.

Fashion Industry Charter for Climate Action | Raw Materials Working Group | Fashion Industry Charter for Climate Action | Raw Materials Working Group
Fashion Industry Charter for Climate Action | Raw Materials Working Group | Fashion Industry Charter for Climate Action | Raw Materials Working Group
123
4.2.1.3 Invest in upgrading ginning technology
in India and Africa
Improving lint yields of ginning machines, reducing manpower and energy demand can potentially reduce GHG impacts. Upgrading
176 From 2019 CRDC Australia Grower Survey Report: Average of Small size farm=28%; Medium farm=36% and Large farms=43%177 Daystar, J. S., Barnes, E., Hake, K., & Kurtz, R. (2017). Sustainability trends and natural resource use in US cotton production. BioResources, 12(1),
362-392.178 Ibid.
ginning technologies (e.g. installing automatic feeders) not only increases the productivity but will also help reduce contamination and improve fiber quality. Sourcing electricity from renewable energy resources (e.g., solar panel) is a good strategy to lower the ginning GHG impacts.
4.2.2 Precision Farming
Water and nutrient availability are the limiting factors for achieving higher yields. Precision farming is a system which gathers site-specific parameters including soil conditions, nutrient and water availability, assesses the farm site to deploy site-specific crop management practices to maximize yields and minimize crop input requirements. Real time yield monitoring can help track and improve crop management strategies and farmers are likely to see higher yields. Precision farming technologies has the potential to achieve GHG reductions from optimized nutrient management and water use efficiency as described below.
4.2.2.1 Optimal dosing of fertilizer
As highlighted in Section 2.2.2.6, farmers may apply excessive fertilizers, which contributes to GHG impacts from fertilizer production and nitrous oxide emissions from the soil. Improving nutrient use efficiency is essential for cotton cultivated on soils with low nutrient availability. Reduced fertilizer use leads to lower GHG impacts related to fertilizer production and reduces the field emissions from nitrogen-based fertilizer inputs. Implementing precision farming technologies leads to fuel savings, thereby driving lower GHG emissions. Varying soil conditions will affect nutrient requirements and fertilizer
inputs can vary, so soil testing is important to determine optimum nutrient requirements and fertilizer application rates. According the 2019 CRDC survey, on average176, fertilizer application rates across 36% of Australia’s farmed cotton area are optimized based on soil testing on the fields and around 42% of the growers use the same fertilizer application rate across the farm. In US, 86% of cotton growers apply fertilizers based on soil testing and analysis and most growers reported higher yields and improved resource efficiencies except for Far West and Southwest regions177.
4.2.2.2 Optimize water use efficiency
Drip irrigation method is the most water efficient irrigation method compared to surface and furrow irrigation. Investing in drip irrigation technologies can improve crop productivity, water efficiency, nitrous oxide emissions from soils are lower and drives GHG emission reductions. Currently, surface or furrow irrigation is the most popular irrigation method in the world and to improve water efficiency, the water flow rate, soil characteristics and infiltration rate needs to be measured and optimized. According to Daystar et. al178, 59% of growers in US used flow measuring devices such as flow meters to track the water consumption per hectare,

Fashion Industry Charter for Climate Action | Raw Materials Working Group | Fashion Industry Charter for Climate Action | Raw Materials Working Group
Fashion Industry Charter for Climate Action | Raw Materials Working Group | Fashion Industry Charter for Climate Action | Raw Materials Working Group
124
regulate water flow and ensure functioning of irrigation systems, thereby improving water management. A 2015 US national field survey indicates that moisture monitoring systems reduces the strain on water resources and is one of the key factors in yield increase.
179 Adapted from Table 3 of Daystar, J. S., Barnes, E., Hake, K., & Kurtz, R. (2017). Sustainability trends and natural resource use in US cotton production. BioResources, 12(1), 362-392.
180 Cotton Research and Development (CRDC) Australia (2016)181 Hedayati, M., Brock, P. M., Nachimuthu, G., & Schwenke, G. (2019). Farm-level strategies to reduce the life cycle greenhouse gas emissions of
cotton production: An Australian perspective. Journal of Cleaner Production, 212, 974-985.
In US, cotton growers deploying precision agricultural technologies (refer to Table 29) report higher yields and higher resource use efficiencies compared to non-precision farming techniques.
Table 29. Precision technologies used in 2015179.
Technology Used USA
Yield monitor 20%
Autosteer or GPS guidance 69%
Hand-held GPS 9%
Aerial or Satellite Imagery 13%
Soil map 37%
Grid soil sampling 46%
GPS-based swath control 51%
Real-time flow control 60%
Investment in research and development of precision farming technologies listed below could potentially lower GHG emissions:
• Smart siphons, a state-of-the-art water measurement tool which calculates the water needs based on data collected by sensors on the fields and triggers the irrigation system based on crop needs in real time.
• Adoption of precision sensing technologies that better measure water availability and use by the crop has the potential to enhance Australia’s water use efficiency by 40% in 15 years180.
• Drones are used to inspect cotton fields and monitor pests and disease infestation, irrigation systems and crop health.
• Sensor technology used to collect spatial data layers for soils and analyze soil conditions to determine nutrient needs and improve soil fertility.
• Solar-powered pumping: Use of solar powered irrigation pumps can lead to fuel savings and reduced GHG emissions. In 2019, 27% of growers in Australia generated solar energy. A recent study on Australian cotton181, found that changing from diesel to solar powered irrigation pumps could result in 8.1% of reduction in GHG emissions.
• Weed seeker technology uses rigs fitted with camera to identify and spray only affected areas rather than the whole field greatly reducing the need for herbicide production and lowering the GHG emissions.
• Canopy temperature sensors improve water efficiency by measuring the temperature of cotton plant’s leaves to identify the optimal time for irrigating the crop.

Fashion Industry Charter for Climate Action | Raw Materials Working Group | Fashion Industry Charter for Climate Action | Raw Materials Working Group
Fashion Industry Charter for Climate Action | Raw Materials Working Group | Fashion Industry Charter for Climate Action | Raw Materials Working Group

Fashion Industry Charter for Climate Action | Raw Materials Working Group | Fashion Industry Charter for Climate Action | Raw Materials Working Group
Fashion Industry Charter for Climate Action | Raw Materials Working Group | Fashion Industry Charter for Climate Action | Raw Materials Working Group
126
4.2.3 Soil health is the key
182 Long Term Effects of Organic Amendments on Soil Fertility. A review. Diacono et al, 2009.183 Long Term Effects of Organic Amendments on Soil Fertility. A review. Diacono et al, 2009.184 Ibid.185 Based on communication with experts.
Soil compaction is an issue. Poor soil structure: 1) restricts root growth which in turn restricts the ability of the plant to extract moisture and nutrients from the soil and 2) reduces the total volume of water that the soil can store. These factors can potentially reduce yield and decrease resource use efficiency. Growing cotton year after year on the same land, while failing to replenish nutrients withdrawn from harvests, erosion, and/or leaching, degrades the soil physically, chemically and biologically. Soils that are rich in organic matter are less likely to erode182. Adoption of soil health practices can improve rainfall infiltration rates and greater soil water-holding capacity, increases drought resilience, improves crop productivity, increases carbon storage and reduces GHG emissions. The following soil conservation practices are critical to maintain healthy soils:
• Maintain soil cover, • Reduce soil disturbance by minimizing
tillage and prevent loss of soil organic matter,
• Leave crop residues on the field instead of crop residue removal or burning,
• Add organic matter to soils through compost, manure, crop residue, or raw waste, and
• Diversify using crop rotations, cover crops or intercropping.
It has been demonstrated that applying organic amendments over the long term (defined as at more than 6 years) increased organic carbon by up to 90% compared to unfertilized soils, and by up to 100% compared to chemical fertilizer applications183. Soil health improvement strategies must include simultaneously an increase in organic matter and the uptake of soil nutrients by the crops to prevent as much leaching as possible. One way of limiting
nutrient leaching through adding organic matter is to process manure into compost before applying it to the soil. The extra step generates higher physical properties in terms of volume, particle size and consistency. It also helps balancing the nutrient composition, stabilizing the organic material and slowing down the release of nutrients184.
It is important to note that the type of compost applied matters, as not every compost behaves as a carbon sink. Most compost generated from windrow composting process is a good mulch but may not necessarily behave as a carbon sink. Increasing the soil microbial diversity (ratio of bacteria and fungi), such as BEAM practices, restores the photosynthetic capacity, thereby storing more carbon in the soil185. As illustrated in Figure 9, experimental data indicates that BEAM compost application (refer to Section 2.2.5.1.1 for more details) has the potential to mitigate 38 metric ton CO2e per hectare per year.
Replacement of synthetic fertilizer with organic fertilizer solely without changes in other farm management practice does not improve soil health and carbon sequestration in the long run. The farmer should focus on building soil health to improve crop productivity and build soil carbon. Building soil organic matter is specific to each farm, is a gradual process, and takes few years to actualize. Soil sampling and testing is required to measure soil fertility and is the key to improving crop management strategies. Once the soil is sampled, the goal is to increase soil fertility by incorporating crop residues at the beginning of the planting season and gradually implement one process at a time. It is critical to improve the soil biological activity by applying organic compost. Once the soil conditions gradually show improvement, cover crops can be implemented. Over the next

Fashion Industry Charter for Climate Action | Raw Materials Working Group | Fashion Industry Charter for Climate Action | Raw Materials Working Group
Fashion Industry Charter for Climate Action | Raw Materials Working Group | Fashion Industry Charter for Climate Action | Raw Materials Working Group
127
crop cycle, the farmer can begin implementing reduced tillage and transition to no-till farming over time. Transitioning from conventional till
186 Panel, ICAC Expert. “Measuring Sustainability in Cotton Farming Systems—Towards a Guidance Framework.” (2014).187 NAPCOR (2020): Cradle to resin Life Cycle Analyis of Polyethylene Terephthalate Resin; https://napcor.com/wp-content/uploads/2020/05/Final-
Revised-Virgin-PET-Resin-LCA.pdf
to no-till cotton system has the potential to increase soil organic carbon by 13%, thereby reducing GHG emissions186.
4.2.4 Training farmers
Farmer education, awareness and training programs focused on best practices for cotton farming is essential and should cover the following:
• Support schemes to provide good quality certified planting seeds
• Design strategies to protect crop from weather variability, pests and diseases
• Facilitate access to crop nutrient management and integrated pest management (IPM) strategies including biocontrol, natural pesticides and reduced pesticide use.
• Promote soil conservation techniques• Support schemes for adopting precision
farming techniques including optimal fertilizer dosing, water management, etc.
4.3 POLYESTER
The GHG profile of PET is heavily influenced by the source of feedstock used for PET precursor (PTA, or DMT and MEG) production, which can include either crude oil or natural gas based naphtha or ethane, PET waste materials or alternative sources such as sugarcane or corn derived feedstocks or waste gases from the iron and steel sector. A recent LCA study187 on virgin PET chips produced in North America indicates PTA and MEG precursors account for the bulk of GHG impacts, contributing to 60% and 24% of GHG impacts, respectively. Section 2.3.2.1and 2.3.2.2 provide a better understanding of the relevant parameters that influence the GHG emission profile of PET.
The main determinants affecting the GHG footprint of petrochemical feedstocks (ethylene and p-xylene) used for PET precursors are:
• GHG profile of crude oil and natural gas exploration for naphtha or ethane production. It varies due to the following factors: crude oil composition (sweet/sour), age and location of refinery, feedstock intake flexibility, differences in refinery configurations and transportation impacts of crude oil imports. The global volume-weighted average GHG intensity of refined crude oil is estimate at ~17 g CO2eq./MJ refined crude oil, with country-level emissions varying by a factor of 5 ranging from 7 to 35 g CO2eq./MJ (refer to Figure 14 for more details). Gas flaring practices have a considerable influence on the emissions. Crude oil producers with above-average GHG intensity, such as Algeria, Iraq, Nigeria, Iran, and the U.S., have higher GHG intensities due to gas flaring.

Fashion Industry Charter for Climate Action | Raw Materials Working Group | Fashion Industry Charter for Climate Action | Raw Materials Working Group
Fashion Industry Charter for Climate Action | Raw Materials Working Group | Fashion Industry Charter for Climate Action | Raw Materials Working Group
128
• For example, assuming an average input of 1.1 kg crude oil input per kg of naphtha and a yield of 7% of naphtha at the oil refinery, the GHG intensity of naphtha used in steam cracker is likely to range between 0.24 kg CO2e/kg naphtha to 1.4 kg CO2e/kg naphtha depending on the region of crude oil extraction.
• Energy demand of the steam cracker/catalytic reforming process, refinery configuration and the process efficiencies, which varies depending on the type of steam cracker feed (naphtha or ethane).
Use of recycled feedstock is an effective method for producing low carbon PET for the apparel and textile sector.
Based on current knowledge and LCA research presented in Figure 13, the following low carbon sources of PET are identified. Note that the current list excludes bio-based PET from the comparison due to limited availability of LCA data.
• Mechanically recycled PET has the lowest GHG profile compared to virgin PET and chemically recycled PET, with the potential to achieve the following reduction when using post-consumer plastic bottles:
– 66% GHG reduction for recycled chips/pellets compared to virgin PET chips – 27 % GHG reduction for DTY production compared to virgin PET filament DTY
• Chemically recycled PET: 5-27% GHG reductions can be achieved by shifting from virgin PET to chemically recycled PET, depending on the source of feedstock and region of PET production.
Based on current knowledge of findings presented in Section 2.3, the following recommendations are summarized below in decreasing order of importance:
4.3.1 Accelerate scale of recycling technology providers
There is a need to invest in technologies that recover PET effectively and allow for feedstock intake flexibility, with varying levels of contaminants in the waste stream and different types of feedstocks. As bottle-to-fiber mechanical recycling technology has
proved to be a low carbon source of PET, it is necessary to build pre-processing capabilities with advanced mechanisms that allow for other types of waste streams with higher contaminant levels such as waste textiles and ocean waste.
4.3.2 Improve recycling infrastructure
The recycling rate is the key to maintaining a stable supply of feedstock for recycled PET production. As discussed in Section 2.3.2.2.3.2, due to lack of incentives and
piecemeal regulations across countries, the waste collection practices are inefficient. There a need to increase waste collection volume by scaling the existing recycling

Fashion Industry Charter for Climate Action | Raw Materials Working Group | Fashion Industry Charter for Climate Action | Raw Materials Working Group
Fashion Industry Charter for Climate Action | Raw Materials Working Group | Fashion Industry Charter for Climate Action | Raw Materials Working Group
129
infrastructure and to develop large scale plastic waste collection systems. National and local authorities need to collaborate and work on developing policy mechanisms such
188 Chemical Recycling: Making Fiber-to-Fiber Recycling a Reality for Polyester Textiles: https://greenblue.org/work/chemical-recycling/189 IEA (2018); The Future of Petrochemicals; https://www.iea.org/reports/the-future-of-petrochemicals
as implementing taxes on landfill disposal of recoverable waste, credit schemes for waste material collection and emphasize the need to design products with recycled content.
4.3.3 Invest in automated sorting technologies
An ideal recycling system is one where pre/post-consumer textiles (e.g. used garments, carpets, automotive interiors, etc.) are converted back into virgin quality yarns to make new textiles, also often referred to as “fiber-to-fiber” recycling. To address these constraints, innovative automated sorting technologies are emerging to improve the processing efficiencies and increasing the purity of recycled feedstocks.
Advanced sorting technologies can not only help increase the PET recycling rates but also help improve the scale of recycled PET production. For example, Fibersoft Project and SIPTex/FITS are two major initiatives conducting research on automated sorting technologies which use near infrared spectroscopy (NIRS) to sort large volumes of post-consumer textiles, by fiber type188. Investment in these types of advanced technologies is necessary to help commercialize recycled PET production.
4.3.4 Invest in alternative feedstocks for PET production
Investing in technologies that use alternative feedstocks such as non-food crops grown on degraded land (e.g., short-rotation crops such as miscanthus, willow, poplar, etc.), waste materials from biomass processing (e.g., food
waste, saw dust, etc.) or use of microbes to break down plastics into monomers, has the potential to mitigate GHG impacts of PET production.
4.3.5 Scaling of Carbon Capture, Utilization and Storage (CCUS)
technologies to mitigate GHG emissions from petrochemical production
According to IEA189, the deployment of carbon capture, utilization and storage (CCUS) on a wide scale has the potential to reduce 35% of GHG emissions from the chemical sector by
2050. Feasibility for wide scale deployment and permanence of CCUS are yet to be demonstrated.

Fashion Industry Charter for Climate Action | Raw Materials Working Group | Fashion Industry Charter for Climate Action | Raw Materials Working Group
Fashion Industry Charter for Climate Action | Raw Materials Working Group | Fashion Industry Charter for Climate Action | Raw Materials Working Group
130

Fashion Industry Charter for Climate Action | Raw Materials Working Group | Fashion Industry Charter for Climate Action | Raw Materials Working Group
Fashion Industry Charter for Climate Action | Raw Materials Working Group | Fashion Industry Charter for Climate Action | Raw Materials Working Group
131
05 Next Steps with Existing Materials
06 Potential for New Fibers
07 Request from Industry/How to Partecipate

Fashion Industry Charter for Climate Action | Raw Materials Working Group | Fashion Industry Charter for Climate Action | Raw Materials Working Group
Fashion Industry Charter for Climate Action | Raw Materials Working Group | Fashion Industry Charter for Climate Action | Raw Materials Working Group
132
5.1 Cotton
• Explore the implications of using all on farm by-products as input for fertilizer or as biomass energy.
• Differentiation reporting of country specific cotton and farming associations such as those in Australia and the U.S.
• Further studies on the impacts of specific farming systems are required. Baseline data collection, comparative studies, isolated variables, and a consistent LCA methodology over several years are essential to improve research.
5.2 Polyester
• Research the effects of spills and leaks in fossil fuel extraction on the carbon intensity and environmental impact of feedstock.
• Review recycling technologies as they are commercialized.• Research and review polyester made of plant based oil e.g. castor oil as they are
commercialized.• Support the development of technologies and systems that enable the use and
availability of post-consumer and post-industrial feedstock material for recycling.
Next Steps with Existing Materials

Fashion Industry Charter for Climate Action | Raw Materials Working Group | Fashion Industry Charter for Climate Action | Raw Materials Working Group
Fashion Industry Charter for Climate Action | Raw Materials Working Group | Fashion Industry Charter for Climate Action | Raw Materials Working Group

Fashion Industry Charter for Climate Action | Raw Materials Working Group | Fashion Industry Charter for Climate Action | Raw Materials Working Group
Fashion Industry Charter for Climate Action | Raw Materials Working Group | Fashion Industry Charter for Climate Action | Raw Materials Working Group
134
There are a number of opportunities for innovation in viscose, cotton and polyester fiber production from the feedstock through manufacturing. There are solutions emerging from both incumbents and new innovators. Please note, this report does not list out specific innovations or innovators in this space.
6.1
CottonOpportunities for innovation in cotton include both technological innovations but also those that enable better farming practices such as regenerative agriculture.
Regenerative agriculture is usually described as a system of farming principles and practices that are designed to enhance ecosystem services by regenerating top soil, soil health and building biodiversity. Practices include no till farming, using cover crops and building diversity in cropping systems.
Innovations in growing cotton include technological innovations such as soil treatment, which uses safe, biodegradable mulch to improve soil water retention and create a micro-climate. As well as seed treatment which is used for cotton seeds that draws on beneficial microbes (endophytes) that live inside plants to improve their natural resistance to disease. Smart / precision agriculture, which utilizes technologies such as sensors, GPS and drones to gather data from which models can be developed to determine plant- specific agricultural treatments.
6.2
PolyesterMost sources of PET are appropriate for either recycling process; however, the two most commonly used feedstocks are PET bottles/packaging and polyester waste textiles. There are two types of recycling relevant for circularity in the fashion industry, mechanical and chemical. On the mechanical recycling side, the fibre output is a lower quality grade than that of virgin, meaning it is more commonly used in staple fibre production and blended with virgin fibres, therefore not providing a truly circular solution. Having said that, given the sheer abundance of plastic waste available and the improved impact associated with recycled fibre production, many established PET producers have forayed into recycling. Unlike mechanical recycling, chemical recycling produces PET output of identical quality without any fibre degradation, therefore allowing the process to repeat multiple times. Furthermore, chemical recycling can recycle textile and blended textiles, paving the way for closing the cloop and reducing the GHG.
Partially biobased PET is commercially available today, produced using bio-MEG and bio-PTA by dehydrating bioethanol derived from fermentation of sugarcane, corn and other energy crops. The sustainability of bio-based PET is subject to feedstock cultivation conditions and practices, which varies by region within a country.
Potential for New Fibers

Fashion Industry Charter for Climate Action | Raw Materials Working Group | Fashion Industry Charter for Climate Action | Raw Materials Working Group
Fashion Industry Charter for Climate Action | Raw Materials Working Group | Fashion Industry Charter for Climate Action | Raw Materials Working Group

Fashion Industry Charter for Climate Action | Raw Materials Working Group | Fashion Industry Charter for Climate Action | Raw Materials Working Group
Fashion Industry Charter for Climate Action | Raw Materials Working Group | Fashion Industry Charter for Climate Action | Raw Materials Working Group
136
While the data quality may not be perfect and requires more investment, brands can begin taking steps immediately to source lower-carbon options for their existing fibers by utilizing available information from published Life Cycle Inventories, as well as qualitative criteria around production impacts. To take steps on preferred raw material sourcing, however, will require alignment and buy-in from within each brand.
Transitioning to lower impact material takes intensive internal coordination, with suggested steps for the program manager:
• Build internal consensus and buy-in for transitioning materials It is important to create awareness and partnerships with key teams, such as designers, fabric R&D, supply chain sourcing, product developers, merchants and marketing. Having allies and champions at all levels, from implementors to executives, will be crucial to supporting the process of transition.
• Develop/adopt evaluation and preferred fiber designation Utilizing industry work such as [this report, Higg MSI, Textile Exchange Preferred Fibers Toolkit], brands will need to define and develop their portfolio of lower-carbon raw materials. This will vary by company based on their fiber consumption and product needs.
• Partner internally to train and educate sourcing/design teams Creating or adopting educational materials will help bring others along the journey to understanding both the need to focus on sourcing to reduce carbon emissions and the available options that exist.
• Develop impact measurement capabilities by improving data collection Collect internal sourcing data: In order to build a transition roadmap to new materials, accessing the current systems to collect and track sourcing data will support measuring current and future material choices. A Product Line Management (PLM) system should collect raw materials data like fabric purchases by measurable qualities, like g/m3, that allow for comparability over time and tracking towards goals. Furthermore, it is essential to engage suppliers and invest in collecting life cycle inventory data on key manufacturing operations. Improving data collection will enhance data quality and help provide more accurate baseline KPI measurements and help set and monitor reduction targets. Set product/material based goals: Initial goal-setting is often around adoption or transition of materials, such as virgin polyester to recycled polyester, or conventional (uncertified) to organic cotton. Setting targets like these is highly achievable for all companies, as they measure what is already being purchased and produced.
Request from Industry/ How to Partecipate

Fashion Industry Charter for Climate Action | Raw Materials Working Group | Fashion Industry Charter for Climate Action | Raw Materials Working Group
Fashion Industry Charter for Climate Action | Raw Materials Working Group | Fashion Industry Charter for Climate Action | Raw Materials Working Group
137
Once brands have ability to measure current sourcing and have developed their roadmap to sourcing preferred lower-carbon fibers, there can be a renewed focus on understanding what impacts have been achieved from transition. This may include detailed Scope 3 baselines, allowing for modeling of sourcing choices
• Measure adoption, more widely build support to measure total sourcing of materials so understand transition In order to quantify transition to lower-carbon materials, brands will need to develop metrics and KPIs around material sourcing. This may involve coordinating with fabric sourcing teams as well as integrating within Product Line Management systems/software to capture materials. In addition, brands will need to develop capacity to measure materials by weight, often by g/m3 or other measures that allow for comparison and conversion tracking.
• Provide guidance on purchasing and claims support Most preferred fibers (such as organic, recycled, BCI cotton, Responsible Wool/Down) and branded materials require supply chain certification as well as have guidelines & restrictions on marketing claims. Setting up a support system to encourage the sourcing of these materials according to best practices (generally GOTS/OCS, RCS/GRS and other certifications provide guidance) can help product and marketing teams with adoption.
• Set outcome-based goals (carbon reductions; intensity and absolute) Finally, brands will be able to shift from setting targets based on purchasing or materials uptake (such as x% recycled poly, conversion to organic cotton, etc.) and set metrics and targets based on indicators such as % reductions in CO2e, in line with Science Based Targets.

Fashion Industry Charter for Climate Action | Raw Materials Working Group | Fashion Industry Charter for Climate Action | Raw Materials Working Group
Fashion Industry Charter for Climate Action | Raw Materials Working Group | Fashion Industry Charter for Climate Action | Raw Materials Working Group
138
A.1 Methodology for Literature Review
As an example, the methodology used for reviewing cotton LCA studies is described below.
• SCS approach to data collection, filtering and discarding studies that are not compatible: 27 studies were relevant (refer to Table 32 for list of data sources), accessible and reviewed based on the following established basic criteria step-by-step:
– The studies must quantify carbon footprint for cotton fiber or at least include impacts from cotton farming and/or ginning processes. If no→ discard
– The studies must provide background information on cotton farming practices. If no→ discard
– The studies must clearly outline the system boundaries and exclusions. If scope does not match→ discard
– The studies must clearly define whether primary or secondary data was used for modeling GHG emissions. If ONLY secondary data is used→ discard
– The studies must clearly specify the methodology and background data used for modeling GHG emissions. If methodology is inconsistent→ discard
– If data is too old→ discard – Overall, prioritized most recent studies (discarded studies published prior to 2000) – Include studies which address the data gaps and limitations
• SCS step-by-step approach for filling data gaps on ginning:
– Reviewed literature to find GHG emissions for ginning on a country level→ If no information available→ move on to step ii
– Reviewed ecoinvent database (v3.1 to maintain consistency) to see if we could process electricity data required per kg fiber ginned→ if no dataset available→ move on to step iii
– Used global average data for ginning190
Overall data quality was poor for ginning in LCAs. Most LCAs use secondary data for modeling this process. The gin turnout varies from 35%-42%, depending on the country.
• Scaling up results reported on the basis of seed cotton into ginned fiber. Some LCAs report results relative to seed cotton rather than ginned fiber. SCS took the following approach for scaling seed cotton LCA results to 1000 kg ginned fiber:
190 Ginning impacts are typically low and contribute to less than 18% of overall cotton fiber impacts
Appendices

Fashion Industry Charter for Climate Action | Raw Materials Working Group | Fashion Industry Charter for Climate Action | Raw Materials Working Group
Fashion Industry Charter for Climate Action | Raw Materials Working Group | Fashion Industry Charter for Climate Action | Raw Materials Working Group
139
– Reviewed seed inputs per kg fiber in LCAs for a particular country→ – Applied country level estimate (average of 2.62 kg seed cotton per kg ginned fiber for
India)→ for ginning, used impacts calculated in Cotton Inc and TE LCA. For India Min value: 2.4 kg seed cotton per kg ginned fiber (from ecoinvent database) Max value of 2.8 kg seed cotton per kg ginned fiber (from Textile Exchange LCA) Average: 2.62 kg seed cotton per kg ginned fiber
A.2 Literature Review Criteria
Table 30 lists the literature review criteria for cotton LCA studies.
Table 30. Literature review criteria for Cotton LCA studies.
Review Criteria for Cotton Description
1. Geographic Scope/Country Specify the country name
2. Cotton Type Specify the type of cotton source: conventional/BCI/organic/
mechanically recycled
3. Region/State Specify the region or province where cotton is grown (if
available)
4.1 Baseline Results- Cotton Cultivation Results reported for cotton cultivation process
4.1a Best Case (lower end)- Cotton Cultivation Report lower end of results (if available)
4.1b. Worst Case (higher end)- Cotton Cultivation Report higher end of results (if available)
4.2 Baseline Results- Ginning/ (**recycling fibers for recycled cotton) Results reported for ginning process/recycling process (if
applicable)
4.2a. Best Case (lower end)- Ginning Report lower end of results (if available)
4.2b.Worst Case (higher end)- Ginning Report higher end of results (if available)
5.1 Baseline Results TOTAL- Cotton Cultivation+Ginning TOTAL results reported for cotton cultivation+ginning
5.1a. Best Case (lower end)- Cotton Cultivation+Ginning Report lower end of results (if available)
5.1b. Worst Case (higher end)- Cotton Cultvation+Ginning Report higher end of results (if available)
5.2 Climate Change results with credit (kg CO2e/metric ton ginned
cotton fiber)
Report results with credit
5.3a. Sub-processes: Other Report results on a subprocess level is available
5.3b. Sub-process: Machinery Report results for machinery sub-process (i.e. fuel used in
tractors, agricultural equipment, etc.) if available
5.3c. Sub-process: Fertilizer production Report results for fertilizer production process if available
5.3d. Sub-process: Pesticide production Report results for pesticide production process if available
5.3e. Sub-process: Field emissions Report results for field emissions (e.g. N2O from fertilizer
application) if available
5.3f. Sub-process: Crop rotation Report results for crop rotation process if available
5.3g. Sub-process: Reference system Report results for the reference system if available
5.3h. Sub-process: Ginning Report results for ginning process if available
5.3i. Sub-process: Irrigation Report results for irrigation process if available

Fashion Industry Charter for Climate Action | Raw Materials Working Group | Fashion Industry Charter for Climate Action | Raw Materials Working Group
Fashion Industry Charter for Climate Action | Raw Materials Working Group | Fashion Industry Charter for Climate Action | Raw Materials Working Group
140
Review Criteria for Cotton Description
5.3j. Sub-process: Transport to gin/factory Report results for transportation process if available
5.3k. Sub-process: CUTTING/SHREDDING (FOR RECYCLED FIBERS) Report results on a subprocess level is available (only
applicable to recycled cotton)
6. Methodology Specify the methodology used for assessment
7. Any credits assigned (e.g. biobased carbon content)? Specify whether any credits are applied in this assessment
8. Tillage practice (conventional/reduced/no-till) Specify the tillage practice (conventional/reduced/no-till) used
for assessment
9. Amount of seed sown Specify the amount of seed sown in kg/ha
10. Cotton harvest practice (traditional v/s mechanical) Describe the type of cotton harvest practice
11. Crop Yield (t/ha) (enter quantitative data if available) State the crop yield data applied in the study
12. Irrigated or Rainfed? (enter % irrigated if available) State the type of water requirement: rainfed or irrigated
12.1 Irrigation System Specify the type of irrigation system (if available)
13. Crop residue burning? State whether crop residues are burnt on the field. If not, how
is crop residue managed?
14. Crop rotation practice? State whether crop rotation/intercropping/double cropping is
prevalent
15. Grade of fiber/yarn produced? Specify the fiber length
16. Pesticide Type & application rate? (enter quantitative data if
available)
Enter the amount of pesticide applied by type
17. Fertilizer Type & application rate? (enter quantitative data if
available)
Enter the amount of fertilizer applied by type
18. Diesel fuel use (l/ha)? (enter quantitative data if available) Enter the amount of diesel use used on the field per hectare
19. Electricity use (kWh/metric ton ginned fiber)? (enter quantitative
data if available)
Enter the amount of electricity used for ginning, irrigation and
other farm operations
20. Land transformation/Field Clearing (i.e. clearing of native forest/
grasslands/habitat) for agriculture
Is land transformed or cleared for cotton agriculture?
21. Soil Type/Conditions Specify the soil characteristics and conditions for cotton
farming
22. Soil Carbon Fluxes (e.g. soil C sequestration, soil C losses,etc.) Specify whether soil carbon fluxes are modeled
23. Allocation Method Used Specify the type of allocation method: economic v/s mass-
based allocation
24. Primary data Specify the type of primary data (if available)
25. Primary data collection period Specify the primary data collection period
26. Secondary data Specify the type of secondary data (if available)
27. Database used for modeling Specify the database used for modeling (e.g. ecoinvent/GaBi)
28. LCA software ? Which LCA software was used to develop the LCA model?
29. Notable Assumptions Specify the assumptions used in the study (if available)
30. Notable Limitations Specify the limitations of the study (if available)
31. Comments Any Comments?
32. Key Conclusions from the study State the conclusions drawn from the study
33. Included in the model Specify the inclusions in the system boundary
34. Excluded from the model Specify the exclusions from the system boundary
35. Waste collection region (ONLY APPICABLE TO RECYCLED COTTON) State the region of waste collection
36. Feedstock for recycled cotton (only applicable to recycled cotton) Post-consumer textile clippings/pre-consumer textile?
37. Study Name State the name of the LCA study/report

Fashion Industry Charter for Climate Action | Raw Materials Working Group | Fashion Industry Charter for Climate Action | Raw Materials Working Group
Fashion Industry Charter for Climate Action | Raw Materials Working Group | Fashion Industry Charter for Climate Action | Raw Materials Working Group
141
Review Criteria for Cotton Description
38. Date of source Specify the date of the study/report
39. Authors Specify the author name
40. Who commissioned the study (who paid for it) Who paid for this study?
41. Type of study (LCA report (R), database (D), peer-reviewed journal
paper (J), conference paper (C),
What type of study is this?
42. Cross-referenced data sources State whether any other studies are cross referenced in this
study.
43. Scope Specify the scope of assessment
44. Higg MSI Score What is the Higg MSI Score?
45. Reason for discarding the study (e.g. Inconsistent methodology) Why did we discard this study? Is it because it is a duplicate
value? Or Inconsistent methodology?
46. Proxy value/ Measured/Calculated from graphs/Extrapolation
estimate?
Proxy: Data from other study applied to current study in order
to scale to a consistent functional unit of 1 metric ton of
ginned fiber.
Measured/Calculated: Values derived from graphs/charts/
tables in the same study by applying factors such as %
contribution of process in order to maintain consistency of the
functional unit.
Extrapolated estimate: Values extrapolated in order to scale
results to 1metric ton of ginned fiber. E.g. Unit conversion or
scaling seed cotton result to ginned fiber result
Questionnaires were shared with PET manufacturers for data collection and Table 31 includes the list of parameters included for the literature review criteria for PET LCA studies.
Table 31. Literature review criteria for PET LCA studies.
Review Criteria for Polyester (PET)
STUDY REFERENCE/DATA SOURCE 1. Study Name
2. Date of source
3. Authors
4. Who commissioned the study (who paid for it)
5. Type of study (LCA report (R), peer-reviewed journal paper (J), conference
paper (C), master’s thesis (T), book chapter (B), or other type of report (OR))
6. Cross referenced data sources
SCOPE 7. Goal of the study
8. Scope
9. Functional Unit (FU)
10. Geographic Scope
11. Grade of virgin PET and rPET filament yarn/fiber

Fashion Industry Charter for Climate Action | Raw Materials Working Group | Fashion Industry Charter for Climate Action | Raw Materials Working Group
Fashion Industry Charter for Climate Action | Raw Materials Working Group | Fashion Industry Charter for Climate Action | Raw Materials Working Group
142
Review Criteria for Polyester (PET)
GHG Emissions per Metric Ton of PET
Filament for KEY PROCESSES
12. Agriculture/Feedstock Production
13. Sorting/separation
14. Cleaning/Washing/Drying
15. Grinding/Crushing
16. Pelletization
17. Chopping (applicable to staple fibers)
18. Depolymerization
19. Polymerization
20. Melt extrusion
21. Precursor production (e.g. DMT, TPA, EG, BHET)
22. Filament Yarn - DTY
23. TOTAL Cradle-to-gate carbon footprint (total of the above applicable processes)
METHOD/STUDY REFERENCE/DATA
SOURCE
24. Does the carbon footprint result include any credits? If yes, please describe
the what the credit was applied for. Could you provide us with the amount
of credit applied per functional unit?
25. Do you generate any by-products? If yes, how did you treat the by-products in
the model? If you have applied any credits, then please specify the amount
of credit applied per functional unit
26. Was allocation method applied for any of the processes?? If yes, could you describe
whether you applied mass-based or economic allocation method?
27. LCA database used for modeling (e.g. GaBi, ecoinvent, etc.)
28. Software used for assessment (e.g. GaBi, SimaPro, openLCA)
29. Feedstock conversion efficiency
30. LCA or carbon footprint methodology used for assessment
(e.g. IPCC 2013 GWP 100, IPCC 2007 GWP 100, CML, etc.)
SOIL 31. Are Soil C fluxes (i.e. soil C sequestration., soil C losses,etc.) included?
NOTES ON DATA COLLECTION,
ASSUMPTIONS & PROCESSING FROM
REVIEWED STUDIES
32. Primary data
33. Primary data collection period
34. Secondary data
35. Database used for modeling
36. LCA software?
37. Notable Assumptions
38. Notable Limitations
39. Key Conclusions/Findings from the Study
40. Comments
41. Included in the Study
42. Excluded in the Study
SCORES 43. Higg MSI Score

Fashion Industry Charter for Climate Action | Raw Materials Working Group | Fashion Industry Charter for Climate Action | Raw Materials Working Group
Fashion Industry Charter for Climate Action | Raw Materials Working Group | Fashion Industry Charter for Climate Action | Raw Materials Working Group
143
A.3 Data Sources and References
Table 32 through Table 33 provides the list of data sources reviewed for the scope of this study.
Table 32. Data sources reviewed for Cotton. (CC: Conventional Cotton; OC: Organic Cotton; BCI: Better Cotton; RC: Mechanically recycled cotton; RA: Regenerative Agriculture; X: data is included in the scope of the review).
#Cotton Type Study Name
Publi-cation Date Authors
Commissioner of Study
Cross-referenced data sources
Geographic Scope/Country
Data Point Included in Review?191
SAC: Higg MSI Score (GWP)
1 CC LCA Update of
Cotton Fiber
and Fabric
Life Cycle
Inventory
2017 Thinkstep (PE
International)
Cotton Inc 1) GaBi 2)
Higg MSI 3)
Study #10 4)
Hedayati et.
al 2019
Global X 1.82
Australia X
China Aggregat-
ed with
global
values
India
USA
2 CC Life Cycle
Assessment of
Cotton Fiber
& Fabric - full
report
2012 PE
International
and Cotton
Incorporated
Cotton Inc Study #10 Global X
China
India
USA
3 CmiA The carbon
and water
footprint of
cotton made
in Africa
2013 Dr. Moritz Hill
and Kordula
Wick / Systain
Aid by Trade
Foundation
Africa X
4 CmiA Life Cycle
Assessment
of Cotton
made in Africa
(CmiA)
2014 PE
International
(Thinkstep)
Aid by Trade
Foundation
Higg MSI &
Study #10
Africa X 1.19
5 CC Life Cycle
Energy Use &
Greenhouse
Gas Emissions
of Australian
Cotton: Impact
of farming
systems
2010 Khabbaz B CRDC
Australia
Yilmaz (2005)
for Turkey
cotton and
Chen & Baille
(2007) for
Australia
Australia X
191 Blank cells indicate that the study was discarded from the scope of assessment

Fashion Industry Charter for Climate Action | Raw Materials Working Group | Fashion Industry Charter for Climate Action | Raw Materials Working Group
Fashion Industry Charter for Climate Action | Raw Materials Working Group | Fashion Industry Charter for Climate Action | Raw Materials Working Group
144
#Cotton Type Study Name
Publi-cation Date Authors
Commissioner of Study
Cross-referenced data sources
Geographic Scope/Country
Data Point Included in Review?191
SAC: Higg MSI Score (GWP)
6 CC Environmental
analysis of a
cotton yarn
supply chain
2012 University
Politecnica,
Ancona, Italy
Bevilacqua,
Ciarapica,
Mazzuto,
Paciarotti
anonymous
European
fashion
company
China X
India X
USA X
7 BCI Life Cycle
Assessment
of Cotton
Cultivation
Systems
2018-
2019
Thinkstep (PE
International)
C&A
Foundation
India X
CC India X
OC India X
8 BCI Cutting
cotton carbon
emissions
(Findings from
Warangal,
India)
2013 WWF UK &
WWF India
Marks &
Spencer
India X
9 CC Eco-efficiency
of cotton-
cropping
systems in
Pakistan: an
integrated
approach
of life cycle
assessment
and data
envelopment
analysis
2015 Ullah A et. al CIRAD,
Higher
Education
Commission
of Pakistan
(HEC) &
Asian
Institute of
Technology
Pakistan X
10 CC Environmental
impact of
Recover cotton
in textile
industry
2015 M. de la
Guardia et. al
Generalitat
Valenciana
& Hilaturas
Ferre
Baydar et.al
(2015)
Turkey X
Zhang et al.
(2015)
China X
RC Higg MSI|
TE LCA
(2014); CmiA
LCA (2014)
used for
comparison
with organic
cotton and
conventional
cotton
Spain X 0.188
OC Baydar et.al
(2015)
Turkey X

Fashion Industry Charter for Climate Action | Raw Materials Working Group | Fashion Industry Charter for Climate Action | Raw Materials Working Group
Fashion Industry Charter for Climate Action | Raw Materials Working Group | Fashion Industry Charter for Climate Action | Raw Materials Working Group
145
#Cotton Type Study Name
Publi-cation Date Authors
Commissioner of Study
Cross-referenced data sources
Geographic Scope/Country
Data Point Included in Review?191
SAC: Higg MSI Score (GWP)
11 RC LCA of
recycling
cotton
2016 Miljogiraff
(Swedish LCA
consulting
firm)
H&M Pakistan X
12 OC Life Cycle
Assessment
(LCA) of
Organic
Cotton -A
global average
2014 PE
International
(Thinkstep)
Textile
Exchange
EP&L
database
China X
EP&L
database
India X
EP&L
database
Tanzania X
EP&L
database
Turkey X
EP&L
database
USA X
1) GaBi 2)
Higg MSI 3)
Study #10
Global X 0.941
13 OC Confidential
data
2012 Confidential Confidential Kyrgyzstan X
14 OC Confidential
data
2012 Confidential Confidential (T):LCA of
Two Textile
Products:
Wool and
Cotton
(Cardoso
2013)
Tajikistan X
15
BCI Life Cycle
Assessment of
Organic,BCI &
Conventional
Cotton: A
Comparative
Study of
Cotton
Cultivation
Practices in
India
2018 Thinkstep (PE
International)
Arvind
Limited
India X
CC India X
OC India X

Fashion Industry Charter for Climate Action | Raw Materials Working Group | Fashion Industry Charter for Climate Action | Raw Materials Working Group
Fashion Industry Charter for Climate Action | Raw Materials Working Group | Fashion Industry Charter for Climate Action | Raw Materials Working Group
146
#Cotton Type Study Name
Publi-cation Date Authors
Commissioner of Study
Cross-referenced data sources
Geographic Scope/Country
Data Point Included in Review?191
SAC: Higg MSI Score (GWP)
16
CC Life cycle
assessment of
organic and
conventional
non-Bt cotton
products from
Mali
2020 Avadi. A et. al ELSA TE 2014,
Cotton Inc,
C&S 2018,
Nalley 2013,
Velden
213, CmiA
2014,Matlock
2009
Mali
OC Mali
17 OC Feasibility
study and
strategy
development
of agricultural
emission
reduction
measures
within Rare’s
pilot area in
China
2018 Soil and More Rare China X
18 Updated
Carbon
Footprint of
Australian
Irrigated
Cotton
2019 CRDC CRDC Hedayati e. al
(2019)
Australia X
19 CC Assessing the
impacts of
Regenerative
Organic
Agriculture
2020 Bren School of
Environmental
Science and
Management,
UCSB
Patagonia Global X
20 CC CRDC 2019
Grower
SUrvey
2020 CRDC CRDC Australia X
21 RA Dr. David
Johnson’s
research
on BEAM
compost
2010 Dr. David
Johnson
USA X
22 CC Ecoinvent 3.6 2016 Quantis,
Mireille Faist
Emmenegger
Global X

Fashion Industry Charter for Climate Action | Raw Materials Working Group | Fashion Industry Charter for Climate Action | Raw Materials Working Group
Fashion Industry Charter for Climate Action | Raw Materials Working Group | Fashion Industry Charter for Climate Action | Raw Materials Working Group
147
#Cotton Type Study Name
Publi-cation Date Authors
Commissioner of Study
Cross-referenced data sources
Geographic Scope/Country
Data Point Included in Review?191
SAC: Higg MSI Score (GWP)
23 OC Ecoinvent 3.6 2015-
2018
Archana Datta,
Federation
of Indian
Chambers of
Commerce and
Industry
Global X
24 RC EP&L database 2019 Pwc Kering China X
India X
Spain X
OC China X
India X
Kyrgyzstan X
Tanzania X
Turkey X
United
States
X
25 CC USDA 1996-
2007
IDEMAT USA X
26 CC A scan level
cotton carbon
life cycle
assessment:
has Bio-Tech
reduced
the carbon
emissions
from cotton
production in
the USA?
2013 Nalley,
Danforth,
Niederman,
Teague
The cotton
foundation
USA X
27 RA Seeding Soil’s
Potential
2018 Wrangler Wrangler USA X

Fashion Industry Charter for Climate Action | Raw Materials Working Group | Fashion Industry Charter for Climate Action | Raw Materials Working Group
Fashion Industry Charter for Climate Action | Raw Materials Working Group | Fashion Industry Charter for Climate Action | Raw Materials Working Group
148
#Cotton Type Study Name
Publi-cation Date Authors
Commissioner of Study
Cross-referenced data sources
Geographic Scope/Country
Data Point Included in Review?191
SAC: Higg MSI Score (GWP)
28 CC The water
footprint
of cotton
consumption:
An
assessment
of the impact
of worldwide
consumption
of cotton
products on
the water
resources in
the cotton
producing
countries
2005 A.K Chapagain
et. al
EP&L
database
Australia,
Brazil,
China,
India,
Pakistan,
Turkey,
USA
29 CC,
OC
Ecological
Footprint
and Water
Analysis of
Cotton, Hemp
and Polyester
2005 Stockholm
Environment
Institute
BioRegional
Devel-
opment
Group +
WWF-Cym-
ru
USA
30 Cotton
Spin-
ning
(not in
scope)
An
investigation
on energy
consumption
in yarn
production
with special
reference to
ring spinning
2007 Erdem Koc &
Emel Kaplan
(blank) Higg MSI Global
31 CC LCA
benchmarking
study on
textiles made
of cotton,
polyester,
nylon, acryl, or
elastane
2013 Van der
Velden, Patel,
Vogtlander
China

Fashion Industry Charter for Climate Action | Raw Materials Working Group | Fashion Industry Charter for Climate Action | Raw Materials Working Group
Fashion Industry Charter for Climate Action | Raw Materials Working Group | Fashion Industry Charter for Climate Action | Raw Materials Working Group
149
#Cotton Type Study Name
Publi-cation Date Authors
Commissioner of Study
Cross-referenced data sources
Geographic Scope/Country
Data Point Included in Review?191
SAC: Higg MSI Score (GWP)
32 BCI Evaluation
of the early
impacts of the
BCI cotton on
smallholders’
cotton
producers
in Kurnool
district India
Kumar, Nelson,
Martin,
Narayanan,
Suresh
Reddy, Badal,
Latheed,
Young
ISEAL (glob-
al mem-
bership or-
ganisation
for credible
sustain-
ability
standards)
India
33 BCI BCI and the
Greening of
Cotton: An
analysis of the
Better Cotton
Aims and the
Impacts of
Soil Salinity in
Maharashtra,
India
2015 Estee Peters Inerna-
tional Land
& Water
Manage-
ment, WWF
India
India
34 CC Life Cycle
Assessment of
conventional
and organic
cotton
cultivation for
the production
of a T-shirt
2014 Sipperly,
Edinger,
Teamhy, Jasper
India
35 CC IDEMAT 2020 TU Delft China
36 CC GaBi 2010-
2014
Thinkstep Cotton Inc #1 Cotton Inc Global
Table 33. Data sources reviewed for PET
# PET Type Study Name Publication Date Authors Commissioner
of StudyGeographic Scope
Cross-referenced data sources
1 Virgin PET Cradle-to-Gate Life
Cycle Inventory
of Nine Plastics
Resins and Four
Polyurethane
Precursors Report
2011 Franklin
Associates
The Plastics
Division of
the American
Chemistry
Council
North
America
2 Virgin PET 2020 NAPCOR North America

Fashion Industry Charter for Climate Action | Raw Materials Working Group | Fashion Industry Charter for Climate Action | Raw Materials Working Group
Fashion Industry Charter for Climate Action | Raw Materials Working Group | Fashion Industry Charter for Climate Action | Raw Materials Working Group
150
# PET Type Study Name Publication Date Authors Commissioner
of StudyGeographic Scope
Cross-referenced data sources
3 Mechanically
recycled PET
Life Cycle
Inventory of 100%
Postconsumer HDPE
and PET Recycled
Resin
2011 Franklin
Associates
APR, NAPCOR North America
4 Virgin PET,
Chemically
recycled PET
Evaluating the impact
of closed loop supply
chains on Nike’s
environmental
performance and
costs
2013 Hagoort, S.
5 Virgin PET,
Mechanically
Recycled PET,
Chemically
Recycled PET
LCA of recycling PET
bottle to fiber
2010 Li Shen
et. al
Western
Europe,
Taiwan
Higg MSIv3.0
6 Virgin PET LCA-textiles_cotton_
polyester
2014 van der
Velden
Europe
7 Recycled PET LCI for PC recycled
resins_PET HDPE
and PP
2018 Franklin Associates
APR
8 Chemcially
recycled PET
Patagonia’s Common
Threads Garment
Recycling Program:
A Detailed Analysis
2006 Patagonia Patagonia Japan
9 Bio-based PET Comparing life cycle
energy and GHG
emissions of bio-
based PET, recycled
PET, PLA and man-
made cellulosics
2012 Li Shen
et. al
10 Bio-based PET,
Recycled PET
17 Case Studies
Summaries
2017 ICCA ICCA India, Japan,
Europe
11 Virgin PET,
Mechanically
recycled PET
Anonymous 2018 Anony-
mous
Anonymous India Higg MSIv3.0
12 Virgin PET,
Chemically
recycled PET
Anonymous 2017 Anony-
mous
Anonymous China
13 CarbonSmartPET Anonymous 2019 Anony-
mous
Anonymous China
14 Bio-based PET Anonymous 2019 Anony-
mous
Anonymous USA
15 Virgin PET,
Mechanically
recycled PET
Anonymous 2016 Anony-
mous
Anonymous Italy

Fashion Industry Charter for Climate Action | Raw Materials Working Group | Fashion Industry Charter for Climate Action | Raw Materials Working Group
Fashion Industry Charter for Climate Action | Raw Materials Working Group | Fashion Industry Charter for Climate Action | Raw Materials Working Group
151
# PET Type Study Name Publication Date Authors Commissioner
of StudyGeographic Scope
Cross-referenced data sources
16 Virgin PET,
Chemically
recycled PET
Anonymous 2018 Anony-
mous
Anonymous Japan,
Malaysia
17 Virgin PET,
Mechanically
Recycled PET,
Chemically
Recycled PET
GaBi database 2019 India, US,
Europe
Higg MSIv3.0,
Plastic Europe
18 Virgin PET,
Mechanically
Recycled PET
ecoinventv3.6 2019 Europe,
US, Global,
Canada
Plastics
Europe, ELCD
19 Virgin PET Eco-profiles of PET,
MEG, PTA, naphtha
2009-2014 Plastics
Europe
Europe ELCD
20 Virgin PET,
Mechanically
recycled PET
Anonymous 2014 Anony-
mous
Anonymous USA
21 Recycled PET A life cycle
assessment of the
closed-loop recycling
and thermal recovery
of
post-consumer PET
2009 Chilton
et. al

Fashion Industry Charter for Climate Action | Raw Materials Working Group | Fashion Industry Charter for Climate Action | Raw Materials Working Group
Fashion Industry Charter for Climate Action | Raw Materials Working Group | Fashion Industry Charter for Climate Action | Raw Materials Working Group
152
2000 Powell Street, Ste. 600, Emeryville, CA 94608 USA
+1.510.452.8000 main +1.510.452.8001 fax
Global Climate Action
Copyright © 2022 FDOKUMEN