
Residential Cogeneration Systems: A Review of The Current ...
Upload
khangminh22Category
view
0download
0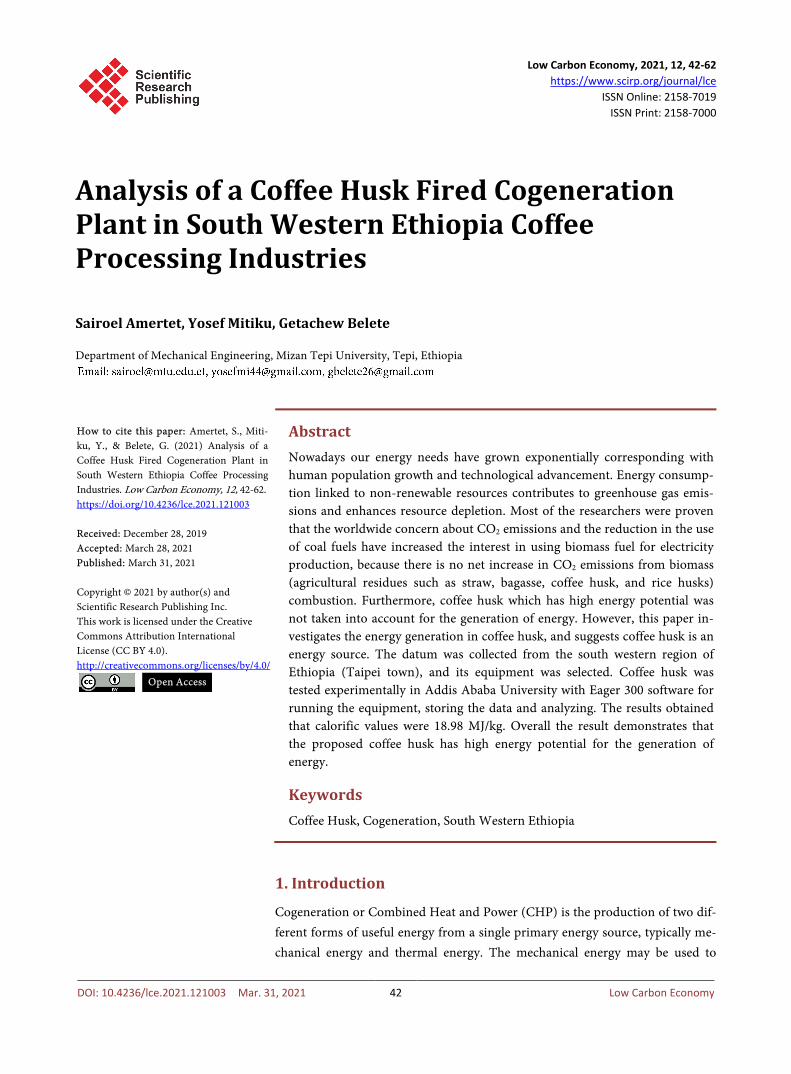
Low Carbon Economy, 2021, 12, 42-62 https://www.scirp.org/journal/lce
ISSN Online: 2158-7019 ISSN Print: 2158-7000
DOI: 10.4236/lce.2021.121003 Mar. 31, 2021 42 Low Carbon Economy
Analysis of a Coffee Husk Fired Cogeneration Plant in South Western Ethiopia Coffee Processing Industries
Sairoel Amertet, Yosef Mitiku, Getachew Belete
Department of Mechanical Engineering, Mizan Tepi University, Tepi, Ethiopia
Abstract Nowadays our energy needs have grown exponentially corresponding with human population growth and technological advancement. Energy consump-tion linked to non-renewable resources contributes to greenhouse gas emis-sions and enhances resource depletion. Most of the researchers were proven that the worldwide concern about CO2 emissions and the reduction in the use of coal fuels have increased the interest in using biomass fuel for electricity production, because there is no net increase in CO2 emissions from biomass (agricultural residues such as straw, bagasse, coffee husk, and rice husks) combustion. Furthermore, coffee husk which has high energy potential was not taken into account for the generation of energy. However, this paper in-vestigates the energy generation in coffee husk, and suggests coffee husk is an energy source. The datum was collected from the south western region of Ethiopia (Taipei town), and its equipment was selected. Coffee husk was tested experimentally in Addis Ababa University with Eager 300 software for running the equipment, storing the data and analyzing. The results obtained that calorific values were 18.98 MJ/kg. Overall the result demonstrates that the proposed coffee husk has high energy potential for the generation of energy.
Keywords Coffee Husk, Cogeneration, South Western Ethiopia
1. Introduction
Cogeneration or Combined Heat and Power (CHP) is the production of two dif-ferent forms of useful energy from a single primary energy source, typically me-chanical energy and thermal energy. The mechanical energy may be used to
How to cite this paper: Amertet, S., Miti-ku, Y., & Belete, G. (2021) Analysis of a Coffee Husk Fired Cogeneration Plant in South Western Ethiopia Coffee Processing Industries. Low Carbon Economy, 12, 42-62. https://doi.org/10.4236/lce.2021.121003 Received: December 28, 2019 Accepted: March 28, 2021 Published: March 31, 2021 Copyright © 2021 by author(s) and Scientific Research Publishing Inc. This work is licensed under the Creative Commons Attribution International License (CC BY 4.0). http://creativecommons.org/licenses/by/4.0/
Open Access

S. Amertet et al.
DOI: 10.4236/lce.2021.121003 43 Low Carbon Economy
drive an alternator for producing electricity or rotate equipment such as motor, compressor, pump or fan for delivering various services. Thermal energy can be used either for direct process applications or for indirectly producing steam, hot water, hot air for the dryer or chilled water for process cooling. According to the Second Law of Thermodynamics, the plant gives back heat to a cold sink before rejecting the remaining heat to the environment at the reference temperature (To). A cogeneration plant system can operate at efficiencies greater than those achieved when heat and power are produced in separate or distinct processes (Wakui & Yokoyama, 2011; Bapat, Kulkarni, & Bhandarkar, 1997; Hall, Rosil-lo-Calle, & Woods, 1991). Cogeneration plant may use different forms of primary energy sources (renewable or non-renewable), among these energy sources bio-mass is the one. It is the third largest renewable primary energy resource in the world, after coal and oil (Werthera, Saengera, Hartgea, Ogadab, & Siagib, 2000). In all its forms, biomass currently provides about 1250 million TOE (Tons of Oil Equivalence) which is about 14% of the world’s annual energy consumption. Bio-mass is a major source of energy in developing countries, where it provides 35% of all the energy requirements (Strehler & Stuetzle, 1987; Gemechu, 2009; Wiersum, Gole, Gatzweiler, Volkmann, Bognetteau, & Wirtu, 2008). The worldwide concern about CO2 emissions and the reduction in the use of coal fuels have increased the interest in using biomass fuel for electricity production, because there is no net in-crease in CO2 emissions from biomass combustion (Pandey, Soccol, Nigan, Brand, Mohan, & Rovossos, 2000). Biomass materials with high energy potential include agricultural residues such as straw, bagasse, coffee husk, rice husks, as well as resi-dues from forest related activities such as wood chips, sawdust, bark and so forth (Murthy & Naidu, 2012; FAU-14, 1986; Franca & Oliveira, 2009).
From the above papers, we can infer that the presented paper considered the generation of energy based on different types of renewable or non-renewable energy sources. The paper’s results were shown good for different types of re-newable or non-renewable energy sources. However, coffee husk which has high energy potential was not taken into account for the generation of energy. In the end the results obtained that calorific values were 18.98 MJ/kg, maximum tem-perature of the furnace attained from the energy balance, based on this value in-side the combustion chamber was 1489˚C, and the amount of air required per kg of coffee husk was 5.45 kg. The remaining part of this paper is organized as fol-lows: Section 2 describes data collection and interpretation of coffee husk. The experimental analysis of coffee husk and its equipment selection is carried out in Section 3. Section 4 presents the result and discussion. The conclusion of the work will be presented in Section 5.
2. Data Collection and Interpretation
From the data shown in Figures 1-3 and Table 1 & Table 2, the average annual collected coffee and provide to the industries will be as follows (World Bank, 1986):

S. Amertet et al.
DOI: 10.4236/lce.2021.121003 44 Low Carbon Economy
( )average annual collected coffee
29039.72 18949.29 24159.79 38641.65 16981.08 29742.31 32037.29 30795.868
220346.99 27543.37 Ton8
+ + + + + + +=
= =
Figure 1. Flowchart of coffee processing.
Figure 2. Coffee collected in dry and wet.

S. Amertet et al.
DOI: 10.4236/lce.2021.121003 45 Low Carbon Economy
Figure 3. Total collected coffee in the Zone.
Table 1. Coffee collected and generated from the factories from 2003-2010 (E.C) [in Ton].
Year Kind 2003 2004 2005 2006 2007 2008 2009 2010
Washed coffee
2225.55 2369.28 1941.09 2870.33 1600.33 2714.56 2649.64 3637.36
Unwashed coffee
5970.74 5100.03 7127.17 10,742.58 6167 8760.59 5728.03 4380.75
Collected wet
11,127.50 11,846.45 9705.45 14,351.65 6401.32 15,978 20,298.09 2340.63
Collected dry
17,912.22 7102.84 14,454.34 24,290 10,579.76 13,764.31 11,739.20 7055.23
Table 2. Total collected coffee in the Zone [in Ton].
Year Kind
2003 2004 2005 2006 2007 2008 2009 2010
Collected Wet coffee
11,127.5 11,846.45 9705.45 14,351.65 6401.32 15,978 20,298.09 23,740.63
Collected dry coffee
17,912.22 7102.84 14,454.34 24,290 10,579.76 13,764.31 11,739.2 7055.23
Total 29,039.72 18,949.29 24,159.79 38,641.65 16,981.08 29,742.31 32,037.29 30,795.86
To know the average coffee husk generated in this region, we face difficult
problems, since there was no information about the coffee husk that generated as waste from the industries. We manually tried to know the amount of husk out of one quintal of dry coffee by measuring each product (pure coffee, husk, outer skin of the coffee and other foreign bodies) of the machine with help expe-rienced worker, dry coffee processing industry for 10 working days.
From Table 3, it is possible to estimate the average amount of coffee husk per 100 Kg (Adams & Dougan, 1987).
( )37 35 42 33 36 34 40 37 31 41 366 36.6 kg10 10
+ + + + + + + + += =

S. Amertet et al.
DOI: 10.4236/lce.2021.121003 46 Low Carbon Economy
Table 3. Estimation of average coffee husk generated from 100 kg of dry coffee.
Weight [kg] Item
Day 1 Day 2 Day 3 Day 4 Day 5 Day 6 Day 7 Day 8 Day 9 Day 10
pure coffee
42 44 39 44 40 40 37 41 45 37
Coffee Husk
37 35 42 33 36 34 40 37 31 41
outer skin
14 12 8 10 15 16 18 15 13 14
Others 7 9 11 13 9 10 5 7 11 8
Therefore, during coffee process ~36.8% will be coffee husk the rest 63.2% will
be pure coffee and other byproducts. So the coffee husk generated from the industries per year will be:
( )27543.37 36.810135.96 Ton Year
100×
=
There are 44 wet and 27 dry coffee processing industries are founded in the region, these dry coffee processing industries use electric power for their respec-tive pulping machines. The power estimations were depicted as in Figures 4-9.
3. Experimental Analysis of Coffee Husk and Its Equipment Selection
The experiments were conducted using the facilities in Addis Ababa University and Geological Survey of Ethiopian using some sample of coffee husks which came from one coffee processing factory available in the region. The proximate and ultimate analyses of the husk were done using standard ex-periodontal pro-cedures. In order to obtain information about the combustion mechanisms of the coffee husks. Proximate analysis is used to characterize the coffee husk in order to measure its moisture, volatile matter, fixed carbon, and ash contents. Ultimate analysis gives the actual chemical composition (usually C, H, N, S and O by difference) (Musebe, Agwenanda, & Mitiku, 2007) (Figure 10).
During sample preparation for the CHNS analysis 5 mg dried and crushed sample is mixed with an oxidizer (vanadium pentoxide [V2O5]) catalyst in a tin capsule, which is then combusted in a furnace temperature of 900˚C and oven temperature of 75˚C with a condition of carried gas flow rate of 120 ml/min, reference flow rate 100 ml/min and oxygen flow rate 250 ml/min. The addition of the V2O5 ensures complete conversion of inorganic sulfur in the sample to sulfur dioxide. Then combustion products CO2, SO2, H2O and NO2 are carried by a constant flow of carrier gas (helium) that passes through a glass column packed with an oxidation catalyst of tungsten trioxide (WO3) and a copper re-ducer both kept at 900˚C. At this temperature, the nitrogen oxide is reduced to N2 and oxidation is completed. The gas mixture N2, CO2, H2O and SO2 are then transported by the helium to chromatography column, where separation takes

S. Amertet et al.
DOI: 10.4236/lce.2021.121003 47 Low Carbon Economy
place. After separation eluted gases are sent to the thermal conductivity detector (TCD) (set at 290˚C.) where electrical signals processed by the Eager 300 soft-ware provide percentages of nitrogen, carbon, hydrogen, and sulfur contained in the sample. Eager 300 software is used for running the equipment, storing the data and analyzing (Kumar, Baah, Pozo, Kufa, Zeleke, & Okwadi, 2002).
Figure 4. Average cost of power for dry processing 1.
Figure 5. Average cost of power for dry processing 2.
Figure 6. Average cost of power for wet processing.

S. Amertet et al.
DOI: 10.4236/lce.2021.121003 48 Low Carbon Economy
Figure 7. Monthly average daily sunshine duration for Tepi.
Figure 8. Monthly average hourly global radiation on the horizontal surface for Tepi town.
Figure 9. Monthly averages of daily global radiation on the horizontal surface for Tepi town.

S. Amertet et al.
DOI: 10.4236/lce.2021.121003 49 Low Carbon Economy
Figure 10. Flash CHNS/O-analyzer.
3.1. For Laboratory Elemental Analysis of the Coffee Husk (CTA, 1999)
100for carbon 100
100for Nitrogen 100
100for Hydrogen 100
d adad
d adad
d adad
C CM
N NM
H HM
= −
= −
= −
where: d = the dry basis; ad = as determined basis; Mad = the moisture content of the general analysis sample when analyzed.
During the calibration process six points for every component are taken and the sample was run in duplicate finally the average values to be taken are as in Table 4.
3.2. For Proximate Analysis of the Coffee Husk
Proximate analysis helps to assess the percentage of volatile matter, fixed carbon, moisture and ash contents. This analysis is very important to study the combus-tion phenomenon of the coffee husk. Therefore, to know the proximate analysis and calorific value of the coffee husk different laboratory equipment is used in Geological Survey of Ethiopian. The experiment is conducted by international standard test method using three main apparatus, these are CARBOLITE fur-nace, Carbolite oven and Adiabatic Calorimeter. 200 GM of coffee husk sample which came from the study area is taken from this analysis (Fan, Soccol, Pandey, & Soccol, 2003) (Figure 11).
The experiment started from the sample preparation room. In this room, giv-ing a code for the sample was the primary task and Y-M-001 was the sample code number. Next, removal of unwanted moisture from the sample is done in a Retsch model RS 200 (Fiori & Florio, 2010). Then grinding of the sample using

S. Amertet et al.
DOI: 10.4236/lce.2021.121003 50 Low Carbon Economy
an electrical milling machine is done. Sieving the crushed sample with the help of 0.60 mesh sieve and packing the prepared sample with plastic sheet was the last work in the sample preparation room. After this the sample is sent to the hydrocarbon laboratory where the analysis of the prepared sample is conducted (Figure 12).
Proximate analysis indicates the behavior of the husk when it is heated. Therefore the following tasks are conducted in the hydrocarbon laboratory.
1) When 1 gram sample of husk is subjected to a temperature of about 110˚C in the oven for a period of 1 hour, the loss in weight of the sample gives the moisture content of the husk.
2) When 1 gram sample of husk is placed in covered crucible and heated to 950˚C inside Carbolite Furnace and maintained at that temperature for about 6 minutes. There is a loss in weight due to the eliminating of moisture and volatile matter. So present of volatile matter is calculated here.
3) When 1 gram sample of husk is placed on uncovering crucible and heated to 750˚C until the husk is completely burned, a constant weight reached, which indicates that there is only ash remaining in the crucible. Complete combustion of husk is determined by repeated weighing of the sample.
4) The amount of fixed carbon is determined as follows, using subtraction of percentage by mass.
Table 4. Laboratory elemental analysis report of coffee husk.
Sample Type C (%) H (%) N (%) S (%) O (%)
Coffee Husk 46.8314 4.8132 0.4454 0.0500 ~47.860
Figure 11. Equipment in sample preparation room.
Figure 12. Equipment used in hydrocarbon laboratory.

S. Amertet et al.
DOI: 10.4236/lce.2021.121003 51 Low Carbon Economy
3.3. Calorific Value Analysis of the Coffee Husk
The calorific value (heat of combustion) of a sample may be broadly defined as the number of heat units liberated by a unit mass of a sample when burned with oxygen in an enclosure of constant volume (Wilen, Stahlberg, Sipila, & Ahokas, 1987; Ogada, 1995; Nussbaumer & Hustad, 1997). In this research to determine the calorific value of the coffee husk, the oxygen bomb adiabatic calorimeter is used, which is the standard instrument for measuring calorific values of solid and liquid combustible samples in Geological Survey of Ethiopian shown in Figure 13.
The amount of heat obtained from the sample was then determined by mul-tiplying the observed temperature rise by a previously determined energy equiv-alent of the calorimeter. Then, by dividing this value by the weight of the sample, we obtain the calorific value (heat of combustion) of the sample on a unit weight basis. Corrections must be applied to adjust these values for any heat transfer occurring in the calorimeter, as well as for any side reactions which are unique to the bomb combustion process in Table 5 which were obtained (Kreith, 2000).
Formulas used for Post processing
( )( )
( )
( ) ( )
The energy equivalent W
Wight of Standard material Heat of combustion of standard materialTemperature rise produced in the test
temperature rise energy equivalentThe gross heat of combustion Hg
weight of
∗=
∗=
the sample
From the results of experiments, it can be concluded that Coffee husk is cha-racterized by low moisture contents. The low moisture content is an important factor in the combustion of coffee husks, since the problems associated with the combustion of high moisture content of fuels are avoided. One such problem is the effect of moisture on the heating values of fuels. It is seen that husk has a
Figure 13. Oxygen bomb adiabatic calorimeter.
Table 5. Laboratory proximate analyses and calorific value report of coffee husk.
Sample Code
Volatile Matters (%)
Fixed carbon in %
Moisture in %
Ash in %
Dry in %
Calorific Value cal/gm
Y-M-001 71.63 16.9 7.92 3.54 0.8 4533.1

S. Amertet et al.
DOI: 10.4236/lce.2021.121003 52 Low Carbon Economy
higher heating value when we compare it with other agricultural residues (Me-nendez, Dominguez, Fernandez, & Pis, 2007). The ash contents of the husk are also low and are within acceptable range. This gives a great advantage during furnace design. Because for the combustion of agricultural residues with high ash contents, such as rice husks, consideration must be given to incorporate an efficient ash removal equipment from the flue gas to eliminate or reduce parti-culate pollution. Due to the low contents of sulfur, SO2 emission problems would not be expected during coffee husks combustion (Wilson, John, Mhilu, Yang, & Blasiak, 2010). The high volatile matter, content indicates easy ignition of fuel, although it has a significant effect on the combustion mechanisms and consequently on the design and operation of the combustion systems for this fuel. The coffee husk is lighter and smaller than wood chips and coals burned. Thus, there may be a tendency of the particles to be carried out of the furnace with the flue gas. Furthermore, without proper design of the furnace, part of the combustible volatile gases may leave the furnace unbound. The bulk density of the coffee husks is low, raising the costs of transportation and storage. Further-more, coffee briquettes are fragile and not suitable for long distance transporta-tion. Coffee husks are therefore more suitable for firing within the production region.
3.4. Combustion Analysis of Coffee Husk
Combustion chamber of boiler is designed to use the chemical energy in the cof-fee husk to raise the energy content of fluid in the steam generators (Boiler), so that it can be used for power and heating applications. During the combustion process, oxygen reacts with carbon, hydrogen, and other elements in the husk to produce a flame and hot combustion gases (Flue gas). As these gases are drawn through the boiler it cools as heat is transferred to the working fluid. Eventually the gases flow through a stack and into the atmosphere. As long as husks and air are both available to continue the combustion process, heat will be generated. The combustion chamber is the most important part of the boiler. It is con-structed of bricks that causes to minimize heat dissipation to the surrounding. It also has no involvement to do any kind of work. In addition, the kinetic and po-tential energies of the fluid streams are usually negligible. Then only total ener-gies of the incoming streams and the outgoing mixture remained same for anal-ysis. The conservation of mass and energy principle requires that these two equal each other that is shown in Figure 14 which was obtained from (Nag, 2008).
Figure 14. Schematic mass and energy balance diagram of combustion chamber (Nag, 2008).

S. Amertet et al.
DOI: 10.4236/lce.2021.121003 53 Low Carbon Economy
Considering the theoretical combustion reaction for the organic component of the husk, such as carbon, hydrogen and sulfur (Raja, Srivastava, & Dwivedi, 2006) for mass of air required. The combustion process is assumed as the ideal case (stoichiometry). So, nitrogen is not considered to react with oxygen during combustion reaction. It limits the intimacy between the fuel molecules and O2. When the fuel composition is known, the carbon balance method is quite accu-rate for mass balance calculation (Werthera, Saengera, Hartgea, Ogadab, & Sia-gib, 2001). In this work, combustion takes place with excess air and when free carbon is not present in the products. The products of combustion are mainly gaseous. When a sample is taken for analysis it is usually cooled down to a tem-perature which is below the saturation temperature of the steam present. The steam content is therefore not included in the analysis, which is then quoted as the analysis of the dry product. Since the products are gaseous, it is usual to quote the analysis by volume. An analysis, which includes the steam in the ex-haust is called a wet analysis (Coskun, Oktay, & Ilten, 2009). To obtain the maximum temperature attained in the furnace, the analysis of heat balance is necessary (Harry, 1998).
3.5. Steam Generators (Boiler) Selection
A steam generator generates steam at the desired rate, at the desired pressure and temperature by burning the coffee husk in its furnace. It is a complex inte-gration of com-buster, economizer, evaporator and super heater. Steam genera-tor is a closed vessel in which the heat produced by the combustion of fuel is transferred to water for its conversion into steam at the desired temperature and pressure. While selecting a boiler the factors should be considered: the working pressure and quality of steam required, which is whether wet or dry or super-heated, Steam generation rate, Floor area available, Accessibility for repair and inspection, Comparative initial cost, Erection facilities, The probable load avail-able, The fuel and water available, Operating and maintenance cost and etc. Heat exchangers (Steam generators) are devices where two moving fluid streams ex-change heat without mixing. A heat exchangers typically involve no work inte-ractions (w = 0) and negligible kinetic and potential energy changes for each fluid streams (Frank, Peter de, Sarah, & Jeremy, 2007). Depending upon whether the pressure of steam is below or above the critical pressure (221.2 bar), steam generators can be either subcritical or supercritical units. The subcritical steam generators are water tube drum type and they usually operate at between 130 and 180 bar steam pressure. Which produce superheated steam at about 540˚C - 560˚C (Rajput, 2008). But here, for this specific case a subcritical steam genera-tor which operates at 10 bar is used, for this, satisfies the main goal of this paper that is developing a CHP steam plant with minimum cost and maximum effi-ciency. The increase in steam pressure is limited by the consideration of me-chanical stresses and the ensuing higher cost of equipment. And the increase in steam temperature is limited by the properties of the construction materials of boiler and turbine. Increasing the steam temperature above 540˚C, increases the
S. Amertet et al.
DOI: 10.4236/lce.2021.121003 54 Low Carbon Economy
metallurgical quality of the nozzle and steam turbine blades by 30%. Very high pressures at the maximum temperature are undesirable because they create ma-terial strength problems (Aljundi, 2009). Heat transfer to water in the steam ge-nerators takes place in the three different regimes (Kenya Planters Cooperation Union (KPCU), 1996). Water is first heated sensibly in the economizer till it be-comes saturated liquid. In the evaporator there is phase change from by absorb-ing the latent heat of vaporization at 10 bar the saturated vapor is farther heated at constant pressure in the superheated (Eastop & McConkey, 1993).
An economizer is a feed water heater which raises the temperature of feed water to about the saturated liquid temperature at the boiler pressure using the flue gases discharged from the boiler. The justifiable cost for an economizer de-pends on the total gain in efficiency (Bbergman, Lavine, Incropera, & Dewitt, 2011). In turn, this depends on the gas temperature out of the boiler and feed water temperature to the boiler. Economizer tubes are commonly 45 - 70 mm in diameter. And also the coils are installed at 45 - 50 mm spacing between them as obtained from Table 6 (Treybal, 1981).
3.6. Selection of Coffee Dryer
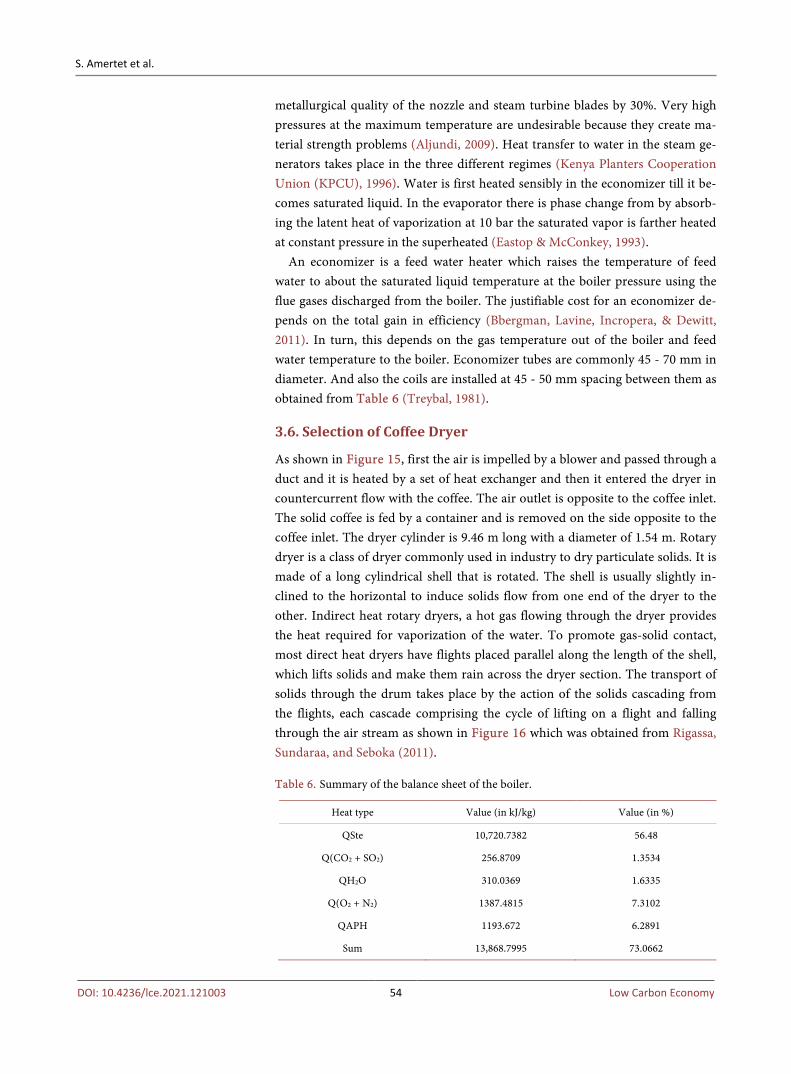
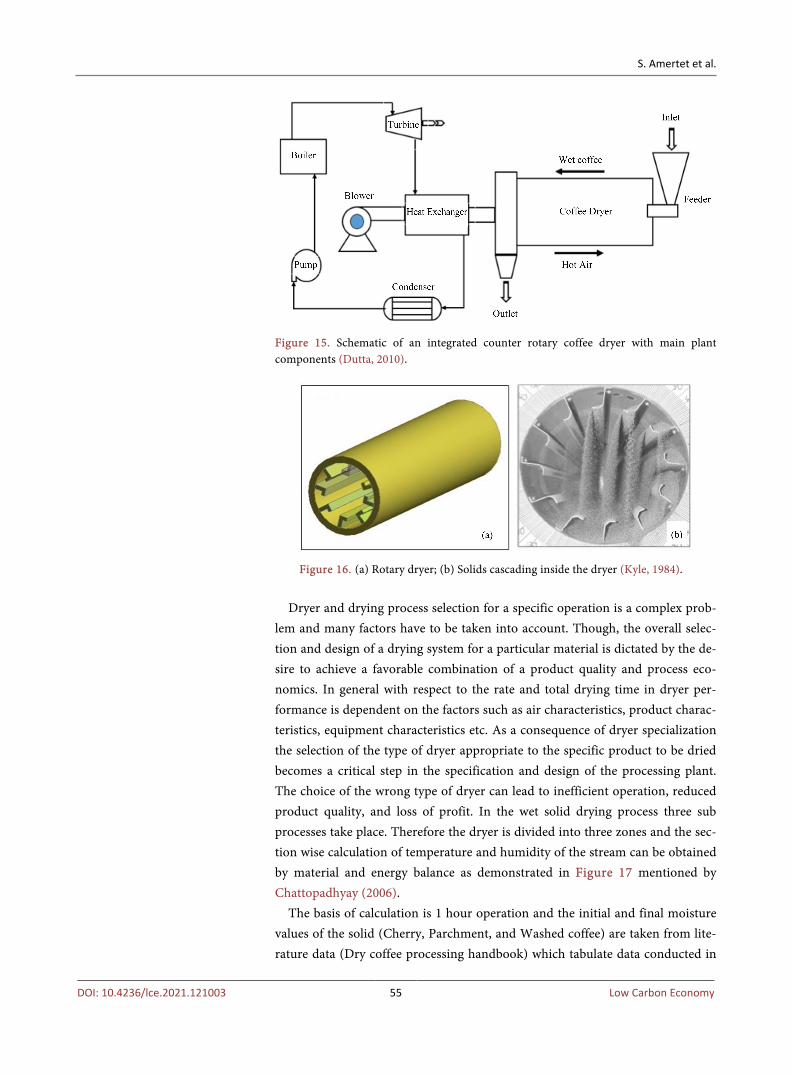
As shown in Figure 15, first the air is impelled by a blower and passed through a duct and it is heated by a set of heat exchanger and then it entered the dryer in countercurrent flow with the coffee. The air outlet is opposite to the coffee inlet. The solid coffee is fed by a container and is removed on the side opposite to the coffee inlet. The dryer cylinder is 9.46 m long with a diameter of 1.54 m. Rotary dryer is a class of dryer commonly used in industry to dry particulate solids. It is made of a long cylindrical shell that is rotated. The shell is usually slightly in-clined to the horizontal to induce solids flow from one end of the dryer to the other. Indirect heat rotary dryers, a hot gas flowing through the dryer provides the heat required for vaporization of the water. To promote gas-solid contact, most direct heat dryers have flights placed parallel along the length of the shell, which lifts solids and make them rain across the dryer section. The transport of solids through the drum takes place by the action of the solids cascading from the flights, each cascade comprising the cycle of lifting on a flight and falling through the air stream as shown in Figure 16 which was obtained from Rigassa, Sundaraa, and Seboka (2011).
Table 6. Summary of the balance sheet of the boiler.
Heat type Value (in kJ/kg) Value (in %)
QSte 10,720.7382 56.48
Q(CO2 + SO2) 256.8709 1.3534
QH2O 310.0369 1.6335
Q(O2 + N2) 1387.4815 7.3102
QAPH 1193.672 6.2891
Sum 13,868.7995 73.0662
S. Amertet et al.
DOI: 10.4236/lce.2021.121003 55 Low Carbon Economy
Figure 15. Schematic of an integrated counter rotary coffee dryer with main plant components (Dutta, 2010).
Figure 16. (a) Rotary dryer; (b) Solids cascading inside the dryer (Kyle, 1984).
Dryer and drying process selection for a specific operation is a complex prob-
lem and many factors have to be taken into account. Though, the overall selec-tion and design of a drying system for a particular material is dictated by the de-sire to achieve a favorable combination of a product quality and process eco-nomics. In general with respect to the rate and total drying time in dryer per-formance is dependent on the factors such as air characteristics, product charac-teristics, equipment characteristics etc. As a consequence of dryer specialization the selection of the type of dryer appropriate to the specific product to be dried becomes a critical step in the specification and design of the processing plant. The choice of the wrong type of dryer can lead to inefficient operation, reduced product quality, and loss of profit. In the wet solid drying process three sub processes take place. Therefore the dryer is divided into three zones and the sec-tion wise calculation of temperature and humidity of the stream can be obtained by material and energy balance as demonstrated in Figure 17 mentioned by Chattopadhyay (2006).
The basis of calculation is 1 hour operation and the initial and final moisture values of the solid (Cherry, Parchment, and Washed coffee) are taken from lite-rature data (Dry coffee processing handbook) which tabulate data conducted in

S. Amertet et al.
DOI: 10.4236/lce.2021.121003 56 Low Carbon Economy
Figure 17. Temperature profile for solid and gas in a counter rotary dryer (Chattopadhyay, 2006).
the laboratory of Panama research (Geankoplis, 1993). In Sheka Zone there are two types of dry coffee processing machineries (local and foreign) with a work-ing capacity of 700 - 1000 and 1200 - 1500 kg/h respectively (Ginzburg & Savina, 1982; Kinch, 1967; Walas, 1990). Since the dryer is the supplier for the processing machineries so, as much as possible, it must be work with the same working capacity of the pulping machine. Therefore, to make the design safe the minimum working capacity 700 kg/h is taken for this work.
3.7. Energy Analysis of the Cogeneration Power Plant
The cogeneration thermal power plant analysis is based on a simple Rankine-cycle, steam generated from saturated liquid water (feed water) is used as the working fluid. The super saturated steam flows through the turbine, where its internal energy is converted into mechanical work to run an electricity generat-ing system. And the steam comes out from the turbine supplies heat to the dry process. Not all the energy from steam can be utilized for running the generating system because of losses due to friction, viscosity, bend on blades, heat losses from boilers i.e. hot flue gas losses, radiation losses and blow down losses etc. (Hewitt & Barbosa, 2008; Kreith, Manglik, & Bohn, 2003). Rankine cycle is the theoretical cycle constructed from four main processes on which the generation steam power plant works. The main processes in the Rankine cycle are:
Process 1-2: Reversible adiabatic expansion in the turbine. Process 2-3 (2’-3’): Constant pressure transfer of heat in the condenser (Dry-
ing processes). Process 3-4: Reversible adiabatic pumping processes in the feed pump. Process 4-1: Constant pressure transfer of heat in the boiler. Then, I am going to analyze energy of the cogeneration plant considering 1 kg
of fluid and applying steady flow energy equation (SFEE) to Steam generators (boiler), Turbine, Condenser and Pump (Figure 18).
The power plant itself consumes a part of the electricity produced. This is due to the various auxiliary equipment required like feed water pumps, circulation pumps and air/flue gas blowers. In forced circulation boilers the share of elec-
S. Amertet et al.
DOI: 10.4236/lce.2021.121003 57 Low Carbon Economy
tricity consumed by the circulation pump is about 0.5% of the electricity pro-duced by the plant. Normally the internal power consumption is about 5% of the electricity produced by the power plant. In this context, since the power used is electrical (and taken from the grid), the internal power consumption share is reduced from the final boiler efficiency in boiler calculations (Rajput, 1990; Sai-dur, Ahamed, & Masjuki, 2010; Duffie & Beckman, 1991; Glikin, 1978).
4. Results and Discussion
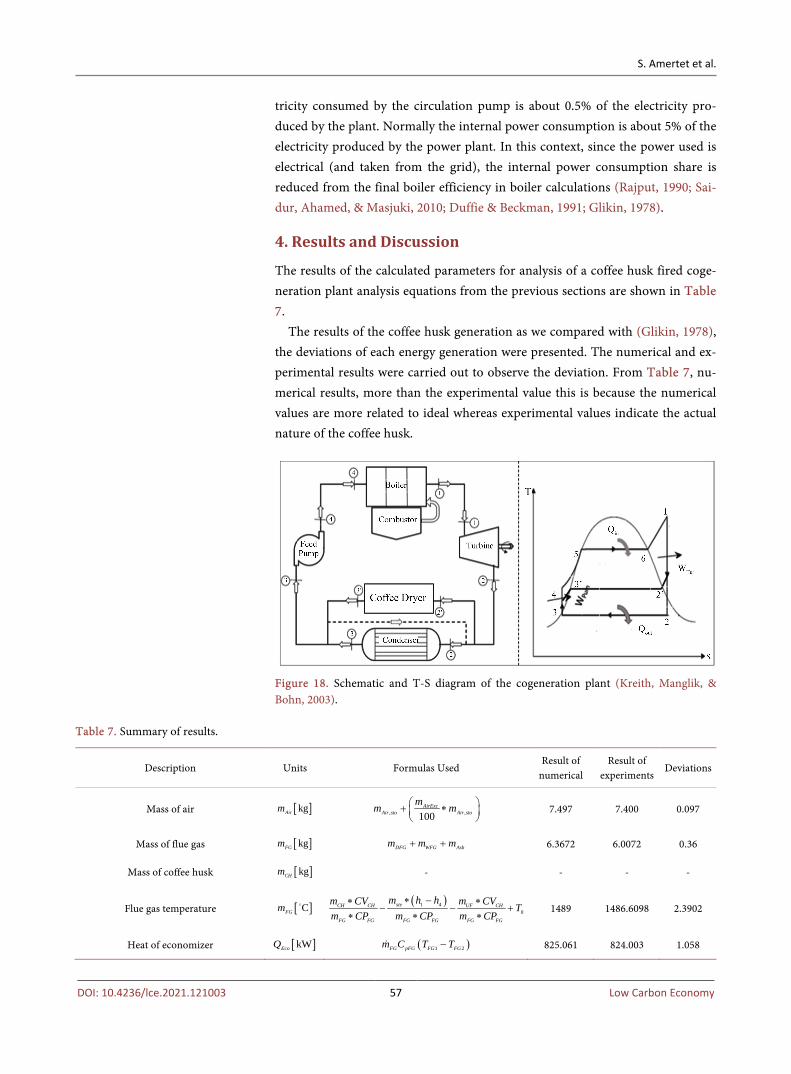
The results of the calculated parameters for analysis of a coffee husk fired coge-neration plant analysis equations from the previous sections are shown in Table 7.
The results of the coffee husk generation as we compared with (Glikin, 1978), the deviations of each energy generation were presented. The numerical and ex-perimental results were carried out to observe the deviation. From Table 7, nu-merical results, more than the experimental value this is because the numerical values are more related to ideal whereas experimental values indicate the actual nature of the coffee husk.
Figure 18. Schematic and T-S diagram of the cogeneration plant (Kreith, Manglik, & Bohn, 2003).
Table 7. Summary of results.
Description Units Formulas Used Result of
numerical Result of
experiments Deviations
Mass of air [ ]kgAirm , ,100AirExc
Air sto Air sto
mm m + ∗
7.497 7.400 0.097
Mass of flue gas [ ]kgFGm DFG WFG Ashm m m+ + 6.3672 6.0072 0.36
Mass of coffee husk [ ]kgCHm - - - -
Flue gas temperature [ ]CFGm ˚ ( )1 40
steCH CH UF CH
FG FG FG FG FG FG
m h hm CV m CV Tm CP m CP m CP
∗ −∗ ∗− − +
∗ ∗ ∗ 1489 1486.6098 2.3902
Heat of economizer [ ]kWEcoQ ( )1 2FG pFG FG FGm C T T−� 825.061 824.003 1.058

S. Amertet et al.
DOI: 10.4236/lce.2021.121003 58 Low Carbon Economy
Continued
Heat transfer surface of the economizer 2msA Eco
c lm
QU F T∗ ∗∆
23.46 22.98 0.48
Total length of tubes of the economizer [ ]mL sAdπ∗
149.377 149.377 0
Heat of evaporator [ ]kWEvaQ st fgm h∗� 8716.2764 8644.76 71.5164
Heat transfer surface of evaporator 2msA minTuN Ch∗ 33.281 30.678 2.603
Total length of evaporator [ ]mL sAdπ∗
211.87 211.87 0
Rate of steam [ ]kg sstm� ( )1 2FG pFG FG FG
fg
m C T Th
−� 0.7701 0.6302 0.1399
Heat rate of super [ ]kWSHQ ( )min 1 2G S tC TF Tε ∗ ∗ − 1179.4 1169.98 9.42
Transfer surface of superheater 142.04 139.86 2.18
Mass of dry cherry [ ]kg hSm� ( )100% %Chem X−� 1350 1290.87 59.13
Moisture in the wet cherry [ ]1 %X 100
IMIM−
2.3333 1.98 0.3533
Moisture in the dry cherry [ ]2 %X 100%
FMFM
0.1111 0.08956 0.02154
Water evaporated [ ]kgm ( )1 2Sm X X−� 3000 2909.89 90.11
Inlet gas thermal energy [ ]2 kJ kgGH ( )2 0 2S G LC T T Y H− + 176.982 170.68 6.302
Rate of mass of gas [ ]kg hGm� ( ) ( )1 2 1 2G Pm Y Y m X X− = −� � 98,684.21 98,590.58 93.63
Heat transfer units in section-III ,TU IIIN 2
,
G GB
m III
T TT−
∆ 0.022 0.002 0.020
heat transfer units in section-II ,TU IIN ,
GB GA
m II
T TT−
∆ 0.2636 0.2333 0.0303
Total transfer units TUN , , ,TU I TU II TU IIIN N N+ + 1.84 1.09 0.75
Diameter of the dryer [ ]mD 0.54 S∗
π 1.54 1.54 0
Length of dryer [ ]mL TU TUN L∗ 9.46 9.46 0
Revolution per min RPM peripheral speed / diameter 4.44 4.44 0
Flue gas loss [ ]%FGL ( ) ( )2 2 2 2 2o o H OL c s L L O N+ + + + 10.297 10.099 0.198
Other losses [ ]%OthW By subtraction 26.9338 25.09778 1.83602
Total heat absorbed in boiler [ ]kJ kginW 1 4h h− 3286.301 3198.898 87.403
Work of feed pump [ ]kJ kgFPW ( )3 5 3V P P− 0.9999 0.9999 0
Work of turbine [ ]kJ kgTUW 1 2h h− 1116.7421 1116.7421 0
Net work [ ]kJ kgnetW TU PUW W− 1115.742 1110.987 4.7551
Net power output [ ]MwOutP ste netm w∗ 11.2 10.97 0.23
Overall CHP plant efficiency [ ]%Overallη net pro
in
W QQ+
84.15 83.957 0.193

S. Amertet et al.
DOI: 10.4236/lce.2021.121003 59 Low Carbon Economy
5. Conclusion
In this work, the coffee husk fired cogeneration plant has been investigated using the designed water tube boiler and rotary type cherry coffee dryer with the se-lected pump and condensate steam turbine components after the detailed analy-sis of the combustion of coffee husk using its chemical properties resulted from the laboratory. The following conclusions have been drawn from the work: Cof-fee husk is characterized by a high content of volatile matter and low contents of fixed carbon and ash. Due to the low contents of sulfur, SO2 emission problems would not be expected during coffee husks combustion. The calorific value of the coffee husk has been carried out in the laboratory. The result was obtained as 18 KJ/kg. With this heating value, maximum temperature of the flue gas was calculated from the heat balance equation in the furnace. Thermal analysis of the coffee husk fired CHP has done with the operating conditions, taken into ac-count, hence, for an efficient use of coffee husk as a fuel for the generation of steam in the boiler, the design calculation dimension results of different compo-nents of the plant should be used. The designed CHP plant configuration and its evaluation based on the identified potential in a coffee processing industry result in 11.2 MW of electrical output from the waste coffee husk. Among this 1.05 MW is used to meet the total demand of the factories, but the rest 10.15 MW is supplied to the national grid of community service. The work also suggested doing a detailed thermodynamic analysis of the plant as it could cover the ther-mal demand of the factories from the combustion of coffee husk which shifts their drying method to the advanced one. Shifting the industries mode from natural drying to thermal drying mode using the steam generated during coge-neration power plant process increases the quality of coffee with a low usage of man power and less drying space besides transfer of technology of waste to energy conversion. The work also enables us to see the power consumed by the coffee processing industries is very small. Therefore, planting a coffee husk fired cogeneration plant in Sheka zone plays a great role in supporting the community and the government beyond covering their power and heat demand.
Conflicts of Interest
The authors declare no conflicts of interest regarding the publication of this pa-per.
References Adams, M. R., & Dougan, J. (1987). Waste Products. In R. J. Clarke, & R. Macrae (Eds.),
Coffee (pp. 257-291). London, New York, NY: Elsevier Applied Science Publishers Ltd.
Aljundi, I. H. (2009). Energy and Exergy Analysis of a Steam Power Plant in Jordan. Ap-plied Thermal Engineering, 29, 324-328. https://doi.org/10.1016/j.applthermaleng.2008.02.029
Bapat, D. W., Kulkarni, S. V., & Bhandarkar, V. P. (1997). Design and Operating Expe-rience on Fluidized Bed Boiler Burning Biomass Fuels with High Alkali Ash. Proceed-ings of the 14th International Conference on Fluidized Bed Combustion, Vancouver,

S. Amertet et al.
DOI: 10.4236/lce.2021.121003 60 Low Carbon Economy
11-14 May 1997, 80-83.
Bbergman, T. L., Lavine, A. S., Incropera, F. P., & Dewitt, D. P. (2011). Fundamentals of Heat and Mass Transfer (7th ed., pp. 40-45). Hoboken, NJ: John Wiley & Sons.
Chattopadhyay, P. (2006). Boiler Operation Engineering. New Delhi: Tata McGraw-Hill.
Coskun, C., Oktay, Z., & Ilten, N. (2009). A New Approach for Simplifying the Calcula-tion of Flue Gas Specific Heat and Specific Exergy Value Depending on Fuel Composi-tion. Energy, 34, 1898-1902. https://doi.org/10.1016/j.energy.2009.07.040
CTA (Coffee and Tea Development Authority) (1999). Ethiopia Cradle of the Wonder-bean Coffee Arabica (Abissinica). Addis Ababa: Coffee and Tea Development Author-ity.
Duffie, J. A., & Beckman, W. A. (1991). Solar Engineering of Thermal Processes (2nd ed.). New York, NY: John Wiley and Sons.
Dutta, B. K. (2010). Principles of Mass Transfer and Separation Processes. New Delhi: PHI Learning Pvt. Ltd.
Eastop, T. D., & McConkey, A. (1993). Applied Thermodynamics and Engineering (5th ed.). London: Pearson Education Ltd.
Fan, L., Soccol, A. T., Pandey, A., & Soccol, C. R. (2003). Cultivation of Pleurotus Mu-shrooms on Brazilian Coffee Husk and Effects of Caffeine and Tannic Acid. Micologia Aplicada International, 15, 15-21.
Fiori, L., & Florio, L. (2010). Gasification and Combustion of Grape Marc: Comparison among Different Scenarios. Waste Biomass Valorization, 1, 191-200. https://doi.org/10.1007/s12649-010-9025-7
Franca, A. S., & Oliveira, L. S. (2009). Coffee Processing Solid Wastes: Current Uses and Future Perspectives. In G. S. Ashworth, & P. Azevedo (Eds.), Agricultural Wastes (pp. 90-96). New York, NY: Nova Publishers.
Frank, R. C., Peter de, G., Sarah, L. H., & Jeremy, W. (2007). The Biomass Assessment Handbook. Padstow: T. J. International.
Geankoplis, C. J. (1993). Transport Processes and Unit Operations (3rd ed.). Upper Sad-dle River, NJ: Prentice Hall.
Gemechu, B. (2009). Efforts at Promoting, Branding Ethiopia’s Coffee. The Ethiopian Herald, 19 May 2009.
Ginzburg, A. S., & Savina, I. M. (1982). Mass Transfer Characteristics of Food Products. Moscow: LiPP. (In Russian)
Glikin, P. G. (1978). Transport of Solids through Flighted Rotation Drums. Transactions of the Institution of Chemical Engineers, 56, 120-126.
Hall, D. O., Rosillo-Calle, F., & Woods, J. (1991). Biomass and Its Importance in Balanc-ing CO2 Budgets. In G. Grassi, A. Collina, & H. Zibetta (Eds.), Biomass for Energy, In-dustry and Environment (pp. 89-96). London: Elsevier Science.
Harry, M. F. (1998). Standard Handbook of Hazardous Waste Treatment and Disposal. New York, NY: McGraw Hall.
Hewitt, G. F., & Barbosa, J. (2008). APV Dryer Handbook. Crawley: Invensys APV Tech-nical Centre.
Kenya Planters Cooperation Union (KPCU) (1996). Company Information Booklet. Nairobi: Factory Data.
Kinch (1967). Dry Coffee Processing Handbook (3rd ed.). Houston, TX: Gulf Publishing Company.
Kreith, F. (2000). The CRC Handbook of Thermal Engineering. Boca Raton, FL: CRC

S. Amertet et al.
DOI: 10.4236/lce.2021.121003 61 Low Carbon Economy
Press. https://doi.org/10.1201/9781420050424
Kreith, F., Manglik, R.M., & Bohn, M.S. (2003). Principle of Heat Transfer (7th ed.). New York, NY: Nelson Education.
Kumar, S., Baah, F., Pozo, E. A., Kufa, T., Zeleke, A., & Okwadi, J. (2002). Research and Development Options for Enhancing Income and Sustainability of Farming Systems in Kafa-Sheka Zone of Ethiopia. 17th Symposium of International Centre for Develop-ment Oriented Research in Agriculture, Florida, 17-20 November 2002, 45-50.
Kyle, B. G. (1984). Chemical and Process Thermodynamics. Englewood Cliffs, NJ: Pren-tice Hall.
Menendez, J. A., Dominguez, A., Fernandez, Y., & Pis, J. J. (2007). Evidence of Self-Gasification during the Microwave-Induced Pyrolysis of Coffee Hulls. Energy Fu-els, 21, 373-378. https://doi.org/10.1021/ef060331i
Murthy, P. S., & Naidu, M. (2012). Sustainable Management of Coffee Industry Bypro-ducts and Value Addition: A Review. Resources, Conservation & Recycling, 66, 45-58. https://doi.org/10.1016/j.resconrec.2012.06.005
Musebe, R., Agwenanda, C., & Mitiku, M. (2007). Primary Coffee Processing in Ethiopia: Patterns, Constraints and Determinants. African Crop Science Conference Proceed-ings, 8, 1417-1421.
Nag, P. K. (2008). Power Plant Engineering (3rd ed.). New York, NY: Tata McGraw-Hill Publishing Company Limited.
Nussbaumer, T., & Hustad, J. E. (1997). Overview of Biomass Combustion. In A. V. Bridgwater, & D. G. B. Boocock (Eds.), Developments in Thermochemical Biomass Conversion (pp. 1229-1246). London: Chapman and Hall.
Ogada, T. (1995). Combustion and Emission Characteristics of Wet Sewage Sludge in a Bubbling Fluidised Bed Combustor. PhD Thesis, Hamburg: Technical University Hamburg.
Pandey, A., Soccol, C. R., Nigan, P., Brand, D., Mohan, F., & Rovossos, S. (2000). Bio-technological Potential of Coffee Pulp and Husk for Bio-Process. Biochemical Engi-neering Journal, 6, 153-162. https://doi.org/10.1016/S1369-703X(00)00084-X
Raja, A. K., Srivastava, A. P., & Dwivedi, M. (2006). Power Plant Engineering. New Delhi: New Age International.
Rajput, R. K. (2008). Thermal Engineering. New Delhi: Laxmi.
Rajput, R.K. (1990). Engineering Thermodynamics (3rd ed.). New Delhi: Laxmi Publica-tions (P) Ltd.
Rigassa, N., Sundaraa, R. D., & Seboka, B. B. (2011). Challenges and Opportunities in Municipal Solid Waste Management: The Case of Addis Ababa City, Central Ethiopia. Journal of Human Ecology, 33, 179-190. https://doi.org/10.1080/09709274.2011.11906358
Saidur, R., Ahamed, J. U., & Masjuki, H. H. (2010). Energy, Exergy and Economic Analy-sis of Industrial Boilers. Energy Policy, 38, 2188-2197. https://doi.org/10.1016/j.enpol.2009.11.087
Strehler, A., & Stuetzle, W. (1987). Biomass Residues. In D. O. Hall (Ed.), Biomass (pp. 75-97). New York, NY: Wiley.
Treybal, R. E. (1981). Mass Transfer Operations (International ed.). Singapore: McGraw-Hill Book Company.
UNDP (United Nations Development Programme)/World Bank Energy Sector Manage-ment Assistance Programme (ESMAP) (1986). Agricultural Residue Briquetting Pilot

S. Amertet et al.
DOI: 10.4236/lce.2021.121003 62 Low Carbon Economy
Projects for Substitute Household and Industrial Fuels. Vol. 1, Technical Report, May-nard, MA: Digital Equipment Corporation.
Wakui, T., & Yokoyama, R. (2011). Optimal Sizing of Residential Gas Engine Cogenera-tion System for Power Interchange Operation from Energy Saving Viewpoint. Energy, 36, 3816-3824. https://doi.org/10.1016/j.energy.2010.09.025
Walas, S. M. (1990). Chemical Process Equipment: Selection and Design. Oxford: But-terworth Heinemann.
Werthera, J., Saengera, M., Hartgea, E., Ogadab, T., & Siagib, Z. (2000). Combustion of Agricultural Residues. Progress in Energy and Combustion Science, 26, 1-27. https://doi.org/10.1016/S0360-1285(99)00005-2
Werthera, J., Saengera, M., Hartgea, E., Ogadab, T., & Siagib, Z. (2001). Combustion of Coffee Husks. Renewable Energy, 23, 103-121. https://doi.org/10.1016/S0960-1481(00)00106-3
Wiersum, K. F., Gole, T. W., Gatzweiler, F., Volkmann, J., Bognetteau, E., & Wirtu, O. (2008). Certification of Wild Coffee in Ethiopia: Experiences and Challenges. Forest, Trees Livelihoods, 18, 9-21. https://doi.org/10.1080/14728028.2008.9752614
Wilen, C., Stahlberg, P., Sipila, K., & Ahokas, J. (1987). Pelletization and Combustion of Straw. In D. L. Klass (Ed.), Energy from Biomass and Wastes (pp. 469-483). London, New York, NY: Elsevier Applied Science Publishers Ltd.
Wilson, L., John, G. R., Mhilu, C. F., Yang, W., & Blasiak, W. (2010). Coffee Husks Gasi-fication Using High Temperature Air/Steam Agent. Fuel Processing Technology, 91, 1330-1337. https://doi.org/10.1016/j.fuproc.2010.05.003
World Bank (1986). Agro-Industry Proffles: FAU-14 Coffee. Sectoral Library Interna-tional Bank for Reconstruction and Development. Washington DC: World Bank.
Copyright © 2022 FDOKUMEN