monte carlo simulation of pulverized coal-fired power plants ...
164
MONTE CARLO SIMULATION OF PULVERIZED COAL-FIRED POWER PLANTS: EFFICIENCY IMPROVEMENT AND CO2 CAPTURE OPTIONS A Thesis Submitted to the Faculty of Graduate Studies and Research In Partial Fulfillment of the Requirements for the Degree of Master of Applied Science in Industrial Systems Engineering University of Regina by Teerawat Sanpasertparnich Regina, Saskatchewan November, 2007 Copyright© 2007: T. Sanpasertparnich Reproduced with permission of the copyright owner. Further reproduction prohibited without permission. MONTE CARLO SIMULATION OF PULVERIZED COAL-FIRED POWER PLANTS: EFFICIENCY IMPROVEMENT AND C 02 CAPTURE OPTIONS A Thesis Submitted to the Faculty of Graduate Studies and Research In Partial Fulfillment of the Requirements for the Degree of Master of Applied Science in Industrial Systems Engineering University of Regina by Teerawat Sanpasertpamich Regina, Saskatchewan November, 2007 Copyright© 2007: T. Sanpasertpamich Reproduced with permission of the copyright owner. Further reproduction prohibited without permission.
-
Upload
khangminh22 -
Category
Documents
-
view
2 -
download
0
Transcript of monte carlo simulation of pulverized coal-fired power plants ...

MONTE CARLO SIMULATION OF PULVERIZED COAL-FIRED POWER PLANTS:
EFFICIENCY IMPROVEMENT AND CO2 CAPTURE OPTIONS
A Thesis
Submitted to the Faculty of Graduate Studies and Research
In Partial Fulfillment of the Requirements
for the Degree of
Master of Applied Science
in Industrial Systems Engineering
University of Regina
by
Teerawat Sanpasertparnich
Regina, Saskatchewan
November, 2007
Copyright© 2007: T. Sanpasertparnich
Reproduced with permission of the copyright owner. Further reproduction prohibited without permission.
MONTE CARLO SIMULATION OF PULVERIZED COAL-FIRED POWER PLANTS:
EFFICIENCY IMPROVEMENT AND C 0 2 CAPTURE OPTIONS
A Thesis
Submitted to the Faculty o f Graduate Studies and Research
In Partial Fulfillment o f the Requirements
for the Degree o f
Master o f Applied Science
in Industrial Systems Engineering
University o f Regina
by
Teerawat Sanpasertpamich
Regina, Saskatchewan
November, 2007
Copyright© 2007: T. Sanpasertpamich
Reproduced with permission of the copyright owner. Further reproduction prohibited without permission.

1+1 Library and Archives Canada
Bibliotheque et Archives Canada
Published Heritage Branch
395 Wellington Street Ottawa ON K1AON4 Canada
Direction du Patrimoine de redition
395, rue Wellington Ottawa ON K1AON4 Canada
NOTICE: The author has granted a non-exclusive license allowing Library and Archives Canada to reproduce, publish, archive, preserve, conserve, communicate to the public by telecommunication or on the Internet, loan, distribute and sell theses worldwide, for commercial or non-commercial purposes, in microform, paper, electronic and/or any other formats.
The author retains copyright ownership and moral rights in this thesis. Neither the thesis nor substantial extracts from it may be printed or otherwise reproduced without the author's permission.
Your file Votre reference ISBN: 978-0-494-42361-5 Our file Notre reference ISBN: 978-0-494-42361-5
AVIS: L'auteur a accorde une licence non exclusive permettant a la Bibliotheque et Archives Canada de reproduire, publier, archiver, sauvegarder, conserver, transmettre au public par telecommunication ou par ('Internet, preter, distribuer et vendre des theses partout dans le monde, a des fins commerciales ou autres, sur support microforme, papier, electronique et/ou autres formats.
L'auteur conserve la propriete du droit d'auteur et des droits moraux qui protege cette these. Ni la these ni des extraits substantiels de celle-ci ne doivent etre imprimes ou autrement reproduits sans son autorisation.
In compliance with the Canadian Privacy Act some supporting forms may have been removed from this thesis.
While these forms may be included in the document page count, their removal does not represent any loss of content from the thesis.
1*1
Canada
Conformement a la loi canadienne sur la protection de la vie privee, quelques formulaires secondaires ont Ote enleves de cette these.
Bien que ces formulaires aient inclus dans la pagination, it n'y aura aucun contenu manquant.
Reproduced with permission of the copyright owner. Further reproduction prohibited without permission.
1*1 Library and Archives Canada
Published Heritage Branch
395 Wellington Street Ottawa ON K1A0N4 Canada
Bibliotheque et Archives Canada
Direction du Patrimoine de I'edition
395, rue Wellington Ottawa ON K1A0N4 Canada
Your file Votre reference ISBN: 978-0-494-42361-5 Our file Notre reference ISBN: 978-0-494-42361-5
NOTICE:The author has granted a nonexclusive license allowing Library and Archives Canada to reproduce, publish, archive, preserve, conserve, communicate to the public by telecommunication or on the Internet, loan, distribute and sell theses worldwide, for commercial or noncommercial purposes, in microform, paper, electronic and/or any other formats.
AVIS:L'auteur a accorde une licence non exclusive permettant a la Bibliotheque et Archives Canada de reproduire, publier, archiver, sauvegarder, conserver, transmettre au public par telecommunication ou par Nntemet, preter, distribuer et vendre des theses partout dans le monde, a des fins commerciales ou autres, sur support microforme, papier, electronique et/ou autres formats.
The author retains copyright ownership and moral rights in this thesis. Neither the thesis nor substantial extracts from it may be printed or otherwise reproduced without the author's permission.
L'auteur conserve la propriete du droit d'auteur et des droits moraux qui protege cette these.Ni la these ni des extraits substantiels de celle-ci ne doivent etre imprimes ou autrement reproduits sans son autorisation.
In compliance with the Canadian Privacy Act some supporting forms may have been removed from this thesis.
While these forms may be included in the document page count, their removal does not represent any loss of content from the thesis.
Conformement a la loi canadienne sur la protection de la vie privee, quelques formulaires secondaires ont ete enleves de cette these.
Bien que ces formulaires aient inclus dans la pagination, il n'y aura aucun contenu manquant.
i * i
CanadaReproduced with permission of the copyright owner. Further reproduction prohibited without permission.

UNIVERSITY OF REGINA
FACULTY OF GRADUATE STUDIES AND RESEARCH
SUPERVISORY AND EXAMINING COMMITTEE
Teerawat Sanpasertparnich, candidate for the degree of Master of Applied Science in Industrial Systems Engineering, has presented a thesis titled Monte Carlo Simulation of Pulverized Coal-Fired Power Plants: Efficiency Improvement and CO2 Capture Options, in an oral examination held on November 6, 2007. The following committee members have found the thesis acceptable in form and content, and that the candidate demonstrated satisfactory knowledge of the subject material.
External Examiner: Dr. G. Zhao, Faculty of Engineering, PSE
Supervisor: Dr. A. Aroonwilas, Faculty of Engineering, ISE
Committee Member: Dr. P. Gu, Faculty of Engineering, PSE
Committee Member: Dr. D. de Montigny, Faculty of Engineering, EVSE
Chair of Defense: Dr. A. Wee, Department of Chemistry and Biochemistry
Reproduced with permission of the copyright owner. Further reproduction prohibited without permission.
UNIVERSITY OF REGINA
FACULTY OF GRADUATE STUDIES AND RESEARCH
SUPERVISORY AND EXAMINING COMMITTEE
Teerawat Sanpasertpamich, candidate for the degree of Master of Applied Science in Industrial Systems Engineering, has presented a thesis titled Monte Carlo Simulation of Pulverized Coal-Fired Power Plants: Efficiency Improvement and C02 Capture Options, in an oral examination held on November 6, 2007. The following committee members have found the thesis acceptable in form and content, and that the candidate demonstrated satisfactory knowledge of the subject material.
External Examiner: Dr. G. Zhao, Faculty of Engineering, PSE
Supervisor: Dr. A. Aroonwilas, Faculty of Engineering, ISE
Committee Member: Dr. P. Gu, Faculty of Engineering, PSE
Committee Member: Dr. D. de Montigny, Faculty of Engineering, EVSE
Chair of Defense: Dr. A. Wee, Department of Chemistry and Biochemistry
Reproduced with permission of the copyright owner. Further reproduction prohibited without permission.

Abstract
This study investigated the effects of operating and design parameters of coal-
fired power plants on net efficiency of power generation as well as a rate of CO2
emission. The key parameters were identified and used to determine optimal design and
operating conditions that would offer the maximum power plant efficiency. The
investigation focused on both subcritical and supercritical pulverized coal-fired power
plants. The study also examined how the net efficiency of the power plants responds to
changes in performance of an integrated CO2 capture unit, thus helping identify the
optimal capture target providing the least energy penalty per unit of the CO2 captured.
This study was carried out by first developing a process-based computer model of the
pulverized coal-fired power plants that were built on the principles of coal combustion,
combustion chemistry, heat transfer from a combustion zone, combined material and
energy balances and thermodynamics of a steam power cycle. Simulation of the
developed model was then performed for a sensitivity analysis using rank correlation
coefficient and Monte Carlo simulation approaches in order to arrive at the optimal
operating and design conditions.
It was found from the study that the major influential parameters were moisture
content in coal, steam pressures throughout a turbine system, boiler efficiency,
temperature of preheated air, and temperatures of both main steam and reheated steam.
The obtained parametric effects were quantified and translated into a series of empirical
correlations of the net efficiency that could be readily utilized by power industries and
engineers. Besides the net efficiency, the magnitude of the energy penalty due to the CO2
Reproduced with permission of the copyright owner. Further reproduction prohibited without permission.
Abstract
This study investigated the effects o f operating and design parameters o f coal-
fired power plants on net efficiency o f power generation as well as a rate o f CO2
emission. The key parameters were identified and used to determine optimal design and
operating conditions that would offer the maximum power plant efficiency. The
investigation focused on both subcritical and supercritical pulverized coal-fired power
plants. The study also examined how the net efficiency o f the power plants responds to
changes in performance o f an integrated CO2 capture unit, thus helping identify the
optimal capture target providing the least energy penalty per unit o f the CO2 captured.
This study was carried out by first developing a process-based computer model o f the
pulverized coal-fired power plants that were built on the principles o f coal combustion,
combustion chemistry, heat transfer from a combustion zone, combined material and
energy balances and thermodynamics o f a steam power cycle. Simulation o f the
developed model was then performed for a sensitivity analysis using rank correlation
coefficient and Monte Carlo simulation approaches in order to arrive at the optimal
operating and design conditions.
It was found from the study that the major influential parameters were moisture
content in coal, steam pressures throughout a turbine system, boiler efficiency,
temperature o f preheated air, and temperatures o f both main steam and reheated steam.
The obtained parametric effects were quantified and translated into a series o f empirical
correlations o f the net efficiency that could be readily utilized by power industries and
engineers. Besides the net efficiency, the magnitude o f the energy penalty due to the CO2
i
Reproduced with permission of the copyright owner. Further reproduction prohibited without permission.

capture integration was evaluated and also the optimal level of the CO2 capture target was
identified. The sensitivity analysis for cost of electricity was also performed in this study
based on different scenarios, i.e., base subcritical pulverized coal-fired power plant
without the CO2 capture, subcritical pulverized coal-fired power plant with the CO2
capture using alkanolamine solvent, base supercritical pulverized coal-fired power plant
without the CO2 capture, and supercritical pulverized coal-fired power plant with the CO2
capture using alkanolamine solvent.
ii
Reproduced with permission of the copyright owner. Further reproduction prohibited without permission.
capture integration was evaluated and also the optimal level o f the CO2 capture target was
identified. The sensitivity analysis for cost o f electricity was also performed in this study
based on different scenarios, i.e., base subcritical pulverized coal-fired power plant
without the CO2 capture, subcritical pulverized coal-fired power plant with the CO2
capture using alkanolamine solvent, base supercritical pulverized coal-fired power plant
without the CO2 capture, and supercritical pulverized coal-fired power plant with the CO2
capture using alkanolamine solvent.
ii
Reproduced with permission of the copyright owner. Further reproduction prohibited without permission.

Acknowledgement
I would like to sincerely acknowledge Dr. Adisorn Aroonwilas, my supervisor,
and Dr. Amornvadee Veawab for their constructive guidance, valuable time and effort
throughout my whole thesis. Their willingness to mentor is greatly appreciated.
I wish to express my gratitude to Dr. Nader Mahinpey and Dr. Amr Henni for
superior classes. They instructed me on how to create mathematical modeling. I was
able to perform my research without relying on commercial chemical process simulators.
I have enjoyed my time at the University of Regina since I joined the International Test
Centre for CO2 Capture (ITC) and the Toastmasters International club.
I am grateful to my advisory committee, Dr. Peter Gu and Dr. David deMontigny,
for their valuable questions and recommendations that were helpful in improving my
thesis.
Importantly, I would like to recognize the Natural Sciences and Engineering
Research Council of Canada (NSERC), the Faculty of Graduate Studies and Research
(FGSR), and the Faculty of Engineering for their financial support.
iii
Reproduced with permission of the copyright owner. Further reproduction prohibited without permission.
Acknowledgement
I would like to sincerely acknowledge Dr. Adisom Aroonwilas, my supervisor,
and Dr. Amomvadee Veawab for their constructive guidance, valuable time and effort
throughout my whole thesis. Their willingness to mentor is greatly appreciated.
I wish to express my gratitude to Dr. Nader Mahinpey and Dr. Amr Henni for
superior classes. They instructed me on how to create mathematical modeling. I was
able to perform my research without relying on commercial chemical process simulators.
I have enjoyed my time at the University o f Regina since I joined the International Test
Centre for CO2 Capture (ITC) and the Toastmasters International club.
I am grateful to my advisory committee, Dr. Peter Gu and Dr. David deMontigny,
for their valuable questions and recommendations that were helpful in improving my
thesis.
Importantly, I would like to recognize the Natural Sciences and Engineering
Research Council o f Canada (NSERC), the Faculty o f Graduate Studies and Research
(FGSR), and the Faculty o f Engineering for their financial support.
iii
Reproduced with permission of the copyright owner. Further reproduction prohibited without permission.

Dedication
I would like to state that this thesis is dedicated to my parents and my sisters for
their encouragement, especially to my dad. Although he was physically unhealthy, he had
never given me a notice about his painful illness when I was studying here in Canada.
Finally, I would like to thank Bhurisa Thitakamol, my greatest partner, for her brilliantly
technical advice through my thesis from the beginning to the end.
iv
Reproduced with permission of the copyright owner. Further reproduction prohibited without permission.

Table of Contents
page
Abstract
Acknowledgement iii
Dedication iv
Table of Contents
List of Tables viii
List of Figures
Acronym and Abbreviation xiii
Nomenclature xv
Chapter One: Introduction 1
1.1 Electricity Generation by Coal 1
1.2 Coal-Fired Power Plants and the Environment 3
1.3 GHG Mitigation Strategies for Coal-Fired Power Plants 6
1.3.1 Improvement in Net Efficiency 7
1.3.2 CO2 Capture Technologies 12
1.4 Research Objectives 14
Chapter Two: Literature Review and Fundamental 16
2.1 Development of Combustion Process 16
2.2 Chemistry of Coal Combustion 17
2.3 Heat of Combustion 18
2.4 Steam Power Cycle 19
Reproduced with permission of the copyright owner. Further reproduction prohibited without permission.
Table of Contents
page
Abstract i
Acknowledgement iii
Dedication iv
Table of Contents v
List of Tables viii
List of Figures x
Acronym and Abbreviation xiii
Nomenclature xv
Chapter One: Introduction 1
1.1 Electricity Generation by Coal 1
1.2 Coal-Fired Power Plants and the Environment 3
1.3 GHG Mitigation Strategies for Coal-Fired Power Plants 6
1.3.1 Improvement in Net Efficiency 7
1.3.2 CO2 Capture Technologies 12
1.4 Research Objectives 14
Chapter Two: Literature Review and Fundamental 16
2.1 Development o f Combustion Process 16
2.2 Chemistry o f Coal Combustion 17
2.3 Heat o f Combustion 18
2.4 Steam Power Cycle 19
v
Reproduced with permission of the copyright owner. Further reproduction prohibited without permission.

2.5 Design and Operation of Pulverized Coal-Fired Power Plants
2.6 CO2 Capture from Coal-Fired Flue Gas
Chapter Three: Development of Coal-Fired Power Plant Model
22
27
30
3.1 Model Development 30
3.1.1 Furnace 31
3.1.2 Once-through Boiler 32
3.1.3 Turbines and Pumps 32
3.1.4 Feedwater Heaters 33
3.2 Model Validation 38
3.3 Sensitivity Analysis and Performance Optimization 38
3.3.1 Monte Carlo Simulation 40
3.3.2 Rank Correlation Coefficient 43
3.3.3 Ranges of Input Parameters 45
Chapter Four: Results and Discussions: Subcritical Coal-Fired Power Plant 52
4.1 Maximum-Minimum Ranges of Plant Performance 52
4.2 Sensitivity Analysis 54
4.3 Individual Effects of Process Parameters on Plant Performance 57
4.3.1 Effect of Moisture Content in Coal 58
4.3.2 Effect of Preheated Air Temperature 58
4.3.3 Effects of Main Steam Temperature and Reheating Temperature 60
4.3.4 Effects of Boiler and Turbine Efficiencies 62
4.3.5 Effect of Excess Air Supply 62
4.3.6 Effect of Pressure Drop across the Steam Cycle 65
4.3.7 Effects of Pressure and Pressure Distribution in the Turbine Series 65
4.4 Efficiency Correlations for Subcritical Pulverized Coal-fired Power Plant 71
4.5 Optimum Operating Conditions 78
4.6 Efficiency Drop due to CO2 Capture 81
4.6.1 Application of CO2 Capture Process 81
4.6.2 Effect of CO2 Removal Efficiency 83
vi
Reproduced with permission of the copyright owner. Further reproduction prohibited without permission.
2.5 Design and Operation o f Pulverized Coal-Fired Power Plants 22
2.6 CO2 Capture from Coal-Fired Flue Gas 27
Chapter Three: Development of Coal-Fired Power Plant Model 30
3.1 Model Development 30
3.1.1 Furnace 31
3.1.2 Once-through Boiler 32
3.1.3 Turbines and Pumps 32
3.1.4 Feedwater Heaters 33
3.2 Model Validation 38
3.3 S ensitivity Analysis and Performance Optimization 3 8
3.3.1 Monte Carlo Simulation 40
3.3.2 Rank Correlation Coefficient 43
3.3.3 Ranges o f Input Parameters 45
Chapter Four: Results and Discussions: Subcritical Coal-Fired Power Plant 52
4.1 Maximum-Minimum Ranges o f Plant Performance 52
4.2 Sensitivity Analysis 54
4.3 Individual Effects o f Process Parameters on Plant Performance 57
4.3.1 Effect o f Moisture Content in Coal 58
4.3.2 Effect o f Preheated Air Temperature 58
4.3.3 Effects of Main Steam Temperature and Reheating Temperature 60
4.3.4 Effects of Boiler and Turbine Efficiencies 62
4.3.5 Effect o f Excess Air Supply 62
4.3.6 Effect o f Pressure Drop across the Steam Cycle 65
4.3.7 Effects o f Pressure and Pressure Distribution in the Turbine Series 65
4.4 Efficiency Correlations for Subcritical Pulverized Coal-fired Power Plant 71
4.5 Optimum Operating Conditions 78
4.6 Efficiency Drop due to CO2 Capture 81
4.6.1 Application of CO2 Capture Process 81
4.6.2 Effect o f CO2 Removal Efficiency 83
vi
Reproduced with permission of the copyright owner. Further reproduction prohibited without permission.

Chapter Five: Results and Discussions: Supercritical Coal-Fired Power Plant 87
5.1 Individual Parametric Effects 90
5.2 Efficiency Correlations for Supercritical Pulverized Coal-fired Power Plant99
5.3 Optimum Operating Conditions 104
5.4 Efficiency Drop due to CO2 Capture 107
Chapter Six: Economic Assessment 112
6.1 Economic Basis 112
6.1.1 Allowance for Funds Used during Construction 113
6.1.2 Levelized Fixed Charge Rate of Capital Cost 114
6.1.3 Levelized Operating Cost 116
6.1.4 Present Worth Cost 116
6.2 Cost of Electricity of Pulverized Coal-Fired Power Plants 117
6.3 Sensitivity Analysis for Electricity Cost 123
Chapter Seven: Conclusions and Future Work 126
7.1 Conclusions 126
7.2 Future Work 128
List of References 129
Appendix
Appendix A
vii
134
134
Reproduced with permission of the copyright owner. Further reproduction prohibited without permission.
Chapter Five: Results and Discussions: Supercritical Coal-Fired Power Plant 87
5.1 Individual Parametric Effects 90
5.2 Efficiency Correlations for Supercritical Pulverized Coal-fired Power Plant99
5.3 Optimum Operating Conditions 104
5.4 Efficiency Drop due to CO2 Capture 107
Chapter Six: Economic Assessment 112
6.1 Economic Basis 112
6.1.1 Allowance for Funds Used during Construction 113
6.1.2 Levelized Fixed Charge Rate o f Capital Cost 114
6.1.3 Levelized Operating Cost 116
6.1.4 Present Worth Cost 116
6.2 Cost o f Electricity o f Pulverized Coal-Fired Power Plants 117
6.3 Sensitivity Analysis for Electricity Cost 123
Chapter Seven: Conclusions and Future Work 126
7.1 Conclusions 126
7.2 Future Work 128
List of References 129
Appendix 134
Appendix A 134
vii
Reproduced with permission of the copyright owner. Further reproduction prohibited without permission.

List of Tables
page
Table 1.1 Comparison of PC, CFB, PFB and IGCC 4
Table 1.2 Research studies on improvement of power plant efficiency 8
Table 3.1 Comparison between simulation results in this study and published data 39
Table 3.2 Type of distribution curves used in this study 41
Table 3.3 Main input for subcritical and supercritical PCs 48
Table 4.1 Maximum-minimum performance of subcritical PC 53
Table 4.2 Characteristics of Illinois#6 bituminous coal 55
Table 4.3 Characteristics of coal used for simulation 76
Table 4.4 Optimal process operations for subcritical PC 80
Table 4.5 Comparison of subcritical PC with and without MEA-based CO2
absorption unit 84
Table 5.1 Maximum-minimum performance of supercritical PC 88
Table 5.2 Optimal process operations for supercritical PC 106
Table 5.3 Comparison of supercritical PC with and without MEA-based CO2
absorption unit 109
Table 6.1 Economic inputs 118
Table 6.2 Results of economic analysis for subcritical and supercritical PCs with
and without MEA-based CO2 absorption unit 119
Table 6.3 Ranges of Economic inputs for analysis of electricity cost 124
viii
Reproduced with permission of the copyright owner. Further reproduction prohibited without permission.
List of Tables
page
Table 1.1 Comparison of PC, CFB, PFB and IGCC 4
Table 1.2 Research studies on improvement o f power plant efficiency 8
Table 3.1 Comparison between simulation results in this study and published data 39
Table 3.2 Type o f distribution curves used in this study 41
Table 3.3 Main input for subcritical and supercritical PCs 48
Table 4.1 Maximum-minimum performance o f subcritical PC 53
Table 4.2 Characteristics o f Illinois# 6 bituminous coal 55
Table 4.3 Characteristics o f coal used for simulation 76
Table 4.4 Optimal process operations for subcritical PC 80
Table 4.5 Comparison o f subcritical PC with and without MEA-based CO2
absorption unit 84
Table 5.1 Maximum-minimum performance o f supercritical PC 8 8
Table 5.2 Optimal process operations for supercritical PC 106
Table 5.3 Comparison o f supercritical PC with and without MEA-based CO2
absorption unit 109
Table 6.1 Economic inputs 118
Table 6.2 Results o f economic analysis for subcritical and supercritical PCs with
and without MEA-based CO2 absorption unit 119
Table 6.3 Ranges o f Economic inputs for analysis o f electricity cost 124
viii
Reproduced with permission of the copyright owner. Further reproduction prohibited without permission.

Table A.1 Emission factors for bituminous and subbituminous coal combustion
without control equipment
Table A.2 List of enthalpy and entropy correlations of streams
ix
Reproduced with permission of the copyright owner. Further reproduction prohibited without permission.
Table A.1
Table A.2
Emission factors for bituminous and subbituminous coal combustion
without control equipment 138
List o f enthalpy and entropy correlations o f streams 139
Reproduced with permission of the copyright owner. Further reproduction prohibited without permission.

List of Figures
page
Figure 1.1 Projected fuel share of world's electricity generation from 2002 to 2025 2
Figure 1.2 Scheme of pulverized coal-fired power plant 5
Figure 1.3 Flow diagram of MEA-based CO2 absorption unit 13
Figure 2.1 Simple scheme of Reheat-regenerative Rankine cycle 21
Figure 2.2 Scheme of "subcritical" pulverized coal-fired power plant 25
Figure 2.3 Scheme of "supercritical" pulverized coal-fired power plant 26
Figure 2.4 Schematic diagram of integration of environmental abatement units 28
Figure 3.1 Regression flowchart for correlating steam properties 35
Figure 3.2 Computational algorithm of developed power plant model 36
Figure 3.3 Developed power plant model and Monte Carlo simulation 42
Figure 3.4 Basic flowchart for ranking algorithm 44
Figure 3.5 Identified points of input parameters for subcritical PC 46
Figure 3.6 Identified points of input parameters for supercritical PC 47
Figure 4.1 Results of sensitivity analysis by an approach of rank correlation
coefficient 56
Figure 4.2 Effects of moisture content in coal and temperature of preheated air 59
Figure 4.3 Effects of main steam and reheated steam temperatures 61
Figure 4.4 Effects of boiler and turbine efficiencies 63
Figure 4.5 Effect of excess air for coal combustion 64
Figure 4.6 Effect of pressure drop in steam cycle 66
Figure 4.7 Effect of pressure in the HP stage 68
x
Reproduced with permission of the copyright owner. Further reproduction prohibited without permission.
List of Figures
page
Figure 1.1 Projected fuel share o f world’s electricity generation from 2002 to 2025 2
Figure 1.2 Scheme o f pulverized coal-fired power plant 5
Figure 1.3 Flow diagram of MEA-based CO2 absorption unit 13
Figure 2.1 Simple scheme o f Reheat-regenerative Rankine cycle 2 1
Figure 2.2 Scheme o f “subcritical” pulverized coal-fired power plant 25
Figure 2.3 Scheme o f “supercritical” pulverized coal-fired power plant 26
Figure 2.4 Schematic diagram of integration o f environmental abatement units 28
Figure 3.1 Regression flowchart for correlating steam properties 35
Figure 3.2 Computational algorithm of developed power plant model 36
Figure 3.3 Developed power plant model and Monte Carlo simulation 42
Figure 3.4 Basic flowchart for ranking algorithm 44
Figure 3.5 Identified points o f input parameters for subcritical PC 46
Figure 3.6 Identified points o f input parameters for supercritical PC 47
Figure 4.1 Results o f sensitivity analysis by an approach o f rank correlation
coefficient 56
Figure 4.2 Effects o f moisture content in coal and temperature o f preheated air 59
Figure 4.3 Effects o f main steam and reheated steam temperatures 61
Figure 4.4 Effects o f boiler and turbine efficiencies 63
Figure 4.5 Effect o f excess air for coal combustion 64
Figure 4.6 Effect o f pressure drop in steam cycle 6 6
Figure 4.7 Effect o f pressure in the HP stage 6 8
Reproduced with permission of the copyright owner. Further reproduction prohibited without permission.

Figure 4.8
Figure 4.9
Figure 4.10
Figure 4.11
Figure 4.12
Figure 4.13
Figure 4.14
Figure 4.15
Figure 4.16
Figure 5.1
Figure 5.2
Figure 5.3
Figure 5.4
Figure 5.5
Figure 5.6
Figure 5.7
Figure 5.8
Figure 5.9
Figure 5.10
Figure 5.11
Effect of pressure at the 1st IP stage
Effect of pressure at the 3rd IP stage
Effect of pressure at the last LP stage
Reference net efficiency of base subcritical PC
Parity plot of net efficiency between empirical correlation and
theoretical model
Scheme of subcritical PC at optimal operating conditions
Scheme of subcritical PC with MEA-based absorption unit operating
at optimal conditions
Effect of CO2 loading on reboiler heat duty
Effect of CO2 removal efficiency on net efficiency point drop
Results of sensitivity analysis by an approach of rank correlation
coefficient
Effects of moisture content in coal and temperature of preheated air
Effects of main steam and reheated steam temperatures
Effects of boiler and turbine efficiencies
Effect of excess air for coal combustion
Effect of pressure drop in steam cycle
Effect of pressure in the HP stage
Effect of pressure at the 2nd HP Stage
Effect of pressure at the 1St IP stage
Effect of pressure at the 3rd IP stage
Effect of pressure at the last LP stage
xi
70
70
72
73
77
79
82
85
86
89
91
92
93
94
96
97
97
98
98
100
Reproduced with permission of the copyright owner. Further reproduction prohibited without permission.
Figure 4.8 Effect o f pressure at the 1st IP stage 70
Figure 4.9 Effect o f pressure at the 3rd IP stage 70
Figure 4.10 Effect o f pressure at the last LP stage 72
Figure 4.11 Reference net efficiency of base subcritical PC 73
Figure 4.12 Parity plot o f net efficiency between empirical correlation and
theoretical model 77
Figure 4.13 Scheme of subcritical PC at optimal operating conditions 79
Figure 4.14 Scheme of subcritical PC with MEA-based absorption unit operating
at optimal conditions 82
Figure 4.15 Effect o f CO2 loading on reboiler heat duty 85
Figure 4.16 Effect o f CO2 removal efficiency on net efficiency point drop 86
Figure 5.1 Results o f sensitivity analysis by an approach o f rank correlation
coefficient 89
Figure 5.2 Effects o f moisture content in coal and temperature o f preheated air 91
Figure 5.3 Effects o f main steam and reheated steam temperatures 92
Figure 5.4 Effects o f boiler and turbine efficiencies 93
Figure 5.5 Effect o f excess air for coal combustion 94
Figure 5.6 Effect o f pressure drop in steam cycle 96
Figure 5.7 Effect o f pressure in the HP stage 97
Figure 5.8 Effect o f pressure at the 2nd HP Stage 97
Figure 5.9 Effect o f pressure at the 1st IP stage 98
Figure 5.10 Effect o f pressure at the 3rd IP stage 98
Figure 5.11 Effect o f pressure at the last LP stage 100
xi
Reproduced with permission of the copyright owner. Further reproduction prohibited without permission.

Figure 5.12 Reference net efficiency of base supercritical PC
Figure 5.13 Parity plot of net efficiency between empirical correlation and
theoretical model
Scheme of supercritical PC at optimal operating conditions
Scheme of supercritical PC with MEA-based absorption unit operating
at optimal conditions
Comparison of energy penalty between subcritical and supercritical
PCs
Magnitude of energy penalty per unit of CO2 removal efficiency
Levelized fixed charge rate for capital cost
Cost of electricity (COE) difference, (0/kWh, yearn - yearn_i)
Capital recovery period
Results of sensitivity analysis for cost of electricity
Algorithm to compute the temperature profile in furnace/boiler
Algorithm for Gauss-Seidel method
Algorithm for NO calculation
Parity plot of enthalpy between actual data and empirical correlation
Figure 5.14
Figure 5.15
Figure 5.16
Figure 5.17
Figure 6.1
Figure 6.2
Figure 6.3
Figure 6.4
Figure A.1
Figure A.2
Figure A.3
Figure A.4
xii
101
103
105
108
110
111
115
121
122
125
134
135
136
137
Reproduced with permission of the copyright owner. Further reproduction prohibited without permission.
Figure 5.12 Reference net efficiency of base supercritical PC 1 0 1
Figure 5.13 Parity plot o f net efficiency between empirical correlation and
theoretical model 103
Figure 5.14 Scheme of supercritical PC at optimal operating conditions 105
Figure 5.15 Scheme o f supercritical PC with MEA-based absorption unit operating
at optimal conditions 108
Figure 5.16 Comparison o f energy penalty between subcritical and supercritical
PCs 1 1 0
Figure 5.17 Magnitude o f energy penalty per unit o f CO2 removal efficiency 1 1 1
Figure 6.1 Levelized fixed charge rate for capital cost 115
Figure 6.2 Cost o f electricity (COE) difference, (0/kWh, yearn - yearn-i) 1 2 1
Figure 6.3 Capital recovery period 1 2 2
Figure 6.4 Results o f sensitivity analysis for cost o f electricity 125
Figure A .l Algorithm to compute the temperature profile in furnace/boiler 134
Figure A.2 Algorithm for Gauss-Seidel method 135
Figure A.3 Algorithm for NO calculation 136
Figure A.4 Parity plot o f enthalpy between actual data and empirical correlation 137
xii
Reproduced with permission of the copyright owner. Further reproduction prohibited without permission.

Acronym and Abbreviation
AFUDC allowance for funds used during construction
CCUJ Center for Coal Utilization, Japan
CEA Canadian Electricity Association
CFB circulating fluidized bed power plant
COE cost of electricity
DEA diethanolamine
DGA diglycolamine
DIPA diisopropanolamine
EIA Environmental Investigation Agency
FOR enhanced oil recovery
ESP electrostatic precipitator
FGD flue gas desulfurization
FWHs feedwater heaters
FBC fluidized bed combustor power plant
G generator
GHGs greenhouse gases
HHV high heating value
HP high pressure turbine
IEA International Energy Agency
IP intermediate pressure turbine
IGCC integrated gasification combined cycle power plant
Reproduced with permission of the copyright owner. Further reproduction prohibited without permission.
Acronym and Abbreviation
AFUDC allowance for funds used during construction
CCUJ Center for Coal Utilization, Japan
CEA Canadian Electricity Association
CFB circulating fluidized bed power plant
COE cost o f electricity
DEA diethanolamine
DGA diglycolamine
DIPA diisopropanolamine
EIA Environmental Investigation Agency
EOR enhanced oil recovery
ESP electrostatic precipitator
FGD flue gas desulfurization
FWHs feedwater heaters
FBC fluidized bed combustor power plant
G generator
GHGs greenhouse gases
HHV high heating value
HP high pressure turbine
IEA International Energy Agency
IP intermediate pressure turbine
IGCC integrated gasification combined cycle power plant
Reproduced with permission of the copyright owner. Further reproduction prohibited without permission.

LEBS advanced coal-fired low emission boiler system
LHV low heating value
LNB low NO burner
LP low pressure turbine
MDEA N-methyldiethanolamine
MEA monoethanolamine
MWh megawatt-hour
NEDO New Energy and Industrial Technology Development Organization
O&M operating and maintenance
PC pulverized coal-fired power plant
PFB pressurized fluidized bed power plant
PM particulate matter
RH reheater
SCR selective catalytic reduction
SH superheater
TEA triethanolamine
TWh terawatt-hour
U.S.DOE United States Department of Energy
xiv
Reproduced with permission of the copyright owner. Further reproduction prohibited without permission.
LEBS advanced coal-fired low emission boiler system
LHV low heating value
LNB low NOx burner
LP low pressure turbine
MDEA A-methyldiethanolamine
MEA monoethanolamine
MWh megawatt-hour
NEDO New Energy and Industrial Technology Development Organization
O&M operating and maintenance
PC pulverized coal-fired power plant
PFB pressurized fluidized bed power plant
PM particulate matter
RH reheater
SCR selective catalytic reduction
SH superheater
TEA triethanolamine
TWh terawatt-hour
U.S.DOE United States Department o f Energy
Reproduced with permission of the copyright owner. Further reproduction prohibited without permission.

Nomenclature
A percent ash content by weight, %
AFUDC allowance for funds used during construction, $/kW
C percent carbon content by weight, %
Cp,, specific heat capacity of combustion product i, kJ/kmol K
CC consumable cost, $/kWh
CF capacity factor, %
COE cost of electricity, 0/kWh or $/kWh
CRF capital recovery factor
CF capacity factor, %
es annual escalation rate, %
e error between actual and empirical correlation data
Ea percent excess air, %
Fm percent free moisture in coal, %
FC fuel cost, $/kWh
FCF fixed charge rate
h specific enthalpy, kJ/kg
hi specific enthalpy of stream i, kJ/s
Afii enthalpy change of combustion product i, kJ/s
H percent hydrogen content by weight, %
HHV high heating value, kJ/kg coal
i interest rate, %
xv
Reproduced with permission of the copyright owner. Further reproduction prohibited without permission.
Nomenclature
A percent ash content by weight, %
AFUDC allowance for funds used during construction, $/kW
C percent carbon content by weight, %
Cpj specific heat capacity o f combustion product i, kJ/kmol K
CC consumable cost, $/kWh
CF capacity factor, %
COE cost o f electricity, 0/kWh or $/kWh
CRF capital recovery factor
CF capacity factor, %
es annual escalation rate, %
e error between actual and empirical correlation data
Ea percent excess air, %
Fm percent free moisture in coal, %
FC fuel cost, $/kWh
FCF fixed charge rate
h specific enthalpy, kJ/kg
ht specific enthalpy o f stream i, kJ/s
AH i enthalpy change of combustion product i, kJ/s
H percent hydrogen content by weight, %
HHV high heating value, kJ/kg coal
i interest rate, %
xv
Reproduced with permission of the copyright owner. Further reproduction prohibited without permission.

Kp
1
L
til coal
N
NN2
N NO
NO2
N total
0
OC
OM
PN,
PNO
Po,
P
P drop
P,„
PV
present worth discount rate, %
reaction equilibrium
likeliest
latent heat of vaporization, kJ/kg vapor
rate of coal consumption, kg/s
mass flow rate of combustion product i, kg/s
percent nitrogen content by weight, %
the number of moles of nitrogen
the number of moles of nitric oxide
the number of moles of oxygen
the total number of moles
percent oxygen content by weight, %
other operating costs, $/kWh
operating and maintenance cost, $/kWh
partial pressure of nitrogen, kPa
partial pressure of nitric oxide, kPa
partial pressure of oxygen, kPa
pressure
percent pressure drop, %
power output, kW
present value, $/kW
xvi
Reproduced with permission of the copyright owner. Further reproduction prohibited without permission.
j present worth discount rate, %
KP reaction equilibrium
I likeliest
L latent heat of vaporization, kJ/kg vapor
™ coal rate o f coal consumption, kg/s
mt mass flow rate o f combustion product i, kg/s
N percent nitrogen content by weight, %
n N2 the number of moles o f nitrogen
N n othe number o f moles o f nitric oxide
N o 2 the number of moles o f oxygen
N total the total number o f moles
0 percent oxygen content by weight, %
oc Other operating costs, $/kWh
OM operating and maintenance cost, $/kWh
P n 2 partial pressure of nitrogen, kPa
P NO partial pressure o f nitric oxide, kPa
Po2 partial pressure o f oxygen, kPa
P pressure
P drop percent pressure drop, %
Pw power output, kW
PV present value, $/kW
Reproduced with permission of the copyright owner. Further reproduction prohibited without permission.

qh
ql
Qboiler
Qecon
Qevap
Qfurnace
Amain steam
Qpreheater
01211
QSH
R
R2
S
S
sr
T
Tair
Tm
Tr
TCR
HHV-based combustion heat, kJ/kg coal
LHV-based combustion heat, kJ/kg coal
heat input from boiler, kJ/s
heat transferred to economizer, kJ/s
heat transferred to evaporator, kJ/s
furnace heat, kJ/s
LHV-based combustion heat, kJ/s
heat for producing main steam, kJ/s
heat recovered from hot flue gas via air preheater, kJ/s
heat for producing reheated steam, kJ/s
heat for producing superheat steam, kJ/s
rank correlation coefficient
coefficient of multiple determination
specific entropy, kJ/kg K
percent sulfur content by weight, %
sum square of residual between actual and empirical correlation data
temperature
preheated air temperature, °C
main temperature, °C
reheating temperature, °C
total capital requirement, $/year
xvii
Reproduced with permission of the copyright owner. Further reproduction prohibited without permission.
Qh HHV-based combustion heat, kJ/kg coal
<n LHV-based combustion heat, kJ/kg coal
Qboiler heat input from boiler, kJ/s
Qecon heat transferred to economizer, kJ/s
Qevap heat transferred to evaporator, kJ/s
Q furnace furnace heat, kJ/s
Q i LHV-based combustion heat, kJ/s
Qmain steam heat for producing main steam, kJ/s
Q preheater heat recovered from hot flue gas via air preheater, kJ/s
Qrh heat for producing reheated steam, kJ/s
Qsh heat for producing superheat steam, kJ/s
R rank correlation coefficient
R2 coefficient o f multiple determination
s specific entropy, kJ/kg K
S percent sulfur content by weight, %
S r sum square o f residual between actual and empirical correlation data
T temperature
T a ir preheated air temperature, °C
Tm main temperature, °C
Tr reheating temperature, °C
TCR total capital requirement, $/year
Reproduced with permission of the copyright owner. Further reproduction prohibited without permission.

US uniform series value, $/kW
W mass of water vapor, kg vapor/kg coal
* 1-1P i power produced from section i of high pressure turbine, kJ/s
* IP i power produced from section i of intermediate pressure turbine, kJ/s
* LP ,i power produced from section i of low pressure turbine, kJ/s
*our power output from steam cycle, kJ/s
W out,net net power output of overall system, kJ/s
WP pumping power input, kJ/s
* 13' i power input for individual pumps, kJ/s
* P,isen isentropic pumping power, kJ/s
* P foto( total pumping power, kJ/s
F.VT turbine power, kJ/s
* T ,isen isentropic turbine power, kJ/s
* T ,total total power from turbines, kJ/s
Greek letter
a
fi
6 Q
es
alpha or negative skew
beta or positive skew
approximate relative error, %
specified error, %
xviii
Reproduced with permission of the copyright owner. Further reproduction prohibited without permission.
US uniform series value, $/kW
w mass o f water vapor, kg vapor/kg coal
wHP,t power produced from section i o f high pressure turbine, kJ/s
K,< power produced from section i o f intermediate pressure turbine, kJ/s
K j power produced from section i o f low pressure turbine, kJ/s
wout power output from steam cycle, kJ/s
w" out,net net power output o f overall system, kJ/s
Wp pumping power input, kJ/s
Wp,t power input for individual pumps, kJ/s
wP.isen isentropic pumping power, kJ/s
^ P , to ta l total pumping power, kJ/s
WT turbine power, kJ/s
wrr T,isen isentropic turbine power, kJ/s
WT .total total power from turbines, kJ/s
Greek letter
a alpha or negative skew
P beta or positive skew
£a approximate relative error, %
specified error, %
xviii
Reproduced with permission of the copyright owner. Further reproduction prohibited without permission.

0
p
-
A r/
furnace
boiler
r 1 drop
net
71 ref
T
1 th
minimum value
mean value
standard deviation
efficiency variation, %
efficiency of furnace, %
efficiency of boiler, %
net efficiency point drop, %
net efficiency, %
reference efficiency, %
efficiency of turbine, %
thermal efficiency of steam cycle, %
xix
Reproduced with permission of the copyright owner. Further reproduction prohibited without permission.
d minimum value
M mean value
a standard deviation
A 77 efficiency variation, %
V furnace efficiency o f furnace, %
boiler efficiency o f boiler, %
V drop net efficiency point drop, %
V net net efficiency, %
V re f reference efficiency, %
I t efficiency o f turbine, %
7* thermal efficiency o f steam cycle, %
Reproduced with permission of the copyright owner. Further reproduction prohibited without permission.

Chapter One
Introduction
1.1 Electricity Generation by Coal
Electricity generation by coal is one of the most important activities in fossil fuel
based economies across the globe. About 7000 TWh (Terawatt hours) of electricity were
produced by coal in 2004. It was considered the largest fuel share, accounting for 39.8%
of the world's total electricity production (IEA, 2006a). In Canada, in 2003, coal was the
second largest energy resource for electricity generation providing about 19% of
Canada's total electricity generation (CEA, 2006). As reported by Energy Information
Administration (EIA) in 2005, the use of coal for electricity generation will continue to
play a primary role in the global scale at least until the year 2025 (Figure 1.1). The global
demand for coal is expected to rise significantly, as the major developing countries such
as China and India are planning for additional capacity of coal-fired generation in the
next two decades (IEA, 2006b). The growing coal demand trend will result in a global
coal consumption of more than 6000 mtce (million tons of carbon equivalent) by the year
2030.
Today, there are several coal-based electricity generation technologies that have
been used worldwide for both commercial and demonstration purposes. Such
technologies include a pulverized coal-fired power plant (PC), a circulating fluidized bed
power plant (CFB), a pressurized fluidized bed power plant (PFB) and an integrated
gasification combined cycle power plant (IGCC). The PC is the conventional technology
1
Reproduced with permission of the copyright owner. Further reproduction prohibited without permission.
Chapter One
Introduction
1.1 Electricity Generation by Coal
Electricity generation by coal is one o f the most important activities in fossil fuel
based economies across the globe. About 7000 TWh (Terawatt hours) o f electricity were
produced by coal in 2004. It was considered the largest fuel share, accounting for 39.8%
of the world’s total electricity production (IEA, 2006a). In Canada, in 2003, coal was the
second largest energy resource for electricity generation providing about 19% of
Canada’s total electricity generation (CEA, 2006). As reported by Energy Information
Administration (ELA) in 2005, the use o f coal for electricity generation will continue to
play a primary role in the global scale at least until the year 2025 (Figure 1.1). The global
demand for coal is expected to rise significantly, as the major developing countries such
as China and India are planning for additional capacity o f coal-fired generation in the
next two decades (IEA, 2006b). The growing coal demand trend will result in a global
coal consumption of more than 6000 mtce (million tons o f carbon equivalent) by the year
2030.
Today, there are several coal-based electricity generation technologies that have
been used worldwide for both commercial and demonstration purposes. Such
technologies include a pulverized coal-fired pow er plant (PC ), a circulating flu idized bed
power plant (CFB), a pressurized fluidized bed power plant (PFB) and an integrated
gasification combined cycle power plant (IGCC). The PC is the conventional technology
1
Reproduced with permission of the copyright owner. Further reproduction prohibited without permission.

Percent of Total
100 —
80 —0 Natural Gas
60 — Nuclear
Eri] Renewables
0 Coal 40— Oil
20 --
0
V
2002 2010 2015 2020 2025
Figure 1.1 Projected fuel share of world's electricity generation from 2002 to 2025.
(Redrawn from ETA, 2005)
2
Reproduced with permission of the copyright owner. Further reproduction prohibited without permission.
Percent of Total
100
80Natural Gas
NuclearRenewables
60
Coal4 0 - Oil
2 0 -
2002 2010 2015 2020 2025
Figure 1.1 Projected fuel share o f world’s electricity generation from 2002 to 2025.
(Redrawn from EIA, 2005)
Reproduced with permission of the copyright owner. Further reproduction prohibited without permission.

that relies on simple combustion of pulverized coal in a furnace at about 1650-1900°C
(Woodruff et al., 2005). Energy from the coal combustion is utilized for generating high-
pressure steam that drives steam turbines. The CFB is operated by combusting coal in a
fluidized bed combustor in the presence of limestone to reduce sulfur dioxide (SO2)
content in an emitted flue gas. Solid particles of limestone, ashes and unburned coal
resulting from the combustion are continuously collected by cyclones and re-circulated
within the combustor (Woodruff et al., 2005). The PFB is almost similar to the CFB,
except that the combustor is operated at a higher pressure ranging from 1.0 to 1.5 MPa.
Both of the CFB and PFB generate electricity mainly through the steam cycle. For the
IGCC, the electricity is produced by the gas turbines and steam turbines. Coal is gasified
to produce a stream of syngas (or synthesis gas) that drives the gas turbines and the flue
gas from the gas turbine is used to produce a high-pressure steam that drives the steam
turbines. Among these four technologies, the PC is the most commonly used power plant
around the world as shown in Table 1.1. A typical schematic diagram of the PC is given
in Figure 1.2.
1.2 Coal-Fired Power Plants and the Environment
Despite its significance, the use of coal for electricity generation poses an adverse
impact on humans and the environment, especially excessive emissions of greenhouse
gases (GHGs) to the atmosphere as also listed in Table 1.1. In 2001, the combustion of
coal contributed 38% of the total carbon dioxide (CO2) emission from the industrialized
world (Smith and Rousaki, 2002). It is recognized that CO2 is one of the major GHGs
causing global warming.
3
Reproduced with permission of the copyright owner. Further reproduction prohibited without permission.
that relies on simple combustion o f pulverized coal in a furnace at about 1650-1900°C
(Woodruff et al., 2005). Energy from the coal combustion is utilized for generating high-
pressure steam that drives steam turbines. The CFB is operated by combusting coal in a
fluidized bed combustor in the presence o f limestone to reduce sulfur dioxide (SO2)
content in an emitted flue gas. Solid particles o f limestone, ashes and unbumed coal
resulting from the combustion are continuously collected by cyclones and re-circulated
within the combustor (Woodruff et al., 2005). The PFB is almost similar to the CFB,
except that the combustor is operated at a higher pressure ranging from 1.0 to 1.5 MPa.
Both o f the CFB and PFB generate electricity mainly through the steam cycle. For the
IGCC, the electricity is produced by the gas turbines and steam turbines. Coal is gasified
to produce a stream of syngas (or synthesis gas) that drives the gas turbines and the flue
gas from the gas turbine is used to produce a high-pressure steam that drives the steam
turbines. Among these four technologies, the PC is the most commonly used power plant
around the world as shown in Table 1.1. A typical schematic diagram of the PC is given
in Figure 1.2.
1.2 Coal-Fired Power Plants and the Environment
Despite its significance, the use o f coal for electricity generation poses an adverse
impact on humans and the environment, especially excessive emissions o f greenhouse
gases (GHGs) to the atmosphere as also listed in Table 1.1. In 2001, the combustion o f
coal contributed 38% o f the total carbon dioxide (CO2) emission from the industrialized
world (Smith and Rousaki, 2002). It is recognized that CO2 is one o f the major GHGs
causing global warming.
3
Reproduced with permission of the copyright owner. Further reproduction prohibited without permission.

Reproduced w
ith permission o
f the copyright owner.
Furth
er reproduction prohibited w
ithout perm
ission.
Table 1.1 Comparison of PC, CFB, PFB and IGCC.
Description Sub-/Supercritical PC
Reliability, availability and commercial Commercial plants readiness with flue gas
desulfurization (FGD) since 1980s.
Worldwide established GW —1000
%HHV 35.8 — 38.9 Net efficiency
Unit size MW 400-1000
Emission rate (with SO2, NOR, and particulate removals)
SO2 kg/MWh 0.34-0.79
4=,
NO,, kg/MWh 0.20-1.20
Particulate matter kg/MWh 0.04-0.12
CO2
Capital requirement
kg/MWh 760-874
$/kW 1129 — 1173
CFB & PFB IGCC Reference
Expected to be in commercial application in year 2015a.
Expected to be in commercial application in year 2015a.
U.S.DOE (1999)
(CFB), —1 (PFB)
—3 Lako (2004)
35.5 — 39.0 32.3 — 43.1b U.S.DOE (1999); Marion et al. (2004)
<460 <318 Lako (2004)
0.34-0.66 negligible b - 0.87 U.S.DOE (1999); Marion et al. (2004); Lako (2004)
0.20-0.80 negligible b - 0.40 U.S.DOE (1999); Marion et al. (2004); Lako (2004)
0.003 0.008 U.S.DOE (1999)
816-906 718 b -898 U.S.DOE (1999); Marion et al. (2004); Lako (2004)
1100 1193 13 —1409 U.S.DOE (1999); Marion et al. (2004)
a The year 2015 is predicted based on the U.S.DOE (1999). b The H-class of the gas turbine used in the IGCC is on an early commercial demonstration phase and it is considered as a future case.
Reproduced
with perm
ission of the
copyright ow
ner. Further
reproduction prohibited
without
permission.
Table 1.1 Comparison of PC, CFB, PFB and IGCC.
Description Sub-/SupercriticalPC
CFB & PFB IGCC Reference
Reliability, availability and commercial readiness
Commercial plants with flue gas desulfurization (FGD) since 1980s.
Expected to be in commercial application in year 2015a.
Expected to be in commercial application in year 2015a.
U.S.DOE (1999)
Worldwide established GW -1000 -3 (CFB), -1 (PFB)
-3 Lako (2004)
Net efficiency %HHV 35.8-38 .9 35 .5 -39 .0 32.3 - 4 3 .11’ U.S.DOE (1999); Marion et al. (2004)
Unit size MW 400-1000 <460 <318 Lako (2004)
Emission rate (with SO:2, NOx, and particulate removals)
so2 kg/MWh 0.34-0.79 0.34-0.66 negligibleb - 0.87 U.S.DOE (1999); Marion et al. (2004); Lako (2004)
NOx kg/MWh 0.20-1.20 0.20-0.80 negligibleb - 0.40 U.S.DOE (1999); Marion et al. (2004); Lako (2004)
Particulate matter kg/MWh 0.04-0.12 0.003 0.008 U.S.DOE (1999)
C02 kg/MWh 760-874 816-906 718 6 -898 U.S.DOE (1999); Marion et al. (2004); Lako (2004)
Capital requirement $/kW 1129-1173 1100 1193 b- 1409 U.S.DOE (1999); Marion et al. (2004)
a The year 2015 is predicted based on the U.S.DOE (1999).b The H-class of the gas turbine used in the IGCC is on an early commercial demonstration phase and it is considered as a future case.

Fu
rnac
eBo
iler
Boiler feed pump
Condenser
Condensate pump
ter train
SH Superheater RH Reheater HP High pressure turbine IP Intermediate pressure turbine LP Low pressure turbine FWH Feedwater heater G Generator
Figure 1.2 Scheme of pulverized coal-fired power plant.
(Modified from Singer, 1991; Drbal et al., 1996;
U.S.DOE, 1999 and Kakaras et al., 2002)
5
Reproduced with permission of the copyright owner. Further reproduction prohibited without permission.
Fur
nace
/Boi
ler
LPEvaporator
Snray water
Condenser-Reheat
Condensate pump13)
Upper feeawater heater train,Coal
SH SuperheaterRH ReheaterHP High pressure turbineIP Intermediate pressure turbineLP Low pressure turbineFWH Feedwater heaterG Generator
Figure 1.2 Scheme o f pulverized coal-fired power plant.
(Modified from Singer, 1991; Drbal et al., 1996;
U.S.DOE, 1999 and Kakaras et al., 2002)
\ / Air heatei Degerator
Boiler feed pump
5
Reproduced with permission of the copyright owner. Further reproduction prohibited without permission.

Although no emission standard has been set for CO2, efforts to reduce CO2 emissions
from existing coal-fired power plants are driven by responsibility to the environment and
community as well as the international agreements including Kyoto Protocol that 169
countries and governmental entities have signed and ratified. Canada has committed to
reducing CO2 emissions to a target 6% below 1990 levels by the year 2012. With its
increasing rate of GHG emissions after 1990, Canada will be required to lower the
emission by about 20-25% from the projected GHG emissions of 703-748 Mt in the year
2010 (Neitzert et al., 1999).
1.3 GHG Mitigation Strategies for Coal-Fired Power Plants
Reduction of CO2 emissions from coal-fired power plants can be achieved by two
fundamental strategies: (i) an improvement in net efficiency of the power generation
cycle and (ii) an integration of a CO2 capture unit to remove CO2 from the combustion
flue gas before it is discharged to the atmosphere. The improved efficiency strategy can
be realized through either adjusting the power plant operating conditions or modifying
the plant's configuration to fully utilize energy resources within the system. Applying
these two approaches can lead to the maximum plant efficiency as well as the minimum
coal consumption, thus resulting in the reduced rate of CO2 emissions at a specific net
power output. To further reduce emissions to a much lower level, the integration of the
CO2 capture unit into the power plants becomes necessary. However, the capture strategy
is not straightforward, as it requires the integrated power plants to be larger in size and
capable of providing additional energy for CO2 capture activities. This means that
6
Reproduced with permission of the copyright owner. Further reproduction prohibited without permission.
Although no emission standard has been set for CO2, efforts to reduce CO2 emissions
from existing coal-fired power plants are driven by responsibility to the environment and
community as well as the international agreements including Kyoto Protocol that 169
countries and governmental entities have signed and ratified. Canada has committed to
reducing CO2 emissions to a target 6 % below 1990 levels by the year 2012. With its
increasing rate o f GHG emissions after 1990, Canada will be required to lower the
emission by about 20-25% from the projected GHG emissions o f 703-748 Mt in the year
2010 (Neitzert et al., 1999).
1.3 GHG Mitigation Strategies for Coal-Fired Power Plants
Reduction o f CO2 emissions from coal-fired power plants can be achieved by two
fundamental strategies: (i) an improvement in net efficiency of the power generation
cycle and (ii) an integration o f a CO2 capture unit to remove CO2 from the combustion
flue gas before it is discharged to the atmosphere. The improved efficiency strategy can
be realized through either adjusting the power plant operating conditions or modifying
the plant’s configuration to fully utilize energy resources within the system. Applying
these two approaches can lead to the maximum plant efficiency as well as the minimum
coal consumption, thus resulting in the reduced rate o f CO2 emissions at a specific net
power output. To further reduce emissions to a much lower level, the integration o f the
CO2 capture unit into the power plants becomes necessary. However, the capture strategy
is not straightforward, as it requires the integrated power plants to be larger in size and
capable o f providing additional energy for CO2 capture activities. This means that
6
Reproduced with permission of the copyright owner. Further reproduction prohibited without permission.

capturing CO2 from the coal-fired power plants will present an increase in the cost of
electricity.
1.3.1 Improvement in Net Efficiency
Table 1.2 summarizes a number of research studies presenting various methods
that can help improving the net efficiency of coal-fired power plants (Hobbs and Heller,
1923; Leung and Moore, 1966; Cicconardi et al., 1991; Miliaras and Broer, 1991;
Schilling, 1993; Kitto, 1996; Regan et al., 1996; Petermann and Fett, 1997; U.S.DOE,
1999; Beer, 2000; Chattopadhyay, 2000; Kiga et al., 2000; Kakaras et al., 2002; Kjaer,
2002; Toshiyuki et al., 2002; Termuehlen and Emsperger, 2003; Gwosdz et al., 2005).
From the table, methods of improvement include a reduction of the moisture content in
coal, a use of an air pre-heater for waste energy recovery, an introduction of feed water
heaters (FWHs), an adjustment of operating temperature and pressure as well as an
introduction of advanced material and a new design of a boiler, a furnace and a turbine.
It should be noted that most studies were aimed only at an individual effect of one or a
pair of such operating and design parameters on the improvement of the plant efficiency.
There is no research study on the optimization of the power plant efficiency that
simultaneously takes all parametric effects and the associated parametric interactions into
account. Such a study would allow the development of operational and design strategies
to achieve the maximum power generation efficiency.
7
Reproduced with permission of the copyright owner. Further reproduction prohibited without permission.
capturing CO2 from the coal-fired power plants will present an increase in the cost of
electricity.
1.3.1 Improvement in Net Efficiency
Table 1.2 summarizes a number o f research studies presenting various methods
that can help improving the net efficiency of coal-fired power plants (Hobbs and Heller,
1923; Leung and Moore, 1966; Cicconardi et al., 1991; Miliaras and Broer, 1991;
Schilling, 1993; Kitto, 1996; Regan et al., 1996; Petermann and Fett, 1997; U.S.DOE,
1999; Beer, 2000; Chattopadhyay, 2000; Kiga et al., 2000; Kakaras et al., 2002; Kjaer,
2002; Toshiyuki et al., 2002; Termuehlen and Emsperger, 2003; Gwosdz et al., 2005).
From the table, methods o f improvement include a reduction of the moisture content in
coal, a use o f an air pre-heater for waste energy recovery, an introduction o f feed water
heaters (FWHs), an adjustment o f operating temperature and pressure as well as an
introduction o f advanced material and a new design o f a boiler, a furnace and a turbine.
It should be noted that most studies were aimed only at an individual effect o f one or a
pair o f such operating and design parameters on the improvement o f the plant efficiency.
There is no research study on the optimization o f the power plant efficiency that
simultaneously takes all parametric effects and the associated parametric interactions into
account. Such a study would allow the development o f operational and design strategies
to achieve the maximum power generation efficiency.
Reproduced with permission of the copyright owner. Further reproduction prohibited without permission.

Reproduced w
ith permission o
f the copyright owner.
Furth
er reproduction prohibited w
ithout perm
ission.
Table 1.2 Research studies on improvement of power plant efficiency.
Reference Power Plant Research Objective Finding
Hobbs and Heller, PC
1923
Study the effects of a
boiler capacity on the
plant efficiency.
The high boiler capacity or power output results in a better combustion efficiency
and coal consumption.
Leung and Moore,
1966
Supercritical
PC
Analyze the proper
position for steam
extraction in the turbine
series.
Appropriately extracting the steam pressure from the turbine series can improve the
net heat rate by 5.7%.
Cicconardi et al.,
1991
FBC Conduct the parametric
study.
Increasing the excess air from 10 to 40% slightly reduces the net efficiency.
Increasing a combustion temperature from 800 to 1000°C causes an improvement of
the plant efficiency by 6.3%.
Increasing of a compression and an expansion efficiencies from 0.8 to 0.9 results in
an improvement of the efficiency by 2.8 and 3.9%, respectively.
Miliaras and Broer, PC
1991
Review the advantage of a
regenerative system, a
double reheat steam cycle
and an arrangement of
equipment.
The regenerative system and the appropriate arrangement results in a reduction of the
coal consumption by 6.5% and an increase of the net power output by 21.2%.
The double steam reheater gives a reduction of the coal consumption by 7.3%.
Schilling, 1993 PC Review the process
parameters affecting the
net efficiency.
Increasing the excess air causes a reduction in the plant efficiency.
Reducing a stack temperature results in an improvement of the plant efficiency.
Increasing the main temperature and pressure from 25 to 35 MPa and from 540 to
600°C improves the plant efficiency by about 1.5%.
Reproduced
with perm
ission of the
copyright ow
ner. Further
reproduction prohibited
without
permission.
Table 1.2 Research studies on improvement of power plant efficiency.
Reference Power Plant Research Objective Finding
Hobbs and Heller,
1923
PC Study the effects of a
boiler capacity on the
plant efficiency.
The high boiler capacity or power output results in a better combustion efficiency
and coal consumption.
Leung and Moore, Supercritical Analyze the proper Appropriately extracting the steam pressure from the turbine series can improve the
1966 PC position for steam
extraction in the turbine
series.
net heat rate by 5.7%.
Cicconardi et al.,
1991
FBC Conduct the parametric
study.
Increasing the excess air from 10 to 40% slightly reduces the net efficiency.
Increasing a combustion temperature from 800 to 1000°C causes an improvement of
the plant efficiency by 6.3%.
Increasing o f a compression and an expansion efficiencies from 0.8 to 0.9 results in
an improvement of the efficiency by 2.8 and 3.9%, respectively.
Miliaras and Broer,
1991
PC Review the advantage of a
regenerative system, a
double reheat steam cycle
and an arrangement of
equipment.
The regenerative system and the appropriate arrangement results in a reduction o f the
coal consumption by 6.5% and an increase o f the net power output by 21.2%.
The double steam reheater gives a reduction o f the coal consumption by 7.3%.
Schilling, 1993 PC Review the process
parameters affecting the
net efficiency.
Increasing the excess air causes a reduction in the plant efficiency.
Reducing a stack temperature results in an improvement of the plant efficiency.
Increasing the main temperature and pressure from 25 to 35 MPa and from 540 to
600°C improves the plant efficiency by about 1.5%.

Reproduced w
ith permission o
f the copyright owner.
Furth
er reproduction prohibited w
ithout perm
ission.
Table 1.2 Research studies on improvement of power plant efficiency. (continued)
Reference Power Plant Research Objective Finding
Schilling, 1993
(continued)
Changing the plant process from the single to the double steam reheater gives an
improvement of the plant efficiency.
Reducing a backpressure offers an increase of the plant efficiency.
Kitto, 1996 PC Evaluate the effect of the
subcritical, supercritical
and ultrasupercritical
power plants on the net
efficiency and identify key
parameters for plant
designs and operations.
The net efficiencies of the subcritical, supercritical and ultrasupercritical power
plants are 37, 42 and 46%, respectively.
The key parameters are (i) an advanced combustion system, (ii) a variable and dual
pressure operations, (iii) a spiral and vertical furnace circuit, (iv) a thermal design,
(v) a boiler material, (vi) a heat recovery, and (vii) an advanced SO2 emission
control.
Regan et al., 1996 LEBS a Purpose ideas to improve
the net efficiency.
The net efficiency is associated with condenser pressure, plant capacity and types of
coal-fired power stations.
The high pressure steam of 50 MPa at 600°C triple reheat stages gives the thermal
efficiency improvement by 3%.
A key to operate the power plant at a high temperature and pressure is the
introduction of the advanced material.
Petermann and
Fett, 1997
FBC Study the effect of thermal Increasing the thermal load of a 150-MW FBC from 70 to 100% results in an
load on the power output. increase of power output greater than 50 MW.
a LEBS is the advanced coal-fired low emission boiler system.
Reproduced
with perm
ission of the
copyright ow
ner. Further
reproduction prohibited
without
permission.
Table 1.2 Research studies on improvement of power plant efficiency, (continued)
Reference Power Plant Research Objective Finding
Schilling, 1993
(continued)
Changing the plant process from the single to the double steam reheater gives an
improvement o f the plant efficiency.
Reducing a backpressure offers an increase o f the plant efficiency.
Kitto, 1996 PC Evaluate the effect o f the
subcritical, supercritical
and ultrasupercritical
power plants on the net
efficiency and identify key
parameters for plant
designs and operations.
The net efficiencies of the subcritical, supercritical and ultrasupercritical power
plants are 37,42 and 46%, respectively.
The key parameters are (i) an advanced combustion system, (ii) a variable and dual
pressure operations, (iii) a spiral and vertical furnace circuit, (iv) a thermal design,
(v) a boiler material, (vi) a heat recovery, and (vii) an advanced S 02 emission
control.
Regan et al., 1996 LEBS a Purpose ideas to improve
the net efficiency.
The net efficiency is associated with condenser pressure, plant capacity and types of
coal-fired power stations.
The high pressure steam of 50 MPa at 600°C triple reheat stages gives the thermal
efficiency improvement by 3%.
A key to operate the power plant at a high temperature and pressure is the
introduction o f the advanced material.
Petermann and
Fett, 1997
FBC Study the effect of thermal
load on the power output.
Increasing the thermal load o f a 150-MW FBC from 70 to 100% results in an
increase of power output greater than 50 MW.
a LEBS is the advanced coal-fired low emission boiler system.

Reproduced w
ith permission o
f the copyright owner.
Further reproduction prohibited w
ithout permission.
Table 1.2 Research studies on improvement of power plant efficiency. (continued)
Reference Power Plant Research Objective Finding
U.S.DOE, 1999 PC Demonstrate the net
efficiency, the coal
consumption and CO2
emissions from various
types of the power plants.
The net efficiencies of the subcritical, supercritical and ultrasupercritical power
plants are 37.6, 39.9, and 41.4%, respectively.
The coal consumptions of the subcritical, supercritical and ultrasupercritical power
plants are 39.0, 37.3 and 36.0 kg/s, respectively.
CO2 emissions from the subcritical, supercritical and ultrasupercritical power plants
are 837, 789 and 761 kg/MWh, respectively.
Beer, 2000 PC Discuss the variation of
the net efficiency caused
by a change in types of
the power plants.
Changing the plant's configuration from the subcritical to the supercritical PC can
improve the net efficiency from 39.4 to 41.1% and can reduce the coal consumption
from 874 to 826 ktonne/year.
Kiga et al., 2000 PC Investigate the effect of
the preheated air
temperature and the 0 2
content on the combustion
efficiency.
Preheating the air temperature from 35 to 850°C enhances the combustion efficiency
from —90 to —92%.
Lowering the 0 2 content in the supplied air from 21 to 8% decreases the combustion
efficiency from —92 to —79%.
Chattopadhyay,
2000
PC Study the effect of the
process parameters on the
net efficiency.
The high excess air and the free moisture in coal give the low net efficiency.
The high pressure and the temperature as well as the high turbine and boiler
efficiency offer an increase of the net efficiency.
Reproduced
with perm
ission of the
copyright ow
ner. Further
reproduction prohibited
without
permission.
Table 1.2 Research studies on improvement o f power plant efficiency, (continued)
Reference Power Plant Research Objective Finding
U.S.DOE, 1999 PC Demonstrate the net
efficiency, the coal
consumption and C 02
emissions from various
types of the power plants.
The net efficiencies of the subcritical, supercritical and ultrasupercritical power
plants are 37.6, 39.9, and 41.4%, respectively.
The coal consumptions o f the subcritical, supercritical and ultrasupercritical power
plants are 39.0, 37.3 and 36.0 kg/s, respectively.
C02 emissions from the subcritical, supercritical and ultrasupercritical power plants
are 837, 789 and 761 kg/MWh, respectively.
Beer, 2000 PC Discuss the variation of
the net efficiency caused
by a change in types o f
the power plants.
Changing the plant’s configuration from the subcritical to the supercritical PC can
improve the net efficiency from 39.4 to 41.1% and can reduce the coal consumption
from 874 to 826 ktonne/year.
Kiga et al., 2000 PC Investigate the effect of
the preheated air
temperature and the 0 2
content on the combustion
efficiency.
Preheating the air temperature from 35 to 850°C enhances the combustion efficiency
from ~90 to -92%.
Lowering the 0 2 content in the supplied air from 21 to 8% decreases the combustion
efficiency from -92 to -79%.
Chattopadhyay,
2000
PC Study the effect o f the
process parameters on the
net efficiency.
The high excess air and the free moisture in coal give the low net efficiency.
The high pressure and the temperature as well as the high turbine and boiler
efficiency offer an increase o f the net efficiency.

Reproduced w
ith permission o
f the copyright owner.
Further reproduction prohibited w
ithout permission.
Table 1.2 Research studies on improvement of power plant efficiency. (continued)
Reference Power Plant Research Objective Finding
Kakaras et al.,
2002
PC Study a coal dryer to
reduce the moisture
content in coal.
Reducing the moisture from 50-60% to 15-22% results in an improvement of the net
efficiency up to 7.4%.
Kjaer, 2002 Ultrasuper - Study the advanced Using the advanced material results in an improvement of the net efficiency greater
critical PC material of boiler tubes. than 50%.
Toshiyuki et al.,
2002
PC Investigate the effect of
the air temperature.
Raising the temperature to 727°C results in a decrease of ignition delay, causing an
increase of the net efficiency.
Termuehlen and PC Study the key equipments The introduction of the feedwater heaters and the steam reheater as well as the
Emsperger, 2003 to improve the plant increase of the pressure and temperature in the steam cycle can improve the steam
efficiency. efficiency from 34 to 58% b.
Gwosdz et al., PC Study the advantage and Lowering the excess air results in an increase of the net efficiency, but causing a
2005 disadvantage of the excess corrosion problem due to a presence of the carbon monoxide (CO) content.
air on the net efficiency.
b iIt s noted that the steam power cycle efficiency is not the net efficiency. It is always higher than the net efficiency.
Reproduced
with perm
ission of the
copyright ow
ner. Further
reproduction prohibited
without
permission.
Table 1.2 Research studies on improvement of power plant efficiency, (continued)
Reference Power Plant Research Objective Finding
Kakaras et al.,
2002
PC Study a coal dryer to
reduce the moisture
content in coal.
Reducing the moisture from 50-60% to 15-22% results in an improvement o f the net
efficiency up to 7.4%.
Kjaer, 2002 Ultrasuper -
critical PC
Study the advanced
material of boiler tubes.
Using the advanced material results in an improvement o f the net efficiency greater
than 50%.
Toshiyuki et al.,
2002
PC Investigate the effect of
the air temperature.
Raising the temperature to 727°C results in a decrease o f ignition delay, causing an
increase of the net efficiency.
Termuehlen and
Emsperger, 2003
PC Study the key equipments
to improve the plant
efficiency.
The introduction of the feedwater heaters and the steam reheater as well as the
increase of the pressure and temperature in the steam cycle can improve the steam
efficiency from 34 to 58% b.
Gwosdz et al.,
2005
PC Study the advantage and
disadvantage o f the excess
air on the net efficiency.
Lowering the excess air results in an increase o f the net efficiency, but causing a
corrosion problem due to a presence o f the carbon monoxide (CO) content.
b It is noted that the steam power cycle efficiency is not the net efficiency. It is always higher than the net efficiency.

1.3.2 CO2 Capture Technologies
CO2 capture is one of the potential approaches to reduce GHG emissions and meet
Kyoto targets. The goal of the capture is to remove CO2 from industrial gas streams and
to inject the removed CO2 into underground reservoirs for storage and enhance oil
recovery (EOR). Capturing CO2 can be achieved by several techniques, including gas
absorption, adsorption, membrane separation and cryogenic distillation. Among these
techniques, the gas absorption by chemical solvents is the most economical solution for
capturing CO2 from high-volume gas streams (Metz et al., 2005). Figure 1.3 illustrates a
typical flow diagram of the CO2 absorption unit that includes an absorption section for
capturing CO2 and a solvent regeneration section for restoring an absorption capacity of a
solvent and producing a high-purity CO2 gaseous stream. Monoethanolamine (MEA) is
the most commonly used solvent in this process.
It is well-recognized that CO2 absorption is an energy-intensive process that
consumes a large amount of the heat for the solvent regeneration up to 4800 kJ/kg CO2
captured (Aroonwilas and Veawab, 2007). To put the absorption process into use, the
energy required must be extracted from the power-generation steam cycle that will cause
a reduction in the net efficiency of the power plants commonly referred to as an energy
penalty. By far, there are a number of studies that address the issue of the energy penalty
resulting from the integration of the CO2 capture unit into the power plants (Desideri and
Paolucci, 1999; David and Herzog, 2000; Nsakala et al., 2001; Rao and Rubin, 2002;
Fisher et al., 2005). However, those studies were done based on a fixed CO2 capture
target, without considering how the changes in such a target would affect the extent of the
energy penalty. One may expect a disproportion between the amount of CO2 removed
12
Reproduced with permission of the copyright owner. Further reproduction prohibited without permission.
1.3.2 C 0 2 Capture Technologies
C 0 2 capture is one of the potential approaches to reduce GHG emissions and meet
Kyoto targets. The goal o f the capture is to remove C 0 2 from industrial gas streams and
to inject the removed C 0 2 into underground reservoirs for storage and enhance oil
recovery (EOR). Capturing C 0 2 can be achieved by several techniques, including gas
absorption, adsorption, membrane separation and cryogenic distillation. Among these
techniques, the gas absorption by chemical solvents is the most economical solution for
capturing C 0 2 from high-volume gas streams (Metz et al., 2005). Figure 1.3 illustrates a
typical flow diagram of the C 0 2 absorption unit that includes an absorption section for
capturing C 0 2 and a solvent regeneration section for restoring an absorption capacity o f a
solvent and producing a high-purity C 0 2 gaseous stream. Monoethanolamine (MEA) is
the most commonly used solvent in this process.
It is well-recognized that C 0 2 absorption is an energy-intensive process that
consumes a large amount of the heat for the solvent regeneration up to 4800 kJ/kg C 0 2
captured (Aroonwilas and Veawab, 2007). To put the absorption process into use, the
energy required must be extracted from the power-generation steam cycle that will cause
a reduction in the net efficiency o f the power plants commonly referred to as an energy
penalty. By far, there are a number o f studies that address the issue o f the energy penalty
resulting from the integration o f the C 0 2 capture unit into the power plants (Desideri and
Paolucci, 1999; David and Herzog, 2000; Nsakala et al., 2001; Rao and Rubin, 2002;
Fisher et al., 2005). However, those studies were done based on a fixed C 0 2 capture
target, without considering how the changes in such a target would affect the extent o f the
energy penalty. One may expect a disproportion between the amount o f C 0 2 removed
12
Reproduced with permission of the copyright owner. Further reproduction prohibited without permission.

Treated gas Condenser
CO2 product
Reflux drum
Cooler Reboiler
Rich amine pump Lean amine pump
Figure 1.3 Flow diagram of MEA-based CO2 absorption unit.
(Modified from Kohl and Nielsen, 1997)
13
Reproduced with permission of the copyright owner. Further reproduction prohibited without permission.
MEA/Wateimake up
Treated gas
Cooler
Heat exchangerBlower
Cooler
oo00a
00
Condenser
CO2 product
Reflux drum
Pump
Steam
v _ (yl t̂HReboiler
Rich amine pump Lean amine pump
Figure 1.3 Flow diagram of MEA-based CO2 absorption unit.
(Modified from Kohl and Nielsen, 1997)
13
Reproduced with permission of the copyright owner. Further reproduction prohibited without permission.

and the corresponding energy penalty as, from the fundamental viewpoint, the energy
requirement for the CO2 capture does not correlate in a proportional manner with the
efficiency of the CO2 capture unit. It is therefore worth examining if there is an optimal
point providing the most environmental benefit with the least energy penalty.
1.4 Research Objectives
This study is aimed at investigating the effects of the various operating and design
parameters on the improvement in the net efficiency of the pulverized coal-fired power
plants as well as the reduction in the emissions of GHGs from electricity generation by
coal. The key parameters governing the efficiency improvement are identified and used
to determine the optimal design and operating conditions that offer the maximum power
plant efficiency. The investigation focuses on both subcritical and supercritical
pulverized coal-fired power plants. The present study also examines how the net
efficiency of the power plants responds to the changes in the performance of the
integrated CO2 capture unit, thus helping identify the optimal capture target that offers
the least energy penalty per unit of CO2 captured. This study is carried out by first
developing a process-based computer model of pulverized coal-fired power plants that is
built on the principles of coal combustion, combustion chemistry, heat transfer from
combustion zone, combined material and energy balances, and thermodynamics of a
steam power cycle. Simulation of the developed model is then performed for a sensitivity
analysis using the rank correlation coefficient and the Monte Carlo simulation approaches
in order to arrive at the optimal operating and design conditions. In addition, the
levelized cost of electricity, the cost of electricity difference and the capital equivalent
14
Reproduced with permission of the copyright owner. Further reproduction prohibited without permission.
and the corresponding energy penalty as, from the fundamental viewpoint, the energy
requirement for the CO2 capture does not correlate in a proportional manner with the
efficiency o f the CO2 capture unit. It is therefore worth examining if there is an optimal
point providing the most environmental benefit with the least energy penalty.
1.4 Research Objectives
This study is aimed at investigating the effects o f the various operating and design
parameters on the improvement in the net efficiency o f the pulverized coal-fired power
plants as well as the reduction in the emissions o f GHGs from electricity generation by
coal. The key parameters governing the efficiency improvement are identified and used
to determine the optimal design and operating conditions that offer the maximum power
plant efficiency. The investigation focuses on both subcritical and supercritical
pulverized coal-fired power plants. The present study also examines how the net
efficiency o f the power plants responds to the changes in the performance o f the
integrated CO2 capture unit, thus helping identify the optimal capture target that offers
the least energy penalty per unit o f CO2 captured. This study is carried out by first
developing a process-based computer model o f pulverized coal-fired power plants that is
built on the principles o f coal combustion, combustion chemistry, heat transfer from
combustion zone, combined material and energy balances, and thermodynamics o f a
steam power cycle. Simulation o f the developed model is then performed for a sensitivity
analysis using the rank correlation coefficient and the Monte Carlo simulation approaches
in order to arrive at the optimal operating and design conditions. In addition, the
levelized cost of electricity, the cost o f electricity difference and the capital equivalent
14
Reproduced with permission of the copyright owner. Further reproduction prohibited without permission.

method are simulated to reveal the cost comparison between the subcritical and
supercritical pulverized coal-fired power plants. The sensitivity analysis of the cost
model is performed to investigate the individual effect of cost inputs on the cost of
electricity.
This thesis is divided into seven chapters. Introduction and research objectives are
presented in this chapter. Chapter 2 provides the basic principles of coal combustion and
its chemistry as well as a literature review of the coal-fired power plants and the CO2
capture unit. Details of development and simulation of the pulverized coal-fired power
plant model are given in Chapter 3. Simulation and optimization results for the
subcritical pulverized coal-fired power plant are reported in Chapter 4, whereas the
results for the supercritical pulverized coal-fired power plant are presented in Chapter 5.
Chapter 6 provides an economic implication of the study. Finally, conclusions drawn
from the study and recommendations for future work are given in Chapter 7.
15
Reproduced with permission of the copyright owner. Further reproduction prohibited without permission.
method are simulated to reveal the cost comparison between the subcritical and
supercritical pulverized coal-fired power plants. The sensitivity analysis o f the cost
model is performed to investigate the individual effect o f cost inputs on the cost of
electricity.
This thesis is divided into seven chapters. Introduction and research objectives are
presented in this chapter. Chapter 2 provides the basic principles o f coal combustion and
its chemistry as well as a literature review of the coal-fired power plants and the CO2
capture unit. Details o f development and simulation o f the pulverized coal-fired power
plant model are given in Chapter 3. Simulation and optimization results for the
subcritical pulverized coal-fired power plant are reported in Chapter 4, whereas the
results for the supercritical pulverized coal-fired power plant are presented in Chapter 5.
Chapter 6 provides an economic implication of the study. Finally, conclusions drawn
from the study and recommendations for future work are given in Chapter 7.
15
Reproduced with permission of the copyright owner. Further reproduction prohibited without permission.

Chapter Two
Literature Review and Fundamental
This chapter provides background in combustion process, basic principles of coal
combustion and its chemistry, as well as thermodynamics associated with a steam or
vapor power cycle. A literature review of the pulverized coal-fired power plants and the
CO2 capture unit is also given here.
2.1 Development of Combustion Process
Development of combustion process started in 1697 with Stahl proposing a
hypothetical combustion theory (Singer, 1991). During the 1700's, Joseph and Lavoisier
discovered that oxygen (02) in the atmosphere was an important element supporting
combustion of substances, paving the way for modern combustion theory (Singer, 1991).
Also during the 1700's, Black discovered latent heat of fusion and vaporization being
released through the combustion process (Singer, 1991). With a specific amount of heat
released, it was found that different substances offered different magnitudes of
temperature change during the combustion. This finding led to a concept of heat capacity
commonly used today. In 1824, French engineer Sadi Carnot proposed a reversible
power cycle known as "Carnot" cycle that was capable of producing work energy from a
theoretical operation running between two thermal reservoirs, i.e. a high-temperature heat
source and a low-temperature heat sink (Smith et al., 1996). During the mid 1800's, Joule
demonstrated how the work was able to transform into heat energy through water-based
16
Reproduced with permission of the copyright owner. Further reproduction prohibited without permission.
Chapter Two
Literature Review and Fundamental
This chapter provides background in combustion process, basic principles o f coal
combustion and its chemistry, as well as thermodynamics associated with a steam or
vapor power cycle. A literature review o f the pulverized coal-fired power plants and the
CO2 capture unit is also given here.
2.1 Development of Combustion Process
Development o f combustion process started in 1697 with Stahl proposing a
hypothetical combustion theory (Singer, 1991). During the 1700’s, Joseph and Lavoisier
discovered that oxygen (O2) in the atmosphere was an important element supporting
combustion o f substances, paving the way for modem combustion theory (Singer, 1991).
Also during the 1700’s, Black discovered latent heat o f fusion and vaporization being
released through the combustion process (Singer, 1991). With a specific amount o f heat
released, it was found that different substances offered different magnitudes o f
temperature change during the combustion. This finding led to a concept o f heat capacity
commonly used today. In 1824, French engineer Sadi Carnot proposed a reversible
power cycle known as “Camof ’ cycle that was capable o f producing work energy from a
theoretical operation running between two thermal reservoirs, i.e. a high-temperature heat
source and a low-temperature heat sink (Smith et al., 1996). During the mid 1800’s, Joule
demonstrated how the work was able to transform into heat energy through water-based
16
Reproduced with permission of the copyright owner. Further reproduction prohibited without permission.

experiments (Smith et al., 1996). All these findings are considered the fundamental
concept to the design and construction of the current power generation processes.
2.2 Chemistry of Coal Combustion
The operational concept of coal-fired power generation is to generate heat by
combusting coal (usually pulverized) in a furnace, and then transferring such heat to the
vapor power cycle where water serving as a working fluid is heated and transformed into
superheated & high-pressure steam that drives a series of turbines for electricity
generation. The coal combustion begins with evaporation of moisture in coal and
undergoes the process called "devolatilization" where coal particles release volatile
organic compounds under high temperature. Then, the coal particles are combusted at a
higher temperature after the volatile compounds are driven off. From the chemistry
viewpoint, the combustion of coal is associated with chemical reactions of oxygen (02) in
air with carbon (C) and other elements in coal including hydrogen (H), nitrogen (N), and
sulfur (S). Gaseous products of the coal combustion mainly consist of carbon dioxide
(CO2), water vapor (H20), sulfur dioxide (SO2), and nitrogen oxides (N0x) as well as
nitrogen (N2) and excess oxygen (02) from the air.
combustion are (de Nevers, 2000):
C + 02 _, CO2
The main reactions in the coal
(2.1)
H + y4 o, — y2H2o (2.2)
S + 02 ...„ SO2 (2.3)
0 + N 2 NO + N (2.4) -=---=-'-
17
Reproduced with permission of the copyright owner. Further reproduction prohibited without permission.
experiments (Smith et al., 1996). All these findings are considered the fundamental
concept to the design and construction o f the current power generation processes.
2.2 Chemistry of Coal Combustion
The operational concept o f coal-fired power generation is to generate heat by
combusting coal (usually pulverized) in a furnace, and then transferring such heat to the
vapor power cycle where water serving as a working fluid is heated and transformed into
superheated & high-pressure steam that drives a series o f turbines for electricity
generation. The coal combustion begins with evaporation o f moisture in coal and
undergoes the process called “devolatilization” where coal particles release volatile
organic compounds under high temperature. Then, the coal particles are combusted at a
higher temperature after the volatile compounds are driven off. From the chemistry
viewpoint, the combustion of coal is associated with chemical reactions o f oxygen (O2) in
air with carbon (C) and other elements in coal including hydrogen (H), nitrogen (N), and
sulfur (S). Gaseous products o f the coal combustion mainly consist o f carbon dioxide
(CO2), water vapor (H2O), sulfur dioxide (SO2), and nitrogen oxides (NOx) as well as
nitrogen (N2) and excess oxygen (O2) from the air. The main reactions in the coal
combustion are (de Nevers, 2000):
c + o 2 • c o 2 (2 .1)
h +/<o 2 — y2H2o (2 .2 )
s + o 2 — s o 2 (2.3)
o + n 2 NO + N (2.4)
17
Reproduced with permission of the copyright owner. Further reproduction prohibited without permission.

N+02 NO+0 (2.5)
NO + 72 0 2 NO2 (2.6)
N2 + 0 2 2N0 (2.7)
Note that the water vapor in the produced flue gas is also derived from free moisture in
coal. With a known composition of coal as well as the moisture content, the
concentrations of all combustion products in the flue gas stream can be calculated. In
addition to the gaseous products, the coal combustion also generates by-products
producing ashes and particulate matters that cannot be volatilized.
2.3 Heat of Combustion
Heat of combustion (qh) is primarily an integration of exothermic heats released
from chemical reactions listed above (Reactions 2.1 through 2.7). The qh in kJ/kg of coal
can be evaluated by (Perry et al., 1997)
qh = 2.326[146.58C + 568.78H + 29.4S — 6.58A — 51.53(0 + (2.8)
where C, H, S, A, 0, and N are weight percentages (on a dry basis) of carbon, hydrogen,
sulfur, ash, oxygen, and nitrogen, respectively. This dry basis heat of combustion is
usually referred to as "High Heating Value", HHV (Singer, 1991; Smith et al., 1996) of
which a fraction will be consumed through evaporation of the free moisture in the
supplied coal during the actual combustion process. This leads to a reduction in heat
available for steam generation in the vapor power cycle. The reduced heat of combustion
is commonly known as "Low Heating Value" (LHV), q1 ,
ql = qh — L •W (2.9)
18
Reproduced with permission of the copyright owner. Further reproduction prohibited without permission.
N + 0 2 ^ NO + O (2.5)
N 0 + / 0 2 — N 0 2 (2.6)
N 2 + 0 2 = 2M ? (2.7)
Note that the water vapor in the produced flue gas is also derived from free moisture in
coal. With a known composition o f coal as well as the moisture content, the
concentrations of all combustion products in the flue gas stream can be calculated. In
addition to the gaseous products, the coal combustion also generates by-products
producing ashes and particulate matters that cannot be volatilized.
2.3 Heat of Combustion
Heat o f combustion (qh) is primarily an integration o f exothermic heats released
from chemical reactions listed above (Reactions 2.1 through 2.7). The qh in kJ/kg of coal
can be evaluated by (Perry et al., 1997)
qh = 2.326[l46.58C + 568.78H + 29.4S - 6.58A - 51.53{0 + JV)] (2.8)
where C, H, S, A, O, and N are weight percentages (on a dry basis) o f carbon, hydrogen,
sulfur, ash, oxygen, and nitrogen, respectively. This dry basis heat o f combustion is
usually referred to as “High Heating Value”, H H V (Singer, 1991; Smith et al., 1996) of
which a fraction will be consumed through evaporation o f the free moisture in the
supplied coal during the actual combustion process. This leads to a reduction in heat
available for steam generation in the vapor power cycle. The reduced heat o f combustion
is commonly known as “Low Heating Value” (LHV), q, ,
q , = q k - L - W (2.9)
18
Reproduced with permission of the copyright owner. Further reproduction prohibited without permission.

where W represents mass of water vapor in the produced flue gas per unit mass of coal
burned, and L denotes the latent heat of water vaporization.
2.4 Steam Power Cycle
Coal-based electricity generation is commonly achieved through the use of the
steam power cycle that receives heat from the coal combustion and converts the heat into
work output in form of electricity. The "Rankine" cycle is the simplest steam power
cycle that was first introduced by William Rankine, a Scottish engineering professor, in
1859 (Singer, 1991; Smith et al., 1996). This basic steam cycle is composed of four main
components: (i) a boiler where the combustion heat is utilized for generating high-
pressure superheated steam, (ii) a turbine system driven by generated steam to produce
electricity, (iii) a condenser where low-pressure and low-quality steam exiting the turbine
system is condensed into saturated liquid water (or condensate), and (iv) a high-pressure
feedwater pump used for circulating liquid water back to the boiler. The relatively low
efficiency of the Rankine cycle lead to a modified cycle known as "Reheat Rankine"
cycle where reduced-energy steam extracted from a front part of the turbine system is
routed to the boiler for reheating before sent back to a next part of the turbine for further
electricity generation. The reheating process helps maintain a high energy level of the
superheated steam driving the turbine, thus providing additional work output that results
in an increase in the thermal efficiency of the steam cycle. A single reheat cycle with a
double casing steam turbine was implemented in actual power plants in the mid 1920's
and became the standard equipment in the late 1940's after successful invention of a
high-pressure boiler. A double reheat with triple casing steam turbine was introduced in
19
Reproduced with permission of the copyright owner. Further reproduction prohibited without permission.
where W represents mass o f water vapor in the produced flue gas per unit mass o f coal
burned, and L denotes the latent heat o f water vaporization.
2.4 Steam Power Cycle
Coal-based electricity generation is commonly achieved through the use o f the
steam power cycle that receives heat from the coal combustion and converts the heat into
work output in form of electricity. The “Rankine” cycle is the simplest steam power
cycle that was first introduced by William Rankine, a Scottish engineering professor, in
1859 (Singer, 1991; Smith et al., 1996). This basic steam cycle is composed o f four main
components: (i) a boiler where the combustion heat is utilized for generating high-
pressure superheated steam, (ii) a turbine system driven by generated steam to produce
electricity, (iii) a condenser where low-pressure and low-quality steam exiting the turbine
system is condensed into saturated liquid water (or condensate), and (iv) a high-pressure
feedwater pump used for circulating liquid water back to the boiler. The relatively low
efficiency of the Rankine cycle lead to a modified cycle known as “Reheat Rankine”
cycle where reduced-energy steam extracted from a front part o f the turbine system is
routed to the boiler for reheating before sent back to a next part o f the turbine for further
electricity generation. The reheating process helps maintain a high energy level o f the
superheated steam driving the turbine, thus providing additional work output that results
in an increase in the thermal efficiency o f the steam cycle. A single reheat cycle with a
double casing steam turbine was implemented in actual power plants in the mid 1920’s
and became the standard equipment in the late 1940’s after successful invention of a
high-pressure boiler. A double reheat with triple casing steam turbine was introduced in
19
Reproduced with permission of the copyright owner. Further reproduction prohibited without permission.

the 1970's. Also, the efficiency of the Reheat Rankine cycle can be further improved by
integrating a series of the feedwater heaters (FWHs) into the system to help raise
temperature of feedwater before entered the boiler. Several portions of the superheated
steam extracted from the turbine system serves as heating media for either open type
feedwater heaters (deaerator) or closed type feedwater heaters. This integrated system,
referred to as "Reheat-regenerative Rankine" cycle, is the conceptual system used in the
coal-fired power stations today. A simplified flow diagram of the Reheat-regenerative
Rankine cycle is given in Figure 2.1. The thermal efficiency of the steam cycle (r/th) can
be determined from the heat input from the boiler ( .0boiler) and the power output from the
cycle ( Wout ) as follows.
* out th = r. V)
boiler
(2.10)
According to Figure 2.1, the power output is produced from HP (High-pressure), IP
(Intermediate-pressure), and LP (Low-pressure) turbines. Therefore, the total power
output from these turbines (*Total ) can be expressed as
W T,total = E * HP,i E * IP,i E * LP,i i=1 i=1 i=1
(2.11)
where if>. , and Pi/Lp,1 denote the power output produced from section i of the HP,
IP, and LP turbines, respectively. Total pumping power input ( P,total) is the sum of
power input for each individual pump (Wpi ).
P
W P,total =IT /r/ P,i i=1
20
(2.12)
Reproduced with permission of the copyright owner. Further reproduction prohibited without permission.
the 1970’s. Also, the efficiency o f the Reheat Rankine cycle can be further improved by
integrating a series o f the feedwater heaters (FWHs) into the system to help raise
temperature o f feedwater before entered the boiler. Several portions o f the superheated
steam extracted from the turbine system serves as heating media for either open type
feedwater heaters (deaerator) or closed type feedwater heaters. This integrated system,
referred to as “Reheat-regenerative Rankine” cycle, is the conceptual system used in the
coal-fired power stations today. A simplified flow diagram o f the Reheat-regenerative
Rankine cycle is given in Figure 2.1. The thermal efficiency o f the steam cycle {rjth) can
be determined from the heat input from the boiler ( QboUer) and the power output from the
cycle ( Wout) as follows.
According to Figure 2.1, the power output is produced from HP (High-pressure), IP
(Intermediate-pressure), and LP (Low-pressure) turbines. Therefore, the total power
output from these turbines ( WT total) can be expressed as
where WH P, W[Pi, and WLPJ denote the power output produced from section i o f the HP,
IP, and LP turbines, respectively. Total pumping power input ( Wptotal) is the sum of
pow er input for each individual pum p ( W P j ) .
■boiler
(2 .10)
m n o(2 .11)
(2 .12)(=i
20
Reproduced with permission of the copyright owner. Further reproduction prohibited without permission.

Pump
Turbine
Condenser
Pump Feedwater heater
HP High pressure turbine IP Intermediate pressure turbine LP Low pressure turbine
Figure 2.1 Simple scheme of Reheat-regenerative Rankine cycle.
21
Reproduced with permission of the copyright owner. Further reproduction prohibited without permission.
HP Turbine
Boiler
Condenser
PumpPump Feedwater heater
HP High pressure turbine IP Intermediate pressure turbineLP Low pressure turbine
Figure 2.1 Simple scheme o f Reheat-regenerative Rankine cycle.
21
Reproduced with permission of the copyright owner. Further reproduction prohibited without permission.

The power output from the steam cycle then can be written as
Wow = W T ,total W P,total (2.13)
The net heat input from the boiler is the sum of the heat for producing main steam
(Amain steam) and reheated steam (a ). The general equation can be written as
Qboiler = Amain steam + QRH (2.14)
From the practical viewpoint, it is rather common to identify the performance of the
power station in terms of the net efficiency (Net) that combines the efficiency of both
steam power cycle (77th) and combustor or furnace (furnace). The net efficiency is often
used as an index that directly correlates the rate of the coal consumption ( ?he. / ) to the
power of electricity generation ( s * out ,net)•
HHV-based efficiency;
LHV-based efficiency;
rinet
y i
VV out,net
coal q h
Tr/out net 1 net
m =
coal • q1
(2.15a)
(2.15b)
where Wout,net is the net power output after all unit operations (e.g. environmental
abatement units) are supplied by the power output from the steam cycle.
2.5 Design and Operation of Pulverized Coal-Fired Power Plants
Construction of large-scale pulverized coal-fired power plants began after the
successful development of conceptual design of Reheat-regenerative Rankine cycle. This
22
Reproduced with permission of the copyright owner. Further reproduction prohibited without permission.
The power output from the steam cycle then can be written as
Wout=WT'total- W P,total (2.13)
The net heat input from the boiler is the sum of the heat for producing main steam
( Qmain steam) and reheated steam ( QRH). The general equation can be written as
Qboiler ~ Qmain steam Q r H (2 .14)
From the practical viewpoint, it is rather common to identify the performance o f the
power station in terms o f the net efficiency ( rjnet) that combines the efficiency o f both
steam power cycle and combustor or furnace ( rjfurnace). The net efficiency is often
used as an index that directly correlates the rate o f the coal consumption ( mcoal) to the
power o f electricity generation ( Woul net).
HHV-based efficiency;
WV net ~ —1-—■ (2.15a)
™ COal '< lh
LHV-based efficiency;
0 , , , = - ^ - (2-15b)m c o a l'< ll
where Woutnet is the net power output after all unit operations (e.g. environmental
abatement units) are supplied by the power output from the steam cycle.
2.5 D esign and O peration o f Pulverized C oal-F ired Pow er Plants
Construction of large-scale pulverized coal-fired power plants began after the
successful development o f conceptual design of Reheat-regenerative Rankine cycle. This
22
Reproduced with permission of the copyright owner. Further reproduction prohibited without permission.

cycle consists of a once-through boiler, a single reheat-condensing turbine system, a
vacuum condenser, a condensate and a boiler feed pumps, and a set of open and closed
feedwater heaters (FWHs). The once-through boiler generates superheated steam by
receiving and utilizing heat from the coal combustion through a series of heat-transfer
modules, including superheaters (SHs), reheaters (RHs), an evaporator, and an
economizer. These heat-transfer modules are arranged along the flow path of a hot flue
gas stream to recover heat in sequential steps. The superheated steam from the boiler is
routed to a multi-stage turbine system that is designed to extract heat from steam to three
different pressure ranges: the high-pressure (HP), the intermediate-pressure (IP) and the
low-pressure (LP) ranges. The exhaust steam leaving the HP turbine is sent back to the
boiler and heated by the reheaters to superheated temperature before entering to the IP
turbine. The reheated steam now undergoes a pressure reduction through the IP turbine,
resulting in exhaust steam routed directly to the LP turbine. Low quality steam leaving
the LP turbine is then cooled and condensed in the vacuum condenser at a pressure of as
low as 6 kPa. At this time, the condensate is pumped through a series of the feedwater
heaters run by steam extracted from the turbine system at different pressures. The heated
condensate known as feedwater is now introduced back to the boiler to complete the
steam cycle operation. Note that the desired number of the feedwater heaters is based on
a general construction guideline for power capacity above 200 MW (Drbal et al., 1996).
The higher the plant capacity is, the greater the number of the feedwater heaters are
required.
In the late 1980s, the pulverized coal-fired power plants usually operated under
conditions below critical pressure of water, i.e., a temperature of 538°C and a pressure of
23
Reproduced with permission of the copyright owner. Further reproduction prohibited without permission.
cycle consists of a once-through boiler, a single reheat-condensing turbine system, a
vacuum condenser, a condensate and a boiler feed pumps, and a set o f open and closed
feedwater heaters (FWHs). The once-through boiler generates superheated steam by
receiving and utilizing heat from the coal combustion through a series o f heat-transfer
modules, including superheaters (SHs), reheaters (RHs), an evaporator, and an
economizer. These heat-transfer modules are arranged along the flow path o f a hot flue
gas stream to recover heat in sequential steps. The superheated steam from the boiler is
routed to a multi-stage turbine system that is designed to extract heat from steam to three
different pressure ranges: the high-pressure (HP), the intermediate-pressure (IP) and the
low-pressure (LP) ranges. The exhaust steam leaving the HP turbine is sent back to the
boiler and heated by the reheaters to superheated temperature before entering to the IP
turbine. The reheated steam now undergoes a pressure reduction through the IP turbine,
resulting in exhaust steam routed directly to the LP turbine. Low quality steam leaving
the LP turbine is then cooled and condensed in the vacuum condenser at a pressure o f as
low as 6 kPa. At this time, the condensate is pumped through a series o f the feedwater
heaters run by steam extracted from the turbine system at different pressures. The heated
condensate known as feedwater is now introduced back to the boiler to complete the
steam cycle operation. Note that the desired number of the feedwater heaters is based on
a general constmction guideline for power capacity above 200 MW (Drbal et al., 1996).
The higher the plant capacity is, the greater the number o f the feedwater heaters are
required.
In the late 1980s, the pulverized coal-fired power plants usually operated under
conditions below critical pressure o f water, i.e., a temperature o f 538°C and a pressure of
23
Reproduced with permission of the copyright owner. Further reproduction prohibited without permission.

16.54 MPa. Such "subcritical" pulverized coal-fired power plants have offered the HHV-
based net efficiency of 37.6% (U.S.DOE, 1999). With the growing electricity demand
and the increasing environmental concern about GHG emissions, there has been the need
to improve the efficiency of the power generation cycle. Recently, the development of the
advanced material has allowed the power plants to operate under supercritical and
ultrasupercritical conditions. The supercritical technology helps improve power plant
efficiency to as high as 39.9% (HHV) while the ultra-supercritical would offer the net
efficiency of 41.4% (HHV) (U.S.DOE, 1999).
This study focuses on the 425 MW (gross output) subcritical and supercritical
pulverized coal-fired power plants. Configurations of the power plants are based on the
existing technology as demonstrated in Figures 2.2 and 2.3. The typical operating
conditions of these power plants are 530-600°C main steam and reheating temperatures,
290-370 kg/s main steam capacity, 15-20% excess air for the coal combustion, and 3-6%
pressure drop across the feedwater heaters (Singer, 1991; Drbal et al., 1996; U.S.DOE,
1999, Perry et al., 1997; Kakaras et al., 2002; Woodruff, 2005).
In addition to the steam cycle described above, an air preheater is also considered
the other important component of the typical pulverized coal-fired power plants as it
helps recover heat from the coal combustion that is otherwise wasted through the
discharged flue gas. The preheater for the pulverized coal-fired power plants is
Ljungstrom type which is capable of raising temperature of the incoming air to 250-
350°C (Singer, 1991; Chattopadhyay, 2000; Woodruff, 2005).
24
Reproduced with permission of the copyright owner. Further reproduction prohibited without permission.
16.54 MPa. Such “subcritical” pulverized coal-fired power plants have offered the HHV-
based net efficiency o f 37.6% (U.S.DOE, 1999). With the growing electricity demand
and the increasing environmental concern about GHG emissions, there has been the need
to improve the efficiency o f the power generation cycle. Recently, the development o f the
advanced material has allowed the power plants to operate under supercritical and
ultrasupercritical conditions. The supercritical technology helps improve power plant
efficiency to as high as 39.9% (HHV) while the ultra-supercritical would offer the net
efficiency o f 41.4% (HHV) (U.S.DOE, 1999).
This study focuses on the 425 MW (gross output) subcritical and supercritical
pulverized coal-fired power plants. Configurations o f the power plants are based on the
existing technology as demonstrated in Figures 2.2 and 2.3. The typical operating
conditions o f these power plants are 530-600°C main steam and reheating temperatures,
290-370 kg/s main steam capacity, 15-20% excess air for the coal combustion, and 3-6%
pressure drop across the feedwater heaters (Singer, 1991; Drbal et al., 1996; U.S.DOE,
1999, Perry et al., 1997; Kakaras et al., 2002; Woodruff, 2005).
In addition to the steam cycle described above, an air preheater is also considered
the other important component o f the typical pulverized coal-fired power plants as it
helps recover heat from the coal combustion that is otherwise wasted through the
discharged flue gas. The preheater for the pulverized coal-fired power plants is
Ljungstrom type which is capable o f raising temperature o f the incoming air to 250-
350°C (Singer, 1991; Chattopadhyay, 2000; Woodruff, 2005).
24
Reproduced with permission of the copyright owner. Further reproduction prohibited without permission.

Fu
rnac
e/B
oil
er
Boller feed pump
Condensate pump —t
SH Superheater RH Reheater HP High pressure turbine IP Intermediate pressure turbine LP Low pressure turbine FWH Feedwater heater G Generator
Figure 2.2 Scheme of "subcritical" pulverized coal-fired power plant.
(Modified from Singer, 1991; Drbal et al., 1996;
U.S.DOE, 1999 and Kakaras et al., 2002)
25
Reproduced with permission of the copyright owner. Further reproduction prohibited without permission.
Furn
ace/
Boi
ler ^
_ T SffiEvaporator
Spray water
Condenser-Reheat
^CHjoi^er
fu '
Upper feedwater heater train^ Lower feedwater heater trpin
s<8 >A ir heate Deaerator
Boiler feed pump
Condensate pumpr*^>
Superheater ReheaterHigh pressure turbine Intermediate pressure turbine Low pressure turbine
FWH Feedwater heater G Generator
Figure 2.2 Scheme o f “subcritical” pulverized coal-fired power plant.
(Modified from Singer, 1991; Drbal et al., 1996;
U.S.DOE, 1999 and Kakaras et al., 2002)
25
Reproduced with permission of the copyright owner. Further reproduction prohibited without permission.

Fur
nace
/Boi
ler
Coal
Evaporator
II ►•11111 I ni• I 1
Air
eu
Upper fe dwater h ater train Lower feedwater he
is Merator
Boiler feed pump
LP
Condenser
Condensate pump
ter train
SH Superheater RH Reheater HP High pressure turbine IP Intermediate pressure turbine LP Low pressure turbine FWH Feedwater heater G Generator
Figure 2.3 Scheme of "supercritical" pulverized coal-fired power plant.
(Modified from Singer, 1991; Drbal et al., 1996;
U.S.DOE, 1999 and Kakaras et al., 2002)
26
Reproduced with permission of the copyright owner. Further reproduction prohibited without permission.
Fur
nace
/Boi
ler
Coal
^1 I ̂ 1 'V1 I —
„ " , SH 2 m 2 S H I Evaporator
Spray water ICondenserReheat
Eco'nomizer
Lower feedwuter heater trainUpper feedwater h ater train
Air heatei __Deaerator‘t§F- 1
Condensate pump
SH SuperheaterBoiler feed pump RH Reheater
HP High pressure turbineIP Intermediate pressure turbineLP Low pressure turbineFWH Feedwater heaterG Generator
Figure 2.3 Scheme of “supercritical” pulverized coal-fired power plant.
(Modified from Singer, 1991; Drbal et al., 1996;
U.S.DOE, 1999 and Kakaras et al., 2002)
26
Reproduced with permission of the copyright owner. Further reproduction prohibited without permission.

2.6 CO2 Capture from Coal-Fired Flue Gas
The current environmental abatement units that help remove air pollutants from
the pulverized coal-fired flue gas are composed of a low NO. burner, a selective catalytic
reduction (SCR) unit, a particulate removal unit, and a flue gas desulfurization (FGD)
unit. The NO„ emission is regulated by a combination of the low-NO„ burner with about
65% NO. removal and the SCR unit with about 63% NO. removal. The particulate
matters released to the surrounding are controlled by an electrostatic precipitator (ESP)
with about 99.99% particulate removal. The SO2 emission discharged to the atmosphere
is limited by the FGD unit with about 96% SO2 removal (U.S.DOE, 1999). The gas
absorption process is considered the upcoming abatement unit that would be installed at a
downstream of the FGD unit to capture CO2 before the flue gas is discharged through the
stack (see Figure 2.4).
As mentioned earlier, gas absorption into an aqueous alkanolamine solution is the
most suitable and practical technology for capturing CO2 from low-pressure flue gas
streams. This technology has been well-established for more than a half century to work
successfully in gas treating services as well as chemical industries. The typical process
flow diagram of the CO2 absorption unit was illustrated earlier in Figure 1.3.
Alkanolamines used for the CO2 capture can be classified into three types:
primary, secondary, and tertiary alkanolamines. The primary alkanolamines include
monoethanolamine (MEA) and diglycolamine (DGA). The secondary alkanolamines are
diethanolamine (DEA) and diisopropanolamine (DIPA) while the tertiary alkanolamines
are triethanolamine (TEA) and N-methyldiethanolamine (MDEA). Among these
alkanolamines, the MEA solvent is the most popular solvent due to its high reactivity
27
Reproduced with permission of the copyright owner. Further reproduction prohibited without permission.
2.6 C 0 2 Capture from Coal-Fired Flue Gas
The current environmental abatement units that help remove air pollutants from
the pulverized coal-fired flue gas are composed of a low NOx burner, a selective catalytic
reduction (SCR) unit, a particulate removal unit, and a flue gas desulfurization (FGD)
unit. The NOx emission is regulated by a combination o f the low-NOx burner with about
65% NOx removal and the SCR unit with about 63% NOx removal. The particulate
matters released to the surrounding are controlled by an electrostatic precipitator (ESP)
with about 99.99% particulate removal. The S 0 2 emission discharged to the atmosphere
is limited by the FGD unit with about 96% SO2 removal (U.S.DOE, 1999). The gas
absorption process is considered the upcoming abatement unit that would be installed at a
downstream of the FGD unit to capture CO2 before the flue gas is discharged through the
stack (see Figure 2.4).
As mentioned earlier, gas absorption into an aqueous alkanolamine solution is the
most suitable and practical technology for capturing CO2 from low-pressure flue gas
streams. This technology has been well-established for more than a half century to work
successfully in gas treating services as well as chemical industries. The typical process
flow diagram of the CO2 absorption unit was illustrated earlier in Figure 1.3.
Alkanolamines used for the CO2 capture can be classified into three types:
primary, secondary, and tertiary alkanolamines. The primary alkanolamines include
monoethanolamine (MEA) and diglycolamine (DGA). The secondary alkanolamines are
diethanolamine (DEA) and diisopropanolamine (DIPA) while the tertiary alkanolamines
are triethanolamine (TEA) and A-methyldiethanolamine (MDEA). Among these
alkanolamines, the MEA solvent is the most popular solvent due to its high reactivity
27
Reproduced with permission of the copyright owner. Further reproduction prohibited without permission.

Coa
Furnace
Air
Low NOx burner
SCR
Air prebeater
SCR Selective Catalytic Reduction ESP Electrostatic Precipitator FGD Flue Gas Desulfurization MEA Monoethanolamine
ESP FGD I
Treated gas gas
Stack
--....1 MEA-based plant
CO2 product
CO2 compression
Figure 2.4 Schematic diagram of integration of environmental abatement units.
28
Reproduced with permission of the copyright owner. Further reproduction prohibited without permission.
Furnace Treated
Low NOx burner
Stack
w vMEA-based plantAir prebeater
CO2 productSCR Selective Catalytic Reduction ESP Electrostatic PrecipitatorFGD Flue Gas DesulfurizationMEA Monoethanolamine
CO2 compression
Figure 2.4 Schematic diagram of integration o f environmental abatement units.
28
Reproduced with permission of the copyright owner. Further reproduction prohibited without permission.

with CO2. However, it is well-known that capturing CO2 using the MEA solvent is the
energy-intensive operation. Integrating the CO2 capture unit into the pulverized coal-
fired power plants would result in a significant reduction in the net power output and also
the net efficiency of the power plants since a portion of steam normally used for
electricity generation within the steam cycle must be utilized for the CO2 capture activity.
The energy requirement of the MEA-based absorption process could be as high as 4800
kJ/kg CO2 captured for a capture target of 90%. (Sakwattanapong, 2005; Aroonwilas and
Veawab, 2007). The high energy intensity can be compromised by reducing the CO2
capture efficiency.
29
Reproduced with permission of the copyright owner. Further reproduction prohibited without permission.
with CO2. However, it is well-known that capturing CO2 using the MEA solvent is the
energy-intensive operation. Integrating the CO2 capture unit into the pulverized coal-
fired power plants would result in a significant reduction in the net power output and also
the net efficiency o f the power plants since a portion o f steam normally used for
electricity generation within the steam cycle must be utilized for the CO2 capture activity.
The energy requirement o f the MEA-based absorption process could be as high as 4800
kJ/kg CO2 captured for a capture target o f 90%. (Sakwattanapong, 2005; Aroonwilas and
Veawab, 2007). The high energy intensity can be compromised by reducing the CO2
capture efficiency.
29
Reproduced with permission of the copyright owner. Further reproduction prohibited without permission.

Chapter Three
Development of Coal-Fired Power Plant Model
This study was carried out by simulating the operation and performance of the
pulverized coal-fired power plants over wide ranges of design and operating conditions.
A process-based computer model for the subcritical and supercritical pulverized coal-
fired power plants was developed on the basis of coal combustion, combustion chemistry,
heat transfer from the combustion zone, combined material and energy balances, and the
thermodynamics of a steam power cycle for electricity generation. The model was written
in a Microsoft® Excel spreadsheet using Crystal Ball® software add-in to perform a
sensitivity analysis. Simulation of this model gave essential information on the coal
consumption rate, the thermal efficiency, the net efficiency, the power output, and also
the CO2 emission rate from the coal combustion. The following sections provide details
of the model development & simulation, the model validation, and the sensitivity analysis
conducted in this study.
3.1 Model Development
The simulation model was built according to typical configurations of the
pulverized coal-fired power plants shown in Figures 2.2 and 2.3. A series of process
modules was formulated specifically for individual process components that were put
together to form the complete system of power generation. The principles used in such
modules are highlighted next.
30
Reproduced with permission of the copyright owner. Further reproduction prohibited without permission.
Chapter Three
Development of Coal-Fired Power Plant Model
This study was carried out by simulating the operation and performance o f the
pulverized coal-fired power plants over wide ranges o f design and operating conditions.
A process-based computer model for the subcritical and supercritical pulverized coal-
fired power plants was developed on the basis o f coal combustion, combustion chemistry,
heat transfer from the combustion zone, combined material and energy balances, and the
thermodynamics o f a steam power cycle for electricity generation. The model was written
in a Microsoft® Excel spreadsheet using Crystal Ball® software add-in to perform a
sensitivity analysis. Simulation o f this model gave essential information on the coal
consumption rate, the thermal efficiency, the net efficiency, the power output, and also
the CO2 emission rate from the coal combustion. The following sections provide details
o f the model development & simulation, the model validation, and the sensitivity analysis
conducted in this study.
3.1 Model Development
The simulation model was built according to typical configurations o f the
pulverized coal-fired power plants shown in Figures 2.2 and 2.3. A series o f process
modules was formulated specifically for individual process components that were put
together to form the complete system of power generation. The principles used in such
modules are highlighted next.
30
Reproduced with permission of the copyright owner. Further reproduction prohibited without permission.

3.1.1 Furnace
Energy released from coal combustion in the furnace in kJ/s is derived from two
main components: LHV-based combustion heat (Q1 = mcoai • ql ) and waste heat recovered
from a hot flue gas via the air preheater ( 0 preheater)• With a known composition of coal
and a moisture content, the 0 1 can be calculated using Equations (2.8) and (2.9). A
general equation for furnace heat ( ) can be written as
Qfurnace = a+ Qpreheater (3.1)
This furnace heat is translated into the change in enthalpy of the combustion flue gas,
which can be evaluated from the sum of enthalpy change for each combustion product
( AI:I1) as follows
m
Qfurnace = E All i=i
(3.2)
The AiIi is sensible heat that causes an increase in flue gas temperature (7) as given
below
= frhiCpidT (3.3)
Where and Cpj represent mass flow rate and heat capacity of the combustion product
i, respectively. The mass flow rates of the combustion products can be calculated by
performing the material balance based on Reactions (2.1) through (2.7) presented in the
previous chapter. By combining Equations (3.2) and (3.3), the temperature of the flue gas
leaving the furnace (the combustion zone) to the boiler (the heat transfer zone) can be
determined.
31
Reproduced with permission of the copyright owner. Further reproduction prohibited without permission.
3.1.1 Furnace
Energy released from coal combustion in the furnace in kJ/s is derived from two
main components: LHV-based combustion heat ( Q, = mcoal • qt) and waste heat recovered
from a hot flue gas via the air preheater ( Qpreheater). With a known composition of coal
and a moisture content, the Q, can be calculated using Equations (2.8) and (2.9). A
general equation for furnace heat ( Qfurnace) can be written as
Qfurnace Q l Qpreheater (^'1)
This furnace heat is translated into the change in enthalpy o f the combustion flue gas,
which can be evaluated from the sum of enthalpy change for each combustion product
(AH t) as follows
m
(h„,„. - T a m , (3.2)!=1
The AH i is sensible heat that causes an increase in flue gas temperature (7) as given
below
AH; = \m {CpJdT (3.3)
where mi and C . represent mass flow rate and heat capacity o f the combustion product
i, respectively. The mass flow rates o f the combustion products can be calculated by
performing the material balance based on Reactions (2.1) through (2.7) presented in the
previous chapter. B y com bining Equations (3 .2) and (3 .3), the temperature o f the flue gas
leaving the furnace (the combustion zone) to the boiler (the heat transfer zone) can be
determined.
31
Reproduced with permission of the copyright owner. Further reproduction prohibited without permission.

3.1.2 Once-through Boiler
While traveling through the boiler unit, the hot combustion flue gas from the
furnace gives away its energy for the production of high quality steam driving the turbine
system. Relationship between the furnace heat (Q furnace) and the heat absorbed by the
boiler ( Oboder ) can be expressed as
Oboiler = 71 boiler • 0 furnace (3.4)
where r holl„ is the efficiency of the once-through boiler. Based on a general boiler
design, the Oboiler is the combined heat absorbed through four heat-transfer components:
an economizer ( •Oecoo), an evaporator ( a mp ), a superheater (QS, ), and a reheater ( ).
A general heat equation can be written as
Qboiler = 0econ Qevap QSH + Q (3.5)
3.1.3 Turbines and Pumps
Actual power extracted from the turbine ( Pkr ) can be determined from turbine
efficiency (iir ) and isentropic power ( ,r/kT ,isen) as follows
WT 717' • WT,isen (3.6)
According to the process configurations in Figures 2.2 and 2.3, electricity is produced
from a series of the HP, IP, and LP turbines. Several portions of steam are also extracted
from these turbines and used in the feedwater heaters. This results in a variation in a
mass flow rate of steam that passes through each turbine section. As such, in this study
32
Reproduced with permission of the copyright owner. Further reproduction prohibited without permission.
3.1.2 Once-through Boiler
While traveling through the boiler unit, the hot combustion flue gas from the
furnace gives away its energy for the production o f high quality steam driving the turbine
system. Relationship between the furnace heat ( Qfurnace) and the heat absorbed by the
boiler ( Qboiler) can be expressed as
Qboiler Vboiler Qfurnace (^"4)
where rjboiler is the efficiency o f the once-through boiler. Based on a general boiler
design, the Qboiler is the combined heat absorbed through four heat-transfer components:
an economizer ( Qecon), an evaporator ( Qevap), a superheater ( QSH), and a reheater ( QRH).
A general heat equation can be written as
Qboiler = Qecon + Qevap + Q s H + QrH (3.5)
3.1.3 Turbines and Pumps
Actual power extracted from the turbine (WT) can be determined from turbine
efficiency (rjr ) and isentropic power ( WTJsen) as follows
» r = 7 r -»V*. (3-6)
According to the process configurations in Figures 2.2 and 2.3, electricity is produced
from a series o f the HP, IP, and LP turbines. Several portions o f steam are also extracted
from these turbines and used in the feedwater heaters. This results in a variation in a
mass flow rate of steam that passes through each turbine section. As such, in this study
32
Reproduced with permission of the copyright owner. Further reproduction prohibited without permission.

the power produced from each turbine is determined from the combined power from
individual sections. Total power output from turbines :otar) can be expressed as
W T,total E W IP,i E W LP,i i=1 i=1 i=1
(3.7)
where TITHpi , and ii/Lpj denote the power output produced from section i of the HP,
IP, and LP turbines, respectively.
Power input for the feedwater pump ( ) can be calculated from
W P isen VV
=
P(3.8)
rip
where lip and PiTp,is„ are pump efficiency and isentropic power of pump, respectively.
Total pumping power ( Vrippoi ) is the sum of the power input for individual pumps ( )
P
W P,total = ZW P,i i=1
Power output from the steam cycle then can be written as
W ont = W T,total —WP,total
(3.9)
(3.10)
3.1.4 Feedwater Heaters
Heat transfer of each feedwater heater can be determined by using the energy
balance principle demonstrating that total enthalpy of fluids entering the heater is equal to
total enthalpy leaving the heater. An energy equation of the feedwater heater can be
written as
33
Reproduced with permission of the copyright owner. Further reproduction prohibited without permission.
the power produced from each turbine is determined from the combined power from
individual sections. Total power output from turbines ( WT total) can be expressed as
m n o
(3-7>1=1 1=1 1=1
where WHP i , W[Pi, and WLPi denote the power output produced from section i o f the HP,
IP, and LP turbines, respectively.
Power input for the feedwater pump (Wp ) can be calculated from
WWP = - ^ ~ (3.8)
V p
where rjp and WP isen are pump efficiency and isentropic power o f pump, respectively.
Total pumping power ( Wp total) is the sum of the power input for individual pumps ( WP i )
(3.9)1=1
Power output from the steam cycle then can be written as
Wout=WTitotal- W P,otal (3.10)
3.1.4 Feedwater Heaters
Heat transfer o f each feedwater heater can be determined by using the energy
balance principle demonstrating that total enthalpy of fluids entering the heater is equal to
total enthalpy leaving the heater. An energy equation o f the feedwater heater can be
written as
33
Reproduced with permission of the copyright owner. Further reproduction prohibited without permission.

(3.11)
where and h. are mass flow rate and specific enthalpy of the stream i entering or
leaving the heater.
It should be noted that the working fluid in the steam-power cycle is water. Its
properties, especially enthalpy and entropy, depend on temperature and pressure within
the cycle. To calculate performance of the individual process components described
above, empirical correlations of steam properties are considerably significant. In this
study, the steam properties obtained from Perry et al. (1997) were regressed using
multiple linear and/or non-linear regressions by an approach of the Monte Carlo
simulation. An algorithm flowchart for data regression is given in Figure 3.1. The
enthalpy and entropy correlations of steam are
h= f(P,T,$).z1(a1P+b1P2 + ...+ di ln P)+ z2 (a2T + b2T2 +...+d2 1nT) (3.12a)
+ Z3 (a3s+b3s 2 +...+d3 lns)+e0
s= f(P,T,h )= zi(aiP + biP2 + ...+ di lnP)+ z2(a2T + b2T2 +...+d2 1nT) (3.12b)
+z3(a3h+b3h 2 +...+d3 lnh)+e0
where P, T, h ands denote pressure, temperature, specific enthalpy and specific entropy,
respectively. The coefficient z, , z2 and z3 are 0 or 1, and and ea are the
real number also listed in Appendix A.
Simulation of the developed model was done through computational steps as
illustrated in Figure 3.2. The calculations started with the input of the operating and
design parameters including the net power output of the power station, the coal
composition, the percentage of the excess air for the coal combustion, the temperature
34
Reproduced with permission of the copyright owner. Further reproduction prohibited without permission.
m it
Y l{mi -hi )in (3 .H )!=1 1-1
where mi and ht are mass flow rate and specific enthalpy of the stream i entering or
leaving the heater.
It should be noted that the working fluid in the steam-power cycle is water. Its
properties, especially enthalpy and entropy, depend on temperature and pressure within
the cycle. To calculate performance o f the individual process components described
above, empirical correlations o f steam properties are considerably significant. In this
study, the steam properties obtained from Perry et al. (1997) were regressed using
multiple linear and/or non-linear regressions by an approach o f the Monte Carlo
simulation. An algorithm flowchart for data regression is given in Figure 3.1. The
enthalpy and entropy correlations o f steam are
h = f ( P , T , s ) = z I ( a IP + blP 2 +... + d 3 lnP ) + z 2(a 2T + b2T 2 +... + d 2 InT)(3.12a)
+ z 3(a 3s + b3s +... + d 3 lns) + e0
s = f ( P , T , h ) = z 1( a 1P + bIP 2 +... + d j l n P ) + z 2( a 2T + b2T 2 +... + d 2 InT)(3.12b)
+ z 3(a 3h + b3h 2 +... + d 3 lnh) + e0
where P, T, h and s denote pressure, temperature, specific enthalpy and specific entropy,
respectively. The coefficientz , , z 2 and z 3 are 0 or 1, and a, 3,b1 3 ,...,dl 3 and e0are the
real number also listed in Appendix A.
Simulation o f the developed model was done through computational steps as
illustrated in Figure 3.2. The calculations started with the input o f the operating and
design parameters including the net power output o f the power station, the coal
composition, the percentage o f the excess air for the coal combustion, the temperature
34
Reproduced with permission of the copyright owner. Further reproduction prohibited without permission.

Multiple linear/non-linear equations
Guess a new set of coefficients
I 1
n n
e2 = v E(.. i,steam table — Y ixorrelationi=1 i=l
End
Data of steam properties from
steam table
Figure 3.1 Regression flowchart for correlating steam properties.
35
Reproduced with permission of the copyright owner. Further reproduction prohibited without permission.
No
Yes
End
Guess a new set of coefficients
Data of steam properties from
steam table
Multiple linear/non-linear equations
s r = E e * = H ( y i,steam table V i,correlation )i=l i - l
Figure 3.1 Regression flowchart for correlating steam properties.
35
Reproduced with permission of the copyright owner. Further reproduction prohibited without permission.

Start
Parameter Input: • Coal composition (C, H, N, S, 0, ash and moisture) • % excess air • Net power output • Temperatures (main steam, reheated steam, preheated air) • Pressures (boiler, condenser, FWHs) • Pressures of steam extracted from turbines • Pressure drops (boiler, FWHs) • Efficiency (boiler, turbines)
Calculations for Coal Combustion:
• Flue gas composition • Furnace heat • Flue gas temperature
Calculations for Steam Cycle: • Enthalpy of each steam • Mass fraction of each stream • Work from turbines • Work for pumps • Work output • Mass flow of steam
1
Calculations for Plant Performance: • Rate of coal consumption • Thermal efficiency of steam cycle • Net efficiency of power station
Calculations for Plant Emissions: • SO2 emission rate • NO„ emission rate • CO2 emission rate • PM emission rate
Figure 3.2 Computational algorithm of developed power plant model.
36
Reproduced with permission of the copyright owner. Further reproduction prohibited without permission.
Parameter Input:• Coal composition (C, H, N, S, O, ash and moisture)• % excess air• Net power output• Temperatures (main steam, reheated steam, preheated air)• Pressures (boiler, condenser, FWHs)• Pressures of steam extracted from turbines• Pressure drops (boiler, FWHs)• Efficiency (boiler, turbines)
Start
Calculations for Plant Performance:• Rate of coal consumption• Thermal efficiency of steam cycle• Net efficiency of power station
Calculations for Coal Combustion:
• Flue gas composition• Furnace heat• Flue gas temperature
Calculations for Plant Emissions:• SO2 emission rate• NOx emission rate• C 02 emission rate• PM emission rate
Calculations for Steam Cycle:• Enthalpy of each steam• Mass fraction of each stream• Work from turbines• Work for pumps• Work output• Mass flow of steam
Figure 3.2 Computational algorithm of developed power plant model.
36
Reproduced with permission of the copyright owner. Further reproduction prohibited without permission.

and pressure of process streams as well as the efficiency of process components (i.e. the
furnace, the boiler, the turbine and the pump). After the input step, the calculations were
done in parallel for the combustion of coal and the steam cycle. For the coal combustion,
flue gas composition was calculated on the basis of the material balance and presented as
percentages of N2, 02, CO2, H2O, SO2, and NOR. The furnace heat and the flue gas
temperature were then calculated. For the steam cycle, the calculations were started by
determining the enthalpy of each process stream based on the input operating conditions.
Mass fractions of individual process streams within the steam cycle were then calculated
by performing both energy and the material balances for all process components. At this
point, the calculated mass fractions and enthalpies were used for calculating works
associated with the turbines and pumps as well as the net work output per unit mass of
steam generated and rejected from the boiler and condenser, respectively. With the
specified power output in MW, the mass flow rates of steam at different process locations
were identified. Combining calculated results from both the coal combustion and steam
cycle provided information on the coal consumption rate, the net efficiency of power
stations and also the emission rates of the air pollutants, particularly NOR, particulate
matters (PM), SO2, and CO2. It is noted that the emission rate of NO was numerically
calculated by the relationship among molar flowrate of N2 and 02, reaction equilibrium
(Kr) and flame temperature in the furnace. The emission rate of PM was approximately
calculated by emission factors based on percentage by weight of ash in coal. These
calculations are demonstrated in Appendix A.
37
Reproduced with permission of the copyright owner. Further reproduction prohibited without permission.
and pressure o f process streams as well as the efficiency o f process components (i.e. the
furnace, the boiler, the turbine and the pump). After the input step, the calculations were
done in parallel for the combustion o f coal and the steam cycle. For the coal combustion,
flue gas composition was calculated on the basis o f the material balance and presented as
percentages o f N2, 0 2, C 0 2, H20 , S 0 2, and NOx. The furnace heat and the flue gas
temperature were then calculated. For the steam cycle, the calculations were started by
determining the enthalpy o f each process stream based on the input operating conditions.
Mass fractions of individual process streams within the steam cycle were then calculated
by performing both energy and the material balances for all process components. At this
point, the calculated mass fractions and enthalpies were used for calculating works
associated with the turbines and pumps as well as the net work output per unit mass of
steam generated and rejected from the boiler and condenser, respectively. With the
specified power output in MW, the mass flow rates o f steam at different process locations
were identified. Combining calculated results from both the coal combustion and steam
cycle provided information on the coal consumption rate, the net efficiency of power
stations and also the emission rates o f the air pollutants, particularly NOx, particulate
matters (PM), S 0 2, and C 0 2. It is noted that the emission rate o f NOx was numerically
calculated by the relationship among molar flowrate o f N2 and 0 2, reaction equilibrium
(Kp) and flame temperature in the furnace. The emission rate o f PM was approximately
calculated by emission factors based on percentage by weight o f ash in coal. These
calculations are demonstrated in Appendix A.
37
Reproduced with permission of the copyright owner. Further reproduction prohibited without permission.

3.2 Model Validation
The developed model was validated by comparing simulation results from this
study with data reported by the U.S.DOE (1999) and Kakaras et al. (2002). The
comparison was made under identical operating conditions as listed in Table 3.1. Note
that the previous studies provided no information on several important parameters,
including the temperature of the preheated air, the percentage of the excess air, as well as
the efficiency of the boiler and turbines. In this study, values of such parameters were
assigned in ranges in order to cover all possible operational scenarios. As a result, the
simulation outputs are also reported in ranges as shown in the table. It is clear that the
simulation results obtained from this study agree well with the literature data in the two
cases, thus validating the developed model.
3.3 Sensitivity Analysis and Performance Optimization
After the development of the power plant model, the sensitivity analysis by an
approach of the rank correlation coefficient was performed to reveal how individual
process parameters influence the performance of the pulverized coal-fired power plants,
particularly the net efficiency, the rate of coal consumption and CO2 emissions. In this
study, the analysis was carried out using a Monte Carlo simulation in which the general
concept was to randomly select values for all input parameters that were used to calculate
model outputs. This random-approach simulation was repeated for a number of trials
(30000 in this study), sufficient for establishing a correlation between input parameters
and output results and providing knowledge of the maximum and/or minimum output
values in order to reveal the optimal solution for the operation and design of the
38
Reproduced with permission of the copyright owner. Further reproduction prohibited without permission.
3.2 Model Validation
The developed model was validated by comparing simulation results from this
study with data reported by the U.S.DOE (1999) and Kakaras et al. (2002). The
comparison was made under identical operating conditions as listed in Table 3.1. Note
that the previous studies provided no information on several important parameters,
including the temperature o f the preheated air, the percentage o f the excess air, as well as
the efficiency of the boiler and turbines. In this study, values o f such parameters were
assigned in ranges in order to cover all possible operational scenarios. As a result, the
simulation outputs are also reported in ranges as shown in the table. It is clear that the
simulation results obtained from this study agree well with the literature data in the two
cases, thus validating the developed model.
3.3 Sensitivity Analysis and Performance Optimization
After the development o f the power plant model, the sensitivity analysis by an
approach of the rank correlation coefficient was performed to reveal how individual
process parameters influence the performance o f the pulverized coal-fired power plants,
particularly the net efficiency, the rate o f coal consumption and CO2 emissions. In this
study, the analysis was carried out using a Monte Carlo simulation in which the general
concept was to randomly select values for all input parameters that were used to calculate
model outputs. This random-approach simulation was repeated for a number o f trials
(30000 in this study), sufficient for establishing a correlation between input parameters
and output results and providing knowledge o f the maximum and/or minimum output
values in order to reveal the optimal solution for the operation and design o f the
38
Reproduced with permission of the copyright owner. Further reproduction prohibited without permission.

Table 3.1 Comparison between simulation results in this study and published data.
Description Case-1 (This study - U.S.DOE,
1999)
Case-2 (This study - Kakaras et al.,
2002) Coal type Illinois #6 Greek coal Net power output (MW) 397.0 336.0 Boiler temperature (°C) 538.0 536.0 Reheat temperature (°C) 538.0 540.0 HP turbine
1st stage-extract pressure (MPa) 4.16 3.54 IP turbine
l at stage-extract pressure (MPa) 1.92 2.00 r d stage-extract pressure (MPa) 1.21 1.05 ,-.rd .5 stage-extract pressure (MPa) - 0.518
LP turbine 1st stage-extract pressure (MPa) 0.46 0.223 r d stage-extract pressure (MPa) 0.165 0.074 3rd
stage-extract pressure (MPa) 0.088 0.031 4th stage-extract pressure (MPa) 0.0430 0.0060 5th stage-extract pressure (MPa) 0.0068 -
Discharge pressure of boiler feed pump (MPa)
20.00 24.65
Discharge pressure of condensate pump (MPa)
2.275 1.83
Preheated air temperature (°C)a (250.0-350.0) (250.0-350.0) % excess air a (15.0-20.0) (15.0-20.0) Pressure drop in FWHs (%) 3.0 3.7 Pressure drop in boiler (%) 9.0 22.0 Boiler efficiency (%)a (90.0-92.0) (90.0-92.0) Turbine efficiency (%)a (90.0-92.0) (90.0-92.0)
U.S.DOE, This study Kakaras et This study Performance 1999 al., 2002
Net efficiency (%) 37.6 35.4-38.5 37.1 34.6-38.1 Coal consumption (kg/sec) 39.0 37.9-40.4 162.3 157.2-169.5 CO2 emission (kg/MWh) 837 818-871 - 1207-1302 SO2 emission (kg/MWh) 1.42 1.39-1.48 - 2.19-2.36 NOx emission (kg/MWh) 1.86 2.17-2.05 - 0.53-0.64 PM emission (kg/MWh) 0.12 0.17-0.18 - 0.82-0.89
a Values were assigned in this study.
39
Reproduced with permission of the copyright owner. Further reproduction prohibited without permission.
Table 3.1 Comparison between simulation results in this study and published data.
Description Case-1 (This study - U.S.DOE,
1999)
Case-2(This study - Kakaras et al.,
2002)Coal type Illinois #6 Greek coalNet power output (MW) 397.0 336.0Boiler temperature (°C) 538.0 536.0Reheat temperature (°C) 538.0 540.0HP turbine
1st stage-extract pressure (MPa) 4.16 3.54IP turbine
1st stage-extract pressure (MPa) 1.92 2.002nd stage-extract pressure (MPa) 1.21 1.053rd stage-extract pressure (MPa) - 0.518
LP turbine1st stage-extract pressure (MPa) 0.46 0.2232nd stage-extract pressure (MPa) 0.165 0.0743rd stage-extract pressure (MPa) 0.088 0.0314th stage-extract pressure (MPa) 0.0430 0.00605th stage-extract pressure (MPa) 0.0068 -
Discharge pressure of boiler feed 20.00 24.65pump (MPa)Discharge pressure of condensate 2.275 1.83pump (MPa)Preheated air temperature (°C)a (250.0-350.0) (250.0-350.0)% excess aira (15.0-20.0) (15.0-20.0)Pressure drop in FWHs (%) 3.0 3.7Pressure drop in boiler (%) 9.0 22.0Boiler efficiency (%)a (90.0-92.0) (90.0-92.0)Turbine efficiency (%)a (90.0-92.0) (90.0-92.0)
PerformanceU.S.DOE,
1999This study Kakaras et
al., 2002This study
Net efficiency (%) 37.6 35.4-38.5 37.1 34.6-38.1Coal consumption (kg/sec) 39.0 37.9-40.4 162.3 157.2-169.5C 02 emission (kg/MWh) 837 818-871 - 1207-1302S 02 emission (kg/MWh) 1.42 1.39-1.48 - 2.19-2.36NOx emission (kg/MWh) 1.86 2.17-2.05 - 0.53-0.64PM emission (kg/MWh) 0.12 0.17-0.18 - 0.82-0.89
a Values were assigned in this study.
39
Reproduced with permission of the copyright owner. Further reproduction prohibited without permission.

pulverized coal-fired power plants. The following subsections are a brief description of
the Monte Carlo simulation and the rank correlation coefficient.
3.3.1 Monte Carlo Simulation
The Monte Carlo simulation is the stochastic method in which the concept is to
randomly select values of input parameters, and then perform the simulation in order to
observe a variation in the output values. This method is normally used for simulating a
real system by investigating different scenarios under uncertainty conditions. The
simulation result is on the basis of a probabilistic risk analysis. This work presents the
sensitivity analysis by applying the Monte Carlo simulation with various probabilistic
distributions as concluded in Table 3.2. The result of the sensitivity analysis clearly
identified which input process parameters contributed to changes in the output values. In
addition, the incorporation between the Monte Carlo simulation and the rank correlation
coefficient (see details in the next subsection) helps identify significance levels for
influential parameters in terms of the correlation coefficient lying between -1 and 1. If the
input has a significant effect on the output, the corresponding correlation coefficient will
be very high (nearly either -1 or 1). A positive coefficient represents that increasing the
input will increase the output whereas the negative coefficient represents that increasing
the input will decrease the output. The Monte Carlo simulation in this study was
performed using Crystal Ball® software as an add-in to Microsoft Excel®. The
relationship between the Monte Carlo simulation and the developed model is
demonstrated in Figure 3.3.
40
Reproduced with permission of the copyright owner. Further reproduction prohibited without permission.
pulverized coal-fired power plants. The following subsections are a brief description of
the Monte Carlo simulation and the rank correlation coefficient.
3.3.1 Monte Carlo Simulation
The Monte Carlo simulation is the stochastic method in which the concept is to
randomly select values o f input parameters, and then perform the simulation in order to
observe a variation in the output values. This method is normally used for simulating a
real system by investigating different scenarios under uncertainty conditions. The
simulation result is on the basis o f a probabilistic risk analysis. This work presents the
sensitivity analysis by applying the Monte Carlo simulation with various probabilistic
distributions as concluded in Table 3.2. The result o f the sensitivity analysis clearly
identified which input process parameters contributed to changes in the output values. In
addition, the incorporation between the Monte Carlo simulation and the rank correlation
coefficient (see details in the next subsection) helps identify significance levels for
influential parameters in terms of the correlation coefficient lying between -1 and 1. If the
input has a significant effect on the output, the corresponding correlation coefficient will
be very high (nearly either -1 or 1). A positive coefficient represents that increasing the
input will increase the output whereas the negative coefficient represents that increasing
the input will decrease the output. The Monte Carlo simulation in this study was
performed using Crystal Ball® software as an add-in to Microsoft Excel®. The
relationship between the Monte Carlo simulation and the developed model is
demonstrated in Figure 3.3.
40
Reproduced with permission of the copyright owner. Further reproduction prohibited without permission.

Table 3.2 Type of distribution curves used in this study.
Type of Distribution
Equation
Uniform distribution
1 f(x) (3.13) =
-
Where, 0, = minimum
02 = maximum
Normal distribution f(x) — 1 (x — p ) 21 (3.14) exp[
cr-571- 20-2—oo < x < -Foo Where,
• = mean
o- = standard deviation
Purpose
• It is used to represent the variability of randomness under valid ranges, i.e., the minimum and the maximum.
• All variability within the valid ranges are likely equal to occur.
• It is no valid range of the minimum and maximum.
• The variability of randomness is based on the nominal value and the standard deviation.
• Almost the variability of randomness is most likely to occur in the nominal value but the rest are symmetrically occurred across the nominal value.
• The standard deviation indicates how far the variability of randomness could occur.
Beta distribution
f(x) .__[ +16) i x"-, •(1—xr (3.15a) l(a)•F( /3)
Where,
/(x) = V' • e-jix (3.15b)
a = alpha = beta
• It is used to represent the variability of randomness under the valid ranges, i.e., the minimum and the maximum.
• It is used to represent the variability of randomness under either in percentage or in fractions.
• The percentage or the fraction of possible occurrence is specified as alpha or beta parameter.
• The negative skew implies that the alpha is greater than the beta, but positive skew implies vice versa.
Triangular distribution
f (x) =
h(x — 01 ) if 0, < x < 1
if 1 < x < 0,
(3.16a) 1 — 0,
h(02 — x)
0, —1
Where, 1 = Likeliest
h 2
(3.16b) = 0, — 0,
• It is used to represent the variability of randomness under the valid ranges, i.e., the minimum and the maximum.
• It is used to represent the variability of randomness falling mostly near the likeliest number under the triangular-shaped distribution.
(Source: Crystal Ball, 2004)
41
Reproduced with permission of the copyright owner. Further reproduction prohibited without permission.
Table 3.2 Type of distribution curves used in this study.
Type of Equation PurposeDistribution___________________Uniform idistribution = q _q
9x < x < 02 Where,
0, = minimum02 = maximum
• It is no valid range of the(3.14) minimum and maximum.
• The variability of randomness is based on the nominal value and the standard deviation.
• Almost the variability of randomness is most likely to occur in the nominal value but the rest are symmetrically occurred across the nominal value.
• The standard deviation indicates how far the variability of randomness could occur.
Normaldistribution f(x) = -
1rexp
12c t
-0 0 < X < + 00
Where,H = mean a = standard deviation
( x - p f
• It is used to represent the variability of randomness under valid ranges, i.e., the minimum and the maximum.
• All variability within the valid ranges are likely equal to occur.
Betadistribution f ( x ) =
H a + P)
Where,
r ( x ) = ^ - ' - e %a = alpha P = beta
(3.15b)
It is used to represent thevariability of randomness under the valid ranges, i.e., the minimum and the maximum.It is used to represent thevariability of randomness under either in percentage or infractions.The percentage or the fraction of possible occurrence is specified as alpha or beta parameter.The negative skew implies that the alpha is greater than the beta, but positive skew implies vice versa.
Triangulardistribution
/(* ) =
Where,/
h(x - 0,)i - e l
h(92 - x )e1-i
Likeliest2
if 9X < x < I(3.16a)
o,-o,(3.16b)
It is used to represent thevariability of randomness under the valid ranges, i.e., the minimum and the maximum.It is used to represent thevariability of randomness falling mostly near the likeliest numberunder the triangular-shapeddistribution.
(Source: Crystal Ball, 2004)
41
Reproduced with permission of the copyright owner. Further reproduction prohibited without permission.

Start
i
r Parameter Input: ".. • Coal composition (C, H, N, S, 0, ash and moisture) • % excess air • Net power output • Temperatures (main steam, reheated steam, preheated air) • Pressures (boiler, condenser, FWHs) • Pressures of steam extracted from turbines • Pressure drops (boiler, FWHs) • Efficiency (boiler, turbines)
s Calculations for Coal Combustion:
• Flue gas composition • Furnace heat • Flue gas temperature
$ Calculations for Steam Cycle:
• Enthalpy of each steam • Mass fraction of each stream • Work from turbines • Work for pumps • Work output • Mass flow of steam
-- — n 1 I I t I I 1 1 I 1 I 1 I 1 I I 1 1 t 1 1 1 I I I I i 1 I
Calculations for Plant Performance: • Rate of coal consumption • Thermal efficiency of steam cycle • Net efficiency of power station
1 Calculations for Plant Emissions:
• SO2 emission rate • NO„ emission rate • CO2 emission rate • PM emission rate
1
Monte Carlo Simulation and Rank Correlation Coefficient
Figure 3.3 Developed power plant model and Monte Carlo simulation.
42
Reproduced with permission of the copyright owner. Further reproduction prohibited without permission.
Start
Parameter Input:Coal composition (C, H, N, S, O, ash and moisture)% excess air Net power outputTemperatures (main steam, reheated steam, preheated air) Pressures (boiler, condenser, FWHs)Pressures of steam extracted from turbines Pressure drops (boiler, FWHs)Efficiency (boiler, turbines)
Calculations for Coal Combustion:
• Flue gas composition• Furnace heat• Flue gas temperature
Calculations for Steam Cycle:• Enthalpy of each steam• Mass fraction of each stream• Work from turbines• Work for pumps• Work output• Mass flow of steam
Calculations for Plant Performance:• Rate of coal consumption• Thermal efficiency of steam cycle• Net efficiency of power station
Calculations for Plant Emissions:• S 02 emission rate• NOx emission rate• C 02 emission rate• PM emission rate
T
M onte Carlo Sim ulation and R ank C orrelation Coefficient
Figure 3.3 Developed power plant model and Monte Carlo simulation.
42
Reproduced with permission of the copyright owner. Further reproduction prohibited without permission.

3.3.2 Rank Correlation Coefficient
The most recognized statistic methods for calculating the correlation coefficients
are (i) an ordinary correlation coefficient and (ii) a rank correlation coefficient. The rank
correlation technique was chosen in this study because it was able to handle the input and
output data that did not have a normal or a uniform distribution. The coefficient can be
calculated from the following equation.
n n
nExiyi — xi E yi
R=
11 n Xi2 —(n I
2
x i ) ni — (E
2
y i 3 /2Z
i=1 i=1 i=1 i=1
(3.17)
where xi and yi denote the data points of input and output, and n represents the number of
data points in a sample. A flowchart demonstrating ranking algorithms is given in Figure
3.4.
43
Reproduced with permission of the copyright owner. Further reproduction prohibited without permission.
3.3.2 Rank Correlation Coefficient
The most recognized statistic methods for calculating the correlation coefficients
are (i) an ordinary correlation coefficient and (ii) a rank correlation coefficient. The rank
correlation technique was chosen in this study because it was able to handle the input and
output data that did not have a normal or a uniform distribution. The coefficient can be
calculated from the following equation.
R = 1=1 1=1 1=1
- > I > 2 - [ ! > , •v 1=1 y V i=i v i=i y
(3.17)
i=i
where x, and y t denote the data points o f input and output, and n represents the number o f
data points in a sample. A flowchart demonstrating ranking algorithms is given in Figure
3.4.
43
Reproduced with permission of the copyright owner. Further reproduction prohibited without permission.

4D
0
Step la
10.75
10.96
17.97
10.63
16.74
14.68
11.35
11.33
10.94
15.05
11.68
13.90
11.91
10.44
11.63
11.21
13.47
11.97
13.25
12.59
Step 2b Step 3 Step 4'
10.44 (10.44,1) 3
10.63 (10.63,2) 5
1 10.75 2 10'
(10.75,3) 3 Ob.
20
10.94 (10.94,4) 2
10.96 (10.96,5) 19
11.21 (11.21,6) 17
11.33 (11.33,7) 8
11.35 (11.35,8) 7
11.63 (11.63,9) 4
11.68 (11.68,10) 18
11.91 (11.91,11) 10
11.97 (11.97,12) 16
12.59 (12.59,13) 11
13.25 (13.25,14) 1
13.47 (13.47,15) 9
13.90 (13.90,16) 6
14.68 (14.68,17) 15
15.05 (15.05,18) 12
16.74 (16.74,19) 14
17.97 (17.97,20) 13
a Raw data before ranked from the minimum to the maximum number. As shown in the figure, it is the example of a small set which contains only 20 data points. b New data after ranked from the minimum to the maximum. In this study, one set of data has 30000 numbers. Thus a quick sort algorithm is necessary in case developing own algorithm (Martin, 1971).
All values ranked will be substituted into parameter x of Equation (3.17). Another set of raw data will be ranked by using the same algorithm and put into parameter y of Equation (3.17).
Figure 3.4 Basic flowchart for ranking algorithm.
44
Reproduced with permission of the copyright owner. Further reproduction prohibited without permission.
S tep l a S tep 2b S tep 3 S tep 4C
10.75 10.44 (10.44,1) 310.96 10.63 (10.63,2) 517.97 1 10.75 2 „ (10.75,3) 3 „ 2010.63
w10.94 (10.94,4) 2
16.74 10.96 (10.96,5) 1914.68 11.21 (11.21,6) 1711.35 11.33 (11.33,7) 811.33 11.35 (11.35,8) 710.94 11.63 (11.63,9) 415.05 11.68 (11.68,10) 1811.68 11.91 (11.91,11) 1013.90 11.97 (11.97,12) 1611.91 12.59 (12.59,13) 1110.44 13.25 (13.25,14) 111.63 13.47 (13.47,15) 911.21 13.90 (13.90,16) 613.47 14.68 (14.68,17) 1511.97 15.05 (15.05,18) 1213.25 16.74 (16.74,19) 1412.59 17.97 (17.97,20) 13
a Raw data before ranked from the minimum to the maximum number. As shown in the figure, it is the example of a small set which contains only 20 data points.b New data after ranked from the minimum to the maximum. In this study, one set of data has 30000 numbers. Thus a quick sort algorithm is necessary in case developing own algorithm (Martin, 1971). c All values ranked will be substituted into parameter x of Equation (3.17). Another set of raw data will be ranked by using the same algorithm and put into parameter y of Equation (3.17).
Figure 3.4 Basic flowchart for ranking algorithm.
Reproduced with permission of the copyright owner. Further reproduction prohibited without permission.

3.3.3 Ranges of Input Parameters
Table 3.3 provides ranges of input parameters for the sensitivity analysis. (also
see Figures 3.5 and 3.6 for identified points of input) These values were based on typical
operating conditions and practical appearances of the subcritical and supercritical
pulverized coal-fired power plants. Note that type of data distributions for each
parameter was also provided, as it was required for input selection process during the
Monte Carlo simulation. The followings are the highlights of the primary assumptions for
the analysis.
• Inlet pressures of the HP, IP, and LP turbines as well as the backpressure were the
controllable operating conditions. They were defined as uniform distribution.
• Boiler temperature was ranged from 530 to 600°C. This parameter could not be
set at a specific value because it was changed with other factors such as the excess
air and the combustion temperature. The boiler temperature could be significantly
varied within a range of —10 to 5°C (Chattopadhyay, 2000). To handle the
asymmetric range of variation, the beta distribution was assigned for the Monte
Carlo simulation.
• The amount of air supplied to the furnace was assigned to be more than the
theoretical requirement, thus preventing incomplete combustion. The percentage
of the excess air fed into the system was ranged from 15 to 20% (Woodruff et al.,
2005), which was defined as the beta distribution.
• Pressure drop across the tube-side of the feedwater heaters ranged from 3 to 6%.
(Drbal et al., 1996) This parameter was defined as the normal distribution
45
Reproduced with permission of the copyright owner. Further reproduction prohibited without permission.
3.3.3 Ranges of Input Parameters
Table 3.3 provides ranges o f input parameters for the sensitivity analysis, (also
see Figures 3.5 and 3.6 for identified points o f input) These values were based on typical
operating conditions and practical appearances o f the subcritical and supercritical
pulverized coal-fired power plants. Note that type of data distributions for each
parameter was also provided, as it was required for input selection process during the
Monte Carlo simulation. The followings are the highlights o f the primary assumptions for
the analysis.
• Inlet pressures o f the HP, IP, and LP turbines as well as the backpressure were the
controllable operating conditions. They were defined as uniform distribution.
• Boiler temperature was ranged from 530 to 600°C. This parameter could not be
set at a specific value because it was changed with other factors such as the excess
air and the combustion temperature. The boiler temperature could be significantly
varied within a range of -10 to 5°C (Chattopadhyay, 2000). To handle the
asymmetric range o f variation, the beta distribution was assigned for the Monte
Carlo simulation.
• The amount o f air supplied to the furnace was assigned to be more than the
theoretical requirement, thus preventing incomplete combustion. The percentage
of the excess air fed into the system was ranged from 15 to 20% (Woodruff et al.,
2005), which was defined as the beta distribution.
• Pressure drop across the tube-side o f the feedwater heaters ranged from 3 to 6 %.
(Drbal et al., 1996) This parameter was defined as the normal distribution
45
Reproduced with permission of the copyright owner. Further reproduction prohibited without permission.

Reproduced w
ith permission o
f the copyright owner.
Further reproduction prohibited w
ithout permission.
Fu
rnac
e/B
oil
er
Coal
Q
r
Evapo
/ \ /
‘\ /
\ / —A
Air
CS OD 44
G 20
D C Boiler feed pump
8
24
CO absorption process/ Reboiler
LP
-- 7
28
0 Condensate pump
---it 36
29 30 31 32 33 34 35
Figure 3.5 Identified points of input parameters for subcritical PC.
—1%)_ _1
Reproduced
with perm
ission of the
copyright ow
ner. Further
reproduction prohibited
without
permission.
G 20
CO2 absorption I process/ Reboiler|I----
40HP LP
- -FSpray water -A
Condense!. Reheat
H 1 - - J __L - - M - - N
,<^>nomizer 1—0 C ondensate pump
36 "
-BCoal
A ir heater
Boiler feed pump
Air
Figure 3.5 Identified points o f input parameters for subcritical PC.

Reproduced w
ith permission o
f the copyright owner.
Further reproduction prohibited w
ithout permission.
r
Furn
ace
/Boile
r
Coal I
Q l• /•
/ / / •
\ / —A r--
Evaporator 17; 1—R1 FH
Spay
Air
ater
RH1
40 1 17
H 20
E 13
Deaerator' 9
8
Boiler feed pump
24 F
L LP
--A 28
Condens
1 P Condensate pump
—B 3 2
30 31 32 33 34 35
Figure 3.6 Identified points of input parameters for supercritical PC.
Reproduced
with perm
ission of the
copyright ow
ner. Further
reproduction prohibited
without
permission.
H 20
C O 2 absorption I process/ R eb o ilerf "1
LPs h ;
EvaporatorF G
Spray vyater - A
RH1 Reheat
- - M - - N -O- - 3 7 I J - - K
l - L p Condensate pump
- -B 3 6 --Coal
40 1Air heater Deaerator
Boiler feed pump
Air
Figure 3.6 Identified points o f input parameters for supercritical PC.

Reproduced w
ith permission o
f the copyright owner.
Further reproduction prohibited w
ithout permission.
Table 3.3 Main input for subcritical and supercritical PCs.
Point Pressure (MPa) Temperature (°C) Distribution Source
Min Max Min Max For Subcritical PC shown in Figure 3.5 A 0.0060 0.0068 36.3 38.5 Uniform Distribution Singer (1991), U.S.DOE, (1999), Kakaras et al. (2002)
B 1.830 2.275 36.3 38.5 Uniform Distribution U.S.DOE, (1999), Kakaras et al. (2002)
C 1.05 1.27 181.9 190.5 Uniform Distribution U.S.DOE, (1999), Kakaras et al. (2002)
D 19.99 20.57 196.5 196.7 Uniform Distribution Singer (1991), U.S.DOE, (1999)
E 16.64 19.00 530.0 600.0 Uniform Distribution for pressure, and Beta Distribution for temperature (minimum, maximum, alpha, beta) = (530.0, 600.0, 2.0, 3.0)
Singer (1991), Perry et al. (1997), U.S.DOE, (1999), Kakaras et al. (2002), Sanders (2004)
F 3.54 4.50 310.3 345.0 Uniform Distribution Singer (1991), U.S.DOE (1999), Kakaras et al. (2002), Sanders (2004)
G 3.19 4.10 530.0 600.0 Beta Distribution (minimum, maximum, alpha, beta) = (530.0, 600.0, 2.0, 3.0)
Singer (1991), Perry et al. (1997), U.S.DOE (1999), Chattopadhyay (2000), Kakaras et al. (2002), Sanders (2004)
H 2.00 2.52 469.5 506.0 Uniform Distribution Singer (1991), Kakaras et al. (2002), Sanders (2004)
I 1.05 1.27 381.9 411.8 Uniform Distribution Singer (1991), Kakaras et al. (2002), Sanders (2004)
J, K 0.60 0.90 334.9 346.5 Uniform Distribution
L 0.223 0.480 204.3 299.3 Uniform Distribution Singer (1991), Kakaras et al. (2002)
M 0.074 0.180 103.2 198.7 Uniform Distribution Singer (1991), Kakaras et al. (2002)
N 0.031 0.040 69.2 101.9 Uniform Distribution Singer (1991), Kakaras et al. (2002)
0 0.0060 0.0068 36.3 38.5 Uniform Distribution Singer (1991), U.S.DOE (1999), Kakaras et al. (2002)
P 0.103 250.0 350.0 Beta Distribution (minimum, maximum, alpha, beta) = (250.0, 350.0, 3.0, 3.0)
Chattopadhyay (2000), Kakaras et al. (2002)
Q 0.103 25.0 25.0 Fixed
Reproduced
with perm
ission of the
copyright ow
ner. Further
reproduction prohibited
without
permission.
Table 3.3 Main input for subcritical and supercritical PCs.
Point Pressure (MPa) Temperature (°C) Distribution SourceMin Max Min Max
For Subcritical PC shown in Figure 3.5A 0.0060 0.0068 36.3 38.5 Uniform Distribution Singer (1991), U.S.DOE, (1999), Kakaras etal. (2002)
B 1.830 2.275 36.3 38.5 Uniform Distribution U.S.DOE, (1999), Kakaras et al. (2002)
C 1.05 1.27 181.9 190.5 Uniform Distribution U.S.DOE, (1999), Kakaras et al. (2002)
D 19.99 20.57 196.5 196.7 Uniform Distribution Singer (1991), U.S.DOE, (1999)
E 16.64 19.00 530.0 600.0 Uniform Distribution for pressure, and Beta Distribution for temperature (minimum, maximum, alpha, beta)= (530.0, 600.0,2.0,3.0)
Singer (1991), Perry et al. (1997), U.S.DOE, (1999), Kakaras et al. (2002), Sanders (2004)
F 3.54 4.50 310.3 345.0 Uniform Distribution Singer (1991), U.S.DOE (1999), Kakaras et al. (2002), Sanders (2004)
G 3.19 4.10 530.0 600.0 Beta Distribution(minimum, maximum, alpha, beta) = (530.0, 600.0, 2.0,3.0)
Singer (1991), Perry et al. (1997), U.S.DOE (1999), Chattopadhyay (2000), Kakaras et al. (2002), Sanders (2004)
H 2.00 2.52 469.5 506.0 Uniform Distribution Singer (1991), Kakaras et al. (2002), Sanders (2004)
I 1.05 1.27 381.9 411.8 Uniform Distribution Singer (1991), Kakaras et al. (2002), Sanders (2004)
J, K 0.60 0.90 334.9 346.5 Uniform Distribution
L 0.223 0.480 204.3 299.3 Uniform Distribution Singer (1991), Kakaras et al. (2002)
M 0.074 0.180 103.2 198.7 Uniform Distribution Singer (1991), Kakaras et al. (2002)
N 0.031 0.040 69.2 101.9 Uniform Distribution Singer (1991), Kakaras et al. (2002)
0 0.0060 0.0068 36.3 38.5 Uniform Distribution Singer (1991), U.S.DOE (1999), Kakaras et al. (2002)
P 0.103 250.0 350.0 Beta Distribution(minimum, maximum, alpha, beta) = (250.0, 350.0, 3.0, 3.0)
Chattopadhyay (2000), Kakaras et al. (2002)
Q 0.103 25.0 25.0 Fixed

Reproduced w
ith permission o
f the copyright owner.
Further reproduction prohibited w
ithout permission.
Table 3.3 Main input for subcritical and supercritical PCs. (continued)
Point Pressure (MPa) Temperature (°C) Distribution Source
Min Max Min Max For Supercritical shown PC in Figure 3.6 A 0.0050 0.0068 33.1 38.5 Uniform Distribution Singer (1991), U.S.DOE, (1999), Kakaras et al. (2002),
Aroonwilas and Veawab (2007)
B 1.830 2.275 36.3 38.5 Uniform Distribution U.S.DOE, (1999), Kakaras et al. (2002)
C 1.05 1.27 181.9 190.5 Uniform Distribution U.S.DOE, (1999), Kakaras et al. (2002)
D 27.75 31.80 189.8 190.8 Uniform Distribution Singer (1991), U.S.DOE, (1999)
E 22.09 25.34 530.0 600.0 Uniform Distribution for pressure, and Beta Distribution for temperature (minimum, maximum, alpha, beta) = (530.0, 600.0, 2.0, 3.0)
Singer (1991), Perry et al. (1997), U.S.DOE, (1999), Kakaras et al. (2002), Sanders (2004)
F 5.50 7.05 380.9 436.8 Uniform Distribution Singer (1991), U.S.DOE (1999), Kakaras et al. (2002), Sanders (2004)
G 3.54 4.50 310.1 344.7 Uniform Distribution Singer (1991), U.S.DOE (1999), Kakaras et al. (2002), Sanders (2004)
H 3.19 4.10 530.0 600.0 Beta Distribution (minimum, maximum, alpha, beta) = (530.0, 600.0, 2.0, 3.0)
Singer (1991), Perry et al. (1997), U.S.DOE (1999), Chattopadhyay (2000), Kakaras et al. (2002), Sanders (2004)
I 2.00 2.52 469.5 506.0 Uniform Distribution Singer (1991), Kakaras et al. (2002), Sanders (2004)
J 1.05 1.27 381.9 411.8 Uniform Distribution Singer (1991), Kakaras et al. (2002), Sanders (2004)
K, L 0.60 0.90 334.9 346.5 Uniform Distribution
M 0.223 0.480 204.3 299.3 Uniform Distribution Singer (1991), Kakaras et al. (2002)
N 0.074 0.180 103.2 198.7 Uniform Distribution Singer (1991), Kakaras et al. (2002)
0 0.031 0.040 69.2 101.9 Uniform Distribution Singer (1991), Kakaras et al. (2002)
P 0.0050 0.0068 36.3 38.5 Uniform Distribution Singer (1991), U.S.DOE (1999), Kakaras et al. (2002)
Reproduced
with perm
ission of the
copyright ow
ner. Further
reproduction prohibited
without
permission.
Table 3.3 Main input for subcritical and supercritical PCs. (continued)
Point Pressure (MPa) Temperature (°C) Distribution SourceMin Max Min Max
For Supercritical shown PC in Figure 3.6A 0.0050 0.0068 33.1 38.5 Uniform Distribution Singer (1991), U.S.DOE, (1999), Kakaras etal. (2002),
Aroonwilas and Veawab (2007)
B 1.830 2.275 36.3 38.5 Uniform Distribution U.S.DOE, (1999), Kakaras et al. (2002)
C 1.05 1.27 181.9 190.5 Uniform Distribution U.S.DOE, (1999), Kakaras et al. (2002)
D 27.75 31.80 189.8 190.8 Uniform Distribution Singer (1991), U.S.DOE, (1999)
E 22.09 25.34 530.0 600.0 Uniform Distribution for pressure, and Beta Distribution for temperature (minimum, maximum, alpha, beta)= (530.0, 600.0,2.0,3.0)
Singer (1991), Perry et al. (1997), U.S.DOE, (1999), Kakaras et al. (2002), Sanders (2004)
F 5.50 7.05 380.9 436.8 Uniform Distribution Singer (1991), U.S.DOE (1999), Kakaras et al. (2002), Sanders (2004)
G 3.54 4.50 310.1 344.7 Uniform Distribution Singer (1991), U.S.DOE (1999), Kakaras et al. (2002), Sanders (2004)
H 3.19 4.10 530.0 600.0 Beta Distribution(minimum, maximum, alpha, beta) = (530.0,600.0,2.0, 3.0)
Singer (1991), Perry et al. (1997), U.S.DOE (1999), Chattopadhyay (2000), Kakaras et al. (2002), Sanders (2004)
I 2.00 2.52 469.5 506.0 Uniform Distribution Singer (1991), Kakaras et al. (2002), Sanders (2004)
J 1.05 1.27 381.9 411.8 Uniform Distribution Singer (1991), Kakaras et al. (2002), Sanders (2004)
K, L 0.60 0.90 334.9 346.5 Uniform Distribution
M 0.223 0.480 204.3 299.3 Uniform Distribution Singer (1991), Kakaras et al. (2002)
N 0.074 0.180 103.2 198.7 Uniform Distribution Singer (1991), Kakaras et al. (2002)
O 0.031 0.040 69.2 101.9 Uniform Distribution Singer (1991), Kakaras et al. (2002)
P 0.0050 0.0068 36.3 38.5 Uniform Distribution Singer (1991), U.S.DOE (1999), Kakaras et al. (2002)

Reproduced w
ith permission o
f the copyright owner.
Furth
er reproduction prohibited w
ithout perm
ission.
Table 3.3 Main input for subcritical and supercritical PCs. (continued)
Point Pressure (MPa) Temperature (°C) Distribution Source Min Max Min Max 0.103
Q
250.0 350.0 Beta Distribution (minimum, maximum, alpha, beta) = (250.0, 350.0, 3.0, 3.0)
Chattopadhyay (2000), Kakaras et al. (2002)
R 0.103 25.0 25.0 Fixed
Miscellaneous significant parameters
Description
%P
ress
ure
Dro
p
FWH 1
FWH 2
FWH 3
FWH 4
FWH 5
FWH 6
FWH 7 (for super- critical PC) Boiler
% Excess air
Boiler efficiency (%)
Turbine efficiency (%)
Free moisture in coal (%)
Min Max Distribution Source
-3.0% -6.0% Normal Distribution, -4.5 ± 1.5% Drbal et al. (1996)
-3.0% -6.0% Normal Distribution, -4.5 ± 1.5% Drbal et al. (1996)
-3.0% -6.0% Normal Distribution, -4.5 ± 1.5% Drbal et al. (1996)
-3.0% -6.0% Normal Distribution, -4.5 ± 1.5% Drbal et al. (1996)
-3.0% -6.0% Normal Distribution, -4.5 ± 1.5% Drbal et al. (1996)
-3.0% -6.0% Normal Distribution, -4.5 t 1.5% Drbal et al. (1996)
-3.0% -6.0% Normal Distribution, -4.5 ± 1.5% Drbal et al. (1996)
-9.0% -10.0% Normal Distribution, -9.5 ± 0.5% U.S.DOE (1999), Sanders (2004)
15.0% 20.0% Beta Distribution (minimum, maximum, alpha, beta) = (15.0, 20.0, 3.0, 3.0)
Woodruff et al. (2005)
90.0% 92.0% Uniform Distribution Termuehlen and Emsperger (2003)
90.0% 92.0% Uniform Distribution Termuehlen and Emsperger (2003)
11.12% 17.60% Beta Distribution (minimum, maximum, alpha, beta)
U.S.DOE (1999), Geers and O'Brien (2002)
= (11.12, 17.6, 3.0, 3.0)
Reproduced
with perm
ission of the
copyright ow
ner. Further
reproduction prohibited
without
permission.
Table 3.3 Main input for subcritical and supercritical PCs. (continued)
Point Pressure (MPa) Min Max
Temperature (°C) Min Max
Distribution Source
0.103Q
250.0 350.0 Beta Distribution(minimum, maximum, alpha, beta) = (250.0, 350.0, 3.0, 3.0)
Chattopadhyay (2000), Kakaras et al. (2002)
r 0.103 25.0 25.0 Fixed -
Miscellaneous significant parameters
Description Min Max Distribution Source
FWH 1 -3.0% -6.0% Normal Distribution, -4.5 ± 1.5% Drbal etal. (1996)FWH 2 -3.0% -6.0% Normal Distribution, -4.5 ± 1.5% Drbal etal. (1996)
ft FWH 3 o -3.0% -6.0% Normal Distribution, -4.5 ± 1.5% Drbal etal. (1996)Q FWH 4<D
-3.0% -6.0% Normal Distribution, -4.5 ± 1.5% Drbal et al. (1996)
g FWH 5 -3.0% -6.0% Normal Distribution, -4.5 ± 1.5% Drbal etal. (1996)£ FWH 6 -3.0% -6.0% Normal Distribution, -4.5 ± 1.5% Drbal etal. (1996)
^ FWH 7 (for supercritical PC)
-3.0% -6.0% Normal Distribution, -4.5 ± 1.5% Drbal etal. (1996)
Boiler -9.0% -10.0% Normal Distribution, -9.5 ± 0.5% U.S.DOE (1999), Sanders (2004)
% Excess air 15.0% 20.0% Beta Distribution(minimum, maximum, alpha, beta)= (15.0, 20.0, 3.0, 3.0)
Woodruff et al. (2005)
Boiler efficiency (%) 90.0% 92.0% Uniform Distribution Termuehlen and Emsperger (2003)Turbine efficiency (%) 90.0% 92.0% Uniform Distribution Termuehlen and Emsperger (2003)Free moisture in coal (%)
%
11.12% 17.60% Beta Distribution(minimum, maximum, alpha, beta)= (11.12, 17.6,3.0,3.0)
U.S.DOE (1999), Geers and O'Brien (2002)

with the standard deviation of 0.75 percent point. The pressure drop across a
shell-side of feedwater heaters was considered insignificant.
• Pressure drop across the boiler unit was ranged from 9 to 10% under the normal
distribution with the standard deviation of 0.25 percent point (U.S.DOE, 1999;
Sanders, 2004).
• Free moisture content in coal was varied from 11.1 to 17.6 wt%. (U.S.DOE, 1999;
Geers and O'Brien, 2002). This parameter was defined as the beta distribution.
51
Reproduced with permission of the copyright owner. Further reproduction prohibited without permission.
with the standard deviation o f 0.75 percent point. The pressure drop across a
shell-side o f feedwater heaters was considered insignificant.
• Pressure drop across the boiler unit was ranged from 9 to 10% under the normal
distribution with the standard deviation o f 0.25 percent point (U.S.DOE, 1999;
Sanders, 2004).
• Free moisture content in coal was varied from 11.1 to 17.6 wt%. (U.S.DOE, 1999;
Geers and O'Brien, 2002). This parameter was defined as the beta distribution.
51
Reproduced with permission of the copyright owner. Further reproduction prohibited without permission.

Chapter Four
Results and Discussions: Subcritical Coal-Fired Power Plant
The main objective of this chapter is to provide a set of simulation results
obtained for the typical pulverized coal-fired power plant operated under the subcritical
conditions. The maximum-minimum ranges of the plant performance including the
thermal efficiency, the net efficiency and the pollutant emissions are reported in the first
part of the chapter. The sensitivity analysis by an approach of the rank correlation
coefficient is then presented in order to reveal the significant process parameters on the
plant efficiency and emissions. Individual parametric effects have been quantified and
are reported as a set of empirical correlations that can be readily utilized by power
industries and other researchers in the related field. In addition, this chapter also provides
the discussion regarding the application of the CO2 capture process for reducing GHG
emissions from the power plant as well as the potential impact on the energy penalty
caused by the CO2 capture activity.
4.1 Maximum-Minimum Ranges of Plant Performance
Table 4.1 summarizes the maximum-minimum ranges of the plant performance
including the thermal efficiency, the net efficiency, the rate of the coal consumption, the
combustion temperature, the emission rate of CO2 and other air pollutants. These
results were obtained through the Monte Carlo simulation in which the simulating
conditions (or values of the process parameters such as the steam pressure and
52
Reproduced with permission of the copyright owner. Further reproduction prohibited without permission.
Chapter Four
Results and Discussions: Subcritical Coal-Fired Power Plant
The main objective o f this chapter is to provide a set o f simulation results
obtained for the typical pulverized coal-fired power plant operated under the subcritical
conditions. The maximum-minimum ranges o f the plant performance including the
thermal efficiency, the net efficiency and the pollutant emissions are reported in the first
part o f the chapter. The sensitivity analysis by an approach o f the rank correlation
coefficient is then presented in order to reveal the significant process parameters on the
plant efficiency and emissions. Individual parametric effects have been quantified and
are reported as a set o f empirical correlations that can be readily utilized by power
industries and other researchers in the related field. In addition, this chapter also provides
the discussion regarding the application o f the CO2 capture process for reducing GHG
emissions from the power plant as well as the potential impact on the energy penalty
caused by the CO2 capture activity.
4.1 Maximum-Minimum Ranges of Plant Performance
Table 4.1 summarizes the maximum-minimum ranges o f the plant performance
including the thermal efficiency, the net efficiency, the rate o f the coal consumption, the
com bustion temperature, the em ission rate o f C 0 2 and other air pollutants. T hese
results were obtained through the Monte Carlo simulation in which the simulating
conditions (or values o f the process parameters such as the steam pressure and
52
Reproduced with permission of the copyright owner. Further reproduction prohibited without permission.
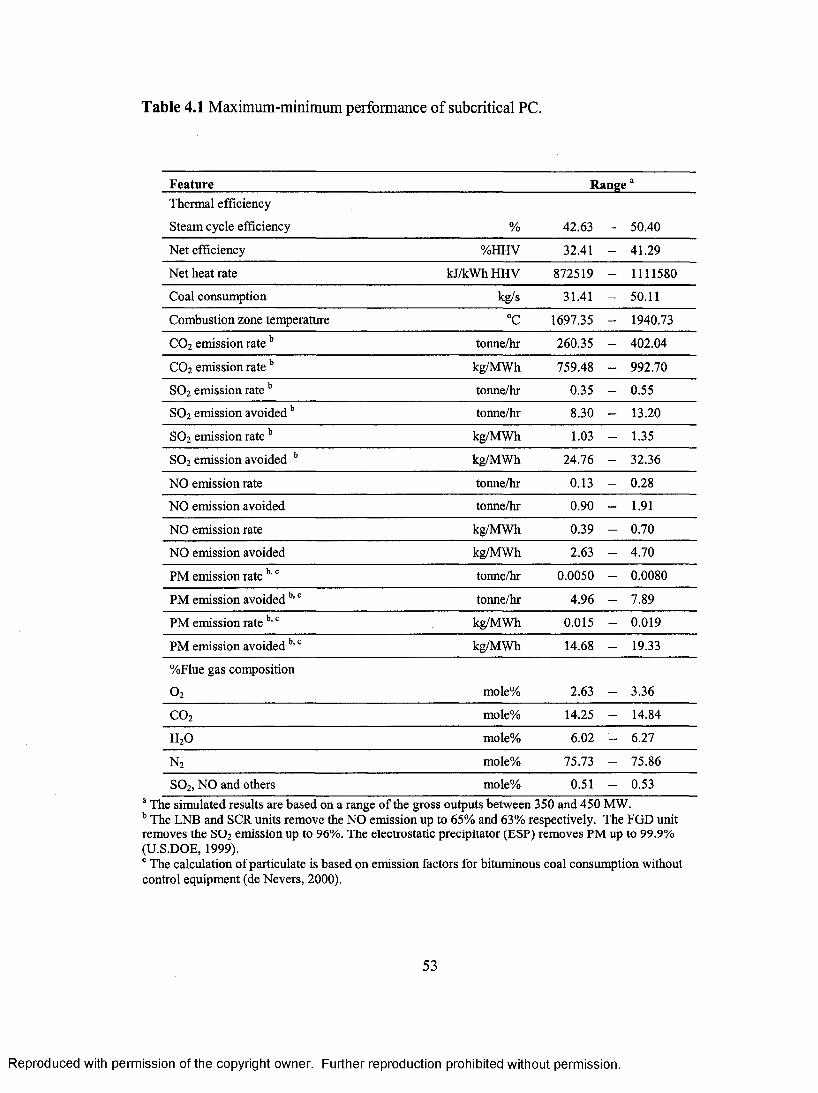
Table 4.1 Maximum-minimum performance of subcritical PC.
Feature Range aThermal efficiency
Steam cycle efficiency 42.63 - 50.40
Net efficiency %HHV 32.41 - 41.29
Net heat rate kJ/kWh HHV 872519 - 1111580
Coal consumption kg/s 31.41 - 50.11
Combustion zone temperature °C 1697.35 - 1940.73
CO2 emission rate b tonne/hr 260.35 - 402.04
CO2 emission rate b kg/MWh 759.48 - 992.70
SO2 emission rate b tonne/hr 0.35 - 0.55
SO2 emission avoided b tonne/hr 8.30 - 13.20
SO2 emission rate b kg/MWh 1.03 - 1.35
SO2 emission avoided b kg/MWh 24.76 - 32.36
NO emission rate tonne/hr 0.13 - 0.28
NO emission avoided tonne/hr 0.90 - 1.91
NO emission rate kg/MWh 0.39 - 0.70
NO emission avoided kg/MWh 2.63 - 4.70
PM emission rate b' c tonne/hr 0.0050 - 0.0080
PM emission avoided b' tonne/hr 4.96 - 7.89
PM emission rate b' c kg/MWh 0.015 - 0.019
PM emission avoided b' c kg/MWh 14.68 - 19.33
%Flue gas composition
02 mole% 2.63 - 3.36
CO2 mole% 14.25 - 14.84
H2O mole% 6.02 - 6.27
N2 mole% 75.73 - 75.86
SO2, NO and others mole% 0.51 - 0.53
a The simulated results are based on a range of the gross outputs between 350 and 450 MW. b The LNB and SCR units remove the NO emission up to 65% and 63% respectively. The FGD unit removes the SO2 emission up to 96%. The electrostatic precipitator (ESP) removes PM up to 99.9% (U.S.DOE, 1999).
The calculation of particulate is based on emission factors for bituminous coal consumption without control equipment (de Nevers, 2000).
53
Reproduced with permission of the copyright owner. Further reproduction prohibited without permission.
Table 4.1 Maximum-minimum performance of subcritical PC.
Feature RangeaThermal efficiency
Steam cycle efficiency % 42.63 - 50.40
Net efficiency %HHV 32.41 - 41.29
Net heat rate kJ/kWh HHV 872519 - 1111580
Coal consumption kg/s 31.41 - 50.11
Combustion zone temperature °C 1697.35 - 1940.73
CO2 emission rate b tonne/hr 260.35 - 402.04
C02 emission rate b kg/MWh 759.48 - 992.70
S 0 2 emission rateb tonne/hr 0.35 - 0.55
S 02 emission avoided b tonne/hr 8.30 - 13.20
SO2 emission rate b kg/MWh 1.03 - 1.35
S 02 emission avoided b kg/MWh 24.76 - 32.36
NO emission rate tonne/hr 0.13 - 0.28
NO emission avoided tonne/hr 0.90 - 1.91
NO emission rate kg/MWh 0.39 - 0.70
NO emission avoided kg/MWh 2.63 - 4.70
PM emission rateb’c tonne/hr 0.0050 - 0.0080
PM emission avoided b’c tonne/hr 4.96 - 7.89
PM emission rate b’c kg/MWh 0.015 - 0.019
PM emission avoidedb’c kg/MWh 14.68 - 19.33
%Flue gas composition
0 2 mole% 2.63 - 3.36
C 02 mole% 14.25 - 14.84
H20 mole% 6.02 - 6.27
n 2 mole% 75.73 - 75.86
S 02, NO and others mole% 0.51 - 0.53a The simulated results are based on a range of the gross outputs between 350 and 450 MW. b The LNB and SCR units remove the NO emission up to 65% and 63% respectively. The FGD unit removes the SO2 emission up to 96%. The electrostatic precipitator (ESP) removes PM up to 99.9% (U.S.DOE, 1999).c The calculation of particulate is based on emission factors for bituminous coal consumption without control equipment (de Nevers, 2000).
53
Reproduced with permission of the copyright owner. Further reproduction prohibited without permission.

temperature, the moisture content in coal and the excess air for the coal combustion) were
randomly selected for each run of the repeated simulation. Note that the results presented
in the table were based on combustion of Illinois #6 bituminous coal of which the
characteristics were given in Table 4.2. It is obvious that the performance of the
subcritical pulverized coal-fired power plant, i.e., the net efficiency and CO2 emissions
can be varied in the wide ranges (32.41-41.29% net efficiency and 759-993 kg/MWh CO2
emission). Significant variation in the performance indicates the important role of
process conditions under which the power plant is operated.
4.2 Sensitivity Analysis
To arrive at the improved plant performance (i.e. the net efficiency, the CO2
emissions and the coal consumption), a sensitivity analysis by an approach of the rank
correlation coefficient was performed to reveal the effect of operating parameter on the
power plant performance and emissions. Figure 4.1 shows the results presented as the
correlation coefficients of individual operating parameters that indicate proportional
effects of such parameters on the net efficiency, the CO2 emissions, and the rate of the
coal consumption. The operating parameters of interest include the temperature of the
preheated air, the moisture content in coal, the temperature of main steam, the
temperature of reheated steam, the efficiency of the boiler and turbine units, the percent
excess air for combustion, the pressure drop across the feedwater heaters and boiler, and
the steam pressures at different locations throughout the turbine system (i.e. HP inlet, HP
outlet, IP 1St extract, IP 2nd extract, IP outlet, LP 1st extract, LP 2nd extract, LP 3rd extract,
and LP outlet). Note that the value of the correlation coefficient ranges from
54
Reproduced with permission of the copyright owner. Further reproduction prohibited without permission.
temperature, the moisture content in coal and the excess air for the coal combustion) were
randomly selected for each run o f the repeated simulation. Note that the results presented
in the table were based on combustion o f Illinois #6 bituminous coal o f which the
characteristics were given in Table 4.2. It is obvious that the performance o f the
subcritical pulverized coal-fired power plant, i.e., the net efficiency and CO2 emissions
can be varied in the wide ranges (32.41-41.29% net efficiency and 759-993 kg/MWh CO2
emission). Significant variation in the performance indicates the important role of
process conditions under which the power plant is operated.
4.2 Sensitivity Analysis
To arrive at the improved plant performance (i.e. the net efficiency, the CO2
emissions and the coal consumption), a sensitivity analysis by an approach of the rank
correlation coefficient was performed to reveal the effect o f operating parameter on the
power plant performance and emissions. Figure 4.1 shows the results presented as the
correlation coefficients o f individual operating parameters that indicate proportional
effects o f such parameters on the net efficiency, the CO2 emissions, and the rate o f the
coal consumption. The operating parameters o f interest include the temperature o f the
preheated air, the moisture content in coal, the temperature o f main steam, the
temperature o f reheated steam, the efficiency o f the boiler and turbine units, the percent
excess air for combustion, the pressure drop across the feedwater heaters and boiler, and
the steam pressures at different locations throughout the turbine system (i.e. HP inlet, HP
outlet, IP 1st extract, IP 2nd extract, IP outlet, LP 1st extract, LP 2nd extract, LP 3rd extract,
and LP outlet). Note that the value o f the correlation coefficient ranges from
54
Reproduced with permission of the copyright owner. Further reproduction prohibited without permission.

Table 4.2 Characteristics of Illinois#6 bituminous coal.
Proximate Analysis (percent by weight)
Moisture content 11.12-17.6 %
Volatile content 34.99-44.2 %
Fixed carbon 44.19-45.0 %
Ash 9.7-10.8 %
Ultimate Analysis (percent by weight)
Carbon 69.0 %
Hydrogen 4.9 %
Nitrogen 1.0 %
Sulfur 4.3 %
Ash 10.8 %
Oxygen 10.0 %
(Source: U.S.DOE, 1999; Geers and O'Brien, 2002)
55
Reproduced with permission of the copyright owner. Further reproduction prohibited without permission.
Table 4.2 Characteristics o f Illinois#6 bituminous coal.
Proximate Analysis (percent by weight)
Moisture content 11.12-17.6 %
Volatile content 3 4 .9 9 .4 4 .2 %
Fixed carbon 44.19-45.0 %
Ash 9.7-10.8 %
Ultimate Analysis (percent by weight)
Carbon 69.0 %
Hydrogen 4.9 %
Nitrogen 1.0 %
Sulfur 4.3 %
Ash 10.8 %
Oxygen 10.0 %
(Source: U.S.DOE, 1999; Geers and O'Brien, 2002)
55
Reproduced with permission of the copyright owner. Further reproduction prohibited without permission.

6
Input
Preheated air temperature
Free moisture in coal
Main temperature
Reheat temperature
Boiler efficiency
Turbine efficiency
Excess air
Pressure drop of FWH & boiler
HP inlet
HP outlet
IP 1st extract
IP 2nd extract
IP 3rd extract
LP 1st extract
LP 2nd extract
LP 3rd extract
LP outlet
Boiler feed pressure
Condensate pressure
Deaerator inlet
-1.00 -0.75 -0.50 -0.25 0.00 0.25 0.50 0.75 1.00
Coefficient
0 Net efficiency (%) 12 CO2 (tonne/hour) ■ Coal consumption (kg/sec) Output
Figure 4.1 Results of sensitivity analysis by an approach of rank correlation coefficient.
56
Reproduced with permission of the copyright owner. Further reproduction prohibited without permission.
Input
Preheated air temperature
Free moisture in coal
M ain temperature
Reheat temperature
Boiler efficiency
Turbine efficiency
Excess air
Pressure drop o fF W H & boiler
HP inlet
HP outlet
IP 1st extract
IP 2nd extract
IP 3rd extract
LP 1st extract
LP 2nd extract
LP 3rd extract
LP outlet
Boiler feed pressure
C ondensate pressure
Deaerator inlet
-1.00 -0.75 -0.50 -0.25 0.00 0.25 0.50 0.75 1.00
Coefficient
□ Net efficiency (%) E3 C 02 (tonne/hour) ■ Coal consumption (kg/sec) O utpu t
Figure 4.1 Results o f sensitivity analysis by an approach of rank correlation coefficient.
56
Reproduced with permission of the copyright owner. Further reproduction prohibited without permission.

-1.00 to 1.00. In general, the positive coefficient indicates that an increase in value of
the selected parameter causes the plant performance or the output to rise whereas the
negative coefficient suggests otherwise. The magnitude of the coefficient is proportional
to the level of the effect on the plant performance. From the figure, major influential
parameters are the temperature of the preheated air, the efficiency of the boiler, the
moisture content in coal, the temperature of main steam, the temperature of reheated
steam, and the steam pressures at the outlet of the HP, IP, and LP turbines. Details of
individual parametric effects are given in the following sections.
4.3 Individual Effects of Process Parameters on Plant Performance
This section provides a comprehensive presentation of individual parametric
effects on the net efficiency of the subcritical pulverized coal-fired power plant. All
results presented here were obtained from the simulation of the power plant model
developed in this study. To reveal the true effect of a specific parameter, the simulation
was performed with fixed values of all process parameters, except for the parameter of
interest in which the value was varied within the predetermined range. Understanding
these parametric effects is essential for the development of empirical correlations in the
next section.
57
Reproduced with permission of the copyright owner. Further reproduction prohibited without permission.
-1.00 to 1.00. In general, the positive coefficient indicates that an increase in value of
the selected parameter causes the plant performance or the output to rise whereas the
negative coefficient suggests otherwise. The magnitude of the coefficient is proportional
to the level o f the effect on the plant performance. From the figure, major influential
parameters are the temperature o f the preheated air, the efficiency o f the boiler, the
moisture content in coal, the temperature o f main steam, the temperature o f reheated
steam, and the steam pressures at the outlet o f the HP, IP, and LP turbines. Details of
individual parametric effects are given in the following sections.
4.3 Individual Effects of Process Parameters on Plant Performance
This section provides a comprehensive presentation of individual parametric
effects on the net efficiency o f the subcritical pulverized coal-fired power plant. All
results presented here were obtained from the simulation o f the power plant model
developed in this study. To reveal the true effect o f a specific parameter, the simulation
was performed with fixed values o f all process parameters, except for the parameter o f
interest in which the value was varied within the predetermined range. Understanding
these parametric effects is essential for the development o f empirical correlations in the
next section.
57
Reproduced with permission of the copyright owner. Further reproduction prohibited without permission.

4.3.1 Effect of Moisture Content in Coal
Figure 4.2 demonstrates the direct effect of the free moisture content in coal on
the net efficiency of the subcritical pulverized coal-fired power plant. The higher the
moisture content, the lower the net efficiency. This is because, in the presence of free
moisture, a fraction of the heat released from the coal combustion is utilized through a
phase changing process that converts liquid water in supplied coal into water vapor
present in the combustion flue gas. Losing such energy during the phase changing
process leads to a reduction in the temperature of the combustion flue gas, reflecting a
lower amount of heat available for transfer into the steam cycle. From the figure, the
reduction in the net efficiency due to the presence of coal moisture is rather significant.
An increase in coal moisture by about 6% (i.e. 11.12-17.60%) causes the power plant net
efficiency to drop by 2.5 percent point (e.g. 35.0-32.5% net efficiency) regardless of the
temperature of the preheated air.
4.3.2 Effect of Preheated Air Temperature
The net efficiency of the pulverized coal-fired power plant can be improved by
preheating the air supplied for the coal combustion via the air preheater unit where waste
heat from the exhaust flue gas is recovered. The recovered waste heat provides extra heat
to the supplied air, resulting in an increase in the air temperature. Increasing the
temperature allows the combustion in the furnace to proceed at a higher temperature, thus
offering a higher quality of heat transferred to the steam cycle. Figure 4.2 shows that
preheating the supplied air to a higher temperature causes the net efficiency to increase in
a linear manner. Regardless of the moisture content in coal, a one percent point increase
58
Reproduced with permission of the copyright owner. Further reproduction prohibited without permission.
4.3.1 Effect of Moisture Content in Coal
Figure 4.2 demonstrates the direct effect o f the free moisture content in coal on
the net efficiency of the subcritical pulverized coal-fired power plant. The higher the
moisture content, the lower the net efficiency. This is because, in the presence o f free
moisture, a fraction o f the heat released from the coal combustion is utilized through a
phase changing process that converts liquid water in supplied coal into water vapor
present in the combustion flue gas. Losing such energy during the phase changing
process leads to a reduction in the temperature o f the combustion flue gas, reflecting a
lower amount of heat available for transfer into the steam cycle. From the figure, the
reduction in the net efficiency due to the presence o f coal moisture is rather significant.
An increase in coal moisture by about 6% (i.e. 11.12-17.60%) causes the power plant net
efficiency to drop by 2.5 percent point (e.g. 35.0-32.5% net efficiency) regardless o f the
temperature o f the preheated air.
4.3.2 Effect of Preheated Air Temperature
The net efficiency o f the pulverized coal-fired power plant can be improved by
preheating the air supplied for the coal combustion via the air preheater unit where waste
heat from the exhaust flue gas is recovered. The recovered waste heat provides extra heat
to the supplied air, resulting in an increase in the air temperature. Increasing the
temperature allows the combustion in the furnace to proceed at a higher temperature, thus
offering a higher quality o f heat transferred to the steam cycle. Figure 4.2 shows that
preheating the supplied air to a higher temperature causes the net efficiency to increase in
a linear manner. Regardless o f the moisture content in coal, a one percent point increase
58
Reproduced with permission of the copyright owner. Further reproduction prohibited without permission.

Net
Eff
icie
ncy
(%)
36.0
35.0 -
34.0 -
33.0 -
32.0 -
31.0 -
30.0
250
00)
3>
* °C.C111PC4 * *
.0. 00 40:16*.PC°4
aiSairtri at1311133EP Cri 11:3:13:1
0
Ci
szna 0,3 Ana A
arl dta SK X X < X
A
•I‘'
70#45001 .0461.°( X A
X AO( 3°°°41C /00 4E21/11111111114.'
ora30011/114•15Free Moisture in Coal (%)
o 11.12 0 12.74 a 14.36 x 15.98 x 17.60
275 300 325
Preheated Air Temperature (°C)
350
Figure 4.2 Effects of moisture content in coal and temperature of preheated air.
59
Reproduced with permission of the copyright owner. Further reproduction prohibited without permission.
S®0 sw
1a
36.0 -1
35.0 - o<x> «■
□ ID0034.0 -
A *
33.0 - X *X
as*32.0 -
31.0 -
30.0 -
— '” D nJJ^ JdCttInCIIJ3tP A A
^ a * * * * * * m M * * *
F ree M o is tu re in C oal (%o 11.12 □ 12.74 A 14.36 x 15.98 x 17.60
250 275 300 325
Preheated Air Temperature (°Q
350
Figure 4.2 Effects o f moisture content in coal and temperature o f preheated air.
59
Reproduced with permission of the copyright owner. Further reproduction prohibited without permission.

in the net efficiency can be achieved by raising the preheated air temperature by 80°C.
Note that the temperature of the preheated air should be limited up to 350°C due to a
metallurgical limitation of common air preheaters (Singer, 1991; Chattopadhyay, 2000;
Woodruff et al., 2005).
4.3.3 Effects of Main Steam Temperature and Reheating Temperature
Increasing the temperature of the superheated steam driving the turbines leads to a
higher enthalpy producing additional work from the steam cycle. This simply results in
an increase in the net efficiency of the power plant. Figure 4.3 illustrates a proportional
relationship between the net efficiency and the temperature of main steam generated from
the boiler unit. Reheating the temperature is also included in the figure as a parameter.
In general, increasing the temperature of either main steam or reheated steam by 50°C
results in an increase in the net efficiency by one half percent point. It should be noted
that, despite the positive effects of the steam temperatures on the plant efficiency, an
increase in such temperatures must be done within the metallurgical limitation of the
steam boiler, i.e. main steam pipe fabricated by a terrific material with 2.25Cr 1Mo can
tolerate the temperature up to about 545°C according to New Energy and Industrial
Technology Development Organization (NEDO) and Center for Coal Utilization Japan
(CCUJ) (2004).
60
Reproduced with permission of the copyright owner. Further reproduction prohibited without permission.
in the net efficiency can be achieved by raising the preheated air temperature by 80°C.
Note that the temperature o f the preheated air should be limited up to 350°C due to a
metallurgical limitation o f common air preheaters (Singer, 1991; Chattopadhyay, 2000;
Woodruff et al., 2005).
4.3.3 Effects of Main Steam Temperature and Reheating Temperature
Increasing the temperature o f the superheated steam driving the turbines leads to a
higher enthalpy producing additional work from the steam cycle. This simply results in
an increase in the net efficiency o f the power plant. Figure 4.3 illustrates a proportional
relationship between the net efficiency and the temperature o f main steam generated from
the boiler unit. Reheating the temperature is also included in the figure as a parameter.
In general, increasing the temperature o f either main steam or reheated steam by 50°C
results in an increase in the net efficiency by one half percent point. It should be noted
that, despite the positive effects o f the steam temperatures on the plant efficiency, an
increase in such temperatures must be done within the metallurgical limitation o f the
steam boiler, i.e. main steam pipe fabricated by a ferritic material with 2.25Cr IMo can
tolerate the temperature up to about 545°C according to New Energy and Industrial
Technology Development Organization (NEDO) and Center for Coal Utilization Japan
(CCUJ) (2004).
60
Reproduced with permission of the copyright owner. Further reproduction prohibited without permission.

36.0
Net
Eff
icie
ncy
(%)
35.5 -
35.0
34.5 -
34.0 -
33.5 -
33.0
530.0
w X
xxxx4X
)00011141° ..AinmAA a ow vosiartifirOso< aitetato c.---00 co
))0 *INA -.% itaabge At' Agrosionrsols°,,,,ci , 00 o ,604 coign ,00 ot0N.- -
walla 4:4000P o EP 40.10044000
<0 o Reheat Temperature (°C)
o 530.0 o 547.5 A 565.0 x 582.5 X 600.0
547.5 565.0 582.5 600.0
Temperature of Main Steam (°C)
Figure 4.3 Effects of main steam and reheated steam temperatures.
61
Reproduced with permission of the copyright owner. Further reproduction prohibited without permission.
36.0
35.5
^ 35.0U
1 34.5€w$ 34.0 S5
33.5
33.0530.0 547.5 565.0 582.5 600.0
Temperature of Main Steam (°Q
Figure 4.3 Effects o f main steam and reheated steam temperatures.
Reheat Temperature (°Qo 530.0 a 547.5 A 565.0 x 582.5 x 600.0
Reproduced with permission of the copyright owner. Further reproduction prohibited without permission.

4.3.4 Effects of Boiler and Turbine Efficiencies
Figure 4.4 shows the effects of the turbine and boiler efficiency on the net
efficiency of the power plant. An increase in the turbine efficiency from 90 to 92% leads
to a slight improvement in the net efficiency (i.e. 0.1 percent point) whereas an increase
in the boiler efficiency by the same magnitude (2%) results in about 0.75 percent point
increase in the efficiency. This indicates that the boiler efficiency plays an important role
in improving the efficiency of the power plant.
4.3.5 Effect of Excess Air Supply
The amount of the excess air supplied to the furnace is necessary, from the
practical viewpoint, to achieve the complete combustion. However, introducing the
excess air to the furnace leads to an increasing amount of gas-phase traveling through the
combustion zone and boiler unit, causing a reduction in the net efficiency of the power
plant. However, the reduction in the efficiency is rather small as demonstrated in Figure
4.5. About 3 percent increase in the excess air (i.e. from 16 to 19%) causes a slight
efficiency drop of 0.03 percent point. Therefore, the effect of the excess air may be
considered negligible.
62
Reproduced with permission of the copyright owner. Further reproduction prohibited without permission.
4.3.4 Effects of Boiler and Turbine Efficiencies
Figure 4.4 shows the effects o f the turbine and boiler efficiency on the net
efficiency o f the power plant. An increase in the turbine efficiency from 90 to 92% leads
to a slight improvement in the net efficiency (i.e. 0 .1 percent point) whereas an increase
in the boiler efficiency by the same magnitude (2%) results in about 0.75 percent point
increase in the efficiency. This indicates that the boiler efficiency plays an important role
in improving the efficiency o f the power plant.
4.3.5 Effect of Excess Air Supply
The amount o f the excess air supplied to the furnace is necessary, from the
practical viewpoint, to achieve the complete combustion. However, introducing the
excess air to the furnace leads to an increasing amount o f gas-phase traveling through the
combustion zone and boiler unit, causing a reduction in the net efficiency o f the power
plant. However, the reduction in the efficiency is rather small as demonstrated in Figure
4.5. About 3 percent increase in the excess air (i.e. from 16 to 19%) causes a slight
efficiency drop of 0.03 percent point. Therefore, the effect o f the excess air may be
considered negligible.
62
Reproduced with permission of the copyright owner. Further reproduction prohibited without permission.

35.7
35.6 AZ& A A, MANZa(tDM AON aftAA 46.a6LsfitOAAAA namemitad
35.4 -
Net
Eff
icie
ncy
(%)
35.2 cILAufiCI CanraarlD IINEE:Prai3Erp3 Ea 0 =Xi MacCIDallaci
35.0 -
34.8 "poem pp 4110(00.200:00> 0 010 0 03:CO CID CO
34.6 - Boiler Efficiency (%)
34.4 - *90.0
34.2 - 0 91.0
A 92.0 34.0
90.0 90.5 91.0 91.5 92.0
Turbine Efficiency (%)
Figure 4.4 Effects of boiler and turbine efficiencies.
63
Reproduced with permission of the copyright owner. Further reproduction prohibited without permission.
35.7 r --------------------------------------------- — .........3 5 . 6 - ^ AAA^ m m ^ a n u i n m A i A <m h w m ,
35.4 -g 35.2 m D m racnrno.aw :
§ 35-° 'H 34.8 *3xx«x> ooctxxaco «x»<*»a>o<»<*> o<x*> o < k » « < »
~ 34.6 Boiler Efficiency (%)
* 34 .4 - ♦ 90-°□ 91.0
34.2 -A 92.0
34.0----------------- -1-1---------------1--------------- 1---------------
90.0 90.5 91.0 91.5 92.0
Turbine Efficiency (%)
Figure 4.4 Effects o f boiler and turbine efficiencies.
a * a a ^ a * a a a
________ mnmnniiiriniiiUiJifipmin muLLimJi gmmMiixPaxn ™
»J>CX£S> <X>ctxxaoo «xxx>€»axx»co oooeo o <*sfx><» <®
Boiler Efficiency (%)<> 90.0
□ 91.0 A 92.0
Reproduced with permission of the copyright owner. Further reproduction prohibited without permission.

Net
Eff
icie
ncy
(%)
16.0 17.0 18.0 19.0
Excess Air (%)
Figure 4.5 Effect of excess air for coal combustion.
64
20.0
Reproduced with permission of the copyright owner. Further reproduction prohibited without permission.
34.8
&sE
34.715.0 16.0 17.0 18.0 19.0 20.0
Excess Air (%)
Figure 4.5 Effect o f excess air for coal combustion.
64
Reproduced with permission of the copyright owner. Further reproduction prohibited without permission.

4.3.6 Effect of Pressure Drop across the Steam Cycle
Based on the thermodynamic principles, the enthalpy of steam not only depends
on temperature but also pressure of the system. If the steam cycle is subjected to a high
pressure drop, a large amount of steam heat can be lost causing the net efficiency to
reduce. Figure 4.6 shows the effect of the pressure drop in the boiler unit and the FWH
train. It is clear that the pressure drop in the boiler unit has an impact on the net
efficiency of the power plant whereas the effect of the pressure drop in the FWH train is
considered negligible. Yet, the effect of the boiler pressure drop is rather insignificant.
An increase in the pressure drop by 2% contributes to a slight reduction in the net
efficiency (about 0.2 percent point).
4.3.7 Effects of Pressure and Pressure Distribution in the Turbine Series
In general, operating the steam cycle with a large difference between inlet
pressure and outlet pressure of turbine series (i.e. boiler pressure and condenser pressure)
tends to offer a high thermal efficiency of the power plant. In addition to these two
pressure boundaries, the steam pressures at different turbine stages also play important
roles in defining the efficiency of the power plant. The followings are the highlights of
such pressure effects that focus on the outlet pressure of the HP turbine, the 1st stage and
the outlet pressures of the IP turbine, as well as the 4th stage pressure of the LP turbine.
65
Reproduced with permission of the copyright owner. Further reproduction prohibited without permission.
4.3.6 Effect of Pressure Drop across the Steam Cycle
Based on the thermodynamic principles, the enthalpy o f steam not only depends
on temperature but also pressure o f the system. If the steam cycle is subjected to a high
pressure drop, a large amount o f steam heat can be lost causing the net efficiency to
reduce. Figure 4.6 shows the effect o f the pressure drop in the boiler unit and the FWH
train. It is clear that the pressure drop in the boiler unit has an impact on the net
efficiency o f the power plant whereas the effect o f the pressure drop in the FWH train is
considered negligible. Yet, the effect o f the boiler pressure drop is rather insignificant.
An increase in the pressure drop by 2% contributes to a slight reduction in the net
efficiency (about 0 .2 percent point).
4.3.7 Effects of Pressure and Pressure Distribution in the Turbine Series
In general, operating the steam cycle with a large difference between inlet
pressure and outlet pressure o f turbine series (i.e. boiler pressure and condenser pressure)
tends to offer a high thermal efficiency of the power plant. In addition to these two
pressure boundaries, the steam pressures at different turbine stages also play important
roles in defining the efficiency o f the power plant. The followings are the highlights of
such pressure effects that focus on the outlet pressure o f the HP turbine, the 1st stage and
ththe outlet pressures o f the IP turbine, as well as the 4 stage pressure o f the LP turbine.
65
Reproduced with permission of the copyright owner. Further reproduction prohibited without permission.

34.9
34.8
, 0 34.7
s•—• Q, 34.6
0a 34.5
-
--
- ig 34.4 -w ti 34.3 - 4
34.2 -
34.1
34.0
8.0 9.0 10.0
Pressure Drop in Boiler Units (%)
Figure 4.6 Effect of pressure drop in steam cycle.
66
11.0
Reproduced with permission of the copyright owner. Further reproduction prohibited without permission.
N®0sW'£.3Ew"8z
34.9
34.8 H
34.7
34.6
34.5
34.4
34.3
34.2
34.1 H
34.0 -
8
Pressure Drop in FWHs (% )
o 3.0
a 4.0
a 5.0
x 6 .0
0 9.0 10.0
Pressure Drop in Boiler Units (%
Figure 4.6 Effect o f pressure drop in steam cycle.
66
11.0
Reproduced with permission of the copyright owner. Further reproduction prohibited without permission.

(a) Pressure of HP turbine
Figure 4.7 illustrates the effect of the HP turbine pressure ratio on the net
efficiency of the power plant. Increasing the pressure ratio from 4.5 to 5.8 generally
helps improve the plant efficiency. Note that an increase in the pressure ratio can be
achieved by either increasing the inlet pressure of the HP turbine or reducing the outlet
pressure of the HP turbine. Between these two approaches, reducing the outlet pressure is
the primary cause of the improved efficiency. This can be seen clearly from the figure.
By keeping the outlet pressure constant (e.g. 4.12 MPa), raising the inlet pressure or the
pressure ratio of the turbine does not contribute to any improvement in the plant
efficiency but causing a slight reduction in the efficiency due to a higher work load in the
boiler feed pump. It should be noted that this subsection considers only the HP turbine
pressure and the net efficiency with fixed values of all process parameters. However,
unless the rest of parameter inputs are fixed, increasing HP inlet pressure improves the
net efficiency. On the contrary, lowering the outlet pressure from 4.5 to 3.7 MPa can
enhance the efficiency by one half percent points.
Despite its positive impact, reducing the outlet pressure beyond a specific point
(3.7 MPa in the figure) can cause a reduction in the plant efficiency. Based on a typical
process scheme of the subcritical PC (Figure 3.5), a fraction of exhaust steam from the
HP turbine is used to heat the feedwater heater. Lowering the pressure of the exhaust
steam below the optimal level leads to a reduced temperature of the heater, thus causing
the net efficiency of the power plant to drop.
67
Reproduced with permission of the copyright owner. Further reproduction prohibited without permission.
(a) Pressure of HP turbine
Figure 4.7 illustrates the effect o f the HP turbine pressure ratio on the net
efficiency of the power plant. Increasing the pressure ratio from 4.5 to 5.8 generally
helps improve the plant efficiency. Note that an increase in the pressure ratio can be
achieved by either increasing the inlet pressure o f the HP turbine or reducing the outlet
pressure o f the HP turbine. Between these two approaches, reducing the outlet pressure is
the primary cause o f the improved efficiency. This can be seen clearly from the figure.
By keeping the outlet pressure constant (e.g. 4.12 MPa), raising the inlet pressure or the
pressure ratio of the turbine does not contribute to any improvement in the plant
efficiency but causing a slight reduction in the efficiency due to a higher work load in the
boiler feed pump. It should be noted that this subsection considers only the HP turbine
pressure and the net efficiency with fixed values o f all process parameters. However,
unless the rest of parameter inputs are fixed, increasing HP inlet pressure improves the
net efficiency. On the contrary, lowering the outlet pressure from 4.5 to 3.7 MPa can
enhance the efficiency by one half percent points.
Despite its positive impact, reducing the outlet pressure beyond a specific point
(3.7 MPa in the figure) can cause a reduction in the plant efficiency. Based on a typical
process scheme o f the subcritical PC (Figure 3.5), a fraction o f exhaust steam from the
HP turbine is used to heat the feedwater heater. Lowering the pressure o f the exhaust
steam below the optimal level leads to a reduced temperature o f the heater, thus causing
the net efficiency o f the power plant to drop.
67
Reproduced with permission of the copyright owner. Further reproduction prohibited without permission.

35.0
,..; 34.8 - ,... t' z i 34.6 -a 44 t Z 34.4 -
34.2
4.4
wag
Crumb ittlts21, <3211041
HP Outlet (MPa)
o 3.54 O 3.74 A 3.93 x 4.12
* 4.31 O 4.50
4.8 5.2 5.6
Pressure Ratio, HP Inlet/Outlet
Figure 4.7 Effect of pressure in the HP stage.
68
6.0
Reproduced with permission of the copyright owner. Further reproduction prohibited without permission.
35.0
34.80s
1 34.6S3w"8* 34.4
34.24.4 4.8 5.2 5.6 6.0
P re ssu re R a tio , H P In le t/O u tle t
H P O u tle t (M P a)
o 3.54o 3.74A 3.93 x 4.12 x 4.31 o 4.50
F ig u re 4.7 Effect o f pressure in the HP stage.
68
Reproduced with permission of the copyright owner. Further reproduction prohibited without permission.

(b) Pressure of IP turbine
Figures 4.8 and 4.9 show the effect of the steam pressure ratio in the IP turbine
extracted at the 1st and the 3rd stages. Both figures indicate that increasing the pressure
ratio (e.g. from 1.3 to 2.0 in Figure 4.8 and from 3.6 to 6.7 in Figure 4.9) leads to a
reduction in the plant efficiency which is opposite to the results given in the previous
subsection (the pressure ratio of the HP turbine). Based on earlier discussion, there are
two approaches to increase the pressure ratio, i.e., increasing the inlet pressure and
reducing the outlet pressure. This means that reducing the pressure ratio can be achieved
by either reducing the inlet pressure or increasing the outlet pressure. Reducing the
pressure ratio by decreasing inlet pressure of the turbine with the constant outlet pressure
offers the improvement of the net efficiency. In Figures 4.8, for example, at 2.0 MPa
outlet pressure, reducing the pressure ratio from 2.0 to 1.7 results in an increase in the net
efficiency. From Figure 3.5, exhaust steam from the HP turbine is extracted to drive the
IP turbine. A high inlet pressure presented in the IP turbine implies a low pressure ratio in
the HP turbine which leads to a reduction of the net efficiency as previously concluded in
Figure 4.7. Even though decreasing the inlet pressure results in the positive impact on
the net efficiency, decreasing the pressure beyond a certain level could cause a slight
reduction in efficiency. In Figure 4.8, for instant at 2.0 MPa, reducing the pressure ratio
from 1.7 to 1.6 causes a reduction of the net efficiency.
Increasing the pressure ratio by decreasing the outlet pressure causes a reduction
of the net efficiency. Figure 4.8 shows that decreasing the outlet pressure from 2.5 to 2.0
MPa causes a reduction of 0.2 percent point. Similarly, Figure 4.9 shows that reducing
the outlet pressure from 0.9 to 0.6 MPa causes a reduction of the net efficiency by about
69
Reproduced with permission of the copyright owner. Further reproduction prohibited without permission.
(b) Pressure of IP turbine
Figures 4.8 and 4.9 show the effect o f the steam pressure ratio in the IP turbine
extracted at the 1st and the 3rd stages. Both figures indicate that increasing the pressure
ratio (e.g. from 1.3 to 2.0 in Figure 4.8 and from 3.6 to 6.7 in Figure 4.9) leads to a
reduction in the plant efficiency which is opposite to the results given in the previous
subsection (the pressure ratio o f the HP turbine). Based on earlier discussion, there are
two approaches to increase the pressure ratio, i.e., increasing the inlet pressure and
reducing the outlet pressure. This means that reducing the pressure ratio can be achieved
by either reducing the inlet pressure or increasing the outlet pressure. Reducing the
pressure ratio by decreasing inlet pressure o f the turbine with the constant outlet pressure
offers the improvement o f the net efficiency. In Figures 4.8, for example, at 2.0 MPa
outlet pressure, reducing the pressure ratio from 2.0 to 1.7 results in an increase in the net
efficiency. From Figure 3.5, exhaust steam from the HP turbine is extracted to drive the
IP turbine. A high inlet pressure presented in the IP turbine implies a low pressure ratio in
the HP turbine which leads to a reduction o f the net efficiency as previously concluded in
Figure 4.7. Even though decreasing the inlet pressure results in the positive impact on
the net efficiency, decreasing the pressure beyond a certain level could cause a slight
reduction in efficiency. In Figure 4.8, for instant at 2.0 MPa, reducing the pressure ratio
from 1.7 to 1.6 causes a reduction o f the net efficiency.
Increasing the pressure ratio by decreasing the outlet pressure causes a reduction
o f the net efficiency. Figure 4.8 shows that decreasing the outlet pressure from 2.5 to 2.0
MPa causes a reduction o f 0.2 percent point. Similarly, Figure 4.9 shows that reducing
the outlet pressure from 0.9 to 0.6 MPa causes a reduction o f the net efficiency by about
69
Reproduced with permission of the copyright owner. Further reproduction prohibited without permission.

Net
Eff
icie
ncy
(%)
Net
Eff
icie
ncy
(%)
Pressure Ratio, IP Inlet/Outlet at 1st Stage
Figure 4.8 Effect of pressure at the 1st IP stage.
37.0
36.5 -
36.0 -
35.5 -
35.0 -
34.5 -
34.0
IP Outlet at 3 rd Stage (MPa)
o 0.60
0 0.70
A 0.80
X 0.90
3.5 4.0 4.5 5.0 5.5 6.0 6.5 7.0 7.5
Pressure Ratio, IP Inlet/Outlet at 3 rd Stage
Figure 4.9 Effect of pressure at the 3rd IP stage.
70
Reproduced with permission of the copyright owner. Further reproduction prohibited without permission.
35.2
35.1 - Qc^
8'
.1it-
£
34.9
34.7
34.5
34.3
IP Outlet at 1St Stage(MPa)
o 2 .0 0
□ 2 .1 0
a 2 .2 0
x 2.30 x 2.40 ° 2.50
1.2 1.5 1.8 2.1 2.4
Pressure Ratio, IP Inlet/Outlet at 1st Stage
Figure 4.8 Effect o f pressure at the 1st IP stage.
37.0 -
36.5 -
^ 36.0 -
s*5 35.5 -aa% 35.0 -
34.5 -
34.0 -3.5 4.0 4.5 5.0 5.5 6.0 6.5 7.0 7.5
Pressure Ratio, IP Inlet/Outlet at 3rd Stage
IP Outlet at 3 Stage
o 0.60
□ 0.70A 0.80
x 0.90
Figure 4.9 Effect o f pressure at the 3rd IP stage.
70
Reproduced with permission of the copyright owner. Further reproduction prohibited without permission.

1.0 percent point. This indicates that reducing the pressure of the exhaust steam leads to
a reduction of temperature of the feedwater heaters, causing the net efficiency to drop.
(c) Pressure of LP turbine
Decreasing the pressure of the exhaust steam from the LP turbine causes
additional work required by the condensate pump. Nevertheless, it offers a much higher
work output from the turbine system, thus helping improve the net efficiency of the
power plant. Figure 4.10 shows the effect of the steam pressure in the LP turbine
extracted at the 4th stage. The higher the pressure ratio between the inlet and the outlet,
the greater the net efficiency becomes. Even though the reduction of the exhaust pressure
provides a higher net efficiency, it could form excessive moisture in the turbine causing
damage on the turbine blade. The acceptable level of the moisture content was limited to
10% in this study.
4.4 Efficiency Correlations for Subcritical Pulverized Coal-fired Power Plant
This section demonstrates empirical equations of the net efficiency for the
subcritical pulverized coal-fired power plant that were created according to the
parametric effects on the net efficiency as previously reported in section 4.3. In general,
most parametric effects were presented in the linear manner, except for the effect of the
pressure in turbine series. An additional analysis for pressure is given here.
Figure 4.11 shows the reference net efficiency (rfref) of a base power plant that
was set to operate under reference conditions (i.e. 19.0 MPa HP inlet pressure, 2.6 MPa
IP outlet pressure at the 1st stage and 6.0 kPa backpressure). Apparently, the reference
71
Reproduced with permission of the copyright owner. Further reproduction prohibited without permission.
1.0 percent point. This indicates that reducing the pressure o f the exhaust steam leads to
a reduction o f temperature of the feedwater heaters, causing the net efficiency to drop.
(c) Pressure of LP turbine
Decreasing the pressure o f the exhaust steam from the LP turbine causes
additional work required by the condensate pump. Nevertheless, it offers a much higher
work output from the turbine system, thus helping improve the net efficiency o f the
power plant. Figure 4.10 shows the effect o f the steam pressure in the LP turbine
extracted at the 4th stage. The higher the pressure ratio between the inlet and the outlet,
the greater the net efficiency becomes. Even though the reduction o f the exhaust pressure
provides a higher net efficiency, it could form excessive moisture in the turbine causing
damage on the turbine blade. The acceptable level o f the moisture content was limited to
1 0 % in this study.
4.4 Efficiency Correlations for Subcritical Pulverized Coal-fired Power Plant
This section demonstrates empirical equations o f the net efficiency for the
subcritical pulverized coal-fired power plant that were created according to the
parametric effects on the net efficiency as previously reported in section 4.3. In general,
most parametric effects were presented in the linear manner, except for the effect o f the
pressure in turbine series. An additional analysis for pressure is given here.
Figure 4.11 shows the reference net efficiency (tjref) o f a base power plant that
was set to operate under reference conditions (i.e. 19.0 MPa HP inlet pressure, 2.6 MPa
IP outlet pressure at the 1st stage and 6.0 kPa backpressure). Apparently, the reference
71
Reproduced with permission of the copyright owner. Further reproduction prohibited without permission.

37.0
36.0
35.0 -
34.0
80.0
LP Outlet at 4th Stage (kPa) o 6.00
6.40 A 6.80
97.5 115.0 132.5 150.0
Pressure Ratio, LP Inlet/Outlet at 4th Stage
Figure 4.10 Effect of pressure at the last LP stage.
72
Reproduced with permission of the copyright owner. Further reproduction prohibited without permission.
37.0
N~^ 36.0 - >>
* 35.0 -
34.0 J80.0 97.5 115.0 132.5 150.0
Pressure Ratio, LP Inlet/Outlet at 4th Stage
A□
<P
iffip LP Outlet at 4 Stage(kPa)o 6 .0 0
□ 6.40 A 6.80
Figure 4.10 Effect of pressure at the last LP stage.
72
Reproduced with permission of the copyright owner. Further reproduction prohibited without permission.

3.4 3.6 3.8 4.0 4.2 4.4
HP Outlet at 1St Stage (MPa)
4.6
Figure 4.11 Reference net efficiency of base subcritical PC.
(Base condition: 19.0 MPa HP inlet pressure, 2.6 MPa 1P outlet pressure at the 1st stage
and 6.0 kPa backpressure)
73
Reproduced with permission of the copyright owner. Further reproduction prohibited without permission.
35.0
IP, Outlet jat 3 S(age (M[Pa)
0.9034.0
0.?3Ur
a 33.00.7^
.2 0.68S3"8fc 32.0
31.03.8 4.0 4.2 4.4 4.63.4 3.63.2
HP Outlet a t 1st Stage (MPa)
Figure 4.11 Reference net efficiency of base subcritical PC.
(Base condition: 19.0 MPa HP inlet pressure, 2.6 MPa IP outlet pressure at the 1st stage
and 6.0 kPa backpressure)
73
Reproduced with permission of the copyright owner. Further reproduction prohibited without permission.

efficiency (Piref) varies with both HP outlet pressure and IP outlet pressure. With the well-
defined outlet pressure of the HP and IP turbines, the i'ref can be obtained directly from
the plot. However, it should be noted that changing the steam pressure extracted from the
1st stage of the IP turbine also causes the variation in the value of the gref• The change in
the reference net efficiency due to the 1st stage IP pressure was regressed and can be
presented as
A r hipijiwp3 = (a • Pmi+b • PIA C • P11,3) • (2.6-Plli ) (4.1)
where a, b and c are the regression constants with the values of —0.00124, 0.00794 and
—0.00743, respectively. PHI,/ PIP, and P11,3 denote the 1st stage HP turbine pressure, and the
1st and 3rd IP stage turbine pressures, respectively. By combining the calculated
efficiency variation and the reference efficiency from Figure 4.11, the net efficiency of
the power plant can be defined as
'/net 7.7. r ref — / (4.2)
Based on the effects of other parameters presented earlier in section 4.3, the efficiency
Equation (4.2) was modified to include these effects. After regression, the efficiency
equation can be presented as
net =(1 ref — 411 HP] JP] ,IP3 ) + 0.016 • ( 20.0— E a,r )+ 0.39 • ( 17.6 — F.)+ 0.012•(Ta,r — 250.0)
+ 0.011 • (T. — 530.0 )+ 0.010. (Tr —530.0)+0.38• (n boiler 90.0 ) + 0.05 5 • (th —90.0) (4.3)
—0.1 • (Pd„, —6.0)
where Eair, Tair, Tm, Tr, 1 In and Pdrop represent the excess air (%), the free
moisture in coal (%), the preheated air temperature (°C), the main temperature (°C), the
reheating temperature (°C), the boiler efficiency (%), the turbine efficiency (%) and the
74
Reproduced with permission of the copyright owner. Further reproduction prohibited without permission.
efficiency (r\rej) varies with both HP outlet pressure and IP outlet pressure. With the well-
defined outlet pressure o f the HP and IP turbines, the rjref can be obtained directly from
the plot. However, it should be noted that changing the steam pressure extracted from the
1st stage o f the IP turbine also causes the variation in the value o f the r/ref- The change in
the reference net efficiency due to the 1st stage IP pressure was regressed and can be
presented as
^ 0 ' = (a ' Php, ’ Pip, + c ' /̂/>3) ' ) (4.1)
where a, b and c are the regression constants with the values o f -0.00124, 0.00794 and
-0.00743, respectively. PHP/, PIPi and PIPj denote the 1st stage HP turbine pressure, and the
1st and 3rd IP stage turbine pressures, respectively. By combining the calculated
efficiency variation and the reference efficiency from Figure 4.11, the net efficiency o f
the power plant can be defined as
Vnet = V re f ~ ^0'HP\,IP\,IP, (4-2)
Based on the effects o f other parameters presented earlier in section 4.3, the efficiency
Equation (4.2) was modified to include these effects. After regression, the efficiency
equation can be presented as
nm ~ O lr e f - ^ HPl IPl IP3) + 0 .016-(20.0-E air) + 0 3 9 -(1 7 .6 -F m) + 0.012-(Tair-250 .0)
+ 0.01 l-(Tm - 530.0) + 0.010-(Tr - 530.0) + 0.38- ( r j ^ - 9 0 .0 ) + 0.055-(rjr -9 0 .0 ) (4.3)
-0 .1 (Pirop -6 .0 )
where Eair, Fm, Tain Tm, Tr, rjboiier, 0t and Pdrop represent the excess air (%), the free
moisture in coal (%), the preheated air temperature (°C), the main temperature (°C), the
reheating temperature (°C), the boiler efficiency (%), the turbine efficiency (%) and the
74
Reproduced with permission of the copyright owner. Further reproduction prohibited without permission.

pressure drop (%) across the boiler and FWHs, respectively. Note that Equation (4.3)
was developed for Illinois#6 bituminous coal.
To develop a more general equation that can be used for other types of coal,
Equation (4.3) was further modified to accommodate the variation in the high heating
value (HHV, kJ/kg coal) and hydrogen content (H, percent by weight) for individual coals
(see Table 4.3). The final equation then can be written as
rinet ( riref 4 11-1P1 ± 0.016 .( 20.0 — Ea) +[0.39 HHV
17.6 F,,)+ 2.05 H 4.9 •( ).( — •( — 28,818
)]
+0.012 • (Ta„. — 250.0) + 0.011 • (T„, — 530.0) + 0.010 • — 530.0 )+ 0.38' , ( Fn (4.4) boiler — 90.0)
+0.055 • T — 90.0 ) — 0.1. (Pdrop —6.0)
It is noted that Equation (4.4) is valid for a range of operating conditions as previously
given in Table 3.3 with the types of coals as given in Table 4.3. A parity plot between
the efficiency calculated from the empirical equation and that obtained from the power
plant theoretical model is given in Figure 4.12. The multiple determination coefficient
(R2) of 0.99 from the plot indicates a good agreement.
75
Reproduced with permission of the copyright owner. Further reproduction prohibited without permission.
pressure drop (%) across the boiler and FWHs, respectively. Note that Equation (4.3)
was developed for Illinois# 6 bituminous coal.
To develop a more general equation that can be used for other types o f coal,
Equation (4.3) was further modified to accommodate the variation in the high heating
value (HHV, kJ/kg coal) and hydrogen content (H, percent by weight) for individual coals
(see Table 4.3). The final equation then can be written as
Tl n e t ~ ( t l r e f ^ H P , ,IP , J P 3 ) + 0.016 '(20 .0 Ea) + 0 - 3 9 - ( ^ - } ( 1 7 . 6 - F m) + 2 .0 5 - ( H - 4 .9 )J o , o l o
+ 0.012 ■ (Tair - 250.0) + 0.01l-(T m- 530.0) + 0.010 -(Tr - 530.0) + 0.38 ■ (rjboiler - 9 0 .0 ) (4 -4 )
+ 0.055 • (rjT - 9 0 .0 ) - 0 .1 • (Pirop - 6 .0 )
It is noted that Equation (4.4) is valid for a range of operating conditions as previously
given in Table 3.3 with the types o f coals as given in Table 4.3. A parity plot between
the efficiency calculated from the empirical equation and that obtained from the power
plant theoretical model is given in Figure 4.12. The multiple determination coefficient
(R2) o f 0.99 from the plot indicates a good agreement.
75
Reproduced with permission of the copyright owner. Further reproduction prohibited without permission.

Table 4.3 Characteristics of coal used for simulation.
Content (percent by
Bituminous coal Subbituminous coal Lignite
weight) Pittsburg
#8 Illinois
#6
Upper Freeport
MV
Spring Creek
Decker North
Dakota Hallaville
Moisture 5.2 11.2-17.6 2.2 24.1 23.4 33.3 37.7
Ultimate
C 74.0 69.0 74.9 70.3 72.0 63.3 66.3
H 5.1 4.9 4.7 5.0 5.0 4.5 4.9
0 7.9 10.0 4.97 17.69 16.41 19.0 16.2
N 1.6 1.0 1.27 0.96 0.95 1.0 1.0
S 2.3 4.3 0.76 0.35 0.44 1.1 1.2
A (ash) 9.1 10.8 13.4 5.7 5.2 11.1 10.4
HHV a(kJ/kg coal)
30856 28818 30854 28285 29033 25043 26949
a The HHV is equal to 2.326[146.58C+ 568.78H+ 29.4S- 6.58A - 51.53(0+N)] (Perry et al., 1997).
(Source: U.S.DOE, 1999; Geers and O'Brien, 2002)
76
Reproduced with permission of the copyright owner. Further reproduction prohibited without permission.
Table 4.3 Characteristics o f coal used for simulation.
Content (percent by weight)
Bituminous coal Subbituminous coal Lignite
Pittsburg#8
Illinois#6
UpperFreeport
MV
SpringCreek Decker North
Dakota Hallaville
Moisture 5.2 11.2-17.6 2.2 24.1 23.4 33.3 37.7Ultimate
C 74.0 69.0 74.9 70.3 72.0 63.3 66.3H 5.1 4.9 4.7 5.0 5.0 4.5 4.9
0 7.9 10.0 4.97 17.69 16.41 19.0 16.2
N 1.6 1.0 1.27 0.96 0.95 1.0 1.0S 2.3 4.3 0.76 0.35 0.44 1.1 1.2A (ash) 9.1 10.8 13.4 5.7 5.2 11.1 10.4
HHVa 30856 28818 30854 28285 29033 25043 26949(kJ/kg coal)
a The HHV is equal to 2.326[146.58C + 568.78// + 29 .45- 6.58,4 - 51.53(0+/V)] (Perry et al., 1997).
(Source: U.S.DOE, 1999; Geers and O'Brien, 2002)
76
Reproduced with permission of the copyright owner. Further reproduction prohibited without permission.

R2 = 0.99
42.0
,—, 37.8 -
r 9 33.5 -
E W cu W s 29.3 -
25.0
25.0 29.3 33.5 37.8 42.0
o Bitumino4
• Subbituniinous
& Lignite
Net Efficiency (%) — Power Plant Theoretical Model
Figure 4.12 Parity plot of net efficiency between empirical correlation
and theoretical model.
(Original in color)
77
Reproduced with permission of the copyright owner. Further reproduction prohibited without permission.
25.0 29.3 33.5 37.8 42.0
Net Efficiency (%) — Power Plant Theoretical Model
Figure 4.12 Parity plot o f net efficiency between empirical correlation
and theoretical model.
(Original in color)
77
Reproduced with permission of the copyright owner. Further reproduction prohibited without permission.

4.5 Optimum Operating Conditions
This section presents the optimal operating conditions that would provide the
highest net efficiency possible for the subcritical pulverized coal-fired power plant. The
appropriate net efficiency was obtained by adjusting plant operations according to the
sensitivity analysis and by considering individual effects of process parameters.
Constraint for each parameter was also taken into account.
The first constraint is the moisture content of steam leaving the LP turbine. The
moisture content of LP steam should not be higher than 10% to prevent droplet erosion
problem on turbine blades (Termuehlen and Emsperger, 2003). Temperature of high-
pressure steam is another important constraint. High operating temperature can cause a
severe impact on the pipe (e.g., corrosion). Even though the advanced material
technology allows material to withstand the temperature beyond 600°C (Kjaer, 2002;
NEDO and CCUJ, 2004), the cost of pipe and associated maintenance cost will become
high. In practical, the main steam temperature and reheat temperature should be defined
in a range of 530-545°C for subcritical pulverized coal-fired power stations (Singer,
1991; U.S.DOE, 1999; Kakaras et al., 2002; Sanders, 2004). Regarding the individual
effects of process parameters and the constraints of process variables, the optimal
operating conditions are given in Figure 4.13 and Table 4.4. Note that the results
presented in the figure and table were based on the 425 MW (gross output) subcritical
pulverized coal-fired power plant with the combustion of Illinois #6 bituminous coal.
78
Reproduced with permission of the copyright owner. Further reproduction prohibited without permission.
4.5 Optimum Operating Conditions
This section presents the optimal operating conditions that would provide the
highest net efficiency possible for the subcritical pulverized coal-fired power plant. The
appropriate net efficiency was obtained by adjusting plant operations according to the
sensitivity analysis and by considering individual effects o f process parameters.
Constraint for each parameter was also taken into account.
The first constraint is the moisture content o f steam leaving the LP turbine. The
moisture content o f LP steam should not be higher than 10% to prevent droplet erosion
problem on turbine blades (Termuehlen and Emsperger, 2003). Temperature o f high-
pressure steam is another important constraint. High operating temperature can cause a
severe impact on the pipe (e.g., corrosion). Even though the advanced material
technology allows material to withstand the temperature beyond 600°C (Kjaer, 2002;
NEDO and CCUJ, 2004), the cost o f pipe and associated maintenance cost will become
high. In practical, the main steam temperature and reheat temperature should be defined
in a range o f 530-545°C for subcritical pulverized coal-fired power stations (Singer,
1991; U.S.DOE, 1999; Kakaras et al., 2002; Sanders, 2004). Regarding the individual
effects o f process parameters and the constraints o f process variables, the optimal
operating conditions are given in Figure 4.13 and Table 4.4. Note that the results
presented in the figure and table were based on the 425 MW (gross output) subcritical
pulverized coal-fired power plant with the combustion o f Illinois # 6 bituminous coal.
78
Reproduced with permission of the copyright owner. Further reproduction prohibited without permission.

Reproduced w
ith permission o
f the copyright owner.
Further reproduction prohibited w
ithout permission.
Fu
rnac
eBo
iler
r
Evaporator
0.10312047.67
r40.731477.80
i
Coal 0.103 283.52 350 453.07
0.103 287 (HHV)25 35.42N
/ \ /
\ / \ /
/ ....
H
C/ 3/4 2902.91 12 u 285.211
0.90 3279.8
3.40 3588.4 545.0 287.85
19.00 3401.0 545.0 298.79 403.4 245.76
1
Reheat
Air heater
0.103 473 46.7 453.07
0.1031-251453.07
Air
20.571794.10 187.9 2.64
3.74 2902.9 306.4113.58
19.95 957.8 223.0 298.79
er FWH train
3.74 978.7
co) 19.53 1044.7
0400
O
241.3298.79
T=155.22°C
.58
HP LP
1.05 817.1
2.52 817.1 192.4 31.11
for 0.90
0.90 13279.8 403.4121.31
0.074 2682.4 104.9 10.08
0.22 2868 206 10.74
Lower FWH train 1.67 517.15 1.72 74.95 1.78 268.8 123.0 267.07 89.3 67.07 64.2 267
5.6 127.4 21.31
20.57 794.10 0 187.9 301.43 Boiler feed pump
.223
1.05 772.0 1.62 736.08 181.9 301.43 173.9 267.07
0.03112661.487.6 10.71
0.0062374.736.3 214.24
Condenser
0.006 156.19 36.3 267.
Condensate pump
0.001171.836.3 52.83
1.831158.08 36.31267.07
0.031 71.8 40.8 52.83
535.6 0.074 394.5 0.031 289.7 21.31 32.04
0.223 394.5 0.07 93.7
289.7 32.04 68.7
Figure 4.13 Scheme of subcritical PC at optimal operating conditions.
(For Illinois#6 bituminous coal)
42.12
°C I kg/s
Reproduced
with perm
ission of the
copyright ow
ner. Further
reproduction prohibited
without
permission.
VO
3.40 3588.4545.01287.85
19.00 3401.0 3279.8545.0 298.79 245.76
rVil K 4 rVit=TT sm Rm sin
Evaporator
2902.93 0 6 4 298.79
0.006 2374.7.031 2661.487.6 10.71 214.24
Condenserg j Rh I^I Reheat2902.
3289.2 0.90 3279.83483.6508.7 17.52 403.4 2131
conomize 0.006 156.190.074 2682436.3
Condensate pump267.07104.9 10.08
0.223128683187.910.74
2902.90.103 2047.67 3 0 6 4 1338
940.73 477. 0.006171.8314.52 3 6 3 52.83223.0 298.79Lower FWH tram
1 3 3 158.517.15 374.95 3 6 3 267.07tram 123.0 267.07 267.07 267.0*r0.103 283.52
350 453.07 1.05 817.10.103128734 (HHV)
2s| 35.42 \
\
31.11
2.52 817.1 0.0311713192.4131.11 127421.31 40.8 52.83Air heater
794.100.103 4 7 3 ed pump772.0 1.62
46.71453.07 187.9 30143 21.31 32.04 42.121044.7 736.08298.79 0.223 394.5 0.074 289.7181.9 301.43 173.9 267.07
32.04 68.70.103 -
251453.07
Air155.22°C
MPa kj/kg°C kg/s
Figure 4.13 Scheme o f subcritical PC at optimal operating conditions.
(For fllinois# 6 bituminous coal)

Table 4.4 Optimal process operations for subcritical PC.
Description Optimal Operation
Boiler temperature (°C) 545.0
Reheat temperature (°C) 545.0
HP turbine
1st stage-extract pressure (MPa) 3.74
IP turbine
1s` stage-extract pressure (MPa)
2" stage-extract pressure (MPa)
3rd stage-extract pressure (MPa)
2.52
1.27
0.90
LP turbine
1st stage-extract pressure (MPa) 0.223
2" stage-extract pressure (MPa) 0.074
3rd stage-extract pressure (MPa) 0.031
4th stage-extract pressure (MPa) 0.0060
Discharge pressure of boiler feed 20.57 pump (MPa) Discharge pressure of condensate 1.83 pump (MPa) Preheated air temperature (°C) 350.0
Excess air (%) 15.0
Pressure drop in FWHs (%) <3.0
Pressure drop in boiler (%) <9.0
Boiler efficiency (%) >92.0
Turbine efficiency (%) >92.0
80
Reproduced with permission of the copyright owner. Further reproduction prohibited without permission.
Table 4.4 Optimal process operations for subcritical PC.
Description Optimal Operation
Boiler temperature (°C) 545.0Reheat temperature (°C) 545.0HP turbine
1st stage-extract pressure (MPa) 3.74IP turbine
1st stage-extract pressure (MPa) 2.522nd stage-extract pressure (MPa) 1.273rd stage-extract pressure (MPa) 0.90
LP turbine1st stage-extract pressure (MPa) 0.2232nd stage-extract pressure (MPa) 0.0743rd stage-extract pressure (MPa) 0.0314th stage-extract pressure (MPa) 0.0060
Discharge pressure of boiler feed 20.57pump (MPa)Discharge pressure of condensate 1.83pump (MPa)Preheated air temperature (°C) 350.0Excess air (%) 15.0Pressure drop in FWHs (%) <3.0Pressure drop in boiler (%) <9.0Boiler efficiency (%) >92.0Turbine efficiency (%) >92.0
80
Reproduced with permission of the copyright owner. Further reproduction prohibited without permission.

4.6 Efficiency Drop due to CO2 Capture
This section reveals the efficiency drop of the subcritical PC after integrating with
the CO2 capture unit. The reference plant obtained from the optimal conditions was
combined with the MEA-based CO2 absorption unit with 90% CO2 removal efficiency.
The investigation of the efficiency drop due to the changes in the CO2 removal efficiency
was conducted.
4.6.1 Application of CO2 Capture Process
It is well recognized that the MEA-based CO2 absorption is the energy-intensive
process. The majority of energy is supplied to the reboiler while other parts of the
process require low energy. In this study, a low pressure steam between the IP and LP
turbines was extracted to the reboiler according to the model conducted by Alie (2006).
The configuration of the subsidiary equipment and units (i.e., pressure control valve,
desuperheater, sump and pump) to control the process steam before entering the reboiler
was adapted from the work done by Fisher et al. (2005). The heat requirement to operate
the reboiler was chosen according to the work experimentally performed by
Sakwattanapong (2005). Energy for solvent regeneration of 4800 kJ/kg CO2 captured was
reported for 90% CO2 removal efficiency. Figure 4.14 conceptually demonstrates the
scheme of the subcritical pulverized coal-fired power plant integrated with the MEA-
based CO2 absorption unit.
81
Reproduced with permission of the copyright owner. Further reproduction prohibited without permission.
4.6 Efficiency Drop due to CO2 Capture
This section reveals the efficiency drop o f the subcritical PC after integrating with
the CO2 capture unit. The reference plant obtained from the optimal conditions was
combined with the MEA-based CO2 absorption unit with 90% CO2 removal efficiency.
The investigation o f the efficiency drop due to the changes in the CO2 removal efficiency
was conducted.
4.6.1 Application of CO 2 C apture Process
It is well recognized that the MEA-based CO2 absorption is the energy-intensive
process. The majority o f energy is supplied to the reboiler while other parts o f the
process require low energy. In this study, a low pressure steam between the IP and LP
turbines was extracted to the reboiler according to the model conducted by Alie (2006).
The configuration o f the subsidiary equipment and units (i.e., pressure control valve,
desuperheater, sump and pump) to control the process steam before entering the reboiler
was adapted from the work done by Fisher et al. (2005). The heat requirement to operate
the reboiler was chosen according to the work experimentally performed by
Sakwattanapong (2005). Energy for solvent regeneration of 4800 kJ/kg CO2 captured was
reported for 90% CO2 removal efficiency. Figure 4.14 conceptually demonstrates the
scheme o f the subcritical pulverized coal-fired power plant integrated with the MEA-
based CO2 absorption unit.
81
Reproduced with permission of the copyright owner. Further reproduction prohibited without permission.

Reproduced w
ith permission o
f the copyright owner.
Further reproduction prohibited w
ithout permission.
Evapo ator
Fur
nace
/Boi
ler
00 0103 047.6
1940.73 477.80
Coal
0. 03 287 25 35.42
1:1
4141 Etr. aff 41
3 40 3588.4 545.0 287.85
H
3.74
H1
19.00 3401.0 545.0 298.79
3.74 12902.9 306.4 298.79
2902.9 28521 RH Reheat
HP
m
04
0.103 314.52 395. 477.80 ;11CI)
0.103 283.52 350 453.07
/
Air heater
0.103 4 46.7 453.07
0.103 25 453.07
Air
)
Up
3.74 2902.9 306.4 13.58
19. 957.8 223. 298.79
2.52 13483.6 508.7 17.52
20.571794.10 187.9 2.64
er FWH train
3.74 978.7 227 13.58
19.53 1044.7 co, 241.3 298.79 9400 44
T=155.22iC
20.57 794.10 187.9 301.43 Boi
1.05 817.1 31.
0.90 3279.8 403. 132.63
0.90 3279.8 403 245.76 0.45
Desuper heater
0.45 104.8 25. 544.4 -to 0.10
25.0
CO2 absorption process/Reboile
0.45 726. 5 3279.8 145.0 677.03
400.
1.2713289.2 0.90 3279.8 414.313.26 403. 2131
232 817.1 -192.4 31.11
Dea rator
0
0.22 .33412868 206. 14.14
132.63
0.074126824104.9 10.30
LP
Lower FWH train .67 517.15 1.72 7495 1.78 68.8
123. 134.44 89.3 34.44 642134
0.90 5.6 127.4 21.31
0.4271153.58123. 132.63
O
0.0312661.4 0.006 2374.7 87.6 9.72 36.3 78.98
Condenser
0.006 156.19 36.3 134.44
Condensate pump
wJJ0.000171.836.3 55.46
1.831158.08 36.31134.44
0.031 171. 40.8 55.46
er feed pump 1.05 772.0 1.62 736.08 181.9 301.43 173. 134.44
0.223 535.6 21.31
0.223 93.7
0.074 394.5 35.44
0.0311289.7
394.5 0.074 289.7 35.44 68.7 45.74
.74
1KFLalc.J/ °C kg/s
e
104.7544.4
41-
[4;
Figure 4.14 Scheme of subcritical PC with MEA-based absorption unit operating at optimal conditions.
(For Illinois#6 bituminous coal)
Reproduced
with perm
ission of the
copyright ow
ner. Further
reproduction prohibited
without
permission.
C O 2 absorption process/Reboiier
Desuperheater
13588.4 0.90 13279.8545.0| 287.85
3279.1 726.750.45 3279.1
LPHP;h i
Evaporator
3.74 12902.9306.4! 298.79
0.00612374.70.03112661.487.6 19.72 3 63 178.98
CondenserV 3.74 2902.91 m r imi. Rn Reheat
1.27 1 3289.2
0.0061156.193 6 3 1134.44
C ondensate pump
0.0061171.8
187.9|2.643.74 12902.9306.4) 1338^
19.951957.8940.73)477.80
0.103| 31432 3 6 3 |55.46298.79395.94) 477.80Lower FW H train
1.7812681.67 1517.15 363j 134.44Upper FW H trainCoal 0.103128332 3501453.07~ 1.05 1817.1
0.103128734 (HHV) 25] 35.42%
p u t
0.03140.8 55.46A ir heater 3.74 978.7 Deaerator
0.074 0.031 289.7535.62131
0.103|473i87.9)3br43 Boiier U ed pum p
1.05 772.0 1.62181.9)301.43 173.9
45.7446.7)453.07 1044.7 736.(298.79 289.70.223
93.73943 0.074 35.44 68.7
134.44
0.1031- MPal kJ/kg °C | kg/s
25| 453.07
Air
Figure 4.14 Scheme o f subcritical PC with MEA-based absorption unit operating at optimal conditions.
(For Illinois#6 bituminous coal)

Table 4.5 summarizes the calculated power plant performance before and after
integrated with the MEA-based CO2 absorption unit. The integration of the CO2 capture
unit causes the net efficiency to drop from 39.2% to 27.6%. The ratio of CO2 emitted to
the net power output is decreased from 805.95 to 113.58 kg/MWh (323.38 to 32.34
tonne/hr). However the ratios of other pollutant emissions to the net power output are
slightly increased.
4.6.2 Effect of CO2 Removal Efficiency
The effect of the CO2 removal efficiency of the CO2 capture unit on the net
efficiency of the power plant was also investigated here. Figure 4.15 gives the
relationship between heat duty and lean CO2 loading (mole CO2/ mole MEA) reported in
the literature. According to the figure, the leaner the absorption solvent (low CO2
loading) supplied into the absorber inlet, the higher the energy required for solvent
regeneration (heat duty). The leaner solvent is capable of absorbing more CO2 from the
flue gas. This basically means that the reboiler heat duty per unit CO2 increases with the
increasing CO2 capture efficiency. This trend is used to analyze the effect of the CO2
removal efficiency on the power plant net efficiency point drop as illustrated in Figure
4.16a.
This figure reveals that a higher removal efficiency provides a greater reduction in
the net efficiency. However, when the results were analyzed as a ratio of the net
efficiency point drop to the CO2 removal efficiency, the optimal point for CO2 removal
was identified as shown in Figure 4.16b. The optimal CO2 removal efficiency was found
at 72% CO2 removal efficiency.
83
Reproduced with permission of the copyright owner. Further reproduction prohibited without permission.
Table 4.5 summarizes the calculated power plant performance before and after
integrated with the MEA-based CO2 absorption unit. The integration o f the CO2 capture
unit causes the net efficiency to drop from 39.2% to 27.6%. The ratio o f CO2 emitted to
the net power output is decreased from 805.95 to 113.58 kg/MWh (323.38 to 32.34
tonne/hr). However the ratios o f other pollutant emissions to the net power output are
slightly increased.
4.6.2 Effect of CO2 Removal Efficiency
The effect o f the CO2 removal efficiency of the CO2 capture unit on the net
efficiency o f the power plant was also investigated here. Figure 4.15 gives the
relationship between heat duty and lean CO2 loading (mole CO2/ mole MEA) reported in
the literature. According to the figure, the leaner the absorption solvent (low CO2
loading) supplied into the absorber inlet, the higher the energy required for solvent
regeneration (heat duty). The leaner solvent is capable o f absorbing more CO2 from the
flue gas. This basically means that the reboiler heat duty per unit CO2 increases with the
increasing CO2 capture efficiency. This trend is used to analyze the effect o f the CO2
removal efficiency on the power plant net efficiency point drop as illustrated in Figure
4.16a.
This figure reveals that a higher removal efficiency provides a greater reduction in
the net efficiency. However, when the results were analyzed as a ratio o f the net
efficiency point drop to the CO2 removal efficiency, the optimal point for CO2 removal
was identified as shown in Figure 4.16b. The optimal CO2 removal efficiency was found
at 72% CO2 removal efficiency.
83
Reproduced with permission of the copyright owner. Further reproduction prohibited without permission.

Table 4.5 Comparison of subcritical PC with and without MEA-based CO2 absorption
unit.
Description PC without MEA-
based CO2 capture
PC with MEA-based CO2
capture
Gross power output MW 424.74 424.74
Energy consumption without MEA-based CO2absorption unit
MW 24.74 24.74
Energy consumption due to MEA-based CO2 absorption unit
MW 116.23
Net power output MW 400.00 283.77
Net efficiency %HHV 39.18 27.62
Coal consumption kg/s 35.42 35.42
CO2 emitted tonne/hr 322.38 32.23
CO2 emitted kg/MWh 805.95 113.58
SO2 emitted tonne/hr 0.44 0.44
SO2 emitted kg/MWh 1.09 1.55
NO emitted tonne/hr 0.24 0.24
NO emitted kg/MWh 0.60 0.84
PM emitted tonne/hr 0.006 0.006
PM emitted kg/MWh 0.016 0.022
84
Reproduced with permission of the copyright owner. Further reproduction prohibited without permission.
Table 4.5 Comparison of subcritical PC with and without MEA-based CO2 absorption
unit.
DescriptionPC without MEA-
based co2 capture
PC with MEA- based co2
captureGross power output MW 424.74 424.74Energy consumption without MEA-based C02 absorption unit MW 24.74 24.74
Energy consumption due to MEA-based C02 absorption unit MW - 116.23
Net power output MW 400.00 283.77
Net efficiency %HHV 39.18 27.62
Coal consumption kg/s 35.42 35.42
C02 emitted tonne/hr 322.38 32.23
C02 emitted kg/MWh 805.95 113.58
S 02 emitted tonne/hr 0.44 0.44
S 02 emitted kg/MWh 1.09 1.55
NO emitted tonne/hr 0.24 0.24
NO emitted kg/MWh 0.60 0.84
PM emitted tonne/hr 0.006 0.006
PM emitted kg/MWh 0.016 0.022
84
Reproduced with permission of the copyright owner. Further reproduction prohibited without permission.

Reb
oil
er H
eat D
uty
(M
J/ k
g C
O2)
8.0
7.0 -
6.0 -
5.0 -
4.0 -
3.0 -
2.0 -
1.0 -
0.0
0.15 0.20 0.25 0.30 0.35 0.40 0.45
Lean CO2 Loading (mole CO2 / mole MEA)
Figure 4.15 Effect of CO2 loading on reboiler heat duty.
(Source: Sakwattanapong, 2005)
85
Reproduced with permission of the copyright owner. Further reproduction prohibited without permission.
8.06u 7.0 oc* 6.0
£ 5.0
I* 4-°
i 3 , =$ 2.0
1 1.0 04
0.00.15 0.20 0.25 0.30 0.35 0.40 0.45
Lean CO2 Loading (mole CO2 / mole MEA)
Figure 4.15 Effect o f CO2 loading on reboiler heat duty.
(Source: Sakwattanapong, 2005)
85
Reproduced with permission of the copyright owner. Further reproduction prohibited without permission.

Net
Eff
icie
ncy
Po
int D
rop
, 'd
rop
, (%
) nd
rop
/ %
CO
2 R
emov
al
15.75
14.0 -
10.5 -
7.0 -
3.5 -
0.0
0
0.17 0.16 -
0.14 -
0.12 -
0.10 -
0.08 -
0.06 -
0.04 -
0.02 -
0.00
0
25 50 75
CO2 Removal Efficiency (%)
(a)
25 50 75
100
100
CO2 Removal Efficiency (%)
(b)
Figure 4.16 Effect of CO2 removal efficiency on net efficiency point drop.
86
Reproduced with permission of the copyright owner. Further reproduction prohibited without permission.
15.75
£. 14.0OimT3srr>Q*
g 10.5
7.0
S3w
0.01000 25 50 75
CO2 Removal Efficiency (% )
(a)
0.170.16
° '14£ 0.12| 0.106 0.08 ug 0.06
| 0.04
P 0.02
0.0010050 75250
CO 2 R em oval Efficiency (% )
(b)
Figure 4.16 Effect of CO2 removal efficiency on net efficiency point drop.
Reproduced with permission of the copyright owner. Further reproduction prohibited without permission.

Chapter Five
Results and Discussions: Supercritical Coal-Fired Power Plant
This chapter provides the simulation results obtained for the supercritical
pulverized coal-fired power plant. The results presented here can be considered the
extension of results in Chapter Four to cover supercritical operating conditions. Table 5.1
presents maximum-minimum ranges of plant performance. In general, the information
reported in this table are similar to those reported in Table 4.1, except for the range of
their outputs. Under the supercritical condition, the net efficiency can reach as high as
43.2% whereas the maximum net efficiency of the subcritical pulverized coal-fired power
plant is 41.3% (Table 4.1).
Figure 5.1 outlines the sensitivity analysis based on the correlation coefficient of
individual operating parameters. The parametric effects are similar to those in Chapter
Four. It should be noted that for the supercritical pulverized coal-fired power plant, the
pressure of steam extracted from the middle of the HP turbine (the 1st extract) was
included as the additional parameter. It was found that this new parameter had a
significant impact on the net efficiency of the plant.
87
Reproduced with permission of the copyright owner. Further reproduction prohibited without permission.
Chapter Five
Results and Discussions: Supercritical Coal-Fired Power Plant
This chapter provides the simulation results obtained for the supercritical
pulverized coal-fired power plant. The results presented here can be considered the
extension of results in Chapter Four to cover supercritical operating conditions. Table 5.1
presents maximum-minimum ranges o f plant performance. In general, the information
reported in this table are similar to those reported in Table 4.1, except for the range of
their outputs. Under the supercritical condition, the net efficiency can reach as high as
43.2% whereas the maximum net efficiency o f the subcritical pulverized coal-fired power
plant is 41.3% (Table 4.1).
Figure 5.1 outlines the sensitivity analysis based on the correlation coefficient o f
individual operating parameters. The parametric effects are similar to those in Chapter
Four. It should be noted that for the supercritical pulverized coal-fired power plant, the
pressure o f steam extracted from the middle o f the HP turbine (the 1st extract) was
included as the additional parameter. It was found that this new parameter had a
significant impact on the net efficiency o f the plant.
87
Reproduced with permission of the copyright owner. Further reproduction prohibited without permission.

Table 5.1 Maximum-minimum performance of supercritical PC.
Feature Range a
Thermal efficiency
Steam cycle efficiency 43.57 - 52.13
Net efficiency %HHV 32.39 - 43.19
Net heat rate kJ/kWh HHV 834135 - 1112266
Coal consumption kg/s 30.01 - 46.38
Combustion zone temperature °C 1697.35 - 1940.73
CO2 emission rate b tonne/hr 256.1 - 394.9
CO2 emission rate b kg/MWh 747.1 - 975.1
SO2 emission rate b tonne/hr 0.34 - 0.54
SO2 emission avoided b tonne/hr 8.17 - 12.97
SO2 emission rate b kg/MWh 1.01 - 1.32
SO2 emission avoided b kg/MWh 24.36 - 31.79
NO emission rate tonne/hr 0.13 -- 0.27
NO emission avoided tonne/hr 0.89 - 1.88
NO emission rate kg/MWh 0.38 - 0.69
NO emission avoided kg/MWh 2.61 - 4.64
PM emission rate b' C tonne/hr 0.0050 - 0.0070
PM emission avoided b' c tonne/hr 4.80 - 7.40
PM emission rate b' c kg/MWh 0.013 - 0.018
PM emission avoided b' c kg/MWh 13.28 - 18.13
%Flue gas composition
02 mole% 2.63 - 3.36
CO2 mole% 14.25 - 14.84
H2O mole% 6.02 - 6.27
N2 mole% 75.73 - 75.86
SO2, NO and others mole% 0.51 - 0.53
a The simulated results are based on a range of the gross outputs between 350 and 450 MW. b The LNB and SCR units remove the NO emission up to 65% and 63% respectively. The FGD unit removes the SO2 emission up to 96%. The electrostatic precipitator (ESP) removes PM up to 99.9% (U.S.DOE, 1999).
The calculation of particulate is based on emission factors for bituminous coal consumption without control equipment (de Nevers, 2000).
88
Reproduced with permission of the copyright owner. Further reproduction prohibited without permission.
Table 5.1 Maximum-minimum performance of supercritical PC.
Feature RangeaThermal efficiency
Steam cycle efficiency % 43.57 - 52.13
Net efficiency %HHV 32.39 - 43.19
Net heat rate kJ/kWh HHV 834135 - 1112266
Coal consumption kg/s 30.01 - 46.38
Combustion zone temperature °C 1697.35 - 1940.73
C 02 emission rate b tonne/hr 256.1 - 394.9
C02 emission rate b kg/MWh 747.1 - 975.1
S 02 emission rateb tonne/hr 0.34 - 0.54
S 02 emission avoided b tonne/hr 8.17 - 12.97
S 02 emission rate b kg/MWh 1.01 - 1.32
S 02 emission avoided b kg/MWh 24.36 - 31.79
NO emission rate tonne/hr 0.13 - 0.27
NO emission avoided tonne/hr 0.89 - 1.88
NO emission rate kg/MWh 0.38 - 0.69
NO emission avoided kg/MWh 2.61 - 4.64
PM emission rateb’c tonne/hr 0.0050 - 0.0070
PM emission avoided b’c tonne/hr 4.80 - 7.40
PM emission rate b'c kg/MWh 0.013 - 0.018
PM emission avoided b’c kg/MWh 13.28 - 18.13
%Flue gas composition
o 2 mole% 2.63 - 3.36
O O N> mole% 14.25 - 14.84
h2o mole% 6.02 - 6.27
n 2 mole% 75.73 - 75.86
S 02, NO and others mole% 0.51 - 0.53a The simulated results are based on a range of the gross outputs between 350 and 450 MW. b The LNB and SCR units remove the NO emission up to 65% and 63% respectively. The FGD unit removes the S 02 emission up to 96%. The electrostatic precipitator (ESP) removes PM up to 99.9% (U.S.DOE, 1999).c The calculation of particulate is based on emission factors for bituminous coal consumption without control equipment (de Nevers, 2000).
88
Reproduced with permission of the copyright owner. Further reproduction prohibited without permission.

WI
6
Input
Preheated air temperature
Free moisture in coal
Main temperature
Reheat temperature
Boiler efficiency
Turbine efficiency
Excess air
Pressure drop of FWH & boiler
HP inlet
HP 1st extract
HP 2nd extract
IP 1st extract
IP 2nd extract
IP 3rd extract
LP 1st extract
LP 2nd extract
LP 3rd extract
IP outlet
Boiler feed pressure
Condensate pressure
Deaerator inlet
-1.00 -0.75 -0.50 -0.25 0.00 0.25 0.50 0.75 1.00
Coefficient
❑ Net efficiency (%) Ea CO2 (tonne/hour) ■ Coal consumption (kg/sec) Output
Figure 5.1 Results of sensitivity analysis by an approach of rank correlation coefficient.
89
Reproduced with permission of the copyright owner. Further reproduction prohibited without permission.
InputPreheated air temperature
Free moisture in coal
Main temperature
Reheat temperature
Boiler efficiency
Turbine efficiency
Excess air
Pressure drop o f FWH & boiler
HP inlet
HP 1st extract
HP 2nd extract
IP 1st extract
IP 2nd extract
IP 3rd extract
LP 1st extract
LP 2nd extract
LP 3rd extract
LP outlet
Boiler feed pressure
Condensate pressure
Deaerator inlet
-1.00 -0.75 -0.50 -0.25 0.00 0.25 0.50 0.75 1.00
Coefficient
□ Net efficiency (%) H C 02 (tonne/hour) ■ Coal consumption (kg/sec) Output
' 1 11 p
i1
I p
-__11
...... c6□......
i;□......1
gjg 1
1m
■......1
Figure 5.1 Results o f sensitivity analysis by an approach o f rank correlation coefficient.
89
Reproduced with permission of the copyright owner. Further reproduction prohibited without permission.

5.1 Individual Parametric Effects
Figure 5.2 illustrates the effects of the free moisture content in coal and the
temperature of the preheated air on the net efficiency of the supercritical pulverized coal-
fired power plant. The effects presented in the figure are identical to those for the
subcritical conditions, i.e., increasing the moisture content by 6% leads to a reduction in
the net efficiency by 2.5 percent point and increasing the preheated air temperature by
80°C results in an increase in the net efficiency by 1.0 percent point.
Figure 5.3 illustrates a proportional relationship between the net efficiency and
the temperature of main and reheated steam generated from the boiler unit. According to
the figure, increasing the temperature of main steam by 28Pc regardless of the
temperature of reheated steam results in an increase in the net efficiency by one half a
percent point. At a given temperature of main steam, the same percent of the net
efficiency point can be achieved by increasing the temperature of reheated steam by
45°C.
Figure 5.4 shows the effects of the turbine and boiler efficiencies on the net
efficiency of the power plant. An increase in the turbine efficiency from 90 to 92% gives
a slight improvement in the net efficiency (i.e. 0.1 percent point) while an increase in the
boiler efficiency by the same magnitude (2%) results in the improvement in the net
efficiency by 0.8 percent point.
The effect of the excess air may be considered unimportant as illustrated in Figure
5.5. About 3 percent increase in the excess air (i.e. from 16 to 19%) causes a slight
efficiency drop of 0.03 percent point.
90
Reproduced with permission of the copyright owner. Further reproduction prohibited without permission.
5.1 Individual Parametric Effects
Figure 5.2 illustrates the effects o f the free moisture content in coal and the
temperature o f the preheated air on the net efficiency of the supercritical pulverized coal-
fired power plant. The effects presented in the figure are identical to those for the
subcritical conditions, i.e., increasing the moisture content by 6% leads to a reduction in
the net efficiency by 2.5 percent point and increasing the preheated air temperature by
80°C results in an increase in the net efficiency by 1.0 percent point.
Figure 5.3 illustrates a proportional relationship between the net efficiency and
the temperature o f main and reheated steam generated from the boiler unit. According to
the figure, increasing the temperature of main steam by 28°C regardless o f the
temperature o f reheated steam results in an increase in the net efficiency by one half a
percent point. At a given temperature o f main steam, the same percent o f the net
efficiency point can be achieved by increasing the temperature o f reheated steam by
45°C.
Figure 5.4 shows the effects o f the turbine and boiler efficiencies on the net
efficiency o f the power plant. An increase in the turbine efficiency from 90 to 92% gives
a slight improvement in the net efficiency (i.e. 0.1 percent point) while an increase in the
boiler efficiency by the same magnitude (2%) results in the improvement in the net
efficiency by 0.8 percent point.
The effect o f the excess air may be considered unimportant as illustrated in Figure
5.5. About 3 percent increase in the excess air (i.e. from 16 to 19%) causes a slight
efficiency drop of 0.03 percent point.
90
Reproduced with permission of the copyright owner. Further reproduction prohibited without permission.

36.5 36.0 -
34.5 -u
a 33.0 - W
31.5 -
30.0
250
Free Moisture in Coal (%) o 11.12 a 12.74 A 14.36 x 15.98 x 17.60
275 300 325
Preheated Air Temperature (°C)
350
Figure 5.2 Effects of moisture content in coal and temperature of preheated air.
91
Reproduced with permission of the copyright owner. Further reproduction prohibited without permission.
31.5
figure 5.2 Bffects
o <XXXX> <X>CCWC<**eO9B30K»<><3t&<l̂ <>KK>
0 3 0m rjm m rm r m im i* nnrudiiULBm DO COO D
a /wmM mwataeM CJm, ^a a m etxm a ^m
x x xxx&mc
c °a l(% )0 U.12 ° 12.74
4 14.36 x 15.98
* 17.60
Free Moisture in
275
C h e a te d Air T.enipe nature (°q
° f moisture content in coal and ,em peratoeo fp reheateda.r
91
Permission of the „c°Pyright ow ner F u rth ,

36.5
36.0 -
‘g ‘' 35.5 -
35.0 -
W 34.5 -
34.0 -
33.5 -
33.0
530.0
Reheat Temperature (°C)
o 530.0 o 547.5 A 565.0 x 582.5 * 600.0
547.5 565.0 582.5 600.0
Temperature of Main Steam (°C)
Figure 5.3 Effects of main steam and reheated steam temperatures.
92
Reproduced with permission of the copyright owner. Further reproduction prohibited without permission.
36.5
36.0 -
aiBw"8£
35.0 \
34.5
34.0
33.5 H
33.0
■rfK. ** •mK A A
S S ifc - '
Reheat Temperature (°Qo 530.0 □ 547.5 A 565.0 x 582.5 x 600.0
530.0 547.5 565.0 582.5 600.0
Temperature of Main Steam (°C)
Figure 5.3 Effects o f main steam and reheated steam temperatures.
92
Reproduced with permission of the copyright owner. Further reproduction prohibited without permission.

36.0
Amalla A &AA &A% IAA AthAA LOACIAMIA AM ea&
Net
Eff
icie
ncy
(%) 35.5 -
a UP a Dam a ammo mm 033 oa as ma ED ED 0:1
35.0 -
34.5 -
34.0
90.0
COW) 000 0 0 QM 0 C. 0 0 0 *CO 0 CO 00 CM
Boiler Efficiency (%)
o 90.0
o 91.0
A 92.0
90.5 91.0 91.5
Turbine Efficiency (%)
Figure 5.4 Effects of boiler and turbine efficiencies.
93
92.0
Reproduced with permission of the copyright owner. Further reproduction prohibited without permission.
36.0
1 35.0S3WtS* 34.5
34.0
AAAA /MS& A A /MftAA rfWV\AAAA A a ft ^
^ 35,5 i odd □□>□ □ ninDDmm cmno □□ mo to no cP
o ^ o o o o O <x» « « > « OOXXDO o «x> oo coo
Boiler Efficiency (% )
o 90.0 □ 91.0 A 92.0
90.0 90.5 91.0 91.5
Turbine Efficiency (% )
92.0
Figure 5.4 Effects o f boiler and turbine efficiencies.
93
Reproduced with permission of the copyright owner. Further reproduction prohibited without permission.

Net
Eff
icie
ncy
(%)
16.0 17.0 18.0 19.0 20.0
Excess Air (%)
Figure 5.5 Effect of excess air for coal combustion.
94
Reproduced with permission of the copyright owner. Further reproduction prohibited without permission.
35.0
&I&W
34.920.017.0 18.0 19.015.0 16.0
Excess A ir(% )
Figure 5.5 Effect o f excess air for coal combustion.
94
Reproduced with permission of the copyright owner. Further reproduction prohibited without permission.

Figure 5.6 shows the effect of the pressure drop in the boiler unit and the FWH
train. It is noticed that the pressure drop in the boiler unit and the FWH trains shows a
small negative impact on the net efficiency of the power plant. An increase in the
pressure drop of the boiler unit by 2% contributes to a slight reduction in the net
efficiency (about 0.2 percent point) while an increase in the pressure drop of the FWH
trains by 2% causes a reduction in the net efficiency by 0.02 percent point.
Figure 5.7 through 5.11 shows the effect of the pressure distribution in the turbine
series. Figure 5.7 demonstrates the effect of the steam pressure extracted at the 1st stage
of the HP turbine on the net efficiency of the power plant. Lowering the 1st stage outlet
pressure from 7.1 to 5.5 MPa can enhance the efficiency by about 1.3 percent points.
Increasing the inlet pressure slightly improves the net efficiency. From the figure, by
keeping the outlet pressure constant at 5.5 MPa, raising the inlet pressure from 22.1 to
25.3 MPa by increasing the pressure ratio from 4.0 to 4.6 enhances the net efficiency by
only 0.13 percent point.
Figure 5.8 shows the effect of the steam pressure leaving the HP turbine.
Apparently, decreasing the outlet pressure below the optimal level (i.e. 4.1-4.3 MPa)
leads to a reduction of the plant efficiency.
Figures 5.9 and 5.10 demonstrate the effect of the steam pressure extracted from
the IP turbine. A reduction in the steam pressure at either the 1st or the 3rd stage of the IP
turbine causes the efficiency drop. Figure 5.9 shows that decreasing the 1St IP outlet
pressure from 2.5 to 2.0 MPa leads to 0.2 percent point reduction. Figure 5.10 shows that
reducing the 3rd IP outlet pressure from 0.9 to 0.6 MPa affects the net efficiency about 1.0
percent point drop.
95
Reproduced with permission of the copyright owner. Further reproduction prohibited without permission.
Figure 5.6 shows the effect o f the pressure drop in the boiler unit and the FWH
train. It is noticed that the pressure drop in the boiler unit and the FWH trains shows a
small negative impact on the net efficiency o f the power plant. An increase in the
pressure drop o f the boiler unit by 2% contributes to a slight reduction in the net
efficiency (about 0.2 percent point) while an increase in the pressure drop o f the FWH
trains by 2% causes a reduction in the net efficiency by 0.02 percent point.
Figure 5.7 through 5.11 shows the effect o f the pressure distribution in the turbine
series. Figure 5.7 demonstrates the effect o f the steam pressure extracted at the 1st stage
o f the HP turbine on the net efficiency o f the power plant. Lowering the 1st stage outlet
pressure from 7.1 to 5.5 MPa can enhance the efficiency by about 1.3 percent points.
Increasing the inlet pressure slightly improves the net efficiency. From the figure, by
keeping the outlet pressure constant at 5.5 MPa, raising the inlet pressure from 22.1 to
25.3 MPa by increasing the pressure ratio from 4.0 to 4.6 enhances the net efficiency by
only 0.13 percent point.
Figure 5.8 shows the effect o f the steam pressure leaving the HP turbine.
Apparently, decreasing the outlet pressure below the optimal level (i.e. 4.1-4.3 MPa)
leads to a reduction o f the plant efficiency.
Figures 5.9 and 5.10 demonstrate the effect of the steam pressure extracted from
the IP turbine. A reduction in the steam pressure at either the 1st or the 3rd stage o f the IP
turbine causes the efficiency drop. Figure 5.9 shows that decreasing the 1st IP outlet
pressure from 2.5 to 2.0 MPa leads to 0.2 percent point reduction. Figure 5.10 shows that
reducing the 3rd IP outlet pressure from 0.9 to 0.6 MPa affects the net efficiency about 1.0
percent point drop.
95
Reproduced with permission of the copyright owner. Further reproduction prohibited without permission.

35.2
35.1 -
0"
34.9 -7.09
34.7 -
34.5
8.0
Xx op A
Pressure Drop in FWHs (%)
o 3.0 4.0
a 5.0 x 6.0
9.0 10.0
Pressure Drop in Boiler Units (%)
Figure 5.6 Effect of pressure drop in steam cycle.
96
11.0
Reproduced with permission of the copyright owner. Further reproduction prohibited without permission.
35.2
35.1 -
C=0s W'
a 34.9 -I &W13I 34 .7-
34.5 -8.0 9.0 10.0 11.0
Pressure Drop in Boiler Units (% )
xxo<> A
Pressure Drop inFWHs (% )
o 3.0□ 4.0 A 5.0 x 6.0
Figure 5.6 Effect o f pressure drop in steam cycle.
96
Reproduced with permission of the copyright owner. Further reproduction prohibited without permission.

35.2
7 34.9
•e4.-1 34.5
Z 34.2
Net
Eff
icie
ncy
(%)
33.8
.0400gez'
HP Outle at 1st Stage (MPa) o 5.50
:13 665.
..481231
x 6.74 o 7.05
3.0 3.4 3.8 4.2 4.6
Pressure Ratio, BP Inlet/Outlet at 1st Stage
Figure 5.7 Effect of pressure in the HP stage.
35.9
35.6 -
35.3 -
35.0
4.5 5.5
HP Outlet at 2 nd Stage (MPa) * 3.54 o 3.74 A 3.93 x 4.12 x 4.31 o 4.50
6.5
Pressure Ratio, HP Inlet/Outlet at 2nd Stage
Figure 5.8 Effect of pressure at the 2 nd HP Stage.
97
7.5
Reproduced with permission of the copyright owner. Further reproduction prohibited without permission.
35.2
C= 34.9oN
fc*§*8 34.5 S3W
S? 34.2
33.8
a * * * * * * * * 0*
H P O u tle t a t 1st S tage(M P a)o 5.50 a 5.81 a 6 .1 2
x 6.43 x 6.74 o 7.05
3.0 3.4 3.8 4.2 4.6
P re ssu re R a tio , H P In le t/O u tle t a t 1st S tage
F ig u re 5.7 Effect o f pressure in the HP stage.
35.9
35.6 -0ss-/
.1£w
35.3
35.04.5
H P O u tle t a t 2nd S tage (M P a)♦ 3.54□ 3.74a 3.93x 4.12x 4.31
, o 4.50
5.5 6.5 7.5
P re ssu re R a tio , H P In le t/O u tle t a t 2nd S tage
F ig u re 5.8 Effect o f pressure at the 2nd HP Stage
97
Reproduced with permission of the copyright owner. Further reproduction prohibited without permission.

Net
Eff
icie
ncy
(%)
Pressure Ratio, IP Inlet/Outlet at 1st Stage
Figure 5.9 Effect of pressure at the 1st IP stage.
36.8
36.5 -
e 36.2 - C.> 1:1
.41.4 35.9 -
W ta 35.6 -z
35.3 -
35.0
3.5 4.0 4.5 5.0 5.5 6.0 6.5 7.0 7.5
IP Outlet at 3 rd Stage (MPa)
o 0.60 O 0.70 & 0.80 x 0.90
Pressure Ratio, IP Inlet/Outlet at 3 rd Stage
Figure 5.10 Effect of pressure at the 3rd IP stage.
98
Reproduced with permission of the copyright owner. Further reproduction prohibited without permission.
35.9
35.6'■S 0s
bI&W-g 35, fc
3 -
35.0
i / w Outlet a t 1st Stage(MPa)o 2.00 o 2.10 a 2.20 x 2.30 x 2.40 o 2.50
1.2 1.5 1.8 2.1 2.4
Pressure Ratio, IP Inlet/Outlet at 1st Stage
Figure 5.9 Effect o f pressure at the 1st IP stage.
IP Outlet a t 3 Stage (MPa)o 0.60 □ 0.70 A 0.80 x 0.90
36.5 -
36.2 -
tS 35.6 £
35.03.5 4.0 4.5 5.0 5.5 6.0 6.5 7.0 7.5
Pressure Ratio, IP Inlet/Outlet a t 3rd Stage
Figure 5.10 Effect o f pressure at the 3rd IP stage.
98
Reproduced with permission of the copyright owner. Further reproduction prohibited without permission.

Figure 5.11 indicates that lowering the steam pressure leaving the LP turbine
significantly improves the net efficiency. The finding is similar to the results presented
previously in Chapter Four.
5.2 Efficiency Correlations for Supercritical Pulverized Coal-fired Power Plant
Based on the parametric effects presented in the previous section, empirical
correlations for predicting the net efficiency of the supercritical pulverized coal-fired
power plant were developed by means of regression.
Figure 5.12 shows the reference net efficiency (riref) for a base supercritical power
plant operating under reference conditions (i.e., 25.34 MPa inlet pressure, 5.5 MPa HP
outlet pressure at the 1st stage, 2.6 MPa IP outlet pressure at the la stage and 5.0 kPa
backpressure).
Similar to the case of the subcritical pulverized coal-fired power plant (Chapter
Four), changing the pressure of steam extracted from the middle of either the HP or IP
turbine will change the magnitude of the power plant efficiency. In this case, the
deviation of the net efficiency due to the change in such pressures was obtained through
the regression and can be reported as
A7ip,,Hp2 (a • PHI,/ b• PHp2 +c • Plpi +d • Pm )'(PHpi -5•5 ) (5.1)
+(e•PHPI +J • PHp2 +g • Pipi +h • Pip, )•( 2.6-Pip, )
where a, b, c, d, e, f, g and h are the regression constants with the values of -0.00042,
-0.0008, 0.00414, 0.00438, 0.00295, -0.00174, -0.002 and -0.001, respectively. The
terms of PHp and P. represent the corresponding pressure of steam in the HP or IP
99
Reproduced with permission of the copyright owner. Further reproduction prohibited without permission.
Figure 5.11 indicates that lowering the steam pressure leaving the LP turbine
significantly improves the net efficiency. The finding is similar to the results presented
previously in Chapter Four.
5.2 Efficiency Correlations for Supercritical Pulverized Coal-fired Power Plant
Based on the parametric effects presented in the previous section, empirical
correlations for predicting the net efficiency o f the supercritical pulverized coal-fired
power plant were developed by means o f regression.
Figure 5.12 shows the reference net efficiency (r}rej) for a base supercritical power
plant operating under reference conditions (i.e., 25.34 MPa inlet pressure, 5.5 MPa HP
outlet pressure at the 1st stage, 2.6 MPa IP outlet pressure at the 1st stage and 5.0 kPa
backpressure).
Similar to the case o f the subcritical pulverized coal-fired power plant (Chapter
Four), changing the pressure o f steam extracted from the middle o f either the HP or IP
turbine will change the magnitude o f the power plant efficiency. In this case, the
deviation o f the net efficiency due to the change in such pressures was obtained through
the regression and can be reported as
HPi ,HP2 .IP] .IPs ~ ( a ' PH P; + ̂ ‘ P h P2 + C ' ^ IP j ' ̂ I P 3 ) ' ( ^ H P , ~ 5 ' $ )
+ ( e - P h p j f ' P h p 2 ^ 8 ‘ f * iP i ' P 1 P 3 ) ' ( 2 - 6 - P [ p t )
where a, b, c, d, e, f g and h are the regression constants with the values o f -0.00042,
-0.0008, 0.00414, 0.00438, 0.00295, -0.00174, -0.002 and -0.001, respectively. The
terms of PHP. and P,p represent the corresponding pressure o f steam in the HP or IP
99
Reproduced with permission of the copyright owner. Further reproduction prohibited without permission.

Net
Eff
icie
ncy
(%)
38.0
37.5 -
37.0 -
36.5 -
36.0 -
35.5 -
35.0 -
34.5
80.0
LP Outlet at 4th Stage (kPa) o 5.00 a 5.50 a 6.00 x 6.40 x 6.80
105.0 130.0 155.0 180.0
Pressure Ratio, LP Inlet/Outlet at 4th Stage
Figure 5.11 Effect of pressure at the last LP stage.
100
Reproduced with permission of the copyright owner. Further reproduction prohibited without permission.
38.0
37.5 -
? 37.0 -
a 36.5 -.aS 36.0 - wu£ 35.5 -
35.0 -
34.5 -80.0 105.0 130.0 155.0 180.0
Pressure Ratio, LP Inlet/Outlet at 4th Stage
Figure 5.11 Effect o f pressure at the last LP stage.
LP Outlet at 4 (kPa)o 5.00 □ 5.50A 6.00x 6.40 x 6.80
th Stage
Reproduced with permission of the copyright owner. Further reproduction prohibited without permission.

36.5 IP Outlet at 3 rd Stage (MPa)
3.2 3.4 3.6 3.8 4.0 4.2 4.4
HP Outlet at 2nd Stage (MPa)
4.6
Figure 5.12 Reference net efficiency of base supercritical PC.
(Base condition: 25.34 MPa HP inlet pressure, 5.5 MPa HP outlet pressure at 1st stage,
2.6 MPa IP outlet pressure at 1st stage and 5.0 kPa backpressure)
101
Reproduced with permission of the copyright owner. Further reproduction prohibited without permission.
36.5IP Outlet at 3 “ Stage (MPa)
36.00.83N®0s
i-P"£.S,a
35.5 0.750.68
35.00.60
34.5
4) 34.0
33.5
33.03.2 3.4 3.6 3.8 4.0 4.2 4.4 4.6
HP Outlet at 2nd Stage (MPa)
Figure 5.12 Reference net efficiency of base supercritical PC.
(Base condition: 25.34 MPa HP inlet pressure, 5.5 MPa HP outlet pressure at 1st stage,
2.6 MPa IP outlet pressure at 1st stage and 5.0 kPa backpressure)
101
Reproduced with permission of the copyright owner. Further reproduction prohibited without permission.

turbine extracted at ith-stage. The net efficiency of the supercritical pulverized coal-fired
power plant can be defined as
r1 net net = r ref — A 7 1HPI ,HP2 ,IPI ,IP3 (5.2)
The // ref value can be obtained from Figure 5.12 while the efficiency variation can be
calculated from Equation (5.1). To include the effects of other process parameters,
Equation (5.2) was modified and is presented in the following form
7 net = Olref Ar ?HP' ,HP2 JP] JP3 ) + 0.016 •( 20.0 — Ea) +[0..39•( 11
)( 17.6 — F.) + 2.05•( H — 4.9 )] 28
117
81 8
+ 0.012•(Tair — 250.0 )+ 0.018 • (T — 530.0 )+ 0.011• (Tr — 530.0 )+ 0.40•(th.der — 90.0 ) (5.3)
+ 0.057 • — 90.0 )— 0.11. (Pdrop —6.0)
where Eair, Fm, Tair, Tm, Tr, ?Moiler, and Pdrop represent the excess air (%), the free
moisture in coal (%), the preheated air temperature (°C), the main temperature (°C), the
reheating temperature (°C), the boiler efficiency (%), the turbine efficiency (%) and the
pressure drop (%), respectively. The HHV and H represent the high heating value (kJ/kg
coal) and hydrogen content of coal used (percent by weight).
It should be noted that Equation (5.3) is valid for the process parameters and types
of coals as given in Tables 3.3 and 4.3, respectively. A parity plot between the efficiency
calculated from the empirical correlation and that from the power plant model is
illustrated in Figure 5.13. The R2 of 0.99 indicates an excellent prediction from the
empirical correlation.
102
Reproduced with permission of the copyright owner. Further reproduction prohibited without permission.
turbine extracted at ith-stage. The net efficiency o f the supercritical pulverized coal-fired
power plant can be defined as
^1 net = T l r e f ~ ^ HP{ ,HP2 ,/P, ,/P3 ( 5 -2)
The rjref value can be obtained from Figure 5.12 while the efficiency variation can be
calculated from Equation (5.1). To include the effects o f other process parameters,
Equation (5.2) was modified and is presented in the following form
0 3 9 ' (^ 8 } 0 ? ' 6 " F J + 2-05 ' ( H ~ 4'9)Vnet ~ (tfref .IP] ,IP3 ) + 6 •( 20.0 Ea) +
+ 0.012 ■ (Tair - 250.0) + 0.018 -(Tm- 530.0) + 0.01 l-(Tr - 530.0) + 0.40■ (rjMkr - 9 0 .0 ) (5 ‘3 )
+ 0.057 ■ (nT - 90.0) - 0 .1 1 • (Pdrop - 6 .0)
where Eair, Fm, Tair, Tm, Tr, rjboiier, r\T and Pdrop represent the excess air (%), the free
moisture in coal (%), the preheated air temperature (°C), the main temperature (°C), the
reheating temperature (°C), the boiler efficiency (%), the turbine efficiency (%) and the
pressure drop (%), respectively. The HHV and H represent the high heating value (kJ/kg
coal) and hydrogen content o f coal used (percent by weight).
It should be noted that Equation (5.3) is valid for the process parameters and types
o f coals as given in Tables 3.3 and 4.3, respectively. A parity plot between the efficiency
calculated from the empirical correlation and that from the power plant model is
illustrated in Figure 5.13. The R2 o f 0.99 indicates an excellent prediction from the
empirical correlation.
102
Reproduced with permission of the copyright owner. Further reproduction prohibited without permission.

-54
44.0
39.3
0..4 CJ 1:1
.2.4 C.)
lig34.5
Ei 29.8
25.0
-
* Bituminou
a Subbiturnitiois
Lignite
25.0 29.8 34.5 39.3
2 = 0 99
44.0
Net Efficiency (%) — Power Plant Theoretical Model
Figure 5.13 Parity plot of net efficiency between empirical correlation
and theoretical model.
(Original in color)
103
Reproduced with permission of the copyright owner. Further reproduction prohibited without permission.
a"o'w "g
fc IA r9 .2 UA
■8 - H *E g *©.55 S W
44.0
39.3
34.5
29.8
o Bituminous » Subbitumino
Lignite
ubbitummous
Bituminous
25.025.0 29.8 34.5 39.3 44.0
Net Efficiency (%) ~ Power Plant Theoretical Model
Figure 5.13 Parity plot o f net efficiency between empirical correlation
and theoretical model.
(Original in color)
103
Reproduced with permission of the copyright owner. Further reproduction prohibited without permission.

5.3 Optimum Operating Conditions
The optimal operation of the supercritical pulverized coal-fired power plant can
be identified by changing the operating conditions and considering the individual effects
of process parameters as previously mentioned. However, a few parameters must be
carefully considered to allow the power plant to practically operate. In this study, the
moisture content of steam leaving any turbines is limited to 10% to prevent the
operational problem (Termuehlen and Emsperger, 2003). There is no limitation for main
and reheat temperatures in the steam power cycle since the material used for the boiler
tube was assumed to be ferritic and austenitic that could withstand the temperature up to
600°C (NEDO and CCUJ, 2004). Based on such constraints, the optimal operating
conditions are given in Figure 5.14 and Table 5.2. It should be noted that the results
presented in the figure and table were based on the 425 MW (gross output) supercritical
pulverized coal-fired power plant with the combustion of Illinois #6 bituminous coal.
104
Reproduced with permission of the copyright owner. Further reproduction prohibited without permission.
5.3 Optimum Operating Conditions
The optimal operation o f the supercritical pulverized coal-fired power plant can
be identified by changing the operating conditions and considering the individual effects
o f process parameters as previously mentioned. However, a few parameters must be
carefully considered to allow the power plant to practically operate. In this study, the
moisture content o f steam leaving any turbines is limited to 10% to prevent the
operational problem (Termuehlen and Emsperger, 2003). There is no limitation for main
and reheat temperatures in the steam power cycle since the material used for the boiler
tube was assumed to be ferritic and austenitic that could withstand the temperature up to
600°C (NEDO and CCUJ, 2004). Based on such constraints, the optimal operating
conditions are given in Figure 5.14 and Table 5.2. It should be noted that the results
presented in the figure and table were based on the 425 MW (gross output) supercritical
pulverized coal-fired power plant with the combustion o f Illinois #6 bituminous coal.
104
Reproduced with permission of the copyright owner. Further reproduction prohibited without permission.

Reproduced w
ith permission o
f the copyright owner.
Further reproduction prohibited w
ithout permission.
r --
Evaporator
0.103 11940.7
Coal
3.29 37133 600 262.43
RH1
C0110MIZ r
Reheat
4.31 2968.7 337.9 1958
2047.6 0.103 314.52 b 29.92 1099.8 30.85 957.8 451.71 395.94 451.71 el) 2$2.7 285.78 223.0 285.78
Upper FWD ain
.103 28734 33.59
0.103 350
283.52 429.91
0.103 4
.02 1175 68.1 285.78
Air heater
46.7 29.91
8000
0.103 25 429.91
Air
.31 122.9 11.18
232
530 1122.9 334 978.7 257.1 11.18 2273 30.75
25.34 3485.7 600 285.78
1 41
5.50 3048.0 380.9 11.18
2.52 13507 519.1 14.42
31.80806.8190.81 7.41
2.52 830.2 195.3
978.7 31.8 30.75 190.8
45.17
1.05 830.2 5.17
488
IP
1.27 13310.0 423.9 9.07
Deaerator 806.8 293.19
11.05 772.0 181.9 293.19
Boiler feed pump
0.9
0.9 3300.9 413.2 220.03
0.9
LP
3300.9 413.2 18.92
0.07412695.4111.518.98
0.22312886.8214.4 9.57
0.00512357.133.1 190.70
Condense
0.031126 3.8 94.0 10.79 0.005 142. 2
33.1 23815
Condensate pump
1.67 517.15 1.72 374.95 1.78 268.80 123.0 238.95 89.3 238.95 64.2 238.95
0.223 535.6
535.6
18.92
0.223
ower F train
- 28.49
394.5 0.074
0.031
1.831144.3633.1 238.95
0.031 158.3 37.6 48.25
289.7
289.7 127.4 18.92 93.7 28.49 68.7 37.46
Figure 5.14 Scheme of supercritical PC at optimal operating conditions.
(For Illinois#6 bituminous coal)
37.46
0.0051158.333.1 48.25
MPa kJ/ ° C kg/s
Reproduced
with perm
ission of the
copyright ow
ner. Further
reproduction prohibited
without
permission.
600 1262.430.913300.9
413.2] 220.03
LPEvaporator
5.50 13048.0 0.00512357.1 33.1 1190.70380.9| 11.18
0.913300.9111.5] 8.98413.2] 18.92
Condense]ReheatRH
0.031126'2.52 135070.005| 142.52 33.1 ] 238.95
423.9] 9.07 214.4] 9 ^ 7 94.0 110.794.31 12968.7 31.801xonom 190.817̂ 41
Condensate pump
374.95 1.78 238.95,642
268.!957.1 1.67 517.15 1.720.1031314.52 29.92110998 30.85 252.7 285.78 223.0
Upj er FWH0.10312047.6
123.0 238.95 ,893 238.95395.94|451.71
trainCoal0.00511583
I 0.103| 28332~ t 350 1429.91
>.02 1175.1I.103l 28734 [4537285.78
33.592.52 1830.2
0.031115831953 45.17Air heater 37.6 ] 48.25Deaerator
1 CT n \ I 1.05 [772.0\ S 5 ' 181.9] 293.19
Boiler feed pump0.9
535.6 0.074 394.5 0.031 289.70.223978.7 31.8 1806.81122.9 18.921.103] 473 11.18 30.75 190.8] 293.1946.7 1429.911
3 9 4 3 0.074 289.7535.6 032318.92 93.7
978.71122.9 3 34 28.49 68.7 37.4611.18 2273 30.75257.10.1031 MPal kJ/kg
°C I kg /s
Figure 5.14 Scheme o f supercritical PC at optimal operating conditions.
(For Hlinois#6 bituminous coal)

Table 5.2 Optimal process operations for supercritical PC.
Description Optimal Operation
Boiler temperature (°C) 600.0
Reheat temperature (°C) 600.0
HP turbine
1st stage-extract pressure (MPa) 25.34
2" stage-extract pressure (MPa) 3.29
IP turbine
stage-extract pressure (MPa)
2" stage-extract pressure (MPa)
Std stage-extract pressure (MPa)
2.52
1.27
0.90
LP turbine
1st stage-extract pressure (MPa) 0.223
2 nd z stage-extract pressure (MPa) 0.074
Std stage-extract pressure (MPa) 0.031
4th stage-extract pressure (MPa) 0.0050
Discharge pressure of boiler feed pump (MPa)
31.8
Discharge pressure of condensate pump (MPa) Preheated air temperature (°C)
1.83
350.0
Excess air (%) 15.0
Pressure drop in FWHs (%) <3.0
Pressure drop in boiler (%) <9.0
Boiler efficiency (%) >92.0
Turbine efficiency (%) >92.0
106
Reproduced with permission of the copyright owner. Further reproduction prohibited without permission.
Table 5.2 Optimal process operations for supercritical PC.
Description Optimal Operation
Boiler temperature (°C) 600.0Reheat temperature (°C) 600.0HP turbine
1st stage-extract pressure (MPa) 25.342nd stage-extract pressure (MPa) 3.29
IP turbine1st stage-extract pressure (MPa) 2.522nd stage-extract pressure (MPa) 1.273rd stage-extract pressure (MPa) 0.90
LP turbine1st stage-extract pressure (MPa) 0.2232nd stage-extract pressure (MPa) 0.0743rd stage-extract pressure (MPa) 0.0314m stage-extract pressure (MPa) 0.0050
Discharge pressure of boiler feed 31.8pump (MPa)Discharge pressure of condensate 1.83pump (MPa)Preheated air temperature (°C) 350.0Excess air (%) 15.0Pressure drop in FWHs (%) <3.0Pressure drop in boiler (%) <9.0Boiler efficiency (%) >92.0Turbine efficiency (%) >92.0
106
Reproduced with permission of the copyright owner. Further reproduction prohibited without permission.

5.4 Efficiency Drop due to CO2 Capture
This section reveals the efficiency drop due to the integration of the CO2 capture
unit into the supercritical pulverized coal-fired power plant. The reference plant obtained
from the optimal conditions was the MEA-based CO2 absorption unit with 90% CO2
removal efficiency.
Figure 5.15 illustrates the schematic diagram of the supercritical pulverized coal-
fired power plant integrated with the MEA-based CO2 absorption unit. Details of the
CO2 capture unit can be found in Section 4.6 presented earlier. Table 5.3 summarizes the
calculated power plant performance before and after integrated with the MEA-based CO2
absorption unit. The integration of the CO2 capture causes the net efficiency to drop from
43.1% to 31.4%. The ratio of CO2 emitted to the net power output decreased from 764.3
to 107.4 kg/MWh (305.72 to 30.57 tonne/hr). A comparison of the energy penalty due to
the CO2 capture between the subcritical and supercritical pulverized coal-fired power
plants is given in Figure 5.16.
For the effect of the CO2 removal efficiency on the net efficiency of the
supercritical pulverized coal-fired power plant, the finding is similar to the case of the
subcritical pulverized coal-fired power plant. Figure 5.17 shows the magnitude of the
energy penalty per unit of the CO2 removal efficiency. Apparently, the optimal removal
efficiency can be identified at 72% CO2 removal efficiency.
107
Reproduced with permission of the copyright owner. Further reproduction prohibited without permission.
5.4 Efficiency Drop due to CO2 Capture
This section reveals the efficiency drop due to the integration o f the CO2 capture
unit into the supercritical pulverized coal-fired power plant. The reference plant obtained
from the optimal conditions was the MEA-based CO2 absorption unit with 90% CO2
removal efficiency.
Figure 5.15 illustrates the schematic diagram of the supercritical pulverized coal-
fired power plant integrated with the MEA-based CO2 absorption unit. Details o f the
CO2 capture unit can be found in Section 4.6 presented earlier. Table 5.3 summarizes the
calculated power plant performance before and after integrated with the MEA-based CO2
absorption unit. The integration of the CO2 capture causes the net efficiency to drop from
43.1% to 31.4%. The ratio of CO2 emitted to the net power output decreased from 764.3
to 107.4 kg/MWh (305.72 to 30.57 tonne/hr). A comparison o f the energy penalty due to
the CO2 capture between the subcritical and supercritical pulverized coal-fired power
plants is given in Figure 5.16.
For the effect o f the CO2 removal efficiency on the net efficiency of the
supercritical pulverized coal-fired power plant, the finding is similar to the case o f the
subcritical pulverized coal-fired power plant. Figure 5.17 shows the magnitude o f the
energy penalty per unit o f the CO2 removal efficiency. Apparently, the optimal removal
efficiency can be identified at 72% CO2 removal efficiency.
107
Reproduced with permission of the copyright owner. Further reproduction prohibited without permission.

Reproduced w
ith permission o
f the copyright owner.
Further reproduction prohibited w
ithout permission.
Fu
rnac
e/B
oil
er
r
Evaporator
0.103 11940
Coal
28734
C.
0.103 283.52
2.‘ 33.59 / 350 429.91
Icromiir
0.103 314.52 395.94 451.71
Reheat
4.31 2968.7 337.9 19.58
V 29.92 1099.8 30.85 957.8 04 2p.7 285.78 223.0 285.78
Upper FWH train
.02 1175. 1 285.78
Air heater
429.9
25 429.9
41J 5.50 1122.9 354 978.7
00 257.1 11.18 227.5 30.75
339 37133
25.34 3485.7 600 285.78
2.52 13507
31.801806.8 519.1 14.42
190.817.41
2.52195.3 45.17
Deaerator 978.7 31.8 806.8 30.75 190.8 293.19
% 1 1.05 772.0) 181.9 293.19
Boiler feed pump
0.45 104.8 25.02 512.0 0.10 104.7
25.0
Desuper-402 absorptionheater process/Reboile
0.9 3300.9 413.24.20 045 3300.9
409.9 124.1
0-9
0.45 734.2 145.0 636.1
0.07412695.4111.5 9.17
0.421157.46123.7 124.1
0.00512357.133.1 164.50
Condens
94.31 0 9.
2670 0.005 142 2
.0 .8
33.1 114.85
Condensate pump
1.67 517.15 1.72 374.95 1.78 268.80 123.0 114.85 89.3 114.85 64.2 114.85
Lower FWH train
1.831144.3633.11114.85
0.0051158.3 33.1 150.35
0.223 535.6 0.074394.5 0.031 289.7 0.031 158.3 1%) ---- 18.92 - 31.48 - 40.65 37.6 50.35
535.6 0.223 394.5 0.074 289.7 127.4 18.92 93.7 31.48 68.7 40.65
AL'a11 rc.J °C kg/s
512.0
Figure 5.15 Scheme of supercritical PC with MEA-based absorption unit operating at optimal conditions.
(For Illinois#6 bituminous coal)
Reproduced
with perm
ission of the
copyright ow
ner. Further
reproduction prohibited
without
permission.
o00
CO 2 absorption process/Reboiler
Desuperheater
•'Vii )..... IrVI _Vj—“ S f f i RH2 SHI
Evaporator j
LP
5.50 13048.0 O.OOSl2357.1
CondensiReheatRH
252 13507423.9| 9.074-11 12968.7 33.1 1114^5
Condensate pump
517.15 1.7229.9211099.8 30.85 252.7 285.78 223.0
U p jerF W H395J>4| 451.71
trainCoal1.05 1830.2I 0-10312835?
. SCO 4-943 OS1.103128734 [45472.32 1830.
Air heater Deaerator0“ I 1.051772.0J 181.91293.19
Boiler feed pump
0.0311289.7 0.031 1583978.7 31.30.75 190^|293.19
394.5 0.074
11.18 227.5MPa kJ/kg°C I kg/sAir
Figure 5.15 Scheme o f supercritical PC with MEA-based absorption unit operating at optimal conditions.
(For Illinois#6 bituminous coal)

Table 5.3 Comparison of supercritical PC with and without MEA-based CO2 absorption
unit.
Description PC without MEA-
based CO2capture
PC with MEA-based CO2
capture
Gross power output MW 425.29 425.29
Energy consumption without MEA-based CO2absorption unit
MW 25.29 25.29
Energy consumption due to MEA-based CO2 absorption unit
MW 115.27
Net power output MW 400.00 284.73
Net efficiency %HHV 43.08 31.44
Coal consumption kg/s 33.59 33.59
CO2 emitted tonne/hr 305.72 30.57
CO2 emitted kg/MWh 764.30 107.36
SO2 emitted tonne/hr 0.42 0.42
SO2 emitted kg/MWh 1.04 1.46
NO emitted tonne/hr 0.23 0.23
NO emitted kg/MWh 0.58 0.81
PM emitted tonne/hr 0.0059 0.0059
PM emitted kg/MWh 0.015 0.021
109
Reproduced with permission of the copyright owner. Further reproduction prohibited without permission.
Table 5.3 Comparison o f supercritical PC with and without MEA-based CO2 absorption
unit.
DescriptionPC without MEA-
based C 0 2 capture
PC with MEA- based C 0 2
captureGross power output MW 425.29 425.29Energy consumption without MEA-based C02 absorption unit MW 25.29 25.29
Energy consumption due to MEA-based C02 absorption unit MW - 115.27
Net power output MW 400.00 284.73
Net efficiency %HHV 43.08 31.44
Coal consumption kg/s 33.59 33.59
C02 emitted tonne/hr 305.72 30.57
C02 emitted kg/MWh 764.30 107.36
S02 emitted tonne/hr 0.42 0.42
S02 emitted kg/MWh 1.04 1.46
NO emitted tonne/hr 0.23 0.23
NO emitted kg/MWh 0.58 0.81
PM emitted tonne/hr 0.0059 0.0059
PM emitted kg/MWh 0.015 0.021
109
Reproduced with permission of the copyright owner. Further reproduction prohibited without permission.

Net
Eff
icie
ncy
(%)
60
55 -
50
45 -
40 -
35 -
30 -
25 -
20
15 -
10 -
5
Subcritical Power Plant Supercritical Power Plant
Figure 5.16 Comparison of energy penalty
between subcritical and supercritical PCs.
110
Reproduced with permission of the copyright owner. Further reproduction prohibited without permission.
a>
£§
"8£
□ Without C 02 capture With C 02 capture
43.0839.18
31.4427.62
Subcritical Power Plant Supercritical Power Plant
Figure 5.16 Comparison of energy penalty
between subcritical and supercritical PCs.
110
Reproduced with permission of the copyright owner. Further reproduction prohibited without permission.

lum
p /
%C
O2
Rem
oval
0.17 0.16 -
0.14 -
0.12 -
0.10 -
0.08 -
0.06 -
0.04 -
0.02 -
0.00
o Subcritical coal-fired power plant
A Supercritical coal-fired power plant
0 25 50 75
CO2 Removal Efficiency (%)
100
Figure 5.17 Magnitude of energy penalty per unit of CO2 removal efficiency.
111
Reproduced with permission of the copyright owner. Further reproduction prohibited without permission.
0.170.16 -
0.14 -14>o 0.12 -S£ 0.10 -
0 0.08 -uo ' 0.06 -—.
a.£ 0.04 -■o
0.02 -
0.00 -
§
o Subcritical coal-fired power plant a Supercritical coal-fired power plant
25 50 75 100
C 0 2 Removal Efficiency (% )
Figure 5.17 Magnitude o f energy penalty per unit o f C 0 2 removal efficiency.
I l l
Reproduced with permission of the copyright owner. Further reproduction prohibited without permission.

Chapter Six
Economic Assessment
This chapter focuses on an economic assessment to reveal the cost of electricity
based on both subcritical and supercritical pulverized coal-fired power plants. The
assessment was based on a year-by-year basis counting effects of time, escalation rate
and present worth discount rate are performed to give comprehensive understanding on
economic analysis.
6.1 Economic Basis
Generally, the cost of structure of any industrial plants includes two main
components; fixed cost and operating cost. The fixed cost is commonly referred to as
capital investment associated with equipment cost, material cost, labor cost, engineering
cost, contingency cost, insurance, taxes, land costs, indirect cost and allowance for funds
used during construction (AFUDC). The operating cost includes operating and
maintenance cost (O&M cost), consumable cost (e.g., water, chemical, electricity), fuel
cost and others consumed during plant operation (Singer, 1991; Drbal et al., 1996; U.S.
DOE, 1999). The capital investment is basically converted to annual cost taking place
year-by-year during electric power produced. The operating cost is commonly presented
as the expense per kilowatt-hour of electricity ($/kWh). The sum of capital investment
and operating cost is referred to as cost of electricity (COE). The equation can be written
by
112
Reproduced with permission of the copyright owner. Further reproduction prohibited without permission.
Chapter Six
Economic Assessment
This chapter focuses on an economic assessment to reveal the cost o f electricity
based on both subcritical and supercritical pulverized coal-fired power plants. The
assessment was based on a year-by-year basis counting effects o f time, escalation rate
and present worth discount rate are performed to give comprehensive understanding on
economic analysis.
6.1 Economic Basis
Generally, the cost o f structure o f any industrial plants includes two main
components; fixed cost and operating cost. The fixed cost is commonly referred to as
capital investment associated with equipment cost, material cost, labor cost, engineering
cost, contingency cost, insurance, taxes, land costs, indirect cost and allowance for funds
used during construction (AFUDC). The operating cost includes operating and
maintenance cost (O&M cost), consumable cost (e.g., water, chemical, electricity), fuel
cost and others consumed during plant operation (Singer, 1991; Drbal et al., 1996; U.S.
DOE, 1999). The capital investment is basically converted to annual cost taking place
year-by-year during electric power produced. The operating cost is commonly presented
as the expense per kilowatt-hour o f electricity ($/kW h). The sum o f capital investm ent
and operating cost is referred to as cost o f electricity (COE). The equation can be written
by
112
Reproduced with permission of the copyright owner. Further reproduction prohibited without permission.

COE = ( TCR )
+(0M+FC+CC+OC) CF • Pw
(6.1)
where TCR, CF and P,„, represent total capital investment ($/year or $/hr), capacity factor
(%) and power output (kW) while OM, FC, CC and OC denote operating and
maintenance cost, fuel cost, consumable cost and other operating costs ($/kWh).
The conversion of the capital investment as previously mentioned is on a basis of
annual cost that decreases year-by-year (Drbal et al., 1996; Bohm, 2006). In other words
it does not remain constant throughout the entire lifetime of the plant. To normalize the
electricity cost, a factor of levelized fixed charge rate (FCF) must be included in the
calculation. Therefore, Equation (6.1) can be rewritten as
COE =( TCR
FCF + (OM + FC + CC + OC) (6.2) CF • Pw
The above equation is commonly used in several cost studies (Griffiths and Marr-Laing,
2002; Metz et al., 2005). The following is a discussion of the other parameters associated
with the economic assessment.
6.1.1 Allowance for Funds Used during Construction
AFUDC is a charge made by the owner for borrowing the construction fund. The
total AFUDC is considered an extra cost added into the capital investment. The equation
is expressed by (Drbal et al., 1996)
AFUDC rate = (/ + i)'" (6.3)
where i represents monthly or annual interest rate (%) and m represents number of
months or years before the plant is placed in service.
113
Reproduced with permission of the copyright owner. Further reproduction prohibited without permission.
COE =C F -P
+ ( OM + FC + CC + OC) (6.1)w J
where TCR, CF and Pw represent total capital investment ($/year or $/hr), capacity factor
(%) and power output (kW) while OM, FC, CC and OC denote operating and
maintenance cost, fuel cost, consumable cost and other operating costs ($/kWh).
The conversion o f the capital investment as previously mentioned is on a basis o f
annual cost that decreases year-by-year (Drbal et al., 1996; Bohm, 2006). In other words
it does not remain constant throughout the entire lifetime o f the plant. To normalize the
electricity cost, a factor o f levelized fixed charge rate (FCF) must be included in the
calculation. Therefore, Equation (6.1) can be rewritten as
COE =C F P
FCF + (O M + FC + CC + OC) (6 .2)w J
The above equation is commonly used in several cost studies (Griffiths and Marr-Laing,
2002; Metz et al., 2005). The following is a discussion o f the other parameters associated
with the economic assessment.
6.1.1 Allowance for Funds Used during Construction
AFUDC is a charge made by the owner for borrowing the construction fund. The
total AFUDC is considered an extra cost added into the capital investment. The equation
is expressed by (Drbal et al., 1996)
AFUDC rate = (/ + i)m (6.3)
where i represents monthly or annual interest rate (%) and m represents number of
months or years before the plant is placed in service.
113
Reproduced with permission of the copyright owner. Further reproduction prohibited without permission.

6.1.2 Levelized Fixed Charge Rate of Capital Cost
For any industrial plants placed in service, the annual fixed charge is composed of
several cost components, including debt, federal and provincial (or state) income taxes,
plant depreciation, property taxes, insurances and other administrator costs. Among these
costs, plant depreciation, property, taxes, insurances and other administrative costs
constantly reduce the capital requirement throughout the entire plant lifetime. However,
the other two cost components (an increase of return on debt and equity and decrease of
income taxes) significantly reduce the capital requirement over the years as illustrated in
Figure 6.1. The reduction in these costs can be estimated by the present worth factor.
Present worth factor = 1(1+ j)"
(6.4)
where j and n are present worth discount rate (%) and number of years placed in service,
respectively.
The fixed charge rate of capital cost is levelized by the sum of the present worth
of each annual cost divided by the total present worth factor given in Equation (6.4). Its
equation can be simplified by
Levelized fixed charge = E annual cost a x 1
1=1l + fi n
114
1i=1 a ± P n
(6.5)
Reproduced with permission of the copyright owner. Further reproduction prohibited without permission.
6.1.2 Levelized Fixed Charge Rate of Capital Cost
For any industrial plants placed in service, the annual fixed charge is composed of
several cost components, including debt, federal and provincial (or state) income taxes,
plant depreciation, property taxes, insurances and other administrator costs. Among these
costs, plant depreciation, property, taxes, insurances and other administrative costs
constantly reduce the capital requirement throughout the entire plant lifetime. However,
the other two cost components (an increase o f return on debt and equity and decrease of
income taxes) significantly reduce the capital requirement over the years as illustrated in
Figure 6.1. The reduction in these costs can be estimated by the present worth factor.
where j and n are present worth discount rate (%) and number o f years placed in service,
respectively.
The fixed charge rate o f capital cost is levelized by the sum of the present worth
Present worth factor = o+jr (6.4)
of each annual cost divided by the total present worth factor given in Equation (6.4). Its
equation can be simplified by
^ annual cost n x
Levelized fixed charge = (6.5)
114
Reproduced with permission of the copyright owner. Further reproduction prohibited without permission.

20-
Return on debt and equity
State and federal income taxes
Properties, taxes, insurances, and other administrative costs
Depreciation (straight line)
Year in service
Figure 6.1 Levelized fixed charge rate for capital cost.
(Source Drbal et al., 1996)
115
End of book life
Reproduced with permission of the copyright owner. Further reproduction prohibited without permission.
20 »
15Return on debt
and equity
State and federal income taxes
5 - Properties, taxes, insurances, and other administrative costs
Depreciation (straight line)
End of1 2 3Year in service book life
Figure 6.1 Levelized fixed charge rate for capital cost.
(Source Drbal et al., 1996)
115
Reproduced with permission of the copyright owner. Further reproduction prohibited without permission.

6.1.3 Levelized Operating Cost
The operating cost can be varied by the effects of several factors such as present
worth discount rate and annual escalation rate. The operating cost can be levelized by the
following equation (Drbal et al., 1996).
Levelized operating cost = (cost at beginning of first year) x (CRF) x 1-Kn (6.6a) j -es
1 + es K —
1 + j
l•CRF — (1+
(1 + j)° — 1
(6.6b)
(6.6c)
where es, j and n represent annual escalation rate (%), present worth discount rate (%)
and number of years placed in service.
6.1.4 Present Worth Cost
It is commonly known that time is the main factor indicating the present worth
cost. Even though a cost value shown in future is higher than the value in the present
time, it does not mean that the future value is worth more than the current value. For
comparison purposes, the cost values reported at different time periods must convert to
the present values (PV) using the following equation. (Singer, 1991; Drbal et al., 1996)
( 1+ :1) n —1 PV =US x kl±it
(6.7)
where US, j and n denote uniform series present worth factor, present worth discount rate
(%) and number of years placed in service.
116
Reproduced with permission of the copyright owner. Further reproduction prohibited without permission.
6.1.3 Levelized Operating Cost
The operating cost can be varied by the effects o f several factors such as present
worth discount rate and annual escalation rate. The operating cost can be levelized by the
following equation (Drbal et al., 1996).
l _ K nLevelized operating cost = (cost at beginning o f first year) x (CRF) x ------- (6.6a)
j-es
K = (6.6b)* + j
CRF = + (6.6c)( l + j ) n - l
where es, j and n represent annual escalation rate (%), present worth discount rate (%)
and number o f years placed in service.
6.1.4 Present Worth Cost
It is commonly known that time is the main factor indicating the present worth
cost. Even though a cost value shown in future is higher than the value in the present
time, it does not mean that the future value is worth more than the current value. For
comparison purposes, the cost values reported at different time periods must convert to
the present values (PV) using the following equation. (Singer, 1991; Drbal et al., 1996)
P V = U S x (1 + ~ J (6.7)j ( l + j ) n
where US, j and n denote uniform series present worth factor, present worth discount rate
(%) and number o f years placed in service.
116
Reproduced with permission of the copyright owner. Further reproduction prohibited without permission.

6.2 Cost of Electricity of Pulverized Coal-Fired Power Plants
This section summaries the evaluation of electricity cost derived from both
subcritical and supercritical pulverized coal-fired power plant operations. The cost
evaluation was performed for a reference power plant (425 MW gross output) with and
without the CO2 capture unit. The economic inputs used in the evaluation are given in
Table 6.1. The calculation results are presented in Table 6.2. Note that the results
presented in the table were obtained for Illinois#6 bituminous coal and 90% CO2 removal
efficiency.
From the table, cost of electricity from the subcritical pulverized coal-fired power
plant with and without the CO2 capture unit is slightly lower than the cost from the
supercritical pulverized coal-fired power plant (i.e. 4.30 and 8.19 0/kWh for the
subcritical, and 4.37 and 8.20 0/kWh for the supercritical pulverized coal-fired power
plants without and with the CO2 capture unit). This finding is consistent with the results
from other studies (U.S.DOE, 1999; Kraemer et al., 2004; Bohm, 2006). Based on
U.S.DOE (1999) the capital requirement for supercritical pulverized coal-fired power
plant is higher than subcritical pulverized coal-fired power plant (i.e. $1226.7/kW for the
subcritical pulverized coal-fired power plant and $1274.6/kW for the supercritical
pulverized coal-fired power plant). This leads to a higher cost of the supercritical-based
electricity.
117
Reproduced with permission of the copyright owner. Further reproduction prohibited without permission.
6.2 Cost of Electricity of Pulverized Coal-Fired Power Plants
This section summaries the evaluation o f electricity cost derived from both
subcritical and supercritical pulverized coal-fired power plant operations. The cost
evaluation was performed for a reference power plant (425 MW gross output) with and
without the CO2 capture unit. The economic inputs used in the evaluation are given in
Table 6.1. The calculation results are presented in Table 6.2. Note that the results
presented in the table were obtained for Illinois#6 bituminous coal and 90% CO2 removal
efficiency.
From the table, cost of electricity from the subcritical pulverized coal-fired power
plant with and without the CO2 capture unit is slightly lower than the cost from the
supercritical pulverized coal-fired power plant (i.e. 4.30 and 8.19 0/kWh for the
subcritical, and 4.37 and 8.20 0/kWh for the supercritical pulverized coal-fired power
plants without and with the CO2 capture unit). This finding is consistent with the results
from other studies (U.S.DOE, 1999; Kraemer et al., 2004; Bohm, 2006). Based on
U.S.DOE (1999) the capital requirement for supercritical pulverized coal-fired power
plant is higher than subcritical pulverized coal-fired power plant (i.e. $1226.7/kW for the
subcritical pulverized coal-fired power plant and $1274.6/kW for the supercritical
pulverized coal-fired power plant). This leads to a higher cost o f the supercritical-based
electricity.
117
Reproduced with permission of the copyright owner. Further reproduction prohibited without permission.

Table 6.1 Economic inputs.
Parameter Reference
Economic life 35.0 years Griffiths and Marr-Laing (2002)
Construction period 4.0 years Drbal et al. (1996)
Annual escalation rate 7.0 Drbal et al. (1996)
Present worth discount rate 11.5 % Drbal et al. (1996)
Capacity factor 85.0 % U.S.DOE (1999)
Allowance for funds used during construction (AFUDC)
25.0 % Drbal et al. (1996)
Total plant cost 1129a $/kW U.S.DOE (1999) (no MEA-based CO2 capture) 11731' Total plant cost + MEA-based 2090a $/kW David and Herzog CO2 capture 2130 (2000) MEA consumption 1.5 kg MEA Hendriks (1994)
tonne CO,
MEA reagent cost 1250 $/tonne MEA Rao and Rubin (2002)
Operating & maintenance 10662a $/kWh U.S.DOE (1999) (O&M) cost (no consumable cost and fuel cost)
11064"
Consumable operating cost 5152 $/kWh U.S.DOE (1999)
Other capital investment cost 41V $/kWh U.S.DOE (1999) 42.51'
Fuel cost 33719' $/kWh U.S.DOE (1999)
a The given value is used for the subcritical pulverized coal-fired power plant. b The given value is used for the supercritical pulverized coal-fired power plant.
The given value is based on the 400 MW-based power plant with 38.97 kg coal/s and 9577 kJ/kWh. The supplied coal is Illinois#6 bituminous coal (U.S.DOE, 1999)
118
Reproduced with permission of the copyright owner. Further reproduction prohibited without permission.
Table 6.1 Economic inputs.
Parameter ReferenceEconomic life 35.0 years Griffiths and Marr-
Laing (2002)Construction period 4.0 years Drbal et al. (1996)Annual escalation rate 7.0 % Drbal et al. (1996)Present worth discount rate 11.5 % Drbal et al. (1996)Capacity factor 85.0 % U.S.DOE (1999)Allowance for funds used during construction (AFUDC)
25.0 % Drbal et al. (1996)
Total plant cost(no MEA-based C 02 capture)
1129“1173b
$/kW U.S.DOE (1999)
Total plant cost + MEA-based C 02 capture
2090“2134b
$/kW David and Herzog (2000)
MEA consumption 1.5 kg MEA tonne C 0 2
Hendriks (1994)
MEA reagent cost 1250 $/tonne MEA Rao and Rubin (2002)
Operating & maintenance (O&M) cost (no consumable cost and fuel cost)
10662“11064b
$/kWh U.S.DOE (1999)
Consumable operating cost 5152 $/kWh U.S.DOE (1999)Other capital investment cost 41.0“
42.5b$/kWh U.S.DOE (1999)
Fuel cost 33719° $/kWh U.S.DOE (1999)a The given value is used for the subcritical pulverized coal-fired power plant. b The given value is used for the supercritical pulverized coal-fired power plant.c The given value is based on the 400 MW-based power plant with 38.97 kg coal/s and 9577 kJ/kWh. The
supplied coal is Illinois#6 bituminous coal (U.S.DOE, 1999)
118
Reproduced with permission of the copyright owner. Further reproduction prohibited without permission.

Table 6.2 Results of economic analysis for subcritical and supercritical PCs with and
without MEA-based CO2 absorption unit.
Description
Without MEA-based CO2capture unit
With MEA-based CO2capture unit
Subcritical PC
Supercritical PC
Subcritical PC
Supercritical PC
Gross power output MW 424.74 425.29 424.74 425.29
Energy consumption without MEA-based
MW 24.74 25.29 24.74 25.29
Energy consumption from MEA-based CO2capture unit
MW 116.23 115.27
Net power output MW 400.00 400.00 283.77 284.73
Capital requirement $/kW 1129.20 1173.40 2090.00 2134.40
Allowance for funds used during construction
$/kW 282.30 293.35 522.50 533.60
Total plant investment $/kW 1411.50 1466.75 2612.50 2668.00
Other capital investment cost
$/kW 41.00 42.50 41.00 42.50
Total capital requirement
$/kW 1452.50 1509.25 2653.50 2710.50
0/kWh 2.75 2.86 5.02 5.13
Total operating and maintenance cost
$x1.000 10.66 11.06 15.03 15.54
Total consumable operating costs
$x1000 5.15 5.15 9.00 8.88
Fuel cost $x1000 30.46 28.89 42.93 40.58
Levelized cost of electricity (calculated at 85% capacity factor)
0/kWh 4.30 4.37 8.19 8.20
119
Reproduced with permission of the copyright owner. Further reproduction prohibited without permission.
Table 6.2 Results o f economic analysis for subcritical and supercritical PCs with and
without MEA-based CO2 absorption unit.
Description
Without MEA-based C02 capture unit
With MEA-based C02 capture unit
Subcritical Supercritical PC PC
SubcriticalPC
SupercriticalPC
Gross power output MW 424.74 425.29 424.74 425.29
Energy consumption without MEA-based
MW 24.74 25.29 24.74 25.29
Energy consumption from MEA-based C 02 capture unit
MW 116.23 115.27
Net power output MW 400.00 400.00 283.77 284.73
Capital requirement $/kW 1129.20 1173.40 2090.00 2134.40
Allowance for funds used during construction
$/kW 282.30 293.35 522.50 533.60
Total plant investment $/kW 1411.50 1466.75 2612.50 2668.00
Other capital investment cost
$/kW 41.00 42.50 41.00 42.50
Total capital requirement
$/kW 1452.50 1509.25 2653.50 2710.50
0/kWh 2.75 2.86 5.02 5.13
Total operating and maintenance cost
SxlOOO 10.66 11.06 15.03 15.54
Total consumable operating costs
SxlOOO 5.15 5.15 9.00 8.88
Fuel cost SxlOOO 30.46 28.89 42.93 40.58
Levelized cost of electricity (calculated at 85% capacity factor)
0/kWh 4.30 4.37 8.19 8.20
119
Reproduced with permission of the copyright owner. Further reproduction prohibited without permission.

However, it should be noticed that the supercritical pulverized coal-fired power plant
offers the higher net efficiency than the subcritical pulverized coal-fired power plant.
This means that the simple calculation for cost of electricity may not be the real indicator.
Therefore, cost of electricity difference year-by-year and capital equivalent method
should be considered to reveal the true effect. The results based on more complex
calculation are given in Figures 6.2 and 6.3. Figure 6.2 shows a rapid increase in cost of
electricity difference within the first 10 years before gradual drop. Regardless of the CO2
capture activity, the supercritical pulverized coal-fired power plant offers a lower cost of
electricity difference. This implies that cost of supercritical pulverized coal-fired power
plant may be lower than the subcritical pulverized coal-fired power plant. The economic
advantage of the supercritical pulverized coal-fired power plant can be seen more clearly
in Figure 6.3 when the present worth of operating cost is added to the total fixed charge
of capital cost on year-by-year basis throughout the plant lifetime. From the figure, the
cumulative present worth of annual cost for the supercritical pulverized coal-fired power
plants with and without CO2 capture is higher than the subcritical pulverized coal-fired
power plants with and without CO2 capture during the first 7th and 9th years of operation.
However, the cumulative present worth for the supercritical pulverized coal-fired power
plants becomes lower than that for the subcritical pulverized coal-fired power plants after
7th and 9th years of operation. The difference is significant in terms of the total cost when
the cumulative present worth is multiplied by the net power output. This suggests that
not only the supercritical pulverized coal-fired power plant gives a higher plant
performance and lower air pollutions, but also it offers a better economic cost than the
subcritical pulverized coal-fired power plant does.
120
Reproduced with permission of the copyright owner. Further reproduction prohibited without permission.
However, it should be noticed that the supercritical pulverized coal-fired power plant
offers the higher net efficiency than the subcritical pulverized coal-fired power plant.
This means that the simple calculation for cost o f electricity may not be the real indicator.
Therefore, cost o f electricity difference year-by-year and capital equivalent method
should be considered to reveal the true effect. The results based on more complex
calculation are given in Figures 6.2 and 6.3. Figure 6.2 shows a rapid increase in cost of
electricity difference within the first 10 years before gradual drop. Regardless o f the CO2
capture activity, the supercritical pulverized coal-fired power plant offers a lower cost of
electricity difference. This implies that cost o f supercritical pulverized coal-fired power
plant may be lower than the subcritical pulverized coal-fired power plant. The economic
advantage o f the supercritical pulverized coal-fired power plant can be seen more clearly
in Figure 6.3 when the present worth o f operating cost is added to the total fixed charge
o f capital cost on year-by-year basis throughout the plant lifetime. From the figure, the
cumulative present worth o f annual cost for the supercritical pulverized coal-fired power
plants with and without CO2 capture is higher than the subcritical pulverized coal-fired
th fhpower plants with and without CO2 capture during the first 7 and 9 years o f operation.
However, the cumulative present worth for the supercritical pulverized coal-fired power
plants becomes lower than that for the subcritical pulverized coal-fired power plants after
7th and 9th years o f operation. The difference is significant in terms o f the total cost when
the cumulative present worth is multiplied by the net power output. This suggests that
not only the supercritical pulverized coal-fired power plant gives a higher plant
performance and lower air pollutions, but also it offers a better economic cost than the
subcritical pulverized coal-fired power plant does.
120
Reproduced with permission of the copyright owner. Further reproduction prohibited without permission.

2.5
2.0 -
0.0
,att
4 I/
'
.0- -P 0 -a
P A 11 71 , lai ots
..,1 so
la 813 t 8 843
ob 'n'0
A 'a 1:3
sa ,0
'A 13 'Li
Subcritical PC without MEA-based CO2 absorption
° o Supercritical PC without MEA-based CO2 absorption
0 Subcritical PC with MEA-based CO2 absorption o
Supercritical PC with MEA-based CO2 absorption
0.0 5.0 10.0 15.0 20.0 25.0 30.0 35.0
Year in Service
Figure 6.2 Cost of electricity (COE) difference, (0/kWh, year, - yearn-1).
121
Reproduced with permission of the copyright owner. Further reproduction prohibited without permission.
COE
Diff
eren
ce,
COE
year
- COE
ye
ar-i,
O'/k
Wh)
2.5
2.0
1.5
1.0
0.5 -
/A> T a ' q
P / "A 13Aa A~n" SA Vio'A ^
Ati
f
isorntion ption
□ Subcritical PC with MEA-based CO2 absorption
I
* * * * « « « *
/ • * * » „ 5 * 4
1 /i p _1 1 O Subcritical PC without MEA-based CO2 absorption w=06=$,
i ? p;
p A ^ A u j /~ ^r\ f: 0 ©
1 r o Supercritical PC without MEA-based CO2 absorption
/©1/ A Supercritical PC with MEA-based CO2 absorption
0 . 0 V ----------------- 1------------------ !------------------ 1-------------------1------------------ 1------------
0.0 5.0 10.0 15.0 20.0 25.0 30.0 35.0
Year in Service
Figure 6.2 Cost o f electricity (COE) difference, (0/kWh, yearn - yearn_i).
121
Reproduced with permission of the copyright owner. Further reproduction prohibited without permission.

Cu
mu
lati
ve
Pre
sen
t Wo
rth
of A
nnual
Cos
t ($/
kW)
30000
25000 -
20000 -
15000 -
10000 -
5000 6
* Subcritical PC without MEA-based CO2 absorption
O Subcritical PC with MEA-based CO2 absorption
O Supercritical PC without MEA-based CO2 absorption
A Supercritical PC with MEA-based CO2 absorption
()Cumulative Present Worth Cost at 0th year Subcritical PC with MEA = 4534.2 $/kW Supercritical PC with MEA = 4628.9 $/kW
()Cumulative Present Worth Cost at 7th year Subcritical PC with MEA = 8405.7 $/kW Supercritical PC with MEA = 8387.2 $/kW
©Cumulative Present Worth Cost at 356 year Subcritical PC with MEA = 26170.9 $/kW Supercritical PC with MEA = 25632.9 $/kW
®Cumulative Present Worth Cost at 0th year Subcritical PC without MEA = 2490.4 $/kW Supercritical PC without MEA = 2587.7 $/kW
C)Cumulative Present Worth Cost at 9th year Subcritical PC without MEA = 6340.8 $/kW Supercritical PC without MEA = 6340.7 $/kW
()Cumulative Present Worth Cost at 35th year Subcritical PC without MEA = 17347.7 $/kW Supercritical PC without MEA = 17069.4 $/kW
4
0 5 7 910 15 20
Year in Service
Figure 6.3 Capital recovery period.
122
25 30 35
Reproduced with permission of the copyright owner. Further reproduction prohibited without permission.
Cum
ulat
ive
Pres
ent
Wor
th
of An
nual
Cos
t ($
/kW
)30000
25000
20000
15000
10000
5000
>k Subcritical PC without MEA-based C02 absorption O Subcritical PC with MEA-based C02 absorption O Supercritical PC without MEA-based C02 absorption A Supercritical PC with MEA-based C02 absorption
© Cumulative Present Worth Cost at 0 year Subcritical PC with MEA =4534.2 $/kW Supercritical PC with MEA = 4628.9 S/kW© Cumulative Present Worth Cost at 7th year Subcritical PC with MEA = 8405.7 $/kW Supercritical PC with MEA = 8387.2 $/kW© Cumulative Present Worth Cost at 35111 year Subcritical PC with MEA = 26170.9 $/kW Supercritical PC with MEA = 25632.9 $/kW <
© .
&
$
©4
© Cumulative Present Worth Cost at 0th year Subcritical PC without MEA = 2490.4 $/kW Supercritical PC without MEA = 2587.7 $/kW© Cumulative Present Worth Cost at 91*1 year Subcritical PC without MEA = 6340.8 $/kW Supercritical PC without MEA = 6340.7 $/kW© Cumulative Present Worth Cost at 35th year Subcritical PC without MEA = 17347.7 $/kW Supercritical PC without MEA = 17069.4 S/kW
5 7 910 15 20 25 30 35
Year in Service
Figure 6.3 Capital recovery period.
122
Reproduced with permission of the copyright owner. Further reproduction prohibited without permission.

6.3 Sensitivity Analysis for Electricity Cost
The objective of this section is to identify major economic parameters affecting
cost of electricity and also to reveal the effect of CO2 capture cost. The sensitivity
analysis by an approach of the rank correlation coefficient was carried out for a number
of parameters including capital requirement, energy consumption, net efficiency, fuel
cost, allowance for funds used during construction, operating and maintenance cost,
consumable operating cost, MEA reagent and other capital investment costs. The
economic inputs for the simulation are summarized in Table 6.3.
Figure 6.4 demonstrates the analysis results presented as the absolute value of
correlation coefficient of individual parameters. Based on the subcritical pulverized coal-
fired power plant, the influential parameters presented in descending order of importance
are energy consumed by the CO2 capture unit, capital requirement for the plant reference,
the net efficiency, the capital requirement for the CO2 capture, the fuel cost, the
allowance for funds used during construction, the operating and maintenance cost, the
consumable operating cost, other capital investment cost and the MEA reagent cost. For
the supercritical pulverized coal-fired power plant, the total capital requirement is the
major influential parameter. In addition, the effect of the net efficiency falls behind the
capital cost. According to the plant efficiency, the supercritical pulverized coal-fired
power plant obviously shows the superior net efficiency than the subcritical pulverized
coal-fired power plant (i.e. 27.62 and 31.44% net efficiency for the subcritical and
supercritical pulverized coal-fired power plants integrated with the CO2 capture units,
respectively). As the net efficiency had already been improved, other parameters (i.e.
capital cost) becomes more sensitive to the cost of electricity.
123
Reproduced with permission of the copyright owner. Further reproduction prohibited without permission.
6.3 Sensitivity Analysis for Electricity Cost
The objective o f this section is to identify major economic parameters affecting
cost o f electricity and also to reveal the effect o f CO2 capture cost. The sensitivity
analysis by an approach o f the rank correlation coefficient was carried out for a number
o f parameters including capital requirement, energy consumption, net efficiency, fuel
cost, allowance for funds used during construction, operating and maintenance cost,
consumable operating cost, MEA reagent and other capital investment costs. The
economic inputs for the simulation are summarized in Table 6.3.
Figure 6.4 demonstrates the analysis results presented as the absolute value of
correlation coefficient o f individual parameters. Based on the subcritical pulverized coal-
fired power plant, the influential parameters presented in descending order o f importance
are energy consumed by the CO2 capture unit, capital requirement for the plant reference,
the net efficiency, the capital requirement for the CO2 capture, the fuel cost, the
allowance for funds used during construction, the operating and maintenance cost, the
consumable operating cost, other capital investment cost and the MEA reagent cost. For
the supercritical pulverized coal-fired power plant, the total capital requirement is the
major influential parameter. In addition, the effect o f the net efficiency falls behind the
capital cost. According to the plant efficiency, the supercritical pulverized coal-fired
power plant obviously shows the superior net efficiency than the subcritical pulverized
coal-fired power plant (i.e. 27.62 and 31.44% net efficiency for the subcritical and
supercritical pulverized coal-fired power plants integrated with the CO2 capture units,
respectively). As the net efficiency had already been improved, other parameters (i.e.
capital cost) becomes more sensitive to the cost o f electricity.
123
Reproduced with permission of the copyright owner. Further reproduction prohibited without permission.

Table 6.3 Ranges of economic inputs for analysis of electricity cost.
Parameter Distribution Reference
Economic life 35.0 years Fixed Griffiths and Man-Laing (2002)
Construction period 4.0 years Fixed Drbal et al. (1996)
Annual escalation rate 7.0 Fixed Drbal et al. (1996)
Present worth discount rate 11.5 % Fixed Drbal et al. (1996)
Capacity factor 85.0 Fixed U.S.DOE (1999)
Allowance for funds used during construction (AFUDC)
25.0 % Triangular distribution Drbal et al. (1996)
Total plant cost 1129a $/kW Triangular distribution U.S.DOE (1999) (no MEA-based CO2 capture) 1173bTotal plant cost + MEA-based 2090a $/kW Triangular distribution David and Herzog CO2 capture 2134" (2000) MEA consumption 1.5 kg MEA Triangular distribution Hendriks (1994)
tonne CO,
MEA reagent cost 1250 $/tonne MEA Triangular distribution Rao and Rubin (2002)
Operating & maintenance 10662a $/kWh Triangular distribution U.S.DOE (1999) (O&M) cost (no consumable cost and fuel cost)
11064"
Consumable operating cost 5152 $/kWh Triangular distribution U.S.DOE (1999)
Other capital investment cost 41.0a $/kWh Triangular distribution U.S.DOE (1999) 42.5"
Fuel cost 33719c $/kWh Triangular distribution U.S.DOE (1999)
a The given value is used for the subcritical pulverized coal-fired power plant. b The given value is used for the supercritical pulverized coal-fired power plant.
The given value is based on the 400 MW-based power plant with 38.97 kg coal/s and 9577 kJ/kWh. The supplied coal is Illinois#6 bituminous coal (U.S.DOE, 1999)
124
Reproduced with permission of the copyright owner. Further reproduction prohibited without permission.
Table 6.3 Ranges of economic inputs for analysis of electricity cost.
Parameter Distribution ReferenceEconomic life 35.0 years Fixed Griffiths and Marr-
Laing (2002)Construction period 4.0 years Fixed Drbal et al. (1996)Annual escalation rate 7.0 % Fixed Drbal etal. (1996)Present worth discount rate 11.5 % Fixed Drbal et al. (1996)Capacity factor 85.0 % Fixed U.S.DOE (1999)Allowance for funds used during construction (AFUDC)
25.0 % Triangular distribution Drbal et al. (1996)
Total plant cost(no MEA-based CO2 capture)
1129“1173b
$/kW Triangular distribution U.S.DOE (1999)
Total plant cost + MEA-based C02 capture
2090“2134b
$/kW Triangular distribution David and Herzog (2000)
MEA consumption 1.5 kg MEA tonne C02
Triangular distribution Hendriks (1994)
MEA reagent cost 1250 $/tonne MEA Triangular distribution Rao and Rubin (2002)
Operating & maintenance (O&M) cost (no consumable cost and fuel cost)
10662“11064b
$/kWh Triangular distribution U.S.DOE (1999)
Consumable operating cost 5152 $/kWh Triangular distribution U.S.DOE (1999)Other capital investment cost 41.0“
42.5b$/kWh Triangular distribution U.S.DOE (1999)
Fuel cost 33719° $/kWh Triangular distribution U.S.DOE (1999)“ The given value is used for the subcritical pulverized coal-fired power plant. b The given value is used for the supercritical pulverized coal-fired power plant.c The given value is based on the 400 MW-based power plant with 38.97 kg coal/s and 9577 kJ/kWh. The
supplied coal is Illinois#6 bituminous coal (U.S.DOE, 1999)
124
Reproduced with permission of the copyright owner. Further reproduction prohibited without permission.

1.00
0.50
0.00
■ Supercritical coal-fired power plant
❑ Subcritical coal-fired power plant
a b c d e f g
a : Energy consumed by CO2 capture
b : Capital requirement (no CO2 capture cost) c : Net efficiency
d : Capital requirement for CO2 capture e : Fuel cost
h i j
f : Allowance for funds used during construction g : Operating and maintenance cost h : Consumable operating cost
i : Other capital investment cost j : MEA reagent cost
Figure 6.4 Results of sensitivity analysis for cost of electricity.
125
Reproduced with permission of the copyright owner. Further reproduction prohibited without permission.
1.00
a>
0.50
■ Supercritical coal-fired power plant □ Subcritical coal-fired power plant
0.00
a : Energy consumed by CO2 capture b : Capital requirement (no CO2 capture cost) c : Net efficiencyd : Capital requirement for CO2 capture e : Fuel cost
e f g h 1 j
f : Allowance for funds used during construction g : Operating and maintenance cost h : Consumable operating cost i : Other capital investment cost j : MEA reagent cost
Figure 6.4 Results o f sensitivity analysis for cost o f electricity.
125
Reproduced with permission of the copyright owner. Further reproduction prohibited without permission.

Chapter Seven
Conclusions and Future Work
7.1 Conclusions
This study is focused on a variety of the process designs and operations, the
developed power plant model, the optimal operation and the economic features in the
subcritical and supercritical pulverize coal-fired power plants for both with and without
the MEA-based CO2 absorption unit. This report is anticipated to give substantial
contributions to engineers and power industries working in project development, financial
analysis and environmental planning. Followings are the conclusions of this research.
• The major operating and design parameters affecting the net efficiency of the
pulverized coal-fired power plants are the moisture content in coal, the pressure
operations at the high-pressure, intermediate-pressure and low-pressure turbines,
the boiler efficiency, the preheated air temperature, the temperature of main steam
and the temperature of reheated steam.
• The supercritical pulverized coal-fired power plant offers a higher net efficiency
than the subcritical pulverized coal-fired power plant by a factor of 2.0 to 3.9
percent point depending upon the degree of the CO2 capture. Furthermore, the
supercritical pulverized coal-fired power plant generates a lower CO2 emission,
compared to the subcritical pulverized coal-fired plant. About 5.2 to 5.5 percent
reduction can be obtained.
126
Reproduced with permission of the copyright owner. Further reproduction prohibited without permission.
Chapter Seven
Conclusions and Future Work
7.1 Conclusions
This study is focused on a variety o f the process designs and operations, the
developed power plant model, the optimal operation and the economic features in the
subcritical and supercritical pulverize coal-fired power plants for both with and without
the MEA-based CO2 absorption unit. This report is anticipated to give substantial
contributions to engineers and power industries working in project development, financial
analysis and environmental planning. Followings are the conclusions o f this research.
• The major operating and design parameters affecting the net efficiency o f the
pulverized coal-fired power plants are the moisture content in coal, the pressure
operations at the high-pressure, intermediate-pressure and low-pressure turbines,
the boiler efficiency, the preheated air temperature, the temperature o f main steam
and the temperature of reheated steam.
• The supercritical pulverized coal-fired power plant offers a higher net efficiency
than the subcritical pulverized coal-fired power plant by a factor o f 2.0 to 3.9
percent point depending upon the degree o f the CO2 capture. Furthermore, the
supercritical pulverized coal-fired power plant generates a lower CO2 emission,
compared to the subcritical pulverized coal-fired plant. About 5.2 to 5.5 percent
reduction can be obtained.
126
Reproduced with permission of the copyright owner. Further reproduction prohibited without permission.

• The key to arriving at the optimal operation of the subcritical pulverized coal-
fired power plant is to operate pressure at 19.0 MPa HP inlet pressure with 5.1 HP
pressure ratio between the inlet and the outlet, at 3.4 MPa IP inlet pressure with
3.8 IP pressure ratio between the inlet and the 3rd stage outlet and at 0.9 MPa LP
inlet pressure with the 150.0 LP pressure ratio between the inlet and the
backpressure outlet as well as the temperature of main steam and reheated steam
at 545°C, the temperature of preheated air at 350°C, the boiler and turbine
efficiencies above 92%, and the lowest possible moisture content in coal. The
optimal operation of the supercritical pulverized coal-fired power plant can be
achieved by operating pressure at 25.3 MPa HP inlet pressure with the 4.6 HP
pressure ratio between the inlet and the 1St stage outlet, at 3.29 MPa IP inlet
pressure with the 3.7 IP pressure ratio between the inlet and the 3rd stage outlet
and at 0.9 MPa LP inlet pressure with the 180.0 LP pressure ratio between the
inlet and the backpressure outlet as well as the temperature of main steam and
reheated steam at 600°C.
• The integration of the MEA-based CO2 absorption unit into both subcritical and
supercritical pulverized coal-fired power plants causes a significant reduction in
the net efficiency up to 14.9 percent point (based on 97% CO2 removal
performance).
• The high percent CO2 removal performance relatively causes a high net efficiency
point drop but is not proportional to the net efficiency point drop per %CO2
removal efficiency. It was found that 97% CO2 removal efficiency gave the
highest net efficiency point drop while 72% CO2 removal performance offered the
127
Reproduced with permission of the copyright owner. Further reproduction prohibited without permission.
• The key to arriving at the optimal operation o f the subcritical pulverized coal-
fired power plant is to operate pressure at 19.0 MPa HP inlet pressure with 5.1 HP
pressure ratio between the inlet and the outlet, at 3.4 MPa IP inlet pressure with
3.8 IP pressure ratio between the inlet and the 3rd stage outlet and at 0.9 MPa LP
inlet pressure with the 150.0 LP pressure ratio between the inlet and the
backpressure outlet as well as the temperature o f main steam and reheated steam
at 545°C, the temperature o f preheated air at 350°C, the boiler and turbine
efficiencies above 92%, and the lowest possible moisture content in coal. The
optimal operation o f the supercritical pulverized coal-fired power plant can be
achieved by operating pressure at 25.3 MPa HP inlet pressure with the 4.6 HP
pressure ratio between the inlet and the 1st stage outlet, at 3.29 MPa IP inlet
pressure with the 3.7 IP pressure ratio between the inlet and the 3rd stage outlet
and at 0.9 MPa LP inlet pressure with the 180.0 LP pressure ratio between the
inlet and the backpressure outlet as well as the temperature o f main steam and
reheated steam at 600°C.
• The integration o f the MEA-based CO2 absorption unit into both subcritical and
supercritical pulverized coal-fired power plants causes a significant reduction in
the net efficiency up to 14.9 percent point (based on 97% CO2 removal
performance).
• The high percent CO2 removal performance relatively causes a high net efficiency
point drop but is not proportional to the net efficiency point drop per %CC>2
removal efficiency. It was found that 97% CO2 removal efficiency gave the
highest net efficiency point drop while 72% CO2 removal performance offered the
127
Reproduced with permission of the copyright owner. Further reproduction prohibited without permission.

optimal CO2 removal efficiency with the lowest net efficiency point drop per
%CO2 removal efficiency.
• The cost of electricity for the subcritical and supercritical pulverized coal-fired
power plants (with and without the CO2 capture unit) is nearly closed to each
other. However, the cumulative present worth of annual cost reveals that, after
about a quarter of plant lifetime, the supercritical pulverized coal-fired power
plant offers a lower cumulative cost.
• From the sensitivity analysis, the cost of electricity depends on the capital
requirement of the power plant, the energy consumption owing to the CO2 capture
unit, the capital requirement of the CO2 capture unit, the net efficiency, the fuel
cost, the allowance for funds used during construction, the operating and
maintenance cost, the consumable operating cost, other capital investment costs
and the MEA reagent cost as sequence.
7.2 Future Work
• The ultra-supercritical pulverized coal-fired power plant which is the most
advanced steam-power cycle, and other types of power plants such as PFB, CFB
and IGCC should be investigated.
• Other CO2 capture technologies besides the MEA-based CO2 absorption unit
should be evaluated.
• The algorithm code written in Microsoft Excel" should be rewritten in a
graphical-based computer program so that it is more users friendly.
128
Reproduced with permission of the copyright owner. Further reproduction prohibited without permission.
optimal CO2 removal efficiency with the lowest net efficiency point drop per
% C 02 removal efficiency.
• The cost o f electricity for the subcritical and supercritical pulverized coal-fired
power plants (with and without the C 0 2 capture unit) is nearly closed to each
other. However, the cumulative present worth o f annual cost reveals that, after
about a quarter o f plant lifetime, the supercritical pulverized coal-fired power
plant offers a lower cumulative cost.
• From the sensitivity analysis, the cost o f electricity depends on the capital
requirement o f the power plant, the energy consumption owing to the C 0 2 capture
unit, the capital requirement o f the C 0 2 capture unit, the net efficiency, the fuel
cost, the allowance for funds used during construction, the operating and
maintenance cost, the consumable operating cost, other capital investment costs
and the MEA reagent cost as sequence.
7.2 Future W ork
• The ultra-supercritical pulverized coal-fired power plant which is the most
advanced steam-power cycle, and other types o f power plants such as PFB, CFB
and IGCC should be investigated.
• Other CO2 capture technologies besides the MEA-based C 0 2 absorption unit
should be evaluated.
• The algorithm code written in Microsoft Excel® should be rewritten in a
graphical-based computer program so that it is more users friendly.
128
Reproduced with permission of the copyright owner. Further reproduction prohibited without permission.

List of References
Alie, C. (2004). CO2 Capture with MEA: Integrating the Absorption Process and Steam Cycle of an Existing Coal-Fired Power Plant : M.A.Sc. Thesis, University of Waterloo, Waterloo, Ontario, Canada.
Aroonwilas, A. and Veawab, A. (2007). Integration of CO2 Capture Unit Using Single-and Blend-Amines into Supercritical Coal-Fired Power Plants: Implications for Emission and Energy Management. International Journal of Greenhouse Gas Control. 1(2), 143-150.
Beer, J.M. (2000). Combustion Technology Developments in Power Generation in Response to Environmental Challenges. Progress in Energy and Combustion Science. 26(4), 301-327.
Bohm, M.C. (2006). Capture-Ready Power Plants — Options, Technologies and Economics: MSc. (TPP) Thesis, Massachusetts Institute of Technology, Cambridge, Massachusetts.
Canadian Electricity Association (CEA). (2006). Power Generation in Canada: A Guide.
Chattopadhyay, P. (2000). Boiler Operation Engineering-Questions and Answers : 2nd
Edition, McGraw-Hill, New York.
Cicconardi, S.P.; Gaggio, G.; Lensi, R. and Spazzafumo, G. (1991). Sensitivity Analysis of a PFB-CC Power System. Proceeding of the Intersociety Energy Conversion Engineering Conference. 26(5), 487-492.
Crystal Ball. (2004). Crystal Ball 7: User Manual. Decisioneering Inc., MAN-CBUM 070001-1.
David, J. and Herzog, H. (2000). The Cost of Carbon Capture. The 5th International Conference on Greenhouse Gas Control Technologies, August 13-16, Cairns, Australia.
de Nevers, N. (2000). Air Pollution Control Engineering : 2nd Edition, McGraw-Hill Higher Education, New York.
Desideri, U. and Paolucci, A. (1999). Performance Modeling of a Carbon Dioxide Removal System for Power Plants. Energy Conversion and Management. 40(18), 1899-1917.
129
Reproduced with permission of the copyright owner. Further reproduction prohibited without permission.
List of References
Alie, C. (2004). CO2 Capture with MEA: Integrating the Absorption Process and Steam Cycle o f an Existing Coal-Fired Power Plant : M.A.Sc. Thesis, University o f Waterloo, Waterloo, Ontario, Canada.
Aroonwilas, A. and Veawab, A. (2007). Integration of CO2 Capture Unit Using Single- and Blend-Amines into Supercritical Coal-Fired Power Plants: Implications for Emission and Energy Management. International Journal o f Greenhouse Gas Control. 1(2), 143-150.
Beer, J.M. (2000). Combustion Technology Developments in Power Generation in Response to Environmental Challenges. Progress in Energy and Combustion Science. 26(4), 301-327.
Bohm, M.C. (2006). Capture-Ready Power Plants - Options, Technologies and Economics: M.Sc. (TPP) Thesis, Massachusetts Institute o f Technology, Cambridge, Massachusetts.
Canadian Electricity Association (CEA). (2006). Power Generation in Canada: A Guide.
Chattopadhyay, P. (2000). Boiler Operation Engineering-Questions and Answers : 2nd Edition, McGraw-Hill, New York.
Cicconardi, S.P.; Gaggio, G.; Lensi, R. and Spazzafiimo, G. (1991). Sensitivity Analysis o f a PFB-CC Power System. Proceeding o f the Intersociety Energy Conversion Engineering Conference. 26(5), 487-492.
Crystal Ball. (2004). Crystal Ball 7: User Manual. Decisioneering Inc., MAN-CBUM 070001-1.
David, J. and Herzog, H. (2000). The Cost o f Carbon Capture. The 5th International Conference on Greenhouse Gas Control Technologies, August 13-16, Cairns, Australia.
de Nevers, N. (2000). Air Pollution Control Engineering : 2nd Edition, McGraw-Hill Higher Education, New York.
Desideri, U. and Paolucci, A. (1999). Performance Modeling o f a Carbon Dioxide Removal System for Power Plants. Energy Conversion and Management. 40(18), 1899-1917.
129
Reproduced with permission of the copyright owner. Further reproduction prohibited without permission.

Drbal, L.F.; Boston, P.G.; Westra, K.L. and Erickson, R.B. (1996). Power Plant Engineering: l g Edition, Black & Veatch, Springer, New York.
Energy Information Administration (ETA). (2005). International Energy Outlook 2005.
Fisher, K.S.; Beitler, C.; Rueter, C.; Searcy, K.; Rochelle, G. and Jassim, M. (2005). Integrating MEA Regeneration with CO2 Compression and Peaking to Reduce CO2 Capture Costs. U.S. Department of Energy, Washington, DC.
Geers, J.M. and O'Brien, C.M. (2002). Basis and Rationale for Potential Subcategorization of Coal-Fired Electric Utility Steam Generating Units. U.S. Environmental Protection Agency, Washington, DC.
Griffiths, M. and Marr-Laing, T. (2002). Thermal Power Generation Emissions National Guidelines for New Stationary Sources and Discussion Document — December 2001. Pembina Institute, Alberta, Canada.
Gwosdz, A.; Leisse, A. and Quenders, H.J. (2005). Pulverised Coal Firing System for the Operation of Steam Generators with Low Excessive Air. VGB Powertech. 85(11), 67-73.
Hendriks, C. (1994). Carbon Dioxide Removal from Coal-Fired Power Plants : 1stEdition, Kluwer Academic Publishers, Dordrecht/Boston/London.
Hobbs, J.C. and Heller, L.W. (1923). Pulverized Fuel for Large Boilers. Proceeding of Engineers ' Society of Western Pennsyvania, 39, 217-266.
International Energy Agency (IEA). (2006a). Key World Energy Statistics 2006, Paris, France.
International Energy Agency (IEA). (2006b). Focus on Clean Coal, Paris, France.
Kakaras, E.; Ahladas, P. and Syrmopoulos, S. (2002). Computer Simulation Studies for the Integration of an External Dryer into a Greek Lignite-Fired Power Plant. Fuel. 81(5), 583-593.
Kiga, T.; Yoshikawa, K.; Sakai, M. and Mochida, S. (2000). Characteristics of Pulverized Coal Combustion in High-Temperature Preheated Air. Journal of Propulsion and Power. 16(4), 601-605.
Kitto, J.B. (1996). Developments in Pulverized Coal-Fired Boiler Technology, Babcock & Wilcox.
Kjaer, S. (2002). The Advanced Supercritical 700°C Pulverized Coal-Fired Power Plant. VGB Power Tech. 7, 47-49.
130
Reproduced with permission of the copyright owner. Further reproduction prohibited without permission.
Drbal, L.F.; Boston, P.G.; Westra, K.L. and Erickson, R.B. (1996). Power Plant Engineering: 1st Edition, Black & Veatch, Springer, New York.
Energy Information Administration (EIA). (2005). International Energy Outlook 2005.
Fisher, K.S.; Beitler, C.; Rueter, C.; Searcy, K.; Rochelle, G. and Jassim, M. (2005). Integrating MEA Regeneration with CO2 Compression and Peaking to Reduce CO2
Capture Costs. U.S. Department o f Energy, Washington, DC.
Geers, J.M. and O'Brien, C.M. (2002). Basis and Rationale fo r Potential Subcategorization o f Coal-Fired Electric Utility Steam Generating Units. U.S. Environmental Protection Agency, Washington, DC.
Griffiths, M. and Marr-Laing, T. (2002). Thermal Power Generation Emissions National Guidelines fo r New Stationary Sources and Discussion Document - December 2001. Pembina Institute, Alberta, Canada.
Gwosdz, A.; Leisse, A. and Quenders, H.J. (2005). Pulverised Coal Firing System for the Operation of Steam Generators with Low Excessive Air. VGB Powertech. 85(11), 67-73.
Hendriks, C. (1994). Carbon Dioxide Removal from Coal-Fired Power Plants : 1st Edition, Kluwer Academic Publishers, Dordrecht/Boston/London.
Hobbs, J.C. and Heller, L.W. (1923). Pulverized Fuel for Large Boilers. Proceeding o f Engineers ’ Society o f Western Pennsyvania, 39, 217-266.
International Energy Agency (IEA). (2006a). Key World Energy Statistics 2006, Paris, France.
International Energy Agency (IEA). (2006b). Focus on Clean Coal, Paris, France.
Kakaras, E.; Ahladas, P. and Syrmopoulos, S. (2002). Computer Simulation Studies for the Integration o f an External Dryer into a Greek Lignite-Fired Power Plant. Fuel. 81(5), 583-593.
Kiga, T.; Yoshikawa, K.; Sakai, M. and Mochida, S. (2000). Characteristics o f Pulverized Coal Combustion in High-Temperature Preheated Air. Journal o f Propulsion and Power. 16(4), 601-605.
Kitto, J.B. (1996). Developments in Pulverized Coal-Fired Boiler Technology, Babcock & Wilcox.
Kjaer, S. (2002). The Advanced Supercritical 700°C Pulverized Coal-Fired Power Plant. VGB Power Tech. 7, 47-49.
130
Reproduced with permission of the copyright owner. Further reproduction prohibited without permission.

Kohl, A.L. and Nielsen, R.B. (1997). Gas Purification : 5th Edition, Gulf Publishing Company, Houston, Texas.
Kraemer, T.G.; Nelson, G., Card, R.; Draper, E.L. and Mudd, M.J. (2004). Opportunities to Expedite the Construction of New Coal-Based Power Plant, National Coal Council (NCC).
Lako P. (2004). Coal-Fired Power Technologies: Coal-Fired Power Options on the Brink of Climate Policies (ECN-C-04-076), ECN Policy Studies, Netherlands.
Leung, P. and Moore, E.R. (1966). Analysis of Cycle with First-Stage High Pressure Extraction Steam for Auxiliary Turbine Drives. Bechtel Corporation. Combustion. 38(6), 18-26.
Marion, J.L.; Liljedahl, G.N. and Black, S. (2004). A Review of the State-of-the-Art and a View of the Future for Combustion-Based Coal Power Generation. The 29thInternational Technical Conference on Coal Utilization & Fuel Science, April 18-22, Clearwater, Florida.
Martin, W.A. (1971). Sorting. Computing Surveys. 3(4), 147-174.
Metz, B.; Davidson, 0.; de Coninck, H.; Loos, M. and Meyer, L. (2005). IPCC Special Report on Carbon Dioxide Capture and Storage, Intergovernmental Panel on Climate Change, Cambridge University Press.
Miliaras, E.S. and Broer, W.T.F. (1991). Direct Coal-Fired Steam Electricity Plants with High Efficiency and Reduced CO2 Emissions. Proceedings of the American Power Conference. 53(1), 359-364.
Neitzert, F.; Olsen, K.; Collas, P. (1999). Canada 's Greenhouse Gas Inventory: 1997 Emissions and Removals with Trends. Environment Canada.
New Energy and Industrial Technology Development Organization (NEDO) and Center for Coal Utilization Japan (CCUJ). (2004). Clean Coal Technology in Japan.
Niessen, W.R. (1977). Combustion and Incineration Processes: Applications in Environmental Engineering, Marcel Dekker, Inc., New York.
Nsakala, N.Y.; Marion, J.; Bozzuto, C.; Liljedahl, G. and Palkes, M. (2001). Engineering Feasibility of CO2 Capture on an Existing US Coal-Fired Power Plant. The faNational Conference on Carbon Sequestration, May 15-17, Washington, DC.
Perry, R.H., Green, D.W. and Maloney, J.O. (1997). Perry 's Chemical Engineers' Handbook : 7th Edition, McGraw-Hill, New York.
131
Reproduced with permission of the copyright owner. Further reproduction prohibited without permission.
Kohl, A.L. and Nielsen, R.B. (1997). Gas Purification : 5th Edition, Gulf Publishing Company, Houston, Texas.
Kraemer, T.G.; Nelson, G., Card, R.; Draper, E.L. and Mudd, M.J. (2004). Opportunities to Expedite the Construction o f New Coal-Based Power Plant, National Coal Council (NCC).
Lako P. (2004). Coal-Fired Power Technologies: Coal-Fired Power Options on the Brink o f Climate Policies (ECN-C-04-076), ECN Policy Studies, Netherlands.
Leung, P. and Moore, E.R. (1966). Analysis o f Cycle with First-Stage High Pressure Extraction Steam for Auxiliary Turbine Drives. Bechtel Corporation. Combustion. 38(6), 18-26.
Marion, J.L.; Liljedahl, G.N. and Black, S. (2004). A Review o f the State-of-the-Art and a View o f the Future fo r Combustion-Based Coal Power Generation. The 29th International Technical Conference on Coal Utilization & Fuel Science, April 18-22, Clearwater, Florida.
Martin, W.A. (1971). Sorting. Computing Surveys. 3(4), 147-174.
Metz, B.; Davidson, O.; de Coninck, H.; Loos, M. and Meyer, L. (2005/ IPCC Special Report on Carbon Dioxide Capture and Storage, Intergovernmental Panel on Climate Change, Cambridge University Press.
Miliaras, E.S. and Broer, W.T.F. (1991). Direct Coal-Fired Steam Electricity Plants with High Efficiency and Reduced CO2 Emissions. Proceedings o f the American Power Conference. 53(1), 359-364.
Neitzert, F.; Olsen, K.; Collas, P. (1999). Canada’s Greenhouse Gas Inventory: 1997 Emissions and Removals with Trends. Environment Canada.
New Energy and Industrial Technology Development Organization (NEDO) and Center for Coal Utilization Japan (CCUJ). (2004). Clean Coal Technology in Japan.
Niessen, W.R. (1977). Combustion and Incineration Processes: Applications in Environmental Engineering, Marcel Dekker, Inc., New York.
Nsakala, N.Y.; Marion, J.; Bozzuto, C.; Liljedahl, G. and Palkes, M. (2001). Engineering Feasibility o f CO2 Capture on an Existing US Coal-Fired Power Plant. The 1st National Conference on Carbon Sequestration, May 15-17, Washington, DC.
Perry, R.H., Green, D.W. and Maloney, J.O. (1997). Perry’s Chemical Engineers’ H andbook: 7th Edition, McGraw-Hill, New York.
131
Reproduced with permission of the copyright owner. Further reproduction prohibited without permission.

Petermann, A. and Fett, N.F. (1997). A Mathematical Model for a Combined Cycle Power Plant Process-interactions between the Pressurized Circulating Fluidized Bed Combustor, the Water-steam Cycle and the Gas Turbine. Proceedings of the 14th
International Conference on Fluidized Bed Combustion. 2, 723-731.
Rao, A.B. and Rubin, E.S. (2002). A Technical, Economic, and Environmental Assessment of Amine-Based CO2 Capture Technology for Power Plant Greenhouse Gas Control. Environmental Science & Technology. 36(20), 4467-4475.
Regan, J.W.; Borio, R.W.; Palkes, M.; Davidson, M.J.; Wesnor, J.D. and Bender, D.J. (1996). Major Improvements in Pulverized Coal Plant Design. Proceedings of the 21th International Technical Conference on Coal Utilization & Fuel Systems. 21, 389-399.
Sakwattanapong, R. (2005). Evaluation and Characterization of Reboiler Heat-Duty for CO2 Absorption Process Using Single- and Blended- Alkanolamines : MA.Sc. Thesis, University of Regina, Regina, Saskatchewan, Canada.
Sanders, W.P. (2004). Turbine Steam Path Vol. 3a-Mechanical Design and Manufacture, PennWell, Tulsa, Oklahoma.
Schilling, H.D. (1993). Prospects for Power Plant Technology. VGB Kraftwerkstechnik. 73(8), 564-576.
Singer, J.G. (1991). Combustion Fossil Power: a Reference Book on Fuel Burning and Steam Generation : 4th Edition, Combustion Engineering Power Systems Group, Windsor, Connecticut.
Smith, I. and Rousaki, K. (2002). Prospects for Co-Utilisation of Coal with Other Fuels — GHG Emissions Reduction, IEA Coal Research, London, United Kingdom.
Smith, J.M., Van Ness, H.C. and Abbott, M.M. (1996). Introduction to Chemical Engineering Thermodynamics : 5th Edition, McGraw-Hill, New York.
Termuehlen, H. and Emsperger, W. (2003). Clean and Efficient Coal-Fired Power Plants: Development toward Advanced Technologies, ASME Press, New York.
Toshiyuki, S.; Makoto, T.; Tetsuya, H.; Motoki, Y. and Junichi, S. (2002). A Study of Combustion Behavior of Pulverized Coal in High-Temperature Air. Proceedings of the Combustion Institute. 29(1), 503-509.
132
Reproduced with permission of the copyright owner. Further reproduction prohibited without permission.
Petermann, A. and Fett, N.F. (1997). A Mathematical Model for a Combined Cycle Power Plant Process-interactions between the Pressurized Circulating Fluidized Bed Combustor, the Water-steam Cycle and the Gas Turbine. Proceedings o f the 14th International Conference on Fluidized Bed Combustion. 2, 723-731.
Rao, A.B. and Rubin, E.S. (2002). A Technical, Economic, and Environmental Assessment o f Amine-Based CO2 Capture Technology for Power Plant Greenhouse Gas Control. Environmental Science & Technology. 36(20), 4467-4475.
Regan, J.W.; Borio, R.W.; Palkes, M.; Davidson, M.J.; Wesnor, J.D. and Bender, D.J. (1996). Major Improvements in Pulverized Coal Plant Design. Proceedings o f the 21th International Technical Conference on Coal Utilization & Fuel Systems. 21, 389-399.
Sakwattanapong, R. (2005). Evaluation and Characterization o f Reboiler Heat-Duty fo r CO2 Absorption Process Using Single- and Blended- Alkanolamines : M.A.Sc. Thesis, University o f Regina, Regina, Saskatchewan, Canada.
Sanders, W.P. (2004). Turbine Steam Path Vol. 3a-Mechanical Design and Manufacture, PennWell, Tulsa, Oklahoma.
Schilling, H.D. (1993). Prospects for Power Plant Technology. VGB Kraftwerkstechnik. 73(8), 564-576.
Singer, J.G. (1991). Combustion Fossil Power: a Reference Book on Fuel Burning and Steam Generation : 4th Edition, Combustion Engineering Power Systems Group, Windsor, Connecticut.
Smith, I. and Rousaki, K. (2002). Prospects fo r Co-Utilisation o f Coal with Other Fuels - GHG Emissions Reduction, IEA Coal Research, London, United Kingdom.
Smith, J.M., Van Ness, H.C. and Abbott, M.M. (1996). Introduction to Chemical Engineering Thermodynamics : 5th Edition, McGraw-Hill, New York.
Termuehlen, H. and Emsperger, W. (2003). Clean and Efficient Coal-Fired Power Plants: Development toward Advanced Technologies, ASME Press, New York.
Toshiyuki, S.; Makoto, T.; Tetsuya, H.; Motoki, Y. and Junichi, S. (2002). A Study o f Combustion Behavior o f Pulverized Coal in High-Temperature Air. Proceedings o f the Combustion Institute. 29(1), 503-509.
132
Reproduced with permission of the copyright owner. Further reproduction prohibited without permission.

U.S. Department of Energy (U.S.DOE). (1999). Market-Based Advanced Coal Power Systems. Washington, DC.
Woodruff, E.B.; Lammers, H.B. and Lammers, T.F. (2005). Steam Plant Operation: 8th
Edition, McGraw-Hill, New York.
133
Reproduced with permission of the copyright owner. Further reproduction prohibited without permission.
U.S. Department o f Energy (U.S.DOE). (1999). Market-Based Advanced Coal Power Systems. Washington, DC.
Woodruff, E.B.; Lammers, H.B. and Lammers, T.F. (2005). Steam Plant Operation: 8th Edition, McGraw-Hill, New York.
133
Reproduced with permission of the copyright owner. Further reproduction prohibited without permission.

Appendix
Appendix A
Yes
START
Initial values [Tii] = [O]nrai
'Diane =1500°C
Tflame
ph ,C p jdT 25. c
Yes
Tome = max[Tii]
Graphical plots
END
Guess initial boundary condition for [Ti,j]
(except [Ti,j] at preheated air temperature nodes)
PDE for Laplace equation
Transform to algebraic difference approximation
Gauss-Seidel Method
Figure A.1 Algorithm to compute the temperature profile in furnace/boiler.
134
Reproduced with permission of the copyright owner. Further reproduction prohibited without permission.
Appendix
Appendix A
Initial values
[Tij] = [0]imn
Tflame = 1500°C
N oy 1, t ~ Qfurmce
I Yes
N oYes
YesN o
END
START
Report outputs [Tij]
G auss-Seidel M ethod
Transform to algebraic difference approximation
Graphical p lots
PDE for Laplace equationi= l
G uess initial boundary condition for [Tij]
( e x c e p t [T ij] a t p r e h e a te d a i r te m p e r a tu r e n o d e s )
Figure A.1 Algorithm to compute the temperature profile in furnace/boiler.
134
Reproduced with permission of the copyright owner. Further reproduction prohibited without permission.

START initial values
= 0.001, co = 1.001
{xi = 0
Initial boundary condition [A]ovo= [aid, (B)oid=
0
adaz2
[C] =
au 1.1
0
a im /a1,1
a23/a32 a1,„,/a1,2
a..1/ax.m a„.,/a,„,„ 0
b,/a,.,
b2/a22
{d} =•
b„/a„.,,
Yes
(x)ow = (x)
i=0
i = i +1
"0= d(i) - [Ci, I to ml X x
0
x(i) - x0,,,(0 x(i)
x100 —
END
Figure A.2 Algorithm for Gauss-Seidel method.
135
Reproduced with permission of the copyright owner. Further reproduction prohibited without permission.
initial values a = 0.001, a »1.001{Xijnxl ~ 0
START
Initial boundary condition [A]nxm= [aij], {B}nxl={bij}
{d} =
b./a
b,/a
b./a,
[C] =
No
Yes
i = 0
Yes
No
i = i + l
x(i) = d(i) - [Ci, l to
x 100
END
Figure A.2 Algorithm for Gauss-Seidel method.
135
Reproduced with permission of the copyright owner. Further reproduction prohibited without permission.

I 1 2 2
NO(mol NO
) NO(kg NO . kg coal
) mol NO
maw( hr N0( kg NO
) kg coal
M.Wh PW(MW)
Note: Equilibrium constant (Kp) can be found in Niessen, 1977.
Figure A.3 Algorithm for NO calculation.
(Original in color)
136
Reproduced with permission of the copyright owner. Further reproduction prohibited without permission.
DetermineTflame f ro m fTj.jl
■1/2 ' l
P n o NO
mol NO kg coalkg NONO( )' NO(
kg coal mol NO
Note: Equilibrium constant (Kp) can be found in Niessen, 1977.
Figure A.3 Algorithm for NO calculation.
(Original in color)
136
Reproduced with permission of the copyright owner. Further reproduction prohibited without permission.

R2 = 0.99
P4
6000
0
0 2000 4000 6000
Enthalpy (kJ/kg) — Actual Steam Properties
Figure A.4 Parity plot of enthalpy between actual data and empirical correlation.
137
Reproduced with permission of the copyright owner. Further reproduction prohibited without permission.
R2 = 0.996000
g
I? 1 4000 ^ &■<e &>> un, —■3 g 5 'Sa '& 2000w a
u
0 2000 4000 6000
Enthalpy (kJ/kg) - Actual Steam Properties
Figure A.4 Parity plot o f enthalpy between actual data and empirical correlation.
137
Reproduced with permission of the copyright owner. Further reproduction prohibited without permission.

Table A.1 Emission factors for bituminous and subbituminous coal combustion without
control equipment.
Furnace type
Emission factor, lb/ton of coal burned
All particles a Prvaiti- io a
PC, wall-fired, dry bottom 10A 2.3A
PC, wall-fired, wet bottom 7A 2.6A
PC, tangential fired, dry bottom 10A 2.3A
Cyclone 2A 0.26A
Spread stoker 66 13.2
Hand-fired 15 6.2
a Capital letter A on all particulate and P1\410 values represents the percentage by weight of ash in the coal should be multiplied by the factor given.
(Source: de Nevers, 2000)
138
Reproduced with permission of the copyright owner. Further reproduction prohibited without permission.
Table A.1 Emission factors for bituminous and subbituminous coal combustion without
control equipment.
Furnace type
Emission factor, lb/ton of coal burned
All particles a PM10a
PC, wall-fired, dry bottom 10A 2.3A
PC, wall-fired, wet bottom 7A 2.6 A
PC, tangential fired, dry bottom 10A 2.3A
Cyclone 2A 0.26A
Spread stoker 66 13.2
Hand-fired 15 6.2
a Capital letter A on all particulate and PMio values represents the percentage by weight o f ash in the coal should be multiplied by the factor given.
(Source: de Nevers, 2000)
138
Reproduced with permission of the copyright owner. Further reproduction prohibited without permission.

Reproduced w
ith permission o
f the copyright owner.
Furth
er reproduction prohibited w
ithout perm
ission.
Table A.2 List of enthalpy and entropy correlations of streams.
Point Enthalpy Entropy
For subcritical PC shown in Figure 3.5
k = 0.80886p3-600.24144 p 4+1497 .74518 • p 3-1404.4 5177 .7),2 +752.02583 • P,
+ 163.25297 -log P, + 514.44909
112 = h,+v, , • (p-P1)
3 123=0.0000/ • T33-0.00303 -T32 +4.52429•T3-11.99660
4 114=0.0000/ • T43-0.00303 • 7:4 2 +4 .52429 -T4-11.99660
5 h5=0.00001 • T53-0.00303 - T52 +4 .52429 • T5-11.99660
6 126=0.00001- T63-0.00303. T62+4.52429 -T6-11.99660
7 h7=h6
8 128=1.12026- T83-13.88425 - T82+99.26822 - T8+271.21790 • log 7, + 676.05097
9 119- 118+V8(P9 138
10 1210 119
11 h„=0.00001•TH 3-0.00303- T1, 2 +4.52429 - T -11.99660
12 12.12=0.00001-T123-0.00303 • T,22 +4.52429 • T,2-11.99660
13 h13=-3. 14478 - 13,32 +96.89882 - p 3-0.00338 - T32 + 6.76784 -7;3 + 11.47682 s ,3=-0.035230- P13+0.00396 .7;3 ± 4.80006
14 h14 = 66.67716 • Pi4 ± 59607233 • s - 1095.82677 S14=1714 S13
15 h„ = 1114
16 11,6=0.00001 • T163-0.00275 • T162+4.42947 T16-4.81626
17 hi, = 1116
18 11180.00001 • T,83-0.00275 -T182+4.42947 • 7,8-4.81626
19 hig-h18
Reproduced
with perm
ission of the
copyright ow
ner. Further
reproduction prohibited
without
permission.
Table A.2 List o f enthalpy and entropy correlations o f streams.
Point Enthalpy Entropy
For subcritical PC shown in Figure 3.5
1h, = 0.80886P/-600.24144P/+1497.74518 ■ P 3-1404.45177■ P,2 + 752.02583 ■ P,
+ 163.25297-log P, +514.44909
2 h2 =h,+v, -(Pr Pj)
3 h, =0.00001 ■ T3 3-0.00303 - T 2 +4.52429 -T ,-l1.99660
4 h4=0.00001 ■ T43 -0.00303 - Tt 2+4.52429 -T4-l 1.99660
5 h5=0.00001 ■ T 3-0.00303 ■ T 2+4.52429 ■ T,-11.99660
6 h6=0.00001-T63 -0.00303 ■ T 2+4.52429-T,-11.99660
7 h?=h6
8 hs=l.12026■ T 3-13.88425■ Ts2+99.26822 ■ Ts+271.21790 ■ log Ta + 676.05097
9 h9 =hs+vs(P,J-P s)
10 hio~h9
11 hn=0.00001■Tn3-0.00303-TI 2+4.52429-Tn-11.99660
12 h,2=0.00001■ Tl23-0.00303 ■ Tl22+4.52429 ■ Tn-11.99660
13 hu=-3.14478■ PI32+96.89882 ■ P, ,-0.00338- T, 2 + 6.76784 ■ TI3 + 11.47682 s ,,=-0.035230-PI}+0.00396■ T„ +4.80006
14 hl4 = 66.67716■ PI4 + 596.07233■ sI4 -1095.82677 SJ4 Oh ' sn
15 hIS=hI4
16 h,,=0.00001 ■ T j -0.00275 ■ T„2+4,42947 ■ 7],,-4.81626
17 h/7 = hl6
18 hIS=0.00001 ■ T j -000275 ■ T, ,+4.42947 -Tls-4.81626
19 hi9~hIS

Reproduced w
ith permission o
f the copyright owner.
Further reproduction prohibited w
ithout permission.
Table A.2 List of enthalpy and entropy correlations of streams. (continued)
Point Enthalpy Entropy
For subcritical PC shown in Figure 3.5
20 h2 =-117.12271. P202+870.84593 • P20-0.00085 • T202+3.21142 .720 + 482.57351 520-1.18335 • log P20+3.42339- log T20- 1.42544
21 h21=-31.90952 • P2,2+279.46951- P21+113.42764 • 52,2-920.46874- s21 + 3620.89619 521=1121 S20
22 h22=-161.65890 • 1222+64103202 • P22+118.41893. s222-1078.84349 s22 + 4244.44719 S 22 17 22 5 20
23 h23=-166.98757• P232 +641.74374• P23+113.37429.5232-1041.85363- s23 +4254.70448 s 23= 17 23 • S20
24 h24=h23
25 h15=-1439.95286 • P2, 2+1853.85191- P25+37.37623- 52, 2+32.02752- x25 + 189.25439 325 1725 520
26 h26=397.07724 • P26 2+160138985- P26+11.04908 • s26 2+246.39584 • s26 + 73.70142 S 26= 7 7 26 520
27 h22=6813.82750 • P27+372.21059- s22-519.84303 S27=7727 's20
28 h„ =hi + x•hig
29 h790.0000/ • T293 - 0.00275 • T292+4.42947 • T29-4.81626
30 h30=h29
31 h310.00001.73,3 - 0.00275 -T3,2+4.42947 -T3,-4.81626
32 h32 = h3,
33 h33=0.00001 • T333 - 0.00275 -T332+4.42947 -T33-4.81626
34 h34 = h33
35 h350.00001 753 - 0.00275 -T352+4.42947 .T35-4.81626
36 h36
37 h37 = h9
Reproduced
with perm
ission of the
copyright ow
ner. Further
reproduction prohibited
without
permission.
Table A.2 List o f enthalpy and entropy correlations o f streams, (continued)
Point E nthalpy E ntropy
For subcritical PC shown in Figure 3.5
20 h20=-l 17.12271 ■ P2O2+870.84593 ■ P2o-0.00085 ■ T j +3.21142 ■ T10 + 482.57351 s20=-l .18335 ■ logP20+3.42339 - log T20-l.42544
21 h2,=-31.90952-P2l2+279.46951-P2I+113.42764-s2,2-920.46874-s2I +3620.89619 S2 ~ rl2l 'S20
22 h22= -l61.65890-P222+641.03202-P22+ l18.41893-s222-1078.84349-s22 +4244.44719 S22~V22 ’S20
23 h23= -l66.98757-P232+641.74374-P23+ l13.37429-s232-1041.85363-s23 + 4254.70448 2̂3 23 'S20
24 h24=h23
25 h2 =-1439.95286 ■ P25 2+1853.85191 ■ P25+3 7.3 7623 ■ s 25 2+32.02752 -s25 + 189.25439 S25~V25 'S20
26 h2 =397.07724 ■ P26 2+ l601.38985-P26+ l 1.04908 ■ s26 2+246.39584-s26 + 73.70142 S26~V26 'S20
27 h27=6813.82750 ■ P27+372.21059 ■ s2J-519.84303 2̂7 27 ‘ S20
28 h2S=hf +x-hfg
29 h29=0.00001- T j - 0.00275■ T j +4.42947-T29-4.81626
30 3̂0~̂ 2<>
31 h3f=0.00001 -7 2 - 0.00275-T3I2+4.42947-T3,-4.81626
32 h32 = h31
33 h33=0.00001 -TI3 - 0.00275■ T3/+4.42947-T3S-4.81626
34 •Vi1! ;
Ol I
35 h3S=0.00001 ■ T j - 0.00275-Ts 2+4.42947-Tls-4.81626
36 f̂i ll s* b;
37 K = K

Reproduced w
ith permission o
f the copyright owner.
Further reproduction prohibited w
ithout permission.
Table A.2 List of enthalpy and entropy correlations of streams. (continued)
Point Enthalpy Entropy
For supercritical PC shown in Figure 3.6
h, = 0.80886P15-600.24144P14+1497.74518 • P 13 -1 404.45 177 • P 12 ÷
+ 163.25297 log P, + 514.44909
752.02583 P,
2 h2 = h1-Fv2 • (P2-P1)
3 113=0.00001- T33 -0.00303. T32+4.52429 -T3-11.99660
4 h4=0.00001•T43 -0.00303 • T 42 +4.52429 -T4-11.99660
5 45=0.00001 •T83-0.00303 - T 52 +4.52429 -T5-11.99660
6 h6=0.00001 •T63 -0.00303 .T62+4.52429. T6-11.99660
h,=h6
8 h8=1.12026 -T83-13.88425 • T82+99.26822 -T8+271.21790. log 7'8 + 676.05097
9 h9-h8+v8(P9 P8)
10 h,o=h9
11 h,1=0.00001 .T13-0.00303 • T,2 +4.52429 T1-11.99660
12 k2=0.00001 • T123-0.00303. T1, 2+4 .52429 -T„-11.99660
13 h„=-576.43919 • log P,3+4238.42638 • log7;3-7480.10078 s„=-1.60628 • log P,3+5.00953 • log T13-5 32560
14 h14 = 66.67716. P,4 + 596.07233 • s14 - 1095.82677 S 14 = 1714 -S13
15 his = 66.67716 • 115 + 596.07233. s15 - 1095.82677 s 15=7 7 15 S 13
16 h,6=0.00001 -T,63-000275 • T162+4.42947- 1'i6-4.81626
17 h„ = h16
18 h„=0.00001 •T,83-0.00275 -T182+4.42947 • T8-4.81626
19 h„= h„
Reproduced
with perm
ission of the
copyright ow
ner. Further
reproduction prohibited
without
permission.
Table A.2 List o f enthalpy and entropy correlations o f streams, (continued)
Point Enthalpy Entropy
For supercritical PC shown in F igure 3 .6
1h, = 0.80886P*-600.24144P*+1497.74518-P*-1404.45177 • P 2 + 752.02583 - P,
+ 163.25297 logP, +514.44909
2 h2 = h,+v,-(P2-PI)
3 h3=0.00001-T2 -0.00303-T2 +4.52429 Tr l 1.99660
4 ht =0.00001 ■ Tf -000303 ■ T42+4.52429 ■ T4-11.99660
5 h,=0.00001 • r / -0.00303 - T 2+4.52429 ■ Ts-11.99660
6 h6=0.00001 ■ T / -0.00303- T / +4.52429 ■ T6- l 1.99660
7 h,=h6
8 h =1.12026 - T /-13.88425-T 2+99.26822 ■ Ts+271.21790 ■ log Ts + 676.05097
9 h,=hs+vs(P9-P s)
10 1̂0~̂ 9
11 h U=0.00001 Tn3-0.00303 -Tu2+4.52429 -Tn- l 1.99660
12 hu=0.00001 TJ-0.00303 Tn2+4.52429-TU-11.99660
13 hl3=-576,43919 ■ logPI3+4238.42638 ■ logTn-7480.10078 sI3=-l.60628 ■ log PI3+5.00953 ■ log TI3-5.32560
14 hI4 = 66.67716■ PI4 + 596.07233■ s,4 - 1095.82677 S14=Tll4 ' SB
15 h,s = 66.67716 Pl5+ 596.07233 su -1095.82677 SlS=TllS ' S!3
16 hl6=0.00001 -T j -0.00275 ■ T j +4.42947-T16-4.81626
17 h/7 = his
18 hl8=0.00001 ■ T,2-0.00275 ■ T„2+4.42947 ■ TIS-4.81626
19 hi9~hi8

Reproduced w
ith permission o
f the copyright owner.
Further reproduction prohibited w
ithout permission.
Table A.2 List of enthalpy and entropy correlations of streams. (continued)
Point Enthalpy Entropy
For supercritical PC shown in Figure 3.6
20 h„=-117.12271 • P202+870.84593 • P20-0.00085 • 72, 2+3.21142 • T20 +482.57351 s„=-1.18335 -log P„+3.42339 • logT20-1.42544
21 h„=-31.90952 • P212 +279.4695 1 • P21+113.42764 • s 232-920.46874 • s2, + 3620.89619 S21-7721 S20
22 h22=-161.65890 • P22 2 +64 1.03202 P22+1 18.4 1893 • s12 2-1078.84349 • s22 + 4244.44719 s 22= 7722' 520
23 h23=-166.98757 • P„ 2+64174374 • P23+11337429 • s „ 2 -1041.85363 • s23 + 4254.70448 s 23=1123' S20
24 h 14 = 4 23
25 h25=-1439.95286 • P252 +1853.85 191 • P„+37 3 7623 • 52, 2+32.02752 • s „ + 189.25439 S25= 7725 S20
26 h26-397.07724 • P262+160138985. P16+11.04908- s262+246.39584. s26 + 73.70142 S26= 7726 "S20
27 h27=6813.82750 • P27+372.21059.527-519.84303 527= 7127 ' S20
28 h,=hf +x•h f g
29 h29=0.00001 • 7;93 - 0.00275 • T292+4.42947 -T29-4.81626
30 11304123
31 h„=0.00001.7 - 0.00275 - T3,2+4.42947 • T31-4.81626
32 h32 h 31
33 1/330.00001- 7333 - 0.00275 - T332+4.42947 • T33-4.81626
34 h34 h 33
35 h3 =0.00001•13, 3 - 0.00275 • T3, 2+4.42947 • T„-4.81626
36 h36 - h 35
37 h„ = h,
38 h38=0.0000255 •T 383 -0.01373-T382 +6.94766-T382 -191.14775
39 1139-0.00001.7393 - 0.00275-T392+4.42947-T394.81626
Reproduced
with perm
ission of the
copyright ow
ner. Further
reproduction prohibited
without
permission.
Table A.2 List o f enthalpy and entropy correlations o f streams, (continued)
Point E nthalpy E ntropy
For supercritical PC shown in Figure 3.6
20 h20=-IJ 7.12271 ■ P j +870.84593 ■ P2O-0.00085 ■ T j +3.21142 ■ T20 + 482.57351 s20=-l.18335 ■ logP20+3.42339 ■ logT20-l.42544
21 h2I=-31.90952-P2 2+279.46951 ■ P2l+ l l3.42764■ s 2,2-920.46874-s2, + 3620.89619 S21~Tl2I ' S20
22 h22=-161.65890-P222+641.03202-P22+ l18.41893-s22 -1078.84349-s22 +4244.44719 S22~ 022 ' S20
23 h2 =-166.98157- P23 2+641.74374 ■ P2J +113.37429 ■ s232-1041.85363 ■ s23 + 4254.70448 S23~ 023 ' S20
24 h - h ,t
25 h2S=-1439.95286-P252+1853.85191 ■ P2S+37.37623-s2S2+32.02752 ■ s 2S +189.25439 S25=Tl25 ' S20
26 h2 =397.07724-P2f2+1601.38985-P26+ l1.04908-s262+246.39584-s26 + 73.70142 2̂6 9 26 ' S 20
27 h27=6813.82750-P27+372.21059-s27-519.84303 S27~ 027 ' S20
28 h2S =hf +x - hfg
29 h29=0.00001 - T j - 0.00275■ T29+4.42947-T29-4.81626
30 h3a-h 29
31 h3 =0.00001-Tj,3 - 0.00275-T3I2+4.42947-TSI-4.81626
32 h32 = h3i
33 h33=0.00001- T13 - 0.002 75-T33 +4.42947 ■ Tss-4.81626
34 h3t = 3̂3
35 h3 = 0 . 0 0 0 0 1 - - 0.00275-Tj+4.42947-T35-4.81626
36 h36 =h3S
37 h37 = h9
38 h3S=0.0000255 -T 3«3 -0.013 73 -T 3s2 +6.94766-T 332 -191.14775
39 h39=0.00001-T19 - 0.002 75 ■ T39+4.42947 ■ T39-4.81626