Estimation of neuronal firing rates with the three-state biological point process model

b i om a s s a n d b i o e n e r g y 3 4 ( 2 0 1 0 ) 1 1 6 5e1 1 7 4
Avai lab le a t www.sc iencedi rec t .com
ht tp : / /www.e lsev ier . com/ loca te /b iombioe
Full-scale co-firing trial tests of sawdust and bio-wastein pulverized coal-fired 230 t/h steam boiler
Jaroslaw Zuwala*, Marek Sciazko
Institute for Chemical Processing of Coal, Zamkowa St. 1, 41-803 Zabrze, Poland
a r t i c l e i n f o
Article history:
Received 25 January 2008
Received in revised form
13 February 2008
Accepted 11 March 2010
Available online 1 April 2010
Keywords:
Biomass
Co-firing
Slagging and fouling
* Corresponding author. Tel.: þ48 32 271 00 4E-mail address: [email protected]: http://www.ichpw.zabrze.pl
0961-9534/$ e see front matter ª 2010 Elsevdoi:10.1016/j.biombioe.2010.03.003
a b s t r a c t
Co-firing trial tests of sawdust and bio-waste coming from cereal production with hard coal
were carried out at Skawina Power Plant in Poland (1532 MW in fuel, currently belonging to
CEZ Group). Skawina Power Plant is a tangentially-fired pulverized coal unit with nine
boilers (4 boilers of 210 t/h and five boilers of 230 t/h live steam respectively) that produces
590 MW electricity and 618 MW of heat (district heating and process steam).
The paper presents an analysis of energy and ecological effects of sawdust and bio-waste
co-firing in the existing pulverized hard coal boiler. The mixture of coal and biomass was
blended in the coal yard, and fed into the boiler through the coal mills. During the tests,
combustion of mixtures composed of hard coal and sawdust (with mass share of 9.5%) and
hard coal e bio-waste (6.6% mass basis) were examined. The co-firing tests were
successful. Based on the analysis of the test results, the influence of biomass co-firing on
specific components of energy balance (e.g. stack losses and boiler thermal efficiency) was
discussed, in comparison to combustion of coal alone. The emission indices during coal
combustion were calculated and compared to the emission indices for biomass co-firing. It
was proved that co-firing of both biomass sorts leads to a decrease of CO and SO2 emis-
sions. Due to the possibility of considering the part of the energy generated during biomass
co-firing as renewable energy, the procedure for biomass based renewable energy share
determination is presented and illustrated with an example.
ª 2010 Elsevier Ltd. All rights reserved.
1. Introduction At present, the greatest interest is directed towards
The use of biomass for the production of renewable energy in
the power industry is a technology which in spite of its
increasing implementation until the present day still requires
extensive promotion to develop intensively. All new opera-
tional and research experience in this field, especially with
regard to the co-firing of biomass and hard coal in thermal
power generation and cogeneration plants, promote actions
being taken towards optimizing the process (thermal cycle)
and emission parameters.
1; fax: þ48 32 271 08 09.(J. Zuwala).
ier Ltd. All rights reserved
processes that allow the co-firing of biomass and coal in utility
boilers. This proved to be the fastest track towards the use of
biomass in large capacity power units, simultaneously
guaranteeing the high conversion efficiency of the chemical
energy contained in the combusted fuel.
The present paper presents the selected results of biomass
co-firing process and emission research done for pulverized
OP-230 type coal boiler operating in one of the Polish system
power plants. Boilers of this capacity, being a base of 200 MW
power units very common in Poland are representative for the
.

b i om a s s an d b i o e n e r g y 3 4 ( 2 0 1 0 ) 1 1 6 5e1 1 7 41166
most of the Polish power generating sector. The entire scope
of the presented research was executed by the Institute for
Chemical Processing of Coal in Zabrze, Poland.
Due to the fact that the legal regulations in force allow (in
accordance with European RES Directive [1]) a certain share of
the energy produced in the biomass co-firing process to be
classified as renewable energy, the paper also gives the
methodology of balancing energy generated in the co-firing
process and originating from renewable energy sources. The
algorithm is illustrated by an example calculation.
Fig. 2 e Skawina Power Plant location and other CEZ plants
in the close neighborhood.
2. Co-firing experience at the Skawina PowerPlant
2.1. Description of Skawina power plant
The bituminous coal-fired combined heat and power plant
Skawina has an installed capacity of 590 MW electric and
618 MW thermal, supplying electricity to the local distribution
and trading companies and district heat mainly to the city of
Krakow and the city of Skawina. It produces about 2.8 TWh of
electricity per annum. Within its combined production of
power and heat, the plant supplies heat and hot water to the
westernpart of Krakowand the townof Skawina (Figs. 1 and 2).
Skawina is located 21 km southwest of Krakow, the third
largest city and cultural capital of Poland. Polish abundant
reserves of hard coal provide a secure source of fuel. Skawina
is strategically located on the electric grid in the greater Kra-
kow area, and is critical to maintaining the balance of the
electric system. One of Krakow’s principal providers of heat,
supplying over 20% of the city’s thermal requirements, Ska-
wina’s thermal output is necessary to ensure improved reli-
ability of the district heating system.
In Poland, the obligation for energy utilities to purchase
electricity produced from RES (renewable energy sources) (the
“quota system”) was introduced in December 2000. The Ordi-
nance of the Ministry of Economy of 14th August 2008 [2]
confirms quotas of electricity sold to the final consumers con-
nected to the grid on the territory of the Republic of Poland
during the period of 2010e2017 as follows: 10.4% for 2010–2012,
Fig. 1 e Skawina Power Plant.
10.9% for 2013, 11.4% for 2014, 11.9% for 2015, 12.4% for 2016 and
12.9% for 2017. This system of quotas also allows electricity
produced from co-firing of biomass or (biogas) and fossil fuels
taking into account the proportion of chemical energy of used
renewable energy fuel. The same regulation of the Minister of
Economy covers the obligatory requirements for the certifica-
tionandcontrol systemsallowing for theaccounting of a proper
share of electricity produced during the co-firing process, as
“green electricity”.
Co-firing tests of sawdust and bio-waste with hard coal
have been carried out at Skawina Power Plant.
2.2. Fuel analysis
Biomass sorts used in the co-firing tests were:
� sawdust originating fromwood (a mixture of deciduous and
coniferous tree wood with particle sizes of ca. 5 mm and
upper calorific values as received amounting to 13 MJ kg�1),
and
� bio-waste from cereal production and processing (pressing
of barley and rye grains as well as chicory and sugar beet
roots, with particle sizes of ca. 10 mm and upper calorific
values as received amounting to 8 MJ kg�1). The scope of the
processing provided by the supplier exclusively includes
mechanical and thermal treatment that does not cause any
mechanical fouling or chemical contamination of the fuel.
The processing is executed in such a way that such bio-
waste is considered as biomass according to the defini-
tions covered by [2,3].
Having investigated the biomass market and logistic
capability rates, a (maximum) mass share of biomass in the
fuel blend was established at the level of 6.6% (for bio-waste
co-firing) and 9.5% (for sawdust co-firing). To increase the
transparency and clarity of renewable energy settlement
procedures the above-mentioned types of biomass are not co-
fired simultaneously.
Tables 1 and 3 present the fuel analysis of biomass, coal
and fuel blends for co-firing tests. For the purposes of coal and
biomass co-firing tests, two blends were prepared: fuel blend

Table 1 e Fuel analysis of coal, bio-waste and blend “A”used in the co-firing trial tests.
Parameter Components Blend“A”
Coal 1 Coal 2 Coal 3 Coalslurry
Bio-waste
Proximate analysis
Total moisture
Wtr, %
7.10 12.60 6.90 24.40 73.50 17.41
Moisture, Wa, % 3.20 4.40 2.10 4.60 6.40 4.03
Ash, Aa, % 36.60 31.0 8.00 49.50 3.70 30.20
Total sulphur,
Sta, %
0.72 0.74 0.62 1.28 0.32 0.80
Incombustible
sulphur, SAa , %
0.26 0.31 0.15 0.46 0.03 0.29
Combustible
sulphur, SCa, %
0.46 0.43 0.47 0.82 0.29 0.51
Higher heating
value, Qsa, kJ/kg
18,748 20,136 31,271 13,204 20,757 20,358
Lower heating
value, Qia, kJ/kg
17,959 19,270 30,159 12,550 19,446 19,477
Lower heating
value, Qir, kJ/kg
(as received)
17,137 17,407 28,560 9438 3755 16,623
Table 3 e Fuel analysis of coal, sawdust and blend “B”used in the co-firing trial tests.
Parameter Components Blend“B”
Coal 1 Coal 2 Sawdust
Total moisture Wtr, % 12.20 12.60 56.20 16.54
Moisture, Wa, % 4.10 4.50 8.60 4.68
Ash, Aa, % 28.10 22.60 16.90 24.93
Total sulphur, Sta, % 0.74 0.90 0.04 0.73
Incombustible sulphur,
SAa , %
0.30 0.31 0.04 0.28
Combustible sulphur,
SCa, %
0.44 0.59 0.00 0.46
Higher heating value,
Qsa, kJ/kg
21,487 23,341 16,356 21,707
Lower heating value,
Qia, kJ/kg
20,587 22 371 15,189 20,755
Lower heating value,
Qir, kJ/kg (as received)
18,642 20,266 6007 18,061
b i om a s s a n d b i o e n e r g y 3 4 ( 2 0 1 0 ) 1 1 6 5e1 1 7 4 1167
of symbol “A”, containing coal and bio-waste, and as fuel
blend “B”, composed of coal andwood sawdust. Tables 2 and 4
give the relationships between the mass shares of coal,
sawdust and bio-waste.
Table 5 presents the ash analysis and the ash-fusion
temperatures of bio-waste and sawdust used in the co-firing
tests. These parameters have been later used for the evalua-
tion of the influence of biomass co-firing on boiler furnace
slagging and fouling by means of fusibility correlations [4].
2.3. Blending method
Coal is delivered to Skawina Power Plant by rail transport. The
coal is unloaded into the storage yard. Coal is transferred from
the coal yard to the loading hopper by a bulldozer and from
there to the power plant coal bins by belt conveyors. There
also is a possibility of a direct unloading of the coal from
lorries onto the conveyors. The sawdust and the bio-waste
wood waste used in the tests were transported to the power
plant by trucks, the capacity of which ranged between 40 and
120 m3 (about 13e40 tonnes each). The space in the coal yard
was limited, so the biomass was stockpiled just outside the
main coal yard.
Table 2 eMass shares of individual components in blend“A” .
Specification Mass,Mg
Mass share [%]
Component Sizegrade
Asreceived
Calculated as drymass
Bio-waste e 38 6.64 1.92
Coal 1 Fine coal 240 41.96 44.07
Coal 2 Fine coal 100 13.99 20.30
Coal 3 Pea coal 80 16.43 17.50
Coal slurry e 120 20.98 16.20
For the co-firing tests, coal and biomass were mixed by
a bulldozer in the coal yard. Because the blending of coal and
sawdust were done in the coal yard, some minor fluctuations
in the blending ratio were expected.
2.4. Description of the tests
The co-firing tests at Skawina Power Plant were carried out
during February and March 2006. Week-long continuous
testing was conducted. Before that test program, some very
simplified preliminary tests were carried out, mainly based on
injecting small proportions of sawdust mixed with coal. The
main objectives of the tests were:
- to mix both biofuels separately with two different coal
blends,
- to test different proportions of sawdust and bio-waste and
to find the maximum mass share of biomass with which it
was technically possible to co-fire at Skawina Power Plant,
and
- to check the effect of co-firing on the ESP (electrostatic
precipitator) operation.
During the co-firing tests, the following process values
were monitored:
- fuel behavior on the coal conveyors, in the hoppers and coal
mills,
- combustion behavior (ignition and flame stability),
Table 4 e The mass share of individual components inblend “B” mass.
Specification Weight,Mg
Weight [%]
Component Sizegrade
Asreceived
Calculated as drymass
Sawdust - 30 9.51 4.77
Coal 1 fine coal 165 52.30 55.24
Coal 2 fine coal 120.5 38.19 39.99

Table 5 e The ash analysis and the ash-fusiontemperatures of sawdust and bio-waste used in theco-firing tests.
Coal Blend “A”(6.6% bio-waste)
Blend B 9.5%sawdust
Calculated chemical constitution of coal ash and fuel blends ash
(weight percentage)
SiO2 53.91 52.89 53.81
Al2O3 29.67 28.30 29.45
Fe2O3 6.80 6.64 6.77
CaO 2.45 3.53 2.46
MgO 2.06 2.20 2.07
Na2O 0.70 0.75 0.70
K2O 2.97 3.21 2.99
P2O5 0.09 0.24 0.38
SO3 0.00 0.19 0.00
Mn3O4 0.00 0.06 0.00
TiO2 1.35 1.30 1.34
BaO 0.00 0.00 0.00
SrO 0.00 0.00 0.00
Mass share of
co-firing ash in the
total ash amount, %
0 6.438 0.758
Table 6 e Boiler energy balance elements for bio-wasteand coal for blend “A” co-firing tests.
Specification Unit Blend “A”without bio-waste
Blend A
Boiler steam output t/h 212.80 217.60
Boiler thermal power MW 148.90 152.18
Boiler thermal load % 92.52 94.61
Average fuel flux t/h 25.50 31.06
Chemical energy flux MW 163.22 167.95
Steam energy flux MW 204.93 209.27
Heat losses
Stack MW 12.01 11.38
% 7.36 6.78
Ignition (unburnt CO
chemical enthalpy)
MW 0.01 0.02
% 0.01 0.01
Unburned carbon in
slag / bottom ash
MW 0.08 0.51
% 0.05 0.30
Unburned carbon
in fly ash
MW 1.32 2.81
% 0.81 1.67
In slag/bottom ash MW 0.07 0.13
% 0.04 0.08
In fly ash MW 0.14 0.25
% 0.09 0.15
To environment
(radiation and convection)
MW 0.66 0.67
% 0.41 0.40
Boiler efficiency (gross) % 91.23 90.61
Table 7 e Boiler energy balance elements for sawdust forblend “B” co-firing tests.
Specification Unit Blend Bwithoutsawdust
Blend“B”
Boiler steam output t/h 208.30 201.70
Boiler thermal power MW 145.79 141.51
Boiler thermal load % 90.56 87.69
Average fuel flux t/h 25.89 24.38
Chemical energy flux MW 158.24 154.09
Steam energy flux MW 199.93 193.98
Heat losses
Stack MW 10.36 10.37
% 6.55 6.73
Ignition (unburnt
CO chemical enthalpy)
MW 0.02 0.01
% 0.01 0.01
Unburned carbon in
slag / bottom ash
MW 0.05 0.13
% 0.03 0.09
Unburned carbon
in fly ash
MW 1.20 1.25
% 0.76 0.81
In slag/bottom ash MW 0.06 0.07
% 0.04 0.04
In fly ash MW 0.11 0.12
% 0.07 0.08
To environment
(radiation and convection)
MW 0.65 0.64
% 0.41 0.42
Boiler efficiency (gross) % 92.14 91.83
b i om a s s an d b i o e n e r g y 3 4 ( 2 0 1 0 ) 1 1 6 5e1 1 7 41168
- slagging and fouling (process data and visual inspections),
- heat transfer in the furnace (process data and furnace exit
temperatures)
- emissions (SO2, NOx, dust),
- burn-out (UBC e unburned carbon in fly ash and quality of
bottom ash), and
- quality of by-products.
The duration of the test period was seven days and during
that time the sawdust and bio-waste were mixed with several
types of Polish coal. Two different mass shares of biomass
were tested during the test.
2.5. Test results e process and emission parameters ofco-firing
The main objective of the research was to conduct a full
measurement of the process parameters to evaluate the
energy and emission operational indices of OP-230 type boiler
while co-firing blends of coal and biomass.
During the tests, the blending process was carried out in
the coal yard. The fuel blend was then transported to the
power plant bins by belt conveyors. The behavior of the fuel
blend in the coal mills (being primarily a major concern while
co-firing biomass using the direct technology) was carefully
monitored through the tests. Specifically, special attention
was paid to the mill power consumption, grinding results and
mill outlet temperatures.
Grinding coal and biomass mixture in the ball mills had
aminor effect on the coal fineness results: the amount of bigger
particles increased and the amount of smaller parts decreased.
Both caused a negative effect on the burn-out efficiency of coal.
Based on the measurement, the energy balance for the
relevant fuel combinations was developed and the energy
indices were calculated.
Tables 6 and 7 compare the basic energy parameters of the
co-firing process, for bio-waste and sawdust respectively.
Differences in the individual parameters of energy balance
were studied in order to determine the impact of biomass co-
firing on the individual thermal and calorific parameters
comprising the energy balance of the boiler. The comparative
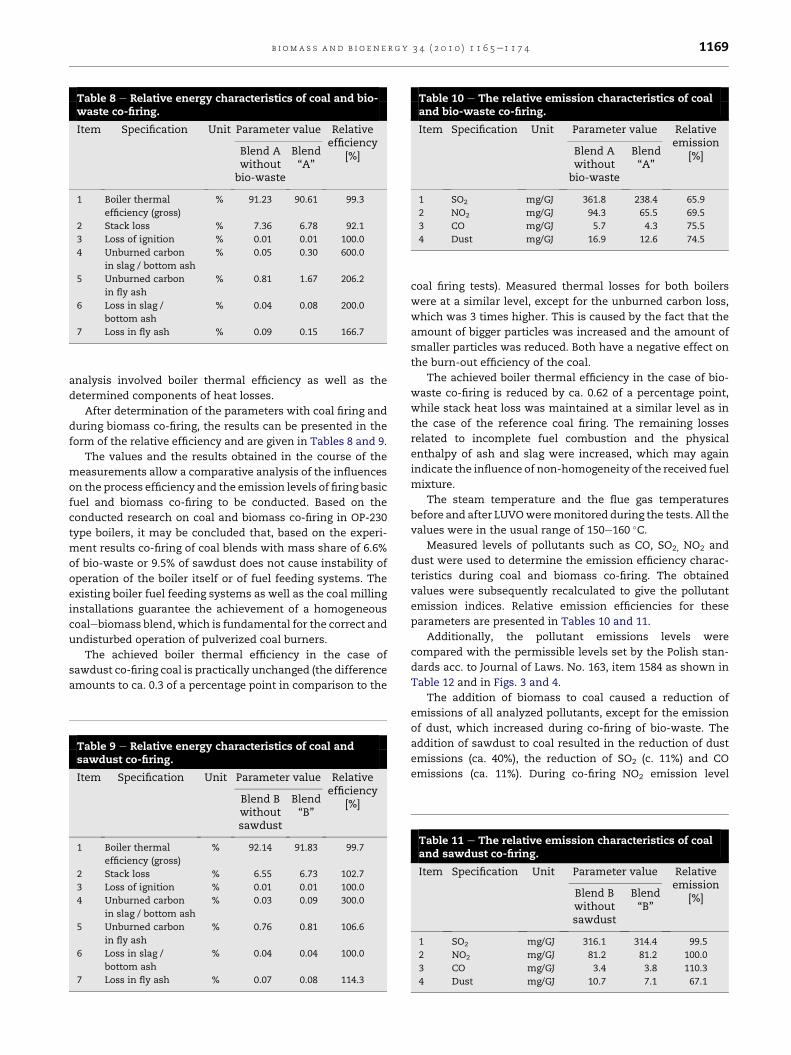
Table 8 e Relative energy characteristics of coal and bio-waste co-firing.
Item Specification Unit Parameter value Relativeefficiency
[%]Blend Awithoutbio-waste
Blend“A”
1 Boiler thermal
efficiency (gross)
% 91.23 90.61 99.3
2 Stack loss % 7.36 6.78 92.1
3 Loss of ignition % 0.01 0.01 100.0
4 Unburned carbon
in slag / bottom ash
% 0.05 0.30 600.0
5 Unburned carbon
in fly ash
% 0.81 1.67 206.2
6 Loss in slag /
bottom ash
% 0.04 0.08 200.0
7 Loss in fly ash % 0.09 0.15 166.7
Table 10 e The relative emission characteristics of coaland bio-waste co-firing.
Item Specification Unit Parameter value Relativeemission
[%]Blend Awithoutbio-waste
Blend“A”
1 SO2 mg/GJ 361.8 238.4 65.9
2 NO2 mg/GJ 94.3 65.5 69.5
3 CO mg/GJ 5.7 4.3 75.5
4 Dust mg/GJ 16.9 12.6 74.5
b i om a s s a n d b i o e n e r g y 3 4 ( 2 0 1 0 ) 1 1 6 5e1 1 7 4 1169
analysis involved boiler thermal efficiency as well as the
determined components of heat losses.
After determination of the parameters with coal firing and
during biomass co-firing, the results can be presented in the
form of the relative efficiency and are given in Tables 8 and 9.
The values and the results obtained in the course of the
measurements allow a comparative analysis of the influences
on the process efficiency and the emission levels of firing basic
fuel and biomass co-firing to be conducted. Based on the
conducted research on coal and biomass co-firing in OP-230
type boilers, it may be concluded that, based on the experi-
ment results co-firing of coal blends with mass share of 6.6%
of bio-waste or 9.5% of sawdust does not cause instability of
operation of the boiler itself or of fuel feeding systems. The
existing boiler fuel feeding systems as well as the coal milling
installations guarantee the achievement of a homogeneous
coalebiomass blend, which is fundamental for the correct and
undisturbed operation of pulverized coal burners.
The achieved boiler thermal efficiency in the case of
sawdust co-firing coal is practically unchanged (the difference
amounts to ca. 0.3 of a percentage point in comparison to the
Table 9 e Relative energy characteristics of coal andsawdust co-firing.
Item Specification Unit Parameter value Relativeefficiency
[%]Blend Bwithoutsawdust
Blend“B”
1 Boiler thermal
efficiency (gross)
% 92.14 91.83 99.7
2 Stack loss % 6.55 6.73 102.7
3 Loss of ignition % 0.01 0.01 100.0
4 Unburned carbon
in slag / bottom ash
% 0.03 0.09 300.0
5 Unburned carbon
in fly ash
% 0.76 0.81 106.6
6 Loss in slag /
bottom ash
% 0.04 0.04 100.0
7 Loss in fly ash % 0.07 0.08 114.3
coal firing tests). Measured thermal losses for both boilers
were at a similar level, except for the unburned carbon loss,
which was 3 times higher. This is caused by the fact that the
amount of bigger particles was increased and the amount of
smaller particles was reduced. Both have a negative effect on
the burn-out efficiency of the coal.
The achieved boiler thermal efficiency in the case of bio-
waste co-firing is reduced by ca. 0.62 of a percentage point,
while stack heat loss was maintained at a similar level as in
the case of the reference coal firing. The remaining losses
related to incomplete fuel combustion and the physical
enthalpy of ash and slag were increased, which may again
indicate the influence of non-homogeneity of the received fuel
mixture.
The steam temperature and the flue gas temperatures
before and after LUVOweremonitored during the tests. All the
values were in the usual range of 150e160 �C.Measured levels of pollutants such as CO, SO2, NO2 and
dust were used to determine the emission efficiency charac-
teristics during coal and biomass co-firing. The obtained
values were subsequently recalculated to give the pollutant
emission indices. Relative emission efficiencies for these
parameters are presented in Tables 10 and 11.
Additionally, the pollutant emissions levels were
compared with the permissible levels set by the Polish stan-
dards acc. to Journal of Laws. No. 163, item 1584 as shown in
Table 12 and in Figs. 3 and 4.
The addition of biomass to coal caused a reduction of
emissions of all analyzed pollutants, except for the emission
of dust, which increased during co-firing of bio-waste. The
addition of sawdust to coal resulted in the reduction of dust
emissions (ca. 40%), the reduction of SO2 (c. 11%) and CO
emissions (ca. 11%). During co-firing NO2 emission level
Table 11 e The relative emission characteristics of coaland sawdust co-firing.
Item Specification Unit Parameter value Relativeemission
[%]Blend Bwithoutsawdust
Blend“B”
1 SO2 mg/GJ 316.1 314.4 99.5
2 NO2 mg/GJ 81.2 81.2 100.0
3 CO mg/GJ 3.4 3.8 110.3
4 Dust mg/GJ 10.7 7.1 67.1

Table 12 e The comparison of calculated emission indices with the permitted limits.
Item Emission Unit Parameter valueb Permissible levelsa
Blend A without bio-waste Blend “A” Blend B without sawdust Blend “B”
1 CO mg/m3 1964.0 1833.5 1988.1 1759.5 2350
2 SO2 mg/m3 511.7 503.8 510.7 454.5 600
3 Dust mg/m3 91.7 96.8 67.0 40.0 350
a According to Journal of Laws, No. 163, item 1584 [5].
b Calculated as 6% O2.
b i om a s s an d b i o e n e r g y 3 4 ( 2 0 1 0 ) 1 1 6 5e1 1 7 41170
remained practically unchanged when compared to the firing
of the reference coals.
The level of pollutant emissions to the environment while
firing coal and co-firing coal with biomass meets the
requirements determined by the Ordinance of the Minister of
the Environment [3].
2.6. Test results e evaluation of the influence of biomassco-combustion on boiler furnace slagging and fouling
Boiler surfaces slagging hazard depends strongly on the
properties of ash, which can be described by characteristic ash
fusion temperatures: initial deformation temperature, soft-
ening temperature, hemispherical temperature and flow
temperature. Ashes over softening temperature can be
strongly adhesive, which results in slagging. For precise
prediction of ash fusibility, various correlations between
fusion temperatures and standardized (given in the form of
oxides) chemical composition of ashes have been determined.
The most popular parameters used for slagging hazard
determination are [4]:
� Ratio of basic (B) compounds to acidic compounds (A) in
a direct form cm:
cm ¼ Fe2O3 þ CaOþMgOþNa2Oþ K2Oþ P2O5
SiO2 þAl2O3 þ TiO2(1)
or in a simplified form:
Rðb=aÞ ¼ Fe2O3 þ CaOþMgOSiO2
(2)
0
500
1000
1500
2000
2500
CO SO2 Dust
Co
ncen
tratio
n in
th
e flu
e g
as, m
g•m
-3
permissible levelcoalcoal + bio-waste
Fig. 3 e The comparison of calculated emission indices
during coal combustion and coal and bio-waste co-firing
with the permitted limits.
� Fouling index Fu
Fu ¼ cmðNa2Oþ K2OÞ (3)
� Slag viscosity index e SR ratio
SR ¼ SiO2
SiO2 þ Fe2O3 þ CaOþMgO(4)
Although application of fusibility correlations does not
ensure entirely reliable evaluation of slagging and fouling
inclination in other than laboratory conditions, it can be
useful by comparing the effects of firing various fuels in the
same boiler [4].
Based on Table 5, the chemical constitution of coal and
biomass blend ashes were determined and the obtained
values (1)e(4) were used for the fusibility correlations to
determine the slagging and corrosion hazard resulting from
co-firing of sawdust and bio-waste. The results are given in
Table 6 and in Fig. 5.
Obtained values of cm and R(b/a) are similar to coal alone
firing (Fig. 5). According to [4], R(b/a) value around 0.15 gives
information about low slagging hazard. This can also be
confirmed by the rather high ash melting temperatures of
both biofuels (Table 5).
The significant influence of biomass co-firing on the values
of Fu is also shown in Fig. 5. It is especially noticeable for
sawdust co-firing due to its higher ash content compared to
bio-waste co-firing. Values of fouling index over 0.6 are
representative for fuels of significant fouling character. Co-
0
500
1000
1500
2000
2500
CO SO2 Dust
Co
nc
en
tra
tio
n in
th
e flu
e g
as
, m
g•m
-3
permissible levelcoalcoal + sawdust
Fig. 4 e The comparison of calculated emission indices
during coal combustion and coal and sawdust co-firing
with the permitted limits.

0
1
2
3
4
5
6
7
8
9
10
cm R(b/a) Fu
0
10
20
30
40
50
60
70
80
90
Sawdust Bio-waste Coal Sawdust co-firing Bio-waste co-firing
Sawdust Bio-waste Coal Sawdust co-firing Bio-waste co-firing
SR
Fig. 5 e The comparison of the calculated indices for determination of the slagging hazard possibilities.
b i om a s s a n d b i o e n e r g y 3 4 ( 2 0 1 0 ) 1 1 6 5e1 1 7 4 1171
firing of sawdust and bio-waste can then bear a strong fouling
risk.
Some sources describe the boiler surfaces corrosion hazard
as higher when a co-firing plant applies NOx reducing tech-
nologies. In the case of Skawina plant, a pulverized coal based
reburning system and OFA systems are applied to reduce NOx,
which means the corrosion hazard and its possible diagnostic
tools should be the subject of further research.
3. Co-firing based renewable energy sharedetermination method
Due to the significant difference in the price of electrical
energy generated from renewable sources and fossil fuel
plants, the method of qualifying both kinds of energy gener-
ated in a co-firing process required unambiguous and
coherent procedures to be set up. The lack of such procedures
could create a risk of unjustified cases of qualifying energy
generated from conventional fuels (coal) as renewable energy.
In addition to the unjustified increases of income, such an
occurrence would make the sales of real renewable energy
sources difficult (an increase in competitiveness).
Consequently, resulting from the above situation, the
generation of renewable energy could statistically grow, while
in reality it would be conventional energy. In addition to the
lack of expected advantageous social and environmental
effects, such a situation could lead to an increase in the prices
of electricity.
Energy sources where conventional fuel (hard coal) and
renewable fuels (sawdust and bio-waste) are fired are not
entirely renewable energy sources. According to the stipula-
tions [5], only a portion of the electrical energy and heat
generated in generating units (determined as sets of
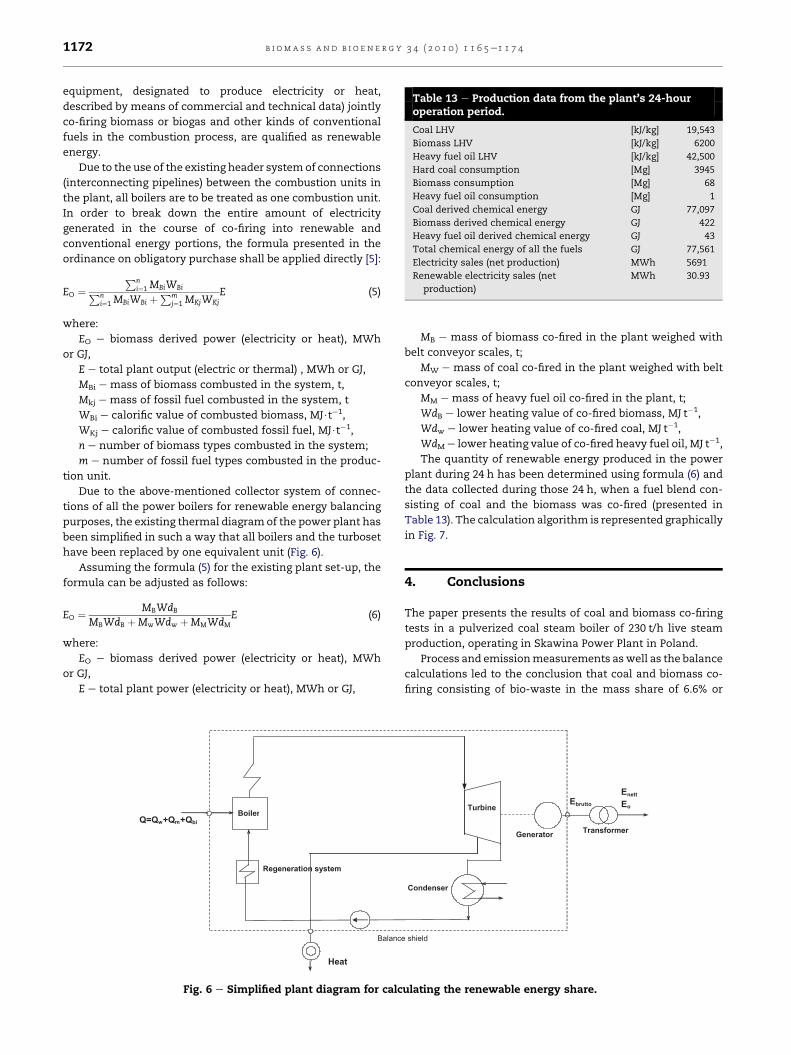
Table 13 e Production data from the plant’s 24-houroperation period.
Coal LHV [kJ/kg] 19,543
Biomass LHV [kJ/kg] 6200
Heavy fuel oil LHV [kJ/kg] 42,500
Hard coal consumption [Mg] 3945
Biomass consumption [Mg] 68
Heavy fuel oil consumption [Mg] 1
Coal derived chemical energy GJ 77,097
Biomass derived chemical energy GJ 422
Heavy fuel oil derived chemical energy GJ 43
Total chemical energy of all the fuels GJ 77,561
Electricity sales (net production) MWh 5691
Renewable electricity sales (net
production)
MWh 30.93
b i om a s s an d b i o e n e r g y 3 4 ( 2 0 1 0 ) 1 1 6 5e1 1 7 41172
equipment, designated to produce electricity or heat,
described by means of commercial and technical data) jointly
co-firing biomass or biogas and other kinds of conventional
fuels in the combustion process, are qualified as renewable
energy.
Due to the use of the existing header systemof connections
(interconnecting pipelines) between the combustion units in
the plant, all boilers are to be treated as one combustion unit.
In order to break down the entire amount of electricity
generated in the course of co-firing into renewable and
conventional energy portions, the formula presented in the
ordinance on obligatory purchase shall be applied directly [5]:
EO ¼Pn
i¼1 MBiWBiPni¼1 MBiWBi þ
Pmj¼1 MKjWKj
E (5)
where:
EO e biomass derived power (electricity or heat), MWh
or GJ,
E e total plant output (electric or thermal) , MWh or GJ,
MBi e mass of biomass combusted in the system, t,
Mkj e mass of fossil fuel combusted in the system, t
WBi e calorific value of combusted biomass, MJ$t�1,
WKj e calorific value of combusted fossil fuel, MJ$t�1,
n e number of biomass types combusted in the system;
m e number of fossil fuel types combusted in the produc-
tion unit.
Due to the above-mentioned collector system of connec-
tions of all the power boilers for renewable energy balancing
purposes, the existing thermal diagramof the power plant has
been simplified in such a way that all boilers and the turboset
have been replaced by one equivalent unit (Fig. 6).
Assuming the formula (5) for the existing plant set-up, the
formula can be adjusted as follows:
EO ¼ MBWdB
MBWdB þMwWdw þMMWdME (6)
where:
EO e biomass derived power (electricity or heat), MWh
or GJ,
E e total plant power (electricity or heat), MWh or GJ,
Fig. 6 e Simplified plant diagram for calc
MB e mass of biomass co-fired in the plant weighed with
belt conveyor scales, t;
MW e mass of coal co-fired in the plant weighed with belt
conveyor scales, t;
MM e mass of heavy fuel oil co-fired in the plant, t;
WdB e lower heating value of co-fired biomass, MJ t�1,
Wdw e lower heating value of co-fired coal, MJ t�1,
WdM e lower heating value of co-fired heavy fuel oil, MJ t�1,
The quantity of renewable energy produced in the power
plant during 24 h has been determined using formula (6) and
the data collected during those 24 h, when a fuel blend con-
sisting of coal and the biomass was co-fired (presented in
Table 13). The calculation algorithm is represented graphically
in Fig. 7.
4. Conclusions
The paper presents the results of coal and biomass co-firing
tests in a pulverized coal steam boiler of 230 t/h live steam
production, operating in Skawina Power Plant in Poland.
Process and emissionmeasurements aswell as the balance
calculations led to the conclusion that coal and biomass co-
firing consisting of bio-waste in the mass share of 6.6% or
ulating the renewable energy share.

Fig. 7 e Graphic presentation of the renewable energy share calculation algorithm.
b i om a s s a n d b i o e n e r g y 3 4 ( 2 0 1 0 ) 1 1 6 5e1 1 7 4 1173
sawdust in the mass share of 9.5% do not negatively affect the
energy efficiency or emission levels of the tested boiler.
The determined emission levels of toxic pollutants result-
ing from coal firing and biomass co-firing meet all require-
ments of the emission standards as specified in the Regulation
of Ministry of Environment [3].
Fig. 8 e Direct injection of biomass to the coal ducts inside
the boiler house.
During the calculations it was found that a combination
of biomass and coal firing can result in worse fouling
conditions than coal firing alone. Therefore, the thickness of
ash deposits increase, which can also increase the slagging
intensity.
Basing on the trial tests results, the Skawina Power Plant
decided to co-fire biomass on the commercial scale. Presently,
after almost two years of direct co-firing of biomass, plant
owners decided to introduce a direct biomass injection to the
fuel feeding system omitting the coal mills which turned out
to be the serious bottleneck for increasing biomass share in
the fuel blend. The pilot installation was constructed (Fig. 8)
and is under the operational testing at the moment [5].
In all the analyzed cases, an advantageous influence of
biomass co-firing, consisting of reduced emissions of
pollutants into the atmosphere, was observed. Due to the
fact that the research covered only emission levels related
to the firing process, it is considered advisable to extend
further research work to the analysis of emission levels
related to all processes related to biomass processing, i.e.:
transportation and preparatory processes. It seems that
a good tool to execute this kind of analysis could also be the
so-called cumulative analysis of the full product life cycle,
popular in Europe [6].
r e f e r e n c e s
[1] Directive 2009/28/EC of the European Parliament and of theCouncil of 23 April 2009 on the promotion of the use of energyfrom renewable sources and amending and subsequentlyrepealing Directives 2001/77/EC and 2003/30/EC.
[2] Regulation of the Minister of Economy of 14th August 2008 onthe detailed range of obligations for obtaining and presentingfor redemption of certificates of origin, for making substitutefees as well as for purchasing of energy and heat producedfrom renewable energy sources and confirmation of dataconcerning the quantity of electricity produced fromrenewable energy sources (Journal of Laws, No. 156, item. 969).

b i om a s s an d b i o e n e r g y 3 4 ( 2 0 1 0 ) 1 1 6 5e1 1 7 41174
[3] Regulation of the Minister of Environment of 20th December2005 (Journal of Laws, No. 260, item. 2181).
[4] Pronobis M. Evaluation of the influence of biomass co-combustion on boiler furnace slagging by means of fusibilitycorrelations. Biomass Bioenergy 2005;28:375e83.
[5] Chaberka M, Zygmanski W, Sciazko M, Zuwala J. Thedevelopment of biomass co-firing concepts on the example of
Skawina Power Plant. Chapter in the monograph. In: Taler J,editor. Modern technologies and machinery for powerproduction. Cracow University of Technology, ISBN 978-83-7242-439-6; 2007 (in Polish).
[6] Christiansen HF. LCA of procurement and conversion ofbiomass and fossil fuels e used for energy production inDenmark; 1997.
Copyright © 2022 FDOKUMEN