Stimuli-responsive nanoparticles from ionic cellulose derivatives
Upload
independentCategory
view
4download
0
Periodicity and Firing Rate As Candidate Neural Codes for theFrequency of Vibrotactile Stimuli
Emilio Salinas, Adrian Hernandez, Antonio Zainos, and Ranulfo Romo
Instituto de Fisiologıa Celular, Universidad Nacional Autonoma de Mexico, 04510, Mexico D.F., Mexico
The flutter sensation is felt when mechanical vibrations between5 and 50 Hz are applied to the skin. Neurons with rapidly adapt-ing properties in the somatosensory system of primates aredriven very effectively by periodic flutter stimuli; their evokedspike trains typically have a periodic structure with highly regulartime differences between spikes. A long-standing conjecture isthat, such periodic structure may underlie a subject’s capacity todiscriminate the frequencies of periodic vibrotactile stimuli andthat, in primary somatosensory areas, stimulus frequency is en-coded by the regular time intervals between evoked spikes, notby the mean rate at which these are fired. We examined thishypothesis by analyzing extracellular recordings from primary(S1) and secondary (S2) somatosensory cortices of awake mon-keys performing a frequency discrimination task. We quantifiedstimulus-driven modulations in firing rate and in spike train peri-odicity, seeking to determine their relevance for frequency dis-
crimination. We found that periodicity was extremely high in S1but almost absent in S2. We also found that periodicity wasenhanced when the stimuli were relevant for behavior. However,periodicity did not covary with psychophysical performance insingle trials. On the other hand, rate modulations were similar inboth areas, and with periodic and aperiodic stimuli, they wereenhanced when stimuli were important for behavior, and weresignificantly correlated with psychophysical performance in sin-gle trials. Thus, the exquisitely timed, stimulus-driven spikes ofprimary somatosensory neurons may or may not contribute tothe neural code for flutter frequency, but firing rate seems to bean important component of it.
Key words: awake monkeys; primary somatosensory cortex;secondary somatosensory cortex; neural coding; flutter; discrim-ination; periodicity; mutual information
The sensation of flutter is produced when mechanical vibrationsbetween 5 and 50 Hz are applied to the skin (Mountcastle et al.,1967; Talbot et al., 1968). Earlier studies using vibrotactile stimulireported four basic observations: (1) that sensation in the flutterrange is mediated by primary afferent fibers and S1 neurons withrapidly adapting properties associated with Meissner’s mechanore-ceptors (Mountcastle et al., 1967; Talbot et al., 1968); (2) that theseafferents and cortical neurons are driven very effectively by peri-odic flutter stimuli, which evoke highly periodic spike trains(Mountcastle et al., 1969, 1990; Recanzone et al., 1992); (3) thatpsychophysical performance in frequency discrimination, which issimilar for humans and monkeys (LaMotte and Mountcastle, 1975),correlates closely with the discriminability of the evoked, periodicinterspike intervals (Mountcastle et al., 1969, Recanzone et al.,1992); and (4) that in afferent and S1 units, the firing rate, com-puted over hundreds of milliseconds, changes little within theflutter range (Talbot et al., 1968; Mountcastle et al., 1969, 1990;Recanzone et al., 1992). In view of these results, it was argued thatflutter frequency cannot be encoded by the firing rate of rapidlyadapting units and that a subject’s capacity to discriminate flutterfrequencies has to depend on the periodicity of the evoked inter-spike intervals (Mountcastle et al., 1967, 1969, 1990; Talbot et al.,1968; Recanzone et al., 1992). This led to the proposal that “fre-quency discrimination is made by a central neural mechanism
capable of measuring the lengths of the dominant periodic intervalsin the [evoked] trains of impulses” (Mountcastle et al., 1967).
Nevertheless, the fourth and crucial observation was based on asmall number of neurons (Mountcastle et al., 1990) or on responsesto a narrow range of frequencies applied to anesthetized animals(Recanzone et al., 1992). Additionally, direct microstimulation ofMeissner-type primary afferents produced flutter sensations offrequencies that were perceived to increase with evoked firing rate(Ochoa and Torebjork, 1983). More recently, we also observed thatmonkeys can discriminate the mean frequencies of aperiodic stim-uli, which lack any temporal regularity. Animals can work withaperiodic stimuli whether these are delivered naturally, by a me-chanical probe, or artificially, through microinjection of electricalcurrent into S1 (Romo et al., 1998). These considerations castdoubts on the bold proposal quoted above. Is it true, then, thatspike periodicity plays a functional role in frequency discrimina-tion and that firing rate does not? If this were the case, corticalsomatosensory neurons would provide a solid demonstration of atemporal neural code (Shadlen and Newsome, 1994, 1998; Singerand Gray, 1995; Ahissar, 1998). Here we try to assess the relation,if any, between behavior and stimulus-driven modulations in firingrate and in periodic interspike timing in S1 and S2. The resultssuggest that firing rate does play an important role in encodingstimulus frequency in our paradigm.
MATERIALS AND METHODSNeurophysiology and behavior. The behavioral task is schematized in Fig-ure 1a [see also Romo et al. (1998); Hernandez et al. (1997)]. In each trialthe monkey had to compare the frequencies of two vibratory stimulipresented consecutively. The sequence of events was as follows. Themechanical probe was lowered, indenting the glabrous (hairless) skin ofone digit of the restrained hand; the monkey reacted, placing its free handon a lever within 1 sec after indentation; after a delay period (1.5–3 sec),the probe oscillated vertically, periodically, at a base frequency; after aninterstimulus interval (1–3 sec), a second stimulus was delivered at acomparison frequency; the monkey had to release the lever within 600msec and press one of two push-buttons to indicate whether the compar-ison frequency was higher or lower than the base. Both stimuli lasted 500msec and were delivered to the distal segment of digits 2, 3, or 4 of the lefthand via a computer-controlled Chubbuck linear motor stimulator (Chub-buck, 1966), which had a 2 mm round tip. Initial indentation was 500 mm.
Received March 13, 2000; revised April 26, 2000; accepted May 1, 2000.This research was supported by an International Scholars Award from the Howard
Hughes Medical Institute and grants from DGAPA-UNAM and CONACYT to R.R.We thank Bill Newsome and Carlos Brody for invaluable suggestions and discussions,and David Egelman for helpful comments. We appreciate the technical assistance ofSergio Mendez and Federico Jandete. E.S. also thanks Terry Sejnowski and theHoward Hughes Medical Institute for their support during final stages of this work.R.R. designed and performed the experiments with the assistance of A.H. and A.Z.;E.S. designed and performed the data analysis; E.S. and R.R. co-wrote thismanuscript.
Correspondence should be addressed to Ranulfo Romo, Instituto de FisiologıaCelular, Universidad Nacional Autonoma de Mexico, 04510, Mexico D.F., Mexico.E-mail: [email protected].
Dr. Salinas’s present address: Computational Neurobiology Laboratory, The SalkInstitute, 10010 North Torrey Pines Road, La Jolla, CA 92037.Copyright © 2000 Society for Neuroscience 0270-6474/00/205503-13$15.00/0
The Journal of Neuroscience, July 15, 2000, 20(14):5503–5515

Stimulus amplitudes were adjusted to equal subjective intensities (Mount-castle et al., 1990; Hernandez et al., 1997). For example, 71 mm at 12 Hzand 51 mm at 34 Hz (;1.4% per Hertz). In each trial of the task, a pair ofbase-comparison frequencies was chosen pseudorandomly from a set typ-ically comprising ;10 pairs. For one full data collection run, at least fivetrials per pair had to accumulate with the same stimulus set. Typically,each run included 10 trials per pair. Figure 1, b and c, shows two stimulussets commonly used in the experiments (set A was used much more often;see Fig. 1, legend). The numbers inside the grids indicate the percentage ofcorrect discriminations for each pair of frequencies. In set A, the differ-ence between base and comparison was always 8 Hz, and the monkeysperformed between 80 and 91% correct. In set B, smaller and largerdifferences were combined. In general, monkeys had clear difficultiesdiscriminating when base and comparison frequencies differed by ;2 Hzor less.
Sinusoidal stimuli were used initially; 137 S1 neurons were studied inthis way. Later we switched to trains of short mechanical pulses like thoseillustrated in Figure 1a. Each of these pulses consisted of a single-cyclesinusoid lasting 20 msec. For stimulation at 20 Hz, 11 successive pulseswere applied, separated by 50 msec. This interval was measured betweenthe beginnings of successive pulses. The data obtained with sinusoidalstimuli were not used in Figure 2 or in comparisons with S2 responses, butthey were included in the comparisons between active and passive condi-tions and between neuronal and psychophysical responses.
Experiments with aperiodic stimuli were also conducted (Romo et al.,1998). In this situation a frequency of 20 Hz still corresponded to 11mechanical pulses delivered in a 500 msec period, so the mean intervalbetween pulses was 50 msec, but the times between pulses were random.The minimum time between the onsets of consecutive pulses was equal totheir width, 20 msec, corresponding to a maximum instantaneous fre-quency of 50 Hz. In practice, then, the total number of pulses delivered wasconstant across trials of a particular frequency, as in the periodic case, andgiven the stimulation period of 500 msec and the pulse width of 20 msec,those pulses were randomly distributed among 500/20 5 25 positions intime (except that the first and last pulses were always delivered at thebeginning and end of the stimulation interval). The specific temporalpattern of pulses was chosen randomly in each trial, and the patterns weredifferent even for trials with the same mean frequency. The monkeys hadto compare the average frequencies of the base and comparison stimuliexactly as before. By average frequency we mean the total number ofstimulation pulses divided by the corresponding 500 msec period. Theseexperiments were of two types: with periodic base and aperiodic compar-ison, or with both aperiodic. Behavioral results from these two variants ofthe paradigm were pooled. These experiments were performed in blocksinterleaved between blocks of regular discrimination with periodic stimuli.
Passive stimulation tests were also performed in blocks and were alsointerleaved between blocks of active discrimination. During passive stim-ulation, the hand used to press the push-buttons was restrained, so therewere no behavioral reactions, and no reward was provided. Otherwise,single trials proceeded as with regular discrimination. The same combi-nations of base-comparison frequencies were used in experiments withperiodic and aperiodic vibrations and in passive and active conditions.However, not all neurons could be recorded long enough to complete allthe types of tests, so the numbers of recorded neurons varied acrossconditions.
Recordings were obtained with an array of seven independent micro-electrodes of 2–3 MV (Mountcastle et al., 1990, 1991). Recording proce-dures were the same as those described by Mountcastle et al. (1990) (seealso Romo et al., 1998, 1999). Microelectrodes were aimed at the handrepresentations in S1 and S2, and the locations of the penetrations wereconfirmed with standard histological techniques. For the analysis of simul-taneously recorded neurons, only pairs with units from different electrodeswere used. Separation between microelectrodes was at least 500 mm.Animals were handled according to the guidelines of the National Insti-tutes of Health and the Society for Neuroscience.
Response measures. The firing rate in each trial was equal to the numberof spikes emitted during the 500 msec stimulation period (base or com-parison) divided by 0.5 sec. The mean firing rate r was obtained byaveraging over trials of equal stimulus frequency; therefore, r and its SD swere functions of frequency (r and s correspond, respectively, to the datapoints and error bars in Figs. 2e, 3e). Response curves of mean firing rateversus stimulus frequency were fitted to linear and Gaussian functionsthrough x2 minimization (Press et al., 1992). Gaussian tuning curves hadfour parameters, amplitude A, baseline B, center frequency C, and widthsG , such that:
r~s! 5 B 1 A exp S 2~s 2 C!2
2sG2 D , (1)
where s is the stimulus frequency. In the text, angle brackets ^& indicateaveraging over all stimulus frequencies. Thus, ^r& indicates the mean firingrate averaged over all frequencies. Similarly, ^s& corresponds to the SD ofthe firing rate averaged over all frequencies and measures the meantrial-to-trial variability. That is, r and s were first calculated independentlyfor each stimulus frequency and then were averaged across frequencies to
obtain ^r& and ^s&. We also computed a signal-to-noise ratio for eachneuron. This was defined as:
SNR 5rmax 2 rmin
^s&, (2)
where rmax and rmin are the maximum and minimum values, over allstimulus frequencies, of the mean firing rate.
To relate periodicity to performance, we used several measures based onFourier decompositions of the time signals formed by the evoked trains ofspikes. For each trial, the power spectrum of the spike train evoked duringthe stimulation period (base or comparison) was computed and normal-ized, having had the DC component removed, so that the total powersummed over all positive frequency bins was 100% (Press et al., 1992).Examples of power spectra for individual trials are shown in Figures 2b,d,3b,d. In this way the number of spikes contained in each train had littleimpact on the resulting Fourier amplitudes, which indicated the proportionof power in the corresponding frequency bins. That is, the Fourier ampli-tudes were mainly determined by the temporal arrangement of the spikes,not by their number (however, the power spectrum could not be computedin trials in which less than two spikes were emitted). The sampling intervalfor the spike trains was 0.5 msec, and the width of the frequency bins was1.95 Hz. The latter was limited by the duration of the stimulation period,which for the Fourier analysis we took as 512 msec.
Four quantities were extracted from each power spectrum, that is, ateach trial. The first two were the power (or amplitude) at the stimulusfrequency (PS) and the power at twice the stimulus frequency. These twonumbers should increase for evoked spikes that are more tightly phase-locked to the stimulation pulses. The third quantity was the maximumpower (maximum y coordinate) between 4 and 42 Hz, and its correspond-ing frequency (x coordinate) was the fourth quantity, which we denomi-nated the power spectrum frequency at peak (PSFP). The three amplitudesmeasure how periodic a spike train is, whereas the PSFP is an actualestimate of stimulus frequency that depends on the periodicity of theevoked spike trains; this distinction is crucial (notice that the stimulusfrequency needs to be known a priori to compute PS and the amplitude attwice the stimulus frequency). Note that the resolution of the PSFPdepends on the width of the frequency bins of the power spectrum.Consider an example that was relatively common in S1. Suppose a neuronis strongly phaselocked to the stimulus and fires spikes somewhat like aclock, one or two spikes per stimulation pulse, in an approximately peri-odic fashion. In its spectra, the maximum power would be at the stimulusfrequency. Thus, the PSFP amplitude would be equal to PS, the PSFPwould be the center of the frequency bin nearest to the stimulus frequency,and all three amplitudes (at the PSFP, at the stimulus frequency, and attwice the stimulus frequency) would be much larger than the averagepower across all bins. Statistical tests applied to any of these four quantitieswere always performed also with the other three, but sometimes only theresults for the most sensitive one are mentioned.
In each trial, we also computed the average interburst interval (AIBI),which measures how often a burst of spikes is produced. A burst wasdefined as a group of spikes in which all intervals between consecutivespikes were less than t msec. Thus, the number of spikes per burst wasvariable, with a minimum of 1, and all interspike intervals within a givenburst had to be smaller than t. Large t values produced few bursts withmany spikes, whereas small t values produced many bursts with few orsingle spikes. Having fixed t, the AIBI was then computed as the meanvalue of the time intervals between consecutive burst endings.
Standardized responses. To compare the above responses in correctdiscrimination trials (hits) versus incorrect discrimination trials (errors),these responses had to be pooled across different base-comparison fre-quency pairs, because errors were rather infrequent. To illustrate thepooling method, we first consider the firing rate as the response. Thestandardized rate in a given trial was obtained by taking the original firingrate at that trial, subtracting the mean rate from all trials belonging to thesame condition (base-comparison frequency pair), and dividing by the SDfrom the same subset of trials. The same was done for all trials in the datacollection run. This eliminated any differences in response level attribut-able to preference for one frequency or combination of base and compar-ison stimulus frequencies—differences across conditions—but left intactany differences within conditions, such as differences between hits anderrors. By construction, such a set of standardized rates has zero mean andunit SD. Exactly the same procedure was followed to compute the stan-dardized measures of periodicity, which were the standardized PSFPamplitude, the standardized PS, and the standardized amplitude at twicethe stimulus frequency. In all cases the standardized values in individualtrials were obtained from the “raw” values by subtracting the mean of thecorresponding condition and dividing by the SD, as explained above.Having obtained the standardized responses for each run, trials wereseparated into two groups. In trials of type 1, the base frequency washigher than the comparison, and in trials of type 2, the comparison washigher than the base. Thus, for each run and each kind of response, twocomparisons between hits and errors were made, one for each set of trialsof the same type. In all cases the mean of all standardized responses inerror trials was compared with the mean of all standardized responses inhit trials, and the significance of the difference was determined (see Figs.8, 9). For each type of comparison, a minimum of five error trials wasrequired.
5504 J. Neurosci., July 15, 2000, 20(14):5503–5515 Salinas et al. • Periodicity versus Firing Rate in S1 and S2

Trial-to-trial covariations in the firing rates of simultaneously recordedneurons were measured using Pearson’s linear correlation coefficient r(Press et al., 1992). This coefficient can be computed easily from the samestandardized rates described in the previous paragraph. If ri
a is the stan-dardized rate of neuron a at trial i, the correlation coefficient betweenneurons a and b is simply:
rab 51N O
i51
N
riari
b, (3)
where N is the total number of trials in the run, including all stimulusfrequencies.
Information estimates and other statistics. Having computed the firingrate, the PSFP, and the AIBI in each trial, we quantified how they variedas functions of stimulus frequency for any given cell. For this we usedShannon’s mutual information (Cover and Thomas, 1991; Abbott et al.,1996). Information is a measure of association between two quantities,typically stimulus and response. Its magnitude relates to the accuracy withwhich one of them can be determined given the other. Thus, by computingthe information that they provide about a stimulus, two different responsescan be compared in the same units, namely, in terms of their capacity toencode the stimulus.
The information that a response r provides about a stimulus s is com-puted from the probability distributions relating these two variables. In ourcase, s is the frequency of the applied flutter stimulus. The function P(rus)represents the conditional probability of observing a response r given thatthe stimulus had a value s. The expression P(r) describes the probability ofobserving a response r regardless of the value of the stimulus, and P(s) isthe probability that the stimulus takes a value s. When all stimuli arepresented the same number of times, P(s) is simply a constant. Using thesequantities, the information that the response provides about the stimuluscan be computed as:
I 5 Or,s
P~s! P~rus!log2 SP~rus!
P~r! D . (4)
Here the sums are over all possible values of the stimulus and the response.Information is measured in bits. If the stimulus s can take N differentvalues, the maximum amount of information that can be provided by anysignal is log2(N) bits. A response carrying these many bits of informationlets us determine exactly which of the N stimulus values is presented in anytrial; stimulus and response are then maximally correlated. Most informa-tion results shown below correspond to experiments in which seven oreight frequencies were applied and in which, therefore, the maximumamount of mutual information was log2 (8) 5 3 bits. An exception to thiswas made in comparisons between active and passive conditions, becausehere what mattered was the difference in information values (found withidentical numbers of frequencies) across conditions; several sets with 9–11frequencies were allowed in these cases.
The information that the firing rate provided about the stimulus, IRATE,was computed from the set of firing rates from all trials assuming that theresponse probability distributions P(rus) were Gaussian (Abbott et al.,1996). (These Gaussians are response probability distributions specific toeach stimulus frequency and should not be confused with the Gaussiantuning curves mentioned above.) Then, a correction for finite sampling,based on Monte Carlo methods, was applied [Treves and Panzeri (1995);E. Salinas, unpublished results, but see below]. In practice, this meant thatI was first computed from Equation 4 and then a correction term, com-puted separately, was subtracted from it. The information that the AIBIprovided about the stimulus, IAIBI, was computed in a similar way, usingthe AIBI values in all trials and assuming Gaussian statistics. The infor-mation that the PSFP provided about the stimulus, IPSFP, was computedsomewhat differently. Because of the Fourier methods involved, PSFPvalues were drawn from binned distributions, so IPSFP was computed usingthe original PSFP bins between 4 and 42 Hz, which correspond to theflutter range; including higher frequencies only increased the uncertaintyin frequency and decreased IPSFP. Corrections for finite sampling were alsoapplied in this case (see below). For all information estimates, at least fivetrials per stimulus value were required.
The significance of all information values was computed through MonteCarlo resampling schemes (Efron, 1982; Press et al., 1992) akin to permu-tation tests (Siegel and Castellan, 1988). The basic procedure consists ofshuffling the order of the trials with respect to the stimulus labels, such thatthe correspondence between stimulus and response is disrupted, madeentirely random, and then recomputing the information values as was doneoriginally, before shuffling. This is done repeatedly, with different shuf-flings, to obtain the fraction of times that the shuffled information waslarger or equal to the original information computed previously from thenonshuffled responses. This fraction gives an estimate of the probability ofmeasuring the original amount of information just by chance, when theactual information is really zero. This is precisely the significance: theprobability of measuring the original amount of information when theresponses are in fact independent from the stimulus. For all significanceestimates, 2000 shufflings were used. In tests using synthetic data generatedby a computer, we found that this method to obtain the significance of
information was extremely robust: its results were accurate even with smallnumbers of trials (five) and regardless of the distributions from which thedata were drawn. A significant amount of information indicates that a realassociation between stimulus and response probably exists; the amount ofinformation quantifies the strength of this association.
When information is computed from relatively small numbers of datasamples, it is typically biased upward with respect to its true value,especially when binned distributions are used (Treves and Panzeri, 1995;Abbott et al., 1996). All of the information calculations for IRATE, IPSFP,and IAIBI were extensively cross-validated through computer simulations tominimize such biases. The simulations essentially consisted of three steps:(1) defining mathematical fits or binned distributions that modeled themeasured empirical response distributions (for rate, PSFP, or AIBI); (2)generating, from these model distributions, synthetic data sampled exactlylike in the experiments, with the same numbers of stimuli and samples; and(3) comparing the information computed from the full model distributionsto the information computed from the synthetic sampled data. This com-parison revealed how information estimates from sampled data deviatefrom the true values on average, depending on the numbers of samples andthe type and distribution of the responses considered. In practice, thisprovided two things: first, an error bar for the information, and second, theterm to be subtracted from Equation 4, i.e., the bias.
Overall, the average correction for IRATE and IAIBI was approximately20.11 bits, and it was similar for significant and nonsignificant values. Themean correction was larger for IPSFP, because it was computed from binneddistributions: on average it was approximately 20.4 bits for significantvalues and approximately 21.1 bits for nonsignificant ones. As a compar-ison, the largest nonsignificant IPSFP in the data presented below (after thecorrection) was of 0.4 bits. Thus, small, nonsignificant IPSFP values were themost biased and suffered the greatest corrections. Note also that theuncorrected numbers never exceeded the theoretical maximum equal tolog2 of the number of frequencies used. These corrections are importantfor the results below primarily when IPSFP is compared with IRATE or IAIBI;otherwise, they make little difference.
Unless specified otherwise, other statistical comparisons were based onpermutation tests (Siegel and Castellan, 1988). Here the underlying idea ispractically the same as for the computation of significance described above.Two distributions are thought to differ in some statistic, for instance intheir means. To test the significance of the difference, the two distributionsare mixed, and two new shuffled distributions, with the same numbers ofelements as the original ones, are obtained. Then the difference in themeans is recomputed, as done originally. The procedure is repeated manytimes with different shufflings, and the end result is an estimate of theprobability of measuring the original difference in the means just bychance, under the null hypothesis that the two sample distributions actu-ally came from the same source. This powerful procedure may be appliednot only to the mean but to other statistics as well. It was used in allpairwise comparisons reported here. For these tests, 5000 permutationswere performed; thus p , 0.0002 was the maximum resolution. Signifi-cance was set at the p , 0.01 level.
RESULTSFiring rate and periodicity modulations in S1Three monkeys (Macaca mulatta) were trained in the discrimina-tion task. In each trial, the frequencies of two mechanical vibrationsdelivered successively had to be compared (Romo et al., 1998;Hernandez et al., 1997) (Fig. 1; and see Materials and Methods).After training, single neurons were recorded extracellularly whilethe task was performed (Mountcastle et al., 1990; Romo et al.,1998). In primates, processing of somatosensory information fromS1 to S2 seems to proceed mostly in a serial fashion (Pons et al.,1987, 1992). We recorded in these two areas to assess any differ-ences in the processing or representation of tactile information. Inboth areas, a neuron was selected for study if, relative to back-ground activity, it responded in any way to the base or comparisonstimulus or during the interstimulus interval. For S1 neurons (areas3b and 1) the stimulating probe was placed at the receptive fieldcenters. S2 neurons had large receptive fields, often bilateral,spanning all digits and sometimes even reaching the forearm (Ponset al., 1987, 1992; Sinclair and Burton, 1993; Fitzgerald et al., 1999).Stimuli were always applied at the fingertips and, as illustrated inFigure 1a, consisted of trains of short mechanical pulses deliveredat various frequencies.
For each neuron, two quantities were computed in each trial: themean firing rate and the PSFP, which is an estimate of stimulusfrequency based on the periodicity of evoked action potentials (seeMaterials and Methods). We used the PSFP because, just like firingrate, it is a scalar quantity from which stimulus frequency can beestimated on a trial-by-trial basis; however, unlike with firing rate,
Salinas et al. • Periodicity versus Firing Rate in S1 and S2 J. Neurosci., July 15, 2000, 20(14):5503–5515 5505

the accuracy of this estimation depends on the periodicity of thespike trains. Figure 2, a and c, shows examples of S1 spike trainsevoked during the base stimulus in individual trials, and Figure 2,b and d, shows the corresponding power spectra. The PSFP issimply the center (x coordinate) of the frequency bin with the mostpower. As illustrated in these Figures, the PSFP in S1 tends to bethe same across trials. This is because the evoked spikes arephase-locked to the individual stimulation pulses. This can be seenmore clearly in Figure 2h, which shows average S1 responsestriggered at the time of individual pulses, the onset of which occursat a time lag equal to 0 msec. The evoked activity reflects theperiodicity of the sensory input. Curves for mean PSFP versusfrequency were also obtained; this was done by averaging the PSFPover trials with equal stimulus frequency. These curves are shownin Figure 2f. Here the points fall close to the x 5 y line, confirmingthat the PSFP typically falls near the stimulus frequency. Curvesfor mean firing rate versus frequency were also obtained; examplesare shown in Figure 2e. Notice that these neurons tend to fire moreaction potentials at higher stimulus frequencies. This was also truefor the population: when straight lines were fit (Press et al., 1992)to the rate-versus-frequency data, most neurons had positiveslopes, as shown in Figure 2g. Variations in mean rate across thetested range of frequencies were similar to those observed previ-ously in somatosensory cortex using paradigms based on othertactile stimuli, such as textured surfaces or tactile motion (Sinclairand Burton, 1991, 1993; Gardner et al., 1992; Romo et al., 1996).
Curves like those of Figure 2, e and f, give a rough idea of thestrength of association between the stimulus and the evoked vari-ations in firing rate and in PSFP, but comparing them against eachother is difficult. Instead, a quantitative measure of association was
computed: Shannon’s mutual information (Cover and Thomas,1991; Abbott et al., 1996) (see Materials and Methods). Thisstatistic is useful because it allows a direct comparison between thetwo kinds of response in the same units, that is, in terms of theircapacity to encode stimulus frequency. The maximum amount ofinformation in these experiments was 3 bits.
In S1, the information that the PSFP—i.e., periodic spike tim-ing—provided about stimulus frequency, IPSFP, was extremely high(1.71 6 0.95 bits, mean 6 SD; 107 of 129 values were significant,p , 0.01), as can be seen in Figure 2i (right plot). In 12 cases, IPSFP.2.8 bits, which means that by computing the PSFPs of any one ofthese neurons, on average seven frequencies could in principle bedistinguished from each other with 100% reliability. The spikerasters of S1 neurons seem to provide a faithful representation ofthe stimulus as it progresses in time (Fig. 2a, c, h), and the highIPSFP values agree with this subjective impression. Notice in Figure2i, however, that the mean IPSFP dropped considerably from area3b, which receives the heaviest thalamic projection (Jones, 1975,1983), to area 1. The average numbers were 1.96 6 0.97 bits forarea 3b (n 5 68) and 1.43 6 0.86 bits for area 1 (n 5 61), and thedifference was highly significant (p , 0.001). These IPSFP valuesrepresent upper bounds on the information provided by the PSFPthat is available to neurons downstream from S1, because neuronalmechanisms that may actually implement an approximate Fourierdecomposition—for example, operations based on spike train au-tocorrelations (Cariani and Delgutte, 1996) or intrinsic oscillators(Ahissar and Vaadia, 1990; Ahissar, 1998)—cannot match theaccuracy of the numerical methods (Press et al., 1992) used tocompute the PSFP.
In contrast to these numbers, the information about stimulusfrequency provided by the firing rate, IRATE, was approximatelysixfold lower, but certainly not negligible (0.28 6 0.23 bits; 74 of129 values were significant). The distribution of values is shown inFigure 2i (lef t). What order of magnitude for IRATE should we haveexpected based on rate curves like those in Figure 2e? To get abetter idea of the correspondence between the rate-versus-frequency curves and IRATE, consider the following idealized butrepresentative example. Suppose the applied stimulus frequency scan take one of eight values, 8, 12, 16, 20, 24, 28, 32 or 36 Hz, andconsider a neuron whose mean firing rate increases linearly with swith a slope of 0.7 spikes, typical of S1 (Fig. 2g), such that theevoked mean firing rate can be described by:
r~s! 5 22 1 0.7s 1 se. (5)
Here e represents random Gaussian noise with zero mean and unitvariance, so s is the SD of the mean firing rate. This s is equivalentto the s computed from the experimental data, except that, forsimplicity, it is considered independent of frequency s. On average,the mean rate of this ideal neuron is ;28 spikes/sec when s 5 8 Hzand ;47 spikes/sec when s 5 36 Hz; these values are also typical forthe minimum and maximum mean rates at which S1 neurons firedduring our experiments. For this idealized typical neuron, whenthe amplitude of the noise is s 5 3.5 spikes/sec, IRATE 5 1 bit;when s 5 8.7 spikes/sec (close to the average measured value, asseen in Fig. 5c), IRATE 5 0.3 bits; and when s 5 16 spikes/secIRATE 5 0.1 bits. In comparison, a Poisson process, which providesa reasonable first order model for neuronal firing (Softky andKoch, 1993; Shadlen and Newsome, 1998), would give IRATE 5 0.3bits, assuming that it fired at the same mean rates and that spikeswere counted in a 500 msec time window. So, for cortical standards,1 bit corresponds to an extremely reliable neuron, and 0.3 bitsshould be more or less typical given the experimental parametersand the measured rates. This is in agreement with the informationvalues computed from the data.
Taken together, these results confirm that S1 spikes are preciselytime-locked to the stimulation pulses (Mountcastle et al., 1969,1990; Recanzone et al., 1992), but they also show that althoughperiodic firing can in principle provide a better code for stimulusfrequency, firing rate cannot be dismissed.
Figure 1. Behavioral paradigm and stimulus sets used. a, Schematic dia-gram of the task. In each trial, the mechanical probe was lowered so that ittouched one of the fingertips of the restrained hand (PD, probe down); themonkey reacted, placing its free hand on a lever within 1 sec after inden-tation (KD, key down); after a delay period (1.5–3 sec) the probe oscillatedvertically, delivering a series of pulses at a base frequency; after an inter-stimulus interval (1–3 sec), a second set of pulses was delivered at acomparison frequency; after the end of the comparison stimulus, themonkey had to release the lever within 600 msec (KU, key up) and press oneof two push-buttons (PB). One button indicated that the comparisonfrequency was higher than the base, and the other indicated that thecomparison was lower than the base. b, c, Two stimulus sets frequently usedin the experiments. The numbers inside the grid indicate the percentage ofcorrect responses for each base-comparison combination. Set A had con-stant differences of 8 Hz between base and comparison. Percentages arebased on the performance of three monkeys throughout 350 runs with thisset. Set B was designed to vary the difficulty of the task in a more systematicmanner. The percentages shown correspond to 42 runs from two monkeys.
5506 J. Neurosci., July 15, 2000, 20(14):5503–5515 Salinas et al. • Periodicity versus Firing Rate in S1 and S2

Differences between S1 and S2Figure 3 shows results, displayed in the same format as those inFigure 2, for a population of S2 neurons. The mean strength of ratemodulations in S2 was comparable to that measured in S1: theaverage IRATE in S2 was lower (0.14 6 0.18 bits), but the maximumvalues were still around 1 bit, as shown in Figure 2i, and ;20% ofall values (139 of 689) were significant (a calculation similar to theone around Equation 5 in this case gave a typical IRATE of ;0.2bits, assuming Poisson statistics). Thus, considerable rate modula-tion was also present in S2. However, comparison between S1 andS2 responses revealed four major differences.
First, a lack of periodicity in S2 was revealed. This can be seenin the spike rasters of Figure 3, a and c, and in the pulse-triggeredresponses of Figure 3h. For the latter, the responses of neuronswith positive and negative slopes were averaged, which is why the
mean firing rates are so similar at the three frequencies shown.Note that phase-locking is hardly noticeable, especially at higherfrequencies. Consistent with this, the mean PSFP in this case ispractically independent of stimulus frequency, as illustrated in theexamples of Figure 3f. In quantitative terms, the mean IPSFP in S2,computed for the spikes evoked during the base stimulus, was anorder of magnitude smaller than in S1 (0.17 6 0.34 bits), and only52 of the 689 neurons had values that were significantly differentfrom zero.
Second, S2 contained a larger proportion of neurons that firedmost strongly at low stimulation frequencies. The middle column ofFigure 3 illustrates such a unit, and e shows that its rate decreasesas a function of frequency. As mentioned above, in S1 strongeractivity typically occurred at higher frequencies, as shown in Figure2e. When firing rates were fitted (Press et al., 1992) as linear
Figure 2. Neuronal responses in S1. Left and middle columns show data, in the same format, from two neurons from areas 3b and 1, respectively. Theright column shows population data from 68 neurons in area 3b and 61 neurons in area 1. All plots are based on neuronal activity evoked by the basestimulus. a, c, Raster plots from five trials in which stimulus frequency was 12 Hz (a) and 28 Hz (c). Small vertical ticks indicate spikes; each row correspondsto one trial. The long vertical line indicates stimulation onset. b, d, Power spectra of the five spike trains shown immediately above. Power is expressed aspercentage of total power across all bins, but only frequencies within the flutter range are shown. e, Mean firing rate (61 SD) as a function of stimulusfrequency. Continuous line indicates best linear fit; dashed line indicates baseline firing rate, computed in the 800 msec preceding stimulation onset. Forthe neurons on the lef t and middle columns, IRATE 5 0.50 6 0.10 and 0.58 6 0.09 bits, respectively (both significant). f, Mean PSFP (61 SD) as a functionof stimulus frequency. The diagonal dotted line indicates equality between x and y axes. For the neurons on the lef t and middle columns, IPSFP 5 2.71 60.03 and 2.08 6 0.04 bits, respectively (both significant). Because PSFP values were discrete and often distributed bimodally, SDs here suggest more overlapbetween response distributions than was actually measured. g, Distribution of slopes from linear fits to the rate-versus-frequency curves (as in e). Whiteand black bars correspond to area 3b and area 1 neurons, respectively. h, Average S1 responses triggered on individual stimulation pulses. The threehistograms correspond to stimulation at 12, 20, and 28 Hz and were constructed from the responses of 89–102 S1 neurons tested at these frequencies. They axis indicates the firing rate (in 1 msec time bins), averaged over neurons and trials, x milliseconds before or after the onset of an individual stimulationpulse, where x is called the time lag. Phase-locking is readily apparent at all frequencies. i, Cumulative distributions for IRATE and IPSFP. The value on they axis represents the fraction of neurons with information smaller or equal to the amount indicated on the x axis. Thin lines indicate separate distributionsfor areas 3b and 1; thick lines correspond to pooled data sets. Note the different scales on the x axes.
Salinas et al. • Periodicity versus Firing Rate in S1 and S2 J. Neurosci., July 15, 2000, 20(14):5503–5515 5507

functions of frequency, in S1 only 8% (10/129) of the resultingslopes were negative, whereas in S2 42% (287/689) of the slopeswere negative. This difference can be seen by comparing Figures 2gand 3g. Interestingly, a similar transformation between S1 and S2representations has been reported for textured surfaces (Sinclairand Burton, 1993). Here we should also mention that, in both areas,most response curves were approximately monotonic. First, thelinear fits were acceptable [Q . 0.001; see Press et al., (1992)] in53% (68/129) and 87% (602/689) of the neurons in S1 and S2,respectively. When Gaussian tuning curves were fitted to the samedata, 98% of the fits were acceptable in both areas (126/129 in S1,673/689 in S2). This is not surprising, because Gaussian tuningcurves had four parameters: baseline, amplitude, center frequency,and width (see Eq. 1). Still, many of the resulting curves weremonotonic, because the centers of the best fitting Gaussians wereeither outside or at the edges of the frequency interval that con-tained the data. For instance, the area 1 neuron in Figure 2e (right)had a center frequency C 5 31 Hz, beyond the highest frequencytested, and a width sG 5 18 Hz. For other neurons, the Gaussiancurves fitted better the saturation effects often seen at lowest orhighest firing rates. For example, the firing rate of the area 3bneuron in Figure 2e (lef t) is lower for 36 than for 28 Hz, althoughit has a positive slope. The Gaussian fit for this neuron had centerfrequency C 5 29 Hz and width sG 5 18 Hz. We considered a
neuron as tuned if the limits C 6 sG were both inside the intervalof tested frequencies and if the neuron also had a significant IRATE.The first condition assures that small saturation effects, like that ofthe area 3b neuron in Figure 2e (lef t), are not counted as actualtuning, and the second one guarantees that the Gaussian curve issignificantly different from flat. Few neurons were found that sat-isfied these criteria: 12% (15/129) in S1 and 1% (8/689) in S2. Inconclusion, most S1 and S2 rate-versus-frequency curves werereasonably monotonic, with negative slopes being more commonin S2.
The third difference was that “flat” neurons were more abundantin S2 (62%, 428/689) than in S1 (31%, 40/129). Flat neurons hadfiring rates that did increase or decrease significantly during stim-ulation, compared with the baseline activity preceding the basestimulus, but were not affected by stimulus frequency, i.e., IRATEwas not significant (here we used p . 0.05 as a criterion). This wasalso reflected in the distribution of slopes: a larger fraction of S2neurons had slopes that were close to zero, as can be seen bycomparing Figures 2g and 3g. This difference in the proportion offlat neurons could be caused partly by suboptimal stimulation of S2;we have observed that S2 receptive fields have essentially nopreference for one or another fingertip (Fitzgerald et al., 1999), butsometimes they do extend beyond the hand (Pons et al., 1987, 1992;Sinclair and Burton, 1993).
Figure 3. Neuronal responses in S2. Left and middle columns show data from two neurons: the firing rate of one increases with increasing stimulusfrequency (positive slope), and the firing rate of the other decreases with increasing stimulus frequency (negative slope). Slopes were extracted from thelinear fits shown in e. Same format is used as in Figure 2, except in d, middle column, frequency was 27 Hz; in e, IRATE 5 0.89 6 0.09 and 0.75 6 0.13bits for lef t and middle columns, respectively (both significant); in h, IPSFP 5 0.26 6 0.18 and IPSFP 5 0 6 0.30 bits, for lef t and middle columns, respectively(both not significant). In h, histograms are averages of 250–287 neurons (note same scale as in Fig. 2). Population data in g and i are based on 689 S2neurons. All data are based on neuronal activity evoked by the base stimulus.
5508 J. Neurosci., July 15, 2000, 20(14):5503–5515 Salinas et al. • Periodicity versus Firing Rate in S1 and S2

Fourth, many neurons in S2 either sustained their frequency-specific responses beyond the base stimulus or displayed them onlyafter stimulus offset, during the interstimulus interval. Figure 4aillustrates this for a neuron with positive slope that maintainedsignificant rate modulation even 1 sec after stimulus offset. Figure4c shows the activity of another, more typical neuron that had anegative slope and prolonged its response for a few hundredmilliseconds. The histograms in Figure 4, b and d, indicate theamount and significance of IRATE and IPSFP for these neurons as afunction of time, and the plot in Figure 4e presents the numbers ofS2 neurons with significant information (IRATE and IPSFP) also asa function of time. Notice that ;13% (89/689) of the neuronsdisplayed significant rate modulations in the 250 msec window afterstimulus offset. Figure 4e also shows that during this same period,10 neurons also had significant IPSFP; however, the number ex-pected just by chance was seven. This means that the sustained
activity lacked a significant oscillatory component. Significant ratemodulations after the stimulus were not observed in S1: fourneurons had significant IRATE during the interstimulus interval,but three were expected just by chance. Therefore, sustained ac-tivity was absent in the primary sensory area [compare with Zhouand Fuster (1996, 1997)]. The significance of maintained S2 activityis hard to pinpoint. To perform the task correctly, the monkeys hadto store the frequency of the base stimulus in short-term memory(Hernandez et al., 1997; Romo et al., 1999). Some prefrontalneurons are also active in this task, throughout or at differentpoints of the interstimulus interval, and their mean firing rates alsoincrease or decrease quasilinearly as functions of stimulus fre-quency (Romo et al., 1999). Additionally, we found that the sus-tained modulation in S2 was greatly reduced during passive stim-ulation, when the stimuli were applied but did not have to beremembered (data not shown). Hence, it is tempting to think thatsuch sustained activity may be related to the working memoryrequirements of the task, but this is speculative.
A simple compromise between firing rate and timingThe above results show that, on the basis of single-cell compari-sons, firing rate modulations in S2 were somewhat weaker thanthose in S1 in terms of information content; on average, IRATEdiffered by a factor of 2. However, the difference in terms ofperiodicity was a factor of 10. Although in S2 the actual averagevalues of IRATE and IPSFP were similar, two points should bestressed: first, that the fraction of neurons with significant IRATEwas twice as high as the fraction of neurons with significant IPSFP,and second, that the IPSFP values represent upper bounds.
We also checked whether distinctions between frequencies couldbe made based on the AIBI in each trial. A burst is simply a groupof spikes close together in time, like those shown in Figure 2a (lef t).We defined a burst through a time window t such that any twospikes within t milliseconds of each other belonged to the sameburst. Notice that the rate of bursts and the rate of spikes arecorrelated—indeed, if t is very small each spike equals a burst andthe two rates become equal—but grouping by bursts with morethan one spike may produce more accurate results than simplycounting spikes, especially when long interspike intervals corre-spond to intervals between consecutive stimulation pulses. TheAIBI represents a plausible middle ground between counting thetotal number of spikes, ignoring their temporal distribution, andtaking into account all individual interspike intervals.
For each neuron, the AIBI was obtained in each trial, and theinformation that the AIBI provided about stimulus frequency,IAIBI, was computed (see Materials and Methods). Parameter t wasset to optimize the average IAIBI in S1. It should be borne in mindthat, having optimized t, IAIBI is expected to be at least equal toIRATE, because one may always choose t close to zero and counteach spike as a burst. A positive value of IAIBI 2 IRATE means thatadditional information is extracted from the timing of spikes, inexcess of the information provided by the rate. With an optimal tof 20 msec, the average IAIBI in S1 was 0.58 6 0.49 bits (n 5 129).Thus, although the PSFP was more efficient, the AIBI did capturesome of the periodic structure of the spike trains, providing twiceas much information as the firing rate alone (McLurkin et al.,1991). This was also true for the maximum values, which were1.16 6 0.09 bits for IRATE and 2.29 6 0.07 for IAIBI. In contrast, inS2 IAIBI was indistinguishable from IRATE (p . 0.49, n 5 689), andthe maximum value was 0.65 6 0.12 bits, quite below the maximumIRATE, which was 1.04 6 0.07 bits. Other values of t were alsotested for S2, but the results were similar: the mean IAIBI alwaysdecreased with increasing t. Hence, grouping spikes by bursts,which effectively doubled the information about stimulus frequencyreported by the firing rate in S1, was entirely ineffective in S2. Thisconfirms, with a different method, that phase-locking is strong in S1and extremely weak in S2.
According to these results, neurons immediately downstreamfrom S1 may read out stimulus frequency in at least two ways:either from S1 firing rate modulations or from the periodic struc-
Figure 4. Sustained neuronal responses in S2. The base stimulus turned onat time zero, lasting 500 msec; stimulus onset and offset are indicated bydotted vertical lines. Interstimulus interval duration was 1–3 sec. a, Spikedensity histograms of a neuron that fired most strongly at high frequencies(positive slope). For the shown traces, stimulus frequencies were 8, 20, and28 Hz, as indicated. b, Information (11 SD) carried by the neuron illus-trated in a as a function of time. IRATE (black bars) and IPSFP (white bars)were computed every 250 msec using the spikes contained in a 250 msectime window centered at the midpoint (x coordinate) between bars. Largeand small dots indicate significance levels of p , 0.01 and p , 0.05,respectively. c, Spike density histograms of a neuron that fired most stronglyat low frequencies (negative slope); same stimulus frequencies as in a. d,Information carried by the neuron illustrated in c as a function of time. e,Number of neurons with significant (p , 0.01) information about stimulusfrequency as a function of time. Black bars correspond to IRATE and whitebars to IPSFP, as in b and d. All spike densities were obtained by convolvingthe spike trains with a Gaussian kernel of SD equal to 30 msec andaveraging over trials of equal frequency.
Salinas et al. • Periodicity versus Firing Rate in S1 and S2 J. Neurosci., July 15, 2000, 20(14):5503–5515 5509
ture of S1 spike trains. In contrast, for neurons downstream fromS2, the second possibility may not be available. Hence, two areasinvolved in somatosensory processing could potentially use funda-mentally different codes to represent the same quantity. S1 isextremely important for somatosensory processing: lesions in thisarea cause severe impairments in discrimination and categoriza-tion tasks (LaMotte and Mountcastle, 1979; Zainos et al., 1997),and activity driven by direct microinjection of electrical currentinto S1 may trigger sensory percepts that probably resemble naturalsensations quite closely (Romo et al., 1998; Wickersham and Groh,1998). Therefore, the crucial question is whether neurons down-stream from S1 read out its periodicity and are affected by it. Weperformed other experiments to try to address this issue.
Context-dependent modulations of activityIn general, the attentional state of a subject performing a task mayhave a strong influence on the neurons involved in it; neuronalresponses are often enhanced when attention is focused on asensory feature that the neurons react to (Hsiao et al., 1993;McAdams and Maunsell, 1999; Treue and Martınez-Trujillo, 1999).We wondered whether spike periodicity or firing rate would besubject to similar modulatory effects. The same sets of stimuli usedfor discrimination—the active condition—were also delivered pas-sively to the monkeys. During passive stimulation the respondingarm was restrained, no behavioral reaction was required, and noreward was delivered.
Figure 5 compares S1 activity evoked during the comparisonstimulus in active and passive conditions. Figure 5a shows that themean IRATE was significantly higher in the active condition (0.42 60.35 bits in active, 0.27 6 0.23 bits in passive; n 5 50 neurons withsignificant information in at least one of the conditions; p ,0.0004); indeed, most points fall above the equality line. Othermeasures of neuronal activity also showed significant variationsacross conditions. Figure 5c shows the average variability in firingrate across trials, ^s&, in the two conditions. In this case most pointsfall below the diagonal line, indicating that variability in firing ratewas significantly smaller during active discrimination (^s& was 8.9 64.2 spikes/sec in active, vs 10.5 6 4.6 spikes/sec in passive; n 5 77neurons tested in the two conditions; p , 0.0002). Across condi-tions, changes in the signal-to-noise ratio (Eq. 2), which is a simplefunction of the firing rates, were strongly correlated with changesin IRATE (linear correlation coefficient was 0.98, p , 0.0002). Thus,with all the measures tested we arrived at the same conclusion: thefiring rate in S1 is a more reliable signal during discrimination thanduring passive stimulation.
We were concerned about this result, however, because we hadnot taken into account the correlations among neurons, i.e., thestimulus-independent co-fluctuations in numbers of spikes fired.For certain changes in the correlations, the information aboutstimulus frequency transmitted jointly by the rates of multipleneurons might have actually decreased, despite an increase in theinformation conveyed by individual neurons (Shadlen and New-some, 1998; Zohary et al., 1994; Abbott and Dayan, 1999). Twoadditional results indicated that this was not the case. First, wemeasured r, the linear correlation coefficient between pairs ofsimultaneously recorded neurons averaged over all pairs. For eachpair, the coefficient was calculated using Equation 3, and a meanover all pairs was computed. We found that r was actually smallerin the active condition, although the difference was not significant(0.10 6 0.18 in active, 0.16 6 0.21 in passive; n 5 84 pairs tested inS1; p . 0.037). Second, we also computed the information providedjointly by the firing rates of pairs of neurons recorded simulta-neously, which takes into account their pairwise correlation, andagain we observed, on average, a significant increase in informationabout stimulus frequency in the active condition with respect to thepassive (p , 0.0002).
Very similar differences between rate modulation in active andpassive conditions were obtained in S2. Figure 6a and c, illustratesthis for IRATE and ^s&, but the same was also true for the signal-to-noise ratio and other measures of activity (Fig. 6, see legend).
Interestingly, the sustained responses after the offset of the basestimulus exhibited similar but larger effects (data not shown).Regarding the correlation coefficients in S2, again, no differencewas found between active and passive conditions (r was 0.07 6 0.20in active and 0.08 6 0.21 in passive; n 5 126 pairs tested in S2; p .0.7), and the information carried jointly by the firing rates of pairsof neurons was also significantly higher during active discrimina-tion (p , 0.0002). Therefore, the behavioral context of the taskdefinitely had an impact on the evoked firing rates of S1 and S2neurons: the numbers of spikes produced were significantly moreregular across trials during active discrimination.
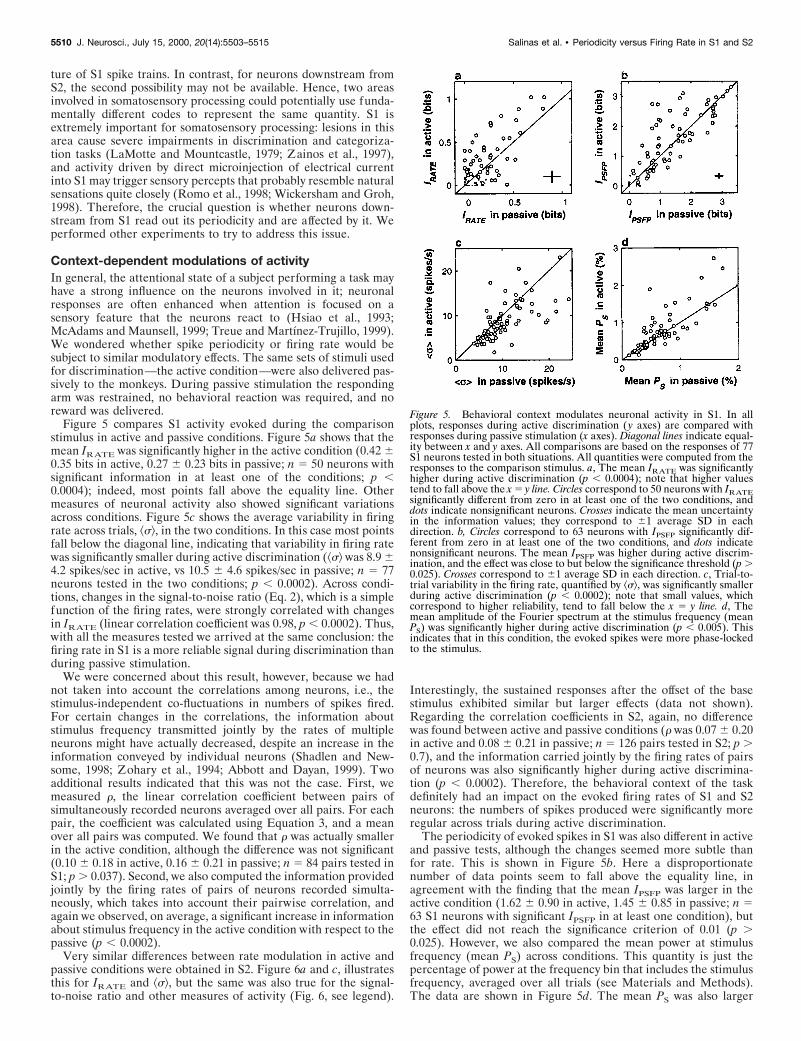
The periodicity of evoked spikes in S1 was also different in activeand passive tests, although the changes seemed more subtle thanfor rate. This is shown in Figure 5b. Here a disproportionatenumber of data points seem to fall above the equality line, inagreement with the finding that the mean IPSFP was larger in theactive condition (1.62 6 0.90 in active, 1.45 6 0.85 in passive; n 563 S1 neurons with significant IPSFP in at least one condition), butthe effect did not reach the significance criterion of 0.01 (p .0.025). However, we also compared the mean power at stimulusfrequency (mean PS) across conditions. This quantity is just thepercentage of power at the frequency bin that includes the stimulusfrequency, averaged over all trials (see Materials and Methods).The data are shown in Figure 5d. The mean PS was also larger
Figure 5. Behavioral context modulates neuronal activity in S1. In allplots, responses during active discrimination ( y axes) are compared withresponses during passive stimulation (x axes). Diagonal lines indicate equal-ity between x and y axes. All comparisons are based on the responses of 77S1 neurons tested in both situations. All quantities were computed from theresponses to the comparison stimulus. a, The mean IRATE was significantlyhigher during active discrimination (p , 0.0004); note that higher valuestend to fall above the x 5 y line. Circles correspond to 50 neurons with IRATEsignificantly different from zero in at least one of the two conditions, anddots indicate nonsignificant neurons. Crosses indicate the mean uncertaintyin the information values; they correspond to 61 average SD in eachdirection. b, Circles correspond to 63 neurons with IPSFP significantly dif-ferent from zero in at least one of the two conditions, and dots indicatenonsignificant neurons. The mean IPSFP was higher during active discrim-ination, and the effect was close to but below the significance threshold (p .0.025). Crosses correspond to 61 average SD in each direction. c, Trial-to-trial variability in the firing rate, quantified by ^s&, was significantly smallerduring active discrimination (p , 0.0002); note that small values, whichcorrespond to higher reliability, tend to fall below the x 5 y line. d, Themean amplitude of the Fourier spectrum at the stimulus frequency (meanPS) was significantly higher during active discrimination (p , 0.005). Thisindicates that in this condition, the evoked spikes were more phase-lockedto the stimulus.
5510 J. Neurosci., July 15, 2000, 20(14):5503–5515 Salinas et al. • Periodicity versus Firing Rate in S1 and S2

during active discrimination (0.72 6 0.53% in active, 0.62 6 0.38%in passive; n 5 77 S1 neurons), and in this case the effect wassignificant (p , 0.005). Thus, the timing of evoked S1 spikesrelative to the stimulation pulses was more regular during activediscrimination; tighter phase-locking occurred in this condition.
Figure 6, b and d, shows that in contrast to S1, no changes inperiodicity were detected in S2 in terms of IPSFP and mean PS (Fig.6, see legend). The same happened for the mean power at the PSFPand for the mean power at twice the stimulus frequency.
Runs of passive tests were applied in blocks, typically after ablock of active discrimination trials. Thus, we considered the pos-sibility that the results of this section might have been corrupted bysome sort of systematic drift in the recordings, such that later teststended to be, for instance, more noisy. However, each neuron wastypically tested in more than two conditions, so we were able to runthe same battery of statistical comparisons on experiments of thesame type, active or passive, testing for differences between earlyand late experimental runs. For example, if three runs (completeblocks of trials) were collected with the sequence active, passive,active, statistical tests were performed between the passive run andthe first active run, and the same tests were repeated for the secondand first active runs, as a control. Across the neural population, nosignificant effects were obtained in any of the control comparisons,showing that the described differences between active and passiveconditions were not caused by drift artifacts.
In summary, these experiments showed an attentional or a con-
textual enhancement of neural activity. In both S1 and S2, the firingrate encoded stimulus frequency better when the stimulus guidedthe animal’s behavior, in the sense that rate provided more infor-mation about the relevant stimulus feature. The periodicity of theevoked spikes did not change with behavioral context in S2, but itdid so in S1. This was surprising and indicates that spike timingmay be influenced by attention or behavioral context (Steinmetz etal., 2000). However, at the level of S1, these results do not favor oneneural code over the other.
Responses to aperiodic stimuliTwo of the monkeys also discriminated the average frequencies ofaperiodic stimuli (Romo et al., 1998) (see Materials and Methods).In this situation, the same numbers of pulses corresponding to eachstimulus frequency were delivered in the 500 msec stimulationperiod, but the times between pulses were random and varied fromtrial to trial. To obtain a reward, the monkeys had to comparecorrectly the average frequencies of the base and comparisonstimuli, just as with periodic vibrations. These animals did not gothrough a retraining period; they were able to perform the taskfrom the initial runs. Because S1 neurons emit spikes that arereliably phase-locked to individual stimulation pulses, aperiodicstimuli impose a timing between phase-locked spikes or bursts ofspikes that, by design, varies randomly within the stimulationperiod and across trials. Similar random timing can also be imposeddirectly through intracortical microstimulation (Romo et al., 1998).
The monkeys’ performance in this task only decreased slightlycompared with discrimination of periodic stimuli: overall, 88 versus80% correct (Romo et al., 1998). We investigated whether neuronalresponses paralleled this similarity. Figure 7, a and b, shows theresponses of an S1 neuron to periodic and aperiodic stimuli at twofrequencies. This neuron responded quite faithfully to individualstimulation pulses. Notice the regular interspike intervals in theperiodic condition, in Figure 7a, and the much more variable spiketrains elicited in the aperiodic condition, in Figure 7b. Figure 7cshows that for any given neuron, IRATE could vary somewhat fromthe periodic to the aperiodic situation, but on average, firing ratemodulations in S1 were indistinguishable across conditions(IRATE 5 0.44 6 0.28 bits for periodic, 0.38 6 0.25 bits foraperiodic; n 5 31 S1 neurons tested in both conditions and withsignificant IRATE in at least one of them; p . 0.19). Differenceswere slightly larger in S2 (IRATE 5 0.37 6 0.22 bits for periodic,0.22 6 0.17 bits for aperiodic; n 5 13; p . 0.055), but fewer sampleswere available. These results show that in the two areas, firing ratewas, on average, similarly modulated by frequency in periodic andaperiodic conditions.
Not surprisingly, in these experiments IPSFP practically vanished:of 41 S1/S2 neurons with significant IPSFP in the periodic condition,only one had a significant value in the aperiodic condition. Thesame thing happened with the mean power at the PSFP, at themean stimulus frequency and at twice the mean stimulus fre-quency. This was expected and simply showed that no consistentmodulations in periodicity are seen with aperiodic stimulation; theFourier spectrum shows no regularity from one trial to the next.
What about bursts of spikes; could they provide a reliable mea-sure of mean stimulus frequency for aperiodic stimuli? In theperiodic condition, the AIBI of S1 neurons carried more informa-tion than the rate, as has been described. The AIBI of S1 neuronsalso provided significant information in the aperiodic conditionbut, as shown in Figure 7d, IAIBI in this case was significantlysmaller than with periodic stimulation (0.71 6 0.47 in periodic,0.32 6 0.18 in aperiodic; n 5 31 S1 neurons tested in bothconditions and with significant IAIBI in at least one of them; p ,0.0002); most data points fall below the equality line. The keyobservation here is that with aperiodic stimuli, IAIBI was, onaverage, slightly smaller than IRATE, and this was the case whetherall neurons or only those with significant information were com-pared. This can be appreciated by comparing the y-axis values inFigure 7, c and d. Comparisons using bursts of other sizes were alsomade—we used t 5 20, 15, 10, and 5 msec—but the results were
Figure 6. Behavioral context modulates neuronal activity in S2. In allplots, responses during active discrimination ( y axes) are compared withresponses during passive stimulation (x axes). Diagonal lines indicate equal-ity between x and y axes. All comparisons are based on the responses of 108S2 neurons tested in both situations. Format is the same as in Figure 5,except that all quantities were computed from the responses to the basestimulus. a, The mean IRATE was significantly higher during active discrim-ination (p , 0.0002); note that higher values tend to fall above the x 5 y line.Circles correspond to 43 neurons with IRATE significantly different fromzero in at least one of the two conditions, and dots indicate nonsignificantneurons. Crosses indicate the mean uncertainty in the information values;they correspond to 61 average SD in each direction. b, Circles correspondto 19 neurons with IPSFP significantly different from zero in at least one ofthe two conditions, and dots indicate nonsignificant neurons. The meanIPSFP was not significantly different in the two conditions (p . 0.11). Crossescorrespond to 61 average SD in each direction. c, Trial-to-trial variabilityin the firing rate, quantified by ^s&, was significantly smaller during activediscrimination (p , 0.0062); note that small values, which correspond tohigher reliability, tend to fall below the x 5 y line. d, The mean amplitudeof the Fourier spectrum at the stimulus frequency (mean PS) did not changeacross conditions (p . 0.06).
Salinas et al. • Periodicity versus Firing Rate in S1 and S2 J. Neurosci., July 15, 2000, 20(14):5503–5515 5511

the same: collecting bursts rather than single spikes provided noadditional information about stimulus frequency. Optimizing indi-vidually the t of each neuron did not increase the informationsignificantly either. Hence, for aperiodic stimuli, clustering thespikes into bursts was just as efficient as ignoring the interspikeintervals altogether. For the few S2 neurons tested, there was nosignificant difference in the mean IAIBI values across conditions(periodic versus aperiodic), and these values were similar to thoseof IRATE (Fig. 7c, d, triangles).
Discrimination of periodic and aperiodic stimuli corresponds toslightly different tasks; in fact, the two types of stimuli can bedistinguished easily by human subjects. This means that at leastsome information about the temporal structure of the stimuli isreadily accessible perceptually. Therefore, these results cannotexclude the possibility that temporal information is used to con-struct the neural representation of stimulus frequency, even in theaperiodic condition. However, they provide two conclusions: first,that constructing a neural representation of stimulus frequencybased on the temporal patterns of spikes evoked during aperiodicstimulation would require read-out mechanisms more powerful
than simply identifying bursts of spikes in single cells, and second,that firing rate could provide a neural code for frequency commonto the two tasks and the two areas.
Covariations between neuronal andbehavioral responsesAs mentioned in the introductory remarks, earlier studies pointedout a close match between the discriminability of flutter frequen-cies and the observed variance in the phase at which spikes areevoked by periodic stimuli (Mountcastle et al., 1969; Recanzone etal., 1992). This relationship was only a theoretical possibility, be-cause the neurophysiological and psychophysical data that werecompared had been collected in different experiments. However, asimilar but direct comparison was possible using our data, becausethey were collected from behaving animals whose psychophysicalperformance was being monitored. If the periodicity of S1 spikes isimportant for frequency discrimination, then a subject should in-deed be more likely to discriminate correctly when S1 neuronshappen to fire spike trains with a highly periodic structure. This isthe crux of the following analysis. We compared neuronal andbehavioral responses on a trial-by-trial basis to try to detect anycovariations between them. The results below apply to responsescomputed from neuronal activity evoked during the comparisonstimulus. For the base stimulus, no significant effects were found forany quantity, which is not surprising considering the short-termmemory component of the task.
The main idea was to compare neuronal responses during cor-rect discriminations (hits) with responses during error trials. Be-cause errors were much less frequent than hits, responses obtainedfor different conditions, i.e., for different combinations of base andcomparison stimulus frequencies, had to be standardized andpooled, as described in Materials and Methods. In all data collec-tion runs, two types of trials were considered separately. In trials oftype 1, the frequency of the comparison stimulus was lower thanthe frequency of the base, and in trials of type 2, the frequency ofthe comparison was higher than the frequency of the base. Thus,for each run, two comparisons were made, one for each set of trialsof the same type. In both cases the mean standardized response inerror trials was compared with the mean standardized response inhit trials, and the significance of the difference was determined.Figure 8, a and c, illustrates this procedure for a single S1 neuron,and Figure 9, a and c, illustrates it for a single S2 neuron. Here Hand E indicate hit and error categories, respectively, and thesubscript indicates the type of trial. Each dot corresponds to asingle trial, and the horizontal bars indicate the means for hits anderrors in the corresponding categories. In both Figures, the differ-ence between panels a and c lies in the quantity considered as theresponse.
To detect systematic variations in periodic spike timing, wecomputed standardized versions of the PSFP amplitude, of PS, andof the amplitude of the power spectrum at twice the stimulusfrequency. These three quantities tend to increase the closer aspike train is to a perfectly periodic arrangement, so high valuesshould correspond to better likelihood for correct discrimination, ifperiodicity is related to performance. In most S1 and S2 cells, thesequantities were the same in hit and error trials, as illustrated inFigures 8c and 9c. We did find four S1 neurons for which the meanstandardized PS was significantly different for hit and error trials,but this number of neurons was not significantly different (p . 0.21)from that expected by chance under the null hypothesis that hit anderror responses come from the same distribution (among 238 S1neurons, 2.38 significant tests at the 0.01 level were expected bychance). In other words, the result was not significant. The samewas true for the three measures of periodicity, in both S1 and S2,and for type 1 and type 2 trials. The periodicity of spikes in singleneurons showed no detectable covariations with behavior.
This negative result, however, was obtained by testing the neu-rons one at a time, but if higher periodicity tends to produce betterperformance, then across the population, standardized responsesmight show a tendency to be larger in hit trials than in error trials.
Figure 7. Neuronal responses to periodic and aperiodic stimuli. The fourraster plots at the top show spike trains from an S1 neuron that was testedwith periodic (a) and aperiodic (b) stimuli at frequencies of 12 and 35 Hz,as indicated. Each set of responses includes 10 trials collected during activediscrimination. For a given stimulus frequency, the train of stimulationpulses was identical for all periodic trials but was different for all aperiodictrials. However, at a given mean frequency, the total number of pulsesdelivered was the same in both conditions. Long vertical lines indicatestimulus onset. In the periodic condition the neuron had IRATE 5 0.67 60.10 and IAIBI 5 1.44 6 0.10 bits; with aperiodic stimulation IRATE 50.70 6 0.10 and IAIBI 5 0.65 6 0.11 bits. IRATE (c) and IAIBI (d) werecomputed for 41 S1 and 30 S2 neurons tested with periodic and aperiodicstimuli. In both panels, circles and triangles correspond to S1 and S2neurons, respectively, with significant information in at least one of the twoconditions (periodic or aperiodic), and small dots indicate S1 and S2neurons that had nonsignificant values in the two conditions. Diagonal linesindicate equal values in the two axes. Crosses on the bottom right cornersindicate 61 average SD in each direction. IRATE did not change acrossconditions, in either area; data points in c are distributed symmetricallyaround the diagonal line. IAIBI was significantly larger with periodicstimulation; data points in d tend to fall below the diagonal. With aperi-odic pulses, IAIBI was similar to IRATE; the y-axis values in c and d aresimilar (see Results).
5512 J. Neurosci., July 15, 2000, 20(14):5503–5515 Salinas et al. • Periodicity versus Firing Rate in S1 and S2

Nevertheless, no such trend was observed. This is illustrated inFigures 8d and 9d. In these plots, each point corresponds to oneneuron. Each x coordinate is the difference between the mean of alltype 1 error trials and the mean of all type 1 hit trials, using thestandardized PS as a response, and the y coordinate is the samequantity but for type 2 trials. Observe that the clouds of points aresymmetric and centered at 0 in both directions. This is because, onaverage, differences between responses in hits and errors were notsignificantly different from zero and were not correlated acrosstypes of trials either: for the S1 population in Figure 8d, thecorrelation coefficient was practically zero (0.008, p , 0.9), and forthe S2 population in Figure 9d, the correlation coefficient was20.23, but it was not significantly different from zero (p . 0.025).Similar results were obtained when these tests were repeated usingthe standardized power at the PSFP or the standardized power attwice the stimulus frequency. No significant covariations betweenperiodicity and behavior could be detected in either area.
In contrast, the numbers of evoked spikes did show significantcovariations with behavioral performance. Figure 8a shows datafrom an S1 neuron with large differences between the means of the
H and E categories. This neuron had a positive slope of 1.17 6 0.12spikes. The significant difference between H1 and E1 means that atany given comparison frequency lower than the base, on average,the chances of observing an error were higher when the neuronfired more spikes than usual for the given comparison frequency.This association was not a rare event. Among 231 runs that had atleast five type 2 errors, we found 11 S1 neurons whose averagestandardized rates were significantly different in hit and error trials.This number may appear small, but with 231 samples the chancesof finding at least 11 significant values when no real differenceexists between two conditions is ,3 in 105 (binomial distributionwith p 5 0.01). Among the 219 runs with sufficient type 1 errors,only four neurons with significant differences were found, whichwas within the range expected by chance (p . 0.18), but there wasadditional evidence for the firing rate being related to behavior. Inthis case, a significant effect was observed across the population:the differences between standardized responses for hits and errorswere significantly anticorrelated across trial types. This is shown inFigure 8b. In this plot the cloud of points is not symmetric; itscorrelation coefficient is 20.42 (n 5 191, p , 0.0002). When aneuron fired, for instance, more spikes in incorrect versus correctdiscriminations in type 1 trials, it typically fired fewer spikes inincorrect versus correct discriminations of the opposite type. This
Figure 8. Single-trial covariations between behavioral responses and neu-ronal responses in S1. This analysis was based on the neuronal activityevoked by the comparison stimulus. a, Standardized firing rates (dots) for asingle S1 neuron are shown subdivided into four categories: hits (H1 ) anderrors (E1 ) when the frequency of the base stimulus was higher than thefrequency of the comparison stimulus (type 1 trials), and hits (H2 ) anderrors (E2 ) when the frequency of the comparison stimulus was higher thanthe frequency of the base (type 2 trials). Thick horizontal lines representmean values for each category. For this neuron, the mean values in errortrials were significantly different (p , 0.002) from the mean values in hittrials of the same type. This neuron had a positive slope of 1.17 6 0.12spikes. b, The standardized firing rate reveals a negative correlation be-tween error types in S1. Each point represents one of 191 S1 neurons withat least five errors of each type. For each neuron, the mean difference instandardized rate between errors and hits for type 2 trials (E2 2 H2 ) wascomputed and plotted versus the mean difference for type 1 trials (E1 2H1 ). The population shows a negative correlation between error types:Pearson’s linear correlation coefficient was 20.42 (p , 0.0002). Dotted linesindicate the origin. c, Standardized power at the stimulus frequency (PS) forthe neuron illustrated in a, with trials subdivided into the same fourhit /error categories. The differences in mean between hits and errors of thesame type were not significant, although this neuron had significant IPSFP(0.80 6 0.14 bits). d, The standardized PS shows no correlation betweenerror types in S1. The plot shows mean differences in standardized PSbetween errors and hits for type 2 versus type 1 trials for 184 S1 neurons.The correlation coefficient was practically zero (0.008, p . 0.9). Dotted linesindicate the origin.
Figure 9. Single-trial covariations between behavioral responses and neu-ronal responses in S2, based on the neuronal activity evoked by thecomparison stimulus. Same format as in Figure 8. a, Standardized firingrates (dots) for a single S2 neuron are shown subdivided into four catego-ries: hits (H1 ) and errors (E1 ) when the frequency of the base stimulus washigher than the frequency of the comparison stimulus (type 1 trials), andhits (H2 ) and errors (E2 ) when the frequency of the comparison stimuluswas higher than the frequency of the base (type 2 trials). Thick horizontallines represent mean values for each category. For this neuron, the meanvalues in error trials were significantly different (p , 0.0002) from the meanvalues in hit trials of the same type. b, The standardized firing rate revealsa negative correlation between error types in S2. Each point represents oneof 128 S2 neurons with at least five errors of each type. For each neuron, themean difference in standardized rate between errors and hits for type 2trials (E2 2 H2 ) was computed and plotted versus the mean difference fortype 1 trials (E1 2 H1 ). The population shows a negative correlationbetween error types: Pearson’s linear correlation coefficient was 20.52 (p ,0.0002). Dotted lines indicate the origin. c, Standardized power at thestimulus frequency (PS) for the neuron illustrated in a, with trials subdi-vided into the same four hit /error categories. The differences in meanbetween hits and errors of the same type were not significant. d, Meandifferences in standardized PS between errors and hits for type 2 versus type1 trials for 103 S2 neurons. There was a small, nonsignificant correlation of20.23 (p . 0.025). Dotted lines indicate the origin.
Salinas et al. • Periodicity versus Firing Rate in S1 and S2 J. Neurosci., July 15, 2000, 20(14):5503–5515 5513
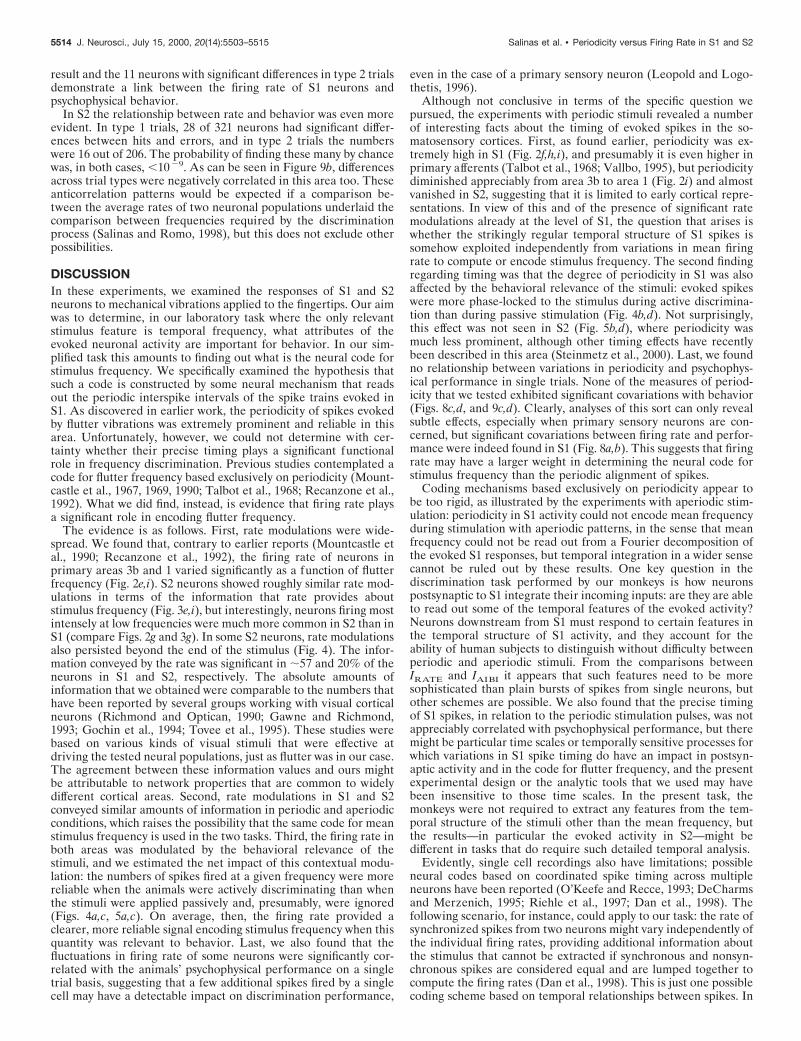
result and the 11 neurons with significant differences in type 2 trialsdemonstrate a link between the firing rate of S1 neurons andpsychophysical behavior.
In S2 the relationship between rate and behavior was even moreevident. In type 1 trials, 28 of 321 neurons had significant differ-ences between hits and errors, and in type 2 trials the numberswere 16 out of 206. The probability of finding these many by chancewas, in both cases, ,1029. As can be seen in Figure 9b, differencesacross trial types were negatively correlated in this area too. Theseanticorrelation patterns would be expected if a comparison be-tween the average rates of two neuronal populations underlaid thecomparison between frequencies required by the discriminationprocess (Salinas and Romo, 1998), but this does not exclude otherpossibilities.
DISCUSSIONIn these experiments, we examined the responses of S1 and S2neurons to mechanical vibrations applied to the fingertips. Our aimwas to determine, in our laboratory task where the only relevantstimulus feature is temporal frequency, what attributes of theevoked neuronal activity are important for behavior. In our sim-plified task this amounts to finding out what is the neural code forstimulus frequency. We specifically examined the hypothesis thatsuch a code is constructed by some neural mechanism that readsout the periodic interspike intervals of the spike trains evoked inS1. As discovered in earlier work, the periodicity of spikes evokedby flutter vibrations was extremely prominent and reliable in thisarea. Unfortunately, however, we could not determine with cer-tainty whether their precise timing plays a significant functionalrole in frequency discrimination. Previous studies contemplated acode for flutter frequency based exclusively on periodicity (Mount-castle et al., 1967, 1969, 1990; Talbot et al., 1968; Recanzone et al.,1992). What we did find, instead, is evidence that firing rate playsa significant role in encoding flutter frequency.
The evidence is as follows. First, rate modulations were wide-spread. We found that, contrary to earlier reports (Mountcastle etal., 1990; Recanzone et al., 1992), the firing rate of neurons inprimary areas 3b and 1 varied significantly as a function of flutterfrequency (Fig. 2e,i). S2 neurons showed roughly similar rate mod-ulations in terms of the information that rate provides aboutstimulus frequency (Fig. 3e,i), but interestingly, neurons firing mostintensely at low frequencies were much more common in S2 than inS1 (compare Figs. 2g and 3g). In some S2 neurons, rate modulationsalso persisted beyond the end of the stimulus (Fig. 4). The infor-mation conveyed by the rate was significant in ;57 and 20% of theneurons in S1 and S2, respectively. The absolute amounts ofinformation that we obtained were comparable to the numbers thathave been reported by several groups working with visual corticalneurons (Richmond and Optican, 1990; Gawne and Richmond,1993; Gochin et al., 1994; Tovee et al., 1995). These studies werebased on various kinds of visual stimuli that were effective atdriving the tested neural populations, just as flutter was in our case.The agreement between these information values and ours mightbe attributable to network properties that are common to widelydifferent cortical areas. Second, rate modulations in S1 and S2conveyed similar amounts of information in periodic and aperiodicconditions, which raises the possibility that the same code for meanstimulus frequency is used in the two tasks. Third, the firing rate inboth areas was modulated by the behavioral relevance of thestimuli, and we estimated the net impact of this contextual modu-lation: the numbers of spikes fired at a given frequency were morereliable when the animals were actively discriminating than whenthe stimuli were applied passively and, presumably, were ignored(Figs. 4a,c, 5a,c). On average, then, the firing rate provided aclearer, more reliable signal encoding stimulus frequency when thisquantity was relevant to behavior. Last, we also found that thefluctuations in firing rate of some neurons were significantly cor-related with the animals’ psychophysical performance on a singletrial basis, suggesting that a few additional spikes fired by a singlecell may have a detectable impact on discrimination performance,
even in the case of a primary sensory neuron (Leopold and Logo-thetis, 1996).
Although not conclusive in terms of the specific question wepursued, the experiments with periodic stimuli revealed a numberof interesting facts about the timing of evoked spikes in the so-matosensory cortices. First, as found earlier, periodicity was ex-tremely high in S1 (Fig. 2f,h,i), and presumably it is even higher inprimary afferents (Talbot et al., 1968; Vallbo, 1995), but periodicitydiminished appreciably from area 3b to area 1 (Fig. 2i) and almostvanished in S2, suggesting that it is limited to early cortical repre-sentations. In view of this and of the presence of significant ratemodulations already at the level of S1, the question that arises iswhether the strikingly regular temporal structure of S1 spikes issomehow exploited independently from variations in mean firingrate to compute or encode stimulus frequency. The second findingregarding timing was that the degree of periodicity in S1 was alsoaffected by the behavioral relevance of the stimuli: evoked spikeswere more phase-locked to the stimulus during active discrimina-tion than during passive stimulation (Fig. 4b,d). Not surprisingly,this effect was not seen in S2 (Fig. 5b,d), where periodicity wasmuch less prominent, although other timing effects have recentlybeen described in this area (Steinmetz et al., 2000). Last, we foundno relationship between variations in periodicity and psychophys-ical performance in single trials. None of the measures of period-icity that we tested exhibited significant covariations with behavior(Figs. 8c,d, and 9c,d). Clearly, analyses of this sort can only revealsubtle effects, especially when primary sensory neurons are con-cerned, but significant covariations between firing rate and perfor-mance were indeed found in S1 (Fig. 8a,b). This suggests that firingrate may have a larger weight in determining the neural code forstimulus frequency than the periodic alignment of spikes.
Coding mechanisms based exclusively on periodicity appear tobe too rigid, as illustrated by the experiments with aperiodic stim-ulation: periodicity in S1 activity could not encode mean frequencyduring stimulation with aperiodic patterns, in the sense that meanfrequency could not be read out from a Fourier decomposition ofthe evoked S1 responses, but temporal integration in a wider sensecannot be ruled out by these results. One key question in thediscrimination task performed by our monkeys is how neuronspostsynaptic to S1 integrate their incoming inputs: are they are ableto read out some of the temporal features of the evoked activity?Neurons downstream from S1 must respond to certain features inthe temporal structure of S1 activity, and they account for theability of human subjects to distinguish without difficulty betweenperiodic and aperiodic stimuli. From the comparisons betweenIRATE and IAIBI it appears that such features need to be moresophisticated than plain bursts of spikes from single neurons, butother schemes are possible. We also found that the precise timingof S1 spikes, in relation to the periodic stimulation pulses, was notappreciably correlated with psychophysical performance, but theremight be particular time scales or temporally sensitive processes forwhich variations in S1 spike timing do have an impact in postsyn-aptic activity and in the code for flutter frequency, and the presentexperimental design or the analytic tools that we used may havebeen insensitive to those time scales. In the present task, themonkeys were not required to extract any features from the tem-poral structure of the stimuli other than the mean frequency, butthe results—in particular the evoked activity in S2—might bedifferent in tasks that do require such detailed temporal analysis.
Evidently, single cell recordings also have limitations; possibleneural codes based on coordinated spike timing across multipleneurons have been reported (O’Keefe and Recce, 1993; DeCharmsand Merzenich, 1995; Riehle et al., 1997; Dan et al., 1998). Thefollowing scenario, for instance, could apply to our task: the rate ofsynchronized spikes from two neurons might vary independently ofthe individual firing rates, providing additional information aboutthe stimulus that cannot be extracted if synchronous and nonsyn-chronous spikes are considered equal and are lumped together tocompute the firing rates (Dan et al., 1998). This is just one possiblecoding scheme based on temporal relationships between spikes. In
5514 J. Neurosci., July 15, 2000, 20(14):5503–5515 Salinas et al. • Periodicity versus Firing Rate in S1 and S2

general, these codes may be subtle, and testing whether they havea functional impact may be difficult. Even if they are present,neurons may or may not combine them with firing rate modulationsto encode messages efficiently. To get a better understanding ofneural coding in the cortex, what needs to be assessed is theeffective contribution of all of these mechanisms to behavior.
REFERENCESAbbott LF, Dayan P (1999) The effect of correlated activity on the accu-
racy of a population code. Neural Comput 11:91–101.Abbott LF, Rolls ET, Tovee MJ (1996) Representational capacity of face
coding in monkeys. Cereb Cortex 6:498–505.Ahissar E (1998) Temporal-code to rate-code conversion by neuronal
phase-locked loops. Neural Comput 10:597–650.Ahissar E, Vaadia E (1990) Oscillatory activity of single units in a somato-
sensory cortex of an awake monkey and their possible role in textureanalysis. Proc Natl Acad Sci USA 87:8935–8939.
Cariani PA, Delgutte B (1996) Neural correlates of the pitch of complextones. I. Pitch and pitch salience. J Neurophysiol 76:1698–1716.
Chubbuck JK (1966) Small motion biological stimulator. Appl Digest5:1319–1341.
Cover TM, Thomas JA (1991) Elements of information theory. New York:Wiley.
Dan Y, Alonso JM, Usrey WM, Reid RC (1998) Coding of visual infor-mation by precisely correlated spikes in the lateral geniculate nucleus.Nat Neurosci 1:501–507.
DeCharms RC, Merzenich MM (1995) Primary cortical representation ofsounds by the coordination of action potential timing. Nature381:610–613.
Efron B (1982) The jacknife, the bootstrap and other resampling plans.Philadelphia: Society for Industrial and Applied Mathematics.
Fitzgerald PJ, Lane JW, Yoshioka T, Nakama T, Hsiao SS (1999) Multi-digit receptive field structures and orientation tuning properties of neu-rons in SII cortex of the awake monkey. Soc Neurosci Abstr 25:1684.
Gardner EP, Palmer CI, Hamalainen HA, Warren S (1992) Simulation ofmotion on the skin. V. Effect of stimulus temporal frequency on therepresentation of moving bar patterns in primary somatosensory cortexof monkeys. J Neurophysiol 67:37–63.
Gawne TJ, Richmond BJ (1993) How independent are the messages car-ried by adjacent inferior temporal neurons? J Neurosci 13:2758–2771.
Gochin PM, Colombo M, Dorfman GA, Gerstein GL, Gross CG (1994)Neural ensemble coding in inferior temporal cortex. J Neurophysiol71:2325–2337.
Hernandez A, Salinas E, Garcıa R, Romo R (1997) Discrimination in thesense of flutter: new psychophysical measurements in monkeys. J Neuro-sci 17:6391–6400.
Hsiao SS, Johnson KO, O’Shaughnessy DM (1993) Effects of selectiveattention of spatial form processing in monkey primary and secondarysomatosensory cortex. J Neurophysiol 70:444–447.
Jones EG (1975) Lamination and differential distribution of the thalamicafferents within the sensory-motor cortex of the squirrel monkeys.J Comp Neurol 160:167–204.
Jones EG (1983) Lack of collateral thalamocortical projection to fields ofthe first somatic sensory cortex in monkeys. Exp Brain Res 52:375–384.
LaMotte RH, Mountcastle VB (1975) The capacities of humans and mon-keys to discriminate between vibratory stimuli of different frequency andamplitude: a correlation between neural events and psychophysical mea-surements. J Neurophysiol 38:539–559.
LaMotte RH, Mountcastle VB (1979) Disorders in somesthesis followinglesions of parietal lobe. J Neurophysiol 42:400–419.
Leopold DA, Logothetis NK (1996) Activity changes in early visual cor-tex reflect monkeys’ percepts during binocular rivalry. Nature379:549–553.
McAdams CJ, Maunsell JHR (1999) Effects of attention on orientationtuning functions of single neurons in macaque cortical area V4. J Neu-rosci 19:431–441.
McLurkin JW, Optican LM, Richmond BJ, Gawne TJ (1991) Concurrentprocessing and complexity of temporally encoded neuronal messages invisual perception. Science 253:675–677.
Mountcastle VB, Talbot WH, Darian-Smith I, Kornhuber HH (1967)Neural basis of the sense of flutter-vibration. Science 155:597–600.
Mountcastle VB, Talbot WH, Sakata H, Hyvarinen J (1969) Corticalneuronal mechanisms in flutter-vibration studied in unanesthetized mon-keys. Neuronal periodicity and frequency discrimination. J Neurophysiol32:453–484.
Mountcastle VB, Steinmetz MA, Romo R (1990) Frequency discrimina-tion in the sense of flutter: psychophysical measurements correlated withpostcentral events in behaving monkeys. J Neurosci 10:3032–3044.
Mountcastle VB, Reitboek HJ, Poggio GF, Steinmetz MA (1991) Adap-tation of the Reitboek method of multiple microelectrode recording tothe neocortex of the waking monkey. J Neurosci Methods 36:77–84.
Ochoa J, Torebjork E (1983) Sensations evoked by intraneural micro-stimulation of single mechanoreceptor units innervating the human hand.J Physiol (Lond) 342:633–654.
O’Keefe J, Recce ML (1993) Phase relationship between hippocampalplace units and the EEG theta rhythm. Hippocampus 3:317–330.
Pons TP, Garraghty PE, Friedman DP, Mishkin M (1987) Physiologicalevidence for serial processing in somatosensory cortex. Science237:417–420.
Pons TP, Garraghty PE, Mishkin M (1992) Serial and parallel processingof tactal information in somatosensory cortex of rhesus monkeys. J Neu-rophysiol 68:518–527.
Press WH, Teukolsky SA, Vetterling WT, Flannery BP (1992) Numericalrecipes in C. Cambridge: Cambridge UP.
Recanzone GH, Merzenich MM, Schreiner CE (1992) Changes in thedistributed temporal response properties of S1 cortical neurons reflectimprovements in performance on a temporally based tactile discrimina-tion task. J Neurophysiol 67:1071–1091.
Richmond BJ, Optican L (1990) Temporal encoding of two-dimensionalpatterns by single units in primate primary visual cortex. II. Informationtransmission. J Neurophysiol 64:370–380.
Riehle A, Grun S, Diesemann M, Aertsen A (1997) Spike synchronizationand rate modulation differentially involved in motor cortical function.Science 278:1950–1953.
Romo R, Merchant H, Zainos A, Hernandez A (1996) Categorization ofsomaesthetic stimuli: sensorimotor performance and neuronal activity inprimary somatic sensory cortex of awake monkeys. NeuroReport7:1273–1279.
Romo R, Hernandez A, Zainos A, Salinas E (1998) Somatosensory dis-crimination based on cortical microstimulation. Nature 392:387–390.
Romo R, Brody CD, Hernandez A, Lemus L (1999) Neuronal correlatesof parametric working memory in the prefrontal cortex. Nature399:470–473.
Salinas E, Romo R (1998) Conversion of sensory signals into motor com-mands in primary motor cortex. J Neurosci 18:499–511.
Shadlen MN, Newsome WT (1994) Noise, neural codes and cortical or-ganization. Curr Opin Neurobiol 4:569–579.
Shadlen MN, Newsome WT (1998) The variable discharge of corticalneurons: implications for connectivity, computation and informationcoding. J Neurosci 18:3870–3896.
Siegel S, Castellan NJ (1988) Nonparametric statistics for the behavioralsciences. New York: McGraw-Hill.
Sinclair RJ, Burton H (1991) Neuronal activity in the primary somatosen-sory cortex in monkeys (Macaca mulatta) during active touch of texturedsurface gratings: responses to groove width, applied force, and velocity ofmotion. J Neurophysiol 66:153–169.
Sinclair RJ, Burton H (1993) Neuronal activity in the second somatosen-sory cortex of monkeys (Macaca mulatta) during active touch of gratings.J Neurophysiol 70:331–350.
Singer W, Gray CM (1995) Visual feature integration and the temporalcorrelation hypothesis. Annu Rev Neurosci 18:555–586.
Softky WR, Koch C (1993) The highly irregular firing of cortical cells isinconsistent with temporal integration of random EPSPs. J Neurosci13:334–350.
Steinmetz PN, Roy A, Fitzgerald PJ, Hsiao SS, Johnson KO, Niebur E(2000) Attention modulates synchronized neuronal firing in primatesomatosensory cortex. Nature 404:187–190.
Talbot WH, Darian-Smith I, Kornhuber HH, Mountcastle VB (1968) Thesense of flutter vibration: comparison of the human capacity with re-sponse patterns of mechanoreceptive afferents from the monkey hand.J Neurophysiol 31:301–334.
Tovee MJ, Rolls ET, Treves A, Bellis RP (1995) Information encodingand the responses of single neurons in the primate temporal visual cortex.J Neurophysiol 70:640–654.
Treue S, Martınez-Trujillo JC (1999) Feature-based attention influencesmotion processing gain in macaque visual cortex. Nature 399:575–579.
Treves A, Panzeri S (1995) The upward bias in measures of informationderived from limited data samples. Neural Comput 7:399–407.
Vallbo AB (1995) Single-afferent neurons and somatic sensation in hu-mans. In: The cognitive neurosciences (Gazzaniga MS, ed), pp 237–252.Cambridge, MA: MIT.
Wickersham I, Groh JM (1998) Electrically evoking sensory experience.Curr Biol 8:R412–R414.
Zainos A, Merchant H, Hernandez A, Salinas E, Romo R (1997) Role ofprimary somatic sensory cortex in the categorization of tactile stimuli:effects of lesions. Exp Brain Res 115:357–360.
Zhou YD, Fuster JM (1996) Mnemonic neuronal activity in somatosen-sory cortex. Proc Natl Acad Sci USA 93:10533–10537.
Zhou YD, Fuster JM (1997) Neuronal activity of somatosensory cortex ina cross-modal (visuo-haptic) memory task. Exp Brain Res 116:551–555.
Zohary E, Shadlen MN, Newsome WT (1994) Correlated neuronal dis-charge rate and its implications for psychophysical performance. Nature370:140–143.
Salinas et al. • Periodicity versus Firing Rate in S1 and S2 J. Neurosci., July 15, 2000, 20(14):5503–5515 5515
Copyright © 2022 FDOKUMEN