ADSORPTION OF TERNARY METAL SYSTEM ONTO SAWDUST OF LOCUST BEAN TREE ( Parkia biglobosa):EQUILIBRIUM,...
22
International Journal of Scientific & Engineering Research, Volume 4, Issue 6, June-2013 1275 ISSN 2229-5518 IJSER © 2013 http://www.ijser.org Adsorption Of Ternary Metal System Onto The Sawdust Of Locust Bean Tree (Parkia biglobosa): Equilibrium, Kinetics And Thermodynamics Studies. Giwa, A. A., Olajire, A. A., Oladipo, M. A., Bello, M. O. and * Bello I. A. Department of Pure and Applied Chemistry, Ladoke Akintola University of Technology, Ogbomoso – Nigeria ABSTRACT The use of raw sawdust, RSD, of locust bean tree (Parkia biglobosa), a low-cost, locally available agroforestry waste as an adsorbent for removing a ternary mixture of heavy metals comprising of copper, lead and nickel (TMS) from aqueous solution was examined. Equilibrium data obtained from batch adsorption experiments were analysed with Langmuir, Freundlich and Temkin isotherm models, with Langmuir equation giving the best fit to the data. The effect of contact time, initial concentration and pH of the solution and dose of RSD on the efficiency of the sorption process was also evaluated. The kinetics of the sorption was studied using different models; it was observed to have followed pseudo–second order model with high R 2 values and close agreement between the theoretical and experimental values of qe for all initial TMS concentrations studied. The thermodynamic parameters of the adsorption showed that the process was feasible, exothermic and accompanied with increased randomness Key words : Ternary metal system, adsorption, kinetics, isotherm, thermodynamics, Parkia biglobosa. *Author for all Correspondences, E-mail<[email protected]> Tel: +2348035920250 IJSER
Transcript of ADSORPTION OF TERNARY METAL SYSTEM ONTO SAWDUST OF LOCUST BEAN TREE ( Parkia biglobosa):EQUILIBRIUM,...

International Journal of Scientific & Engineering Research, Volume 4, Issue 6, June-2013 1275 ISSN 2229-5518
IJSER © 2013 http://www.ijser.org
Adsorption Of Ternary Metal System Onto The Sawdust Of Locust Bean Tree (Parkia biglobosa): Equilibrium, Kinetics And Thermodynamics Studies.
Giwa, A. A., Olajire, A. A., Oladipo, M. A., Bello, M. O. and *Bello I. A.
Department of Pure and Applied Chemistry, Ladoke Akintola University of Technology,
Ogbomoso – Nigeria
ABSTRACT
The use of raw sawdust, RSD, of locust bean tree (Parkia biglobosa), a low-cost, locally available agroforestry waste as an adsorbent for
removing a ternary mixture of heavy metals comprising of copper, lead and nickel (TMS) from aqueous solution was examined. Equilibrium data
obtained from batch adsorption experiments were analysed with Langmuir, Freundlich and Temkin isotherm models, with Langmuir equation giving the
best fit to the data. The effect of contact time, initial concentration and pH of the solution and dose of RSD on the efficiency of the sorption process was
also evaluated. The kinetics of the sorption was studied using different models; it was observed to have followed pseudo–second order model with high
R2 values and close agreement between the theoretical and experimental values of qe for all initial TMS concentrations studied. The thermodynamic
parameters of the adsorption showed that the process was feasible, exothermic and accompanied with increased randomness
Key words : Ternary metal system, adsorption, kinetics, isotherm, thermodynamics, Parkia biglobosa. *Author for all Correspondences, E-mail<[email protected]>
Tel: +2348035920250
IJSER

International Journal of Scientific & Engineering Research, Volume 4, Issue 6, June-2013 1276 ISSN 2229-5518
IJSER © 2013 http://www.ijser.org
INTRODUCTION
Though heavy metals are natural components of
the environment, their levels have undergone dramatic
increase with increasing population and sophistication in
human activities, especially since the beginning of
industrial revolution (1). At least twenty metals have been
classified as toxic, and 50% of these are being emitted into
the environment in amounts that pose risks to human
health (2). These toxic metals constitute a serious threat to
the well-being of man, wildlife and even plants if present
above certain threshold levels (3). Excessive release of the
metals into the environment due to industrialization and
urbanization has posed a great problem all over the world.
They have been observed to be the cause of serious illnesses
affecting vital organs and tissues of the human body (4, 5
and 6).
A major source of heavy metals in the environment
is the discharge of untreated industrial effluents from
industries such as paints, plating, fertilizers, mining, textile
dyeing and processing, automobile manufacturing and
metal processing (7, 8 and 9). Some heavy metals, being
constituents of pesticides, paints and fertilizers, are
introduced into the environment through the application of
these products. Besides their toxicity, heavy metals are of
utmost concern because, unlike organic pollutants which
are mostly biodegradable, they do not degrade into non-
toxic end products. They persist in the environment and
even bioaccumulate in the food chain (10).
Cadmium, copper, zinc, iron, mercury and lead are
metals of serious concern according to the world health
organization. In fact, Lead together with mercury and
cadmium have been referred to as “ the big three” because
of their significant negative impact on the environment
(11).
Copper is an essential elements, it is important in the
physiological functions of living tissues and regulate many
biochemical processes when present in the trace
concentrations (12). Health conditions like nephritic
syndrome, copper intoxication and burn injuries have been
associated with high concentrations of copper. The
presence of high level of Cu(II) ions is of serious
toxicological concern, as it is known to deposit in brain,
skin, liver, pancreas and myocardium.
The increasing awareness about the hazardous
nature of the metals has generated serious concern to
government at various levels, pressure groups and
individual activists (13). Nigeria is not left out of this
serious concern, as the Federal Environmental Protection
Agency (FEPA) was established in 1989. FEPA at the
national level and SEPA (State environmental protection
Agency) in some states of the federation later
metamorphosed into full blown ministries of environment.
The increased level of awareness in both the public and
regulatory share led of awareness in both the public
regulatory sphere need to the need to improve the
treatment of industrial effluent, a major source of
environmental pollution.
Several conventional methods such as
coagulation/flocculation (14, 15), Oxidation process (16, 17)
reverse osmosis, chemical precipitations, ion exchange and
the use of activated charcoal (18) have being in use over the
years for the removal of toxic heavy metals from
wastewater . However, some of these technologies cannot
effect complete removal of the pollutants, or are too
expensive. There is therefore the need to develop more
effective and economical technologies for the removal of
IJSER

International Journal of Scientific & Engineering Research, Volume 4, Issue 6, June-2013 1277 ISSN 2229-5518
IJSER © 2013 http://www.ijser.org
heavy metals from effluents. This has led to the search for
non-conventional low-cost materials for this purpose.
The current trend is to investigate the possibility of
employing various agrowastes and biological materials
that are available in commercial quantities for wastewater
remediation by adsorption (19).This is a better alternative to
the conventional techniques not only because it is cheap to
process, but also because it is highly efficient and the
materials are readily and abundantly available.
Various agroforestry by-products in their raw and
modified forms have been studied; these include sugarcane
bagasse, rice husk, soybean hulls, waste tea leaves, peanut
shells and saw dust (20, 21). However, more work and
investigations are still required to be carried out on some
other locally available agricultural materials.
In this work, the adsorption property of chemically
untreated saw dust of locust bean tree (Parkia biglobosa), as a
low-cost and non-conventional adsorbent for the removal
of a mixture of copper, lead and nickel from aqueous
solution was studied. Though several works have been
done on the adsorption of single heavy metals from
aqueous solutions using agroforestry-based adsorbents,
not much work has been reported on the adsorption of
ternary heavy metal mixture, especially onto saw dust of
Parkia biglobosa, hence the significance of this study. This
work will also contribute to the search for low-cost
adsorbents and the possibility of utilizing various
agricultural and forestry by-products, which are in many
cases also pollution sources.
MATERIALS AND METHODS
Preparation of Adsorbent
A large quantity of Parkia biglobosa saw dust was
collectedd from local saw mills in Ogbomoso South-west
Nigeria. Debris and other relatively big foreign materials
were hand-picked from the husk collected, after which it
was extensively washed with tap water to remove soil and
dust. It was then thoroughly rinsed with distilled water,
drained and oven-dried at 105 0C for 15 h. The dried
material was then. ground, sieved and stored in air–tight
containers as raw saw dust (RSD).
Characterisation of the Adsorbent (RSD)
The adsorbent was characterized using FTIR
spectroscopy and Scanning Electron Microscopy (SEM).
The IR spectrum of RSD was recorded using Nicolet Avatar
FT-IR within the ranre 4000 cm-1 and 450 cm-1. The
morphology of the adsorbent prepared was examined on
Hitachi 2300 Scanning electron microscope. Samples were
coated with gold before being subjected to SEM analysis.
PREPARATION OF SORBATE
The adsorbate used in this study was a mixture of three
heavy metals: copper, lead and nickel. Stock solutions
(1000 mg/L) of the metals were prepared by dissolving an
accurately weighed analytical grade Copper nitrate, Lead
nitrate and Nickel nitrate in deionised water. Ternary metal
system (TMS) working solutions of different
concentrations, as required, were prepared by mixing
equal volumes of the stock solutions and accurately
diluting it with deionised water to give equal concentration
(in g/L) of the metal ions in the mixture.
BATCH ADSORPTION EXPERIMENTS
Batch adsorption experiments were carried out in
which 20cm3 of TMS of different concentrations was mixed
IJSER

International Journal of Scientific & Engineering Research, Volume 4, Issue 6, June-2013 1278 ISSN 2229-5518
IJSER © 2013 http://www.ijser.org
with a definite mass (0.05-0.70g) of RSD in 150cm3 plastics
bottles and were agitated in a horizontal mechanical shaker
(SM 101 by Surgafriend Medicals) at 120 rpm for pre-
determined periods of time and temperature at natural pH.
The mixture was filtered through whatman filter paper,
and filtrate analyzed for it residual metal content using
atomic absorption spectrophotometer. All experiments
were carried out in duplicate and mean values determine
were presented.
Mathematical quantitative evaluations were carried out by
using the following equations:
( )
)1(M
VCCq eo
e−
=
( )
)2(M
VCCq to
t−
=
)3(100(%) xC
CCR
o
to −=
where eq and tq are the amount of dye adsorbed (mg/g)
at equilibrium and at time t respectively; Co and Ct are the
initial concentration (at t = 0) and its concentration at time t
= t (mg/L); M is the mass RSD (g); V is the volume of TMS
(L) and R is percentage of metal removed.
Since adsorption is affected by physical and chemical
variables, the influence of initial metal concentration, RSD
dose, pH, temperature and contact time are investigated in
this study.
RESULTS AND DISCUSSION
Characterization of RSD
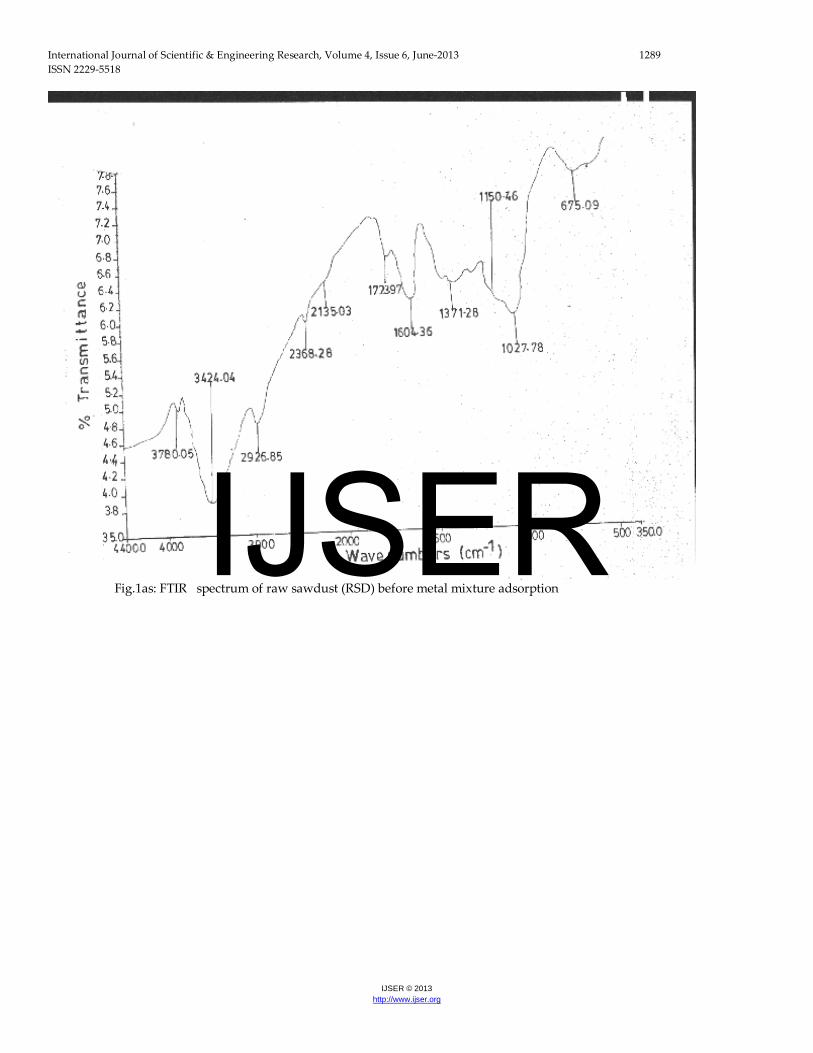
The FTIR spectrum of RSD before adsorption (Fig.
1a) displays a number of absorption peaks, indicating the
complex nature of the material. The spectrum revealed
diagnostic bands at 3424 cm–1 representing bonded – OH in
the oxygen-containing functional groups. The positions of
the C–H (2926 cm–1), aromatic C = C (1604 cm–1), C–O (1150
cm–1) and carbonyl (1723 cm–1) vibrations, contributed by
those in the structure of cellulose, hemicellulose and lignin,
which are common components of plant materials, are
indicated by the spectrum of RSD (22). Thus, the FTIR
spectrophotometric analysis indicates that the adsorbent
has potential adsorption sites as represented by functional
groups such as COOH, C = O, and C=C.
The FTIR spectrum of the adsorbent after heavy
uptake in the ternary metal system is shown in Figure 1b.
When compared with the FTIR spectrum of the adsorbent
before any adsorption (Fig. 1a), there were remarkable
differences in the position or occurrence of some diagnostic
bands. There was a slight shift in the position of –OH or –
NH band at 3424 cm-1 in RSD before adsorption to 3430 cm-1
after adsorption. A similar shift was also observed in the
C=O stretch from 1723 cm–1 to 1736 cm–1. These
IJSER
International Journal of Scientific & Engineering Research, Volume 4, Issue 6, June-2013 1279 ISSN 2229-5518
IJSER © 2013 http://www.ijser.org
observations showed that adsorption of the metal ions
really occurred.
The Scanning Electron Microscope (SEM) was used
to study the surface morphology of the adsorbent. The
surface textural structure of RSD is presented as scanning
electron micrographs observed at three different
magnifications (x 100, x 500 and × 1000) (Fig. 2). The SEM
images of RSD showed the irregular texture and porous
nature of the surface of the adsorbent (Fig. 2). Its apparent
rough surface is a pointer to high surface area (23), which
enhances adsorption.
Metal initial concentration and Contact time effects
The effect of contact time on the amount of Cu2+, Pb2+ and
Ni2+ adsorbed onto RSD was studied using three different
initial concentrations ( 5, 20 and 50 mg/L) so as to optimize
the adsorption time and to study the kinetics of the
sorption process. A RSD dose of 0.25 g was added to 20 mL
solution of the different concentrations of TMS at a
temperature of 30 oC. Adsorption process was allowed to
take place for a contact time of 3 h .
As contact time increases, the concentration of the
three metals in the solution decreased rapidly at the
beginning and later slows down until it remained constant
at about 45 - 120 minutes, depending on the concentration
of the metals. This indicates that the removal of the metals
by RSD was very rapid at the beginning (Fig. 3). In fact, in
all the initial concentrations used, and for all the metals,
over 70% removal was achieved within the first 10 min
(figure not shown). A contact time of 2 h was then taken as
equilibrium time. The initial rapid phase may be due to the
large number of vacant sites available at the initial period of
the sorption (24). The amount of each metal adsorbed
per unit mass of RSD also increased with increasing initial
concentration of the metal ions. For example, the amount of
Cu2+ removed at 40 minutes contact jumped from 0.38
mg/g at the initial concentration of 5 mg/L to 1.48 mg/g and
3.17 mg/g, at the initial concentrations of 20 and 50 mg/L
respectively. This may be because an increase in initial
concentration enhances the interaction between the ions
and the surface of the adsorbent (25). This however, leads
to a corresponding reduction in the percentage removal of
the metal ion (96.8, 88.9 and 76.6 % respectively). The same
trend was also observed for the sorption of nickel.
Similar observation of a decrease in percentage
removal with increasing initial concentration of sorbate,
even though the amount adsorbed increased was reported
in many works (26, 27). Removal efficiency ( R ) was higher
for low concentration because of availability of unoccupied
binding sites on the adsorbent. R decreased with increasing
concentration because of nearly complete coverage of the
binding sites at high metal concentrations.
However, lead was the most preferred for
adsorption onto RSD of the three metals. For example, at
the equilibrium time of 2 h, the adsorption capacities of the
metals were 3.37, 3.91 and 1.34 mg/g for Cu, Pb and Ni
respectively; indicating that Pb > Cu > Ni (Fig. 3).
EFFECT OF RSD DOSE
Adsorbent dose is an important parameter in any
adsorption process as it determines adsorption capacity at a
given initial sorbate concentration. The effect of RSD dose
on the adsorption of Cu (II), Pb (II) and Ni (II) ions was
studied by varying the quantity of the adsorbent from 0.05
g to 0.70 g in 20 mL of 30 mg/L solution of TMS. while
IJSER
International Journal of Scientific & Engineering Research, Volume 4, Issue 6, June-2013 1280 ISSN 2229-5518
IJSER © 2013 http://www.ijser.org
keeping other parameters (contact time, agitation speed,
particle size, pH temperature) constant.
The results show that the adsorption capacity of
RSD decreased with increasing adsorbent concentration.
The adsorption capacity of RSD for copper ions in the
mixture decreased from 3.75 to 0.49 mg/g with an increase
in the adsorbent dose from 0.05 to 0.4 g (Fig. 4). Similar
observations were also made in the adsorption of Pb (II)
and Ni (II) ions. However, the removal efficiency, R, of the
adsorbent generally improved with increasing dose. This
can be attributed to the increase in the adsorbent pore
surface areas and availability of more adsorption sites with
increasing mass of adsorbent (26, 28).
The increase in removal efficiency with increasing
adsorbent concentration was rapid at low dosage but
gradually falls and describes a typical saturation curve.
This is in line with Langmuir hypothesis of increasing
competition among adsorbent particles per unit volume (28,
29, 30).
Effect of pH
The initial pH of a solution is a very important
factor in an adsorption process (31). This is because a
change in pH affects the nature and characteristics of both
the adsorbent and the species of the adsorbate present,
which eventually leads to a change in the adsorption (32,
33, 34).
In this work the effect of the initial pH of TMS on its
adsorption by RSD was investigated over a range of pH
values of 1.8 – 7.2 at the initial dye concentration of 30
mg/L. Change in the pH of the dye solution was effected
using dilute NaOH and HCl solutions as appropriate.
Figure 5 shows the effect of pH of TMS on the adsorption of
the constituent metal ions. There was increase in the
adsorption capacity of RSD for the three metal ions in TMS
with increasing pH until a value of 3.7 for copper and
nickel, and 2.7 for lead. There was only a slight variation in
the adsorption of copper in the pH range 3.7 – 7.2, with the
highest sorption observed at pH 5.6. For lead, 100%
sorption (2.4 mg/g) was observed at a pH range of 3.7 – 7.2.
There was, however, a drastic increase in adsorption
capacity of RSD for lead from 0.64 to 2.35 mg/g (> 200%
rise) with a change in pH from1.8 to 2.7. Similarly, a general
increase in adsorption capacity was also observed in the
adsorption of nickel from TMS. At acidic pH values the
presence of H+ ions in the system makes the surface of the
adsorbent to acquire positive charge, which then repels the
cations electrostatically (35). The increase in adsorption
with rising pH in the acidic region can therefore be
attributed to the decreasing competition between the heavy
metal cations and H+ ions for the active sites on RSD (36).
Increase in pH leads to a decrease in the amount of H+ ions
on the surface of the adsorbent thereby reducing the
repulsion between the positive surface charge and the
cations of the heavy metals (37).
ADSORPTION ISOTHERMS
An adsorption isotherm model gives the
equilibrium relationship between the sorbate in the fluid
phase (solution) and the sorbate sorbed on the sorbent at
constant temperature.(38, 39). They are very useful for
obtaining the adsorption capacity so as to facilitate the
evaluation of the feasibility of the adsorption process for a
given application and for selection of the most appropriate
sorbent at the optimum experimental conditions (38, 40). It
is a factor which is important in optimizing the use of
adsorbents (25, 32)
In this work, adsorption isotherms were carried out
at initial concentrations of 5-60 mg/L. The Langmuir,
Freundlich and Temkin isotherm models were employed
to interprete the sorption process in order to understand
IJSER

International Journal of Scientific & Engineering Research, Volume 4, Issue 6, June-2013 1281 ISSN 2229-5518
IJSER © 2013 http://www.ijser.org
the mechanism of adsorption of Pb (II) and Ni (II) ions by
RSD.
The Freundlich isotherm is an empirical model which
indicates the surface heterogeneity of the adsorbent. The
equation is given as (41, 42):
nefe CKq /1= -----------------------------------------
--------------(4)
The linear form of the equation is:
efe cn
Kq log1loglog += --------------------------
--------------(5)
where qe is the amount of sorbate adsorbed at equilibrium
(mg/g); Kf (L/g) and n are Freundlich constants which
indicate the adsorption capacity of the adsorbent and
adsorption intensity, respectively (43) , ce is the equilibrium
concentration of sorbate in the solution (mg/dm3)
A plot of log qe versus log ce gives a straight line of
slope 1/n and intercept log Kf from which n and Kf can be
evaluated.
If 1/n < 1, then the adsorption is favorable and the
adsorption capacity increases with the occurrence of new
adsorption sites. But if 1/n > 1, the adsorption bond
becomes weak and unfavorable adsorption takes place,
leading to a decrease in adsorption capacity (42). The
Langmuir isotherm equation is given as ( 44, 45):
ea
eam
ckckq
qe+
=1
----------------------------------------
-------------------(6)
where qe is the amount of dye adsorbed per unit mass at
equilibrium(mg/g); qm is the maximum possible amount of
dye that can be adsorbed per unit mass of adsorbent
(mg/g); ce is concentration of sorbate in the solution at
equilibrium (mg/dm3); ka is the sorption equilibrium
constant.
The linearised form of equation (6) is
m
e
mae
e
qc
qkqc
+=1
------------
-----------(7)
A plot of e
e
qC
versus ce gives a straight line, with a
slope of mq
1 and intercept
ma qk1
.
The essential characteristics of Langmuir isotherm can be
expressed in terms of a dimensionless constant KR, the
separation factor or equilibrium parameter, which is
defined as:
oaR CK
K+
=1
1 --------------------------------------
----------(8)
where KR is dimensionless separation factor; Ka is Langmuir
constant (dm3 /mg); Co is the initial concentration of sorbate
(mg/dm3). The shape of the isotherm is linear if KR = 1, it is
irreversible if KR < 0, unfavourable if KR > 1 and favourable
if 0 < KR < 1 (46, 47).
IJSER

International Journal of Scientific & Engineering Research, Volume 4, Issue 6, June-2013 1282 ISSN 2229-5518
IJSER © 2013 http://www.ijser.org
The Temkin isotherm model is given by the following
equation (48, 49):
ecbaq ln+= ---------------------------------------------
-----------(9)
where q is the amount of adsorbate adsorbed per unit
weight of adsorbent; Ce is the concentration of adsorbate in
solution at equilibrium (mg/dm3); a is a constant related to
adsorption capacity; b is a constant related to adsorption
intensity
A plot of q versus ln Ce gives a straight line from
which the intercept (a) and the slope (b) can be evaluated.
Temkin isotherm assumes that the more energetic
adsorption sites are occupied first, and that the adsorption
process is chemisorption i.e. the particles of the adsorbate
get attached to the adsorbent through valent bond
formation (42).
Parameters obtained from the linear plots of the three
isotherm models as given by equations 5, 7 and 9 are
presented in Table 1. From the correlation coefficient, R2,
values Langmuir seems to give the best fit. The maximum
monolayer coverage, qm , is the appropriate parameter to
consider when assessing the capacity of any adsorbent (40).
The order of qm of RSD for the metals is: Pb (4.17 mg/g) >
Cu (3.73 mg/g) > Ni (1.44 mg/g). This indicates that RSD has
higher affinity for Pb (II) ions than for Cu (II) and Ni (II)
ions present together in an aqueous system.
Plots of KR , a dimensionless separation factor,
which is a characteristic of Langmuir isotherm model,
against the initial concentration of metals in TMS is
presented in Figure 6. KR values obtained for Cu (II) and
Ni (II) ions fall between 0 and 1, indicating favourable
adsorption (47).
The Kf and n obtained from the linear plots of Freundlich
isotherm are given on Table 1. The values of 1/n being less 1
may imply that there is an element of heterogeneity in the
sorption process, especially for Cu (II) and Ni (II) ions. The
values of Freundlich constant, Kf , obtained were 1.22, 3.41
and 0.69 for Cu, Pb and Ni respectively.. Kf is an empirical
constant which indicates the sorption capacity of the
sorbent.
The Temkin parameters, bT and KT were evaluated and
presented on Table 1.
ADSORPTION KINETICS
To investigate the mechanism of the adsorption
process, three rate equations and an intraparticle diffusion
model by Webber-Morris were employed to test the
experimental data. The kinetic models used were the
Largergren pseudo-first order, the pseudo-second order
and the Elovich models. The applicability of the models
were ascertained by comparing the plots’ goodness-of-fit
tests using the regression coefficients, R2 . The pseudo-first
order model was described by Largergren as (50);
tkqqq ete 303.2
log)log( 1−=− ---------- (10)
where qe (mg g–1) is the amount of dye adsorbed at
equilibrium, qt (mg g–1) is the amount of metal adsorbed at
time t and k1 (min–1) is the rate constant of pseudo-first
order adsorption. The Largergren first order rate constant
(k1) and qe determined from the mode l for the metals, and
IJSER

International Journal of Scientific & Engineering Research, Volume 4, Issue 6, June-2013 1283 ISSN 2229-5518
IJSER © 2013 http://www.ijser.org
their respective coefficients of correlation, R2,are shown in
Table 2. The experimental qe values did not agree at all with
the values calculated from this model, qe,mod (Table 2). This,
therefore, shows that the adsorption of TMS onto RSD does
not follow a first order kinetics.
The pseudo-second order model gives the best description
of the mechanism of TMS adsorption onto RSD. Apart from
its having the highest R2 for the three metals, the adsorption
capacities calculated from this model was very close to the
values obtained experimentally (Table 2). The pseudo-
second order rate constant, k2 obtained for the metals was
of the order Pb (0.74 g/mg.min) > Cu (0.17 g/mg.min) > Ni
(0.05 g/mg.min). The pseudo-second initial rate constant
obtained from the model revealed a very low value for
sorption of nickei in TMS.
The linear plots of Elovich equation for the three
metal ions have relatively high correlation coefficients
(Table 2). The Elovich model also can be said to be good for
describing the sorption of TMS onto RSD. The Elovich
initial adsorption rate constant, α, for the adsorption of
copper and lead are high, while the value was low for
nickel (table 2).
The mechanism of the rate-limiting step in this
sorption process is further investigated by fitting the
experimental data in intraparticle diffusion plot. When the
intraparticle mass transfer resistance is the rate-limiting
step, the sorption process is said to be particle diffusion
controlled (51). Several equations have been used to model
the intraparticle diffusion.
According to Weber and Morris (52), a plot of
sorption capacity at a given time, qt , versus √t should be a
straight line if intraparticle diffusion is involved; and if it is
the only rate-determining factor, the line passes through the
origin. This is from the equation:
qt = Kd t0.5 (11)
Where Kd is the intraparticle diffusion rate constant.
However, if the plot has an intercept (i.e. does not
pass through the origin), it shows that intra-particle
diffusion may not be the only factor limiting the rate of the
sorption process (53, 54). Poots et al., (53), however,
proposed that during the early stages of sorption, some
boundary layer resistance was involved. The equation was
then modified as (55, 51) :
qt = Kd t0.5 + X1 (12)
where X1 depicts the boundary layer thickness (55).
Kd and X1 can be obtained from the slope and intercept
respectively.
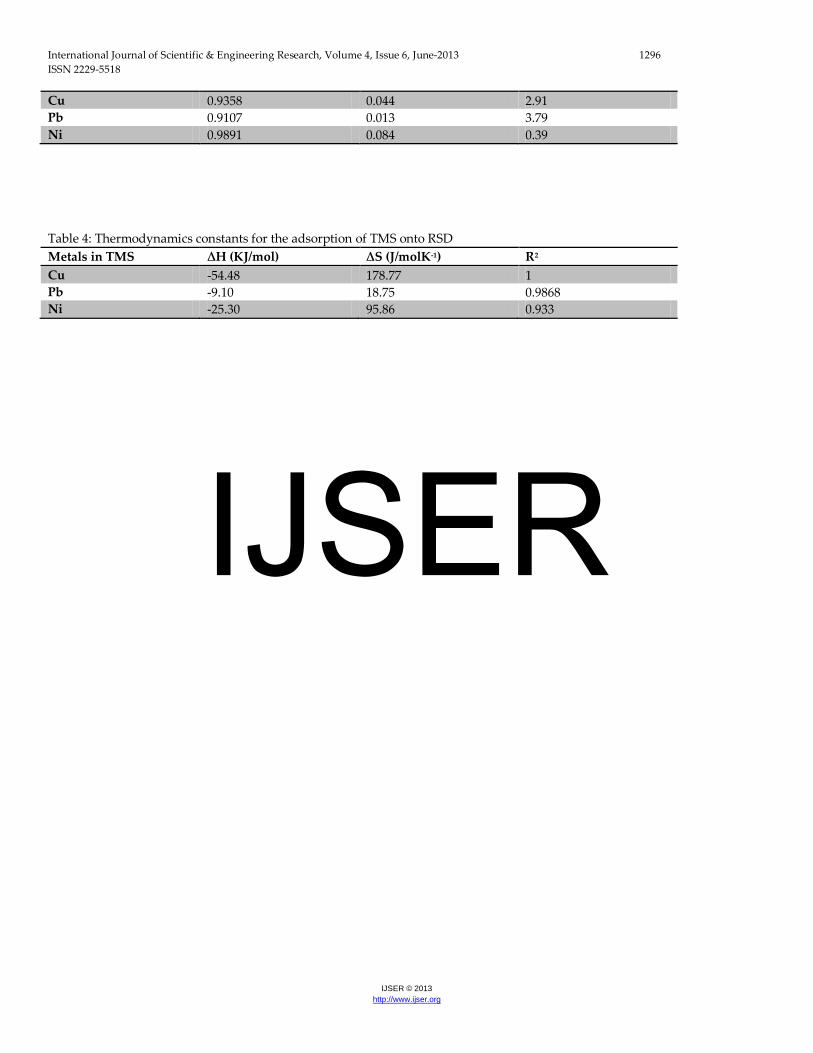
The correlation coefficients obtained from the plots
were, 0.9107 – 0.9891 (0. Table 3). However, the straight
lines do not pass through the origin i.e. the intercepts > 0
(Fig. 7). This deviation of the lines from the origin indicates
that intra-particle diffusion may be a factor in the sorption
process, but it is not the only controlling step (56). The
intercept and the two-phase nature of the plot suggest that
surface sorption is also an important factor in the sorption
process, as indicated by the presence of boundary layer
effect.
The first phase of the bilinear plot is attributable to
boundary layer diffusion. Similar trend was reported in the
literature (49, 57, 58). The second linear portion (phase II)
indicates the micropore diffusion (59). The larger the
intercept, the greater is the contribution of the surface
sorption (boundary layer resistance) in the rate–limiting
step (57). Both Kid and Xi have direct relationship with the
initial concentration of the metal solution. So, the higher the
initial concentration, the greater is the effect of boundary
layer and its contribution on the rate determining step.
IJSER

International Journal of Scientific & Engineering Research, Volume 4, Issue 6, June-2013 1284 ISSN 2229-5518
IJSER © 2013 http://www.ijser.org
Effect of temperature/ Thermodynamics
Another way of elucidating sorption mechanism of
adsorbate-adsorbent system is to study the effect of
temperatue of the adsorbate system on the adsorption
process so as to evaluate the thermodynamic parameters.
This is with a view to ascertain the spontaneity of the
sorption process. The thermodynamic parameters like
Gibb’s free energy change, ∆Go (KJ∕mol),the enthalpy
change, ∆Ho (KJ/mol) and entropy change, ∆SO(J/mol/K) are
then calculated (60, 61). The Gibbs free energy, ∆Go, is the
fundamental criterion of spontaneity. A negative value of
∆Go establishes the feasibility of an adsorption process (62).
In this work, these parameters were obtained from the
following equations:
∆G = -RTln K ……………………………….. (26)
∆G = ∆H - T∆S ……………………………….(27)
where
∆S is the standard entropy change (J/mol/k)
∆H is the standard entropy change (J/mol)
T is the absolute temperature(K)
K is the equilibrium constant
∆H and ∆S were obtained from the intercept and slope of
the plot of ∆G against T respectively.
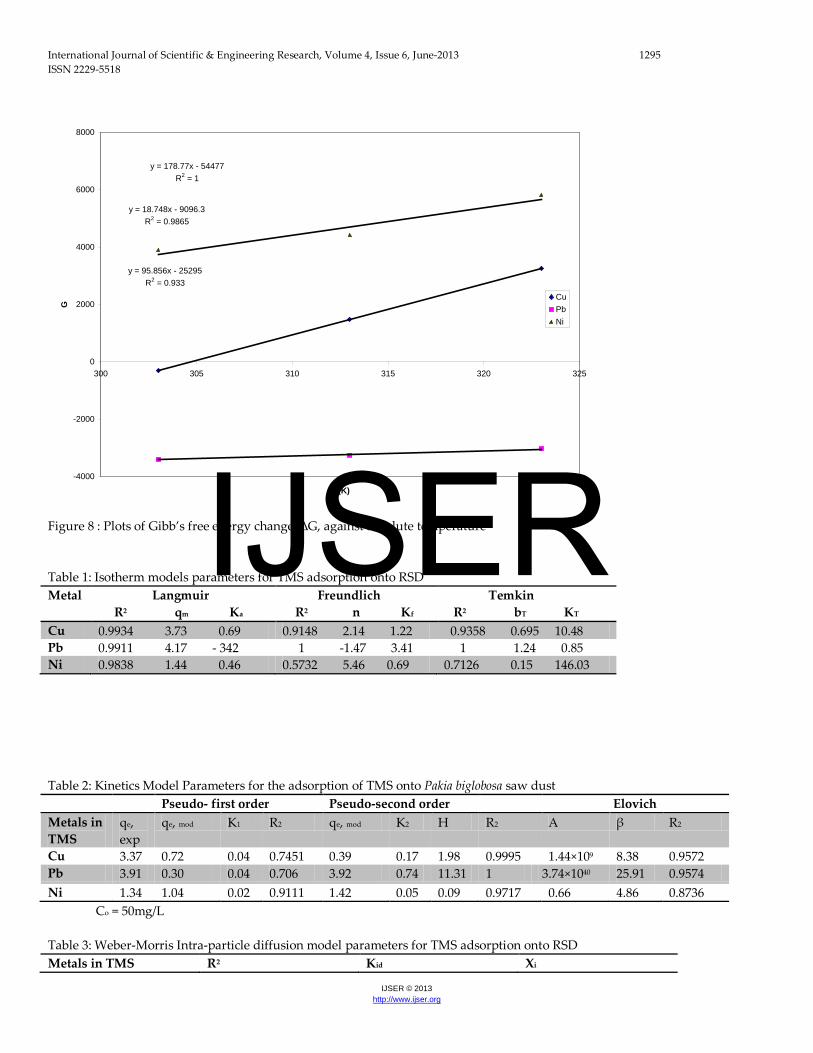
Figure 8 shows the linear plots of ∆G versus T for the
sorption of Cu (II), Pb (II) and Ni (II) ions in TMS. Table 4
shows the magnitudes of the thermodynamic parameters
(∆G, ∆H and ∆S) obtained at different temperatures (300-
328 K). The negative values of ∆G confirmed the feasibility
and spontaneity of the adsorption process at the
temperatures studied. The ∆H values obtained from the
plots for the three metals were negative, indicating that the
adsorption processes were exothermic (Table 4). The ∆S
values were, however, positive (Table 4). The positive
values of ∆S is an indication that randomness increased at
the RSD/TMS interface.
The sorption of Pb (II) ions was spontaneous as it
has negative ∆G al all temperatures studied. However, the
spontaneity of Cu (II) sorption become increasingly
reduced with increasing temperature (Fig.8).
CONCLUSION
The adsorptive removal of a mixture of copper,
lead and nickel ions from aqueous solution by raw saw
dust of locust bean tree was investigated under different
experimental conditions, in this work. The results
presented in the paper clearly show that the different
operational parameters such as adsorbent dosage, initial
dye concentration, temperature and contact time employed
in this study, influenced the overall adsorption process. The
Langmuir isotherm was found to have the best fit to the
experimental data, with the highest regression coefficient.
The sorption dynamics showed that the dye uptake rate
was rapid at the beginning, attaining equilibrium in 2 h.
The kinetics was best described by the pseudo-second order
and Elovich models, with reasonably high linear regression
coefficients. The thermodynamic parameters obtained
indicated that the sorption process was feasible (negative
∆G) and exothermic (negative ∆H). The low ∆G values
points to the likelihood of physisorption. The sorption
process was associated with a increase in the degree of
randomness as ∆S was negative
REFERENCES
IJSER
International Journal of Scientific & Engineering Research, Volume 4, Issue 6, June-2013 1285 ISSN 2229-5518
IJSER © 2013 http://www.ijser.org
1. Nriagu, J.O. (1979). Global Investory of natural and
anthropogenic emissions of trace metals to the
atmosphere. Nature, 278: 409 – 411.
2. Kortenkamp, A., Casadevall, M., Faux, S.P., Jenner,
A., Shayer, R.O.J., Woodbridge, N. and O’Brien, P.
(1996). A role for molecular oxygen in the
formation of DNA damage during the reduction of
the carcinogen chromium (vi) by glutathione.
Archiv. Biochem. Biophys., 329(2) : 199 – 208.
3. Giwa, A.A., Amuda, O.S., Bello, I.A. and Bello,
M.O. (2007). Biomonitoring of heavy metal
pollution in Ibadan, Nigeria. Int. Jour. Phys. Sci.,
2(1), 47 – 52.
4. Tahvonen, R. (1996). Contents of Pb and Cd in food
and diets. Food Env. Int., 12, 1 – 7.
5. Cizyl, J. (1990). Lead and Cadmium contamination
of soil and vegetable in the upper Silesia region of
Poland. Sci. Total Env. 96, 199 – 204.
6. Lee, D. H.K. (1972). Metal contamination and
human health, Academic Press, New York, 17 –
162.
7. Habib – Ur – Rehman, M.S., Imtiaz, A., Sher,S. and
Hameedullah (2006). Sorption studies of Nickel
ions onto sawdust of Dalbergia sissoo. Jour. China
Chem. Soc., 53 : 1045 – 1052.
8. Harrison, R.M. and Laxen, D.P.H. (1980). Metals in
environmental chemistry. Chem. Br., 16 : 316 – 320.
9. Low, K.S. and Lee, C.K. (1991). Cadmium uptake
by Moss Calympess delcsertiis. Bioresour. Technol., 38
: 1 – 6.
10. Ceribasi, H.I. and Yetis, U. (2001). Biosorption of
Ni (II) and Pb (II) by Phanaerochate chrysosporium
from a binary metal system – kinetics. Water SA.,
27(1) : 15 – 20.
11. Volesky, B. (1994). Advances in biosorption of
metals : selection of biomass types. FEMS Microbio.
Rev., 14 : 291 – 302.
12. Amuda, O.S., Giwa, A.A. and Bello, I.A.( 2007).
Removal of heavy metal from industrial
wastewater using modified activated coconut shell
carbon. Biochem. Eng. Jour., 36 : 174 – 181.
13. Giwa, A.A., Abdus-Salam, N., Amuda, O.S. and
Bello, I.A. (2007). Biological Monitoring of
Chromium. Copper, Iron, Manganese and Zinc in
Ibadan province, Nigeria. Int. Jour. Biosci., 2(1), 40 -
47
14. Amuda, O.S., Amoo, I.A., Ipinmoroti, K.O. and
Ajayi, O.O. (2006). Coagulation/flocculation
process in the removal of trace metals present in
industrial wastewater. Jour. Appl. Sci. Environ. Mgt.,
10(3): 159 – 162.
15. Sletten, R.S., Benjamin, M.M., Horng, J.J. and
Ferguson, J. F.(1995). Physical-chemical treatment
of landfill leachates for metal removal. Water Res.
29(10), 2376-2386
16. Martinez, N.S.S., Fernandez, J.F., Segura, X.F. and
Ferrer, A.S. (2003). Pre – oxidation of an extremely
polluted industrial wastewater by the fenton’s
reagent. Jour. Hazard. Mat., B101 : 315 – 322.
17. Peres, J.A., Beltran de Heredia, J. and Dominguez,
J.R. (2004). Integrated fenton’s reagent ;
coagulation/flocculation process for the treatment
of cork processing wastewater. Jour. Hazard. Mater.,
107(3) : 115 – 121.
18. Poon, C.P.C. (1986). Removal of cadmium from
wastewaters. Cadmium in the Environ., 50.
19. Abdel-Ghani, N.T., Hefny, M. and El-Chaghaby,
G.A.F. (2007). Removal of lead from aqueous
solution using low cost abundantly available
IJSER

International Journal of Scientific & Engineering Research, Volume 4, Issue 6, June-2013 1286 ISSN 2229-5518
IJSER © 2013 http://www.ijser.org
adsorbents. Int. Jour. Environ. Sci. Tech., 4(1): 67 –
73.
20. John, M.M., Marshall, W.E. and Toles, C.A. (1998).
Agricultural by products as granular activated
carbon for adsorbing dissolved metals and
organics. Jour. Chem. Technol. Biotechnol., 71 : 131
– 140.
21. Taty – Costodes, V.C., Fauduet, H., Porte, C. and
Delacroiz, A. (2003). Removal of Cd (II) and Pb (II)
ions from aqueous and solutions by adsorption
onto sawdust of Pinus sylvestris. Jour. Hazard. Mat.,
B105 : 121 – 142.
22. Olajire, A. A. 2012. Principles and Applications of
Spectroscopic Techniques. Sina2tees Publications;
(2012), 268 pp.
23. Demirbas, E., Kobya, M., Senturk, E. and Ozkan, T.
(2004). Adsorption kinetics of chromium (VI) from
aqueous solutions on the activated carbons
prepared fro agricultural wastes, Water SA, 30 (4),
533-539.
24. Wong, S.Y; Tan, Y.P; Abdullah, A.H and Ong, S.T
(2009). The removal of basic and reactive dyes using
quartenised sugar cane bagasse. J. Phy. Sci., 20 (1), 59 – 74.
25. Mas Rosenal, H.M.H and Kathiresan, S. (2009). The
removal of methyl red from aqueous solution using
banana Pseudostem fibers. Ame. Jour. Appl. Sci.,
6(9): 1690-1700.
26. Saiful Azhar, S. Ghaniey Liew, A., Suhardy, D.,
Farizul Hafiz, K. and Irfan Hatim, M.D. (2005). Dye
removal from aqueous solution by using
adsorption on treated sugarcane bagasse. Am. J. Appl. Sci.
2(11); !499-1503.
27. Daniela, S. and Doina, B. (2005). Equilibrium and
kinetic study of reactive dye brilliant red He-3b
adsorption by activated charcoal Acta. Chim. Stov.
52, 73-79.
28. Esmaili, A., Ghasemi, S. and Rustaiyan, A. (2008).
Evaluation of the activated carbon prepared of algae
gracilaria for the biosorption of Cu(II) from
aqueous solutions. American-Eurasian. J. Agric. & Env. Sci.
3(6); 810-813.
29. Converti, M.D., Borgi, M.L Ferraiolo, G and Zillin.
(1992). Fly ash as sorbent for COD and suspended
solid abatement from industrial waste waters. Chem.
Biochem. Eng. Q. 16, 195-200.
30. Jain, R. and Sikarwar, S. (2008). Removal of
Hazardous dye congo red from waste material. J. Hazard.
Mater. 152; 942-948.
31. Mittal, A., Gupta, V.K., Malviya, A. and Mittal, J.
(2008). Process development for the batch and bulk
removal and recovery of a hazardous, water
soluble azo dye metanil yellow by adsorption over waste
materials (bottom ash and De-oiled soya). J.
Hazard. Mater. 151:821-832.
32. Zawani Z, Luqman Chuah A and Thomas S. Y.
Choong (2009). Equilibrium, Kinetics and Thermodynamic
studies: Adsorption of remazol black 5 on the palm kernel
shell activated carbon (PKS- AC). Euro. Jour. Sci. Res.,
Vol. 37, No. 1, 67-76.
33. Pandey, K., Sharma, S.K. and Sambi, S.S. (2010),
Kinetics and equilibrium study of chromium
adsorption on zeolite NaX. Int. J. Environ. Sci. Tech.,
7 (2), 395-404.
34. Kannan N. and Murugarel S. (2007), Column
Studies on the removal of dyes Rhodamine-B,
Congo red and Acid violet by adsorption on
various adsorbents. E-J. Environ. Agric. Food Chem.
6(3), 1860-1868.
IJSER
International Journal of Scientific & Engineering Research, Volume 4, Issue 6, June-2013 1287 ISSN 2229-5518
IJSER © 2013 http://www.ijser.org
35. Yasin, Y., Hussein, M. Z. and Ahmad, F.H. (2007).
Adsorption of Methylene Blue onto Treated
Activated Carbon, The Malay. Jour. Anal. Sci.,
11(11), 400-406.
36. Santhi, T., Manonnxni, S. and Smitha, T. (2010).
Kinetics and Isotherm studies on cationic dyes
adsorption onto Annona Squmosa seed activated
carbon. Int. Jour. Eng. Sci. Tech. Vol 2(3), 287-295.
37. Blazquez, G., Hernainz, F., Calero, M. and Ruiz-
Nunez, L. F. (2005). Removal of cadmium ions with
olive stones: the effect of some parameters. Proc.
Biochem. 40, 2649-2654.
38. Kadirvelu, K; Kavipriya, M; Karthika, C; Radhika,
M; Vennilamani, N and Pattabhi, S. (2003).
Utilization of various agricultural waste for
activated carbon preparation and application for aqueous
solution. Bioresour. Technol., 87 : 129 – 132.
39. Ali Riza, D., Yalcin, G., Nusret, K. and Elcin, G.
(2007). Comparison of activated carbon and bottom
ash for removal of reactive dye from aqueous
solution. Bioresour. Technol., 98 : 834 – 839.
40. Binupriya, A.R., Sathishkumar, M., Jung, S.H.,
Song, S.H. and Yun, S.I. (2009). A novel method in
utilization of bok bunja seed wastes from wineries
in liquid – phase sequestration of reactive blue 4.
Int. Jour. Environ, Res., 3(1) : 1 – 12.
41. Nagda G.K. and Ghole V.S. (2009). Biosorption of
Congo Red by Hydrogen Peroxide Treated Tendu
waste, Iran J. Env. Health Sci. Eng., 6(3), 195-200.
42. Freundlich, H.M.F. 1906. Über die adsorption in
lösungen, Zeitschrift für Physikalische Chemie 57A,
385–470.
43. Lain – Chuen, J., Cheng – Cai, W., Chung – Kung,
L. and Ting – Chu, H. (2007). Dyes adsorption onto
organoclay and MCM – 41. Jour. Env. Eng. Manage.,
17(1) : 29 – 38.
44. Malik, P.K (2004). Dye removal from wastewater
using activated carbon developed from sawdust:
Adsorption equilibrium and kinetics. J. Hazard.
Mater. 113, 81 – 88.
45. Langmuir, I. (1918). The adsorption of gases on
plane surfaces of glass, mica and platinum. Jour.
Ame. Chem. Soc., 40 : 1361 – 1403.
46. Ho, Y.S (2005). Effect of pH on lead removal from
water using tree fern as the sorbent. Bioresource Technol.,
96: 1292 – 1296.
47. Namasivayam, C., Radhika, R. and Suba, S. (2001).
Uptake of dyes by a promising locally available
agricultural solid waste : coir pith. Wast. Manage.,
21: 381 – 387.
48. Chiu, H. and Wang, J (2009).. Adsorption
thermodynamics of cobalt ions onto attapugite.
JEPS, 3, 102-106;
49. Temkin, M.I. and Pyzhev, V., (1940). Kinetics of
Ammonia synthesis on promoted iron catalysts,
Acta Physiochim, URSS 12, 327-356.
50. Oladoja, N.A., Asia, I.O., Aboluwoye, C.O.,
Oladimeji, B. and Ashogbon, A.O. (2008). Studies
on the sorption of basic dye by rubber (Hevea
brasiliensis) seed shell. Turk. Jour. Eng. Env. Sci., 32 :
143 – 152.
51. Lagergren, S. 1898. Zur theorie der sogenannten
adsorption gelöster stoffe. Kungliga Svenska
Vetenskapsakademiens. Handlingar, Band 24(4), 1-39.
52. Igwe, J.C. and Abia, A.A. (2007). Studies on the
effects of temperature and particle size on
bioremediation of As(III) from aqueous solution
using modified and unmodified coconut fiber.
Global Jour. Environ. Res., 1(1) : 22 – 26.
IJSER

International Journal of Scientific & Engineering Research, Volume 4, Issue 6, June-2013 1288 ISSN 2229-5518
IJSER © 2013 http://www.ijser.org
53. Weber, W.J. and Morris, J.C. (1963). Kinetics of
adsorption on carbon from solution. Jour. Sanit.
Eng. Div. Ame. Soc. Civ. Eng., 89 : 31 – 60.
54. Poots, V.J.P., Mckay, G. and Healy, J.J. (1976). The
removal of acid dye from effluent using natural
adsorbents –II wood. Wat. Res. 10, , 1067-1070.
55. Ho, Y.S., Mckay, G. 2003. Sorption of dyes and
copper ions onto biosorbents. Proc. Biochem. 38,
1047 – 1061.
56. McKay, G. and Poots, V.J. (1980). Kinetics and
diffusion processes in colour removal from effluent
using wood as an adsorbent. Jour. Chem. Tech.
Biotech., 30 : 279 – 292.
57. Ong, S.A., Seng, C.E., Lom, V. 2007. Kinetic of
adsorption of Cu(II) and Cd(II) from aqueous
solution on rice husk and modified rice husk. E-
Jour. Environ, Agric. and Food Chem., 6(2), 1764 –
1774.
58. Arivoli, S. and Thenkuzhali, M. 2008. Kinetic,
mechanistic, thermodynamic and equilibrium
studies on the adsorption of rhodamine B by acid
activated low cost carbon. E – Jour. Chem., 5(2) : 187
– 200.
59. Bhattacharya, K.G and Sharma, A. (2004). Kinetics
and thermodynamics of methylene blue
adsorption on neem (Azadirachta indica) leaf
powder. Dyes and Pigments, 65: 51 – 59.
60. Allen, S. J., Whitten, L. J., Murray, M. and Duggan,
O., (1997). Adsorption of pollutant by peat, lignite
and activated chars. J. Chem. Technol. Biotechnol.
68, 442-452.
61. Ncibi, M.C., Mahjoub, B. and Seffen, M. (2007).
Kinetics and Equilibrium Studies of Methylene
blue biosorption by Posidonia Ocenai (L.) fibres. J.
Hazard Mater. B139, 280-285.
62. Gong, R., Liang, J., Chen, J. and Huang, F. (2009).
Removal of bisphenol A from aqueous solution by
hydrophobic sorption of hemimicelles. Int. J.
Environ. Sci. Tech., 6 (4), 539-544.
s
IJSER
International Journal of Scientific & Engineering Research, Volume 4, Issue 6, June-2013 1289 ISSN 2229-5518
IJSER © 2013 http://www.ijser.org
Fig.1as: FTIR spectrum of raw sawdust (RSD) before metal mixture adsorption
IJSER

International Journal of Scientific & Engineering Research, Volume 4, Issue 6, June-2013 1290 ISSN 2229-5518
IJSER © 2013 http://www.ijser.org
Fig.1b: FTIR spectrum of raw sawdust (RSD) after metal mixture adsorption
(a) X100 RSD
IJSER

International Journal of Scientific & Engineering Research, Volume 4, Issue 6, June-2013 1291 ISSN 2229-5518
IJSER © 2013 http://www.ijser.org
(b) X500 RSD
© X1000 RSD Figure 2: SEM images RMH at different magnifications (a) x100, (b) x500, (c) x1000
IJSER

International Journal of Scientific & Engineering Research, Volume 4, Issue 6, June-2013 1292 ISSN 2229-5518
IJSER © 2013 http://www.ijser.org
0
0.5
1
1.5
2
2.5
3
3.5
4
4.5
0 20 40 60 80 100 120 140 160 180 200
Contact time (min)
qt (m
g/g)
Cu,5mg/LCu,20mg/LCu,50mg/LPb,5mg/LPb,20mg/LPb,50mg/LNi,5mg/LNi,20mg/LNi,50mg/L
Figure 3: Effect of Contact time and initial metal concentration on the sorption of TMS
by RSD.
0
0.5
1
1.5
2
2.5
3
3.5
4
4.5
0 0.1 0.2 0.3 0.4 0.5 0.6 0.7 0.8
RSD dose (g)
qe (m
g/g)
CuPbNi
IJSER

International Journal of Scientific & Engineering Research, Volume 4, Issue 6, June-2013 1293 ISSN 2229-5518
IJSER © 2013 http://www.ijser.org
Figure 4 : Effect of RSD dose on the adsorption of Cu (II), Pb (II) and Ni (II) ions in
TMS
0
0.5
1
1.5
2
2.5
3
0 1 2 3 4 5 6 7 8
pH
qe (m
g/g) qe (Cu)
qe(Pb)qe(Ni)
Figure 5 : Effect of the pH of TMS on the adsorption of Cu (II), Pb (II) and Ni (II) ions
by RSD
IJSER

International Journal of Scientific & Engineering Research, Volume 4, Issue 6, June-2013 1294 ISSN 2229-5518
IJSER © 2013 http://www.ijser.org
-0.05
0
0.05
0.1
0.15
0.2
0.25
0.3
0.35
0 10 20 30 40 50 60 70
Initial TMS concentration (mg/L)
KR
KR,CuKR,PbKR,Ni
Figure 6 : Plots of KR versus initial concentrations of Cu, Pb and Ni in TMS
y = 0.0441x + 2.9101R2 = 0.9358
y = 0.0125x + 3.7897R2 = 0.9107
y = 0.0842x + 0.3872R2 = 0.9891
0
0.5
1
1.5
2
2.5
3
3.5
4
4.5
4 5 6 7 8 9 10 11 12 13 14
qt (m
g/g) Cu,50mg/L
Pb,50mg/LNi,50mg/L
√t
Figure 7 : Webber-Morris intra-particle diffusion plots for the sorption of Cu, Pb and Ni in TMS
IJSER
International Journal of Scientific & Engineering Research, Volume 4, Issue 6, June-2013 1295 ISSN 2229-5518
IJSER © 2013 http://www.ijser.org
y = 178.77x - 54477R2 = 1
y = 18.748x - 9096.3R2 = 0.9865
y = 95.856x - 25295R2 = 0.933
-4000
-2000
0
2000
4000
6000
8000
300 305 310 315 320 325
T (K)
G
CuPbNi
Figure 8 : Plots of Gibb’s free energy change, ∆G, against absolute temperature
Table 1: Isotherm models parameters for TMS adsorption onto RSD Metal Langmuir
R2 qm Ka Freundlich R2 n Kf
Temkin R2 bT KT
Cu 0.9934 3.73 0.69 0.9148 2.14 1.22 0.9358 0.695 10.48 Pb 0.9911 4.17 - 342 1 -1.47 3.41 1 1.24 0.85 Ni 0.9838 1.44 0.46 0.5732 5.46 0.69 0.7126 0.15 146.03 Table 2: Kinetics Model Parameters for the adsorption of TMS onto Pakia biglobosa saw dust Pseudo- first order Pseudo-second order Elovich Metals in TMS
qe, exp
qe, mod K1 R2 qe, mod K2 H R2 Α β R2
Cu 3.37 0.72 0.04 0.7451 0.39 0.17 1.98 0.9995 1.44×10⁹ 8.38 0.9572 Pb 3.91 0.30 0.04 0.706 3.92 0.74 11.31 1 3.74×1040 25.91 0.9574 Ni 1.34 1.04 0.02 0.9111 1.42 0.05 0.09 0.9717 0.66 4.86 0.8736 Co = 50mg/L Table 3: Weber-Morris Intra-particle diffusion model parameters for TMS adsorption onto RSD Metals in TMS R2 Kid Xi
IJSER
International Journal of Scientific & Engineering Research, Volume 4, Issue 6, June-2013 1296 ISSN 2229-5518
IJSER © 2013 http://www.ijser.org
Cu 0.9358 0.044 2.91 Pb 0.9107 0.013 3.79 Ni 0.9891 0.084 0.39 Table 4: Thermodynamics constants for the adsorption of TMS onto RSD Metals in TMS ∆H (KJ/mol) ∆S (J/molK-1) R2 Cu -54.48 178.77 1 Pb -9.10 18.75 0.9868 Ni -25.30 95.86 0.933
IJSER