Design and Experimental Studies of a Biomass Fired Furnace ...
153
DOCTORAL TH ESI S L Design and Experimental Studies of a Biomass Fired Furnace for Small- and Medium Scale Heating Applications Joakim Lundgren Luleå University of Technology Department of Applied Physics and Mechanical Engineering, Division of Energy Engineering 2004:211 ISSN: 1402-15441 !SRN: LTU-DT— 04/21 — SE
-
Upload
khangminh22 -
Category
Documents
-
view
1 -
download
0
Transcript of Design and Experimental Studies of a Biomass Fired Furnace ...

D O C T O R A L T H ESI S L
Design and Experimental Studies of a
Biomass Fired Furnace for Small- and
Medium Scale Heating Applications
Joakim Lundgren
L u l e å U n i v e r s i t y o f T e c h n o l o g y
D e p a r t m e n t o f A p p l i e d Physics and M e c h a n i c a l E n g i n e e r i n g , D i v i s i o n o f E n e r g y E n g i n e e r i n g
2004:211 I S S N : 1402-15441 ! S R N : L T U - D T — 04/21 — SE

D E S I G N A N D E X P E R I M E N T A L S T U D I E S O F A
B I O M A S S F I R E D F U R N A C E F O R S M A L L - A N D
M E D I U M S C A L E H E A T I N G A P P L I C A T I O N S
Joakim Lundgren
Avd för Energiteknik
Institutionen för Tillämpad fysik, maskin- & materialteknik
Luleå tekniska universitet
Akademisk avhandling
som med vederbörligt tillstånd av Tekniska fakultetsnämnden v id Luleå tekniska universitet för avläggande av teknologie doktorsexamen, kommer att offentligt försvaras vid Luleå tekniska universitet, lokal E231, fredagen den 11 j un i 2004, k l 10.00
Fakultetsopponent: Dr Øyvind Skreiberg, Inst. för Energi- og
processteknikk, Norges Teknisk- Naturvitenskapelige Universitet,
Trondheim, Norge
Doctoral Thesis 2004:21 ISSN 1402-1544 I S R N : L T U - D T — 0 4 / 2 1 — S E

D O C T O R A L T H E S I S
D E S I G N A N D E X P E R I M E N T A L STUDIES OF A B I O M A S S F I R E D
F U R N A C E F O R S M A L L - A N D M E D I U M SCALE H E A T I N G
A P P L I C A T I O N S
J o a k i m Lundgren
Div i s ion o f Energy Engineering
Depar tment o f A p p l i e d Physics. Mechanical and Material Engineering
Luleå Univers i ty o f Technology
S-971 87 Lu leå - Sweden

P R E F A C E
This w o r k has been carried ou t at the D i v i s i o n o f Energy Engineer ing at Lu leå U n i v e r s i t y o f
Technolog) ' . T h e w o r k was part ly f u n d e d by the European C o m m i s s i o n i n the f r a m e w o r k o f
the N o n - N u c l e a r Energy P rog ramme J O U L E I I I and part ly by the Swedish N a t i o n a l Energy
Admin i s t r a t ion .
I w o u l d l i ke to express m y deepest grat i tude to m y supervisors Prof. J inyue Y a n , D o c . Jan
Dahl and D r . R o g e r Hermansson f o r the f r u i t f u l col laborat ion, their support and sk i l fu l
guidance. I am also indebted t o m y f o r m e r supervisor Prof . B j ö r n K j e l l s t r ö m f o r t ak ing his
t ime to p e r f o r m several p r o o f readings and g i v i n g many valuable advices. I am most gra teful to
all o f y o u f o r the encouragement and inspi ra t ion y o u have p rov ided t h r o u g h o u t the w o r k .
I w o u l d also l ike to express m y grati tude to M r . M i k a e l Jansson, Swebo Flis o c h Ene rg i , f o r the
smooth co-opera t ion du r i ng these years. I w o u l d also l ike to thank M r . E s b j ö r n Pettersson, f o r
the interest ing discussions we have had. E s b j ö r n was also co-author i n t w o o f the appended
papers.
Fur thermore , I w o u l d l ike to express m y appreciation to the local district heat ing company,
Boden Ene rg i A B ( B E A B ) , w h o has been very accommoda t ing du r ing the pro jec t . T h e y have
supplied the wood-ch ips free o f charge, invested i n f u e l containers and p r o v i d e d technical
support i n f o r m o f electricians and engineers du r i ng the installation and w h e n problems came
up. T h e y also a l lowed us to use the i r m a i n district heat ing n e t w o r k as a heat sink, w h i c h was a
basic c o n d i t i o n to be able to p e r f o r m l o n g - t e r m test runs.
I w o u l d also l i ke to thank all m y colleagues at the D i v i s i o n o f Energy Eng inee r ing f o r the i r
support and the f r i end ly atmosphere, especially M r . Lars Johansson and M r . M i k a e l Larsson
and m y f o r m e r colleagues D r . Hassan Salman and M r . Magnus Lundqv i s t f o r the enjoyable
t ime d u r i n g ou r journeys .
I am very t h a n k f u l t o m y dear g i r l f r i e n d Susanna and m y fami ly f o r their immense patience,
encouragement and f o r always be ing there f o r me. Final ly , to m y friends, thank y o u f o r all the
support and I hope that I w i l l have m o r e t i m e n o w to see y o u all .
Joakim L u n d g r e n
Luleå M a y 10 2004

A B S T R A C T
There is great potent ia l f o r expansion o f biomass based heating systems i n Sweden. A t present,
more than 40 T W h o f o i l and electr ic i ty are used f o r heat ing purposes. As the Swedish
parl iament aims to phase ou t nuclear p o w e r , i t is o f great impor tance to pu t efforts i n t o
reducing the use o f electric heating. O n e measure c o u l d be to conver t these systems to biomass
district heat ing. Since large-scale distr ict heat ing systems are w e l l established i n the count ry , i t
can be expected that n e w installations o f small- and m e d i u m sized heating plants w i l l increase.
Such a deve lopment w o u l d lead t o a s ignif icant r e d u c t i o n o f C O , emissions and many n e w j o b
opportuni t ies . T h e ma in obstacle f o r such a deve lopment is o f an economic nature i n the f o r m
o f l o w electr ic i ty prices and relat ively h i g h investments required f o r district heating d i s t r ibu t ion
systems.
The m a i n object ive o f this w o r k was to study possibilities to develop an e n v i r o n m e n t - f r i e n d l y
and economic heating system suitable f o r small distr ict heating networks , where the furnace
should have the abi l i ty to manage w e t as w e l l as unclassified biofuels . T h e system should also
be able t o cope w i t h large and f r equen t ly o c c u r r i n g thermal ou tpu t variations f u l f i l l i n g the
most rigorous env i ronmenta l restrictions.
The studies have been focussed o n the evaluat ion o f the envi ronmenta l per formance o f the
newly developed furnace using p r i m a r i l y w e t w o o d - c h i p s as fue l . Horse manure m i x e d w i t h
different b e d d i n g materials has also been tested.
In order t o i m p r o v e the opera t ion condi t ions f o r biomass fired furnaces installed i n small scale
district heat ing systems as w e l l as the economic condi t ions f o r poten t ia l customers, and also to
reduce the heat losses d u r i n g summer , a solar assisted system w i t h t w o d i f fe ren t system
solutions has been theoretically investigated and compared .
The n e w l y developed furnace consists o f t w o combus t ion stages, a p r i m a r y - and a secondary
zone. T h e p r imary combus t ion chamber is pa r t i t ioned , where one modu le operates i n the
range o f 50 k W to 150 k W and the o ther 150 k W to 350 k W . T o reach m a x i m u m thermal
output 500 k W ; b o t h chambers are r u n together. T h e pa r t i t i on ing makes i t possible t o
maintain the requi red combus t ion temperature also at l o w e r heat loads. T h e secondary zone is
designed to obta in as g o o d m i x i n g b e t w e e n the secondary air and the combust ible gases as
possible. T h e C F D - c o d e C F X has been used to evaluate h o w the t w o flows should be m i x e d .
The results o f the combus t ion experiments w h e n using w e t wood-ch ips as f u e l show that the
emissions o f C O and T H C are very l o w i n the comple te thermal ou tpu t range as w e l l as
dur ing heat load f luctuat ions. Tests have also s h o w n that i t is possible to use horse manure as
fuel f o r heat p roduc t i on . Analysis o f the chemica l compos i t i on o f the ash f r o m horse manure
combust ion showed that i t should be possible t o recycle i t to forest lands. Th i s m e t h o d is
compared w i t h other viable alternatives such as compos t ing and biogas p roduc t i on .
Solar assisted biomass distr ict hea t ing systems have been studied w i t h a v i e w to reduc ing
operation hours o n l o w thermal o u t p u t . B y l e t t i ng the households generate their o w n h o t tap
water d u r i n g summer, the culver t heat losses can be min imi sed du r ing that season. T h e
calculations also show that this so lu t ion is m o r e economica l than a convent ional system w i t h a
solar col lec tor f i e l d and a heat store located near the heat ing plant.
K E Y W O R D S : Biomass combustion; district heating; emissions; horse manure; solar heating
A P P E N D E D P A P E R S
This thesis comprises the f o l l o w i n g papers
P A P E R I
Lundgren J , Hermansson R , Lundqvis t M . 2003. Design o f a secondary combus t ion chamber
tor a 350 k W w o o d - c h i p s f i r e d furnace. Proceedings of the 4'h Internationell Conference on Fluid and
Thermal Energy Conversions (FTEC), Bah, Indonesia, Dec . 7 - 1 1 .
P A P E R I I
Lundgren J, Hermansson R , D a h l J. 2004. Exper imen ta l studies o f biomass bo i l e r suitable f o r
small district heat ing ne tworks . Biomass and Bioenergy. 26 (5), pp 443-453 .
P A P E R I I I
Lundgren J , Hermansson R , D a h l J. 2004. Exper imen ta l studies d u r i n g heat load f luctuat ions
i n a 500 k W w o o d - c h i p s fired boi ler . Biomass and Bioenergy. 26 (3), pp 255-267 .
P A P E R I V
Lundgren J, Hermansson R . 2004. Solar assisted small-scale biomass district heat ing system i n
the n o r t h e r n part of Sweden. Accepted f o r pub l i ca t ion i n International Journal of Green Energy.
P A P E R V
Lundgren J, Y a n J, Hermansson R , D a h l J . 2004. Smal l - and m e d i u m scale biomass district
heating i n Sweden - po ten t ia l and problems i n f u r t h e r u t i l i sa t ion . Submi t t ed f o r pub l i ca t ion i n
International Journal of Energy Research.
P A P E R V I
Lundgren J, Pettersson E . 2004. Practical, env i ronmen ta l and economic evaluat ion o f d i f fe ren t
options f o r horse manure management. Accepted f o r presentat ion at the I f f 1 ' International
Congress of Chemical and Process Engineering, Prague, Czech R e p u b l i c , A u g . 22-25 .
P A P E R V I I
Lundgren J, Pettersson E . 2004. C o m b u s t i o n o f horse manure f o r heat p r o d u c t i o n . Submi t t ed
fo r pub l ica t ion i n Bioresource technology.

T A B L E O F C O N T E N T S
P A G E
I N T R O D U C T I O N 11
B A C K G R O U N D 1 1
T H E E N E R G Y S I T U A T I O N I N S W E D E N 1 2
B I O M A S S C O M B U S T I O N 1 5
Technologies for biomass combustion 1 5
Pollutants from biomass combustion and emission regulations in Sweden 1 6 P R O B L E M F O R M U L A T I O N 1 8
Objectives and scope of the research 2 0
S U M M A R Y A N D C O M M E N T S O N T H E A P P E N D E D P A P E R S 21
PAPER. 1 2 1
Design of a secondary combustion chamber for a 350 kW wood-chips fired furnace 2 1
P A P E R I I 2 3
Experimental studies of biomass boiler suitable for small district heating networks 2 3
P A P E R I I I 2 5
Experimental studies during heat load fluctuations in a 500 kW wood-chips fired boiler 2 5
P A P E R I V 2 7
Solar assisted small-scale biomass district heating system in the northern part of Sweden 2 7
P A P E R V 2 9
Small- and medium scale biomass district heating in Sweden - potential and problems in further utilisation 2 9 P A P E R V I 3 0
Practical, environmental and economic evaluation of different options for horse manure management 3 0
P A P E R V I I 3 2
Combustion of horse manure for heat production 3 2
A D D I T I O N A L E X P E R I M E N T A L W O R K 3 5
P A R T I C L E E M I S S I O N M E A S U R E M E N T S 3 5
C O M B U S T I O N O F H O R S E M A N U R E M I X E D W I T H S T R A W 3 5
C O N C L U S I O N S 3 7
F U T U R E W O R K 3 8
I N C R E A S E D N O M I N A L T H E R M A L O U T P U T O F T H E F U R N A C E 3 8
F U R T H E R E M I S S I O N S T U D I E S A N D E N V I R O N M E N T A L I M P R O V E M E N T S 3 8
F U R T H E R S T U D I E S R E G A R D I N G C O M B U S T I O N O F H O R S E M A N U R E 3 8
F I N A L R E M A R K S 3 9
R E F E R E N C E S 4 0
A P P E N D I X I I
D E S C R I P T I O N O F T H E T E S T P L A N T A N D E X P E R I M E N T A L S E T U P i
A P P E N D I X I I V I I
T E C H N I C A L S P E C I F I C A T I O N S O F T H E P L A N T v n
A P P E N D I X I I I V I I I
C O N T R O L S Y S T E M , M E A S U R I N G E Q U I P M E N T A N D U N C E R T A I N T I E S v m

I N T R O D U C T I O N
B A C K G R O U N D
The interest i n increased use o f renewable energy sources w o r l d w i d e has g r o w n stronger i n the
last t w o decades. T h e m a i n reasons are the t w o o i l crisis du r ing the 1970s and the concern f o r
the increased concent ra t ion o f greenhouse gases i n the atmosphere and their inf luence o n the
climate.
The first o i l crisis d u r i n g the years 1973 to 1974 caused h i g h o i l prices and, as consequence,
energy ra t ion ing preparations. T h e next o i l price increase occurred d u r i n g the years 1978 to
1980, due to the po l i t i ca l r e v o l u t i o n i n I ran. T h e decrease o f o i l available o n the marke t was
not very large, bu t w h e n Saudi-Arabia decreased its o i l p r o d u c t i o n at the same t im e , i t became
more noticeable. Several countries expected another b i g o i l crisis and b o u g h t u p large
stockrooms o f o i l . T h e war be tween Iran and Iraq i n the late 1980 d i d no t cause a n e w o i l
crisis, since the stocks were w e l l - f i l l e d and the demand l o w due to h i g h o i l prices. These
disturbances con t r ibu ted t o addi t ional incentives f o r subst i tut ion o f o i l based energy.
Chmate change caused by anthropogenic activities is considered to be one o f the most serious
envi ronmenta l problems. A c c o r d i n g to U N ' s In te rgovernmenta l Panel o n Cl imate Change
( I P C C ) , the average global surface temperature is expected to increase by 1 . 4 ° C to 5 . 8 ° C over
the pe r iod f r o m 1990 to 2100. These results cover the f u l l range o f 35 Special Repor t s o n
Emission Scenarios (SRES), based o n a n u m b e r o f cl imate models. ( H o u g h t o n et.al, 2001) .
The U n i t e d Nat ions F r a m e w o r k C o n v e n t i o n o n Chmate Change ( U N F C C C ) states that the
overall objec t ive is "stabilisation of greenhouse gas concentrations in the atmosphere at a level that would
prevent dangerous anthropogenic interference with the climate system". Unless m a j o r changes are made
concerning the use o f fossil fuels f o r energy convers ion, the concentra t ion o f greenhouse gases
i n the atmosphere w i l l con t inue t o increase. ( H o f f e r t et.al, 1998).
T o make every e f fo r t towards a sustainable society w o u l d i nvo lve replacing fossil fuels by an
increased use o f renewable energy, such as biomass. C u r r e n d y , biomass sources supply a round
15% o f the global energy use, o f w h i c h the deve lop ing countries account f o r 13% o f the to ta l
share. O n l y 2% are used i n the industrialised countries. A c c o r d i n g to the European
Commission's w h i t e paper, the a m b i t i o n is to double the use o f renewable energy sources
f r o m the current level o f a round 6 % up to at least 12 % i n the year 2010. A signif icant share is
forecasted t o be biomass. (European C o m m i s s i o n , 1997).
Another i m p o r t a n t reason f o r decreasing the use o f fossil fuels is o f an economic nature. I m p o r t
o f o i l and other fossil fuels f o r electr ici ty and heat p r o d u c t i o n is expensive and a direct loss f o r
the local economy. B y contrast, renewable energy resources are o f t en developed i n the v i c i n i t y
o f the p r o d u c t i o n un i t , w h i c h means that the m o n e y spent o n energy p r o d u c t i o n stays local ly .
M a n y j o b opportuni t ies can therefore evolve f r o m the manufacture, design, installation and
maintenance o f renewable energy products . Fur the rmore , jobs are also created ind i rec t ly f r o m
businesses supplying renewable energy companies w i t h , f o r example raw material , transports
and equipment . T h e wages and salaries generated f r o m these jobs p rov ide addi t ional resources
to the local economy.
Add i t iona l ly , the benefits o f renewable energy sources are no t o n l y env i ronmen ta l and
economic, bu t also i m p o r t a n t f r o m the p o i n t o f v i e w o f the security, especially f o r those
countries that are strongly dependent o t f o r e i g n o i l i m p o r t . Th is energy source is vulnerable to ,
11

for example, pol i t ica l instabilities and t rad ing disputes. I f the country 's dependence o n fo re ign
o i l i m p o r t cou ld be reduced, this w o u l d strengthen the nat ional energy security.
T H E E N E R G Y S I T U A T I O N I N S W E D E N
T h e Swedish parl iament has decided t o create the necessary condit ions f o r effect ive energy use
and cost-effective energy supply w i t h l o w negative effect o n health, env i ronmen t and chmate.
T h e goal is a fu tu re energy system based o n indigenous and n o n - p o l l u t i n g energy sources to
the fullest possible extent. (Swedish G o v e r n m e n t Energy B i l l , 2002).
I n the last three decades there has been a radical change i n the Swedish energy supply. I n 1970,
crude o i l and other o i l products accounted for 77% o f the total energy supply, w h i l e f o r
example bioenergy accounted f o r a round 9%. Today , the share o f o i l used f o r energy
generation has decreased d o w n to 32%. I n 2002, the total p r imary energy supply i n Sweden
amounted to 616 T W h . (5 T W h o f electr ici ty was impor ted) . (Swedish N a t i o n a l Energy
Admin i s t r a t i on , 2003a). Figure 1 shows the total p r imary energy supply dis t r ibuted o n d i f fe ren t
energy sources and fuels.
F I G U R E 1. Primary energy supply in Sweden 2002 [TWIiJ. (Swedish National Energy
Administration, 2003a).
As the figure shows, non-renewable energy sources, such as nuclear p o w e r and fossil fuels, are
stil l dominant , together account ing f o r more than 70% o f the pr imary energy supply i n
Sweden. T h e largest con t r i bu to r is nuclear p o w e r account ing f o r 33% o f the to ta l supply,
corresponding to 201 T W h f u e l i n p u t or 66 T W h o f electrici ty. T h e energy supply f r o m coal
and coke is rough ly at the same level calculated as percentage as i n the year 1970, a round 4%
o f the total energy supply. Renewab le energy sources account f o r 28% o f the total supply,
where biomass based energy makes up the largest share, around 16% or 98 T W h . (Swedish
Na t iona l Energy Admin i s t r a t i on , 2003a). C o m p a r e d t o other countries i n Europe , the share o f
renewables is relat ively large.
Further changes i n the p r imary energy supply i n Sweden may be expected i n the near fu tu re .
A f t e r a r e fe rendum i n the year 1980, the Swedish Parliament decided to gradually phase ou t
nuclear p o w e r u n t i l the year 2010, i f i t is possible to replace i t w i t h economica l ly - and
12

envi ronmenta l ly sustainable alternatives. I t is h o w e v e r unclear i f this year st i l l is a val id t ime
l i m i t . A c c o r d i n g to a l aw that came i n t o force i n 1998, the Swedish G o v e r n m e n t has the
author i ty t o decide the p o i n t o f t ime w h e n the right to operate a nuclear reactor should be
ceased. (Swedish Codes o f Statutes, 1997).
A t present, a large part o f the generated electr ic i ty is used f o r heat ing purposes, m a i n l y due to
l o w electr ic i ty prices, l o w installation costs and convenient operat ion. Figure 2 shows the most
c o m m o n alternatives used f o r space heat ing and ho t tap water preparat ion i n detached houses,
blocks o f flats and other dwel l ings i n Sweden i n the year 2002.
• Other dwelling?
• Blocks o f flats
• Detached houses
Disttict heating F.lcctridtv Wood-chips,
logs, pellets
F I G U R E 2. Energy use for space heating and hot tap water preparation in Sweden 2002. (Swedish
National Energy Administration, 2003c).
As s h o w n i n the f igure , distr ict heating is the d o m i n a t i n g heat supply f o l l o w e d by electr ici ty
and o i l . D i s t r i c t heat ing is the most c o m m o n heating alternative i n blocks o f flats and other
dwellings. T h e detached house sector is the largest sector w i t h a to ta l use o f 42 T W h i n 2002,
in w h i c h more than a t h i r d ot the households use electric heating. T h e second most c o m m o n
source is a c o m b i n a t i o n o f electr ici ty and some f o r m o f biomass w h i l e the t h i r d is o i l based
heating. T h e use o f electr ici ty f o r heating purposes increased rapidly d u r i n g the years 1970 to
1990, made possible t h r o u g h the expansion o f nuclear p o w e r d u r i n g the years 1970 to 1980.
(Swedish N a t i o n a l Energy A d m i n i s t r a t i o n , 2003c). A t present, 22 T W h o f electr ici ty are used
for heat ing purposes, corresponding to 33% o f the electr ici ty generated by nuclear p o w e r
plants.
Figure 3 shows the deve lopment o f the total energy supply to the district heat ing sector i n the
last three decades. T h e figure shows that the distr ict heat ing sector is expanding. I n 2002, the
total energy supply to the distr ict heat ing sector amoun ted to 55 T W h , corresponding t o a
nearly f o u r f o l d increase since 1970. A d d i t i o n a l l y , the figure illustrates the radical change o f the
fuel compos i t ion . For example, i n 1980 o i l accounted f o r m o r e than 90% o f the energy
supplied, w h i l e the present o i l share is less than 8%. T h e f u e l compos i t i on is cur rent ly more
mixed and biomass fuels are dominan t , account ing f o r a round 36 T W h or m o r e than 60% o f
the total supply.
13

60
Y e a r
• O i l • Katural gas GCoal • Bio fuels ind peat • Electricboilers • i-Ieat pumps E Waste heat
F I G U R E 3. The development of the total energy supply to the district heating sector. (Swedish National
Energy Administration, 2003a).
A n impor t an t reason f o r this development is that b ioenergy use i n Sweden is more compet i t ive
w i t h fossil fuels today than before, ma in ly due to increased taxes o n fossil fuels the last decades.
For example, the current tax o n heating o i l used is h igher than the o i l i m p o r t price itself.
(Swedish Pe t ro leum Inst i tute , 2004) .
T h e use o f b iofuels , peat etc i n Swedish district heat ing plants is s h o w n i n figure 4.
Y e a r
• Refuse • W o o d fuels • Tal l oil pitch O Peat • O t h e r fuels E3 Biofuels for electricity production
F I G U R E 4. Use of biofuels, peat etc in district heating plants during the years 1980 to 2002. (Swedish
National Energy Administration, 2003a).
14

The use o f w o o d - f u e l s has increased by a factor o f f ive since 1990. T h e y consist ma in ly o f
fe l l ing wastes and by-produc ts f r o m the forest industries. T h e use o f r e f ined biomass, such as
pellets and briquettes, is also increasing, at present a m o u n t i n g to rough ly 4 T W h .
Refuse has been used i n distr ict heat ing plants since the early 1970s. T o d a y , combust ible
wastes must be separated f r o m o ther sorts o f refuse. Refuse used f o r c o m b u s t i o n is exempted
f r o m l and f i l l disposal tax, w h i c h i n January 2003 amounted to S E K 370 per t o n . As one
measure to reduce the ever-increasing amount o f refuse at landfi l ls , the Swedish parl iament has
decided to p r o h i b i t deposi t ion o f organic materials f r o m the year 2005. (Swedish Codes o f
Statutes, 2001) .
Biomass distr ict heat ing i n larger communi t i e s supplying apartments and o the r dwel l ings is w e l l
estabhshed i n Sweden, whe re typica l bo i le r thermal ou tpu t capacities are i n the range o f 20 to
150 M W t l l . Increasing taxes o n f u e l o i l and developments o f the d i s t r i bu t i on n e t w o r k
technology have made installations of district heat ing and use o f biomass fuels economica l ly
attractive also f o r smaller communi t i e s , where typical boi ler capacities c o u l d be about 0.1 t o 2
M W , ,
B I O M A S S C O M B U S T I O N
Technologies for biomass combustion
There are a n u m b e r of d i f fe ren t technologies used f o r combus t ion o f biomass fuels, such as
fixed bed - , fluidised bed - and dust combus t ion . A t present, the d o m i n a t i n g techniques f o r
small-scale hea t ing applications are underfeed stokers, grate firing, b u b b l i n g fluidised bed (BFB)
and c i rcu la t ing fluidised bed ( C F B ) furnaces. (Obernberger, 1998). H e a t i n g plants w i t h thermal
outputs i n the range o f 1-5 M W t h are o f t en o f the m o v i n g grate type, m a i n l y f o r economic
reasons. These types are considered robust and reliable, bu t are se ldom equipped w i t h any
advanced process c o n t r o l . I n communi t i e s where there are saw-mills f o r example , larger plants
such as cogenerat ion plants i n the thermal ou tpu t order o f 100 M W t h have been o r are be ing
bui l t . I n such plants, C F B furnaces are the most c o m m o n l y used. (Zethraeus, 1999).
Fixed-bed c o m b u s t i o n systems inc lude grate furnaces and underfeed stokers. T h e r e are several
types o f the f o r m e r , such as fixed grate systems, v ib ra t ing grates, t ravel l ing grates and underfeed
rotat ing grates. Grate furnaces are generally considered to be suitable f o r b iofuels w i t h h i g h
moisture contents, va ry ing particle sizes and h i g h ash contents.
Staged-air c o m b u s t i o n is c o m m o n l y applied i n large- as w e l l as small-scale biomass combus t ion
applications. A c c o r d i n g to Obernberge r (1998), comprehensive investigations have s h o w n that
p r imary- and secondary air should be supplied i n w e l l separated c o m b u s t i o n chambers. Th i s
method may be regarded as a p r i m a r y measure ma in ly to reduce emissions o f products o f
incomplete c o m b u s t i o n and p reven t f o r m a t i o n o f N O x .
I n grate fired furnaces, p r i m a r y combus t ion air is usually supphed t h r o u g h a fixed bed, i n
w h i c h d r y i n g , gasification and charcoal combus t ion take place. T h e combust ib le gases
produced are b u r n e d i n a secondary combus t ion zone separated f r o m the f u e l bed by adding
secondary air.
A n o v e r v i e w o f advantages and disadvantages o f using a grate furnace according t o
Obernberger (1998) and V a n L o o (2002) is shown i n table 1.
15

T A B L E 1. Advantages and disadvantages of using a grate furnace (Obernberger, 1998; Van Loo, 2002)
Advantages Disadvantages
• L o w inves tment f o r plants < 20 M W t h o N o n ü x i n g o f w o o d fuels and herbaceous
• L o w opera t ing costs fuels possible
• L o w dust l oad i n the flue gas 0 Ef f i c i en t N O , r e d u c t i o n requires special
• Less sensitive t o slagging than fluidised bed technologies
furnaces o H i g h excess o x y g e n (5-8 vo l%) decreases
the ef f ic iency
o C o m b u s t i o n condi t ions no t as homogenous
as i n fluidised b e d furnaces
• L o w emission levels at part ial load
operat ion is d i f f i c u l t to achieve
Advantages and disadvantages o f other types o f furnaces may also be f o u n d i n V a n L o o et.al
(2002) and Obernberger (1998).
Pollutants from biomass combustion and emission regulations in Sweden
Pollutants that have negative impacts o n env i ronment and heal th are released no t on ly f r o m
combus t ion o f fossil fuels, b u t also f r o m biomass combust ion . T h e r e is h o w e v e r no doub t that
the latter has many impor t an t envi ronmenta l advantages compared to the fo rmer . (Flyver
Christiansen, 1997). Biomass is, f o r example, C O , - n e u t r a l w i t h respect to the greenhouse gas
balance.
C O , is the m a i n p r o d u c t f r o m combus t ion o f all biomass fuels , o r i g ina t i ng f r o m the carbon
conten t o f the f u e l . T h e convers ion takes place t h rough several e lementary steps and reaction
paths. C O is the most i m p o r t a n t final intermediate and is o x i d i z e d to C O , i f oxygen is
available. C O and to ta l hydrocarbons ( T H C ) , volati le organic compounds ( V O C ) and
polycyche aromatic hydrocarbons ( P A H ) are all products o f i ncomple t e combus t ion (P IC) .
O t h e r p r i m a r y pollutants are particulate matter ( P M ) and d i f f e ren t oxides o f n i t rogen ( N O x ) .
(Jenkins et.al, 1998).
Pollutants i n the f o r m o f P I C are main ly a result o f one o f these:
• T o o l o w combus t ion temperature
• In su f f i c i en t m i x i n g o f combust ible gases and combus t ion air
• D e f i c i t o f oxygen
• T o o short residence t i m e i n h i g h temperature zones
A l l o f the variables are h o w e v e r l i n k e d to each other. A g o o d m i x i n g o f the combust ible gases
and the secondary air reduces the amoun t o f secondary air needed, w h i c h results i n higher
flame temperature as w e l l as l o w e r excess air rat io. Consequent ly , emissions o f incomple te
c o m b u s t i o n products are reduced due to higher temperature, w h i c h speeds up the elementary
react ion rates, and a g o o d m i x i n g , w h i c h reduces the requ i red residence t i m e f o r m i x i n g the
combust ib le gases and the secondary air. H o w e v e r , this does n o t automat ical ly mean reduced
N O x emissions. I n order to reduce emissions o f P I C as w e l l as N O x emissions, the p r imary
excess air rat io has to be opt imised. (Van L o o , 2002).
Nussbaumer et.al (1997) have presented typical emissions o f P I C and P M using poor as w e l l as
h i g h standard equ ipment f o r biomass combust ion . T h e emission values are s h o w n i n table 2.
16

T A B L E 2. Comparison of emissions between poor and high standard furnace design (Nussbaumer et.al,
1997)
Emissions @ 11% O , Poor standard High standard
Excess air ra t io , A. 2-4 1.5-2
C O f m g N m J ] 1000-5000 20-250
T H C [ m g N n T 3 ] 100-500 < 1 0
P A H [ n i g N n T 3 ] 0 .1-10 < 0 . 0 1
Particles, after cyc lone [ m g N n T ] 150-500 50-150
C o m b u s t i o n o f o i l , coal and biofuels emits more or less pollutants i n the f o r m o f N O , . These
are dependent n o t on ly o n the f u e l type, bu t also to a great extent o n the combus t ion
equipment and the combus t ion process. N O s emissions f r o m biomass combus t ion originate
main ly f r o m the f u e l b o u n d n i t rogen (fuel N O , ) , w h i l e N O , emissions f r o m o i l and coal occur
w h e n the n i t rogen i n the combus t ion air starts to react w i t h o x y g e n radicals ( thermal N O , ) .
The latter is f o r m e d at temperatures above approximate ly 1 3 0 0 ° C , a temperature level that is
rarely reached d u r i n g combus t ion o f biomass. (Van L o o , 2002) .
N O , emissions may be e f f ic ien t ly reduced by secondary measures such as Selective Catalyt ic
R e d u c t i o n ( S C R ) o r non-catalyt ic reduc t ion ( S N C R ) , w h i c h are se ldom applicable i n smail-
and m e d i u m sized boilers, however , main ly f o r economic reasons. ( N o r d i n , 1991). T y p i c a l
emissions f r o m smaller biomass plants may be relat ively h i g h , i n excess o f 120 m g N O , M J '
based o n fue l i n p u t . T h e best boilers i n the thermal o u t p u t order o f 100 M W are generally
be low 20 m g M J ' , b u t then by using S C R . (Zethraeus, 1999).
Pollutants i n the f o r m o f N O , contr ibute to the f o r m a t i o n o f acid ra in and pho tochemica l
smog. N i t r o u s ox ide ( N , 0 ) is a green house gas and contributes to the global w a r m i n g .
A t present, no o f f i c i a l regulations f o r small- and m e d i u m scale biomass distr ict heat ing plants
concerning emissions o f C O , N O , or particles exist i n Sweden, bu t there are r e commended
l imits . N e w heat ing plants i n the thermal ou tpu t range o f 0.5 to 10 M W must be repor ted to
the m u n i c i p a l counc i l . Table 3 shows the recommendat ions app ly ing to clean w o o d b u r n i n g
appliances accord ing to V a n L o o et.al (2002).
T A B L E 3. Emission recommendations for wood burning appliances. (Van Loo et.al, 2002)
Thermal output \MW\ CO jmg M f f NO,, jmg M f ' j Particles fmg Nm f"
<0.5 500 m g N m ' 3 * - 350
0.5-10 90 (day-mean) 100 100 (urban areas)
180 (hour-mean) 350 (rural areas)
> 1 0 90 (day-mean) 100 35
180 (hour-mean)
I n dry f lue gas, 11 v o l % O ,
For small-scale domestic furnaces w i t h thermal outputs b e l o w 50 k W , the emissions o f organic
gaseous compounds ( O G C ) are howeve r regulated. For p r i m a r y heat ing sources, i.e. boilers,
emissions should no t exceed 150 m g N n T ' dry gas at 10% O , .
I n N o v e m b e r 1989, the N o r d i c C o u n c i l o f Minis ters decided to i n t roduce vo lun ta ry , posit ive
Ecolabel l ing i n the N o r d i c reg ion . N o r d i c Ecolabe l l ing has developed cri ter ions f o r b u r n i n g
solid biofuels i n boilers o f thermal outputs up to 300 k W t l l . I n order t o be approved, t w o tests
must be carr ied ou t by an accredited laboratory, whe re the bo i l e r should be operated at
17

n o m i n a l the rmal ou tpu t and three levels o f l o w e r load , 20, 40 and 60% o f the n o m i n a l ou tput .
A comple te test repor t i n w h i c h the laboratory certifies that the results f r o m the n o m i n a l load
and the average values o f the l o w load test do n o t exceed the emissions l imi t s presented i n
table 4. ( N o r d i c Ecolabell ing, 2000).
T A B L E 4. Emission criterions to be approved by the Nordic Ecolabelling.
Thermal output (P) [kW] OCC ImgNm3]" CO jmg Nm'3]' Particles [mg Nm'3!*
< 100 70 1000** 70
1()()<P < 300 50 500** 70
I n dry f lue gas, 10 v o l % O ,
** V a l i d l o r boilers w i t h automatic f u e l feeding
A l i m i t o f N O x emissions is at present considered f o r inc lus ion . ( N o r d i c Ecolabel l ing, 2000) .
P R O B L E M F O R M U L A T I O N
As s h o w n i n figure 2, large amounts o f e lect r ic i ty and o i l are at present used f o r heating
purposes, i n part icular i n the detached house sector. Since the Swedish par l iament aims to
phase o u t the country 's largest electrici ty producer , nuclear power , i t is o f great impor tance to
pu t effor ts i n t o reduc ing the use o f electric heat ing. I n add i t ion , electricity is a h i g h qual i ty
energy p r o d u c t and should be used f o r other purposes than heat ing up houses. O n e measure
c o u l d be to conver t f r o m o i l - and electric heating t o distr ict heat ing based o n renewables, such
as biomass. Th is w o u l d on the one hand decrease the emissions o f green house gases to the
atmosphere and o n the other facilitate the planned nuclear phase o u t and thereby con t r ibu te to
a m o r e sustainable energy supply system.
As m e n t i o n e d earlier, district heating is a w e l l estabhshed technology , bu t f o r the most part i n
large communi t i e s . Large district heating systems have the highest compet i t ive strength i n areas
w i t h dense settlements and are therefore main ly ut i l i sed i n blocks o f flats and other dwel l ings ,
also s h o w n i n figure 2. This means that, i f the use o f distr ict heat ing should increase, i t may be
expected that installations o f small- and m e d i u m scale distr ict heat ing systems, m a i n l y supplying
heat to the detached house sector, w i l l increase. T h e m a i n problems f o r f u r t h e r u t i l i sa t ion o f
such plants are o f the f o l l o w i n g natures;
• E c o n o m i c
H i g h capital costs i n relat ion to the to ta l annual heat del ivery f o r systems i n sparsely popula ted
areas make i t d i f f i c u l t to meet the p ro f i t ab i l i t y demands. A d d i t i o n a l l y , the c o m p e t i t i o n w i t h
inexpensive and convenient electric heating has made i t even m o r e d i f f i c u l t to establish smaller
systems. (Swedish Na t iona l Energy A d m i n i s t r a t i o n , 2003a). I t is therefore o f great impor tance
t o have reasonable investments and operat ion costs i n order to facilitate fu r the r u t i l i sa t ion .
• E n v i r o n m e n t a l
Small plants fired w i t h unre f ined biomass w i l l experience variations o f the combus t ion
propert ies o f the fue l , i n this case its particle size and above al l , its moisture content . T h e latter
may vary i n the range o f 25-55% f o r wood-ch ips and l o g g i n g residues, d o w n to b e l o w 10% f o r
s a w m i l l residues. T h e particle size w i l l also vary, due to the fibrous structure o f the w o o d ,
w h i c h makes i t d i f f i c u l t to break i t up i n t o reasonable isometr ic particles. (Zethraeus, 1999).
Fu r the rmore , Zethraeus (1999) concludes that a small p lant w i l l experience a m o r e variable
f u e l qua l i ty than larger plants. T h e variations o f moi s tu re con ten t o f the f u e l f e d i n t o the
furnace w i l l cause variations o f the adiabatic f lame temperature as w e l l as f luc tuat ions o f the
18

local o x y g e n concen t ra t ion i n the furnace. T h e latter occurs main ly since the wate r vapour
dilutes the c o m b u s t i o n air. Th i s means that the condi t ions f o r hydrocarbon b u r n o u t w i l l vary,
and therefore also the emissions o f C O , T H C and P A H . Consequently, small plants must pu t a
high d e m a n d o n the qual i ty o f the fue l , mean ing that f r o m the env i ronmenta l o r combus t ion
technology p o i n t o f v i e w , pellets or briquettes should be most suitable. O n the o ther hand, this
may i n m a n y cases be questionable f r o m an economic p o i n t o i v i e w , since upgraded fuels are
more expensive and efforts have to be pu t i n t o keeping the operat ion costs d o w n . T h e cur ren t
prices o f w o o d - c h i p s and pellets/briquettes are SEK 130 and SEK 186 per M W h , respectively.
(Swedish N a t i o n a l Energy A d m i n i s t r a t i o n , 2003b) .
Moreove r , Karlsson et al. (1997) have studied the best exist ing technology f o r biomass fired
heating plants i n the the rmal ou tpu t range o f 0.5 to 10 M W , from the v i e w p o i n t o f emissions.
Several tests have been p e r f o r m e d w i t h d i f ie rent fuels, heat loads and types o f furnaces. T h e
results o f the study show that emissions o f incomple te combus t ion products are re la t ively l o w
at h igher heat loads, typica l ly b e l o w 500 m g N n T 3 and 8 m g N n T 3 , respectively. H o w e v e r , the
study also showed that plants p roduced a large amoun t o f pollutants l ike C O and T H C , up to
12 000 m g N m " and 2 000 m g N n T , respectively, d u r i n g l o w as w e l l as v a r y i n g thermal
output . I n smaller distr ict heat ing ne tworks supplied w i t h on ly one boiler , such load variations
cannot be avoided. For example, d u r i n g summer, the space heat ing demand m a y be considered
very l o w or non-exis tent . T h e demand f o r ho t tap water is approximate ly the same,
independent o f season, b u t the variations o f the demand over the day are large. D u e to this,
the bo i l e r must be able to w o r k w i t h a vary ing thermal ou tpu t i n the range of 10 to 100% o f
the n o m i n a l ou tpu t , since the average heat demand d u r i n g summer is estimated to be a round
10% o f the m a x i m u m demand i n win te r . A t such l o w thermal outputs, most exis t ing biomass
fuelled boilers must be operated using o n / o f f con t ro l , generally result ing i n h i g h emissions o f
PIC and l o w ef f ic iency .
There are h o w e v e r solutions to reduce the n u m b e r o f operat ion hours at l o w heat load and
o n / o f f c o n t r o l . O n e is to use solar heat p o w e r f o r ho t water preparation outside the heat ing
per iod as w e l l as space heat ing support. (Faninger, 2000) . T h e most c o m m o n w a y o f u t i l i s ing
solar heat i n c o m b i n a t i o n w i t h district heating i n Sweden and other countries i n Scandinavia is
to b u i l d solar col lec tor fields close to the heating plant. Several plants o f this type are i n
operat ion i n the southern and midd le parts of Sweden, bu t none i n the n o r t h e r n part at
present. T h i s is m a i n l y due to the f o l l o w i n g factors:
• L o w e r prices f o r e lectr ic i ty due to l o w e r taxes i n this part o f the coun t ry .
• L o w solar i r rad ia t ion w h e n the demand f o r heat is h i g h .
• Sparsely popula ted areas, w h i c h requires l o n g d i s t r ibu t ion ne tworks .
The m a i n p r o b l e m o f this so lu t ion is that the l o n g d i s t r ibu t ion ne tworks result n o t o n l y i n a
larger inves tment , bu t also i n large heat losses, i n part icular d u r i n g summer , i f calculated as
percentage o f the del ivered heat.
A c c o r d i n g to V a n L o o et.al (2002), development o f furnaces w i t h h i g h f l e x i b i h t y regarding
biomass f u e l qual i ty ( m u l t i f u e l combus t ion systems) is one m a j o r goal. Such furnace may be
w e l c o m e d by f o r example horse stable owners, w h o current ly have o r w i l l experience
problems i n ge t t ing rid o f the residues from horsebox cleaning. A t present, the waste is
generally deposi ted at landfi l ls or spread o n arable land. D u e to the earher m e n t i o n e d
p r o h i b i t i o n o f disposal o f organic material at landfil ls , there is a great interest amongst stable
owners i n finding practically, env i ronmenta l ly and economica l ly sustainable alternatives f o r
management o f the horse manure . O n e o p t i o n cou ld be to use the refuse as f u e l f o r local heat
19

generat ion. T h i s w o u l d o n the one hand significantly reduce the a m o u n t o f refuse and o n the
other reduce the cost f o r hea t ing the stable facilities.
Objectives and scope of the research
T h e m a i n ob jec t ive o f this w o r k was to study possibihties to accompl ish an e n v i r o n m e n t -
f r i end ly and economic heat ing system fo r small district heat ing ne tworks .
As expla ined earlier, the problems w i t h available techniques are that
• H i g h emissions occur d u r i n g l o w - and varying heat loads
• D r y fuels l i ke pellets and briquettes may be requi red , w h i c h are relat ively expensive
This w o r k was focussed o n investigating the possibihties to develop a furnace that can manage
wet w o o d - c h i p s i n the thermal ou tpu t range o f 10-100% o f the n o m i n a l o u t p u t w i t h
main ta ined l o w emissions o f h a r m f u l substances, l ike C O , N O , and T H C . Fur the rmore , the
system shou ld be able to handle fast and large heat load f luc tuat ions w i t h small env i ronmenta l
impact .
In order to i m p r o v e the opera t ion condit ions f o r biomass fired furnaces installed i n small
district hea t ing systems and to reduce the heat losses d u r i n g summer , a solar assisted system
w i t h t w o d i f fe ren t system solutions was theoretically investigated and compared .
A n o t h e r challenge was t o t ry t o use horse manure m i x e d w i t h d i f f e ren t types o f bedd ing
materials as f u e l f o r heat generat ion. Th is is o f great interest a m o n g the horse owners , w h o w i l l
have prob lems i n ge t t ing r i d o f the horse manure w h e n the n e w l a w o n organic material
deposi t ion comes i n t o force .
20

SUMMARY A N D C O M M E N T S O N T H E A P P E N D E D PAPERS
I n this section, the contents o f the appended papers and the most impor t an t results presented i n
these are summarised and i n some cases complemen ted w i t h remarks and comments . F ive o f
the papers have been publ ished i n or submi t ted to in ternat ional journals , w h i l e t w o o f the
papers have been or w i l l be publ ished i n conference proceedings.
The exper imental w o r k was carried ou t i n a test plant that was part ly designed b y the author
and installed i n the t o w n o f B o d e n , Sweden. T h e plant and the n e w l y developed furnace are
described i n detail i n appendix I and I I . T h e measuring equipment used i n the experiments and
the measuring uncertainties are described i n appendix I I I .
P A P E R I
Design of a secondary combustion chamber for a 350 kWwood-chips fired furnace
This paper is focused o n describing the design o f a secondary air supply arrangement a imed at
obtaining a good m i x be tween the secondary air and the combust ible gases i n the larger
combust ion chamber. T o f i n d an as o p t i m a l design as possible, the commerc ia l C F D - c o d e
C F X has been used t o f i n d ou t h o w to m i x the t w o flows. Details about the C F X - c o d e may
be f o u n d i n the C F X User Ma nua l . ( A E A Techno logy , 1997). I n order to evaluate the
effectiveness o f the secondary zone, measurements o f the gas compos i t i on before the secondary
air supply and emissions o f P I C have been carried ou t and compared.
The geometry o f the secondary zone and the design o f the secondary air supply arrangement
are described i n appendix I . T h e simulations d i d n o t include any chemical reactions, bu t were
focussed o n the m i x i n g behaviour o f the t w o gas streams. B y using detailed studies o f the
region i n w h i c h the m i x i n g takes place i t was possible to predic t the per formance o f d i f fe ren t
configurations o f air supply. T h e variable used to opt imise the m i x i n g was the diameter o f the
secondary air inlets, i nd i r ec t ly a f fec t ing ei ther the j e t ve loc i ty or the n u m b e r o f holes and the
hole to hole distance. T h e temperature o f the combust ible gases was set to 8 0 0 ° C and the p re
heated secondary air to 5 0 0 ° C . These figures had to be assumed, since n o measurement data
was available at this t i m e . W i t h d i f fe ren t temperatures o f the gas streams, the temperature
dis t r ibut ion above the pipes can be used as a g o o d indica tor o n h o w w e l l the gases m i x .
Figure 5 shows the resul t ing temperature d i s t r ibu t ion f o r the con f igu ra t i on that gave the best
m i x i n g behaviour.
F I G U R E 5. Temperature (K) in the mixing zone. Tiie distance between the pipes is 70 mm.
21

T h e predict ions indicate that the m i x i n g o f the gas f r o m the p r imary zone and the combus t ion
air is no t as g o o d i n the w a l l r eg ion as i n the centre o f the flow, i n the f igure il lustrated as
higher temperatures. This is h o w e v e r d i f f i c u l t to avoid . As s h o w n i n f igure 5, the temperature
d i s t r ibu t ion a f e w centimetres above the pipes is relatively even, meaning that the t w o flows
may be considered t o be w e l l m i x e d .
Figure 6a-b shows the results o f the gas compos i t i on measurements before adding the
secondary air and the resulting emissions, respectively.
Depth Time
F I G U R E 6 A - B . The left figure (a) shows the gas composition before the secondary air supply at different
depths of the furnace. Each point in figure 6a represents an average value during three minutes of
measurements. The right figure (b) shows the composition of the stack gases during the experiment. This
measurement was carried out simultaneously with the measurements inside the primary zone.
T h e measurements before the secondary air supply were carried ou t at a loca t ion s h o w n i n
figure I V i n appendix I . T h e results show that the r educ t ion o f C O is signif icant i nd ica t ing that
the secondary combus t ion chamber works w e l l . T h e gases leaving the p r imary zone had an
average content o f C O o f a round 26 200 p p m , w h i l e the average C O emission amounted to
189 p p m . T h e ma jo r r educ t ion is due to that the gas temperature be ing h i g h enough and the
combust ible gases and the secondary air be ing w e l l m i x e d .
As s h o w n i n figure 6b, large fluctuations i n the O , content occurred d u r i n g the exper iment ,
causing temporary O , deficits result ing i n h i g h peaks o f C O . This p r o b l e m is discussed i n a
previous paper by L u n d g r e n et.al (2001). I n that paper, the results o f the i n t r o d u c t o r y
experiments are presented, w h i c h showed that p r imary air supplied t h r o u g h the grate i n this
type o f furnace yielded an ine f f i c i en t combus t ion process result ing i n h i g h emissions o f C O
every t ime the pis ton used f o r f u e l feed ing made a stroke. T h e emission peaks disappeared
w h e n the air supply t h r o u g h the grate was closed. Figure 7 clearly illustrates this.
Time (min)
F I G U R E 7. Emissions of CO standardised to 10 vol% 0 2 with and without primary air through the
grate
22

W i t h p r i m a r y air supplied t h r o u g h the grate, i t is bel ieved that holes i n the f u e l bed were
fo rmed . W h e n the p i s ton pushed n e w f u e l over these holes, the gasification process got very
intense causing lack o f oxygen and h igh peaks o f C O . Supply o f addi t ional combus t ion air at
the times o f p is ton strokes m i g h t have solved the p r o b l e m , b u t this approach was no t
considered as practical.
Howeve r , w i t h o u t the p r i m a r y air t h r o u g h the grate, problems w i t h large amounts o f u n b u n i t
fuel occurred. I t was therefore decided to redesign the p r imary air supply arrangement and let
parts o f the p r i m a r y air be supplied t h r o u g h the s idewalk and parts f r o m above the f u e l bed
through a pipe i n the f r o n t o f the furnace. Th is m e t h o d w o r k e d ou t w e l l and no fu r the r
changes o f the air supply system were made d u r i n g the projec t .
P A P E R II
Experimental studies of biomass boiler suitable for small district heating networks
Results o f experiments at constant thenna l outputs after the redesign o f the p r imary air supply
arrangement are presented i n this paper. O n e o f the objectives o f these studies was to
investigate i f i t is possible to r u n the boi ler d o w n to 10% o f its n o m i n a l thermal ou tpu t w i t h
maintained l o w emissions o f u n b u r n t gases. A n o t h e r was to investigate the inf luence o f the f u e l
moisture content o n the combus t ion process.
Figure 8 shows a summary o f results obtained d u r i n g steady state condi t ions i n the complete
thermal ou tpu t range o f the furnace, 50 to 500 k W .
50 60 150 175 200 250 350 500
T h e r m a l ou tpu t ( k W )
F I G U R E 8. Average emissions of CO, NOx, THC and excess air ratios during steady-state operation.
Tlie emissions are standardised to 10 vol% 0 2 .
As shown i n the f igure , the emissions o f C O and T H C are l o w i n the entire thenna l o u t p u t
range, b e l o w 105 m g N m 3 and 2 m g N n T 3 respectively. A t t henna l outputs exceeding 60 k W ,
the emissions o f C O are even l o w e r , b e l o w 25 m g N n T 3 . T h e emissions o f N O x are typical ly
i n the range o f 120 m g N n T 3 to 190 m g N m 4 . (AH figures standardised to 10 v o l % O , ) .
Several tests were p e r f o r m e d at d i f fe ren t thermal outputs w i t h d i f fe ren t f u e l moisture contents
i n the range o f 30% up to 58%. Figure 9 and 10 show results o f experiments i n the large
23

combus t ion chamber w h e n using wood-ch ips w i t h mois ture contents o f 35% and 58%,
respectively.
1000 - \
£ 800 Hi £ I i 6 0 0 H
8 4 0 0 H
Ü 200 H a E
T e m p e r a t u r e
0 2 — A
C O
20
H 15 P
h 10 3
H 5
0 T 1 I
0 1 2 3 4
Time (h)
F I G U R E 9. Temperature before the secondary zone, 0 2 content and CO emissions (normalised to 10
vol% 0 2 ) . The fuel moisture content was 35%.
O 4 0 0 0 H
C . 3000 H
h 20
i l 1 1 r 0 2 4 6 8 10
Time (h)
FIGUFCE 10. Temperature before the secondary zone, O, content and CO emissions (normalised to 10
vol% O f ) . The fuel moisture content was 58%.
As s h o w n i n the figures, the start up phase is s ignif icantly longer w h e n using a f u e l w i t h higher
mois ture content . H o w e v e r , du r i ng steady-state condi t ions , the heat transfer rate f r o m the
ceramics is h i g h enough i n b o t h cases to cause an ef f ic ient d r y i n g process. I t is therefore
possible to keep the gas temperature level above 8 0 0 ° C and thereby obtain an eff ic ient
combus t ion process.
A f t e r one w e e k o f cont inuous operat ion at va ry ing thermal o u t p u t (150-350 k W ) , the thermal
ef f ic iency calculated as the ratio be tween del ivered- and supplied energy amounted to 83%.
T h e stack gas losses corresponded to 1 1 % assuming an ambient temperature o f 2 5 ° C , w h i l e the
loss due to C O emissions amounted to 0.02%. T h e surface temperature o f the furnace was no t
measured, m a k i n g i t d i f f i c u l t to p e r f o r m a complete energy balance.
T h e smaller combus t ion chamber appeared to be more sensitive f o r h i g h f u e l moisture
contents than the larger modu le , ind ica t ing that the smaller combus t ion chamber is no t
24

opt imal ly d imensioned. For example, the distance f r o m the p r i m a r y - to the secondary zone is
too large and should be decreased i n order to decrease the c o o l i n g rate o f the combust ib le
gases.
Compared to the emissions o f P I C presented i n table 2 concern ing h igh and poor qual i ty
design o f combus t ion equipment , the developed furnace may be regarded to be o f the f o r m e r
standard. T h e emissions o f C O are also b e l o w the r ecommended l imi ts according to table 3
and the C O emission c r i t e r ion set by the N o r d i c Ecolabel l ing according to table 4.
These results were h o w e v e r obta ined under steady state condi t ions and the results m i g h t no t
necessarily be val id w h e n there are rapid variations in the heat load. This is the reason whs
experiments were also made w i t h vary ing heat loads, presented i n paper I I I .
P A P E R I I I
Experimental studies during heat load fluctuations in a 500 k W wood-chips fired boiler
In this paper, results o f several l o n g - t e r m experiments w i t h fluctuating thermal ou tpu t are
presented. O n e exper iment w i t h stepwise thermal ou tpu t variations be tween 50 k W and 500
k W was carried ou t f o l l o w e d by experiments where simulated heat demands o f d i f f e ren t
seasons were matched i n order to study the per formance o f the system i n more realistic
operation condi t ions. T h e experiments were p e r f o r m e d by using either the furnace on ly or the
furnace together w i t h the heat store. Comparisons be tween the t w o strategies have been made
concerning emissions and per formance .
Figure 11 shows the in tended var ia t ion o f the the rmal ou tpu t d u r i n g the experiments w i t h
stepwise variations. Each thermal ou tpu t level was a imed to be mainta ined f o r at least one h o u r
dur ing steady state condi t ions .
600 n
0 I - I I I - I I I i T I —
1 2 3 4 5 6 7 8 9
Time (h)
F l G U P l E 1 1 . Experimental procedure. Stepwise thermal output variations
Figure 12a-b shows the var ia t ion o f the thermal ou tpu t and the result ing emissions o f C O and
N O , d u r i n g the experiments w i t h stepwise variations w i t h as w e l l as w i t h o u t the heat store.
25

Delivered thermal output 600-1
F I G U R E 1 2 A - B . Experiments with stepwise thermal output variations. The left figure (a) shows the
result when the heal store was used to manage the fluctuations. The right one (b) shows the result when
the combustion chamber handled the variations by itself.
T h e average emissions o f C O and N O , d u r i n g the experiments are shown i n table 5.
Three di f ferent seasons were exper imental ly simulated; w in te r , summer and spr ing / fa l l . T h e
space heating demand was assumed to vary l inearly w i t h the outside temperature w i t h
m i n i m u m (0 k W ) at + 1 7 ° C and m a x i m u m (300 k W ) at - 3 0 ° C . T h e exper imenta l ly simulated
heat load peaks, due to increased ho t tap water use du r ing m o r n i n g , l u n c h , d inner and
evening, were set manual ly by either increasing/decreasing the f u e l - and air supply rate or
l oad ing / un load ing the heat store. I t is, however , very d i f f i cu l t to foresee the exact size o f the
heat load peaks i n a real n e t w o r k . These w i l l depend o n the type o f consumer and size o f the
n e t w o r k . Therefore , i t was o f a greater interest to study the result ing emissions and h o w fast
the system responded to a load change. T h e heat load peaks were in tended to last f o r
approximate ly one to t w o hours and to be i n the range o f 150 to 200 k W . T h e experiments
were carried ou t w i t h the furnace alone as w e l l as w i t h the furnace together w i t h the heat
store.
Table 5 shows average emissions o f C O , N O , and T H C du r ing thermal o u t p u t variations.
T A B L E 5. Average emissions during experiments with thermal output variations
Gas component Unit Heat store No heat store
Stepwise thermal output variations
C O [ m g MJ" ' ] 3 30
N O , [ m g MJ" 1 ] 80 81
T H C f m g M L 1 ! 0.2 0.3
Winter season
C O [ m g MJ" 1 ] 4 5
N O , I m g M J ^ l 91 91
Spring/fall season
C O [ m g MJ" ' ] 23 15
N O , [ m g M J - ' l 61 83
Summer season
C O [ m g M J 1 ] 16 -N O , r m g M f l 91 -
26

The results show that the average emissions o f C O were very l o w i n all experiments and, b y a
wide marg in , f u l f i l the emission l i m i t recommendat ions presented i n table 3 as w e l l as the
N o r d i c Ecolabel l ing c r i t e r i on presented i n table 4 re-calculated to equal units . T h e emissions
o f N O , are also b e l o w the recommendat ions i n table 3.
The heat demand d u r i n g summer season is very l o w and can be assumed to be zero w h e n the
outside temperature is + 1 7 ° C or higher . T h e demand f o r ho t tap water is h o w e v e r
independent o f season. I n part icular d u r i n g dayt ime, w h e n the customers need h o t water f o r
showers, laundry and other housework , large heat load fluctuations w i l l occur (Fredriksen et.al,
1993). I n the case where no heat store is inc luded, the boi ler has to be started w h e n the
demand f o r ho t tap wate r increases and stopped w h e n the demand decreases. Th i s w i l l cause
large problems concern ing the abi l i ty to meet the demand and emissions o f air pollutants.
Fur thermore, the start up t i m e o f the boi le r is most l ike ly longer than the du ra t ion ot the ho t
tap water peak, w h i c h means that the demand cannot be matched. For that reason, this
experiment was no t carried out . O n e measure to solve this p r o b l e m c o u l d be to use solar
heating together w i t h a heat store f o r ho t tap water preparat ion d u r i n g summer, w h i c h means
that the bo i l e r does n o t have to be i n opera t ion du r ing this t ime .
P A P E R I V
Solar assisted small-scale biomass district heating system in the northern part of Sweden
I n order to reduce the n u m b e r o f opera t ion hours at l o w heat loads, a solar assisted biomass
district heat ing system is technical ly interesting. I n this paper, a case study o f a p ro jec ted solar
assisted biomass distr ict heat ing system is presented, where a dis t r ibuted solar heat system is
compared to a conven t iona l system w i t h a centrally placed solar col lector f i e l d and heat store.
The m a i n object ive has been to investigate h o w the economy as w e l l as the ef f ic iency o f a
biomass-solar district heat ing system differs be tween the t w o system solutions.
The n e w solar assisted biomass district heat ing n e t w o r k is planned to be located i n a small rural
c o m m u n i t y located a round 20 k m west o f the t o w n o f Lu leå i n the n o r t h o f Sweden. A t
present, the m a j o r i t y o f the households i n the village use electrically heated water radiator
systems. T h e t w o local distr ict heat ing companies i n the n e i g h b o u r i n g cities o f L u l e å and
Boden have at present no i n t e n t i o n to expand their ne tworks i n order to distr ibute heat t o the
village. As the m a j o r i t y o f the households' electric boilers are o l d and w i l l soon be i n need o f
replacement, the local householders ' association consider b u i l d i n g the i r o w n local biomass
district heating plant. I n this study i t was assumed that 70 households w i l l connect to the
ne twork .
The current solar energy c o n t r i b u t i o n to the total energy supply i n the n o r t h e r n part o f the
country o n an annual basis is marginal , ma in ly due to the nor ther ly lat i tude. T h e solar intensi ty
is very l o w d u r i n g at least f o u r months i n the w i n t e r and the highest solar al t i tude angle is
be low 1 0 ° , m a k i n g i t impossible to collect useful energy f r o m the sun d u r i n g this t ime o f the
year w h e n the demand f o r heat is the largest. T h e study was therefore focussed o n using solar
heating f o r ho t tap water preparat ion d u r i n g the summer per iod , f r o m June to Augus t , bu t also
for space heating support d u r i n g the spring and au tumn .
The results o f the study indica ted technical as w e l l as economic advantages o f using a
distributed system solut ion compared to a conven t iona l system w i t h a centralized solar
collector f i e l d and a heat store. Figure 13 shows sketches o f the t w o systems.
27

F I G U R E 13. Solar assisted biomass district heating with central- and distributed system solutions
Calculations o f the culver t heat losses i n the projec ted district heating n e t w o r k showed that i t
may be possible to reduce the losses by 82 M W h a" , equivalent to a round 1170 k W h per
household and year i f the connected households generate the i r o w n ho t tap water d u r i n g
summer. I n relat ion to the estimated solar col lector o u t p u t f o r one household over a year, the
heat loss r educ t ion is significant, corresponding to a round 7 9 % o f the total solar col lector
ou tpu t . This means that i n order to generate the equal a m o u n t o f useful solar energy f o r a
col lector field, the area has to be increased by rough ly 4 n r per household. T h e economic
calculations are summarised i n table 6.
T A B L E 6. Total annual energy cost per household for different heating alternatives
Option Annual energy cost* ISEK a'1 j
Electr ic heating, existing electric bo i le r 23 250
Biomass fue l l ed district heating 28 740
Biomass and solar based district heating 29 570
centrahsed design
Biomass and solar based district heating 28 600
dis t r ibuted design
* I n c l u d i n g heat and electr ici ty
As s h o w n i n the table, the dis t r ibuted so lu t ion resulted i n a l o w e r annual energy cost f o r the
connected customer than the centralised system. A n o t h e r interest ing result, no t inc luded i n the
paper, was that, based o n the economic figures used i n this study, the distr ibuted so lu t ion
resulted a l o w e r annual cost than a convent iona l biomass fue l l ed district heating system w i t h o u t
solar heat. H o w e v e r , the calculations also showed that the annual cost f o r all the distr ict
heat ing alternatives exceeded the customer's present cost f o r electric heating.
28

One o f the reasons w h y the resul t ing annual energy cost f o r the district heat ing alternatives is
h igh is to a large part due to that the energy demand density or n e t w o r k heat ut i l isat ion rate is
very l o w . V a n L o o (2002) claims that i t should exceed 800 k W h per meter culver t and that the
targeted value is 1 200 k W h per meter , w h i l e i n this case i t on ly amounts to a round 500 k W h
per meter calculating w i t h 70 connected households.
I n this study the losses were estimated o n basis o f the average soil temperature over a year. This
w i l l lead to some underest imat ion o f heat losses d u r i n g w i n t e r and overest inia t ion o f the losses
i n the summer per iod . T h e conclus ion that d is t r ibuted system solut ion is m o r e economic than
the centralised w i l l no t be changed.
P A P E R V
Small- and medium scale biomass district heating in Sweden — potential and problems in further utilisation
As the t i t le o f the paper implies , the a i m has been to investigate the possibihties f o r and
obstacles to an expansion o f small scale biomass based district heating i n Sweden. For this
purpose i t is necessary to consider the condi t ions i n the f o r m o f fu tu re biomass f u e l resource
bases and market potentials. T h e latter consist m a i n l y o f the households that at present use
electricity or o i l f o r space heat ing and ho t tap water preparat ion purposes.
The paper also includes economic calculations o f a fictitious biomass district heat ing plant i n
the n o r t h e r n part ot Sweden. T h e resul t ing specific energy cost is compared w i t h the total
specific cost f o r electric heat ing assuming 50 and 90 connected households. Add i t i ona l l y , the
envi ronmenta l and socioeconomic advantages f o l l o w i n g fu r the r ut i l isat ion o f small scale
biomass distr ict hearing are discussed.
A li terature survey has s h o w n that the biomass f u e l resource base w i l l be suff ic ient i n the
foreseeable fu tu re . The re is obvious ly a need f o r smal l - and m e d i u m scale district heating
plants, as a large amoun t o f electr ici ty and o i l is st i l l i n use especially i n the detached house
sector. T h e total electrici ty and o i l use f o r hea t ing purposes i n Sweden totals 42 T W h and
constitutes the m a x i m u m possible po ten t ia l f o r a dis t r ic t heating expansion. Calcula t ing w i t h
an average annual operat ion t i m e o f 4 000 hours, the space f o r n e w installed thenna l p o w e r i n
small- and m e d i u m size biomass fired distr ict hea t ing ne tworks w o u l d a m o u n t to around 10
G W .
The increased use o f biomass f o r energy convers ion has tu rned ou t to i n v o l v e several
advantages f o r employment , and thereby f o r the local economy, as w e l l as f o r the
env i ronment . Assuming that all heat ing o i l used f o r hea t ing purposes (20 T W h ) is replaced by
biomass, means that the emissions o f C O , w o u l d reduce b y 5.4 m i l h o n tonnes per year. Th is
corresponds to 9.8 % o f the Swedish to ta l net emissions o f C O , i n the year 2001 , w h i c h
amounted to 55.3 m i l l i o n tonnes. (Swedish E n v i r o n m e n t a l Pro tec t ion Agency , 2003)
A c c o r d i n g to the Swedish B ioene rgy Associa t ion (2003), an extended use o f 1 T W h o f
biomass fuels may generate be tween t w o - and f o u r h u n d r e d n e w equivalent f u l l t ime jobs .
Consequently, up to 16 000 n e w jobs c o u l d be created i n the next f e w decades. O n l y the
combust ion equipment manufac tu r ing business w i D p r o v i d e jobs f o r approximately 8 000
persons. T h e wages and salaries generated f r o m these jobs p rov ide an addi t ional i ncome to the
local economy.
I t is h o w e v e r o f great impor tance that the resu l t ing cost f o r biomass based district heat ing does
not exceed the customers' present cost f o r heat ing. T h e results o f the economic calculations i n
29

this study show, however , that the cost for biomass district heating is h igher than the cost f o r
electric heating calculating w i t h 50 as w e l l as 90 connected households. T h e electr ic i ty pr ice
has therefore been iden t i f i ed as one o f the m a i n bottlenecks for a fu r the r expansion o f smal l -
and m e d i u m scale district hea t ing , main ly since electric heat ing is c o m m o n l y used i n the
detached house sector and the e lec t r ic i ty pr ice is relatively l o w . For these reasons, i t is ve ry
impor t an t to pu t efforts i n t o k e e p i n g d o w n the investments and operat ion costs i n distr ict
hearing plants a imed f o r this sector. T h e latter may be kept d o w n by using an u n r e f i n e d f u e l
l ike wood-ch ips instead o f an upgraded one l i ke pellets. T h e transport distance f r o m the f u e l
deliverer to the plant must h o w e v e r be taken i n to account. Calculations showed that, at the
current price levels f o r pellets and w o o d - c h i p s , i t is no t cost-effective to transport w o o d - c h i p s
far ther than between 50 and 130 k m , depending o n the moisture content o f the f u e l ,
compared to pellets.
P A P E R V I
Practical, environmental and economic evaluation of different options for horse manure management
T h e m a i n objectives o f this s tudy have been to investigate viable alternatives f o r horse manure
management. T h e considered op t ions are compos t ing f o r recyc l ing to arable land, c o m b u s t i o n
f o r heat generation and biogas p r o d u c t i o n f o r electricity generation.
I n Sweden there are nearly 3 0 0 000 horses (Statistics Sweden, 2000), generat ing a r o u n d 6
m i l l i o n m o f waste annually. T o d a y , this residue is usually spread o n arable land or deposited
at landfi l ls . T h e latter o p t i o n causes economic problems f o r many stable owners , b u t the
greatest drawback is that i t is n o t e nv i ronme n t - f r i end ly and w i l l be p r o h i b i t e d i n the year
2005. There is at present a great interest a m o n g t r o t t i n g course- and r i d i n g school owners i n
signif icantly reduc ing the a m o u n t o f the generated waste by using a practical and economica l
m e t h o d that is also env i ronmen ta l l y ben ign
A b r i e f summary o f the advantages and disadvantages o f the d i f ferent manure management
methods considered are s h o w n i n table 7.
30

T A B L E 7. Advantages and disadvantages of different horse manure management options
Combustion of the manure for heat production
Advantages Disadvantages
• S igni f icant ly reduced cost f o r heating o f • Large emissions o f N O s c o n t r i b u t i n g to soil
the facil i t ies, m a i n l y due to " f r ee" f u e l ac id i f i ca t ion
• Considerable decrease o f the amoun t o f • Increased purchases o f a r t i f ic ia l fertihzers, i f
refuse needed
• Fewer transports o f waste to compost ing • Re la t ive ly large investments requi red
or disposal waste stations and o i l ( i f the • M a y requi re transports o f the ash
stable has o i l based heating) required
Composting
Advantages Disadvantages
• Decreased v o l u m e o f waste, w h i l e the
concent ra t ion o f nutr ients increases
• Possible r educ t i on o f ar t i f ic ia l fert i l izer
purchases
• M a y require transports o f composted
material t o arable l and and f u e l o i l
• Emissions o f N H , , c o n t r i b u t i n g to
eu t roph ica t ion and ac id i f i ca t ion '
• T h e composted material may inc lude
u n w a n t e d oat weeds
• Emissions o f N 2 0 and C H 4 , c o n t r i b u t i n g
to the global w a r m i n g
Biogas production
Advantages Disadvantages
• Considerable r educ t i on o f the waste • M a y w o r k o n l y as a supplementary heat
v o l u m e source as the generated heat may n o t cover
• Fewer transports o f waste to compos t ing the comple te heat demand
or disposal waste stations • Large investments requi red and thereby
• Small env i ronmen ta l impac t relat ively h i g h annual cost
• T h e residue may conta in unwan ted oat
weeds, i f i t is spread o n arable land
• Transports o f the residue may be requi red
Swedish E n v i r o n m e n t a l P ro tec t ion Agency (2004)
I t is d i f f i c u l t to make a general comparison o f c o m b u s t i o n o f horse manure w i t h o ther
alternatives f r o m the v i e w p o i n t o f the economy and env i ronmen ta l in f luence . I f , f o r example,
the stable facihties are heated by district heating and inc lude large arable l and areas o n w h i c h
composted horse manure may be spread and used as fer t i l izer , i t is d o u b t f u l w h e t h e r i t w o u l d
be advantageous to install a furnace to b u r n the waste and be fo rced t o b u y ar t i f ic ia l fert i l izers
instead. O n the o ther hand, i f the stable uses electrici ty o r o i l f o r heat ing purposes and has no
arable l and i n the v i c i n i t y , i t is at least economical ly p rof i t ab le to invest i n a heat ing plant that
enables use o f horse manure f o r heat p roduc t i on .
This has been s h o w n i n a case study o f a riding school located i n the t o w n o f T i m r å i n the
middle part o f Sweden, w h e r e the first commerc ia l vers ion o f the n e w l y developed furnace,
described i n A p p e n d i x I and I I , is installed. T h e riding school has 50 horses, w h i c h annually
produce a round 1 000 m 3 o f waste. T h e total annual heat demand amounts to 400 M W h ,
w h i c h approximate ly corresponds to ha l f o f the energy available i n the refuse. Previously, the
stable had an electric bo i le r installed.
31

E v e n i t transports are required to get rid o f the waste surplus, the calculations show that the
c o m b u s t i o n alternative is the most economica l ly attractive f o r the case i n T i m r å . T h e total
annual cost f o r space heating, ho t tap wate r prepara t ion and waste management is between
S E K 170 000 and SEK 265 000 l o w e r compared to the o ther methods considered.
T h e heat ing plant i n T i m r å was taken i n t o opera t ion i n September 2003 and has since then
been r u n n i n g cont inuously w i t h on ly a f e w shorter in te r rup t ions o f the operat ion. A c c o r d i n g
t o the owner , the plant has been w o r k i n g satisfactory and more than 130 000 k W h o f
e lectr ic i ty has been saved du r i ng September t o December , w o r t h nearly S E K 100 000
calculated at the present electricity price rate i n T i m r å . (Andersson, 2004).
P A P E R V I I
Combustion of horse manure for heat production
T h i s paper presents results o f several c o m b u s t i o n experiments, where a m i x t u r e o f horse
manure and wood-shavings has been used as f u e l . T h e m a i n object ive o f the paper was to
evaluate the combus t ion process and present the resul t ing emissions o f C O and N O x . A n o t h e r
a i m was to investigate the possibil i ty o f r ecyc l ing the ash, ma in ly by analysis o f the heavy
m e t a l - and nu t r i en t content o f the ash. A l l exper iments described i n this paper were carried
ou t i n the larger modu le o f the first vers ion o f the furnace .
C o m b u s t i o n o f horse manure f o r heat genera t ion is n o t h i n g n e w i n Sweden. There are
however , to the author's knowledge , o n l y a t ew plants o f this k i n d i n opera t ion at present and
i t is d i f f i c u l t to f i n d published reports regard ing the subject. Schuster et.al (1997), br ief ly
present emissions f r o m a boi ler using horse manure m i x e d w i t h straw as f u e l , installed at the
t r o t t i n g course i n Fär jes tad close t o the c i t y o f Karlstad, Sweden. T h e results o f the
measurements indicate that the combus t ion e q u i p m e n t i n that plant is no t appropriate f o r this
k i n d o f f u e l . T h e emissions o f C O var ied i n the range o f 1200 to m o r e than 5000 p p m
( A c c o r d i n g to the authors o f the report the m a x i m u m measuring range o f the gas analyser was
5000 p p m ) w h i l e the 0 2 contents var ied b e t w e e n 10 t o 20 v o l % . T h e emissions o f N O s were
i n the range o f 25 to 80 p p m .
Table 8 shows the chemical composit ions o f horse manure m i x e d w i t h wood-shavings and
w o o d - c h i p s .
T A B L E 8. Chemical compositions and measured heating values of wood-chips and horse manure mixed
with wood-shavings
Analysis Method Unit Wood-chips Manure
Sulphur SS 18 71 77:1 % o f D S < 0 . 0 1 0.14
C a r b o n L E C O - m e t h o d 1 % o f D S 49.5-49.8 48.6
H y d r o g e n L E C O - m e t h o d 1 % o f D S 6.1-6.2 5.8
N i t r o g e n L E C O - m e t h o d 1 % o f D S < 0 . 1 0.9
O x y g e n Calculated % o f D S 43.5-44.0 44.3
C h l o r i n e SS187154:1 % o f D S 0.004 0.26
A s h SS 187 177:1 % o f D S 0.5 7.3
H e a t i n g value, calorimetr ic SS-ISO 1928:1 M J / k g D S 20.56 19.37
L o w e r heat ing value SS-1SO 1928:1 M J / k g D S 19.21 18.14
Volat i les SS-ISO 562:1 % o f D S 84.1-84.6
32

As s h o w n i n table 8, the f u e l b o u n d n i t r o g e n is more than 9 times higher i n the manure
mix tu re . T h e results o f the combus t ion experiments p e r f o r m e d i n the n e w furnace described
in appendix I and I I , using the manure m i x t u r e as f u e l , showed that the emissions ot N O s
were s ignif icant ly h igher than f o r wood-ch ips . T h e results also showed that i t is possible to
obtain almost as l o w emissions o f C O as w h e n w e t w o o d - c h i p s were used. T y p i c a l emissions
o f C O and N O , were i n the range 30 m g N n T 1 to 150 m g N n T 1 and 280 to 350 m g N m " at
10 v o l % O , , respectively.
Table 9 shows the measured and the r e c o m m e n d e d m i n i m u m and m a x i m u m concentrat ions o f
nutrients and trace elements i n ash products to a l low recyc l ing to forestlands according to the
Swedish N a t i o n a l Boa rd o f Forestry (2002).
T A B L E 9. Recommended minimum and maximum concentrations in ash products to be recycled to
forests. (National Board of Forestry, 2002)
Standard values Measured values
Elements Lowest Highest
Macro nutrients g/kg DS
Ca 125 110
M g 20 53
K 30 95
P 10 18
Trace elements mg/kg DS
B 500 n.a'
Cu 400 105
Z n 1000 7000 344
As 30 < 3
Pb 300 5
C d 30 < 0 . 1
Cr 100 1000
H g 3 < 0 . 1
N i 70 378
V 70 70.8
Organic pesticides mg/kg DS
Total P A H (tentative) 2 n.a'1
a not analysed
The results show that the ash contained a l o w e r ca lc ium concent ra t ion than the recommended ,
w h i c h may inf luence the self hardening abi l i ty . W o o d ash generally contains a h i g h
concentra t ion o f ca lc ium and does u p o n storage i n h u m i d chmate self-harden. This is due to
that the ca lc ium i n the ash fo rms ca lc ium hydrox ide , w h i c h reacts w i t h carbon d iox ide
f o r m i n g l imestone. A h igh ca lc ium concent ra t ion means larger coverage o f the particles w i t h
l imestone, w h i l e a l o w concentra t ion means a l o w e r coverage corresponding to a m o r e soluble
ash p r o d u c t w i t h less strength. D u e to this, i t may be d i f f i c u l t to t u rn the ash i n t o an easily
recycled p roduc t .
The measured concentrations o f n i cke l ( N i ) and c h r o m i u m (Cr) i n the ash were h igher than
the r e c o m m e n d e d levels. Analysis o f the m a j o r inorganic components i n the b o t t o m ash
indicated, however , on con tamina t ion o f the ash by some stainless steel, w h i c h may expla in the
higher con ten t o f N i and Cr .
33

T h e m a j o r drawback is that the n i t rogen i n the manure cannot be used as ferti l iser o n
agricultural land, since al l o f the n i t rogen leaves t h r o u g h the ch imney . I n pr inc ip le , the ash
could be used as a fer t i l iser o n agricul tural land as w e l l as forestlands. T h e ash contains
substantial amounts o f phosphorus, w h i c h ought to be recycled to farmlands i n many cases i n
order no t to l o w e r the depot o f phosphorus i n the g r o u n d . I t has been shown that the
phosphorus i n the ash after c o m b u s t i o n exists i n chemical structures less accessible to plants
than i n manure . I t has been c la imed that this is a drawback o f ashes, bu t L i n d e r h o l m (1997)
stated that on ly 0.01 % o f the phosphorus i n the g r o u n d is accessible to the plants anyway, and
that i t is o f h t t le impor tance i n w h i c h chemical f o r m the phosphorus is added to the depot .
M o r e ash analysis is h o w e v e r needed, before i t can be stated whe ther the quota be tween
phosphorus and heavy metals is h igher or l o w e r than i n the phosphorus products f r o m the
fertiliser industry . I f the quota we re f o u n d to be acceptable, the ash cou ld be considered f o r
agricultural l and as w e l l forests.
34

A D D I T I O N A L E X P E R I M E N T A L W O R K
I n this section, addi t ional experiments no t i nc luded i n any o f the appended papers are
presented.
P A R T I C L E E M I S S I O N M E A S U R E M E N T S
Particle measurements before and after the cyclones at h i g h and l o w thermal o u t p u t levels have
been pe r fo rmed . W o o d - c h i p s were used as f u e l d u r i n g these experiments. T h e results are
shown i n table 10, bu t are no t i nc luded i n any o f the appended papers.
T A B L E 10. Measuring conditions and particle emissions at 10 vol% 02
L o w t h e n n a l ou tpu t H i g h thermal ou tpu t
Befo re cyclone A f t e r cyclone Befo re cyclone A f t e r cyclone
Gas v o l . (1) 294.3 323.2 1871 1516
T e m p . ( °C) 15.9 14.8 23 23.5
A i r pressure 994 994 1015 1015
(mbar)
T o t . particle 17.8 24.6 236.2 133
weight (mg)
Particle emission 64.39 80.72 134.85 93.88
d.b ( m g N n T 3 )
Particle emission 58.64 67.84 111.92 77.52
w .b ( m g N n T 3 )
Surprisingly, the result shows that the part icle emissions are larger after the cyclone d u r i n g the
experiment at l o w thermal ou tpu t . T h e reason f o r this is still unclear. A l l measured values are
however be low the emission levels presented i n table 2 regarding h i g h standard combus t ion
equipment .
C O M B U S T I O N O F H O R S E M A N U R E M I X E D W I T H S T R A W
O n basis o f the operational experiences and the results o f the experiments presented i n paper
V I I , a n e w version o f the furnace was recent ly developed and installed at the test site i n B o d e n .
The largest differences compared to the f o r m e r version are that the n e w one on ly has one
single combus t ion chamber, w i t h a m a x i m u m thermal ou tpu t o f a round 250 k W , and
automatic ash feeding conveyor . O t h e r differences w o r t h m e n t i o n i n g are that the diameter o f
the feeding screws is larger and the p is ton is d r iven by an electric m o t o r instead o f hydraulics.
This furnace is ident ical w i t h the furnace installed at the r i d i n g school i n T i m r å .
A f e w combus t ion experiments have been carried ou t using horse manure m i x e d w i t h straw as
fuel . These tests tu rned ou t to be m o r e chal lenging than the ones w i t h horse manure and
wood-shavings. Figure 14 shows the results o f one o f the first tests, whe re manure m i x e d
wood-shavings was used i n the b e g i n n i n g to heat up the furnace. T h e manure and straw
mix tu re entered the system after approximate ly 190 minutes o f operat ion, causing a m o r e
unstable combus t ion process w i t h relat ively large O , - and emissions fluctuations, as s h o w n i n
the figure.
35

O 50 100 150 2 0 0 2 5 0 3 0 0 3 5 0
T ime (min)
F I G U R E 14. Emissions of CO and N O , and 0 2 content during the experiment with straw mixed with
horse manure. (Emissions normalized to 10 vol% Of
T h e m a i n reason f o r this was that the f u e l feed ing rate var ied f requent ly due to bad f u e l qual i ty
and the fact that the feeding system is no t designed f o r l o n g straws. A d d i t i o n a l l y , the f u e l
m i x t u r e was delivered f r o m the southern part o f Sweden and arr ived several weeks before the
tests t o o k place, w h i c h caused the f u e l to begin to m o u l d . I t is therefore uncer ta in i f the
qual i ty o f the test f u e l was representative.
T h e average emission o f C O was at any rate satisfactorily l o w d u r i n g the exper iment , a round
50 m g N n T J . As shown i n the f igure , the emissions o f N O , increased w h e n the s t raw/manure
m i x t u r e entered, f r o m a level o f approximate ly 250 m g N m " to nearly 400 m g N n T 1 .
A n o t h e r p r o b l e m that occur red was s inter ing o f the ashes. I t is generally k n o w n that ashes o f
straw, w h i c h has a l o w content o f Ca and a h i g h content o f K , start to sinter and mel t at
considerably l o w e r temperatures than w o o d fuels. T h e sintered ashes were discovered after the
exper iment , w h e n relat ively large cakes had been f o r m e d o n the grate. N o p r o b l e m occurred
h o w e v e r i n the ash conveyor d u r i n g the test. Further experiments are h o w e v e r necessary to
investigate i f this w i l l cause ash feeding problems i n the l o n g t e rm.
N o analysis has yet been p e r f o r m e d o f the ashes from straw combus t ion , bu t analysis o f the f u e l
shows that, f r o m the p o i n t o f v i e w o f heavy metal contents, the ash w o u l d f u l f i l the
requirements shown i n table 9. H o w e v e r , the ash does no t originate f r o m w o o d products and
is therefore no t covered by the recommendat ions .
36

C O N C L U S I O N S
The m a i n conc lus ion o f this w o r k is that i t is possible to accomplish a small scale biomass based
heating system that f u l f i l s the env i ronmenta l requirements.
The most i m p o r t a n t results are summarised be low;
• T h e r e is a great potent ia l f o r expansion o f biomass distr ict hea t ing systems i n Sweden.
A t present, the use o f o i l and electr ici ty f o r hearing purposes exceeds 40 T W h and
constitutes the m a x i m u m potent ia l fo r a district heating expansion. Such a development
w o u l d lead to a significant r educ t ion o f C O , emissions and many new j o b
oppor tun i t i es .
• T h e large c o m b u s t i o n chamber enables use o f w o o d - c h i p s w i t h mois ture contents i n
the range o f 30% to 58%. T h e experiments i n the smaller chamber show, o n the
contrary , that the moisture content has a strong inf luence o n the combus t ion process.
• T h e furnace has a w i d e thermal ou tpu t span, i n the range of 10 to 100% o f n o m i n a l
t he rma l o u t p u t w i t h mainta ined l o w emissions o f P I C . T y p i c a l average C O emissions
are b e l o w 25 m g N m " .
• T h e furnace has the abihty to handle fast and large heat l oad var ia t ion w i t h mainta ined
l o w emissions o f h a r m f u l substances, w h e n using the c o m b u s t i o n chamber on ly as w e l l
as w h e n i t is used together w i t h the heat store.
• I t has been s h o w n that the secondary zone works very w e l l , p r o v e n by the significant
r e d u c t i o n o f the C O concent ra t ion o f the gases leaving the p r i m a r y zone. T h e use o f
C F D f o r the design has saved a l o t o f t ime and expensive exper imenta l w o r k .
• D i s t r i b u t e d solar collectors and heat stores installed i n each household connected t o a
dis t r ic t heat ing n e t w o r k , makes i t possible to reduce the heat d i s t r ibu t ion losses
radically compared to a convent iona l system. Calculat ions have also shown that the
d is t r ibuted system is m o r e economical ly attractive f o r a househo ld .
• Several i m p o r t a n t advantages have been iden t i f i ed w h e n us ing horse manure as a f u e l
f o r heat p r o d u c t i o n i n stable facilities. T h e stable and t r o t t i n g course owners w i l l o n the
one hand decrease the cost f o r heating their facihties and o n the other, to a
considerable extent , solve exist ing or fu tu re problems i n g e t t i n g n d o f the residue.
• T h e results of the combus t ion experiments using horse manure m i x e d w i t h w o o d -
shavings as f u e l showed that the emissions o f C O are re la t ive ly l o w , typical ly b e l o w
150 m g N n T ' . T h e emissions o f N O , are h o w e v e r considerably h igher compared to
emissions d u r i n g combus t ion o f wood-ch ips .
37

F U T U R E W O R K
T h e f o l l o w i n g suggestions are made f o r f u r t h e r w o r k pardy i n order to complete the
evaluat ion and i m p r o v e the envi ronmenta l data and the f u e l flexibility o f the furnace and part ly
to create n e w ideas f o r fu tu re research projects.
I N C R E A S E D N O M I N A L T H E R M A L O U T P U T O F T H E F U R N A C E
I t is o f great impor tance to make sure that the p r i m a r y air is equally d is t r ibuted over the grate
and that the air jets are a l lowed to penetrate the f u e l bed. These t w o condi t ions are f u l f i l l e d i n
this furnace , bu t problems may occur w h e n the design is scaled to larger capacities. Th is is due
to the fact that an increased n o m i n a l thermal o u t p u t requires an increase of the furnace w i d t h ,
m a k i n g i t more d i f f i c u l t fo r the pr imary air jets supplied f r o m the s idewalk to reach the centre
o f the f u e l bed. I t is most l ike ly possible to shghtly increase the n o m i n a l thermal ou tpu t ot the
furnace, b u t there is def in i te ly a l i m i t . Fur ther studies are necessary to investigate this issue,
preferable by using C F D - m o d e l l i n g , f o l l o w e d b y tests f o r va l ida t ion o f the predict ions.
F U R T H E R E M I S S I O N S T U D I E S A N D E N V I R O N M E N T A L I M P R O V E M E N T S
Emissions o f particles and P A H should deserve m o r e comprehensive studies than the ones
carried ou t i n this project . Measurements d u r i n g realistic operat ional condi t ions should be
p e r f o r m e d using w o o d - c h i p s as w e l l as horse manure as fuels. T h e latter c o u l d f o r example be
p e r f o r m e d i n the plant i n T i m r å .
I n larger plants, simultaneous gas absorpt ion (SO, , N O , and H C l ) as w e l l as particle removal
may be achieved by using scrubbers. General ly, small scale biomass distr ict heating plants cou ld
n o t a f f o r d this k i n d o f equipment . (Van L o o , 2002) . I t w o u l d therefore be o f a great interest to
t ry to develop simple and affordable stack gas cleaning devices suitable f o r small scale plants,
ma in ly i n order to decrease emissions o f particles b u t also to increase the thermal eff ic iency.
F U R T H E R S T U D I E S R E G A R D I N G C O M B U S T I O N O F H O R S E M A N U R E
D u r i n g storage o f horse manure i n piles, containers or the l i ke , chemica l processes are started
changing the physical properties o f the mater ial . I f horse manure w i l l be used as a fue l , i t is
i m p o r t a n t to k n o w h o w the storage t ime affects the c o m b u s t i o n properties, ma in ly the heat ing
value and the ash content . Measurements o f the chemical c o m p o s i t i o n o f horse manure before
and after a compos t ing process show a s ignif icant r e d u c t i o n o f the carbon content (Steineck
et.al, 2001) , ind ica t ing that the effective hea t ing value will change w i t h the storage t ime . T h e
questions are, h o w m u c h the heating value w i l l change and f o r h o w l o n g i t is possible to store
the m a n u r e w h e n a t tempt ing to use i t as f u e l .
Ef for t s should also be pu t i n to reduc t ion o f N O , emissions, w h i c h h o w e v e r may be d i f f i c u l t
since the emissions originate f r o m the f u e l b o u n d n i t rogen . First o f all , an opt imisa t ion o f the
p r i m a r y excess air ra t io should be carried ou t . I t may even be discussed whe ther a slight
increase o f C O should be a l lowed i n order t o reduce the N O , emissions.
L o n g - t e r m experiments using horse manure m i x e d w i t h straw as w e l l as studies o f possible
s inter ing and f o u l i n g problems du r i ng straw c o m b u s t i o n are requi red . Add i t i ona l l y , an
evaluat ion o f the combus t ion process and the resul t ing emissions us ing other bedding materials
hke peat and paper m i x e d w i t h horse manure as fuels w o u l d be o f interest.
38

F I N A L R E M A R K S
This thesis may be considered to be very broad, spanning over several d i f fe ren t subjects. Some
o f t hem indeed deserved more comprehensive studies than wha t was possible w i t h i n the
available t i m e and economic resources o f this projec t .
The ma in part o f this w o r k was carried ou t w i t h i n a research pro jec t f u n d e d by the European
Commiss ion d u r i n g the years 1998 to 2 0 0 1 . T h e construct ion o f the test p lant i n B o d e n started
i n the end o f 1998 and was comple ted i n the beg inn ing o f the year 2000. T h e first c o m b u s t i o n
experiment was carr ied o u t on February 28 th the same year, meaning that o n l y one and a half-
year, rough ly , was r e m a i n i n g o f the pro jec t w h e n col lec t ion of exper imenta l data c o u l d start.
The ma in a im o f the i n t r o d u c t o r y experiments was to learn h o w the system w o r k e d and to
ident i fy necessary changes of the design. Fortunately, on ly a f e w modi f i ca t ions were requ i red ,
but some o f t h e m were relat ively t i m e consuming.
Another severe pract ical d i f f i c u l t y was related to the use of the distr ict heat ing n e t w o r k as a
heat sink. A large saw m i l l connected to the system caused substantial f luc tua t ions o f the
differential pressure i n the n e t w o r k , w h i c h o f t e n made i t impossible to del iver the generated
heat since the capacity o f the c i r cu l a t i on p u m p was l i m i t e d . Th is occurred d u r i n g many o f the
long t e r m experiments, w h i c h therefore had to be terminated and started f r o m the b e g i n n i n g
again.
These issues caused strict t ime constraints i n the experimental w o r k . Large efforts had to be p u t
into f u l f i l l i n g the most i m p o r t a n t tasks o f the project , w h i c h main ly consisted o f the design o f
the furnace and the evaluation o t its env i ronmenta l performance d u r i n g l o w as w e l l as v a r y i n g
heat load.
Even i f m o r e data regarding the per formance o f the experimental furnace w o u l d have been
desirable and f u r t h e r studies o f some issues treated i n the papers, there are no reasons to bel ieve
that the d r a w n conclusions are n o t va l id .
39

R E F E R E N C E S
A E A T e c h n o l o g y . 1997. C F X User M a n u a l . 8.19 H a r w e l l , D i d c o t , O x f o r d s h i r e O X l l O R A ,
U n i t e d K i n g d o m .
Andersson A . 2004. Personal c o m m u n i c a t i o n . T h e munic ipa l i ty o f T i m r å , Sweden.
European C o m m i s s i o n . 1997. A n energy p o l i c y f o r the European U n i o n . C O M (95) 682.
W h i t e Paper ot the European C o m m u n i t y , Brussels.
Faninger, G . 2000 . C o m b i n e d Solar-Biomass Dis t r i c t Hea t i ng i n Aus t r ia . Solar Energy 69 (6),
425-435.
Flyver Christ iansen H . , Fock M . W . 1997. L C A o f Procurement and C o n v e r s i o n o f Biomass
and Fossil Fuels - used f o r Energy P r o d u c t i o n i n D e n m a r k 1997. Poster presented at the First
W o r l d Confe rence and E x h i b i t i o n o n Biomass f o r Energy and Indus t ry , June 5-9, 2000,
Sevilla, Spain.
Fredriksen S., W e r n e r S. 1993. F j ä r r v ä r m e - T e o r i , t ekn ik o c h f u n c t i o n . Studentl i t teratur ,
L u n d , Sweden.
H o f f e r t M L , Caldeira K . , Jain A K . , Hattes EF . , Harvey L D D . , Pot te r S D . , Schlesinger M E . ,
Schneider S H . , Wat t s R G . , W i g l e y T M L . , Wuebbles DJ . 1998. Ene rgy Impl ica t ions o f Future
Stabilisation o f A tmosphe r i c C O , content . Nature. 395, pp. 881-884.
H o u g h t o n J T . , D i n g Y . , Griggs DJ. , N o g u e r M . , van der L i n d e n PJ., X i a o s u D . 2 0 0 1 . C l ima te
change 2 0 0 1 : T h e Scient i f ic Basis. Cambr idge Univers i ty Press, U K , pp 944.
Jenkins B . M . , Bax te r L . L . , Mi l e s Jr T . R . , Mi l e s T . R . 1998. C o m b u s t i o n propert ies o f biomass,
Fuel Processing Technology 54, pp 17-46.
Karlsson M - L . , Gustafsson L . , M å r t e n s s o n D . , Leckner B . 1997. Analysis o f today's best
available t echno logy f o r biomass fired heat ing plants i n the range o f 0.5 to 10 M W , Techn ica l
report , N ä r i n g s - o c h utveckl ingsverket ( N U T E K ) , S tockholm, Sweden.
L i n d e r h o l m K . 1997. Plant availabil i ty o f phosphorus i n d i f f e ren t k inds o f sewage sludge,
conmrercial fe r t ihzer and ash, V A - F o r s k R e p o r t 1997:6, V A V A B , S t o c k h o l m , Sweden.
Lundgren J, Hermansson R , D a h l J. 2 0 0 1 . A n e w b io fue l based bo i l e r concept f o r small
district heat ing systems. Proceedings of the 2001 Joint International Combustion Symposium, Kauai ,
U S A , Sept. 9-I2'.
N a t i o n a l B o a r d o f Forestry. 2002. Recommenda t ions f o r the ex t rac t ion o f forest f u e l and
compensat ion fe r t i l i s ing . Meddelande 3-2002. J ö n k ö p i n g , Sweden.
N o r d i c Ecolabe l l ing . 2000. Ecolabel l ing o f solid b io fue l boilers. Cr i t e r i a document , 14
December 2000 - 14 D e c e m b e r 2006, Vers ion 1.3, Svanen, S t o c k h o l m , Sweden.
40

N o r d i n A . 1991 . Resul ts f r o m Extensive Measurements on a 25 M W C i r c u l a t i n g Flu id ized
Bed C o m b u s t o r F i r ed w i t h Biomass - E q u i l i b r i u m M o d e l E x p l a i n i n g the N O emissions. Proc.
o f the First In te rna t iona l Confe rence on C o m b u s t i o n T e c h n o l o g y l o r a Cleaner E n v i r o n m e n t ,
Vi l l amoura , Por tugal .
Nussbaumer T . , H u s t a d JE. 1997. O v e r v i e w o f Biomass C o m b u s t i o n , Deve lopment s i n
T h e r m o c h e m i c a l Biomass Convers ion , Blackie Academic & Professional, pp 1229-1243.
Obernberger I . 1998. Decentral ized Biomass C o m b u s t i o n : State o f the A r t and Future
Deve lopment . Biomass and Bioenergy 14(1): 33-56.
Schuster R . , S t r ö m b e r g B . 1997. F ö r b r ä n n i n g av gödse l - E n orienterande l i t teraturs tudie m e d
kommenta re r [ C o m b u s t i o n o f manure] , Technica l repor t 0 3 - 5 1 3 , Stiftelsen f ö r v ä r m e t e k n i s k
forskning, S t o c k h o l m , Sweden.
Statistics Sweden (SCB) , 2000. Press release N r 2000-267, S t o c k h o l m , Sweden .
Steineck S., Svensson L . , Tersmeden M . , Ä k e r h i e l m M . , Karlsson S. 2 0 0 1 . M i l j ö a n p a s s a d
hantering av h ä s t g ö d s e l [Sustainable handl ing o f horse manure ] , J T I - r e p o r t 280, Swedish
Institute o f A g r i c u l t u r a l and Env i ronmen ta l Engineer ing , Uppsala, Sweden .
Swedish B ioene rgy Associat ion. 2003. Bioenergy - A rev iew. Fact sheet. Focus B ioene rgy N o
1, S t o c k h o l m , Sweden .
Swedish Codes o f Statutes (SFS). 1997. Lag (1997:1320) o m k ä r n k r a f t s avveck l ingen , Swedish
Parliament, S t o c k h o l m , Sweden.
Swedish Codes o f Statutes (SFS). 2001 . F ö r o r d n i n g (2001:512) o m depone r ing av avfall ,
Swedish Parl iament, S t o c k h o l m , Sweden.
Swedish E n v i r o n m e n t a l Pro tec t ion Agency . 2003. Sweden's N a t i o n a l I n v e n t o r y R e p o r t 2003
- submi t ted under the U n i t e d Nat ions C o n v e n t i o n o n Chmate Change. Statistical repor t ,
S tockho lm, Sweden.
Swedish E n v i r o n m e n t a l Pro tec t ion Agency. 2004. Svavel- och k v ä v e u t s l ä p p f r å n svenska
samhä l l s sek to re r [Emissions o f sulphur and n i t rogen f r o m sectors o f Swedish society] , U R L :
http:/ /wrww.natui~vardsverket.se. (Accessed 2004-04-13) .
Swedish G o v e r n m e n t Energy B i l l . 2002. C o o p e r a t i o n f o r a secure, e f f ic ien t and
envi ronmenta l ly f r i e n d l y energy supply. M i n i s t r y o f Industr ia l , E m p l o y m e n t and
C o m m u n i c a t i o n , S t o c k h o l m , Sweden.
Swedish N a t i o n a l Ene rgy A d m i n i s t r a t i o n . 2003a. Energy i n Sweden 2003. Statistical repor t ,
Eskilstuna, Sweden.
Swedish N a t i o n a l Energy Admin i s t r a t i on . 2003b. Price sheet f o r biomass, peat etc. N o .
3 /2003. Eskilstuna, Sweden.
Swedish N a t i o n a l Energy A d m i n i s t r a t i o n . 2003c. V ä r m e i Sverige 2002 - E n u p p f ö l j n i n g av
v ä r m e m a r k n a d e r n a . (Hea t ing i n Sweden 2002 — A f o l l o w - u p o f the hea t ing markets).
Eskilstuna, Sweden.
41

Swedish Pe t ro leum Institute (SPI). 2004. Genomsni t t l iga m å n a d s p r i s e r 2002-2004 för
E ldmgso l j a 1, v i l la . U R L : ht tp: / /www.spi .se/s ta t is t ik .asp?stat=82 (accessed 2004-04-21) .
S t o c k h o l m , Sweden.
V a n L o o S. and Koppe j an J. (Eds.). 2002. H a n d b o o k o f Biomass C o m b u s t i o n and C o F i r ing .
Prepared by Task 32 o f the Imp lemen t ing Agreemen t o n B i o e n e r g y under the auspices o f the
In te rna t iona l Energy Agency ( I E A ) . T w e n t e Un ive r s i t y Press. Enschede, the Netherlands.
Zethraeus B . 1999. Problems i n b i o f u e l u t i l i sa t ion- A Swedish perspective. T h e I F R F
Indust r ia l C o m b u s t i o n Magazine, M a r c h 1999.
42

A P P E N D I X I
I N C R E A S E D C O M B U S T I O N S T A B I L I T Y I N M O D U L A T I N G B I O M A S S B O I L E R S
F O R D I S T R I C T H E A T I N G N E T W O R K S
The m a i n part o f the w o r k described i n this thesis has been carried out i n a European
C o m m u n i t y pro jec t t i t l ed Increased Combustion Stability in Modulating Biomass boilers for District
Heating Networks w i t h partners i n Fin land, Switzerland, Austr ia and Sweden. Th ree d i f fe ren t
biomass boi le r concepts have been developed and tested d u r i n g the years 1998 to 2 0 0 1 . T h e
Finnish partner, V T T Energy i n Jyväsky lä , has designed a bo i le r based o n acoustic pulsating
combust ion . T h e a im was to study possible effects on the combus t ion intensi ty and emissions
when using w e t biomass fuels. T h e Founda t ion o f Appropr ia te T e c h n o l o g y and Social Eco logy
(FATSE) i n Langenbruck, Switzer land, has designed a combus t ion chamber that creates a
standing vor tex i n order to achieve h igh mass transfer rate also at l o w e r b u r n rates and
investigate possible improvements o f the stability o f the combus t ion process by acoustic
s t imulat ion. Ins t i tu t Rir Apparatebau, Mechanische Verfahrenstechnik u n d Feuerungstechnik
( I A M F T ) i n Graz, Austr ia , has developed the G l o w Guard to detect g l o w i n g char o n the grate
in order to con t ro l the grate speed and air supply to the f u e l bed. T h e Depa r tmen t o f
Techno logy and Na tu ra l Sciences ( I T N ) at V ä x j ö Un ive r s i t y i n Sweden has developed a
signal-processing a lgo r i thm that c o u l d be used fo r ext ract ion o f correct i n f o r m a t i o n f r o m real
t ime measurements i n furnaces. L u l e å Univers i ty o f Technology ' s part o f the p ro jec t was, as
ment ioned , to develop a w o o d - c h i p s bo i le r design g i v i n g stabilised combus t ion at vary ing
thermal outputs w i t h less emission o f pollutants over a w i d e thermal ou tpu t range. T h e w o r k
was carried ou t i n close coopera t ion w i t h a local industr ia l company, A D Swebo Flis o c h
Energi i n Boden , Sweden.
The complete w o r k and the results o f the d i f fe ren t tasks are described i n detail i n the f i na l
report o f the pro jec t . '
D E S C R I P T I O N O F T H E T E S T P L A N T A N D E X P E R I M E N T A L S E T U P
The test plant is located i n the t o w n o f B o d e n i n the n o r t h o f Sweden, a round 70 k m south o f
the Ar t i e C i rc le . I n the f o l l o w i n g a comple te and detailed descript ion o f the test plant is
presented.
Combustion equipment and combustion air supply
As m e n t i o n e d earlier, the boi le r is designed to be suitable f o r small district heat ing systems.
The f o l l o w i n g requirements have been set;
• T h e furnace must be able to w o r k w i t h a va ry ing thermal ou tpu t , cover ing 10% to
100% o f the m a x i m u m heat demand o f the n e t w o r k f u l f i l l i n g the most rigorous
restrictions concern ing emissions o f C O , T H C and N O x over the entire thermal
o u t p u t range.
Eriksson G. , Hermansson R . (Eds.). 2 0 0 1 . Increased Combus t ion Stability i n M o d u l a t i n g Biomass Boilers fo r
District Heat ing Systems, Final report w i t h i n the N o n Nuclear Energy Programme J O U L E U I , Luleå Univers i ty
o f Technology, Sweden.
i

• T h e system must be able to handle fast and large heat load fluctuations w i t h mainta ined
l o w emissions o f h a r m f u l substances.
• T h e furnace must enable use o f wood-ch ips w i t h h i g h mois ture content , at least up to
55%.
T h e f u e l is stored i n t w o portable containers each w i t h a v o l u m e o f 30 m 3 , roughly
corresponding to 18 to 20 tonnes o f wood-ch ips total ly. T h e local district heating company i n
Boden , B o d e n Energ i A B ( B E A B ) , has supplied the wood-ch ips d u r i n g the projec t .
Figure la shows a p ic ture o f the container system. T h e container system is equipped w i t h
centreless feeding screws convey ing the f u e l in to an intermediate f u e l store inside the boi ler
r o o m as s h o w n i n figure l b .
F IGUFTE I A - B . The portable fuel containers outside the heating plant and the intermediate fuel store
inside the building.
The furnace is, i n p r inc ip le , o f a counter -cur rent grate type, mean ing that the flame d i rec t ion
is the opposite o f the f u e l flow, according to figure I I .
T h e counte r -cur ren t type is considered to be appropriate f o r w e t b io fuels, such as wood-ch ips
and w e t bark, due to the increased convect ive heat transfer f r o m the f u e l bed con t r i bu t ing to
an i m p r o v e d d r y i n g process o f the fue l . "
2 Van L o o S. and Koppejan J. (Eds.). 2002. Handbook o f Biomass Combus t ion and C o Fi r ing . Prepared by Task
32 o f the Implement ing Agreement on Bioenergy under the auspices o f the International Energy Agency ( IEA) .
Twen te Univers i ty Press. Enschede, the Netherlands.
Ü

Coun te r -cu r ren t g ra te fu rnace
Pr imary combustion air
F I G U R E I I . Typical counter-current grate furnace
As men t ioned earlier, the thermal o u t p u t span o f the furnace should be 10% to 100% o f
m a x i m u m heat load. I n order to main ta in the required combus t ion temperature at l o w e r heat
loads, the pr imary combus t ion chamber is pa r t i t ioned where one modu le operates i n the range
o f 50 k W to 150 k W and the o ther 150 k W to 350 k W . T o reach m a x i m u m thermal o u t p u t
500 k W ; b o t h chambers r u n together.
The combust ion process is p e r f o r m e d i n t w o stages, i n a p r i m a r y - and a secondary zone.
Figure I I I shows 3 - D v iews o f the par t i t ioned p r imary combus t ion chamber and the secondary
zone.
iii

Figure I V shows a more detailed side v i e w o f the furnace.
Ill :11M in.mini.Ill mir F r o n : pnmary air
F I G U R E I V . Side view of the combustion chamber.
F r o m the intermediate f u e l store, s h o w n i n f igure l b , three feeding screws transport the f u e l
i n to the p r imary combus t ion chamber, whe re t w o o f the screws are connected t o the larger
m o d u l e and one to the smaller. Exper iments have s h o w n that i t is necessary to have at least
t w o feed ing screws to get a u n i f o r m d i s t r ibu t ion o f the f u e l i n the larger chamber. T h e f u e l
f eed ing system also includes a hydraul ic pis ton inside each chamber, w h i c h is used to transport
the b u r n i n g f u e l bed f o r w a r d . T h e displacement and the speed o f the pis ton stroke are chosen
f ree ly . I n order to transport the f u e l smooth ly and keep the f u e l bed calm, the p is ton strokes
should be pe r fo rmed at l o w speeds. T h e displacement was typical ly a round 10 c m d u r i n g the
tests.
T h e f u e l enters the combus t ion chamber at a hor izon ta l plane and moves s lowly towards an
i n c l i n e d plane. T h e purpose o f the t w o planes is to dry the wood-ch ips before the combus t ion
process, using heat transfer b y radia t ion and convec t ion f r o m the combust ible gases. Pyrolysis
starts i n the slope and the beg inn ing o f the hor izon ta l plane after the slope. Final charcoal
combus t ion takes place o n the hor i zon ta l plane and on the steps shown i n the figure.
T h e p r i m a r y air is pre-heated i n a double w a l l arrangement outside the ceramics i n each
m o d u l e . T h e largest difference compared to a convent iona l counte r -cur ren t grate furnace
s h o w n i n figure I I , is that the p r imary air is supplied f r o m above the f u e l bed and no t t h r o u g h
the grate. I n this furnace, the combus t ion air is i n t roduced partly t h r o u g h slotted steel pipes at
t w o levels integrated i n the sidewalls and part ly t h r o u g h a pipe i n the f r o n t o f the furnace.
H o w e v e r , the first version o f the p r i m a r y combus t ion chamber was designed and constructed
i n a w a y that made i t possible to t ry d i f fe ren t supply options, such as combinat ions o f air
supphed t h r o u g h the grate and f r o m above the f u e l bed t h r o u g h the sidewall pipes.
T h e secondary combus t ion chamber is cyl indr ica l ly shaped i n order to create a re -c i rcu la t ing
f l o w and thereby enhance the large scale m i x i n g and combus t ion intensi ty. I t is assumed that
iv

the most i m p o r t a n t factors f o r a good b u r n o u t rate are to create a g o o d m i x i n g be tween
pr imary gases and secondary air and to mainta in a h i g h gas temperature. A g o o d m e t h o d o f
achieving this is to supply preheated combus t ion air as h igh ve loc i ty air jets. T o make the
penetration easier i t is advantageous to have a l o w m o m e n t u m o f the p r i m a r y gases and short
distances f o r the secondary air jets to travel. Unfo r tuna t e ly , these t w o statements contradict
each o ther since a l o w p r i m a r y flow m o m e n t u m requires a large cross sectional area, leading to
larger penet ra t ion distances be ing required. T h e secondary air is pre-heated part ly outside the
cylinder and part ly be tween the t w o p r imary chambers to a f e w hundred degrees depending on
the thermal ou tpu t .
The purpose o f the secondary combus t ion chamber is to supply secondary air t h r o u g h pipes
across the neck, as shown i n figure I I I . Each pipe has a large n u m b e r o f small holes t h r o u g h
w h i c h air jets enter. B e t w e e n every t w o pipes the holes are placed i n a zigzag pattern to avo id
the jets oppos ing each other. This has been p r o v e n to enhance the penetra t ion depth and
m i x i n g / T h e air jets are directed slightly upwards to avoid h igh resistance that may increase
the pressure i n the p r i m a r y chamber and cause leakage o f hazardous gases i n t o the plant
bu i ld ing .
A conven t iona l 500 k W heat transfer u n i t is used t o heat up the water to the requi red
temperature. T h e plant is connected to the dis t r ic t -heat ing n e t w o r k i n B o d e n t h r o u g h a heat
exchanger.
T w o cyclones o f d i f fe ren t sizes are installed after the heat transfer un i t . T h e smaller one is used
at l o w e r thermal outputs to mainta in a h i g h gas veloci ty i n order to secure the particle
separation. Figure V shows an explanatory sketch o f the plant i n B o d e n .
< ) Chimney
Cyclones
Intermediate fuel store
District heating
network
r =Te(mocouple of type N
FIGUPvE V . Explanatory sketch of the plant in Boden.
Hermansson R. , Lundqvist M . 1998. Datorbaserade k o n s t r u k t i o n s h j ä l p m e d e l för mi l jövän l iga re b iob räns l ee ldade
pannor och kaminer, Repor t w i t h i n the small-scale combust ion programme, Tile Swedish National Energy
Administration, Project nr P-10643-1 . (In Swedish).
V

As one way to handle the heat load variations i n the dis t r ic t -heat ing n e t w o r k , a 35 m water
heat store w i t h atmospheric pressure above the water surface is installed. I t also works as an
expansion v o l u m e and, i n case o f failure o f the c i rcu la t ion pumps, as a self-circulated coo l ing
buf fe r f o r the heat recovery un i t . T h e free water surface at the top o f the store has been
covered by a t h i n f o i l to prevent d i f fus ion o f air i n t o the water v o l u m e , w h i c h w o u l d cavise
corros ion i n the water tank and i n the w h o l e system.
v i

A P P E N D I X I I
T E C H N I C A L S P E C I F I C A T I O N S O F T H E P L A N T
T A B L E I . Combustion chamber
Type Fixed-grate
Capacity range 50-500 k W
Fuel W o o d - c h i p s , moisture content 3 0 - 5 8 % w t (d.b)
Horse manure , moisture content up to 5 0 % w t (d.b)*
Grate thermal load 0.77 M W n T 2
Furnace thermal load 0.48 M W r n 3
C o m b u s t i o n temperature 8 5 0 - 1 1 0 0 ° C
Ash r emova l system A u t o m a t i c feeding screw
N o l o w e r l i m i t has been i d e n t i f i e d
T A B L E I I . Heat transfer unit
Water v o l u m e 1.5 m 3
O u t g o i n g water temperature (max) 9 5 ° C
O u t g o i n g water temperature (min) 6 5 ° C
I n c o m i n g water temperature (max) 6 0 ° C
I n c o m i n g water temperature (min) 4 0 ° C
Water mass flow (max) 3.4 k g s"1
Water mass flow (min) 0.5 k g s'
Flue gas temperature
Figure V shows the f lue gas temperature as a f u n c t i o n o f the heat load o f the furnace.
2 0 4 0 6 0 8 0 100
H e a t l o a d (%)
F I G U R E V I . Typical flue gas temperatures (°C) at heat loads in the range of 10-100% of nominal
thermal output
V I I

A P P E N D I X I I I
C O N T R O L S Y S T E M , M E A S U R I N G E Q U I P M E N T A N D U N C E R T A I N T I E S
Control system
A large part o f the i n i t i a l preparatory w o r k i n the pro jec t consisted o f deve loping the plant
con t ro l system. This was h o w e v e r designed f o r research purposes on ly . A commerc ia l vers ion
o f the con t ro l system has recently been developed by A b e l k o I n n o v a t i o n A D i n close
col laborat ion w i t h the author. Ef for t s have been p u t i n to m a k i n g the con t ro l system as easily
operated and inexpensive as possible.
A l l fans are f requency speed cont ro l led , w h i l e the f u e l feed ing screws and the pistons are
operated o n / o f f .
T h e thermal ou tpu t o f the furnace is con t ro l led by the outside temperature and the energy
level i n the heat store.
Measuring equipment
T h e analysis o f the stack gas compos i t i on is carried ou t immedia te ly after the heat transfer un i t .
A m u l t i - c o m p o n e n t gas analyser f o r onl ine measurements o f N O , C O , C O , and O , (Maihak)
and a heated T H C analyser ( J U M ) are installed. I n addi t ion , a N O / N O , converter ( J N O x ) is
installed to be able to measure total N O x . Figure V I shows the installation o f the gas analysis
equipment .
0 2 0 0 m m
T e m p e r a t u r e
c o n t r o l l e r
Gas ana lyse r Gas c o n d i t i o n i n g H e a t e d gas H e a t e d p r o b e
e q u i p m e n t s a m p l e l ine
F I G U R E V I I . Installation of the gas analysis equipment in the heating plant in Boden
T h e heated probe and the heated gas sample hnes were mainta ined at a constant temperature o f
1 2 0 ° C . Table I I I shows the measuring methods and ranges f o r the d i f ferent gas components .
v i i i

T A D L E I I I . Measuring ranges and -methods for different gas components
Range Method
o 2 0-25 v o l % Paramagnetic O , cell
C O 0-1000/10 000 p p m F T I R *
C O , 0-20 v o l % F T I R *
N O 0-500 p p m 0 - 1 0 / 1 0 2 / 1 0 3 / 1 0 V l 0 5 p p m
F T I R *
T H C
0-500 p p m 0 - 1 0 / 1 0 2 / 1 0 3 / 1 0 V l 0 5 p p m F I D * *
*Fourier T r a n s f o r m In f ra R e d , **Flame Ionisa t ion De tec to r
Gas temperatures have been measured above the f u e l bed i n the p r imary zone, before and after
the secondary combus t ion chamber and after the heat transfer un i t . T h e temperatures are
measured by radiation-shielded thermocouples o f type N . T h e loca t ion o f the temperature
gauges are shown i n figure V .
Ultrasonic f l o w meters and temperature gauges ot type P T - 1 0 0 were used to measure the
thermal ou tpu t o f the boi ler and the the rmal ou tpu t dehvered to the dis tr ict-heat ing n e t w o r k .
A l l values were recorded i n t w o data loggers at a samphng f requency o f 2 H z .
Fuel samples have been dr ied i n an electrical oven f o r at least 24 hours at approximate ly 1 0 5 ° C
to determine the mois ture content o f the f u e l . Samples have been taken regularly d u r i n g the
experiments.
Measuring uncertainties
Calculations show that the measuring uncertainties f o r C O , C O , and N O x are + / - 5 . 2 % o f the
measured value f o r a n e w l y calibrated gas analysis ins t rument and + / - S . 4 % after one week o f
operation. For O , measurements, the uncer ta in ty is + / - 5 . 1 % and + / - 5 . 3 % respectively. T h e
uncertainty o f the T H C measurements is calculated at + / - 2 . 7 % immedia te ly after cal ibrat ion
and +Z-3 .4 % after 24 hours o f opera t ion . T h e gas analysers have been calibrated at least once a
week.
The reason f o r the small difference i n uncer ta in ty b e t w e e n n e w l y calibrated equ ipment and
after one week o f operat ion is the large c o n t r i b u t i o n f r o m in t e r f e r ing substances, w h i c h always
occurs. T h e considered error sources are presented i n paper I I .
The uncertainties o f the temperature measurements o f the ho t gases i n the p r i m a r y - and
secondary zone are more d i f f i c u l t to calculate. E v e n i f the thermocouples are radia t ion
shielded, w h i c h gready improves the accuracy, the largest measuring error is due to the
radiation exchange between the t he rmocoup le and the su r round ing ceramic walls. For this
reason, i t is d i f f i c u l t to calculate the uncertainties, as they are strongly dependent o n the surface
temperature o f the surroundings, w h i c h is n o t measured.
i x


Proceedings of the International Conference on Fluid and Thermal Energy Conversion 2003
B a l i . Indonesia, December 7 — 1 1 , 2003
© F T E C 2003
I S S N 0854 - 9346
Design of a Secondary Combustion Chamber for a 350 kW Wood-Chips Fired Furnace
J. Lundgren-1, R. Hermansson-2, M . Lundqvist-3
Division of Energy Engineering, Department of Applied Physics and Mechanical Engineering. Luleå
University of Technology , SWEDEN
Contact Person: Joakim Lundgren
Division of Energy Engineering, Department of Applied Physics and Mechanical Engineering, Luleå
University of Technology, S-971 87 Luleå, SWEDEN
Phone: +46 920 491307, Fax: +46 920 491047, E-mail: [email protected]
Abstract The ambition to decrease emissions of green house gases has promored the use of biomass as an environmentally friendly energy source. Combustion of biomass can produce hazardous emissions unless the combustibles are oxidized to their final products. In order fo achieve complete combustion in a 350 kW wood chip fired furnace, a secondary combustion chamber has been developed. Computational Fluid Dynamics (CFD) is used to aid the design. Both simulations and experimental results show that the secondary chamber works well. Secondary air and combustibles mixes well and the resulting emissions of carbon monoxide and total hydrocarbons (THC) are far below recommended limits.
Keywords: Renewable energy, Biomass, Combustion. CFD
INTRODUCTION
The increasing emissions of green house gases worldwide makes biomass an interesting source of energy since biomass has, unlike fossil fuels, no net emission of carbon dioxide. Thus, biomass combustion does not contribute to the increasing problem with the green house effect, global warming. The quantity of biomass is high in Sweden and can replace some of the fossil fuel that is currently used to produce heat. Even though combustion of biomass does not contribute to global warming, the emissions from biomass plants can cause problems due to emissions of nitric oxides, particles and carcinogenic polyaromatic hydrocarbons. The latter is a result of incomplete combustion and the former is mainly a result of the nitrogen content in the fuel, fuel N O v Additional nitric oxides may be formed at high combustion temperatures in combination with a surplus of oxygen, thermal N O v
To limit emissions of incomplete combustion products as well as nitric oxides, common practice is to apply staged combustion. By supplying the combustion air at different stages of the combustion, the devolatilisation and gas phase combustion are separated. In the first stage, the peak temperature will decrease and the substoichiometric conditions will prevent formation of large amounts of nitric oxides. In the second stage, sufficient amount of secondary air is supplied to achieve a good bum out resulting in low emissions of incomplete combustion products.
Pollutants in form of products of incomplete combustion like CO, THC and PAH (Polycyclic Aromatic Hydrocarbons), are mainly a result of either:
009-1

Design o f a Secondary Combust ion Chamber f o r a 350 k W Wood-Chips Fired Furnace
• Too low combustion temperature • Insufficient mixing between combustible gases and combustion air • Deficit of oxygen • Too short residence time in high temperature zones
Al l of the variables are however linked to each other. A good mixing between the combustible gases and the secondary air reduces the amount of secondary air needed, which results in higher flame temperature as well as lower excess air ratio. Consequently, emissions of incomplete combustion products are reduced due to higher temperature, which speeds up the elementary reaction rates, and a good mixing, which reduces the required residence time for mixing the combustible gases and the secondary air. However, this does not automatically mean reduced NO\ emissions. In order to reduce emissions of products of incomplete combustion as well as NC\ emissions, the primary excess air ratio has to be optimised. [ 11.
A good measure of how well the combustible gases are mixed with secondary air is to study the correlation between emissions of NO, and CO. [2|. In a furnace with bad mixing conditions, a clear correlation between CO and N0 X can be expected, where high concentrations of CO mean low concentrations of N0 V and vice versa. In furnaces with a well functioning secondary zone, a very weak or non existent correlation between CO and NO, can be expected.
This paper is focused on describing the design of a secondary air supply arrangement to obtain a good mixing between air and gases. To find an optimal design, the commercial CFD-code CFX has been used to evaluate how to mix the secondary air with combustible gases. Measurements of the gas composition before the secondary air supply and emissions of products of incomplete combustion have been carried out to evaluate the effectiveness of the secondary zone. The paper does not include studies of how emissions of NO x are affected.
DESIGN OF T H E COMBUSTION C H A M B E R
Luleå University of Technology and a local industry company, AB Swebo Flis och Energi, have developed a 350 kW wood-chips fired furnace designed to manage fuels with high moisture content. The furnace is divided into a primary zone and a secondary zone.
Primary combustion chamber
Figure 1 shows a drawing of the primary combustion chamber. The fuel is fed into the furnace at the beginning of the upper horizontal plane and slides down the slope to the lower horizontal plane. A piston pushes the fuel along the lower plane and down the steps before the residue enters the ash box at the far end. Primary air is supplied through small holes in two levels along the sidewalls. The partly oxidised gases from the primary zone enter the secondary combustion chamber through the neck in the top.
009-2

J. Lundgren -1 , R. Hermansson-2, M . Lundqvis t -3
Figure 1 : The primary combustion chamber of the 350 kW wood chip fired furnace
Secondary combustion chamber
The secondary combustion chamber is cylindrical to create a re-circulating flow, which enhances the large scale mixing and combustion intensity. It is assumed that the most important factor for a good burn out rate is to create good mixing in the neck between primary gases and secondary air and to maintain a high temperature. The best method to achieve this is to supply preheated combustion air as high velocity air jets. To make penetration easier it is advantageous to have a low momentum of the primary gases and short distances for the secondary air jets to travel. Unfortunately, these two statements contradict since a low primary flow momentum requires large cross sectional area, which leads to large penetration distances required.
The concept of the secondary combustion chamber is to supply secondary air through seven pipes across the neck, see figure 2. Each pipe has a large number of small holes through which air jets enter.
Figure 2: Secondary combustion chamber showing pipes for secondary air supply.
Between every two pipes the holes are placed in a zigzag pattern so that the jets do not oppose each other. This has been proven to enhance the penetration depth and mixing. [3]. The air jets are directed slightly upwards to avoid high resistance, which can increase the pressure in the primary chamber and cause leakage of hazardous gases into the plant building. Figure 3 show a sketch of three pipes, indicating how the air jets are supplied.
009-3

Design o f a Secondary Combus t ion Chamber fo r a 350 k W Wood-Ch ips Fired Furnace
Primary gas flow
Figure 3: Secondary air supply through pipes
The gases are evacuated from the secondary zone by an exhaust fan producing a pressure below the atmospheric at the neck where the pipes are located. The pressure, and therefore also the gas flow, will vary along the neck since the gases are evacuated at one end of the cylinder (e.g. right end of figure 2).
Simulations
Since, in this case, mixing of combustible gases and secondary air is considered to be one of the most important factors to achieve complete combustion the simulations does not include chemical reactions. Instead, the focus lies on the mixing behaviour of the two gas streams.
By using detailed studies of the region in which the mixing takes place it is possible to predict the performance for different configurations of air supply. A detailed study of the mixing zone requires a good space resolution, so to lower the computational time both symmetry and periodicity are made use of, see figure 4. The variable used to optimise mixing is the diameter of the inlets, which indirectly affects either the jet velocity or the number of holes and the hole to hole distance.
Symmetric
o
o
0
0
0
0
Periodic
.i) Symmetr ic
Figure 4: The geometrical model used to simulate mixing. Red dotted area indicates region included in CFD model. Arrows show periodic and symmetric boundaries.
The primary gas is given a temperature of 800°C and the preheated secondary air is 500°C. With different temperatures on the gas streams, the temperature distribution above the pipes can be used as a good indicator on how well the mixing works. A well-function mixing will result in an even temperature distribution. The diameter of the pipes is 30 mm, the distance between them is 70 mm and the dimension of the neck is 700 x 300 mm.
009-4

J. Lundgren-1 , R. Hermansson-2, M . Lundqvis t -3
CFD has also been used to calculate how the primary gas flow varies along the neck. To maintain a constant stoichiometry above the neck, secondary air is supplied in proportion to the primary gas flow in each gap, which is increasing from left to right in figure 2. Since the percentage of secondary air varies with power output, fuel quality etcetera, two different cases has been tested, 30% and 50% secondary air at full load. The air supply has though been optimised for 50% secondary air, which is the share during normal operation. It would be very complicated to include all air jets along the neck, so the jets are modelled as sources of mass, momentum and enthalpy in the gaps between the pipes instead, see figure 5.
^ipes O O O O O O O
A A *
Primary gas f l o w
Figure 5: Computational domain
Mass, momentum and enthalpy sources for the secondary air jets are functions of power output, fuel quality and desired share of secondary air. For details about the CFX code see CFX User Manual [4].
COMPUTATIONAL R E S U L T S
Mixing
Figure 6 show the resulting temperature distribution for the configuration that gave best mixing behaviour (e.g. most even temperature distribution above the neck). The diameter of the holes is 7 mm and the hole-to-hole distance is 22 mm.
Figure 6: Temperature (K) in the mixing zone.
As seen from figure 6, the two flows are well mixed a few centimetres above the pipes. A small leakage can be observed close to the pipe walls (illustrated as higher temperatures), which is difficult to avoid.
009-5

Design o f a Secondary Combust ion Chamber f o r a 350 k W Wood-Chips Fi red Furnace
Stoichiometry along neck
Figure 7 shows the relative amount of secondary air required to maintain a constant stoichiometry along the neck for 50% secondary air. This can easily be transferred to the number of holes required in each pipe. Figure 8 shows the resulting temperature distribution above the neck
gap no.
Figure 7: Calculated relative secondary air supply to maintain a constant stoichiometry.
1020 r
1010
1000
990
980
970
960
950
940
930
920
0
-Oblique, 50% secondary air
• Even, 50% secondary air
-Oblique, 30% secondary air
0,1 0.2 0,3 0,4
Distance, m
0.5 0.6 0,7
Figure 8: Mixing temperature above the pipes.
The pink line corresponds to an even air distribution, which gives a sloping temperature profile. The green and blue lines correspond to the oblique air distribution from figure 7 for 50% and 30% secondary air respectively. The resulting temperature profiles are even.
E X P E R I M E N T S
Measuring equipment
A water-cooled suction pyrometer was used to measure the composition of gases leaving the primary zone. Measurements were carried out at depths of 100, 200, 300, 400, 500 and 600 mm immediately before the secondary zone. See figure 1. The measurements were arranged by 1AMFT (Institut für Apparatebau, Mechanische Verfahrenstechnik und Feuerungstechnik) in Graz, Austria and described in detail by Rath [5]. At the end of the pyrometer a partial gas stream was led through three filters and a gas cooling unit before the gas was analysed for its content of carbon monoxide and carbon dioxide
009-6

J. Lundgren-1 , R. Hermansson-2, M . Lundqvis t -3
(Binos 100, Fisher & Rosemount), the oxygen content (Oxinos, Fisher & Rosemount) and the content of volatile organic carbon expressed by the propane equivalent (flame ionisation detector FID 123, Testa). Figure 9 shows a sketch of the measuring arrangements.
cooling water
Figure 9: Measuring arrangement for primary gas analysis
The suction pyrometer was developed by IAMFT and is made of heat-resistant steel. The tip of the pyrometer is not cooled and is provided with a shield inset of ceramics. In the centre of this ceramics a thermocouple type K is located. The gases were sucked out through this shield at high gas velocity (50-70 m/s).
Data were recorded every second and values in this paper are presented as average values during steady-state conditions.
The analysis of the stack gas composition was carried out immediately after the heat transfer unit. A multi-component gas analyser for online measurements of NO, CO, C 0 2 and 0 2 (Maihak) was installed. Additionally, a NO/NO, converter (JNOX) was used to measure total NO s . Figure 10 shows the installation of the gas analysis equipment.
< > 200 mm
Figure 10: Installation of the gas analysis equipment for stack gas measurements
The heated probe and the heated gas sample lines were maintained at a constant temperature of
120°C Table 1 shows the measuring methods and ranges for the different gas components.
009-7

Design of a Secondary Combustion Chamber for a 350 kW Wood-Chips Fired Furnace
Table 1. Measuring ranges and -methods for different gas components
Range Method
o 2 0-25 vol% Paramagnetic 0 2 cell CO 0-1000/10 000 ppm FTIR* c o 2 0-20 vol% FTIR* NO 0-500 ppm
0-10/102/103/104/10s ppm FTIR*
THC 0-500 ppm 0-10/102/103/104/10s ppm FID**
Fourier Transform Infra Red, **Flame Ionisation Detector
The analysis of PAH was carried out by leading a gas sample flow isokineticaly through glass fibre filters, where particles were separated at a temperature above the dew point of the gas. The particle free gas was cooled and the condensate was collected in a vessel. Non-condensed PAH was collected in a glass ampoule containing Amberlite XAD-2 and PUF (poly urethane foam). The system was rinsed with acetone of HPLC quality after the sampling. The filters, the ampoule, the condensate and the acetone were extracted and analysed using GC-MS (gaschromotograhy-masspechtrometry) technique.
Experimental results
The delivered thermal output was 290 kW at steady state conditions and the moisture content of the wood-chips used during the experiment was 40 wt.-%. The secondary air was pre-heated to approximately 240°C and secondary air proportion was 35%. Unfortunately, these conditions do not agree with the assumptions made in the calculations. However, the experimental conditions can be considered less propitious than the simulation assumptions. The emissions of CO have been used as an indicator of the combustion effectiveness.
Figure 11 shows the resulting gas concentration profile along the neck. As mentioned earlier, this point is located immediately before the secondary zone as shown in figure 1.
Depth Figure 11: Gas composition before the secondary zone
Each point in the figure represents an average value during three minutes of measurements. The results showed that a high concentration of CO was obtained along the entire primary zone outlet. A maximum value of CO exceeding 50 000 ppm was registered at a depth of 300 mm, which may have been caused by local deficit of oxygen. The average content of CO was 26 230 ppm. Figure 12 shows the measured temperature distribution along the outlet.
009-8

J. Lundgren-1, R. Hermansson-2, M . Lundqvist-3
1 2 0 0 - ,
1000 -
800 -
600
400
200 -
o4 T
100 I
200 n 1 — 300 400
Depth
Figure 12: Gas temperature along the outlet of the primary zone
500 600 700
Earlier experiments in this furnace and in others have shown that the gas temperature must exceed 800°C to achieve a good combustion process. [ 1 ] , [6]. The measurements show that this condition is fulfilled.
Stack gas measurements
Figure 13 shows gas composition of the stack gases during the experiments. The measurements were carried out simultaneously with the measurements inside the primary zone. Unfortunately, measurements of THC could not be performed due to failure of the equipment.
O 5 0 x 1 0 J - f
o > o
@
E
E tu
O O
T - 2 0
M 5
H o %
h 5
1 - 0
11 :15 1 1 : 2 0 11 :25 1 1 : 3 0
Time Figure 13: Stack gas composition. CO emissions standardised to 10 vol% 0 2
At the time of the test runs, no automatic control of secondary air supply was used. As shown in figure 14, relatively large fluctuations of the 0 2 content after a piston stroke was encountered, meaning that new fuel enters the chamber resulting in an intensified gasification. This causes peaks of CO emissions due to temporary lack of 0 2 . Since the air supply was constant and the amount of combustible gases increased, this occurrence was unavoidable. Later experiments have shown that the peaks could, relatively easy, be avoided by changing the primary air supply arrangement. See Lundgren et.al [6]. The average concentration of CO was anyway comparatively low, 189 ppm normalised to 10 vol.% 0 2 .
Figure 14 shows the emissions of NO x as a function of CO. It should be mentioned that the data is collected from another experiment than the above in order to get more measuring points. The conditions during the two experiments were however equivalent.
009-9

Design o f a Secondary Combus t ion Chamber f o r a 350 k W Wood-Chips Fired Furnace
50 100 150 CO (ppm)
Figure 14: Correlation between NO x and CO
The result shows that there is no obvious correlation between NO, and CO, indicating that the mixing works satisfactorily, [2],
Emissions of polycyclic hydrocarbons (PAH)
Emissions of PAH is correlated to emissions of CO at gas temperatures higher than 700-800°C, low emissions of CO means low emissions of PAH and vice versa. [1]. Table 2 shows a comparison between poor and high standard combustion chamber design concerning typical ranges of emissions from various types of wood burning equipment, such as grate firings and understoker furnaces.
Table 2: Comparison between poor and high standard furnace design [7]
Emissions @ 11 % Q 2 (mg/Nm3) Poor standard High standard CO 1000-5000 20-250 PAH 0.1-10 <0.01
Table 3 shows the emission of PAH. The average content of CO was 10 mg/Nm (standardised to 10 vol % 0 2 )
Table 3: PAH compounds (^g/Nm3)
Naphthalene 1,29 Flouranthene 11,32 2-Methylnaphtalene 0,09 Pyrene 15,22 1 -Methy lnaphtalene 0,05 Benz[a]anthracene 1,23 Biphenyl 0,17 Chrysene 1,99 2,6-DiMethylnaphtalene 0,00 Benzo[b]flouranthene 1,84 Acentaphtylene 0,14 Benzo[k]flouranthene 0,47 Acenaphtene 0,00 Benzo[e]pyrene 1,42 2,3,5-Trimethylnaphtalene 0,00 Benzo[a]pyrene 0,57 Flourene 0,05 Perylene 0,06 Phenanthrene 5,68 Indeno[l ,2,3-cd]pyrene 0,68 Anthracene 0,38 Dibenz[a,h]anthracene 0,02 1 -Methy lphenanthrene 0,21 Benzo[g,h,i]perylene 1,96
T O T A L PAH 44,85 (0,045 mg/Nm 3)
The result show that the emissions of PAH was surprisingly high, taken into consideration that the emission of CO was very low. Even i f the furnace was running at steady-state conditions, the gas sampling took place relatively early after the start up of the plant. This could have led to contamination from the previous shut down of the furnace. Further experiments are therefore necessary to be able to draw any major conclusions.
009-10

J. Lundgren-1 , R. Hermansson-2, M . Lundqvist-3
CONCLUSIONS
Results from CFD calculations show that combustible gases and secondary air mixes well in the secondary zone and that the calculated oblique air distribution gives almost constant stoichiometry along the neck.
Also the experimental results show that the mixing works satisfactorily. A comparison between the CO concentration before and after the secondary air supply shows that the CO content is significantly reduced after the secondary zone. This is due to the fact that the two most important conditions discussed earlier are fulfil led, the gas temperature is high enough and the combustible gases and the secondary air are well mixed. The latter is also confirmed by the non existing correlation between NOx and CO.
No definite conclusions can be drawn considering emissions of PAH. Further measurements are required.
Lhe use of CFD to find an optimum design of the secondary zone has proven to be very efficient in time and cost. By using CFD, an efficient design of the secondary chamber has been developed without expensive experimental work.
A C K N O W L E D G E M E N T S
This work is part of a project titled Increased Combustion Stability in Modulating Biomass Boilers for District Heating Systems. The project is partly funded by the European Commission in the framework of the Non Nuclear Energy Programme JOULE I I I , contract No JOR3-CT98-0278 and partly by the Swedish National Energy Administration.
The authors would like to thank the partners of the project for fruitful co-operation and discussions during the project meetings and especially Mr Mikael Jansson, Swebo Ris och Energi AB for a very smooth co-operation. The authors also gratefully acknowledge Dipl.-Ing Johannes Rath and Dipl.-Ing Martin Zimmel, Technische Universität in Graz and Mr Esbjörn Pettersson, ETC in Piteå for their devoted work during the measurements in Boden.
Furthermore, the authors would like to express thanks to our colleagues at the Division of Energy Engineering, Luleå University of Technology.
R E F E R E N C E S
[1] Van Loo S. and Koppejan J. (eds.), Handbook of Biomass Combustion and Co Firing, Twente University Press, 2002 [2] Energy Agency for Southeast Sweden, "Environmental Demands for Bio-fuelled Plants in the Effect Range 0.3 to 10 MW, Technical report, 2001. (In Swedish only). 13) Hermansson R, Lundqvist M. "Datorbaserade konstruktionshjälpmedel för miljövänligare biobränsleeldade pannor och kaminer", Report within the small-scale combustion programme, The Swedish National Energy Administration, Project nr P-10643-1, 1998. (In Swedish only). [4] CFX User Manual, AEA Lechnology, 8.19 Harwell, Didcot, Oxfordshire OX11 0RA, United Kingdom, 1997 [51 Rath J, "Measurements of Temperature and Concentration of Gas at the Biomass Combustion Boiler in Boden/Sweden March 2000", Technical report, Technische Universität Graz, 2000 [61 Lundgren J, Hermansson R, Dahl J, "A New Bio Fuel Based Boiler Concept for Small District Heating Systems", Proc. 2001 Joint International Combustion Symposium, Kauai, Hawaii, USA, September 9-12,2001 [7] NussbaumerT, Hustad J.E, "Overview of Biomass Combustion", Developments in Thermochemical Biomass Conversion, Blackie Academic&Professional, pp 1229-1243, 1997
009-11


'.sciencedirect.com
• » « ' " • B I O M A S S & B I O E N E R G Y
3 (2004) 443-453
www.elsevier.com/locaie/hiombioe
Experimental studies of a biomass boiler suitable for small district heating systems
J. Lundgren*. R. Hermansson, J. Dahl
Division of Energy Engineering. Litlea University of Technology. Lutea 6-077 87. Sweden
Received 9 January 2003: received in revised form 5 Sepieniber 2003: accepted 5 September 2003
Abstract
Extensive experiinents have been earned out in a newly developed furnace suitable for small district heating networks.
Tlte fuel is wood-chips with moisture content in the range o f 30-58%. One of the unique features of this new furnace is the
broad thermal output span, which makes it possible to run the boiler down to 10% o f maximum heat load, with maintained
low emissions o f CO and total hydrocarbons ( T H C ) . The aim o f this study has been to evaluate the performance o f the
combustion chamber during steady-state operation in the complete thennal output range.
The experiments show very good results over the entire thermal output range. In the range 60 kW up to 500 k W .
the average CO content in the stack gases is typically below 25 mg N m - 3 (20 ppm) and the NO, concentration be
low 195 mg N m - 3 (95 ppm) during steady state conditions. At lower thennal outputs, the average CO content is below
105 mg N m - 1 (84 ppm). ( A l l values standardised to 10 v o l % Oi.)
© 2003 Elsevier Ltd. Al] rights reserved.
Keywords: Biomass: Combustion: District heating; Emissions
Available online at www
• c m
ELSEVIER Biomass and Bioenergy 2'
1. Introduction
A study, canied out by the Swedish Na t iona l Board
o f Industrial and Technical Development ( N U T E K ) .
shows that biomass boilers in the thermal output range
0.5-10 M W emit a disproportional amount o f p o l l u
tants in f o r m o f products o f incomplete combust ion
during low or vary ing thermal output [ ] ] . Since this
is a common situation in small dis t r ic t -heat ing net
works, it is important to have a system that can handle
these types o f operation w i t h m i n i m a l env i ronmen
tal impact. Large and f requent ly occur r ing heat load
'Corresponding author. Tel.: +46-920-49-13-07:
fax: +46-920-49-10-47.
E-mail address: [email protected] (J. Lundgren).
0961-9534/$-see front matter © 2003 Elsevier Ltd . A l l rights reserved.
doi:I0.I0167j.biombioe.2003.09.001
peaks arises in dayt ime, especially du r ing the s u m -
met. The heat demand can be considered very l o w or
non-existent whi l e the demand fo r hot tap water is ap
proximate ly the same, independent o f season. Due to
this the boiler must be able to work w i t h a m o d u l a t i n g
thermal output in the range 1 0 - 1 0 0 % o f the n o m i n a l
thermal output, since the average heat demand d u r i n g
summer is estimated to be around 10% o f the demand
in winter .
A new concept for small-scale heat p roduc t ion
based on biomass, described in detai l by Lundgren
et al. [ 2 ] , has been developed by L u l e å Un ive r s i t y
o f Technology and a local industry company, A B
Swebo Flis och Energi . The combust ion chamber is
designed fo r a m a x i m u m heat load o f 500 k W and
f o r thennal output modulat ion down to 50 k W , us ing

444 J, Lundgren et cd. I Biomass ond Bioenergy 26 (20041 44S-4ÖS
wood-chips , w i t h h igh moisture content, as fue l . The
reason f o r using an unrefined f u e l instead o f pellets or
briquettes is to reduce the fue l costs. The investment
can also be reduced i f the boi ler can handle this wide
thermal output span, since no supplementary heating
source w i l l be needed dur ing summer.
The market fo r this k i n d o f instal lat ion is expected
to g row substantially, i f the emission problems can be
mastered. Part icularly, in Nor the rn - , M i d - and East
ern Europe and other countries w i t h access to forestry
and agricul tural residues there is an increasing use
o f biomass fuels f o r central heating systems in small
communi t ies .
The a im o f this experimental study has been to eval
uate the performance o f the combust ion chamber at
constant thermal output. Experiments have been car
ried out to v e r i f y the wide thermal output span and the
furnace 's ab i l i ty to handle f u e l w i t h h igh moisture con
tent, wi th maintained l o w emissions o f unburn! gases.
The combustion eff ic iency has not been measured
dur ing the experiments. However , the emission o f C O
can be regarded as a good indicator o f the combus t ion
qual i ty .
2. Test facility and experimental set up
The test plant is located in the northern part o f
Sweden, around 70 k m south o f the A r c t i c C i rc le
in the t o w n o f Boden, and is connected to the l o
cal district-heating network. The f a c i l i t y includes,
besides furnace and heat transfer uni t , a water heat
store as one possibi l i ty to handle the heat load
variations. T w o cyclones are used f o r stack gas
cleaning.
F ig . I shows an explanatory sketch o f the f u e l - and
a i r f l ow in the plant.
Fig. 1. Fuel- and air/gas flow path.

J. Lundgren el al. I Biomass and Bioenergy 26 (2004) 443-453
Tabic I
Chemical composition ot" the fuel
Analysis Method Unit Result
Sulphur SS iS 71 77:1 % o f dry substance < 0 . 0 I
Carbon LECO-method ! % o f d iy substance 49 .5-49 .8
Hydrogen LECO-method 1 % o f dry substance 6.1-6.2
Nitrogen LECO-method 1 % o f dry substance < 0 . 1
Oxygen Calculated % o f dry substance 43 .5 -44 .0
Char residues SS 18 71 77:1 % o f dry substance 0.5
Volatiles SS-ISO 562:1 % o f dry substance 84.1-84.6
2.1. Fuel
Wood-chips w i t h moisture content in the range o f
3 0 - 5 8 % have been used dur ing the experiments. To
determine the moisture content, f u e l samples were
dried in an electrical oven f o r at least 2 4 h at approx
imately I 0 5 ° C .
A n accredited laboratory ( S L U , Umea, Sweden) has
performed analysis o f the chemical composi t ion o f
the wood-chips on several occasions. The results are
shown in Table I .
Acco rd ing to He l l w i g [ 3 ] , the size o f the wood-chips
can be d iv ided into fine- and rough wood-chips w i t h
side-lengths f r o m 5 to 5 0 m m and 5 0 to 1 0 0 m m ,
respectively. The wood-chips used in most o f the
performed experiments can be classified as rough
wood-chips w i t h a typical size between 4 0 and
1 0 0 m m .
2.2. The combustion chamber
The combust ion chamber, shown in F i g . 2 , is de
signed in a way that enables use o f wood-chips w i t h
high moisture content, up to at least 5 5 % , and to have
a wide thermal output span, 1 0 - 1 0 0 % , s t i l l f u l f i l l i n g
the most r igorous emission restrictions. I t should also
be able to handle large and fast heat load variations. It
is however k n o w n that a convent ional biomass boi ler
out on the market in Sweden can not manage a thermal
output be low 3 0 % o f its nomina l wi thou t producing
large amounts o f pollutants l ike C O and T H C . One o f
the main reasons is the d i f f i cu l t y to keep the required
combustion temperature at l ower heat loads. There
fore, the p r imary combust ion chamber is d iv ided in
two modules, where one o f them is designed to handle
the thermal output span 5 0 - 1 5 0 k W and the other 1 5 0
- 3 5 0 k W . For operation over 3 5 0 k W , both modules
are running together.
The fue l feeding system consists o f three feeding
screws, where t w o o f them are connected to the larger
module and one to the smaller. Experiments have
shown that it is necessary to have at least t w o feeding
screws to get a u n i f o r m dis t r ibut ion o f the f u e l . The
feeding system also includes a hydraul ic piston inside
each chamber, wh ich is used to transport the burn ing
fue l bed f o r w a r d . The displacement and the speed o f
the piston stroke can be chosen f ree ly .
The wood-chips enter the back o f the p r imary cham
ber on the upper horizontal plane and are pushed
s l o w l y towards a slope. The intent ion w i t h the plane
and the slope is to dry the f u e l before the combust ion
starts using heat transfer by radiation and convection
f r o m the burning gases. Pyrolysis takes place at the
end o f the slope and on the beginning o f the lower
horizontal plane. Final char combust ion takes place on
the l o w e r horizontal plane and at the steps shown in
F ig . 2 .
The pr imary air is pre-heated in a double w a l l ar
rangement outside the ceramics in each module . P r i
mary air is introduced part ly through slotted steel pipes
in the sidewalls and partly through a pipe in the f ron t
o f the furnace. (See F ig . 2 ) . I n the present design, no
air is supplied through the grate, due to problems w i t h
large peaks o f C O in earlier experiments when this
was tr ied, see Lundgren et a l . [ 2 ] . The ratio between
f ron t - and side p r imary air can be set manually. Exper
iments w i t h different settings o f this ratio and the ratio
between total p r imary - and secondary air have been
per formed in order to study the effects on emissions
and excess air. The results are shown in this paper.

446 ./ Lundgren et all Biomass and Bioenergy 20 12004 / 443 - 45.
The combustible gases produced by the combustion
process continue to the cy l indr ica l ceramic secondary
chamber. The design was developed on basis o f com
putational f l u i d dynamics ( C F D ) simulations and
results f r o m previous experiments. The secondary air
is pre-heated partly outside (he cyl inder and partly
between the t w o pr imary chambers to a f e w hundred
degrees C. The temperature is a f unc t i on o f the fi
nal thermal output, w i t h preheating increasing as the
power o f the furnace increases. C F D simulations were
used to find the best possible way to supply the sec
ondary air in order to obtain as good m i x i n g between
secondary air and combustible gases as possible.
The design o f the secondary combust ion chamber is
described in detail in a paper wr i t ten by Lundgren
et al . [ 4 ] .
2.3. Measuring equipment
The analysis o f the slack gas composi t ion is car
ried out immedia te ly after the heat transfer unit . A
mul t i -component gas analyser f o r online measure
ments o f N O , C O , C O : and 0 2 ( M a i h a k ) and a heated
T H C analyser ( J U M ) are installed. I n addi t ion, a
N O / N O : converter ( J N O X ) is installed to be able to
measure total NO. , . The temperatures are measured
by radiation shielded thermocouples o f type N . T e m
peratures in the pr imary zone are measured in the
larger module, but not in the smaller one. The only
temperature measured when the smaller module is
in operation, is the temperature after the secondary
combustion chamber.
The values are recorded every thirt ieth second in
two loggers.
2.4. Measuring uncertainties
Calculations show that the measuring uncertainties
f o r C O , C 0 2 and N O , are ± 5 . 2 % o f the measured
value f o r a newly calibrated gas analysis instrument
and ± 5 . 4 % after one week o f operation. For 0 2 mea
surements, the uncertainty is ± 5 . 1 % and ± 5 . 3 % re
spectively. The uncertainty o f the T H C measurements
is calculated to ± 2 . 7 % after calibration and ± 3 . 4 %

./. Lundgren et al. i Biomass and Bioenergy 26 (2004; 443-453 447
Tabic 2
Measuring methods, source o f errors and its inaccuracy for different measuring methods
Gas CO. C O ; . N O , 0 : T H C
Method FTIR P.m cel l 1 F I D
Source o f errors Inaccuracy
Calibration (reference gas)11 ± 2 ' « , ± 2 % ±2"/ , ,
Zero point d r i f t 3 < 1 %/week < 1 %/week < 1.5%/24 h
Span gas dr i f t 1 1 < 1 %/week < 1 %/week < 1 . 5 % / 2 4 h
Noisc ; l < 1 % < 0 . 2 % — Residual moisture in gas sample 1 . < 1% < 1% — Interfering substances'1 < 4 % < 4 % — Linearity deviation < 2 % b < 2 % b < l % a
Pressure- and temperature changes- < 1% <!% — Oxygen synergism 1 1 — — < 1.5%
Data logger (analog input)' 1 ± 0 . 0 3 % ± 0 . 0 3 % ± 0 . 0 3 %
"According to the manufacturer.
Maximal acceptable deviations according to t he Swedish Environmental Protection Agency.
after 24 h. The gas analysers have been calibrated at
least once a week.
The reason fo r the small difference in uncertainty
between newly calibrated equipment and after one
week o f operation is due to the large con t r ibu t ion f r o m
interfering substances, wh ich a lways occurs. The er
ror sources considered are presented in Table 2.
3. Experimental results
3.1. The larger combustion chamber (150-350 k W )
Most o f the experiments have been pe r fo rmed in
the larger combustion chamber, ma in ly because it has
more measuring equipment than the smaller module .
The introductory experiments showed that it was
possible to obtain very low emissions o f C O and T H C
in the complete thermal output span o f the larger
chamber. The results, presented by Lundgren et a l .
[ 2 ] , showed that p r imary air supplied through the grate
caused a more ineff ic ient combust ion than when the
primary air is supplied f r o m above the f u e l bed. I t was
also found that to obtain a good combust ion process,
the gas temperature must exceed at least 8 0 0 ° C before
the entrance to the secondary zone.
The larger combustion chamber is designed to han
dle thennal outputs in the range o f 150-35(1 k W . I t is,
however, o f a great interest to find the absolute m i n
imum and m a x i m u m thermal output w i t h maintained
low emissions.
The results presented in F ig . .3 show that it is
possible to run the combustion chamber between
430 k W down to around 60 k W . However , it is
most l ike ly d i f f i cu l t to run the boi ler at such l o w
thermal output f o r a longer t ime w i t h l o w emis
sions, due to the resulting temperature decrease in
the combust ion chamber. Noticeable is that the c o m
bustion process is more sensitive f o r piston strokes
at lower thermal outputs considering C O peaks, see
F i g . 3. A t lower thermal outputs, the temperature o f
the combustible gases decreases, w h i c h reduces the
combust ion intensity in the secondary combust ion
chamber.
The moisture content o f the f u e l dur ing the exper
iment was 50%. The average C O and N O , concen
trat ion in the stack gases were 20 and 138 m g N m - 3 ,
respectively. The average 0 2 content was 10 v o l % .
Several tests have been performed at different ther
mal outputs w i t h different moisture contents o f the
wood-chips . Figs. 4 and 5 show the results f r o m t w o
test runs at 350 k W w i t h moisture contents 3 5 % and
5 8 % , respectively.
A s shown in Figs. 4 and 5, the start up phase is
s ign i f icant ly longer when using a f u e l w i t h h igher
moisture content. However , dur ing steady-state cond i
t ions, the heat transfer rate f r o m the ceramics is h igh
enough in both cases to cause an eff ic ient d r y i n g p ro
cess. I t is therefore possible to keep the gas tempera
ture level above 8 0 0 ° C and thereby obtain an ef f ic ient
combust ion process. Noticeable is that the start up

J. Lundgren c! al. I Biomass and Bioenergy 26 (2004) 443-453
3. The actual thermal output span of the larger combustion chamber (emissions standardised to 10 vol% O T )•
O11000-
! g 800'
Temperature
n 2 Time (h)
4. Temperature before the secondary zone. O 2 content and C O emissions at 10 voI% O 2 . Moisture content 35"
Time (h)
5. Temperature before the secondary zone. 0/> content and C O emissions at 10 vol% O T . Moisture content 58%.

J. Lundgren et al /Biomass and Bioenergy 26 (2004) 443-453 449
Tabic 3
Results o f the air supply study at t w o different thermal outputs
Thermal output 150 kW
Secondary air 20 % 30 % 40 %
Front Side ratio 0.7 1 o 1.3 0.7 1.0 1.3 0.7 1.0 1.3
Excess air ratio / 1.65 1.69 1.61 1.73 1.73 1.7S 1.5 1.59 1.63
CO mg N u r - ' 10 10 10 11 16 13 8 5 6 .
NO, mg N u r - ' 144 146 136 142 142 146 127 154 131
THC mg N m - 3 0.05 (I . I 0.2 0.8 0.5 0.8 0.3 0.3 0.3
Thennal output 350 kW
Secondary air 40 % 50 '!„ 55 %
Front/Side ratio 0.7 1.0 1.3 0.7 1.0 1.3 0.7 1.0 1.3
Excess air ratio /. 1.41 1.48 1.6 1.35 1.47 1.47 1.47 1.55 1.54
CO mg N m - ' 19 19 26 16 24 21 16 17 23
NO., mg N n r ' 166 162 168 160 16(1 160 156 156 156
THC mg N m " ' 0.6 0.6 O.S (1.2 0.2 0.2 0.3 11.5 0.3
Average thermal outputs and emissions during steady-state condit ions in the arger combustion chamber
Module K 150-350 k W )
Thennal output 150 kW 200 k W 250 kW 350 k W
Moisture content % 46.2 48.0 42.8 44.7
Excess air ratio /. 1.55 1.5; 1 1.55 1.51
CO (mg n m - ' ) 14 8 1 1 1 1
N O , (mg n m - 3 ) 142 115 193 0)1
THC (mg n n r ' ) 0.3 1.9 0.4 0.5
phase in the experiment w i t h the drier f u e l shown in
Fig. 4 is very fast.
However , other experiments show that emission
problems can occur i f the wood-chips are fine and at
the same t ime wet. In this case, the fue l bed gets very
compact, w h i c h makes it d i f f i c u l t f o r the pr imary air
jets to penetrate in to the fue l bed. This results in a
lower combust ion temperature, higher emissions o f
CO and an increased amount o f unburnt f ue l .
Three different dis tr ibut ions o f pr imary- and sec
ondary air supplies at t w o different thennal outputs
have been studied. The studies also included three d i f
ferent ratios between f ron t - and side pr imary air w i t h
the total vo lume f l o w o f p r imary air kept constant.
The mois ture content o f the wood-chips was 4 5 %
during the experiments. Each experiment lasted f o r at
least one hour dur ing steady state condit ions. Table 3
shows the average excess air rat io and emissions fo r
different settings.
The study shows that the N O , content can be
s l igh t ly reduced i f the amount o f pr imary air is re
duced. I t also shows that the excess air ratio decreases
i f more side- than f ront pr imary air is supplied, due to
a more effect ive use o f the p r imary air. The content
o f C O is not considerably affected.
It can be discussed whether the levels o f primary-/ '
secondary air ratios should have been chosen w i t h
larger difference to be able to draw any def in i t ive con
clusions. Therefore , fur ther investigations are neces
sary.
Table 4 shows a summary o f performed test runs
in the whole thermal output span o f the larger module

450 J. Lundgren t t ui. 1 Biomass and Bioenergy 26 f . 1004) 443 - 453
Tabic 5
Average thermal outputs and emissions at 10 v o l / n O : during steady-state conditions in the smaller combustion chamber
Module 2 ( 5 0 - 1 5 0 k W )
Thermal output 50 kW 100 k W 125 kW 150 kW
Moisture content 3 — — — — Excess air ratio /. 2.15 1.87 1,64 2.1
C O ( m g n n r ' ) 104 07 44 101
N O , ( m g n m - 3 ) 160 181 172 167
T H C (mg n m " ' ) 0.3 — 1.0 —
"The moisture content o f the fuel was not measured during these experiments, but was estimated to be between 30% and 40%.
0 2 4 6 8 10X103
Time (s)
Fig. 6. The temperature after the secondary combustion chamber, the CO- and O ; content. Moisture content 52%.
dur ing steady-state condit ions. The emissions o f C O
are very l o w in al l test runs, w h i l e the content o f N O ,
is re la t ively high at higher thermal output.
I t is, however , very d i f f i c u l t to draw any ma jo r con
clusions concerning the N O , content, since the f u e l
qual i ty is vary ing largely. Sometimes the f u e l contains
a lot o f bark, sticks and twigs , w h i c h automatical ly
increases the N O , concentration in the stack gases.
3.2. Experiinents in the smaller combustion
chumher ("50-150 k W ;
A number o f experiments in the complete thermal
output span o f the smaller combust ion chamber w i t h
different moisture contents o f the f u e l have been per
formed . Table 5 shows typ ica l results in the smal l
combust ion chamber dur ing steady state condi t ions .
A comparison o f the results between the t w o m o d
ules shows that the excess air rat io, C O and N O , con
centrations in the stack gases are s igni f icant ly higher
in the smaller chamber, see Tables 4 and 5.
The main reasons are severe air leakage through the
grate and lack o f pr imary air distr ibution contro l . In
this design, it is unfortunately not possible to control
the front- /s ide air rat io. Most o f the air is supplied
through the f ron t pipe, due to less pressure drops than
in the side pipes. The veloci ty o f the f ron t air gets
so h igh , that the fue l is b lown away. When the pis
ton strikes and pushes new fuel to the empty part o f
the f u e l bed. the gasif ication gets too intensive, w h i c h
causes large C O peaks. The excess air ratio increases
since the pr imary air is not ef f ic ient ly used.
A i r leakage through the grate appears in several
locations in the furnace causing considerably larger
peaks o f C O when the piston strikes. In addi t ion ,
higher N O , content occurs when the air is b l o w n
through the f u e l bed.
I t also seems l ike the smaller combustion chamber
is more sensitive to the fue l moisture content than the
larger module . Figs. 6 and 7 show the temperature af ter
the secondary combust ion chamber and the C O - and
0 2 contents in t w o dif ferent experiments at a thermal
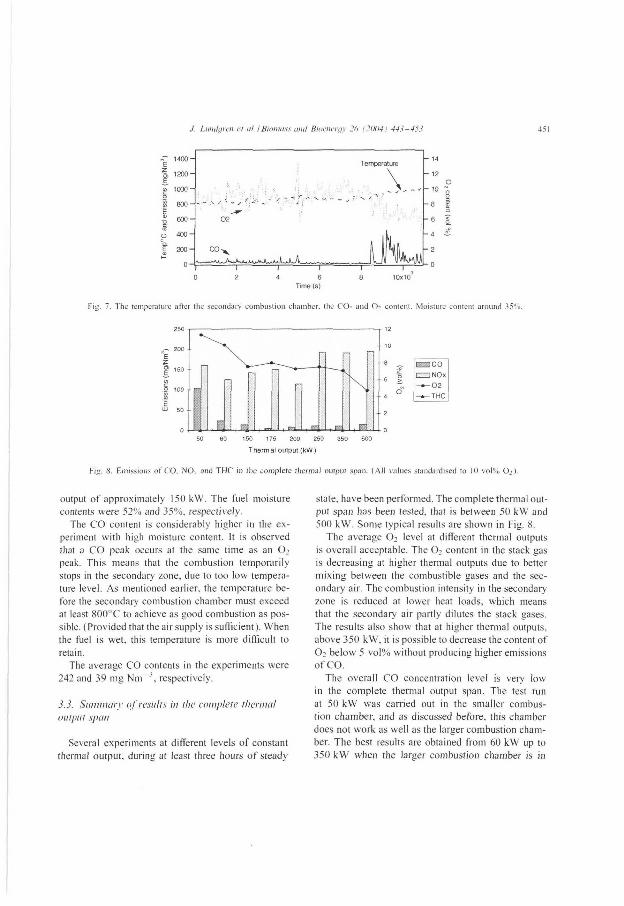
/ Liuulgren et ut. I Biomass ami Bioenergy 26 (2(lt)4 j 44S-4SS 451
0 2 4 6 8 10X103
Time (s)
Fig. 7. T he temperature after the secondary combustion chamber, the C O - and O ; content. Moisture content around 35%.
50 60 150 175 200 250 350 500
Thermal output (kW)
Fig. S. Emissions of C O . NO, and T H C in the complete thermal output span. (AH values standardised to Ifl vol% 0 2 ) .
output o f approximately 150 k W . The f u e l moisture
contents were 5 2 % and 35%. respectively.
The C O content is considerably higher in the ex
periment w i t h high moisture content. It is observed
that a C O peak occurs at the same t ime as an O i
peak. Th i s means that the combustion temporar i ly
stops in the secondary zone, due to too l o w tempera
ture level . A s mentioned earlier, the temperature be
fore the secondary combustion chamber must exceed
at least 8 0 0 ° C to achieve as good combust ion as pos
sible. (P rov ided that the air supply is su f f i c ien t ) . W hen
the fue l is wet . this temperature is more d i f f i c u l t to
retain.
The average C O contents in the experiments were
242 and 39 m g N m - ' , respectively.
3.3. Summary of results in the complete thermal output span
Several experiments at different levels o f constant
thermal output , dur ing at least three hours o f steady
state, have been performed. The complete thermal out
put span has been tested, that is between 50 k W and
500 k W . Some typical results are shown in F ig . 8 .
The average O T level at difierent thermal outputs
is overa l l acceptable. The O-, content in the stack gas
is decreasing at higher thermal outputs due to better
m i x i n g between the combustible gases and the sec
ondary air. The combust ion intensity in the secondary
zone is reduced at lower heat loads, wh ich means
that the secondary air partly dilutes the stack gases.
The results also show that at higher thermal outputs,
above 350 k W . it is possible to decrease the content o f
O i b e l o w 5 v o l % wi thout producing higher emissions
o f C O .
The overa l l C O concentration level is very l o w
in the complete thermal output span. The test run
at 50 k W was carried out in the smaller combus
t ion chamber, and as discussed before, this chamber
does not w o r k as w e l l as the larger combust ion cham
ber. T h e best results are obtained f r o m 60 k W up to
350 k W when the larger combust ion chamber is in

452 J. Lundgren et al. I Biomass and Bioenergy 26 (20(14 j 443—453
operation. Good results are also achieved when the
t w o chambers operate together at 500 k W . L o w emis
sions o f C O also mean l o w emissions o f T H C , w h i c h
is conf i rmed in the performed experiments.
3.4. Fuel bunionl
A n analysis o f the amount o f unburnt carbon i n
the sol id residue f r o m the furnace has been per formed
b y an accredited laboratory ( S L U , U m e a ) . The result
show that the amount o f unburnt carbon is be low 0.1 %
o f dry substance. This result is val id f o r both combus
t ion chambers.
3.5. Thermal efficiency
O n l y one calculation o f the thermal ef f ic iency has
been performed since the fue l consumption is not mea
sured continuously. Therefore, calculations can on ly
be per formed when a new fue l container w i t h a k n o w n
weight is delivered. Then, when the container is empty
and the boi ler has been running cont inuously , it is
possible to calculate the eff ic iency. Unfor tuna te ly , the
surface temperature o f the furnace is not measured,
w h i c h makes it impossible to per form a complete heat
balance.
The calor i f ic heat value o f the f u e l can be calculated
as
(19.22 - 2 1 . 7 * ( / / T 0 0 ) * 0 . 2 7 8 ( k W h k g - 1 ) , ( 1 )
where / is the moisture content o f the f u e l in percent.
D u r i n g the experiment, the larger combust ion
chamber was operating w i t h a modula t ing thermal out
put in the range 150-350 k W . The moisture content
o f the fue l was 50.4%, wh ich gives the ca lor i f ic heat
value 2.3 k W h k g - 1 . Tota l ly , 8.5 tonnes wood-chips
were consumed dur ing the test corresponding to
19.55 M W h .
The total energy product ion, calculated by inte
grat ing the measured thermal output del ivered to the
distr ict-heating network over the t ime o f operation,
amounted to 16.192 M W h . The thermal ef f ic iency ca l
culated as the ratio between delivered- and supplied
energy, amounts to approximately 83%.
Calculations show that the stack gas losses amount
to 1 1 % , assuming an ambient temperature o f 2 5 ° C .
The loss due to C O emissions is calculated to 0.02%.
The losses f r o m unburnt carbon in the fly ash and i n
the sol id residue f r o m the furnace as we l l as T H C
emissions are however not considered.
4 . Discussion
The results o f the experiments at constant thermal
outputs in the complete heat load range are very satis
factory. It has been shown that the furnace can oper
ate at thermal outputs around 10% o f m a x i m u m load,
wi thout p roduc ing large amounts o f unburnt gases.
Experiments w i t h fast and large heat load f luctuations
w i l l also soon be performed. Need fo r capacity to cope
w i t h large load f luctuations can arise, f o r example dur
ing summer seasons, when the heat demand is equal
or close to zero and only peaks f o r hot tap water oc
cur. The bo i le r has then to be started dur ing the peak
period and then stopped unt i l next peak arises. In this
case, it w i l l take a w h i l e f o r the furnace to heat up and
when it finally has reached steady state, the peak is
most l i k e l y over. The solut ion could be to use the heat
store f o r the load variations. It w i l l a l low the furnace
to run at an almost constant thermal output, w h i l e the
heat store takes care o f the hot tap water peaks. Exper
iments where the furnace operates together w i t h the
heat store w i l l be per formed.
I t has been observed that when the combust ion
chamber is started and stopped, that is heated up
and cooled d o w n , air leakages appear in new places.
The steps after the ceramic f u e l bed are made out
o f steel to fac i l i ta te tests w i t h different arrangements
fo r the p r i m a r y air supply. The steel steps have a
high coeff ic ient o f thermal expansion, wh ich results
in d imensional changes dur ing starts and stops. This
affects the air leakage between the steel steps and the
ceramic f u e l bed and the sidewalls, which gets larger
at every new start up.
The smaller combust ion chamber appears to be
more sensitive f o r high moisture contents o f the
wood-chips than the larger module , wh ich indicates
that the smaller combust ion chamber is not o p t i
ma l ly d imensioned. For example, the distance f r o m
the p r imary - to the secondary zone is too large and
should be reduced in order to decrease the coo l ing
rate o f the combust ib le gases.
Furthermore, as shown in Tables 4 and 5, the N O v
content is o f t e n higher in the smaller chamber than
in the larger. I t is very d i f f i c u l t to give a reasonable
J. Lundgren et al IBio/nass ami Bioenergy 26 1201141 443-455
explanation f o r this observat ion and it is therefore nec
essary to carry out fu r the r experiments in both cham
bers wi th exact ly the same f u e l qual i ty to be able to
eliminate the effect o f differences in fue l bound ni t ro
gen in the exper imental results.
5. Conclusions
Experiments at constant thermal output, in the range
60-500 k W , show very good results consider ing emis
sions o f C O and T H C . The average C O content in
the stack gases du r ing the presented tests is below
25 mg N m " ' .
Moisture contents o f the f u e l up to around 5 8 % do
not seem to affect the combust ion process negatively,
when the large combust ion chamber is in operation.
The only observed dif ference between using a wet and
dry fue l , is the t ime to heat up the furnace. The exper
iments in the smaller chamber show, on the contrary,
that the mois ture content o f the fue l has a strong i n
fluence on the combust ion process.
The large combus t ion chamber has a much broader
thermal output span than it was designed fo r . The ex
periment showed that it is possible to operate it be
tween 60 k W up to 430 k W , w i t h maintained low
emissions o f C O and T H C . I t is however not l i k e l y that
it is possible to operate at that l o w thermal output fo r
a longer per iod , due to a decreasing gas temperature.
The smaller combust ion chamber does not w o r k as
good as the larger module . However , the results ate
anyway satisfactory. The C O concentrations are typ
ical ly below 105 m g N m ~ J and N O , content below
182 mg N m ~ ' (standardised to 10 v o l % 0 2 ) dur ing
steady state condi t ions .
Further experiments are necessary to be able to draw
any major conclusions concerning the thermal e f f i
ciency.
The main conclusions are that it is possible to run
the boiler d o w n to 10% o f m a x i m u m load w i t h low
emissions o f C O and T H C even when wet wood-chips
453
are used. This can reduce both the investment and
operating costs fo r small dis tr ict heating plants.
Acknowledgements
This work is part o f a project t i t led Increased C o m
bustion Stabi l i ty in M o d u l a t i n g Biomass Boilers f o r
District Heating Systems. The project is partly funded
by the European Commiss ion in the f r a m e w o r k o f the
Non Nuclear Energy Programme J O U L E I I I and part ly
by the Swedish Nat ional Energy Admin i s t r a t i on .
The authors w o u l d l ike to thank the partners o f the
project f o r f r u i t f u l co-operation and discussions dur
ing the project meetings and especial ly M r . M i k a e l
Jansson, Swebo Flis och Energi A B f o r a very smooth
co-operation. The authors also g ra t e fu l ly acknowledge
Boden Energi A B f o r p r o v i d i n g fue l and other va lu
able services. Furthermore, the authors w o u l d l ike to
express thanks to our colleagues at the D i v i s i o n o f
Energy Engineering. Lulea Univers i ty o f Technology,
especially our technician M r B j ö r n Lundqvis t f o r his
devoted work .
References
[1] Karlsson M - L . Gustavsson L . Mårtensson D. Leckner B.
Analysis of today's best available technology for biomass fired
heating plants in the range of 0.5-10 M W . Technical report.
N U T E K . 1997.
[2] Lundgren J. Hermansson R. Dahl J. A new biofuel based boiler
concept for small district heating systems. Proceedings of the
Joint International Combustion Symposium. Kauai. Hawaii.
U S A . Sept. 9-12. 2001.
[3] Hellwig M . Zum Abbrand von HolzcnbrennstofTen
unter besonderer Berücksichtigung der zeitlichen Abläufe.
Technische Universität München-Dissertat ion, 1988.
[4] Lundgren J. Hermansson R. Lundqvist M. Design of a
secondary combustion chamber for a 350 kW wood-chips fired
furnace. Proceedings of International Conference on Fluid and
Thennal Energy Conversion ( F T E C 2003). Bali . Indonesia.
Dec. 7-11. 2003.


Available online at www.sciencedirect.com
I P SCBNCE^O.RECT- B I O M A S S &
A B I O E N E R G Y ELSEVIER Biomass and Bioenergy 26 (2004) 255-267 .
www.elsevier.com/locaie/hiornbioe
Experimental studies during heat load fluctuations in a 500 kW wood-chips fired boiler
J. Lundgren*, R. Hermansson, J. Dahl
Division of Energy Engineering, Lided University of Technology S-971 87, Luted. Sweden
Received 23 August 2002: received in revised form 30 June 2003: accepted 9 July 2003
Abstract
Several l o n g - t e r m e x p e r i m e n t s w i t h fluctuating t h e n n a l ou tpu t s have been ca r r i ed on t in a n e w l y d e v e l o p e d b i o m a s s f u e l l e d
bo i le r sui table f o r s m a l l d i s t r i c t h ea t i ng n e t w o r k s . T h e expe r imen t s have been p e r f o r m e d b y e i the r u s i n g the f u r n a c e o n l y o r
the furnace t oge the r w i t h a w a t e r heat s tore . C o m p a r i s o n s be tween these t w o o p e r a t i o n strategies have been m a d e c o n c e r n i n g
emissions and o v e r a l l p e r f o r m a n c e . F u r t h e r m o r e , the p lan t has been r u n to m a t c h a s i m u l a t e d heat d e m a n d d u r i n g d i f f e r e n t
seasons, i n o r d e r t o s tudy the p e r f o r m a n c e o f the sys tem d u r i n g m o r e rea l i s t i c o p e r a t i o n c o n d i t i o n s .
The results are ve ry s a t i s f a c t o r y c o n c e r n i n g b o t h p e r f o r m a n c e and emis s ions , u s i n g any o f the c o n t r o l s t rategies .
T y p i c a l emi s s ions o f C O a n d NO. , d u r i n g the e x p e r i m e n t s are i n the range o f 1 0 - 5 0 n i g N m - 3 ( 5 - 2 5 m g M J - 1 )
and 1 3 0 - 1 7 5 m g N m - 3 ( 6 0 - 9 0 m g M J - 1 ) . r e spec t ive ly . H o w e v e r , d u r i n g s u m m e r w h e n the heat d e m a n d is l o w o r zero,
operat ional p r o b l e m s w i l l o c c u r i f the heat s tore is e x c l u d e d . T h e r e f o r e , the m a i n c o n c l u s i o n is that the m o s t app rop r i a t e
solu t ion f o r a s m a l l d i s t r i c t - h e a t i n g sys tem is t o use a w a t e r heat store to m a t c h the heat l o a d v a r i a t i o n s , w h i l e the f u r n a c e
operates at as cons tan t t h e r m a l o u t p u t as poss ib le .
© 2003 E l s e v i e r L t d . A l l r i g h t s rese rved .
Keywords: Biomass; Wood-chips: Combustion; District heating; Emissions
1. Introduction
In order to decrease the dependence on electrical
power fo r heating purposes, conversion f r o m elec
tric heating to distr ict heating based on biomass is
an ongoing ac t iv i ty in Sweden in areas covered b y
the main distr ict heating networks. Due to a referen
dum in 1980, it was decided to phase out the nuclear
power, i f i t should t u m out to be possible to replace
it w i th economical and envi ronmenta l ly sustainable
* Corresponding author. Tel. : +46-920-49-13-07: fax: +46-920-
49-10-47.
E-ntail address: joakimfri 'mt. luth.se (J. Lundgren) .
alternatives. Current ly , the nuclear p o w e r produc
t ion contributes w i t h approximate ly 55 T W h or 3 9 %
o f the total e lectr ic i ty product ion in Sweden. The
most c o m m o n type o f heating in f a m i l y houses in
Sweden is electric heating, being the main heating
source in approximate ly 3 3 % o f such dwel l ings . In
the year 2000, the total e lec t r ic i ty use in detached
houses f o r heating purposes amounted to 14 T W h
[ 1 ] . Therefore, convers ion to dis t r ic t heating is one
important measure fo r f ac i l i t a t i ng the planned nuclear
phase out.
Biomass based dis t r ic t heating f o r larger c o m
munities, where typical bo i le r capacities are in
the range o f 2 0 - 1 5 0 M W | , is w e l l established in
Sweden. Increasing taxes on f u e l o i l and developments
0961-9534/$-see f ront matter © 2003 Elsevier L t d . A l l rights reserved,
doi: 10.1016/S0961 -9534(03 )00120-X

256 J. Lundgren et al. I Biomass ami Bioenergy 26 12004 } 2ÖÖ-267
o f the d i s t r ibu t ion network technology have made
ins ta l la t ion o f district heating and use o f biomass
f u e l economica l ly interesting also f o r smaller com
muni t ies , where typical boi ler capacities could be
about 0 . 5 - 2 M W t h . There ate a lot o f smaller com
muni t ies , located outside the areas covered by the
ma in dis t r ic t heating networks that are w e l l suited
f o r smal ler dis tr ict heating networks, where the heat
p roduc t ion cou ld be based on biofuels . Small-scale
dis t r ic t heating is however associated w i t h some
problems. Karlsson et al . [ 2 ] have shown that smaller
biomass boilers in the range o f 500 k W up to 10 M W
emi t unacceptable amounts o f pollutants in f o r m o f
products o f incomplete combustion dur ing low or
v a r y i n g thermal output. In smaller dis tr ict heating
ne tworks suppl ied w i t h on ly one boiler , such load
situations cannot be avoided. For example, dur ing
summer, the space heating demand can be consid
ered very l o w o r non-existent. The demand fo r hot
tap water is approximately the same, independent o f
season, but the variations o f the demand over the
day are large. The resul t ing load variat ion fo r the
bo i le r can however be reduced by use o f a hot wa
ter heat store. Even then, the boi ler must be able
to w o r k w i t h a vary ing thermal output in the range
o f 1 0 - 1 0 0 % o f the nominal output, since the aver
age heat demand dur ing summer is estimated to be
around 10% o f the m a x i m u m demand in winter . Mos t
ex i s t ing biomass fue l led boilers w o u l d give very
h igh emissions when operated at the l o w end o f the
output tange.
I n order to el iminate this problem, L u l e å Univer
sity o f Techno logy and a local industry company, A B
Swebo Fl i s och Energi , have developed a 500 k W
biomass f i red boiler , aimed at small-scale district
heat ing systems and designed to give l o w emissions
o f pol lu tants also at l o w and variable loads. A water
heat store is installed to provide one way o f handl ing
the load fluctuations down to zero. Previous exper
iments at constant thermal output in the heat load
range 1 0 - 1 0 0 % o f the nominal output have been per
f o r m e d , see Lundgren et al. [ 3 ] . The results show that
the combus t ion process is very effective in the entire
load range w i t h average C O concentrations typica l ly
b e l o w 105 m g N m . In the thermal output range,
6 0 - 5 0 0 k W , the average C O concentration is even
lower , b e l o w 20 m g Nnr 3 ( A l l values standardised
to 10 v o l % 0 2 ) .
The a im o f this study has been to evaluate how the
system per fo rms under large and fast thermal output
variations, b y either using the furnace on ly or the f u r
nace together w i t h the heat store. A comparison o f
the overal l per formance o f the furnace and emissions
f o r the d i f ferent operational strategies has been made
to find the most appropriate solution f o r small distr ict
heating networks .
2. Description of the test facility
The test site is located in the t o w n o f Boden in
northern Sweden close to the Arc t i c Ci rc le . I t is con
nected to the local distr ict-heating network through a
heat exchanger. The plant consists o f a fue l storage,
fue l conveyors, a new type o f furnace, a conventional
biomass convect ion bo i le r and, as mentioned earlier,
a heat store. T w o parallel cyclones o f different sizes
are used f o r stack gas cleaning. The small one is used
at l o w thermal outputs, in order to maintain a high gas
ve loc i ty to secure the par t ic le separation.
2.1. The coinbustiem chamber
I t is k n o w n that convent ional combust ion
chambers o n the market in Sweden emit dis
proport ionate amounts o f unburnt gases at thermal
outputs b e l o w 3 0 % o f their nomina l output, due to
d i f f icu l t ies in ma in ta in ing the required combust ion
temperature leve l . Therefore , to enable good combus
t ion at heat loads d o w n to 10% o f the m a x i m u m , this
furnace is par t i t ioned in t w o modules, where one op
erates in the thermal output range o f 50 up to 150 k W
and the other in the range o f 150 to 350 k W . T o reach
the m a x i m u m heat load o f 500 k W , both modules op
erate together. The combust ion process is per formed
in t w o stages, in a p r i m a r y and a secondary zone. The
design is described in detail by Lundgren et al . [ 4 ] .
Figs. 1 and 2 show sketches o f the t w o zones.
The f u e l f e ed ing system consists o f three on /o f f con
t ro l led f eed ing screws, where t w o are connected to
the larger modu le and one to the smaller. Experiments
have shown that it is necessary to have at least t w o
feeding screws to the larger module in order to get
a u n i f o r m d i s t r ibu t ion o f the fue l . The feeding sys
tem also includes a hydraul ic piston inside each cham
ber, w h i c h is used to transport the burn ing f u e l bed

/ Lundgren et al. I Biomass and Bioenergy 26 12004) 255-267 257
Gases to the secondary zone
Flg. 1. The primary combustion chamber.
Gases to the heat
transfer unit
Gases f r o m the p r imary zone
Fig. 2. The secondary combustion chamber,
forward. The length and the speed o f the piston stroke
can be chosen f ree ly .
The pr imary air is pie-heated in a double wa l l
arrangement outside the ceramics in each module.
Primary air is introduced part ly through slotted steel
pipes in the sidewalls and part ly through a pipe in
the front o f the furnace. The secondary combustion
chamber and the secondary air supply system are de
signed to get as good m i x i n g between the combustible
gases and the secondary air as possible. The design
was dev eloped on the basis o f C F D simulations and
previous experiments. F ig . 3 shows a side v i e w o f the
combustion chamber.
2.2. Waler heat storage
As one way o f handl ing heat load variations in the
district-heating ne twork , an unpressurised water heat
store is installed. The heat store has a water vo lume
o f about 35 t n 3 and a height-to-diameter ratio o f 2.6.
The storage capacity is about 1.4 M W h .
The installation o f a heat store yields several
important benefits.
• It can be used to cover temporary heat load peaks,
instead o f starting a potential back-up heat source.
• It can be used to counter-balance the thermal out
put o f the boi ler and thereby improve the combus
tion ef f ic iency, due to fewer operation starts and
stops [ 5 ] .
• Smoother operation decreases the emissions o f
pollutants such as C O and T H C
• The heat store serves as a heat reserve source in
case o f serv ice interruptions or breakdowns
• In case o f fa i lure o f the c i rculat ion pumps, the heat
store w i l l serve as a self-circulated coo l ing butler
f o r the heat recovery unit .
A well- insulated water heat store can however be rela
t ive ly expensive. The investment f o r a n insulated heat
store o f this size is approximately S15000 in Sweden.
However , the investment 's influence on the specific
heat cost is minor . Assuming a reasonable interest rate
o f 5% and a depreciation t ime o f 20 years, the annual
capital cost amounts to S1200. Furthennote assum
ing a yearly heat product ion o f about 1200 M W h . the
increase o f the specific heat cost w i l l be approximately
$1 M W h - 1 .
It should however be mentioned that the size o f
this heat store is vastly over-dimensioned considering
the nominal thermal output o f the boiler . The size o f
the heat store in a commercia l distr ict heating plant
o f this size, can de f in i t ive ly be reduced and thereby
also the cost.
2.3. Control oj the plant
The fue l - feeding rate is control led by adjust ing
the t ime between the piston strokes. When the piston
strikes, the feeding screws start and run f o r a pre-set
t ime found by experience. The running t ime o f the
feeding screws is on ly dependent on the length o f
the piston strokes. Both have f ixed values, 60 s and
10 c m , respectively.
Furthermore, it can be assumed that the thermal out
put o f the furnace is proport ional to the ratio between

the running t ime o f the feeding screws and the t ime
between piston strokes. The t ime between the piston
strokes ( A / p j s t o „ ) ( E q . ( 1 ) ) is a func t ion o f space heat
ing demand ( f j ) , the moisture content o f the fue l ( / )
and runn ing t ime o f the feeding screw ( / S C [ C W ) . I n ad
d i t ion , i f f o r example the delivered temperature f r o m
the bo i le r ( 7 K ) approaches the b o i l i n g point it is o f
course necessary to decrease the thermal output o f the
furnace. This means that also 7j, influences the fue l
feeding rate.
A / p l s l o n = / ( F d , / s c r c w , / , 7 ' b ) . (1 )
The required set points f o r the fue l feeding system,
pr imary air and secondary air supply and stack gas
fan are calculated by the control system, where the
calculated space heating demand and fue l moisture
content are the input parameters.
T o be able to match the space heating demand w i t h
the actual del ivered thermal output f r o m the boiler , a
special control program has been wr i t t en . The aver
age difference (Pan) between the result ing boiler ther
mal output (Ph) and the space heating demand ( P j ) is
calculated every hour (Eq . ( 2 ) ) . Since changes o f the
outside temperature are s low, one hour between the
calculations seemed reasonable.
i m — • ( -) n
N e w values o f the thermal output and the heat demand
are received every f i f t h second, which means that
n = 720.
The average difference (.Pjirr) is used to calculate
a constant C to adjust the t ime between the piston
strokes and thereby the delivered thermal output
according to Eqs. ( 3 ) and ( 4 ) .
C l = Q _ i - ( l + ^ ) , ( 3 )
A/pjston.new — C • A ?p j s t ( , n 0 ]J . ( 4 )
This means that since the running t ime o f the feed
ing screws is fixed and the moisture content o f the
fue l is k n o w n , the on ly parameter cont ro l l ing the ther
mal output o f the furnace is the t ime between piston

J. Lundgren el al. I Biomass oml Bioeneray 26 12(104/ 255-267 259
strokes. This control parameter is corrected every hour
to match the calculated space heating demand. The set
points fo r the primary air-, secondary air- and stack
gas fan are calculated f r o m the t ime between piston
strokes and are adjusted every hour as w e l l .
In order to minimise the emissions o f pollutants in
fo rm o f products o f incomplete combust ion as we l l as
improving the thermal ef f ic iency, it is o f great impor
tance to apply an appropriate control o f the air supply.
Normal ly , direct or indirect process con t ro l is used.
The former means that C O or C , H , is measured con
tinuously and the governing variables are adjusted to
obtain as low emissions as possible. Indirect process
control means that an opt imal excess air ratio ( / ) has
been found f o r all expected process condi t ions and the
measured O : value is used to control /. [ 6 ] .
In this plant, the O T content and the emissions o f
C O are, at present, measured after the heat transfer
unit, which means that the control system receives the
measured values very late, par t icular ly at lower loads
when the gas velocity through the bo i l e r is l ow . I t
is therefore very d i f f i cu l t to obtain a w e l l - f u n c t i o n i n g
regulator fo r cont ro l l ing the air supply. T o address this
problem, a heat resistant lambda probe w i l l be installed
immediately after the secondary zone to obta in a faster
control system.
2.4. Measuring equipment and uncertainties
On-line measurements o f the gaseous products O T ,
CO. CO2, N O , and T H C have been pe r fo rmed dur ing
every experiment. The gas analyses were made w i t h
conventional gas analysers in the Hue gas duct after
the heat transfer unit .
Gas temperatures were measured above the fue l
bed in the pr imary zone, before and a f te r the sec
ondary combustion chamber and a f te r the heat
transfer unit. The temperatures were measured by
radiation-shielded thermocouples o f type N.
The thermal output o f the heat transfer unit and the
thermal output delivered to the dis t r ic t -heat ing net
work were measured by ultrasonic f lowmete rs and
temperature gauges o f type PT-100.
The data acquisit ion system consisted o f t w o l o g
gers, where the values were recorded every th i r t ie th
second.
Table I shows the measuring methods and calcu
lated uncertainties f o r the different gas components .
Table I
Measuring methods and uncertainties
Gas Method Uncertainties Gas Method
Calibrated (%) After one-week
operation ("'., 1
C O ; . C O . FTIR j - s 2 ±5.4 NO,
O : Paramagnetic ±5.1 ±5.3 cell
T H C I I I ) ± 2 . 7 ± 3 . 4 "
; lAfter 24 h of operation.
T o determine the moisture content o f the fue l m i x
ture, fue l samples were dried in an electrical oven f o r
at least 24 h at approximately 1 0 5 ° C .
3. Experiments
Extensive experiments have been carried out in
order to study the performance o f the plant d u r i n g
heat load variations, using either the furnace o n l y or
the furnace together w i t h the heat store. I n i t i a l l y ,
one experiment w i t h stepwise thennal output varia
tions between 50 and 500 k W was carried out f o l
l owed by experiments where simulated heat demands
o f different seasons were matched.
The average emissions are shown both in [ m g
N m ~ 3 ] and [ m g M J - 1 ] based on the net heating value
o f the fue l .
3.1. Stepwise thermal output variations
3.1.1. Procedure Fig . 4 shows the intended variation o f the thermal
output du t i ng the experiments w i t h stepwise output
variations.
The tests were carried out both w i t h the furnace
alone and w i t h the furnace together w i t h the heat store.
Each thermal output level was maintained fo r at least
one hour dur ing steady state condit ions.
3.1.2. The large combustion chamber together w ith the heat store
D u r i n g the test, the combustion chamber was run
n ing at a constant thermal output o f around 250 k W .

260 / Lundgren el at I Biomass und Bioenergy 26 (20041 255-267
600
Ol 1 2 3 4 5 6 7 8 9
Time (h)
Fig. 4. Experimental procedure. Stepwise thermal output variations.
For thermal outputs higher than 250 k W , the heat store
was discharged and f o r lower outputs, the store was
charged. The experiment started when steady state
conditions were achieved at 250 k W . A t this point ,
the heat store was almost comple te ly charged. A f t e r
I h o f steady state, the thermal output was increased
to 350 k W by discharging the heat store. A f t e r an
other one hour o f steady state, the thermal output was
increased to 500 k W in the same way. T o teduce
the thermal output d o w n to 350 k W again, the dis
charging rate was decreased. The three f ina l levels
o f thermal output were obtained by con t ro l l ing the
charging rate o f the heat storage.
3.1.3. The combustion chantbers without hem storage
Dur ing this experiment, both combust ion chambers-
were in operation. The larger module was started at
250 k W . and to increase the thermal output , the smal l
chamber was put in operat ion. A l thennal outputs
below 150 k W . on ly the smaller module was running.
3.2. Results
3.2.1. Larger combustion chamber together with the heal store
The moisture content o f the f u e l du r ing the exper i
ments was 4 1 - 4 3 % . The results are shown in F ig . 5.
The operation o f the furnace w o r k e d smoothly .
The variations o f the bo i l e r thenna l output are most ly
due to fluctuations o f the d i f fe ren t i a l pressure in the
district-heating ne twork , causing a va ry ing return
temperature.
The average emissions o f C O d u r i n g this test
were extremely low, on ly 6 m g N m - 3 (3 mg M.1 ).
It can also be mentioned that the m a x i m u m regis
tered C O value was 15 m g N m . The average N O ,
and T H C emissions were 154 (80 m g M . P 1 ) and
1.2 m g N n r 3 (0.2 m g M J - 1 ), respectively.
3.2.2. The combustion chambers without heat store
D u r i n g the experiment, the mois ture content o f the
wood-chips was 4 9 - 5 1 % . The results are shown in
Fig. 6.
The results show that the emissions o f C O are l o w
at thermal outputs above 150 k W , when the larger
combustion chamber is operat ing. W h e n the smaller
combustion chamber was put in to operat ion to reach
m a x i m u m load, a smaller peak o f C O was registered.
However , the emissions o f C O were l o w du r ing
steady-state conditions, when bo th chambers oper
ated together. In order to decrease the thermal output
down to 50 k W . the larger combus t ion chamber had
to be shut down. This caused h igher emissions o f
C O due to the g l o w i n g phase in the large cham
ber when it was stopped. The average content o f
C O dur ing the complete test run was anyway l o w ,
61 m g N m - 3 (30 mg M J - 1 ) .
The average emissions o f T H C and N O , were 1.3
(0.3 mgMr 1 ) and 1 4 4 m g N m ~ 3 ( 81 m g MJ"1). respectively. A comparison o f the results obtained
when the heat store is used, shows that s topping one
combustion chamber leads to s igni f icant peaks in the
C O emission.
To be able to make an accurate comparison o f the
average emissions between the t w o cases, the opera
t ion t ime and the thermal output var ia t ions should have
been equal. This was however not possible to obtain
due to problems w i t h too h igh d i f fe ren t ia l pressure in
the district heating network.
3.3. Experimental simulations of heat load variations during different seasons
3.3.1. Procedure Three different seasons have been exper imenta l ly
simulated; winter, summer and sp r ing / f a l l . The space
heating demand has been assumed to vary l inear ly
w i t h the outside temperature w i t h m i n i m u m (0 k W )
at + 1 7 ° C and m a x i m u m (300 k W ) at - 3 0 C C . The
experimentally simulated heat load peaks, due to

/ Landgren et al. I Biomass ami Bioenergy 26 (2004 j 255-26? 261
0 2 4 6 8 10 Time (h)
Fig. 6. Thermal output variations and emissions using the combustion chambers. (Emissions standardised to 10 vol% O ? ) .
increased hot tap water use du r ing morn ing , lunch,
dinner and evening, had to be set manually. It is,
however, very d i f f i c u l t to foresee the exact size o f the
heat load peaks in a real ne twork , when it depends on
the type o f consumer and size o f the ne twork. There
fore, it was o f a greater interest to study how fast the
system responded to a load change. The heat load
peaks were intended to last f o r approximate ly one to
two hours and to be i n the range o f 150-200 k W . The
experiments have been carried out both w i t h the
furnace alone and w i t h the furnace together w i t h the
heat store.
It was not possible to measure T H C in any o f the
experiments, due to fa i lure o f the measuring equip
ment. However , i t has been shown that l o w concen
trations o f C O also mean l o w concentrat ions o f T H C ,
see F ig . 7.
The results show that an increased emission o f
T H C occurs when the emissions o f C O exceed about
200 m g N m " 3 .

202 J. Lundgren er cd I Biomass and Bioenergy 26 (2004} 255-267
„ 20 H o™
~1 1—I I I I 11 I 1 1—! I I I 11 I 1 1—I I I I I 2 4 6 8 2 4 6 8 2 4 6 8
10 , 100 CO [mg/Nm @10 vol% 0 2 ]
Fig. 7. Emissions of T H C as a function of emissions of C O when
the larger module was operating.
D u r i n g the experiments w i t h the furnace only , the
s imulated load peaks have been induced manually by
decreasing the t ime between piston strokes and i n
creasing the air supply to reach the desired thermal
output .
W h e n the furnace was used together w i t h the heat
store, the set points f o r the f u e l feeding and air supply
were calculated in the same way as described earlier.
However . 50 k W was added to the setpoint fo r the
thermal output o f the furnace in order to charge the
heat store d u r i n g the t ime between heat load peaks.
Th i s was done to secure that there was sufficient
amount o f energy in the heat store to cover the peaks.
A u t o m a t i c con t ro l o f charging o r discharging the heat
store has not yet been developed, w h i c h means that
the d ischarging rate when load peaks occur was set
manual ly .
3.4. Results
3.4.1. Simulation of winter season D u r i n g the experiments, wood-chips w i t h moisture
content in the range 4 5 - 4 8 % were used. The results o f
the exper iment , where the large combust ion chamber
operated alone, are shown in F ig . 8. The figure shows
the de l ivered thermal output, the calculated space heat
ing demand and emissions o f C O and N O v .
The operat ion o f the furnace w o r k e d w e l l . Occa
s ional ly , smal l peaks o f C O and a sl ight increase o f
N O , emissions occurred when the thermal output o f
the combust ion chamber was increased. The aver
age C O and N O , contents in the stack gases were
13 (5 mg M J " 1 ) and 175 m g N m " 3 (91 m g M . I " 1 ),
respectively.
F i g . 9 shows the results, when the heat store was
used to handle the induced thermal output peaks. The
furnace was runn ing at a thermal output o f approx
imately 50 k W above the calculated space heating
demand.
The operation o f the combust ion chamber du r ing
this experiment worked smoothly as w e l l . Since the
heat store handled the heat load peaks, no peaks o f
C O o r N O v occurred due to changes o f the furnace
thermal output. The average C O and N O , contents
were s l ight ly l ower than in the case wi thou t heat store,
9 (4 m g M J " 1 ) and 173 m g N m " 3 (91 m g M J " 1 ) ,
respectively.
A comparison o f the t w o cases shows no m a j o r d i f
ferences in emissions o f C O or N O , . The results also
show that the response t ime o f the thermal output when
heat load peaks occur is fast in both cases. When us
ing on ly the combust ion chamber, the thermal output
increases around 10 k W / m i n and when using the heat
store around 40 k W / m i n . One possible explanation o f
the fast response t ime in Fig . 8 is that the heat transfer
unit can be used as a smaller heat store, w h i c h means
that it could be charged or discharged f o r shorter
periods o f t imes.
3.4.2. Simulation of spring/fall season
The spr ing/ fa l l season has been simulated in the
same way as the win te r season. However , due to lack
o f t ime f o r the experiments, both the measuring per iod
and the t ime between the peaks had to be decreased.
The moisture content o f the f u e l du r ing both exper i
ments was 50%.
The results o f the experiment, where the large c o m
bustion chamber operated alone, are shown in F ig . 10.
The figure shows the delivered thermal output, the ca l
culated space heating demand and emissions o f C O
and N O j .
The average space heating demand du r ing the
test run was 115 k W , w h i c h is b e l o w the m i n i m u m
thennal output intended f o r the larger combust ion
chamber. This makes the furnace more sensitive
to temporary temperature drops, w h i c h can result
in peaks o f C O . F ig . 10 shows that when the

J. Lundgren el ill l Bunnuss und Bioenergy 26 (201)41 233-267 263
5 0 0 -r
400 H
3 300 H
200 - 4
100 •
O H
Delivered thermal output
Space heating demand
NOx
t- 1000
r- 800
600
CO n r -
10 15
Time (h) 20
E ?
CT 400 —
200 p
1- 0
Fig. S. The large combustion chamber in Operation during simulation of winter season.
500' Delivered thermal output
Space heating demand
r 10 15
Time (h) 20
1000
800
600
f- 400
200
1- 0
Fig. 9. The large combustion chamber in operation together with the heat store during simulation of winter season.
thermal output is increased, the emission o f C O
decreases. The average C O and N O , contents in the
stack gases were anyway l o w , 3 1 ( 1 5 m g M . I ~ ' ) and
156 m g N m " ' (83 m g M J " 1 ) , respectively.
Fig . 11 shows the experiment where the combust ion
chamber operated together w i t h the heat store.
The same problem w i t h a too l o w thermal output
level occurred dur ing this test run . Even i f 50 k W
was added to the thermal output setpoint o f the boi ler
in order to charge the heat store between the load
peaks, the thermal output o f the combustion chamber
was below the intended m i n i m u m output. The most
appropriate solution in this case w o u l d have been to
run the smaller combustion chamber instead, but since
earlier results have shown that it is possible to run
the larger furnace at lower thermal outputs w i t h l o w
emissions and that the smaller one does not w o r k that
w e l l , the larger chamber was used. The qual i ty o f the
f u e l was very bad in both experiments, wh ich caused
frequent problems w i t h the fue l - feed ing system. T h e

264 J Lundgren et ut I Biomass and Bioenergy 26 i2titi4i 2 5 5 - 2 6 7
300 H g 250 -^
ö 150 —I
Delivered thermal output
ft
'v4 CO NOx Space heating demand
d L i a U - g. i l l , , IJ , J j
10 12
1400
1200 <s
Ö 1000 > o
800 "E z:
600 _E w c
400 o LO (/) E
200 LU
14 Time (h)
Fig. 10. The large combustion chamber in operation during simulation of spring/fall season.
Fig. I 1. The large combustion chamber in operation together with the heat store during simulation of spring/fall season.
fue l contained large amounts o f larger pieces o f wood ,
which tend to obstruct the f u e l supply. This resulted
in temporary temperature drops and therefore higher
peaks o f C O .
D u r i n g this experiment, the average C O and N O ,
contents in the stack gases were 50 (23 m g M J - 1 ) and
131 m g N m - ' ' (61 m g M J " ' ) , respectively.
A comparison between the t w o test runs shows very
small differences in emissions o f C O . However , the
content o f N O , in the stack gas is lower in the case
where the heat store was used. A possible explanation
o f this is that a new batch o f f u e l was del ivered before
the test run and the new f u e l m igh t have contained a
higher content o f f u e l bound ni t rogen.
3.4.3. Simulation of summer season The heat demand du r ing the summer season is very
low and can be assumed zero when the outside t em
perature is + 1 7 ° C or higher. However , the demand f o r
hot tap water is independent o f season. Especial ly dur
ing dayt ime, when the customers need hot water fo r
showers, laundry and other housework, large heat load

/ Lundgren el al. I Biomass anil Bioenergi' 26 1201)4} 255-267 265
T - 1000
0 1 2 3 4 5 6
Time (h)
Fig. 12. The large combustion chamber in operation together with the heat store during simulation of summer season.
fluctuations w i l l occur [ 5 ] . In the case where no heat
store is included, the boiler has to be started w h e n the
demand fo r hot tap water increases and stopped w h e n
the demand decreases. This w i l l cause large problems
concerning the ab i l i ty to meet the demand and emis
sions o f air pollutants. Furthermore, the start up t i m e
o f the boiler is most l ike ly longer than the dura t ion o f
the hot tap water peak, wh ich means that the demand
cannot be matched.
The solution o f the problems is to use the water
heat store. The boiler then runs to charge the heat
store and is stopped when the store is f u l l y charged.
The heat store is discharged when the hot tap water
demand increases. Therefore, on ly one s imula t ion o f
the summer season has been performed using the large
combustion chamber together w i t h the heat store. The
larger module was used because o f the good results
also at lower thermal outputs.
In addit ion, the boi ler should be operated at as l o w
thermal output as possible, w i t h maintained l o w emis
sions, to reduce the number o f starts and stops. H o w
ever, this on ly works i f the total heat demand over 24 h
is higher than or equal to the lowest possible amount
o f energy that the furnace can del iver to the heat store
during the same t ime.
The average thermal output o f the boi ler d u r i n g the
experiment was 145 k W , but should have been l o w e r
in a real case, due to the reasons discussed above. The
moisture content o f the wood-chips was 5 1 % . F i g . 12
shows the results o f the test.
D u r i n g this test run, problems w i t h larger pieces o f
wood obstruct ing the fue l feeding occurred as w e l l ,
w h i c h occasionally caused peaks o f C O .
The average C O and N O , contents in the stack
gases were 33 ( 1 6 m g M . I _ 1 ) and 1 5 6 m g N m " " '
(91 m g M J - 1 ) . respectively.
The first and second thermal output peaks were un
for tunately disproportionately large, on ly due to the
human factor. The peaks were induced by opening the
valve to the heat store and i f the operator opens it too
much, this w i l l occur. However, this does not affect
the combust ion process in any way.
4. Discussion
The experiments where the thermal output was var
ied b y stages showed that the emissions were very l o w
independently o f operation strategy. However , l e t t ing
the combust ion chamber operate at constant the rmal
output and using the heat store f o r load variat ions and
thereby avoid ing start- and stop phases give ex t remely
l o w emissions o f C O . The response t ime f o r changes
o f the heat demand was very fast f o r both opera
t ion strategies. Nevertheless, the use o f heat store f o r
handl ing the heat load variations also gave the fastest
response o f the thermal output.
Table 2 shows a summary o f the exper imental
results.
The results show that the average emissions
o f C O are very l o w in al l the per formed experiment .

266 J. Lundgren el al. I Biomass ami Bioenergy 2f> (20041 255-267
Table 2
Summary of resuli :s. Average emissions during different experi-
mcnts
Gas component Unit Heat store No heat store
Stepwise thermal output variations
CO (mg/MJ) 3 30
NO, (mg/MJ) Ml
T H C (mg/MJ) 0 2 0.3
Winter season
C O (mg/MJ) 4 5
N O , (mg/MJ) 91 91
Springlfall season
C O (mg/MJ) 23 15
NO, (mg/MJ) 61 83
Summer season
C O (mg/MJ) 16 — N O , (mg/MJ) 91 —
In general, there are smal l differences in emissions o f
N O , , w i t h the exception o f the spr ing/ fa l l season tests.
Dif ferent fue l qualit ies were used du r ing the exper i
ments w i t h and wi thout heat store, w h i c h cou ld have
affected the results.
There are at least f o u r different alternatives f o r small
distr ict heating systems based on this concept:
• T w o combust ion chambers wi thout heat store.
• O n l y the large combust ion chamber w i t h heat store.
• T w o combust ion chambers w i t h heat store.
• The larger combust ion chamber w i t h heat store
combined w i t h solar heat power.
Due to the situation dur ing summer, the alternative
wi thou t heat store is not appropriate. T o be able to
meet the demand fo r hot tap water d u r i n g summer,
a heat store must be included. As ment ioned before ,
there are no possibi l i t ies to start the furnace when the
heat demand increases and stop it af ter a short t ime
when the load peak is over, ma in ly f o r t w o reasons.
One is that the start-up t ime o f the furnace is too long ,
approximate ly three hours depending on the moisture
content o f the f u e l , and the other is that the emissions
o f pollutants in the f o r m o f products o f incomplete
combust ion w i l l be unreasonably h i g h , both du r ing
start up and stop.
Previous experiments have shown that the smaller
chamber does not work as satisfactorily as the larger
module, f o r several reasons, Lundgren et a l . [ 3 ] . The
results also show that the larger chamber has a much
broader thermal output span than expected. Therefore ,
it might be possible to use the large combust ion cham
ber dur ing every season, even summer, but then only
fo r charging the heat store when it is necessary. In this
case, i f the total heat demand over 24 h d u r i n g sum
mer is higher than or equal to the m i n i m u m amount
o f energy the furnace can deliver, no starts and stops
are required. This also means that small combus t ion
chamber can be excluded, wh ich results in a reduct ion
o f the product ion cost.
I f the average heat demand o f the c o m m u n i t y
dur ing summer is lower than the m i n i m u m amount o f
energy that the larger combustion chamber can pro
duce, an improved smaller module can instead be
used dur ing summer, to avoid start and stop phases.
In other words, the chosen solution depends on the
heat demand situation o f each communi ty o f interest
and. o f course, the economy, which is o f cruc ia l i m
portance f o r the chosen strategy.
Another idea could be to use solar heat p o w e r to
gether w i t h a heat store f o r hot tap water p roduc t ion
dur ing summer, which means that the bo i l e r does
nol have to operate dur ing this t ime. The solar heat
could also contribute lo heat p roduc t ion d u r i n g
spring and f a l l .
The lack o f adequate control o f the air supply has
most l i ke ly not affected the stack gas emissions. O n the
other hand, when the indirect process cont ro l is appl ied
w i t h a faster feedback o f O i concentrat ion, the air
supply w i l l probably be more economic resu l t ing in
an increased thermal eff iciency.
5. Conclusions
The boi ler can handle fast and large heat load va r i
ation w i t h maintained low emissions o f C O , N O , and
T H C . both when using the combust ion chamber on ly
and when it is used together w i t h the heat store. H o w
ever, when the heat demand is l o w , the best so lu t ion
fo r handl ing the heat load peaks is to use the heat store
together w i t h the large combustion chamber.
Concerning the performance o f the bo i l e r d u r i n g
different seasons, no problems should occur d u r i n g

/ Lundgren el ut. I Biomass ond Bioenergy 20 (2(H)4i 255-267 267
winter, spring and f a l l irrespective o f whether the heat
store is used o r not. On the other hand, dur ing summer,
when the heat demand is very low or zero a heat store
w i l l be necessary to secure the need f o r hot tap water
and to reduce emissions o f C O and T H C .
The main conclusion is that the most appropriate
solution f o r a small district-heating system is to use
a water heat store to match the heat load variations,
whi le the furnace operates at as constant thermal
output as possible.
Acknowledgements
This w o r k is part o f a project t i t led Increased
Combust ion Stabi l i ty in Modu la t ing Biomass Boilers
for Distr ict Heat ing Systems. The project is part ly
funded by the European Commiss ion in the f rame
work o f the N o n Nuclear Energy Programme J O U L E
I I I , Contract N o JOR3-CT98-0278 and part ly by the
Swedish Nat ional Energy Adminis t ra t ion .
The authors w o u l d l ike to thank the partners o f
the project f o r f r u i t f u l co-operation and discussions
during the project meetings and especially M r . M i k a e l
Jansson. Swebo Fl is och Energi A B f o r a very smooth
co-operation. The authors also grateful ly acknowledge
Boden Energi A B for p rov id ing fuel and other valu
able services.
Furthermore, the authors wou ld l ike to express
thanks to our colleagues at the Div i s ion o f En
ergy Engineer ing, Luleä Universi ty o f Technology,
especially our technician M r . Björn Lundqvis t fo r his
devoted w o r k .
References
[ I ] Energy in Sweden 2001. Swedish National Energy
Administration.
[2] Karlsson M - L . Gustavsson L . Mårtensson D. Leckner B.
Analysis ot today's best available leehnology for biomass fired
heating plants in the range of 0.3-10 MW. Technical Report.
N U T E K . 1907.
[3] Lundgren J . Hermansson R. Dahl .1. Experimental studies of
a biomass boiler suitable for small district heating network.
Biomass and Bioenergy. accepted for publication.
[4] Lundgren .1. Hermansson R. Dahl J . A new biofucl based
boiler concept for small district heating systems. Proceedings
of the 2001 Joint International Combustion Symposium. Kauai.
Hawaii. U S A . 9 -12 Sept 2001.
f5] Fredrikscn S. Werner S. Fjärrvärme- Teori, teknik och
funktion. Studentlitteratur. Lund. 1993 [In Swedish],
[6] Van Loo S. Koppejan J . editors. Handbook of biomass
combustion and co-firing. Enschcdc: Twente University Press:
2002.


Solar Assisted Small-Scale Biomass District Heating Systems in the Northern part of Sweden
J . Lundgren and R. Hermansson
Division of Energy Engineering, Luleå University of Technology S-971 87, Luleå, Sweden
A B S T R A C T
This paper presents a case study of a projected solar assisted biomass district heating system in the north of Sweden. It is generally known that a biomass district heating system combined with solar heat brings many important benefits. The most common system solution is to install a heat store and a large solar collector field near the heating central. No plant of this type is however in operation in the northern part of Sweden. The main reason for this is that the solar irradiation at these latitudes is very low when the demand for heat is high. Solar heat could however be useful during summer in order to generate hot tap water. One problem is that the heat losses, calculated as percentage of the delivered heat, become very large during these months. This paper presents the idea of allowing the connected households to generate their own hot tap water using solar collectors and heat stores installed in each house. The district-heating network can therefore be closed in summer, which eliminates the heat losses outside the heating period. A case study of a projected plant has been carried out and it is shown that it is possible to reduce the heat losses by 20% compared to a conventional system. This idea also provides many other important technical and economic benefits.
Key Words: District heating; Biomass; Solar heat
I N T R O D U C T I O N
The most common type of heating in large communities in Sweden is district heating, generally based on biofuels and heat pumps. At present, the most common technique for heating up houses in smaller communities is by a boiler installed in each house, where wood-logs and oil and/or electricity are extensively used. It may be mentioned that around 32% of the detached houses in the county of North Bothnia use electric heating. (Jonsson, 2000).
^Cor r e spond ing author. T e l . : +46-920-49 13 07; fax : +46-920-49 10 47
E-mail address: Joakim. Lundgrenia/ltu.se

A l l three alternatives are associated with problems. Combustion o f wood-logs in older boilers
may cause high emissions of pollutants, especially during winter. Oi l fir ing is a problem mainly due to its production o f green house gases, which increases global warming. Electricity is a high quality energy product that should be used for other purposes than heating up houses. In addition, it is important to reduce the demand for electricity for heating since the Swedish parliament has decided to phase out nuclear power, which in the year 2002
accounted for nearly 46% of the total electricity production. (Swedish National Energy
Administration, 2003a)
Connecting the houses to a local district heating system, where the heat production is based on biomass, could help to solve these problems. Biomass based district heating for larger
communities, where typical boiler capacities are in the range o f 20 to 150 MWth, is, as mentioned earlier, wel l established in Sweden. A t present, increasing taxes on fuel oil and developments o f the distribution network technology have made installation o f district heating and use o f biomass fuel economically attractive also for smaller communities, where typical
boiler capacities could be about 0.1 to 2 M W t n .
Several tests o f different biomass fired heating plants in the thermal output range o f 0.5 to 10 M W with the best existing combustion technology have shown that the emissions o f carbon
monoxide (CO) and total hydrocarbons (THC) at higher heat loads are relatively low, typically below 500 mg Nm" 3 and 8 mg Nm" 3 , respectively. However, the tests also showed
that the plants produced large amounts o f pollutants in the form of products o f incomplete combustion (PIC) during low as well as varying thermal outputs. (Karlsson et al., 1997). In small district heating networks, this is a common occurrence. For example, during summer,
the space heating demand may be very low or non-existent, while the demand for hot tap water is approximately the same irrespective o f season. For this reason the system has to work
with a varying thermal output in the range o f 10 to 100% of the nominal output, since the average heat demand during summer is estimated to be around 10% of the maximum demand in winter. A t such low thermal outputs, most existing biomass fuelled boilers must be
operated using on/off control, generally resulting in very high emissions of PIC and low
efficiency.
As an alternative, solar heat power could be used for hot water preparation outside the heating
period as well as space heating support.
A solar assisted biomass district heating plant may bring important benefits such as:
• Reduced number o f operation hours at low heat load and on/off control, resulting in
improved efficiency and reduced emissions o f pollutants. (Faninger, 2000).
• Possibility to perform service and maintenance o f the boiler without interruptions o f
its operation during summer.
The most common way of utilising solar heat in combination with district heating in Sweden and other countries in Scandinavia is to build solar collector fields close to the heating central
as shown in figure 1. A number o f such plants are in operation in the middle- and southern parts o f Sweden, some of which are presented and evaluated by Caiminder et al. (2001);
Dalenbäck (2001).
2

Solar collector
field
Boiler and
heat store
Distribution
network
User
Heat exchanger _ /
User
Heat exchanger
User
Heat exchanger
/ User
Heat exchanger
Figure 1. Sketch of a typical solar assisted biomass district heating plant in Scandinavia
No plant o f this type can however be found in the north o f Sweden, for the most part for the
following reasons;
• Lower prices o f electricity due to lower taxes in this part of the country.
• Low solar irradiation when the demand for heat is high.
• Sparsely populated areas, which requires long distribution networks.
The latter results not only in larger investments but also in large heat losses, in particular during summer, i f calculated as percentage o f the delivered heat. One way o f significantly reducing the heat losses would be to close the district-heating network and let the connected households generate their own hot tap water during this time. This would be possible i f roof
mounted solar collectors and heat stores were distributed to every house.
This paper presents a case study o f a projected solar assisted biomass district heating system in the north of Sweden, where the distributed system is compared to a conventional system
with a centrally placed solar collector field and heat store. The main objective has been to
investigate how the economy as well as the efficiency o f a biomass-solar district heating
system differs between the two system solutions.
N E W S O L A R A S S I S T E D B I O M A S S P L A N T P R O J E C T E D IN T H E N O R T H O F S W E D E N
As mentioned, there are plans to build a solar assisted biomass district heating network in a
small rural community located around 20 k m west o f the town of Luleå in the north o f Sweden. A t present, the majority o f the households in the village use electrically heated water
based systems. Many o f the households' electric boilers are relatively old and w i l l soon be in
need o f replacement.
3

The current solar energy contribution to the total energy supply in the northern part o f the
country is marginal, mainly due to the northerly latitude. The solar intensity is very low during at least four months in winter. During this time of the year the highest solar altitude
angle is below 10°, making it impossible to generate useful energy. Unfortunately, this occurs at the time o f the year when the demand for heat is the largest. Table 1 shows the average annual solar irradiation, temperature and energy output for a flat plate collector in three
Swedish cities, Lund, Stockholm and Luleå.
Table 1. Average annual solar irradiation (G), temperature and collector energy output.
Simulations for three Swedish cities. (Adsten et al., 2002).
Lund Stockholm Luleå (55.72° N) (59.33° N ) (65.55° N)
Average annual solar irradiation on 45°- 1124 1113 1077 tilted surface (kWh/m a) Average annual temperature (°C) for hours 13.4 13.6 9.8 with G(45°)>300 W / m 2
Average annual collector energy output 337 337 298
(kWh/m 2a) for flat-plate collectors ( T o p = 50°C)
As shown in the table, the collector output in Luleå is lower compared to those o f the southern
part of Sweden. It is therefore o f great importance that the generated solar heat is made use o f as efficiently as possible.
For this new plant, two different system solutions have been considered. The first alternative may be regarded as a conventional technique, with a central solar collector field and a short-
term heat store located near the boiler as shown in figure 1. Heat exchangers are then installed in every house to distribute the required space heat and the hot tap water. The second
alternative is to install solar collectors and a heat store in each house according to figure 2.
4

Heating central
Solar
collector
Figure 2. Solar assisted biomass district heating system with distributed solar collectors and heat stores
The heat stores w i l l serve not only as a heat store unit but also as a heat exchanger. Therefore, the heat exchangers used in the conventional system can be excluded. A n electric heater w i l l
be installed in every heat store as a back-up heat source, i f the boiler breaks down or failure of the network occurs. This is not possible in a conventional system, which means that the heat supply security w i l l increase significantly in this system. However, it may not be possible to
mount solar collectors on every single house depending on the geographical orientation o f the house or other unfavourable conditions that may affect the solar heat output. In these cases, the electric heater w i l l be used to generate the hot tap water.
Since the households generate their own hot tap water using solar heat or electricity outside the heating period, it is possible to close the distribution network during this time.
In the fol lowing, the conditions for the projected plant and assumptions made in order to make a comparison between the two different systems solutions are presented.
C O N D I T I O N S AND A N A L Y S I S
It has been assumed that 70 households w i l l be connected to the projected network. Table 2 shows the assumptions made concerning the customers' current demand for space heating, hot tap water and domestic electricity.
Table 2. Current energy demand for one typical household in the community
Space heating (kWh) 20 500 Hot tap water (kWh) 4 500
Domestic electricity (kWh) 5 000
Total energy demand (kWh) 30 000
5

The heat demand totals 25 000 kWh per household, which means that the heating plant should
deliver 1750 M W h annually.
It has been decided to use a wood-chips fired furnace, mainly because the fuel is available
close to the village.
The total solar collector areas have been set equal for both systems in order to be able to compare the two alternatives. On every house a solar collector of 5 m w i l l be installed for the distributed system, corresponding to a total collector field area o f 350 m" for the central
solution.
For the distributed system solution, each household w i l l install a heat store wi th a water volume of 330 litres, which is adequate for a 5 m 2 solar collector. This heat store is in the
same size range as the old electric boilers, which means that it should not be a problem to find the necessary space. In order to obtain the same storage capacity for the central water tank, a
water volume of 23.1 m 3 is required.
Annual Solar Heat Generation
Calculations for a flat plate collector (1-glass) located in Luleå have been carried out by using the TRNSYS based software WINSUN. (Perers and Bales, 2002). The software is used to estimate the performance of different types o f solar collectors and uses accurate weather data
including diffuse and beam radiation to achieve an accurate estimation o f the energy output. The weather file originates f rom data collected by S M H I (Swedish Meteorological and Hydrological Institute) during the years 1983 to 1992. The software uses a dynamic model based on well validated sub models for solar thermal collectors and general heat transfer. The
model is based on the Hottel-Whillier-Bliss equation for flat plate solar collectors wi th improvements that account for correction terms such as thermal capacitance, incident angle
effects, wind speeds and temperature dependence of the heat loss coefficient. The total model has been validated against test rigs during well controlled operating conditions.
The software requires the fol lowing input data to perform the calculations
• Ground reflectance factor, which has been set at 0.2 (grass) for the months o f May to
October. For the remaining months, the ground reflectance factor has been set at 0.9
(snow).
• The average operating water temperature o f the collector ( T o p ) has been set at 50°C,
which is reasonable for preparation o f hot tap water.
• The collector surface is south facing (azimuth angle 0°) and the surface is tilted 45°
f rom the horizontal ground plane. The latter is considered to be close to optimal at this
latitude. (Adsten et al., 2002).
Heat Distribution Losses
The heat losses f rom district heating networks vary significantly f rom system to system, depending strongly on for example the number o f connected customers (demand density),
length and type o f pipes. Measurements in different networks show that the heat losses may
vary f rom 6% to 23 % o f the delivered heat. (Heller, 2002).
6

Figure 3 shows a sketch o f a 2-pipe district heating culvert at a depth h below the ground
surface. Common practice is to put down the culvert with the return pipe above the delivering
pipe.
Figure 3. 2-pipe district heating culvert at a depth h below the ground surface.
According to the culvert manufacturer, the heat distribution loss per meter culvert (Pi o s s ) may
be calculated as
P,... =• AT
[W/m] ( 1 )
where the thermal resistances per meter for the culvert (R^) and the pipe (R p ) respectively,
may be expressed as
R =-In-K
-In 2 ( * + f ) 2(/> + f ) 2
[ r n C / r f ] (2)
= — [ r r T C / f H K 1
(3)
where K is the thermal conductance per meter pipe. The thermal conductivity o f the ground
(A.g) is estimated at 1.9 W m"'°C" . The temperature difference between the culvert and ground
(AT) is calculated as
AT = ^ - ^ - T g [ ' C j (4)
where T f is the delivered water temperature, T r is the return water temperature and T g is the
ground temperature.
In the calculations it has been assumed that the ground temperature remains constant at 5°C
over the year. The delivered water and the return temperature vary depending on the time of
the year.
Table 3 shows the properties o f the chosen district heating culvert for the central system
solution. The distribution network culverts are dimensioned for maximum heat and hot tap
7

water load, and the lengths are estimated by measuring on maps and the data are collected
from the manufacturer. The culvert is located at a depth (h) o f 0.6 m below the ground
surface.
Table 3. Thermal conductance (K) , diameters (d) and lengths o f different culvert dimensions
Dimension 20 25 32 40 50 65 76
K (W/m°C) 0.205 0.225 0.210 0.244 0.282 0.277 0.291
d ( m ) 0.125 0.140 0.180 0.180 0.200 0.250 0.280
Length (m) 1825 150 325 550 175 225 270
For the other system, the culvert may be dimensioned for the average value o f the total heat
load resulting in a smaller average diameter, since the heat stores are distributed. Table 4
shows the properties and lengths for this case.
Table 4. Thermal conductance (K) , diameters (d) and lengths o f different culvert dimensions
Dimension 20 25 32 40 50 65
K (W/m°C) 0.205 0.225 0.210 0.244 0.282 0.277 d ( m ) 0.125 0.140 0.180 0.180 0.200 0.250
Length (m) 2075 275 220 305 150 495
Furthermore, it is assumed that the network can be closed for at least three months during the summer.
Economy
Economic calculations have been performed for both system solutions applied to the projected district heating network. The total annual heating costs have been compared to the customers' present annual cost. Assumed conditions for the plant owner and customers are presented in
tables 5 and 6 based on information f rom manufacturers. Value-added tax o f 25 % is included
in all costs and prices.
Table 5. Assumed conditions for the plant owner
Central Distributed
Investment for furnace, fuel feeding system (SEK) 1 875 000 1 875 000
Investment for heat store 23.1 m 3 (SEK) 93 600 -Investment for solar collectors 350 m 2 (SEK) a 630 000 -Investment for distribution network (SEK) 3 499 950 3 460 820
Personnel, maintenance, etc 182 500 182 500
Depreciation time (years) 15 15
Interest rate 5 % 5 %
Profit margin 5 % 5 %
Fuel price (SEK/MWh) b 128 128 a Installation costs included b According to Swedish National Energy Administration (2003b)
Culvert pipes with diameters below 54 mm are copper Twin-pipes, while larger pipes are
made of steel. The contractor has estimated the costs for digging and refi l l ing at 550 SEK m"1
8

and an average working cost at 220 SEK m" 1. The average total cost per meter o f pipe amounts to around 1000 SEK.
Table 6. Assumed conditions for customers
Central Distributed
Investment for heat store, solar collector, 42 500 control system (SEK) Heat exchanger (SEK) 37 500
Total current energy use ( k W h ) a 30 000 Current total electricity price (25A fuse) 0.775 (SEK/kWh) b
Total electricity price after connection to D H 1.034 (16Afuse) (SEK/kWh)" a See table 2 b According to Boden Energi A B (2004)
In the calculations the depreciation time was set at only 15 years due to the fact that the village is located in the countryside where it is diff icult to foresee demographic changes. A normal depreciation time would have been at least 20 years. As shown in table 6, it is possible to change to a lower current fuse after connecting to the district heating network, since the use
of electricity decreases radically.
R E S U L T S AND D I S C U S S I O N
Figure 4 shows the calculated average solar energy output for a flat plate collector over a normal year in the city o f Luleå. The solar collector output over a year amounts to 298 kWh
m"~, resulting in a total solar collector output o f 1490 kWh per household or 104 300 k W h for the collector field. A higher thermal output is calculated for Apr i l than for May because o f the assumed higher ground reflectance factor due to the snow on the ground.
, I I I I I I
CM E
1 5 0 -CM
E
1 a
4 0 -
o
o 3 0 -
r colle
d
r colle
d
2 0 -
Sola
1 0 -
2 4 6 8 10 12
M o n t h
Figure 4. Average solar collector output over a normal year in Luleå.
It may however be discussed whether the specific solar collector output can be set equal for
both alternatives. A large solar collector field may be optimally oriented towards the south, while collectors mounted on each house may not. Additionally, trees, buildings, etc may
9

cause shadows resulting in a decrease o f the collector output. On the other hand, the efficiency o f the collectors is lower for the central solution, since the operating water temperature has to be higher when the generated heat is distributed in the district heating network. To what extent these factors affect the results is very dif f icul t to estimate, and in
order to obtain more accurate results, a detailed study o f the system when it is built is
required.
Figure 5 shows the calculated heat losses over one year and the assumed water temperatures (delivered and return) for the centralised alternative. The total annual culvert heat loss for the
central system has been calculated at 408 M W h , corresponding to 23.3% o f the total annual heat demand. For the distributed case, it should, as mentioned, be possible to close the district heating network during summer, since the customers generate their own hot tap water during
this time. Thereby, the heat losses during this period can be eliminated as shown in figure 6. Wi th the network closed during these three months, the total annual heat loss totals 326 M W h , corresponding to 18.6% o f the total annual heat demand.
5 0 x 1 0 - 1
03 CD X
4 6 8 10
Month
Figure 5. Heat losses and water temperatures over a year for the centralised system
I I I I L
CO CD cn
03 CD X
5 0 x 1 0 - f
4 0 •
3 0 •
2 0 -
1 0 -
0 • ^ I I
2 4 6 8
Month Figure 6. Heat losses over a year for the distributed system
10 12
10

The heat losses are thereby reduced by 82 M W h or around 1170 kWh per household compared to the central system. In relation to the solar collector output for one household over a year, the heat loss reduction is significant, corresponding to approximately 79% of the estimated total solar collector output. This means that in order to generate the equal amount o f useful solar energy for a collector field, the area has to be increased by roughly 4 n r per household. On the other hand, it may be discussed i f the heat losses during summer are exaggerated, since the ground temperature is most likely higher than the assumed value.
The heat losses may however be considered large for both system solutions. However, the results agree with the upper value that Heller (2002) claims to be reasonable. Table 7 shows the assumed distribution o f the annual generated energy from the different sources after
conversion to district heating. Table 8 shows the required annual heat delivery f r o m the plant. Table 9 shows the results o f the economic calculations based on the assumptions presented in tables 5 to 8. The results show that the distributed system solution is less expensive than the conventional technique, around 960 SEK less per year.
Table 7. Assumed energy generation f rom different sources per customer
Central Distributed
District heating (kWh) 25 000 23 200 Solar energy (kWh) a 1 490 Electricity (water heater and domestic) (kWh) 5 000 5 310 a Included in the district heating share
Table 8. Annual heat delivery f rom the plant and other plant data
Central Distributed
Nominal boiler thermal output (kW) 840 840 Annual heat delivery ( M W h ) 1750 1624
Heat losses ( M W h ) 408 326 Total heat generation ( M W h ) 2158 1950 From biomass boiler ( M W h ) 2053 1950 From cent, solar collector ( M W h ) 104.3 -Boiler efficiency (%) 80% 80% Required fuel input ( M W h ) 2567 2437
Table 9. Present cost for electric heating and cost after connecting to the new network using conventional or distributed system solutions per household
Total annual cost (SEK) Specific energy cost (SEK/kWh)
Electric heating 23 250 0.775 Central system solution 29 567 0.986 Distributed system solution 28 607 0.954
However, the most important criterion for getting the households to change heating systems is that the total annual heating cost w i l l not exceed the customers' present cost. According to the
economic calculations, this cost is larger for both cases, provided that the assumed conditions are valid. I t may therefore be di f f icul t to motivate customers to connect to this k ind o f district
heating system in the present conditions. However, it is important that the potential customer consider the future development o f the electricity and oi l prices.
11

It should be mentioned that there are several uncertainties in the economic calculations. For example, the government may give economic support for solar heating plants installed in detached houses, apartment buildings and other premises. The subsidy amounts to SEK 2.50 per generated k W h and year, but is not allowed to exceed SEK 7,500 per year for detached
houses and SEK 5,000 for blocks o f flats and other dwellings. (Swedish Codes o f Statutes, 2000). In these calculations, no governmental subsidises have been taken into account. The reasons are that they differ f rom case to case and that it is hard to foresee to what extent
government subsidies for this kind o f plant wi l l be available in the future.
In addition, to make a correct economic comparison wi th the current annual energy cost, the customers' investment in a new electrical boiler should be taken into account. As mentioned earlier, several o f the existing electric boilers in the households are today old and w i l l soon
need to be replaced.
A sensitivity analysis has been carried out in order to study how different factors affect the total specific energy price o f the decentralised system. Figure 7 shows the result. As shown in the figure, the depreciation time and the number of connected households have the largest
effect on the specific energy price. I f for example the depreciation time is increased by five years or the number o f customers increases by twenty, the specific price decreases significantly, but not enough to reach break-even. However, calculating wi th a depreciation
time of 20 years as wel l as 90 connected households results in a price very close to the current
electricity price.
2 UJ CO
<E c CD
1.1
1.0 H
0.9 H
0.8 H
0.7 H
+ i
•
200 S E K / m i
' 10 years
4 ' + 1 % . > + 1 0 % - 2 0 % j
<
+ 1 0 % ,
» 50
< - 2 0 0 SEKVrr]
• 20 yea rs
' - 1 % 1 - 1 0 % + 2 0 % ' - 1 0 %
( » 90
CD O
O
T B
J ra
CD
J . i w CO i
w CD "O
lor
out
tor
inv
useho
o o o æ i "5 ö ü O
Figure 7. Different factors affecting the total specific energy price. The dotted line represents the current energy price.
The third most influential factor is the distribution network cost. A n increase of 200 SEK m" results in an increase o f the specific energy price by 0.0424 SEK kWh" 1 . I f the solar collector
output increases by 20 %, the specific energy cost decreases marginally, less than 0.8 %. This
is due to the minor solar energy contribution. Figure 8 shows the electricity price increase required to reach a break-even situation i f the distributed system solution is chosen.
12
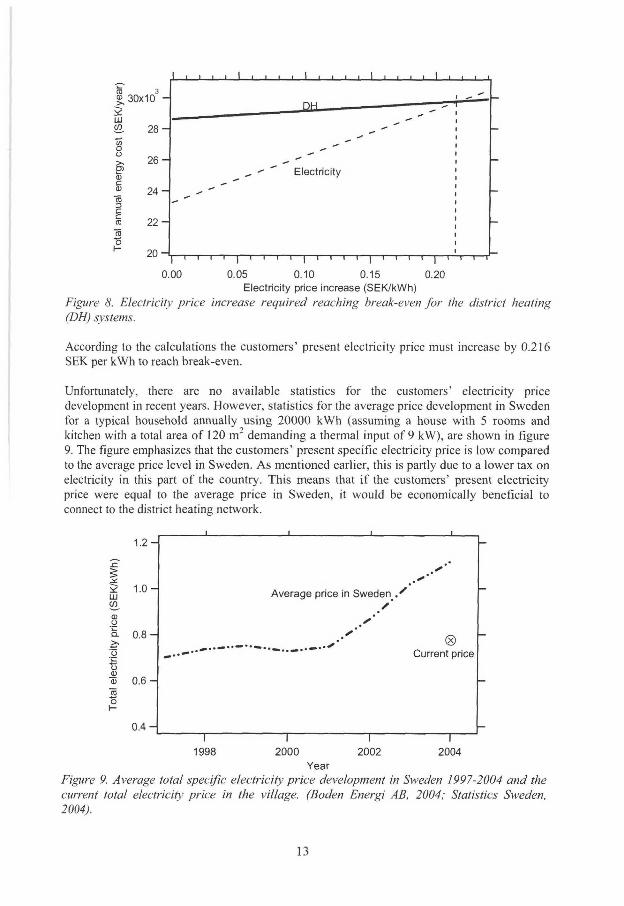
Figure
- j i i — i — i — j — i — t — i — i — i — i — i — i — i — p
0 .05 0 .10 0 .15 0.20
E l e c t r i c i t y p r i ce i nc rease ( S E K / k W h )
Electricity price increase required reaching break-even for the district heating
(DH) systems.
According to the calculations the customers' present electricity price must increase by 0.216 SEK per kWh to reach break-even.
Unfortunately, there are no available statistics for the customers' electricity price
development in recent years. However, statistics for the average price development in Sweden for a typical household annually using 20000 kWh (assuming a house with 5 rooms and kitchen with a total area o f 120 n r demanding a thermal input of 9 kW), are shown in figure
9. The figure emphasizes that the customers' present specific electricity price is low compared to the average price level in Sweden. As mentioned earlier, this is partly due to a lower tax on electricity in this part o f the country. This means that i f the customers' present electricity
price were equal to the average price in Sweden, it would be economically beneficial to connect to the district heating network.
2 LU CO
as o r-
1.2 H
1.0 H
Q. 0.8 H
0.6 H
0.4 H
A v e r a g e p r i c e in S w e d e n ^ . '
® C u r r e n t p r i ce
1 9 9 8 2 0 0 0 2 0 0 2 2 0 0 4
Year Figure 9. Average total specific electricity price development in Sweden 1997-2004 and the
current total electricity price in the village. (Boden Energi AB, 2004; Statistics Sweden,
2004).
13

C O N C L U S I O N S
The solar collector output over a year in the city of Luleå totals 298 k W h m" 2 . This corresponds to approximately 6% o f the total annual heat demand for both cases, calculating
with a solar collector area o f 5 m" per household. The comparison between the central- and distributed system shows that it is possible to decrease the heat losses by 20% i f the distributed system is used, assuming that the network can be closed for three months during
summer. In comparison to the solar collector output for one household over a year, the heat loss reduction is significant, corresponding to approximately 79% of the estimated total solar collector output. This means that in order to generate an equal amount o f useful solar energy for a collector field, the area has to be increased by roughly 4 m~ per household. Additionally,
the efficiency o f the collectors is lower for the central solution, since the operating water temperature has to be higher when the generated heat is distributed in the district heating network. On the other hand, the heat losses during summer are most likely over-estimated,
since the ground temperature is probably higher than the assumed value.
The economic comparison between the central- and the distributed system solution shows that the resulting total annual energy cost is lower for the latter system, roughly SEK 960 less per
year. However, both total heating costs are significantly higher than the customers' present cost for electric heating. This w i l l presumably make it diff icul t to motivate them to connect to
the projected district heating plant. On the other hand, the potential customer should definitively consider the electricity price development, since the price trend is increasing. The calculation shows that the households' present electricity price must increase by 0.216 SEK
kWh" 1 or 35% from today's level to reach a break-even situation.
It is diff icult to draw any explicit conclusions regarding the distributed solar system before the idea has been implemented and evaluated after a reasonable time in operation. However, the
system would solve the problem wi th large heat losses during summer calculated as percentage o f delivered heat and brings other important benefits, which, f rom the authors' point o f view, makes it a very attractive idea.
N O M E N C L A T U R E
G Average annual solar irradiation T o p Average collector operation water temperature Pioss Culvert heat losses in W / m
AT Temperature difference between the pipe and the ground in °C R c Culvert thermal resistance per meter of pipe in m°C/W R p Pipe thermal resistance per meter pipe in m ° C / W
Xg Thermal conductivity o f the ground in W/m°C h Depth in m d Culvert pipe diameter in m
K Thermal conductance per meter pipe in W/m°C
Tf Delivered water temperature in °C T r Return water temperature in °C
T g Ground temperature in °C
14

A C K N O W L E D G E M E N T S
The study has been financed by Swedish National Energy Administration and Objective 1 -
ETJ Structural Fund Programme for Northern Norrland. The authors gratefully acknowledge
this support.
R E F E R E N C E S
Adsten, M . ; Perers, B . ; Wäckelgård, E. (2002). The influence o f climate and location on collector performance. Renewable Energy, 25, 499-509.
Boden Energi A B . (2004). Price information. U R L : http://www.bodensenergi.se/index.asp
(accessed March 2004).
Calminder, B. ; Landfors, K . ; Södergren, L-O. (2001). Medelstora solvärmeanläggningar - En
utvärdering av medelstora solvärmeanläggningar uppförda under perioden 1993-2000, Technical report; K-Konsult Energi A B : Stockholm, Sweden.
Dalenbäck, J-O. (2003). European Large Scale Solar Heating Network, hosted at Chalmers
Tekniska Högskola; Gothenburg, Sweden. U R L : http://www.hvac.chalmers.se/cshp (accessed
Oct 2003).
Faninger, G. (2000). Combined Solar-Biomass District Heating in Austria. Solar Energy, 69
(6), 425-435.
Heller, A.J. (2002). Heat-load modelling for large systems. Applied Energy, 72, 371-387.
Jonsson, M . (2000) Energiläget i Norrbotten, Technical Report; Norrbotten Energy Network:
Luleå, Sweden.
Karlsson, M - L . ; Gustavsson, L . ; Mårtensson, D.; Leckner, B . (1997). Analysis of today's best
available technology for biomass fired heating plants in the range of 0.5 to 10 MW, Technical report; Närings- och teknikutvecklingsverket (NUTEK): Stockholm, Sweden.
Perers, B. ; Bales, C. (2002). A Solar Collector Model for TRNSYS Simulation and System
Testing, Technical Report; Solar Energy Research Center (SERC): Högskolan Dalarna,
Borlänge, Sweden.
Statistics Sweden (SCB).(2004). Prices on electricity (incl grid charges) for household
consumers. URL: http://www.scb.se/templates/tableOrChart 53603.asp (accessed March
2004).
Swedish Codes o f Statutes (SFS) 2000:87. (2000). Förordning (2000:287) om statligt bidrag
till investeringar i solvärme, Swedish Parliament: Stockholm, Sweden.
Swedish National Energy Administration. (2003a). Energy in Sweden 2003, Statistical report;
Swedish National Energy Administration: Eskilstuna, Sweden.
Swedish National Energy Administration. (2003b). Price sheet for biomass, peat etc Nr
3/2003, Swedish National Energy Administration: Eskilstuna, Sweden.
15


SMALL- AND MEDIUM SCALE BIOMASS DISTRICT HEATING IN SWEDEN - POTENTIAL AND PROBLEMS IN
FURTHER UTILISATION
J. Lundgren*, J. Yan, J. Dahl, R. Hermansson
Division of Energy Engineering, Department ofApplied Physics and Mechanical Engineering,
Luleå University of Technology, S-971 87, Luleå, SWEDEN
S U M M A R Y
The objectives o f this paper have been to investigate the possibilities and obstacles o f an
increased utilisation o f biomass district heating primarily in order to replace o i l - and
electric based heating systems. The study shows that the resources o f biomass are
abundant and there is potential for a further biomass usage for energy purposes. More
than 42 TWh of oil and electricity are at present used for heating in Sweden,
constituting the maximum potential for an expansion o f biomass based district heating.
Such evolvement would bring many environmental and socioeconomic benefits. For
example, the CO2 emissions would decrease by more than 5.6 mil l ion tonnes annually
and several job opportunities would be created at different levels. The main hindrance
for a further utilisation is o f economical nature.
KEYWORDS: biomass; district heating; biofuel; biomass combustion; potential
1. INTRODUCTION
The interest for an increased use o f renewable energy sources world wide has grown
stronger in the last two decades. The main reasons are the oi l crisis during the 1970's
and -80's as well as the concern o f the increased concentration of greenhouse gases in
the atmosphere and their influence on the climate.
Climate change caused by anthropogenic activities is considered to be one o f the most
serious environmental problems. According to UN's Intergovernmental Panel on
Climate Change (IPCC), the global averaged surface temperature is expected to increase
by 1.4°C to 5.8°C over the period 1990 and 2100. These results cover the fu l l range of
35 Special Reports on Emission Scenarios (SRES), based on a number o f climate
models. (Houghton et.al, 2001). The United Nations Framework Convention on Climate
Change (UNFCCC) states that the overall objective is "stabilisation of greenhouse gas
*Correspondence to: J. Lundgren
Tel . : +46 920 491 000; fax : +46 920 491 047
E-mail address: Joakim.Lundgren@ltu .se

concentrations in the atmosphere at a level that would prevent dangerous anthropogenic interference with the climate system". Unless major changes are made concerning the use o f fossil fuels for energy conversion, the concentration o f greenhouse gases in the atmosphere w i l l continue to increase. (Hoffert et.al, 1998).
In order to reduce the greenhouse effect, one o f the methods is to substitute fossil fuels by an increased use of renewable energy for heat and electricity generation. According
to the European Commission's white paper, the ambition is to double the use o f renewable energy sources f rom the current level of 6 % up to 12 % in the year 2010. A
significant share is forecasted to be biomass. (European Commission, 1997).
The Swedish parliament has decided to create necessary conditions for effective energy
use and cost-efficient energy supply with low negative effect on health, environment and climate. The goal is a future energy system based on domestic and non-polluting
energy sources to the fullest possible extent.
There has been a radical change in the Swedish energy supply in the last thirty years. For example, the crude oil and other oil products contributed wi th 77% of the total energy supply in the year 1970, while the current share has decreased down to 33% in
the year 2000. The main reason for this was the earlier mentioned oil crisis. Later on, increasing taxes on fossil fuels and investment subsidises for renewable energy promoted a further switch f rom fossil fuels to other energy carriers. During these years,
the oil based energy generation has been replaced by nuclear power, biofuels and an increased hydropower production. The energy supply f rom coal and coke stands
roughly at the same level as 1970, around 4% of the total energy supply. (Swedish National Energy Administration, 2002). Figure 1 shows the total primary energy supply in Sweden 2001, which amounted to 616 TWh. (7 TWh of electricity was exported).
Figure 1. Primary energy supply in Sweden 2001 [TWh]. (Swedish National Energy Administration, 2002).
The figure shows that Sweden has almost 30% of the total energy supply deriving f rom renewable sources. Biomass contributes with the largest share, around 16% of total
energy supply or 98 TWh in absolute figures.
2

Bio fuels can be subdivided into five different groups;
• Wood fuels, such as wood-logs, bark, cutter shavings, wood-chips, pellets, briquettes and other forest residues.
• Black liqueur, which is a by-product f rom the pulp industry formed when wood-chips are boiled in order to produce pulp.
• Peat is a biomass that is incompletely decomposed and has been developed in bogs and fens. It can however be discussed whether peat should be classified as a renewable energy source or not.
• Waste of biological origin is mainly burned up in refuse incineration plants. Methane from sewage-treatment plants and landfills can also be included to this group.
• Agricultural fuels, such as energy grass, straw, grain for ethanol production, originate f rom farming.
The biomass in Sweden is mainly woody biomass, mostly used within the forest industries, district heating plants and detached house sector as well as for electricity generation.
7.7 Objectives
This paper is focused on describing and analysing the current energy usage for space heating purposes and hot tap water preparation in Sweden as well as finding the potential for small- and medium scale district heating based on biomass. Benefits and possible obstacles for a further utilisation are also discussed.
3

2. PRESENT H E A T I N G S I T U A T I O N I N SWEDEN
The demand for space heating in Sweden is relatively large due to the country's cold climate, in particular in the northern part. In table 1, the total energy use for space
heating and hot tap water preparation in detached houses, blocks o f flats and other dwellings is shown.
Table 1. Total annual energy use for space heating and hot tap water preparation in Sweden in year 2000. (Swedish National Energy Administration, 2003a)
Energy use [TWh a"'l
Oil 20 Detached houses 12 Blocks o f flats 3 Other dwellings 5
District heating 41 Detached houses 4
Blocks o f flats 22 Other dwellings 15
Electricity 22 Detached houses 16 Blocks o f flats 2
Other dwellings 4
Wood-chips, logs, pellets, gas 10 Detached houses 10 Blocks o f flats <1 Other dwellings <1
Total 93 Detached houses 42 Blocks o f flats 27 Other dwellings 24
As shown in table 1, more than a third o f the detached houses use electric heating today. Approximately 500 000 single family houses use direct electric heating and around
200 000 have electrically heated water based systems. (Silveira, 2001). The main reasons for this extensive electricity use are low prices and installation costs as well as convenient operation. Other common heating alternatives in this sector are oi l and wood-logs or mixes o f these. Biofuels, in particular wood-logs and chips are most
commonly used in single family houses located on the countryside, linked to the good access to forests.
Electric heating and combustion o f o i l and wood-logs are however associated with problems o f different kinds. Combustion o f wood-logs in older boilers may cause high
emissions o f pollutants, especially during winter. In many Swedish households poor and old combustion equipment is still in use. In fact, the stock o f boilers in Swedish family
houses is considered to be one of the oldest in Europe. (Silveira, 2001). Oi l f i r ing is a problem mainly due to production o f greenhouse gases, which enhances the global
4
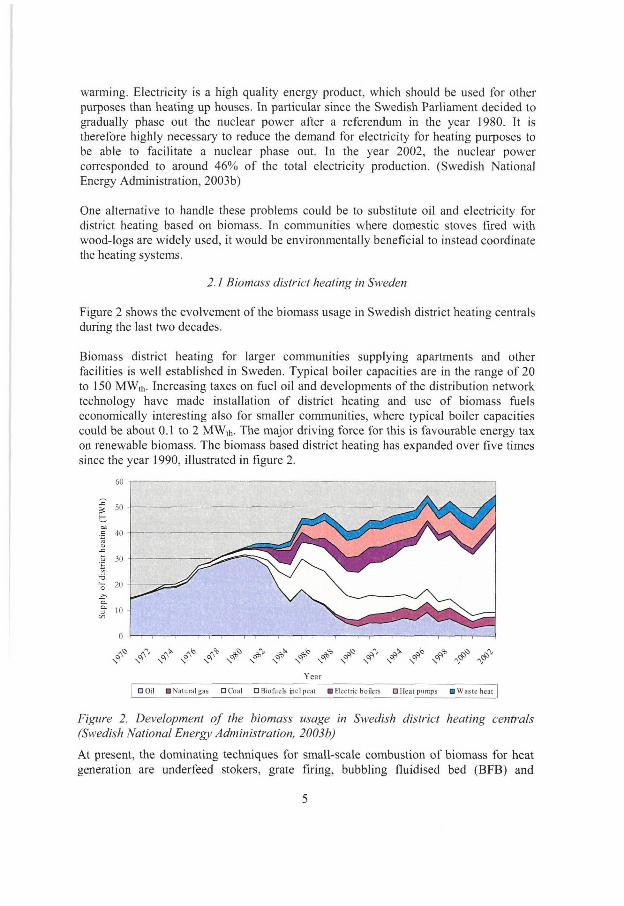
warming. Electricity is a high quality energy product, which should be used for other
purposes than heating up houses. In particular since the Swedish Parliament decided to gradually phase out the nuclear power after a referendum in the year 1980. It is therefore highly necessary to reduce the demand for electricity for heating purposes to
be able to facilitate a nuclear phase out. In the year 2002, the nuclear power corresponded to around 46% of the total electricity production. (Swedish National Energy Administration, 2003b)
One alternative to handle these problems could be to substitute oi l and electricity for
district heating based on biomass. In communities where domestic stoves fired wi th wood-logs are widely used, it would be environmentally beneficial to instead coordinate the heating systems.
2.1 Biomass district heating in Sweden
Figure 2 shows the evolvement of the biomass usage in Swedish district heating centrals during the last two decades.
Biomass district heating for larger communities supplying apartments and other
facilities is well established in Sweden. Typical boiler capacities are in the range o f 20 to 150 MWih. Increasing taxes on fuel oil and developments o f the distribution network
technology have made installation o f district heating and use o f biomass fuels economically interesting also for smaller communities, where typical boiler capacities
could be about 0.1 to 2 M W t n . The major driving force for this is favourable energy tax on renewable biomass. The biomass based district heating has expanded over five times since the year 1990, illustrated in figure 2.
Year
• Oil BNaturalgas • Coal • Biofuels incl peat • Electric boilers • Heat pumps BWastehcat
Figure 2. Development of the biomass usage in Swedish district heating centrals (Swedish National Energy Administration, 2003b)
At present, the dominating techniques for small-scale combustion o f biomass for heat
generation are underfeed stokers, grate firing, bubbling fluidised bed (BFB) and
5

circulating fluidised bed (CFB) furnaces. (Obernberger, 1998). Heating plants wi th thermal outputs in the range of 1-5 M W t n are often o f moving grate type, mainly for
economic reasons. These types are considered robust and reliable, but are seldom equipped with any advanced process control. In communities where for example sawmills exist, larger plants such as cogeneration plants in the thermal output order o f 100
MWti, have been or are being built. In such plants, CFB furnaces are the most commonly used. (Zethraeus, 1999). As shown in figure 2, electricity generation using biofuels is slightly increasing but corresponds to a minor share o f the total biomass
usage at present.
3. POTENTIAL ENERGY, ECONOMIC A N D E N V I R O N M E N T A L A N A L Y S I S
3.1 Bioenergy resources in Sweden
Sweden is a thinly populated country with around 20 inhabitants per square kilometre.
Large forest areas make the country rich in natural biomass resources. Other fuel sources are peat bogs, farmlands, waste and recycled products f rom industries. More than 50 % o f the country's total area is productive forestland, corresponding to 23 mil l ion hectares. The annual net increment is around 100 million m 3 o f total stem
volume, bark included. (Silveira, 2001). According to the National Board o f Forestry (2003), the present annual gross fell ing amounts to 83.5 million m 3 . The amount o f
wood that can be used as fuels in the future is however a controversial issue, depending on ecological, economical as well as technical aspects.
Several studies have been done concerning the potential supply o f biomass energy from forestry in Sweden. The studies have been carried out using different time perspectives and assumptions concerning important influencing factors, such as ash recycling,
competition with other users etc. Due to this, the studies showed large disparities o f the estimated potential o f future biofuel supply. Johansson et.al (1999) have summarised the results f rom some of these studies, showing that the highest estimation on available
biomass energy in the first half o f the 2 1 s ' century amounts to 131 TWh (470 PJ) f rom forestry and 58 TWh (210 PJ) f rom agriculture. Other studies have calculated the potential at lower levels. According to Lönner et.al, around 80 TWh (287 PJ) f rom
forestry can be considered to be economically available in the medium time range. In a longer perspective these figures may increase significantly, primarily due to technical
developments and provided that sufficient demand exists.
There are however large uncertainties in these kinds o f estimations. Concerning potential biomass f rom forests, the future demands for stem wood for building purposes as well as the developments in the paper and pulp industries are large influencing
factors diff icul t to foresee. Governmental energy policy priorities affecting future energy prices and technical progresses are also factors needed to be considered. (Johansson, 1999).
However, Silveira (2001) claims that the common understanding at present is that the
biomass resource base w i l l not be a l imiting factor for future development o f biomass
use in Sweden in the foreseeable future.
6

3.2 Economic calculations
The Swedish Bioenergy Association (2000) has made economic calculations for three plants wi th a nominal thermal output o f 2 M W t n using oi l , pellets and wood-chips
respectively as fuel. Table 2 shows essential data for the calculations. The investments are excluding value-added tax ( V A T ) .
Table 2. Economical calculations according to The Swedish Bioenergy Association
Oi l Pellets Wood-chips Investment (SEK) 1 200 000 5 000 000 6 000 000 Heat generation (MWh/a) 8 000 8 000 8 000 Fuel price (SEK/MWh)* 460 230 140 Maintenance and operation cost 12 000 100 000 180 000 (SEK/a) Overall efficiency (%) 90 85 80 Depreciation time (years) 20 20 20 Interest rate (%) 5 5 5
* A l l taxes included. Note that the prices are not up to date
The calculations should however strictly be considered as an example and as a comparison between different kinds o f fuels. Figure 3 shows the resulting total specific energy cost for the fuels.
LLl CO
Oil Pellets Wood-chips
Figure 3. Total specific energy cost for different fuels in Sweden
It is shown that oi l is the most expensive fuel, while wood-chips are the most economically favourable fuel.
The profitability when using wood chips as fuel is however strongly dependent on
transport distances. Pellets and, in particular, oi l has a higher energy density than wood-
chips, which means that a larger number o f transports are required to for example a
wood-chips f ired heating central than to an o i l - or pellet fired plant. Figure 4 shows the
7

total fuel and transport cost for pellets and wood-chips wi th different moisture contents
as a function o f transport distance. The energy densities (kWh m"3) and bulk densities (kg m" 3, wet basis) are collected f rom Van Loo et.al (2002). According to Karlsson (2000), the cost for lorry transports amounts to 789 SEK h" . This is valid for a lorry with triple axles managing a total load of 10 tonnes. Furthermore, the time for a 10 km
transport is estimated to 30 minutes both ways. The costs for loading and unloading are neglected, since the cost may be considered equal, independent on fuel type. The
calculations are based on specific fuel prices, annual heat generation and overall efficiencies according to table 2. It is further assumed that the lorry can manage the
volume that 10 tonnes o f fuel corresponds to.
1200 L , !
0 50 100 150 200
Distance (km)
Figure 4. Total fuel and transport cost for pellets and wood-chips with moisture contents 30% and 50%, respectively
Based on these assumptions, the calculation shows that it is not profitable to transport wood-chips longer than 50 to 130 km depending on the moisture content in the wood-chips compared to pellets. The distance between the plant and the fuel deliverer is
therefore crucial when the choice of fuel is to be made. Another aspect is that wood-chips fired plants may have close access to stem wood which brings the possibility to produce own wood-chips by using a wood-chipper. Producing own wood-pellets would
in most cases be too expensive at present, at least for small- and medium sized plants.
More detailed economic calculations have been performed for a residential district close to the town o f Boden in north o f Sweden, where biomass district heating can be
considered as an interesting alternative. At present, the majority o f the households use
an old electric boiler, which is in urgent need o f replacement.
Table 3 shows the current energy demand and costs for an average household in the
community.
8

Table 3. Assumed present conditions for the customers
Space heating demand(kWh) Hot tap water demand(kWh) Domestic electricity (kWh) T O T A L A N N U A L ELECTRICITY USE (kWh) Electricity supply system fee (SEK/a)* Specific electricity price (SEK/kWh)* T O T A L A N N U A L ENERGY COST Total specific electricity price (SEK/kWh)*
20 500 4 500 5 000
30 000 4 650 0.62
23 250 0.775
* Val id for a 2-year contract wi th a 25A main fuse including V A T . (Boden Energi, 2004)
Table 4. Conditions for the plant
50 households 90 households
Required boiler thermal output (kW) Annual heat generation (MWh/a)
Overall efficiency (%) Annual fuel input (MWh/a) Fuel price (SKr/MWh)*
600 1250
80 1563 128
1080 2250
80 2813 128
Current wood-chips price according to Swedish National Energy Administration
(2003c)
Table 5. Investments, costs etc
50 households 90 households
Central heating plant (complete) (SEK) 1 750 000 2 000 000 Heat store (SEK) 57 750 103 950 Culvert (SEK) 3 028 950 3 970 950 T O T A L INVESTMENT (SEK) 4 836 700 6 074 900 Interest rate 5% 5% Depreciation time 20 years 20 years Annual capital cost (-fees ) (SEK) 288 109 307 466 Fuel cost (SEK) 200 000 360 000 Maintenance, operation, electricity etc 182 500 182 500 (SEK)** Profit margin 5% 5%
SPECIFIC ENERGY PRICE (SEK/MWh) 563.3 396.7
See table 6 Personnel included
The total economy of the plant is strongly dependent on the number o f customers that connect to the district heating network. Therefore, calculations have been made for 50
as wel l as 90 connected households. It has been chosen to use wood-chips as fuel , due to the nearness to the wood-chips deliverer. There are also future plans to invest in an own wood-chipper. Table 4 shows the conditions for the planned heating central.
9
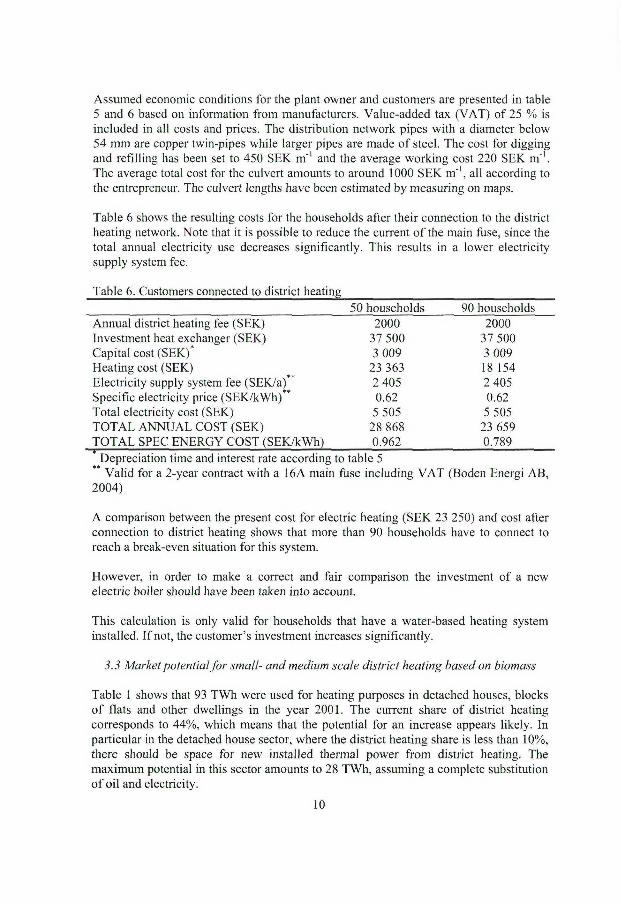
Assumed economic conditions for the plant owner and customers are presented in table 5 and 6 based on information f rom manufacturers. Value-added tax ( V A T ) o f 25 % is included in all costs and prices. The distribution network pipes wi th a diameter below 54 mm are copper twin-pipes while larger pipes are made o f steel. The cost for digging
and refil l ing has been set to 450 SEK m"1 and the average working cost 220 SEK m" 1. The average total cost for the culvert amounts to around 1000 SEK m ' 1 , all according to the entrepreneur. The culvert lengths have been estimated by measuring on maps.
Table 6 shows the resulting costs for the households after their connection to the district
heating network. Note that it is possible to reduce the current o f the main fuse, since the total annual electricity use decreases significantly. This results in a lower electricity supply system fee.
Table 6. Customers connected to district heating
50 households 90 households
Annual district heating fee (SEK) 2000 2000 Investment heat exchanger (SEK) 37 500 37 500 Capital cost (SEK)* 3 009 3 009 Heating cost (SEK) 23 363 18 154 Electricity supply system fee (SEK/a) 2 405 2 405 Specific electricity price (SEK/kWh) 0.62 0.62 Total electricity cost (SEK) 5 505 5 505 T O T A L A N N U A L COST (SEK) 28 868 23 659 T O T A L SPEC ENERGY COST (SEK/kWh) 0.962 0.789
* Depreciation time and interest rate according to table 5
Val id for a 2-year contract with a 16A main fuse including V A T (Boden Energi A B , 2004)
A comparison between the present cost for electric heating (SEK 23 250) and cost after connection to district heating shows that more than 90 households have to connect to reach a break-even situation for this system.
However, in order to make a correct and fair comparison the investment o f a new electric boiler should have been taken into account.
This calculation is only valid for households that have a water-based heating system
installed. I f not, the customer's investment increases significantly.
3.3 Market potential for small- and medium scale district heating based on biomass
Table 1 shows that 93 TWh were used for heating purposes in detached houses, blocks o f flats and other dwellings in the year 2001. The current share o f district heating corresponds to 44%, which means that the potential for an increase appears likely. In
particular in the detached house sector, where the district heating share is less than 10%,
there should be space for new installed thermal power f rom district heating. The maximum potential in this sector amounts to 28 TWh, assuming a complete substitution o f o i l and electricity.
10

It may be easier to convert apartment buildings than detached houses, due to the fact that most o f the apartment buildings already have a water based heat distribution systems installed. District heating is also the most common heat supplier. However, according to table 1, there should be space for an additional district heating energy o f around 5 T W h i f all o f the oi l and electricity are replaced. In other premises, the electricity and o i l usage for heating purposes amounts to 9 TWh.
The total electricity and oi l use for heating purposes in Sweden totals 42 T W h and
constitutes the maximum possible potential for a district heating expansion. Calculating with an average annual operation time of 4000 hours, the space for new installed thermal power in small biomass fired district heating networks would amount to around
10 GW. This figure is also mentioned in other Swedish statistics and off ic ia l reports.
3.4 Environmental and socioeconomic benefits
The increased usage o f biomass for energy conversion has shown several advantages regarding employments, and thereby the local economy, as well as the environment
It is known that combustion o f biomass does not generate net emissions o f CO2 presupposed that the growth is equal to or higher than the fell ing and provided that the
long-term productivity o f the woodlands remains. As presented earlier, these conditions are fu l f i l l ed in Sweden.
Combustion o f oi l generates 0.27 ton o f CO? MWh"' . (Möllersten et.al, 2003). Assuming that all heating oi l used for heating purposes (20 TWh) is replaced by biomass, means that the emissions o f CO? would reduce by 5.4 mil l ion tonnes per year. This corresponds to 9.8 % o f the Swedish total net emissions o f CO2 in the year 2001, which amounted to 55.3 mi l l ion tonnes. (Swedish Environmental Protection Agency,
2003)
Concerning replacement o f electric heating wi th biomass, the environmental effects are more di f f icul t to estimate. In year 2001, 94% o f the Swedish total electricity generation originated f rom hydropower (78.5 TWh) and nuclear power (69.2 TWh). Combustion based electricity generation accounted for around 5%, where 35% was based on coal,
35% o f biomass and 26% o f oi l . (Swedish National Energy Administration, 2002). I f the same shares are applied on the 22 TWh of electricity used for heat generation
according to table 1, i t means that 0.286 TWh originated f rom of oil and 0.385 T W h from coal. According to Wahlund et al (2002), combustion o f coal generates 90.7 kg
C 0 2 per GJfuei (0.326 ton C 0 2 MWh" 1 ) . I f all the electricity for heating purposes is replaced, i t reduces the emissions o f CO? by roughly 203 000 tonnes. This is however a minor contribution compared to the replacement o f heating oi l .
Oi l , coal and wood-fuels contain various concentrations o f fuel bound nitrogen, mainly
emitted as N O x and N 2 during combustion. Emissions o f N O x are strongly dependent on
the combustion equipment and the combustion process and not only the fuel type. For example, larger boilers may use N O x reducing techniques such as Selective Catalytic Reduction (SCR), which seldom is viable in smaller boilers due to economic reasons.
11

Typical emissions f rom smaller biomass plants may be relatively high, in excess o f 120 mg NO2 M P 1 based on fuel input. The best boilers in the thermal output order o f 100 M W are generally below 20 mg MJ" 1 , but then by using SCR. (Zethraeus, 1999).
At present, no off ic ia l regulations concerning emissions o f CO, N O x and particles exist
in Sweden, but there are recommended limits. Table 7 shows the recommendations applying to clean wood burning appliances according to Van Loo et.al (2002).
Table 7. Emission recommendations for wood burning appliances. [Van Loo et.al].
Thermal output [ M W ] CO [mg/MJ] N O x [mg/MJ] Particles [mg/Nm']
<0.5 0.5-10
>10
500 mg/Nm J
90 (day-mean) 180 (hour-mean)
90 (day-mean) 180 (hour-mean)
100
100
350
100 (urban areas) 350 (rural areas)
35*
In dry flue gas, 11 v o l % O?
Another important issue is the economy. Import o f oi l and other fossil fuels for
electricity and heat generation is expensive and a direct loss for the local economy. On the contrary, renewable energy resources are often developed in the vicinity o f the production unit, which means that the money spent on energy generation stays locally.
Many job opportunities can therefore evolve f rom manufacture, design, installation and maintenance o f renewable energy products. Furthermore, jobs are also indirectly created
from businesses supplying renewable energy companies wi th , for example raw material, transports and equipment. Biomass fuels can create up to 20 times more employment than for example coal and oi l . (Van Loo et al, 2002). It has been estimated that an
extended use o f 1 T W h of biomass fuels can generate between two- and four hundred new man-year jobs. Therefore, up to 16 000 new jobs could be created in the next few decades. Only the combustion equipment manufacturing business w i l l provide jobs for
approximately 8 000 persons according to the Swedish Bioenergy Association (2003). The wages and salaries generated from these jobs provide an additional income to the local economy.
Moreover, the benefits with renewable energy sources are not only environmental and economic, but also out o f the security point o f view. Especially for those countries that
are strongly dependent o f foreign oi l imports. This energy source is vulnerable to, for example, political instabilities and trading disputes. I f the country's dependence o f foreign o i l imports could be reduced, it would strengthen the national energy security.
Another very important benefit is that renewable energy sources w i l l never run out. Many other sources o f energy are limited and w i l l some day be depleted.
Additionally, as mentioned earlier, conversion f rom electric heating to district heating facilitates the planned nuclear power phase out.
12

4. DISCUSSION
The largest bottleneck for a further utilisation o f small- and medium scale biomass district heating systems is mainly economy, but also, in some meaning, combustion and
environment related. For example, it has been, and still is for that matter, diff icul t to compete with electric heating since the price for electricity has been very low. Figure 5 shows the total specific electricity price at present offered by different electricity
deliverers in the north o f Sweden as well as the development o f the average total electricity price in the country during the recent years. (Statistics Sweden, 2004),
(Boden Energi A B , 2004), (Luleå Energi A B , 2004), (Piteå Energi A B , 2004).
2 LU CO
1.2 H
1.0 H
Q- 0.8 H
0.6-
0.4
Average price in S w e d e n _ X
• ' / Pi teå- i
North part of Sweden
1998 2000 2002 2004
Year
Figure 5. Total average electricity in Sweden as well as total prices f rom different electricity suppliers in the north o f the country.
The prices shown in the figure are valid for a typical household annually using 20 000
kWh (Assuming a house with five rooms and kitchen with a total area o f 120 m 2
demanding a thennal input o f 9 kW).
It is diff icul t to motivate the customers to connect to a district heating system i f the
resulting annual heating cost is higher than the present. This is often the case, in particular in the northern part o f Sweden due to lower taxes on electricity than in other areas in Sweden. See figure 5.
The electricity price trend is however increasing, which improves the conditions for a
further expansion o f biomass based district heating. On the other hand, Swedish households had previously the opportunity to apply for governmental subsidises for
conversion from electric heating to district heating. However, the Swedish parliament
has decided that the subsidy regulation should be abolished in the end o f January year 2003. According to the National Board o f Housing, Building and Planning (2004),
38 849 applications were registered at between July 1997 and February 2003. This measure w i l l most likely not increase the pace o f conversion, unless a similar subsidy
system is introduced.
13

As mentioned earlier large scale biomass district heating is wel l established in Sweden. Therefore, a large part o f the district heating potential should constitute o f smaller or
middle sized plants, in the thermal output range of 100 kW up to a few M W . Though, larger district heating networks have higher competitive strengths in areas wi th large populations, while smaller networks have more difficulties to achieve the profitability
demands. It is therefore o f great importance to have reasonable investments and
operation costs to be able to compete with other alternatives.
Another issue concerning small biofuel plants is the combustion properties o f the fuel , in this case meaning particle size and above all, the fuel moisture content. The latter
may vary in the range o f 25-55% for wood-chips and logging residues down to below 10% for saw-mill residues. The particle size w i l l also vary, due to the fibrous structure of the wood that makes it diff icul t to grind it into reasonable isometric particles. Zethraeus (1999) claims, that a smaller plant w i l l experience a more variable fuel
quality than larger plants. The variations o f moisture content o f the fuel fed into the furnace w i l l cause variations o f the adiabatic flame temperature as well as fluctuations of the local oxygen concentration in the furnace. The latter occurs mainly since the water vapour dilutes the combustion air. This means that the conditions for hydrocarbon
burnout w i l l vary, and therefore also emissions o f CO, THC and PAH. Consequently, smaller plants must put a high demand on the quality of the fuel, meaning that f rom the
environmental or combustion technology point o f view, pellets or briquettes should be most suitable. On the other hand, this may in many cases counteract with the economy,
since upgraded fuels are more expensive and efforts have to be put on keeping the operation costs down.
Furthermore, Karlsson et al, have studied the best existing technology for small- and
middle sized biomass fired heating plants in the thermal output range of 0.5 to 10 M W , f rom the emissions viewpoint. Several tests have been performed wi th different fuels, heat loads and types o f furnaces. The results show that the average emissions o f unburnt
products, like CO and THC, are relatively low at higher heat loads, typically below 500 mg Nm" 3 and 8 mg Nm" 3 , respectively. However, the study also showed that the plants produced a large amount o f pollutants in form of products o f incomplete combustion
during low as well as varying thermal output. In smaller district heating networks, this is a common occurrence. For example, during summer, the space heating demand can be considered very low or non-existent while the demand for hot tap water is
approximately the same, independent o f season. Due to this, the boiler must be able to work wi th a varying thermal output in the range 10 to 100% of the nominal output,
since the average heat demand during summer is estimated to be around 10% o f the
maximum demand in winter.
As an attempt to address these problems, Luleå University o f Technology has together
with an industrial company, Swebo Flis och Energi A B , developed a new 500 kW th wood-chips fired boiler designed for small district heating systems. Since the plants
economy is o f great importance, efforts have been put on making the concept as inexpensive as possible. For example, to keep down the operation costs i t has been
chosen to use an unrefined fuel in the form of wood-chips, instead o f an upgraded fuel.
14

The investment may be decreased since the biomass boiler system can handle a broad thermal output span, due to the fact that no supplementary heat source is required.
Extensive experimental tests have shown the plant possess fol lowing characteristics
• The furnace manage to work with a varying thermal output, covering 10% to
100% o f the maximum heat demand of the network fu l f i l l i ng the most rigorous restrictions concerning emissions o f CO, THC and N O x over the entire thermal output range.
• The system can handle fast and large heat load fluctuations wi th maintained low emissions o f harmful substances.
• The furnace enables use o f wood-chips with high moisture content, at least up to 55%.
Figure 6 shows a summary o f results obtained during steady state conditions in the thermal output range 50 to 500 kW. The emission factors are based on the net heating
value o f the fuel.
Thermal ou tpu t ( k W )
Figure 6. Average emissions o f CO, N O x , THC and excess air ratios during steady-state operation [mg/MJ]
As shown in the figure, the emissions o f CO and THC are low in the entire thermal
output range, below 60 mg MJ" 1 and 2 mg MJ" 1 respectively. The emissions o f N O x are
typically in the range 60 mg MJ" 1 to 100 mg MJ" 1 . The emissions are below the Swedish recommended limits presented in table 7.
The design o f the new furnace and results f rom the performed experiments are presented in detail by Lundgren et.al, 2001, 2003, 2004a, and 2004b.
15

5. CONCLUSIONS
It can be concluded that the potential for expansion o f biomass district heating systems in Sweden are large. At present, more than 40 TWh of oil and electricity is used for heating purposes. Since large scale district heating systems are well established in the country, it can be expected that new installations of smaller- and middle scale heating
plants w i l l increase. Such development would be followed by several environmental and large socioeconomic benefits, like a significant reduction o f CO2 emissions and many job opportunities. However, how much of these 40 T W h of oi l and electricity that
can be replaced by biomass based district heating is mainly an economic issue.
It is highly necessary that the cost for biomass based district heating do not exceed the customers present cost for heating. Since many households, in particular in the detached house sector, uses electricity for heating purposes, the electricity price development w i l l
play an important role for the future expansion o f small- and medium scale district heating. However, it is also very important that the investments and operation costs of these plants are reasonable. The latter can be kept down by using an unrefined fuel like wood-chips instead o f an upgraded like pellets. However, the transport distance f rom the fuel deliverer to the plant must also be taken into account. Calculations show that it
is not economic to transport wood-chips longer than 50 to 130 k m depending on the moisture content o f the wood-chips in comparison wi th pellets, based on present fuel prices and the assumptions made in this study.
The furnace developed by Luleå University o f Technology and Swebo Flis och Energi
A B has shown good environmental performance during operations characteristic for smaller district heating systems even when using an unclassified fuel in form of wood-
chips o f various moisture contents. Therefore, this concept can be regarded as suitable for this kind o f application.
A C K N O W L E D G E M E N T S
The authors gratefully acknowledge the economic support provided by the European Commission in the framework o f the Non Nuclear Energy Programme JOULE I I I and
the Swedish National Energy Administration. Furthermore, the authors would like to express thanks to our colleagues at the Division o f Energy Engineering, Luleå University o f Technology as well as M r Mikael Jansson, Swebo Flis och Energi A B for a smooth cooperation.
REFERENCES
Boden Energi A B . 2004. Price information. URL:http://www.bodensenergi.se/index.asp (accessed 2004-03-04)
European Commission. 1997. A n energy policy for the European Union. C O M (95) 682. White Paper of the European Community, Brussels.
Hoffer t M I , Caldeira K , Jain A K , Haites EF, Harvey L D D , Potter SD, Schlesinger M E ,
Schneider SH, Watts RG, Wigley T M L , Wuebbles DJ. 1998. Energy Implications of Future Stabilisation o f Atmospheric C 0 2 content. Nature. 395: 881-884.
16

Houghton J. T, Ding Y , Griggs D.J, Noguer M , van der Linden P. J, Xiaosu D. 2001. Climate change 2001: The Scientific Basis. Cambridge University Press, U K , pp
944. Johansson J, Lundqvist U . 1999. Estimating Swedish biomass energy supply. Biomass
and Bioenergy 17, pp. 85-93 Karlsson M - L , Gustafsson L , Mårtensson D, Leckner B. 1997. Analysis o f today's best
available technology for biomass fired heating plants in the range o f 0.5 to 10 M W . Technical report. Swedish National Board for Industrial and Technical
Development ( N U T E K ) . Karlsson T. 2000. Databok för driftsplanering 2000. (Databook for operation planning)
Swedish University o f Agricultural Sciences, Uppsala Lundgren J, Hermansson R, Dahl J. 2001. A new bio fuel based boiler concept for small
district heating systems, Proceedings of the Joint International Combustion
Symposium, Kauai, Hawaii, USA, 9-12 Sept. Lundgren J, Hermansson R, Dahl J. 2004a. Experimental studies of a biomass boiler
suitable for small district heating systems. Biomass and Bioenergy, 26 (5): 443-
453 Lundgren J, Hermansson R, Dahl J. 2004b. Experimental studies during heat load
fluctuations in a 500 k W wood-chips fired boiler. Biomass and Bioenergy, 26 (3): 255-267
Lundgren J, Hermansson R, Lundqvist M . 2003. Design of a secondary combustion chamber for a 350 k W wood-chips fired furnace. Proceedings of the 4,h
International Conference on Fluid and Thermal Energy Conversions (FTEC), Bali , Indonesia, 7-11 Dec.
Luleå Energi A B . 2004. Price information. URL:http://www.luleaenergi.se (accessed
2004-03-04) Lönner G, Danielsson B-O, Vikinge B, Parikka M , Hektor B, Nilsson P-O. 1998.
Availabili ty and cost o f wood fuel in 10 years time. (Kostnader och tillgänglighet för trädbränslen på medel lång sikt). Report 51. Department o f Forest-Industry-Market Studies (SIMS), Swedish University o f Agricultural Sciences, Uppsala
Möllersten K , Yan J, Westermark M . 2003. Potential and cost-effectiveness o f C02 reductions through energy measures in Swedish pulp and paper mills. Energy. 28: 691-710
Obernberger I . 1998. Decentralized Biomass Combustion: State of the Art and Future Development. Biomass and Bioenergy. 14(1): 33-56.
Piteå Energi A B . 2004. Price information. URL:http://www.piteenergi.se (accessed
2004-03-04) Silveira S (Ed.). 2001. Building Sustainable Energy Systems - Swedish Experiences.
The Swedish Building Centre and Swedish National Energy Administration. Statistics Sweden (SCB). 2004. Prices on electricity (incl grid charges) for household
consumers.URL:http://wvvw.scb.se/templates/tableOrChart 53603.asp
(accessed 2004-03-04) Swedish Bioenergy Association. 2003. Bioenergy - A review. Fact sheet. Focus
Bioenergy No 1. Swedish Bioenergy Association. Year o f publication not available. Uppvärmning av
byggnader och flerfamiljshus med trädbränslen. (Heating o f buildings and apartment blocks using wood fuels) (in Swedish).
17

Swedish Environmental Protection Agency. 2003. Sweden's National Inventory Report 2003 - submitted under the United Nations Convention on Climate Change.
Swedish National Energy Administration. 2002. Energy in Sweden 2001. Eskilstuna, Sweden.
Swedish National Energy Administration. 2003a. Värme i Sverige 2002. (Heat in Sweden 2002). Eskilstuna, Sweden.
Swedish National Energy Administration. 2003b. Energy in Sweden 2002. Eskilstuna,
Sweden. Swedish National Energy Administration. 2003c. Price sheet for biomass, peat etc No.
4/2003 The National Board o f Forestry. 2003. Statistical Yearbook o f Forestry 2003.
Jönköping, Sweden. The National Board o f Housing, Building and Planning. 2004. Bidrag för konvertering
från elvärme. (Subsidies for conversion from electric heating). (In Swedish). U R L :
http://wvvw.boverket.se/. (accessed 2004-02-24) Van Loo S. and Koppejan J. (eds.). 2002. Handbook of Biomass Combustion and Co
Firing. Prepared by Task 32 o f the Implementing Agreement on Bioenergy under
the auspices o f the International Energy Agency. Twente University Press. Enschede, the Netherlands
Wahlund B, Yan J, Westermark M . 2002. A total energy system o f fuel upgrading by
drying biomass feedstock for cogeneration: a case study o f Skellefteå bioenergy
combine. Biomass and Bioenergy 23: 271-281. Zethraeus B. 1999. Problems in biofuel utilisation- A Swedish perspective. The IFRF
Industrial Combustion Magazine, March 1999.
18


P R A C T I C A L , E N V I R O N M E N T A L AND E C O N O M I C E V A L U A T I O N OF D I F F E R E N T OPTIONS F O R HORSE MANURE M A N A G E M E N T
J.Lundgren1'*, E.Pettersson2
'Division o f Energy Engineering, Luleå University o f Technology S-971 87, Luleå, Sweden
Telephone: +46 920 491 000, Telefax: +46 920 491 047 E-mail: Joakim.Lundgren(a),ltu.se
"Energy Technology Centre (ETC), Box 726, S-941 28, Piteå, Sweden
Telephone: +46 911 232386 Telefax: +46 911 232386 E-mail: [email protected]
Abstract
In Sweden there are nearly 300 000 horses, generating around 6 mi l l ion m 3 o f waste annually.
Today, this residue is usually spread on arable land or deposited at landfills. There are however other alternatives such as combustion for heat generation and biogas production for heat and electricity generation. These options are today applied to a limited extent. The main objectives o f this study have been to identify practical, economic and environmental benefits
of and problems wi th the above-mentioned alternatives, thereby aiming to find the most suitable horse manure management option for stables in Sweden. The study shows that using the residue for heat generation leads to the largest economic and practical benefits. The
combustion alternative possesses a very unique feature in that the more energy in the form o f heat that is used, the more money is saved. This alternative can also be considered the most
suitable for many Swedish stables.
Introduction
The residue f rom horses contains both solid and liquid portions o f waste, typically about 60% solids and 40% urine. (Wheeler et.al, 2002). Bedding materials are used on the floor o f the
horseboxes and are exchanged regularly in order to keep a hygienic environment for both people working in the stables and for the horses. The waste consists therefore o f a mixture o f
manure, urine and bedding material. From a small inquiry made in northern Sweden it was found that the used amount o f bedding material varied f rom 9 to 29 m 3 per horse and year.
The large variations are due to the fact that the stables and riding schools often pay for the bedding material. Therefore the share o f bedding material in the mixture depends strongly on how careful the keepers are when they clean the horseboxes. (Pettersson et.al, 2002). Wheeler
et.al (2002) claim that approximately 20 m 3 o f material is used per horse and year, which is
close to the average value o f the inquiry.
There are several different types o f bedding materials used today, where the most common are
wood shavings, sawdust, straw, peat, or paper pieces. The choice is strongly dependent on the geographical location o f the stable. For example, in the northern part o f Sweden, wood-
shavings are commonly used due to rich assets o f wood residues, while in the southern part
straw is dominant for similar reasons. The use o f newsprint is however decreasing, due to the suspicion that the printers' ink may be poisonous for the horses (Steineck et.al, 2000).
Cardboard torn to pieces is however suitable and is often used in for example Norway
(Jansson, 2004).
* Corresponding author

In Sweden, there are around 500 riding schools and approximately 300 000 horses (Swedish
Statistics, 2000), meaning that around 6 mill ion m 3 of waste is generated annually. Today, this residue is usually deposited at landfills or composted before it is spread on arable land.
Objectives
The main objective o f this study has been to identify practical, economic and environmental
advantages o f and problems with the different horse manure management practices, for the purpose of finding the most suitable horse manure management option for most o f the stables in Sweden.
Common handling procedures for horse manure in Sweden at present
Figure 1 shows the presently most common management practices for handling horse manure
residues in Sweden according to Hammar (2001).
TRANSPORT
SPREAD ON ARABlE LAND I COMPOST/OTHER USAGE I DEPOSITION AT LANDFILLS
Figure 1. Most commonly used handling practices for horse manure (Hammar, 2001)
After cleaning the horseboxes, the waste is temporarily stored either on a concrete board or in
a container on site, where the former method is the most common. The manure is stored up to about 10 months. Thereafter, it is transported to some kind o f intermediate storage preferably
close to arable land for a further digestion process for one year before the material may be
spread.
The manure could also be loaded in containers directly after the cleaning o f the horse boxes. A lorry collects the container when it is f i l led and transports it to a waste disposal plant or to
an intermediate storage location, usually in the form o f a pile on arable land for one year for
composting before spreading.
2

Composting the horse manure may involve many benefits. The volume of the waste decreases while the concentration o f nutrients increases. Raw manure contains high concentrations o f nitrogen (N), phosphorus (P) and potassium (K) . Auvermann et.al (1999) have made N-P-K analyses o f finished composts, which showed average values o f 0.74 % of elemental nitrogen, 0.24 % of elemental phosphorus and 1.65 % o f elemental potassium. These values may be compared with a commercial fertiliser having an analysis o f 0.75-0.6-2.0.
Different bedding materials are considered more or less suitable for spreading on arable land after composting. Table 1 shows briefly how the choice o f bedding material influences the fertilisation characteristics.
Table 1. Fertilisation characteristics wi th different bedding materials (Steineck et al, 2000)
Material Characteristics
Peat Yields a compact fertiliser, which may easily
be spread on arable lands. Straw Yields an uneven structure, which may
complicate the spreading Wood shavings Yield similar characteristics as peat Paper pieces Yield similar characteristics as straw
Composts o f horse manure mixed with straw are anyway considered to be suitable for spreading on arable land, even i f many farmers may disagree. The reason is that longer straws may complicate the spreading (Hammar, 2001). Many do not recommend spreading
composted manure mixed with wood-shavings recommended, because o f a rumour saying that lignin and terpene contents tend to restrain the growth. According to Steineck et.al (2000) there are however no valid theories that confirm this rumour.
I f the manure is transported to a waste disposal plant, it w i l l either be deposited at landfills or the plant may make use o f it, for example, use the waste for cleaning o f oi l polluted soil.
As f rom the year 2000, the Swedish government introduced a deposition tax per ton waste as an attempt to reduce the ever-increasing quantities o f waste in landfills, as wel l as increase incentives for a more environment-friendly management o f waste materials (Swedish
Government Official Reports, 2002). Many riding schools and trotting courses around the country suffer economic problems and are often dependent on municipal subsidies. In addition, the stables often have to pay a fee to the waste disposal plants for leaving the waste. However, i f the plant can make use o f the waste in some way, the deposition fee may be
reduced. In 2000, the tax amounted to SEK 250 per ton waste. From January 1 2003, it was increased to SEK 370 per ton. (Swedish National Energy Administration, 2003).
More importantly, as from the year 2005, there w i l l be a prohibition o f depositing organic material (Swedish Codes of Statutes, 2001), meaning that direct disposal at landfills may not
be considered a viable solution.
Alternative options for manure handling
The waste could however be used for other purposes. It may for example be used as fuel for heat generation or biogas production for heat and electricity generation. These options are
today applied to a lesser extent.
3

Direct combustion for heat generation
At present, electric- o i l - or district heating is the most commonly used system for space
heating and hot tap water preparation in Swedish stables. One o f the larger costs for the stable- and trotting course owners is the cost for heating the facilities. Therefore, i f the waste could be used for heat generation, the stable owners would on the one hand decrease the cost
for heating and on the other reduce the volume of waste. The demand is o f course that the combustion process should be performed in an optimally environment-friendly way.
Combustion o f horse manure is nothing new. Schuster et al (1997) have written a report
concerning combustion o f animal manure, where the authors conclude that the f i r ing techniques employed have in many cases been old and poor and that the fuel has been too wet. For this reason, problems such as high emissions and ash sintering have been frequently
reported. The authors also claim that the primary driving force has been to get r id o f the waste and not to develop a well-functioning combustion technique for this kind o f fuel . The stable
owners' current driving force is o f course still to minimise their volume of waste, but in a way that is as environment-friendly, economical and practical as possible. Therefore, the interest in and demand for developing a furnace that could handle this kind of waste has increased
dramatically in recent years, in particular due to the future regulations and the present heating
costs.
Production of biogas for electricity and heat generation
The production of biogas wi th A D (anaerobic digestion) technique for electricity and heat
generation is another interesting alternative.
When comparing biogas wi th other alternatives, many factors have to be considered. E.g. one
factor is whether the plant should be running solely on horse manure or i f other raw materials should be considered as wel l . The size and therefore the investment vary wi th different raw
materials and kinetics. E.g. fat produces twice the amount o f energy in the gas per kg o f substrate compared to carbohydrates. Residual fat products, such as offal , have in many cases
a negative value, which may give a suitably situated biogas plant substantial revenue f rom processing fat. The A D processes normally run at fairly low solid content (5 % ) , meaning that the residue may not be transported very far without processing to increase the solid content o f the residue. This may become expensive, especially for smaller plants. The higher value waste
quite often requires special plants due to certain requirements. E.g. offal f rom healthy animals requires hygienisation at 70° C for one hour.
Results of the economic calculations for different management options
Traditional management practices
From the economic point o f view, composting o f horse manure may be beneficial. The stable may have the opportunity to use the material as fertiliser on their arable land and thereby reduce purchases o f artificial fertilisers. Moreover, the composted material may, in some
cases, generate an extra income f r o m selling the product to farmers. However, large quantities of horse manure may not find a farmer wi l l ing to receive the material even free o f charge.
There are however costs for composting the manure. Hammar (2001) has made an economic analysis o f different management options. In the analysis, investments o f compost mixer,
4

concrete board, wagons, costs for transports etc have been taken into account. Additionally, reduced purchases o f artificial fertilisers are considered. The resulting costs are shown in table 2.
Table 2. Specific costs for different handling options valid for stables with 10 horses or more (Hammar, 2001).
Storage on site Concrete board Container
Transported to Waste disposal Intermediate Waste disposal Intermediate plant storage/
Composting plant storage/
Composting Spread on arable land - 98 - 70 (SEK/ton) Deposition at
landfills (SEK/ton) 1
757 - 753 -
Other usage at waste 253 - 223 -
disposal plant (SEK/ton)
The cost for deposition at landfills presented in the table includes a deposition tax o f SEK
250 per ton. As mentioned earlier, this tax is now increased to SEK 370 per ton waste.
Not unexpectedly, deposition at landfills is the most expensive alternative followed by the alternative when the disposal plant in some way makes use o f the residue. However, it should be noted that the total specific cost for any o f the alternatives strongly depends on the total transporting distance. In these calculations, the waste is transported 5 k m to deposit or the final user.
According to Karlsson (2000), the cost for lorry transports amounts to 789 SEK h"1. This
means that a 10 km transport costs roughly 400 SEK, assuming that it takes 30 minutes for a roundtrip. It may further be assumed that one transport manages around 20 tonnes o f waste, resulting in a specific cost o f nearly 2 SEK km" 1 ton"1.
The combustion alternative
A riding school in Timrå, north o f the town o f Sundsvall in Sweden, has invested in a 240
kWth heating plant for the purpose o f using the waste as fuel. Previously, the waste was transported to a soil producer free o f charge, but this was for some unknown reason in decline. The alternatives considered by the stable owner were to invest in a heating plant or
deposit the waste in landfills. The plant was taken into operation in September 2003 and has since then been running more or less continuously. In order to calculate a specific cost per ton horse manure for the combustion alternative, this plant has been used as an example. Table 3 shows the present conditions at the riding school.
Table 3. Present conditions at the riding school in Timrå (Andersson, 2004).
Heated area 6 500 n T
Number o f horses 50
Yearly volume o f waste 1000 m 3
Wood-shavings are used as bedding material in the horse boxes in Timrå. For the economic calculations, the average net heating value o f the fuel mixture is assumed to be 800 k W h m" 3
5

and the density o f the fuel around 450 kg m" 3 (w.b). Table 4 shows the most important data needed for the economic calculations and the resulting annual heating cost.
Table 4. Economic calculations for the heating central in Timrå
Total energy available in waste (kWh) 800 000
Heat demand (kWh) 1 400 000 Boiler efficiency (%) 80 Required fuel supply (kWh) 500 000 Surplus available energy (kWh) 300 000 Corresponding manure surplus (ton) 169
Investment buildings, culvert, installation etc (SEK)" 1 584 000 Concrete board 600 m 2 (SEK) 3 180 000 Combustion equipment (SEK) 2 1 234 000
Annual interest rate (%) 5
Depreciation time (years) 20
Capital cost (SEK) 240 727 Fuel cost (SEK) 4
Maintenance and operation cost (SEK) 30 000
Ash transport (100 km, 2 SEK ton W ) 6300
Total annual cost ( S E K ) 277 027 • t
Zätterqvist (2004). Jansson (2004). Hammar (2001), the cost for a concrete board is around SEK 300 per m". 4 The cost for the bedding material is excluded since it is needed nevertheless
This results in a specific cost o f SEK 615 per ton waste for the stable in Timrå. Additionally, there is still, as shown in the table, a surplus o f around 169 tonnes (375 m 3 ) of manure that has to be taken care of. Depending on whether this surplus is composted or transported to
waste disposal stations for other usage, between SEK 98 and 253 per ton should be added according to table 2. This results in a total specific cost o f between SEK 652 to 710 per ton
waste for this alternative, which may be considered as a relatively high cost compared to the costs for composting presented in table 2. On the other hand, the heat demand is fu l ly covered
for free.
Biogas production
In Sweden a number of A D (anaerobic digestion) plants have been built. Most of them are at
least partly using offal or municipal sewage sludge as feedstock. The investment has in many cases been large and only justified because the alternative costs have been substantial. In Germany, several small AD-plants have been built using building techniques with fairly low
investments. Nilsson (2000) has made a pre-study o f a small farm based plant for Plönninge
agricultural upper secondary school.
The cost analysis is based on the economic calculations carried out by Nilsson (2000) and applied to the conditions o f the Timrå plant. Table 5 shows the most important data.
6

Table 5. Economic calculations for the biogas plant in Timrå.
Investment o f buildings, culvert, installation etc (SEK) 1 1 584 000
Anaerobic digestion equipment (SEK) - 1 900 000
Annual interest rate (%) 5 Depreciation time (years) 20
Capital cost (SEK) 281 900 Maintenance and operation cost (SEK) 53 000
Transport o f AD-rest (10 km) 90 000
Total annual cost ( S E K ) 332 565 1 Jansson (2004) . 2 Nilsson (2000).
The annual cost adds up to nearly SEK 332 600, corresponding to a specific cost o f SEK 740 per ton waste. But by using Nilsson's measured methane production f rom straw mixed with horse manure, an anaerobic digestion o f the total amount o f manure in Timrå would only
cover 60% o f the total heat demand or in absolute figures, 233 300 kWh. However, this is an overestimation o f the production potential f rom wood shavings based horse manure, since lignin-containing compounds w i l l only be degraded to a limited degree. (Angelidaki, et.al
2000). Therefore, a supplementary heating source must generate at least 166 700 kWh
annually to match the demand.
Economic comparison between the alternatives
In order to make a fair comparison between the different alternatives, the choice o f
management and the heat supplier must be included. As mentioned earlier, electric- o i l - or district heating is the most commonly used system for space heating and hot tap water preparation in Swedish stables. Economic calculations for o i l - and electric heating systems
using the conditions o f the riding school in Timrå have been performed. A comparison wi th district heating is not included in this study. Table 6 shows the assumed conditions and the resulting annual heating cost when the heat demand o f the riding school has to be fu l l y
covered by using electricity or oi l .
Table 6. Total annual heating cost by using oil and electricity.
Oil Electricity
Boiler thermal output (kW) 200 Boiler thermal output (kW) 200 Boiler efficiency (%) ' 90 Investment o f electric boiler 4 60 000 Required fuel supply (kWh) 444 000 Investments in buildings, 1 584 000
culvert, installations 2
Investments in buildings, culvert etc2 1 584 000 Annual interest rate (%) 5
Combustion equipment1 120 000 Depreciation time (years) 20
Annual interest rate (%) 5 Capital cost (SEK) 132 000
Depreciation time (years) 20 Total specific electricity 0.75 price (SEK/kWh) 5
Capital cost (SEK) 136 730 Total electricity cost (SEK) 300 000
Specific fuel price (SEK/MWh) 3 726
Fuel cost (SEK) 323 000 Maintenance and operation cost (SEK) 1 12 000
Total annual heating cost ( S E K ) 471 400 Total annual heating cost 432 000 ( S E K )
Swedish Bioenergy Association (SVEBIO), Jansson (2004), Swedish Petroleum Institute
(SPI) (2004), 4 Värmebaronen (2003) , 5 Zätterqvist (2004)
7

For the biogas alternative, it has been chosen to use an electric boiler as a supplementary heat source. Calculating wi th an investment o f SEK 30 000 and a depreciation time, annual interest
and total specific electricity price according to table 6, the annual additional heating cost amounts to SEK 217 335.
The total annual management and heating cost for different alternatives are shown in figure 2.
700000 i , — ; — ,
600000
Heating sys tem
O Board/Other usages a Board/Arable land • Container/Other usages • Container/Arable land B Biogas
Figure 2. Total annual cost for heating of facilities and waste management with different alternatives for the riding school in Timrå.
As shown in the figure, the economically most attractive alternative is the use o f waste as fuel
for heat generation. The annual cost for heating and either composting the manure surplus or transporting it to a waste station for other uses amounts to about SEK 300 000 based on the
assumptions made for the stable in Timrå. The most expensive alternative is to install an oi l boiler and temporarily store the manure on a concrete board, before it is transported to a disposal waste station for other uses. The biogas alternative is more expensive than the
combustion alternative, because it produces less net energy wi th an investment o f the same order as the combustion alternative.
It is o f no interest to calculate the annual cost for the combustion alternative and storage o f the surplus in containers, due to the fact that a concrete board is already on site.
It should however be noted that the cost for handling o f the manure surplus for the combustion alternative is exaggerated, since the cost for a concrete board is included in the heating- as well as the management cost calculations.
Additionally, the calculations should however be considered strictly as an example and are
only valid for the conditions at the riding school in Timrå.
8
Environmental effects
Traditional management practices of the residue and oil based- or electric heating system
Mainly ammonia (NH3) and carbon dioxide are released during storage as well as during the composting process. The ammonia is deposited in the soil forming ammonium ( N H 4
+ ) , before or after the deposit, and may in some circumstances contribute to acidification (Swedish
Environmental Protection Agency, 2004). The deposition rate o f NH3 is considerably higher than for example N O x , which means that NH3 is to a higher extent deposited in the vicinity o f the storage facility (Swedish Environmental Protection Agency, 2002). Emission o f NH3 is a
relatively large problem in Sweden. The amount o f emitted ammonia totalled 53 800 tonnes in 2001, of which 72 % originates f rom different kinds o f manure. (Statistics Sweden, 2001)
According to the Swedish Board o f Agriculture (1995), up to 10-50 % o f the nitrogen in the
manure may be emitted as ammonia during one year o f storage. However, in a study carried out by Karlsson et.al (2003), the ammonia emissions f rom horse manure only amounted to 6-8 % of the total nitrogen content in the waste.
The choice o f bedding material affects the escape o f ammonia. Table 7 explains the
differences briefly.
Table 7. Escapes o f ammonia with different bedding materials (Steineck et al, 2000).
Material Escapes o f ammonia.
Peat Results in relatively small escapes o f ammonia Straw Larger emissions o f ammonia
Wood shavings Moderate emissions o f ammonia
Paper pieces Larger emissions o f ammonia
As shown in the table, the peat compost results in small emissions o f ammonia. The reason is
that peat has a larger ability to absorb ammonium and thereby reduce the escapes (Hammar, 2001). It should be mentioned that compared to composting and storage o f cattle manure, the ammonia losses f rom horse manure are small (Steineck et.al, 2001).
Other gases emitted during storage/composting o f manure are carbon dioxide, methane and nitrous oxide. In a study carried out by Hao et.al (2004), it was found that the emissions o f green house gases (CO2-C equivalent) are about the same for straw and wood chip-bedded
manure. For straw based manure the carbon loss was about 50 % giving larger emissions o f green house gases (CO?-C equivalent) than the initial amount o f carbon. This shows that
substantial reductions o f green house gases w i l l be achieved by manure combustion.
The environmental impact also depends on what kind o f heating system a stable uses. For
example, combustion o f oi l generates 0.27 ton o f CO? MWh" ' (Möllersten et.al, 2003). The horse manure is a biofuel, which means that the combustion process does not contribute to
any net emissions o f CO2.
It is however more diff icul t to estimate the environmental impact caused by using electric heating. A n important aspect is however that since the Swedish parliament aims to phase out
the country's largest electricity producer, nuclear power, it is o f great importance to put
9

efforts into reducing the use o f electric heating. Electricity is also a high quality energy product, which should be used for other purposes than heating up facilities.
Combustion of oil , coal and biofuels results in variously large emissions o f N O x . These are dependent not only on the fuel type, but also strongly on the combustion equipment and the combustion process. N O x emissions f rom biomass combustion originate mainly f rom the fuel
bound nitrogen (fuel- NO x ) , while N O x emissions f rom oil and coal occur when the nitrogen in the combustion air starts to react wi th O radicals (thermal N O x ) . The latter is formed at temperatures above approximately 1300°C, a temperature level that is rarely reached during combustion o f biomass. (Van Loo, 2002).
NH3 as well as N O x emissions contribute to acidification o f soil. N O x forms nitrate (NO3") when it is deposited in the soil and i f the soil is saturated by nitrogen, nitrate is always acidifying (Swedish Environmental Protection Agency, 2004).
Manure combustion alternative
A number of combustion experiments using wood-shavings as well as straw mixed wi th
manure have been performed in a newly developed furnace primarily designed for combustion o f wood-chips with high moisture content. The tests have been carried out mainly in order to study the resulting emissions o f CO and N O x . Table 8 shows the results obtained
during the experiments. Typical emissions using wood-chips o f high moisture content are also presented in the table. The thermal outputs during the experiments were around 150 kW.
Table 8. Typical ranges o f emissions during combustion o f different kinds o f fuel
Manure and wood- Manure and straw 2 Wood-chips' shavings'
CO (mg/Nm 3 ) 50-120 40-135 5-50 N O x (mg/Nm 3 ) 300-350
T T I TT~,—7 365-380 120-150
It should however be mentioned that only two experiments wi th straw have been carried out
until now. To be able to draw any conclusions, i t is necessary to carry out further tests. Other types o f bedding material have not been tested yet.
As shown in the table, it is possible to obtain low emissions o f unburnt carbon, like CO, using any o f the fuels. It is known that low emissions o f CO also mean low emissions o f THC.
The emissions o f N O x are however significantly higher when using a manure mixture in
comparison to combustion o f wood-chips. According to Lundgren et al (2004c), the reason is that the waste has a higher content o f fuel bound nitrogen originating from the urine o f the horses.
A t present, there are no official regulations concerning emissions o f CO, N O x or particles in Sweden for plants with heat power outputs below 500 kW. In Austria, the emissions o f N O x
must be below 350 mg N 0 2 Nm" 3 (at 13 v o l % 0 2 ) for thermal outputs between 0.1-50 M W . In Germany the corresponding l imit is 600 mg Nm" 3 (at 13 v o l % 0 2 ) for thermal outputs below
500 kW. These limits are applied to combustion o f wood waste (Van Loo et al, 2002).
10

The furnace used in the presented experiments and at the riding school in Timrå was primarily designed for wood-chips with a high moisture content as mentioned earlier. The combustion chamber is o f grate fired type and has an integrated fuel drying zone and primary air supplied from above the fuel bed. The design and the obtained experimental results are presented by Lundgren et.al (2001, 2003, 2004a, 2004b). Further experiments are however necessary to evaluate the combustion process when using other bedding materials like peat and paper.
Possible negative long-term effects, such as corrosion and fouling must also be investigated.
Ash related problems and ash disposal
Straw is, f rom the viewpoint o f sintering, a more problematic fuel than wood fuels, due to a lower ash melting temperature. This problem was also experienced during the tests. A
preliminary conclusion was that addition o f chemicals or using small amounts o f peat as bedding material to increase the ash melting temperature l imit may be required. Combustion of manure mixed with wood-shavings did not result in any cumbersome ash sintering
problems.
It has been shown that the ashes from horse manure combustion wi th wood-shavings contain less heavy metal than the level permitted by prevailing regulations (Lundgren et al, 2004c),
which means that it should be possible to use the ash as fertiliser in forestlands. The calcium content o f the ash was however slightly lower than the recommended limits, which may cause some problems in making an easily recycled product. No analysis has yet been performed o f the ashes f rom straw combustion, but analysis of the fuel shows that f r om a heavy metal point of view the ash would f u l f i l the requirements. However, the ash does not origin from wood
products and is therefore not covered by the recommendations.
Biogas
The emissions f rom a well-maintained digester can be neglected, but the emissions f rom the
storage o f the digestion residue can be substantial as regards ammonia. Up to 70 % o f ammonium nitrogen can be emitted as ammonia to the atmosphere by careless handling during storage (Berg 2000). By precaution measures these emissions may be decreased to less
than 2 % during storage o f the digestion residue. The losses during spreading can be in the order o f 10 % but also these can be decreased substantially by proper measures.
The emission f rom the combustion depends on the combustion equipment to a large extent.
Reported values for small-scale gas burners are 20-40 mg N O x MJ" 1 and 50-120 mg CO MJ"' (Swedish Gas Centre, 2000).
Transports
To get a complete picture o f the environmental effects caused by horse manure management, the required transports o f the waste should also be taken into account. The environmental
influence depends strongly on the number o f transports and the total distance, and it is therefore d i f f icu l t to give a general estimation. It has to be calculated f rom case to case.
However, in order to handle residues, transports are required to a varying extent irrespective of which alternative is used. Additionally, i f the stable has an o i l heating system, transports o f oil are required. Evidently, i f the waste can be used on-site as fuel for heat generation, the
11

number o f waste and oi l transports may be minimised and thereby also the environmental
impact f r om heavy traffic.
Table 9 shows typical emissions o f harmful substances f rom lorries.
Table 9. Emissions per litre of diesel f rom lorries (Stenberg, 2004).
Emissions [a 1" ]
N O x 19
c o 2 2700
HC 1.2
CO 2.2
Particulates 0.36
The average fuel consumption amounts to approximately 0.55 1 km" 1 o f diesel for a lorry (Scania 124, motor classification Euro3) with three trailers. In the calculations it is assumed
that one transport manages 50 m 3 o f waste. The oil transports are not included.
Assuming that all the waste generated in Timrå (1000 m 3 annually according to table 3) is
transported either to a storage for composting or to a waste disposal plant, 20 transports per year are required. I f the manure is used as fuel, only the surplus o f around 340 m 3 o f waste has to be transported, corresponding to seven transports per year. Table 10 shows the resulting
reduction o f emissions due to fewer required transports.
Table 10. Reduced emissions due to less transports required.
Emission reduction [kg a"1]
N O x 5
C 0 2 712
HC 0.4
CO 0.6
Particulates 0.1
For this case, the emission reductions due to fewer transports may be considered minor.
However, the "environmental prof i t" increases wi th larger quantities o f waste as well as
longer transporting distances.
Concluding discussion
Direct disposal is not a viable option due to the forthcoming prohibition regarding deposition of organic material. Additionally, the alternative is neither economically nor environmentally
attractive.
Composting may be a good alternative for some stables. The most important advantage is that the volume o f the waste decreases, while the concentration o f nutrients increases which makes
it suitable as fertiliser on arable land. The nearness to the land is however o f crucial importance for the economy, since the transport costs represent a relatively large share o f the
total cost. One problem that makes for example cereal farmers hesitate to accept horse manure is that it may always contain oat weeds. This forces the farmer to weed the fields manually,
because no other weed control is available. (Fredin, 2004).
12

Biogas generation for electricity and/or heat generation is an interesting alternative. The advantages and disadvantages are similar to those o f composting, but involve the opportunity to generate electricity and heat at reasonable costs at the proper location as wel l . The lower dry content o f the AD-waste compared with composting requires still smaller distances to spreading land compared with composting. From an economic point o f view, this alternative seems not to be viable for the Timrå plant, and may even be regarded as impossible for the
reason that there is no agricultural land available close enough for recycling o f the digestion waste. AD-plants operate more or less continuously and have no ability to cope wi th seasonal
variations, and this even more when the process requires a certain temperature to proceed. This means that all biogas applications require that the plant does not provide all o f the heat and therefore require some other source for peak heat loads. From the point o f view of emission, an AD-plant w i l l be the most advantageous, because it w i l l both recycle the nutrients and produce some methane gas which can be used for heating with lower emissions of N O x than direct combustion of the horse manure, which gives in the order o f 225 mg N O x
MJ" 1. The disadvantage is the relatively high annual cost due to the fact that it only can serve
as a supplement to other heating sources.
The most economically attractive alternative is to replace o i l - or electric heating by installation o f a heating plant near the stable facilities and use the horse manure as fuel. This wi l l result in several important benefits such as
• Reduced annual cost for space heating and hot tap water preparation and at the same
time a significant reduction o f the volume o f waste
• Fewer transports o f waste and oil or other fuels required
• Possibility of using the ash as fertiliser on forestlands
Additionally, the concept possesses a unique feature in that the more energy in the form of
heat that is used, the more money is saved. It would even be an interesting idea to install a larger furnace dimensioned for the total annual production o f waste and thereby be able to deliver or sell the surplus heat to other facilities in the vicinity or to an adjacent district
heating network.
The major drawback o f the combustion alternative is that the nitrogen in the manure cannot
be used as fertiliser on agricultural land, because all o f the nitrogen leaves the chimney. In principle the ash could be used as a fertiliser on agricultural land as well as forestlands. The
ash contains substantial amounts o f phosphorus, which ought to be recycled to farmland in many cases in order not to lower the depot o f phosphorus in the ground. It has been shown
that the phosphorus after combustion in the ash exists in chemical structures less accessible to plants than in manure. It has been claimed that this is a drawback o f ashes, but Linderholm (1997) stated that only 0.01 % of the phosphorus in the ground is accessible to the plants, and that it is o f little importance in which chemical form the phosphorus is added to the depot.
More ash analysis is however needed, before it can be stated whether the quota between phosphorus and heavy metals is higher or lower than in the phosphorus products from the
fertiliser industry. I f the quota were found to be acceptable, the ash could be considered for
agricultural land as well .
It is d i f f icu l t to make a general comparison o f combustion o f horse manure with other alternatives f rom the viewpoint o f the environmental influence. It depends for example
strongly on what kind o f heating system the stable uses. I f the manure-based heating system replaces an o i l boiler, more than 108 000 kg o f CO2 w i l l be reduced annually for the case in
13

Timrå. A l l management and heating alternatives contribute more or less to soil acidification.
It is however very diff icul t to give a general estimation o f the differences.
The main conclusion is that combustion o f the residue for heat generation may be an economically and practically attractive alternative for a large portion o f the horse stables in Sweden and other countries wi th similar climate conditions and regulations, provided that the
combustion process is environment-friendly.
Acknowledgements
The authors would like to thank M r Mikael Jansson, Swebo Flis och Energi A B for f ru i t fu l co-operation and discussions during the project. The authors also gratefully acknowledge our
colleagues at the Division o f Energy Engineering, Luleå University o f Technology and
Energy Technology Centre (ETC) in Piteå.
References
Andersson A. 2004. Personal communication. The municipality o f Timrå, Sweden.
Angelidaki I , Ahring B.K, Ahring B .K . 2000. Methods for increasing the biogas potential
f rom the recalcitrant organic matter contained in manure. Water Sei. Tech. 41 (3), 189-94.
Auvermann B.W, McDonald L . A , Devin R, Sweeten J .M. 1999. Composting Horse Manure.
Texas Agricultural Extension Service, B-6084, 6-99. The Texas A & M University System,
USA.
Berg J. 2000. Storage and handling of biogas residues f rom big-scale biogas plants. JTI-report
22, Swedish Institute o f Agricultural and Environmental Engineering, Uppsala, Sweden. (In
Swedish).
Fredin A . 2004. Personal communication. Kagghamra Gård, 147 91 G R Ö D I N G E , Sweden.
Hammar M . 2001. Ekonomiska konsekvenser av olika hanteringssystem för hästgödsel.
[Handling o f horse manure - an economic model]. JTI-report 279, Swedish Institute o f Agricultural and Environmental Engineering, Uppsala, Sweden. (In Swedish).
Hao X . Y . , Chang C , Lamey F.J. 2004. Carbon, nitrogen balances and green house emission
during cattle feedlot manure composting J Environm. Quality 33 (1), 37-44.
Jansson M . 2004. Personal communication. A B Swebo Flis och Energi, Boden, Sweden.
Karlsson S., Torstensson G. 2003. Strängkompostering av hästgödsel, JTI-report 313,
Swedish Institute o f Agricultural and Environmental Engineering, Uppsala, Sweden. (In
Swedish).
Karlsson T. 2000. Databok för driftsplanering 2000. Swedish University o f Agricultural
Sciences, Uppsala, Sweden.
14

Linderholm K . Plant availability o f phosphorus in different kinds o f sewage sludge,
commercial fertilizer and ash, VA-Forsk Report 1997:6, V A V A B , Stockholm, Sweden (In Swedish).
Lundgren J., Hermansson R, Dahl J. 2001. A new bio fuel based boiler concept for small district heating systems. Proceedings o f the Joint International Combustion Symposium, Sept 9-12, Kauai, USA.
Lundgren J., Hermansson R, Dahl J. 2004a. Experimental studies o f biomass boiler suitable for small district heating networks. Biomass and Bioenergy, 26, (5) 443-453.
Lundgren J., Hermansson R, Dahl J. 2004b. Experimental studies during heat load fluctuations in a 500 k W wood-chips fired boiler. Biomass and Bioenergy, 26 (3), 255-267.
Lundgren J., Hermansson R, Lundqvist M . 2003. Design of a secondary combustion chamber for a 350 k W wood-chips fired furnace. Proceedings o f the 4th International Conference on Fluid and Thermal Energy Conversions (FTEC), Dec 7-11, Bali , Indonesia.
Lundgren J., Pettersson E. 2004c. Combustion of horse manure for heat production. Submitted for publication in Bioresource Technology.
Möllersten K, Yan J, Westermark M . 2003. Potential and cost-effectiveness o f C02 reductions through energy measures in Swedish pulp and paper mills. Energy 28, pp. 691-710
Nilsson S. 2000. Farm scale biogas at Plönninge agricultural upper secondary school. JTI-report 21 , Swedish Institute o f Agricultural and Environmental Engineering, Uppsala, Sweden. (In Swedish).
Pettersson E., Lundgren J. 2002. Kretsloppsanpassad förbränning av strömedel/gödsel för häststallar [Combustion o f horse manure], Technical report NIFES 2002-3, Piteå, Sweden. (In
Swedish).
Schuster R., Strömberg B . 1997. Förbränning av gödsel - En orienterande litteraturstudie med kommentarer [Combustion o f manure], Technical report 03-513, Stiftelsen för värmeteknisk forskning, Stockholm, Sweden. (In Swedish).
Statistics Sweden (SCB) and Swedish Environmental Protection Agency, 2001. Utsläpp av
ammoniak t i l l luf t i Sverige 2001 [Emissions o f ammonia to air in Sweden in 2001], Statistical information M l 37 SM 0201, Stockholm, Sweden.
Statistics Sweden (SCB), 2000. Press release Nr 2000-267, Stockholm, Sweden.
Steineck S., Svensson L. , Jakobsson C , Karlsson S., Tersmeden M . 2000. Hästar -gödselhantering [Horses - handling o f manure]. JTI-report 82, Swedish Institute o f Agricultural and Environmental Engineering, Uppsala, Sweden. (In Swedish).
Steineck S., Svensson L. , Tersmeden M . , Åkerhielm H , Karlsson S. 2001. Mil jöanpassad hantering av hästgödsel [Sustainable handling o f horse manure]. JTI-report 280, Swedish Institute o f Agricultural and Environmental Engineering, Uppsala, Sweden. (In Swedish).
15

Stenberg J. 2004. Personal communication, Ragn-Sells A B , Sweden.
Swedish Bioenergy Association (SVEBIO). Year o f publication not available. Uppvärmning
av byggnader och flerfamiljshus med trädbränslen. [Heating of buildings and apartment
blocks using wood fuels]. Stockholm, Sweden. (In Swedish).
Swedish Board o f Agriculture. 1995. Hästar- Gödsel och Mil jö . [Horses- Manure and Environment]. Jordbruksinformation 16-1995, Swedish Board o f Agriculture, Stockholm,
Sweden. (In Swedish).
Swedish Codes o f Statutes (SFS). 2001. Förordning (2001:512) om deponering av avfall
[Statute (2001:512) concerning deposition o f refuse], Swedish Parliament, Stockholm,
Sweden.
Swedish Environmental Protection Agency. 2002. Utsläpp av ammoniak och lustgas f rån förbränningsanläggningar med SNCR/SCR. [Emissions o f ammonia and nitrous oxides f rom
combustion plants using SNCR/SCR], Stockholm, Sweden. (In Swedish).
Swedish Environmental Protection Agency. 2004. Svavel- och kväveuts läpp från svenska samhällssektorer [Emissions o f sulphur and nitrogen f rom sectors o f Swedish society],URL:
http: / /ww w .naturv ard s verket. se, (Accessed 2004-04-13).
Swedish Gas Centre (SGC). 2000. The environmental effect o f energy gases. Report SGC
075, Malmö, Sweden. ( In Swedish).
Swedish Government Of f ic ia l Reports. 2002. SOU 2002:9 Skatt på avfall idag och i framtiden [Tax on refuse at present and in the future], Swedish Parliament, Stockholm, Sweden.
Swedish National Energy Administration. 2003. Energy in Sweden 2003. Statistical report,
Eskilstuna, Sweden.
Swedish Petroleum Institute (SPI). 2004. Genomsnittliga månadspriser 2002-2004 för Eldingsolja 1, vil la. U R L : http://www.spi.se/statistik.asp?stat=82 (accessed 2004-04-21).
Stockholm, Sweden.
Van Loo S. and Koppejan J. (Eds.). 2002. Handbook o f Biomass Combustion and Co Firing. Prepared by Task 32 o f the Implementing Agreement on Bioenergy under the auspices o f the
International Energy Agency. Twente University Press. Enschede, the Netherlands.
Värmebaronen. 2003. Price sheet for electric boilers, o i l burners etc. U R L :
http://www.varmebaronen.se. Kristianstad, Sweden.
Wheeler E., Smith Zajaczkowski J. 2002. Horse Stable Manure Management, College o f
Agricultural Sciences, G-97, Penn State Cooperative Extension, USA.
Zätterqvist L . 2004. Personal communication. The municipality o f Timrå, Sweden
16


C O M B U S T I O N O F H O R S E M A N U R E F O R H E A T P R O D U C T I O N
J.Lundgren''*, E. Pettersson2
'Division o f Energy Engineering, Luleå University o f Technology S-971 87, Luleå,
Sweden 2Energy Technology Centre, Box 726, S-941 28, Piteå, Sweden
Abstract
Several experiments have been performed in a newly developed biomass fired furnace, where a mixture o f horse manure and wood-shavings has been used as fuel. The combustion chamber was primarily designed for combustion of wood-chips with high
moisture content, up to around 55%. The main objective o f the paper was to evaluate the combustion process and present the resulting emissions o f CO and N O x . Another aim was to investigate the possibilities to use the ash as fertiliser by analysing the heavy metal- and nutrient content. The results show that it is possible to use the fuel mixture for heat production, wi th low emissions o f products o f incomplete combustion. However, the
emissions o f N O x are relatively high, due to the high content o f fuel bound nitrogen. Typical emissions of CO and N O x are in the range of 30 mg Nm" 3 to 150 mg Nm" 3 and 280 to 350 mg Nm" 3 at 10% 0 2 , respectively. The analysis o f the ash showed on sufficiently
low concentration o f heavy-metals to allow recycling.
Keywords: Horse manure, combustion, heat production
I N T R O D U C T I O N
The number o f horses in Sweden has increased by five times during the last thirty years. (Svala, 2002). According to Statistics Sweden (2000), there are approximately 300,000
horses and around 500 riding schools in the country today. This makes Sweden the second most horse dense country in Europe wi th 28.1 horses per 1000 inhabitants. (Svala, 2002).
Wood-shavings or sawdust are often used as bedding material in the horseboxes. Other
bedding materials are straw, peat and paper. The material is regularly changed in order to give the horses a hygienic environment and the residue consists o f a mixture o f wood-
shavings, urine and manure. The options for handling this product are recycling to agricultural land either through direct recycling or via biogas production, deposition at
landfills, combustion or other usage.
Corresponding author. Telephone: +46 920 49 13 07, Telefax: +46 920 49 10 47,E-mail: Joakim.Limdzren&.ltu.se

According to a law passed in 2001, landfill o f organic material w i l l be prohibited f rom 1 s l
of January 2005 in Sweden (Swedish Codes o f Statutes, 2001). This law is based on a European Commission Directive (European Commission, 1999) which forces the member states to lower the landfi l l o f biodegradable municipal waste to less than 35 % of the amount produced in 1995. This means that the Swedish law is more stringent than the
directive.
There is a great interest amongst stable and trotting course owners in burning the manure mixture in order to generate space heat and hot tap water for their facilities. Today, most o f the stables in Sweden use o i l , electricity or district heating. Additionally, the ash could be used as fertiliser, i f the amount o f heavy metals, like cadmium, is less than the prevailing
regulations.
From a small inquiry made in northern Sweden it was found that the used amount o f wood-
shavings varied f rom 9 to 29 m per horse and year. The large variations are due to the fact that the stables and riding schools often pay for the bedding material, and the share o f the wood material in the mixture depends strongly on how careful the keepers are when they
clean the horseboxes. (Pettersson et.al, 2002). In the same study, it was found that currently the largest part o f the horse manure is recycled to agricultural land fol lowed by deposition at landfills. Combustion and other usage such as soil production for lawns were
of small importance.
Wheeler et al. (2002) claim that approximately 20 m o f bedding material is used per horse
and year. (Close to the average value of the inquiry). This means that, assuming that all material is wood-shavings, around 6 mil l ion m are used per year in Sweden. This corresponds to about 2.4 T W h or the electricity consumption o f roughly 120 000 typical
family houses in the northern part of Sweden. For many stables, the amount o f wood shavings would easily cover the space heating demand and the demand for hot tap water
over a year. I f this heat production system works satisfactorily, the stable and trotting course owners w i l l on one hand decrease the cost for heating their facilities and on the
other hand partly solve existing or future management problems. It w i l l most l ikely not be possible to get rid o f the residue completely, since the space heating demand during spring, summer and autumn is low or non-existing, while the production o f horse manure is roughly the same every month o f the year, while the horses are put in a stable.
One important condition for motivating combustion o f horse manure is o f course that the resulting emissions are kept at an environmentally benign level. Therefore, preliminary experiments have been carried out in order to evaluate the combustion process, primarily
concerning emissions o f CO and NO x . Comparisons with results f rom traditional combustion o f wood-chips with high moisture content have also been made.
Other aims have been to find the upper l imit o f the fuel moisture content and to analyse the chemical composition o f the ash to find out the possibilities for using it as fertiliser.
E X P E R I M E N T A L S E T U P
The experiments have been carried out in a newly developed biomass fuelled boiler suitable for small district heating networks. The furnace was primarily designed for wood-
chips wi th high moisture content, up to 55%. The test site is located in the town o f Boden in the northern part o f Sweden.
2

Fuel
The moisture content o f the mixture w i l l vary, mostly depending on where it is stored. I f it
is stored outdoors without cover, the moisture content can easily exceed 60 wt%. I f it is stored under a roof, the moisture content w i l l be substantially reduced. Table 1 shows the measured moisture content and ash content o f some fuel samples.
Table 1. Measured moisture- and ash content in manure samples
Date Moisture content % Ash content (% o f DS)
2002 02 19 57 6.77 2002 02 22 57 7.98 2002 0 2 2 8 / 0 3 0 1 49 5.21 2002 03 05 49 6.63 2002 12 21 63 4.88
As shown in the table, the fuel quality varies substantially. The reason for the variations in
moisture content is mainly the weather conditions. It is therefore o f great importance to test fuels wi th different qualities in order to find the upper l imit o f the moisture content in order to achieve a good combustion process.
An accredited laboratory SLU (The Swedish University o f Agricultural Sciences, Umeå, Sweden) has performed analyses o f the chemical composition o f the wood-chips and the
horse manure mixture. The results are shown in table 2 and most o f them are expressed in % of dry substance (DS).
Table 2. Chemical composition and heating value of wood-chips and manure Analysis Method Unit Wood-chips Manure Sulphur SS 18 71 77:1 % o f D S <0.01 0.14 Carbon LECO-method 1 % o f DS 49.5-49.8 48.6 Hydrogen LECO-method 1 % o f D S 6.1-6.2 5.8 Nitrogen LECO-method 1 % of DS <0.1 0.9 Oxygen Calculated % o f D S 43.5-44.0 44.3 Chlorine SS187154:1 % o f D S 0.004 0.26 Ash SS 187 177:1 % o f DS 0.5 7.3 Heating value, calorimetric SS-ISO 1928:1 MJ/kg DS 20.56 19.37 Lower heating value SS-ISO 1928:1 MJ/kg DS 19.21 18.14 Volatiles SS-ISO 562:1 % o f D S 84.1-84.6
The chemical composition o f the fuel mixture is different compared to that o f wood-chips.
For example, the content o f nitrogen in the manure mixture is considerably higher. The
amount o f sustenance substances in horse manure is also higher, which contributes to a lower melting point o f the ash. This means that ash related operational problems could occur to a greater extent than wi th traditional combustion o f wood-chips.
Combustion chamber
The combustion process is performed in two stages, in a primary and a secondary zone.
After the secondary combustion chamber, the gases enter a conventional convection boiler
where the heat is transferred to the water. The cooled gases continue through a cyclone system.
3

Two inclined feeding screws supply the fuel to the combustion chamber. The fuel enters in the back o f the furnace on a horizontal plane and moves slowly towards a slope. The purpose o f the plane and the slope is to dry the fuel before the combustion process, using
heat transfer by radiation and convection f rom the produced gases. Pyrolysis starts in the end of the slope and on the beginning o f the second horizontal plane, where the main combustion takes place. A n electric motor driven piston pushes the fuel forward towards
the steps where the final char combustion takes place. Figure 1 shows a sketch o f the primary combustion chamber.
Figure 1. Sketch of the primary combustion chamber
The primary combustion air is pre-heated in the double wall construction outside the ceramics and supplied partly f rom slotted steel pipes in the sidewalls and partly through a pipe in the front o f the furnace.
The secondary combustion chamber is cylindrical and designed to create a re-circulating f low, which enhances the large scale mixing and the combustion intensity. The secondary
air supply system is designed to get as good mixing between the combustible gases and the secondary air as possible. The design was developed on the basis o f CFD simulations and
previous experiments. A detailed description o f the secondary zone is presented by Lundgren et al. (2003).
Measuring equipment
The analysis o f the stack gas composition is performed immediately after the heat transfer
unit. A multi-component gas analyser for online measurements of NO, CO, C 0 2 and 0 2
(Maihak) is installed. Additionally, a N O / N 0 2 converter (JNOX) is used to convert N 0 2 to NO, which means that the NO instrument can also measure total NO„.
Gas temperatures were measured above the fuel bed in the primary zone, before and after the secondary combustion chamber and after the heat transfer unit. The temperatures were
measured by radiation-shielded thermocouples o f type N .
The thermal output o f the heat transfer unit and the heat supply to the district-heating
network were measured by ultrasonic f low meters and temperature gauges o f type PT-100.
The values were recorded every thirtieth second in two loggers.
4

To determine the moisture content o f the fuel mixture, fuel samples were dried in an
electrical oven for at least 24 hours at approximately 105°C.
P R E L I M I N A R Y E X P E R I M E N T A L R E S U L T S
The aim of the introductory experiments was mainly to study important parameters, such as emissions, gas temperatures and excess air ratios with different fuel qualities and fuel-
feeding settings as well as primary and secondary air ratios.
Dry wood-chips were used as fuel during the start-up phase in every experiment in order to
heat up the ceramics o f the combustion chamber faster.
Figure 2 shows emissions o f CO as a function of the temperature o f the gases before the
entrance to the secondary zone.
Figure 2. Emissions of CO standardised to 10 vol% O 2 as a function of the temperature before the secondary zone
The result shows that a temperature o f about 800°C is necessary to achieve a good
combustion process. The same temperature limit has been found when using wood-chips as
fuel in this furnace Lundgren et al. (2001).
The quality of the fuel , especially the moisture content, is o f great importance for the
combustion process. For example, experiments wi th fuel moisture contents in the range o f
57 wt% to 63 wt% and a large share o f manure have shown that it is not possible to retain the required combustion temperature in this design o f the combustion chamber.
Figure 3 shows the O? content, the temperature before the secondary zone and emissions o f CO and N O x during an experiment wi th a fuel moisture content o f 57 wt%.
5

0 2 4
T i m e (h)
Figure 3. Experiment with fuel moisture content of 57%
As shown in the figure, the temperature was constantly decreasing during the first five
hours until a steady-state condition was reached at a temperature level below 800°C. This
caused an incomplete combustion process, resulting in high peaks o f CO. The conclusion of this experiment was that the net heating value o f the fuel mixture was too low, due to the high moisture content.
To reduce the moisture content o f the fuel mixture, more wood-shavings were added. Figure 4 shows the results o f an experiment using fuel wi th a moisture content o f 49 wt%.
The average boiler thermal output was around 150 kW. The figure shows the emissions o f CO and N O x , the 0 2 content and the temperature before the secondary zone.
0 5 10 15
T i m e (h)
Figure 4. Temperature before the secondary zone, emissions of CO and NOx and O2
content during steady-state conditions
As mentioned earlier, the first couple o f hours o f the test, dry wood-chips were used. After approximately two and half hours, the horse manure mixture was fed into the combustion
6

chamber, which is illustrated by the increasing emissions o f N O x . Even i f the level o f N O x
emissions is high, it must be considered a reasonable level, due to the high content o f
nitrogen in the fuel.
The average emissions o f CO were low and comparable with results f rom experiments
with wet wood-chips at the same thermal output, 150 kW. The emissions could most likely be lowered, since the combustion process is not optimised for this application. For
example, as shown in figure 4, the 0 2 content in the stack gases was much too high. The reason for this was that a large amount o f the total combustion air was supplied in the secondary zone, where, in this case, it only worked as dilution air and unnecessary cooling
of the gases. The average ratio between secondary and primary air supply was 1.38.
The average emissions o f CO and N O x were 130 mg Nm" 3 and 370 mg Nm" 3 , respectively
(Standardised to 10 v o l % 0 2 ) . The average excess air ratio was 2.27. The time when wood-chips were used is excluded.
Another experiment with the same fuel and at the same thermal output level is shown in
figure 5.
^ 1 0 0 0 H
8 0 0 - \
P 6 0 0 H
4 0 0 H
2 0 0 H
o - i
0 1
r - 2 0
h - 1 5
h 10
h 5
0 T 2 3 4
T i m e (h )
Figure 5. Temperature before the secondary zone, emissions of CO and NOx and O2 content during steady-state conditions
The difference compared to the test described above, was that the share o f secondary air
was radically decreased. In this experiment, the average ratio between secondary and
primary air supply was 0.5.
This contributed to a reduction o f the excess air ratio, but also an increase o f the combustion intensity in the primary combustion chamber, which resulted in less emission
of CO. The average emission o f CO was only 37 mg Nm" 3 , while the average emission o f
NO x was 320 mg N m ' 3 . The average excess air ratio was 1.62.
7

Comparison with traditional combustion of wood-chips
Figure 6 shows typical average emissions o f CO and N O x during combustion o f wood-
chips and horse manure, respectively. The average values are calculated f rom data collected f rom several different experiments during steady state condition wi th fuel moisture content around 50 wt% and at a thermal output o f about 150 kW. Exactly the same number o f measured values for each fuel has been used.
400 -|
350
300
'Nm
250 D> _E 200 -U) C o
'in 150 in
E 1XJ 100
50 -
0 -
I ' F T z I CO
I NOx
M a n u r e Wood-chips
Figure 6. Comparison of typical emissions using horse manure and wood-chips as fuel. (The emissions are standardised to 10-vol% O2)
The comparison shows that the average emission o f CO was higher when horse manure was used as fuel. However, the difference is insignificant and both average values are low.
Concerning the emissions o f N O x , the difference between the fuels is considerably larger. As mentioned earlier, this is due to the high content o f fuel bound nitrogen, since the horse
manure mixture contains a large amount o f urine.
Ash
This version o f the combustion chamber was not equipped wi th ash handling equipment,
such as ash screws, and the ash was accumulated inside the combustion module. It was observed that a portion of the ash was sintered.
Table 3 and 4 show a comparison between the ash content in fuel and bottom ash for horse
manure and wood pellets burned in ordinary pellet burners.
8

Table 3. Major inorganic components in fuel and bottom ash for horse manure (M) and
wood pellets (W) burned in ordinary pellet burner
Element % DS in % DS of fuel divided by %DS in % DS of fuel divided by ash ash(M) ash content (7.3 % ) ( M ) ash (W) content (0.5%)(W)
S1O2 42.6 33.15 34.4 25
AI2O3 7.75 3.36 6.07 4.46
CaO 15.4 15.9 26.7 29
F e 2 0 3 4.24 2.30 7.16 4.42
K 2 0 11.5 17.67 9.08 13.02
MgO 8.85 9.64 4.69 4.72
M n 0 2 0.368 0.39 4.28 4.48
N a 2 0 2.59 2.16 1.29 1.56
P 2 0 5 4.27 7.27 4.96 5.26
T i 0 2 0.436 0.29 0.24 0.18
S 0.4 1.9 0.0481 3.2
Cl n.a a 3.56 n.a a 0.8 a not analyzed
Table 4. Inorganic trace components in fuel and bottom ash for horse manure (M) and
wood pellets (W) burned in ordinary pellet burners (mg/kg ash)
Element Ash (M) Fuel ( M ) Ash (W) Fuel (W)
As <3 2.1 2.94 -Ba 656 500 3540 3600
Be 0.892 0 . 5 5 O .6 0.74
Cd <0.1 1.55 0.646 -Co 13.8 6.85 25.4 14.1
Cr 1000 72.5 543 165
Cu 105 104 10000 272
Hg <0.1 0.2 0.1 -La 9.23 <5.5 10.4 <5
Mo 10.3 13.6 49.7 177
Nb <6 <5.5 <6 <5
Ni 378 24.8 410 59
Pb 5.4 5.2 13.1 -
S 4020 19178 481 32000
Sc 7.32 4.6 2.77 1.54
Sn <20 <27 380 22.6
Sr 464 401 1370 1422
V 70.8 42.5 14.2 22.4
W <60 <55 <60 <50
Y 10.4 6.5 8.9 7.42
Zn 344 683 173 2800
Zr 73.6 46.7 101 70.4
Comparing the inorganic constituents in the manure wi th ordinary wood pellets show that
the composition is fairly similar but manure has higher concentrations o f silica, potassium, magnesium and chlorine. The higher concentration o f chlorine w i l l volatilise more
potassium. The higher concentrations o f potassium may decrease the sintering temperature of the ash. Manure does have lower concentrations o f calcium and mangan. The lower
9

concentration o f calcium w i l l influence the self hardening ability o f the ash as explained below.
The analysis of inorganic constituents in the bottom ash compared with the fuel shows that potassium, phosphor and sulphur have left the fuel. The chlorine content was not analyzed
due to the experience that chlorine is very seldom found in biomass ash since potassium chloride is volatile.
The concentrations o f chromium and nickel increased several times in the ash compared with the fuel for manure. Table 3 shows that the iron content has increased substantially as well . This indicates that some stainless steel has contaminated the ash. The wood ash has
probably been contaminated wi th some brass, which contains both copper and zinc. The zinc is volatile both as a metal and as chloride, which could explain the measured low concentrations in the ash. The f l y ash was not collected during the experiments.
Table 5 shows measured and recommended minimum and maximum concentrations o f
nutrients and trace elements in ash products to allow recycling to forests.
Table 5. Recommended minimum and maximum concentrations in ash products to be recycled to forests (National Board of Forestry. 2002)
Standard Measured Limiting values forest in values values (M) Austria (Van Loo. 2002)
Elements Lowest Highest
Macro nutrients g/kg DS
Ca 125 110
M g 20 53 K 30 95 P 10 18
Trace elements mg/kg DS
B 500 n.a a
Cu 400 105 250 Zn 1000 7000 344 1500 As 30 <3
Pb 300 5 100
Cd 30 <0.1 8 Cr 100 1000 250
Hg 3 <0.1 Ni 70 378 100 V 70 70.8
Organic pesticides mg/kg DS
Total PAH (tentative) 2 n.aa
a not analysed
The ash contained lower calcium concentration than recommended. Wood ash contains
high concentrations o f calcium and does upon storage in humid climate self-harden. This is due to that the calcium in the ash form calcium hydroxide, which reacts with carbon
dioxide forming limestone. A high calcium concentration means larger coverage o f the particles wi th limestone while a low concentration means a lower coverage corresponding
to a more soluble ash product wi th less strength.
10

The measured concentrations of nickel and chromium were also higher than recommended, but as may be seen f rom the iron analysis this is probably due to contamination o f the ash
by some stainless steel.
Otherwise the ash fu l f i l s the requirements except for the zinc content. The requirement on the lowest level for zinc is a strange requirement, since zinc is volatile both as a metal and
as chloride. The ash from wood pellets was also too low regarding zinc levels due to vaporisation.
D I S C U S S I O N
The experimental results are so far very promising. Further studies must be carried out to
investigate i f it is possible to reduce the emissions o f N O x . The current legislation in Sweden for N O x emissions does not cover plants smaller than 500 k W and the intended heat output is between 70 and 400 kW. For larger plants than 500 k W the emission limits
are 100 mg MJ" 1 . (Van Loo et al, 2002). In Austria, the N O x emission limits for plants 100 k W - 50 M W are 350 mg N 0 2 Nm" 3 at 13 % 0 2 for wood waste. This means that the plant does meet current limits, but contacts with the Swedish Environmental Protection Agency
(Ejner. 2003) indicate that combustion plants for horse manure would be recommended to be developed towards 100 mg MJ" .
On the other hand, handling, storing and dissemination o f farmyard manure cause
ammonia (NFL) emissions. According to the Swedish Board of Agriculture (2003) a large part o f the total nitrogen content o f the manure w i l l be emitted as ammonium and the largest emissions occur during storage and dissemination. I f the farmyard manure is used as fertiliser on arable land, it is recommended that the manure is composted. During this
process, the nitrogen w i l l be washed out partly as ammonia and partly as nitrate. The amount varies depending on what kind o f bedding material is used.
During combustion the largest part of the nitrogen content is emitted as nitrogen (N 2 ) and nitrogen oxides (NO x ) . Additionally, results from earlier experiments wi th wood-chips have shown that it was possible to slightly reduce the N O x emissions by decreasing the
air/fuel ratio. (Lundgren et al. 2004). This indicates that it should be possible to reduce the emissions o f N O x for this application as well .
This means that all types o f manure handling practices contribute, more or less, to an enhanced acidification o f soil and surface water. Further investigations are required to compare the N O x emissions f rom combustion wi th the escapes o f NH3 regarding the
acidification contribution.
The concentrations o f heavy metals are sufficiently low in order to allow recycling to
forests, because contamination o f the ash w i l l not occur in continuous combustion practise. The lower calcium content resulting in a lower self-hardening capability should however
be considered i f recycling to forest is aimed at.
The major drawback is that the nitrogen in the manure cannot be used as fertiliser on agricultural land, since all o f the nitrogen leaves the chimney. In principle the ash could be
used as a fertiliser on agricultural land as well as forestlands. The ash contains substantial amounts o f phosphorus, which ought to be recycled to farmland in many cases in order not to lower the depot o f phosphorus in the ground. It has been shown that the phosphorus
11

after combustion in the ash exists in chemical structures less accessible to plants than in manure. It has been claimed that this is a drawback o f ashes, but Linderholm (1997) stated that only 0.01 % of the phosphorus in the ground is accessible to the plants, and that it is o f little importance in which chemical form the phosphorus is added to the depot. More ash
analysis is however needed, before it can be stated whether the quota between phosphorus and heavy metals is higher or lower than in the phosphorus products from the fertiliser industry. I f the quota were found to be acceptable, the ash could be considered for
agricultural land as well forests.
C O N C L U S I O N S
The gas temperature before the secondary combustion chamber must exceed 800°C to get
an effective combustion process.
The fuel quality is o f great importance when f i r ing horse manure mixed with wood-shavings, especially the moisture content. It is possible to obtain a good combustion process with low emissions o f unburnt gases i f the moisture content is below 50%. The
horse manure should therefore be stored under a roof or something similar.
The experimental results show that it is possible to obtain almost as low emissions o f CO as when using wet wood-chips. On the other hand, the emissions o f N O x are obviously
higher when using horse manure, due to the higher nitrogen content in the fuel. It should however be taken into account that a large amount o f NFL is emitted during handling, storing and dissemination o f farmyard manure as wel l .
The concentrations o f heavy metals are sufficiently low to allow recycling to forests, but the lower calcium content yielding lower self-hardening capacity should be considered.
The main conclusion is that it is possible to use horse manure for heat production from the
point o f view of emission. Long-term test runs are however required being able to draw any major conclusions concerning sintering and other ash related problems. To be able to perform these longer experiments, an automatic ash removal system must be installed.
A C K N O W L E D G E M E N T S
The authors would like to thank M r Mikael Jansson, Swebo Flis och Energi A B for f ru i t fu l co-operation and discussions during the project. The Network Institute for Future Energy
systems (NIFES) and Swedish National Energy Administration (STEM) has financed this work. The authors gratefully acknowledge this support. The authors would also like to thank our colleagues at the Division o f Energy Engineering, Luleå University o f
Technology and at Energy Technology Centre in Piteå.
R E F E R E N C E S
Ejner B . 2003. Personal communication. Swedish Environmental Protection Agency. Stockholm, Sweden.
European Commission. 1999. Council Directive 1999/31/EC on landfil l o f waste. Luxembourg.
12

Lundgren J., Hermansson R., Lundqvist M . 2003. Design of a Secondary Combustion Chamber for a 350 kW Wood-Chips Fired Furnace. Proc. o f the International Conference on Fluid and Thermal Energy Conversion. 7-11 Dec. Bali , Indonesia.
Lundgren J., Hermansson R., Dahl J. 2001. A new biofuel based boiler concept for small district heating systems. Proc. o f the 2001 Joint International Combustion Symposium. 9-
12 Sept. Kauai, Hawaii, USA.
Lundgren J., Hermansson R., Dahl J. 2004. Experimental studies o f a biomass boiler suitable for small district heating systems. Biomass and Bioenergy. 26 (5). pp 443-453.
National Board o f Forestry. 2002. Recommendations for the extraction o f forest fuel and compensation fertilising. Meddelande 3-2002. Jönköping, Sweden.
Pettersson E., Lundgren J. (2002). Kretsloppsanpassad förbränning av strömedel/-gödsel
från häststallar. Technical report. NIFES 2002-2. Piteå, Sweden. (In Swedish)
Statistics Sweden (SCB). 2000. Press release Nr 2000-267. Stockholm, Sweden.
Swedish Codes o f Statute (SFS). 2001. Law (2001:512) on landfil l o f waste. Swedish Parliament. Stockholm, Sweden. (In Swedish)
Steineck S., Svensson L . 2000. Hästar-gödselhantering. Teknik för lantbruket. JTI-report
82. Swedish Institute o f Agricultural and Environmental Engineering. Uppsala, Sweden. (In Swedish)
Svala C. 2002. The horse in the landscape. Special report -240. Department o f Agricultural Biosystems and Technology. Swedish University o f Agricultural Sciences. Alnarp,
Sweden. (In Swedish)
Swedish Board o f Agriculture. 2003. Yearbook o f agricultural statistics 2003 including food statistics, ch 12. pp 179. Jönköping, Sweden. (In Swedish)
Van Loo S. and Koppejan J. (Eds.). 2002. Handbook o f Biomass Combustion and Co Firing. Prepared by Task 32 o f the Implementing Agreement on Bioenergy under the auspices o f the International Energy Agency ( IEA). Twente University Press. Enschede,
the Netherlands.
Wheeler E., Smith Zajaczkowski J. 2002. Horse Stable Manure Management. College of
Agricultural Sciences. G-97. Penn State Cooperative Extension. USA.
Öhman M . 2002. Personal communication. Umeå University, Sweden.
13

LULEÅ I U N I V E R S I T Y ,
O F T E C H N O L O G Y
Universitetstr