numerical analysis on blast furnace low co2 emission ...
13
NUMERICAL ANALYSIS ON BLAST FURNACE LOW CO 2 EMISSION OPERATION WITH COKE OVEN GAS INJECTION 1 Chu Man-sheng 2 Guo Tong-lai 2 Liu Zheng-gen 2 Xue Xiang-xin 2 Yagi Jun-ichiro 3 Abstract In recent years, the iron and steel industry has been faced with more and more pressure in saving energy, reducing CO 2 emission and environmental burden. The process of injecting coke oven gas (COG) into blast furnace is one of the effective measures for the iron and steel industry to achieve low-carbon ironmaking, energy saving and emission reduction. Numerical simulations on the injection of COG into blast furnace through tuyere are performed in this study by means of raceway mathematical model, multi-fluid blast furnace model and exergy analytical model. With the increase of COG injection, the simulation results are shown as follows: (1) The bosh gas flow rate is increased, while raceway temperature is decreased. Through reducing blast flow rate and enhancing oxygen enrichment to do thermal compensation for raceway, the conditions of raceway can be sustained stable. Meanwhile the volume of raceway is decreased. (2) The in-furnace concentrations of CO and H 2 show increasing; the utilization rate of CO is enhanced, while the utilization rate of H 2 tends to decrease. But the proportion of H 2 in indirect reduction gives a raised tendency, and the reduction rate of burden is accelerated. Due to the location of cohesive zone moving down, the thickness getting thinner and the pressure drop reducing obviously, the permeability of blast furnace gets better. The productivity shows a remarkable increase, for 152.34 m 3 /tHM COG injection, improves by 26.36%. The silicon content of the hot metal decreases, and the quality of the hot metal improves, for 152.34 m 3 /tHM COG injection, the silicon content decreases from 0.26% to 0.05%. Coke rate, total reducing agent rate and carbon emission rate show a considerable decrease, for 152.34 m 3 /tHM COG injection, decreases by 13.49%, 4.12% and 17.54%, respectively. (3) The internal and external exergy loss of furnace both are decreased. The thermodynamic perfection degree and exergy efficiency are increased, compared with no COG injection, which are increased from 90.23% to 92.65% and from 53.39% to 54.25% respectively. The chemical exergy of blast furnace top gas is increased, compared with no COG injection, which is increased from 4.60 GJ/tHM to 4.97 GJ/tHM. So, it is important to strengthen the recycling of top gas. Key words: Blast furnace; Low carbon ironmaking; Coke oven gas injection; Raceway mathematical model; Multi-fluid blast furnace model. 1 Technical contribution to the 6 th International Congress on the Science and Technology of Ironmaking – ICSTI, 42 nd International Meeting on Ironmaking and 13 th International Symposium on Iron Ore, October 14 th to 18 th , 2012, Rio de Janeiro, RJ, Brazil. 2 School of Materials & Metallurgy, Northeastern University, Shenyang, China. 3 Institute of Multidisciplinary Research for Advanced Materials, Tohoku University, Sendai, Japan. ISSN 2176-3135 992
-
Upload
khangminh22 -
Category
Documents
-
view
1 -
download
0
Transcript of numerical analysis on blast furnace low co2 emission ...

NUMERICAL ANALYSIS ON BLAST FURNACE LOW CO2 EMISSION OPERATION WITH COKE OVEN GAS
INJECTION1
Chu Man-sheng2
Guo Tong-lai2
Liu Zheng-gen2
Xue Xiang-xin2 Yagi Jun-ichiro3
Abstract In recent years, the iron and steel industry has been faced with more and more pressure in saving energy, reducing CO2 emission and environmental burden. The process of injecting coke oven gas (COG) into blast furnace is one of the effective measures for the iron and steel industry to achieve low-carbon ironmaking, energy saving and emission reduction. Numerical simulations on the injection of COG into blast furnace through tuyere are performed in this study by means of raceway mathematical model, multi-fluid blast furnace model and exergy analytical model. With the increase of COG injection, the simulation results are shown as follows: (1) The bosh gas flow rate is increased, while raceway temperature is decreased. Through reducing blast flow rate and enhancing oxygen enrichment to do thermal compensation for raceway, the conditions of raceway can be sustained stable. Meanwhile the volume of raceway is decreased. (2) The in-furnace concentrations of CO and H2 show increasing; the utilization rate of CO is enhanced, while the utilization rate of H2 tends to decrease. But the proportion of H2 in indirect reduction gives a raised tendency, and the reduction rate of burden is accelerated. Due to the location of cohesive zone moving down, the thickness getting thinner and the pressure drop reducing obviously, the permeability of blast furnace gets better. The productivity shows a remarkable increase, for 152.34 m3/tHM COG injection, improves by 26.36%. The silicon content of the hot metal decreases, and the quality of the hot metal improves, for 152.34 m3/tHM COG injection, the silicon content decreases from 0.26% to 0.05%. Coke rate, total reducing agent rate and carbon emission rate show a considerable decrease, for 152.34 m3/tHM COG injection, decreases by 13.49%, 4.12% and 17.54%, respectively. (3) The internal and external exergy loss of furnace both are decreased. The thermodynamic perfection degree and exergy efficiency are increased, compared with no COG injection, which are increased from 90.23% to 92.65% and from 53.39% to 54.25% respectively. The chemical exergy of blast furnace top gas is increased, compared with no COG injection, which is increased from 4.60 GJ/tHM to 4.97 GJ/tHM. So, it is important to strengthen the recycling of top gas. Key words: Blast furnace; Low carbon ironmaking; Coke oven gas injection; Raceway mathematical model; Multi-fluid blast furnace model. 1 Technical contribution to the 6th International Congress on the Science and Technology of
Ironmaking – ICSTI, 42nd International Meeting on Ironmaking and 13th International Symposium on Iron Ore, October 14th to 18th, 2012, Rio de Janeiro, RJ, Brazil.
2 School of Materials & Metallurgy, Northeastern University, Shenyang, China. 3 Institute of Multidisciplinary Research for Advanced Materials, Tohoku University, Sendai, Japan.
ISSN 2176-3135
992

1 INTRODUCTION At present, the CO2 emission and energy consumption of blast furnace are the largest in iron and steel enterprise, which accounts for about 76% and 59.26% respectively[1,2]. Therefore ironmaking with blast furnace is the core of energy saving and emission reduction in iron and steel enterprise. And the energy conservation and emission reduction of blast furnace are the main development direction of ironmaking industry. However, taking carbon metallurgy as essence, the technologies of blast furnace tends stable[3]. In order to reduce energy consumption furthermore, to reduce CO2 emissions, to realize low carbon ironmaking, ironmaking workers need to actively strengthen relevant theoretical researches on hydrogen metallurgy to achieve hydrogen enrichment medium used in blast furnace injection. As quality resource with high hydrogen content, COG is injected into blast furnace through tuyere, which has been researched by some scholars. The preliminary research results show that the injection of COG into blast furnace is conductive to accelerate the reduction of burdens, to reduce CO2 emissions, and it is also one of the means for blast furnace to realize low carbon and ultrahigh efficiency [4-8]. Although some researches have been done on injecting COG into blast furnace, most of them confine to field test, which have some disadvantages such as high cost, long time test, and unstable operation, and lack of detailed mathematical simulation on internal reaction mechanisms of blast furnace. At the same time, no improvement measures were presented, and optimal operation failed to materialize. All these conditions restrict the popularization and application of injecting COG into blast furnace. Combining with the practical circumstances of a certain blast furnace, numerical analysis on injecting COG into blast furnace through tuyere was performed in this study by means of raceway mathematical model, multi-fluid blast furnace model and exergy analytical model. Through study, the paper systemically analyzes the relationship between raceway characteristic indices, blast furnace process variables, blast furnace production indices, blast furnace energy utilization and COG injection volume, which provide the theory basis for deeply researching the injection of COG into blast furnace, and provide the references for the comprehensive evaluation feasibility on injecting COG into blast furnace.
2 EFFECTS OF COG INJECTION ON RACEWAY 2.1 Raceway Mathematical Model A raceway mathematical model is set basing on mass and enthalpy balances. The model supposes some ideas as follows: (1) water gas reaction is taken place by water vapor and coke, (2) COG is mixed well with blasting in raceway zone, (3) the main ingredient CH4 of COG transforms into CO and H2, (4) coal combustion reaction, coke solution loss and combustion reaction occur simultaneously in raceway. Eventually, the gas exiting in raceway consists of only CO, H2 and N2
[9]. The variable of each index and responding improved measures in raceway are researched in this study by the raceway model developed through changing the injection rate of COG. Figure 1 gives the flow chart of raceway mathematical model, in which T0
RWY and V0Bosh are theoretical flame temperature and bosh gas flow rate
respectively without COG injection, TRWY and VBosh are theoretical flame temperature and bosh gas flow rate with COG injection.
ISSN 2176-3135
993

TRWY=T0RWY
VBosh=V0Bosh
Inflow conditions of coke oven gas(Rate, composition, ect.)
Mass and enthalpy balances
No
Blast parameters (Oxygen enrichment, blast flow rate,ect.)
Yes
Begin
Raceway conditions
End
TRWY=T0RWY
VBosh=V0Bosh
Inflow conditions of coke oven gas(Rate, composition, ect.)
Mass and enthalpy balances
No
Blast parameters (Oxygen enrichment, blast flow rate,ect.)
Yes
Begin
Raceway conditions
End Figure 1. Computation Procedure of raceway mathematical model.
Raceway Hight
Raceway Depth
Raceway Width(Vertical to the current page)
a
b
c d
e
f
Raceway Hight
Raceway Depth
Raceway Width(Vertical to the current page)
a
b
c d
e
f
Figure 2. Layout of raceway shape.
The correction Hatano Michiharu formula is used to calculate raceway shape in raceway model[10,11]. As shown in Figure 2, depth, width, height and volume of raceway are obtained from this formula according to reaction force analysis on blast penetration, coke gravity and raceway wall. 2.2 Calculation Conditions The calculation was performed for the blast furnace with diameter of 11.5 m, height of 29.4 m and inner volume of 2580 m3. The chemical compositions of COG are listed in Table 1, with hydrogen content is 60.70%, calorific value is 17.65 MJ/m3 and injection temperature is 25 �. The conditions of tuyere and blast are listed in Table 2, with blast flow rate is 4119 m3/min and oxygen enrichment is 3.0%. The carbon content in coke is 85.83%, bulk density is 650 kg/m3 and tuyere coke size is 0.0155 m. The chemical compositions of pulverized coal are listed in Table 3, with carbon content is 81.54%, calorific value is 32.5 MJ/kg, and injection rate is 9.0 kg/s and injection temperature is 25°C. Table 1. Chemical compositions of COG (unit: %)
H2 N2 CO CO2 CH4
60.70 3.77 6.67 2.23 26.63*
*:Small quantity of hydrocarbons in COG is converted into methane.
ISSN 2176-3135
994

Table 2. Conditions of tuyere and blast
Items Tuyere
diameter mm
Tuyere quantity Number
Blast temperature
°C
Blast pressure
kPa
Blast flow rate
m3/min
Oxygen enrichment
%
Blast humidity g/Nm3
Value 125 30 1150 334 4119 3.0 2.3
Table 3. Chemical compositions of pulverized coal (unit: %)
C H N O Ash
81.54 4.22 1.61 3.72 8.91
2.3 Results and Discussion The model calculated four different cases, namely Base, COI3.96, COI7.93 and COI11.89, in which COG injection rate is 0, 3.76, 7.93, 11.89 m3/s, respectively. The base case corresponds to the conventional operation without COG injection. Throughout the calculations, the raceway temperature (2171.83 °C) and bosh gas flow rate (5409.95 m3/min) are maintained nearly constant. Because that blast temperature, blast humidity and pulverized coal injection rate are kept the same as the Base case. In order to maintain constant raceway temperature and bosh gas flow rate, some thermal compensation measures should be applied. In the paper, blast flow rate and oxygen enrichment are adjusted to maintain constant raceway temperature and bosh gas flow rate. As listed in Table 4, with the increase in COG injection, blast flow rate can be decreased to ensure that bosh gas rate is consistent with Base case after thermal compensation, which decreases by 94.95m3/min for increasing 1 m3/s COG injection rate. Simultaneity, oxygen enrichment can be increased to intensify combustion of raceway and to ensure that raceway temperature is consistent with Base case after thermal compensation, which increases by 1.36% for increasing 1 m3/s COG injection rate.
Table 4. Blast flow and oxygen enrichment of blast after thermal compensation
Items Base COI3.96 COI7.93 COI11.89
Blast flow rate/( m3/min) 4119.0 3742.7 3366.5 2990.1
Oxygen enrichment/% 3.00 7.32 12.60 19.22
Thermal compensation measures for the cases are taken to investigate the effects of COG injection rate on raceway conditions, and the concrete calculation results are shown in Table 5. As listed in Table 5, the gas compositions in raceway after thermal compensation are changed obviously. The H2 concentration gradually increases mainly due to a large amount of H2, CH4 and other hydrocarbons brought by COG. The CO concentration gradually increases mainly due to the fact that the increase in oxygen enrichment intensifies the combustion of the raceway, and a large number of coal and coke are involved in combustion reactions. In addition, a small amount of CO and CO2 is in COG and the solution loss reaction of CO2 is exited, which enhances the concentration of CO. CH4 decomposition reaction in tuyere nose also increases the concentration of CO correspondingly. The concentration of N2 in raceway gradually decreases owning to the fact that the increase of oxygen enrichment reduces N2 proportion of blast. Also raceway shape is changed obviously after thermal compensation. Meanwhile the depth, width, height and volume of raceway decrease
ISSN 2176-3135
995

in different degree with the increase in COG injection. With the increasing COG injection rate 1 m3/s, the volume of raceway is reduced by 1.98%, which results in the development of in-furnace edges gas flow, and further affects gas flow distribution in lower parts and equilibrium descent of burdens in upper parts, and some measures should be put to use. Table 5. Effects of COG injection rate on raceway conditions after thermal compensation
Items
Raceway gas compositions Raceway shape Theoretical flame
temperature �
Bosh gas flow rate m3/min φ(CO)
% φ(H2)
% φ(N2)
% Depth
m Width
m Height
m Volume
m3
Base 37.36 4.90 57.74 1.25 0.71 1.08 0.51 2171.83 5409.95
COI3.96 40.45 9.89 49.66 1.19 0.69 1.06 0.47 2171.97 5409.71
COI7.93 43.54 14.88 41.58 1.13 0.68 1.03 0.42 2171.58 5410.19
COI11.89 46.63 19.87 33.50 1.08 0.67 1.01 0.39 2171.84 5409.95
3 SIMULATION ON BLAST FURNACE OPERATION WITH COG INJECTION BASED ON MULTI-FLUID BLAST FURNACE MODEL 3.1 Calculation Conditions A previously presented multi-fluid blast furnace model[12-16] is modified to simulate blast furnace operation with coke oven gas injection. The simulation was performed for the blast furnace with diameter of 11.5 m, height of 29.4 m and inner volume of 2580 m3. The major operating conditions of the simulated blast furnace are listed in Table 6. Table 6. The conditions of four calculation cases
Items Base COI3.96 COI7.93 COI11.89
COG flow rate/(m3/tHM) 0 58.89 110.08 152.34
Blast temperature/°C 1150 1150 1150 1150
Blast flow rate /(m3/tHM) 1111.47 927.57 778.84 638.51
Oxygen enrichment /% 3.0 7.32 12.6 19.22
Pulverized coal rate/(kg/tHM) 145.7 133.8 124.9 115.3
Top gas flow rate /(m3/tHM) 1640.16 1495.5 1383.44 1270.04
Theoretical flame temperature /°C 2171.83 2171.85 2171.70 2171.84
Bosh gas flow rate/(m3/min) 5409.95 5409.97 5409.93 5409.95
Hot metal temperature /°C 1586.62 1583.51 1580.95 1584.75
3.2 Simulation Results and Discussions 3.2.1 Variations of In-furnace state Figure 3 shows the variations of solid temperature distributions with coke oven gas injection. The calculation results reveal that isotherms are gradually shifted downward with increasing coke oven gas injection, and the region between 1200°C and 1400°C isotherms becomes narrower. The location of cohesive zone also tends to descend with the increase in coke oven gas injection. which are attributed to the strongly combustion of carbon in the raceway, which provides more space for the
ISSN 2176-3135
996

decline of solid burdens and accelerates solid burdens charging rate. With remarkable increase in solid charging rate, bigger hear requirements are necessary for heating and reduction of solid burdens in shaft.
0 2 4 60
5
10
15
20
25200
400
600800
10001200
1400
1600
2000 2200
1800
0 2 4 60
5
10
15
20
25H
eig
ht
[m]
200400600
8001000
1200
1400
1600
1800
2000 2200
0 2 4 60
5
10
15
20
25200
400
600800
10001200
1400
1600
2000 2200
1800
0 2 4 60
5
10
15
20
25200400
600800
10001200
14001600
1800
2000 2200
0 2 4 60
5
10
15
20
25200400
6008
001000
1200
1400
1600
1800
2000 2200
(a) Base (b) COI3.96 (c) COI7.93 (d) COI11.89 Figure 3. Distribution of In-furnace solid temperature (°C).
0 2 4 60
5
10
15
20
25
He
igh
t[m
]
3
23
4
5
43
2
0 2 4 60
5
10
15
20
25 7
65
6
7
89
98
7
0 2 4 60
5
10
15
20
25
109
87
8
1012
14
14
12
14
12
0 2 4 60
5
10
15
20
2514
1210
1210
14
18
1618
(a) Base (b) COI3.96 (c) COI7.93 (d)COI11.89
Figure 4. In-furnace distribution of hydrogen concentration (mol %). Figure 4 shows the distributions of H2 concentration for four evaluation cases. H2 concentration increases significantly with COG injection. It is mainly due to the fact that COG contains large amounts of H2, CH4 and other hydrocarbons, and the decomposition of these substances can produce hydrogen. Figure 5 shows the effects of COG injection on reaction rate of H2 reducing wustite, mainly due to increase of H2 concentration, the wustite reduction by H2 tends to carry out faster with the increase of COG injection.
ISSN 2176-3135
997

0 2 4 60
5
10
15
20
25
He
igh
t[m
]
0.0002
0.0001
0.0000
0.00020.00010.0000 0.0003
0 2 4 60
5
10
15
20
25
0.0001 0.0000
0.0003
0.0003
0.0005
0.0001
0.0000
0 2 4 60
5
10
15
20
25
0.00000.0001
0.00030.0005
0.0007
0.0008
0.0000
0.00010.0003
0.0005
0 2 4 60
5
10
15
20
25
0.0010
0.0005
0.0003
0.0001
0.0007
0.0005
0.0000
0.0000
0.0001
0.0003
(a) Base (b) COI3.96 (c) COI7.93 (d)COI11.89
Figure 5. The effects of COG injection on wustite reaction rate by H2 (kmol/m3.s).
0 2 4 60
5
10
15
20
25
He
igh
t[m
]
0.1
0.20.3
0.40.5
0.6
0.70.80.9
0.99
0 2 4 60
5
10
15
20
25
0.1
0.20.3
0.40.5
0.90.8 0.7
0.6
0.99
0 2 4 60
5
10
15
20
25
0.10.2
0.30.4
0.50.6
0.8
0.70.90.99
0 2 4 60
5
10
15
20
25
0.1
0.20.3
0.40.5
0.60.70.9
0.99
0.8
(a) Base (b) COI3.96 (c) COI7.93 (d)COI11.89 Figure 6. Distribution of reduction degree of iron bearing burdens (-).
Figure 6 describes the distribution of reduction degree of iron bearing burdens along furnace height. With the increase of COG injection, the reducing atmosphere in-furnace is strengthened, and the reducing rate of iron bearing burdens is accelerated. In Base case, the reduction degree of iron bearing burdens is about 75% before reaching the cohesive zone. And the reduction degree is more than 90%, nearly 99% of the partial area for COI11.89 case. 3.2.2 Variations of operational parameters The above phenomena can be explained as follows. As listed in Table 7, with increase in COG injection, the involvement ratios of H2 in the reductions of magnetite and wustite are evidently increased. Thus, the overall reaction of iron bearing burdens is accelerated and more efficient reduction is achieved before melting, which is remarkable in the case with high rate of COG injection.
ISSN 2176-3135
998

Table 7. Ratios of hydrogen reduction to the entire indirect reduction
Cases Hydrogen reduction/%
Fe2O3→Fe3O4 Fe3O4→FeO FeO→Fe
Base(0.00 kg/tHM) 1.0 23.0 47.6
COI3.96(24.72 kg/tHM) 2.5 39.2 60.3
COI7.93(46.20 kg/tHM) 4.5 51.2 66.6
COI11.89(63.94 kg/tHM) 7.3 60.8 70.7
Figure 7 shows the effect of COG injection on productivity. The productivity shows obvious increase with increasing on COG injection. In case COI11.89, hot metal productivity is improved by 26.36%. The simulation show that the increase in COG injection contributes to the improvement of productivity.
5200
5600
6000
6400
6800
COI11.89COI7.93COI3.96
Pig
iro
n p
rod
uc
tio
n/(
t/d)
Base
+8.88%
+16.64%
+26.36%
Figure 7. Effects of COG injection on pig iron production.
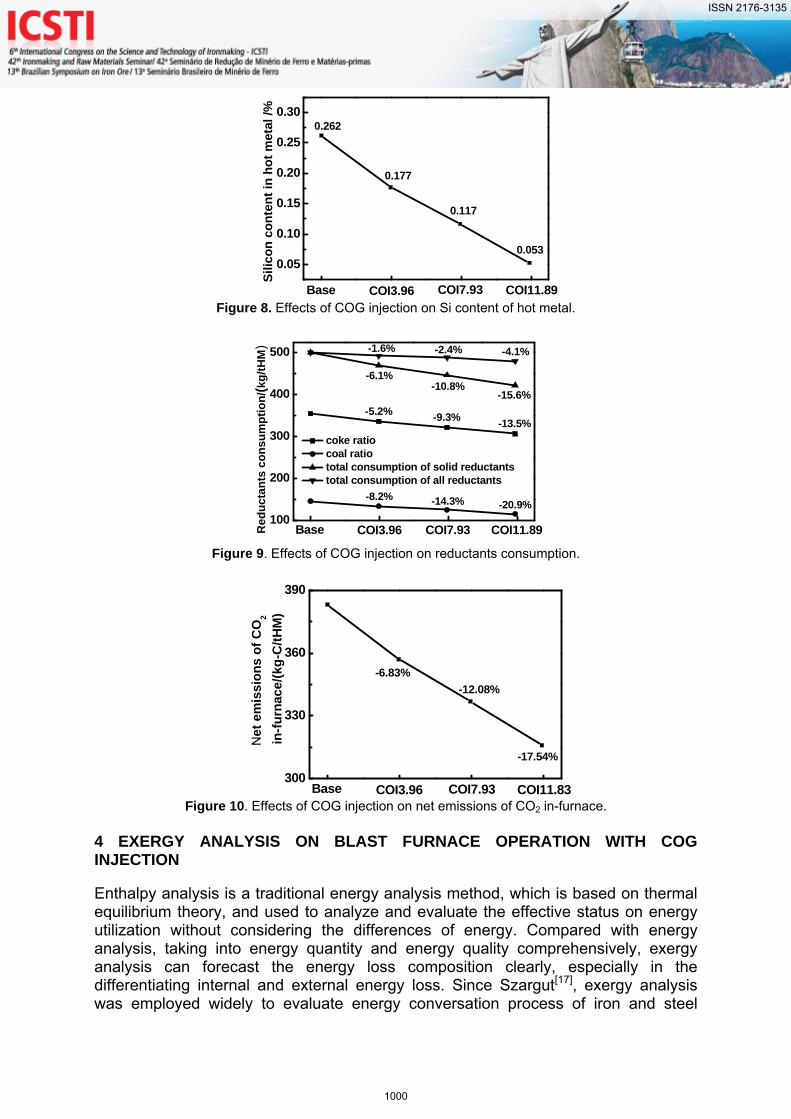
Figure 8 shows the effect of COG injection on Si content in hot metal. The Si content in hot metal decrease from 0.262% of Base case to 0.053% of COI11.89 case, which is beneficial to decrease coke consumption and steelmaking cost. Figure 9 shows the effect of COG injection on reducing agent consumption including coke, pulverized coal, solid reductants and total reducing agent. Corresponding to COG injection increasing from base case to COI11.89 case, coke rate decreases by 47.8 kg/tHM (13.5%), pulverized coal rate decreases by 30.4kg/tHM (20.9%), solid reductants consumption decreases by 78.2 kg/tHM (15.6%) and all reductant consumption decreases by 20.6 kg/tHM (4.1%). Figure 10 shows the effect of COG injection on Net emissions of carbon dioxide. Comparing with Base case, net emission of CO2 decreases by 6.83%, 12.08% and 17.54% respectively for the other three cases. The reason for the decrease is that the main components of COG are hydrogen, methane and other hydrocarbons, which generate H2. More H2 participate in indirect reduction, and the reducing product is H2O.
ISSN 2176-3135
999
0.05
0.10
0.15
0.20
0.25
0.30
0.053
0.117
0.177
COI3.96 COI7.93 COI11.89
Sil
ico
n c
on
ten
t in
ho
t m
eta
l /%
Base
0.262
Figure 8. Effects of COG injection on Si content of hot metal.
100
200
300
400
500
Red
uct
ants
co
nsu
mp
tio
n/(
kg/t
HM
)
coke ratio coal ratio total consumption of solid reductants total consumption of all reductants
-5.2% -9.3%-13.5%
-6.1%-10.8%
-15.6%
-8.2% -14.3% -20.9%
-1.6% -2.4% -4.1%
Base COI3.96 COI7.93 COI11.89
Figure 9. Effects of COG injection on reductants consumption.
300
330
360
390
Net
em
issi
on
s o
f C
O2
in-f
urn
ace/
(kg
-C/t
HM
)
-6.83%
-12.08%
-17.54%
Base COI3.96 COI7.93 COI11.83 Figure 10. Effects of COG injection on net emissions of CO2 in-furnace.
4 EXERGY ANALYSIS ON BLAST FURNACE OPERATION WITH COG INJECTION Enthalpy analysis is a traditional energy analysis method, which is based on thermal equilibrium theory, and used to analyze and evaluate the effective status on energy utilization without considering the differences of energy. Compared with energy analysis, taking into energy quantity and energy quality comprehensively, exergy analysis can forecast the energy loss composition clearly, especially in the differentiating internal and external energy loss. Since Szargut[17], exergy analysis was employed widely to evaluate energy conversation process of iron and steel
ISSN 2176-3135
1000

making system[18-21]. The energy loss source of blast furnace operation with COG injection was indicated using exergy analysis method. Based on this, the energy saving effect was evaluated. To a determined system, exergy can be divided into physical and chemical component. Based on national standards of China[22], the exergy items of blast furnace operation with COG injection for consideration and exergy equilibrium are shown in Figure 10.
Input exergy Ouput exergy
Iron bearing burdens chemical exergy
Coke chemical exergy
Pulverized coalchemical exergy
Hot blast physical exergy
Hot blast chemical exergy
COG physical exergy
COG chemical exergy
Hot metal physical exergy
Hot metal chemical exergy
Hot slag physical exergy
Hot slag chemical exergy
Top gas physical exergy
Top gas chemical exergy
Steam physical exergy
Steam chemical exergy
Cooling water physical exergy
Furnace wall exergy loss
Hot blast bustle pipe exergy loss
Heat transfer exergy loss
Internal exergy loss
Input exergy Ouput exergy
Iron bearing burdens chemical exergy
Coke chemical exergy
Pulverized coalchemical exergy
Hot blast physical exergy
Hot blast chemical exergy
COG physical exergy
COG chemical exergy
Iron bearing burdens chemical exergy
Coke chemical exergy
Pulverized coalchemical exergy
Hot blast physical exergy
Hot blast chemical exergy
COG physical exergy
COG chemical exergy
Hot metal physical exergy
Hot metal chemical exergy
Hot slag physical exergy
Hot slag chemical exergy
Top gas physical exergy
Top gas chemical exergy
Steam physical exergy
Steam chemical exergy
Cooling water physical exergy
Furnace wall exergy loss
Hot blast bustle pipe exergy loss
Heat transfer exergy loss
Internal exergy loss
Hot metal physical exergy
Hot metal chemical exergy
Hot slag physical exergy
Hot slag chemical exergy
Top gas physical exergy
Top gas chemical exergy
Steam physical exergy
Steam chemical exergy
Cooling water physical exergy
Furnace wall exergy loss
Hot blast bustle pipe exergy loss
Heat transfer exergy loss
Internal exergy loss Figure 10. Exergy analysis model diagram of blast furnace.
According to the simulation conditions and results from raceway mathematical model and multi-fluid blast furnace model, exergy analysis model is used to compute exergy analysis data and exergy evaluation indices of blast furnace operation with COG injection rate of 0, 3.96, 7.93 and 11.89 Nm3/s respectively, and the calculation results are listed in table 8. As listed in table 8, with increase in COG injection, the changing trends of input exergy and output exergy of blast furnace are as follows. (1) Due to the decrease in temperature level in-furnace and the reduction of top gas volume, the amount of top gas physical exergy, exergy loss through furnace wall, physical exergy brought by cooling water and hot blast bustle pipe exergy loss all tend to decrease. (2) The physical exergy and chemical exergy of hot metal and hot slag are relatively stable in four operations. (3) The exergy losses in-blast furnace caused by irreversible reactions and heat transfer are significantly decreased. (4) The chemical exergy of top gas tends to increase because of the increase in hydrogen content. Therefore blast furnace operation with top gas recycling should be taken into account in the further research.
ISSN 2176-3135
1001

Table 8. Exergy balance under blast furnace operation with COG injection (Unit: MJ/tHM)
Items Base COI3.96 COI7.93 COI11.89
Input
Iron-bearing burdens chemical exergy 309.57 310.77 311.58 312.28
Coke chemical exergy 10215.21 9678.94 9260.87 8837.04
Pulverized coal chemical exergy 4648.88 4269.19 3985.21 3678.90
Hot blast physical exergy 1262.69 1072.12 890.91 733.85
Hot blast chemical exergy 4.27 4.93 6.43 8.99
COG physical exergy 0.00 6.46 11.93 16.52
COG chemical exergy 0.00 968.37 1807.96 2503.57
Total 16440.62 16310.78 16274.89 16091.15
Output
Hot metal physical exergy 965.90 963.70 961.88 964.53
Hot metal chemical exergy 7956.42 7937.77 7923.68 7907.54
Hot slag physical exergy 360.30 362.58 364.79 371.32
Hot slag chemical exergy 281.83 282.34 280.45 282.82
Top gas physical exergy 324.59 261.61 218.82 181.41
Top gas chemical exergy 4600.67 4759.83 4905.84 4967.52
Steam physical exergy 7.21 8.72 9.26 8.87
Steam chemical exergy 13.08 18.19 21.33 22.60
Cooling water physical exergy 2.41 2.09 1.85 1.53
Blast furnace wall exergy loss 7.86 6.81 6.02 4.97
Hot blast bustle pipe exergy loss 84.76 72.33 60.45 50.15
Heat transfer exergy loss 228.75 198.25 175.37 144.87
Internal exergy loss 1606.84 1436.56 1345.15 1183.02
Total 16440.62 16310.78 16274.89 16091.15
For the convenience of comparison, exergy evaluation indices on four cases are computed by exergy analysis model respectively to evaluate exergy use efficiency. This study takes hot metal exergy as objective exergy to give a comprehensive comparison and analysis among the four cases, and the calculation results are listed in Table 9. As listed in Table 9, with the increase in COG injection, the changing trends of exergy evaluation indices of blast furnace are as follows. (1) Internal exergy loss and total exergy loss all tend to decrease significantly mainly due to the enhancement of oxygen enrichment, which reduces exergy loss of irreversible processes caused by incomplete combustion. Compared with Base case, internal exergy loss and total exergy loss decrease by 26.38% and 39.80% respectively corresponding to COI11.89 operation. (2) Internal exergy loss rate tends to decrease, and external exergy loss rate tends to increase. Therefore the injection of COG is more effective in reducing internal exergy loss than external exergy loss, which can acquire the same results from internal exergy loss coefficient and external exergy loss coefficient. (3) Due to the decrease of irreversible exergy loss in-furnace, the thermodynamic perfection degree and exergy efficiency,compared with no COG injection, increase
ISSN 2176-3135
1002

from 90.23% to 92.65%, from 53.39% to 54.25%, respectively, which enhance the utilization quality of energy. Table 9. Exergy valuation under blast furnace operation with COG injection
Items Base COI3.96 COI7.93 COI11.89
Internal exergy loss /(MJ/tHM) 1606.84 1436.56 1345.15 1183.02
External exergy loss /(MJ/tHM) 5911.46 5972.75 6044.18 6036.06
Total exergy loss /(MJ/tHM) 7518.30 7409.31 7389.33 7219.08
Thermodynamic perfection degree /% 90.23 91.19 91.73 92.65
Exergy efficiency /% 53.39 53.69 53.71 54.25
Internal exergy loss rate /% 21.37 19.39 18.20 16.39
External exergy loss rate /% 78.63 80.61 81.80 83.61
Internal exergy loss coefficient /% 9.96 8.98 8.43 7.50
External exergy loss coefficient /% 36.65 37.33 37.86 38.25
5 CONCLUSIONS In order to further reduce energy consumption and CO2 emissions, to achieve low-carbon ironmaking target, raceway mathematical model and multi-fluid blast furnace model are used to analyze the performance of blast furnace with COG injection, and exergy analysis model is used to evaluate the effective status of energy utilization. Through numerical simulation, the research results are shown as follows.
Bosh gas flow rate increases, raceway temperature falls, in order to make thermal conditions of raceway zone consistent throughout the cases examined here, this study put forward the thermal compensation measures by reducing blast flow rate and enhancing oxygen enrichment. The volume of raceway decreases after thermal compensation.
The concentrations of CO and H2 enhance tremendously in-furnace, the utilization rate of CO increases while the utilization rate of H2 decreases. The proportion of H2 increases tremendously in indirect reduction, the reducing rate of iron bearing materials accelerates. The height of cohesive zone shifts downward, the thickness of cohesive zone gets thinner, the pressure drop reduces obviously, the permeability of blast furnace gets better. The productivity of the furnace shows a remarkable increase, for 152.34 m3/tHM COG injection, improves by 26.36%. The silicon content of the hot metal decreases, and the quality of the hot metal improves, for 152.34 m3/tHM COG injection, the silicon content decreases from 0.26% to 0.05%. Coke rate, total reducing agent rate and carbon emission rate show a considerable decrease, for 152.34 m3/tHM COG injection, decreases by 13.49%, 4.12% and 17.54%, respectively.
The internal exergy loss and total exergy loss decrease in blast furnace. The thermodynamic perfection degree and exergy efficiency increase in blast furnace, compared with no COG injection, increase from 90.23% to 92.65%, from 53.39% to 54.25%, respectively. The chemical exergy of blast furnace top gas increases, compared with no COG injection, increases from 4.60 GJ/tHM to 4.97 GJ/tHM, so it is important to strengthen the chemical exergy recycling of top gas.
ISSN 2176-3135
1003

Acknowledgement The research work in this paper has been sponsored by National Natural Science Foundation of China (No. 50804008) and Program for New Century Excellent Talents in University (NCET-08-0099) and Fundamental Research Funds for the Central Universities (N110602004). REFERENCES 1 WORLD STEEL ASSOCIATION. World steel in figures 2011. p. 1-11, 2011. 2 ARIYAMA T, SATO M. Optimization of ironmaking process for reducing CO2 emission in
the integrated steel works. ISIJ International, v. 46, n. 12, p. 1736-1744, 2006. 3 CHU M. Raw, fuel and auxiliary materials in ferrous metallurgy, Beijing: Metallurgical
Industry Press, p. 12-17, 2010. 4 JUSSEU N, LU H. Injection of coke oven gas into NO.2 blast furnace of France Solmer
Plant, Energy for Metallurgical Industry, v. 7, n. 2, p. 61-62. 1988. 5 ZHANG Z, CUI S. Injection coke oven gas into blast furnace of Makaiyewo Steel, Tai
Gang Translation, n. 2, p. 7-11, 1991. 6 MADDALENA F. L. Coke oven gas injection into blast furnaces. Fuel and Energy, v. 37, n.
3, p. 211, 1996. 7 HELLBERG P, JONSSON T. L. I, JONSSON P. G. Mathematical modelling of the
injection of coke oven gas into a blast furnace tuyere , Scandinavian Journal of Metallurgy, v.34, n. 5, p. 269-275, 2005.
8 KOVALENKO P. E, CHEBOTAREV A. P, PASHINSKII V. F, et al. Improving the use of coke-oven gas in blast furnace smelting. Metallurgist, v.33, n. 9, p. 22-23, 1989.
9 CHU M, YAGI J, SHEN F. Modelling on blast furnace process and innovative ironmaking technologies. Shenyang:Northeastern University Press, P.160-162, 2006.
10 HATANO M, FUKUDA M, TAKEUCHI. An experimental study of the formation of raceway using a cold model. Tetsu-to-Hagane, v. 62, n. 1, p.25-32, 1976.
11 ZHANG L G, LIU D, ZHANG L, et al. Study on influence regularity of BF tuyere diameter and coke particle size on it. Angang Technology, n. 1, p. 7-10, 2006.
12 CHU M. Study on super high efficiency operations of blast furnace based on multi-fluid model , Japan: Tohoku University, p. 5-86, 2004.
13 CHU M, NOGAMI H, YAGI J. Recent process in blast furnace mathematical model. Metalurgia & Materiais, v. 59, n. 11, p.709-712, 2003
14 YAGI J. Mathematical modeling of the flow of four fluids in a packed bed. ISIJ Int., v. 33, n. 6, p. 619-639, 1993.
15 AUSTIN P, NOGAMI H, YAGI J. A mathematical model for blast furnace reaction analysis based on the four fluid model. ISIJ Int., v. 37, n. 8, p. 748-755, 1997.
16 AUSTIN P, NOGAMI H, YAGI J. Computational investigation of scrap charging to the blast furnace. ISIJ Int., v. 38, n. 7, p. 697-703, 1998.
17 SZARGUT J, MORRIS D R, STEWARD F R. Exergy analysis of thermal, chemical and metallurgical Process. New York: Hemisphere, 1998.
18 BISIO. Exergy method for efficient energy resource use in the steel industry. Energy, v. 18, n. 9, p. 971-985, 1993.
19 ERTEM M, SABIT G. Energy balance analysis for Erdemir blast furnace number one. Applied Thermal Engineering, v. 26, n. 11-12, p. 1139-1148, 2006.
20 RASUL M, TANTY B, MOHANTY B. Modelling and analysis of blast furnace performance for efficient utilization of energy [J], Applied Thermal Engineering, v. 27, n. 1, p. 78-88, 2007.
21 PETELA R, HUTNY J, PRICE T. Energy and exergy consumption and CO2 emissions in an ironmaking process. Advances in Environmental Research, v. 6, n. 2, p. 157-170, 2002.
22 CHINA GB/T 14909-2005, Technical guides for exergy analysis in energy system.
ISSN 2176-3135
1004