Experimental and Analytical Investigation of Blast ...
346
ISSN 1520-295X Experimental and Analytical Investigation of Blast Performance of Seismically Resistant Bridge Piers by Shuichi Fujikura and Michel Bruneau Technical Report MCEER-08-0028 December 8, 2008 This research was conducted at the University at Buffalo, State University of New York and was supported by the Federal Highway Administration under contract number DTFH61-98-C-00094.
-
Upload
khangminh22 -
Category
Documents
-
view
0 -
download
0
Transcript of Experimental and Analytical Investigation of Blast ...

ISSN 1520-295X
Experimental and Analytical Investigation of Blast Performance of Seismically
Resistant Bridge Piers
by Shuichi Fujikura and Michel Bruneau
Technical Report MCEER-08-0028
December 8, 2008
This research was conducted at the University at Buffalo, State University of New York and was supported by theFederal Highway Administration under contract number DTFH61-98-C-00094.

NOTICEThis report was prepared by the University at Buffalo, State University of New York as a result of research sponsored by MCEER through a contract from the Federal Highway Administration. Neither MCEER, associates of MCEER, its sponsors, the University at Buffalo, State University of New York, nor any person acting on their behalf:
a. makes any warranty, express or implied, with respect to the use of any information, apparatus, method, or process disclosed in this report or that such use may not infringe upon privately owned rights; or
b. assumes any liabilities of whatsoever kind with respect to the use of, or the damage resulting from the use of, any information, apparatus, method, or process disclosed in this report.
Any opinions, findings, and conclusions or recommendations expressed in this publication are those of the author(s) and do not necessarily reflect the views of MCEER or the Federal Highway Administration.

Experimental and Analytical Investigation of Blast Performance ofSeismically Resistant Bridge Piers
by
Shuichi Fujikura1 and Michel Bruneau2
Publication Date: December 8, 2008 Submittal Date: November 12, 2008
Technical Report MCEER-08-0028
Task Number 094-EXT-1C
FHWA Contract Number DTFH61-98-C-00094
1 Graduate Student, Department of Civil, Structural and Environmental Engineering, University at Buffalo, State University of New York
2 Professor, Department of Civil, Structural and Environmental Engineering, Univer-sity at Buffalo, State University of New York
MCEERUniversity at Buffalo, State University of New YorkRed Jacket Quadrangle, Buffalo, NY 14261Phone: (716) 645-3391; Fax (716) 645-3399E-mail: [email protected]; WWW Site: http://mceer.buffalo.edu


Preface
The Multidisciplinary Center for Earthquake Engineering Research (MCEER) is a na-tional center of excellence in advanced technology applications that is dedicated to the reduction of earthquake losses nationwide. Headquartered at the University at Buffalo, State University of New York, the Center was originally established by the National Sci-ence Foundation in 1986, as the National Center for Earthquake Engineering Research (NCEER).
Comprising a consortium of researchers from numerous disciplines and institutions throughout the United States, the Center’s mission is to reduce earthquake losses through research and the application of advanced technologies that improve engineer-ing, pre-earthquake planning and post-earthquake recovery strategies. Toward this end, the Center coordinates a nationwide program of multidisciplinary team research, education and outreach activities.
MCEER’s research is conducted under the sponsorship of two major federal agencies, the National Science Foundation (NSF) and the Federal Highway Administration (FHWA), and the State of New York. Signifi cant support is also derived from the Federal Emer-gency Management Agency (FEMA), other state governments, academic institutions, foreign governments and private industry.
The Center’s Highway Project develops improved seismic design, evaluation, and retrofi t methodologies and strategies for new and existing bridges and other highway structures, and for assessing the seismic performance of highway systems. The FHWA has sponsored three major contracts with MCEER under the Highway Project, two of which were initiated in 1992 and the third in 1998.
Of the two 1992 studies, one performed a series of tasks intended to improve seismic design practices for new highway bridges, tunnels, and retaining structures (MCEER Project 112). The other study focused on methodologies and approaches for assessing and improving the seismic performance of existing “typical” highway bridges and other highway system components including tunnels, retaining structures, slopes, culverts, and pavements (MCEER Project 106). These studies were conducted to:
• assess the seismic vulnerability of highway systems, structures, and components;• develop concepts for retrofi tting vulnerable highway structures and components;• develop improved design and analysis methodologies for bridges, tunnels, and retain-
ing structures, which include consideration of soil-structure interaction mechanisms and their infl uence on structural response; and
• develop, update, and recommend improved seismic design and performance criteria for new highway systems and structures.
iii

iv
The 1998 study, “Seismic Vulnerability of the Highway System” (FHWA Contract DTFH61-98-C-00094; known as MCEER Project 094), was initiated with the objective of performing studies to improve the seismic performance of bridge types not covered under Projects 106 or 112, and to provide extensions to system performance assessments for highway systems. Specifi c subjects covered under Project 094 include:
• development of formal loss estimation technologies and methodologies for highway systems;
• analysis, design, detailing, and retrofi tting technologies for special bridges, in-cluding those with fl exible superstructures (e.g., trusses), those supported by steel tower substructures, and cable-supported bridges (e.g., suspension and cable-stayed bridges);
• seismic response modifi cation device technologies (e.g., hysteretic dampers, isola-tion bearings); and
• soil behavior, foundation behavior, and ground motion studies for large bridges.
In addition, Project 094 includes a series of special studies, addressing topics that range from non-destructive assessment of retrofi tted bridge components to supporting studies intended to assist in educating the bridge engineering profession on the implementation of new seismic design and retrofi tting strategies.
This report focuses on the protection of highway bridges against earthquake and blast hazards. The results of a previously developed and experimentally validated multi-hazard bridge pier concept consisting of a multi-column pier bent with Concrete-Filled Steel Tube (CFST) columns are briefl y presented (see MCEER-07-0005). The performance of the CFST columns is compared to the blast resistance of ductile reinforced concrete (RC) columns and non-ductile RC columns retrofi tted with steel jackets, detailed in accordance to current seismic design codes and practices. This report describes the details of the design process and the experimental observations of the prototype bridge pier bent constructed using conventional and retrofi tted seismic resistant RC columns. The results from blast experiments are compared with results obtained using simplifi ed analysis methods. Nonlinear dynamic response history analyses are performed to simulate and better understand the behavior of CFST columns under blast loading. The tests on conventional and steel jacket retrofi tted seismic resistant RC columns demonstrated the non-ductile behavior of the RC columns under blast loading and that the columns failed in direct shear at their base. Based on experimental and analytical observations, shape factors for the blast pressures acting on circular columns are established.

v
ABSTRACT
The issue of protecting infrastructure against multiple extreme events is gaining popularity in the
field of civil engineering. This research focuses on the protection of highway bridges against
two hazards, namely earthquakes and blasts. A similarity between seismic and blast events in
relation to bridges is that they can both induce large inelastic deformations in key structural
components. Since many bridges are (or will be) located in areas of moderate to high seismic
activity, and because any bridge can be a potential target for terrorists, there is a need to develop
structural systems capable of performing equally well under both events.
The authors previously presented the development and experimental validation of a multi-hazard
bridge pier concept, and proposed a multi-column pier bent with concrete-filled steel tube
(CFST) columns for this purpose (Fujikura et al. 2007, 2008). To compare with this first series
of blast tests of CFST columns, this research investigates the blast resistance of commonly used
bridge columns, namely seismically ductile reinforced concrete (RC) columns and non-ductile
RC columns retrofitted with steel jackets to make them ductile, detailed in accordance to recent
code of practice.
This report describes the design of the prototype bridge pier bent with these seismically resistant
conventional columns under blast and seismic loading and the corresponding specimen design,
experimental set-up, and experimental results. The results from the blast experiments are
compared with the results from a simplified method of analysis considering an equivalent SDOF
system having an elastic-perfectly-plastic behavior. Additionally, single degree of freedom
(SDOF) and 2D nonlinear dynamic response-history analyses were used to simulate the behavior
of CFST columns in the first series of the tests subjected to blast loading and to better understand
their ultimate behavior.
The tested standard ductile RC and non-ductile RC columns retrofitted with steel jackets were
not found to exhibit a ductile behavior under blast loading, but rather failed in shear at their base.
Based on experimental and analytical observations, different values of shape a factor β that
accounts for the reduction of the blast pressures acting on a circular column were established, as
applicable for the different analytical methods considered.


vii
ACKNOWLEDGMENTS
The authors thank James C. Ray at the Engineer Research and Development Center in the Army
Corps of Engineers for his help and assistance in the logistics of the experiments. Also
acknowledged are the contributions of the staff of the Structural Engineering and Earthquake
Simulation Laboratory at the University of Buffalo, Christopher Budden, Duane Kozlowski, Lou
Moretta, Mark Pitman and Scot Weinreber for their assistance.
This research was conducted at the University at Buffalo (The State University of New York)
and was supported by the Federal Highway Administration under contract number DTFH61-98-
C-00094 to the Multidisciplinary Center for Earthquake Engineering Research. However, any
opinions, findings, conclusions, and recommendations presented in this paper are those of the
authors and do not necessarily reflect the views of the sponsors.


ix
SECTION TITLE PAGE
1: INTRODUCTION ........................................................................................................................................ 1
1.1 Motivation 1
1.2 Scope of Research 3
1.3 Organization of This Report 4
2: LITERATURE REVIEW .......................................................................................................................... 7
2.1 General 7
2.2 Seismic Design of Reinforced Concrete Column in Plastic Hinge 8
2.2.1 American Concrete Institute (ACI) 8
2.2.2 American Association State Highway and Transportation Officials (AASHTO) 9
2.2.3 California Department of Transportation (CALTRANS) 9
2.2.4 MCEER/ATC-49 10
2.3 Seismic Retrofit of Reinforced Concrete Column with Steel Jacket 11
2.3.1 Retrofit Measures for Reinforced Concrete Columns 11
2.3.2 Steel Jacketing 12
2.3.3 Research by Chai et al. (1991) 13
2.3.4 Research by Priestley et al. (1994a, 1994b) 14
2.4 Behavior of Reinforced Concrete subjected to Blast Load 16
2.4.1 Ductile Response 17
2.4.2 Brittle Response 19
2.4.3 Breaching and Spalling Resistance of Reinforced Concrete Element 21
2.5 Direct Shear Failure 22
2.5.1 General 22
2.5.2 Ultimate Capacity of Direct Shear under Static Loads 25
2.5.3 Ultimate Capacity of Direct Shear under Dynamic Loads 27
2.6 Structural Analysis Options under Blast Loading 29
TABLE OF CONTENTS

x
SECTION TITLE PAGE
2.6.1 Consideration of Blast Pressure 30
2.6.2 Interaction between Structure and Blast Loading 30
2.6.3 Discretization of Structure 31
2.6.4 Material and Geometric Nonlinearity 31
3: BLAST PERFORMANCE OF SEISMICALLY RESISTANT REINFORCED
CONCRETE AND STEEL JACKETED BRIDGE PIERS ....................... 33
3.1 Introduction 33
3.2 Experimental Design and Setup 34
3.2.1 General 34
3.2.2 Assumed Blast Scenario 35
3.2.3 Seismic Analysis and Design of Prototype Bridge Pier Bent 37
3.2.3.1 Prototype Bridge Structure 37
3.2.3.2 Analysis of Reinforced Concrete Section 37
3.2.3.3 Seismic Loading 42
3.2.3.4 Analysis of Bent Column for Seismic Loading 43
3.2.3.5 Design of Column Transverse Steel Reinforcement 45
3.2.3.6 Design Footing and Cap-beam 48
3.2.3.7 Design of Steel Jacketed Non-ductile RC Column 50
3.2.4 One-Fourth Scale Model Design 51
3.2.5 Specimen Materials 52
3.2.5.1 Concrete Properties 52
3.2.5.2 Reinforcing Steel and Steel Jacket Properties 53
3.2.6 Model Fabrication 58
3.2.7 Test Setup 62
3.3 Experimental Cases and Observations 66
3.3.1 General 66
3.3.2 Explosive Charge 66
3.3.3 Experimental Cases 66
TABLE OF CONTENTS (CONT’D)

xi
SECTION TITLE PAGE
3.3.4 Experimental Observations 69
3.3.4.1 Test 1 for Column RC1 69
3.3.4.2 Test 2 for Column RC2 70
3.3.4.3 Test 3 for Column SJ2 71
3.3.4.4 Test 4 for Column SJ1 72
3.3.5 Summary 73
3.4 Analytical Study 74
3.4.1 General 74
3.4.2 Moment-Curvature Analysis 74
3.4.3 Simple Plastic Analysis 76
3.4.4 Simplified Blast Analysis by Equivalent SDOF System 77
3.4.5 Direct Shear Resistance of Test Column 80
3.4.6 Breaching and Spalling Resistance 82
4: DYNAMIC ANALYSIS OF BRIDGE PIER SUBJECTED TO BLAST
LOADING .................................................................................................................... 107
4.1 Introduction 107
4.2 Summary of Bridge Pier Tests Subjected to Blast Loading 108
4.3 Selection of Analytical Methods 112
4.4 SDOF Dynamic Analysis 113
4.4.1 General 113
4.4.1 Program for SDOF Dynamic Analysis 114
4.4.2 Analytical Model 115
4.4.3 Applied Blast Loading 118
4.4.4 Methods for Solving Equation of Motion 119
4.4.5 Analytical Results 119
4.4.5.1 Effect of Damping and Load-mass Factor 119
4.4.5.2 Shape Factor β 122
4.4.5.3 Structural Response 124
TABLE OF CONTENTS (CONT’D)

xii
SECTION TITLE PAGE
4.5 Fiber-based Analytical Model 131
4.5.1 General 131
4.5.2 Analytical Model and Solution Algorithm 132
4.5.3 Material Constitutive Models 134
4.5.3.1 Constitutive Model for Steel 135
4.5.3.2 Constitutive Model for Concrete 137
4.5.3.3 Tension Stiffening Model for Steel Bars 137
4.5.3.4 Strain Penetration Model for Steel Bars 138
4.5.4 Model Verification with Quasi-Static Tests 145
4.5.4.1 Overview of Experimental Studies 145
4.5.4.2 Analytical Model for Cyclic Loading Test Columns 147
4.5.4.3 Analytical Results and Comparison with Experimental Results 149
4.6 Fiber-based Dynamic Analysis 155
4.6.1 General 155
4.6.2 Analytical Model for Blast Loading Test Columns 157
4.6.3 Moment-Curvature Analysis for CFST Columns 159
4.6.4 Modal Analysis for CFST Columns 159
4.6.5 Applied Blast Loadings 163
4.6.6 Analytical Results 172
4.6.6.1 Shape Factor β 172
4.6.6.2 Structural Response of CFST Columns 174
4.6.6.3 Structural Response of RC and Steel Jacketed RC Columns 185
4.7 Summary of Dynamic Analysis under Blast Loading 187
5: SUMMARY, CONCLUSIONS, AND RECOMMENDATIONS FOR FURTHER
RESEARCH ................................................................................................................ 191
5.1 Summary 191
5.2 Conclusions 192
5.3 Recommendations for Further Research 193
TABLE OF CONTENTS (CONT’D)

xiii
SECTION TITLE PAGE
6: REFERENCES 195
APPENDIX A: SECTION AND MATERIAL MODELS OF PROTOTYPE
COLUMN FROM XTRACT 203
APPENDIX B: SEISMIC ANALYSIS AND DESIGN OF PROTOTYPE BRIDGE
BENT COLUMN 209
APPENDIX C: DESIGN OF FOOTING AND CAP BEAM OF PROTOTYPE
BRIDGE BENT 227
APPENDIX D: DESIGN OF STEEL JACKETED RC COLUMN OF
PROTOTYPE BRIDGE 239
APPENDIX E: SHOP DRAWINGS OF PIER BENT SPECIMEN 245
APPENDIX F: MODELS AND RESULTS OF MOMENT-CURVATURE
ANALYSIS OF TEST COLUMNS FROM XTRACT 255
APPENDIX G: SIMPLE PLASTIC ANALYSIS OF TEST COLUMNS 267
APPENDIX H: SIMPLIFIED BLAST ANALYSES OF RC COLUMN TESTS 277
APPENDIX I: CYLCIC ANALYSIS TEST SETUP AND HYSTERESIS LOOPS
FOR FIBER-BASED MODEL VERIFICATION 283
TABLE OF CONTENTS (CONT’D)


xv
2-1 Typical Steel Shell Retrofit (Buckle et al. 2006) 12
2-2 Test Setup and Column Details (Chai et al. 1991) 14
2-3 Test Setup and Reinforcement Details (Priestley et al. 1994a, 1994b) 15
2-4 Element Stirrup Reinforcement (USDA 1990) 17
2-5 Typical Laced Wall (USDA 1990) 18
2-6 Typical Resistance-deflection Curve for Concrete Element (adapted from USDA 1990) 19
2-7 Disengagement of Concrete Element Surface (USDA 1990) 20
2-8 Failure of Concrete Element under Blast Loading (USDA 1990) 21
2-9 Design Criteria for Breaching and Direct Spalling (UFC 2004) 22
2-10 Global and Local Roughness (adapted from Ali and White 1990) 24
2-11 Shear Friction Model (adapted from MacGregor and Wight 2005) 24
2-12 Shear Transfer Test Specimen (adapted from MacGregor and Wight 2005) 25
2-13 Comparison of Shear-friction Models with Test Data 27
2-14 Details of Test Specimens and Test Set-up (Hansen et al. 1961) 28
2-15 Details of Test Specimen (Chung 1978) 29
2-16 Discretization of Structure (Priestley et al. 1996) 32
3-1 Schematics of prototype bridge and assumed blast scenario 35
3-2 Blast Damage Threshold (FEMA 2003) 36
3-3 Elevation Details of Prototype Bridge Pier-bent 38
3-4 Reinforcement Details of Prototype Bridge Pier-bent 39
3-5 Stress-strain Model for Unconfined and Confined Concrete (Priestley et al. 1996) 41
3-6 Stress-strain Model for Section Analysis 41
3-7 Axial Force - Moment Interaction Curve for Prototype Bridge Column 42
3-8 Pseudo-acceleration Response Spectrum for Seismic Analysis and Design 43
3-9 General Layout of Experimental Specimen 51
3-10 Vacuum Furnace for Annealing 55
3-11 Stress-Strain Curve for D-1 55
3-12 Stress-Strain Curve for D-2 56
3-13 Stress-Strain Curve for D-3 56
LIST OF FIGURES FIGURE TITLE PAGE

xvi
3-14 Stress-Strain Curve for D-4 57
3-15 Stress-Strain Curve for Steel Jacket 57
3-16 Reinforcement Details of Bent Pier Model 59
3-17 Reinforcement Details of Column Section 59
3-18 Reinforcement Details of Footing and Column 60
3-19 Reinforcement Details of Column – Footing Connection 60
3-20 Reinforcement Details of Column – Cap-beam Connection 61
3-21 Formwork for Column 61
3-22 Shipping Frame for Model 62
3-23 Test Setup and Reaction Frame Details 63
3-24 Test Setup from Front Diagonal View 64
3-25 Test Setup from Side View 64
3-26 Test Setup from Back Diagonal View 65
3-27 Reaction Frame 65
3-28 Explosive Charge Location 68
3-29 Sketch of Column RC1 after Test 1 84
3-30 Left Side View of Column RC1 (Test 1) 84
3-31 Front View of Column RC1 (Test 1) 84
3-32 Column RC1 at Bottom (Test 1) 85
3-33 Fracture Surface of Footing at Column RC1 (Test 1) 85
3-34 Fracture of Longitudinal Steel Bars at Footing (Test 1) 85
3-35 Right Side View of Column RC1 at Bottom (Test 1) 85
3-36 Left Side View of Column RC1 at Bottom (Test 1) 86
3-37 Front Diagonal View of Column RC1 around Charge Height 86
3-38 Left Side View of Column RC1 at Top (Test 1) 86
3-39 Right Side View of Column RC1 at Top (Test 1) 86
3-40 Front View of Column RC1 at Top (Test 1) 87
3-41 Fracture interface of Column RC1 at Top (Test 1) 87
3-42 Back Diagonal View of Column RC1 at Top (Test 1) 87
3-43 Sketch of Column RC2 after Test 2 88
LIST OF FIGURES (Continued) FIGURE TITLE PAGE

xvii
3-44 Front Diagonal View of Column RC2 (Test 2) 88
3-45 Back Diagonal View of Column RC2 (Test 2) 88
3-46 Front View of Column RC2 (Test 2) 89
3-47 Front Diagonal View of Column RC2 at Bottom (Test 2) 89
3-48 Right Side View of Column RC2 at Bottom (Test 2) 89
3-49 Left Side View of Column RC2 at Bottom after Cover Concrete Removal (Test 2) 89
3-50 Right Side View of Column RC2 at Bottom after Cover Concrete Removal (Test 2) 90
3-51 Right Diagonal Front View Column RC2 at Top (Test 2) 90
3-52 Left Diagonal Front View of Column RC2 at Top (Test 2) 90
3-53 Back View of Column RC2 at Top (Test 2) 90
3-54 Sketch of Column SJ2 after Test 3 91
3-55 Right Side View of Column SJ2 (Test 3) 91
3-56 Void at Column SJ2 after Test 3 91
3-57 Drift of Column SJ2 at Bottom (Test 3) 92
3-58 Front Diagonal View of Column SJ2 at Bottom (Test 3) 92
3-59 Fractures of Longitudinal Bars Column SJ2 at Bottom (Diagonally Front View, Test 3) 92
3-60 Back Diagonal View of Column SJ2 at Bottom (Test 3) 92
3-61 Close-in Back View of Column SJ2 at Bottom (Test 3) 93
3-62 Front View of Column SJ2 at Top (Test 3) 93
3-63 Left Side View of Column SJ2 at Top (Test 3) 93
3-64 Back View of Column SJ2 at Top (Test 3) 93
3-65 Cracks at Cap Beam of Column SJ2 (Test 3) 94
3-66 Sketch of Column SJ1 after Test 4 94
3-67 Left Side View of Column SJ1 (Test 4) 95
3-68 Drift of Column SJ1 at Bottom (Test 4) 95
3-69 Fracture of Longitudinal Steel Bars at Footing (Front Diagonal View, Test 4) 95
3-70 Cracking of Steel Tube at Bottom of Column SJ1 at Bottom (Front Diagonal View, Test 4) 95
3-71 Back Diagonal View of Column SJ1 at Bottom (Test 4) 96
LIST OF FIGURES (Continued) FIGURE TITLE PAGE

xviii
3-72 Back Diagonal View of Column SJ1 at Bottom (Test 4) 96
3-73 Front View of Column SJ1 at Top (Test 4) 96
3-74 Back View of Column SJ1 at Top (Test 4) 96
3-75 Moment-Curvature Relationship for RC column 97
3-76 Moment-Curvature Relationship for Steel Jacketed RC column at Middle Section 97
3-77 Moment-Curvature Relationship for Steel Jacketed RC column at bottom Section 98
3-78 Step-by-step Plastic Analysis of RC Column 99
3-79 History of Load versus Deflection at Load Point for RC Column 100
3-80 Step-by-step Plastic Analysis of Steel Jacketed RC Column 101
3-81 History of Load versus Deflection at Load Point for RC Column 102
3-82 Variation of Impulse and Peak Pressure along Height of Column for Column RC1 (Test 1) and SJ2 (Test 3) 102
3-83 Variation of Impulse and Peak Pressure along Height of Column for Column RC2 (Test 2) and SJ1 (Test 4) 103
3-84 RC Column under Bending Moment 103
3-85 Comparison of Shear Resistance with Shear Force at Base of RC Column 104
3-86 Comparison of Shear Resistance with Shear Force at Base of Steel Jacketed RC Column 104
3-87 Comparison of RC Column Damages and Pressure Distributions 105
3-88 Comparison of SJ Column Damages and Pressure Distributions 105
4-1 Comparison of Test Blast Parameters 110
4-2 Comparison of Tested Column Sections and Moment Capacities 110
4-3 Real and Equivalent SDOF System for SDOF Dynamic Analysis 115
4-4 Equivalent Pressure History 120
4-5 Analytical Results for Test 1-3 with β =0.472 (C4 Column) 122
4-6 Analytical Results for Test 1-3 with β =0.566 (C4 Column) 125
4-7 Analytical Results for Test 1-4 with β =0.540 (C6 Column) 126
4-8 Analytical Results for Test 1-5 with β =0.521 (C5 Column) 127
4-9 Analytical Results for Test 1-6 with β =0.558 (C4 Column) 128
4-10 Analytical Results for Test 1-9 with β =0.524 (C6 Column) 129
LIST OF FIGURES (Continued) FIGURE TITLE PAGE

xix
4-11 Analytical Results for Test 1-10 with β =0.492 (C5 Column) 130
4-12 Cross Sections for Fiber Element 133
4-13 Analytical Model for Cyclic Loading Test Specimen 134
4-14 Constitutive Model for Steel (Menegotto and Pinto 1973) 136
4-15 Shift of Yield Asymptote due to Isotropic Strain Hardening (Filippou et al. 1983) 137
4-16 Strain Penetration Model for Steel Bar (Zhao and Sritharan 2007) 140
4-17 Modified Chang-Mander Model for Concrete (adapted from Waugh 2007) 143
4-18 Modified Scott-Kent-Park Model for Concrete (adapted from Yassin 1994) 145
4-19 Analytical Model for CFST Column 148
4-20 Analytical Model for RC Column 148
4-21 Analytical Model for Steel Jacketed RC Column 149
4-22 Analytical Results for Cyclic Loading Test of CFST-34 151
4-23 Analytical Results for Cyclic Loading Test of CFST-42 152
4-24 Analytical Results for Cyclic Loading Test of RC-TP60 152
4-25 Analytical Results for Cyclic Loading Test of RC-Unit9 153
4-26 Analytical Results for Cyclic Loading Test of SJ-Unit4 153
4-27 Analytical Results for Cyclic Loading Test of SJ-CR2 154
4-28 Comparison of Analytical Results with Test Results of CFST Columns 154
4-29 Comparison of Analytical Results with Test Results of RC Columns 155
4-30 Comparison of Analytical Results with Test Results of Steel Jacketed RC Columns 155
4-31 Analytical Model for Blast Loading Tests 158
4-32 Comparison of Moment-Curvature Relationship for CFST C4 Column 160
4-33 Comparison of Moment-Curvature Relationship for CFST C5 Column 161
4-34 Comparison of Moment-Curvature Relationship for CFST C6 Column 161
4-35 Natural Mode Shapes of CFST Columns 162
4-36 Applied Blast Pressures of Test 1-3 (CFST C4 Column) 165
4-37 Applied Blast Pressures of Test 1-4 (CFST C6 Column) 166
4-38 Applied Blast Pressures of Test 1-5 (CFST C5 Column) 167
4-39 Applied Blast Pressures of Test 1-6 (CFST C4 Column) 168
LIST OF FIGURES (Continued) FIGURE TITLE PAGE

xx
4-40 Applied Blast Pressures of Test 1-9 (CFST C6 Column) and Test 1-10 (CFST C5 Column) 169
4-41 Applied Blast Pressures of Test 2-1 (RC1 Column) and Test 2-3 (SJ2 Column) 170
4-42 Applied Blast Pressures of Test 2-2 (RC2 Column) and Test 2-4 (SJ1 Column) 171
4-43 Comparison of Analytical Results with Different Damping Ratio of Test 1-3 (CFST C4 Column) 174
4-44 Analytical Results of Test 1-3 (CFST C4 Column) subjected to Equivalent Uniform Pressures 179
4-45 Analytical Results of Test 1-4 (CFST C6 Column) subjected to Equivalent Uniform Pressures 180
4-46 Analytical Results of Test 1-5 (CFST C5 Column) subjected to Equivalent Uniform Pressures 180
4-47 Analytical Results of Test 1-3 (CFST C4 Column) subjected to Actual Pressures 181
4-48 Analytical Results of Test 1-4 (CFST C6 Column) subjected to Actual Pressures 182
4-49 Analytical Results of Test 1-5 (CFST C5 Column) subjected to Actual Pressures 182
4-50 Analytical Results of Test 1-6 (CFST C4 Column) subjected to Actual Pressures 183
4-51 Analytical Results of Test 1-9 (CFST C6 Column) subjected to Actual Pressures 184
4-52 Analytical Results of Test 1-10 (CFST C5 Column) subjected to Actual Pressures 184
4-53 Analytical Results of Test 2-2 (RC2 Column) 189
4-54 Displacement History of CFST C4 Column using Test 2-2 Blast Pressures (at h = 0.55 m) 189
4-55 Reaction Force History of Test 2-1 (RC1 Column at h = 0.55 m) 190
4-56 Reaction Force History of Test 2-4 (SJ1 Column at h = 0.55 m) 190
4-57 Reaction Force History of Test 2-3 (SJ2 Column at h = 0.55 m) 190
LIST OF FIGURES (Continued) FIGURE TITLE PAGE

xxi
2-1 Design Variations of Test Specimens (Chai et al. 1991) 13
2-2 Design Variations of Test Specimens (Priestley et al. 1994a, 1994b) 16
2-3 Options for Blast Resistance Analysis 30
3-1 Summary of Seismic Analyses 45
3-2 Summary of Transverse Reinforcement for Confinement at Plastic Hinge Zone 48
3-3 Mix Design Formula for Model Concrete 52
3-4 Measured Concrete Properties 53
3-5 Reinforcing Steel Properties 54
3-6 Summary of Column Test Cases and Test Observations 68
3-7 Summary of Moment-Curvature Analyses 76
3-8 Summary of Results of Simplified Blast Analysis (RC Tests) 80
4-1 Summary of All Column Test Cases and Results 109
4-2 Comparison of Analytical Methods 112
4-3 Design Values for SDOF Dynamic Analysis 118
4-4 SDOF Dynamic Analysis Cases for CFST C4 Column of Test 1-3 121
4-5 Summary of Shape Factor from SDOF Dynamic Analysis 123
4-6 Summary of Maximum Response Values for SDOF Dynamic Analyses 131
4-7 Natural Period and Pressure Duration 131
4-8 Cyclic Loading Test Column Details 146
4-9 Material Properties of Cyclic Loading Test Columns 147
4-10 Modal Analysis Results of CFST Columns 162
4-11 Summary of Shape Factors from Fiber-based Dynamic Analyses of CFST Columns 172
4-12 Summary of Analytical Results from Fiber-based Dynamic Analyses of CFST Columns 175
4-13 Summary of Maximum Reaction Forces for RC and Steel Jacketed RC Columns 186
4-14 Summary of β Values and Assumptions of Each Analytical Method 188
LIST OF TABLES TABLE TITLE PAGE


xxiii
1a Coefficient in Menegotto and Pinto model
2a Coefficient in Menegotto and Pinto model
3a Coefficient accounting for strain hardening in Menegotto and Pinto model
4a Coefficient accounting for strain hardening in Menegotto and Pinto model
bA Area longitudinal reinforcing bars
bhA Area of hoop or spiral reinforcing bars
cA (1) Core concrete area (2) area of concrete section resisting shear transfer
cA ′ Modified area of concrete section resisting shear transfer
ccA Core concrete area
chA Cross-section area of structural member
fA Projected area normal to wind
gA (1) Peak ground acceleration (2) gross area of concrete section
skA Area of skin reinforcement
vfA Area of shear-friction reinforcement
vA Shear area of concrete
vfA Area of shear-friction reinforcement across shear plane
vfA ′ Modified area of shear-friction reinforcement across shear plane
b Strain hardening ratio B Cap-beam width
fB Footing width
c (1) Damping coefficient (2) cohesion in shear-friction strength ed Effective depth of concrete member
D Column diameter D′ Center to center diameter of longitudinal reinforcement D′′ Center to center sectional dimension of hoop or spiral reinforcing bars
cD Dynamic increase factor for concrete strength
jD Outside diameter of steel jacket
syD Dynamic increase factor for steel yield strength
e Eccentricity of axial load at footing cE Secant elastic modulus of concrete
NOTATIONS

xxiv
sE Elastic modulus of steel
secE Secant modulus of elasticity
eEI Equivalent flexural stiffness
cf ′ Static compressive strengths of concrete
ccf ′ Compressive strengths of confined concrete
crf Concrete cracking strength
dcf ′ Ultimate compressive strengths of concrete
dyf Dynamic yield stress of steel
duf Dynamic ultimate stress of steel
lf Effective lateral confining pressure
lf ′ Effective lateral confining pressure
tf Tensile strength of steel
uf Static ultimate stress of steel
yf Static yield stress of steel
yjf Yield strength of steel jacket
ytf Yield strength of transverse reinforcement
H Column height xh Maximum center-to-center horizontal spacing of crossties or hoop legs
i Unit positive impulse eqi Equivalent uniform impulse per unit area I Importance of the facility
cI Moment of inertia of core concrete section
crI Moment of inertia of cracked concrete section
DI Equivalent moment of inertia of deck
eqI Equivalent uniform impulse per unit length
sI Moment of inertia of steel tube section *k Generalized stiffness ck Stiffness of column
K Stiffness 1K Shear transfer stress of concrete
eK (1) Equivalent stiffness (2) confinement effectiveness coefficient
NOTATIONS (Continued)

xxv
EK Equivalent elastic stiffness
effK Total effective stiffness
LK (1) Load factor (2) total stiffness of column in longitudinal direction
LMK Load-mass factor
LMeK Load-mass factor for elastic range
LMpK Load-mass factor for plastic range
MK Mass factor
PK Stiffness of pier-bent
SK Stiffness factor
KE Kinetic energy dl Development length of longitudinal reinforcing bar L (1) Total height of column (2) Total span length
fL Footing length
pL Plastic hinge length
m Unit mass *m Generalized mass Dm Mass of a deck per unit length
M Total mass eM Equivalent total mass
nM Nominal moment capacity of column
pM Plastic moment capacity of column
pbM Plastic moment capacity at base of column
pmM Plastic moment capacity at mid of column
p (1) External load per unit length (2) maximum pressure
eqp Equivalent peak pressure
rp Peak reflected pressure, reflected overpressure or peak positive normal reflected pressure
sp Peak overpressure
P (1) Load (2) axial force eP (1) Equivalent load (2) design axial load
rP (1) Reflected overpressure, peak positive normal reflected pressure (2) axial design strength
er Yield resistance of column

xxvi
ur Ultimate resistance of column
R (1) Distance from explosion center (2) resistance of column (3) risk (4) Bauchinger effect coefficient
0R Coefficient in Menegotto and Pinto model
eR (1) Equivalent resistance of column (2) factor to control curve shape of strain penetration model
uR Strength per unit length of column s Spacing of hoop or spiral reinforcing bars
0s Minimum spacing of transverse reinforcement
ys Loaded-end slip of steel reinforcing bar at yield
us Loaded-end slip of steel reinforcing bar at ultimate
AS Pseudo-acceleration response spectrum
DS Elastic displacement response of bridge t Thickness of steel tube, steel jacket
0t Duration of positive phase of blast pressure
at Arrival time of blast wave
bt Minimum thickness to prevent breaching
dt Duration of positive phase of blast pressure
jt Steel jacket thickness
mt Time at which maximum deflection occurs
st Minimum thickness to prevent direct spalling T Natural period of a bridge
effT Effective natural period of a bridge
U Strain energy sfU Strain energy capacity of transverse reinforcement
nv Shear-friction strength
cV Tensile contribution of concrete to shear resistance
eV Elastic lateral force capacity of column
nV Nominal shear strength
nV ′ Modified direct shear resistance
pV Sear resistance by axial force strut action
sV Sear resistance by transverse reinforcement
sjV Shear enhancement due to steel jacket
uV Design shear force

xxvii
Z (1) Scaled distance (2) plastic modulus of C-channel W Explosive charge weight
intW Internal work
pW Explosive charge weight
superW Total weight of bridge superstructure
WD Work done by load x Deflection x Velocity x Acceleration
0x Maximum deflection
0x Maximum velocity
eX Yield deflection of column
EX Equivalent maximum elastic deflection
mX Maximum deflection
pX (1) Horizontal distance between center of an explosive charge weight and a pier (2) Plastic deflection
testX Maximum residual deformation from test
uX Displacement capacity of column z Height of column Z (1) Scaled distance (2) plastic modulus of steel tube β Shape factor, pressure reduction factor δ Normalized deflected shape of column
uΔ Displacement demand
yΔ Elastic displacement capacity of column
cε Concrete compression strain
ccε Strain at peak stress for confined concrete
maxε Absolute maximum strain at instant of strain reversal
tε Strain of steel at tensile strength
yε Yield strain
uε Rupture strain φ Resistance factor
pφ Strength factor θ Angle between column axis and principal tension cracking direction

xxviii
uθ Rotation capacity of column λ Coefficient for shear friction Λ Fixity factor μ (1) Displacement ductility demand (2) friction coefficient
sρ (1) Air density behind wavefront (2) volumetric spiral reinforcement ratio
tρ Longitudinal reinforcement ratio
vρ Reinforcement ratio across shear plane σ Compressive stress action on shear surface
stσ Stress shift in Menegotto and Pinto model accounting for strain hardening ψ Deformation shape

xxix
AASHTO American Association of State Highway and Transportation Officials BEL Bridge Explosive Loading CFST Concrete-Filed Steel Tube CALTRANS California Department of Transportation DIF Dynamic Increase Factor FEM Finite Element Models FHWA Federal Highway Administration FRP Fiber-Reinforced Plastic LRFD Load and Resistance Factor Design RC Reinforced Concrete SEESL Structural Engineering and Earthquake Simulation Laboratory at the University at
Buffalo SDOF Single Degree of Freedom UB University at Buffalo
ABBREVIATIONS


1
SECTION 1 INTRODUCTION
1.1 Motivation
The United States has not suffered from sustained terrorist campaigns like in other countries
(Jenkins 2001b). However, as seen in recent terrorist attacks in the United States such as the
Oklahoma federal building bombing in 1995 and the September 11, 2001 attacks (9/11), the
terrorist threat in the United States is real. The National Intelligence Council (NIC) forecasted
that, at least for the period from 2008 to 2010, the US Homeland will face a persistent and
evolving terrorist threat coming from Islamic terrorist groups and cells, especially al-Qa’ida
which waged the 9/11 attacks (NIE 2007). NIC assesses that “al-Qa’ida’s Homeland plotting is
likely to focus on prominent political, economic, and infrastructure targets with the goal of
producing mass casualties, visually dramatic destruction, significant economic aftershocks,
and/or fear among the US population.”
Modern terrorists have targeted infrastructures, especially public transportation systems in order
to achieve their goals because terrorists can easily and anonymously access the systems. Jenkins
(1997, 2001a) chronologically compiled a list of worldwide terrorist attacks and major criminal
assaults on surface transportation from 1920 to 2000. He reported that nearly 900 terrorist
attacks and other significant criminal incidents related to public surface transportation systems
occurred, most of them in the 30 years from 1970 to 2000 (Jenkins 2001b). No terrorist attack
has yet struck bridges, tunnels and roads in the United States, however terrorist threats have been
received against the four California suspension bridges, including the Golden Gate Bridge in
2001 (Williamson EB and Winget DG 2005), and the Brooklyn Bridge in 1993, 1997 and 2003
(Jenkins 2001b, FBI 2007).
While the focus of these threats has been on large landmark bridges due to their symbolic nature,
the destruction of regular bridges along routes that are key lifelines to specific regional
economies is also foreseeable due to the significant disruption these attacks can create and the

2
possibly simpler logistics in their planning. Historically, bridges have been targets of war and
terrorism because loss of a bridge can have a massive impact on transportation mobility of troops
and a detrimental effect to large populations. Following the aftermath of 9/11, government
leaders, infrastructure owners and the engineering community have recognized that the nation’s
highway system has vulnerabilities and that collapse of a critical bridge could result in
tremendous casualties and enormous economic loss, which resulted in the publication of a
number of documents addressing this concern (see, for instance, FHWA 2003).
Beyond terrorist focused issues alone, bridges are exposed to multiple other hazards. To better
integrate these diverse threats with conflicting demands on structural systems, there has been a
growing trend in the engineering community to find integrated solutions for the design of
infrastructures across various hazards, namely multi-hazard engineering. Multi-hazard
engineering has recently emerged as a new consideration and the community has made an effort
to clarify and establish multihazard engineering principles (see, for instance Multi-Hazard
Symposium 2007). Multi-hazard engineering is defined here as the search for a single design
concept which can satisfactorily fulfill the demands of multiple hazards. The properties that
might be desirable to resist one hazard may have detrimental effects to resist other hazards.
Therefore, multi-hazard engineering addresses problems of infrastructures from the system
perspective by establishing the optimized solutions that can provide protections against multiple
hazards.
The authors previously presented the development and experimental validation of a multi-hazard
bridge pier concept, i.e., a bridge pier system capable of providing an adequate level of
protection against collapse under both seismic and blast loading (Fujikura et al. 2007, 2008).
The proposed concept was a multi-column pier bent with concrete-filled steel tube (CFST)
columns that could provide ductile behavior up to 7 % drift under seismic excitations and
approximately 20 % under blast loading (Marson and Bruneau 2004, Fujikura et al. 2007). The
columns turned out to be effective for blast loadings because breaching and spalling of concrete
are prevented in CFST columns.
While CFST columns perform excellently in a multi-hazard perspective, they have not been
commonly used in bridge engineering practice (although they are sometimes used by some state

3
departments of transportation, such as Alaska DOT). Questions arose as to whether conventional
columns designed to perform satisfactory under seismic excitations would possess adequate blast
resistance. If they did, there would be no need to change current practice for the ductile detailing
of bridge columns. Reinforced concrete (RC) has been widely used for bridge columns. Seismic
detailing requirements for RC columns that can behave in a ductile manner during earthquake are
provided by various documents, such as those published by the American Association of State
Highway and Transportation Officials (AASHTO) and the California Department of
Transportation (Caltrans). Furthermore, in many parts of the United States, particularly in
California, reinforcement detailing requirements in effect prior to the 1971 San Fernando
earthquake resulted in RC columns that exhibited non-ductile behavior during earthquakes.
Many methods have been used to retrofit such non-ductile columns. One of the most popular
methods is steel jacketing which has been commonly used on the west coast of the United States.
A column retrofitted with a steel jacket visually resembles a CFST column, but is typically
discontinuous at the column top and base in order to avoid undesirable overload of the adjacent
members (i.e., footing or cap beam) due to composite action that would significantly increase the
flexural strength of the column (Buckle et al. 2006).
Therefore, the objective of the research presented here was to investigate the blast resistance of
commonly used bridge columns, namely seismically ductile RC columns and non-ductile RC
columns retrofitted with steel jackets to make them ductile, detailed in accordance to recent code
of practice. This second series of test also complements the first series of CFST columns testing
under blast loading by Fujikura et al. (2007, 2008).
1.2 Scope of Research
The research conducted and reported herein consisted of the following steps:
• Design a prototype bridge pier bent with ductile RC columns and one with non-ductile RC
columns retrofitted with steel jacket, subjected to seismic load.
• Design a one-forth scale model with RC and steel jacketed RC columns based on the
prototype pier bent.
• Set up experimental blast parameters assuming the damage level of the column by using
simplified method of analysis.

4
• Perform blast testing on two RC columns and two steel jacketed RC columns.
• Compare the results of damage between those columns and CFST columns that were tested
previously.
• Compare the results of testing with predictions made using the simplified method of analysis.
• Assess the direct shear resistance of those columns and the shear force demands based on
simple plastic analysis.
• Develop and evaluate dynamic analysis methods using a SDOF system model.
• Develop and verify a fiber-based finite element model using quasi-static cyclic loading data.
• Investigate the overall behavior of the tested specimens using a developed fiber-based finite
element model.
1.3 Organization of This Report
Following this introduction, Section 2 contains a review of seismic detailing requirements for
ductile RC column in accordance with the American Concrete Institute (ACI), AASHTO,
Caltrans and MCEER/ATC-49, and a review of the seismic retrofit technique of non-ductile RC
columns using steel jackets. Then, research on the structural response of RC members under
blast load and the direct shear failure of RC members are reviewed. Analysis options under blast
loading are also described. Section 3 presents the seismic design of a conventional bridge pier
bent with ductile RC columns and non-ductile RC columns retrofitted with steel jackets. A
second series of blast testing program using these RC columns and steel jacketed RC columns is
provided. The results of the tests are compared with the simplified method of blast analysis and
the design equations for direct shear resistance of those columns. In Section 4, the analytical
tools using a SDOF system model and a fiber-based finite element model are developed and
evaluated through comparison with the maximum residual displacements obtained from the
experiments. Finally, a summary, conclusions, and recommendations for further research for the
development of multi-hazard resistant bridge columns are presented in Section 5.
Note that for security reasons, some key details of this blast-related study are withheld from this
report. More specifically, the numerical values of some key quantities are not provided. Instead,

5
results are presented in terms of parameters. The values of all of these parameters will be listed
in a special Appendix, which will be made available to selected individuals.


7
SECTION 2
LITERATURE REVIEW
2.1 General As presented in the previous section, the purpose of this study is to research the blast resistance
of commonly used bridge columns, detailed in accordance with recent seismic codes.
Accordingly, this section focuses on reviewing recent seismic design provisions for reinforced
concrete columns and behavior of reinforced concrete members subjected to blast loading.
Recent earthquakes such as the 1989 Loma Prieta, 1994 Northridge and 1995 Kobe earthquakes
revealed the importance of concrete confinement in RC columns, which can be typically
achieved by providing adequate transverse reinforcement. Failures in columns with unconfined
concrete have typically resulted in the collapse of bridges. Different methods and reinforcement
details are available in various design codes to achieve adequate confinement of concrete. At the
same time, various methods for retrofitting non-ductile RC bridge columns have been proposed
in the literature for increasing their confinement and improving their ductility (Buckle et al.
2006). Steel jacketing is one of such retrofitting techniques widely used in many parts of the
United States, particularly in California.
The behavior of RC members, especially bridge columns, subjected to blast loading is of
particular interest in this research project. There exist no comprehensive design guidelines and
specifications for bridges under impulsive blast loading, but the structural behavior of RC
members has been experimentally investigated and well documented for mission-critical
structures such as army facilities and petrochemical facilities (see for instance USDA 1990 and
ASCE 1997). In addition to general behavior of RC members under blast loading, knowledge
also exists regarding the need to consider the risk of direct shear failure as part of the blast
effects design process (Conrath 1999).

8
In this section, various code-specified design requirements for the transverse reinforcement of
RC columns in plastic hinge regions are reviewed. Then, seismic retrofit methods for RC
columns are described, including steel jacketing as one common retrofit technique. After that,
structural response of RC members under blast loading is presented followed by a review of
direct shear failure. Finally, structural analysis options under blast loading are described.
2.2 Seismic Design of Reinforced Concrete Column in Plastic Hinge For a bridge to achieve satisfactory seismic performance, its columns should be designed and
detailed such that they can undergo large cyclic inelastic deformations without degradation in
strength and stiffness. Ductility is the ability of structural elements to sustain these plastic
deformations. A non-ductile column may collapse during a severe earthquake as a result of
losing its strength, whereas a ductile column can dissipate seismic energy through inelastic
deformations. Well detailed column reinforcement, especially in the plastic hinge region, is
essential to achieve the ductility of RC column. Such reinforcement can be detailed to increase
flexural strength of concrete, but most importantly needs to be detailed to prevent premature
buckling of the longitudinal bars and shear failure of the column. The 1989 Loma Prieta, 1994
Northridge and 1995 Kobe earthquakes provided many opportunities to witness the columns with
inadequate transverse reinforcement that failed and triggered collapse of bridges.
In the various design codes and specifications, different methods and details are available to
design transverse reinforcement to achieve concrete confinement and column ductility. A
summary of the seismic design of plastic hinge region for circular columns is presented in the
following sections.
2.2.1 American Concrete Institute (ACI) The building code requirements for structural concrete and commentary (ACI 2004) contains the
code requirements for structural concrete buildings, is not applicable to bridges. However, it is
widely used for designing concrete members. The ACI design provisions specify the detailing of
transverse reinforcement such as to achieve performance in which core concrete of the column
would remain to provide the lateral load-carrying capacity for the column in spite of the covered

9
concrete spalling off. The ACI provisions specify the minimum volumetric spiral reinforcement
ratio, sρ , shall be the greater of
0.45 1g cs
ch yt
A fA f
ρ′⎛ ⎞= −⎜ ⎟
⎝ ⎠ (2-1)
and
0.12 cs
yt
ff
ρ ′= (2-2)
where gA , chA , cf ′ and ytf are gross area of concrete section, cross-section area of a structural
member measured outside-to-outside of transverse reinforcement, specified compressive strength
of concrete and specified yield strength of transverse reinforcement, respectively. Equation 2-2
usually governs for columns with large diameter. The minimum spacing of transverse
reinforcement is specified to be the smaller of one-quarter of the minimum member dimension,
six times the diameter of the longitudinal reinforcement, and os , where os is defined by:
( )144 63
xo
hs in−⎛ ⎞= + ≤⎜ ⎟⎝ ⎠
(2-3)
where xh is the maximum center-to-center horizontal spacing of crossties or hoop legs on all
faces of the column. Note that os need not be taken less than 4 in (102 mm).
2.2.2 American Association State Highway and Transportation Officials (AASHTO) The AASHTO LRFD Bridge Design Specifications (AASHTO 2004) provide the same equations
as those in ACI for selection of the minimum volumetric ratio of spiral reinforcement, namely
those presented in Equations 2-1 and 2-2, with the difference that it specifies the ratio, sρ , shall
satisfy either equations and not necessarily both. Another difference is that the spacing of lateral
reinforcement for confinement is not to exceed one-quarter of the minimum member dimension
or 100 mm center-to center.
2.2.3 California Department of Transportation (CALTRANS)
The CALTRANS Bridge Design Specifications (CALTRANS 2003) specify the use of Equation
2-1 for the minimum volumetric ratio, sρ , of spiral reinforcement outside of potential plastic
hinge region. In potential plastic hinge zone, sρ is limited by the following equations:

10
1.250.45 1 0.5g c es
c y c g
A f PA f f A
ρ⎛ ⎞′⎛ ⎞= − +⎜ ⎟⎜ ⎟ ′⎝ ⎠ ⎝ ⎠
(2-4)
for columns less than or equal to 3 feet (914 mm) in diameter (or least dimension for non-
circular columns), or
1.250.12 0.5c es
y c g
f Pf f A
ρ⎛ ⎞′
= +⎜ ⎟′⎝ ⎠ (2-5)
for columns larger than 3 feet (914 mm) in diameter (or least dimension), where gA , cA , cf ′ , yf
and eP are gross area of section, area of core of spirally reinforced compression member
measured to the outside diameter of the spiral, specified compressive strength of concrete,
specified yield strength of reinforcement and design axial load due to gravity and seismic
loading, respectively. The confinement equations of 2-4 and 2-5 account for the effect of axial
load.
The maximum spacing limit of transverse reinforcement for seismic design is specified in the
CALTRANS Seismic Design Criteria (CALTRANS 2006) to be the smallest of one-fifth of the
least dimension of the cross-section, six times the nominal diameter of the longitudinal
reinforcement, and 8 in (220 mm).
2.2.4 MCEER/ATC-49
MCEER/ATC-49 (2003a, 2003b) summarized and presented in the format of Guide
Specifications the knowledge and results of research programs conducted over two decades prior
to its issuance. Originally it was intended to be incorporated into the AASHTO LRFD Bridge
Design Specifications. However, due to the complexity of the provisions, the provisions were
adopted by AASHTO as a Guide Specification. According to this document, the volumetric ratio
of spiral reinforcement at plastic hinges, sρ , shall not be less than:
2 2
0.008 12 1c e y gs t
sf c g c cc
f P f AU f A f A
ρ ρ⎡ ⎤⎛ ⎞′ ⎛ ⎞⎢ ⎥= + −⎜ ⎟ ⎜ ⎟′ ′⎢ ⎥⎝ ⎠⎝ ⎠⎣ ⎦
(2-6)
where cf ′ , yf , gA and eP were defined previously, and ccA , tρ and sfU are area of column core
concrete measured to the centerline of the perimeter spiral, ratio of longitudinal reinforcement
area to gross area of section and strain energy capacity of the transverse reinforcement (= 110

11
MPa), respectively. Equation 2-6 was developed by Dutta and Mander (1998) who
experimentally demonstrated that the equation worked well for both regular mild steel spirals
and high strength steel wire. The maximum spacing of lateral reinforcement for confinement is
six times the diameter of the longitudinal reinforcement.
2.3 Seismic Retrofit of Reinforced Concrete Column with Steel Jacket
2.3.1 Retrofit Measures for Reinforced Concrete Columns Following the substantial damage to bridge structures due to earthquakes in California,
CALTRANS developed a comprehensive seismic retrofit program for its bridges implemented
over a few decades. The first phase of its program, started following the 1971 San Fernando
Earthquake, was to install restrainers across expansion joints of a large number of bridges
because the greatest risk to those structures was assessed as unseating of superstructure during
earthquakes. The first phase had been practically completed by the time of Whittier Earthquake
(1987), Loma Prieta Earthquake (1989) and Northridge Earthquake (1994). These later
earthquakes happened before the entire seismic retrofit program was completed. While the
seismic restrainers performed well, damage to bridge piers and emphasized the need to retrofit
non-ductile reinforced concrete columns. Therefore, following these earthquakes, CALTRANS
started the second phase of its retrofit program to improve the safety of older bridge columns
(Chai et al. 1991). Chai et al. (1991) categorized the structural inadequacies of the pre-1971
bridge column design as inadequate flexural strength, inadequate flexural ductility, undependable
flexural capacity, inadequate shear strength, footing failures and joint failure.
The Seismic Retrofitting Manual for Highway Structures (Buckle et al. 2006) introduced
methods of retrofitting RC columns including complete or partial replacement, addition of
supplemental columns, shear or flexural strengthening and improvement of column ductility.
Ductility improvement is the most popular of these methods and any of the following techniques
can be applied to achieve the objective: steel jacketing, active confinement by prestressing wire,
active or passive confinement by a composite fiber/epoxy jacket, and reinforced concrete
jacketing. Of these techniques, the most common retrofit implementation has been steel
jacketing and composite fiber/epoxy jacketing.

12
2.3.2 Steel Jacketing
Figures 2-1 (a) and (b) from Buckle et al. (2006) schematically show steel jacketing retrofit
techniques for circular column and rectangular column, respectively, per the method
recommended by CALTRANS (CALTRANS 1996). For circular columns, two rolled steel plate
half-shells are placed around a column, typically with clearance of 13 to 25 mm (0.5 to 1 in)
between the existing column and the jacket. This gap between the jacket and the column is then
filled with a pure cement grout. Note that steel jacketing stops typically at 50 mm (2 in) before
top and bottom of the column. These vertical gaps are left in place in order to avoid increasing
the strength of the column, which is the way to control the maximum demand on the adjacent
structural elements (i.e., footing or cap beam) when flexural plastic hinges develop the strength
of the column. For rectangular columns, as shown in Figure 2-1 (b), an oval jacket is
recommended by CALTRANS (CALTRANS 1996) since retrofitting with rectangular jackets
does not provide enough confining action against concrete expansion as a result of bending. In
this case, concrete using small sized aggregate can be grouted because of the larger gap between
the original column and the steel jacket.
(a) Circular Column (b) Rectangular Column
Figure 2-1 Typical Steel Shell Retrofit (Buckle et al. 2006)

13
2.3.3 Research by Chai et al. (1991)
Chai et al. (1991) experimentally investigated retrofitting techniques of bridge columns using a
steel jacket for enhancing flexural ductility in the potential plastic hinge region. Six column
models with diameter of 610 mm (24 in) and 3.657 m (12 ft) height were tested under lateral
cyclic loading and constant axial load of 1779 kN (400 kips). The various design details for
seven specimens tested by Chai et al. are presented in Table 2-1. Figures 2-2 (a) and (b) show
the test setup and the reinforcement details of columns, respectively. The columns were 0.4
scale of a prototype bridge column with diameter of 1524 mm (60 in). The 4.76 mm (3/16 in)
thick steel jacket provided a volumetric confinement ratio of 3.1 %. The columns were partially
retrofitted with a steel jacket over part of their length at the base of the specimens around the
plastic hinge region. The length of jackets was selected to be 1219 mm (48 in) such that the
moment demand above the jacket did not exceed 75 % of the capacity of the non-retrofitted RC
section.
Table 2-1 Design Variations of Test Specimens (Chai et al. 1991)

14
(a) Test Setup (b) Column Details Figure 2-2 Test Setup and Column Details (Chai et al. 1991)
Columns retrofitted with a steel jacket exhibited a ductile behavior with stable hysteresis curves
up to a ductility ratio of μ = 7 (drift ratio of 5.3 %), while the as-built column failed at ductility
ratio of μ = 1.5 caused by spalling off the cover concrete in the lapped splice region near the base.
Steel jacketing was also found by this test program to be effective to prevent bond failures of the
lapped splices of longitudinal reinforcement from footing. The column stiffness with a steel
jacket was increased by about 10 to 15 %.
2.3.4 Research by Priestley et al. (1994a, 1994b)
Priestley et al. (1994a, 1994b) conducted theoretical and experimental investigation of
retrofitting techniques of bridge columns using a full-height steel jacket focusing on
improvement of the shear strength. An equation for shear strength enhancement by circular steel
jackets was proposed by considering the jacket as continued independent hoops. By modeling
behavior using a truss mechanism, the shear enhancement sjV for circular columns is calculated
by the following equation:

15
( ) ( )2 cot
0.8652
j yj j jsj j yj j j
j
t f D tV t f D t
tθπ π
−= = − (2-7)
where jt is the jacket thickness, jD is outside diameter of the steel jacket, yjf is the yield
strength of the steel jacket and θ is the angle between the column axis and the principal tension
cracking direction. Note that, based on experimental results, θ is assumed to be 30 deg in
Equation 2-7.
Using the test setup shown in Figure 2-3 (a), eight circular and six rectangular column specimens,
which were 0.4 scale of a prototype bridge, were tested under lateral cyclic loading and constant
axial loads of 591.6 kN (133 kips) or 1779.2 kN (400 kips) corresponding to axial load ratios of
0.06 or 0.18. The various design details for fourteen specimens tested by Priestley et al. are
presented in Table 2-2. The aspect ratio of the columns was either 2 or 1.5 in order to model
squat bridge columns that were susceptible to shear failure (rather than flexural failure). Figure
2-3 (b) shows the reinforcement details for columns. The steel jacket thickness was either 4.76
mm (3/16 in) or 3.18 mm (1/8 in).
(a) Test Setup (b) Reinforcement Details Figure 2-3 Test Setup and Reinforcement Details (Priestley et al. 1994a, 1994b)

16
Table 2-2 Design Variations of Test Specimens (Priestley et al. 1994a, 1994b)
The as-built circular and rectangular columns failed in shear with limited ductility. Columns
retrofitted with a steel jacket exhibited ductile behavior with ductility ratios greater than or equal
to μ = 8 (drift ratio of 4 %). Retrofitting with jackets was shown to prevent rapid degradation of
strength and stiffness. The elastic stiffness of the columns with a steel jacket was increased by
about 30 to 64 % for circular and rectangular columns, respectively. The test program indicated
that full-height steel jacketing was effective to enhance shear resistance and flexural
displacement capacity of shear critical RC columns.
2.4 Behavior of Reinforced Concrete subjected to Blast Load Three aspects related to the performance of reinforced concrete elements under blast loading are
reviewed in the following. These are the issues related to ductile response and those related to
brittle response, and a design criterion to prevent breaching and direct spalling of reinforced
concrete slabs.

17
2.4.1 Ductile Response
Ductile behavior is the key to ensure seismic performance of structures. The blast engineering
community has equally recognized the need for ductile design to ensure satisfactory blast
performance. Ductile structures or structural elements are desirable because they can displace
into the inelastic range without excessive degradation of stiffness and strength, and absorb large
amounts of strain energy prior to their collapse.
To resist close-in blast loads and allow the large deformations to achieve ductile response,
USDA (1990) suggested using lacing reinforcements as shown in Figure 2-4 (b), whereas the
conventional shear reinforcement is single leg stirrup as shown in Figure 2-4 (a). In close-in
blast loading, a structural element typically undergoes extremely high-pressure concentrations
which can create local failure. The lacing reinforcements are effective to resist this pressure
because they enhance the confinement of concrete and the displacement ductility and restrain the
buckling of longitudinal bars. For reference, the implementation of this lacing reinforcement is
shown in Figure 2-5 in a typical laced wall for barriers as an example. For far-field blast load,
the applied blast loading is fairly distributed as uniform load and the deformations due to this
uniform load are relatively small. Therefore, USDA (1990) indicates that conventional
reinforcement, such as single leg stirrups (Figure 2-4 (a)), is sufficient to resist such loading and
lacing reinforcement is not necessary.
(a) Single Leg Stirrups
(b) Lacing Reinforcement
Figure 2-4 Element Stirrup Reinforcement (USDA 1990)

18
Figure 2-5 Typical Laced Wall (USDA 1990)
Figure 2-6 adapted from USDA (1990) schematically shows the flexural ductile response curve
of concrete elements. This figure also shows brittle shear response. The rotation limit values at
the support of concrete element designed under blast loading are presented in this figure to
approximately relate deflection of the element to structural damage, such as yield, failure of
compression concrete, and bending of strain hardening. Selection of transverse reinforcement is
also presented to achieve these support rotations. Namely, the concrete element without shear
reinforcement, with single leg stirrups, and with lacing reinforcement would be able to achieve
the support rotations of 2 degree, 4 degree and 12 degree, respectively.

19
Bending of Strain HardeningFailure of Compression Concrete
Yield
2 deg 4 deg 12 deg
Shear Response
No Shear Reinf.
Single Leg Stirrups
Lacing
Deflection
SupportRotation Limit
Res
ista
nce
Flexural Response
Figure 2-6 Typical Resistance-deflection Curve for Concrete Element (adapted from USDA 1990)
2.4.2 Brittle Response Many types of structural elements are unable to exhibit the desirable ductile behavior that can
help resisting blast loads. These structural elements typically fail in a number of brittle ways
which are discussed in the following. The collapse of whole structures can be triggered by the
original local failure of a few structural components. Four types of brittle modes of response
associated with short-duration high dynamic loads are discussed in the following, namely direct
spalling, scabbing, breaching and post-failure fragmentation. Direct shear failure is also
regarded as brittle structural failure, and is addressed in detail in the following section.
Both direct spalling and scabbing are phenomenon of dynamic disengagement of the concrete
element surface, but they are used in different situations. Figures 2-7 (a) and (b) show
experimental results of direct spalled element and scabbed element, respectively. “Direct
spalling” of a concrete element is caused by a tension failure normal to the free surface of the
element (USDA 1990). When a shock front wave strikes a concrete element, a compression
stress wave passes through the element. Once it reaches the rear face, the compression stress
wave is reflected as a tension stress wave and then, this tension stress causes disengagement of

20
the concrete surface. Therefore, direct spalling is observed in the rear free surface. “Scabbing”
is caused by large deflections and observed in the end stage of the ductile flexural mode of a
reinforced concrete element. Large strains due to the large deflections induce severe cracking
and/or crushing of the free surface of the concrete element. Note that Conrath et al. (1999)
defined “scabbing” differently, stating that scabbing is local damage of a front surface when a
shock front strikes the concrete structure.
(a) Direct Spalled Element
(b) Scabbed Element
Figure 2-7 Disengagement of Concrete Element Surface (USDA 1990)
The full thickness of a concrete member can be punched through when the member is subjected
to high explosive loading. This failure is called “Breaching.” Breaching is the local failure
typically observed in reinforced concrete slabs subjected to close-in blast loading.
“Post-failure concrete fragments” are formed when a reinforced concrete element is extremely
overloaded by blast pressures (USDA 1990). These fragments are displaced at high velocities
from the original structure. Post-failure concrete fragments are the results of an element
collapse; therefore the structural element is damaged heavily in this brittle mode. The lacing
reinforcement previously shown in Figure 2-4 (b) is one of the effective ways to reduce this
structural damage associated with post-failure concrete fragments subjected to severe blast
pressures. Figures 2-8 (a) and (b) show the blast test results of concrete element without and
with laced reinforcement, respectively (USDA 1990). The unlaced specimen disintegrated with

21
the dispersion of concrete fragments, while the concrete element with laced reinforcement
exhibited less damage and the material between the plastic hinges remained intact.
(a) Unlaced Element
(b) Laced Element
Figure 2-8 Failure of Concrete Element under Blast Loading (USDA 1990)
2.4.3 Breaching and Spalling Resistance of Reinforced Concrete Element UFC (2004) includes a design criterion to prevent breaching and direct spalling of reinforced
concrete slabs. UFC specifies design performance objectives expressed in terms of desired
damage category broken down into minor damage (cracking), spalling and breaching as shown in
Figure 2-9 (a). Equations to determine the minimum thickness of RC slabs need to prevent these
types of damage. The minimum thickness to prevent breaching, bt (in), is given by:
0.40
1 31 34.120b
Rt WW
−⎛ ⎞= ⎜ ⎟⎝ ⎠
(2-8)
where R is the minimum distance from center of explosive to outside face of RC slab (ft) and
W is the design explosive weight (lb TNT equivalent). The minimum thickness to prevent direct
spalling, st (in), is determined from:
22
0.40
1 31 35.309s
Rt WW
−⎛ ⎞= ⎜ ⎟⎝ ⎠
(2-9)
These equations are plotted in Figure 2-9 (b). The difference between Equations 2-8 and 2-9 lies
in the coefficient of 4.120 and 5.309 used for breaching and direct spalling, respectively.
Accordingly, the required minimum thickness for spalling is about 1.3 times larger than the one
for breaching. According to Equations 2-8 and 2-9, for instance, when R is 3.0 m (9.84 ft) and
W is 300 kg (661 lb), the required RC slab thicknesses bt and st would be 869 mm (34.2 in) and
1118 mm (44.0 in), respectively.
(a) Damage Categories (b) Threshold of damage category Figure 2-9 Design Criteria for Breaching and Direct Spalling (UFC 2004)
2.5 Direct Shear Failure
2.5.1 General The possibility of direct shear failure needs to be considered in blast design since this mode of
response can be critical in many instances. It is often the result of high shear inertia forces which
do not exist in structural members subjected to static or slow dynamic loads (Conrath et al.
1999). However, direct shear failure (also called “shear-friction” in ACI (2004)) is examined in
some cases when designing structural members under static loading (ACI 2004). This type of

23
failure can occur on an interface between different members or parts of members that can slide
on the interface. Especially, direct shear failure needs be considered on an interface between
concrete parts cast at different times and on an interface between different materials like concrete
and steel. This failure is different from the shear failure in bridge columns typically observed in
the event of an earthquake. In the latter case, the column without enough transverse
reinforcement fails in shear with diagonal cracks.
ACI (2004) provides a design equation to prevent direct shear failure for structural members
subjected to static loads. It suggests that this type of failure be considered in a number of
conditions such as an interface between concretes cast at different times and an interface between
different materials like concrete and steel. ACI (2004) cited direct shear as “shear-friction.”
The factors influencing the shear friction capacity can be categorized into global and local
roughness, reinforcement crossing the interface, pressure applied normal to the interface and
concrete strength (Ali and White 1999). As shown in Figure 2-10, global roughness is related to
the overall path of the fracture surface of the concrete member, and local roughness relates to the
localized irregular surface formed on the global roughness. Figure 2-11 schematically shows the
forces developed along the direct shear fracture surface of a RC member subjected to a shear
force. Since the parts on both side of the direct shear interface move laterally relative to one
another, the steel reinforcement across the interface becomes in tension and tries to elongate.
These tension forces in the reinforcement are equilibrated by the compression force developed
along the crack interface as shown in Figure 2-11 (b). The compressive stress produces friction
between the crack surfaces along with the local and global roughness on the surfaces. The
reinforcement crossing the crack surface also provides dowel action to resist the shear forces as
shown in Figure 2-11 (a).
The so-called push-off specimen, as shown in Figure 2-12, is most commonly used to investigate
shear friction. According to the results from this type of experiments (for example, Hofbeck et
al. 1969; and Mattock and Hawkins 1972), the shear-friction strength can be represented by:
nv c μσ= + (2-10)

24
where c is a cohesion term, μ is the coefficient of friction and σ is the compressive stress
acting on the shear surface (MacGregor and Wight 2005).
Shear Plain
Global Roughness
Local Roughness
Actual Interface
Figure 2-10 Global and Local Roughness (adapted from Ali and White 1990)
ShearForce
ShearForce
Reinforcement
(a) Form of Horizontal Shear Crack
ShearForce
Tension inReinforcement
FrictionalStress
Compression onConcrete Surface
(b) Force Development
Figure 2-11 Shear Friction Model (adapted from MacGregor and Wight 2005)

25
P
P
Shear Plane
Shear TransferReinforcement
Figure 2-12 Shear Transfer Test Specimen (adapted from MacGregor and Wight 2005)
2.5.2 Ultimate Capacity of Direct Shear under Static Loads ACI (2004) Section 11.7 provides design rules to estimate the shear-friction strength. The
nominal shear strength, nV , is calculated by:
n vf yV A f μ= (2-11)
where vfA is the area of shear-friction reinforcement across shear plane, yf is the yield strength
of reinforcement, and μ is coefficient of friction. The coefficient μ depends on the surface of
the shear interface under consideration and is taken as 1.4λ for concrete placed monolithically,
1.0λ for concrete placed against hardened concrete with intentionally roughened surface, and
0.6λ for concrete placed against hardened concrete not roughened intentionally, where λ = 1.0
for normal weight concrete, 0.85 for sand-lightweight concrete, and 0.75 for all lightweight
concrete. Equation 2-11 is based on the shear-friction model which assumes the shear resistance
on the surface of the shear interface comes only from friction by ignoring the effect of cohesion.

26
ACI (2004) Commentary R11.7.3 provides another equation to estimate the shear-friction
strength as an alternative method, which is a “modified shear-friction method.” This method has
been proposed by Hofbeck et al. (1969) and Mattock and Hawkins (1972). They reported a
series of push-off tests on specimens with initial cracks and without cracks along a shear plane,
and suggested that the nominal shear strength, nV , is given by:
10.8n vf y cV A f A K= + (2-12)
where cA is the area of the concrete section resisting shear transfer, and 1K = 400 psi (2.8 MPa)
for normal weight concrete, 200 psi (1.4 MPa) for all-lightweight concrete, and 250 psi (1.7
MPa) for sand-lightweight concrete. These values of 1K can be used for both monolithically
cast concrete and concrete cast against hardened concrete with a rough surface (ACI 2004). The
first term in Equation 2-12 represents the shear transferred by friction with the coefficient of
friction taken as 0.8. The second term represents the shear transfer resistance due to cohesion,
which is the sum of the shearing of crack surface roughness and the dowel action of the
reinforcement.
To compare the various shear-friction models with test results, Figure 2-13 was developed. In
this figure, the solid lines represent the upper limit of shear-friction resistance from the shear-
friction model given by Equation 2-11, and the dashed line represents the one from the modified
shear-friction model given by Equation 2-12. Solid circles and open circles in this figure are
respectively the test results for the uncracked and cracked push-off specimens by Hofbeck et al.
(1969). In this figure, the shear stress, nv , (instead of shear force) is plotted against v yfρ where
vρ is the reinforcement ratio across the shear plane. The upper limit of ACI shear-friction model
comes from Section 11.7.5 that the nominal shear strength, nV , shall not be taken greater than the
smaller of 0.2 c cf A′ and 800 cA (lb). Therefore, the limit was taken as 800 psi (5.52 MPa) in this
figure. The ACI shear-friction model gives a conservative prediction of shear strength, while the
ACI modified shear-friction model fits the experimental results quite well.
27
0
2
4
6
8
10
12
0 2 4 6 8 10 12
Uncracked test
Cracked test
0 400 800 1200 1600
0
400
800
1200
1600
Shea
r Stre
ngth
, vn (M
Pa)
(MPa)
= 0.6μμ
= 1.4μ= 1.0 ACI Shear-friction
Model
ACI ModifiedShear-frictionModel
(psi)
yv f ρ
Figure 2-13 Comparison of Shear-friction Models with Test Data
2.5.3 Ultimate Capacity of Direct Shear under Dynamic Loads
Direct shear resistance under dynamic loading is of particular interest in this section. However,
for security reasons, it is difficult to find public domain data on the direct shear resistance of
reinforced concrete elements subjected to impulsive or blast loading. Ross (1983) reported at
least two known studies on direct shear resistance of such elements. One is a series of shear key
tests by Hansen et al. (1961) and the other of a series of push-off element tests by Chung (1978).
Note that the tests by Hansen et al. (1961) were not direct shear tests but concrete shear key tests.
However, it could provide useful information to compare the static and dynamic shear resistance
of concrete elements.
Hansen et al. (1961) conducted a series of static and dynamic tests on three types of concrete
shear keys; plain concrete, plain concrete under compressive stressed and concrete reinforced by
dowel reinforcement embedded diagonally. The objective of this study was to find out the
ultimate shear strength of concrete shear keys that were at the time required in buildings
subjected to static loading and dynamic loading from a nuclear weapon. Details of these

28
specimens and test setup are shown in Figure 2-14. The static load duration for the test program
was about 10 to 15 minutes. The dynamic loads applied were roughly of triangular shape with
the peak load reached in 25 to 40 milliseconds and a total duration of 2250 to 2750 milliseconds.
The shear stress rate was in the order of 200 to 400 N/mm2/sec with these load speeds. The tests
showed that the dynamic shear strength of concrete elements was greater than the static strength,
however the shear failure mode appeared to be similar between static and dynamic loading. The
measured DIF of these shear key resistances were 1.15 for plain concrete, 1.54 for plain concrete
with compressive stress of 1.0 MPa (150 psi), 1.70 for plain concrete with compressive stress of
2.1 MPa (300 psi) and 1.28 for concrete with dowels. The compressive stress and the dowel
reinforcements contributed to increase the shear resistance under impulsive loading.
Figure 2-14 Details of Test Specimens and Test Set-up (Hansen et al. 1961)
Chung (1978) tested 48 concrete push-off specimens with and without dowel reinforcements
across the shear plane as shown in Figure 2-15 under static and dynamic loadings. The objective
29
of this test program was to investigate the shear resistance of concrete joints under dynamic load
and the effects of repeated loading on the dynamic strength of the joints. The hatched part of the
specimen in Figure 2-15 was casted first, followed by unhatched part after hardening of the first
casted segment, therefore creating a construction joint across the shear plain of the specimen.
The peak load was reached in roughly 0.8 milliseconds. The total load duration was 1.5
milliseconds. This load speed was equivalent to a shear stress rate of 12,000 N/mm2/sec. The
dynamic shear strength of the concrete joint was higher than the static shear strength. The test
results showed that the DIF of direct shear resistance was, respectively, 1.8 and 2.0 for with and
without dowel reinforcements.
Figure 2-15 Details of Test Specimen (Chung 1978)
2.6 Structural Analysis Options under Blast Loading There is a variety of analytical methods available to compute structural response of structures
subjected to blast loading. These blast analytical methods range from a simplified analytical
method using a SDOF system, as presented previously, to a finite element model (FEM) that
replicates the detailed structural elements and materials and that accounts for the actual blast
pressure histories acting to the structure. Table 2-3 summarizes some of the analytical options
available on compute the response of structures subjected to blast loading. Winget et al. (2005)

30
provided a good overview of various analytical options by comparing their advantages and
disadvantages. In this subsection, these structural analysis options are briefly reviewed.
Table 2-3 Options for Blast Resistance Analysis
1. Consideration of Blast Pressure
(a) Equivalent Static Analysis (b) Dynamic Analysis
2. Interaction between Structure and Blast Loading
(a) Coupled Analysis (b) Uncoupled Analysis
3. Descretization of Structure
(a) SDOF Model (b) MDOF 2D or 3D Beam Model (c) MDOF FEM
4. Material Nonlinearity
(a) Elastic Model (b) Inelastic Model
5. Geometric Nonlinearity
(a) Linear Model (b) Nonlinear Model
2.6.1 Consideration of Blast Pressure
When calculating structural behavior under blast loading, one of the issues to resolve is how to
consider the blast pressure into the analysis. As part of this determination, it would be possible
to approach this blast loading either statically or dynamically. Static analysis was commonly
used in the past, but is not recommended anymore in most cases. This method is typically called
“equivalent static analysis” or “equivalent wind analysis.” In this method, a blast load is simply
applied as a static load. However, it is difficult to specify an equivalent static blast load that can
accurately replicate all the effects of a dynamic blast loading. This method was used for cases in
which the target structure was located far from the blast source, the blast loading treating as a
wind gust loading. This method had serious shortcomings. As a result, dynamic analysis is the
recommended procedure commonly used in blast resistant. (ASCE 1997)
2.6.2 Interaction between Structure and Blast Loading
In blast dynamic analysis, one issue is whether interaction between the structure and blast
loading should be considered (Winget et al. 2005). A coupled analysis takes this interaction into
account, and the applied blast loads and the structural response affect each other. This analytical

31
method predicts the structural response accurately, however it requires large amount of
computations and advanced computational techniques because they are analyzed at the same
time on the same platform. On the other hand, in an uncoupled analysis, the blast pressures and
the structural responses are calculated separately. As such, the uncoupled analysis requires much
less effort and time than the coupled analysis. Although the coupled analysis is the more
accurate analytical method, the uncoupled analysis typically provides reasonable and
conservative results. Accordingly, uncoupled analysis is commonly used in practical design of
the structures under dynamic loading. (Winget et al. 2005)
2.6.3 Discretization of Structure
Modeling is to formulate the geometry of a structure mathematically. This mathematical model
is discretized by partitioning the structure into a mesh of elements (Cook et al. 2002). This
discretization ranges from a SDOF lumped-mass model to a multi-degree of freedom (MDOF)
FEM model. Figure 2-16 schematically shows this discretization for a bridge structure as an
example. As previously shown in the simplified blast analysis, although the SDOF model cannot
provide the detailed response of the structure, it is sufficient to calculate the response at one
particular point of the structure, which is the maximum deflection point in most cases. This
SDOF model is widely used in the blast resistant design practice because it is simple and
provides reasonable predictions. However, this SDOF model does not capture the structural
behaviors of the higher-order modes which are likely to develop in the structure under blast
loading due to high frequency modes caused by the short duration of blast pressures (Winget et
al. 2005). To account for these higher-order modes, it is necessary for the structures to be
modeled by the higher degree of freedom models, such as MDOF 2D or 3D beam models and
MDOF finite element models.
2.6.4 Material and Geometric Nonlinearity
Structures subjected to blast loadings are typically expected to experience large inelastic
deformations. The material nonlinearity can be considered in the stress-strain relationship using
a simplified model, such as a bi-linear curve, or an accurate model representing the actual
material behavior. If the deformations of the structure are large, geometric nonlinearity should
also be included, which is achieved by considering equilibrium in the deformed structural

32
geometry. Also, the acting direction of the loads may need to be updated when pressures act on
a membrane, such as a thin plate, because direction of the pressure changes as the membrane
stretches and deforms. (Cook et al. 2002)
SDOF Model 2D or 3D Beam Model MDOF FEM
Figure 2-16 Discretization of Structure (Priestley et al. 1996)

33
SECTION 3 BLAST PERFORMANCE OF SEISMICALLY RESISTANT
REINFORCED CONCRETE AND STEEL JACKETED
BRIDGE PIERS
3.1 Introduction The authors previously presented the development and experimental validation of a multi-hazard
bridge pier concept, i.e., a bridge pier system capable of providing an adequate level of
protection against collapse under both seismic and blast loading (Fujikura et al. 2007, 2008).
The proposed concept was a multi-column pier-bent with concrete-filled steel tube (CFST)
columns that could provide ductile behavior up to 7 % drift under seismic excitations (Marson
and Bruneau 2004) and up to 20 % under blast loading. The columns turned out to be effective
for blast loadings because breaching and spalling of concrete are prevented to occur in CFST
columns.
While CFST columns perform excellently in a multi-hazard perspective, they have not been
commonly used in bridge engineering practice (although they are sometimes used by some state
departments of transportation, such as Alaska DOT). Questions arose as to whether conventional
columns designed to perform satisfactory under seismic excitations would possess adequate blast
resistance. If they would, there would be little incentive to change current practice for ductile
detailing of bridge columns to resist blast loadings. Therefore, the objective of the research
presented here is to experimentally investigate the blast resistance of commonly used bridge
columns detailed in accordance to recent seismic design codes. Ductile reinforced concrete (RC)
columns and non-ductile RC columns retrofitted with steel jackets are selected as representative
commonly used bridge columns. As such, this second series of test program complements the
first series of CFST column tests under blast loading (Fujikura et al. 2007, 2008).
Following this section introduction, the seismic design of a prototype bridge pier bent and the
design of a corresponding one-forth scale model are presented along with details of the assumed

34
blast scenario. Next, experimental observations are summarized. Finally, the comparison of
analytical studies and test results is presented, including a moment-curvature analysis, a simple
plastic analysis and a simplified blast analysis using an equivalent SDOF system. Also, direct
shear resistance of RC column, breaching, and spalling resistance are discussed.
3.2 Experimental Design and Setup
3.2.1 General This section describes the design of the prototype and specimen of bridge pier as well as the
setup used for testing for a multi-column bent. As described in Section 1, the objective of this
project is to investigate whether conventional seismic designed bridge piers inherently provide
satisfactory blast performance. These conventional types of bridge piers considered here are
seismically designed ductile reinforced concrete piers as well as non-ductile reinforced concrete
piers retrofitted with steel jackets being confirmed satisfactory seismic performance.
For the purpose of this project, first, to verify whether the seismically ductile systems can
provide satisfactory blast resistance, a credible blast scenario is assumed as described in the
following subsection. Secondly, seismic design of prototype bridge pier is conducted using
response spectrum analysis. Detailing is accomplished in accordance with the recent design
codes. Then, this prototype bridge is scaled down to one-fourth test specimen of bridge pier bent.
Finally, measured properties of materials used in the specimen fabrication are presented followed
by details of specimen, fabrication and experimental setup.
Test specimens were fabricated in the Structural Engineering and Earthquake Simulation
Laboratory (SEESL) at the University at Buffalo (UB) and shipped to the U.S. Army Corps of
Engineers Research Facility in Vicksburg, Mississippi where the blast tests were performed.
Due to constraints in the maximum possible blast charge weight that could be used at the test site
and specimen cost considerations, test specimen dimensions were set to be 1/4 scale of the
prototype bridge piers. The specimens consist of two identical RC columns and two identical
steel jacketed RC columns, connected to a cap-beam and a footing.

35
3.2.2 Assumed Blast Scenario There are many possible courses of action by which terrorists might attempt to destroy a bridge
structure, such as by detonation of hand-placed explosives, vehicle bomb, and collisions using
large vehicles. In this study, the terrorist action considered consists of detonating explosives
located inside a car vehicle placed below the deck at a close distance to the pier. This scenario is
schematically illustrated in Figure 3-1. The horizontal distance pX between the center of an
explosive charge and the pier, referred to as either the blast distance or standoff distance, was
selected based on assessing a credible threat for typical highway bridges (the exact value is not
indicated here for security reasons). The vertical distance between the center of an explosive
charge and the ground was set equal to 1 m (3.3 ft) based simply on the geometry of typical car
vehicles.
35 m 25 m 30 m
6 m
1 m
XpDeckPier
Figure 3-1 Schematics of prototype bridge and assumed blast scenario
Because of its very nature, it is virtually impossible to accurately predict the explosive charge
weight to be used in a terrorist attack. However, reasonable estimates can be made by taking
into account of some characteristics of terrorist actions. For instance, there is a relationship
between the size of the vehicle used to carry explosives and the maximum possible charge
weight, especially when taking into account how explosives will be hidden to avoid detection by
simple visual inspection (Williamson and Winget 2005). Also, while high-tech explosives are
expensive and difficult to handle (especially in large quantities), fertilizer-based explosives can
be fabricated relatively easily using commercially available ingredients, which make them much
more likely to be used. The explosive charge weight adopted in this study, referred to as pW ,
was set based on these and other considerations, and was found to be very similar to the blast

36
weights predicted in FHWA (2003) for terrorist actions using car vehicles (shown in Figure 3-2).
Incidentally, Figure 3-2 provides not only the connection between vehicle types and weapon
yields but also the damage threshold of building components and windows associated with stand-
off distance and size of bomb. For example, if an automobile loaded with 300 lbs-TNT (136 kg-
TNT) is used for terrorist actions, a standoff distance of about 24 ft (8.4 m) is at least required to
prevent the concrete columns fail.
Figure 3-2 Blast Damage Threshold (FEMA 2003)

37
3.2.3 Seismic Analysis and Design of Prototype Bridge Pier Bent Three different design codes or guidelines for bridges, namely AASHTO (2004), MCEER/ATC-
49(2003a) and CALTRANS (2003, 2006), are used for the designed of the prototype bridge pier
bent, and this bent is designed mainly by AASHTO. As discussed in the previous literature
review, MCEER/ATC-49 has reflected the results of recent research programs. To calculate the
shear resistance of the columns, MCEER/ATC-49 considers the contribution of shear resistance
from transverse reinforcement, strut action and concrete tensile strength, while AASHTO does
not consider the strut action in these three contributions. In the following design, MCEER/ATC-
49 was used to calculate the shear resistance of the reinforced concrete columns to consider the
updated research achievement. Detailing in the plastic hinge region of the columns is very
important in this project to achieve the ductile behavior of the column. Accordingly, the
transverse reinforcement in this plastic hinge region is designed by comparing the three different
design specifications; AASHTO, MCEER/ATC-49, and CALTRANS.
3.2.3.1 Prototype Bridge Structure
The prototype bridge chosen in this study is part of a typical 3-span continuous highway bridge
described in Dicleli and Bruneau (1996). The span lengths are 35 m, 25 m and 30 m (total length
L = 90 m) as schematically shown in Figure 3-1. The width of the deck is 16 m, the equivalent
cross-section area of the deck is 0.592 m2, the equivalent moment of inertia of the deck (with
respect to a vertical axis passing through the centroid) is DI = 13.9 m4, the mass of the deck per
unit length is Dm = 12.56 tons/m, and the height of the columns is H = 6 m. The total gravity
load on each pier is assumed equal to 4098 kN. A multi-column pier bent with three columns is
selected to compare with the first test series of CFST columns subjected to blast loading
(Fujikura et al. 2007, 2008). Figures 3-3 and 3-4 show the designed elevation and reinforcement
details of prototype pier bent, respectively. The design process is presented in the following
subsections in detail.
3.2.3.2 Analysis of Reinforced Concrete Section
In the analysis, the specified concrete compressive strength, cf ′ , and longitudinal and transverse
steel yield stress, yf , were 27.6 MPa (4 ksi) and 414 MPa (60ksi), respectively. A column
diameter of 813 mm (32 in) was selected such as to achieve an axial load level would be about

38
10 % of g cA f ′ ; the actual resulting axial load level, g cP A f ′ , was 11 %. The column was
reinforced with 16 – D19 (#6) longitudinal bars, resulting in a longitudinal reinforcement ratio,
lρ , of 0.9 %. The clear cover of concrete was set to be 51 mm (2 in).
An axial force-moment interaction curve was calculated using XTRACT (2007) for the design of
columns. XTRACT is commercial software for cross sectional analysis, such as moment
curvature analysis and axial force moment interaction analysis. The Mander model (Mander et
al. 1988; Priestley et al. 1996) was selected for the constitutive relationship of unconfined and
15000
1000
81312
19
1067
813
3600
6000
Pier Elevation Side View
1219
16000
1500 6000 6000 1500
Figure 3-3 Elevation Details of Prototype Bridge Pier-bent

39
confined concrete. This model is schematically shown in Figure 3-5. In this model, the
maximum strength of confined concrete, ccf ′ , is related to the effective lateral confining pressure,
lf ′ . The stress-strain relationship of concrete (compressive stress, cf , and strain, cε ) is defined
by the following equations:
1cc
c rf xrf
r x′
=− +
(3-1)
where
7.94 22.254 1 1.254l lcc c
c c
f ff ff f
⎛ ⎞′ ′′ ′= + − −⎜ ⎟⎜ ⎟′ ′⎝ ⎠ (3-2)
c
ccx ε
ε= (3-3)
0.002 1 5 1cccc
c
ff
ε⎡ ⎤′⎛ ⎞
= + −⎢ ⎥⎜ ⎟′⎝ ⎠⎣ ⎦ (3-4)
sec
c
c
ErE E
=−
(3-5)
seccc
cc
fEε
′= (3-6)
The elastic modulus of concrete, cE , calculated as per ACI for normal weight concrete, is:
CL
3952
1024
1024
572
572
D16
@ 1
14(#
5 @
4 1
/2")
D16
@ 1
14(#
5 @
4 1
/2")
D13
@ 1
52(#
4 @
6")
D22 @ 262(#7 @ 10 5/16")
10 - D22(10 - #7)
5 - D13(5 - #4)
D16 @ 300(#5 @ 12")
5 - D13(5 - #4 ) A
B
AB
Section A-A Section B-BC
Section C-C
Section D-D
16 D19(16 #6)
DD
10 - D22(10 - #7)
D22 @ 262(#7 @ 10 5/16")
D19 @ 242(#6 @ 9 17/32")
D22( #7) C
Figure 3-4 Reinforcement Details of Prototype Bridge Pier-bent

40
c 57000 cE f ′= (psi) (3-7)
The effective lateral confining pressure, lf ′ , is given by:
2 yh spl e l e
h
f Af K f KD s
⎛ ⎞′ = = ⎜ ⎟′⎝ ⎠ (3-8)
where lf is the maximum effective lateral pressure, and yhf , spA , D′ and hs are the yield
strength, area, diameter and longitudinal spacing of spirals or hoops, respectively. eK is
typically taken as 0.95 for circular sections, 0.75 for rectangular sections and 0.6 for rectangular
wall sections.
The stress-strain relationship for both confined and unconfined concrete used in this calculation
is shown in Figure 3-6 (a). In the confined concrete model, D16 (#5) transverse spiral
reinforcement was used at a spacing of 114 mm (4.5 in). These spiral details were determined
from the seismic design presented in the following subsection. The maximum strength of
confined concrete, ccf ′ , was 38.8 MPa (5.619 ksi) at the strain, ccε , of 0.00605. The crushing
strain was assumed at 0.015. For the unconfined concrete, the effective lateral confining
pressure was set to be 0lf ′= . After the unconfined concrete reached its crushing strain, the
stress-strain model assumed straight line stress degradation up to the complete spalling. The
crushing and spalling strain of the unconfined concrete were assumed to be 0.004 and 0.006,
respectively.
The stress-strain relationship for longitudinal steel bars was idealized using a bi-linear elasto-
perfectly plastic behavior with yield stress of 414 MPa (60ksi) and elastic modulus of 200,000
MPa (29,000 ksi), as shown in Figure 3-6 (b). The fracture strain of steel was set to be 0.03. The
details of section and material models are provided in Appendix A. Finally, axial force-moment
interaction curve for the prototype bridge column, as shown in Figure 3-7, was obtained by
setting the limit strain of core concrete as the strain at maximum strength, ccε , of 0.00605.

41
Figure 3-5 Stress-strain Model for Unconfined and Confined Concrete (Priestley et al.
1996)
0
10
20
30
40
50
0 0.004 0.008 0.012 0.016
Confined Concrete
Unconfined Concrete
0
1
2
3
4
5
6
7
Com
pres
sive
Stre
ss (M
Pa)
Compressive Strain
(ksi
)
(a) Concrete
0
100
200
300
400
500
0 0.01 0.02 0.03 0.040
10
20
30
40
50
60
70
Stre
ss (M
Pa)
Strain(k
si)
(b) Steel
Figure 3-6 Stress-strain Model for Section Analysis

42
0
5000
10000
15000
20000
0 500 1000 1500 2000
0 4000 8000 12000 16000
0
500
1000
1500
2000
2500
3000
3500
4000
Axia
l Loa
d (k
N)
Moment (kNm)
(kip
)
(kip in)
Figure 3-7 Axial Force - Moment Interaction Curve for Prototype Bridge Column
3.2.3.3 Seismic Loading
The prototype bridge structure described in the former subsection is assumed to be located in an
area of moderate seismic activity. For analysis and design purposes, it is assumed that the
corresponding pseudo-acceleration ( AS ) response spectrum is given by:
( )⎭⎬⎫
⎩⎨⎧ +=
TAAATS g
ggA ,50.2,75.181min (3-9)
where gA (peak ground acceleration) is assumed equal to 0.3 g, and T denotes the bridge’s
natural period. The shape of the response spectrum defined by Equation 3-9 (shown in Figure
3-8) is typical of rock or very stiff soil foundations. Equation 3-9 is similar (but not identical) to
the one implemented in the AASHTO LRFD Bridge Design Specifications (AASHTO 2004), the
difference being that here, the short period range of the spectra is not taken as constant but rather
varies as a function of T , and that the long period range varies as a function of T1 instead of
the more conservative 321 T in ASSHTO.

43
0.00
0.20
0.40
0.60
0.80
1.00
0.00 0.20 0.40 0.60 0.80 1.00 1.20 1.40 1.60 1.80 2.00
Period T [sec]
Pseu
do-a
ccel
erat
ion
S A [g
]
Figure 3-8 Pseudo-acceleration Response Spectrum for Seismic Analysis and Design
3.2.3.4 Analysis of Bent Column for Seismic Loading
The analyses of bent columns for seismic loading were made independently in the longitudinal
and transverse directions. In each direction, conservatively assuming that the bearings
supporting the end spans at the abutments do not restrain displacements, stiffness and strength
are only provided by the piers. The inertia forces from the superstructure are assumed to be
equally carried by two pier bents. Calculation details are presented in Appendix B along with
design of the columns.
The prototype bridge has two pier bents, and each pier bent consists of three RC columns fixed at
the foundation. The boundary conditions of the columns at the top is pinned in the longitudinal
direction and fixed in the transverse direction. The stiffness of each column is given by:
33 c cr
cE IkH
= (for longitudinal direction) (3-10)
312 c cr
cE IkH
= (for transverse direction) (3-11)
44
where H is the height of column, cE is the elastic modulus of concrete given by Equation 3-7
and crI is the moment of inertia of cracked section. crI is calculated assuming the moment of
inertia of cracked section is taken as one-half of that of the gross section and given by:
4
64 2cr
DI π= ⋅ (3-12)
where D is the column diameter. The total effective stiffness of the whole bridge, effK , and the
effective natural period are calculated by:
eff cK k=∑ (3-13)
sup2 ereff
eff
WTK g
π=⋅
(3-14)
where the summation in Equation 3-13 is over all columns of the bridge, superW is the total
weight of bridge superstructure and g is the acceleration due to gravity. The elastic lateral force
capacity of each column, eV , is given by:
ne
MVH
= (for longitudinal direction) (3-15)
2 ne
MVH
= (for transverse direction) (3-16)
where nM is the nominal moment capacity of column which is obtained from the axial force -
moment interaction corresponding to the axial load. The yield displacement of each column, yΔ ,
is given by:
ey
c
Vk
Δ = (3-17)
The maximum displacement response of the bridge is given by:
( )2
max 24eff A effT S T
πΔ = (3-18)
Equation 3-18 is derived under the assumption of “equal displacement rule.” This assumption is
applicable when natural period of structure in the constant-velocity and displacement region of
the spectrum in which the period is larger than about 0.5 sec (Chopra 2000).

45
Results of seismic analyses are summarized in Table 3-1. The natural period in each direction
was in the range of the assumption of “equal displacement rule.” Calculated expected ductility
demands in the longitudinal and transverse direction were 2.22 and 3.39, respectively. The
calculations show that the reinforced concrete bent column with diameter of 813 mm (32 in) and
16-D19 (#6) longitudinal bars provided satisfactory performance for the considered seismic
loading.
3.2.3.5 Design of Column Transverse Steel Reinforcement
Ductile energy dissipating elements in the bridge are the columns. Non-ductile failure of the
columns such as shear failure need be avoided to achieve this ductile energy dissipation through
inelastic flexural response of the columns. The rest of the structure has to be designed to remain
elastic for the forces developed when the columns yield. This is consistent with capacity design
principals where the members that are not part of the primary energy dissipating system are
made strong enough to resist the forces coming from the failure of the primary energy dissipating
members. To ensure the columns not to fail in shear prior to the full development of ductile
flexural failure, the flexural capacity of the columns have to be magnified by overstrength factor
accounting for the increase in strength that can be developed by strain hardening due to large
strains. This overstrength factor was taken as 1.5 to calculate the shear demand in each column,
uV (MCEER/ATC-49 2003a). Calculation details are presented in Appendix B.
The design shear force, uV , should satisfy with the following equation from MCEER/ATC-49
(2003a):
Table 3-1 Summary of Seismic Analyses
Design Direction ck [kN/m]
T [sec]
Ve [kN]
yΔ [mm]
maxΔ [mm]
max
yμ Δ=
Δ
Longitudinal 2,328 1.79 140 60 133 2.22
Transverse 14,792 1.00 331 22 75 3.39

46
( )u s p cV V V Vφ≤ + + (3-19)
where φ is the resistance factor (= 0.90), sV is the shear resistance carried by transverse
reinforcement, pV is the contribution of shear resistance from the strut action of column axial
force, and cV is the tensile contribution of concrete to shear resistance. The shear resistance by
transverse reinforcement, sV , for circular columns is calculated by:
cot2
bhs yh
AV f Ds
π θ′′= (3-20)
where bhA , s , yhf and D′′ are respectively the area, center-to-center spacing, yield stress and
center-to-center sectional dimension of hoop or spiral reinforcing bars, and θ is the principal
crack angle or plane. θ is given as follows:
1.6tan tanv v
t g
AA
ρθ αρ
⎛ ⎞= ≥⎜ ⎟Λ⎝ ⎠
(3-21)
where vρ and tρ are the transverse and longitudinal reinforcement ratio, gA is the gross area of
column, vA is the shear area of concrete which may be taken as 0.8 gA for a circular section, Λ
is fixity factor (1.0 for fixed-free or fixed-pinned, and 2.0 for fixed-fixed), and α is the
geometric aspect ratio angle given by:
tan DL
α′
= (3-22)
where D′ is the center-to-center diameter of longitudinal reinforcement and L is the column
height. Equation 3-21 proposed by Kim and Mander (1999) is an analytical expression derived
from an energy minimization of shear-flexure deflections and was validated by experimental
observations. The contribution by arch action, pV , is given by:
tan2
p eV P αΛ= (3-23)
where eP is the compressive axial force including seismic effects. The tensile contribution of
concrete, cV , can be calculated by the following equations:
0.05c c vV f A′= (Plastic hinge zone) (3-24 a)
0.17c c vV f A′= (Outside of plastic hinge zone) (3-24 b)

47
where cf ′ is concrete strength (MPa). Finally, the amount of column transverse reinforcement is
determined from Equations 3-19 and 3-20.
As discussed in the preceding literature review section, design codes typically prescribe
minimum volumetric spiral reinforcement ratio and details for confinement in the plastic hinge
zone. The transverse reinforcement in this plastic hinge zone is designed by comparing the three
different bridge specifications; AASHTO, MCEER/ATC-49, and CALTRANS. There are two
requirements to decide the minimum volumetric spiral reinforcement ratio in each specification.
One is to determine its ratio, sρ , using the equation given, and the other one is to calculate its
ratio, sρ , from the requirements for the minimum spacing of transverse reinforcement. The
details have been presented in the literature review. Table 3-2 summarizes the minimum
volumetric ratio in plastic hinge region in accordance with these two requirements for each
specification. As shown in Table 3-2, the maximum spacing limit of spiral by CALTRANS and
MCEER/ATC-49 gives the maximum amount of transverse reinforcement ration of 0.98 %,
which is based on six times the nominal diameter of longitudinal reinforcement. Therefore, in
plastic hinge region, D16 (#5) was used for transverse spiral reinforcement at spacing of 114 mm
(4.5 in). The plastic hinge region need be specified to be provided this transverse reinforcement.
The length of this plastic hinge zone, pL , was calculated in accordance with AASHTO (2004) to
be:
max( , ,18( ))6
pHL D in= (3-25)
where D and H are the column diameter (813 mm (32 in)) and height of the column (6 m (236
in)). Accordingly, the resulting plastic hinge length, pL , was 1.0 m (39 in).
The connection between the column and its cap beam and footing needs to be reinforced such
that the column flexural capacity can fully develop. AASHTO (2004) specifies that the
development length for all longitudinal steel shall be 1.25 times dl given by:
0.02 b yd
c
A flf
=′
(for D36 bar or smaller) (3-26)

48
where bA and yf are the longitudinal reinforcing bar area (mm2) and the specified yield strength
(MPa), respectively, and cf ′ is the specified compressive concrete strength (MPa). The spiral
reinforcement of the column must be extended into the pier cap and footing for a distance not
less than one-half the column diameter or 380 mm (15 in) (AASHTO 2004). Accordingly, the
longitudinal bars and spirals extended into the cap beam and footing for a distance more than
specified distances as shown in Figure 3-4.
Table 3-2 Summary of Transverse Reinforcement for Confinement at Plastic Hinge Zone
AASHTO CALTRANS ATC-49
0.45 1g cs
c yt
A fA f
ρ ′⎛ ⎞= −⎜ ⎟⎝ ⎠
0.92 % 0.92 % N/A
1.250.45 1 0.5g c es
c yt c g
A f PA f f A
ρ⎛ ⎞′⎛ ⎞= − +⎜ ⎟⎜ ⎟ ′⎝ ⎠ ⎝ ⎠
N/A 0.62 % N/A
0.12 cs
yt
ff
ρ ′= 0.80 % N/A N/A
2 2
0.008 12 1c e y gs t
sf c g c cc
f P f AU f A f A
ρ ρ⎡ ⎤⎛ ⎞′ ⎛ ⎞⎢ ⎥= + −⎜ ⎟ ⎜ ⎟′ ′⎢ ⎥⎝ ⎠⎝ ⎠⎣ ⎦
N/A N/A 0.10 %
Maximum Spacing #5@8” (203 mm)
#5@ 6 bd⋅ =4.5” (114 mm)
#5@ 6 bd⋅ =4.5”(114 mm)
sρ 0.55 % 0.98 % 0.98 %
3.2.3.6 Design Footing and Cap-beam
The footing and cap-beam were designed to be capacity protected as well as the shear force
design of the column as presented previously. This was considered through overstrength factor
of 1.5. Calculation details are presented in Appendix C. This calculation was mainly followed
by the design example in the Design Examples, Recommended LRFD Guidelines for the Seismic
Design of Highway Bridges (MCEER/ATC-49 2003b).
The footing was designed for overturning, soil bearing capacity and sliding in both longitudinal
and transverse directions. In order to limit the uplift of the footing to 50 percent of the footing
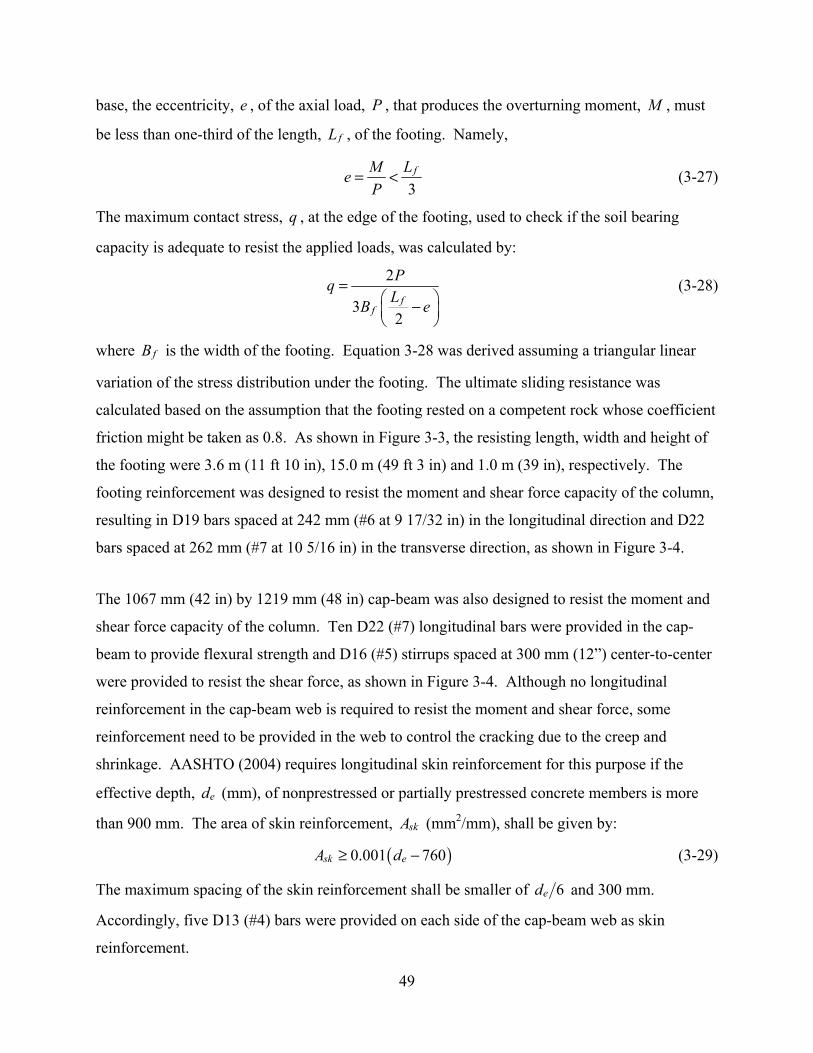
49
base, the eccentricity, e , of the axial load, P , that produces the overturning moment, M , must
be less than one-third of the length, fL , of the footing. Namely,
3
fM LeP
= < (3-27)
The maximum contact stress, q , at the edge of the footing, used to check if the soil bearing
capacity is adequate to resist the applied loads, was calculated by:
2
32
ff
PqLB e
=⎛ ⎞−⎜ ⎟⎝ ⎠
(3-28)
where fB is the width of the footing. Equation 3-28 was derived assuming a triangular linear
variation of the stress distribution under the footing. The ultimate sliding resistance was
calculated based on the assumption that the footing rested on a competent rock whose coefficient
friction might be taken as 0.8. As shown in Figure 3-3, the resisting length, width and height of
the footing were 3.6 m (11 ft 10 in), 15.0 m (49 ft 3 in) and 1.0 m (39 in), respectively. The
footing reinforcement was designed to resist the moment and shear force capacity of the column,
resulting in D19 bars spaced at 242 mm (#6 at 9 17/32 in) in the longitudinal direction and D22
bars spaced at 262 mm (#7 at 10 5/16 in) in the transverse direction, as shown in Figure 3-4.
The 1067 mm (42 in) by 1219 mm (48 in) cap-beam was also designed to resist the moment and
shear force capacity of the column. Ten D22 (#7) longitudinal bars were provided in the cap-
beam to provide flexural strength and D16 (#5) stirrups spaced at 300 mm (12”) center-to-center
were provided to resist the shear force, as shown in Figure 3-4. Although no longitudinal
reinforcement in the cap-beam web is required to resist the moment and shear force, some
reinforcement need to be provided in the web to control the cracking due to the creep and
shrinkage. AASHTO (2004) requires longitudinal skin reinforcement for this purpose if the
effective depth, ed (mm), of nonprestressed or partially prestressed concrete members is more
than 900 mm. The area of skin reinforcement, skA (mm2/mm), shall be given by:
( )0.001 760sk eA d≥ − (3-29)
The maximum spacing of the skin reinforcement shall be smaller of 6ed and 300 mm.
Accordingly, five D13 (#4) bars were provided on each side of the cap-beam web as skin
reinforcement.

50
3.2.3.7 Design of Steel Jacketed Non-ductile RC Column
The second type of seismic designed columns is the non-ductile RC column retrofitted with a
steel jacket. As indicated earlier, this steel jacketing is effective to enhance the ductility of non-
ductile reinforced concrete columns by adding a steel shell that provides the confinement of the
concrete. This steel jacketing allows the plastic hinges developed at the top and bottom where
these plastic hinges would normally be impossible to form for the non-ductile columns without
enough transverse reinforcement inside of the columns. For the purpose of this project,
therefore, a non-ductile RC column was designed to enhance the seismic performance using a
steel jack in accordance with the design procedure developed by Chai et al. (Buckle et al. 2006).
The same diameter and same amount of longitudinal bars used in the ductile RC column were
selected for steel jacketed RC column, namely 813 mm (32 in) and 16-D19 (#6) longitudinal
bars, respectively. Then, the transverse reinforcement was designed to resist the shear force.
The D13 (#4) transverse reinforcement provided, spaced at 210 mm (8 1/4 in), resulted in a
transverse reinforcement ratio of 0.35 %.
Then, this non-ductile RC column was retrofitted using steel jacket in accordance with the design
procedure developed by Chai et al. (Buckle et al. 2006) as described in literature review. Detail
calculations for the transverse reinforcement and steel jacket are presented in Appendix D. For a
circular column, the required steel jacket thickness, t , could be obtained from equilibrium of
stresses action on a half-column section by the following equation:
2
l
s
f Dtf
≥ (3-30)
where lf is the confinement stress, D is the diameter of column and sf is the stress induced in
the steel jacket (Buckle et al. 2006). A clearance of 13 mm (1/2 in) was provided between the
existing column and the jacket. The confinement stress, lf , was taken as 2.07 MPa (300 psi),
which is the value used in this design methods developed by Chai et al. (1991). The stress
induced in the steel jacket, sf , was taken as 200 MPa (29 ksi) that is the stress at a strain of
0.001 calculated using a elastic modulus equal to 200 GPa (29,000 ksi). The resulting thickness
of steel jacket was 4.3 mm (3/16”).

51
3.2.4 One-Fourth Scale Model Design
The design of the prototype bridge pier bent with either RC columns or steel jacketed RC
columns was presented in the previous section. Using geometric similitude, a one-fourth (1/4)
scale model was designed and constructed to accommodate the constraints in the maximum
possible explosive weight that could be used at the test site and considerations for construction
cost (as mentioned earlier).
For convenience, the bridge bent with two different kinds of the columns was used in this project.
Recognizing that all columns in the real bridge bent would be identical, for the purpose of the
experimental convenience and due to the budget constraints, it was deemed adequate to test each
of the columns in this bent successively as if they were a part of the regular bent. The general
layout of the bent of experimental specimens is shown in Figure 3-9. The bent consists of two
identical RC columns (RC1 and RC2) and two identical steel jacketed RC columns (SJ1 and SJ2),
connected to a cap-beam and a footing. Note that the prototype bridge pier bent has three
columns while the specimen had four columns. This was intended to provide as many columns
as possible in one bent, while at the same time providing some distance between the columns
needed to avoid the blast effects from a test on one column to impact the other column tests. The
preliminary calculation indicated that the spacing between these columns was large enough to
preclude the damage to an adjacent column by a test on a target specimen.
Side View
Cap-beam
Footing
Column RC1Column SJ1
Column SJ2
900
250
267
305
1499
Column RC2
203 213
1313
1219 1219 1219254 254
Elevation View
4165
4165
213 203
1473
2054
1499
Liftinghook
Figure 3-9 General Layout of Experimental Specimen

52
3.2.5 Specimen Materials
3.2.5.1 Concrete Properties
The concrete was ready mixed and supplied by a local concrete batching plant. A design mix
was formulated by the plant for a 28 day target compressive strength of 4 ksi (27.6 MPa), slump
of 4.5 in (114 mm) and maximum size of coarse aggregate of 1/2 in (13 mm). The concrete was
poured in two stages; first to do the footing and second to do the columns and cap-beam. At the
concrete joints between the footing and the columns, the surface of the joints was cleaned and
laitance was removed according to the ACI code requirement (ACI 2004). The mix design
formula for 1st and 2nd batch concrete is shown in Table 3-3.
Table 3-3 Mix Design Formula for Model Concrete
Material 1st Batch (1.5 cubic yard)
2nd Batch (2.75 cubic yard)
Footing Columns and Cap-beam
Type I Cement 2712 lb 4687 lb
Concrete Sand 4848 lb 8651 lb
No.1 Crushed Stone 908 lb 1684 lb
Water 16.9 gal. 62.1 gal.
Super-plasticizer 56.0 oz 84.1 oz
Micro-air 5.1 oz 11.2 oz
The compressive strength of the concrete was obtained from compression tests of concrete
cylinders of 4 in (102 mm) diameter and 8 in (203 mm) height. The cylinder specimens were
moist cured near the pier bent model. Sets of three cylinders were tested at seven days, twenty
eight days and six days after the blast tests (corresponding to sixty one days and forty one days
for the 1st and 2nd batch, respectively). Concrete slump and average compressive strength results
are presented in Table 3-4.

53
Table 3-4 Measured Concrete Properties
Concrete Location Slump Compressive Strength
7 days 28 days 6 days after blast tests
Footing (1st Batch)
102 mm (4 in)
28.9 MPa (4.187 ksi)
40.8 MPa (5.912 ksi)
41.5 MPa (6.024 ksi)
Columns and Cap-beam (2nd Batch)
127 mm (5 in)
22.8 MPa (3.303 ksi)
28.9 MPa (4.193 ksi)
32.1 MPa (4.650 ksi)
3.2.5.2 Reinforcing Steel and Steel Jacket Properties
In the design of the prototype bridge, D13 (#4), D16 (#5), D19 (#6) and D22 (#7) deformed
reinforcing bars with specified yield strength of 414 MPa (60 ksi) were used, with cross-
sectional areas of 126.7 mm2 (0.20 in2), 198.6 mm2 (0.31 in2), 286.5 mm2 (0.44 in2) and 387.2
mm2 (0.60 in2), respectively. According to geometric similitude at one-quarter scale, D-1, D-2,
D-3 and D-4 deformed steel wires were used to respectively model the D13, D16, D19 and D22
of the prototype bridge. These steel wire properties are shown in Table 3-5.
These are cold-worked deformed steel wires intended for use as reinforcement in concrete
construction. Their properties are specified by ASTM A496 specified (ASTM 2005b). ASTM
A496 requires tensile properties of 515 MPa (75 ksi) and 585 MPa (85 ksi) for yield strength and
tensile strength based on nominal area of wire, respectively. The wires are available in sizes D-1
to D-45 whose number indicates the nominal cross-sectional areas of the wires in in2. The steel
wires typically have high strength with no plateau and low ductility. Therefore, the steel wires
used in the specimens were heat treated (annealed) to achieve properties similar to those of
commercial steel reinforcing bars with design yield strength of 414 MPa (60 ksi). This was done
for the D-1, D-2 and D-3 wires used to fabricate the column reinforcement. Heat treatment of
the reinforcement used in the cap beam and footing was not accomplished since these structural
elements were designed remain undamaged during this experimental program and were not the
focus of this research. The wires were annealed in a vacuum furnaces produced by Ipsen, Inc. as
shown in Figure 3-10 at a local heat treating company. The steel bars were placed in the vacuum

54
furnace at room temperature, heated to 1135 °F for 60 minutes, cooled to room temperature, and
removed. The final annealing scheme that provided the desired properties was achieved through
trial and error. First annealing attempt at a temperature of 1100 °F lowered the yield strength of
D-3 from 607 MPa (88 ksi) to 538 MPa (78 ksi). To get the yield strength closer to the target
strength of 414 MPa (60 ksi), a second annealing attempt was made with a different set of wires,
for which temperature was set to be 1200 °F, but in this case yield strength was lowered to 390
MPa (40 ksi). Therefore, a final annealing attempt was made at a temperature of 1135 °F
(interpolating 1100 °F and 1200 °F). Representative stress-strain relationships for the D-1 to D-3
wires used in the specimens are shown in Figures 3-11 through 3-13, respectively, from tensile
tests on both the original and annealed wires. Figure 3-14 shows a representative stress-strain
relationship of the original D-4. Mean coupon test results for the annealed wires are presented in
Table 3-5.
Table 3-5 Reinforcing Steel Properties
Bar Diameter mm (in)
Area mm2 (in2)
Yield Stress
MPa (ksi)
Ultimate Stress
MPa (ksi)
Ultimate Strain
Elastic Modulus MPa (ksi)
D-1 2.87 (0.113)
6.45 (0.01)
380 (55.12)
454 (64.57) 0.145 194,289
(28,172)
D-2 4.04 (0.159)
12.90 (0.02)
314 (45.49)
426 (61.72) 0.154 193,269
(28,024)
D-3 4.95 (0.195)
19.35 (0.03)
501 (72.58)
561 (81.38) 0.090 195,007
(28,276)
D-4 5.72 (0.225)
25.81 (0.04) N/A N/A N/A N/A
The steel plate for the steel jacket was a cold-rolled commercial steel sheet with no mandatory
mechanical properties specified by ASTM 1008 CS steel. Typical yield strength and elongation
are specified to be between 140 and 275 MPa (20 and 40 ksi), and more than 30% in 50 mm (2
in), respectively (ASTM 2005c). Coupons for tension testing complying with ASTM A370
(ASTM 2005a) were fabricated from the plate material. Specified plate thickness for the plate
used was 1.2mm (Gauge 18, 0.0478 in). The measured thickness of the plate was 1.13 mm
(0.0445”). Representative stress-strain relationship is presented in Figure 3-15. The mean
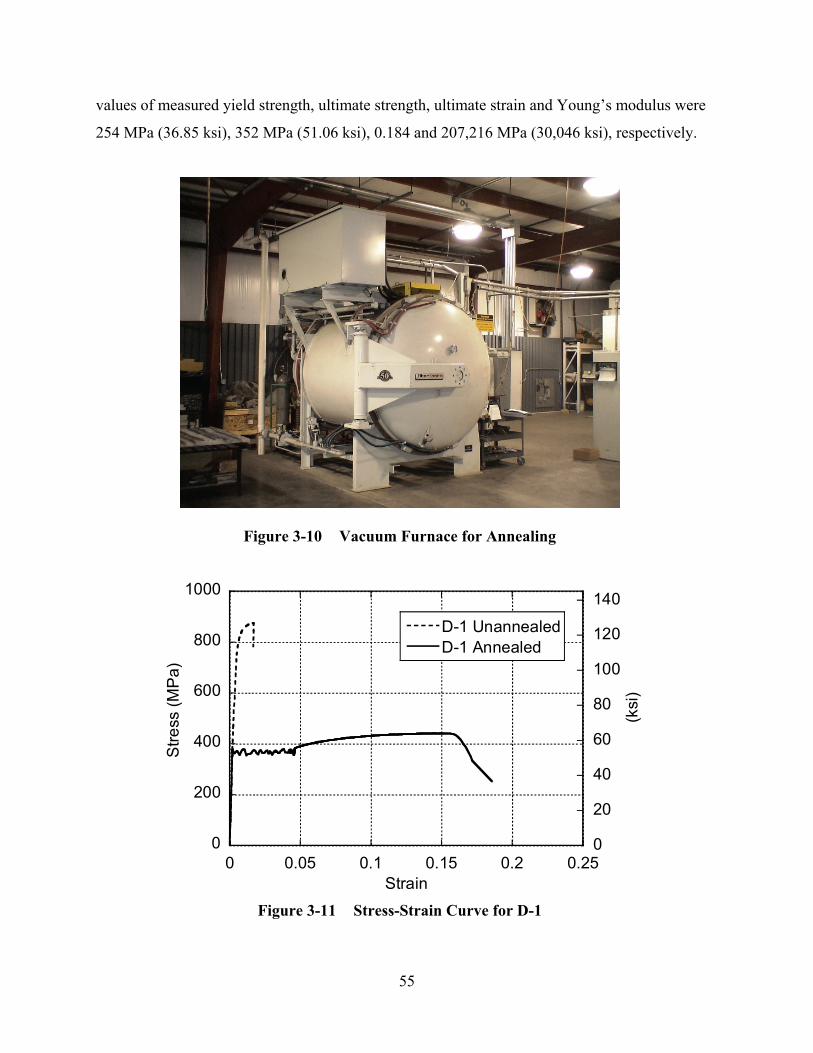
55
values of measured yield strength, ultimate strength, ultimate strain and Young’s modulus were
254 MPa (36.85 ksi), 352 MPa (51.06 ksi), 0.184 and 207,216 MPa (30,046 ksi), respectively.
Figure 3-10 Vacuum Furnace for Annealing
0
200
400
600
800
1000
0 0.05 0.1 0.15 0.2 0.25
D-1 UnannealedD-1 Annealed
0
20
40
60
80
100
120
140
Stre
ss (M
Pa)
Strain
(ksi
)
Figure 3-11 Stress-Strain Curve for D-1

56
0
200
400
600
800
1000
0 0.05 0.1 0.15 0.2 0.25
D-2 UnannealedD-2 Annealed
0
20
40
60
80
100
120
140S
tress
(MP
a)
Strain
(ksi
)
Figure 3-12 Stress-Strain Curve for D-2
0
200
400
600
800
1000
0 0.05 0.1 0.15 0.2 0.25
D-3 UnannealedD-3 Annealed
0
20
40
60
80
100
120
140
Stre
ss (M
Pa)
Strain
(ksi
)
Figure 3-13 Stress-Strain Curve for D-3

57
0
200
400
600
800
1000
0 0.05 0.1 0.15 0.2 0.25
D-4 Unannealed
0
20
40
60
80
100
120
140
Stre
ss (M
Pa)
Strain
(ksi
)
Figure 3-14 Stress-Strain Curve for D-4
0
100
200
300
400
500
0 0.05 0.1 0.15 0.2 0.25 0.3 0.350
10
20
30
40
50
60
70
Stre
ss (M
Pa)
Strain
(ksi
)
Figure 3-15 Stress-Strain Curve for Steel Jacket
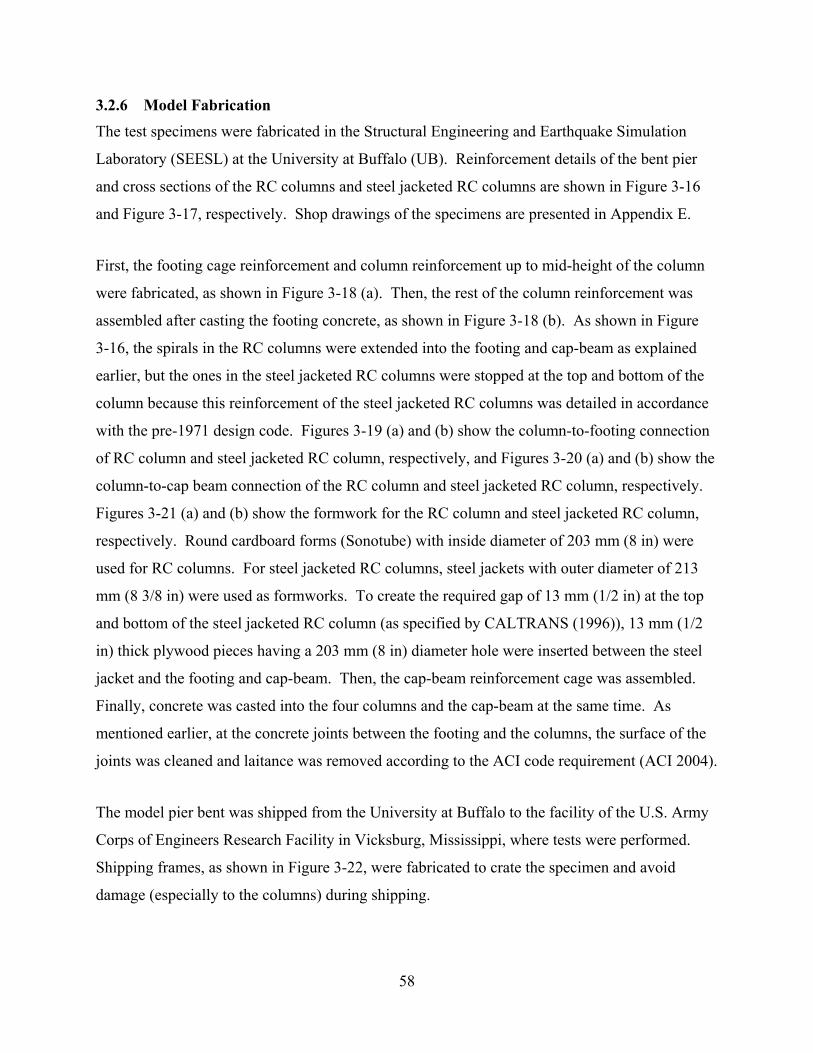
58
3.2.6 Model Fabrication
The test specimens were fabricated in the Structural Engineering and Earthquake Simulation
Laboratory (SEESL) at the University at Buffalo (UB). Reinforcement details of the bent pier
and cross sections of the RC columns and steel jacketed RC columns are shown in Figure 3-16
and Figure 3-17, respectively. Shop drawings of the specimens are presented in Appendix E.
First, the footing cage reinforcement and column reinforcement up to mid-height of the column
were fabricated, as shown in Figure 3-18 (a). Then, the rest of the column reinforcement was
assembled after casting the footing concrete, as shown in Figure 3-18 (b). As shown in Figure
3-16, the spirals in the RC columns were extended into the footing and cap-beam as explained
earlier, but the ones in the steel jacketed RC columns were stopped at the top and bottom of the
column because this reinforcement of the steel jacketed RC columns was detailed in accordance
with the pre-1971 design code. Figures 3-19 (a) and (b) show the column-to-footing connection
of RC column and steel jacketed RC column, respectively, and Figures 3-20 (a) and (b) show the
column-to-cap beam connection of the RC column and steel jacketed RC column, respectively.
Figures 3-21 (a) and (b) show the formwork for the RC column and steel jacketed RC column,
respectively. Round cardboard forms (Sonotube) with inside diameter of 203 mm (8 in) were
used for RC columns. For steel jacketed RC columns, steel jackets with outer diameter of 213
mm (8 3/8 in) were used as formworks. To create the required gap of 13 mm (1/2 in) at the top
and bottom of the steel jacketed RC column (as specified by CALTRANS (1996)), 13 mm (1/2
in) thick plywood pieces having a 203 mm (8 in) diameter hole were inserted between the steel
jacket and the footing and cap-beam. Then, the cap-beam reinforcement cage was assembled.
Finally, concrete was casted into the four columns and the cap-beam at the same time. As
mentioned earlier, at the concrete joints between the footing and the columns, the surface of the
joints was cleaned and laitance was removed according to the ACI code requirement (ACI 2004).
The model pier bent was shipped from the University at Buffalo to the facility of the U.S. Army
Corps of Engineers Research Facility in Vicksburg, Mississippi, where tests were performed.
Shipping frames, as shown in Figure 3-22, were fabricated to crate the specimen and avoid
damage (especially to the columns) during shipping.
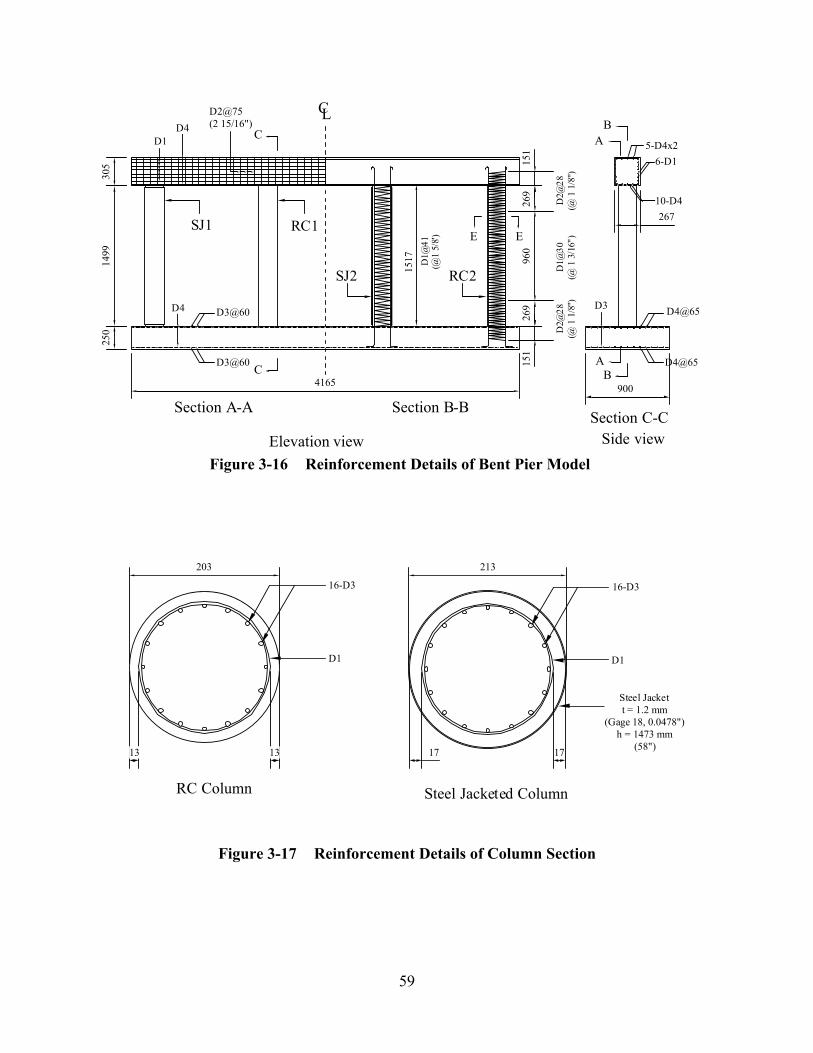
59
A
151
269
960
151
269
1517
D2@
28(@
1 1
/8")
D1@
30(@
1 3
/16"
)D
2@28
(@ 1
1/8
")
D1@
41(@
1 5/
8')Elevation view
5-D4x26-D1
10-D4
D4@65
D4@65
D3
D1
A
B
B
Section B-BSection A-ASection C-C
C
C
CL
Side view
D2@75(2 15/16")D4
RC1SJ1
SJ2 RC2
D3@60
D3@60
D4
E E
4165
1499
250
305
900
267
Figure 3-16 Reinforcement Details of Bent Pier Model
Steel Jacketed ColumnRC Column
213203
17 1713 13
16-D3
D1
16-D3
D1
Steel Jackett = 1.2 mm
(Gage 18, 0.0478")h = 1473 mm
(58")
Figure 3-17 Reinforcement Details of Column Section
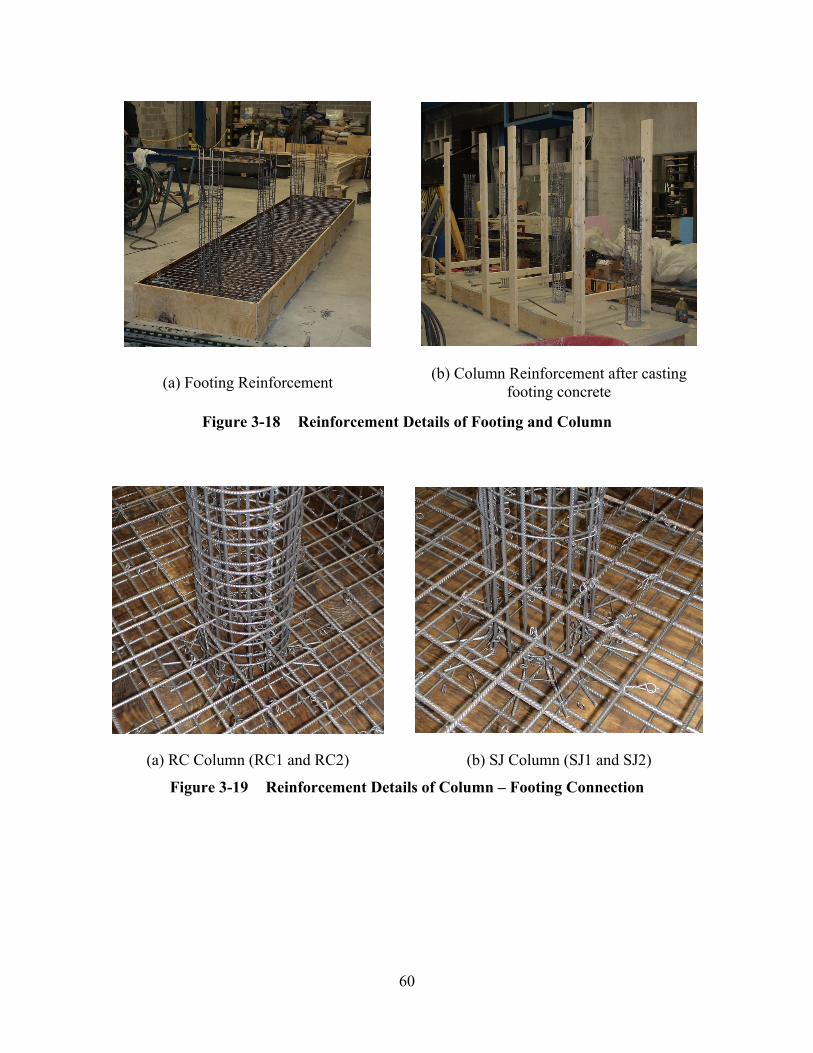
60
(a) Footing Reinforcement (b) Column Reinforcement after casting footing concrete
Figure 3-18 Reinforcement Details of Footing and Column
(a) RC Column (RC1 and RC2) (b) SJ Column (SJ1 and SJ2)
Figure 3-19 Reinforcement Details of Column – Footing Connection

61
(a) RC Column (RC1 and RC2) (b) SJ Column (SJ1 and SJ2)
Figure 3-21 Formwork for Column
(a) RC Column (RC1 and RC2) (b) SJ Column (SJ1 and SJ2)
Figure 3-20 Reinforcement Details of Column – Cap-beam Connection

62
Figure 3-22 Shipping Frame for Model
3.2.7 Test Setup
A series of tests were performed at the U.S. Army Corps of Engineers Research Facility in
Vicksburg, Mississippi. Figure 3-23 illustrates side and plan views of the test setup. There was
a reaction frame between two test models, namely the pier bent with two RC columns and two
steel jacketed RC columns considered in this project, and a steel plate shear wall (SPSW) model
tested as part of another project beyond the scope of this research. The experimental setup is
shown in Figures 3-24 to 3-26 from front diagonal, side, and back diagonal views, respectively.
The model was placed by casting concrete around the footing, as shown in these figures. Note
that the cap-beam was not fixed to the reaction frames as it was intended to allow rotations at
that location, to replicate actual boundary conditions in bridges. Figure 3-27 shows the photo of
the reaction frame at the cap-beam from the back diagonal view.
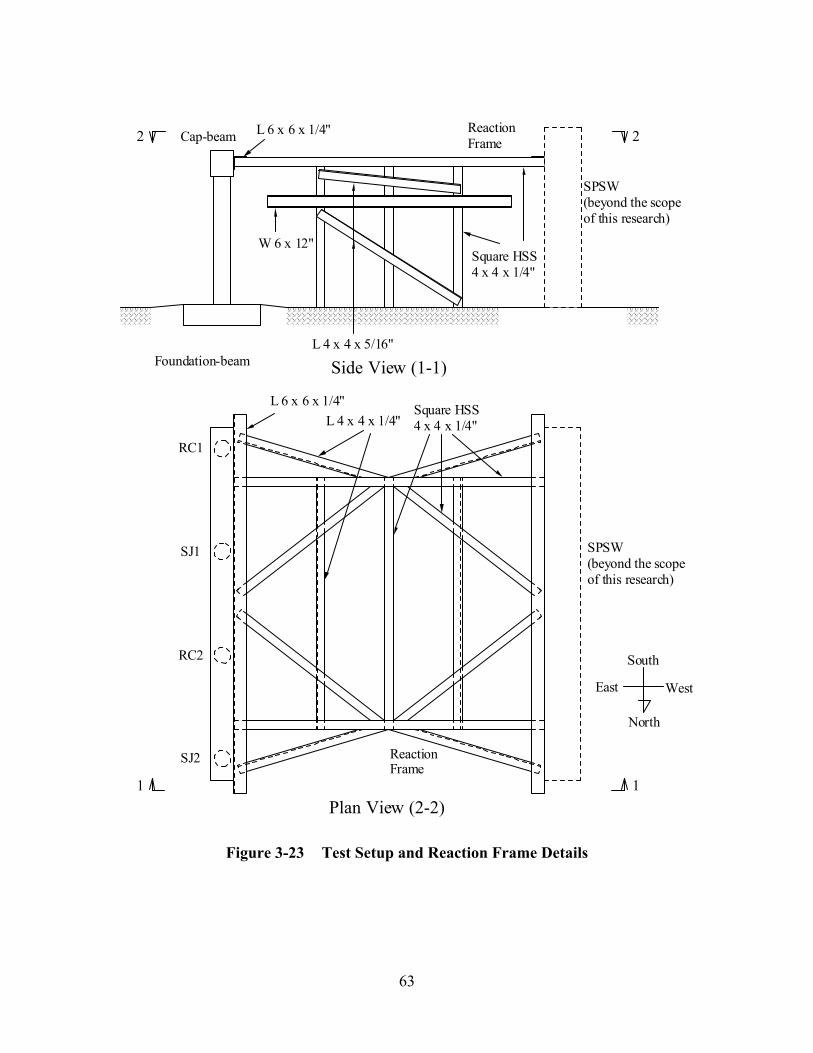
63
Cap-beam
Foundation-beamL 4 x 4 x 5/16"
L 6 x 6 x 1/4"
Square HSS4 x 4 x 1/4"
W 6 x 12"
Side View (1-1)
L 6 x 6 x 1/4"L 4 x 4 x 1/4"
Square HSS4 x 4 x 1/4"
SJ1
RC1
Plan View (2-2)11
22
South
West
North
East
ReactionFrame
ReactionFrame
RC2
SJ2
SPSW(beyond the scopeof this research)
SPSW(beyond the scopeof this research)
Figure 3-23 Test Setup and Reaction Frame Details

64
Figure 3-24 Test Setup from Front Diagonal View
Figure 3-25 Test Setup from Side View

65
Figure 3-26 Test Setup from Back Diagonal View
Figure 3-27 Reaction Frame
66
3.3 Experimental Cases and Observations
3.3.1 General This section presents a description of the explosive charge used in the tests, the experimental
cases, and the experimental observations made after the series of blast tests on two RC columns
and two steel jacked RC columns. The tests were performed at the U.S. Army Corps of
Engineers Research Facility in Vicksburg, Mississippi. Due to constraints in the maximum
possible blast charge weight that could be used at the test site, test specimen dimensions were set
to be 1/4 scale of the prototype bridge piers as mentioned in a previous section.
3.3.2 Explosive Charge Nitromethane was used for the explosive charges. Nitromethane with the chemical formula
CH3NO2 is widely used as a solvent in a variety of industrial appreciations such as a cleaning
solvent and a reaction medium. The actual charge mass is conventionally converted into a TNT
equivalent mass, and the conversion factor is 1.1. For instance, a 10 kg charge of nitromethane
converts to 11 kg of TNT. In addition, 2% of sensitizer was added to aid initiation of the
detonation. Figure 3-28 schematically shows the explosive charge location with respect to the
specimen. The charge was included in a plastic columnar vessel with a diameter of 241 mm (9
1/2 inches).The charge weight is denoted as w , and the height of the charge, h , within the
container varies depending on the charge volume. The standoff distance, x , is horizontal
distance between the center of the explosive charge and the closest point of the column to the
charge. The charge height is taken as the vertical distance from ground to the center of the
charge.
3.3.3 Experimental Cases Summary of the column test cases is presented in Table 3-6 along with the description of test
observations. Exact values of charge weights and standoff distances are not presented for
security reasons; instead these values were normalized by the parameters of X and W ,
respectively. Three parameters were considered in deciding test conditions: height of charge, z ,
standoff distance, x , and weight of charge, w . Height was chosen to be 0.25 m representative
of the height for the assumed blast scenario, which was 1 m for the prototype bridge. Scale
distances, Z , given by:

67
13
xZw
= (3-31)
are also provided for each test case to compare with the case of the assumed terrorist attack
scenario for the prototype bridge. Note that the smaller scale distances create larger pressure and
impulse. The maximum blast charge was limited to W due to the constraints at the test site.
Due to this constraint of maximum blast charge weight, the target deformation of the columns
was achieved by changing the standoff distances.
The target deformations of the columns were set equal to 4 degree and 2 degree of rotational
angle at the base of the column for Test 1 and Test 2, respectively. These deformation limits
were chosen based on recommended design limits by Mays and Smith (1995) for reinforced
concrete beams and slabs. The support rotations of 2 degree and 4 degree correspond to minor
damage and extensive plastic hinging of the column, respectively. In this context, minor damage
means that personnel and equipment should be protected against fragments coming from damage
of the structural members.
These rotational angles at the bottom of the column were obtained by assuming that the
maximum deformation of the column occurred at the height of explosion, i.e. 0.25 m from the
ground. This maximum deformation was calculated by simplified analysis using an equivalent
SDOF system and energy conservation. The details of this simplified analysis will be presented
in Section 3.4 of the analytical study. The standoff distances and charge weights of Tests 3 and 4
on steel jacketed RC columns were selected to be the ones for Tests 1 and 2 on RC columns,
respectively.

68
Cap-beam
Foundation-beam
ReactionFrame
x
D/2 D/2
h/2
h/2
z: Charge HeightStandoff Distance
Plastic Container
w: Explosive Charge
D: 63.5 mm or 152.4 mmh: depending on charge volume
Side View Figure 3-28 Explosive Charge Location
Table 3-6 Summary of Column Test Cases and Test Observations
Test Num. Column Objective Charge
WeightStandoffDistance
Charge Height (m)
Scaled Distance
( 0.333X W )
Test Observations
Prototype --- --- --- --- --- 3.74 ---
Test 1 RC1 θ = 4 deg Collapse W 2.16 X 0.250 2.16 Shear failure
at bottom
Test 2 RC2 θ = 2 deg
Minor Damage
W 3.25 X 0.250 3.25 Onset of shear
failure at bottom
Test 3 SJ2 Same as Test 1 W 2.16 X 0.250 2.16 Shear failure
at bottom
Test 4 SJ1 Same as Test 2 W 3.25 X 0.250 3.25 Shear failure
at bottom
69
3.3.4 Experimental Observations
3.3.4.1 Test 1 for Column RC1
Column RC1 was tested using an explosion of charge weight W at a standoff distance of 2.16 X
and height of 0.25 m, intended to induce 4 degree of total elastic and plastic rotational angle at
the bottom of the column. Figure 3-29 illustrates the deformation and damage of the column
after Test 1, showing left, blast, right and back side views as defined in this figure. Column RC1
did not to exhibit a ductile behavior under blast loading, but rather failed in shear at the base of
the column. Figures 3-30 and 3-31 are the left side view and front view of the column after the
test, respectively. As shown in Figure 3-30 by lines showing the original position of the
specimen, the column was tilted towards the back side, rotating around a point at the top of the
column after the column sheared off at the bottom.
Original position of the column at the footing is shown in Figure 3-32, and Figure 3-33 shows a
close-up picture of the fracture surface at the footing. This surface was the construction joint.
However, as described in the subsection on model fabrication, laitance was removed from the
surface of the footing before casting column concrete. The fracture surfaces of longitudinal bars
coming out from the footing are shown in Figure 3-34. The bottom part of the column was
blown off as shown in Figures 3-35 and 3-36. The front face of the column was damaged more
heavily than the back face because of the blast pressures acting on the front face. Many small
pits were observed on the front side of the column around the blast charge height as shown in
Figure 3-37.
Figures 3-38 and 3-39 show the top of the column from left and right side views. A 40 mm (1
9/16 in) gap between the cap beam and the column was observed on the front side of the column,
and the width of a second crack positioned at 72 mm (2 13/16 in) from the top of the column on
the front side was 3 mm (1/8 in), as shown in Figures 3-38. Figure 3-40 shows the top of the
column from a front view, and Figure 3-41 is a close-up picture of the gap at the top of the
column. Ten longitudinal bars were fractured out of total sixteen bars at that location. As shown
in Figure 3-42, the cover concrete spalled off up on the back of the column to the height of 90
mm (3 17/32 in) from the top of the column due to the large deformation of the column, but no

70
damage was observed in the core concrete because of the confinement by transverse
reinforcement in this plastic hinge region.
The progression of damage for this Column RC1 could be explained as follows, based on
observations on the condition of the column after the test. First, plastic hinges were deemed to
form at the bottom of the column and at the height of the explosion, and possibly at the top of the
column as well. Evidence of forming plastic hinging around the explosion height could be seen
in some cracks observed on the back side of the column as shown in Figure 3-29. This figure
also shows that the part of the column from the bottom up to a height of about 838 mm (33 in)
from that point had a slight curvature outward to the back side, which agrees with the moment
that would develop under this assumption. Then, while these plastic hinges were developing or
after these hinges formed, the column could have been sheared off at its base because the shear
force that developed there exceeded the direct shear strength at that location. Finally, blast
pressures acting on the column and/or inertia forces developed in the column masses pushed the
cantilever column supported from the top to rotate towards the back side. As a result, a negative
moment developed at the top of the column, leading to fracture of the steel bars on the tension
side at the top of the column and the spalling off the cover concrete on the compression side, as
shown in Figures 3-40 and 3-42, respectively. Accordingly, cracks were also observed on the
blast side from mid-height to the top of the column. Figure 3-29 shows that the part of the
column from the top down to a height of about 838 mm (33 in) from the base had slight
curvature inward to the back side due to this negative moment developed at the top.
3.3.4.2 Test 2 for Column RC2
Column RC2 was tested using an explosion of charge weight W at a standoff distance of 3.25 X
and height of 0.25 m, intended to induce 2 degree of total elastic and plastic rotational angle at
the bottom of the column. Figure 3-43 illustrates the deformation and damage of the column
after Test 2, showing left, blast, right and back side views. The concrete spalling was observed
around the bottom of the column. The column deformed towards the back side, as shown in
Figure 3-43 (a), and a maximum deformation of 16 mm (5/8 in) was observed around one third
of the height from the base of the column. This figure also shows that the column had a slight
curvature outward to the back side. Figures 3-44 to 3-46 show the column after Test 2 from

71
front diagonal, back diagonal and front views. Note that these pictures were taken after the
rubble was removed from the bottom part of the column.
Figures 3-47 and 3-48 show the bottom of the column from front diagonal and right side views,
respectively, before the rubble was removed. The cover concrete on the front face was still
loosely in place in the column, although this material had almost fallen apart from the column,
whereas the one in the back face was completely disengaged from the column. This
disengagement is called “direct spalling” of concrete in the literature reviewing the structural
response of reinforced concrete structures subjected to blast load, as described in literature
review. A compression stress wave, created by blast pressures in the front face, traveled through
the column and reflected on the rear column face as a tension stress wave. As a result of this
tension stress, the direct spalling of the cover concrete occurred. Figures 3-49 and 3-50
respectively show the bottom of the column from left and right side views after the rubble was
removed. The cover concrete spalled off up to a height of 117 mm (4 5/8 in) from the bottom of
the column. The shear deformations at the bottom part of the column can be observed by
comparing against the longitudinal reinforcement vertical solid line in Figure 3-49. Therefore,
Column RC2 was deemed to exhibit the onset of direct shear failure at the bottom of the column.
Figures 3-51 to 3-53 show the top of the column from right diagonal front, left diagonal front,
and back side views, respectively. A gap of 4 mm (5/32 in) observed between the cap beam and
the top of the column on its front side, as shown in Figure 3-51, was again attributed to the
negative moment that developed at the top of the column. As shown in Figure 3-53, the cracks
were not observed at the top of the column on the back side since this part was in compression.
3.3.4.3 Test 3 for Column SJ2
Column SJ2 was tested using an explosion of charge weight W at a standoff distance of 2.16 X
and height of 0.25 m, which are the same blast parameters as Test 1 for Column RC1. Figure
3-54 illustrates the deformation and damage of the column after Test 3, showing left, blast, right
and back side views. Column SJ2 did not exhibit a ductile behavior subjected to blast loading,
but rather failed in shear at the base of the column as observed in Test 1 for Column RC1.
Figure 3-55 shows the column after Test 3 from a right side view. As shown in this figure by

72
lines showing the original position of the specimen, the column was tilted towards the back,
rotating around a point at the top of the column after the column sheared off at the bottom. The
steel jacketed column remained straight and no structural damage was observed along this
column. Figure 3-56 shows a dent of 14 mm (9/16 in) deep observed after the test, which had
not been seen before the test. Since this occurred 0.3 m above the height of the blast charge, it
was attributed to the possible presence of an air pocket inside the steel shell due to lack of
vibration during casting the concrete. This was not investigated further since this local
imperfection has no impact on the results.
A lateral displacement of the bottom of the column at the footing of about 78 mm (3 1/16 in) was
measured, as shown in Figure 3-57. Figure 3-58 shows the bottom of the column from a front
diagonal view. Figure 3-59 is a close-up picture of the footing from a front diagonal view. The
fracture of longitudinal bars coming out from the footing can be seen in this picture. All the
longitudinal bars at the bottom of the column were observed to be fractured. The bottom part of
the column from a back view is shown in Figure 3-60 and a close-up picture of the bottom part
of the column from the same view is shown in Figure 3-61. The fracture of the longitudinal bars
and the crushing of concrete inside the steel jacket at the bottom part of the column can be seen
in these photos.
Figures 3-62 to 3-64 show the top of the column from front, side and back views. Because of the
negative moment developed at the top of the column, a 6 mm (1/4 in) gap between the cap beam
and the column was observed on the front side, as shown in Figure 3-62, but no gap or crack was
observed there on the back side, as shown in Figure 3-64. Diagonal cracks were observed on the
bottom face of the cap beam developed from the column, as shown in Figure 3-65.
3.3.4.4 Test 4 for Column SJ1
Column SJ1 was tested using an explosion of charge weight W at a standoff distance of 3.25 X
and height of 0.25 m, which are the same blast parameters as Test 2 for Column RC2. Figure
3-66 illustrates the deformation and damage of the column after Test 4, showing left, blast, right
and back side views. As in Test 3 for Column SJ2, Column SJ1 failed in shear at the column
base. As shown in Figure 3-67 by lines showing the original position of the specimen, the

73
column was tilted towards the back side rotating around a point at the top of the column after the
column sheared off at the bottom. The steel jacketed column remained straight and no structural
damage was observed along the column as observed in Test 3 for Column SJ1.
The lateral displacement at the base of the column at the footing was 83 mm (3 1/4 in), as shown
in Figure 3-68. The deformed shapes of the two steel jacketed columns, namely Column SJ1 and
SJ2, were almost the same. All the longitudinal bars at the base of Column SJ1 were also
fractured. Figure 3-69 from front diagonal view shows the fractured longitudinal bars coming
out from the footing. A crack was observed along the welding seam of the steel tube on the back
side of the column base, as shown in Figure 3-70. Figures 3-71 and 3-72 show the bottom of the
column from back diagonal view. The column was sheared off from the footing surface at the
concrete joint. However, there was no crushing of concrete observed inside the steel jacket at the
column base on the back side. Making a comparison of this damage of the column base on the
back face with the one of Column RC2 of Test 2, in which blast parameters were the same, here
the concrete inside the steel jacket had not been damaged whereas the cover concrete of the RC
column was disengaged as previously shown in Figures 3-49 and 3-50 due to direct spalling.
From this comparison, it can be concluded that steel jacketing is effective to protect against
direct spalling of the concrete, even though it is ineffective to prevent the observed direct shear
failure.
Figures 3-73 to 3-74 show the top of the column from front and back views. Because of the
negative moment developed at the top of the column, a 6 mm (1/4 in) gap between the cap beam
and the column was observed on the front side, as shown in Figure 3-73. There were also some
cracks between the cap beam and the column top on the back side, as shown in Figure 3-74, but
these cracks closed at the center on the back side.
3.3.5 Summary The standard ductile RC and non-ductile RC columns retrofitted with steel jackets were not
found to exhibit a ductile behavior under blast loading, but rather failed in shear at the base,
contrary to the CFST columns which were shown to be effective to resist blast loadings in
previous experiments. The steel jacketed columns, although visually resembling the CFST
columns, are significantly different in construction due to the presence of gaps at the column top
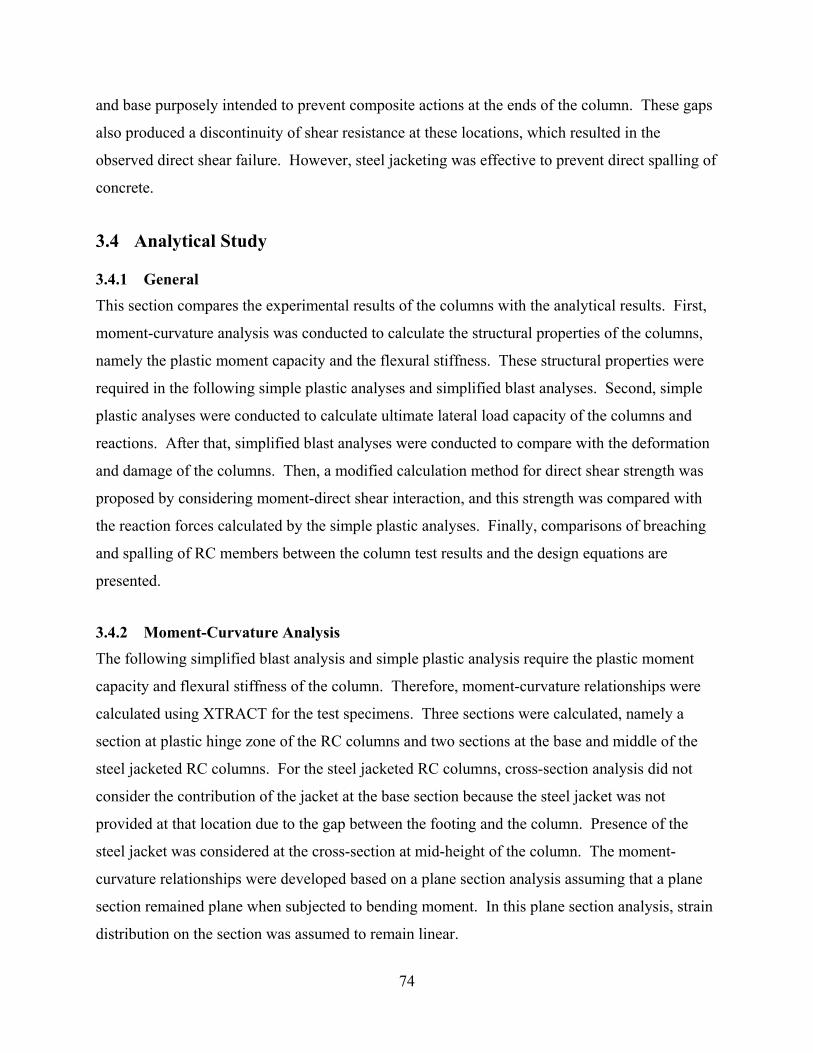
74
and base purposely intended to prevent composite actions at the ends of the column. These gaps
also produced a discontinuity of shear resistance at these locations, which resulted in the
observed direct shear failure. However, steel jacketing was effective to prevent direct spalling of
concrete.
3.4 Analytical Study
3.4.1 General This section compares the experimental results of the columns with the analytical results. First,
moment-curvature analysis was conducted to calculate the structural properties of the columns,
namely the plastic moment capacity and the flexural stiffness. These structural properties were
required in the following simple plastic analyses and simplified blast analyses. Second, simple
plastic analyses were conducted to calculate ultimate lateral load capacity of the columns and
reactions. After that, simplified blast analyses were conducted to compare with the deformation
and damage of the columns. Then, a modified calculation method for direct shear strength was
proposed by considering moment-direct shear interaction, and this strength was compared with
the reaction forces calculated by the simple plastic analyses. Finally, comparisons of breaching
and spalling of RC members between the column test results and the design equations are
presented.
3.4.2 Moment-Curvature Analysis The following simplified blast analysis and simple plastic analysis require the plastic moment
capacity and flexural stiffness of the column. Therefore, moment-curvature relationships were
calculated using XTRACT for the test specimens. Three sections were calculated, namely a
section at plastic hinge zone of the RC columns and two sections at the base and middle of the
steel jacketed RC columns. For the steel jacketed RC columns, cross-section analysis did not
consider the contribution of the jacket at the base section because the steel jacket was not
provided at that location due to the gap between the footing and the column. Presence of the
steel jacket was considered at the cross-section at mid-height of the column. The moment-
curvature relationships were developed based on a plane section analysis assuming that a plane
section remained plane when subjected to bending moment. In this plane section analysis, strain
distribution on the section was assumed to remain linear.

75
These analyses were conducted using the strength values obtained from the compression tests of
concrete cylinders and the tensile tests of reinforcement bars and steel plates from which the
steel jackets were fabricated. For the analyses, concrete strength, cf ′ , was taken as equal to 32.1
MPa (4.65 ksi). Young’s modulus, cE , was calculated by Equation 3-7 as per ACI (2004).
Yield strength and Young’s modulus of D-3 steel wire used as reinforcement (as described in
Section 3.2.5.2) were equal to 501 MPa (72.58 ksi) and 195,007 MPa (28,276 ksi), respectively.
Yield strength and Young’s modulus of the steel jacket were equal to 254 MPa (36.85 ksi) and
207,216 MPa (30,046 ksi), respectively. The above concrete strength and yield stress of steel
were multiplied by 1.25 and 1.2, respectively, to account for strength magnification at large
strain rates under impulsive conditions (Mays and Smith 1995). The Mander model presented in
Section 3.2.3.2 was used for the constitutive relationship of unconfined and confined concrete.
The stress-strain relationships for longitudinal bars and steel jacket were idealized using a bi-
linear elasto-perfectly plastic behavior. The details of section and material models are provided
in Appendix F.
Figures 3-75 to 3-77 present the results of moment-curvature analyses for the RC column
section, and for the steel jacketed RC column at base and middle sections, respectively. Solid
lines represent the results of these analyses and dashed lines represent the corresponding bi-
linear elasto-perfectly plastic curves used in the subsequent simple analyses. To simplify the
moment-curvature relationships, these bi-linear curves were obtained such that the energy under
the moment-curvature relationships of both curves was equal when reaching an ultimate
curvature displacement. The section properties obtained from the cross-section analyses are
summarized in Table 3-7. The details of how these results were obtained are provided in
Appendix F.

76
Table 3-7 Summary of Moment-Curvature Analyses
Section Effective
Yield Curvature 1/m (1/in)
Effective Yield MomentkN-m (kip-in)
Effective Flexural StiffnesskN-m2 (kip-in2)
Ultimate Curvature 1/m (1/in)
RC 0.030 (0.0008)
14.0 (124.0)
463.8 (161,600)
0.628 (0.0159)
SJ at bottom
0.020 (0.0005)
34.5 (305.0)
1698.2 (591,700)
0.508 (0.0129)
SJ at middle
0.032 (0.0008)
15.2 (134.6)
455.8 (158,800)
0.585 (0.0149)
3.4.3 Simple Plastic Analysis
Simple plastic analyses were conducted to calculate the ultimate lateral load capacity and
reactions of the RC column and the steel jacketed RC column. A simple plastic analysis is
suitable to calculate ultimate global structural capacities based on simple calculations. In this
analysis, a rigid-perfectly plastic hinge model is assumed with a zero-length plastic hinge. The
details of this analysis are presented in text books (such as in Bruneau at el. 1998). The step-by-
step method of analysis was selected. This analytical method follows the structural behavior
step-by-step, from the initial elastic stage up to collapse, through plastic hinging formations. The
blast pressure was assumed to load the column as a point load acting at the height of the blast
charge. Standard solutions presented in LRFD Manual of Steel Construction (AISC 2001) were
used to calculate moment diagrams and deflections of the columns because the target structure
was simply a beam fixed at both ends subjected to a concentrated load.
Figure 3-78 illustrates for the analyzed RC column, the incremental moment diagram and total
moment diagram for each analysis step. In Step 1, the point load was increased until the plastic
moment capacity, pM , of 14.0 kN-m (124.0 kip-in) previously calculated by moment curvature
analysis was reached at the base of the column. In Step 2, a modified structure fixed at the top
and supported at the bottom was used to calculate the incremental load that produced for the
additional load at which a plastic hinge at the height of the blast charge. Finally, in Step 3, a
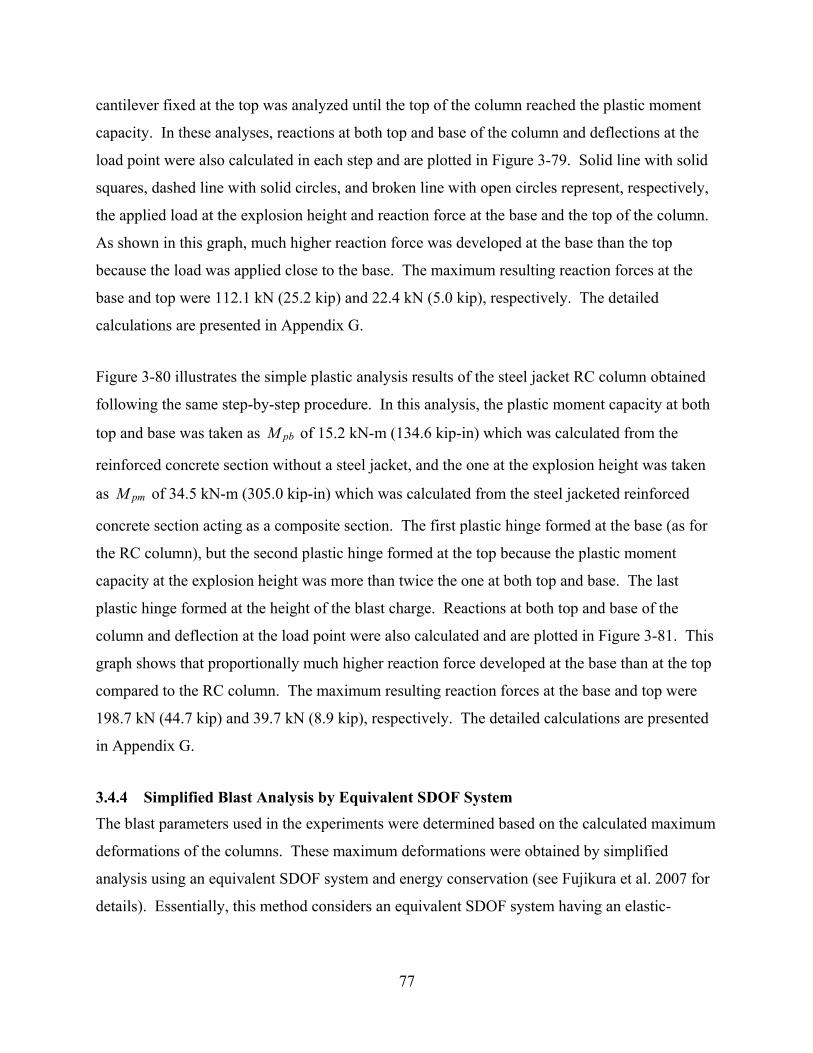
77
cantilever fixed at the top was analyzed until the top of the column reached the plastic moment
capacity. In these analyses, reactions at both top and base of the column and deflections at the
load point were also calculated in each step and are plotted in Figure 3-79. Solid line with solid
squares, dashed line with solid circles, and broken line with open circles represent, respectively,
the applied load at the explosion height and reaction force at the base and the top of the column.
As shown in this graph, much higher reaction force was developed at the base than the top
because the load was applied close to the base. The maximum resulting reaction forces at the
base and top were 112.1 kN (25.2 kip) and 22.4 kN (5.0 kip), respectively. The detailed
calculations are presented in Appendix G.
Figure 3-80 illustrates the simple plastic analysis results of the steel jacket RC column obtained
following the same step-by-step procedure. In this analysis, the plastic moment capacity at both
top and base was taken as pbM of 15.2 kN-m (134.6 kip-in) which was calculated from the
reinforced concrete section without a steel jacket, and the one at the explosion height was taken
as pmM of 34.5 kN-m (305.0 kip-in) which was calculated from the steel jacketed reinforced
concrete section acting as a composite section. The first plastic hinge formed at the base (as for
the RC column), but the second plastic hinge formed at the top because the plastic moment
capacity at the explosion height was more than twice the one at both top and base. The last
plastic hinge formed at the height of the blast charge. Reactions at both top and base of the
column and deflection at the load point were also calculated and are plotted in Figure 3-81. This
graph shows that proportionally much higher reaction force developed at the base than at the top
compared to the RC column. The maximum resulting reaction forces at the base and top were
198.7 kN (44.7 kip) and 39.7 kN (8.9 kip), respectively. The detailed calculations are presented
in Appendix G.
3.4.4 Simplified Blast Analysis by Equivalent SDOF System
The blast parameters used in the experiments were determined based on the calculated maximum
deformations of the columns. These maximum deformations were obtained by simplified
analysis using an equivalent SDOF system and energy conservation (see Fujikura et al. 2007 for
details). Essentially, this method considers an equivalent SDOF system having an elastic-

78
perfectly-plastic behavior, and assumes that all the energy imparted to the system by the blast
loading is converted into internal strain energy.
Under these conditions, the maximum deformation due to impulsive-type blast loading, mX , is
given by:
⎟⎟⎠
⎞⎜⎜⎝
⎛+= E
uLM
eqm X
RmKIX
2
21 (3-32)
where eqI is the equivalent uniform impulse per unit length, LMK is the load-mass factor, m is
the mass per unit length of the column, uR is the strength per unit length of the column and EX
is the displacement at the onset of plastic behavior. In this analysis, eqI was calculated by:
eqeq iDI β= (3-33)
where eqi is the equivalent uniform impulse per unit area, D is the column diameter and β is
the factor to account for the reduction of pressures on the circular column due to its circular
shape. This factor β could be taken as 0.45. This value of 0.45 was obtained from previous
blast test results of CFST columns by comparing the observed maximum deformations with the
results predicted by this simplified analysis.
The quantity of this equivalent uniform impulse per unit area, eqi , in Equation 3-33 was
calculated by:
( ) ( )
( )∫∫
δ
δ= H
H
eqdzz
dzzzii
0
0 (3-34)
where ( )zi indicates the variation of impulse per unit area along the height of the column and
( )zδ is the normalized deflected shape of the column. In this analysis, ( )zi was taken as the
envelop of maximum impulse (per unit area) at any time along the height of the column. Values
of ( )zi were calculated using the program Bridge Explosive Loading (BEL 2004). BEL
generates airblast pressures considering reflections of the blast wave on the deck and on the
ground. The resulting values of ( )zi are qualitatively shown in Figure 3-82 for Test 1 and Test 3
and in Figure 3-83 for Test 2 and Test 4 along with the envelop of maximum pressure along the
height of the columns. Assuming that the in-span hinge develops at the height of the blast charge

79
and both top and base of the column, the normalized deflected shape, ( )zδ , for inelastic
deformations after plastic hinging is given as a system of rigid-link members between those
plastic hinges.
For the boundary conditions and this deflected shape, the load-mass factor is LMK = 0.66 and ur
is given by 228.8u pr M L= where L is the height of the column, and pM is the plastic moment
capacity of the column calculated by XTRACT as presented previously. Finally, EX is given by
euE KrX = where eK , the unit elastic stiffness of the equivalent SDOF system, is given by
4307e eK EI L= . The flexural stiffness of the column, eEI , was also calculated by XTRACT.
Detail calculations of these simplified blast analyses are presented in Appendix H.
The results of these simplified analyses of Column RC1 for Test 1 and Column RC2 for Test 2
are summarized in Table 3-8. The maximum deformation (total elastic and plastic deformation)
and plastic rotation at bottom respectively resulted in 19.2 mm and 4.4 deg for Test 1 and 9.5
mm and 2.2 deg for Test 2. The objective of Test 1 and Test 2 were respectively to induce
extensive plastic rotation of the column base and minor damage to the column base as presented
in Section 3.3.3 about the test cases. Although Column RC1 after Test 1exhibited some level of
inelastic flexural deformations, the magnitude of plastic rotation that happened before direct
shear failure can not be reliably calculated for a lack of the reference point at the base of the
column. From the measured deformations of Column RC2 after Test 2, the plastic rotation at the
base of this column was 2.5 deg (0.043 rad) calculated from the experimental maximum
deformation of 16 mm at a height of 370 mm from the base. This experimentally obtained
rotation was larger than the prediction of 2.2 deg calculated by the simplified analysis because
the bottom part of the column itself also deformed in shear, which was not considered in this
analysis, occurred in the experiment.

80
Table 3-8 Summary of Results of Simplified Blast Analysis (RC Tests)
Test Num. and Column
Equivalent Uniform Impulse
MPa-msec (psi-msec)
Ultimate resistance
kN/m (kip/in)
Yield Deformation
mm (in)
Maximum Deformation
mm (in)
Plastic Rotation at
Bottom θ
Test 1 RC1
6.07 (880.7)
180 (1.03)
6.4 (1/4)
19.2 (3/4) 4.4
Test 2 RC2
3.81 (552.0)
180 (1.03)
6.4 (1/4)
9.5 (3/8) 2.2
3.4.5 Direct Shear Resistance of Test Column Direct shear resistance of the test columns was compared with the reaction forces calculated by
simple plastic analyses in the previous subsection. The literature related to the ultimate capacity
of direct shear subjected to static loads was reviewed and presented in literature review, but no
equations were found in the public domain literature to quantify its resistance under dynamic
loads. Consequently, the direct shear resistance of test specimens was calculated using Equation
2-12 developed for static loads. The effect of dynamic loading was considered by incorporating
the strain rate effect on material properties into this equation through dynamic increase factors.
By considering the dynamic increase factors, Equation 2-12 is modified to become:
10.8n vf y sy c cV A f D A K D= + (3-35)
where syD and cD are, respectively, the dynamic increase factors for yield stress of steel and for
concrete strength. syD and cD were taken as 1.2 and 1.25, respectively (Mays and Smith 1995).
Because the RC column section and the steel jacketed RC column section at the base of the
columns had the same configuration and materials, they were calculated to have the same direct
shear resistance as given by Equation 3-35. For 309.6vfA = mm2, 501yf = MPa, 32365cA =
mm2 and 1 2.8K = MPa, the direct shear resistance, nV , of the tested columns is 262.2 kN (58.9
kip). This resistance is larger than the maximum reaction forces at the bottom of the columns
calculated by the simple plastic analyses presented in Section 3.4.3, namely 112.1 kN and 238.4
kN for the RC column and the steel jacketed RC column, respectively. This calculation

81
indicated that those columns would not fail in direct shear at the base. However three of the test
columns were found to fail in direct shear at their base during the experiments.
To explain the direct shear behavior observed in the tests, it was decided to investigate the
possible reduction of direct shear strength in a plastic hinge region. When a large bending
moment is applied at the reinforced concrete section, cracking occurs in the tension zone of the
concrete section. At that point, flexure is resisted by the compression zone of the section and the
steel reinforcement in the tension zone of the section. Direct shear resistance given by Equation
2-48 is the sum of the cohesion and friction resistance along the direct shear interface. In this
calculation, the parts on both sides of the direct shear interface fully contact each other.
However, on the cracked section under bending moment, the compression zone of the section is
deemed to only contact along that section. This is particularly the case in regions of plastic
hinging. Therefore, because, as observed experimentally and from simple plastic analyses, a
plastic moment was developed at the base of the column, the above is considered to develop a
moment-direct shear interaction. For this model, only the part of the section in compression is
assumed to be able to resist the shear force since direct shear resistance is deemed unable to
develop when two surfaces do not contact each other.
Figure 3-84 schematically shows a reinforced concrete section subjected to a bending moment
used to formulate the moment-direct shear interaction model. This model is based on plane
section analysis assuming that plane section remained plane when subjected to bending,
consistently with all earlier moment-curvature analyses. The part of the section hatched in
Figure 3-84 is in compression. By replacing vfA and cA in Equation 3-35 with vfA ′ and cA ′ ,
respectively, the modified direct shear resistance, nV ′ , is given by:
10.8n vf y sy c cV A f D A K D′ ′ ′= + (3-36)
where vfA ′ and cA ′ are the area of longitudinal reinforcement and concrete in compression zone
as shown in Figure 3-84. The position of neutral axis needs to be determined to calculate this
compression zone. This neutral axis position was calculated by moment-curvature analysis as
described in the previous subsection.

82
Figures 3-85 and 3-86 compare the new direct shear resistance at the base of the columns
calculated per the above modified procedure with the shear force developed at the base of RC
columns and steel jacketed RC columns, respectively, varying as a function of the moment
developed at the base. These direct shear resistance were calculated by Equation 3-36, and the
shear forces were obtained from the simple plastic analyses. A solid curve with open circles and
a dashed line represent the direct shear resistance and the shear force developed, respectively, in
these figures. For both columns, as the moment increases, the direct shear resistance decreases
due to the shift of the neutral axis position towards the outer compression fiber. Obviously, a
larger shear force demand develops at the column base as the moment increases due to the
increase of the applied load. The intersection of these curves is the point where the shear force is
equal to the direct shear resistance. This point occurs at a shear force of 63.0 kN (14.2 kip) and a
corresponding moment of 11.8 kN-m (104.5 kip-in) for the RC column, and a shear force of 63.6
kN (14.3 kip) and the moment of 11.9 kN-m (105.5 kip-in) for the steel jacketed RC column.
Figures 3-85 and 3-86 also show that direct shear failure was deemed to occur in both columns
before the first plastic hinge develops at the base of the columns. According to these results, it
appears that this moment-direct shear interaction model correctly allows capturing the
experimentally observed behavior. Note that this moment-direct shear interaction model is to be
compared with static shear force developed from the simple plastic mechanism.
3.4.6 Breaching and Spalling Resistance Breaching and spalling of the bottom part of the column were observed at the RC columns in
Test 1 and Test 2, respectively. Therefore, the required thickness to prevent breaching and
spalling were calculated for Test 1 and Test 2 to compare with the test specimens according to
the design equations presented in the literature review section. The minimum thickness to
prevent breaching, bt , and spalling, st , are given by Equations 2-8 and 2-9, respectively. Note
that these equations were derived from test data for reinforced concrete slabs.
Figure 3-28 compares the damage of Column RC1 and RC2 with their envelopes of maximum
pressure distributions calculated by BEL. The higher pressures act around the bottom of the
columns because of the reflection of the pressures on the ground. The maximum pressures in
these envelopes were 160.7 MPa (23.3 ksi) in Test 1 and 82.1 MPa (11.9 ksi) in Test 2. The

83
minimum thickness of RC slabs is calculated using the blast standoff distance and charge weight
by Equations 2-8 and 2-9. These equations are based on the airburst blast, and the reflection of
pressure on the ground is not considered in these equations. Therefore, to consider this pressure
magnification due to the reflection of the pressures on the ground, the blast standoff distance and
explosive charge weight need to be adjusted to calculate the minimum thickness required when
subjected to the high pressure reflected on the ground. These parameters were calculated back
from the maximum pressures by using the public domain computer program AT-Blast (ARA
2004).
Using this approach, the required thickness to prevent breaching and spalling for Test 1 were
calculated to be 358 mm (14.1 in) and 461 mm (18.2 in), respectively. For Test 2, the resulting
required thickness was 304 mm (12.0 in) and 392 mm (15.4 in) for breaching and spalling,
respectively. These thickness values were larger than the column diameter of 203 mm (8 in).
Therefore, these calculations indicated that RC slabs with a thickness of 203 mm would undergo
breaching when subjected to the blast pressures used in both tests. According to the
experimental results, breaching was observed in Test 1, but spalling was observed in Test 2
instead of breaching as shown in Figure 3-43. Therefore, these equations based on RC slabs
could be too conservative to quantify the breaching and spalling resistance of reinforced concrete
circular columns. Also, these equations are possibly not applicable to seismically detailed
ductile reinforce concrete columns since the RC slabs, for which these equations have been
derived, are not typically detailed well with similarly closely spaced reinforcement. Note that no
equation was found in the public domain literature to quantify the breaching and spalling
resistance of circular shape reinforced concrete columns.

84
18
38
59
80
102
123
144
165
188
216
242
263
285
309
328
347
367
379
HorizontalDeformation
(mm)
6613
817
@76
(b) Blast Side (d) Back Side(a) Left Side (c) Right Side
Explosion25
0
(b) Blast (E) Side
(d) Back (W) Side
(a)Left (S)
Side
(c)Right (N)
Side
Explosion
3
2
3
1
2Crack Width
(mm)
10 longitudinal barsfractured out of 16.
All longitudinalbars fractured.
Gap:40 (mm)
Figure 3-29 Sketch of Column RC1 after Test 1
Figure 3-30 Left Side View of Column RC1 (Test 1)
Figure 3-31 Front View of Column RC1 (Test 1)

85
Figure 3-32 Column RC1 at Bottom (Test 1)
Figure 3-33 Fracture Surface of Footing at Column RC1 (Test 1)
Figure 3-34 Fracture of Longitudinal Steel Bars at Footing (Test 1)
Figure 3-35 Right Side View of Column RC1 at Bottom (Test 1)

86
Figure 3-36 Left Side View of Column RC1 at Bottom (Test 1)
Figure 3-37 Front Diagonal View of Column RC1 around Charge Height
Figure 3-38 Left Side View of Column RC1 at Top (Test 1)
Figure 3-39 Right Side View of Column RC1 at Top (Test 1)

87
Figure 3-40 Front View of Column RC1 at Top (Test 1)
Figure 3-41 Fracture interface of Column RC1 at Top (Test 1)
Figure 3-42 Back Diagonal View of Column RC1 at Top (Test 1)
88
1
3
5
7
8
11
12
12
13
14
15
16
16
15
16
15
14
HorizontalDeformation
(mm)
6613
817
@76
Explosion
13
250
(b) Blast Side (d) Back Side(a) Left Side (c) Right Side
Gap:4 (mm)
(b) Blast (E) Side
(d) Back (W) Side
(a)Left (S)
Side
(c)Right (N)
Side
Explosion
Figure 3-43 Sketch of Column RC2 after Test 2
Figure 3-44 Front Diagonal View of
Column RC2 (Test 2) Figure 3-45 Back Diagonal View of
Column RC2 (Test 2)
89
Figure 3-46 Front View of Column RC2
(Test 2) Figure 3-47 Front Diagonal View of
Column RC2 at Bottom (Test 2)
Figure 3-48 Right Side View of Column RC2 at Bottom (Test 2)
Figure 3-49 Left Side View of Column RC2 at Bottom after Cover Concrete
Removal (Test 2)
Reference Line

90
Figure 3-50 Right Side View of Column RC2 at Bottom after Cover Concrete
Removal (Test 2)
Figure 3-51 Right Diagonal Front View Column RC2 at Top (Test 2)
Figure 3-52 Left Diagonal Front View of Column RC2 at Top (Test 2)
Figure 3-53 Back View of Column RC2 at Top (Test 2)

91
Unconfinedconcretecrush
Dent14 mm deep
1
6
10
17
19
21
24
28
32
37
40
45
50
52
57
62
67
71
HorizontalDeformation
(mm)
6669
18@
76
Explosion
75
250
Dent
Steel jacketbulge
Steel jacketbulge
(b) Blast Side (d) Back Side(a) Left Side (c) Right Side
Gap:6 (mm)
All longitudinalbars fractured.
(b) Blast (E) Side
(d) Back (W) Side
(a)Left (S)
Side
(c)Right (N)
Side
Explosion
Figure 3-54 Sketch of Column SJ2 after Test 3
Figure 3-55 Right Side View of Column SJ2 (Test 3)
Figure 3-56 Void at Column SJ2 after Test 3

92
Figure 3-57 Drift of Column SJ2 at Bottom (Test 3)
Figure 3-58 Front Diagonal View of Column SJ2 at Bottom (Test 3)
Figure 3-59 Fractures of Longitudinal Bars Column SJ2 at Bottom
(Diagonally Front View, Test 3)
Figure 3-60 Back Diagonal View of Column SJ2 at Bottom (Test 3)

93
Figure 3-61 Close-in Back View of Column SJ2 at Bottom (Test 3)
Figure 3-62 Front View of Column SJ2 at Top (Test 3)
Figure 3-63 Left Side View of Column SJ2 at Top (Test 3)
Figure 3-64 Back View of Column SJ2 at Top (Test 3)

94
1
6
10
15
19
23
27
31
35
39
44
49
52
56
61
65
71
74
HorizontalDeformation
(mm)
6669
18@
76
Explosion
79
250
Dent6 mm deep
Unconfinedconcrete crush(Blast side)
(b) Blast Side (d) Back Side(a) Left Side (c) Right Side
All longitudinalbars fractured.
Gap:6 (mm)
Crackat welding ofsteel jacket
(b) Blast (E) Side
(d) Back (W) Side
(a)Left (S)
Side
(c)Right (N)
Side
Explosion
Figure 3-66 Sketch of Column SJ1 after Test 4
Figure 3-65 Cracks at Cap Beam of Column SJ2 (Test 3)

95
Figure 3-67 Left Side View of Column SJ1 (Test 4)
Figure 3-68 Drift of Column SJ1 at Bottom (Test 4)
Figure 3-69 Fracture of Longitudinal Steel Bars at Footing (Front Diagonal View,
Test 4)
Figure 3-70 Cracking of Steel Tube at Bottom of Column SJ1 at Bottom (Front
Diagonal View, Test 4)
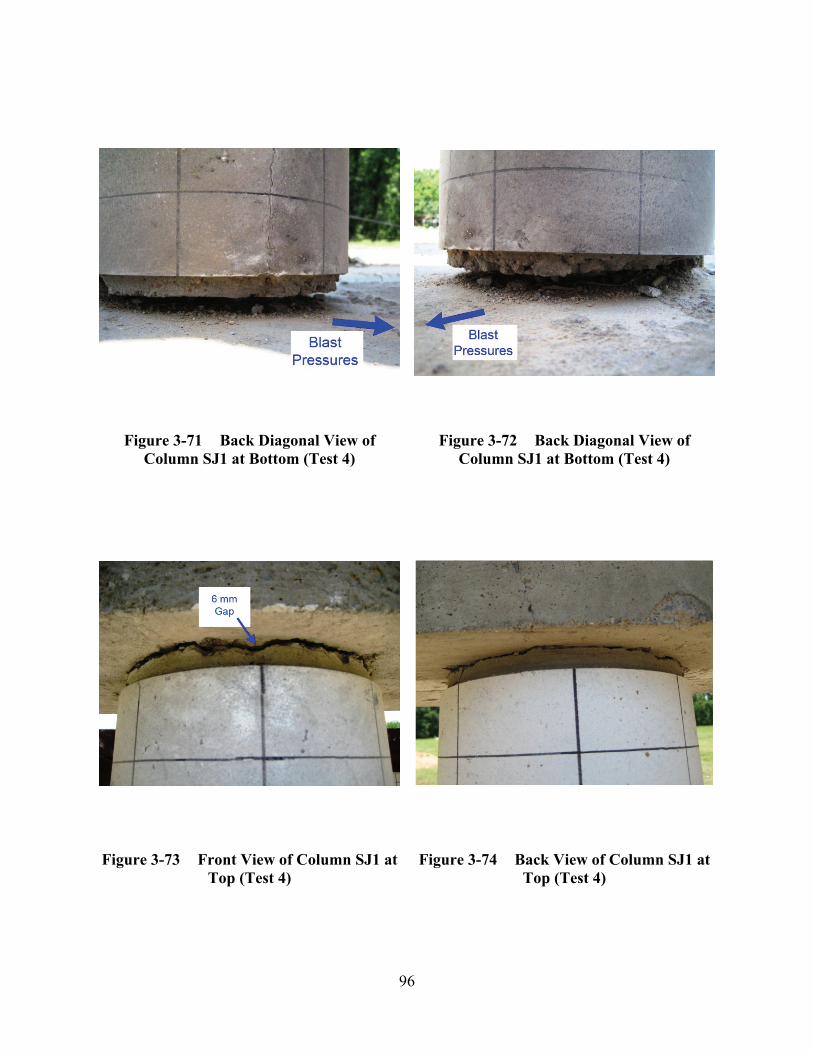
96
Figure 3-71 Back Diagonal View of Column SJ1 at Bottom (Test 4)
Figure 3-72 Back Diagonal View of Column SJ1 at Bottom (Test 4)
Figure 3-73 Front View of Column SJ1 at Top (Test 4)
Figure 3-74 Back View of Column SJ1 at Top (Test 4)

97
0
5
10
15
20
0 0.1 0.2 0.3 0.4 0.5 0.6 0.7 0.8
Moment Curvature Curve
Moment Curvature Bilinearization
0
50
100
150
0 0.005 0.01 0.015 0.02M
omen
t (kN
-m)
Curvature (1/m)
(kip
-in)
(1/in)
Figure 3-75 Moment-Curvature Relationship for RC column
0
10
20
30
40
0 0.1 0.2 0.3 0.4 0.5 0.6 0.7 0.8
Moment Curvature Curve
Moment Curvature Bilinearization
0
100
200
300
0 0.005 0.01 0.015 0.02
Mom
ent (
kN-m
)
Curvature (1/m)
(kip
-in)
(1/in)
Figure 3-76 Moment-Curvature Relationship for Steel Jacketed RC column at Middle
Section

98
0
5
10
15
20
0 0.1 0.2 0.3 0.4 0.5 0.6 0.7 0.8
Moment Curvature Curve
Moment Curvature Bilinearization
0
50
100
150
0 0.005 0.01 0.015 0.02M
omen
t (kN
-m)
Curvature (1/m)
(kip
-in)
(1/in)
Figure 3-77 Moment-Curvature Relationship for Steel Jacketed RC column at bottom
Section

99
1250
250
(1-a) Analyzed Structure (1-b) Incremental Moment Diagram
(1-c) Total Moment Diagram
2.8 kN-m(0.20 Mp)
14.0 kN-m(Mp)
4.7 kN-m(0.34 Mp)
0.20 Mp
0.34 Mp
Mp
1250
250
(2-a) Analyzed Structure (2-b) Incremental Moment Diagram
(2-c) Total Moment Diagram
6.0 kN-m(0.43 Mp)
9.3 kN-m(0.66 Mp)
0.63 Mp
Mp
Mp
1250
250
(3-a) Analyzed Structure (3-b) Incremental Moment Diagram
(3-c) Total Moment Diagram
5.2 kN-m(0.37 Mp)
Mp
Mp
Mp
Step 1
Step 2
Step 3
P
P
P
Figure 3-78 Step-by-step Plastic Analysis of RC Column

100
0
50
100
150
200
0 5 10 15 20
Applied ForceReaction Force at BaseReaction Force at Top
0
10
20
30
40
0 0.2 0.4 0.6
Forc
e (k
N)
Deflection (mm)
(kip
)
(in)
Figure 3-79 History of Load versus Deflection at Load Point for RC Column

101
1250
250
(1-a) Analyzed Structure (1-b) Incremental Moment Diagram
(1-c) Total Moment Diagram
3.0 kN-m(0.20 Mpb)
15.2 kN-m(Mpb)
5.1 kN-m(0.15 Mpm)
0.20 Mpb
0.34 Mpm
Mpb
1250
250
(2-a) Analyzed Structure (2-b) Incremental Moment Diagram
(2-c) Total Moment Diagram
12.2 kN-m(0.80 Mpb)
18.8 kN-m(0.54 Mpm)
Mpb
0.69 Mpm
Mpb
1250
250
(3-a) Analyzed Structure (3-b) Incremental Moment Diagram
(3-c) Total Moment Diagram
10.6 kN-m(0.31 Mpm)
Mpb
Mpm
Mpb
Step 1
Step 2
Step 3
P
P
P
Figure 3-80 Step-by-step Plastic Analysis of Steel Jacketed RC Column

102
0
100
200
300
0 5 10 15 20
Applied ForceReaction Force at BaseReaction Force at Top
0
20
40
60
0 0.2 0.4 0.6
Forc
e (k
N)
Deflection (mm)
(kip
)
(in)
Figure 3-81 History of Load versus Deflection at Load Point for RC Column
0
0.5
1
1.5
0 5 10 15
0 1 2
0
1
2
3
4
Col
umn
Hei
ght (
m)
Impulse per Unit Area (MPa-msec)
Impulse per Unit Area (ksi-msec)
Col
umn
Hei
ght (
ft)
0
0.5
1
1.5
0 50 100 150 200
0 5 10 15 20 25
0
1
2
3
4
Col
umn
Hei
ght (
m)
Pressure (MPa)
Pressure (ksi)
Col
umn
Hei
ght (
ft)
Figure 3-82 Variation of Impulse and Peak Pressure along Height of Column for Column RC1 (Test 1) and SJ2 (Test 3)

103
0
0.5
1
1.5
0 5 10 15
0 1 2
0
1
2
3
4
Col
umn
Hei
ght (
m)
Impulse per Unit Area (MPa-msec)
Impulse per Unit Area (ksi-msec)
Col
umn
Hei
ght (
ft)
0
0.5
1
1.5
0 50 100 150 200
0 5 10 15 20 25
0
1
2
3
4
Col
umn
Hei
ght (
m)
Pressure (MPa)
Pressure (ksi)
Col
umn
Hei
ght (
ft)
Figure 3-83 Variation of Impulse and Peak Pressure along Height of Column for Column RC2 (Test 2) and SJ1 (Test 4)
Moment
Strain Distribution
Testion
CompressionAvf '
Ac '
CL
Figure 3-84 RC Column under Bending Moment

104
0
100
200
300
0 2 4 6 8 10 12 14
Shear Resistance
Shear Force
0
20
40
60
0 20 40 60 80 100 120
Forc
e (k
N)
Moment at Base (kN-m)
(kip
)
(kip-in)
Forming 1st Plastic Hinge at Base
Figure 3-85 Comparison of Shear Resistance with Shear Force at Base of RC Column
0
100
200
300
0 5 10 15
Shear Resistance
Shear Force
0
20
40
60
0 20 40 60 80 100 120
Forc
e (k
N)
Moment at Base (kN-m)
(kip
)
(kip-in)
Forming 1st Plastic Hinge at Base
Figure 3-86 Comparison of Shear Resistance with Shear Force at Base of Steel
Jacketed RC Column

105
0 50 100 150Max Pressure Distribution
(MPa) 0 50 100Max Pressure Distribution
(MPa)116
117
Con
cret
eS
palli
ng
Con
cret
eS
palli
ng
Explosion Explosion
(a) Column RC1, Test 1 (b) Column RC2, Test 2 Figure 3-87 Comparison of RC Column Damages and Pressure Distributions
Max Pressure Distribution (MPa)
Max Pressure Distribution(MPa)
(a) Column SJ2, Test 3 (b) Column SJ1, Test 4
0 50 100 150 (MPa)
116
Con
cret
eSp
allin
g
Explosion
0 50 100(MPa)
117
Con
cret
eSp
allin
g
Explosion
Figure 3-88 Comparison of SJ Column Damages and Pressure Distributions


107
SECTION 4 DYNAMIC ANALYSIS OF BRIDGE PIER SUBJECTED TO
BLAST LOADING
4.1 Introduction Two series of blast tests on three different types of bridge columns showed that the performance
of the proposed system of multi-column bent with CFST columns was superior to that of
comparable seismically ductile RC columns and steel jacketed non-ductile RC columns. In fact,
the seismically ductile RC columns and steel jacketed non-ductile RC columns failed to perform
in a ductile manner when subjected to blast loading. Therefore, the rest of this report mainly
focuses on analysis methods to capture the ductile response of the proposed CFST bridge pier
columns subjected to blast loading. However, for the sake of obtaining shear forces for direct
shear, an alternative analytical method is performed for the RC columns and steel jacketed RC
columns.
As presented in the literature review, there is a variety of analytical methods available to
compute the response of structures subjected to blast loading ranging from a simplified analytical
method using a SDOF system to a finite element model (FEM). The objectives of the dynamic
analyses conducted here are to develop the design tools to calculate the blast response of circular
shaped bridge columns, and to understand the behavior of these bridge columns subjected to
blast loading. For these purposes, in this research project, three different analytical methods
have been adopted to replicate the behavior of the tested bridge columns subjected to blast
loading, namely simplified analysis, SDOF dynamic analysis, and fiber-based dynamic analysis.
The first analytical method, simplified analysis, was presented and was compared with the test
results of CFST columns (Fujikura et al. 2007, 2008) and of RC columns and steel jacketed RC
columns in Section 3.4.4. Here, the results obtained using the other two blast analysis methods,
namely SDOF dynamic analysis, and fiber-based dynamic analysis, are compared with the
experimental results.

108
The shape factor β , which is meant to represent the effect of the shape of the column in
reducing the applied blast pressure, is unavoidably affected by some assumptions used in the
simplified analytical model. So, if a more sophisticated analysis model is used and some of these
assumptions are removed, it would be incorrect to use the same β value as developed for the
simplified method. Therefore, the factor β needs to be reevaluated if more sophisticated
analysis methods are used to eliminate some of these assumptions.
Following this section introduction, the experimental results for the two series of blast tests on
three different types of columns are summarized before presenting the blast dynamic analyses.
Then, the three analytical methods used in this research are compared. Next, the SDOF dynamic
analysis is presented. After that, fiber-based analytical model is discussed, along with
verification of this fiber-based analytical model based on quasi-static cyclic loading tests done by
various researchers, and then the dynamic analysis results obtained using this fiber-based model
are presented. Finally, results obtained using the three different analysis methods are
summarized.
4.2 Summary of Bridge Pier Tests Subjected to Blast Loading This subsection summarizes the experimental results of two series of blast tests to the three
different types of columns previously tested, because this information will be used in the
subsequent blast dynamic analyses using SDOF model and fiber-base model presented later.
Recall that, in the first series of blast tests, a multi-hazard bridge pier system, namely a pier bent
with CFST columns, was proposed and its behavior was experimentally investigated when
subjected to blast loading (Fujikura et al. 2007, 2008). Also, in Section 3, two types of
seismically designed conventional bridge pier columns were investigated, namely ductile RC
columns and non-ductile RC columns retrofitted with steel jackets, Table 4-1 summarizes the
blast parameters and test results of all those test cases. The side view of these blast situations of
these detonations to the column is schematically illustrated in Figure 4-1.

109
Table 4-1 Summary of All Column Test Cases and Results
Blast Parameters Test Results
Test Num Column Charge
Weight Standoff Distance
Scaled Distance Height Residual
Displ. Experimental Observations
13
X
W (m) (mm)
Prototype --- --- 3.74 1.0 N/A N/A
1st S
erie
s
1-1 CFST C4 0.1 W 3 X 6.46 0.25 0 No Damage
1-2 CFST C4 0.55 W 3 X 3.66 0 No Damage
1-3 CFST C4 2 X 2.00 0.75 30 Flexural
1-4 CFST C6 1.1 X 1.10 46 Flexural
1-5 CFST C5 1.3 X 1.30 76 Flexural
1-6 CFST C4 1.6 X 1.60 24 Flexural
1-7 CFST C4 W 0.6 X 0.60 395 Flexural (Steel Fracture)
1-9 CFST C6 0.8 X 0.80 45 Flexural
1-10 CFST C5 0.8 X 0.80 0.25 100 Flexural (Steel Fracture)
2nd S
erie
s
2-1 RC1 2.16 X 2.16 N/A Direct Shear
2-2 RC2 3.25 X 3.25 N/A Onset of Direct Shear
2-3 SJ2 2.16 X 2.16 N/A Direct Shear
2-4 SJ1 3.25 X 3.25 N/A Direct Shear

110
ReactionFrame
250
750
StandoffDistance(in X)
W
0.55W0.10W
321.31.61.10.6
0.8
Test 1-1
Test 1-2Test 1-3
Test 1-7
Test 1-4
Test 1-9,10 Test 1-6
Test 1-5
CFST Tests
W
RC, SJ Tests
Test 2-1,3 Test 2-2,4
2.16 3.25 Figure 4-1 Comparison of Test Blast Parameters
(1a) CFST C4 Column
102 127 152
(2b) Steel JacketedColumn
(2a) RC Column
203
Mp = 15.1 kN-m Mp = 16.5 kN-m Mp = 40.5 kN-m
(1b) CFST C5 Column
(1c) CFST C6 Column
213
Mp = 14.0 kN-m Mp = 15.2 kN-m
Tests 1-1,1-2, 1-3 and 1-6 Tests 1-5 and 1-10 Tests 1-4 and 1-9
Tests 2-1 and 2-3 Tests 2-2 and 2-4
Figure 4-2 Comparison of Tested Column Sections and Moment Capacities

111
Figure 4-2 compares the cross-section and moment capacity of the tested CFST C4, C5 C6
columns, RC column and steel jacketed column. The moment capacity of CFST columns was
calculated using the Bruneau and Marson (2004) equations, and that of RC column and steel
jacketed RC column was obtained from the moment-curvature analyses presented in Section
3.4.2. As shown in Figure 4-2, the moment capacity of the CFST C4 column is comparable to
that of the RC column and steel jacketed column. Being all ductile members of nearly identical
strength, these three columns would be expected to perform equally well when subjected to
seismic loading. Note that these columns are detailed to resist the shear force due to flexural
hinging at the ends of the column. That would develop due to the earthquake loading. As shown
in Table 4-1, the standoff distance of Test 1-6 for CFST C4 column is closer than that of Test 2-1
for RC1 column and Test 2-3 for SJ2 column. Although CFST C4 column was subjected to the
larger blast pressures due to the closer standoff distance, it exhibited a ductile behavior under the
blast loading while both RC1 column and SJ2 column failed in shear at their bases. From this
observation, even though CFST, RC and steel jacketed RC columns perform equally well under
seismic loading, only the CFST column would perform well under blast loading. This is
attributed to the inadequate direct shear resistance at the base of the RC and steel jacketed RC
column.
While the above is useful in quantifying the relative performance of these structural systems, it is
instructive to review each of column types would have performed for the terrorist attack scenario
assumed in this research (Sections 3.2.2). The basis of comparison for the experimental results
with the prototype is achieved through the use of scaled distance concept. The scaled distance of
the prototype is 3.74 (in 1 3X W ) as shown Table 4-1, which is calculated from the charge
weight and standoff distance of the terrorist attack scenario assumed in Sections 3.2.2. Since no
damage was observed to CFST C4 column in Test 1-2 whose scale distance of 3.66 is smaller
than that of the assumed blast scenario, this indicates the CFST columns would perform well to
resist the assumed terrorist attack. Recall that the CFST column was originally designed
assuming the β valued of 0.85 and expected the ductility of 7% which did not occur because the
actual β valued for this type of column discovered to be 0.45 using the simplified analyses.
From Test 2-3 which has the scale distance of 3.25, direct spalling of the cover concrete at the
bottom of RC2 column and the shear deformation at this location were observed. Therefore,

112
when subjected to the assumed terrorist attack with slightly larger scale distance of 3.74, a
seismically designed ductile reinforced concrete column would exhibit at most the minor damage
of spalling cover concrete. Since SJ1 column failed in direct shear at the base of the column in
Test 2-4 with a 3.25 scaled distance, steel jacketed reinforced concrete column would be
expected to fail in shear at the base when subjected to the assumed terrorist attack with a slightly
larger scale distance of 3.74. However, the assumed attack scenario. For other scenarios in
which the explosive charge would be increased, it is clear from Figure 4-1 that the RC column
(Test 2-1) and steel jacketed RC column (Test 2-3) would fail in shear at the base, but the CFST
column (Test 1-6) would provide the greater robustness against the larger explosive charge.
4.3 Selection of Analytical Methods As presented previously, three different analytical methods were adopted in this research, namely
simplified analysis, SDOF dynamic analysis, and fiber-based dynamic analysis. Table 4-2
compares these analytical methods in terms of the analytical options presented in Section 2.6.
Table 4-2 Comparison of Analytical Methods
Simplified Analysis
SDOF Dynamic Analysis
Fiber-based Dynamic Analysis
1. Analytical Procedure Dynamic (Impulse)
Dynamic (Pressure-History)
Dynamic (Pressure-History)
2. Interaction between Structure and Blast Loading Uncoupled Uncoupled Uncoupled
3. Descretization of Structure SDOF SDOF MDOF 2D Fiber-Based
4. Material Nonlinearity Inelastic Inelastic Inelastic
5. Geometric Nonlinearity Nonlinear Nonlinear Nonlinear

113
The common options between these three analytical methods are that: (a) they are dynamic
analysis, (b) the structure and the blast loading are uncoupled, (c) material nonlinearity is
considered, and (d) geometric nonlinearity is not considered. The uncoupled analysis is chosen
because this analysis is commonly used in the practical design of structures under dynamic
loading and provides reasonable results, as discussed in literature review. The material
nonlinearity should be included here because all materials behaved in the inelastic range under
the blast pressures considered in this research. The blast experimental program shown in the
previous sections was done without axial forces in the columns. Therefore, the geometric
nonlinearity is not considered in the analysis because the moment magnification (namely P-δ
effect) associated with large deformation and axial force is small and negligible in these tests.
Between these analyses, the dynamic load is applied differently, and the structure is discretized
differently. As presented previously, the simplified analysis uses the concept of equivalent
impulse to calculate the maximum deformation assuming that all the energy imparted to the
system by the blast loading is converted into internal strain energy. This analytical method
provides acceptable results when the blast pressure duration is much shorter than the natural
period of the structure (i.e. impulsive loading condition). The SDOF dynamic analyses and
fiber-based dynamic analyses are conducted using the equivalent uniform pressure-history and
the actual pressure-history, respectively, generated by the program Bridge Explosive Loading
(BEL 2004). As for the discretization of the structure, the simplified analysis and the SDOF
dynamic analysis use the same SDOF lumped-mass system (equivalent SDOF system) whereas
the columns are modeled by the 2D fiber-based beam model in the fiber-based dynamic analysis.
4.4 SDOF Dynamic Analysis 4.4.1 General
Experimentally obtained maximum residual deformations of the tested columns were compared
with the ones that could be calculated using the SDOF dynamic response history analyses. These
analyses were conducted for the six test cases of CFST columns for which residual plastic
deformations were obtained. The strength values obtained from the compression tests of
concrete cylinders and the tensile tests for steel were considered in these analyses. The concrete
strength and yield stress of steel were multiplied by 1.25 and 1.2, respectively, to account for

114
strength magnification at large strain rates under impulsive conditions (Mays and Smith 1995).
The SDOF dynamic analyses were not conducted for the test RC columns and steel jacketed RC
columns because the flexural residual deformations to be compared with the analytical results
were not significant from these columns due to the shear failures of the column base.
The simplified analysis method used neglected the damping term because one cycle of structural
response develops under blast loading and because the simplified analysis can not take the
damping effect into account. Here, since response time-history analyses are performed, it is a
small effort to include the damping effect. Accordingly, the damping is considered in the
analyses to verify the impact of this phenomenon.
4.4.1 Program for SDOF Dynamic Analysis
There are a few programs available to perform a SDOF dynamic analysis for structures subjected
to blast loading. The program SPAn32 (USACE-OD 2002), developed by the U.S. Army Corps
of Engineers, is commonly used for this purpose subjected to blast loading in the blast
engineering community. However, the distribution of this program is limited to the U.S.
government agencies and their contractors. NONLIN (1996) is a public domain SDOF dynamic
program, originally developed for seismic response time-history analysis of SDOF system that
has an option to apply dynamic blast forces, and has been sometimes referenced in the literature.
However, here, the program Single-Degree-of-Freedom Blast Effects Design Spreadsheets
(SBEDS) version 3.1 (USACE-PDC 2007), which is a product of the U.S. Army Corps of
Engineers, was used because its distribution is unlimited for public use and this program is
tailored for blast engineering design rather than earthquake engineering design.
SBEDS is typically used to design structural components subjected to blast loading. Using an
equivalent SDOF system, and running on an Excel workbook platform, SBEDS has pre-
determined options for the analysis of ten common structural components, including a steel plate,
a reinforced concrete slab, reinforced masonry and wood panel, with various support conditions.
This program follows two design guidelines, namely TM 5-1300 Structures to Resist the Effects
of Accidental Explosions (USDA 1990) and UFC 3-340-01 Design and Analysis of Hardened
Structures to Conventional Weapons Effects (UFC 2002), as applicable. SBEDS generates a

115
uniform distributed pressure from a hemispherical surface burst explosion for a specified charge
weight and standoff distance. A user defined pressure-history can also be incorporated in the
analysis. (USACE-PDC 2006)
4.4.2 Analytical Model
In the SDOF dynamic analysis conducted below, the test columns were represented by an
equivalent SDOF system that was also used for the simplified blast analysis. This is
schematically illustrated in Figure 4-3. The viscous damping was not considered in the
simplified blast analysis, but it was considered in this SDOF dynamic analysis as shown in
Figure 4-3. The equation of motion for an equivalent SDOF system shown in Figure 4-3 is given
by:
( )e e e eM x C x K x P t+ + = (4-1)
EquivalentMass: Me
EquivalentLoad: Pe(t)
x = xmax 0
x
Load: p(t)
Mass: MDamping: CStiffness: K
x
x = xmax 0
EquivalentStiffness: Ke
EquivalentDamping: Ce
Figure 4-3 Real and Equivalent SDOF System for SDOF Dynamic Analysis
Using transformation factors which are the mass factor MK , the viscous damping factor DK , the
stiffness factor SK , and the load factor LK , Equation 4-1 is rewritten in terms of the real
structural system as:
( )M D S LK M x K C x K K x K P t+ + = (4-2)

116
By setting LK = SK and LK = DK and using the load-mass factor, LMK , Equation 4-2 is
simplified to:
( )LMK M x C x K x P t+ + = (4-3)
In this process, since the resistance of an element which comes from the stiffness in the internal
force tending to restore the structure to its original position, the load factor LK can be set equal
to the stiffness factor SK . For expediency, the equation of motion of the real structural system is
written as a SDOF system that only depends on the load-mass factor, LMK , therefore, it is
implied that LK = DK in Equation 4-3. This is not necessarily correct mathematically, but it is
the approach that has been used in SBEDS. (USACE-PDC 2006)
The load-mass factor, LMK , depends on boundary conditions and loading conditions.
Furthermore, for the same given boundary condition and loading condition, the load-mass
factor, LMK , for the specific structure can take different values depending on whether the
structure behaves in the elastic, elasto-plastic, or plastic ranges as presented in Table 2-4. This is
because virtual work developed in the element depends on the element deformation shapes
which are different in each range. A fixed-fixed boundary condition and a uniformly distributed
load were chosen for the experimental columns. These are the boundary conditions that are
representative of what happened in the experiments due to the torsional resistance of the cap
beam. For this fixed-fixed boundary condition and a uniformly distributed load, the
corresponding values of the load-mass factor, LMK , are 0.77, 0.78 and 0.66 for response in the
elastic, elasto-plastic, and plastic ranges, respectively.
The simplified analysis requires the idealized bi-linear resistance-displacement function, ( )eR x ,
also called an equivalent resistance function (see details in Fujikura et al. 2007). Even though
the dynamic SDOF analyses conducted with SBEDS can handle a tri-linear resistance curve (as
well as more complex ones), for the sake of comparing the dynamic analysis results with the
simplified analysis results, it was decided to use the same equivalent resistance-displacement
function, ( )eR x . In the equivalent resistance-deflection function, ( )eR x , for the one span fixed-
fixed supported column, since the program SBEDS can assign different load-mass factors to
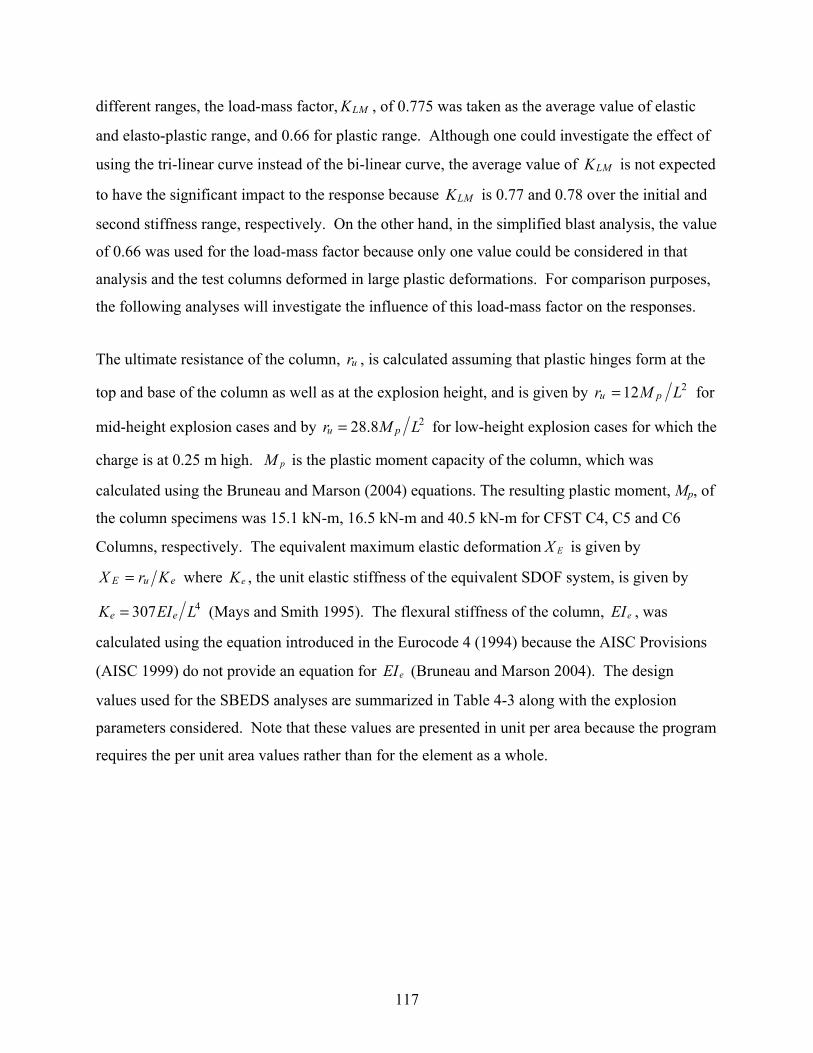
117
different ranges, the load-mass factor, LMK , of 0.775 was taken as the average value of elastic
and elasto-plastic range, and 0.66 for plastic range. Although one could investigate the effect of
using the tri-linear curve instead of the bi-linear curve, the average value of LMK is not expected
to have the significant impact to the response because LMK is 0.77 and 0.78 over the initial and
second stiffness range, respectively. On the other hand, in the simplified blast analysis, the value
of 0.66 was used for the load-mass factor because only one value could be considered in that
analysis and the test columns deformed in large plastic deformations. For comparison purposes,
the following analyses will investigate the influence of this load-mass factor on the responses.
The ultimate resistance of the column, ur , is calculated assuming that plastic hinges form at the
top and base of the column as well as at the explosion height, and is given by 212 LMr pu = for
mid-height explosion cases and by 228.8u pr M L= for low-height explosion cases for which the
charge is at 0.25 m high. pM is the plastic moment capacity of the column, which was
calculated using the Bruneau and Marson (2004) equations. The resulting plastic moment, Mp, of
the column specimens was 15.1 kN-m, 16.5 kN-m and 40.5 kN-m for CFST C4, C5 and C6
Columns, respectively. The equivalent maximum elastic deformation EX is given by
euE KrX = where eK , the unit elastic stiffness of the equivalent SDOF system, is given by
4307e eK EI L= (Mays and Smith 1995). The flexural stiffness of the column, eEI , was
calculated using the equation introduced in the Eurocode 4 (1994) because the AISC Provisions
(AISC 1999) do not provide an equation for eEI (Bruneau and Marson 2004). The design
values used for the SBEDS analyses are summarized in Table 4-3 along with the explosion
parameters considered. Note that these values are presented in unit per area because the program
requires the per unit area values rather than for the element as a whole.

118
Table 4-3 Design Values for SDOF Dynamic Analysis
Test Num. Column Explosive Parameters Mass per Unit Area
Stiffness per Unit Area
Resistance per Unit Area
w x z (m) (kg/m2) (kPa/mm) (kPa)
Test 1-3 C4 2 X 243.7 192.2 1062.0
Test 1-4 C6 1.1 X 0.75 340.0 538.9 1892.2
Test 1-5 C5 W 1.3 X 291.9 322.6 924.9
Test 1-6 C4 1.6 X 243.7 192.2 1911.1
Test 1-9 C6 0.6 X 0.25 340.0 538.9 3404.7
Test 1-10 C5 0.8 X 291.9 322.6 1664.5
4.4.3 Applied Blast Loading
The blast pressures acting on the column vary with time and locations along the column. In the
simplified analysis, a single value of the equivalent uniform impulse was needed to calculate the
maximum response of the column modeled as SDOF system. Accordingly, an equivalent
uniform impulse was used to take the blast pressures into account, and the envelope of the
maximum impulse was used to calculate the equivalent uniform impulse as presented in
Equation 3-34.
In the SDOF dynamic analysis, the equivalent uniform pressure at a given time is applied to the
structural model following a time history step-by-step analysis. This equivalent uniform
pressure at time of t , ( )eqp t , is given by:
( )( ) ( )
( )0
0
,H
eq H
p z t z dzp t
z dz
δ
δ=∫∫
(4-4)
where ( ),p z t is the pressure distribution along the height of the column at time t , and ( )zδ is
the normalized deflected shape of the column. The values of ( ),p z t were calculated using the
Bridge Explosive Loading program (BEL 2004) which was used for the simplified analyses as

119
well. The normalized deflected shape, ( )zδ , was taken as inelastic deformations after plastic
hinging. The shape was defined by rigid-link members between plastic hinges assuming that an
in-span hinge develops at the height of the blast charge and that other hinges form at both the top
and base of the column. The resulting equivalent pressure histories, ( )eqp t , for the six test cases
of CFST columns are shown in Figure 4-4. The time increment of each step in these pressure
histories is 0.01 msec.
4.4.4 Methods for Solving Equation of Motion
To calculate the maximum response of the equivalent SDOF system, Equation 4-3 needs to be
solved. The program SBEDS uses the constant velocity method to solve this equation (USACE-
PDC 2006). There are more accurate methods for the numerical integration of the equations of
motion such as Newmark-beta method (USACE-PDC 2006), but this constant velocity method is
simple and stable, and suitable for the workbook based software. However, it is necessary to use
a small time step to obtain an accurate solution using the constant velocity method.
Biggs (1964) suggests that the time step interval in the constant velocity method should not be
larger than one-tenth of the natural period of the structural system to obtain sufficiently accurate
results for practical purposes. The comparison of selected analytical results obtained using the
Newmark-beta method showed that the program SBEDS provided solutions within a 2%
difference if using the recommended small time step (USACE-PDC 2006).
4.4.5 Analytical Results
4.4.5.1 Effect of Damping and Load-mass Factor
For the sake of comparison, this subsection investigates the sensitivity of the load-mass
factor, LMK and the damping effect on the structural response. To do this, only one case of the
CFST column was considered, which was the CFST C4 column of Test 1-3. In the simplified
analysis procedure, the damping effect was not considered and the load-mass factor, LMK , was
assumed to be 0.66. By comparison, the SDOF dynamic analysis here considers both a damping
of 0% and5 %. Since the program SBEDS can account for the different load-mass factors to
different ranges, the load-mass factor of 0.775 and 0.66 was used for the elastic and plastic
range, respectively as presented in Section 4.4.2.

120
-100
10203040506070
0
2
4
6
8
10
0 0.5 1 1.5 2
Equ
ival
ent P
ress
ure
(MPa
)
Time (msec)
(ksi
)
(a) Test 1-3, B1-C4 Column
-200
20406080
100120140
0
5
10
15
20
0 0.5 1 1.5 2
Equ
ival
ent P
ress
ure
(MPa
)
Time (msec)
(ksi
)
(b) Test 1-4, B1-C6 Column
-20
0
20
40
60
80
100
120
0
5
10
15
0 0.5 1 1.5 2
Equ
ival
ent P
ress
ure
(MPa
)
Time (msec)
(ksi
)
(c) Test 1-5, B1-C5 Column
-20
0
20
40
60
80
100
-202468101214
0 0.5 1 1.5 2
Equ
ival
ent P
ress
ure
(MPa
)
Time (msec)
(ksi
)
(d) Test 1-6, B2-C4 Column
-50
0
50
100
150
200
250
-505101520253035
0 0.5 1 1.5 2
Equ
ival
ent P
ress
ure
(MPa
)
Time (msec)
(ksi
)
(e) Test 1-9, B2-C6 Column
and Test 1-10, B2-C5 Column
Figure 4-4 Equivalent Pressure History

121
To compare the SDOF dynamic analyses with the simplified analyses and to compare three
different set of assumptions of the SDOF dynamic analyses, three different cases are analyzed as
shown in Table 4-4. LMeK and LMpK in Table 4-4 are respectively the load-mass factors for the
elastic and plastic range. Case 1 considers the same load-mass factors and damping ratio as
those considered in the simplified analysis, namely LMeK = LMpK =0.66 and no damping. Case 2
is identical to Case 1 except that it considers the damping ratio of 5%. Case 3 considers the load-
mass factors that vary over the different ranges of structural response where LMeK and LMpK are
0.775 and 0.66, respectively. The shape factor β of 0.472 used in these analyses was the
resulting value from the simplified analysis for this particular column case as presented in Table
3-8.
Table 4-4 SDOF Dynamic Analysis Cases for CFST C4 Column of Test 1-3
Case 1 Case 2 Case 3
LMeK 0.66 0.66 0.775
LMpK 0.66 0.66 0.66
Damping Ratio (%) 0 5 5
The analytical results of the displacement history and resistance-displacement relationship
obtained for each of the three cases considered are shown in Figure 4-5 (a) and (b), respectively.
Note that the resistance in Figure 4-5 (b) is expressed in a unit of pressure (kPa) because the
program considers the structure per unit area. The vertical dashed line at 30 mm in these figures
shows the maximum residual displacement obtained in the experiment. The displacement when
resistance equals zero (after the structure has been loaded and unloaded) in Figure 4-5 (b) is the
residual plastic displacement which should be equal to the experimentally obtained residual
displacement of 30 mm in this case.

122
0
5
10
15
20
25
30
35
40
0
0.5
1
1.5
0 5 10 15 20 25 30
Case1: 0.66, 0.66, 0%Case2: 0.66, 0.66, 5%Case3: 0.775, 0.66, 5%Test Resisual Displacement
Dis
plac
emen
t (m
m)
Time (msec)(in
)
(a) Displacement History
-1500
-1000
-500
0
500
1000
1500
-200
-150
-100
-50
0
50
100
150
200
0 5 10 15 20 25 30 35 40
Case1: 0.66, 0.66, 0%Case2: 0.66, 0.66, 5%Case3: 0.775, 0.66, 5%Test Resisual Displacement
Res
ista
nce
(kP
a)
Displacement (mm)
(psi
)
(b) Resistance-Displacement Relationship
Figure 4-5 Analytical Results for Test 1-3 with β =0.472 (C4 Column)
By comparing displacement history curves of Case 1 and Case 2 in Figure 4-5 (a), it can be seen
that considering the damping effect does have a small effect of approximately 5% less on the
maximum deformation reached. However, considering the damping shows the progressive
attenuation of the amplitude of vibrations. More importantly, by comparing displacement history
curves of Case 2 and Case 3 in Figure 4-5 (a), using the two values of load-mass factor, LMK
reduces the maximum displacement amplitude significantly, by 23%. Therefore this factor has a
more significant impact on the maximum displacement. These trends on the effect of the
damping and the load-mass factor can also be seen in the residual displacement as shown in
Figure 4-5 (b).
4.4.5.2 Shape Factor β
To match the analytical residual displacements with the experimental results, the shape factor β
was calibrated for the six test CFST columns here. Table 4-5 summarizes the resulting shape
factors β for those six cases, including the ones obtained from the simplified analyses. Since in
Tests 3, 4 and 5 the blast charges were located at mid-height of the column and in Tests 6, 8 and
10 they were located at low-height of the column, the factors β were averaged differently for
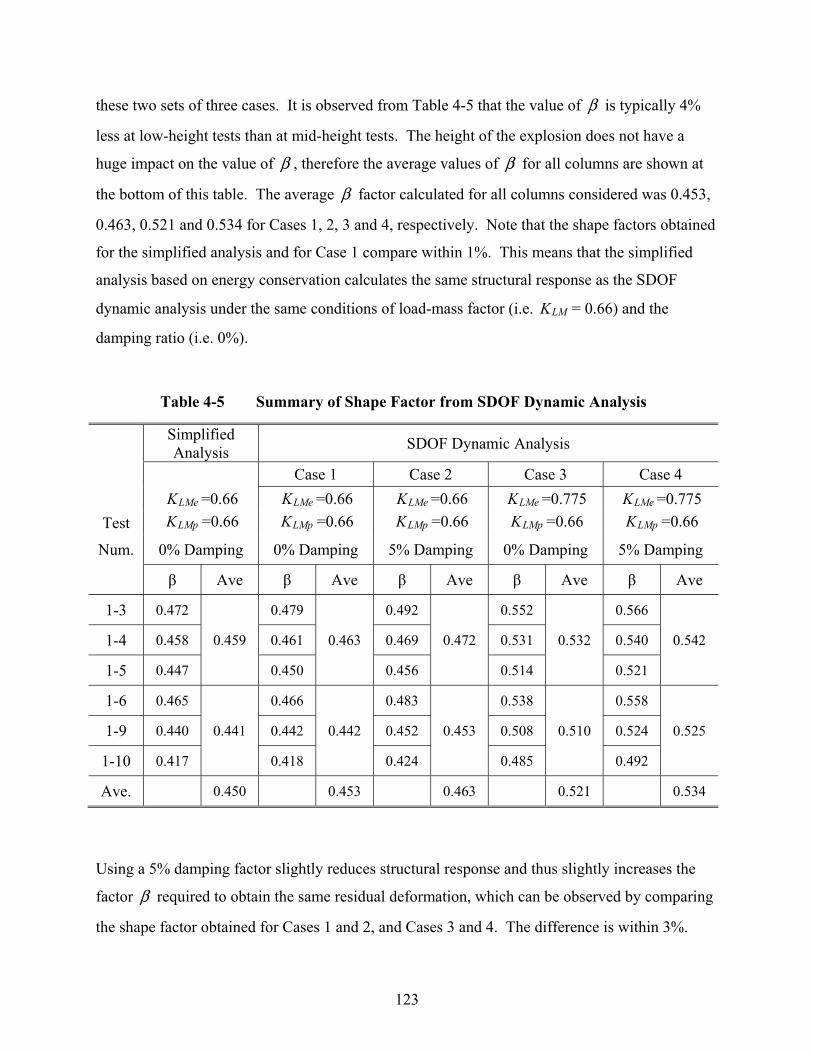
123
these two sets of three cases. It is observed from Table 4-5 that the value of β is typically 4%
less at low-height tests than at mid-height tests. The height of the explosion does not have a
huge impact on the value of β , therefore the average values of β for all columns are shown at
the bottom of this table. The average β factor calculated for all columns considered was 0.453,
0.463, 0.521 and 0.534 for Cases 1, 2, 3 and 4, respectively. Note that the shape factors obtained
for the simplified analysis and for Case 1 compare within 1%. This means that the simplified
analysis based on energy conservation calculates the same structural response as the SDOF
dynamic analysis under the same conditions of load-mass factor (i.e. LMK = 0.66) and the
damping ratio (i.e. 0%).
Table 4-5 Summary of Shape Factor from SDOF Dynamic Analysis
Simplified Analysis SDOF Dynamic Analysis
Case 1 Case 2 Case 3 Case 4 LMeK =0.66 LMeK =0.66 LMeK =0.66 LMeK =0.775 LMeK =0.775
Test LMpK =0.66 LMpK =0.66 LMpK =0.66 LMpK =0.66 LMpK =0.66
Num. 0% Damping 0% Damping 5% Damping 0% Damping 5% Damping
β Ave β Ave β Ave β Ave β Ave
1-3 0.472 0.479 0.492 0.552 0.566
1-4 0.458 0.459 0.461 0.463 0.469 0.472 0.531 0.532 0.540 0.542
1-5 0.447 0.450 0.456 0.514 0.521
1-6 0.465 0.466 0.483 0.538 0.558
1-9 0.440 0.441 0.442 0.442 0.452 0.453 0.508 0.510 0.524 0.525
1-10 0.417 0.418 0.424 0.485 0.492
Ave. 0.450 0.453 0.463 0.521 0.534
Using a 5% damping factor slightly reduces structural response and thus slightly increases the
factor β required to obtain the same residual deformation, which can be observed by comparing
the shape factor obtained for Cases 1 and 2, and Cases 3 and 4. The difference is within 3%.

124
The increase of β value is larger for Cases 3 and 4. In Cases 3 and 4, using the load-mass factor
in the elastic range, LMeK , of 0.775, in addition to that over the plastic range of 0.66, increases
the shape factor by about 15% over that for Cases 1 and 2, respectively. The resulting value of
β for this type of circular columns is 0.534 (i.e. mean value of 0.543 and standard deviation of
0.027 from the six samples considered) for SDOF dynamic analysis using 5% damping and the
different load-mass factors corresponding to the different structural ranges. Note that the larger
the shape factor, the larger the blast pressures that the structure can resist.
4.4.5.3 Structural Response
The structural responses of six CFST test cases shown in Table 4-5 are presented in Figures 4-6
to 4-11, to verify that the analytical residual displacements using the shape factor β shown in
Table 4-5 match the experimental residual displacements and to illustrate the structural response
of SDOF dynamic analyses using these β values. In each analytical case, (a) displacement
history, (b) velocity history, (c) acceleration history, and (d) resistance displacement relationship
are presented. The dashed lines in the figures of (a) displacement history and (d) resistance
displacement relationship represent the plastic residual displacements obtained from the
experiments. Table 4-6 summarizes the maximum acceleration, velocity and displacement
response, and the corresponding time when those responses occurred after the blast pressure
began to be applied to the structure, along with the pressure duration of the positive phase.
As shown in Table 4-6, accelerations reach their maximum values shortly after the blast pressure
is applied. Table 4-6 also shows that the displacements reach their maximum values much later
after the end of the applied blast pressure. This is typically the case when the blast pressure
duration is much shorter than the natural period of the structure (i.e. impulsive loading case). To
illustrate that this is indeed the case here, Table 4-7 shows the relationship between the duration
of the positive phase of the blast pressure history and the natural period of the structure. The
ratios d nt T in the range of 1/30 to 1/45 confirm that these test cases are indeed the impulsive
loading cases because the blast pressure duration is much shorter than the natural period of the
structure.

125
0
10
20
30
40
0 5 10 15 20
Def
lect
ion
(mm
)
Time (msec) (a) Displacement History
-10
0
10
20
0 5 10 15 20
Vel
ocity
(mm
/mse
c)
Time (msec) (b) Velocity History
-500
50100150200250
0 5 10 15 20
Acc
eler
atio
n (m
m/m
sec
2 )
Time (msec) (c) Acceleration History
-1500
-1000
-500
0
500
1000
1500
0 10 20 30 40 50
Res
ista
nce
(kPa
)
Displacement (mm) (d) Resistance Displacement Relationship
Figure 4-6 Analytical Results for Test 1-3 with β =0.566 (C4 Column)

126
0102030405060
0 5 10 15 20
Def
lect
ion
(mm
)
Time (msec) (a) Displacement History
-10
0
10
20
30
0 5 10 15 20
Vel
ocity
(mm
/mse
c)
Time (msec) (b) Velocity History
-500
50100150200250300
0 5 10 15 20
Acc
eler
atio
n (m
m/m
sec
2 )
Time (msec) (c) Acceleration History
-2000
-1000
0
1000
2000
0 10 20 30 40 50 60
Res
ista
nce
(kPa
)
Displacement (mm) (d) Resistance Displacement Relationship
Figure 4-7 Analytical Results for Test 1-4 with β =0.540 (C6 Column)

127
020
406080
100
0 5 10 15 20
Def
lect
ion
(mm
)
Time (msec) (a) Displacement History
-10
0
10
20
30
0 5 10 15 20
Vel
ocity
(mm
/mse
c)
Time (msec) (b) Velocity History
-500
50100150200250300
0 5 10 15 20
Acc
eler
atio
n (m
m/m
sec
2 )
Time (msec) (c) Acceleration History
-1500
-1000
-500
0
500
1000
1500
0 20 40 60 80 100
Res
ista
nce
(kPa
)
Displacement (mm) (d) Resistance Displacement Relationship
Figure 4-8 Analytical Results for Test 1-5 with β =0.521 (C5 Column)

128
0
10
20
30
40
0 5 10 15 20
Def
lect
ion
(mm
)
Time (msec) (a) Displacement History
-10
0
10
20
30
0 5 10 15 20
Vel
ocity
(mm
/mse
c)
Time (msec) (b) Velocity History
-500
50100150200250300
0 5 10 15 20
Acc
eler
atio
n (m
m/m
sec
2 )
Time (msec) (c) Acceleration History
-2000
-1000
0
1000
2000
0 10 20 30 40 50
Res
ista
nce
(kPa
)
Displacement (mm) (d) Resistance Displacement Relationship
Figure 4-9 Analytical Results for Test 1-6 with β =0.558 (C4 Column)

129
0102030405060
0 5 10 15 20
Def
lect
ion
(mm
)
Time (msec) (a) Displacement History
-100
10203040
0 5 10 15 20
Vel
ocity
(mm
/mse
c)
Time (msec) (b) Velocity History
0100200300400500
0 5 10 15 20
Acc
eler
atio
n (m
m/m
sec
2 )
Time (msec) (c) Acceleration History
-4000
-2000
0
2000
4000
0 10 20 30 40 50 60
Res
ista
nce
(kPa
)
Displacement (mm) (d) Resistance Displacement Relationship
Figure 4-10 Analytical Results for Test 1-9 with β =0.524 (C6 Column)
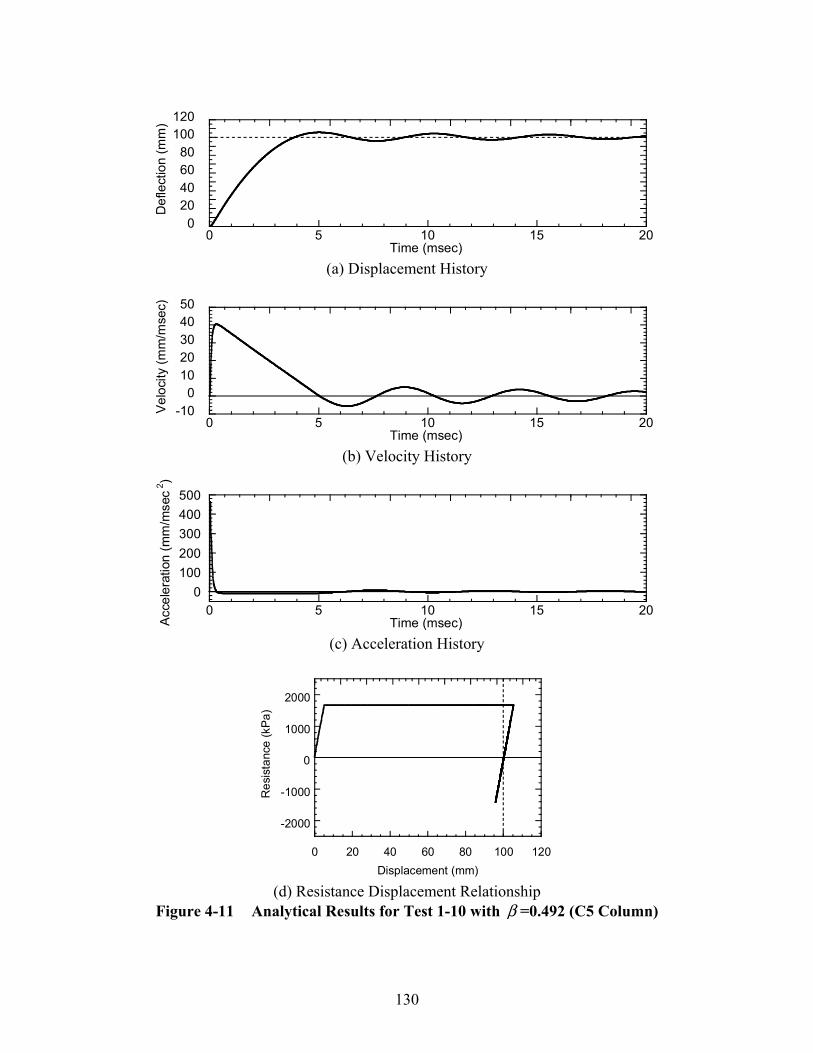
130
020406080
100120
0 5 10 15 20
Def
lect
ion
(mm
)
Time (msec) (a) Displacement History
-100
1020304050
0 5 10 15 20
Vel
ocity
(mm
/mse
c)
Time (msec) (b) Velocity History
0100200300400500
0 5 10 15 20
Acc
eler
atio
n (m
m/m
sec
2 )
Time (msec) (c) Acceleration History
-2000
-1000
0
1000
2000
0 20 40 60 80 100 120
Res
ista
nce
(kPa
)
Displacement (mm) (d) Resistance Displacement Relationship
Figure 4-11 Analytical Results for Test 1-10 with β =0.492 (C5 Column)

131
Table 4-6 Summary of Maximum Response Values for SDOF Dynamic Analyses
Pressure Acceleration Velocity Displacement
Test Num. Col. Duration Acc. Time Vel. Time Displ. Time
(msec) (mm/msec2) (msec) (mm/msec) (msec) (mm) (msec)
Test 1-3 C4 0.16 196.1 0.02 18.5 0.42 35.5 3.43
Test 1-4 C6 0.13 270.8 0.01 25.5 0.34 49.6 3.53
Test 1-5 C5 0.12 249.1 0.01 25.1 0.42 78.9 5.84
Test 1-6 C4 0.14 259.3 0.02 25.2 0.31 33.9 2.48
Test 1-9 C6 0.14 424.4 0.01 35.8 0.26 51.2 2.66
Test 1-10 C5 0.14 463.6 0.01 40.4 0.29 105.5 5.00
Table 4-7 Natural Period and Pressure Duration
Test Num. Column Natural Period
nT
Pressure Duration
dt d nt T
(msec) (msec)
Test 1-3 C4 6.2 0.16 1/38.8
Test 1-4 C6 4.4 0.13 1/33.8
Test 1-5 C5 5.3 0.12 1/44.2
Test 1-6 C4 6.2 0.14 1/44.3
Test 1-9 C6 4.4 0.14 1/31.4
Test 1-10 C5 5.3 0.14 1/37.9
4.5 Fiber-based Analytical Model 4.5.1 General
The behavior of the three different types of bridge columns tested previously, namely CFST
columns, RC columns and steel jacketed RC columns, needs to be analyzed using an advanced

132
analytical model to understand their behavior when subjected to blast loading. A fiber-based
model was used for this purpose. The first step of a fiber-based model analysis is calibration of
the model for the hysteretic behavior of materials under consideration for the three types of the
bridge pier columns considered here. This is required to correctly set the parameters describing
the model. Ideally this calibration should be accomplished using experimental results obtained
from blast loading. However, the experimental data of these three type columns subjected to
blast loading is not available for this purpose. Therefore, here, quasi-static cyclic loading test
data is used instead to verify the developed analytical model itself.
Although an advanced finite element models (FEM) using solid elements or shell elements might
be appropriate for capturing the localized behavior of the structural elements such as beam-
column connections, frame models using a fiber-based beam-column model are more
computationally effective to accurately capture the non-linear dynamic response analysis of
structures (Spacone et al. 1996a, 1996b). In the fiber-based model, the member section is
divided into fibers in which the unidirectional stress-strain relationships of the materials are
assigned to represent the section characteristic. Note that the fiber-based model assumes that
plane section remains plane and the section is normal to the longitudinal axis when the element
deforms. The open-source computational program OpenSees (2007) was used to perform the
fiber-based analyses in this research.
Following this subsection introduction, analytical model and solution algorithm used are
discussed. Then, the details of the uniaxial constitutive models in this research are presented.
Finally, the fiber-based analytical model is calibrated and verified by comparing with the quasi-
static cyclic loading test data of CFST columns, RC columns and steel jacketed RC columns.
4.5.2 Analytical Model and Solution Algorithm
Figure 4-12 schematically shows the analytical model sections for (a) CFST columns, (b) RC
columns and (c) steel jacketed RC columns. The sections are divided into fibers for which the
different materials, as shown in Figure 4-12, are assigned different unidirectional stress-strain
relationships. Core concrete and cover concrete are modeled by 256 confined concrete and 32
unconfined concrete relationships, respectively. Each rebar is modeled by one element. Steel

133
tube and steel jacket are modeled as 64 discretize steel bar fibers. Note that CFST column did
not have the reinforcing steel bars inside of core concrete.
SteelBar
UnconfinedConcrete
ConfinedConcrete
ConfinedConcrete
ConfinedConcrete
SteelBar
SteelJacket
SteelTube
(a) CFST Section (b) RC Section (c) Steel Jacketed RC Section
Figure 4-12 Cross Sections for Fiber Element
Figure 4-13 schematically shows the analytical models of the piers used for the quasi-static
calibration tests using two-dimensional discrete frame models. This figure considers lateral load
applied at the top of the column for a cantilever fixed at the base. The base of the RC column
and steel jacketed RC column are modeled using zero-length section element to model strain
penetration at this section. The strain penetration is the localized inelastic deformation occurring
at the member end regions due to bar slips typically observed during the cyclic loading tests and
also subjected to earthquake loading (Zhao and Sritharan 2007). A special inelastic element is
introduced at that zero-length section element to model this behavior of reinforcing bars. Note
that this strain penetration was not modeled for the blast test columns because these localized
inelastic deformations at the member end regions were not observed in the experimental
observations.
To solve the nonlinear equilibrium equation, the Krylov-Newton algorithm provided by
OpenSees (2007) was used. Krylov-Newton algorithm is an iterative incremental solver based
on the modified Newton method with Krylov subspace acceleration to calculate the next time

134
step. This algorithm gives relatively faster and more robust convergence in general. (Charlson
and Miller 1998)
Zero-lengthSectionElement
FiberElement
LoadingLoadingLoading
TestSpecimen
(a) CFST Column (b) RC Column(c) Steel Jacketed RC Column
Figure 4-13 Analytical Model for Cyclic Loading Test Specimen
4.5.3 Material Constitutive Models
A variety of unidirectional stress-strain relationships is available for steel and concrete to
replicate the behavior of reinforced concrete elements. Selection of the constitutive model is the
key to simulate structural response accurately. Research on the analysis of reinforced concrete
structures (e.g. Orakcal and Wallace 2006a, Zhao and Sritharan 2007 to name a few) has showed
that using fiber models implemented with appropriate constitutive relations for concrete and
reinforcing steel can accurately predict the nonlinear behavior of the structures when compared
with the experimental results. The following subsections describe the details of the uniaxial
constitutive models for concrete and steel adopted in this research. The tension stiffening model
for steel bars in the RC members and the strain penetration model occurring along longitudinal
steel bars at the connection intersection are also described.

135
4.5.3.1 Constitutive Model for Steel
To represent the uniaxial constitutive model for reinforcing steel bars, steel jackets, and steel
tubes of CFST columns, the Menegotto-Pinto model (Menegotto and Pinto 1973) was used. This
model considers the hysteretic behavior of steel and account for Bauschinger effect. Isotropic
strain hardening is expected to occur during crack closure in a reinforced concrete member
(Filippou et al. 1983). To account for this effect, the modified Menegotto-Pinto model by
Filippou et al. (1983) is implemented in the reinforcing steel bars of the reinforced concrete
members considered here.
The stress-strain (σ ε− ) relationship of Menegotto-Pinto model is schematically shown in
Figure 4-14. The points ( rε , rσ ) and ( 0ε , 0σ ) in Figure 4-14 are, respectively, the reversal point
and the intersection of two asymptotes which are the elastic asymptote with stiffness of 0E and
the yield asymptote with stiffness of 1E . The point ( rε ′ , rσ ′ ) is the previous reversal point. The
model is represented by:
( )
( )
** *
1*
1
1 R R
bb
εσ ε
ε
−= +
+ (4-5)
where
*
0
r
r
ε εεε ε
−=−
(4-6)
*
0
r
r
σ σσσ σ
−=−
(4-7)
1
0
EbE
= (4-8)
b is the strain hardening ratio, and R is the Bauchinger effect coefficient given by:
10
2
aR Ra
ξξ
= −+
(4-9)
where
0 r
y
ε εξε
′−= (4-10)

136
( , )
( , )
( , ) ( , )
Strain
Stre
ss
Figure 4-14 Constitutive Model for Steel (Menegotto and Pinto 1973)
0R = 20, 1a = 18.5 and 2a = 0.15 are the values recommended by Menegotto and Pinto
experimentally for reinforcing bars.
Filippou et al. (1983) proposed a modified Menegotto-Pinto model for the reinforcing steel bars
in reinforced concrete members to account for isotropic strain hardening. As schematically
shown in Figure 4-15, this isotropic strain hardening effect is simply considered by shifting the
yield asymptote by stσ . stσ is given by:
max3 4st y
ya aεσ σ
ε⎛ ⎞
= −⎜ ⎟⎝ ⎠
(4-11)
where maxε is the absolute maximum strain at the instant of strain reversal, yε and yσ are yield
strain and stress, respectively, and 3a and 4a are parameters to be determined experimentally.
Filippou et al recommended using values of 3a = 0.01 and 4a = 7.

137
Figure 4-15 Shift of Yield Asymptote due to Isotropic Strain Hardening (Filippou et al. 1983)
4.5.3.2 Constitutive Model for Concrete
As shown in Figure 4-12, core concrete of RC columns, and concrete of CFST columns and steel
jacketed RC columns are modeled by confined concrete, and cover concrete of RC column was
modeled by unconfined concrete. The uniaxial hysteretic constitutive relationship of modified
Chang-Mander model (Waugh 2007) was adopted for both unconfined and confined concrete
except for the core concrete of the zero-length section element (see Figure 4-13). This is because
large deformation needs to be accommodated at this location (the zero-length section element) in
the analysis due to the strain penetration of longitudinal steel bars at the base of the column. For
this purpose, modified Scott-Kent-Park model (Yassin 1994) was used in the core concrete of the
zero-length section element.
4.5.3.3 Tension Stiffening Model for Steel Bars
The stress-strain relationship of steel bars embedded in concrete is different from that of bare
bars (as typically tested to determine their material properties), because steel bars in concrete are
stiffened by concrete (called “tension stiffening”). When a reinforced concrete member is

138
subjected to a uniaxial tension force, cracks develop in the member between the forces. Since the
cracked and uncracked parts of the reinforced concrete member resist the longitudinal tension
force, the stresses and strains vary along the member.
Belarbi and Hsu (1994) proposed the stress-strain constitutive model for a mild steel bar
embedded in a reinforced concrete member by averaging the stress and the strain of steel bars
along the member, based on comprehensive reinforced concrete panel tests subjected to uniaxial
stresses. It was found that the average yield stress of steel bars in concrete was lower than that of
bare bars. The following bilinear model was proposed for the average stress-strain ( sf - sε )
constitutive model of mild steel bars embedded in concrete:
s s sf E ε= ( )0.93 2s yf B f≤ − (4-12)
( ) ( )0.91 2 0.02 0.25s y s sf B f B E ε= − + + ( )0.93 2s yf B f> − (4-13)
with
1.5
1 cr
y
fBfρ
⎛ ⎞= ⎜ ⎟
⎝ ⎠ (4-14)
where yf and sE are the yield strength and modulus of elasticity of bare steel bars, respectively,
and crf is the concrete cracking strength.
Note that this tension stiffening model provides a backbone envelop curve of constitutive stress-
strain curve. Therefore, the hysteresis constitutive model for reinforcing steel bars was
determined such that the backbone envelope of the curve was decided by this tension stiffening
model and the hysteresis rules within that envelope followed the Menegotto-Pinto model as
presented in Section 4.5.3.1.
4.5.3.4 Strain Penetration Model for Steel Bars
As previously discussed in Section 4.5.2, large deformations typically develops at the base of a
column due to the strain penetration of longitudinal steel bars during cyclic loading tests and also
as such during to earthquakes. For this purpose, the zero-length section element was used at this
location as shown in Figure 4-13. Zhao and Sritharan (2007) proposed a hysteretic stress-slip

139
model for reinforcing bars that can be implemented in fiber-based analysis using the zero-length
section element.
The proposed hysteretic stress-slip model (σ - s ) is shown in Figure 4-16. The backbone
envelope curve has two regions, namely a straight line for the elastic region and a curvilinear
part for the post-yield region, as shown in Figure 4-16 (a). The post-yield curve is represented
by:
1
1 e e eR R R
ss
sb s
μσ
μ μ
−=⎡ ⎤⎛ ⎞ ⎛ ⎞⎢ + ⎥⎜ ⎟ ⎜ ⎟−⎢ ⎥⎝ ⎠ ⎝ ⎠⎣ ⎦
(4-15)
with
y
u y
ff fσσ −=
− (4-16)
y
y
s sss−= (4-17)
u y
y
s ss
μ −= (4-18)
where b is the stiffness reduction factor, eR is a factor to control the shape of the curve (taken as
1.01 by Zhao and Sritharan), yf and uf are respectively the yield and ultimate strengths of the
steel reinforcing bar, and ys and us are the corresponding loaded-end slips. From the
experimental database, they also found that us = 30 ~ 40 ys and b = 0.3 ~ 0.5 would be
appropriate in their proposed model. As shown in Figure 4-16 (b), the unloading path follows a
straight line with the elastic slope until the stress becomes zero. The reloading path follows the
same shape as the post-yield envelop curve.
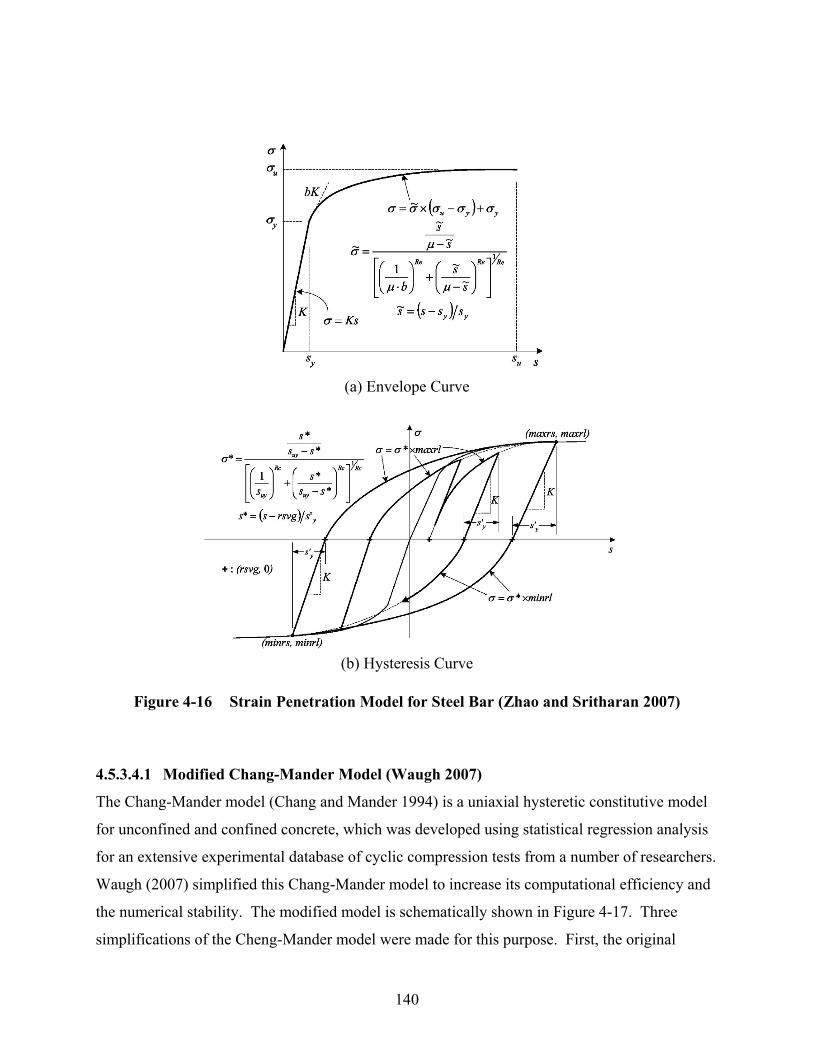
140
(a) Envelope Curve
(b) Hysteresis Curve
Figure 4-16 Strain Penetration Model for Steel Bar (Zhao and Sritharan 2007)
4.5.3.4.1 Modified Chang-Mander Model (Waugh 2007)
The Chang-Mander model (Chang and Mander 1994) is a uniaxial hysteretic constitutive model
for unconfined and confined concrete, which was developed using statistical regression analysis
for an extensive experimental database of cyclic compression tests from a number of researchers.
Waugh (2007) simplified this Chang-Mander model to increase its computational efficiency and
the numerical stability. The modified model is schematically shown in Figure 4-17. Three
simplifications of the Cheng-Mander model were made for this purpose. First, the original

141
model uses a power function for its unloading and reloading paths, but these power function
curves are simplified into tri-linear curves. Second, the original model represented in dashed line
in Figure 4-17 shifts the tension envelop by 0ε (as shown in Figure 4-17), but the modified
model does not shift the tension envelop. Lastly, when the curve rejoins the backbone envelope
after unloading and reloading, increases in additional strain transition smoothly in the original
model, but this is not modeled in the modified model. Compressive and tensile stress-strain
backbone envelope curves for unconfined and confined concrete are presented as follows.
The compressive stress-strain ( cf - cε ) backbone envelope curve for unconfined concrete of the
Cheng-Mander model is given by:
1
1 1
rnxyr xn x
r r
=⎛ ⎞+ − +⎜ ⎟− −⎝ ⎠
(4-19)
where c cy f f ′= , c cx ε ε ′= , cf ′ is the maximum compressive strength (MPa), cε ′ is the
corresponding strain , and n and r are parameters to control the curve shape. The parameter n
is given by:
c c
c
Enfε ′
=′
(4-20)
where cE is initial modulus of elasticity. Based on experimental results, the recommended
values for parameters cE , cε ′ , and r to define the compressive envelope are:
8200c cE f ′= (MPa) (4-21)
( )
14
28c
cf
ε′
′ = (4-22)
1.95.2
cfr′
= − (MPa) (4-23)
The tension stress-strain backbone envelope curve for unconfined concrete is in the same shape
as that of the compression envelope. The recommended tensile strength, tf , and the
corresponding strain tε (see Figure 4-17) are:
0.62t cf f ′= (MPa) (4-24)
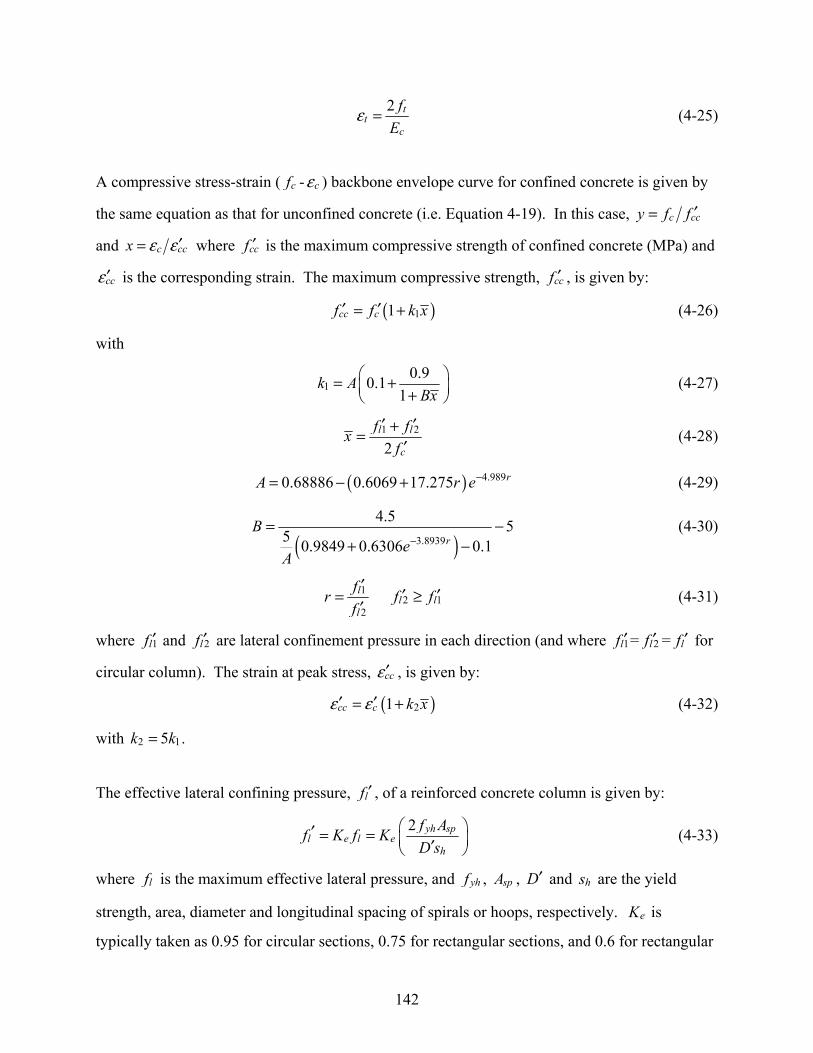
142
2 tt
c
fE
ε = (4-25)
A compressive stress-strain ( cf - cε ) backbone envelope curve for confined concrete is given by
the same equation as that for unconfined concrete (i.e. Equation 4-19). In this case, c ccy f f ′=
and c ccx ε ε ′= where ccf ′ is the maximum compressive strength of confined concrete (MPa) and
ccε ′ is the corresponding strain. The maximum compressive strength, ccf ′ , is given by:
( )11cc cf f k x′ ′= + (4-26)
with
10.90.1
1k A
Bx⎛ ⎞= +⎜ ⎟+⎝ ⎠
(4-27)
1 2
2l l
c
f fxf
′ ′+=′
(4-28)
( ) 4.9890.68886 0.6069 17.275 rA r e−= − + (4-29)
( )3.8939
4.5 55 0.9849 0.6306 0.1rB
eA
−= −
+ − (4-30)
1
2
l
l
frf
′=
′ 2 1l lf f′ ′≥ (4-31)
where 1lf ′ and 2lf ′ are lateral confinement pressure in each direction (and where 1lf ′ = 2lf ′ = lf ′ for
circular column). The strain at peak stress, ccε ′ , is given by:
( )21cc c k xε ε′ ′= + (4-32)
with 2 15k k= .
The effective lateral confining pressure, lf ′ , of a reinforced concrete column is given by:
2 yh spl e l e
h
f Af K f KD s
⎛ ⎞′ = = ⎜ ⎟′⎝ ⎠ (4-33)
where lf is the maximum effective lateral pressure, and yhf , spA , D′ and hs are the yield
strength, area, diameter and longitudinal spacing of spirals or hoops, respectively. eK is
typically taken as 0.95 for circular sections, 0.75 for rectangular sections, and 0.6 for rectangular
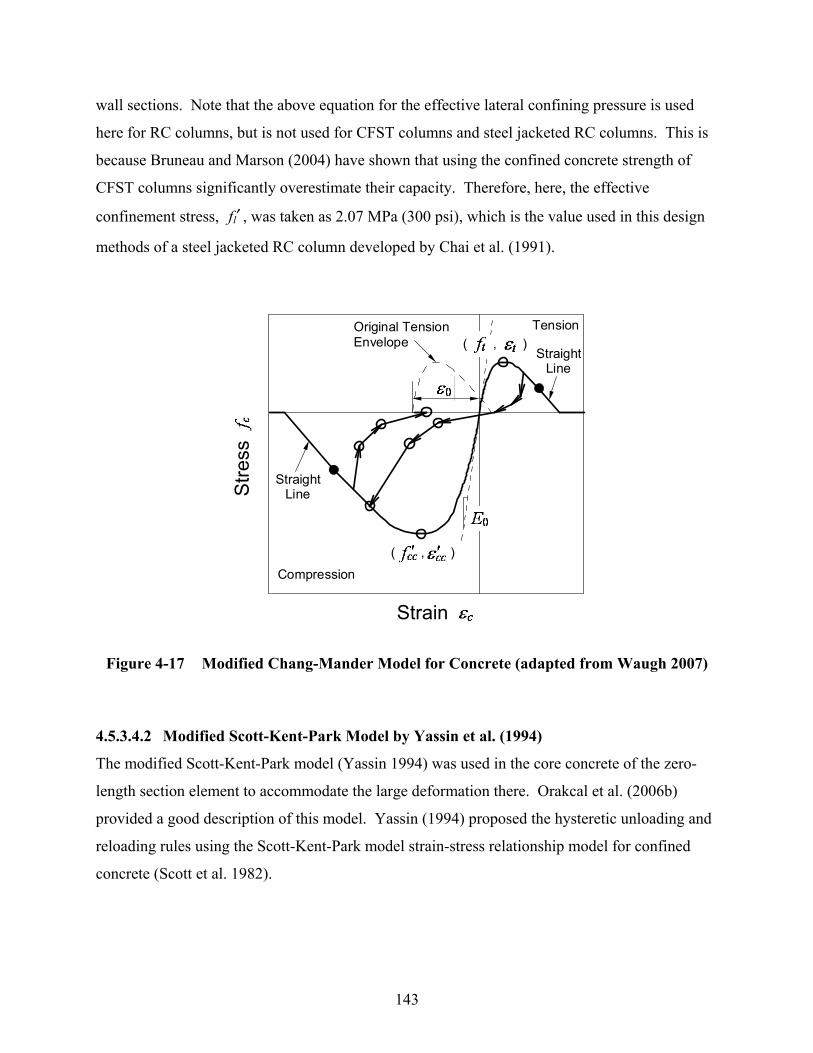
143
wall sections. Note that the above equation for the effective lateral confining pressure is used
here for RC columns, but is not used for CFST columns and steel jacketed RC columns. This is
because Bruneau and Marson (2004) have shown that using the confined concrete strength of
CFST columns significantly overestimate their capacity. Therefore, here, the effective
confinement stress, lf ′ , was taken as 2.07 MPa (300 psi), which is the value used in this design
methods of a steel jacketed RC column developed by Chai et al. (1991).
( , )
( , )Original TensionEnvelope
StraightLine
StraightLine
Strain
Stre
ss
Tension
Compression
Figure 4-17 Modified Chang-Mander Model for Concrete (adapted from Waugh 2007)
4.5.3.4.2 Modified Scott-Kent-Park Model by Yassin et al. (1994)
The modified Scott-Kent-Park model (Yassin 1994) was used in the core concrete of the zero-
length section element to accommodate the large deformation there. Orakcal et al. (2006b)
provided a good description of this model. Yassin (1994) proposed the hysteretic unloading and
reloading rules using the Scott-Kent-Park model strain-stress relationship model for confined
concrete (Scott et al. 1982).

144
The modified Scott-Kent-Park Model is schematically shown in Figure 4-18. There are three
regions in this backbone envelope curve, namely an ascending curve (OA), a descending straight
a horizontal (AB), and constant straight curve (BC), which are given by:
2
0 02 c c
c cf Kf ε εε ε
⎡ ⎤⎛ ⎞ ⎛ ⎞′= −⎢ ⎥⎜ ⎟ ⎜ ⎟⎝ ⎠ ⎝ ⎠⎢ ⎥⎣ ⎦
0cε ε≤ (OA) (4-34)
( )01c c cf Kf Z ε ε′ ⎡ ⎤= − −⎣ ⎦ 0 0c αε ε ε< ≤ (AB) (4-35)
c cf Kfα ′= 0c αε ε> (BC) (4-36)
where
0 0.002Kε = (4-37)
1 s yh
c
fKf
ρ= +′
(4-38)
0
0.53 0.29 0.75
145 100c
sc h
Zf h
f sρ ε
=′ ′+ + −
′ −
(4-39)
In these equations, 0ε is the concrete strain at maximum stress of cKf ′ , 0αε is the strain when the
horizontal straight curve segment starts (at point B in Figure 4-18), K is the factor accounting
for the strength increase in maximum stress due to confinement (at point A in Figure 4-18), Z is
the slope of strain softening (along AB in Figure 4-18), cf ′ and yhf are, respectively, the concrete
compressive strength (MPa) and the transverse reinforcement yield strength (MPa), sρ is the
volumetric ratio of transverse reinforcement, h′ is the width of core concrete, and hs is the
spacing of stirrups of hoop. Also, α is a factor to determine the magnitude of the strength in
region BC in Figure 4-18. Scott et al. (1982) suggested α = 0.2, but α = 0.6 was used to
accommodate the large deformation in the zero-length section element at the base of the column
in this research.

145
B
( , )
O
Strain
Stre
ss
Tension
Compression( , )
A
C
( , )
Figure 4-18 Modified Scott-Kent-Park Model for Concrete (adapted from Yassin 1994)
4.5.4 Model Verification with Quasi-Static Tests
As discussed in the beginning of this subsection, the purpose of this analytical study is to
simulate the blast response of three different types of the bridge pier columns, namely CFST
columns, RC columns and steel jacketed RC columns, using fiber-based analysis model as
presented above. As a first step, for the sake of verifying the fiber-based model itself, correlation
studies were conducted for the quasi-static cyclic loading tests of the three different type
columns. The analytically predicted behavior of these columns was compared with the
experimentally obtained one. Accordingly, two different columns for each type of column tested
by various researchers were used for each CFST column, RC column and steel jacketed RC
column, and the details of these columns are provided in the following.
4.5.4.1 Overview of Experimental Studies
Two different columns for each column type were selected, namely the two CFST column
specimens CFST-34 and CFST-42 tested by Marson and Bruneau (2004), the two RC column
specimens RC-TP60 and RC-Unit9 tested by Matsukawa et al. (2002) and Ghee at al. (1989),

146
respectively, and the two steel jacketed RC column specimens SJ-Unit4 and SJ-CR2 tested by
Chai et al. (1991) and Priestley et al. (1994a, 1994b), respectively. All these six columns were
tested under cyclic loading to investigate the seismic performance of each type of columns.
Details and material properties of each test column are shown in Table 4-8 and Table 4-9,
respectively. All columns were fixed at their base and free at their top where loads were applied,
except for the SJ-CR2 Column. In the case of the SJ-CR2 Column, the base of the column was
fixed and rotation of the top of the column was constrained. “Effective height” in Table 4-8 is
defined as the distance between the bottom of the column and the center of the loading actuator.
In Table 4-9, cf ′ is the concrete strength, yf , yhf and yjf are, respectively, the yield strength of
longitudinal reinforcement steel, transverse reinforcement steel, and steel tube or steel jacket.
The details of specimen and the hysteresis loops experimentally obtained are presented in
Appendix I. These hysteresis loops from the experiments are compared with those of analytical
results later.
Table 4-8 Cyclic Loading Test Column Details
Column Type
Effective Height
Column Diameter
Axial Force
Boundary Condition
(mm) (mm) (kN)
CFST-34 CFST Column
2200 323.9 1920 Fix-Free
CFST-42 2200 406.4 1920 Fix-Free
RC-TP60 RC Column
1350 400.0 180 Fix-Free
RC-Unit9 1000 400.0 751.5 Fix-Free
SJ-Unit4 Steel Jacketed Column
3658 632.2 1779 Fix-Free
SJ-CR2 2438 632.2 591.6 Fix-Fix (Rotation)

147
Table 4-9 Material Properties of Cyclic Loading Test Columns
Column Type
Longitudinal Steel Ratio
Transverse Steel Ratio cf ′ yf yhf yjf
(%) (%) (MPa) (MPa) (MPa) (MPa)
CFST-34 CFST Column
9.05 N/A 40 N/A N/A 415
CFST-42 9.13 N/A 35 N/A N/A 505
RC-TP60 RC Column
2.02 0.745 27.8 377 374 N/A
RC-Unit9 3.20 1.02 29.9 448 372 N/A
SJ-Unit4 Steel Jacketed Column
2.53 0.174 38.1 315 352 324
SJ-CR2 2.53 0.18 34.0 324 359 348
4.5.4.2 Analytical Model for Cyclic Loading Test Columns
The six columns were modeled by two-dimensional discrete models using beam-column
elements as previously described in Section 4.5.2. Figures 4-19 to 4-21 show the individual
analytical models for the CFST columns, RC columns, and steel jacketed RC columns,
respectively, along with the assignment of fiber sections to the elements. CFST columns were
modeled using the CFST sections shown in Figure 4-12 (a), and RC columns were modeled
using the RC sections shown in Figure 4-12 (b). In steel jacketed RC columns, assuming the
bond stress between the steel jacket and grout developed at a length of half of the column
diameter from the edge of the jacket, the contribution of the steel jacket to the flexural resistance
of the column was not considered over these length, but confinement effect by the steel jacket
(SJ Confined in Figure 4-21 (a)) was considered. Therefore, the label quote as “SJ Section” in
Figure 4-21 means that steel jackets increase the flexural strength as well as increasing the
confinement of the reinforced concrete section. The label quote as “RC Section (SJ Confined)”
in Figure 4-21 means that the reinforced concrete section is confined, but the steel jackets do not
increase the flexural strength of the section. Note that in Figure 4-21 (a) for that particular
column, the steel jacket extended only for limited height from the bottom of the column upward
as opposed to the SJ-CR2 Column in Figure 4-21 (b) for which the steel jacket spanned the entire
height of the column. The rotation of the top of the SJ-CR2 Column was constrained as shown

148
in Figure 4-21 (b). The zero-length element was used in both RC columns and steel jacketed RC
columns to implement the strain penetration model.
Loading
10@
220
= 2
200
1
2
3
4
5
6
7
8
9
10
11
CFSTSection
AxialForce
Figure 4-19 Analytical Model for CFST Column
Loading
6@20
0 =
220
07
RCSection
Zero-lengthElement
9
8
1
6
5
4
3
2 150
AxialForce
(a) RC-TP60 Column
Loading5@
200
= 1
000
7
RCSection
Zero-lengthElement
1
6
5
4
3
2
AxialForce
(b) RC-Unit9 Column
Figure 4-20 Analytical Model for RC Column

149
Loading
2414
7
RCSection
Zero-lengthElement
1
6
543
2
8
9
340
587
316
SJ Section
RC Section(SJ Confined)
RC Section(SJ Confined)
AxialForce
(a) SJ-Unit4 Column
Loading
1766
7
1
6
5
4
3
2
8
336
336
SJ Section
RC Section(SJ Confined)
RC Section(SJ Confined)
9Zero-length
Element
Zero-lengthElement
AxialForce
(b) SJ-CR2 Column Figure 4-21 Analytical Model for Steel Jacketed RC Column
4.5.4.3 Analytical Results and Comparison with Experimental Results
Figures 4-22 (a) through 4-27 (a) compare the experimentally obtained hysteresis loops with the
analytical results computed using the fiber-based model for the column and material properties
outlined in the prior subsections for the same six columns. Figures 4-22 (a) and 4-23 (a)
compare the base moment-displacement hysteresis loops, and Figures 4-24 (a) through 4-27 (a)
compare the lateral force-displacement hysteresis loops (because that is how they were presented
in the original publications). In Figures 4-22 to 4-27, the analytical stress-strain relationships of
(b) the core concrete at the compression edge and (c) the steel tube or steel bar at the tension
edge, are also presented. Note that in many of the experiments multiple cycles of loadings were
applied to each specified value of displacements (sometimes up to 3 or 5 cycles depending on the
experiment), but here only one cycle of loading was applied in the numerical analyses conducted.
The experimental hysteresis loops of CFST-34 and CFST-42, and SJ-CR2 were plotted based on
the graphs presented in Marson and Bruneau (2004) and Priestley et al. (1994b), respectively.
The experimental hysteresis loops of RC-TP60, and RC-Unit9 and SJ-Unit4 were obtained from

150
the Kawashima Lab Test Database (Tokyo Tech 2008) and the PEER Structural Performance
Database (PEER 2008), respectively. Here, it is observed in Figures 4-22 (a) through 4-27 (a)
that the analytically obtained hysteretic behaviors capture well the experimentally obtained ones
at least for the first cycle of displacement at the same displacement amplitude.
To further evaluate effectiveness of the analytical results in replicating the experimentally
obtained hysteresis loops, (a) the maximum base moment or lateral force at each cycle and (b)
the residual displacement at each cycle, are compared with those obtained from the test results
for the CFST columns, RC columns and steel jacketed RC columns in Figures 4-28 to 4-30,
respectively. The results on the figures show the ratio of the analytical results to the
experimental results versus the maximum drift at each cycle.
Figure 4-28 shows that the maximum base moment of CFST columns was predicted within 10%
accuracy when the drift is larger than 2%. The accuracy was substantially less for those values at
lower magnitude of drift. The difference between the analytical and experimental results was
significantly larger for the residual displacements although at larger drift in excess of 1% in
positive direction and 4% in negative direction the accuracy is still within 10%. This provided
confidence in the analytical model particularly given for the blast analyses, presented in
subsequence subsection, for which the specimens were subjected to significantly larger than 2%
drift.
As shown in Figure 4-29(a), the difference in maximum lateral force of RC columns between the
analyses and experiments are within 20%. The residual displacement of RC-TP60 was predicted
very well, but the analytical residual displacement of RC-Unit9 was larger than experimental one
by more than 20% as shown in Figure 4-29(b). Note that the data between -1.5% and 1.0 % was
not available in these cases.
Figure 4-30 shows that the maximum lateral force of steel jacketed RC columns was predicted
within 10% accuracy when the drift is larger than 1.5%. The accuracy was substantially less for
those values at lower magnitude of drift. The difference between the analytical and experimental

151
results was significantly larger for the residual displacements although at larger drift in excess of
1.5 % in positive direction and 3% in negative direction the accuracy is still within 20%.
Overall, for all the types of columns considered, the analyses conducted in this section
demonstrate that the fiber-based model is able to capture reasonably well the maximum lateral
forces that can be developed in the specimen as well as their residual displacements for the
magnitude of inelastic deformation typically expected to develop in blast loading situations.
-600
-400
-200
0
200
400
600
-200 -150 -100 -50 0 50 100 150 200
-8 -4 0 4 8
ExperimentAnalysis
Mom
ent (
kN-m
)
Displacement (mm)
Drift (%)
(a) Base Moment-Displacement Hysteresis
-60
-50
-40
-30
-20
-10
0
10
-0.12 -0.1 -0.08 -0.06 -0.04 -0.02 0 0.02S
tress
(MPa
)
Strain (b) Core Concrete at Compression Edge
-600
-400
-200
0
200
400
600
-0.2 -0.15 -0.1 -0.05 0 0.05 0.1 0.15 0.2
Stre
ss (M
Pa)
Strain (c) Steel Tube at Tension Edge
Figure 4-22 Analytical Results for Cyclic Loading Test of CFST-34

152
-1200
-800
-400
0
400
800
1200
-200 -150 -100 -50 0 50 100 150 200
-8 -4 0 4 8
ExperimentAnalysis
Mom
ent (
kN-m
)
Displacement (mm)
Drift (%)
(a) Base Moment-Displacement Hysteresis
-60
-50
-40
-30
-20
-10
0
10
-0.14 -0.12 -0.1 -0.08 -0.06 -0.04 -0.02 0 0.02
Stre
ss (M
Pa)
Strain (b) Core Concrete at Compression Edge
-600
-400
-200
0
200
400
600
-0.2 -0.15 -0.1 -0.05 0 0.05 0.1 0.15 0.2
Stre
ss (M
Pa)
Strain (c) Steel Tube at Tension Edge
Figure 4-23 Analytical Results for Cyclic Loading Test of CFST-42
-150
-100
-50
0
50
100
150
-80 -60 -40 -20 0 20 40 60 80
-3 -2 -1 0 1 2 3
ExperimentAnalysis
Late
ral F
orce
(kN
)
Displacement (mm)
Drift (%)
(a) Lateral Force-Displacement Hysteresis
-40
-30
-20
-10
0
-0.01 -0.005 0 0.005
Stre
ss (M
Pa)
Strain (b) Core Concrete at Compression Edge
-600
-400
-200
0
200
400
600
-0.02 -0.01 0 0.01 0.02 0.03 0.04
Stre
ss (M
Pa)
Strain (c) Steel Bar at Tension Edge
Figure 4-24 Analytical Results for Cyclic Loading Test of RC-TP60

153
-400
-300
-200
-100
0
100
200
300
400
-80 -60 -40 -20 0 20 40 60 80
-3 -2 -1 0 1 2 3
ExperimentAnalysis
Late
ral F
orce
(kN
)
Displacement (mm)
Drift (%)
(a) Lateral Force-Displacement Hysteresis
-50
-40
-30
-20
-10
0
10
-0.02 -0.015 -0.01 -0.005 0 0.005
Stre
ss (M
Pa)
Strain (b) Core Concrete at Compression Edge
-600
-400
-200
0
200
400
600
-0.02 -0.01 0 0.01 0.02 0.03 0.04
Stre
ss (M
Pa)
Strain (c) Steel Bar at Tension Edge
Figure 4-25 Analytical Results for Cyclic Loading Test of RC-Unit9
-300
-200
-100
0
100
200
300
-200 -100 0 100 200
-10 -5 0 5 10
ExperimentAnalysis
Late
ral F
orce
(kN
)
Displacement (mm)
Drift (%)
(a) Lateral Force-Displacement Hysteresis
-60
-50
-40
-30
-20
-10
0
10
-0.01 -0.005 0 0.005
Stre
ss (M
Pa)
Strain (b) Core Concrete at Compression Edge
-400
-200
0
200
400
-0.01 0 0.01 0.02 0.03
Stre
ss (M
Pa)
Strain (c) Steel Bar at Tension Edge
Figure 4-26 Analytical Results for Cyclic Loading Test of SJ-Unit4
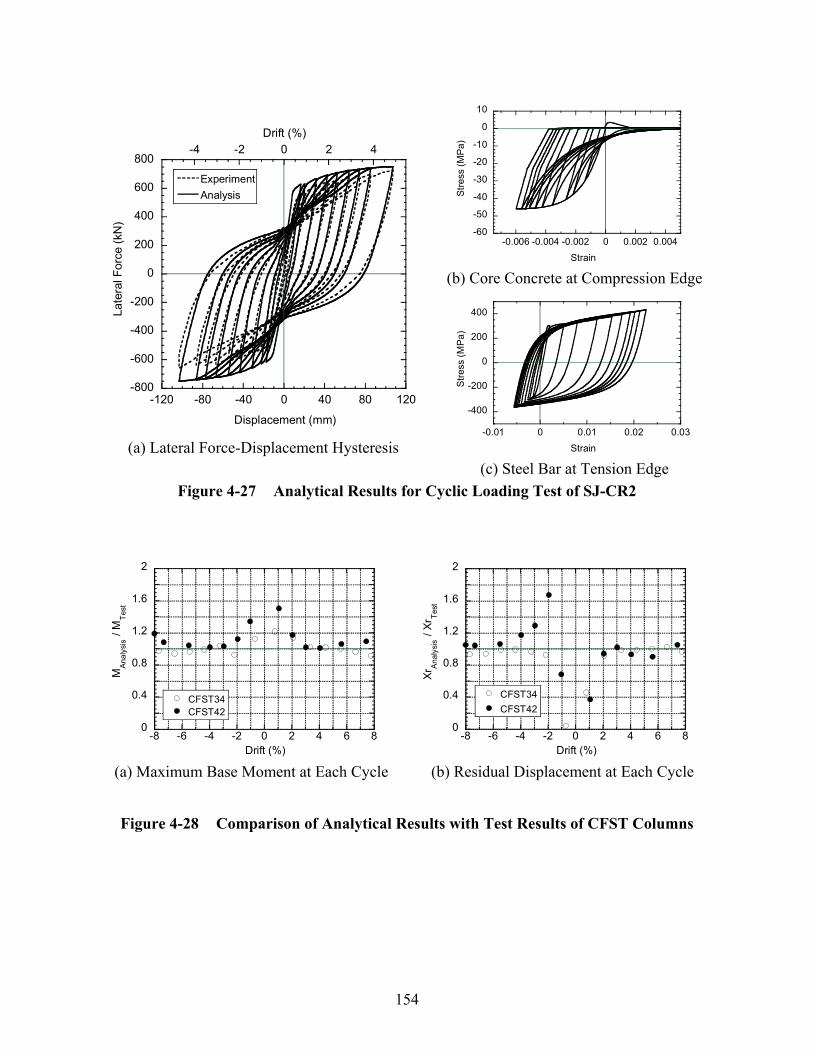
154
-800
-600
-400
-200
0
200
400
600
800
-120 -80 -40 0 40 80 120
-4 -2 0 2 4
ExperimentAnalysis
Late
ral F
orce
(kN
)
Displacement (mm)
Drift (%)
(a) Lateral Force-Displacement Hysteresis
-60
-50
-40
-30
-20
-10
0
10
-0.006 -0.004 -0.002 0 0.002 0.004
Stre
ss (M
Pa)
Strain (b) Core Concrete at Compression Edge
-400
-200
0
200
400
-0.01 0 0.01 0.02 0.03
Stre
ss (M
Pa)
Strain (c) Steel Bar at Tension Edge
Figure 4-27 Analytical Results for Cyclic Loading Test of SJ-CR2
0
0.4
0.8
1.2
1.6
2
-8 -6 -4 -2 0 2 4 6 8
CFST34CFST42
MAn
alys
is /
MTe
st
Drift (%)
(a) Maximum Base Moment at Each Cycle
0
0.4
0.8
1.2
1.6
2
-8 -6 -4 -2 0 2 4 6 8
CFST34CFST42
XrAn
alys
is /
XrTe
st
Drift (%)
(b) Residual Displacement at Each Cycle
Figure 4-28 Comparison of Analytical Results with Test Results of CFST Columns

155
0
0.4
0.8
1.2
1.6
2
-6 -4 -2 0 2 4 6
RC-TP60
RC-Unit9
F Anal
ysis
/ F Te
st
Drift (%) (a) Maximum Lateral Force at Each Cycle
0
0.4
0.8
1.2
1.6
2
-6 -4 -2 0 2 4 6
RC-TP60RC-Unit9
XrAn
alys
is /
XrTe
st
Drift (%) (b) Residual Displacement at Each Cycle
Figure 4-29 Comparison of Analytical Results with Test Results of RC Columns
0
0.4
0.8
1.2
1.6
2
-6 -4 -2 0 2 4 6
SJ-Unit4SJ-CR2
F Anal
ysis
/ F Te
st
Drift (%) (a) Maximum Lateral Force at Each Cycle
0
0.4
0.8
1.2
1.6
2
-6 -4 -2 0 2 4 6
SJ-Unit4SJ-CR2
XrAn
alys
is /
XrTe
st
Drift (%) (b) Residual Displacement at Each Cycle
Figure 4-30 Comparison of Analytical Results with Test Results of Steel Jacketed RC Columns
4.6 Fiber-based Dynamic Analysis 4.6.1 General
The purpose of fiber-based dynamic analyses presented here is hopefully to better capture full
response history of the column when subjected to blast loading, and also to revisit the shape
factor β derived previously from the simplified analyses and the SDOF dynamic analyses. As

156
discussed in Section 4.1, the shape factor β accounting for the reduction of blast pressures
unavoidably is affected by some assumptions built in the analytical model and method applied.
Some of these assumptions are dynamic increase factors used in the material model, moment-
curvature relationship used in the structural model, and viscous damping ratio.
Section 4.5 demonstrated that the fiber-based analytical method using the appropriate uniaxial
constitutive model for concrete and steel was able to capture reasonably well the maximum
lateral forces and residual displacement developed in the cyclically tested validation specimen
selected. Thus, here, this validated model is used to investigate in more details the behavior and
response of three different types of columns tested previously, namely CFST columns, RC
columns and steel jacketed RC columns when subjected to blast loading.
Flexural residual displacements obtained from the blast tests of CFST bridge columns (that
exhibited a ductile behavior) were selected as the comparison basis to assess the accuracy of the
analytical results obtained from the fiber-based model. Note that the flexural residual
deformations of the tested RC columns and steel jacketed RC columns were not significant due
to the shear failures of the column base. Therefore, as a first step, maximum residual
deformations of the tested CFST columns were compared with the ones that could be calculated
using the fiber-based analytical model. From there, the procedures to determine the factor β
follow what was done in Section 4.4 for the SDOF dynamic response history analyses.
By using the value of the factor β calibrated by the fiber-based model analyses for CFST
columns, the tested RC columns and steel jacketed RC columns were then analyzed using the
fiber-based model. Since the fiber-based analysis used in this research cannot capture the direct
shear failure which was actually observed in these column tests, the purpose of these fiber-based
analyses of the RC columns and steel jacketed RC columns are to calculate the shear force at the
column base (i.e. reaction force) to compare with the direct shear resistance of the columns.
In the following subsection, analytical models used for fiber-based analyses are discussed. Then,
moment-curvature analyses and modal analyses for CFST columns are presented. After the
description of how the applied blast loads are modeled in the analyses, analytical results of the

157
fiber-based based dynamic analyses are presented for the three different types of test columns,
namely CFST columns, RC columns and steel jacketed RC columns.
4.6.2 Analytical Model for Blast Loading Test Columns
The three different types of columns tested previously, namely CFST columns, RC columns and
steel jacketed RC columns, subjected to blast loading, were modeled using two-dimensional
discrete frame models as presented in Section 4.5. Figure 4-31 schematically shows a two-
dimensional discrete frame model analyzed and the type of cross-section assigned to the
elements for each column type (using the properties described in Section 4.5.2), along with two
different profile of applied blast loading. The model has 17 nodes, from Node 1 to Node 17, and
16 elements, from Elem 1 (Node 1 to Node 2) to Elem 16 (Node 16 to Node 17). The columns
were fixed at the bottom (Node 1) and the rotation and horizontal translation of the column top
(Node 17) was constrained to apply the axial force coming from the cap beam. The applied axial
forces were taken as 5.81 kN (1.31 kip) for the CFST columns and 2.00 kN (0.45 kip) for both
the RC columns and steel jacketed RC columns. The discrete lumped mass was assigned to the
nodes of Node 2 to Node16 as inertias to resist the blast loads. The gravity load corresponding
to these masses was applied as a uniformly distributed load along a column height. Note that the
strain penetration model used in the quasi-static cyclic loading test specimens was not modeled
for these blast test columns because these localized inelastic deformations were not observed in
specimens.
As shown in Figure 4-31, the CFST sections shown in Figure 4-12 (a) were assigned to the CFST
columns, and the RC sections shown in Figure 4-12 (b) were assigned to the RC columns. The
labels stating “PH Confined” and “OPH Confined” in Figure 4-31 (b) means that the reinforced
concrete sections are confined according to the actual transverse reinforcement ratios in the
plastic hinge (PH) region and outside of the plastic hinge (OPH) region, respectively. In the steel
jacketed RC columns, assuming that the bond stress between the steel jacket and grout developed
at a length of about half of the column diameter from the edge of the jacket, the contribution of
the steel jacket to the flexural resistance of the column was not considered over these length, but
confinement effect by the steel jacket was considered (as for the analytical model of the cyclic
loading test steel jacketed RC columns presented in Section 4.5.4.2).

158
14@
100
= 14
00
12
34
56
78
910
11CFSTSection
AxialForce
13
15
17
12
14
16
5050
(i) Uniformly Distributed Pressure
(ii) Actual Pressure
RC Section(OPH Confined)
(a) CFST Column
(b) RC Column
(c) Steel Jacketed RC Column
RC Section(PH Confined)
RC Section(PH Confined)
RC Section(SJ Confined)
RC Section(SJ Confined)
SJ Section
Section AssignmentApplied Loading Figure 4-31 Analytical Model for Blast Loading Tests
The Menegotto-Pinto model (Menegotto and Pinto 1973) was used to represent the uniaxial
constitutive model for steel jackets and steel tubes of the CFST columns. The reinforcing steel
bars were modeled using a tension stiffening model by Belarbi and Hsu (1994) to provide a
backbone envelope curve of constitutive stress-strain relationship and using the modified
Menegotto-Pinto model (Filippou et al. 1983) with isotropic strain hardening effect to determine
hysteresis rules within that envelope. The modified Chang-Mander model (Waugh 2007) was
used to model the uniaxial constitutive model for unconfined and confined concrete. The details
of these material constitutive models were presented previously in Section 4.5.3.
The strength values obtained from the compression tests of concrete cylinders and the tensile
tests for steel were considered in the analyses. The concrete strength and yield stress of steel
were multiplied by 1.25 and 1.2, respectively, to account for strength magnification at large
strain rates under impulsive conditions (Mays and Smith 1995).

159
To account for the damping effect of the structure, Rayleigh damping was used. A damping ratio
was assumed to be 5% for the first and third modes. The Krylov-Newton algorithm (see Section
4.5.2) provided by OpenSees (2007) was used to solve the nonlinear equilibrium equation. The
time increment of each step in the applied pressure histories was 0.01 msec, and the time step of
analyses was 0.0025 msec.
4.6.3 Moment-Curvature Analysis for CFST Columns
The moment-curvature relationship calculated using the fiber-based model, in which the
appropriate material stress-strain relationships were used, was compared with that used for the
simplified analysis and SDOF dynamic analysis. The moment-curvature relationship is one of
the analytical assumptions to affect the value of factor β . Both simplified analysis presented in
Section 3.4 and SDOF dynamic analysis presented in Section 4.4 used the same simplified
elasto-perfectly plastic moment-curvature relationship based on simple calculations. Figures
4-32 to 4-34 respectively compare the moment-curvature curves of CFST C4, C5, and C6
columns from the fiber-based model with the simplified moment-curvature curves (obtained
using the Bruneau and Marson (2004) equations for pM and effective stiffness). The resulting
maximum moment capacity calculated using the fiber-based model was 15.57, 18.50, and 43.05
kN-m for the CFST C4, C5, and C6 columns, respectively. These values are, respectively, 3, 12,
and 6% higher than those obtained by the simple calculations. The differences are attributed to
the strain hardening effect of the steel tubes modeled in the fiber-based calculations whereas this
effect was not considered in the simple calculations. These differences are small, and it shows
that the previous assumptions are reasonable. Therefore, it will be possible to compare results
obtained from the fiber-based model with those obtained from the simplified model.
4.6.4 Modal Analysis for CFST Columns
Modal analyses were performed for the three CFST columns (C4, C5, and C6 columns) to
investigate their vibration properties, namely natural periods and mode shapes. Table 4-10
presents the modal analysis results of natural periods and effective masses for Mode 1 through 7.
These are based on the initial stiffness of the columns. The natural periods of the first mode,
which has the highest effective mass of 69%, are 5.13, 4.18, and 3.65 for CFST C4, C5, and C6
columns, respectively. Because of the fix-fix boundary conditions of the columns, the effective

160
masses of the anti-symmetric Modes 2, 4, and 6 are zero. Therefore, these even modes do not
contribute the structural responses. The natural mode shapes of Mode 1, 3, 5, and 7 for the three
CFST columns are shown in Figure 4-35. First, the mode shapes were normalized such that
maximum displacements become unity, and then these normalized mode shapes were multiplied
by their corresponding effective masses. The resulting normalized mode shapes of same modes
for these different columns are almost identical.
0
5
10
15
20
0 0.1 0.2 0.3 0.4 0.5 0.6 0.7 0.8
Fiber-based Model
Simple Calculation
0
50
100
150
0 0.005 0.01 0.015 0.02
Mom
ent (
kN-m
)
Curvature (1/m)(k
ip-in
)
(1/in)
Figure 4-32 Comparison of Moment-Curvature Relationship for CFST C4 Column

161
0
5
10
15
20
0 0.1 0.2 0.3 0.4 0.5 0.6 0.7 0.8
Fiber-based Model
Simple Calculation
0
50
100
150
0 0.005 0.01 0.015 0.02M
omen
t (kN
-m)
Curvature (1/m)
(kip
-in)
(1/in)
Figure 4-33 Comparison of Moment-Curvature Relationship for CFST C5 Column
0
10
20
30
40
50
0 0.1 0.2 0.3 0.4 0.5 0.6 0.7 0.8
Fiber-based Model
Simple Calculation
050100150200250300350400
0 0.005 0.01 0.015 0.02
Mom
ent (
kN-m
)
Curvature (1/m)
(kip
-in)
(1/in)
Figure 4-34 Comparison of Moment-Curvature Relationship for CFST C6 Column

162
0
0.5
1
1.5
-0.4 -0.2 0 0.2 0.4 0.6 0.8
Mode 1Mode 3
Mode 5Mode 7
Hei
ght (
m)
Displacement
(a) CFST C4 Column
0
0.5
1
1.5
-0.4 -0.2 0 0.2 0.4 0.6 0.8
Mode 1Mode 3
Mode 5Mode 7
Hei
ght (
m)
Displacement
(b) CFST C5 Column
0
0.5
1
1.5
-0.4 -0.2 0 0.2 0.4 0.6 0.8
Mode 1Mode 3
Mode 5Mode 7
Hei
ght (
m)
Displacement
(c) CFST C6 Column
Figure 4-35 Natural Mode Shapes of CFST Columns
Table 4-10 Modal Analysis Results of CFST Columns
CFST C4 Column CFST C5 Column CFST C6 Column
Mode Natural Period
Effective Mass
Natural Period
Effective Mass
Natural Period
Effective Mass
(msec) (%) (msec) (%) (msec) (%)
1 5.13 69.0 4.18 69.0 3.65 69.0
2 1.86 0.0 1.52 0.0 1.32 0.0
3 0.95 13.2 0.77 13.2 0.67 13.2
4 0.57 0.0 0.47 0.0 0.41 0.0
5 0.38 5.4 0.31 5.4 0.27 5.4
6 0.28 0.0 0.23 0.0 0.20 0.0
7 0.21 2.9 0.17 2.9 0.15 2.9
163
4.6.5 Applied Blast Loadings
As shown in Figure 4-31, there were two profiles of blast loadings applied in the blast pressure
history analyses. One is (i) the uniformly distributed equivalent pressures, and the other is (ii) the
actual pressure distribution (obtained as described later). The uniformly distributed equivalent
pressures were selected to compare with the SDOF dynamic analyses which also used uniformly
distributed equivalent pressures. The analyses using the uniformly distributed pressures also
provide some preliminary basic understanding of the column response subjected to blast. The
equivalent pressure histories used here are identical to those used in the SDOF dynamic analyses
presented in Figure 4-4. The analyses conducted using uniformly distributed equivalent
pressures were only performed for the three test cases with mid-height explosion, namely Test 1-
3 of CFST C4 Column, Test 1-4 of CFST C6 Column, and Test 1-5 of CFST C5 Column,
because the pressures actually applied to these columns during the tests were closer to
symmetrically loading to the structure and are suited for modeling using uniformly distributed
loads due to this symmetry.
The analyses conducted using actual pressure profiles were done by calculating these profiles
using Bridge Explosive Loading program (BEL 2004). The blast pressures along the height of
column were obtained at 84 data points along the height of the column, and these pressures were
averaged within each member (approximately five pressure points with each member). Figures
4-36 to 4-42 show the resulting applied blast pressures for Tests 1-3, 1-4, 1-5, 1-6, 1-9 and 1-10,
2-1 and 2-3, and 2-2 and 2-4, respectively. These figures present (1) comparison of blast
pressure distributions along the height at three selected different times from BEL with those
applied in the analyses, and (2) applied pressure histories for two selected elements which are
Elem 1 and 8, and Elem 1 and 3 for the mid-height and low-height explosion cases, respectively.
Note that the times in these figures start at the initiation of the explosions.
Figure 4-36(1) shows by comparing the pressure distribution obtained from BEL with those
averaged as indicated before that the resolution of the pressure distributions is satisfactory. It
also illustrates that the symmetric distribution of pressures is applied to the column as shown in
Figures 4-36(1a) and (1b) until the pressures are reflected on the ground and act on the elements
around the bottom of the column. The pressures reflected on the ground are observed in the

164
bottom element (Elem 1) in Figure 4-36(1c). The maximum blast pressure applied to the center
element is 2.3 times higher than that applied to the bottom element in this case as shown in
Figures 4-36(2a) and (2b). The trends described above are also observed in the mid-height
explosion cases of Test 1-4 and Test 1-5 as shown in Figure 4-37 and Figure 4-38, respectively.
For the cases with low-height explosions, the applied blast pressures of Tests 1-6, 1-9, 1-10, 2-1,
2-3, 2-2 and 2-4 are presented in Figures 4-39 to 4-42 (sometimes grouped together). Because
the explosions are closer to the ground surface, the higher pressures are applied to the lower
height of the column, due to the Mack reflection, than highest pressures of the mid-height
explosion cases. For example, the values of maximum pressures of Tests 2-1 and 2-3 is 151.7
MPa developed at mid-height element whereas that of Test 1-3 is 128.7 MPa developed at the
base element, even though the standoff distance of Test 1-3 ( x = 2X) is closer than those of Tests
2-1 and 2-3 ( x = 2.16X). The maximum pressures were calculated at the base of the column due
to the Mack reflection except for Tests 1-9 and 1-10. This is because the standoff distances of
these cases ( x = 0.8X) were so close that the Mack mechanism did not form between the
explosive charge and the column. Therefore, the maximum pressures were not computed at the
base of the column, but at the height of the explosion in these test cases.

165
0
0.5
1
1.5
-50 0 50 100 150
BELApplied Pressures
0
1
2
3
4
Col
umn
Hei
ght (
m)
Pressure (MPa)
Col
umn
Hei
ght (
ft)
(1a) t = 0.12 (msec)
0
0.5
1
1.5
-50 0 50 100 150
BELApplied Pressures
0
1
2
3
4
Col
umn
Hei
ght (
m)
Pressure (MPa)
Col
umn
Hei
ght (
ft)(1b) t = 0.20 (msec)
0
0.5
1
1.5
-50 0 50 100 150
BELApplied Pressures
0
1
2
3
4
Col
umn
Hei
ght (
m)
Pressure (MPa)
Col
umn
Hei
ght (
ft)
(1c) t = 0.25 (msec)
(1) Comparison of Pressure Distributions
0
50
100
150
0
5
10
15
20
0 0.5 1 1.5
Pre
ssur
e (M
Pa)
Time (msec)
(ksi
)
(2a) Bottom Element (Elem 1)
0
50
100
150
0
5
10
15
20
0 0.5 1 1.5
Pre
ssur
e (M
Pa)
Time (msec)
(ksi
)
(2b) Center Element (Elem 8)
(2) Applied Pressure Histories
Figure 4-36 Applied Blast Pressures of Test 1-3 (CFST C4 Column)
166
0
0.5
1
1.5
0 250 500
BELApplied Pressure
0
1
2
3
4
Col
umn
Hei
ght (
m)
Pressure (MPa)
Col
umn
Hei
ght (
ft)
(1a) t = 0.05 (msec)
0
0.5
1
1.5
0 250 500
BELApplied Pressure
0
1
2
3
4
Col
umn
Hei
ght (
m)
Pressure (MPa)
Col
umn
Hei
ght (
ft)(1b) t = 0.13 (msec)
0
0.5
1
1.5
0 250 500
BELApplied Pressure
0
1
2
3
4
Col
umn
Hei
ght (
m)
Pressure (MPa)
Col
umn
Hei
ght (
ft)
(1c) t = 0.20 (msec)
(1) Comparison of Pressure Distributions
0
250
500
-10010203040506070
0 0.5 1 1.5
Pres
sure
(MP
a)
Time (msec)
(ksi
)
(2a) Bottom Element (Elem 1)
0
250
500
-10010203040506070
0 0.5 1 1.5
Pre
ssur
e (M
Pa)
Time (msec)
(ksi
)
(2b) Center Element (Elem 8)
(2) Applied Pressure Histories
Figure 4-37 Applied Blast Pressures of Test 1-4 (CFST C6 Column)

167
0
0.5
1
1.5
0 250 500
BELApplied Pressure
0
1
2
3
4
Col
umn
Hei
ght (
m)
Pressure (MPa)
Col
umn
Hei
ght (
ft)
(1a) t = 0.06 (msec)
0
0.5
1
1.5
-100 0 100 200 300 400
BELApplied Pressure
0
1
2
3
4
Col
umn
Hei
ght (
m)
Pressure (MPa)
Col
umn
Hei
ght (
ft)(1b) t = 0.13 (msec)
0
0.5
1
1.5
-100 0 100 200 300 400
BELApplied Pressure
0
1
2
3
4
Col
umn
Hei
ght (
m)
Pressure (MPa)
Col
umn
Hei
ght (
ft)
(1c) t = 0.21 (msec)
(1) Comparison of Pressure Distributions
-100
0
100
200
300
400
-10
0
10
20
30
40
50
0 0.5 1 1.5
Pre
ssur
e (M
Pa)
Time (msec)
(ksi
)
(2a) Bottom Element (Elem 1)
-100
0
100
200
300
400
-10
0
10
20
30
40
50
0 0.5 1 1.5
Pre
ssur
e (M
Pa)
Time (msec)
(ksi
)
(2b) Center Element (Elem 8)
(2) Applied Pressure Histories
Figure 4-38 Applied Blast Pressures of Test 1-5 (CFST C5 Column)
168
0
0.5
1
1.5
0 100 200 300
BELApplied Pressure
0
1
2
3
4
Col
umn
Hei
ght (
m)
Pressure (MPa)
Col
umn
Hei
ght (
ft)
(1a) t = 0.08 (msec)
0
0.5
1
1.5
0 100 200 300
BELApplied Pressure
0
1
2
3
4
Col
umn
Hei
ght (
m)
Pressure (MPa)
Col
umn
Hei
ght (
ft)(1b) t = 0.10 (msec)
0
0.5
1
1.5
0 100 200 300
BELApplied Pressure
0
1
2
3
4
Col
umn
Hei
ght (
m)
Pressure (MPa)
Col
umn
Hei
ght (
ft)
(1c) t = 0.22 (msec)
(1) Comparison of Pressure Distributions
0
100
200
300
0
8
16
24
32
40
48
0 0.5 1 1.5
Pre
ssur
e (M
Pa)
Time (msec)
(ksi
)
(2a) Bottom Element (Elem 1)
0
100
200
300
0
8
16
24
32
40
48
0 0.5 1 1.5
Pre
ssur
e (M
Pa)
Time (msec)
(ksi
)
(2b) Low Height Element (Elem 3)
(2) Applied Pressure Histories
Figure 4-39 Applied Blast Pressures of Test 1-6 (CFST C4 Column)

169
0
0.5
1
1.5
0 250 500 750 1000
BELApplied Pressure
0
1
2
3
4
Col
umn
Hei
ght (
m)
Pressure (MPa)
Col
umn
Hei
ght (
ft)
(1a) t = 0.04 (msec)
0
0.5
1
1.5
0 250 500 750 1000
BELApplied Pressure
0
1
2
3
4
Col
umn
Hei
ght (
m)
Pressure (MPa)
Col
umn
Hei
ght (
ft)(1b) t = 0.06 (msec)
0
0.5
1
1.5
0 250 500 750 1000
BELApplied Pressure
0
1
2
3
4
Col
umn
Hei
ght (
m)
Pressure (MPa)
Col
umn
Hei
ght (
ft)
(1c) t = 0.13 (msec)
(1) Comparison of Pressure Distributions
0
250
500
750
1000
0
50
100
0 0.5 1 1.5
Pre
ssur
e (M
Pa)
Time (msec)
(ksi
)
(2a) Bottom Element (Elem 1)
0
250
500
750
1000
0
50
100
0 0.5 1 1.5
Pre
ssur
e (M
Pa)
Time (msec)
(ksi
)
(2b) Low Height Element (Elem 3)
(2) Applied Pressure Histories
Figure 4-40 Applied Blast Pressures of Test 1-9 (CFST C6 Column) and Test 1-10 (CFST C5 Column)

170
0
0.5
1
1.5
-50 0 50 100 150 200
BELApplied Pressure
0
1
2
3
4
Col
umn
Hei
ght (
m)
Pressure (MPa)
Col
umn
Hei
ght (
ft)
(1a) t = 0.12 (msec)
0
0.5
1
1.5
-50 0 50 100 150 200
BELApplied Pressure
0
1
2
3
4
Col
umn
Hei
ght (
m)
Pressure (MPa)
Col
umn
Hei
ght (
ft)(1b) t = 0.13 (msec)
0
0.5
1
1.5
-50 0 50 100 150 200
BELApplied Pressure
0
1
2
3
4
Col
umn
Hei
ght (
m)
Pressure (MPa)
Col
umn
Hei
ght (
ft)
(1c) t = 0.13 (msec)
(1) Comparison of Pressure Distributions
-50
0
50
100
150
200
-5
0
5
10
15
20
25
0 0.5 1 1.5
Pre
ssur
e (M
Pa)
Time (msec)
(ksi
)
(2a) Bottom Element (Elem 1)
-50
0
50
100
150
200
-5
0
5
10
15
20
25
0 0.5 1 1.5
Pre
ssur
e (M
Pa)
Time (msec)
(ksi
)
(2b) Low Height Element (Elem 3)
(2) Applied Pressure Histories
Figure 4-41 Applied Blast Pressures of Test 2-1 (RC1 Column) and Test 2-3 (SJ2 Column)

171
0
0.5
1
1.5
-25 0 25 50 75 100
BELApplied Pressure
0
1
2
3
4
Col
umn
Hei
ght (
m)
Pressure (MPa)
Col
umn
Hei
ght (
ft)
(1a) t = 0.20 (msec)
0
0.5
1
1.5
-25 0 25 50 75 100
BELApplied Pressure
0
1
2
3
4
Col
umn
Hei
ght (
m)
Pressure (MPa)
Col
umn
Hei
ght (
ft)(1b) t = 0.21 (msec)
0
0.5
1
1.5
-25 0 25 50 75 100
BELApplied Pressure
0
1
2
3
4
Col
umn
Hei
ght (
m)
Pressure (MPa)
Col
umn
Hei
ght (
ft)
(1c) t = 0.31 (msec)
(1) Comparison of Pressure Distributions
-25
0
25
50
75
100
0
4
8
12
0 0.5 1 1.5
Pre
ssur
e (M
Pa)
Time (msec)
(ksi
)
(2a) Bottom Element (Elem 1)
-25
0
25
50
75
100
0
4
8
12
0 0.5 1 1.5
Pre
ssur
e (M
Pa)
Time (msec)
(ksi
)
(2b) Low Height Element (Elem 3)
(2) Applied Pressure Histories
Figure 4-42 Applied Blast Pressures of Test 2-2 (RC2 Column) and Test 2-4 (SJ1 Column)

172
4.6.6 Analytical Results
4.6.6.1 Shape Factor β
The shape factor β was calibrated for the six tested CFST columns, as well as the simplified
analyses (Fujikura et al. 2007, 2008) and SDOF dynamic analyses (Section 4.4.5.2), to match the
analytical results obtained using the fiber-based analyses with the experimental results. Table
4-11 summarizes the resulting shape factor β for the six tested CFST columns. As described in
Section 4.6.5, there were two profiles of blast loadings applied, namely the uniformly distributed
equivalent pressures and the actual pressure distributions. For comparison purposes, the
resulting values of β obtained from the analyses with 0.5% damping ratio, in addition to 5%
damping ratio, are also presented in Table 4-11 to investigate the sensitivity of the damping
effect on the values of β . Because the analyses with 0% Rayleigh damping ratio did not
converge, a small damping ratio of 0.5% was selected for this purpose.
Table 4-11 Summary of Shape Factors from Fiber-based Dynamic Analyses of CFST Columns
Test Test Equivalent Pressures Actual Pressures
Num. Col. Displ. 0.5 % Damping 5 % Damping 5 % Damping
(mm) β Ave.β β Ave.β β Ave.β
1-3 C4 30 0.564 0.630 0.670
1-4 C6 46 0.544 0.547 0.637 0.643 0.652 0.665
1-5 C5 76 0.534 0.662 0.672
1-6 C4 24 N/A N/A 0.606
1-9 C5 45 N/A N/A N/A N/A 0.550 0.561
1-10 C6 100 N/A N/A 0.528
Ave. N/A N/A 0.613
The average β value of 0.547 obtained using the uniformly distributed equivalent pressures and
fiber-based model with 0.5% damping ratio are comparable to the one of 0.532 from the SDOF

173
dynamic analyses with 0% damping ratio using the two different load-mass factors
corresponding to the different structural ranges (i.e. Case 3 in Table 4-5). The difference between
these two β values is within 3%, which is attributed to the difference of their moment-curvature
relationship as presented in Section 4.6.3.
The β value increases significantly, by about 18%, for the fiber-based model with the increase
of the damping ratio from 0.5% to 5% in the equivalent pressure profiles as shown in Table 4-11.
By contrast, the increase of the damping ratio from 0% to 5% did not affect the β value
significantly in the SDOF dynamic analyses as presented in Section 4.4.5.2. This is because the
fiber-based analysis can take the higher modes of vibrations into account and uses the Rayleigh
damping here. To investigate this, Figure 4-43 compares the displacement history at the column
mid-height and the reaction force history at the column base corresponding to 0.5% and5 %
damping ratios for the Test 1-3 case. Note that the average β factors of 0.564 for 0.5% damping
and 0.630 for 5% damping were determined by matching the residual displacements obtained
analytically with those obtained from the experiments as shown in Figure 4-43(a). As shown in
Figure 4-43(b), the resulting reaction force at the base of the column using 0.5% damping ratio
fluctuates at a higher frequency (i.e. at short periods in the range of 0.1 to 0.2 msec) whereas the
reaction history curve using 5% damping ratio is relatively smoother and has less effects of
higher frequency modes. The origin of the high frequency modes that develop during response
to the blast loadings will be explained in the subsequent subsection. Since the 5% Rayleigh
damping was used based on the first and third modes of vibrations, the high frequency modes
above the 3rd mode were less significant in this case. Therefore, the Rayleigh damping for the
fiber-based model has an effect, and can significantly reduce the structural response when
subjected to the blast loading.
Beyond the above, it is also observed in Table 4-11 that using the actual pressure profiles slightly
increases the average β value by 4% over using the uniformly distributed equivalent pressures
for the mid-height explosion cases. When using actual pressure profiles, the average β value
for the low-height explosion cases is 15% smaller than that for the mid-height explosion cases,
while this difference was only 3% for the SDOF dynamic analyses (in Table 4-5). This could be

174
partly attributed to the reflected pressures on the ground computed by BEL. The BEL assumes
that the pressure reflects on the ground perfectly, but this was not the case in the experiments.
Accordingly, the reflected pressures applied to the column close to the ground could be
overestimated, resulting in the lower values of β for the low-height explosion cases. In the
SDOF dynamic analyses, this possible overestimation of the reflected pressures can be reduced
in the process of calculating the equivalent pressures given by Equation 4-4 because of the
normalized deflected shape of the column assumed in the calculation.
0
10
20
30
40
50
0
0.4
0.8
1.2
1.6
0 5 10 15 20 25
0.5 % Damping5 % DampingTest Residual Displ.
Dis
plac
emen
t (m
m)
Time (msec)
(in)
(a) Displacement History (at Mid-height)
-350
-300
-250
-200
-150
-100
-50
0
50
0 0.5 1 1.5
0.5 % Damping
5 % Damping
Rea
ctio
n Fo
rce
(kN
)
Time (msec)
(b) Reaction Force History (at Base)
Figure 4-43 Comparison of Analytical Results with Different Damping Ratio of Test 1-3 (CFST C4 Column)
4.6.6.2 Structural Response of CFST Columns
In order to verify that the analytical residual displacements obtained using the shape factor β
presented in Table 4-11 would match the experimental ones, and to illustrate the structural
response using these factors, the structural responses of six tested CFST columns computed
using a fiber-based model with 5% damping ratio are presented in Figures 4-44 to 4-52. The
resulting maximum displacements and maximum reaction forces at the base and top of the

175
column are summarized in Table 4-12. Note that the maximum displacements obtained from the
SDOF dynamic analyses are also presented in Table 4-12.
Table 4-12 Summary of Analytical Results from Fiber-based Dynamic Analyses of CFST Columns
Maximum Displacement Maximum Reaction Force
Test SDOF
Dynamic Analysis
Equivalent Pressures
Actual Pressures
Equivalent Pressures Actual Pressures
Num. Col. Base Top Base Top
mm mm mm kN kN kN kN
1-3 C4 35.5 41.8 43.5 -303.8 -303.8 -280.2 -97.9
1-4 C6 49.6 57.8 57.8 -1106.4 -1106.4 -306.1 321.9
1-5 C5 78.9 86.4 86.0 -643.2 -643.2 -322.7 -115.8
1-6 C4 33.9 N/A 36.9 N/A N/A -855.0 -101.0
1-9 C6 51.2 N/A 55.7 N/A N/A -2074.0 -326.7
1-10 C5 105.5 N/A 108.3 N/A N/A -1157.3 -149.5
4.6.6.2.1 Mid-height Explosion and Equivalent Pressure Cases
Figures 4-44 to 4-46 present the analytical results of Tests 1-3, 1-4 and 1-5, respectively, for the
mid-height explosion cases when subjected to the uniformly distributed equivalent pressures.
Figure 4-44(1) presents acceleration, velocity, and displacement distributions along the height of
the column at three selected different times (t = 0.12, 0.60, and 1.04 msec). The time of 0.12
msec is shortly after the blast loadings were applied and largest accelerations were observed: at
that time almost no deformations are observed along the column. The times of 0.60 and 1.04
msec, are arbitrarily selected to show the high frequency modes in the acceleration shapes
similar to the mode shapes of the third mode and fifth mode, respectively, as shown in Figure
4-35. These high frequency mode effects are summed in both the velocity and displacement
shapes.

176
In Figure 4-44(2), the maximum displacement of 41.8 mm is observed at time of 4.02 msec,
much later than the end of the applied blast pressure (the blast pressure starts at the time of 0.10
msec, and the pressure duration is 0.16 msec as shown in Table 4-7). This maximum
displacement is larger than that of SDOF dynamic analysis shown in Table 4-12 by 18%. The
reaction forces at the base and top of the column are identical due to the symmetry of the column
and the blast pressure profiles applied as shown in Figure 4-44(3). The maximum reaction forces
of -303.8 kN are observed at time of 0.15 msec that occurs before the end of the applied blast
pressure. In Figure 4-44(3), there are some localized fluctuations of the reaction forces in the
overall reaction force history curve. This is again attributed to the high frequency modes of
vibrations. For instance, the acceleration shape at time of 0.60 msec in Figure 4-44(1a) causes
the localized fluctuation of the reaction forces observed around time of 0.60 msec in Figure
4-44(3). This localized fluctuation of the reaction force is observed more significantly in the
analytical results with small damping ratio as presented in Figure 4-43(b).
The stress-strain relationships of core concrete and steel tube in Figure 4-44(4) show that these
fiber materials experience less cyclic loading than typically the case under earthquake loadings.
However, these curves show that the response following the point of maximum displacement is
not purely linear elastic and that rather the stiffness of the structure is less at that point than the
initial stiffness. The trends described above are also observed in the other mid-height explosion
cases of Test 1-4 and Test 1-5 under equivalent pressures as shown in Figures 4-45 and 4-46.
4.6.6.2.2 Mid-height Explosion and Actual Pressure Cases
Figures 4-47 to 4-49 present the analytical results of Tests 1-3, 1-4 and 1-5, respectively, for the
mid-height explosion cases when subjected to the actual pressure profiles. Figure 4-47(1)
presents acceleration, velocity, and displacement distributions along the height of the column at
three selected different times (t = 0.12, 0.38, and 0.62 msec). At time of 0.12 msec, the masses
around mid-height only are subjected to the accelerations and velocities because the blast
pressures are only applied to around mid-height of the column as presented in Figure 4-36(1a).
The times of 0.38 and 0.62 msec are arbitrarily selected to show the acceleration and velocity
distributions. These distributions are not symmetric because the reflected pressures on the

177
ground are applied around low-height of the column as shown in Figure 4-36(1c). The high
frequency modes are also observed in the acceleration distribution at times of 0.38 and 0.62 msec.
Displacement history at mid-height (in Figure 4-47(2)), and stress-strain relationship of core
concrete and steel tube (in Figure 4-47(4)) are similar to those observed in the analytical results
of equivalent pressure case (in Figure 4-44). As shown in Figure 4-36(3), the reaction forces at
the base and top of the column are identical up to 0.23 msec, but after that, the magnitude of the
reaction force at the bottom increases significantly due to the reflected pressures on the ground
applied around low-height of the column as shown in Figure 4-36(1c).
The trends described above are also observed in the other mid-height explosion cases of Test 1-4
and Test 1-5 under actual pressure profiles as shown in Figures 4-48 and 4-49. Table 4-12 shows
that the maximum displacements obtained from actual pressures are comparable to those from
equivalent pressures, and that the maximum reaction forces obtained form actual pressures are
overall smaller than those from equivalent pressures.
4.6.6.2.3 Low-height Explosion and Actual Pressure Cases
Figures 4-50 to 4-52 present the analytical results of Tests 1-6, 1-9 and 1-10, respectively, for
low-height explosion cases (h = 0.25 m) when subjected to the actual pressure profiles. Figure
4-50(1) presents acceleration, velocity, and displacement distributions along the height of the
column at three selected different times (t = 0.09, 2.25, and 5.25 msec). At time of 0.09 msec,
the masses around low-height only are subjected to the accelerations and velocities because the
blast pressures are only applied to around mid-height of the column as presented in Figure
4-39(1a). As shown in Figure 4-50(2), the maximum displacement at height of 0.35 m is
observed at time of 2.25 msec, and after that, another peak displacement is observed at time of
5.52 msec. This phenomenon can be explained either by recognizing contributions of the higher
mode effects or by thinking about it in terms of traveling wave effects. First, the maximum
velocity around low-height of the column occurs at time of 0.09 msec. Then, by traveling wave
effects, the masses above that point are pulled outwards up to time of 2.25 msec to create the
second velocity distribution shown in Figure 4-50(1b). Under the effect of the traveling impulse,

178
another maximum displacement occurs at time of 5.25 msec per the deflected shape shown in
Figure 4-50(1c).
There is a significant difference of maximum reaction forces developed at the base and top of the
column as shown in Figure 4-50(3). The maximum reaction forces observed are -855.0 kN and -
101.0 kN at the base and top, respectively as shown in Table 4-12. This is because the higher
pressures are applied to around lower-height of the column due to the Mach reflection of the
blast pressures on the ground as presented in Figure 4-39(1).
The trends described above are also observed in the other low-height explosion cases of Test 1-9
and Test 1-10 under actual pressure profiles as shown in Figures 4-51 and 4-52. Figures 4-51(4)
and 4-52(4) show the large strains developed both in the core concrete fiber at compression edge
and in the steel tube at tension edge. Maximum strains of 0.84 and 1.38 are developed in the
steel tube of Test 1-9 and Test 1-10, respectively. These values are much larger than their
fracture strain of about 0.25 in CFST C6 column (Test 1-9) and 0.4 in CFST C5 column (Test 1-
10) obtained from the coupon tests of their steel tubes. The blast test observations presented in
Section 3.4.4 showed that the steel tube of CFST C5 column (Test 1-10) fractured at the base of
the column, but that of CFST C6 column (Test 1-9) did not fracture. Although the model was
not developed to investigate why CFST C6 column did not fracture even though its analytically
obtained strain suggests otherwise, it is speculated that the strain at the base of the steel tube
might have been less than the predicted strain by the analytical model on account of unbounding
of the steel tube in the concrete foundation allowing the strains to propagate below the
foundation.
179
0
0.5
1
1.5
-50 0 50 100 150 200
t = 0.12 (msec)t = 0.60 (msec)t = 1.04 (msec)
Hei
ght (
m)
Acceleration (mm/msec2) (1a) Acceleration
0
0.5
1
1.5
-10 0 10 20 30 40 50
t = 0.12 (msec)t = 0.60 (msec)t = 1.04 (msec)
Hei
ght (
m)
Velocity (mm/msec) (1b) Velocity
0
0.5
1
1.5
-10 0 10 20 30
t = 0.12 (msec)t = 0.60 (msec)t = 1.04 (msec)
Hei
ght (
m)
Displacement (mm) (1c) Displacement
(1) Structural Response Distributions along Height
0
10
20
30
40
50
0
0.4
0.8
1.2
1.6
0 5 10 15 20 25
Dis
plac
emen
t (m
m)
Time (msec)
(in)
(2) Displacement History (at Mid-height)
-350-300-250-200-150-100-50
050
0 2 4 6 8 10
BaseTopR
eact
ion
Forc
e (k
N)
Time (msec) (3) Reaction Force History
-80
-60
-40
-20
0
-0.08 -0.06 -0.04 -0.02 0
Stre
ss (M
Pa)
Strain (4a) Core Concrete at Compression Edge
-600
-400
-200
0
200
400
600
-0.02 0 0.02 0.04 0.06 0.08 0.1 0.12
Stre
ss (M
Pa)
Strain (4b) Steel Tube at Tension Edge
(4) Stress-Strain Relationships
Figure 4-44 Analytical Results of Test 1-3 (CFST C4 Column) subjected to Equivalent Uniform Pressures
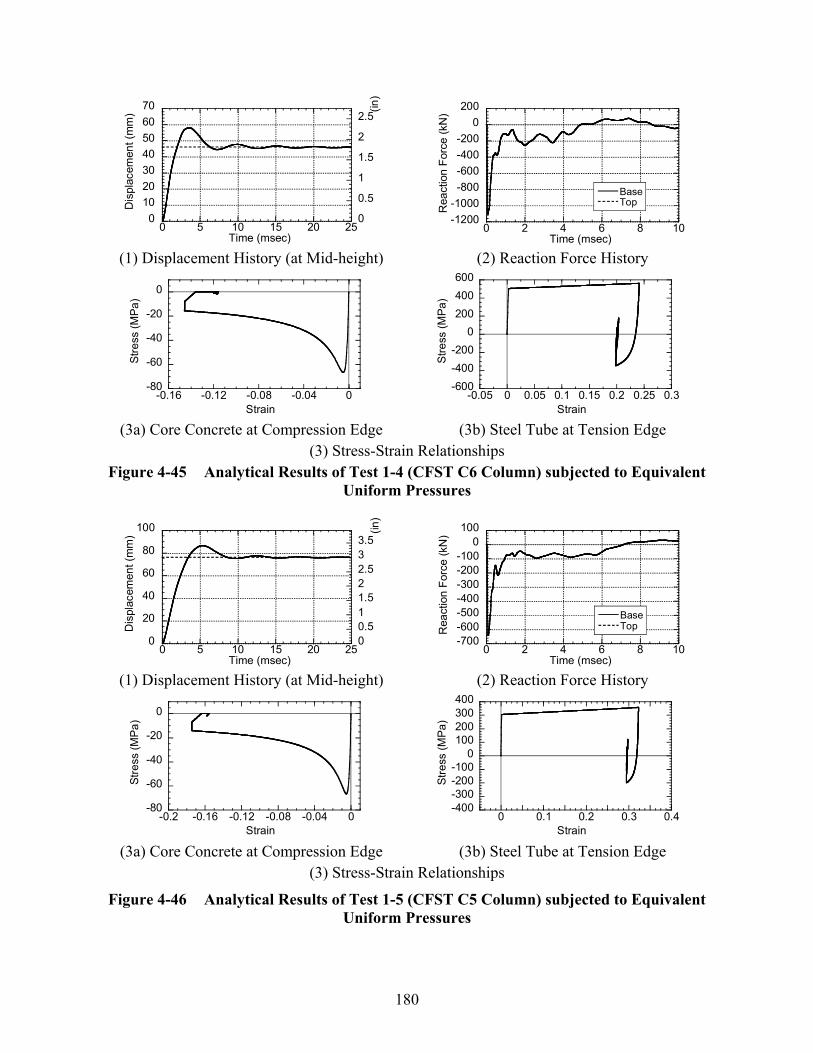
180
010203040506070
0
0.5
1
1.5
2
2.5
0 5 10 15 20 25
Dis
plac
emen
t (m
m)
Time (msec)
(in)
(1) Displacement History (at Mid-height)
-1200-1000-800-600-400-200
0200
0 2 4 6 8 10
BaseTop
Rea
ctio
n Fo
rce
(kN
)
Time (msec) (2) Reaction Force History
-80
-60
-40
-20
0
-0.16 -0.12 -0.08 -0.04 0
Stre
ss (M
Pa)
Strain (3a) Core Concrete at Compression Edge
-600-400-200
0200400600
-0.05 0 0.05 0.1 0.15 0.2 0.25 0.3
Stre
ss (M
Pa)
Strain (3b) Steel Tube at Tension Edge
(3) Stress-Strain Relationships Figure 4-45 Analytical Results of Test 1-4 (CFST C6 Column) subjected to Equivalent
Uniform Pressures
0
20
40
60
80
100
00.511.522.533.5
0 5 10 15 20 25
Dis
plac
emen
t (m
m)
Time (msec)
(in)
(1) Displacement History (at Mid-height)
-700-600-500-400-300-200-100
0100
0 2 4 6 8 10
BaseTopR
eact
ion
Forc
e (k
N)
Time (msec) (2) Reaction Force History
-80
-60
-40
-20
0
-0.2 -0.16 -0.12 -0.08 -0.04 0
Stre
ss (M
Pa)
Strain (3a) Core Concrete at Compression Edge
-400-300-200-100
0100200300400
0 0.1 0.2 0.3 0.4
Stre
ss (M
Pa)
Strain (3b) Steel Tube at Tension Edge
(3) Stress-Strain Relationships
Figure 4-46 Analytical Results of Test 1-5 (CFST C5 Column) subjected to Equivalent Uniform Pressures

181
0
0.5
1
1.5
-100 0 100 200 300 400
t = 0.12 (msec)t = 0.38 (msec)t = 0.62 (msec)
Hei
ght (
m)
Acceleration (mm/msec2) (1a) Acceleration
0
0.5
1
1.5
-10 0 10 20 30
t = 0.12 (msec)t = 0.38 (msec)t = 0.62 (msec)
Hei
ght (
m)
Velocity (mm/msec) (1b) Velocity
0
0.5
1
1.5
-10 0 10 20 30
t = 0.12 (msec)t = 0.38 (msec)t = 0.62 (msec)
Hei
ght (
m)
Displacement (mm) (1c) Displacement
(1) Structural Response Distributions along Height
0
10
20
30
40
50
0
0.4
0.8
1.2
1.6
0 5 10 15 20 25
Dis
plac
emen
t (m
m)
Time (msec)
(in)
(2) Displacement History (at Mid-height)
-350-300-250-200-150-100-50
050
0 2 4 6 8 10
BaseTopR
eact
ion
Forc
e (k
N)
Time (msec) (3) Reaction Force History
-80-70-60-50-40-30-20-10
0
-0.1 -0.08 -0.06 -0.04 -0.02 0
Stre
ss (M
Pa)
Strain (4a) Core Concrete at Compression Edge
-600
-400
-200
0
200
400
600
0 0.05 0.1 0.15
Stre
ss (M
Pa)
Strain (4b) Steel Tube at Tension Edge
(4) Stress-Strain Relationships
Figure 4-47 Analytical Results of Test 1-3 (CFST C4 Column) subjected to Actual Pressures

182
010203040506070
0
0.5
1
1.5
2
2.5
0 5 10 15 20 25
Dis
plac
emen
t (m
m)
Time (msec)
(in)
(1) Displacement History (at Mid-height)
-400
-200
0
200
400
0 2 4 6 8 10
BaseTopR
eact
ion
Forc
e (k
N)
Time (msec) (2) Reaction Force History
-80
-60
-40
-20
0
-0.16 -0.12 -0.08 -0.04 0
Stre
ss (M
Pa)
Strain (3a) Core Concrete at Compression Edge
-600-400-200
0200400600
-0.05 0 0.05 0.1 0.15 0.2 0.25 0.3
Stre
ss (M
Pa)
Strain (3b) Steel Tube at Tension Edge
(3) Stress-Strain Relationships Figure 4-48 Analytical Results of Test 1-4 (CFST C6 Column) subjected to Actual
Pressures
0
20
40
60
80
100
00.511.522.533.5
0 5 10 15 20 25
Dis
plac
emen
t (m
m)
Time (msec)
(in)
(1) Displacement History (at Mid-height)
-400
-300
-200
-100
0
100
0 2 4 6 8 10
BaseTopR
eact
ion
Forc
e (k
N)
Time (msec) (2) Reaction Force History
-80
-60
-40
-20
0
-0.2 -0.16 -0.12 -0.08 -0.04 0
Stre
ss (M
Pa)
Strain (3a) Core Concrete at Compression Edge
-400-300-200-100
0100200300400
0 0.1 0.2 0.3 0.4
Stre
ss (M
Pa)
Strain (3b) Steel Tube at Tension Edge
(3) Stress-Strain Relationships
Figure 4-49 Analytical Results of Test 1-5 (CFST C5 Column) subjected to Actual Pressures
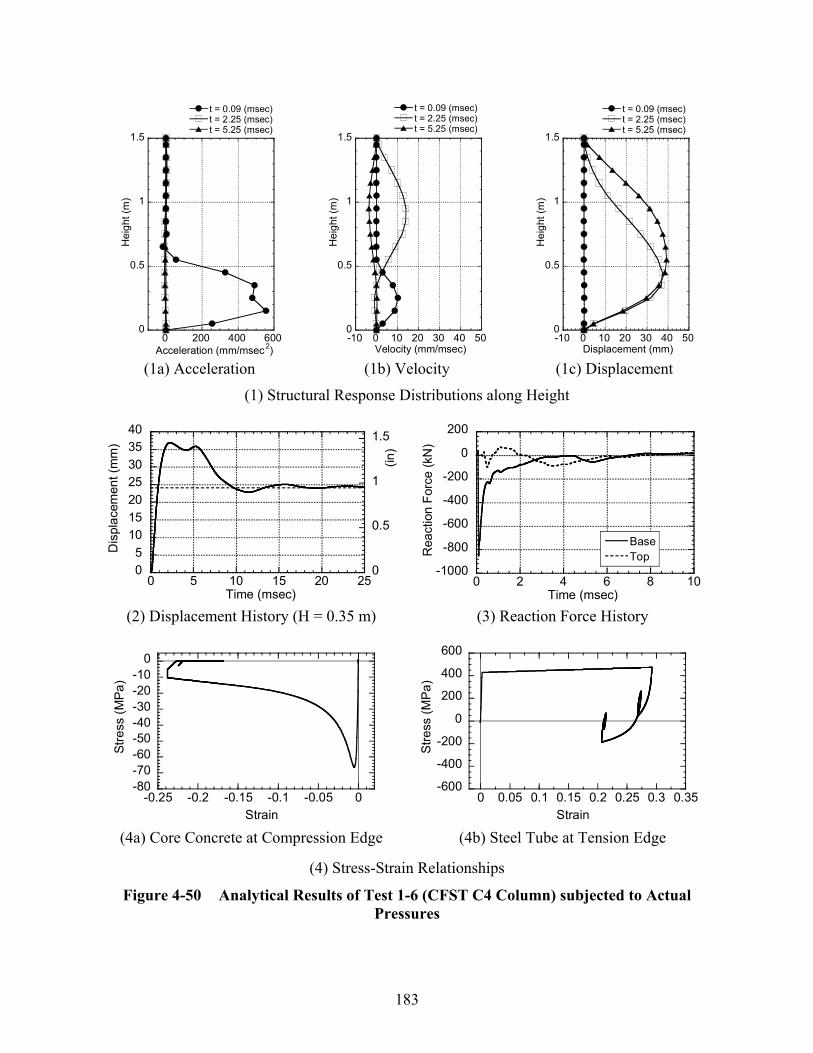
183
0
0.5
1
1.5
0 200 400 600
t = 0.09 (msec)t = 2.25 (msec)t = 5.25 (msec)
Hei
ght (
m)
Acceleration (mm/msec2) (1a) Acceleration
0
0.5
1
1.5
-10 0 10 20 30 40 50
t = 0.09 (msec)t = 2.25 (msec)t = 5.25 (msec)
Hei
ght (
m)
Velocity (mm/msec) (1b) Velocity
0
0.5
1
1.5
-10 0 10 20 30 40 50
t = 0.09 (msec)t = 2.25 (msec)t = 5.25 (msec)
Hei
ght (
m)
Displacement (mm) (1c) Displacement
(1) Structural Response Distributions along Height
05
10152025303540
0
0.5
1
1.5
0 5 10 15 20 25
Dis
plac
emen
t (m
m)
Time (msec)
(in)
(2) Displacement History (H = 0.35 m)
-1000
-800
-600
-400
-200
0
200
0 2 4 6 8 10
BaseTopR
eact
ion
Forc
e (k
N)
Time (msec) (3) Reaction Force History
-80-70-60-50-40-30-20-10
0
-0.25 -0.2 -0.15 -0.1 -0.05 0
Stre
ss (M
Pa)
Strain (4a) Core Concrete at Compression Edge
-600
-400
-200
0
200
400
600
0 0.05 0.1 0.15 0.2 0.25 0.3 0.35
Stre
ss (M
Pa)
Strain (4b) Steel Tube at Tension Edge
(4) Stress-Strain Relationships
Figure 4-50 Analytical Results of Test 1-6 (CFST C4 Column) subjected to Actual Pressures
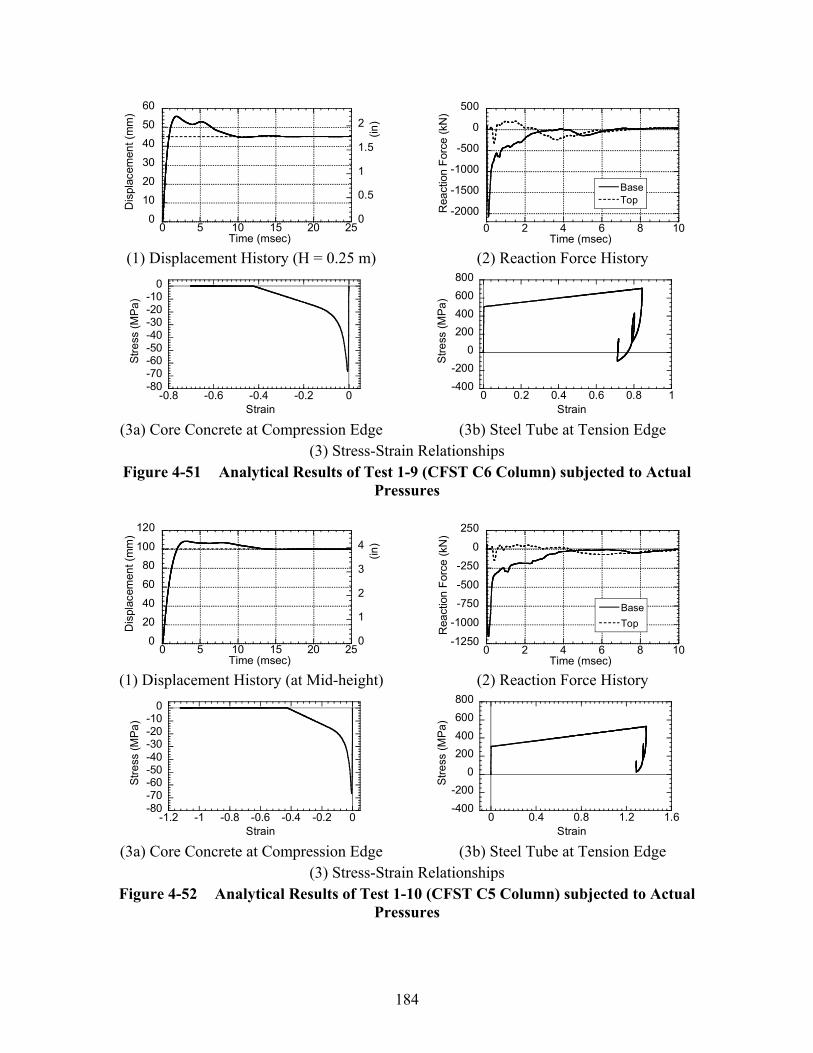
184
0
10
20
30
40
50
60
0
0.5
1
1.5
2
0 5 10 15 20 25
Dis
plac
emen
t (m
m)
Time (msec)
(in)
(1) Displacement History (H = 0.25 m)
-2000
-1500
-1000
-500
0
500
0 2 4 6 8 10
BaseTop
Rea
ctio
n Fo
rce
(kN
)
Time (msec) (2) Reaction Force History
-80-70-60-50-40-30-20-10
0
-0.8 -0.6 -0.4 -0.2 0
Stre
ss (M
Pa)
Strain (3a) Core Concrete at Compression Edge
-400-200
0200400600800
0 0.2 0.4 0.6 0.8 1
Stre
ss (M
Pa)
Strain (3b) Steel Tube at Tension Edge
(3) Stress-Strain Relationships Figure 4-51 Analytical Results of Test 1-9 (CFST C6 Column) subjected to Actual
Pressures
0
20
40
60
80
100
120
0
1
2
3
4
0 5 10 15 20 25
Dis
plac
emen
t (m
m)
Time (msec)
(in)
(1) Displacement History (at Mid-height)
-1250
-1000
-750
-500
-250
0
250
0 2 4 6 8 10
BaseTop
Rea
ctio
n Fo
rce
(kN
)
Time (msec) (2) Reaction Force History
-80-70-60-50-40-30-20-10
0
-1.2 -1 -0.8 -0.6 -0.4 -0.2 0
Stre
ss (M
Pa)
Strain (3a) Core Concrete at Compression Edge
-400-200
0200400600800
0 0.4 0.8 1.2 1.6
Stre
ss (M
Pa)
Strain (3b) Steel Tube at Tension Edge
(3) Stress-Strain Relationships Figure 4-52 Analytical Results of Test 1-10 (CFST C5 Column) subjected to Actual
Pressures

185
4.6.6.3 Structural Response of RC and Steel Jacketed RC Columns
The second series of tested columns, namely RC columns and steel jacketed RC columns,
subjected to blast loading, were analyzed using a fiber-based analytical model. Two identical
RC columns (RC1 and RC2) and two identical steel jacketed RC columns (SJ1 and SJ2) were
tested, and their test cases and test observations were summarized in Table 4-1. As presented in
Section 3.3.4, RC1 column and both SJ1 and SJ2 column failed in direct shear at their bases, and
RC2 column did not fail in direct shear, but was deemed to exhibit the onset of direct shear at the
same location. Therefore, the purpose of the fiber-based analyses was to compute the maximum
reaction forces developed at the base of the columns. Displacement history and stress-strain
relationships of concrete and steel reinforcement are also investigated for RC2 column which did
not fail in direct shear.
The shape factor β was taken as 0.561 that was obtained from the previous fiber-based
analytical results of CFST columns for the low-height explosions (Section 4.6.6.1). The
damping ratio of 5% was considered using Rayleigh damping for the first and third modes.
Figure 4-53 presents displacement history, reaction force history, and stress-strain relationship of
core concrete at compression edge and steel bar at tension edge for Test 2-2 of RC2 column.
The displacement history was computed at the height of 0.55 m where the analytically obtained
maximum flexural residual displacement of the column is observed. Figure 4-53(1) shows that
after reaching the maximum displacement of 8.5 mm, the column at this point displaces back to -
1.7 mm. This negative displacement was not observed in the analytical displacement histories of
the six CFST columns presented in Section 4.6.6.2. This is because the pressures applied to
CFST columns were much higher than these applied to this RC2 column, thus the residual
displacements were so large that the columns did not displace in negative phase. For comparison
purposes only, CFST C4 column was re-analyzed using the same blast pressure profile as that for
Test 2-2 of RC2 column. As presented in Figure 4-54, the same trend is observed in the
displacement history curve as that for Test 2-2 of RC2 column shown in Figure 4-53(1). Note
that the fact that displacement history swings back to the negative displacement range is a minor
point overall. The residual displacement nonetheless remains positive displacement. As shown
in Figure 4-53(2), the maximum reaction force at the base is -594.9 kN.

186
Figures 4-55 to 4-57 show reaction force histories at the base and top of each column up to 1.0
msec for Test 2-1, Test 2-4, and Test 2-3, respectively. The maximum reaction forces at the base
of the column observed in these figures and Figure 4-53(2) are summarized in Table 4-13 along
with those calculated from simple plastic analyses presented in Section 3.4.3. Note that because
the maximum reaction forces obtained from the simple plastic analyses are calculated using the
moment capacity of the column sections, reaction forces for a given columns remain the same
regardless of the blast charge weight and standoff distance because the flexural plastic
mechanism fully develops and limits the maximum shear in the column assumed statically
applied loads. By contrast, the maximum reaction forces at the base obtained using the fiber-
based dynamic analyses are significantly larger than those from the simple plastic analyses, and
are larger when standoff distances are closer with same charge weight. This is because the
dynamic fiber-based analysis allows considering dynamic equilibrium that accounts for the large
blast pressures and the inertia force before the plastic mechanism develops. The maximum
reaction forces of steel jacketed RC columns from the fiber-based dynamic analyses are larger
than those of RC columns by 12% and 6% for the standoff distance of 2.16X and 3.25X,
respectively. These differences are not as large as that of 77% from the simple plastic analysis
results.
Table 4-13 Summary of Maximum Reaction Forces for RC and Steel Jacketed RC Columns
Maximum Reaction Force at Base
Test Num. Col. Charge
Weight Standoff Distance
Fiber-based Analysis
Simple Plastic Analysis
kN kN
2-1 RC1 W 2.16 X
-931.7 -112.1
2-2 SJ2 -1042.0 -198.7
2-3 RC2 W 3.25 X
-594.9 -112.1
2-4 SJ1 -632.5 -198.7
187
Note that the reaction forces from the fiber-based dynamic analyses provided in Table 4-12 for
CFST columns and in Table 4-13 for RC and steel jacketed RC columns are all valuable but
cannot be compared with the direct shear strength calculated earlier. These forces are only
applied in a small amount of time, as impulses. The fact that they exceed the direct shear
capacity does not necessary mean that direct shear failure will develop because it takes a finite
amount of time for direct shear failure to initiate and propagate. Direct shear resistances that
have been used earlier could be compared with the forces obtained from the statically applied
load. Dynamic shear force likely exceeds the value calculated per Equation 3-36. This remains
to be determined from future research, and as such the reaction forces obtained from the dynamic
fiber-based analysis models cannot be compared with direct shear resistance at this time.
4.7 Summary of Dynamic Analysis under Blast Loading In this project, three different analytical methods have been adopted to replicate the behavior of
bridge tested columns subjected to blast loading, namely simplified analysis, SDOF dynamic
analysis, and fiber-based dynamic analysis. In this section, the later two analysis methods were
investigated in depth and the results obtained compared together as well as against those
obtained from the simplified analysis method. The important objective of these series of
analyses was to determine the shape factor β to account for the reduction of the blast pressures
applied to the column. This shape factor is principally intended to account for the reduction of
the blast pressures due to the circular shape of the column; however, in fact this factor β
unavoidably is affected by some of assumptions built in the analytical model and method applied.
Therefore, it is important to use the value of β that corresponds to the assumptions and
conditions used for each analytical method. These are summarized in Table 4-14 along with the
resulting β values for each analytical method.

188
Table 4-14 Summary of β Values and Assumptions of Each Analytical Method
Assumptions and Conditions
Simplified Analysis
SDOF Dynamic Analysis
Fiber-based Dynamic Analysis
β V
alue
Mid-height 0.459 0.542 0.665
Low-height 0.441 0.525 0.561
All Ave. 0.450 0.534 0.613
Mod
elin
g C
onsi
dera
tions
Column Shape Circular Shape
Dynamic Increase Factor
Concrete Strength: 1.25 Steel Yield Stress: 1.20
Strain Hardening of Steel Not Considered Considered
Discretization SDOF Model 2D Fiber-based Model
Load-mass Factor LMeK = 0.66 LMpK =0.66
LMeK = 0.775 LMpK =0.66 No Need
Damping Neglected 5% Viscous Damping
5% Rayleigh Damping
Bla
st L
oadi
ng
Con
side
ratio
ns Physical Quantity Energy Pressure
Applied Loading Equivalent Impulse
Uniform Equivalent
Pressure History
Actual Pressure Profile History
Clearing Effect Not Considered
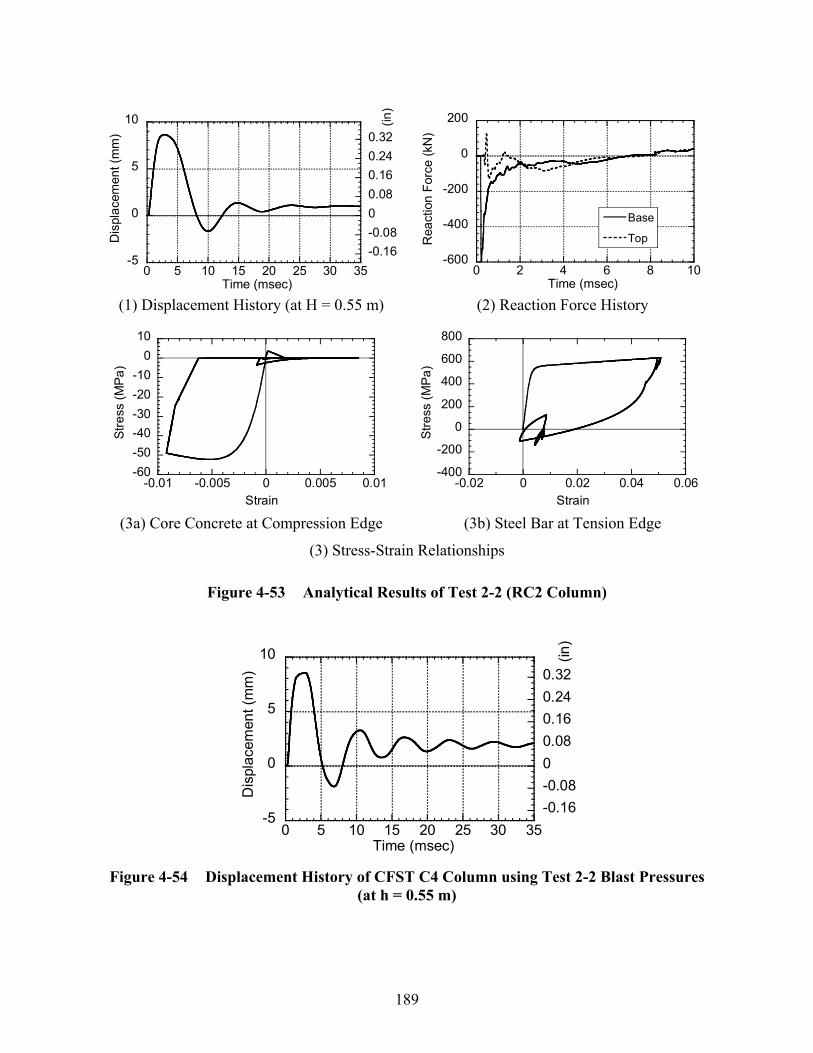
189
-5
0
5
10
-0.16-0.0800.080.160.240.32
0 5 10 15 20 25 30 35
Dis
plac
emen
t (m
m)
Time (msec)
(in)
(1) Displacement History (at H = 0.55 m)
-600
-400
-200
0
200
0 2 4 6 8 10
Base
TopRea
ctio
n Fo
rce
(kN
)
Time (msec) (2) Reaction Force History
-60-50-40-30-20-10
010
-0.01 -0.005 0 0.005 0.01
Stre
ss (M
Pa)
Strain (3a) Core Concrete at Compression Edge
-400
-200
0
200
400
600
800
-0.02 0 0.02 0.04 0.06
Stre
ss (M
Pa)
Strain (3b) Steel Bar at Tension Edge
(3) Stress-Strain Relationships
Figure 4-53 Analytical Results of Test 2-2 (RC2 Column)
-5
0
5
10
-0.16-0.0800.080.160.240.32
0 5 10 15 20 25 30 35
Dis
plac
emen
t (m
m)
Time (msec)
(in)
Figure 4-54 Displacement History of CFST C4 Column using Test 2-2 Blast Pressures
(at h = 0.55 m)

190
-1000
-800
-600
-400
-200
0
200
0 0.2 0.4 0.6 0.8 1
BaseTopR
eact
ion
Forc
e (k
N)
Time (msec)
Figure 4-55 Reaction Force History of Test 2-1 (RC1 Column at h = 0.55 m)
-800
-600
-400
-200
0
200
0 0.2 0.4 0.6 0.8 1
Base
TopRea
ctio
n Fo
rce
(kN
)
Time (msec)
Figure 4-56 Reaction Force History of Test 2-4 (SJ1 Column at h = 0.55 m)
-1200-1000-800-600-400-200
0200
0 0.2 0.4 0.6 0.8 1
Base
TopRea
ctio
n Fo
rce
(kN
)
Time (msec)
Figure 4-57 Reaction Force History of Test 2-3 (SJ2 Column at h = 0.55 m)

191
SECTION 5 SUMMARY, CONCLUSIONS, AND RECOMMENDATIONS FOR
FURTHER RESEARCH
5.1 Summary In this research, the blast resistance of two commonly used seismically designed bridge pier
systems with ductile reinforced concrete (RC) columns and non-ductile RC column retrofitted
with steel jackets has been investigated experimentally and analytically to complement the first
series of CFST columns testing under blast loading by Fujikura et al. (2007, 2008). A fiber-
based finite element model was developed and the overall behavior of the tested specimens was
investigated using this developed fiber-based finite element model.
The seismic designs of prototype bridge pier with these two types of commonly used columns
were conducted using response spectrum analysis with the same response spectrum as the CFST
columns. Detailing was accomplished in accordance with the recent seismic design code
requirements to achieve concrete confinement and column ductility.
Blast testing was conducted at the U.S. Army Corps of Engineers Research Facility for a one-
forth scale multi-column bent specimen having two RC columns and two steel jacketed RC
columns. The one-forth scale specimen was designed based on the seismically designed
prototype bridge columns and using geometric similitude. The test blast parameters were
determined using the simplified analysis method using the calibrated value of β obtained from
earlier test results on CFST columns. The tested RC columns and steel jacketed RC columns did
not exhibit ductile behavior under blast loading, and failed in direct shear at the base.
Simple plastic analyses were conducted to calculate the reaction shear forces at the base of the
RC columns and steel jacketed RC columns. The resulting reaction shear forces at the base of
these columns were not found to be larger than the direct shear strengths calculated using
conventional equations, but these reaction shear forces were found to exceed the direct shear

192
strength obtained using a moment-direct shear interaction model that was developed and
proposed here to calculate the direct shear strength on cross-sections simultaneously subjected to
large moments – which confirmed the experimentally observed behavior.
SDOF dynamic analyses considering an equivalent SDOF system were performed for the CFST
column tests using an equivalent pressure history. The sensitivity of the load-mass factor
required in an equivalent SDOF system, as well as the effect of damping on structural response,
was investigated. The shape factor β was reevaluated for SDOF dynamic analysis, and it was
found that the resulting factor appropriate to be used in conjunction with this particular analysis
method was equal to 0.534 is used in conjunction with a value of 5% viscous damping and two
different load-mass factors corresponding to the elastic and inelastic stages of structural response.
Fiber-based analytical models were developed for the CFST column, RC column and steel
jacketed column and verified using the quasi-static cyclic loading tests done by various
researchers. Then, using these fiber-based analytical models, response history analyses subjected
to actual blast pressure profile were conducted for the tested CFST columns to investigate their
behavior and to calibrate the shape factor β corresponding to this particular analytical method.
The resulting β values were 0.665 for mid-height explosions and 0.561 for low-height
explosions using 5% Rayleigh damping. Using these calibrated β values, dynamic analyses
were also conducted for the RC columns and steel jacketed columns using the fiber-based
structural models.
5.2 Conclusions Two seismically designed conventional bridge pier systems with ductile RC columns and with
non-ductile steel jacketed RC columns have been investigated experimentally and analytically
when subjected to blast loading. A multi-hazard bridge pier system with CFST columns
conducted in the first series of the tests has also been investigated analytically. The key
conclusions from this research are as follows:
1. The standard ductile RC and non-ductile RC columns retrofitted with steel jackets were
not found to exhibit a ductile behavior under blast loading, and failed in shear at their

193
base. The steel jacketed columns, although visually resembling the CFST columns, are
significantly different in construction due to the presence of gaps between the ends of the
steel jacket and the footing and pier cap, purposely intended to prevent composite actions
at the ends of the column. These gaps also produced a discontinuity of shear resistance at
these locations, which resulted in the observed direct shear failure. However, steel
jacketing was effective to prevent direct spalling of concrete.
2. This study has allowed establishing the different values of β that account for the
reduction in blast pressures applied to the circular column, as appropriate for the different
analytical methods considered. The assumptions and conditions that affect the values of
β have been presented in Table 4-14.
3. A moment-direct shear interaction model to calculate the direct shear resistance of RC
sections was proposed to account for the reduction of direct shear resistance on cross-
sections simultaneously subjected to large moments. This model explained the direct
shear failure observed in the RC and steel jacketed RC columns when compared with the
reaction force calculated using simple plastic analysis.
4. It was found that the structural response obtained using SDOF dynamic analysis is
sensitive to the load-mass factors needed to model structural components as an equivalent
SDOF system. Appropriate load-mass factors should be used corresponding to the elastic
and inelastic ranges of structural response during time history analysis.
5. Analyses using fiber-based models showed that high frequency modes of vibration have
some influence on the structural response when subjected to blast loading. It was also
found that using Rayleigh damping with the fiber-based model can significantly reduce
the structural response under blast loading due to the high frequency mode effects.
5.3 Recommendations for Further Research The following recommendations for further research are provided based on the observations and
results from this research to further develop the multi-hazard resistant highway bridge pier:

194
1. The mechanism of dynamic direct shear resistance of RC sections and CFST sections
under impulsive loading should be investigated. Models to assess the dynamic direct
shear strength of these sections need to be developed to compare with the shear force
predicted by the analyses using fiber-based models under blast loading.
2. The influence of axial force on the behavior of columns under blast loading should be
investigated. The blast tests on columns presented here were done without the axial force
typically applied in actual bridge columns. This effect was investigated analytically
using P-delta analysis for the CFST column cases (Fujikura et al. 2007, 2008), but it
needs to be validated experimentally. In the RC and steel jacketed RC columns, the
existence of axial force in the column could increase the direct shear strength at the base.
3. The uniaxial constitutive models for confined and unconfined concrete, and steel when
subjected to impulsive loading should be investigated to model the uniaxial material
behavior in analyses using fiber-element models. In this research, the uniaxial
constitutive models under the quasi-static loading were adopted by simply multiplying
strength by the dynamic increase factors.
4. Detailed 3-D finite element models could be developed for the tested columns to further
investigate their behavior, such as for the development of the direct shear failure at the
base of the columns.
5. Future research should investigate means and methods to prevent direct shear failure at
the base of reinforced concrete columns and steel jacketed reinforced concrete columns.
One such strategy might be to introduce circular shear collars at the base of the columns
that would transfer shear forces to the foundation by bearing directly on the columns..
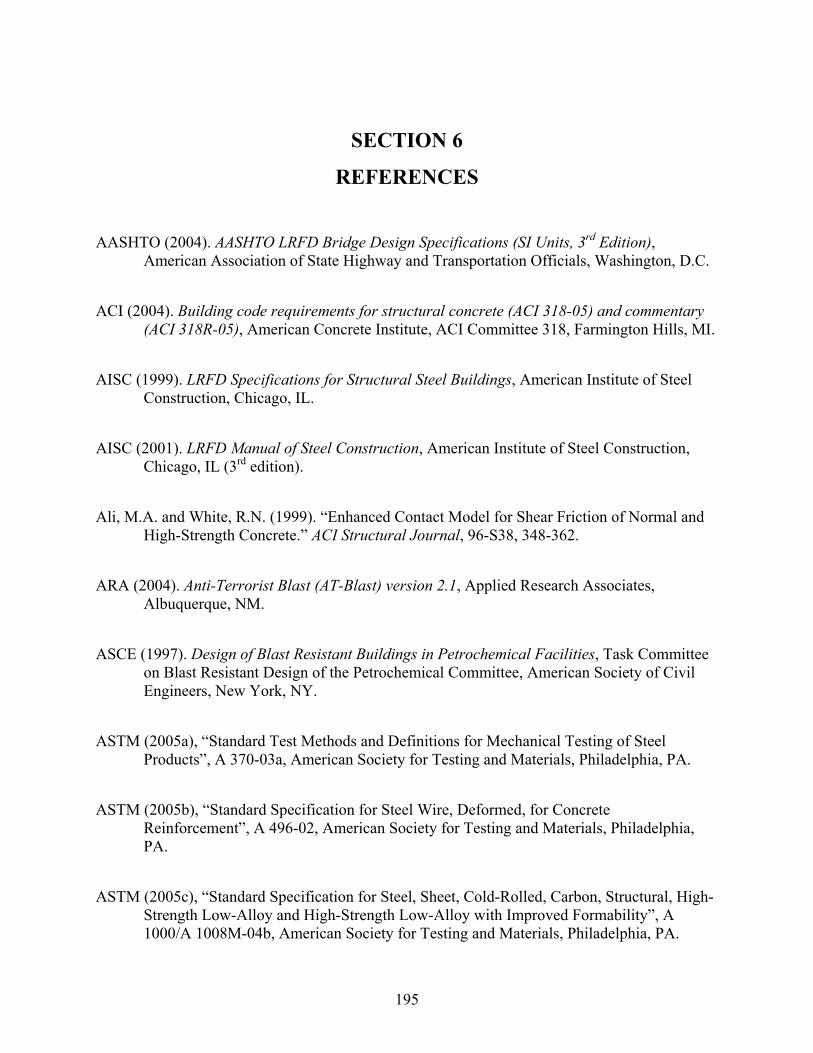
195
SECTION 6
REFERENCES
AASHTO (2004). AASHTO LRFD Bridge Design Specifications (SI Units, 3rd Edition), American Association of State Highway and Transportation Officials, Washington, D.C.
ACI (2004). Building code requirements for structural concrete (ACI 318-05) and commentary (ACI 318R-05), American Concrete Institute, ACI Committee 318, Farmington Hills, MI.
AISC (1999). LRFD Specifications for Structural Steel Buildings, American Institute of Steel Construction, Chicago, IL.
AISC (2001). LRFD Manual of Steel Construction, American Institute of Steel Construction, Chicago, IL (3rd edition).
Ali, M.A. and White, R.N. (1999). “Enhanced Contact Model for Shear Friction of Normal and High-Strength Concrete.” ACI Structural Journal, 96-S38, 348-362.
ARA (2004). Anti-Terrorist Blast (AT-Blast) version 2.1, Applied Research Associates, Albuquerque, NM.
ASCE (1997). Design of Blast Resistant Buildings in Petrochemical Facilities, Task Committee on Blast Resistant Design of the Petrochemical Committee, American Society of Civil Engineers, New York, NY.
ASTM (2005a), “Standard Test Methods and Definitions for Mechanical Testing of Steel Products”, A 370-03a, American Society for Testing and Materials, Philadelphia, PA.
ASTM (2005b), “Standard Specification for Steel Wire, Deformed, for Concrete Reinforcement”, A 496-02, American Society for Testing and Materials, Philadelphia, PA.
ASTM (2005c), “Standard Specification for Steel, Sheet, Cold-Rolled, Carbon, Structural, High-Strength Low-Alloy and High-Strength Low-Alloy with Improved Formability”, A 1000/A 1008M-04b, American Society for Testing and Materials, Philadelphia, PA.
196
BEL. (2004). Bridge Explosive Loading (BEL) version 1.1.0.3. US Army Corps of Engineers’ Engineer Research and Development Center, Vicksburg, MS. (distribution limited to U.S. Government agencies and their contractors).
Belarbi, A. and Hsu, T.T.C. (1994). “Constitutive Laws of Concrete in Tension and Reinforcing Bars Stiffened by Concrete.” ACI Structural Journal, 91-S46, 465-474.
Biggs, J. (1964), Introduction to Structural Dynamics, McGraw Hill, New York
Bruneau, M., Uang, C.M. and Whittaker, A. (1998). Ductile Design of Steel Structures, McGraw-Hill.
Bruneau, M. and Marson, J. (2004). “Seismic design of concrete-filled circular steel bridge piers”, Journal of Bridge Engineering, 9(1), 24-34.
Buckle, I.G., Friedland, I, Mander, J., Martin, G., Nutt, R. and Power, M. (2006). “Seismic Retrofitting Manual for Highway Structures: Part 1 – Bridges”, MCEER-06-SP10, MCEER.
CALTRANS. (1996). Earthquake Retrofit Guidelines for Bridges, Memo to Designers 20-4, California Department of Transportation, Sacramento, CA.
CALTRANS. (2003). Bridge Design Specifications, September, Sacramento, CA.
CALTRANS. (2006). Seismic Design Criteria, Version 1.4, Sacramento, CA.
Chai, Y.H., Priestley, M.J.N. and Seible, F. (1991). “Seismic Retrofit of Circular Bridge Columns for Enhanced Flexural Performance.” ACI Structural Journal, V.88, No.5 Sep.-Oct., 572-583.
Chang, G.A. and Mander, J.B. (1994). Seismic Energy Based Fatigue Damage Analysis of Bridge Columns: Part I – Evaluation of Seismic Capacity, Technical Report NCEER-94-0006, NCEER, State University of New York at Buffalo, Buffalo, NY.
Charlson, N.N. and Miller, K. (1998). “Design and Application of A Gradient-Weighted Moving Finite Element Code I: In One Dimension.” SIAM Journal of Scientific Computing, vol. 19, No.3, pp.728-765, Society for Industrial and Applied Mathematics.

197
Chopra, A.K. (2000). Dynamics of Structures, 2nd Edition, Prentice Hall, NJ.
Chung, H.W. (1978). “Shear Strength of Concrete Joints under Dynamic Loads.” Journal of the Concrete Society, 12(3), 27-29.
Conrath, E.J., Krauthammer, T., Marchand, K.A. and Mlakar, P.F. (1999). Structural Design for Physical Security: State of the Practice, ASCE, Reston, Va.
Cook, R.D., Malkus, D.S., Plesha, M.E. and Witt, R.J. (2002). Concepts and Applications of Finite Element Analysis, 4th Edition, John Wiley & Sons, NJ.
Dicleli M, Bruneau M (1996). “Quantitative approach to rapid seismic evaluation of slab-on-girder steel highway bridges.” Journal of Structural Engineering, 122(10), 1160-1168.
Dutta, A. and Mander, J.B. (1998). “Capacity Design and Fatigue Analysis of Confined Concrete Columns”, Technical Report MCEER-98-0007, Multidisciplinary Center for Earthquake Engineering Research, State University of New York at Buffalo, Buffalo, NY.
Eurocode 4. (1994). “Design of composite steel and concrete structures.” Commission of the European Communities, Brussels.
FBI. (2007). “Terrorism 2002-2005.” Federal Bureau of Investigation, U.S. Department of Justice.
FHWA. (2003). Recommendations for bridge and tunnel security. Prepared by the Blue Ribbon Panel on Bridge and Tunnel Security, Federal Highway Administration, Washington, D.C.
Filippou, F.C, Popov, E.P. and Bertero, V.V. (1983). Effects of bond deterioration on hysteretic behavior of reinforced concrete joints. EERC Report No. UCB/EERC-83/19. Earthquake Engineering Research Center. University of California, Berkley. California.
Fujikura, S., Bruneau, M., Lopez-Garcia, D. (2007). “Experimental Investigation of Blast Performance of Seismically Resistant Concrete-Filled Steel Tube Bridge Piers”, Technical Report MCEER-07-0005, MCEER, University at Buffalo, Buffalo, NY.

198
Fujikura, S., Bruneau, M. and Lopez-Garcia, D. (2008) “Experimental Investigation of Multihazard Resistant Bridge Piers having Concrete-Filled Steel Tube under Blast Loading”, Journal of Bridge Engineering, 13(6), 586-594.
Ghee, A.B., Priestley, M.J.N. and Paulay, T. (1989). “Seismic Shear Strength of Circular Reinforced Concrete.” ACI Structural Journal, Vol.86, No.1, Jan.-Feb., 45-59.
Hansen, R.J., Nawy, E.G. and Shah, J.M., (1961). “Response of Concrete Shear Keys to Dynamic Loading.” Journal of The ACI, 57(65), 1475-1490.
Hofbeck, J.A., Ibrahim, A.H and Mattock, A.H. (1969). “Shear Transfer in Reinforced Concrete.” ACI Journal, 66(2), 119-128.
Jenkins, B.M. (1997). Protecting Public Surface Transportation Systems and Patrons from Terrorism Activities. MTI Report 97-04, Mineta Transportation Institute, San Jose, CA
Jenkins, B.M. (2001a). Protecting Public Surface Transportation Systems and Patrons from Terrorism Activities. MTI Report 97-04, Mineta Transportation Institute, San Jose, CA
Jenkins, B.M. (2001b). “Protecting Public Surface Transportation Against Terrorism and Serious Crime: Continuing Research on Best Security Practices.” MTI Report 01-07, Mineta Transportation Institute, San Jose, CA
Kim, J-H. and Mander, J.B. (1999). Truss Modeling of Reinforced Concrete Shear-Flexure Behavior, Technical Report MCEER-99-0005, Multidisciplinary Center for Earthquake Engineering Research, State University of New York at Buffalo, Buffalo, NY.
Mander, J.B., Priestley, M.J.N. and R. Park (1988). “Theoretical Stress-Strain Model for Confined Concrete Columns.” Journal of Structural Engineering, ASCE, Vol. 114, No. 8, 1804-1826.
MacGregor, J.G. and Wight, J.K. (2005). Reinforced Concrete Mechanics and Design Fourth Edition, Prentice, NJ.
Marson, J. and Bruneau, M. (2004). “Cyclic testing of concrete-filled circular steel bridge piers having encased fixed-based detail.” Journal of Bridge Engineering, ASCE, 9(1), 14-23.

199
Matsukawa, R, A. Kawashima, K., Sakai, J. and Shoji, G. (2002). “Effect of Lateral Confinement by Spirals on Seicmic Performance of Circular Reinforced Concrete Bridge Piers.” Journal of Structural Engineering, Vol. 48A, pp. 715-723, Japan Society of Civil Engineers. (in Japanese)
Mattock, A.H. and Hawkins, N.M. (1972). “Shear Transfer in Reinforced Concrete-Recent Research.” PCI Journal, 17(2), 55-75.
Mays, G.C. and Smith, P.D. (1995): Blast effects on buildings. Telford, London, UK.
MCEER/ATC-49. (2003a). Recommended LRFD Guidelines for the Seismic Design of Highway Bridges, Part I: Specifications and II: Commentary and Appendices, ATC and MCEER.
MCEER/ATC-49. (2003b). Design Examples, Recommended LRFD Guidelines for the Seismic Design of Highway Bridges, ATC and MCEER.
Menegotto, M. and Pinto, E. (1973). “Method of analysis for cyclically loaded reinforced concrete plane frames including changes in geometry and non-elastic behavior of elements under combined normal force and bending.” Proceedings of IABSE Symposium. Lisbon, Portugal.
Multi-Hazard Symposium. (2007). Symposium on Emerging Developments in Multi-Hazard Engineering, Architectural Engineering Institute and MCEER, McGraw Hill Conference Center, New York City, September 18, 2007. <http://mceer.buffalo.edu/meetings/aei/default.asp> (January 18, 2008).
NIE. (2007). “The Terrorist Threat to the US Homeland”, National Intelligence Estimate, National Intelligence Council.
NONLIN version 6.01. (1996). Advanced Structural Concepts, Golden, Colo.
OpenSees. (2007). Open System for Earthquake Engineering Simulation ver 1.7.5, Pacific Earthquake Engineering Research Center, University of California, Berkeley, CA.
Orakcal, K. and Wallace, J.W. (2006a). “Flexural Modeling of Reinforced Concrete Walls-Experimental Verification.” ACI Structural Journal, 103-S21, 196-206.

200
Orakcal, K., Massone, L.M. and Wallace, J.W. (2006b). Analytical Modeling of Reinforced Concrete Walls for Predicting Flexural and Coupled-Shear-Flexural Responses. PEER Report 2006/07. Pacific Earthquake Engineering Research Center. University of California, Berkley. California.
PEER (2008). “PEER Structural Performance Database.” Pacific Earthquake Engineering Research Center, <http://nisee.berkeley.edu/spd/> (May 1, 2008).
Priestley, M.J.N., Seible, F., Xiao, Y. and Verma, R. (1994a). “Steel Jacket Retrofitting of Reinforced Concrete Bridge Columns for Enhanced Shear Strength – Part 1: Theoretical Considerations and Test Design.” ACI Structural Journal, V.91, No.4 Jul.-Aug., 394-405.
Priestley, M.J.N., Seible, F., Xiao, Y. and Verma, R. (1994b). “Steel Jacket Retrofitting of Reinforced Concrete Bridge Columns for Enhanced Shear Strength – Part 2: Test Results and Comparison with Theory.” ACI Structural Journal, V.91, No.5 Sep.-Oct., 537-551.
Priestley, M.J.N., Seible, F. and Calvi, G.M. (1996). Seismic Design and Retrofit of Bridges, Wiley, New York, NY.
Ross, T.J. (1983). Direct Shear Failure in Reinforced Concrete Beams under Impulsive Loading, Technical Report AFWL-TR-83-84, Air Force Weapons Laboratory, Kirtland Air Force Base, NM.
Scott, B.D., Park, R. and Priestley, M.J.N. (1982). “Stress-strain Behavior of Concrete Confined by Overlapping Hoops at Low and High Strain Rate.” Journal of ACI, 79(1), 13-27.
Spacone, E., Filippou, F.C. and Taucer, F.F.(1996a). “Fiber Beam-Column Model for Non-Linear Analysis of R/C Frames: Part I. Formulation.” Earthquake Engineering and Structural Dynamics, Vol. 25, 711-725.
Spacone, E., Filippou, F.C. and Taucer, F.F.(1996b). “Fiber Beam-Column Model for Non-Linear Analysis of R/C Frames: Part II. Applications.” Earthquake Engineering and Structural Dynamics, Vol. 25, 711-725.
Tokyo Tech (2008). “Kawashima Lab Test Database.” Kawashima Earthquake Engineering Laboratory, Tokyo Institute of Technology, <http://seismic.cv.titech.ac.jp/en/titdata/> (May 1, 2008).

201
UFC. (2002). Design and Analysis of Hardened Structures to Conventional Weapons Effects. Unified Facilities Criteria UFC 3-340-01, Department of Defense, USA. (distribution limited to U.S. Government agencies and their contractors)
UFC. (2004). Basic Guidelines for Chemical Hardening of New Military Facilities. Unified Facilities Criteria UFC 3-340-13, Department of Defense, USA.
USACE-OD. (2002). SPAn32 version 1.2.7.2. U.S. Army Corps of Engineers Omaha District, Omaha, Neb. (distribution limited to U.S. Government agencies and their contractors).
USACE-PDC. (2006). User’s Guide for the Single-Degree-of-Freedom Blast Effects Design Spreadsheets (SBEDS), U.S. Army Corps of Engineers Protective Design Center, Omaha, Neb.
USACE-PDC. (2007). Single-Degree-of-Freedom Blast Effects Design Spreadsheets (SBEDS) version 3.1, U.S. Army Corps of Engineers Protective Design Center, Omaha, Neb.
USDA. (1990). Structures to Resist the Effects of Accidental Explosions. Technical Manual TM 5-1300, US Department of the Army, Washington, DC.
Waugh J. (2007). Personal correspondence with writer. Department of Civil, Construction and Environmental Engineering, Iowa State University.
Williamson, E.B. and Winget, D.G. (2005). “Risk management and design of critical bridges for terrorist attacks.” Journal of Bridge Engineering, 10(1), 96-106.
Winget DG, Marchand KA and Williamson EB (2005). “Analysis and design of critical bridges subjected to blast loads.” Journal of Structural Engineering, 131(8), 1243-1255.
XTRACT (2007). XTRACT Educational Version ver. 3.0.8, TRC/Imbsen Software Systems, Rancho Cordova, CA.
Yassin, M.H.M. (1994). Nonlinear Analysis of Prestressed Concrete Structures under Monotonic and Cyclic Loads. Dissertation. University of California, Berkeley. California.
Zhao, J and Sritharan, S. (2007). “Modeling of Strain Penetration Effects in Fiber-Based Analysis of Reinforced Concrete Structures.” ACI Structural Journal, 104-S14, 133-141.


APPENDIX A SECTION AND MATERIAL MODELS OF PROTOTYPE
COLUMN FROM XTRACT
Axial force - moment interaction curve was calculated using XTRACT (2007) for the design of
the prototype bridge bent column. This appendix provides the details of section and material
models. The stress-strain relationships for confined and unconfined concrete and steel bars are
presented.
203

204
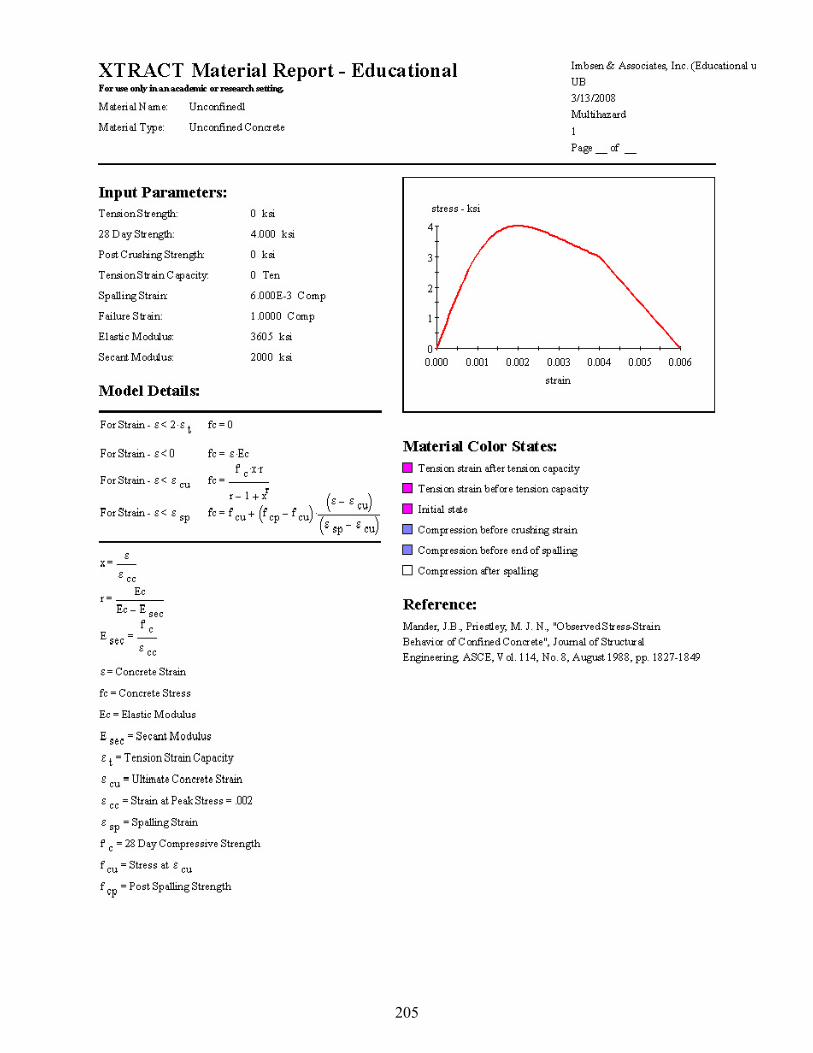
205

206

207


APPENDIX B SEISMIC ANALYSIS AND DESIGN OF PROTOTYPE BRIDGE
BENT COLUMN
This appendix provides details on the analysis and design of prototype bridge bent columns.
Response spectrum analysis was executed for the prototype bridge. The pier bent was designed
according to the recent design code. A column diameter of 813 mm (32 in) is selected and the
column was reinforced with 16 – D19 (#6) longitudinal bars. Calculated expected ductility
demands in the longitudinal and transverse direction were 2.22 and 3.39, respectively.
Transverse spiral reinforcement was provided with D16 (#5) at spacing of 114 mm (4.5 in) in
plastic hinge region and D13 (#4) at spacing of 152 mm (6 in) outside of plastic hinge region.
209

Appendix B
--- RC Column of Prototype Bridge Design ---
D = 32 in, L. Bar = 16 #6, T. Bar = #[email protected] in f'c = 4 ksi
DESIGN STEP 1 _ Design Earthquake Response Spectra
0.0000.1000.2000.3000.4000.5000.6000.7000.8000.9001.000
0 0.2 0.4 0.6 0.8 1 1.2 1.4 1.6 1.8 2 2.2 2.4Period T (sec)
Pseu
do-a
ccel
erat
ion
SA (g
)
Fa 1.0:= Ss 0.75:=
Fv 1.0:= S1 0.30:=
DESIGN STEP 2 _ Section Properties From XTRACT
-5000
0
5000
10000
15000
20000
0.0 500.0 1000.0 1500.0 2000.0
Moment (kNm)
Axi
al F
orce
(kN
)
D = 32 inches, Logitudinal bar 16#6
210

Appendix B
Pcol_dltop 1519 kN=Pcol_dltopPpier
n
Pcap_bm
n+:=
Number of columns per pier
Total dead load at top of column, Pcol_dltop:
Pcol_dl 1594 kN=Pcol_dlPpier
n
Pcap_bm
n+ Pcol+:=
Number of columns per piern 3:=
Total dead load at bottom of column, Pcol_dl:
Pcap_bm 468 kN=Pcap_bm 42 in⋅( ) 48 in⋅( )⋅ 15 m⋅( )⋅ 24
kN
m3⋅:=
Weight of cap beam, Pcap_bm:
Pcol 74.7 kN=Pcolπ
4Dcol
2⋅ 24⋅
kN
m3⋅ Hclr⋅:=
Hclr 6 m⋅:=
Dcol 813 mm=Dcol 32 in⋅:=
Dead load of column, Pcol:
Ppier 4090 kN⋅:=
Vertical load, Ppier:
Wsuper 11089kN=
Wsuper wsuper L⋅:=
wsuper 123.21kN
m:=
Length of bridgeL 90m:=
Total superstructure weight, Wsuper:
Effective Weights
Design Step 3.1 _ Longitudinal Direction
DESIGN STEP 3 _ Determine Elastic Seismic Forces and Displacements
211

Appendix B
Ec 24856 MPa=
Icrπ
64
Dcol4
2⋅:= Cracked section taken as one-half gross section.
ΔyMn H2
⋅
3 Ec⋅ Icr⋅:= Δy 60 mm= Δy 0.20 ft=
Effective Period
Hclr 6.00 m=
Keff 2 n⋅3 Ec⋅ Icr⋅
H3:= Keff 13973
kN
m=
Teff 2πWsuper
Keff g⋅:= Teff 1.79 s=
Required Lateral Strength
Required lateral strength of column, Vup:
VupMn
H:= Vup 140 kN=
ΣVup 2 n⋅ Vup⋅:= ΣVup 838 kN=
Yield Displacement
P Pcol_dltop:= P 1519 kN=
Mx1 978.2 kN⋅ m⋅:= Px1 1522.6kN:=
Mx2 944.1 kN⋅ m⋅:= Px2 1367.3kN:=
---> MP Px2−
Px1 Px2−Mx1 Mx2−( )⋅ Mx2+:= M 977 kN m⋅= Mn M:= From P-M Curve
Mn 977 mkN= Nominal moment at top of column
H 7.0 m⋅:= Height to bearing from foundation
f'c 4000 psi⋅:=
Ec 57000 psi0.5⋅ f'c⋅:= Ec 3605 ksi=
212

Appendix B
Plastic Rotationθp 1.9%=θp 0.019=θpΔmax
H:=
μ 2.22=μΔmaxΔy
:=
Δmax 133 mm=ΔmaxVEQ
Keff:=
VEQ 1861 kN=VEQ Sa Wsuper⋅:=
Sa 0.168=SaFv S1⋅
Teffsec⋅:=
Maximum Deformation
Cs 0.08=CsΣVup
Wsuper:=
Seismic coefficient, Cs
213

Appendix B
Vup2 Vup:= Vup3 Vup:=
Mn1 Mn:= Mn2 Mn:= Mn3 Mn:=
Hcg_bot 7.0 m⋅:= Height from cg of superstructure to bottom of column
Hcg_top 1.0 m⋅:= Height from cg of superstructure to top of column
ΔP_botVup1 Vup2+ Vup3+( ) Hcg_bot⋅ Mn1 Mn2+ Mn3+( )−
12 m⋅:=
ΔP_bot 326 kN= Increment on outer columns
P1 Pcol_dl ΔP_bot+:= P1 1920 kN= Outer column
P2 Pcol_dl:= P2 1594 kN= Inner column
Design Step 3.2 _ Transverse Direction
Effective Weights
Same as longitudinal direction.
Yield Displacement
Mn 977 kN m⋅=
Δy2 Mn⋅ Hclr
2⋅
12 Ec⋅ Icr⋅:= Δy 22 mm=
Effective Period
Hclr 6.00 m=
Keff 2 n⋅6 Ec⋅ Icr⋅
Hclr3
:= Keff 44376kN
m=
Teff 2πWsuper
Keff g⋅:= Teff 1.00 s=
Required Lateral Strength
First iteration:
Vup2 Mn⋅
Hclr:= Vup 326 kN=
Vup1 Vup:=
214

Appendix B
Mn2 M:= From P-M Curve
P P3:= P 1268 kN=
Mx1 944.1 kN⋅ m⋅:= Px1 1367.3kN:=
Mx2 912.8 kN⋅ m⋅:= Px2 1228.5kN:=
---> MP Px2−
Px1 Px2−Mx1 Mx2−( )⋅ Mx2+:= M 922 kN m⋅= Mn3 M:= From P-M Curve
Mn1 1061 kN m⋅= Vup12Mn1
Hclr:=
Mn2 993 kN m⋅= Vup22Mn2
Hclr:=
Mn3 922 kN m⋅= Vup32Mn3
Hclr:=
ΔP_botVup1 Vup2+ Vup3+( ) Hcg_bot⋅ Mn1 Mn2+ Mn3+( )−
12 m⋅:=
ΔP_bot 331 kN= Increment on outer columns at bottom
P3 Pcol_dl ΔP_bot−:= P3 1268 kN= Outer column
Second iteration:
From the column interaction diagram:
P P1:= P 1920 kN=
Mx1 1061.3 kN⋅ m⋅:= Px1 1922.9kN:=
Mx2 1017.5 kN⋅ m⋅:= Px2 1707.6kN:=
---> MP Px2−
Px1 Px2−Mx1 Mx2−( )⋅ Mx2+:= M 1061 kN m⋅= Mn1 M:= From P-M Curve
P P2:= P 1594 kN=
Mx1 1017.5 kN⋅ m⋅:= Px1 1707.6kN:=
Mx2 978.2 kN⋅ m⋅:= Px2 1522.6kN:=
---> MP Px2−
Px1 Px2−Mx1 Mx2−( )⋅ Mx2+:= M 993 kN m⋅=
215

Appendix B
Plastic Rotationθp 1.1 %=θp 0.011=θpΔmax
H:=
μ 3.39=μΔmaxΔy
:=
Δmax 75 mm=ΔmaxVEQ
Keff:=
VEQ 3317 kN=VEQ Sa Wsuper⋅:=
Sa 0.299=SaFv S1⋅
Teffsec⋅:=
Maximum Deformation
Cs 0.18=Cs2 Vbent⋅
Wsuper:=
Seismic coefficient, Cs
Increment on outer columns at topΔP_top 165 kN=
ΔP_topVup1 Vup2+ Vup3+( )− Hcg_top⋅ Mn1 Mn2+ Mn3+( )+
12 m⋅:=
ConvergeVbent
3 Vup⋅1.01=
Vbent 992 kN=Vbent Vup1 Vup2+ Vup3+:=
216

Appendix B
Inside potential plastic hinge zones:
Pcol_top Pcol_dltop ΔP_top+:=
P Pcol_top:= P 1685 kN=
Mx1 1017.5 kN⋅ m⋅:= Px1 1707.6kN:=
Mx2 978.2 kN⋅ m⋅:= Px2 1522.6kN:=
---> MP Px2−
Px1 Px2−Mx1 Mx2−( )⋅ Mx2+:= M 1013 kN m⋅= Mp_top M:= From P-M Curve
Mp_top 1013 mkN=
Pcol_bot Pcol_dl ΔP_bot+:= Pcol_bot 1925 kN=
P Pcol_bot:= P 1925 kN=
Mx1 1106.7 kN⋅ m⋅:= Px1 2169.3kN:=
Mx2 1061.3 kN⋅ m⋅:= Px2 1922.9kN:=
DESIGN STEP 4 _ Determine Transverse Steel in Columns
Required Shear Strength by Transverse Steel for Pmax Column
c 2 in⋅:= Clear cover
dt6
8in⋅:= Diameter of longitudinal reinforcement
dv4
8in⋅:= Diameter of transverse reinforcement
D 32 in⋅:= Column diameter
D' D 2 dv⋅− dt− 2 c⋅−:= Circle diameter of longitudinal reinforcement
D' 667 mm= D' 26.25 in=
D'' D 2 c⋅−:= Circle diameter of transverse reinforcement
D'' 711 mm= D'' 28.00 in=
Hclr 6.00 m=
αD'
Hclr:= α 6.37 deg=
f'c 27.6MPa=
217

Appendix B
Av 0.42m2= Shear area of concrete
Vc 0.05 f'c⋅ Av⋅ MPa0.5⋅:= Vc 109 kN= Contribution of concrete
Λ 2:= Fixity Factor: 2 for Fix-Fix
VpΛ Pe⋅ tan α( )⋅
2:= Vp 233 kN= Contribution of arch action
φ 0.90:= Strength reduction factor for shear
VsVu
φVc− Vp−:= Vs1 Vs:= Vs1 234 kN= Contribution of truss action
Required Shear Strength by Transverse Steel for Pmin Column
Inside potential plastic hinge zones:
Pcol_top Pcol_dltop ΔP_top−:=
P Pcol_top:= P 1354 kN=
---> MP Px2−
Px1 Px2−Mx1 Mx2−( )⋅ Mx2+:= M 1062 kN m⋅= Mp_bot M:= From P-M Curve
Mp_bot 1062 kN m⋅=
Suppose the overstrength factor, OS, to 1.5.
OS 1.5:=
Pe Pcol_dl OS ΔP_bot⋅+:= Pe 2090 kN=
Mp_top OS Mp_top⋅:= Mp_top 1519 kN m⋅=
Mp_bot OS Mp_bot⋅:= Mp_bot 1592 kN m⋅=
VuMp_top Mp_bot+
Hclr:= Vu 519 kN=
Shear resistance in the end regions:
Agπ D2⋅
4:= Ag 0.5189 m2
= Cross-sectional area of column
Acπ D''2⋅
4:= Ac 0.40m2
= Cross-sectional area of column core
Av 0.8 Ag⋅:=
218

Appendix B
Suppose the overstrength factor, OS, to 1.5.
OS 1.5:=
Pe Pcol_dl OS ΔP_bot⋅−:= Pe 1098 kN=
Mp_top OS Mp_top⋅:= Mp_top 1412 kN m⋅=
Mp_bot OS Mp_bot⋅:= Mp_bot 1381 kN m⋅=
VuMp_top Mp_bot+
Hclr:= Vu 465 kN=
Shear resistance in the end regions:
Vc 0.05 f'c⋅ Av⋅ MPa0.5⋅:= Vc 109 kN= Contribution of concrete
Λ 2:= Fixity Factor: 2 for Fix-Fix
VpΛ Pe⋅ tan α( )⋅
2:= Vp 123 kN= Contribution of arch action
φ 0.90:= Strength reduction factor for shear
Mx1 944.1 kN⋅ m⋅:= Px1 1367.3kN:=
Mx2 912.8 kN⋅ m⋅:= Px2 1228.5kN:=
---> MP Px2−
Px1 Px2−Mx1 Mx2−( )⋅ Mx2+:= M 941 kN m⋅= Mp_top M:= From P-M Curve
Mp_top 941 mkN=
Pcol_bot Pcol_dl ΔP_bot−:=
P Pcol_bot:= P 1263 kN=
Mx1 912.8 kN⋅ m⋅:= Px1 1228.5kN:=
Mx2 879.9 kN⋅ m⋅:= Px2 1084.4kN:=
---> MP Px2−
Px1 Px2−Mx1 Mx2−( )⋅ Mx2+:= M 921 kN m⋅= Mp_bot M:= From P-M Curve
Mp_bot 921 kN m⋅=
219

Appendix B
For a circular section:
fyh 60 ksi⋅:= Yield strength of spiral
Abhr2π
⎛⎜⎝
⎞⎟⎠
Vs s⋅
fyh D''⋅
⎛⎜⎜⎝
⎞⎟⎟⎠
⋅1
cot θ( )⎛⎜⎝
⎞⎟⎠
:= Abhr 0.233 in2= < Abh 0.20 in2
= OK
Outside the plastic hinge zone:
Vc 0.17 f'c⋅ Av⋅ MPa0.5⋅:= Vc 371 kN= Contribution of concrete
Therefore, the spiral spacing can be much greater than the one in plastic hinge zone.
Note that according to LRFD Article 5.10.6.2, the spiral spacing for a compression member shall not exceed 6 inches.
---> s 6 in⋅:= and Abh 0.20 in2⋅:= (#4)
ρs4 Abh⋅
s D''⋅:= ρs 0.48%= Provided
Transverse Reinforcement for Confinement at Plastic Hinges by LRFD
VsVu
φVc− Vp−:= Vs2 Vs:= Vs2 286 kN= Contribution of truss action
Transverse Reinforcement for Confinement at Plastic Hinges
Vs max Vs1 Vs2,( ):= Vs 286 kN=
Suppose s 20 in⋅:= and Abh 0.20 in2⋅:= (#4)
ρv2 Abh⋅
s D''⋅:= ρv 0.0007= ρv 0.07%=
At 16 0.44⋅ in2⋅:=
ρtAt
Ag:= ρt 0.009= ρt 0.9%=
θ atan1.6 ρv⋅ Av⋅
Λ ρt⋅ Ag⋅
⎛⎜⎜⎝
⎞⎟⎟⎠
0.25⎡⎢⎢⎣
⎤⎥⎥⎦
:= θ 25.5deg=
tan θ( ) 0.48= > tan α( ) 0.11= ---> use tan(θ)
220

Appendix B
fyh 60.00 ksi= fyh 413.7 MPa=
ρs_min2 0.45Ag
Ac1−
⎛⎜⎜⎝
⎞⎟⎟⎠
⋅f'c
fyh⋅:= ρs_min2 0.0092=
ρs_min max ρs_min1 ρs_min2,( ):= ρs_min 0.0092=
Suppose s 4.5 in⋅:= and Abh 0.31 in2⋅:= (#5)
ρs4 Abh⋅
s D''⋅:= ρs 0.0098= > ρs_min 0.0092=
ρs 0.98%= Provided
Extent of plastic hinge region, Lp:
D 32.00 in= Column diameter
Hclr 6.00 m= Column height
Lp max DHclr
6, 18 in⋅,
⎛⎜⎝
⎞⎟⎠
:= Lp 1.00 m= Lp 39 in= LRFD Article 5.10.11.4.1 c
Minimum reinforcement from LRFD Article 5.10.11.4.1 d:
f'c 4000 psi= f'c 27.6MPa=
fy 60 ksi⋅:= fy 413.7 MPa=
ρs_min1 0.12f'c
fy⋅:= ρs_min1 0.008=
Minimum reinforcement from LRFD Article 5.7.4.6:
Ag 804.25 in2=
Ac 615.75 in2=
221
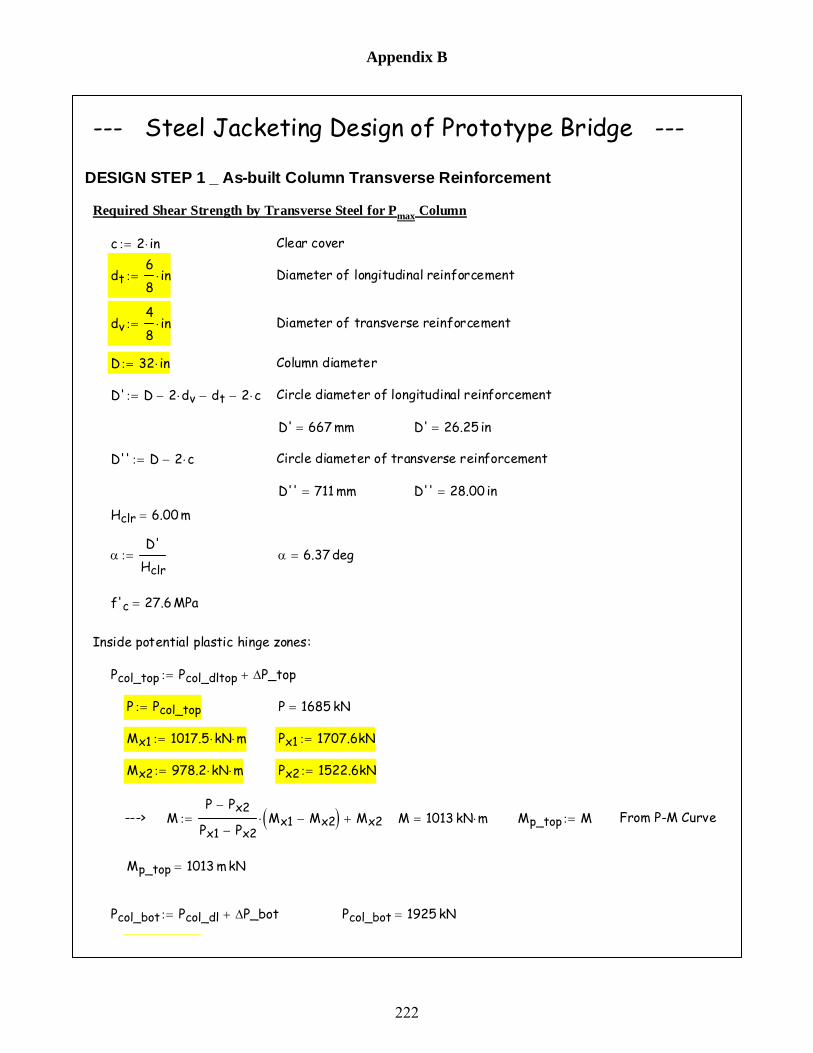
Appendix B
αD'
Hclr:= α 6.37 deg=
f'c 27.6MPa=
Inside potential plastic hinge zones:
Pcol_top Pcol_dltop ΔP_top+:=
P Pcol_top:= P 1685 kN=
Mx1 1017.5 kN⋅ m⋅:= Px1 1707.6kN:=
Mx2 978.2 kN⋅ m⋅:= Px2 1522.6kN:=
---> MP Px2−
Px1 Px2−Mx1 Mx2−( )⋅ Mx2+:= M 1013 kN m⋅= Mp_top M:= From P-M Curve
Mp_top 1013 mkN=
Pcol_bot Pcol_dl ΔP_bot+:= Pcol_bot 1925 kN=
--- Steel Jacketing Design of Prototype Bridge ---
DESIGN STEP 1 _ As-built Column Transverse Reinforcement
Required Shear Strength by Transverse Steel for Pmax Column
c 2 in⋅:= Clear cover
dt6
8in⋅:= Diameter of longitudinal reinforcement
dv4
8in⋅:= Diameter of transverse reinforcement
D 32 in⋅:= Column diameter
D' D 2 dv⋅− dt− 2 c⋅−:= Circle diameter of longitudinal reinforcement
D' 667 mm= D' 26.25 in=
D'' D 2 c⋅−:= Circle diameter of transverse reinforcement
D'' 711 mm= D'' 28.00 in=
Hclr 6.00 m=
222

Appendix B
Ag 0.5189 m2= Cross-sectional area of column
Acπ D''2⋅
4:= Ac 0.40m2
= Cross-sectional area of column
Av 0.8 Ag⋅:= Av 0.42m2= Shear area of concrete
Vc 0.05 f'c⋅ Av⋅ MPa0.5⋅:= Vc 109 kN= Contribution of concrete
φ 0.90:= Strength reduction factor for shear
VsVu
φVc−:= Vs1 Vs:= Vs1 271 kN= Contribution of truss action
Required Shear Strength by Transverse Steel for Pmin Column
Inside potential plastic hinge zones:
Pcol_top Pcol_dltop ΔP_top−:=
P Pcol_top:= P 1354 kN=
P Pcol_bot:= P 1925 kN=
Mx1 1061.3 kN⋅ m⋅:= Px1 2169.3kN:=
Mx2 1017.5 kN⋅ m⋅:= Px2 1707.6kN:=
---> MP Px2−
Px1 Px2−Mx1 Mx2−( )⋅ Mx2+:= M 1038 kN m⋅= Mp_bot M:= From P-M Curve
Mp_bot 1038 kN m⋅=
Suppose the overstrength factor, OS, to 1.0.
OS 1.0:=
Pe Pcol_dl OS ΔP_bot⋅+:= Pe 1925 kN=
Mp_top OS Mp_top⋅:= Mp_top 1013 kN m⋅=
Mp_bot OS Mp_bot⋅:= Mp_bot 1038 kN m⋅=
VuMp_top Mp_bot+
Hclr:= Vu 342 kN=
Shear resistance in the end regions:
Agπ D2⋅
4:=
223

Appendix B
Suppose the overstrength factor, OS, to 1.5.
OS 1.0:=
Pe Pcol_dl OS ΔP_bot⋅−:= Pe 1263 kN=
Mp_top OS Mp_top⋅:= Mp_top 941 kN m⋅=
Mp_bot OS Mp_bot⋅:= Mp_bot 921 kN m⋅=
VuMp_top Mp_bot+
Hclr:= Vu 310 kN=
Shear resistance in the end regions:
Vc 0.05 f'c⋅ Av⋅ MPa0.5⋅:= Vc 109 kN= Contribution of concrete
φ 0.90:= Strength reduction factor for shear
VsVu
φVc−:= Vs2 Vs:= Vs2 236 kN= Contribution of truss action
Transverse Reinforcement for Confinement at Plastic Hinges
Vs max Vs1 Vs2,( ):= Vs 271 kN=
Mx1 944.1 kN⋅ m⋅:= Px1 1367.3kN:=
Mx2 912.8 kN⋅ m⋅:= Px2 1228.5kN:=
---> MP Px2−
Px1 Px2−Mx1 Mx2−( )⋅ Mx2+:= M 941 kN m⋅= Mp_top M:= From P-M Curve
Mp_top 941 mkN=
Pcol_bot Pcol_dl ΔP_bot−:=
P Pcol_bot:= P 1263 kN=
Mx1 944.1 kN⋅ m⋅:= Px1 1367.3kN:=
Mx2 912.8 kN⋅ m⋅:= Px2 1228.5kN:=
---> MP Px2−
Px1 Px2−Mx1 Mx2−( )⋅ Mx2+:= M 921 kN m⋅= Mp_bot M:= From P-M Curve
Mp_bot 921 kN m⋅=
224

Appendix B
DESIGN STEP 2 _ Steel Jacketing Design
Required Steel thickness, tj for Confinement
fs 200 MPa⋅:= Stress induced in the jacket
At strain of 0.001 when Es = 200,000 MPa
fl 2.07 MPa⋅:= Required confinement stress
This assumpution is from Chai et al., 1991
Suppose xc 0.25 in⋅:= Clearlance
Dj D 2 xc⋅+:= Dj 826 mm= Dj 32.5 in= Outside diameter of steel jacket
tjfl Dj⋅
2 fs⋅:= tj 4.3mm= tj 0.17 in=
Check steel thickness, tj for Shear
Vs 271 kN= Required shear strength
tj 4.3mm=
Suppose s 8.25 in⋅:=
At 16 0.44⋅ in2⋅:=
ρtAt
Ag:=
ρt 0.009= ρt 0.9%= Longitudinal reinforcement ratio
θ 45 deg⋅:=
fyh 60 ksi⋅:= Yield strength of spiral
Abhr2π
⎛⎜⎝
⎞⎟⎠
Vs s⋅
fyh D''⋅
⎛⎜⎜⎝
⎞⎟⎟⎠
⋅1
cot θ( )⎛⎜⎝
⎞⎟⎠
:= Abhr 0.190 in2= -----> Abh 0.20 in2
⋅:= (#4)
ρs4 Abhr⋅
s D''⋅:= ρs 0.0033= ρs 0.33%= Required
ρs4 Abh⋅
s D''⋅:= ρs 0.0035= ρs 0.35%= Provided
225

Appendix B
fyj 42 ksi⋅:= fyj 290 MPa=
θ 30 deg⋅:=
Shear strength enhancement by steel jacket, Vsj:
Vsjπ
2tj⋅ fyj⋅ Dj tj−( )⋅ cot θ( )⋅:= Vsj 2764 kN= > Vs 271 kN= OK
226

APPENDIX C DESIGN OF FOOTING AND CAP BEAM OF PROTOTYPE
BRIDGE BENT
This appendix provides details on the design of the footing and cap beam for the prototype
bridge pier bent. The footing and cap-beam were designed to be capacity protected as well as the
shear force design of the column as presented previously. This was considered through
overstrength factor of 1.5. The resisting length, width and height of the footing were 3.6 m (11 ft
10 in), 15.0 m (49 ft 3 in) and 1.0 m (39 in), respectively. The footing reinforcement was
designed to resist the moment and shear force capacity of the column, resulting in D19 bars
spaced at 242 mm (#6 at 9 17/32 in) in the longitudinal direction and D22 bars spaced at 262 mm
(#7 at 10 5/16 in) in the transverse direction. For 1067 mm (42 in) by 1219 mm (48 in) cap-
beam, ten D22 (#7) longitudinal bars were provided to resist the moment and D16 (#5) stirrups
spaced at 300 mm (12”) center-to-center were provided to resist the shear force.
227

Appendix C
n 3:= Number of columns per pier
P Pcol_dl n⋅ Pftg+:= P 4909 kN=
P 1.25 P⋅:= P 6136 kN= Load factor (1.25 for DC)
Design moment and shear forces:
OS 1.5:= Overstrength factor
Mn 1055 kN⋅ m⋅:=
MOT OS Mn⋅ n⋅:= MOT 4748 kN m⋅=
H 6 m⋅:=
VOTMOT
H:= VOT 791 kN=
--- Prototype Footing and Cap-beam Design ---
Column: D = 32 in, L. Bar = 16 #6, T. Bar = #4@6 in f'c = 4 ksi
DESIGN STEP 1 _ Footing Design in Longitudinal Direction
Design Step 1.1 _ Forces
Bf 15.0 m⋅:= Width of footing
Df 1.0 m⋅:= Depth of footing
Lf 3.6 m⋅:= Length of footing
Vftg Bf Df⋅ Lf⋅:= Vftg 54.00 m3= Volumn of footing
Foundation weight:
Pftg Vftg 2.350⋅kN
m3⋅:= Pftg 127 kN=
Axial Force:
Pcol_dl 1594 kN⋅:= Dead load a top of a column
228
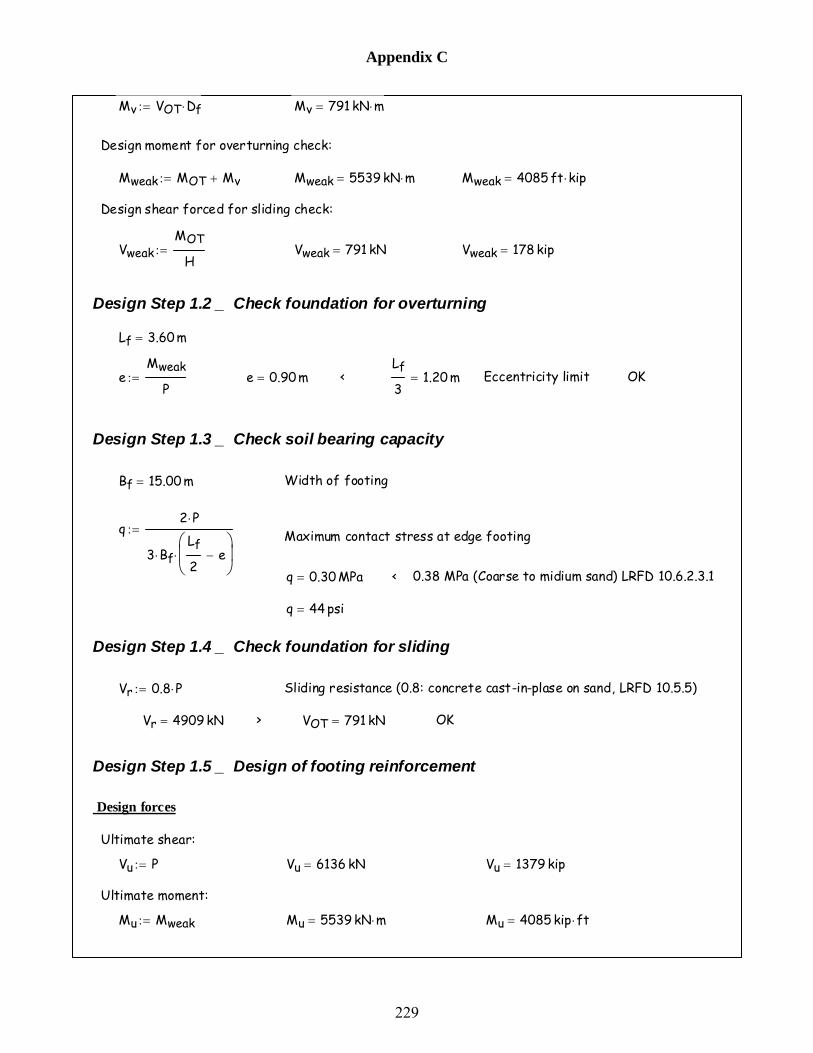
Appendix C
Maximum contact stress at edge footing
q 0.30 MPa= < 0.38 MPa (Coarse to midium sand) LRFD 10.6.2.3.1
q 44 psi=
Design Step 1.4 _ Check foundation for sliding
Vr 0.8 P⋅:= Sliding resistance (0.8: concrete cast-in-plase on sand, LRFD 10.5.5)
Vr 4909 kN= > VOT 791 kN= OK
Design Step 1.5 _ Design of footing reinforcement
Design forces
Ultimate shear:
Vu P:= Vu 6136 kN= Vu 1379 kip=
Ultimate moment:
Mu Mweak:= Mu 5539 kN m⋅= Mu 4085 kip ft⋅=
Mv VOT Df⋅:= Mv 791 kN m⋅=
Design moment for overturning check:
Mweak MOT Mv+:= Mweak 5539 kN m⋅= Mweak 4085 ft kip⋅=
Design shear forced for sliding check:
VweakMOT
H:= Vweak 791 kN= Vweak 178 kip=
Design Step 1.2 _ Check foundation for overturning
Lf 3.60 m=
eMweak
P:= e 0.90 m= <
Lf
31.20 m= Eccentricity limit OK
Design Step 1.3 _ Check soil bearing capacity
Bf 15.00 m= Width of footing
q2 P⋅
3 Bf⋅Lf
2e−
⎛⎜⎝
⎞⎟⎠
⋅
:=
229

Appendix C
Depth of equivalent stress block
dv da
2−:= dv 0.90m= Effective depth
φ 0.9:=
One-way shear:
β 2.0:=
Bf 15.00 m=
φVc1 φ 0.0316⋅ ksi0.5⋅ β⋅ f'c⋅ Bf⋅ dv⋅:= φVc1 10635 kN= φVc1 2391 kip=
φVc2 φ 0.25⋅ f'c⋅ Bf⋅ dv⋅:= φVc2 84137 kN= φVc2 18915kip=
φVc min φVc1 φVc2,( ):= φVc 10635 kN= > Vu 6136 kN= OK
Two-way shear:
Design for moment
Required longitudinal Bar:
φ 0.90:= fy 60 ksi⋅:= j 0.925:=
c 3 in⋅:=
dbl6
8in⋅:=
d Df c−dbl
2−:= d 0.91 m= d 36.00 in=
AstMu
φ fy⋅ j⋅ d⋅:= Ast 27.27 in2
=
As 0.44 in2⋅:= (#6)
sBf As⋅
Ast:= s 9.53 in= s 242 mm=
Design for shear
f'c 4.0 ksi⋅:= fy 60.00 ksi=
aAst fy⋅
0.85 f'c⋅ Bf⋅:= a 20.69 mm=
230

Appendix C
ld 21 in=ld 524 mm=ld 1.25 ld⋅:=
ld 17 in=ld 419 mm=ld1.25 Ab⋅ fy⋅
in ksi0.5⋅ f'c
:=
(#6 : column longitudinal bars)Ab 0.44 in2⋅:=
f'c 27.6MPa=
fy 414 MPa=
Extention of column steel into a footing is set to be 1.25ld.
Design Step 1.6 _ Extention column steel into footing
OKVu 6136 kN= >
βc 1:= For circular column
dv 0.90m=
Dcol 28 in⋅:=
b0 2πDcol
2
dv
2+
⎛⎜⎝
⎞⎟⎠
⋅:= b0 5.07 m= b0 200 in= Length of critical shear perimeter
φVc1 φ 0.0630.126βc
+⎛⎜⎝
⎞⎟⎠
⋅ ksi0.5⋅ f'c⋅ b0⋅ dv⋅:= φVc1 10758 kN= φVc1 2419 kip=
φVc2 φ 0.126⋅ ksi0.5⋅ f'c⋅ b0⋅ dv⋅:= φVc2 7172 kN= φVc2 1612 kip= Limit
φVc min φVc1 φVc2,( ):= φVc 7172 kN=
231
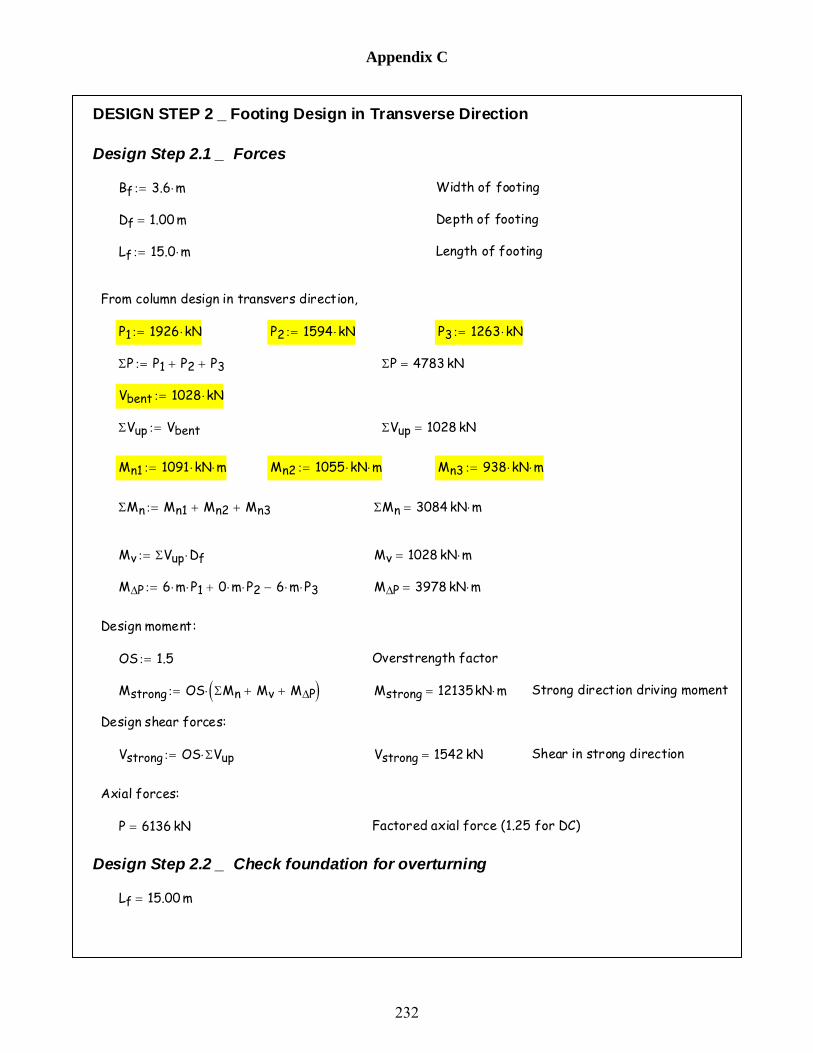
Appendix C
ΣMn 3084 kN m⋅=
Mv ΣVup Df⋅:= Mv 1028 kN m⋅=
MΔP 6 m⋅ P1⋅ 0 m⋅ P2⋅+ 6 m⋅ P3⋅−:= MΔP 3978 kN m⋅=
Design moment:
OS 1.5:= Overstrength factor
Mstrong OS ΣMn Mv+ MΔP+( )⋅:= Mstrong 12135kN m⋅= Strong direction driving moment
Design shear forces:
Vstrong OS ΣVup⋅:= Vstrong 1542 kN= Shear in strong direction
Axial forces:
P 6136 kN= Factored axial force (1.25 for DC)
Design Step 2.2 _ Check foundation for overturning
Lf 15.00 m=
DESIGN STEP 2 _ Footing Design in Transverse Direction
Design Step 2.1 _ Forces
Bf 3.6 m⋅:= Width of footing
Df 1.00 m= Depth of footing
Lf 15.0 m⋅:= Length of footing
From column design in transvers direction,
P1 1926 kN⋅:= P2 1594 kN⋅:= P3 1263 kN⋅:=
ΣP P1 P2+ P3+:= ΣP 4783 kN=
Vbent 1028 kN⋅:=
ΣVup Vbent:= ΣVup 1028 kN=
Mn1 1091 kN⋅ m⋅:= Mn2 1055 kN⋅ m⋅:= Mn3 938 kN⋅ m⋅:=
ΣMn Mn1 Mn2+ Mn3+:=
232
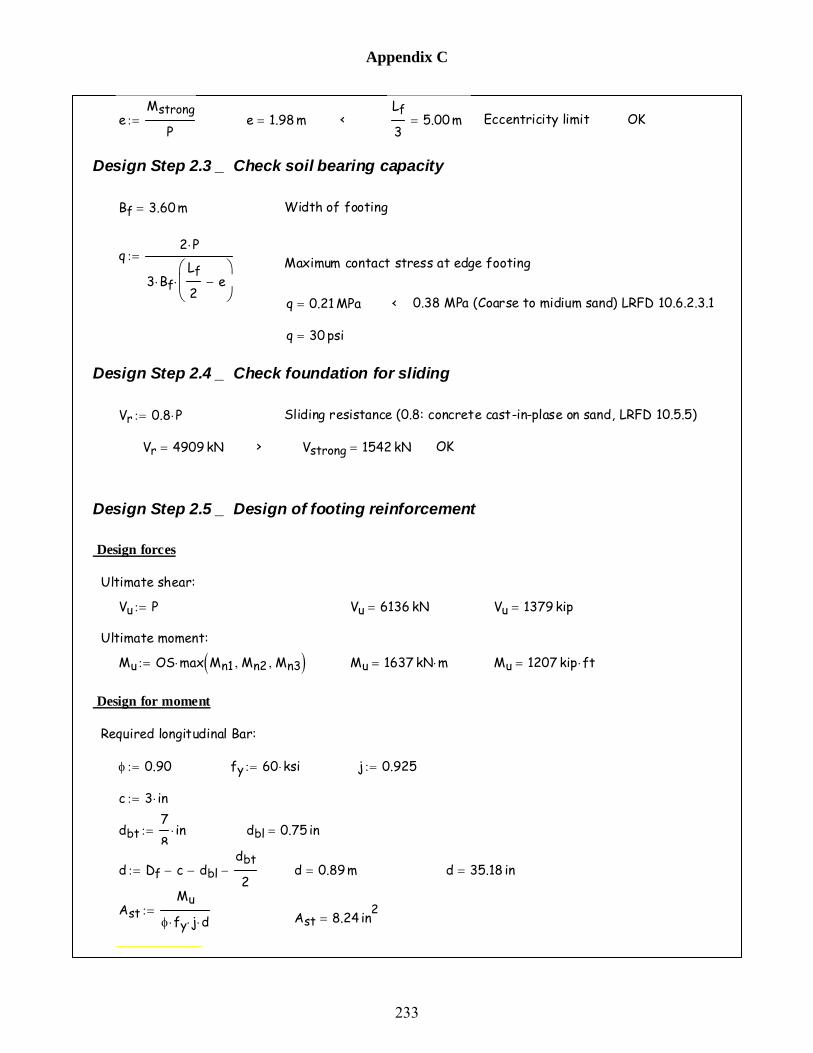
Appendix C
Ultimate shear:
Vu P:= Vu 6136 kN= Vu 1379 kip=
Ultimate moment:
Mu OS max Mn1 Mn2, Mn3,( )⋅:= Mu 1637 kN m⋅= Mu 1207 kip ft⋅=
Design for moment
Required longitudinal Bar:
φ 0.90:= fy 60 ksi⋅:= j 0.925:=
c 3 in⋅:=
dbt7
8in⋅:= dbl 0.75 in=
d Df c− dbl−dbt
2−:= d 0.89m= d 35.18 in=
AstMu
φ fy⋅ j⋅ d⋅:= Ast 8.24 in2
=
eMstrong
P:= e 1.98 m= <
Lf
35.00 m= Eccentricity limit OK
Design Step 2.3 _ Check soil bearing capacity
Bf 3.60m= Width of footing
q2 P⋅
3 Bf⋅Lf
2e−
⎛⎜⎝
⎞⎟⎠
⋅
:= Maximum contact stress at edge footing
q 0.21 MPa= < 0.38 MPa (Coarse to midium sand) LRFD 10.6.2.3.1
q 30 psi=
Design Step 2.4 _ Check foundation for sliding
Vr 0.8 P⋅:= Sliding resistance (0.8: concrete cast-in-plase on sand, LRFD 10.5.5)
Vr 4909 kN= > Vstrong 1542 kN= OK
Design Step 2.5 _ Design of footing reinforcement
Design forces
233

Appendix C
As 0.60 in2⋅:= (#7)
sBf As⋅
Ast:= s 10.32 in= s 262 mm=
Design for shear
Same as longitudinal direction.
234

Appendix C
Maximum moment at top (form transverst design of column)Muu_eq 1091 kN⋅ m⋅:=
Design forces of earthquake load
Vu_d 931 kN=Vu_d 1.25 Vu_d⋅:=
Mul_d 355 kN m⋅=Mul_d 1.25 Mul_d⋅:=
Muu_d 1279 kN m⋅=Muu_d 1.25 Muu_d⋅:=
Considering Load factor (1.25 for DC):
Maximum shear forceVu_d 745 kN⋅:=
Maximum momnet at spanMul_d 284 kN⋅ m⋅:=
Maximum moment at columnMuu_d 1023 kN⋅ m⋅:=
Shear diagram
Moment diagram
Analysis model
Design forces of dead load
Design Step 3.1 _ Forces
DESIGN STEP 3 _ Cap-beam Design
235

Appendix C
Dc 1219 mm= Depth of cap-beam
Design Step 3.2 _ Design of cap-beam reinforcement
Design for moment
Required longitudinal Bar:
Mu Muu:= Mu 1637 kN m⋅=
φ 0.90:= fy 60 ksi⋅:= j 0.875:=
c 2 in⋅:=
dtr4
8in⋅:= (#4) Transverse bar diameter
db7
8in⋅:= (#7) Longitudinal bar diameter
d Dc c− dtr−db
2−:= d 1.14 m= d 45.06 in=
Mul_eq 1091 kN⋅ m⋅:= Maximum moment at bottom (form transverst design of column)
OS 1.50=
Muu_eq OS Muu_eq⋅:= Muu_eq 1637 kN m⋅=
Mul_eq OS Mul_eq⋅:= Mul_eq 1637 kN m⋅=
H 6 m⋅:=
Vu_eqMul_eq Muu_eq+
H:= Vu_eq 546 kN=
Design forces
Muu max Muu_d Muu_eq,( ):= Muu 1637 kN m⋅=
Mul max Mul_d Mul_eq,( ):= Muu 1637 kN m⋅=
Vu max Vu_d Vu_eq,( ):= Vu 931 kN=
Capbeam dimension
Bc 42 in⋅:= Bc 1067 mm= Width of cap-beam
Dc 48 in⋅:=
236
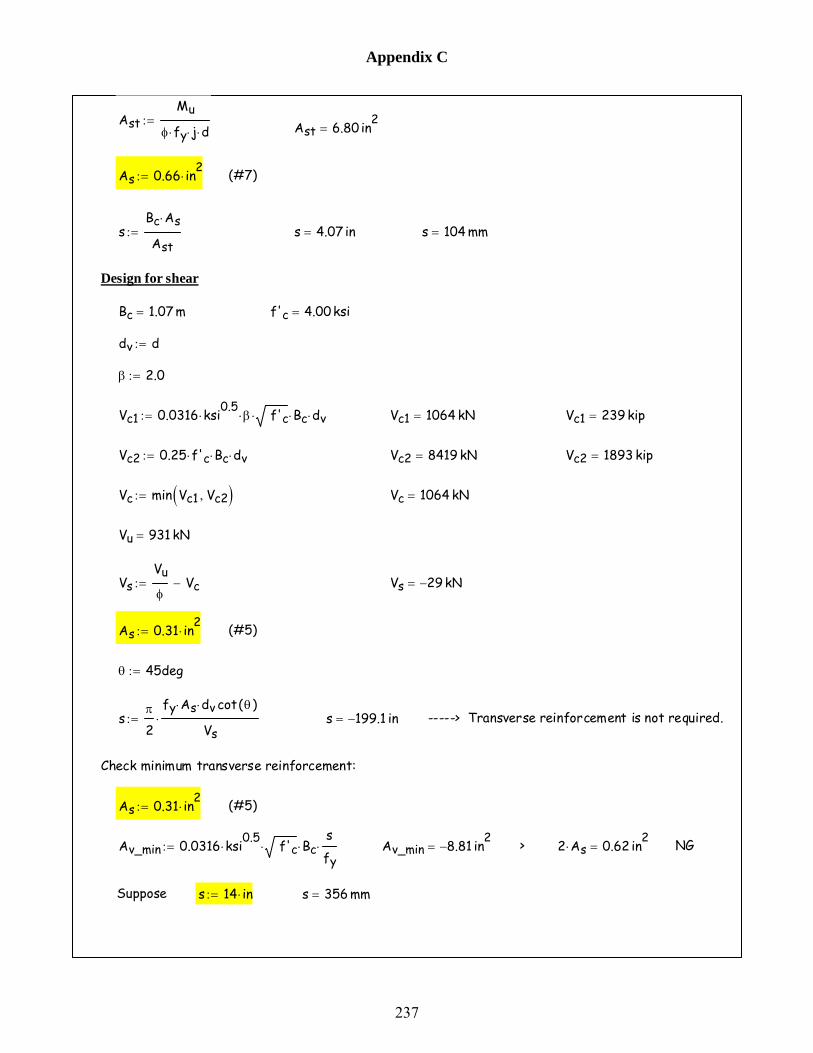
Appendix C
VsVu
φVc−:= Vs 29− kN=
As 0.31 in2⋅:= (#5)
θ 45deg:=
sπ
2
fy As⋅ dv cot θ( )⋅
Vs⋅:= s 199.1− in= -----> Transverse reinforcement is not required.
Check minimum transverse reinforcement:
As 0.31 in2⋅:= (#5)
Av_min 0.0316 ksi0.5⋅ f'c⋅ Bc⋅
s
fy⋅:= Av_min 8.81− in2
= > 2 As⋅ 0.62 in2= NG
Suppose s 14 in⋅:= s 356 mm=
AstMu
φ fy⋅ j⋅ d⋅:= Ast 6.80 in2
=
As 0.66 in2⋅:= (#7)
sBc As⋅
Ast:= s 4.07 in= s 104 mm=
Design for shear
Bc 1.07 m= f'c 4.00ksi=
dv d:=
β 2.0:=
Vc1 0.0316 ksi0.5⋅ β⋅ f'c⋅ Bc⋅ dv⋅:= Vc1 1064 kN= Vc1 239 kip=
Vc2 0.25 f'c⋅ Bc⋅ dv⋅:= Vc2 8419 kN= Vc2 1893 kip=
Vc min Vc1 Vc2,( ):= Vc 1064 kN=
Vu 931 kN=
237

Appendix C
Askt 0.73 in2= <
Ast
41.70 in2
= OK Limit
As 0.20 in2⋅:= (#4)
s mind6
300 mm⋅,⎛⎜⎝
⎞⎟⎠
:= s 191 mm= s 7.5 in= Maximum spacing
Dc 2 c⋅− db−
s5.74= -----> n 4:= Number of bars
n As⋅ 0.80 in2= > Askt 0.73 in2
= OK
Design Step 3.4 _ Extention column steel into cap-beam
Same as footing.
Av_min 0.0316 ksi0.5⋅ f'c⋅ Bc⋅
sfy⋅:= Av_min 0.619 in2
= < 2 As⋅ 0.62 in2= OK
Note that according to LRFD Article 5.10.6.3, the spiral spacing for a compression member shall not exceed 300 mm.
---> s 300 mm⋅:= and As 0.31 in2= (#5)
Design Step 3.3 _ Skin reinforcement
d 1145 mm=
Ask 0.001 d 760 mm⋅−( )⋅:= Ask 0.38mm2
mm= Ask 0.18
in2
ft= LRFD Article 5.7.3.4
Ast 6.80 in2= Flexural tension reinforcement
Dc 1219 mm=
Askt Ask Dc⋅:=
238

APPENDIX D DESIGN OF STEEL JACKETED RC COLUMN OF
PROTOTYPE BRIDGE
This appendix provides details on the design of steel jacketed RC columns of prototype bridge
pier bent. The non-ductile RC column with diameter of 813 mm (32 in), 16-D19 (#6)
longitudinal bars and transverse reinforcement ratio of 0.35 % was retrofitted with steel jacket
with thickness of 4.3 mm (3/18 in). A clearance of 13 mm (1/2 in) was provided between the
existing column and the jacket. This thickness of steel jacket was designed such that a steel
jacket provided the confinement stress of 2.07 MPa.
239

Appendix D
αD'
Hclr:= α 6.37 deg=
f'c 27.6MPa=
Inside potential plastic hinge zones:
Pcol_top Pcol_dltop ΔP_top+:=
P Pcol_top:= P 1685 kN=
Mx1 1017.5 kN⋅ m⋅:= Px1 1707.6kN:=
Mx2 978.2 kN⋅ m⋅:= Px2 1522.6kN:=
---> MP Px2−
Px1 Px2−Mx1 Mx2−( )⋅ Mx2+:= M 1013 kN m⋅= Mp_top M:= From P-M Curve
Mp_top 1013 mkN=
Pcol_bot Pcol_dl ΔP_bot+:= Pcol_bot 1925 kN=
--- Steel Jacketing Design of Prototype Bridge ---
DESIGN STEP 1 _ As-built Column Transverse Reinforcement
Required Shear Strength by Transverse Steel for Pmax Column
c 2 in⋅:= Clear cover
dt6
8in⋅:= Diameter of longitudinal reinforcement
dv4
8in⋅:= Diameter of transverse reinforcement
D 32 in⋅:= Column diameter
D' D 2 dv⋅− dt− 2 c⋅−:= Circle diameter of longitudinal reinforcement
D' 667 mm= D' 26.25 in=
D'' D 2 c⋅−:= Circle diameter of transverse reinforcement
D'' 711 mm= D'' 28.00 in=
Hclr 6.00 m=
240

Appendix D
Ag 0.5189 m2= Cross-sectional area of column
Acπ D''2⋅
4:= Ac 0.40m2
= Cross-sectional area of column
Av 0.8 Ag⋅:= Av 0.42m2= Shear area of concrete
Vc 0.05 f'c⋅ Av⋅ MPa0.5⋅:= Vc 109 kN= Contribution of concrete
φ 0.90:= Strength reduction factor for shear
VsVu
φVc−:= Vs1 Vs:= Vs1 271 kN= Contribution of truss action
Required Shear Strength by Transverse Steel for Pmin Column
Inside potential plastic hinge zones:
Pcol_top Pcol_dltop ΔP_top−:=
P Pcol_top:= P 1354 kN=
P Pcol_bot:= P 1925 kN=
Mx1 1061.3 kN⋅ m⋅:= Px1 2169.3kN:=
Mx2 1017.5 kN⋅ m⋅:= Px2 1707.6kN:=
---> MP Px2−
Px1 Px2−Mx1 Mx2−( )⋅ Mx2+:= M 1038 kN m⋅= Mp_bot M:= From P-M Curve
Mp_bot 1038 kN m⋅=
Suppose the overstrength factor, OS, to 1.0.
OS 1.0:=
Pe Pcol_dl OS ΔP_bot⋅+:= Pe 1925 kN=
Mp_top OS Mp_top⋅:= Mp_top 1013 kN m⋅=
Mp_bot OS Mp_bot⋅:= Mp_bot 1038 kN m⋅=
VuMp_top Mp_bot+
Hclr:= Vu 342 kN=
Shear resistance in the end regions:
Agπ D2⋅
4:=
241

Appendix D
Suppose the overstrength factor, OS, to 1.0.
OS 1.0:=
Pe Pcol_dl OS ΔP_bot⋅−:= Pe 1263 kN=
Mp_top OS Mp_top⋅:= Mp_top 941 kN m⋅=
Mp_bot OS Mp_bot⋅:= Mp_bot 921 kN m⋅=
VuMp_top Mp_bot+
Hclr:= Vu 310 kN=
Shear resistance in the end regions:
Vc 0.05 f'c⋅ Av⋅ MPa0.5⋅:= Vc 109 kN= Contribution of concrete
φ 0.90:= Strength reduction factor for shear
VsVu
φVc−:= Vs2 Vs:= Vs2 236 kN= Contribution of truss action
Transverse Reinforcement for Confinement at Plastic Hinges
Vs max Vs1 Vs2,( ):= Vs 271 kN=
Mx1 944.1 kN⋅ m⋅:= Px1 1367.3kN:=
Mx2 912.8 kN⋅ m⋅:= Px2 1228.5kN:=
---> MP Px2−
Px1 Px2−Mx1 Mx2−( )⋅ Mx2+:= M 941 kN m⋅= Mp_top M:= From P-M Curve
Mp_top 941 mkN=
Pcol_bot Pcol_dl ΔP_bot−:=
P Pcol_bot:= P 1263 kN=
Mx1 944.1 kN⋅ m⋅:= Px1 1367.3kN:=
Mx2 912.8 kN⋅ m⋅:= Px2 1228.5kN:=
---> MP Px2−
Px1 Px2−Mx1 Mx2−( )⋅ Mx2+:= M 921 kN m⋅= Mp_bot M:= From P-M Curve
Mp_bot 921 kN m⋅=
242

Appendix D
DESIGN STEP 2 _ Steel Jacketing Design
Required Steel thickness, tj for Confinement
fs 200 MPa⋅:= Stress induced in the jacket
At strain of 0.001 when Es = 200,000 MPa
fl 2.07 MPa⋅:= Required confinement stress
This assumpution is from Chai et al., 1991
Suppose xc 0.5 in⋅:= Clearlance
Dj D 2 xc⋅+:= Dj 838 mm= Dj 33.0 in= Outside diameter of steel jacket
tjfl Dj⋅
2 fs⋅:= tj 4.3mm= tj 0.17 in=
Check steel thickness, tj for Shear
Vs 271 kN= Required shear strength
tj 4.3mm=
Suppose s 8.25 in⋅:=
At 16 0.44⋅ in2⋅:=
ρtAt
Ag:=
ρt 0.009= ρt 0.9%= Longitudinal reinforcement ratio
θ 45 deg⋅:=
fyh 60 ksi⋅:= Yield strength of spiral
Abhr2π
⎛⎜⎝
⎞⎟⎠
Vs s⋅
fyh D''⋅
⎛⎜⎜⎝
⎞⎟⎟⎠
⋅1
cot θ( )⎛⎜⎝
⎞⎟⎠
:= Abhr 0.190 in2= -----> Abh 0.20 in2
⋅:= (#4)
ρs4 Abhr⋅
s D''⋅:= ρs 0.0033= ρs 0.33%= Required
ρs4 Abh⋅
s D''⋅:= ρs 0.0035= ρs 0.35%= Provided
243

Appendix D
fyj 42 ksi⋅:= fyj 290 MPa=
θ 30 deg⋅:=
Shear strength enhancement by steel jacket, Vsj:
Vsjπ
2tj⋅ fyj⋅ Dj tj−( )⋅ cot θ( )⋅:= Vsj 2850 kN= > Vs 271 kN= OK
244

APPENDIX E SHOP DRAWINGS OF PIER BENT SPECIMEN
This appendix provides the shop drawings of pier bent specimen. The general layout,
reinforcement details, formwork details and shipping frame details are presented.
245

246

247

248
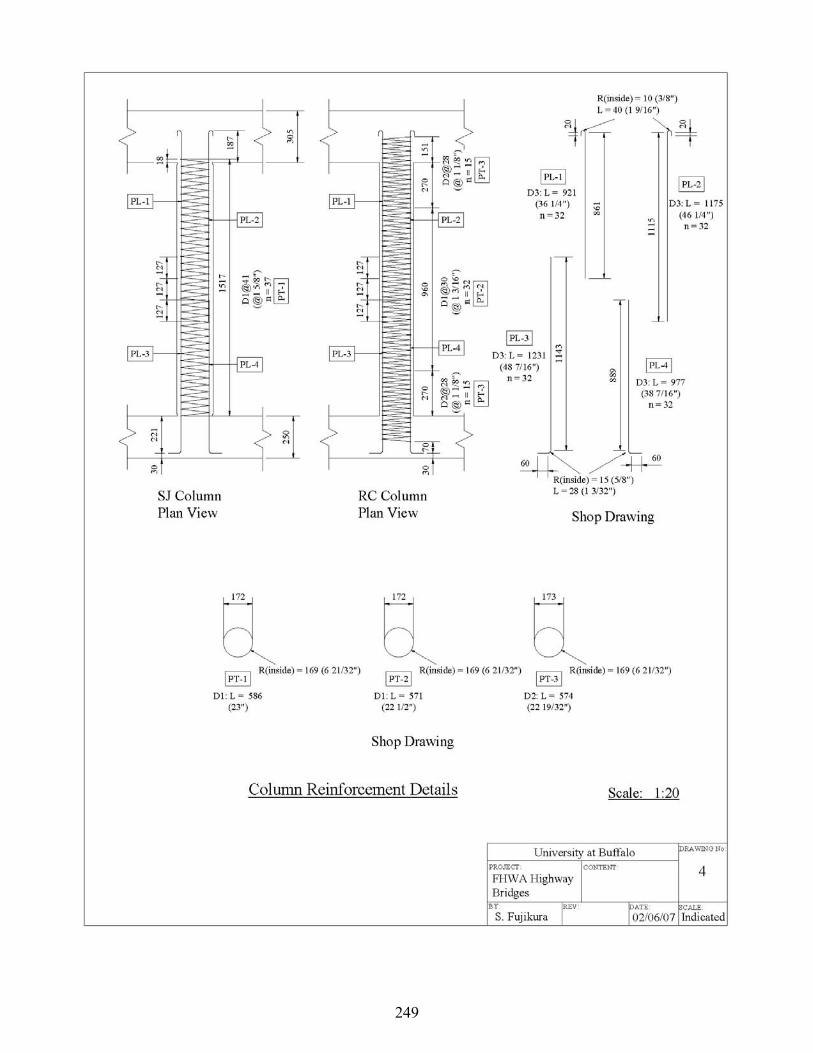
249

250

251

252

253


APPENDIX F MODELS AND RESULTS OF MOMENT-CURVATURE
ANALYSIS OF TEST COLUMNS FROM XTRACT
Moment-curvature relationships were calculated using XTRACT (2007) for the test columns.
This appendix provides the details of section and material models and analytical results. The
stress-strain relationships for confined and unconfined concrete, steel bars and steel jacket are
presented.
255

256
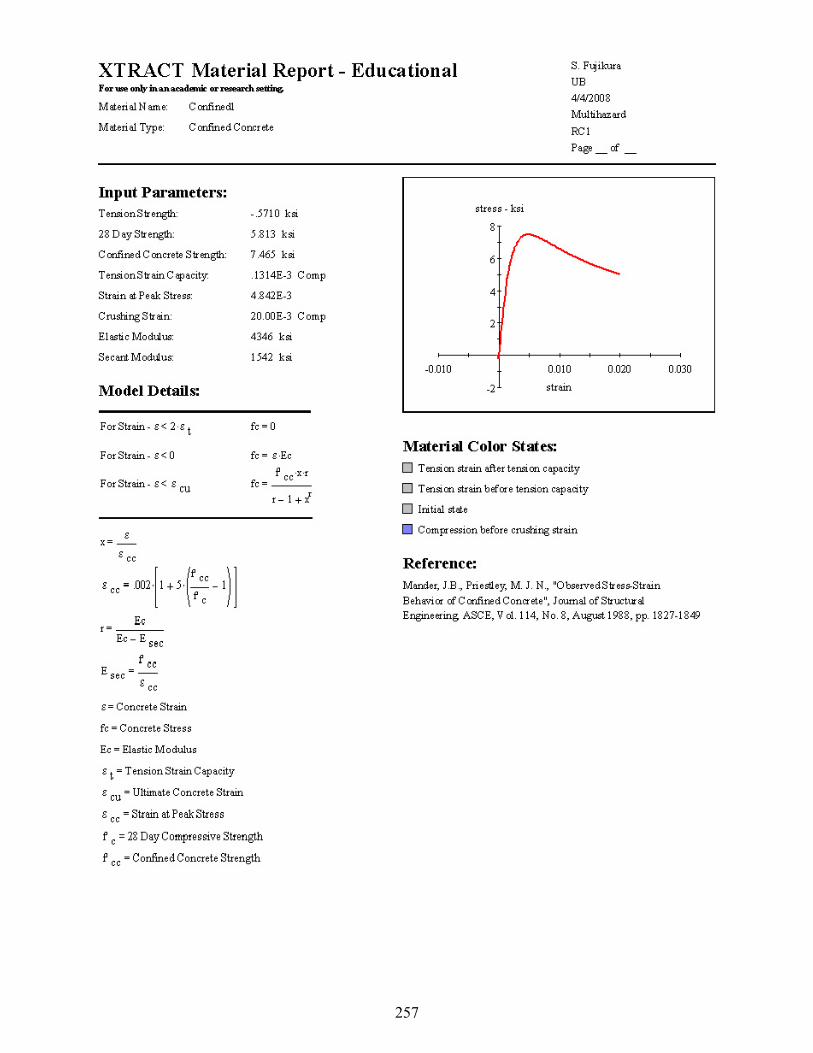
257

258

259

260

261

262

263

264

265

266

APPENDIX G SIMPLE PLASTIC ANALYSIS OF TEST COLUMNS
This appendix provides details on the simple plastic analyses of the RC columns and steel
jacketed RC columns. These plastic analyses were conducted to calculate ultimate lateral load
capacity and reactions of these columns. The maximum resulting reaction forces at the base and
top of the RC columns were 112.1 kN (25.2 kip) and 22.4 kN (5.0 kip), respectively. The
maximum resulting reaction forces at the base and top of the steel jacketed RC columns were
198.7 kN (44.7 kip) and 39.7 kN (8.9 kip), respectively.
267

Appendix G
*1 : Dinamic Increase Factors were considered for material.
Plastic MomentCapacity of Column *1
Mp 14.0 kN m⋅=Mp 124.0 kip⋅ in⋅:=
Flexural Stiffness *1EI 463.8 kN m2⋅=EI 161.6 103⋅ kip⋅ in2
⋅:=
b 1.250 m=b L a−:=
Height of Loada 0.25 m⋅:=
Height of Column:L 1.5 m⋅:=Geometry:
MPa 1000000 Pa⋅:=kN 1000 N⋅:=
msecsec1000
:=ksikip
in2:=kip 1000 lbf⋅:=Units:
Simple Plastic Analysis
--- RC1 and RC2 Test Specimen --- (Applied Force at Blast Height)
268

Appendix G
Moment @ Top
Ma_12 P1⋅ a2
⋅ b2⋅
L3:= Ma_1 4.7kN m⋅= Moment @ Load Point
Deflection
wa_1P1 a3
⋅ b3⋅
3 EI⋅ L3⋅
:= wa_1 0.5mm= Deflection @ Load Point
Step 2: Forming 2nd Plastic Hinge
Maximum Force
P2a Mp Ma_1−( ) 2 L3⋅
a b2⋅
⋅1
a 2 L⋅+⋅:= P2a 49.7 kN= When Ma reaches Mp
P22 Mp− M2_1−( )−2 L2⋅
a b⋅⋅
1a L+⋅:= P22 92.2 kN= When M2 reaches Mp
P2 min P2a P22,( ):= P2 49.7 kN= -----> Plastic hinge formes at load point
Step 1: Forming 1st Plastic Hige
Maximum Force
P1Mp L2
⋅
a b2⋅
:= P1 80.7 kN= When base moment (M1) reaches Mp
Reactions
R1_1P1 b2
⋅
L33 a⋅ b+( )⋅:= R1_1 74.7 kN= Reaction @ Bottom
R2_1P1 a2
⋅
L3a 3 b⋅+( )⋅:= R2_1 6.0kN= Reaction @ Top
Moment
M1_1P1 a⋅ b2
⋅
L2−:= M1_1 14.0− kN m⋅= Moment @ Bottom
M2_1P1 a2
⋅ b⋅
L2−:= M2_1 2.8− kN m⋅=
269

Appendix G
Step 3: Forming Last Plastic Hinge
Maximum Force
P3Mp M2_1+ M2_2+
b:= P3 4.1kN= When M2 reaches Mp
Reactions
R2_3 P3:= R2_3 4.1kN= Reaction @ Top
Moment
M2_3 P3 b⋅:= M2_3 5.2kN m⋅= Moment @ Top
Deflection
wa_3P3 b3
⋅
3 EI⋅:= wa_3 5.8mm= Deflection @ Load Point
Reactions
R1_2P2 b2
⋅
2 L3⋅
a 2 L⋅+( )⋅:= R1_2 37.4 kN= Reaction @ Bottom
R2_2P2 a⋅
2 L3⋅
3 L2⋅ a2
−( ):= R2_2 12.3 kN= Reaction @ Top
Moment
M2_2P2 a⋅ b⋅
2 L2⋅
− a L+( )⋅:= M2_2 6.0− kN m⋅= Moment @ Top
Ma_2 R1_2 a⋅:= Ma_2 9.3kN m⋅= Moment @ Load Point
Deflection
wa_2P2 a2
⋅ b3⋅
12 EI⋅ L3⋅
3 L⋅ a+( )⋅:= wa_2 1.5mm= Deflection @ Load Point
270

Appendix G
w''a 7.9mm=w''a wa_1 wa_2+ wa_3+:=
R''2 22.4 kN=R''2 R2_1 R2_2+ R2_3+:=
R''1 112.1 kN=R''1 R1_1 R1_2+:=
P'' 134.5 kN=P'' P1 P2+ P3+:=
Step 3:
w'a 2.1mm=w'a wa_1 wa_2+:=
R'2 18.3 kN=R'2 R2_1 R2_2+:=
R'1 112.1 kN=R'1 R1_1 R1_2+:=
P' 130.4 kN=P' P1 P2+:=
Step 2:
wa 0.5mm=wa wa_1:=
R2 6.0kN=R2 R2_1:=
R1 74.7 kN=R1 R1_1:=
P1 80.7 kN=P P1:=
Step 1:
Summary
271

Appendix G
*1 : Dinamic Increase Factors were considered for material.
Plastic MomentCapacity of Column at Middle *1
MpM 34.5 kN m⋅=MpM 305.0 kip⋅ in⋅:=
Plastic MomentCapacity of Column at Base and Top *1
MpB 15.2 kN m⋅=MpB 134.6 kip⋅ in⋅:=
Flexural Stiffness *1(Steel Jacketed Column)
EI 1698.1 kN m2⋅=EI 591.7 103⋅ kip⋅ in2
⋅:=
b 1.250 m=b L a−:=
Height of Loada 0.25 m⋅:=
Height of Column:L 1.5 m⋅:=Geometry:
MPa 1000000 Pa⋅:=kN 1000 N⋅:=
msecsec1000
:=ksikip
in2:=kip 1000 lbf⋅:=Units:
Simple Plastic Analysis
--- SJ1 and SJ2 Test Specimen --- (Applied Force at Blast Height)
272

Appendix G
Moment @ Top
Ma_12 P1⋅ a2
⋅ b2⋅
L3:= Ma_1 5.1kN m⋅= Moment @ Load Point
Deflection
wa_1P1 a3
⋅ b3⋅
3 EI⋅ L3⋅
:= wa_1 0.2mm= Deflection @ Load Point
Step 2: Forming 2nd Plastic Hinge
Maximum Force
P2a MpM Ma_1−( ) 2 L3⋅
a b2⋅
⋅1
a 2 L⋅+⋅:= P2a 156.3 kN= When Ma reaches Mp
P22 MpB− M2_1−( )−2 L2⋅
a b⋅⋅
1a L+⋅:= P22 100.1 kN= When M2 reaches Mp
P2 min P2a P22,( ):= P2 100.1 kN= -----> Plastic hinge formes at Top
Step 1: Forming 1st Plastic Hige
Maximum Force
P1MpB L2
⋅
a b2⋅
:= P1 87.6 kN= When base moment (M1) reaches Mp
Reactions
R1_1P1 b2
⋅
L33 a⋅ b+( )⋅:= R1_1 81.1 kN= Reaction @ Bottom
R2_1P1 a2
⋅
L3a 3 b⋅+( )⋅:= R2_1 6.5kN= Reaction @ Top
Moment
M1_1P1 a⋅ b2
⋅
L2−:= M1_1 15.2− kN m⋅= Moment @ Bottom
M2_1P1 a2
⋅ b⋅
L2−:= M2_1 3.0− kN m⋅=
273

Appendix G
P3MpM Ma_1− Ma_2−
a b⋅L⋅:= P3 50.7 kN= When Ma reaches Mp
Reactions
R1_3P3 b⋅
L:= R1_3 42.2 kN= Reaction @ Bottom
R2_3P3 a⋅
L:= R2_3 8.4kN= Reaction @ Top
Moment
Ma_3P3 a⋅ b⋅
L:= Ma_3 10.6 kN m⋅= Moment @ Top
Deflection
wa_3P3 a2
⋅ b2
3 EI⋅ L⋅:= wa_3 0.6mm= Deflection @ Load Point
Reactions
R1_2P2 b2
⋅
2 L3⋅
a 2 L⋅+( )⋅:= R1_2 75.3 kN= Reaction @ Bottom
R2_2P2 a⋅
2 L3⋅
3 L2⋅ a2
−( ):= R2_2 24.8 kN= Reaction @ Top
Moment
M2_2P2 a⋅ b⋅
2 L2⋅
− a L+( )⋅:= M2_2 12.2− kN m⋅= Moment @ Top
Ma_2 R1_2 a⋅:= Ma_2 18.8 kN m⋅= Moment @ Load Point
Deflection
wa_2P2 a2
⋅ b3⋅
12 EI⋅ L3⋅
3 L⋅ a+( )⋅:= wa_2 0.8mm= Deflection @ Load Point
Step 3: Forming Last Plastic Hinge
Maximum Force
274

Appendix G
w''a 1.6mm=w''a wa_1 wa_2+ wa_3+:=
R''2 39.7 kN=R''2 R2_1 R2_2+ R2_3+:=
R''1 198.7 kN=R''1 R1_1 R1_2+ R1_3+:=
P'' 238.4 kN=P'' P1 P2+ P3+:=
Step 3:
w'a 1.0mm=w'a wa_1 wa_2+:=
R'2 31.3 kN=R'2 R2_1 R2_2+:=
R'1 156.4 kN=R'1 R1_1 R1_2+:=
P' 187.7 kN=P' P1 P2+:=
Step 2:
wa 0.2mm=wa wa_1:=
R2 6.5kN=R2 R2_1:=
R1 81.1 kN=R1 R1_1:=
P1 87.6 kN=P P1:=
Step 1:
Summary
275


APPENDIX H SIMPLIFIED BLAST ANALYSES OF RC COLUMN TESTS
This appendix provides details on the simplified analyses of the RC columns for Test 1 and Test
2 to calculate the maximum deformations of the columns under blast loading. The maximum
deformations were obtained using an equivalent SDOF system and energy conservation. The
maximum deformation and plastic rotation at base respectively resulted in 19.2 mm and 4.4 deg
for Test 1 and 9.5 mm and 2.2 deg for Test 2.
277
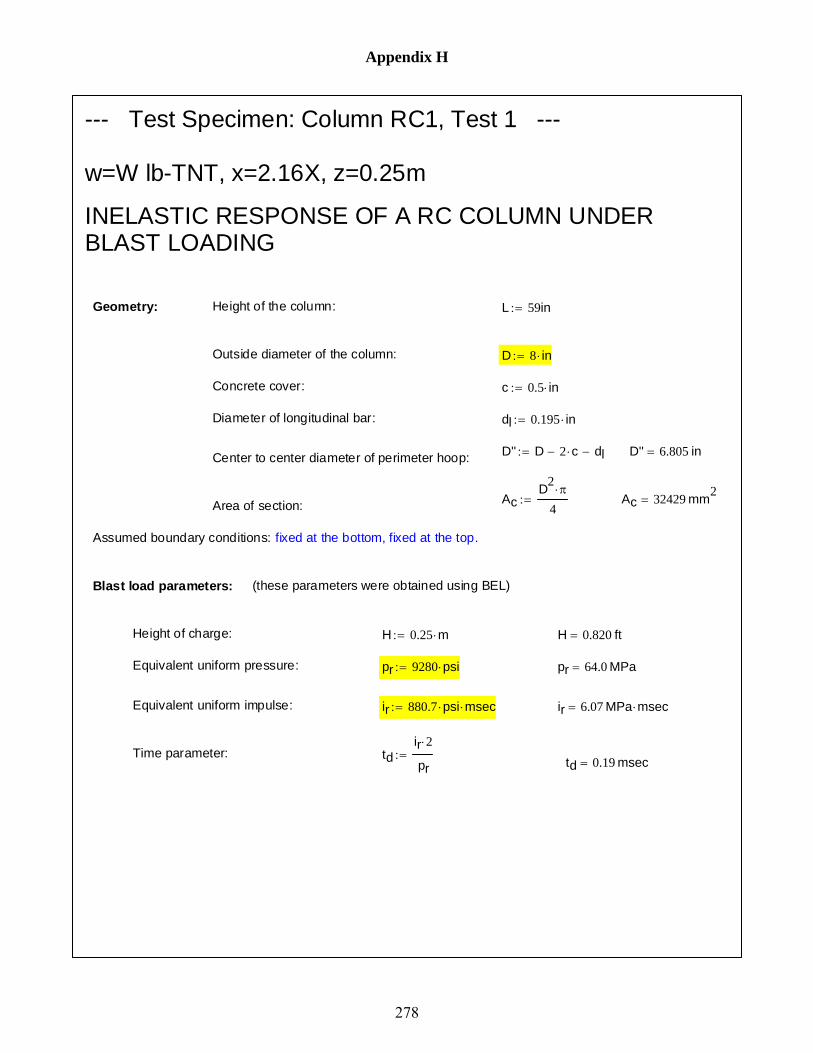
Appendix H
Assumed boundary conditions: fixed at the bottom, fixed at the top.
Blast load parameters: (these parameters were obtained using BEL)
Height of charge: H 0.25 m⋅:= H 0.820 ft=
Equivalent uniform pressure: pr 9280 psi⋅:= pr 64.0 MPa=
Equivalent uniform impulse: ir 880.7 psi⋅ msec⋅:= ir 6.07 MPa msec⋅=
Time parameter: tdir 2⋅
pr:= td 0.19 msec=
--- Test Specimen: Column RC1, Test 1 ---
w=W lb-TNT, x=2.16X, z=0.25m
INELASTIC RESPONSE OF A RC COLUMN UNDER BLAST LOADING
Geometry: Height of the column: L 59in:=
Outside diameter of the column: D 8 in⋅:=
Concrete cover: c 0.5 in⋅:=
Diameter of longitudinal bar: dl 0.195 in⋅:=
D'' D 2 c⋅− dl−:= D'' 6.805 in=Center to center diameter of perimeter hoop:
AcD2
π⋅
4:= Ac 32429 mm2
=Area of section:
278

Appendix H
ru28.8 Mp⋅
L2:= ru 180
kNm
=
Deflection at yielding: XEruKE
:= XE 6.4mm=
Shape factor of circular column: β 0.450:=
Impulse per unit length: i β D⋅ ir⋅:=
Inelastic deformation demand: Xdi2
2 KLM⋅ mass⋅ ru⋅
XE2
+:= Xd 19.2 mm=
Xd XE− 12.9 mm=
Plastic rotation:θ atan
XdH
⎛⎜⎝
⎞⎟⎠
:= θ 0.077 rad= θ 4.4deg=
Inelastic deformation of the column:
Moment curvature Analysis of RC column:(using XTRACT)
Plastic moment Capacity: Mp 124.0 kip⋅ in⋅:= Mp 14.01 kN m⋅=
Equivalent flexural stiffness: EIe 161600 kip⋅ in2⋅:= EIe 464 kN m2
⋅=
Inelastic deformation:
Equivalent elastic stiffness per unit length: KE307 EIe⋅
L4:= KE 28229
kN
m2=
Load - mass factor: KLM 0.66:=
Mass per unit length: mass Ac 2500⋅kg
m3⋅:= mass 81
kgm
=
Ultimate resistance per unit length:
279

Appendix H
Area of section:
Assumed boundary conditions: fixed at the bottom, fixed at the top.
Blast load parameters: (these parameters were obtained using BEL)
Height of charge: H 0.25 m⋅:=
Equivalent uniform pressure: pr 5438 psi⋅:= pr 37.5 MPa=
Equivalent uniform impulse: ir 552 psi⋅ msec⋅:= ir 3.81 MPa msec⋅=
Time parameter: tdir 2⋅
pr:= td 0.20 msec=
--- Test Specimen: Column RC2, Test 2 ---
w=W lb-TNT, x=3.25X, z=0.25m
INELASTIC RESPONSE OF A RC COLUMN UNDER BLAST LOADING
Geometry: Height of the column: L 59in:=
Outside diameter of the column: D 8 in⋅:=
Concrete cover: c 0.5 in⋅:=
Diameter of longitudinal bar: dl 0.195 in⋅:=
D'' D 2 c⋅− dl−:= D'' 6.805 in=Center to center diameter of perimeter hoop:
AcD2
π⋅
4:= Ac 32429 mm2
=
280

Appendix H
Ultimate resistance per unit length: ru28.8 Mp⋅
L2:= ru 180
kNm
=
Deflection at yielding: XEruKE
:= XE 6.4mm=
Shape factor of circular column: β 0.450:=
Impulse per unit length: i β D⋅ ir⋅:=
Inelastic deformation demand: Xdi2
2 KLM⋅ mass⋅ ru⋅
XE2
+:= Xd 9.5mm=
Xd XE− 3.1mm=
Plastic rotation:θ atan
XdH
⎛⎜⎝
⎞⎟⎠
:= θ 0.038 rad= θ 2.2deg=
Inelastic deformation of the column:
Moment curvature Analysis of RC column:(using XTRACT)
Plastic moment Capacity: Mp 124.0 kip⋅ in⋅:= Mp 14.01 kN m⋅=
Equivalent flexural stiffness: EIe 161600 kip⋅ in2⋅:= EIe 464 kN m2
⋅=
Inelastic deformation:
Equivalent elastic stiffness per unit length: KE307 EIe⋅
L4:= KE 28229
kN
m2=
Load - mass factor: KLM 0.66:=
Mass per unit length: mass Ac 2500⋅kg
m3⋅:= mass 81
kgm
=
281


APPENDIX I CYLCIC ANALYSIS TEST SETUP AND HYSTERESIS LOOPS
FOR FIBER-BASED MODEL VERIFICATION
This appendix provides details on the cyclic analysis test setups and hysteresis loops for fiber-
based analysis verification. Figures I-1 to I-6 show the test setups and the hysteresis loops
experimentally obtained for CFST-34, CFST-42, RC-TP60, RC-Unit9, SJ-Unit4, and SJ-CR2
Column, respectively.
283

(a) Specimen
(b) Hysteresis Loops
Figure I-1 Specimen and Hysteresis Loops for CFST-34 (Marson and Bruneau 2004)
(a) Specimen
(b) Hysteresis Loops
Figure I-2 Specimen and Hysteresis Loops for CFST-34 (Marson and Bruneau 2004)
284
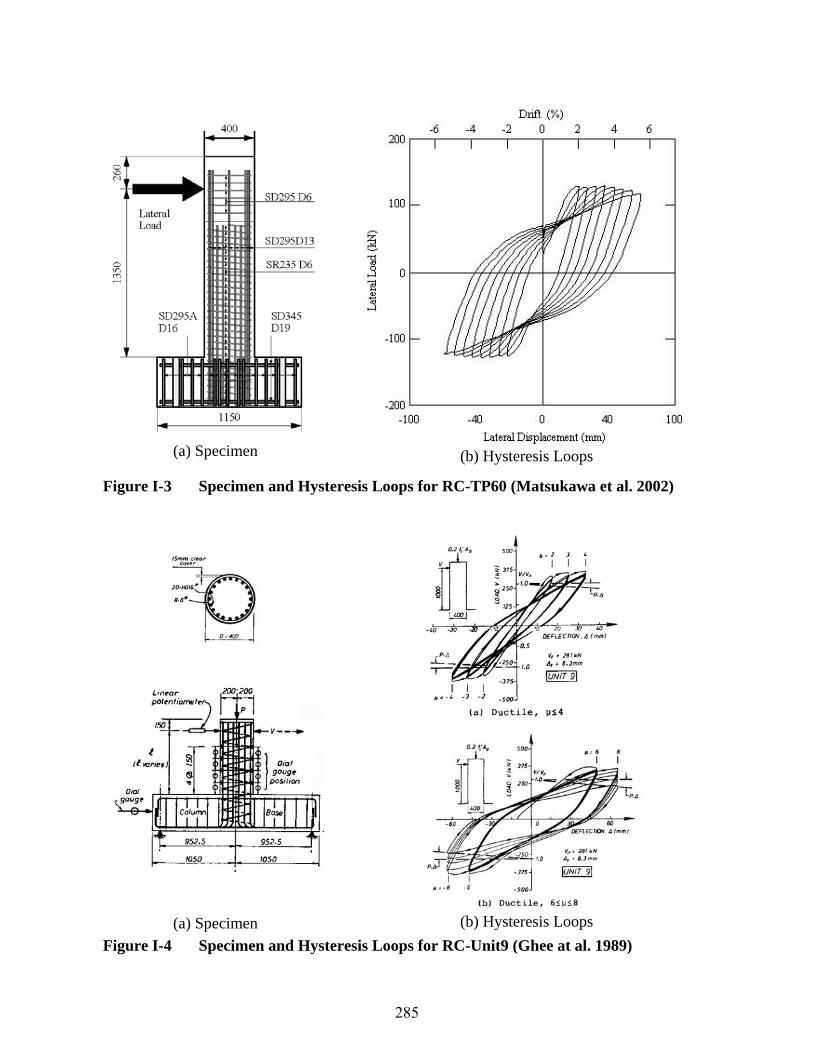
(a) Specimen
(b) Hysteresis Loops
Figure I-3 Specimen and Hysteresis Loops for RC-TP60 (Matsukawa et al. 2002)
(a) Specimen
(b) Hysteresis Loops
Figure I-4 Specimen and Hysteresis Loops for RC-Unit9 (Ghee at al. 1989)
285

(a) Specimen
(b) Hysteresis Loops
Figure I-5 Specimen and Hysteresis Loops for SJ-Unit4 (Chai et al. 1991)
(a) Specimen
(b) Hysteresis Loops
Figure I-6 Specimen and Hysteresis Loops for SJ-CR2 (Priestley et al. 1994a, 1994b)
286

287
MCEER Technical Reports
MCEER publishes technical reports on a variety of subjects written by authors funded through MCEER. These reports are available from both MCEER Publications and the National Technical Information Service (NTIS). Requests for reports should be directed to MCEER Publications, MCEER, University at Buffalo, State University of New York, Red Jacket Quadrangle, Buffalo, New York 14261. Reports can also be requested through NTIS, 5285 Port Royal Road, Springfield, Virginia 22161. NTIS accession numbers are shown in parenthesis, if available. NCEER-87-0001 "First-Year Program in Research, Education and Technology Transfer," 3/5/87, (PB88-134275, A04, MF-
A01). NCEER-87-0002 "Experimental Evaluation of Instantaneous Optimal Algorithms for Structural Control," by R.C. Lin, T.T.
Soong and A.M. Reinhorn, 4/20/87, (PB88-134341, A04, MF-A01). NCEER-87-0003 "Experimentation Using the Earthquake Simulation Facilities at University at Buffalo," by A.M. Reinhorn
and R.L. Ketter, to be published. NCEER-87-0004 "The System Characteristics and Performance of a Shaking Table," by J.S. Hwang, K.C. Chang and G.C.
Lee, 6/1/87, (PB88-134259, A03, MF-A01). This report is available only through NTIS (see address given above).
NCEER-87-0005 "A Finite Element Formulation for Nonlinear Viscoplastic Material Using a Q Model," by O. Gyebi and G.
Dasgupta, 11/2/87, (PB88-213764, A08, MF-A01). NCEER-87-0006 "Symbolic Manipulation Program (SMP) - Algebraic Codes for Two and Three Dimensional Finite Element
Formulations," by X. Lee and G. Dasgupta, 11/9/87, (PB88-218522, A05, MF-A01). NCEER-87-0007 "Instantaneous Optimal Control Laws for Tall Buildings Under Seismic Excitations," by J.N. Yang, A.
Akbarpour and P. Ghaemmaghami, 6/10/87, (PB88-134333, A06, MF-A01). This report is only available through NTIS (see address given above).
NCEER-87-0008 "IDARC: Inelastic Damage Analysis of Reinforced Concrete Frame - Shear-Wall Structures," by Y.J. Park,
A.M. Reinhorn and S.K. Kunnath, 7/20/87, (PB88-134325, A09, MF-A01). This report is only available through NTIS (see address given above).
NCEER-87-0009 "Liquefaction Potential for New York State: A Preliminary Report on Sites in Manhattan and Buffalo," by
M. Budhu, V. Vijayakumar, R.F. Giese and L. Baumgras, 8/31/87, (PB88-163704, A03, MF-A01). This report is available only through NTIS (see address given above).
NCEER-87-0010 "Vertical and Torsional Vibration of Foundations in Inhomogeneous Media," by A.S. Veletsos and K.W.
Dotson, 6/1/87, (PB88-134291, A03, MF-A01). This report is only available through NTIS (see address given above).
NCEER-87-0011 "Seismic Probabilistic Risk Assessment and Seismic Margins Studies for Nuclear Power Plants," by Howard
H.M. Hwang, 6/15/87, (PB88-134267, A03, MF-A01). This report is only available through NTIS (see address given above).
NCEER-87-0012 "Parametric Studies of Frequency Response of Secondary Systems Under Ground-Acceleration Excitations,"
by Y. Yong and Y.K. Lin, 6/10/87, (PB88-134309, A03, MF-A01). This report is only available through NTIS (see address given above).
NCEER-87-0013 "Frequency Response of Secondary Systems Under Seismic Excitation," by J.A. HoLung, J. Cai and Y.K.
Lin, 7/31/87, (PB88-134317, A05, MF-A01). This report is only available through NTIS (see address given above).
NCEER-87-0014 "Modelling Earthquake Ground Motions in Seismically Active Regions Using Parametric Time Series
Methods," by G.W. Ellis and A.S. Cakmak, 8/25/87, (PB88-134283, A08, MF-A01). This report is only available through NTIS (see address given above).
NCEER-87-0015 "Detection and Assessment of Seismic Structural Damage," by E. DiPasquale and A.S. Cakmak, 8/25/87,
(PB88-163712, A05, MF-A01). This report is only available through NTIS (see address given above).

288
NCEER-87-0016 "Pipeline Experiment at Parkfield, California," by J. Isenberg and E. Richardson, 9/15/87, (PB88-163720,
A03, MF-A01). This report is available only through NTIS (see address given above). NCEER-87-0017 "Digital Simulation of Seismic Ground Motion," by M. Shinozuka, G. Deodatis and T. Harada, 8/31/87,
(PB88-155197, A04, MF-A01). This report is available only through NTIS (see address given above). NCEER-87-0018 "Practical Considerations for Structural Control: System Uncertainty, System Time Delay and Truncation of
Small Control Forces," J.N. Yang and A. Akbarpour, 8/10/87, (PB88-163738, A08, MF-A01). This report is only available through NTIS (see address given above).
NCEER-87-0019 "Modal Analysis of Nonclassically Damped Structural Systems Using Canonical Transformation," by J.N.
Yang, S. Sarkani and F.X. Long, 9/27/87, (PB88-187851, A04, MF-A01). NCEER-87-0020 "A Nonstationary Solution in Random Vibration Theory," by J.R. Red-Horse and P.D. Spanos, 11/3/87,
(PB88-163746, A03, MF-A01). NCEER-87-0021 "Horizontal Impedances for Radially Inhomogeneous Viscoelastic Soil Layers," by A.S. Veletsos and K.W.
Dotson, 10/15/87, (PB88-150859, A04, MF-A01). NCEER-87-0022 "Seismic Damage Assessment of Reinforced Concrete Members," by Y.S. Chung, C. Meyer and M.
Shinozuka, 10/9/87, (PB88-150867, A05, MF-A01). This report is available only through NTIS (see address given above).
NCEER-87-0023 "Active Structural Control in Civil Engineering," by T.T. Soong, 11/11/87, (PB88-187778, A03, MF-A01). NCEER-87-0024 "Vertical and Torsional Impedances for Radially Inhomogeneous Viscoelastic Soil Layers," by K.W. Dotson
and A.S. Veletsos, 12/87, (PB88-187786, A03, MF-A01). NCEER-87-0025 "Proceedings from the Symposium on Seismic Hazards, Ground Motions, Soil-Liquefaction and Engineering
Practice in Eastern North America," October 20-22, 1987, edited by K.H. Jacob, 12/87, (PB88-188115, A23, MF-A01). This report is available only through NTIS (see address given above).
NCEER-87-0026 "Report on the Whittier-Narrows, California, Earthquake of October 1, 1987," by J. Pantelic and A.
Reinhorn, 11/87, (PB88-187752, A03, MF-A01). This report is available only through NTIS (see address given above).
NCEER-87-0027 "Design of a Modular Program for Transient Nonlinear Analysis of Large 3-D Building Structures," by S.
Srivastav and J.F. Abel, 12/30/87, (PB88-187950, A05, MF-A01). This report is only available through NTIS (see address given above).
NCEER-87-0028 "Second-Year Program in Research, Education and Technology Transfer," 3/8/88, (PB88-219480, A04, MF-
A01). NCEER-88-0001 "Workshop on Seismic Computer Analysis and Design of Buildings With Interactive Graphics," by W.
McGuire, J.F. Abel and C.H. Conley, 1/18/88, (PB88-187760, A03, MF-A01). This report is only available through NTIS (see address given above).
NCEER-88-0002 "Optimal Control of Nonlinear Flexible Structures," by J.N. Yang, F.X. Long and D. Wong, 1/22/88, (PB88-
213772, A06, MF-A01). NCEER-88-0003 "Substructuring Techniques in the Time Domain for Primary-Secondary Structural Systems," by G.D.
Manolis and G. Juhn, 2/10/88, (PB88-213780, A04, MF-A01). NCEER-88-0004 "Iterative Seismic Analysis of Primary-Secondary Systems," by A. Singhal, L.D. Lutes and P.D. Spanos,
2/23/88, (PB88-213798, A04, MF-A01). NCEER-88-0005 "Stochastic Finite Element Expansion for Random Media," by P.D. Spanos and R. Ghanem, 3/14/88, (PB88-
213806, A03, MF-A01).

289
NCEER-88-0006 "Combining Structural Optimization and Structural Control," by F.Y. Cheng and C.P. Pantelides, 1/10/88, (PB88-213814, A05, MF-A01).
NCEER-88-0007 "Seismic Performance Assessment of Code-Designed Structures," by H.H-M. Hwang, J-W. Jaw and H-J.
Shau, 3/20/88, (PB88-219423, A04, MF-A01). This report is only available through NTIS (see address given above).
NCEER-88-0008 "Reliability Analysis of Code-Designed Structures Under Natural Hazards," by H.H-M. Hwang, H. Ushiba
and M. Shinozuka, 2/29/88, (PB88-229471, A07, MF-A01). This report is only available through NTIS (see address given above).
NCEER-88-0009 "Seismic Fragility Analysis of Shear Wall Structures," by J-W Jaw and H.H-M. Hwang, 4/30/88, (PB89-
102867, A04, MF-A01). NCEER-88-0010 "Base Isolation of a Multi-Story Building Under a Harmonic Ground Motion - A Comparison of
Performances of Various Systems," by F-G Fan, G. Ahmadi and I.G. Tadjbakhsh, 5/18/88, (PB89-122238, A06, MF-A01). This report is only available through NTIS (see address given above).
NCEER-88-0011 "Seismic Floor Response Spectra for a Combined System by Green's Functions," by F.M. Lavelle, L.A.
Bergman and P.D. Spanos, 5/1/88, (PB89-102875, A03, MF-A01). NCEER-88-0012 "A New Solution Technique for Randomly Excited Hysteretic Structures," by G.Q. Cai and Y.K. Lin,
5/16/88, (PB89-102883, A03, MF-A01). NCEER-88-0013 "A Study of Radiation Damping and Soil-Structure Interaction Effects in the Centrifuge," by K. Weissman,
supervised by J.H. Prevost, 5/24/88, (PB89-144703, A06, MF-A01). NCEER-88-0014 "Parameter Identification and Implementation of a Kinematic Plasticity Model for Frictional Soils," by J.H.
Prevost and D.V. Griffiths, to be published. NCEER-88-0015 "Two- and Three- Dimensional Dynamic Finite Element Analyses of the Long Valley Dam," by D.V.
Griffiths and J.H. Prevost, 6/17/88, (PB89-144711, A04, MF-A01). NCEER-88-0016 "Damage Assessment of Reinforced Concrete Structures in Eastern United States," by A.M. Reinhorn, M.J.
Seidel, S.K. Kunnath and Y.J. Park, 6/15/88, (PB89-122220, A04, MF-A01). This report is only available through NTIS (see address given above).
NCEER-88-0017 "Dynamic Compliance of Vertically Loaded Strip Foundations in Multilayered Viscoelastic Soils," by S.
Ahmad and A.S.M. Israil, 6/17/88, (PB89-102891, A04, MF-A01). NCEER-88-0018 "An Experimental Study of Seismic Structural Response With Added Viscoelastic Dampers," by R.C. Lin, Z.
Liang, T.T. Soong and R.H. Zhang, 6/30/88, (PB89-122212, A05, MF-A01). This report is available only through NTIS (see address given above).
NCEER-88-0019 "Experimental Investigation of Primary - Secondary System Interaction," by G.D. Manolis, G. Juhn and
A.M. Reinhorn, 5/27/88, (PB89-122204, A04, MF-A01). NCEER-88-0020 "A Response Spectrum Approach For Analysis of Nonclassically Damped Structures," by J.N. Yang, S.
Sarkani and F.X. Long, 4/22/88, (PB89-102909, A04, MF-A01). NCEER-88-0021 "Seismic Interaction of Structures and Soils: Stochastic Approach," by A.S. Veletsos and A.M. Prasad,
7/21/88, (PB89-122196, A04, MF-A01). This report is only available through NTIS (see address given above).
NCEER-88-0022 "Identification of the Serviceability Limit State and Detection of Seismic Structural Damage," by E.
DiPasquale and A.S. Cakmak, 6/15/88, (PB89-122188, A05, MF-A01). This report is available only through NTIS (see address given above).
NCEER-88-0023 "Multi-Hazard Risk Analysis: Case of a Simple Offshore Structure," by B.K. Bhartia and E.H. Vanmarcke,
7/21/88, (PB89-145213, A05, MF-A01).

290
NCEER-88-0024 "Automated Seismic Design of Reinforced Concrete Buildings," by Y.S. Chung, C. Meyer and M. Shinozuka, 7/5/88, (PB89-122170, A06, MF-A01). This report is available only through NTIS (see address given above).
NCEER-88-0025 "Experimental Study of Active Control of MDOF Structures Under Seismic Excitations," by L.L. Chung,
R.C. Lin, T.T. Soong and A.M. Reinhorn, 7/10/88, (PB89-122600, A04, MF-A01). NCEER-88-0026 "Earthquake Simulation Tests of a Low-Rise Metal Structure," by J.S. Hwang, K.C. Chang, G.C. Lee and
R.L. Ketter, 8/1/88, (PB89-102917, A04, MF-A01). NCEER-88-0027 "Systems Study of Urban Response and Reconstruction Due to Catastrophic Earthquakes," by F. Kozin and
H.K. Zhou, 9/22/88, (PB90-162348, A04, MF-A01). NCEER-88-0028 "Seismic Fragility Analysis of Plane Frame Structures," by H.H-M. Hwang and Y.K. Low, 7/31/88, (PB89-
131445, A06, MF-A01). NCEER-88-0029 "Response Analysis of Stochastic Structures," by A. Kardara, C. Bucher and M. Shinozuka, 9/22/88, (PB89-
174429, A04, MF-A01). NCEER-88-0030 "Nonnormal Accelerations Due to Yielding in a Primary Structure," by D.C.K. Chen and L.D. Lutes,
9/19/88, (PB89-131437, A04, MF-A01). NCEER-88-0031 "Design Approaches for Soil-Structure Interaction," by A.S. Veletsos, A.M. Prasad and Y. Tang, 12/30/88,
(PB89-174437, A03, MF-A01). This report is available only through NTIS (see address given above). NCEER-88-0032 "A Re-evaluation of Design Spectra for Seismic Damage Control," by C.J. Turkstra and A.G. Tallin, 11/7/88,
(PB89-145221, A05, MF-A01). NCEER-88-0033 "The Behavior and Design of Noncontact Lap Splices Subjected to Repeated Inelastic Tensile Loading," by
V.E. Sagan, P. Gergely and R.N. White, 12/8/88, (PB89-163737, A08, MF-A01). NCEER-88-0034 "Seismic Response of Pile Foundations," by S.M. Mamoon, P.K. Banerjee and S. Ahmad, 11/1/88, (PB89-
145239, A04, MF-A01). NCEER-88-0035 "Modeling of R/C Building Structures With Flexible Floor Diaphragms (IDARC2)," by A.M. Reinhorn, S.K.
Kunnath and N. Panahshahi, 9/7/88, (PB89-207153, A07, MF-A01). NCEER-88-0036 "Solution of the Dam-Reservoir Interaction Problem Using a Combination of FEM, BEM with Particular
Integrals, Modal Analysis, and Substructuring," by C-S. Tsai, G.C. Lee and R.L. Ketter, 12/31/88, (PB89-207146, A04, MF-A01).
NCEER-88-0037 "Optimal Placement of Actuators for Structural Control," by F.Y. Cheng and C.P. Pantelides, 8/15/88,
(PB89-162846, A05, MF-A01). NCEER-88-0038 "Teflon Bearings in Aseismic Base Isolation: Experimental Studies and Mathematical Modeling," by A.
Mokha, M.C. Constantinou and A.M. Reinhorn, 12/5/88, (PB89-218457, A10, MF-A01). This report is available only through NTIS (see address given above).
NCEER-88-0039 "Seismic Behavior of Flat Slab High-Rise Buildings in the New York City Area," by P. Weidlinger and M.
Ettouney, 10/15/88, (PB90-145681, A04, MF-A01). NCEER-88-0040 "Evaluation of the Earthquake Resistance of Existing Buildings in New York City," by P. Weidlinger and M.
Ettouney, 10/15/88, to be published. NCEER-88-0041 "Small-Scale Modeling Techniques for Reinforced Concrete Structures Subjected to Seismic Loads," by W.
Kim, A. El-Attar and R.N. White, 11/22/88, (PB89-189625, A05, MF-A01). NCEER-88-0042 "Modeling Strong Ground Motion from Multiple Event Earthquakes," by G.W. Ellis and A.S. Cakmak,
10/15/88, (PB89-174445, A03, MF-A01).
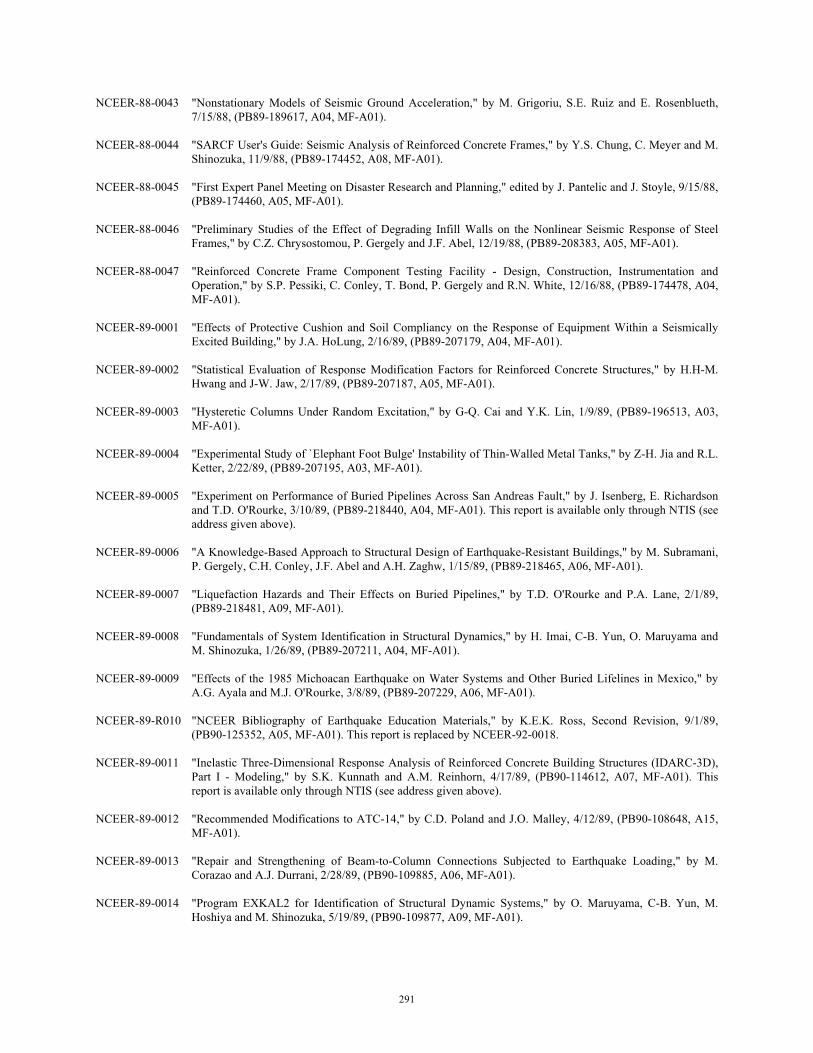
291
NCEER-88-0043 "Nonstationary Models of Seismic Ground Acceleration," by M. Grigoriu, S.E. Ruiz and E. Rosenblueth, 7/15/88, (PB89-189617, A04, MF-A01).
NCEER-88-0044 "SARCF User's Guide: Seismic Analysis of Reinforced Concrete Frames," by Y.S. Chung, C. Meyer and M.
Shinozuka, 11/9/88, (PB89-174452, A08, MF-A01). NCEER-88-0045 "First Expert Panel Meeting on Disaster Research and Planning," edited by J. Pantelic and J. Stoyle, 9/15/88,
(PB89-174460, A05, MF-A01). NCEER-88-0046 "Preliminary Studies of the Effect of Degrading Infill Walls on the Nonlinear Seismic Response of Steel
Frames," by C.Z. Chrysostomou, P. Gergely and J.F. Abel, 12/19/88, (PB89-208383, A05, MF-A01). NCEER-88-0047 "Reinforced Concrete Frame Component Testing Facility - Design, Construction, Instrumentation and
Operation," by S.P. Pessiki, C. Conley, T. Bond, P. Gergely and R.N. White, 12/16/88, (PB89-174478, A04, MF-A01).
NCEER-89-0001 "Effects of Protective Cushion and Soil Compliancy on the Response of Equipment Within a Seismically
Excited Building," by J.A. HoLung, 2/16/89, (PB89-207179, A04, MF-A01). NCEER-89-0002 "Statistical Evaluation of Response Modification Factors for Reinforced Concrete Structures," by H.H-M.
Hwang and J-W. Jaw, 2/17/89, (PB89-207187, A05, MF-A01). NCEER-89-0003 "Hysteretic Columns Under Random Excitation," by G-Q. Cai and Y.K. Lin, 1/9/89, (PB89-196513, A03,
MF-A01). NCEER-89-0004 "Experimental Study of `Elephant Foot Bulge' Instability of Thin-Walled Metal Tanks," by Z-H. Jia and R.L.
Ketter, 2/22/89, (PB89-207195, A03, MF-A01). NCEER-89-0005 "Experiment on Performance of Buried Pipelines Across San Andreas Fault," by J. Isenberg, E. Richardson
and T.D. O'Rourke, 3/10/89, (PB89-218440, A04, MF-A01). This report is available only through NTIS (see address given above).
NCEER-89-0006 "A Knowledge-Based Approach to Structural Design of Earthquake-Resistant Buildings," by M. Subramani,
P. Gergely, C.H. Conley, J.F. Abel and A.H. Zaghw, 1/15/89, (PB89-218465, A06, MF-A01). NCEER-89-0007 "Liquefaction Hazards and Their Effects on Buried Pipelines," by T.D. O'Rourke and P.A. Lane, 2/1/89,
(PB89-218481, A09, MF-A01). NCEER-89-0008 "Fundamentals of System Identification in Structural Dynamics," by H. Imai, C-B. Yun, O. Maruyama and
M. Shinozuka, 1/26/89, (PB89-207211, A04, MF-A01). NCEER-89-0009 "Effects of the 1985 Michoacan Earthquake on Water Systems and Other Buried Lifelines in Mexico," by
A.G. Ayala and M.J. O'Rourke, 3/8/89, (PB89-207229, A06, MF-A01). NCEER-89-R010 "NCEER Bibliography of Earthquake Education Materials," by K.E.K. Ross, Second Revision, 9/1/89,
(PB90-125352, A05, MF-A01). This report is replaced by NCEER-92-0018. NCEER-89-0011 "Inelastic Three-Dimensional Response Analysis of Reinforced Concrete Building Structures (IDARC-3D),
Part I - Modeling," by S.K. Kunnath and A.M. Reinhorn, 4/17/89, (PB90-114612, A07, MF-A01). This report is available only through NTIS (see address given above).
NCEER-89-0012 "Recommended Modifications to ATC-14," by C.D. Poland and J.O. Malley, 4/12/89, (PB90-108648, A15,
MF-A01). NCEER-89-0013 "Repair and Strengthening of Beam-to-Column Connections Subjected to Earthquake Loading," by M.
Corazao and A.J. Durrani, 2/28/89, (PB90-109885, A06, MF-A01). NCEER-89-0014 "Program EXKAL2 for Identification of Structural Dynamic Systems," by O. Maruyama, C-B. Yun, M.
Hoshiya and M. Shinozuka, 5/19/89, (PB90-109877, A09, MF-A01).

292
NCEER-89-0015 "Response of Frames With Bolted Semi-Rigid Connections, Part I - Experimental Study and Analytical Predictions," by P.J. DiCorso, A.M. Reinhorn, J.R. Dickerson, J.B. Radziminski and W.L. Harper, 6/1/89, to be published.
NCEER-89-0016 "ARMA Monte Carlo Simulation in Probabilistic Structural Analysis," by P.D. Spanos and M.P. Mignolet,
7/10/89, (PB90-109893, A03, MF-A01). NCEER-89-P017 "Preliminary Proceedings from the Conference on Disaster Preparedness - The Place of Earthquake
Education in Our Schools," Edited by K.E.K. Ross, 6/23/89, (PB90-108606, A03, MF-A01). NCEER-89-0017 "Proceedings from the Conference on Disaster Preparedness - The Place of Earthquake Education in Our
Schools," Edited by K.E.K. Ross, 12/31/89, (PB90-207895, A012, MF-A02). This report is available only through NTIS (see address given above).
NCEER-89-0018 "Multidimensional Models of Hysteretic Material Behavior for Vibration Analysis of Shape Memory Energy
Absorbing Devices, by E.J. Graesser and F.A. Cozzarelli, 6/7/89, (PB90-164146, A04, MF-A01). NCEER-89-0019 "Nonlinear Dynamic Analysis of Three-Dimensional Base Isolated Structures (3D-BASIS)," by S.
Nagarajaiah, A.M. Reinhorn and M.C. Constantinou, 8/3/89, (PB90-161936, A06, MF-A01). This report has been replaced by NCEER-93-0011.
NCEER-89-0020 "Structural Control Considering Time-Rate of Control Forces and Control Rate Constraints," by F.Y. Cheng
and C.P. Pantelides, 8/3/89, (PB90-120445, A04, MF-A01). NCEER-89-0021 "Subsurface Conditions of Memphis and Shelby County," by K.W. Ng, T-S. Chang and H-H.M. Hwang,
7/26/89, (PB90-120437, A03, MF-A01). NCEER-89-0022 "Seismic Wave Propagation Effects on Straight Jointed Buried Pipelines," by K. Elhmadi and M.J. O'Rourke,
8/24/89, (PB90-162322, A10, MF-A02). NCEER-89-0023 "Workshop on Serviceability Analysis of Water Delivery Systems," edited by M. Grigoriu, 3/6/89, (PB90-
127424, A03, MF-A01). NCEER-89-0024 "Shaking Table Study of a 1/5 Scale Steel Frame Composed of Tapered Members," by K.C. Chang, J.S.
Hwang and G.C. Lee, 9/18/89, (PB90-160169, A04, MF-A01). NCEER-89-0025 "DYNA1D: A Computer Program for Nonlinear Seismic Site Response Analysis - Technical
Documentation," by Jean H. Prevost, 9/14/89, (PB90-161944, A07, MF-A01). This report is available only through NTIS (see address given above).
NCEER-89-0026 "1:4 Scale Model Studies of Active Tendon Systems and Active Mass Dampers for Aseismic Protection," by
A.M. Reinhorn, T.T. Soong, R.C. Lin, Y.P. Yang, Y. Fukao, H. Abe and M. Nakai, 9/15/89, (PB90-173246, A10, MF-A02). This report is available only through NTIS (see address given above).
NCEER-89-0027 "Scattering of Waves by Inclusions in a Nonhomogeneous Elastic Half Space Solved by Boundary Element
Methods," by P.K. Hadley, A. Askar and A.S. Cakmak, 6/15/89, (PB90-145699, A07, MF-A01). NCEER-89-0028 "Statistical Evaluation of Deflection Amplification Factors for Reinforced Concrete Structures," by H.H.M.
Hwang, J-W. Jaw and A.L. Ch'ng, 8/31/89, (PB90-164633, A05, MF-A01). NCEER-89-0029 "Bedrock Accelerations in Memphis Area Due to Large New Madrid Earthquakes," by H.H.M. Hwang,
C.H.S. Chen and G. Yu, 11/7/89, (PB90-162330, A04, MF-A01). NCEER-89-0030 "Seismic Behavior and Response Sensitivity of Secondary Structural Systems," by Y.Q. Chen and T.T.
Soong, 10/23/89, (PB90-164658, A08, MF-A01). NCEER-89-0031 "Random Vibration and Reliability Analysis of Primary-Secondary Structural Systems," by Y. Ibrahim, M.
Grigoriu and T.T. Soong, 11/10/89, (PB90-161951, A04, MF-A01).

293
NCEER-89-0032 "Proceedings from the Second U.S. - Japan Workshop on Liquefaction, Large Ground Deformation and Their Effects on Lifelines, September 26-29, 1989," Edited by T.D. O'Rourke and M. Hamada, 12/1/89, (PB90-209388, A22, MF-A03).
NCEER-89-0033 "Deterministic Model for Seismic Damage Evaluation of Reinforced Concrete Structures," by J.M. Bracci,
A.M. Reinhorn, J.B. Mander and S.K. Kunnath, 9/27/89, (PB91-108803, A06, MF-A01). NCEER-89-0034 "On the Relation Between Local and Global Damage Indices," by E. DiPasquale and A.S. Cakmak, 8/15/89,
(PB90-173865, A05, MF-A01). NCEER-89-0035 "Cyclic Undrained Behavior of Nonplastic and Low Plasticity Silts," by A.J. Walker and H.E. Stewart,
7/26/89, (PB90-183518, A10, MF-A01). NCEER-89-0036 "Liquefaction Potential of Surficial Deposits in the City of Buffalo, New York," by M. Budhu, R. Giese and
L. Baumgrass, 1/17/89, (PB90-208455, A04, MF-A01). NCEER-89-0037 "A Deterministic Assessment of Effects of Ground Motion Incoherence," by A.S. Veletsos and Y. Tang,
7/15/89, (PB90-164294, A03, MF-A01). NCEER-89-0038 "Workshop on Ground Motion Parameters for Seismic Hazard Mapping," July 17-18, 1989, edited by R.V.
Whitman, 12/1/89, (PB90-173923, A04, MF-A01). NCEER-89-0039 "Seismic Effects on Elevated Transit Lines of the New York City Transit Authority," by C.J. Costantino,
C.A. Miller and E. Heymsfield, 12/26/89, (PB90-207887, A06, MF-A01). NCEER-89-0040 "Centrifugal Modeling of Dynamic Soil-Structure Interaction," by K. Weissman, Supervised by J.H. Prevost,
5/10/89, (PB90-207879, A07, MF-A01). NCEER-89-0041 "Linearized Identification of Buildings With Cores for Seismic Vulnerability Assessment," by I-K. Ho and
A.E. Aktan, 11/1/89, (PB90-251943, A07, MF-A01). NCEER-90-0001 "Geotechnical and Lifeline Aspects of the October 17, 1989 Loma Prieta Earthquake in San Francisco," by
T.D. O'Rourke, H.E. Stewart, F.T. Blackburn and T.S. Dickerman, 1/90, (PB90-208596, A05, MF-A01). NCEER-90-0002 "Nonnormal Secondary Response Due to Yielding in a Primary Structure," by D.C.K. Chen and L.D. Lutes,
2/28/90, (PB90-251976, A07, MF-A01). NCEER-90-0003 "Earthquake Education Materials for Grades K-12," by K.E.K. Ross, 4/16/90, (PB91-251984, A05, MF-
A05). This report has been replaced by NCEER-92-0018. NCEER-90-0004 "Catalog of Strong Motion Stations in Eastern North America," by R.W. Busby, 4/3/90, (PB90-251984, A05,
MF-A01). NCEER-90-0005 "NCEER Strong-Motion Data Base: A User Manual for the GeoBase Release (Version 1.0 for the Sun3)," by
P. Friberg and K. Jacob, 3/31/90 (PB90-258062, A04, MF-A01). NCEER-90-0006 "Seismic Hazard Along a Crude Oil Pipeline in the Event of an 1811-1812 Type New Madrid Earthquake,"
by H.H.M. Hwang and C-H.S. Chen, 4/16/90, (PB90-258054, A04, MF-A01). NCEER-90-0007 "Site-Specific Response Spectra for Memphis Sheahan Pumping Station," by H.H.M. Hwang and C.S. Lee,
5/15/90, (PB91-108811, A05, MF-A01). NCEER-90-0008 "Pilot Study on Seismic Vulnerability of Crude Oil Transmission Systems," by T. Ariman, R. Dobry, M.
Grigoriu, F. Kozin, M. O'Rourke, T. O'Rourke and M. Shinozuka, 5/25/90, (PB91-108837, A06, MF-A01). NCEER-90-0009 "A Program to Generate Site Dependent Time Histories: EQGEN," by G.W. Ellis, M. Srinivasan and A.S.
Cakmak, 1/30/90, (PB91-108829, A04, MF-A01). NCEER-90-0010 "Active Isolation for Seismic Protection of Operating Rooms," by M.E. Talbott, Supervised by M.
Shinozuka, 6/8/9, (PB91-110205, A05, MF-A01).

294
NCEER-90-0011 "Program LINEARID for Identification of Linear Structural Dynamic Systems," by C-B. Yun and M. Shinozuka, 6/25/90, (PB91-110312, A08, MF-A01).
NCEER-90-0012 "Two-Dimensional Two-Phase Elasto-Plastic Seismic Response of Earth Dams," by A.N. Yiagos, Supervised
by J.H. Prevost, 6/20/90, (PB91-110197, A13, MF-A02). NCEER-90-0013 "Secondary Systems in Base-Isolated Structures: Experimental Investigation, Stochastic Response and
Stochastic Sensitivity," by G.D. Manolis, G. Juhn, M.C. Constantinou and A.M. Reinhorn, 7/1/90, (PB91-110320, A08, MF-A01).
NCEER-90-0014 "Seismic Behavior of Lightly-Reinforced Concrete Column and Beam-Column Joint Details," by S.P.
Pessiki, C.H. Conley, P. Gergely and R.N. White, 8/22/90, (PB91-108795, A11, MF-A02). NCEER-90-0015 "Two Hybrid Control Systems for Building Structures Under Strong Earthquakes," by J.N. Yang and A.
Danielians, 6/29/90, (PB91-125393, A04, MF-A01). NCEER-90-0016 "Instantaneous Optimal Control with Acceleration and Velocity Feedback," by J.N. Yang and Z. Li, 6/29/90,
(PB91-125401, A03, MF-A01). NCEER-90-0017 "Reconnaissance Report on the Northern Iran Earthquake of June 21, 1990," by M. Mehrain, 10/4/90, (PB91-
125377, A03, MF-A01). NCEER-90-0018 "Evaluation of Liquefaction Potential in Memphis and Shelby County," by T.S. Chang, P.S. Tang, C.S. Lee
and H. Hwang, 8/10/90, (PB91-125427, A09, MF-A01). NCEER-90-0019 "Experimental and Analytical Study of a Combined Sliding Disc Bearing and Helical Steel Spring Isolation
System," by M.C. Constantinou, A.S. Mokha and A.M. Reinhorn, 10/4/90, (PB91-125385, A06, MF-A01). This report is available only through NTIS (see address given above).
NCEER-90-0020 "Experimental Study and Analytical Prediction of Earthquake Response of a Sliding Isolation System with a
Spherical Surface," by A.S. Mokha, M.C. Constantinou and A.M. Reinhorn, 10/11/90, (PB91-125419, A05, MF-A01).
NCEER-90-0021 "Dynamic Interaction Factors for Floating Pile Groups," by G. Gazetas, K. Fan, A. Kaynia and E. Kausel,
9/10/90, (PB91-170381, A05, MF-A01). NCEER-90-0022 "Evaluation of Seismic Damage Indices for Reinforced Concrete Structures," by S. Rodriguez-Gomez and
A.S. Cakmak, 9/30/90, PB91-171322, A06, MF-A01). NCEER-90-0023 "Study of Site Response at a Selected Memphis Site," by H. Desai, S. Ahmad, E.S. Gazetas and M.R. Oh,
10/11/90, (PB91-196857, A03, MF-A01). NCEER-90-0024 "A User's Guide to Strongmo: Version 1.0 of NCEER's Strong-Motion Data Access Tool for PCs and
Terminals," by P.A. Friberg and C.A.T. Susch, 11/15/90, (PB91-171272, A03, MF-A01). NCEER-90-0025 "A Three-Dimensional Analytical Study of Spatial Variability of Seismic Ground Motions," by L-L. Hong
and A.H.-S. Ang, 10/30/90, (PB91-170399, A09, MF-A01). NCEER-90-0026 "MUMOID User's Guide - A Program for the Identification of Modal Parameters," by S. Rodriguez-Gomez
and E. DiPasquale, 9/30/90, (PB91-171298, A04, MF-A01). NCEER-90-0027 "SARCF-II User's Guide - Seismic Analysis of Reinforced Concrete Frames," by S. Rodriguez-Gomez, Y.S.
Chung and C. Meyer, 9/30/90, (PB91-171280, A05, MF-A01). NCEER-90-0028 "Viscous Dampers: Testing, Modeling and Application in Vibration and Seismic Isolation," by N. Makris
and M.C. Constantinou, 12/20/90 (PB91-190561, A06, MF-A01). NCEER-90-0029 "Soil Effects on Earthquake Ground Motions in the Memphis Area," by H. Hwang, C.S. Lee, K.W. Ng and
T.S. Chang, 8/2/90, (PB91-190751, A05, MF-A01).

295
NCEER-91-0001 "Proceedings from the Third Japan-U.S. Workshop on Earthquake Resistant Design of Lifeline Facilities and Countermeasures for Soil Liquefaction, December 17-19, 1990," edited by T.D. O'Rourke and M. Hamada, 2/1/91, (PB91-179259, A99, MF-A04).
NCEER-91-0002 "Physical Space Solutions of Non-Proportionally Damped Systems," by M. Tong, Z. Liang and G.C. Lee,
1/15/91, (PB91-179242, A04, MF-A01). NCEER-91-0003 "Seismic Response of Single Piles and Pile Groups," by K. Fan and G. Gazetas, 1/10/91, (PB92-174994,
A04, MF-A01). NCEER-91-0004 "Damping of Structures: Part 1 - Theory of Complex Damping," by Z. Liang and G. Lee, 10/10/91, (PB92-
197235, A12, MF-A03). NCEER-91-0005 "3D-BASIS - Nonlinear Dynamic Analysis of Three Dimensional Base Isolated Structures: Part II," by S.
Nagarajaiah, A.M. Reinhorn and M.C. Constantinou, 2/28/91, (PB91-190553, A07, MF-A01). This report has been replaced by NCEER-93-0011.
NCEER-91-0006 "A Multidimensional Hysteretic Model for Plasticity Deforming Metals in Energy Absorbing Devices," by
E.J. Graesser and F.A. Cozzarelli, 4/9/91, (PB92-108364, A04, MF-A01). NCEER-91-0007 "A Framework for Customizable Knowledge-Based Expert Systems with an Application to a KBES for
Evaluating the Seismic Resistance of Existing Buildings," by E.G. Ibarra-Anaya and S.J. Fenves, 4/9/91, (PB91-210930, A08, MF-A01).
NCEER-91-0008 "Nonlinear Analysis of Steel Frames with Semi-Rigid Connections Using the Capacity Spectrum Method,"
by G.G. Deierlein, S-H. Hsieh, Y-J. Shen and J.F. Abel, 7/2/91, (PB92-113828, A05, MF-A01). NCEER-91-0009 "Earthquake Education Materials for Grades K-12," by K.E.K. Ross, 4/30/91, (PB91-212142, A06, MF-
A01). This report has been replaced by NCEER-92-0018. NCEER-91-0010 "Phase Wave Velocities and Displacement Phase Differences in a Harmonically Oscillating Pile," by N.
Makris and G. Gazetas, 7/8/91, (PB92-108356, A04, MF-A01). NCEER-91-0011 "Dynamic Characteristics of a Full-Size Five-Story Steel Structure and a 2/5 Scale Model," by K.C. Chang,
G.C. Yao, G.C. Lee, D.S. Hao and Y.C. Yeh," 7/2/91, (PB93-116648, A06, MF-A02). NCEER-91-0012 "Seismic Response of a 2/5 Scale Steel Structure with Added Viscoelastic Dampers," by K.C. Chang, T.T.
Soong, S-T. Oh and M.L. Lai, 5/17/91, (PB92-110816, A05, MF-A01). NCEER-91-0013 "Earthquake Response of Retaining Walls; Full-Scale Testing and Computational Modeling," by S.
Alampalli and A-W.M. Elgamal, 6/20/91, to be published. NCEER-91-0014 "3D-BASIS-M: Nonlinear Dynamic Analysis of Multiple Building Base Isolated Structures," by P.C.
Tsopelas, S. Nagarajaiah, M.C. Constantinou and A.M. Reinhorn, 5/28/91, (PB92-113885, A09, MF-A02). NCEER-91-0015 "Evaluation of SEAOC Design Requirements for Sliding Isolated Structures," by D. Theodossiou and M.C.
Constantinou, 6/10/91, (PB92-114602, A11, MF-A03). NCEER-91-0016 "Closed-Loop Modal Testing of a 27-Story Reinforced Concrete Flat Plate-Core Building," by H.R.
Somaprasad, T. Toksoy, H. Yoshiyuki and A.E. Aktan, 7/15/91, (PB92-129980, A07, MF-A02). NCEER-91-0017 "Shake Table Test of a 1/6 Scale Two-Story Lightly Reinforced Concrete Building," by A.G. El-Attar, R.N.
White and P. Gergely, 2/28/91, (PB92-222447, A06, MF-A02). NCEER-91-0018 "Shake Table Test of a 1/8 Scale Three-Story Lightly Reinforced Concrete Building," by A.G. El-Attar, R.N.
White and P. Gergely, 2/28/91, (PB93-116630, A08, MF-A02). NCEER-91-0019 "Transfer Functions for Rigid Rectangular Foundations," by A.S. Veletsos, A.M. Prasad and W.H. Wu,
7/31/91, to be published.

296
NCEER-91-0020 "Hybrid Control of Seismic-Excited Nonlinear and Inelastic Structural Systems," by J.N. Yang, Z. Li and A. Danielians, 8/1/91, (PB92-143171, A06, MF-A02).
NCEER-91-0021 "The NCEER-91 Earthquake Catalog: Improved Intensity-Based Magnitudes and Recurrence Relations for
U.S. Earthquakes East of New Madrid," by L. Seeber and J.G. Armbruster, 8/28/91, (PB92-176742, A06, MF-A02).
NCEER-91-0022 "Proceedings from the Implementation of Earthquake Planning and Education in Schools: The Need for
Change - The Roles of the Changemakers," by K.E.K. Ross and F. Winslow, 7/23/91, (PB92-129998, A12, MF-A03).
NCEER-91-0023 "A Study of Reliability-Based Criteria for Seismic Design of Reinforced Concrete Frame Buildings," by
H.H.M. Hwang and H-M. Hsu, 8/10/91, (PB92-140235, A09, MF-A02). NCEER-91-0024 "Experimental Verification of a Number of Structural System Identification Algorithms," by R.G. Ghanem,
H. Gavin and M. Shinozuka, 9/18/91, (PB92-176577, A18, MF-A04). NCEER-91-0025 "Probabilistic Evaluation of Liquefaction Potential," by H.H.M. Hwang and C.S. Lee," 11/25/91, (PB92-
143429, A05, MF-A01). NCEER-91-0026 "Instantaneous Optimal Control for Linear, Nonlinear and Hysteretic Structures - Stable Controllers," by J.N.
Yang and Z. Li, 11/15/91, (PB92-163807, A04, MF-A01). NCEER-91-0027 "Experimental and Theoretical Study of a Sliding Isolation System for Bridges," by M.C. Constantinou, A.
Kartoum, A.M. Reinhorn and P. Bradford, 11/15/91, (PB92-176973, A10, MF-A03). NCEER-92-0001 "Case Studies of Liquefaction and Lifeline Performance During Past Earthquakes, Volume 1: Japanese Case
Studies," Edited by M. Hamada and T. O'Rourke, 2/17/92, (PB92-197243, A18, MF-A04). NCEER-92-0002 "Case Studies of Liquefaction and Lifeline Performance During Past Earthquakes, Volume 2: United States
Case Studies," Edited by T. O'Rourke and M. Hamada, 2/17/92, (PB92-197250, A20, MF-A04). NCEER-92-0003 "Issues in Earthquake Education," Edited by K. Ross, 2/3/92, (PB92-222389, A07, MF-A02). NCEER-92-0004 "Proceedings from the First U.S. - Japan Workshop on Earthquake Protective Systems for Bridges," Edited
by I.G. Buckle, 2/4/92, (PB94-142239, A99, MF-A06). NCEER-92-0005 "Seismic Ground Motion from a Haskell-Type Source in a Multiple-Layered Half-Space," A.P. Theoharis, G.
Deodatis and M. Shinozuka, 1/2/92, to be published. NCEER-92-0006 "Proceedings from the Site Effects Workshop," Edited by R. Whitman, 2/29/92, (PB92-197201, A04, MF-
A01). NCEER-92-0007 "Engineering Evaluation of Permanent Ground Deformations Due to Seismically-Induced Liquefaction," by
M.H. Baziar, R. Dobry and A-W.M. Elgamal, 3/24/92, (PB92-222421, A13, MF-A03). NCEER-92-0008 "A Procedure for the Seismic Evaluation of Buildings in the Central and Eastern United States," by C.D.
Poland and J.O. Malley, 4/2/92, (PB92-222439, A20, MF-A04). NCEER-92-0009 "Experimental and Analytical Study of a Hybrid Isolation System Using Friction Controllable Sliding
Bearings," by M.Q. Feng, S. Fujii and M. Shinozuka, 5/15/92, (PB93-150282, A06, MF-A02). NCEER-92-0010 "Seismic Resistance of Slab-Column Connections in Existing Non-Ductile Flat-Plate Buildings," by A.J.
Durrani and Y. Du, 5/18/92, (PB93-116812, A06, MF-A02). NCEER-92-0011 "The Hysteretic and Dynamic Behavior of Brick Masonry Walls Upgraded by Ferrocement Coatings Under
Cyclic Loading and Strong Simulated Ground Motion," by H. Lee and S.P. Prawel, 5/11/92, to be published. NCEER-92-0012 "Study of Wire Rope Systems for Seismic Protection of Equipment in Buildings," by G.F. Demetriades,
M.C. Constantinou and A.M. Reinhorn, 5/20/92, (PB93-116655, A08, MF-A02).

297
NCEER-92-0013 "Shape Memory Structural Dampers: Material Properties, Design and Seismic Testing," by P.R. Witting and F.A. Cozzarelli, 5/26/92, (PB93-116663, A05, MF-A01).
NCEER-92-0014 "Longitudinal Permanent Ground Deformation Effects on Buried Continuous Pipelines," by M.J. O'Rourke,
and C. Nordberg, 6/15/92, (PB93-116671, A08, MF-A02). NCEER-92-0015 "A Simulation Method for Stationary Gaussian Random Functions Based on the Sampling Theorem," by M.
Grigoriu and S. Balopoulou, 6/11/92, (PB93-127496, A05, MF-A01). NCEER-92-0016 "Gravity-Load-Designed Reinforced Concrete Buildings: Seismic Evaluation of Existing Construction and
Detailing Strategies for Improved Seismic Resistance," by G.W. Hoffmann, S.K. Kunnath, A.M. Reinhorn and J.B. Mander, 7/15/92, (PB94-142007, A08, MF-A02).
NCEER-92-0017 "Observations on Water System and Pipeline Performance in the Limón Area of Costa Rica Due to the April
22, 1991 Earthquake," by M. O'Rourke and D. Ballantyne, 6/30/92, (PB93-126811, A06, MF-A02). NCEER-92-0018 "Fourth Edition of Earthquake Education Materials for Grades K-12," Edited by K.E.K. Ross, 8/10/92,
(PB93-114023, A07, MF-A02). NCEER-92-0019 "Proceedings from the Fourth Japan-U.S. Workshop on Earthquake Resistant Design of Lifeline Facilities
and Countermeasures for Soil Liquefaction," Edited by M. Hamada and T.D. O'Rourke, 8/12/92, (PB93-163939, A99, MF-E11).
NCEER-92-0020 "Active Bracing System: A Full Scale Implementation of Active Control," by A.M. Reinhorn, T.T. Soong,
R.C. Lin, M.A. Riley, Y.P. Wang, S. Aizawa and M. Higashino, 8/14/92, (PB93-127512, A06, MF-A02). NCEER-92-0021 "Empirical Analysis of Horizontal Ground Displacement Generated by Liquefaction-Induced Lateral
Spreads," by S.F. Bartlett and T.L. Youd, 8/17/92, (PB93-188241, A06, MF-A02). NCEER-92-0022 "IDARC Version 3.0: Inelastic Damage Analysis of Reinforced Concrete Structures," by S.K. Kunnath, A.M.
Reinhorn and R.F. Lobo, 8/31/92, (PB93-227502, A07, MF-A02). NCEER-92-0023 "A Semi-Empirical Analysis of Strong-Motion Peaks in Terms of Seismic Source, Propagation Path and
Local Site Conditions, by M. Kamiyama, M.J. O'Rourke and R. Flores-Berrones, 9/9/92, (PB93-150266, A08, MF-A02).
NCEER-92-0024 "Seismic Behavior of Reinforced Concrete Frame Structures with Nonductile Details, Part I: Summary of
Experimental Findings of Full Scale Beam-Column Joint Tests," by A. Beres, R.N. White and P. Gergely, 9/30/92, (PB93-227783, A05, MF-A01).
NCEER-92-0025 "Experimental Results of Repaired and Retrofitted Beam-Column Joint Tests in Lightly Reinforced Concrete
Frame Buildings," by A. Beres, S. El-Borgi, R.N. White and P. Gergely, 10/29/92, (PB93-227791, A05, MF-A01).
NCEER-92-0026 "A Generalization of Optimal Control Theory: Linear and Nonlinear Structures," by J.N. Yang, Z. Li and S.
Vongchavalitkul, 11/2/92, (PB93-188621, A05, MF-A01). NCEER-92-0027 "Seismic Resistance of Reinforced Concrete Frame Structures Designed Only for Gravity Loads: Part I -
Design and Properties of a One-Third Scale Model Structure," by J.M. Bracci, A.M. Reinhorn and J.B. Mander, 12/1/92, (PB94-104502, A08, MF-A02).
NCEER-92-0028 "Seismic Resistance of Reinforced Concrete Frame Structures Designed Only for Gravity Loads: Part II -
Experimental Performance of Subassemblages," by L.E. Aycardi, J.B. Mander and A.M. Reinhorn, 12/1/92, (PB94-104510, A08, MF-A02).
NCEER-92-0029 "Seismic Resistance of Reinforced Concrete Frame Structures Designed Only for Gravity Loads: Part III -
Experimental Performance and Analytical Study of a Structural Model," by J.M. Bracci, A.M. Reinhorn and J.B. Mander, 12/1/92, (PB93-227528, A09, MF-A01).
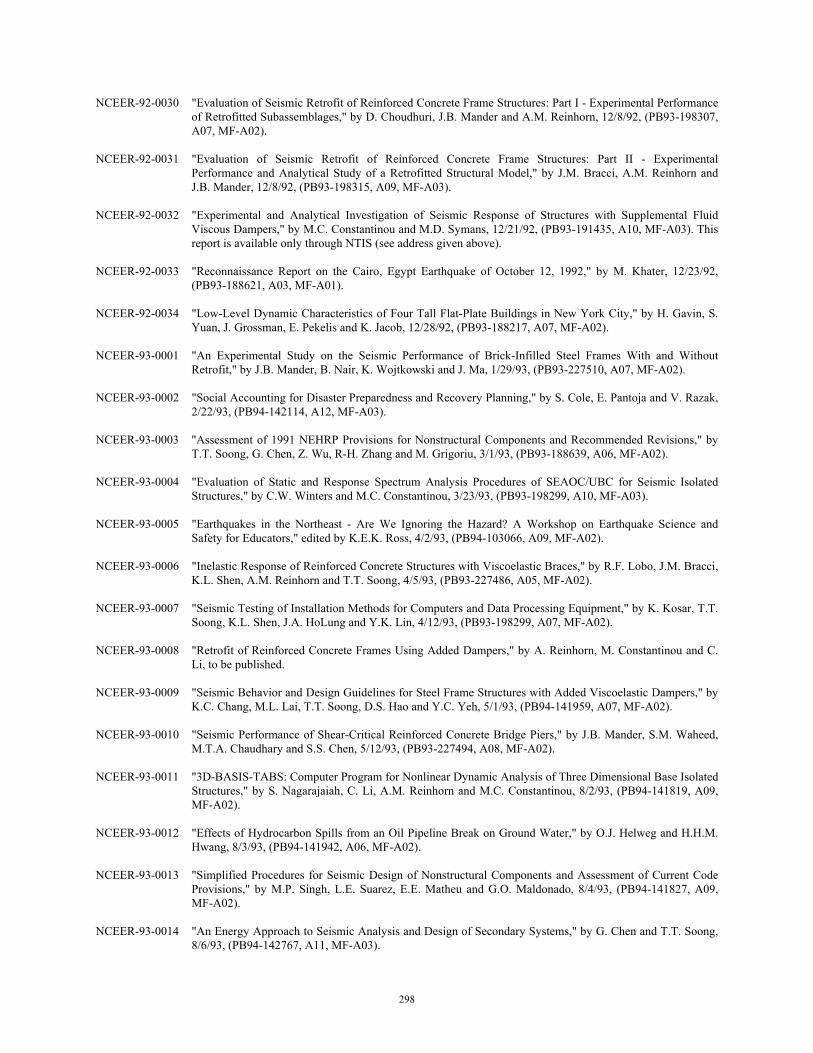
298
NCEER-92-0030 "Evaluation of Seismic Retrofit of Reinforced Concrete Frame Structures: Part I - Experimental Performance of Retrofitted Subassemblages," by D. Choudhuri, J.B. Mander and A.M. Reinhorn, 12/8/92, (PB93-198307, A07, MF-A02).
NCEER-92-0031 "Evaluation of Seismic Retrofit of Reinforced Concrete Frame Structures: Part II - Experimental
Performance and Analytical Study of a Retrofitted Structural Model," by J.M. Bracci, A.M. Reinhorn and J.B. Mander, 12/8/92, (PB93-198315, A09, MF-A03).
NCEER-92-0032 "Experimental and Analytical Investigation of Seismic Response of Structures with Supplemental Fluid
Viscous Dampers," by M.C. Constantinou and M.D. Symans, 12/21/92, (PB93-191435, A10, MF-A03). This report is available only through NTIS (see address given above).
NCEER-92-0033 "Reconnaissance Report on the Cairo, Egypt Earthquake of October 12, 1992," by M. Khater, 12/23/92,
(PB93-188621, A03, MF-A01). NCEER-92-0034 "Low-Level Dynamic Characteristics of Four Tall Flat-Plate Buildings in New York City," by H. Gavin, S.
Yuan, J. Grossman, E. Pekelis and K. Jacob, 12/28/92, (PB93-188217, A07, MF-A02). NCEER-93-0001 "An Experimental Study on the Seismic Performance of Brick-Infilled Steel Frames With and Without
Retrofit," by J.B. Mander, B. Nair, K. Wojtkowski and J. Ma, 1/29/93, (PB93-227510, A07, MF-A02). NCEER-93-0002 "Social Accounting for Disaster Preparedness and Recovery Planning," by S. Cole, E. Pantoja and V. Razak,
2/22/93, (PB94-142114, A12, MF-A03). NCEER-93-0003 "Assessment of 1991 NEHRP Provisions for Nonstructural Components and Recommended Revisions," by
T.T. Soong, G. Chen, Z. Wu, R-H. Zhang and M. Grigoriu, 3/1/93, (PB93-188639, A06, MF-A02). NCEER-93-0004 "Evaluation of Static and Response Spectrum Analysis Procedures of SEAOC/UBC for Seismic Isolated
Structures," by C.W. Winters and M.C. Constantinou, 3/23/93, (PB93-198299, A10, MF-A03). NCEER-93-0005 "Earthquakes in the Northeast - Are We Ignoring the Hazard? A Workshop on Earthquake Science and
Safety for Educators," edited by K.E.K. Ross, 4/2/93, (PB94-103066, A09, MF-A02). NCEER-93-0006 "Inelastic Response of Reinforced Concrete Structures with Viscoelastic Braces," by R.F. Lobo, J.M. Bracci,
K.L. Shen, A.M. Reinhorn and T.T. Soong, 4/5/93, (PB93-227486, A05, MF-A02). NCEER-93-0007 "Seismic Testing of Installation Methods for Computers and Data Processing Equipment," by K. Kosar, T.T.
Soong, K.L. Shen, J.A. HoLung and Y.K. Lin, 4/12/93, (PB93-198299, A07, MF-A02). NCEER-93-0008 "Retrofit of Reinforced Concrete Frames Using Added Dampers," by A. Reinhorn, M. Constantinou and C.
Li, to be published. NCEER-93-0009 "Seismic Behavior and Design Guidelines for Steel Frame Structures with Added Viscoelastic Dampers," by
K.C. Chang, M.L. Lai, T.T. Soong, D.S. Hao and Y.C. Yeh, 5/1/93, (PB94-141959, A07, MF-A02). NCEER-93-0010 "Seismic Performance of Shear-Critical Reinforced Concrete Bridge Piers," by J.B. Mander, S.M. Waheed,
M.T.A. Chaudhary and S.S. Chen, 5/12/93, (PB93-227494, A08, MF-A02). NCEER-93-0011 "3D-BASIS-TABS: Computer Program for Nonlinear Dynamic Analysis of Three Dimensional Base Isolated
Structures," by S. Nagarajaiah, C. Li, A.M. Reinhorn and M.C. Constantinou, 8/2/93, (PB94-141819, A09, MF-A02).
NCEER-93-0012 "Effects of Hydrocarbon Spills from an Oil Pipeline Break on Ground Water," by O.J. Helweg and H.H.M.
Hwang, 8/3/93, (PB94-141942, A06, MF-A02). NCEER-93-0013 "Simplified Procedures for Seismic Design of Nonstructural Components and Assessment of Current Code
Provisions," by M.P. Singh, L.E. Suarez, E.E. Matheu and G.O. Maldonado, 8/4/93, (PB94-141827, A09, MF-A02).
NCEER-93-0014 "An Energy Approach to Seismic Analysis and Design of Secondary Systems," by G. Chen and T.T. Soong,
8/6/93, (PB94-142767, A11, MF-A03).

299
NCEER-93-0015 "Proceedings from School Sites: Becoming Prepared for Earthquakes - Commemorating the Third
Anniversary of the Loma Prieta Earthquake," Edited by F.E. Winslow and K.E.K. Ross, 8/16/93, (PB94-154275, A16, MF-A02).
NCEER-93-0016 "Reconnaissance Report of Damage to Historic Monuments in Cairo, Egypt Following the October 12, 1992
Dahshur Earthquake," by D. Sykora, D. Look, G. Croci, E. Karaesmen and E. Karaesmen, 8/19/93, (PB94-142221, A08, MF-A02).
NCEER-93-0017 "The Island of Guam Earthquake of August 8, 1993," by S.W. Swan and S.K. Harris, 9/30/93, (PB94-
141843, A04, MF-A01). NCEER-93-0018 "Engineering Aspects of the October 12, 1992 Egyptian Earthquake," by A.W. Elgamal, M. Amer, K.
Adalier and A. Abul-Fadl, 10/7/93, (PB94-141983, A05, MF-A01). NCEER-93-0019 "Development of an Earthquake Motion Simulator and its Application in Dynamic Centrifuge Testing," by I.
Krstelj, Supervised by J.H. Prevost, 10/23/93, (PB94-181773, A-10, MF-A03). NCEER-93-0020 "NCEER-Taisei Corporation Research Program on Sliding Seismic Isolation Systems for Bridges:
Experimental and Analytical Study of a Friction Pendulum System (FPS)," by M.C. Constantinou, P. Tsopelas, Y-S. Kim and S. Okamoto, 11/1/93, (PB94-142775, A08, MF-A02).
NCEER-93-0021 "Finite Element Modeling of Elastomeric Seismic Isolation Bearings," by L.J. Billings, Supervised by R.
Shepherd, 11/8/93, to be published. NCEER-93-0022 "Seismic Vulnerability of Equipment in Critical Facilities: Life-Safety and Operational Consequences," by
K. Porter, G.S. Johnson, M.M. Zadeh, C. Scawthorn and S. Eder, 11/24/93, (PB94-181765, A16, MF-A03). NCEER-93-0023 "Hokkaido Nansei-oki, Japan Earthquake of July 12, 1993, by P.I. Yanev and C.R. Scawthorn, 12/23/93,
(PB94-181500, A07, MF-A01). NCEER-94-0001 "An Evaluation of Seismic Serviceability of Water Supply Networks with Application to the San Francisco
Auxiliary Water Supply System," by I. Markov, Supervised by M. Grigoriu and T. O'Rourke, 1/21/94, (PB94-204013, A07, MF-A02).
NCEER-94-0002 "NCEER-Taisei Corporation Research Program on Sliding Seismic Isolation Systems for Bridges:
Experimental and Analytical Study of Systems Consisting of Sliding Bearings, Rubber Restoring Force Devices and Fluid Dampers," Volumes I and II, by P. Tsopelas, S. Okamoto, M.C. Constantinou, D. Ozaki and S. Fujii, 2/4/94, (PB94-181740, A09, MF-A02 and PB94-181757, A12, MF-A03).
NCEER-94-0003 "A Markov Model for Local and Global Damage Indices in Seismic Analysis," by S. Rahman and M.
Grigoriu, 2/18/94, (PB94-206000, A12, MF-A03). NCEER-94-0004 "Proceedings from the NCEER Workshop on Seismic Response of Masonry Infills," edited by D.P. Abrams,
3/1/94, (PB94-180783, A07, MF-A02). NCEER-94-0005 "The Northridge, California Earthquake of January 17, 1994: General Reconnaissance Report," edited by
J.D. Goltz, 3/11/94, (PB94-193943, A10, MF-A03). NCEER-94-0006 "Seismic Energy Based Fatigue Damage Analysis of Bridge Columns: Part I - Evaluation of Seismic
Capacity," by G.A. Chang and J.B. Mander, 3/14/94, (PB94-219185, A11, MF-A03). NCEER-94-0007 "Seismic Isolation of Multi-Story Frame Structures Using Spherical Sliding Isolation Systems," by T.M. Al-
Hussaini, V.A. Zayas and M.C. Constantinou, 3/17/94, (PB94-193745, A09, MF-A02). NCEER-94-0008 "The Northridge, California Earthquake of January 17, 1994: Performance of Highway Bridges," edited by
I.G. Buckle, 3/24/94, (PB94-193851, A06, MF-A02). NCEER-94-0009 "Proceedings of the Third U.S.-Japan Workshop on Earthquake Protective Systems for Bridges," edited by
I.G. Buckle and I. Friedland, 3/31/94, (PB94-195815, A99, MF-A06).

300
NCEER-94-0010 "3D-BASIS-ME: Computer Program for Nonlinear Dynamic Analysis of Seismically Isolated Single and Multiple Structures and Liquid Storage Tanks," by P.C. Tsopelas, M.C. Constantinou and A.M. Reinhorn, 4/12/94, (PB94-204922, A09, MF-A02).
NCEER-94-0011 "The Northridge, California Earthquake of January 17, 1994: Performance of Gas Transmission Pipelines,"
by T.D. O'Rourke and M.C. Palmer, 5/16/94, (PB94-204989, A05, MF-A01). NCEER-94-0012 "Feasibility Study of Replacement Procedures and Earthquake Performance Related to Gas Transmission
Pipelines," by T.D. O'Rourke and M.C. Palmer, 5/25/94, (PB94-206638, A09, MF-A02). NCEER-94-0013 "Seismic Energy Based Fatigue Damage Analysis of Bridge Columns: Part II - Evaluation of Seismic
Demand," by G.A. Chang and J.B. Mander, 6/1/94, (PB95-18106, A08, MF-A02). NCEER-94-0014 "NCEER-Taisei Corporation Research Program on Sliding Seismic Isolation Systems for Bridges:
Experimental and Analytical Study of a System Consisting of Sliding Bearings and Fluid Restoring Force/Damping Devices," by P. Tsopelas and M.C. Constantinou, 6/13/94, (PB94-219144, A10, MF-A03).
NCEER-94-0015 "Generation of Hazard-Consistent Fragility Curves for Seismic Loss Estimation Studies," by H. Hwang and
J-R. Huo, 6/14/94, (PB95-181996, A09, MF-A02). NCEER-94-0016 "Seismic Study of Building Frames with Added Energy-Absorbing Devices," by W.S. Pong, C.S. Tsai and
G.C. Lee, 6/20/94, (PB94-219136, A10, A03). NCEER-94-0017 "Sliding Mode Control for Seismic-Excited Linear and Nonlinear Civil Engineering Structures," by J. Yang,
J. Wu, A. Agrawal and Z. Li, 6/21/94, (PB95-138483, A06, MF-A02). NCEER-94-0018 "3D-BASIS-TABS Version 2.0: Computer Program for Nonlinear Dynamic Analysis of Three Dimensional
Base Isolated Structures," by A.M. Reinhorn, S. Nagarajaiah, M.C. Constantinou, P. Tsopelas and R. Li, 6/22/94, (PB95-182176, A08, MF-A02).
NCEER-94-0019 "Proceedings of the International Workshop on Civil Infrastructure Systems: Application of Intelligent
Systems and Advanced Materials on Bridge Systems," Edited by G.C. Lee and K.C. Chang, 7/18/94, (PB95-252474, A20, MF-A04).
NCEER-94-0020 "Study of Seismic Isolation Systems for Computer Floors," by V. Lambrou and M.C. Constantinou, 7/19/94,
(PB95-138533, A10, MF-A03). NCEER-94-0021 "Proceedings of the U.S.-Italian Workshop on Guidelines for Seismic Evaluation and Rehabilitation of
Unreinforced Masonry Buildings," Edited by D.P. Abrams and G.M. Calvi, 7/20/94, (PB95-138749, A13, MF-A03).
NCEER-94-0022 "NCEER-Taisei Corporation Research Program on Sliding Seismic Isolation Systems for Bridges:
Experimental and Analytical Study of a System Consisting of Lubricated PTFE Sliding Bearings and Mild Steel Dampers," by P. Tsopelas and M.C. Constantinou, 7/22/94, (PB95-182184, A08, MF-A02).
NCEER-94-0023 “Development of Reliability-Based Design Criteria for Buildings Under Seismic Load,” by Y.K. Wen, H.
Hwang and M. Shinozuka, 8/1/94, (PB95-211934, A08, MF-A02). NCEER-94-0024 “Experimental Verification of Acceleration Feedback Control Strategies for an Active Tendon System,” by
S.J. Dyke, B.F. Spencer, Jr., P. Quast, M.K. Sain, D.C. Kaspari, Jr. and T.T. Soong, 8/29/94, (PB95-212320, A05, MF-A01).
NCEER-94-0025 “Seismic Retrofitting Manual for Highway Bridges,” Edited by I.G. Buckle and I.F. Friedland, published by
the Federal Highway Administration (PB95-212676, A15, MF-A03). NCEER-94-0026 “Proceedings from the Fifth U.S.-Japan Workshop on Earthquake Resistant Design of Lifeline Facilities and
Countermeasures Against Soil Liquefaction,” Edited by T.D. O’Rourke and M. Hamada, 11/7/94, (PB95-220802, A99, MF-E08).
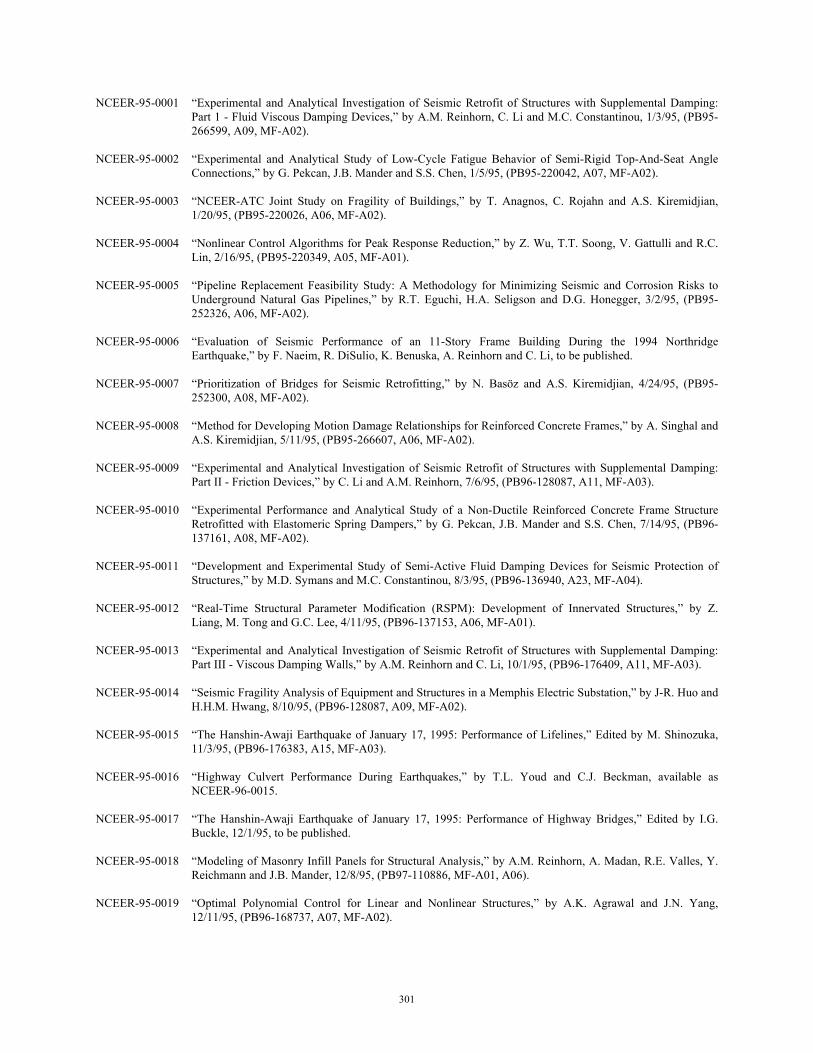
301
NCEER-95-0001 “Experimental and Analytical Investigation of Seismic Retrofit of Structures with Supplemental Damping: Part 1 - Fluid Viscous Damping Devices,” by A.M. Reinhorn, C. Li and M.C. Constantinou, 1/3/95, (PB95-266599, A09, MF-A02).
NCEER-95-0002 “Experimental and Analytical Study of Low-Cycle Fatigue Behavior of Semi-Rigid Top-And-Seat Angle
Connections,” by G. Pekcan, J.B. Mander and S.S. Chen, 1/5/95, (PB95-220042, A07, MF-A02). NCEER-95-0003 “NCEER-ATC Joint Study on Fragility of Buildings,” by T. Anagnos, C. Rojahn and A.S. Kiremidjian,
1/20/95, (PB95-220026, A06, MF-A02). NCEER-95-0004 “Nonlinear Control Algorithms for Peak Response Reduction,” by Z. Wu, T.T. Soong, V. Gattulli and R.C.
Lin, 2/16/95, (PB95-220349, A05, MF-A01). NCEER-95-0005 “Pipeline Replacement Feasibility Study: A Methodology for Minimizing Seismic and Corrosion Risks to
Underground Natural Gas Pipelines,” by R.T. Eguchi, H.A. Seligson and D.G. Honegger, 3/2/95, (PB95-252326, A06, MF-A02).
NCEER-95-0006 “Evaluation of Seismic Performance of an 11-Story Frame Building During the 1994 Northridge
Earthquake,” by F. Naeim, R. DiSulio, K. Benuska, A. Reinhorn and C. Li, to be published. NCEER-95-0007 “Prioritization of Bridges for Seismic Retrofitting,” by N. Basöz and A.S. Kiremidjian, 4/24/95, (PB95-
252300, A08, MF-A02). NCEER-95-0008 “Method for Developing Motion Damage Relationships for Reinforced Concrete Frames,” by A. Singhal and
A.S. Kiremidjian, 5/11/95, (PB95-266607, A06, MF-A02). NCEER-95-0009 “Experimental and Analytical Investigation of Seismic Retrofit of Structures with Supplemental Damping:
Part II - Friction Devices,” by C. Li and A.M. Reinhorn, 7/6/95, (PB96-128087, A11, MF-A03). NCEER-95-0010 “Experimental Performance and Analytical Study of a Non-Ductile Reinforced Concrete Frame Structure
Retrofitted with Elastomeric Spring Dampers,” by G. Pekcan, J.B. Mander and S.S. Chen, 7/14/95, (PB96-137161, A08, MF-A02).
NCEER-95-0011 “Development and Experimental Study of Semi-Active Fluid Damping Devices for Seismic Protection of
Structures,” by M.D. Symans and M.C. Constantinou, 8/3/95, (PB96-136940, A23, MF-A04). NCEER-95-0012 “Real-Time Structural Parameter Modification (RSPM): Development of Innervated Structures,” by Z.
Liang, M. Tong and G.C. Lee, 4/11/95, (PB96-137153, A06, MF-A01). NCEER-95-0013 “Experimental and Analytical Investigation of Seismic Retrofit of Structures with Supplemental Damping:
Part III - Viscous Damping Walls,” by A.M. Reinhorn and C. Li, 10/1/95, (PB96-176409, A11, MF-A03). NCEER-95-0014 “Seismic Fragility Analysis of Equipment and Structures in a Memphis Electric Substation,” by J-R. Huo and
H.H.M. Hwang, 8/10/95, (PB96-128087, A09, MF-A02). NCEER-95-0015 “The Hanshin-Awaji Earthquake of January 17, 1995: Performance of Lifelines,” Edited by M. Shinozuka,
11/3/95, (PB96-176383, A15, MF-A03). NCEER-95-0016 “Highway Culvert Performance During Earthquakes,” by T.L. Youd and C.J. Beckman, available as
NCEER-96-0015. NCEER-95-0017 “The Hanshin-Awaji Earthquake of January 17, 1995: Performance of Highway Bridges,” Edited by I.G.
Buckle, 12/1/95, to be published. NCEER-95-0018 “Modeling of Masonry Infill Panels for Structural Analysis,” by A.M. Reinhorn, A. Madan, R.E. Valles, Y.
Reichmann and J.B. Mander, 12/8/95, (PB97-110886, MF-A01, A06). NCEER-95-0019 “Optimal Polynomial Control for Linear and Nonlinear Structures,” by A.K. Agrawal and J.N. Yang,
12/11/95, (PB96-168737, A07, MF-A02).

302
NCEER-95-0020 “Retrofit of Non-Ductile Reinforced Concrete Frames Using Friction Dampers,” by R.S. Rao, P. Gergely and R.N. White, 12/22/95, (PB97-133508, A10, MF-A02).
NCEER-95-0021 “Parametric Results for Seismic Response of Pile-Supported Bridge Bents,” by G. Mylonakis, A. Nikolaou
and G. Gazetas, 12/22/95, (PB97-100242, A12, MF-A03). NCEER-95-0022 “Kinematic Bending Moments in Seismically Stressed Piles,” by A. Nikolaou, G. Mylonakis and G. Gazetas,
12/23/95, (PB97-113914, MF-A03, A13). NCEER-96-0001 “Dynamic Response of Unreinforced Masonry Buildings with Flexible Diaphragms,” by A.C. Costley and
D.P. Abrams,” 10/10/96, (PB97-133573, MF-A03, A15). NCEER-96-0002 “State of the Art Review: Foundations and Retaining Structures,” by I. Po Lam, to be published. NCEER-96-0003 “Ductility of Rectangular Reinforced Concrete Bridge Columns with Moderate Confinement,” by N. Wehbe,
M. Saiidi, D. Sanders and B. Douglas, 11/7/96, (PB97-133557, A06, MF-A02). NCEER-96-0004 “Proceedings of the Long-Span Bridge Seismic Research Workshop,” edited by I.G. Buckle and I.M.
Friedland, to be published. NCEER-96-0005 “Establish Representative Pier Types for Comprehensive Study: Eastern United States,” by J. Kulicki and Z.
Prucz, 5/28/96, (PB98-119217, A07, MF-A02). NCEER-96-0006 “Establish Representative Pier Types for Comprehensive Study: Western United States,” by R. Imbsen, R.A.
Schamber and T.A. Osterkamp, 5/28/96, (PB98-118607, A07, MF-A02). NCEER-96-0007 “Nonlinear Control Techniques for Dynamical Systems with Uncertain Parameters,” by R.G. Ghanem and
M.I. Bujakov, 5/27/96, (PB97-100259, A17, MF-A03). NCEER-96-0008 “Seismic Evaluation of a 30-Year Old Non-Ductile Highway Bridge Pier and Its Retrofit,” by J.B. Mander,
B. Mahmoodzadegan, S. Bhadra and S.S. Chen, 5/31/96, (PB97-110902, MF-A03, A10). NCEER-96-0009 “Seismic Performance of a Model Reinforced Concrete Bridge Pier Before and After Retrofit,” by J.B.
Mander, J.H. Kim and C.A. Ligozio, 5/31/96, (PB97-110910, MF-A02, A10). NCEER-96-0010 “IDARC2D Version 4.0: A Computer Program for the Inelastic Damage Analysis of Buildings,” by R.E.
Valles, A.M. Reinhorn, S.K. Kunnath, C. Li and A. Madan, 6/3/96, (PB97-100234, A17, MF-A03). NCEER-96-0011 “Estimation of the Economic Impact of Multiple Lifeline Disruption: Memphis Light, Gas and Water
Division Case Study,” by S.E. Chang, H.A. Seligson and R.T. Eguchi, 8/16/96, (PB97-133490, A11, MF-A03).
NCEER-96-0012 “Proceedings from the Sixth Japan-U.S. Workshop on Earthquake Resistant Design of Lifeline Facilities and
Countermeasures Against Soil Liquefaction, Edited by M. Hamada and T. O’Rourke, 9/11/96, (PB97-133581, A99, MF-A06).
NCEER-96-0013 “Chemical Hazards, Mitigation and Preparedness in Areas of High Seismic Risk: A Methodology for
Estimating the Risk of Post-Earthquake Hazardous Materials Release,” by H.A. Seligson, R.T. Eguchi, K.J. Tierney and K. Richmond, 11/7/96, (PB97-133565, MF-A02, A08).
NCEER-96-0014 “Response of Steel Bridge Bearings to Reversed Cyclic Loading,” by J.B. Mander, D-K. Kim, S.S. Chen and
G.J. Premus, 11/13/96, (PB97-140735, A12, MF-A03). NCEER-96-0015 “Highway Culvert Performance During Past Earthquakes,” by T.L. Youd and C.J. Beckman, 11/25/96,
(PB97-133532, A06, MF-A01). NCEER-97-0001 “Evaluation, Prevention and Mitigation of Pounding Effects in Building Structures,” by R.E. Valles and
A.M. Reinhorn, 2/20/97, (PB97-159552, A14, MF-A03). NCEER-97-0002 “Seismic Design Criteria for Bridges and Other Highway Structures,” by C. Rojahn, R. Mayes, D.G.
Anderson, J. Clark, J.H. Hom, R.V. Nutt and M.J. O’Rourke, 4/30/97, (PB97-194658, A06, MF-A03).
303
NCEER-97-0003 “Proceedings of the U.S.-Italian Workshop on Seismic Evaluation and Retrofit,” Edited by D.P. Abrams and
G.M. Calvi, 3/19/97, (PB97-194666, A13, MF-A03). NCEER-97-0004 "Investigation of Seismic Response of Buildings with Linear and Nonlinear Fluid Viscous Dampers," by
A.A. Seleemah and M.C. Constantinou, 5/21/97, (PB98-109002, A15, MF-A03). NCEER-97-0005 "Proceedings of the Workshop on Earthquake Engineering Frontiers in Transportation Facilities," edited by
G.C. Lee and I.M. Friedland, 8/29/97, (PB98-128911, A25, MR-A04). NCEER-97-0006 "Cumulative Seismic Damage of Reinforced Concrete Bridge Piers," by S.K. Kunnath, A. El-Bahy, A.
Taylor and W. Stone, 9/2/97, (PB98-108814, A11, MF-A03). NCEER-97-0007 "Structural Details to Accommodate Seismic Movements of Highway Bridges and Retaining Walls," by R.A.
Imbsen, R.A. Schamber, E. Thorkildsen, A. Kartoum, B.T. Martin, T.N. Rosser and J.M. Kulicki, 9/3/97, (PB98-108996, A09, MF-A02).
NCEER-97-0008 "A Method for Earthquake Motion-Damage Relationships with Application to Reinforced Concrete Frames,"
by A. Singhal and A.S. Kiremidjian, 9/10/97, (PB98-108988, A13, MF-A03). NCEER-97-0009 "Seismic Analysis and Design of Bridge Abutments Considering Sliding and Rotation," by K. Fishman and
R. Richards, Jr., 9/15/97, (PB98-108897, A06, MF-A02). NCEER-97-0010 "Proceedings of the FHWA/NCEER Workshop on the National Representation of Seismic Ground Motion
for New and Existing Highway Facilities," edited by I.M. Friedland, M.S. Power and R.L. Mayes, 9/22/97, (PB98-128903, A21, MF-A04).
NCEER-97-0011 "Seismic Analysis for Design or Retrofit of Gravity Bridge Abutments," by K.L. Fishman, R. Richards, Jr.
and R.C. Divito, 10/2/97, (PB98-128937, A08, MF-A02). NCEER-97-0012 "Evaluation of Simplified Methods of Analysis for Yielding Structures," by P. Tsopelas, M.C. Constantinou,
C.A. Kircher and A.S. Whittaker, 10/31/97, (PB98-128929, A10, MF-A03). NCEER-97-0013 "Seismic Design of Bridge Columns Based on Control and Repairability of Damage," by C-T. Cheng and
J.B. Mander, 12/8/97, (PB98-144249, A11, MF-A03). NCEER-97-0014 "Seismic Resistance of Bridge Piers Based on Damage Avoidance Design," by J.B. Mander and C-T. Cheng,
12/10/97, (PB98-144223, A09, MF-A02). NCEER-97-0015 “Seismic Response of Nominally Symmetric Systems with Strength Uncertainty,” by S. Balopoulou and M.
Grigoriu, 12/23/97, (PB98-153422, A11, MF-A03). NCEER-97-0016 “Evaluation of Seismic Retrofit Methods for Reinforced Concrete Bridge Columns,” by T.J. Wipf, F.W.
Klaiber and F.M. Russo, 12/28/97, (PB98-144215, A12, MF-A03). NCEER-97-0017 “Seismic Fragility of Existing Conventional Reinforced Concrete Highway Bridges,” by C.L. Mullen and
A.S. Cakmak, 12/30/97, (PB98-153406, A08, MF-A02). NCEER-97-0018 “Loss Asssessment of Memphis Buildings,” edited by D.P. Abrams and M. Shinozuka, 12/31/97, (PB98-
144231, A13, MF-A03). NCEER-97-0019 “Seismic Evaluation of Frames with Infill Walls Using Quasi-static Experiments,” by K.M. Mosalam, R.N.
White and P. Gergely, 12/31/97, (PB98-153455, A07, MF-A02). NCEER-97-0020 “Seismic Evaluation of Frames with Infill Walls Using Pseudo-dynamic Experiments,” by K.M. Mosalam,
R.N. White and P. Gergely, 12/31/97, (PB98-153430, A07, MF-A02). NCEER-97-0021 “Computational Strategies for Frames with Infill Walls: Discrete and Smeared Crack Analyses and Seismic
Fragility,” by K.M. Mosalam, R.N. White and P. Gergely, 12/31/97, (PB98-153414, A10, MF-A02).
304
NCEER-97-0022 “Proceedings of the NCEER Workshop on Evaluation of Liquefaction Resistance of Soils,” edited by T.L. Youd and I.M. Idriss, 12/31/97, (PB98-155617, A15, MF-A03).
MCEER-98-0001 “Extraction of Nonlinear Hysteretic Properties of Seismically Isolated Bridges from Quick-Release Field
Tests,” by Q. Chen, B.M. Douglas, E.M. Maragakis and I.G. Buckle, 5/26/98, (PB99-118838, A06, MF- A01).
MCEER-98-0002 “Methodologies for Evaluating the Importance of Highway Bridges,” by A. Thomas, S. Eshenaur and J.
Kulicki, 5/29/98, (PB99-118846, A10, MF-A02). MCEER-98-0003 “Capacity Design of Bridge Piers and the Analysis of Overstrength,” by J.B. Mander, A. Dutta and P. Goel,
6/1/98, (PB99-118853, A09, MF-A02). MCEER-98-0004 “Evaluation of Bridge Damage Data from the Loma Prieta and Northridge, California Earthquakes,” by N.
Basoz and A. Kiremidjian, 6/2/98, (PB99-118861, A15, MF-A03). MCEER-98-0005 “Screening Guide for Rapid Assessment of Liquefaction Hazard at Highway Bridge Sites,” by T. L. Youd,
6/16/98, (PB99-118879, A06, not available on microfiche). MCEER-98-0006 “Structural Steel and Steel/Concrete Interface Details for Bridges,” by P. Ritchie, N. Kauhl and J. Kulicki,
7/13/98, (PB99-118945, A06, MF-A01). MCEER-98-0007 “Capacity Design and Fatigue Analysis of Confined Concrete Columns,” by A. Dutta and J.B. Mander,
7/14/98, (PB99-118960, A14, MF-A03). MCEER-98-0008 “Proceedings of the Workshop on Performance Criteria for Telecommunication Services Under Earthquake
Conditions,” edited by A.J. Schiff, 7/15/98, (PB99-118952, A08, MF-A02). MCEER-98-0009 “Fatigue Analysis of Unconfined Concrete Columns,” by J.B. Mander, A. Dutta and J.H. Kim, 9/12/98,
(PB99-123655, A10, MF-A02). MCEER-98-0010 “Centrifuge Modeling of Cyclic Lateral Response of Pile-Cap Systems and Seat-Type Abutments in Dry
Sands,” by A.D. Gadre and R. Dobry, 10/2/98, (PB99-123606, A13, MF-A03). MCEER-98-0011 “IDARC-BRIDGE: A Computational Platform for Seismic Damage Assessment of Bridge Structures,” by
A.M. Reinhorn, V. Simeonov, G. Mylonakis and Y. Reichman, 10/2/98, (PB99-162919, A15, MF-A03). MCEER-98-0012 “Experimental Investigation of the Dynamic Response of Two Bridges Before and After Retrofitting with
Elastomeric Bearings,” by D.A. Wendichansky, S.S. Chen and J.B. Mander, 10/2/98, (PB99-162927, A15, MF-A03).
MCEER-98-0013 “Design Procedures for Hinge Restrainers and Hinge Sear Width for Multiple-Frame Bridges,” by R. Des
Roches and G.L. Fenves, 11/3/98, (PB99-140477, A13, MF-A03). MCEER-98-0014 “Response Modification Factors for Seismically Isolated Bridges,” by M.C. Constantinou and J.K. Quarshie,
11/3/98, (PB99-140485, A14, MF-A03). MCEER-98-0015 “Proceedings of the U.S.-Italy Workshop on Seismic Protective Systems for Bridges,” edited by I.M. Friedland
and M.C. Constantinou, 11/3/98, (PB2000-101711, A22, MF-A04). MCEER-98-0016 “Appropriate Seismic Reliability for Critical Equipment Systems: Recommendations Based on Regional
Analysis of Financial and Life Loss,” by K. Porter, C. Scawthorn, C. Taylor and N. Blais, 11/10/98, (PB99-157265, A08, MF-A02).
MCEER-98-0017 “Proceedings of the U.S. Japan Joint Seminar on Civil Infrastructure Systems Research,” edited by M.
Shinozuka and A. Rose, 11/12/98, (PB99-156713, A16, MF-A03). MCEER-98-0018 “Modeling of Pile Footings and Drilled Shafts for Seismic Design,” by I. PoLam, M. Kapuskar and D.
Chaudhuri, 12/21/98, (PB99-157257, A09, MF-A02).

305
MCEER-99-0001 "Seismic Evaluation of a Masonry Infilled Reinforced Concrete Frame by Pseudodynamic Testing," by S.G. Buonopane and R.N. White, 2/16/99, (PB99-162851, A09, MF-A02).
MCEER-99-0002 "Response History Analysis of Structures with Seismic Isolation and Energy Dissipation Systems:
Verification Examples for Program SAP2000," by J. Scheller and M.C. Constantinou, 2/22/99, (PB99-162869, A08, MF-A02).
MCEER-99-0003 "Experimental Study on the Seismic Design and Retrofit of Bridge Columns Including Axial Load Effects,"
by A. Dutta, T. Kokorina and J.B. Mander, 2/22/99, (PB99-162877, A09, MF-A02). MCEER-99-0004 "Experimental Study of Bridge Elastomeric and Other Isolation and Energy Dissipation Systems with
Emphasis on Uplift Prevention and High Velocity Near-source Seismic Excitation," by A. Kasalanati and M. C. Constantinou, 2/26/99, (PB99-162885, A12, MF-A03).
MCEER-99-0005 "Truss Modeling of Reinforced Concrete Shear-flexure Behavior," by J.H. Kim and J.B. Mander, 3/8/99,
(PB99-163693, A12, MF-A03). MCEER-99-0006 "Experimental Investigation and Computational Modeling of Seismic Response of a 1:4 Scale Model Steel
Structure with a Load Balancing Supplemental Damping System," by G. Pekcan, J.B. Mander and S.S. Chen, 4/2/99, (PB99-162893, A11, MF-A03).
MCEER-99-0007 "Effect of Vertical Ground Motions on the Structural Response of Highway Bridges," by M.R. Button, C.J.
Cronin and R.L. Mayes, 4/10/99, (PB2000-101411, A10, MF-A03). MCEER-99-0008 "Seismic Reliability Assessment of Critical Facilities: A Handbook, Supporting Documentation, and Model
Code Provisions," by G.S. Johnson, R.E. Sheppard, M.D. Quilici, S.J. Eder and C.R. Scawthorn, 4/12/99, (PB2000-101701, A18, MF-A04).
MCEER-99-0009 "Impact Assessment of Selected MCEER Highway Project Research on the Seismic Design of Highway
Structures," by C. Rojahn, R. Mayes, D.G. Anderson, J.H. Clark, D'Appolonia Engineering, S. Gloyd and R.V. Nutt, 4/14/99, (PB99-162901, A10, MF-A02).
MCEER-99-0010 "Site Factors and Site Categories in Seismic Codes," by R. Dobry, R. Ramos and M.S. Power, 7/19/99,
(PB2000-101705, A08, MF-A02). MCEER-99-0011 "Restrainer Design Procedures for Multi-Span Simply-Supported Bridges," by M.J. Randall, M. Saiidi, E.
Maragakis and T. Isakovic, 7/20/99, (PB2000-101702, A10, MF-A02). MCEER-99-0012 "Property Modification Factors for Seismic Isolation Bearings," by M.C. Constantinou, P. Tsopelas, A.
Kasalanati and E. Wolff, 7/20/99, (PB2000-103387, A11, MF-A03). MCEER-99-0013 "Critical Seismic Issues for Existing Steel Bridges," by P. Ritchie, N. Kauhl and J. Kulicki, 7/20/99,
(PB2000-101697, A09, MF-A02). MCEER-99-0014 "Nonstructural Damage Database," by A. Kao, T.T. Soong and A. Vender, 7/24/99, (PB2000-101407, A06,
MF-A01). MCEER-99-0015 "Guide to Remedial Measures for Liquefaction Mitigation at Existing Highway Bridge Sites," by H.G.
Cooke and J. K. Mitchell, 7/26/99, (PB2000-101703, A11, MF-A03). MCEER-99-0016 "Proceedings of the MCEER Workshop on Ground Motion Methodologies for the Eastern United States,"
edited by N. Abrahamson and A. Becker, 8/11/99, (PB2000-103385, A07, MF-A02). MCEER-99-0017 "Quindío, Colombia Earthquake of January 25, 1999: Reconnaissance Report," by A.P. Asfura and P.J.
Flores, 10/4/99, (PB2000-106893, A06, MF-A01). MCEER-99-0018 "Hysteretic Models for Cyclic Behavior of Deteriorating Inelastic Structures," by M.V. Sivaselvan and A.M.
Reinhorn, 11/5/99, (PB2000-103386, A08, MF-A02).

306
MCEER-99-0019 "Proceedings of the 7th U.S.- Japan Workshop on Earthquake Resistant Design of Lifeline Facilities and Countermeasures Against Soil Liquefaction," edited by T.D. O'Rourke, J.P. Bardet and M. Hamada, 11/19/99, (PB2000-103354, A99, MF-A06).
MCEER-99-0020 "Development of Measurement Capability for Micro-Vibration Evaluations with Application to Chip
Fabrication Facilities," by G.C. Lee, Z. Liang, J.W. Song, J.D. Shen and W.C. Liu, 12/1/99, (PB2000-105993, A08, MF-A02).
MCEER-99-0021 "Design and Retrofit Methodology for Building Structures with Supplemental Energy Dissipating Systems,"
by G. Pekcan, J.B. Mander and S.S. Chen, 12/31/99, (PB2000-105994, A11, MF-A03). MCEER-00-0001 "The Marmara, Turkey Earthquake of August 17, 1999: Reconnaissance Report," edited by C. Scawthorn;
with major contributions by M. Bruneau, R. Eguchi, T. Holzer, G. Johnson, J. Mander, J. Mitchell, W. Mitchell, A. Papageorgiou, C. Scaethorn, and G. Webb, 3/23/00, (PB2000-106200, A11, MF-A03).
MCEER-00-0002 "Proceedings of the MCEER Workshop for Seismic Hazard Mitigation of Health Care Facilities," edited by
G.C. Lee, M. Ettouney, M. Grigoriu, J. Hauer and J. Nigg, 3/29/00, (PB2000-106892, A08, MF-A02). MCEER-00-0003 "The Chi-Chi, Taiwan Earthquake of September 21, 1999: Reconnaissance Report," edited by G.C. Lee and
C.H. Loh, with major contributions by G.C. Lee, M. Bruneau, I.G. Buckle, S.E. Chang, P.J. Flores, T.D. O'Rourke, M. Shinozuka, T.T. Soong, C-H. Loh, K-C. Chang, Z-J. Chen, J-S. Hwang, M-L. Lin, G-Y. Liu, K-C. Tsai, G.C. Yao and C-L. Yen, 4/30/00, (PB2001-100980, A10, MF-A02).
MCEER-00-0004 "Seismic Retrofit of End-Sway Frames of Steel Deck-Truss Bridges with a Supplemental Tendon System:
Experimental and Analytical Investigation," by G. Pekcan, J.B. Mander and S.S. Chen, 7/1/00, (PB2001-100982, A10, MF-A02).
MCEER-00-0005 "Sliding Fragility of Unrestrained Equipment in Critical Facilities," by W.H. Chong and T.T. Soong, 7/5/00,
(PB2001-100983, A08, MF-A02). MCEER-00-0006 "Seismic Response of Reinforced Concrete Bridge Pier Walls in the Weak Direction," by N. Abo-Shadi, M.
Saiidi and D. Sanders, 7/17/00, (PB2001-100981, A17, MF-A03). MCEER-00-0007 "Low-Cycle Fatigue Behavior of Longitudinal Reinforcement in Reinforced Concrete Bridge Columns," by
J. Brown and S.K. Kunnath, 7/23/00, (PB2001-104392, A08, MF-A02). MCEER-00-0008 "Soil Structure Interaction of Bridges for Seismic Analysis," I. PoLam and H. Law, 9/25/00, (PB2001-
105397, A08, MF-A02). MCEER-00-0009 "Proceedings of the First MCEER Workshop on Mitigation of Earthquake Disaster by Advanced
Technologies (MEDAT-1), edited by M. Shinozuka, D.J. Inman and T.D. O'Rourke, 11/10/00, (PB2001-105399, A14, MF-A03).
MCEER-00-0010 "Development and Evaluation of Simplified Procedures for Analysis and Design of Buildings with Passive
Energy Dissipation Systems, Revision 01," by O.M. Ramirez, M.C. Constantinou, C.A. Kircher, A.S. Whittaker, M.W. Johnson, J.D. Gomez and C. Chrysostomou, 11/16/01, (PB2001-105523, A23, MF-A04).
MCEER-00-0011 "Dynamic Soil-Foundation-Structure Interaction Analyses of Large Caissons," by C-Y. Chang, C-M. Mok,
Z-L. Wang, R. Settgast, F. Waggoner, M.A. Ketchum, H.M. Gonnermann and C-C. Chin, 12/30/00, (PB2001-104373, A07, MF-A02).
MCEER-00-0012 "Experimental Evaluation of Seismic Performance of Bridge Restrainers," by A.G. Vlassis, E.M. Maragakis
and M. Saiid Saiidi, 12/30/00, (PB2001-104354, A09, MF-A02). MCEER-00-0013 "Effect of Spatial Variation of Ground Motion on Highway Structures," by M. Shinozuka, V. Saxena and G.
Deodatis, 12/31/00, (PB2001-108755, A13, MF-A03). MCEER-00-0014 "A Risk-Based Methodology for Assessing the Seismic Performance of Highway Systems," by S.D. Werner,
C.E. Taylor, J.E. Moore, II, J.S. Walton and S. Cho, 12/31/00, (PB2001-108756, A14, MF-A03).

307
MCEER-01-0001 “Experimental Investigation of P-Delta Effects to Collapse During Earthquakes,” by D. Vian and M. Bruneau, 6/25/01, (PB2002-100534, A17, MF-A03).
MCEER-01-0002 “Proceedings of the Second MCEER Workshop on Mitigation of Earthquake Disaster by Advanced
Technologies (MEDAT-2),” edited by M. Bruneau and D.J. Inman, 7/23/01, (PB2002-100434, A16, MF-A03).
MCEER-01-0003 “Sensitivity Analysis of Dynamic Systems Subjected to Seismic Loads,” by C. Roth and M. Grigoriu,
9/18/01, (PB2003-100884, A12, MF-A03). MCEER-01-0004 “Overcoming Obstacles to Implementing Earthquake Hazard Mitigation Policies: Stage 1 Report,” by D.J.
Alesch and W.J. Petak, 12/17/01, (PB2002-107949, A07, MF-A02). MCEER-01-0005 “Updating Real-Time Earthquake Loss Estimates: Methods, Problems and Insights,” by C.E. Taylor, S.E.
Chang and R.T. Eguchi, 12/17/01, (PB2002-107948, A05, MF-A01). MCEER-01-0006 “Experimental Investigation and Retrofit of Steel Pile Foundations and Pile Bents Under Cyclic Lateral
Loadings,” by A. Shama, J. Mander, B. Blabac and S. Chen, 12/31/01, (PB2002-107950, A13, MF-A03). MCEER-02-0001 “Assessment of Performance of Bolu Viaduct in the 1999 Duzce Earthquake in Turkey” by P.C. Roussis,
M.C. Constantinou, M. Erdik, E. Durukal and M. Dicleli, 5/8/02, (PB2003-100883, A08, MF-A02). MCEER-02-0002 “Seismic Behavior of Rail Counterweight Systems of Elevators in Buildings,” by M.P. Singh, Rildova and
L.E. Suarez, 5/27/02. (PB2003-100882, A11, MF-A03). MCEER-02-0003 “Development of Analysis and Design Procedures for Spread Footings,” by G. Mylonakis, G. Gazetas, S.
Nikolaou and A. Chauncey, 10/02/02, (PB2004-101636, A13, MF-A03, CD-A13). MCEER-02-0004 “Bare-Earth Algorithms for Use with SAR and LIDAR Digital Elevation Models,” by C.K. Huyck, R.T.
Eguchi and B. Houshmand, 10/16/02, (PB2004-101637, A07, CD-A07). MCEER-02-0005 “Review of Energy Dissipation of Compression Members in Concentrically Braced Frames,” by K.Lee and
M. Bruneau, 10/18/02, (PB2004-101638, A10, CD-A10). MCEER-03-0001 “Experimental Investigation of Light-Gauge Steel Plate Shear Walls for the Seismic Retrofit of Buildings”
by J. Berman and M. Bruneau, 5/2/03, (PB2004-101622, A10, MF-A03, CD-A10).
MCEER-03-0002 “Statistical Analysis of Fragility Curves,” by M. Shinozuka, M.Q. Feng, H. Kim, T. Uzawa and T. Ueda, 6/16/03, (PB2004-101849, A09, CD-A09).
MCEER-03-0003 “Proceedings of the Eighth U.S.-Japan Workshop on Earthquake Resistant Design f Lifeline Facilities and
Countermeasures Against Liquefaction,” edited by M. Hamada, J.P. Bardet and T.D. O’Rourke, 6/30/03, (PB2004-104386, A99, CD-A99).
MCEER-03-0004 “Proceedings of the PRC-US Workshop on Seismic Analysis and Design of Special Bridges,” edited by L.C.
Fan and G.C. Lee, 7/15/03, (PB2004-104387, A14, CD-A14). MCEER-03-0005 “Urban Disaster Recovery: A Framework and Simulation Model,” by S.B. Miles and S.E. Chang, 7/25/03,
(PB2004-104388, A07, CD-A07). MCEER-03-0006 “Behavior of Underground Piping Joints Due to Static and Dynamic Loading,” by R.D. Meis, M. Maragakis
and R. Siddharthan, 11/17/03, (PB2005-102194, A13, MF-A03, CD-A00). MCEER-04-0001 “Experimental Study of Seismic Isolation Systems with Emphasis on Secondary System Response and
Verification of Accuracy of Dynamic Response History Analysis Methods,” by E. Wolff and M. Constantinou, 1/16/04 (PB2005-102195, A99, MF-E08, CD-A00).
MCEER-04-0002 “Tension, Compression and Cyclic Testing of Engineered Cementitious Composite Materials,” by K. Kesner
and S.L. Billington, 3/1/04, (PB2005-102196, A08, CD-A08).

308
MCEER-04-0003 “Cyclic Testing of Braces Laterally Restrained by Steel Studs to Enhance Performance During Earthquakes,” by O.C. Celik, J.W. Berman and M. Bruneau, 3/16/04, (PB2005-102197, A13, MF-A03, CD-A00).
MCEER-04-0004 “Methodologies for Post Earthquake Building Damage Detection Using SAR and Optical Remote Sensing:
Application to the August 17, 1999 Marmara, Turkey Earthquake,” by C.K. Huyck, B.J. Adams, S. Cho, R.T. Eguchi, B. Mansouri and B. Houshmand, 6/15/04, (PB2005-104888, A10, CD-A00).
MCEER-04-0005 “Nonlinear Structural Analysis Towards Collapse Simulation: A Dynamical Systems Approach,” by M.V.
Sivaselvan and A.M. Reinhorn, 6/16/04, (PB2005-104889, A11, MF-A03, CD-A00). MCEER-04-0006 “Proceedings of the Second PRC-US Workshop on Seismic Analysis and Design of Special Bridges,” edited
by G.C. Lee and L.C. Fan, 6/25/04, (PB2005-104890, A16, CD-A00). MCEER-04-0007 “Seismic Vulnerability Evaluation of Axially Loaded Steel Built-up Laced Members,” by K. Lee and M.
Bruneau, 6/30/04, (PB2005-104891, A16, CD-A00). MCEER-04-0008 “Evaluation of Accuracy of Simplified Methods of Analysis and Design of Buildings with Damping Systems
for Near-Fault and for Soft-Soil Seismic Motions,” by E.A. Pavlou and M.C. Constantinou, 8/16/04, (PB2005-104892, A08, MF-A02, CD-A00).
MCEER-04-0009 “Assessment of Geotechnical Issues in Acute Care Facilities in California,” by M. Lew, T.D. O’Rourke, R.
Dobry and M. Koch, 9/15/04, (PB2005-104893, A08, CD-A00). MCEER-04-0010 “Scissor-Jack-Damper Energy Dissipation System,” by A.N. Sigaher-Boyle and M.C. Constantinou, 12/1/04
(PB2005-108221). MCEER-04-0011 “Seismic Retrofit of Bridge Steel Truss Piers Using a Controlled Rocking Approach,” by M. Pollino and M.
Bruneau, 12/20/04 (PB2006-105795). MCEER-05-0001 “Experimental and Analytical Studies of Structures Seismically Isolated with an Uplift-Restraint Isolation
System,” by P.C. Roussis and M.C. Constantinou, 1/10/05 (PB2005-108222). MCEER-05-0002 “A Versatile Experimentation Model for Study of Structures Near Collapse Applied to Seismic Evaluation of
Irregular Structures,” by D. Kusumastuti, A.M. Reinhorn and A. Rutenberg, 3/31/05 (PB2006-101523). MCEER-05-0003 “Proceedings of the Third PRC-US Workshop on Seismic Analysis and Design of Special Bridges,” edited
by L.C. Fan and G.C. Lee, 4/20/05, (PB2006-105796). MCEER-05-0004 “Approaches for the Seismic Retrofit of Braced Steel Bridge Piers and Proof-of-Concept Testing of an
Eccentrically Braced Frame with Tubular Link,” by J.W. Berman and M. Bruneau, 4/21/05 (PB2006-101524).
MCEER-05-0005 “Simulation of Strong Ground Motions for Seismic Fragility Evaluation of Nonstructural Components in
Hospitals,” by A. Wanitkorkul and A. Filiatrault, 5/26/05 (PB2006-500027). MCEER-05-0006 “Seismic Safety in California Hospitals: Assessing an Attempt to Accelerate the Replacement or Seismic
Retrofit of Older Hospital Facilities,” by D.J. Alesch, L.A. Arendt and W.J. Petak, 6/6/05 (PB2006-105794). MCEER-05-0007 “Development of Seismic Strengthening and Retrofit Strategies for Critical Facilities Using Engineered
Cementitious Composite Materials,” by K. Kesner and S.L. Billington, 8/29/05 (PB2006-111701). MCEER-05-0008 “Experimental and Analytical Studies of Base Isolation Systems for Seismic Protection of Power
Transformers,” by N. Murota, M.Q. Feng and G-Y. Liu, 9/30/05 (PB2006-111702). MCEER-05-0009 “3D-BASIS-ME-MB: Computer Program for Nonlinear Dynamic Analysis of Seismically Isolated
Structures,” by P.C. Tsopelas, P.C. Roussis, M.C. Constantinou, R. Buchanan and A.M. Reinhorn, 10/3/05 (PB2006-111703).
MCEER-05-0010 “Steel Plate Shear Walls for Seismic Design and Retrofit of Building Structures,” by D. Vian and M.
Bruneau, 12/15/05 (PB2006-111704).

309
MCEER-05-0011 “The Performance-Based Design Paradigm,” by M.J. Astrella and A. Whittaker, 12/15/05 (PB2006-111705). MCEER-06-0001 “Seismic Fragility of Suspended Ceiling Systems,” H. Badillo-Almaraz, A.S. Whittaker, A.M. Reinhorn and
G.P. Cimellaro, 2/4/06 (PB2006-111706). MCEER-06-0002 “Multi-Dimensional Fragility of Structures,” by G.P. Cimellaro, A.M. Reinhorn and M. Bruneau, 3/1/06
(PB2007-106974, A09, MF-A02, CD A00). MCEER-06-0003 “Built-Up Shear Links as Energy Dissipators for Seismic Protection of Bridges,” by P. Dusicka, A.M. Itani
and I.G. Buckle, 3/15/06 (PB2006-111708). MCEER-06-0004 “Analytical Investigation of the Structural Fuse Concept,” by R.E. Vargas and M. Bruneau, 3/16/06
(PB2006-111709). MCEER-06-0005 “Experimental Investigation of the Structural Fuse Concept,” by R.E. Vargas and M. Bruneau, 3/17/06
(PB2006-111710). MCEER-06-0006 “Further Development of Tubular Eccentrically Braced Frame Links for the Seismic Retrofit of Braced Steel
Truss Bridge Piers,” by J.W. Berman and M. Bruneau, 3/27/06 (PB2007-105147). MCEER-06-0007 “REDARS Validation Report,” by S. Cho, C.K. Huyck, S. Ghosh and R.T. Eguchi, 8/8/06 (PB2007-106983). MCEER-06-0008 “Review of Current NDE Technologies for Post-Earthquake Assessment of Retrofitted Bridge Columns,” by
J.W. Song, Z. Liang and G.C. Lee, 8/21/06 (PB2007-106984). MCEER-06-0009 “Liquefaction Remediation in Silty Soils Using Dynamic Compaction and Stone Columns,” by S.
Thevanayagam, G.R. Martin, R. Nashed, T. Shenthan, T. Kanagalingam and N. Ecemis, 8/28/06 (PB2007-106985).
MCEER-06-0010 “Conceptual Design and Experimental Investigation of Polymer Matrix Composite Infill Panels for Seismic
Retrofitting,” by W. Jung, M. Chiewanichakorn and A.J. Aref, 9/21/06 (PB2007-106986). MCEER-06-0011 “A Study of the Coupled Horizontal-Vertical Behavior of Elastomeric and Lead-Rubber Seismic Isolation
Bearings,” by G.P. Warn and A.S. Whittaker, 9/22/06 (PB2007-108679). MCEER-06-0012 “Proceedings of the Fourth PRC-US Workshop on Seismic Analysis and Design of Special Bridges:
Advancing Bridge Technologies in Research, Design, Construction and Preservation,” Edited by L.C. Fan, G.C. Lee and L. Ziang, 10/12/06 (PB2007-109042).
MCEER-06-0013 “Cyclic Response and Low Cycle Fatigue Characteristics of Plate Steels,” by P. Dusicka, A.M. Itani and I.G.
Buckle, 11/1/06 06 (PB2007-106987). MCEER-06-0014 “Proceedings of the Second US-Taiwan Bridge Engineering Workshop,” edited by W.P. Yen, J. Shen, J-Y.
Chen and M. Wang, 11/15/06 (PB2008-500041). MCEER-06-0015 “User Manual and Technical Documentation for the REDARSTM Import Wizard,” by S. Cho, S. Ghosh, C.K.
Huyck and S.D. Werner, 11/30/06 (PB2007-114766). MCEER-06-0016 “Hazard Mitigation Strategy and Monitoring Technologies for Urban and Infrastructure Public Buildings:
Proceedings of the China-US Workshops,” edited by X.Y. Zhou, A.L. Zhang, G.C. Lee and M. Tong, 12/12/06 (PB2008-500018).
MCEER-07-0001 “Static and Kinetic Coefficients of Friction for Rigid Blocks,” by C. Kafali, S. Fathali, M. Grigoriu and A.S.
Whittaker, 3/20/07 (PB2007-114767). MCEER-07-0002 “Hazard Mitigation Investment Decision Making: Organizational Response to Legislative Mandate,” by L.A.
Arendt, D.J. Alesch and W.J. Petak, 4/9/07 (PB2007-114768). MCEER-07-0003 “Seismic Behavior of Bidirectional-Resistant Ductile End Diaphragms with Unbonded Braces in Straight or
Skewed Steel Bridges,” by O. Celik and M. Bruneau, 4/11/07 (PB2008-105141).

310
MCEER-07-0004 “Modeling Pile Behavior in Large Pile Groups Under Lateral Loading,” by A.M. Dodds and G.R. Martin, 4/16/07(PB2008-105142).
MCEER-07-0005 “Experimental Investigation of Blast Performance of Seismically Resistant Concrete-Filled Steel Tube
Bridge Piers,” by S. Fujikura, M. Bruneau and D. Lopez-Garcia, 4/20/07 (PB2008-105143). MCEER-07-0006 “Seismic Analysis of Conventional and Isolated Liquefied Natural Gas Tanks Using Mechanical Analogs,”
by I.P. Christovasilis and A.S. Whittaker, 5/1/07. MCEER-07-0007 “Experimental Seismic Performance Evaluation of Isolation/Restraint Systems for Mechanical Equipment –
Part 1: Heavy Equipment Study,” by S. Fathali and A. Filiatrault, 6/6/07 (PB2008-105144). MCEER-07-0008 “Seismic Vulnerability of Timber Bridges and Timber Substructures,” by A.A. Sharma, J.B. Mander, I.M.
Friedland and D.R. Allicock, 6/7/07 (PB2008-105145). MCEER-07-0009 “Experimental and Analytical Study of the XY-Friction Pendulum (XY-FP) Bearing for Bridge
Applications,” by C.C. Marin-Artieda, A.S. Whittaker and M.C. Constantinou, 6/7/07 (PB2008-105191). MCEER-07-0010 “Proceedings of the PRC-US Earthquake Engineering Forum for Young Researchers,” Edited by G.C. Lee
and X.Z. Qi, 6/8/07. MCEER-07-0011 “Design Recommendations for Perforated Steel Plate Shear Walls,” by R. Purba and M. Bruneau, 6/18/07,
(PB2008-105192). MCEER-07-0012 “Performance of Seismic Isolation Hardware Under Service and Seismic Loading,” by M.C. Constantinou,
A.S. Whittaker, Y. Kalpakidis, D.M. Fenz and G.P. Warn, 8/27/07, (PB2008-105193). MCEER-07-0013 “Experimental Evaluation of the Seismic Performance of Hospital Piping Subassemblies,” by E.R. Goodwin,
E. Maragakis and A.M. Itani, 9/4/07, (PB2008-105194). MCEER-07-0014 “A Simulation Model of Urban Disaster Recovery and Resilience: Implementation for the 1994 Northridge
Earthquake,” by S. Miles and S.E. Chang, 9/7/07, (PB2008-106426). MCEER-07-0015 “Statistical and Mechanistic Fragility Analysis of Concrete Bridges,” by M. Shinozuka, S. Banerjee and S-H.
Kim, 9/10/07, (PB2008-106427). MCEER-07-0016 “Three-Dimensional Modeling of Inelastic Buckling in Frame Structures,” by M. Schachter and AM.
Reinhorn, 9/13/07, (PB2008-108125). MCEER-07-0017 “Modeling of Seismic Wave Scattering on Pile Groups and Caissons,” by I. Po Lam, H. Law and C.T. Yang,
9/17/07 (PB2008-108150). MCEER-07-0018 “Bridge Foundations: Modeling Large Pile Groups and Caissons for Seismic Design,” by I. Po Lam, H. Law
and G.R. Martin (Coordinating Author), 12/1/07 (PB2008-111190). MCEER-07-0019 “Principles and Performance of Roller Seismic Isolation Bearings for Highway Bridges,” by G.C. Lee, Y.C.
Ou, Z. Liang, T.C. Niu and J. Song, 12/10/07. MCEER-07-0020 “Centrifuge Modeling of Permeability and Pinning Reinforcement Effects on Pile Response to Lateral
Spreading,” by L.L Gonzalez-Lagos, T. Abdoun and R. Dobry, 12/10/07 (PB2008-111191). MCEER-07-0021 “Damage to the Highway System from the Pisco, Perú Earthquake of August 15, 2007,” by J.S. O’Connor,
L. Mesa and M. Nykamp, 12/10/07, (PB2008-108126). MCEER-07-0022 “Experimental Seismic Performance Evaluation of Isolation/Restraint Systems for Mechanical Equipment –
Part 2: Light Equipment Study,” by S. Fathali and A. Filiatrault, 12/13/07 (PB2008-111192). MCEER-07-0023 “Fragility Considerations in Highway Bridge Design,” by M. Shinozuka, S. Banerjee and S.H. Kim, 12/14/07
(PB2008-111193).

311
MCEER-07-0024 “Performance Estimates for Seismically Isolated Bridges,” by G.P. Warn and A.S. Whittaker, 12/30/07 (PB2008-112230).
MCEER-08-0001 “Seismic Performance of Steel Girder Bridge Superstructures with Conventional Cross Frames,” by L.P.
Carden, A.M. Itani and I.G. Buckle, 1/7/08, (PB2008-112231). MCEER-08-0002 “Seismic Performance of Steel Girder Bridge Superstructures with Ductile End Cross Frames with Seismic
Isolators,” by L.P. Carden, A.M. Itani and I.G. Buckle, 1/7/08 (PB2008-112232). MCEER-08-0003 “Analytical and Experimental Investigation of a Controlled Rocking Approach for Seismic Protection of
Bridge Steel Truss Piers,” by M. Pollino and M. Bruneau, 1/21/08 (PB2008-112233). MCEER-08-0004 “Linking Lifeline Infrastructure Performance and Community Disaster Resilience: Models and Multi-
Stakeholder Processes,” by S.E. Chang, C. Pasion, K. Tatebe and R. Ahmad, 3/3/08 (PB2008-112234). MCEER-08-0005 “Modal Analysis of Generally Damped Linear Structures Subjected to Seismic Excitations,” by J. Song, Y-L.
Chu, Z. Liang and G.C. Lee, 3/4/08 (PB2009-102311). MCEER-08-0006 “System Performance Under Multi-Hazard Environments,” by C. Kafali and M. Grigoriu, 3/4/08 (PB2008-
112235). MCEER-08-0007 “Mechanical Behavior of Multi-Spherical Sliding Bearings,” by D.M. Fenz and M.C. Constantinou, 3/6/08
(PB2008-112236). MCEER-08-0008 “Post-Earthquake Restoration of the Los Angeles Water Supply System,” by T.H.P. Tabucchi and R.A.
Davidson, 3/7/08 (PB2008-112237). MCEER-08-0009 “Fragility Analysis of Water Supply Systems,” by A. Jacobson and M. Grigoriu, 3/10/08 (PB2009-105545). MCEER-08-0010 “Experimental Investigation of Full-Scale Two-Story Steel Plate Shear Walls with Reduced Beam Section
Connections,” by B. Qu, M. Bruneau, C-H. Lin and K-C. Tsai, 3/17/08. MCEER-08-0011 “Seismic Evaluation and Rehabilitation of Critical Components of Electrical Power Systems,” S. Ersoy, B.
Feizi, A. Ashrafi and M. Ala Saadeghvaziri, 3/17/08 (PB2009-105546). MCEER-08-0012 “Seismic Behavior and Design of Boundary Frame Members of Steel Plate Shear Walls,” by B. Qu and M.
Bruneau, 4/26/08. MCEER-08-0013 “Development and Appraisal of a Numerical Cyclic Loading Protocol for Quantifying Building System
Performance,” by A. Filiatrault, A. Wanitkorkul and M. Constantinou, 4/27/08. MCEER-08-0014 “Structural and Nonstructural Earthquake Design: The Challenge of Integrating Specialty Areas in Designing
Complex, Critical Facilities,” by W.J. Petak and D.J. Alesch, 4/30/08. MCEER-08-0015 “Seismic Performance Evaluation of Water Systems,” by Y. Wang and T.D. O’Rourke, 5/5/08. MCEER-08-0016 “Seismic Response Modeling of Water Supply Systems,” by P. Shi and T.D. O’Rourke, 5/5/08. MCEER-08-0017 “Numerical and Experimental Studies of Self-Centering Post-Tensioned Steel Frames,” by D. Wang and A.
Filiatrault, 5/12/08. MCEER-08-0018 “Development, Implementation and Verification of Dynamic Analysis Models for Multi-Spherical Sliding
Bearings,” by D.M. Fenz and M.C. Constantinou, 8/15/08. MCEER-08-0019 “Performance Assessment of Conventional and Base Isolated Nuclear Power Plants for Earthquake Blast
Loadings,” by Y.N. Huang, A.S. Whittaker and N. Luco, 10/28/08. MCEER-08-0020 “Remote Sensing for Resilient Multi-Hazard Disaster Response – Volume I: Introduction to Damage
Assessment Methodologies,” by B.J. Adams and R.T. Eguchi, 11/17/08.

312
MCEER-08-0021 “Remote Sensing for Resilient Multi-Hazard Disaster Response – Volume II: Counting the Number of Collapsed Buildings Using an Object-Oriented Analysis: Case Study of the 2003 Bam Earthquake,” by L. Gusella, C.K. Huyck and B.J. Adams, 11/17/08.
MCEER-08-0022 “Remote Sensing for Resilient Multi-Hazard Disaster Response – Volume III: Multi-Sensor Image Fusion
Techniques for Robust Neighborhood-Scale Urban Damage Assessment,” by B.J. Adams and A. McMillan, 11/17/08.
MCEER-08-0023 “Remote Sensing for Resilient Multi-Hazard Disaster Response – Volume IV: A Study of Multi-Temporal
and Multi-Resolution SAR Imagery for Post-Katrina Flood Monitoring in New Orleans,” by A. McMillan, J.G. Morley, B.J. Adams and S. Chesworth, 11/17/08.
MCEER-08-0024 “Remote Sensing for Resilient Multi-Hazard Disaster Response – Volume V: Integration of Remote Sensing
Imagery and VIEWSTM Field Data for Post-Hurricane Charley Building Damage Assessment,” by J.A. Womble, K. Mehta and B.J. Adams, 11/17/08.
MCEER-08-0025 “Building Inventory Compilation for Disaster Management: Application of Remote Sensing and Statistical
Modeling,” by P. Sarabandi, A.S. Kiremidjian, R.T. Eguchi and B. J. Adams, 11/20/08. MCEER-08-0026 “New Experimental Capabilities and Loading Protocols for Seismic Qualification and Fragility Assessment
of Nonstructural Systems,” by R. Retamales, G. Mosqueda, A. Filiatrault and A. Reinhorn, 11/24/08. MCEER-08-0027 “Effects of Heating and Load History on the Behavior of Lead-Rubber Bearings,” by I.V. Kalpakidis and
M.C. Constantinou, 12/1/08. MCEER-08-0028 “Experimental and Analytical Investigation of Blast Performance of Seismically Resistant Bridge Piers,” by
S.Fujikura and M. Bruneau, 12/8/08.


ISSN 1520-295X
University at Buffalo The State University of New York