
Design of a Blast Resistant Armour Plate
166
Design of a Blast Resistant Armour Plate Søren Barrett Rasmus V.L.R. Christiansen Ahmad Othman M.Sc. Thesis Aalborg University June 2017 Department of Materials and Production
-
Upload
khangminh22 -
Category
Documents
-
view
0 -
download
0
Transcript of Design of a Blast Resistant Armour Plate

Design of a Blast Resistant
Armour Plate
Søren Barrett
Rasmus V.L.R. Christiansen
Ahmad Othman
M.Sc. Thesis Aalborg University
June 2017 Department of Materials and Production


Department of Materialsand ProductionFibigerstræde 16DK 9220 Aalborg Østwww.ses.aau.dk
Title:Design of a blast resistant armourplate
Project period:DMS4, Spring semester 2017
Project group:1.123c
Group members:
Søren Barrett
Rasmus V. L. R. Christiansen
Ahmad Othman
Supervisors:Jørgen Asbøll Kepler
ECTS:30
Number of pages:106 + (46)
Annex:ZIP-archive
Submission date:2016-06-02
Synopsis:This thesis treats blast effects on a genericarmour floor panel with prioritised focus onthe military applications more specifically theHumvee. The purpose of this thesis is to deter-mine the blast load from an explosive placedbelow the vehicle, investigate the material pa-rameters of an aluminium foam for implemen-tation in an armour solution, and suggest ageneric armour panel maximising energy ab-sorption for protection of the personnel in thevehicle. Initially, the case of the thesis is pre-sented along with the thesis scope and outline.This is followed by general theory as a basisfor the remainder of the thesis. The blast load,peak pressure and impulse, from a DM51 handgrenade exploding beneath a floor panel of thevehicle is determined using two different meth-ods. Both methods are based on empiricallyobtained data in grand test schemes, and aretherefore validated for a large variety of cases.The investigation of the energy absorbing prop-erties of the aluminium foam shows that theavailable foam is highly inhomogeneous and in-convenient for design tasks requiring great tol-erances. An alternative is therefore investi-gated using a highly modifiable structure of lat-tices for designs requiring great material con-trol. However, the cost of the aluminium foammakes it highly desirable for structures cover-ing a large area, and analytical as well as nu-merical models are developed for determiningeffective designs utilising the foam. Differentdesign concepts are investigated, morphed andrejected until a single design is optimised forenergy absorption and use in the armour floorpanel of the vehicle. Finally, plans for experi-mental validation of both the analytical meth-ods and the final design are described.


Preface
This thesis has been submitted to the Department of Materials and Production at AalborgUniversity in partial fulfilment of the requirements for the M.Sc. degree on the study;Design of Mechanical Systems. The thesis period was from the 1st of February to the2nd of June 2017. The work has been supervised by Associate Professor, Ph.D. JørgenAsbøll Kepler to whom we would like to extent our thanks for guidance, discussions andfeedback throughout the period. Furthermore, we would like to thank the cooperatingpartner Composhield A/S for the project, materials, guidance and discussions and espe-cially a thank you to the company representative Herluf Montes Schütte.
The studies have made use of the commercial softwares MATLAB and ANSYS Autodynand ANSYS explicit dynamics. The report is typeset in LATEX, and figures are madein MATLAB or Microsoft Visio. Furthermore, the terminal ballistics laboratory in thebasement of Fibigerstræde 14, Aalborg University has been used for experiments.
Appended to the thesis is an appendix in which additional information or explanationscan be found. References to theses appendices exist throughout the report, when neces-sary. An electronic annex containing ANSYS simulation files, MATLAB files, materialtests etc. are likewise appended, and can be found in the project database.
References in the report are made using the Harvard method, meaning the authors of thereference along with the year the material is published are stated in the report as [Author,year]. Additional information on the material is listed in the bibliography sorted by thelast name of the first author.
The report is intended for supervisor, censor and Composhield. The content of the reportand project is non-classified, but subjected to a Non-Disclosure Agreement between theauthors and Composhield.
Søren BarrettRasmus V.L.R. ChristiansenAhmad OthmanAalborg, June 2017.
iii


Abstract
The objective of the present M.Sc thesis is to propose a design for a blast resistant armourfloor panel for vehicles in military applications. The project is conducted in cooperationwith Composhield A/S, a military armour manufacturer, who aim to enhance their al-ready extensive product portfolio within lightweight protection panels supplying greaterprotection of their clients in theatres of operation around the world. The proposed designis an amour floor panel with specifications offering protection against a blast load from anexplosive placed directly beneath the vehicle of equivalent 0,12 kg TNT at a distance of 0,5m, i.e. the case-load. The panel does resist greater blast loads with slight modifications.A three-way approach to the problem is taken consisting of an analytical, a numerical andan experimental approach. Only the analytical and numerical approach are finished inthe following report, while the experimental approach is planned for the near future. Theanalytical approach is utilised for obtaining a solid understanding of the governing blastparameters and an initial guess of different design parameters. This approach is mainlyacademical. The actual design of the armour panel is conducted purely numerically.One of the significant problems in the thesis is to determine or quantify the blast loadacting on the floor of the vehicle originating from an exploding DM51 hand grenade of 0,12kg TNT at a distance of 0,5 m. An extensive study of blast effects is therefore conducted inorder to determine the design load on the structure acting as a load case for the remainingof the project. This is followed by a study of the material parameters of foamed aluminiumin order to determine the energy absorbing properties and ultimately the applicabilityin armour panels. Analytical studies in determining the deformation and the optimumdistribution of front panel and foam mass for maximum energy absorption are conducted.However, the manufacturing methods of aluminium foams are very difficult to controlwhile remaining cheap resulting in a, at times, highly inhomogeneous material which isunacceptable in some applications. An alternative using a lattice structure is thereforeinvestigated, resulting in a highly modifiable structure which can be re-engineered forspecific needs.A numerical design procedure using hydrocode is utilised in search of a capable designconcept for blast loads which is the main focus of the thesis. The capable design isreached through a parametric study of multiple iterations minimising the residual load inthe structure following the deformation of the armour panel.The experimental approach has not been conducted, but a plan for near future experimen-tal work is described in the report. This includes verification of discrepancies between theanalytical and numerical approach, and a full-scale test of the armour panel for validationof the ability of the panel to withstand the specified blast threat.


Abstract
Formålet med det foreliggende speciale er at foreslå et design for en sprængningsresistentpanser gulvplade for køretøjer i militære applikationer. Projektet er udført i samarbe-jde med Composhield A/S, en panserproducent for militære applikationer, som søger atudvide deres allerede omfattende produktkatalog indenfor letvægtsbeskyttelsespaneler tilbeskyttelse af deres klienter i verdensomspændende militære brændpunkter. Det fores-låede design er et panser gulvpanel med specifikationer, der tilbyder beskyttelse imod ensprængningslast fra en eksplosiv placeret direkte under køretøjet bestående af en ækvi-valent TNT-vægt på 0,12 kg i en afstand af 0,5 m, m.a.o. case-lasten. Panelet modstårstørre sprængningslaster med få modifikationer.En tredelt fremgangsmåde i forhold til problemet er taget, og består af en analytisk,en numerisk og en eksperimentel del. Kun den analytiske og numeriske del er færdig-gjort, men den eksperimentelle del er planlagt for den nære fremtid. Den analytiske deler udført for at opnå en solid forståelse af de bestemmende sprængningsparameter oget indledende gæt på designparametrene. Denne del er hovedsagelig medtaget grundetakademiske overvejelser. Den faktiske designproces er udført rent numerisk.Et af de signifikante problemer i specialet er at bestemme eller kvantificere sprængningslas-ten virkende på køretøjets gulvpanel fra en eksploderende DM51 håndgranat, hvilket pro-ducerer case-lasten. Et udførligt studie af sprængningseffekter er derfor udført for atbestemme designlasten virkende på køretøjet, som bruges igennem hele projektet. Detteer efterfulgt af et materialestudie i et tilgængeliggjort aluminiumsskum med det formålat bestemme de energiabsorberende egenskaber og ultimativt dettes anvendelighed i etpanserpanel. Analytiske studier er anvendt for at bestemme deformationen i dette skumunder last, og den optimale fordeling af masse i henholdsvis frontpladen og skummetfor maksimal energioptag er ligeledes bestemt. Fremstillingsparametrene er dog megetkrævende at kontrollere mens omkostningerne stadig holdes nede, og dette resulterer iet skum, der til tider er meget uhomogent, hvilket i en række designapplikationer eruacceptabelt. Et alternativ, der gør brug af en gitterkonstruktion, er derfor undersøgtresulterende i et design, der er yderst modificerbar til specifikke behov.En numerisk designproces, ved hydrocodes, er anvendt i forsøget på at finde et kompe-tent sprængningsresistent design, hvilket også er hovedfokusset for dette speciale. Detkompetente design er fundet igennem et parameterstudie over en række iterationer medoptimeringskriteriet at minimere restlasten i strukturen efter deformation af panserpan-elet.Det eksperimentelle arbejde er ikke udført, men en plan for den nære fremtid er beskreveti rapporten. Dette inkluderer en verifikation af de observerede afvigelser imellem deanalytiske og numeriske modeller samt en fuldskala test af panserpanelet for validering afhvorvidt panelet er i stand til at modstå sprængningstruslen.


Contents
Abstract i
Abstrakt i
1 Introduction 11.1 The Humvee . . . . . . . . . . . . . . . . . . . . . . . . . . . . . . . . . . . 21.2 Human tolerance against injuries . . . . . . . . . . . . . . . . . . . . . . . 31.3 Structural response . . . . . . . . . . . . . . . . . . . . . . . . . . . . . . . 51.4 Pressure history at a point . . . . . . . . . . . . . . . . . . . . . . . . . . . 91.5 Thesis scope and limitations . . . . . . . . . . . . . . . . . . . . . . . . . . 111.6 Thesis summary and outline . . . . . . . . . . . . . . . . . . . . . . . . . . 13
2 Problem definition 152.1 Idealised blast wave . . . . . . . . . . . . . . . . . . . . . . . . . . . . . . . 152.2 Equivalent explosive weight in TNT and appropriate scaling law . . . . . . 162.3 Relative position of explosive and the resulting blast-loading type . . . . . 182.4 Shock wave propagation in foams . . . . . . . . . . . . . . . . . . . . . . . 212.5 Energy absorber . . . . . . . . . . . . . . . . . . . . . . . . . . . . . . . . . 23
3 Problem formulation 253.1 Requirements . . . . . . . . . . . . . . . . . . . . . . . . . . . . . . . . . . 25
4 Prediction of blast loads 274.1 Blast parameters . . . . . . . . . . . . . . . . . . . . . . . . . . . . . . . . 274.2 Pressure history determination by following Kinney, Graham and Brode . . 304.3 Pressure history determination at a point by ConWep . . . . . . . . . . . . 304.4 Comparison of the results obtained by the two approaches . . . . . . . . . 324.5 Peak pressure distribution on the plate by ConWep . . . . . . . . . . . . . 33
5 Investigation of foamed aluminium 355.1 General properties of aluminium foam . . . . . . . . . . . . . . . . . . . . 355.2 Foam used in the project . . . . . . . . . . . . . . . . . . . . . . . . . . . . 375.3 An option for replacing the aluminium foam . . . . . . . . . . . . . . . . . 40
6 Analytical study 496.1 Response of a protective plate subjected to a uniform blast load . . . . . . 496.2 Response of a target plate subjected to a spherical blast load . . . . . . . . 54
iii

CONTENTS
6.3 Bending and membrane energy . . . . . . . . . . . . . . . . . . . . . . . . 616.4 Comparison and validation of the results . . . . . . . . . . . . . . . . . . . 636.5 Summary . . . . . . . . . . . . . . . . . . . . . . . . . . . . . . . . . . . . 67
7 Numerical simulations 697.1 Methods . . . . . . . . . . . . . . . . . . . . . . . . . . . . . . . . . . . . . 697.2 Material models . . . . . . . . . . . . . . . . . . . . . . . . . . . . . . . . . 697.3 Considerations when performing hydrocode simulation . . . . . . . . . . . 71
8 Design of Humvee floor 758.1 Design concepts . . . . . . . . . . . . . . . . . . . . . . . . . . . . . . . . . 758.2 Further investigation of the indentations concept . . . . . . . . . . . . . . . 828.3 Final design of protective plate . . . . . . . . . . . . . . . . . . . . . . . . 86
9 Plan for experimental work 919.1 Laboratory experiments . . . . . . . . . . . . . . . . . . . . . . . . . . . . 919.2 A plan for live-blast test . . . . . . . . . . . . . . . . . . . . . . . . . . . . 959.3 Test panel . . . . . . . . . . . . . . . . . . . . . . . . . . . . . . . . . . . . 99
10 Conclusion 103
Bibliography 107
A Blast parameters following Kinney, Graham and Brode 111
B Procedure followed to obtain the blast parameters in ConWep 115
C Aluminium foam material test 121
D Model for calculating foam thickness for blast loaded structure 129
E Basic hydrocode 135
F Hydrocode cycle process 141
G Additional materials for numeric simulations 143
H Design of test setup expansion 145
I Strain gauge measurements 147
iv

1 | Introduction
Dynamic events such as a detonation of an explosive create non-linear shock waves insolids in immediate vicinity, and it is therefore necessary to study, and develop methods,for predicting the effects of such an explosion, such as fracture, failure, but also energyabsorption properties of these solids, [Davison, 2008].
In a historical context, the studies of non-linear wave propagation have been conductedsince the late 1800s. At first, the investigations were mainly theoretical and limited togases. In the early 1900s, experimental research of shock compression in solids slowly be-gan and the interest in this field greatly increased during the 1940s and 1950s due to themilitary value of the research and the modern scientific work is based on the preliminarywork of researchers in the US and the USSR, [Davison, 2008].
This thesis is conducted in collaboration with Composhield A/S, a company that de-velops and manufactures armour for mobile, semi-mobile and non-mobile applications.The mobile application is the focus of this project.
This means, that the following master thesis investigates the effect of an explosiveon a composite armour designed for use on military personnel vehicles such as, but notlimited to, the Humvee [HMMWV: High Mobility Multi-purpose Wheeled Vehicle], figure1.1, and develops a composite armour capable of withstanding an explosion of 0,098 kg ofequivalent TNT in a distance of 0,5 m. This demand great energy absorbing and impulseresistant properties of the armour, which is achievable through use of metallic foams, aspecific designed ’crash’-structure fixture for the chassis to protect the vehicle structurefrom the energy in the blast wave and a capable and correct design of the armour panel.
Figure 1.1: HMMWV M1165 military vehicle. Design of a composite armour for the flooris the focus of the thesis. [AM General, 2017]
An attempt of keeping the project generic is made, as energy absorbing structures canbe used in a variety of fields e.g. crash-structures in the automotive industry for civil use.
1

CHAPTER 1. INTRODUCTION
1.1 The Humvee
It is decided to use the Humvee as the case vehicle as well defined drawings and descriptionsof this vehicle exists. As it is desired to obtain a somewhat generic armour configuration,it is not inconceivable that the plate can be used on the danish APCs (armoured personnelcarriers) M113 as well.
The Humvee is the preferred light tactical vehicle of more than 60 nations worldwidefor either military or homeland security applications. This amount to a number of 230.000HMMWV vehicles currently operational worldwide, [AM General, 2017]. The Humvee isbuilt on a multi-purpose platform permitting a variety of different configurations, and asthe Humvee has been in production since 1983, it amounts to approximately 60 differentofficially recognised configurations of the platform, [Global Security, 2017].
In 2011 the US army facilitated a program to phase out the use of the HMMWVvehicle branches for a new and more modern light tactical vehicle, but the program wasabandoned as the requirements and available technology of such a vehicle would simplyput too much strain on the treasury. Instead, it was decided to modernise the HMMWVprogram by increasing the automotive performance, regain mobility, extend the servicelife and improve blast protection. Thereby extending the service life of the HMMWVprogram for at least 15 years, [Global Security, 2017].
As mentioned the different configurations of the different HMMWV are based on thesame platform, as shown in figure 1.2.
3,30 m
4,84 m
0,4 m
A -pillar B -pillar
(a) The HMMWV M1165 platform. The curbweight is 2.971 kg. Two armour configurationsexists, increasing the weight to 3.279 kg and4.477 kg respectively. [Global Security, 2017].
0,86 m
0,4 m Frame rail
1,82 m
(b) Distance between frame rail, i.e. suitablemounting point for the armour panel. [GlobalSecurity, 2017].
Figure 1.2
As the Humvee operates in regions of both IEDs (Improvised Explosive Devices), RPGs(Rocket-Propelled-Grenade) and ballistics attacks from regular assault and marksman ri-fles, the armour panel has to be able to withstand both blast waves and ballistic impactswithout major compromises. This is especially critical for the side panels of the vehicle.As mentioned earlier, the main concern of this thesis is to treat the floor of the Humvee,and in this case the vulnerability against the ballistic threats is not as great, hence themain area of study is the energy absorption of the floor.
2

1.2. HUMAN TOLERANCE AGAINST INJURIES
A variety of injuries can be sustained by the vehicle personnel during and in theaftermath of an IED or mine explosion below the vehicle, as seen in figure 1.3. An excerptof the injuries are cuts and perforation by flying debris/fragments following the impulse ofthe explosion or rupture of the floor or windows in the vehicle, leg injuries due to the rapiddeformation of the floor and the following loading of the legs, trauma to body or headfollowing the acceleration of the vehicle due to the kinetic energy in the impulse or soil,rocks etc., and finally external/internal burns due to the thermal effect of the explosionor ignition of combustibles in the vehicle.
fragments/flying debris
local deformation
rupture of floor
kinetic energy
thermal effects
kinetic energy
soil, rocks etc.pressure and detonation effects
Vehicle contour
Figure 1.3: An excerpt of the consequences of an IED or mine explosion below the Humvee.Based on Stankiewicz et al. [2015].
1.2 Human tolerance against injuries
The human tolerance against the blast output of an explosion is relatively high [UnifiedFacilities Criteria, 2008]. However, the stance of a person (standing, sitting, prone, face-on or side-on), relative to the blast front, as well as the shape of the pressure front (fastor slow rise, stepped loading), are significant factors in determining the amount of injurysustained.
The threshold and severe lung-damage pressure levels for short duration load are 200to 275 kPa and above 550 kPa, respectively, while the threshold for lethality due to lungdamage is approximately 690 to 827 kPa. On the other hand, the threshold pressure levelfor tissue haemorrhage resulting from long-duration loads may be as low as 69 to 103kPa, which is approximately a third of the sustainable pressure in a short duration blast.[Unified Facilities Criteria, 2008].
A hemispherical surface blast, and the resulting range vs. pressure for the case explosive(defined in sec. 2.2) in free air is shown in figure 1.4. This shows that the hand grenade
3

CHAPTER 1. INTRODUCTION
generates a pressure causing serious lung damage in a radius of 1,5 m. An explosion ofthis case explosive directly beneath the Humvee do cause some vehicular damage, whileremaining fairly safe to conduct experiments with, in case this becomes an option. Iffragments are added to the grenade, the lethality range is 35 m, [Jane’s InformationGroup, 1996]. However, fragments are not considered and used.
0 2 4 6 8 10 12 14 16 18 20
Range [m]
100
102
104
106
Pre
ssur
e [k
Pa]
Range vs. pressure for case explosive, DM51 hand grenade
ReflectedIncident
Figure 1.4: Range vs. pressure for case explosive DM51. Lethal due to pressure in a rangeof 1,5 m.
Structural motion
Besides the pressure tolerance, it is necessary to consider the human tolerance of twotypes of shock exposure;
• Impacts causing body acceleration/deceleration.
• Body vibration as a result of the vibratory motion of the structure.
Studies have indicated that a probable safe impact (of a head against a hard, flatsurface) tolerance velocity is 3 m/s. At 5,5 m/s there is a 50 percent probability of skullfracture and, at 7 m/s, the probability is nearly 100 percent. An impact velocity of 3 m/sis considered to be generally safe for persons who are in a fairly rigid status; therefore,greater impact velocities can be tolerated if the body is in a more flexible position or ifthe area of impact is large. [Unified Facilities Criteria, 2008].
Fragments
Overall, human tolerance to fragment impact is very low; however, certain protection canbe provided with shelter type structures. Fragments can be classified based on their size,velocity, material and source, as [Unified Facilities Criteria, 2008];
• Primary fragments, which are small, high-speed missiles usually formed from casingand/or material located immediately adjacent to the explosion.
4

1.3. STRUCTURAL RESPONSE
• Secondary fragments, which are generated from the breakup of the structure ormaterial contained within the structure.
The design must secure the human inside the vehicle from both fragment types mentionedabove. However the design of the plate in this project accounts only for the blast effectswhere the vehicle is assumed to be already armoured against the ballistic effects of theexplosion.
1.3 Structural response
The dynamic response of a structure and its elements depends on, [Unified FacilitiesCriteria, 2008];
1. the properties (type, weight, shape, casing, etc.) and location of the explosivecharge.
2. the sensitivity (tolerance) of the structure.
3. the physical properties and configuration of the protective structure.
The structural response is defined by the load transferred to the structure by theprotective plate in which a high energy absorbing plate results in a smaller residual loadtransferred to the structure. A good design may direct the residual load to certain points(well supported points) which leads to a better overall response of the structure. In thisproject, a specific case for a set amount of explosive is studied where the design aims toprovide as great a blast protection as possible.
1.3.1 Pressure design ranges
In the following, the response of the structure due to the pressure is presented. Theresponse can be divided into design ranges, defined by the pressure intensity as, (1) highpressure, and (2) low pressure which defines whether the loading is impulsive or dynamic.For a definition of the blast parameters and use of these, see chapter 2 and chapter 4.
High-Pressure design range
At the high-pressure design range, the initial pressures acting on the protective structureare extremely high and furthermore amplified by their reflections on the structure. Alsothe durations of the applied loads are short, particularly in cases where complete ventingof the explosion products are possible, [Unified Facilities Criteria, 2008]. These durationsare also short in comparison to the response time (time to reach maximum deflection)of the individual elements of the structure, i.e the positive phase is short compared withthe natural period. In this case the load has finished acting before the structure has hadtime to respond significantly where most deformation occurs at times greater than t0, seefigure 1.5.
5

CHAPTER 1. INTRODUCTION
Load
Timet0
p0
p(t) tm
Figure 1.5: Impulsive loading: response time compared with load duration. The response isassumed linear with respect to time which is not the real case as seen subsequently. [Smithand Hetherington, 1994].
The graph indicates that the blast load pulse has fallen to zero before any significantdisplacement occurs. Therefore, structures subjected to blast effects in the high-pressurerange can, in certain cases, be designed for the impulse (area under the pressure-timecurve) rather than the peak pressure associated with longer duration blast pressures,[Unified Facilities Criteria, 2008].
Low-Pressure design range
Structures subjected to blast pressures associated with the low-pressure range sustainpeak pressures of smaller intensity than those associated with the high-pressure range.However, the duration of the load can even exceed the response time of the structure.In this case where the positive time t0 and the time of maximum deformation tm of thestructure are approximately the same, the assessment of response in this regime is morecomplex, possibly requiring complete solution of the equation of motion of the structure[Smith and Hetherington, 1994]. This dynamic or pressure-time regime is representedgraphically in figure 1.6.
Structural elements designed for the low-pressure range depend on both pressure andimpulse, [Unified Facilities Criteria, 2008].
A very low-pressure range can be added as a third level which is related to relativelylow peak pressure and large explosive charges (several hundred tons). The duration t0 isextremely long in comparison to those of smaller explosive charges as indicated in figure1.7. The graph indicates that the structure reached its maximum displacement before theblast load has undergone any significant decay. Such a loading is referred to as quasi-staticor pressure loading.
6

1.3. STRUCTURAL RESPONSE
p(t)
p0
tm t0 Time
Load
Figure 1.6: Dynamic loading: response time compared with load duration. Again, theresponse is assumed linear with respect to time which is not the real case. [Smith andHetherington, 1994].
p(t)
p0
tm
t0
Time
Load
Figure 1.7: Quasi-static loading: response time compared with load duration, modifiedfrom [Smith and Hetherington, 1994].
7

CHAPTER 1. INTRODUCTION
1.3.2 Analysing blast environment
Although each design pressure range is distinct, no clear-cut divisions between the rangesexist; therefore, each protective structure must be analysed to determine its response.Figure 1.8 indicates semi-quantitatively the parameters which define the design ranges(including the very low range) of an element, along with the approximate relationshipbetween the time to reach maximum deflection tm and the load duration t0.
It was described earlier that the design range of an element is related to the locationof the element relative to the explosion, see section 2.3. For the quantity of explosivesconsidered in this study, an element (the plate) designed for the high-pressure rangewhich is situated immediately next-to the explosion, and its exposed surface facing theexplosion is oriented normal or nearly normal to the propagation of the initial pressurewave to account for the most severe case as figure 2.5 shows. On the other hand theexplosive detonates on the surface, i.e. ground, as depicted in case c in figure 2.4. This isa very common case when attacking a mobile vehicle using an explosive weapon.
The actual pressure-time relationship resulting from a pressure distribution on theelement is highly irregular because of the multiple reflections from different surfaces suchas the ground, rocks, other structures etc.. For these cases, the pressure-time relationshipmay be approximated by a fictitious right triangular pressure pulse as shown subsequentlyin chapter 4.
t0 t0 t0tm tm tm
Load
Load
Load
Time Time Time
PressureResistance
High pressure Low pressure Very low pressure
Pressure design range
Design load
Incident pressurePressure duration
Response time
tm/t0
High Low Very low
Impulse Pressure-Time Pressure
>> 690 kPa < 690 kPa < 69 kPa
Long
0,1 > tm/t0
Short
3 > tm/t0 > 0,1
Intermediate
Intermediate
Long
Short
tm/t0 > 3
Figure 1.8: Parameters defining pressure design ranges [Unified Facilities Criteria, 2008].Units in the table are transferred from US units into SI units.
8

1.4. PRESSURE HISTORY AT A POINT
1.4 Pressure history at a point
At any point away from the burst, the pressure distribution has the general shape shownin figure 1.9 with regard to time. The shock front arrives at a given location at time taand, after the rise to the peak value, pso the incident pressure decays to the ambient valuein time t0 which is the positive phase duration. This is followed by a negative phase witha duration t−0 that is usually much longer than the positive phase and characterized by anegative pressure (below ambient pressure) having a maximum value of p−so, as well as areversal of the particle flow. The negative phase is usually less important in design thanthe positive phase, and its amplitude p−s must, in all cases, be less than the ambient atmo-sphere pressure p0. The incident impulse associated with the blast wave is the integratedarea under the pressure-time curve and is denoted as is for the positive phase and i−s forthe negative phase.
Time after explosion
tA tA+t0
Positive phase Negative phase
pso
Before arrival
po
Positive specific impulse, is
Negative specific impulse, iS-
0pso
-
t0+tA +t0-
Pressure
t0
t0 t0-
Figure 1.9: Free field pressure-time variation, modified from [Unified Facilities Criteria,2008].
The above treatment of the blast wave phenomena is general. The magnitude of thevarious parameters must be defined depending upon the category of the detonation asdescribed in chapter 2. The pressure history at a point located at 0,5 m distance from theexplosive centre, which represents the case of exploding a hand grenade DM51 under theHumvee floor, can be categorized as a surface burst, [Unified Facilities Criteria, 2008].
At a stationary point in space, the effects of positive pressure air blasts have frequentlybeen modelled with a modified Friedlander’s equation [Guzas and Earls, 2010] as
p(t) =
0,
pmax
(1− t−tA
t0
)e−b( t−tA
t0),
0,
t < tAtA ≤ t ≤ tA + t0t > tA + t0
(1.1)
where p(t) is the overpressure at time t after detonation, pmax is the peak overpressure,tA is the arrival time of the shock wave, t0 is the positive duration of the shock wave,
9

CHAPTER 1. INTRODUCTION
and b is the decay-constant. Depending on whether or not the point of interest is locatedon the surface of an object, pmax is either equal to pso, the peak side-on overpressure (infree air) or pr, the maximum reflected overpressure (upon shock wave reflection at a rigidsurface). All these parameters are shown in figure 1.9.
The impulse per unit area of projected surface, also called the specific impulse i, canbe obtained by integrating the pressure function from eq. 1.1
i =
∫ tA+t0
tA
p(t) dt = pmax (t0)
[1
b− 1
b2(1− e−b
)](1.2)
where i is either the reflected or side-on impulse based on what pmax is used in eq. 1.1.
10

1.5. THESIS SCOPE AND LIMITATIONS
1.5 Thesis scope and limitations
The scope of the thesis is to design a composite armour plate capable of withstandingthe blast threat from explosives. Furthermore, the plate has to be able to withstandincoming fragments due to the explosive. This is not the main concern of this thesis,but some degree of protection against fragments is incorporated due to the design of theblast panel. Specific ballistic protection may be ensured by using a disruptive layer ofceramics and fibre-polymer designed by Composhield at a later stage. Additionally, itis desired to determine a novel structure capable of absorbing a great amount of energywhile still maintaining structural rigidity to be used as discrete fixation points in-betweenthe composite armour plate and the vehicle structure/chassis.
Additive manufacturing methods (3D-printing) of metallic structures are gaining sig-nificant acceptance in different industries as the use/possibilities of components manufac-tured using these methods can be specifically engineered and the cost of the componentslikewise decrease as the technology matures. A design of the discrete fixation points istherefore not limited to geometries which are manufacturable using conventional methods.As the methods and techniques are further developed and the cost decreases the structuremay be used in larger scale for relevant specifications.
The tasks of the thesis are the following;
1) Determine the temporal and spatial distribution of the load in both the armour plate,and discrete fixation/mounting points.
A blast wave creates an impulse of the surrounding air particles and thereby a time de-pendent, often high, load on the armour panel and mounting points. The distributionand magnitude of this impulse is necessary to determine for design purposes.Methods: Two methods are used in determining the load on the structure. The impulseis determined from models developed on empirical data obtained in extensive test pro-grams conducted in the US army. The residual load, i.e. the load transferred to thestructure/chassis, is determined by analytical models.
2) Investigate the metallic foam presently used in the composite armour plate fordetermining the energy absorbing properties and ability to withstand multiple blast waves.
This includes investigation of the effect of cell size, foam density, thickness of skin and foametc. The foam has to be relatively cheap as it is used for a large percentage of the surfacearea of the vehicle. The ballistic protection is assumed to be covered by Composhield andtheir already extensive knowledge of ceramic/fibre-polymer compositions.Methods: Quasi-static compression tests are performed on the foams using a test machine.Dynamic tests can be performed in the terminal ballistic lab impacting the foam witha blast wave representative projectile. Numerical simulations in ANSYS Autodyn arelikewise performed. The multi-hit ability needs in all probability to be live-blast tested.
11

CHAPTER 1. INTRODUCTION
3) Investigate the effect of geometry and/or composition of the armour plate for theHumvee floor on energy absorption, structural integrity etc.
This is an investigation of the effect of thickness, mass of the front plate, energy absorber,back plate and to determine the composition of components for the plate. It also includesan investigation of different concepts, e.g. wave deflection mechanism, and how theseenhance the armour capabilities of the protective panel. It is all to be conducted with focuson the reaction force on the backside of the armour plate. This can be used to calculatethe deflection in the chassis. However, this has to be achieved without sacrificing thevery important ground clearance of the vehicle, i.e. significant gains are necessary beforeforsaking ground clearance, and without increasing the weight of the vehicle uncontrollableto maintain the tactical ability of the military application. To not permanently damagethe chassis of the vehicle, the collapse load of the foam/sacrificial layer has to be keptbelow the elastic capacity of the chassis.Methods: Analytical methods using energy conservation and numerical methods usinghydrocode are utilised for this part of the thesis. Experiments in the terminal ballisticslaboratory are performed using a blast wave replicating projectile, and a live-blast testmay be an option.
4) Design the discrete energy absorption points for the assembly of the armour plate andthe chassis.
This includes a structural design capable of high energy absorption and structural rigidityfor protection of the vehicle structure, i.e. chassis. A novel design may be an option alongwith unconventional manufacturing methods.Methods: Numerical tools and parametrisation is used in determining a suitable structure.The proposed structure is produced by additive manufacturing on available 3D-printers,and experimentally validated afterwards.
5) Parametric study of the armour panel.
Different design concepts and combinations are investigated and a single design is chosen.The parametrisation is performed on a local scale during the design of the individualcomponents of the armour solution, but mainly focused on a single design just before thefinal design is chosen, as a method of saving time.Methods: A literature study of possible design concepts followed by a numerical study inANSYS Autodyn and Explicit dynamics.
6) Experimental validation.
This includes creating a representative blast wave in the terminal ballistics lab and con-ducting experiments that are sufficiently realistic. A pendulum for the dynamic testingof the foam is designed and manufactured, appendix H. The tests are performed for veri-fication of the comparisons made, and of the designs. The difficulty is replicating a blastload in the laboratory without using explosives. It is therefore desired, to also perform alive-blast test.
12

1.6. THESIS SUMMARY AND OUTLINE
1.6 Thesis summary and outline
The following section presents the outline of this thesis, and serve as a quick overview ofthe report along with some of the incentives of the different chapters.
Chapter 1, the present chapter presents the project by a short outline of the effects of adynamic event such as an explosive along with a brief discussion of the historical contextof research in blast waves. This is followed by a presentation of the collaborative partnerof the project Composhield A/S and the objective of the project. A vehicle, the HMMWVM1165, is presented as the case vehicle for which an armour plate to be mounted in thefloor of the vehicle is desired. A brief discussion on the blast effects influencing bothpersonnel and the structural response of the vehicle follows as a short introduction to theproblems in protecting a mechanical structure against explosive threats. The chapter isconcluded by the scope and limitations of the thesis and the thesis outline.
Chapter 2, the problem definition presents the mechanics of blast waves, equivalentTNT, scaling laws, shock propagation and energy absorption which all are the basic the-ory utilised throughout the project. The case explosive, a hand grenade DM51, consistingof 0,0979 kg TNT equivalent explosive is determined in the chapter using the relativeenergy between the actual explosive in the hand grenade, PETN, and TNT.
Chapter 3, the problem formulation presents the requirements for the armour plate basedon the information from the preceding chapter and defines the basis of evaluation for thedesign concepts throughout the design iterations.
Chapter 4, the prediction of the blast load using two different methods are presentedin this chapter. Both methods are based on a great quantity of empirical data obtainedthroughout extensive test programs conducted by e.g. the US army resulting in i.e. theblast prediction software ConWep (Conventional Weapons). The purpose of the chapteris to investigate the methods most suitable for use in the remainder of the project, whichconclusively is the ConWep software. Initially, the chapter presents the most importantblast parameters in determining the blast effects which finally are calculated for the earliermentioned case explosive, the DM51 hand grenade.
Chapter 5, the investigation of the aluminium foam for use in blast resistant armour.In this chapter, a study of the material properties of an aluminium foam is conductedin anticipation of using it in the blast resistant armour. The studies show a very inho-mogeneous material, due to difficult manufacturing control. Therefore, an alternative fordesigns requiring strict tolerances is investigated and a lattice structure, i.e. micro-trussstructure, is determined as a highly modifiable alternative. However, the aluminium foamis still desired for large areal applications due to the favourable price, why analytical mod-els are considered in the following chapter.
13

CHAPTER 1. INTRODUCTION
Chapter 6, the analytical models investigate the deformation in the foam using energyconservation. The models are used in determining the optimum mass distribution be-tween the front buffer plate, and the metallic foam. An analysis of minimising the mass,and an analysis in minimising the thickness of the panel is conducted. The profile of thebulge is determined, along with the effects of membrane and bending deformation modes.Finally, the analytical models of deformation and energy analyses are compared with thenumerical equivalent models.
Chapter 7, the numerical simulations present the methods, models and considerationswhen using hydrocodes in ANSYS Autodyn and ANSYS explicit dynamics.
Chapter 8, the design chapter presents different concepts utilising different methods ofenergy dissipation or absorbing in reducing the residual load transferred to the structure.The concepts are studied in the first iteration and the best compromise is picked and fur-ther enhanced in the second iteration of the design. Here, a parametric study is conductedfor getting closer to the utopia point, i.e the optimum design. This probably has to becombined with some sort of ballistic protection in Composhield’s possession for fragmentsand bullets in case of ambushes. A final design is hereby determined.
Chapter 9, the experimental work describes the experiments to be conducted in theterminal ballistics laboratory in near future for verification of some of the problems anddiscrepancies experienced between the analytical and numerical models. Furthermore, alive blast test is outlined including the use of strain gauges if the opportunity to conduct alive test turn up. This also includes some basic strain gauge theory. Finally, the assemblyof the armour panel is described including some weak points in need of some consideration.The interconnection of report and project is shown in figure 1.10.
Problem definition
- Blast mechanics(idealised, equiv. wgt.,
scaling, blast type, shock
propagation, energy abs.)
Problem formulation
Requirements
Prediction of Blast loads
- Blast parameters- Determination of case
load
Introduction
- Case(Humvee, Human and
structural response)
- Thesis scope
Investigating foamed aluminium
- Material tests- Alternative
Numerical simulations
- Models, method(EOS, strength, BCs)
- Considerations
Design of floor panel
- Design concepts
(1st iter.)
- Final plate concept (2nd iter)
Plan for experiments
- Laboratory experiments
- Live blast test
Comparison Comparison
Analytical study
- Analytical models(deformation, energy)
- Comparison
Figure 1.10: Interconnection of the project and report.
14

2 | Problem definition
The following chapter serves as an introduction to the mechanics of blast wave propa-gation and energy absorption. Theory of terminal ballistics, i.e. the study of projectile/-target interaction is omitted, as it is not the main focus of this project.
An explosion is a fast chemical reaction, in this case involving a solid, during whichrelease of energy and hot gases take place rapidly, [Karlos and Solomos, 2013]. Thephenomenon, usually, lasts for a few milliseconds only, and generates high pressures andtemperatures. The wave propagation, spherically in an unbounded medium, is due to theexpansion of the hot gases and the surrounding air. The resulting pile-up of the moleculesin a layer of compressed air is the blast wave and shock front, in which the majority ofthe energy released in the detonation is contained, [Karlos and Solomos, 2013]. As thewave expands, it experiences a decay in strength and a decrease in velocity but lengthensthe duration.
2.1 Idealised blast wave
A blast wave is; "a shock wave which decays [drastically] immediately after the peakis reached", [Needham, 2010]. A shock is a discontinuity of density, stress, pressure (dis-placements are continuous) that propagates in a material continuum, [Davison, 2008].Conservation of mass, momentum and energy are satisfied at this discontinuity as is thecase for steady smooth wave propagation. A steady wave is therefore interpreted as ashock, if the thickness of this, compared to the other dimensions, is small, [Davison,2008].
Figure 2.1 represents a blast wave parameter at a finite time following a shock. At thefront of the shock, the parameter reaches a peak value in an infinitesimal time-step, andimmediately starts decaying towards a negative phase, [Needham, 2010].
Parameter
Range
Peak value
Negative phase
Positive phase
Arrival
Figure 2.1: A fully developed representation of a general blast wave parameter. The pa-rameter may represent the pressure, density or velocity at a given time, as a function ofrange (time, distance). [Needham, 2010].
15

CHAPTER 2. PROBLEM DEFINITION
For an ideal case representing the pressure/time-history, i.e the blast wave parameteris the pressure as a function of time, see figure 2.2. The figure represents a pressure inrelation to time for a free-air blast wave, reaching a target a distance from the detonationpoint, [Karlos and Solomos, 2013]. The initial pressure at the target is equal to the ambientpressure, po. When the front of the shock reaches the target at the arrival time, tA, thepressure instantaneously increases from the ambient pressure, p0, to the peak pressure,pso, (or peak overpressure). The time of increase in pressure is usually neglected and setto zero, i.e. a discontinuity. An increase in the distance to the detonation point from thetarget means a decrease in peak overpressure, along with the propagation velocity of thewave, figure 2.3. Following the peak pressure, the value decays as a power law – the inverseof the cube of the distance due to the volume of the sphere and that pressure times volumeremain constant – until it reaches the ambient pressure at the time tA+to, where to definesthe time of the positive phase. The negative phase represents the duration the pressureis lower than the ambient pressure, and the duration of this phase is longer than theduration of the positive phase, [Karlos and Solomos, 2013]. Duration and lowest pressureis designated as t−o and p−so respectively. In the negative phase, the target is subjectedto suction forces why fragments etc. might be found on the exterior of the target. Thenegative phase is often disregarded in design purposes, as the main structural damage ina target occurs in the positive phase, as is seen by the magnitude of the pressure, [Karlosand Solomos, 2013]. The impulse, Is, of the blast wave is determined as the shaded areain figure 2.2 and describes the total force applied on the target structure due to the blastwave. For the positive phase,
Is =
∫ tA+to
tA
ps(t) dt (2.1)
The distance between the detonation point and the target is one of the primary pa-rameters when determining the peak overpressure and velocity of the blast wave. Asmentioned above, the magnitude of both decreases rapidly when the distance increases.The effect of the distance on the peak overpressure for the positive phase alone is seen infigure 2.3.
2.2 Equivalent explosive weight in TNT and appropri-ate scaling law
The explosives used in experiments, analyses etc. are according to the universal pro-cedure recalculated to equivalent TNT (tri-nitro-toluene) in kilograms. This is done eventhough the physical properties, such as geometry, of the explosive affects the initial char-acteristics of the blast wave it is found that at a reasonable distance from the detonationcentre all blast waves share the same common configuration, wrt. geometry it convergestowards a spherical blast front. The effect of the explosion is therefore comparable bycalculating equivalency and using scaling factors. TNT is chosen as the norm quantity,as the blast characteristics resemble most of the known solid type explosives often usedin IEDs (improvised-explosive-devices) and controlled explosions for demolitions.
16

2.2. EQUIVALENT EXPLOSIVE WEIGHT IN TNT AND APPROPRIATESCALING LAW
-
--
-
Figure 2.2: Pressure history of an ideal blast wave. [Karlos and Solomos, 2013].
Pressure
Time
[pso1]
[pso2]
[pso3]
[pso4]
Ambient pressure [po] [to1]
[to2]
[to3]
[to4]
Distance 1Distance 2Distance 3Distance 4
D1 < D2 < D3 < D4
Figure 2.3: Peak overpressure at the positive phase for different distances from target todetonation point. The duration of the positive phase increases with increasing distance.[Karlos and Solomos, 2013].
17

CHAPTER 2. PROBLEM DEFINITION
The equivalent amount of TNT, in kg, for a given explosive is defined by chemicalenergy equivalence [MJ/kg] generated in the detonation as,
We = Wexp
Hdexp
HdTNT
(2.2)
where We is the TNT equivalent weight, Wexp is the weight of the actual explosive, Hdexp
is the heat of detonation of the actual explosive and HdTNT is the heat of detonation of
TNT, [Karlos and Solomos, 2013].
As a case for the project, one can assume that the explosive targeting the floor of theHumvee is generated by a standard hand grenade DM51. This grenade contains 60 g ofPETN (Penta-erythritol-tetra-nitrate) which approximately generates Hd
exp = 6,69 MJ/kgof heat in the detonation. TNT approximately generates Hd
TNT = 4,10 MJ/kg of heatduring detonation, [Karlos and Solomos, 2013]. This, using eq. 2.2, yields,
We = 0,0979 kg
of equivalent TNT.
By use of scaling laws, it is possible to obtain blast wave parameters at varying distancesfor any size of explosive. The most used scaling law is the one introduced by Hopkinson-Cranz and known as the cube root scaling law. The idea is, that for detonation of twoexplosives of similar geometry and located at the same scaled distance to the target, butdifferent in weight, similar blast waves are created if the explosion is conducted in thesame atmosphere, [Karlos and Solomos, 2013]. The scaled distance is then,
Z =R
3√We
(2.3)
where R is the distance from the detonation centre to the target (point of interest), andWe is the TNT-equivalent weight of the explosive meaning Z has a unit of m/kg1/3.
Hereby, it is possible to scale an experiment using a controlled amount of explosive toany given actual case.
2.3 Relative position of explosive and the resulting blast-loading type
The blast wave interacting with the target is greatly dependent on the relative positionof the explosive compared to the target. Only external, free and non-contact explosionsare treated in this project. Three basic types of cases exist dependent on the height, H∗,of the explosive above ground and the horizontal distance, RG, between the detonationpoint, W , and the target, [Karlos and Solomos, 2013]. These are seen in figure 2.4.
18

2.3. RELATIVE POSITION OF EXPLOSIVE AND THE RESULTINGBLAST-LOADING TYPE
H*
RG
w
(a) Free-air blast.
RG
w
H*
(b) Air blast.
RG
w
(c) Surface blast.
Figure 2.4: The definition of the three basic cases dependent on the height above ground,and the horizontal distance to the target.
Case a): Free-air blast. The explosive is detonated in free air, and the waves prop-agates spherically, dependent on the geometry of the explosive, outwards from the deto-nation centre. The waves do not interact with any obstacle, i.e. surface/ground, beforeimpinging the target. [Karlos and Solomos, 2013].
Case b): Air blast. As in case a), the explosive detonates in the air, but the sphericalpropagation of the blast waves impinge the target after interaction with an obstacle, i.e.the ground. This results in the creation of a reflective wave, and a mach stem/mach wavefront. [Karlos and Solomos, 2013].
Case c): Surface blast. The explosive detonates on the surface, i.e. ground. Theblast waves immediately interact with the ground and is amplified, and hemi-sphericallypropagates outwards and impinging the target. [Karlos and Solomos, 2013]. This is theprimary case of this thesis.
The effect of the interaction with the ground results in a reflected wave, which has avery different (often higher!) intensity and thereby effect on the pressure applied on thestructure.
2.3.1 Reflection wave (mach stem)
The pressure pattern of the blast wave is different from the idealised case in figure 2.2after interaction with an object, i.e. a reflected wave. The reflected pressure on a rigidsurface is larger than the peak incident pressure, pso, [Karlos and Solomos, 2013]. "Foran ideal linear-elastic solid the air-particles rebound freely from the surface as a reflectedpressure equal to the incident pressure equalling a doubling of the acting pressure. In astrong non-linear blast wave, the reflection of the air-particles is hindered by the contin-uing quantity of particles arriving at the surface from the remainder of the wave, thusleading to a much higher acting pressure as the particles build up", [Karlos and Solomos,2013], and figure 2.5. The ratio of which the reflected pressure is larger than the incidentpressure is dependent on geometry, angle of reflection, type of blast, size, weight anddistance to/of explosive and the interference of reflected waves from other objects.
19

CHAPTER 2. PROBLEM DEFINITION
Pressure
Time [t]
Peak incident pressure [pso]
Ambient pressure [po]
Incident pressure [pt]
Arrival time [tA]
Positive duration
[to]
Negative duration [to-]
tA+to tA+to+to
tA
Reflected pressure [pr]
Peak overpressure [pro]
Blast waves
Reflected pressure
Incident pressure
Incident pressure
α
RA
Insert
Figure 2.5: Pressure history of the reflected and the incident pressure. The insert imageshows the most severe case, i.e. the reflected pressure is largest on surfaces perpendicularto the blast waves, and the peak incident pressure is the equal to the reflected pressure onsurfaces parallel to the blast waves, i.e. the mildest case. This means, that the reflectedpressure is always greater than the incident pressure, by a factor of 2 - 8 times in idealcases, experimental findings show it to be even larger for very close explosion due todissociation effects in the gases. The reflected pressure is greatest at a normal to thedetonation source, RA, and decreases with the incidence angle, α. [Karlos and Solomos,2013].
The effect of the angle of incidence α (fig. 2.5 insert) is negligible while one still achievesa conservative design, as the pressure only decays with increasing angle of incidence. Forangles of incident between 40 − 55 (fig. B.4), the reflected wave behaves a bit differentdue to the creation of a mach stem, also called irregular reflection. The mach stem iscreated due to coalescence of the incident wave, and the reflection wave, [Karlos and
20

2.4. SHOCK WAVE PROPAGATION IN FOAMS
Solomos, 2013]. The intersection of the incident, reflected and mach waves is known asthe triple point (fig. 2.6). The mach stem is assumed to have a constant value throughoutthe height, the creation of a mach stem is shown in figure 2.6.
Incident wave
Reflected wave
Mach stem
α
Triple point
Typical reflection Mach reflection
Figure 2.6: Creation of a mach stem. The height of the mach front increases with anincrease in propagation. The time-pressure history of the mach front is similar, but greater,to the ideal time-pressure history of figure 2.2. If the mach stem is higher than the target,the target is loaded by uniform pressure, else, the lower part of the target is loaded byuniform pressure, and the upper part (above triple point) is loaded by the combined pressureof the incident and reflected wave. The uniform load of the mach front is largest, and canbe used as design criteria for the entire structure. [Karlos and Solomos, 2013].
2.4 Shock wave propagation in foams
As the foam experiences a disturbance, the effect of this disturbance propagates throughthe foam, first as an elastic wave. If the disturbance is sufficiently large or of sufficientlyhigh velocity, the wave is a plastic wave.
An idealized nominal compressive stress-strain curve for a metallic foam is shown infigure 2.7.
When a foam experiences an impact, an elastic wave propagates through it. If thestress of this wave is above σpl, it is followed by a plastic wave. A one-dimensional case isconsidered, fig. 2.8, and it is assumed that the bar is, initially, stationary and stress free,[Ashby et al., 2000]. At t = 0, the bar is subjected to a constant velocity v. An elasticwave propagates through the bar at the speed of cel =
√E/ρ as a response, and yields
a uniform stress of σpl and a negligibly velocity. Trailing is the plastic wave at speed cpl.Downstream from this front, the stress is σpl and velocity is v ≈ 0. Upstream from thefront, the stress and strain is given by point D in figure 2.7, i.e. the stress and strain stateis σD and εD respectively. Furthermore, the density has increased to ρD = ρ/(1 − εD).[Ashby et al., 2000].
21

CHAPTER 2. PROBLEM DEFINITION
Strain ε
Stress σ
εD
E
σpl
D
U
Figure 2.7: A compressive idealized stress-strain curve for a foam. E: elastic modulus, σpl:plateau stress, εD: densification strain. Compaction/densification of the foam happens atthe densification strain. Point D indicates the defined densification stress at the densifi-cation strain, and the slope of the line U-D defines the tangent modulus. [Ashby et al.,2000].
Stress = σD
Velocity = vD
Density = ρD
Stress = σpl
Velocity = 0
Density = ρ
cpl
Plastic wave front
Figure 2.8: One-dimensional wave propagation.
The conservation of momentum is used to relate the change in stress (σD − σpl) acrossthe wave front which is related to the change in velocity vD, [Ashby et al., 2000].
(σD − σpl) = ρ cpl vD (2.4)
and the change in velocity is related to the change in strain as
vD = cpl εD (2.5)
From eq. 2.4 and 2.5, the plastic wave speed is
cpl =
√(σD − σpl)ρ εD
=
√Etρ
(2.6)
where Et is the tangent modulus, which is the slope of the line U-D in figure 2.7.
22

2.5. ENERGY ABSORBER
2.5 Energy absorber
Energy absorbing designs are used in impact structures of vehicles, packaging of productsand blast protection. Increasing focus on the composition and manufacturing methods ofenergy absorbers has resulted in safer and better designs capable of greater absorptionprotecting the passenger, product, structure etc. ensuring only limited or no damage,[Alghamdi [2001], Ashby et al. [2000]]. The absorbers’, whether of metal, plastic orcardboard, method of protection is stated as:
"An energy absorber is a system that converts, totally or partially, kinetic energyinto another form of energy. Energy converted is either reversible, like pressureenergy in compressible fluids and elastic strain energy in solids, or irreversible,
like plastic deformation energy", [Alghamdi, 2001].
This happens, in a properly designed and employed energy absorber, just below the criticalload, i.e. the load that causes damage to the product, passengers etc.
2.5.1 Energy absorption of a blast load
A blast load imparts an impulse onto the absorber and momentum is conserved, [Ashbyet al., 2000]. As momentum is conserved, a relation between the level of the load and theduration of influence exists if the buffer plate, necessary due to the impulse, in front ofthe absorber is accelerated instantaneously to the velocity conserving momentum. Foamwhich is often used in energy absorbers behaves somewhat linear elastic - perfect plastic,the relation is established as in figure 2.9.
σpl
2 σpl
3 σpl
Stress
Duration
Figure 2.9: Stress-duration relation of three linear elastic perfect plastic energy absorbers.Each of them absorbs the same amount of energy.
As mentioned earlier, the energy absorber for this project is to be used in the floorof e.g. a Humvee. The energy is absorbed by plastic deformation, and three modes ofdeformation exists
23

CHAPTER 2. PROBLEM DEFINITION
• bending
• membrane
• translatory
All three of these deformation modes are utilised throughout the project. An example ofthe translatory deformation mode is given in the following. A purely translatory deforma-tion mode is utilised meaning the disruptive layer in front of the energy absorber remainsrigid and undeformed, an important assumption in the analytical model of section 6. Theabsorption of the energy in the blast load is done in the blast absorbing layer along withstrategically placed fixation points transferring the residual energy to the chassis do toconservation of momentum, figure 2.10.
Frame rail/chassis
Absorber layer
Disruptive layer
Backing plate
Designed absorber layer
(a) Pre load.
Frame rail/chassis
Absorber layerDisruptive layer
Backing plate
Designed absorber layer
(b) Post load.
Figure 2.10: General composition of an armour solution for the floor. The designedabsorber layer is for cases where well defined material parameters are necessary at a highercost, or the necessary thickness for using the cheap aluminium foam is impossible, e.g. nearthe suspension. Problems with the foam are discussed later, in chapter 5. Disruptive layerremains rigid and undeformed.
It is described earlier how a ballistic panel for defeating fragments, projectiles etc. isnot prioritised as the risks of penetration from these threats at this location of the vehicleis limited, and Composhield is in possession of known tools to counteract the threats.However, as stressed and further described in chapter 6, it is necessary to have a bufferplate in front of the energy absorber which conveniently could possess some protectiveproperties such as a disruptive layer of high hardness steel ARMOX 500T or ceramic tileswith a backing plate of steel. The buffer plate is necessary as it protects the foam forcomplete disintegration during the blast load, and the additional mass greatly reduces thenecessary thickness of the foam due to energy considerations.
The focus of material and structure for the absorbing layer is, for this project, foamedaluminium as it is relatively cheap, easy manufacturable in relatively large plates andpossess the ideal linear elastic - perfect plastic properties for energy absorption, [Ashbyet al., 2000]. Other options are honeycomb structures, truss structures, layered sacrificialcladdings ([Karagiozova and Jones [2000], Guruprasad and Mukherjee [2000]]) etc. ofaluminium or other materials, whereas novel structures are investigated for the fixationpoints or replacement of the aluminium foam in critical applications as treated later,section 5.3.
24

3 | Problem formulation
The following chapter presents the requirements at which the design considerations andevaluations are based on. Furthermore, the requirements quickly summarise the abovechapter.
3.1 Requirements
Blast threat protection. The blast threats against the military vehicles vary from mis-sion to mission. In some cases, a hand grenade rolled under the vehicle is the greatestthreat, and at other times it might be an Improvised Explosive Device (IED) buried be-neath the road surface. Cases of IED-attack from Iraq suggest that the use of artilleryshells of 122 mm or larger as the explosive device is frequently used, [Global Security,2017]. It is therefore suggested to design for a blast threat of a common hand grenadeDM51 and consider up to a 155 mm artillery shell. See table 3.1 for the necessary param-eters.
DM51 hand grenade 155 mm artillery shell M107Explosive PETN 60,0 g TNTEquivalent TNT 0,0979 kg 6,62 kgGeometry of casing Ø57 mm Ø154,89 mmGeometry of pressure wave Spherical SphericalTotal weight 0,45 kg 40,82 kg
Table 3.1: Parameters for the explosive threats considered in the project. The explosivesused in the M107 artillery shell is dependent on the manufacture, [Jane’s InformationGroup, 1996]. Even though the casing of the artillery shell is cylindrical, and resultingpressure wave of the explosion in close proximity of the shell will propagate cylindricallyas well, it is assumed that the wave is spherical due to the influence of orientation of theshell relative to the vehicle, this is more conservative.
The Standardization agreement (STANAG 4569) treats the protection of vehicle againstkinetic threats, artillery and grenade/mine blasts, [NSA, 2012]. A combined table for theprotection levels are shown in table 3.2 for the artillery and grenade/mine blasts. At themoment, is it chosen to design for the STANAG level 1, as the case explosive is a handgrenade, of the DM51 type.
25

CHAPTER 3. PROBLEM FORMULATION
Level Artillery threat (155 mm) Grenade and mine threat1 RoB: 100 m Hand grenade2 RoB: 80 m AT Mine: 6 kg3 RoB: 60 m AT Mine: 8 kg4 RoB: 25 m AT Mine: 10 kg5 RoB:* 25 m N/A6 RoB: 10 m N/A
Table 3.2: Level of protection according to STANAG 4569. Note; the artillery coloumnindicate the minimum distance wrt. to the fragments from the casing of the artillery shell’sability to penetrate the armour, i.e does not indicate the blast pressure. RoB: Range ofBurst. *Not an error. [NSA, 2012].
Lightweight. As the focus of the project is on mobile armour applications for mili-tary vehicles, an important parameter to minimise is the weight of the armour solution.Excessive weight has an influence on the mobility of the vehicle with regards to fuelconsumption, acceleration, top speed, manoeuvrability and additional cargo load. It isdesired to utilise materials and designs offering a high protection level and low weight.It is difficult to quantify lightweight, so design concepts are compared against the foampanel of equivalent mass, and the residual reaction force.
Ground clearance. To maintain the military strategical operational range of thevehicle, the ground clearance of 400 mm is in an ideal case maintained. This however isalmost impossible unless the structural floor of the Humvee is replaced. It is desired tomaintain as much ground clearance as possible. A 10% reduction is deemed acceptable,hence the armour panel can be 40 mm in thickness in total. This also include any ballisticprotection applied at a later stage.
Mountable. The additional armour for the floor of the vehicle has to be mountable onany variation for the vehicle in question with relative small modifications. The possibilityof attaching mounting point on the plate is therefore necessary.
Environment. Reliability of the solution in the operative environment is a necessity.This include resistance to water, great variation in temperature and general wear. Meansof avoiding or reducing unnecessary wear are therefore taken.
26

4 | Prediction of blast loads
This chapter describes the effects of a blast wave produced by a hand grenade DM51 onthe target plate. The effects here are represented by the reflected pressure and impulse asdescribed in chapter 2. Two methods of obtaining the blast parameters are applied andcompared, whereupon the pressure distribution on the target plate is determined.
Other hazards like fragments are not considered or calculated here, although all typesof effects must be included in the final design.
4.1 Blast parameters
Values for the parameters describing the air blast in eq. 1.1 can be found in a few differentsources. The work of [Kingery and Bulmash, 1984] includes blast data from numerousdifferent tests, both for side-on and reflected cases, and their data is presented in theform of equations as a function of scaled distance Z. These air blast parameter equations(known as the Kingery-Bulmash equations) serve as the basis for the well-known air blastload generation program, ConWep (Conventional Weapons Effects), which is used in thisproject.
Blast parameters for design
Numerous sources including military technical manuals, such as TM 5-1300 (US Army1990), and other sources on design [Guzas and Earls, 2010] suggest a simplification to thedecaying exponential blast profile shown in figure 1.9. This approach involves approx-imating the typical overpressure profile with an equivalent triangular pulse. The peakoverpressure, pso, and the impulse, Is, are preserved but the duration time is modified as
t′
0 =2 Ispso
(4.1)
The decay constant, b, is set to zero to give a triangular shape to the blast profile forminga triangular impulse equivalent, as shown by the dotted line on figure 1.9. This equivalenthas the same initial peak overpressure but a shorter duration time.
4.1.1 Angle of incidence
The angle at which a shock wave strikes a structure affects the magnitude of the peakreflected overpressure. In fact, there is a complex relationship between the coefficient ofreflection, Cr, which is a ratio of the peak reflected overpressure to the peak side-on over-pressure, and the angle of incidence, θ. As discussed by [Guzas and Earls, 2010], assumingnormal reflection is conservative and easier to implement within a blast generation pro-gram. [Randers-Pehrson and Bannister, 1997] assume that the reflected blast overpressureprofile is a function of both time and angle of incidence and it is a combination of thenormally reflected and side-on blast overpressure time histories. Accordingly, the air blast
27

CHAPTER 4. PREDICTION OF BLAST LOADS
profile, p(t,θ), to be applied to an individual finite element at a point in time is calculatedas
p(t,θ) = pr(t) cos2 θ + ps(t) (1 + cos2 θ − 2 cos θ) (4.2)
where θ represents the angle between the normal of an element surface, which includesthe point of interest, and a line between the point of interest and the blast detonationpoint as illustrated in figure 4.1. pr(t) is the reflected air blast profile, following eq. 1.1with pmax = pr, and ps(t) is the side-on blast profile, which is also computed from eq. 1.1with pmax = pso.
HCw
Plate
Point of interest
θ
Figure 4.1: Angle of incidence θ in 2D. Hc is the normal distance from the surface to thedetonation point.
It can be seen from eq. 4.2 that for θ = 0, where the surface normal points towardthe blast source, the air blast profile is represented by the reflected air blast profile fromwhich the second term in eq. 4.2 becomes zero.For all loading options, the incident impulse is calculated as
I(θ) = Ir cos2 θ + Is (1 + cos2 θ − 2 cos θ) (4.3)
where Ir is the impulse for normal reflection, Is is the side-on impulse, and θ is the angleof incidence.
The duration time for the equivalent triangular parameter equations is also a functionof this incident impulse
t′
0(θ) =2 I(θ)
p(t = tA, θ)=
2 I(θ)
pr cos2 θ + ps (1 + cos2 θ − 2 cos θ)(4.4)
where p(t = tA, θ) is the overpressure at the arrival time, from eq. 4.2, pr is the peakreflected overpressure for normal incidence, and ps is the peak side-on overpressure.
28

4.1. BLAST PARAMETERS
4.1.2 Hemispherical blast
Explosions located at the ground surface are categorized as a hemispherical blast as men-tioned before. In [Unified Facilities Criteria, 2008], separate sets of parameters for spher-ical and hemispherical blasts are available.
When a charge is detonated at the ground surface, simultaneous reflected waves fromthe ground are produced, reinforcing the shock wave generated by the initial explosion.The surface charge is shown in figure 4.2(b) with a fictitious complementary hemispheredrawn in a dashed line, below the surface of the ground. A charge suspended in air,is shown in figure 4.2(a). Both charges has the same radius. It is observed that; aslong as the ground surface is rigid and frictionless there is no difference in the explosioneffects for the space above the charge between (a) and (b). Therefore, if the ground isa perfect reflecting surface, i.e. idealized surface, the effect of the hemispherical chargeon its surface is the same as the free air explosion of a charge with the same radius.This is equivalent to a ground charge with weight W , under the conditions described, hasthe same effect as the air charge with weight 2W . However, in most real situations asurface explosion results in a crater, which is associated with energy dissipation relatedto the type of soil. A magnification factor of (1,7-1,8) is, most frequently, used wherethe approach for hemispherical blast is exactly the same as for the spherical blast, exceptthat the charge weight W is replaced by the equivalent weight, [Szuladzinski, 1940]. Theincident pressure ps from the ground burst may therefore be estimated from the air burstdata.
Ground
R R
r r
Air
(a) (b)
Air
Figure 4.2: (a): Free-air explosion, and (b): Surface burst. [Szuladzinski, 1940].
A more accurate magnification factor is based on test results stated in the technicalmanual [Unified Facilities Criteria, 2008], which are the same data used in ConWep. Theresults for ten different charge weights with the same range are obtained in both cases,spherical and hemispherical (surface) burst, and the results are compared to estimate themagnification factor for the present case. The charge weights vary between W/3 and 3W .The mean averaged value is found to be 1,644 for the magnification factor.
29

CHAPTER 4. PREDICTION OF BLAST LOADS
4.2 Pressure history determination by following Kin-ney, Graham and Brode
Detailed information, based on empirical data, about peak values of shock overpressure,as taken from [Brode, 1977] and used in [Guzas and Earls, 2010], are used to obtain theblast parameters, see appendix A. The procedure explained in appendix A for finding theblast parameters is applied for free-air burst but can be applied directly for the surfaceburst by using a magnification factor as mentioned before.
For the studied case, which is a hemispherical explosion, the blast parameters, the peakpressure values, impulses, arrival and positive duration time are obtained based on thesame equations after multiplying the charge weight W by a factor of 1,644 as describedin the previous section. The results are listed in table 4.1.
Pressure Peak pressure Impulse tA t0 Decay coefficient b[kPa] [kPa−ms] [ms] [ms] [ms]
Incident 1340 50,26 0,2215 0,4400 4,555Reflected 8135 305,37 0,2215 0,4400 4,555
Table 4.1: Peak pressure and the blast parameters obtained from appendix A.
The equations used in appendix A to determine the blast parameters assume that thedecay coefficient is the same for the incident and reflected pressure and thereby the onlydifference between them is the peak pressure value. The impulses are calculated using theintegral in eq. 1.2.
4.3 Pressure history determination at a point by Con-Wep
ConWep (Conventional Weapons Effects) is a software developed by the US Army basedon graphs and equations in the technical manual TM5-855-1; Fundamentals of ProtectiveDesign for Conventional Weapons. This software is based on empirical data collected onspherical air and hemispherical surface bursts following detonation of explosives weighingfrom 1 kg to 400.000 kg.
The studied case is illustrated in figure 4.3, where the plate surface is oriented normalto the wave propagation. This case represents the explosion of a hand grenade beneath aHumvee which is protected by the plate.
The program assumes an exponential decay of pressure with time. The modified versionof Friedlander’s equation (eq. 1.1) is used in the program to describe the pressure-timerelation, where pmax is replaced by the side-on pressure or the reflected pressure. Based onempirical data, the air-blast parameters [the side-on pressure pso, reflected pressure, timeof arrival tA, positive phase duration t0, and the specific side-on impulse is] are calculated.The program iterates to find the decay parameter b that makes the area under the time-pressure curve equal to the calculated impulse. The program then uses the Friedlander
30

4.3. PRESSURE HISTORY DETERMINATION AT A POINT BY CONWEP
RG
w
Plate
Ground
Figure 4.3: Load case set up for hemispherical air burst. Protective plate located horizon-tally to the ground above an explosive charge.
equation to find the pressure values at different time steps.Note that the time of duration t0 of the modified Friedlander equation is measured fromtime t = 0.
The program contains a library of standard weapons and lets the user chose from itor even insert new data to define the weapon. For the hand grenade DM51 which is notlisted in the library, the data are inserted manually where the total weapon weight is 0,45kg, the equivalent TNT charge weight is 0,0979 kg and the normal distance to the targetis 0,5 m. The program returns the data listed in table 4.2.
Pressure Peak Pressure Impulse tA t0 Decay coefficient b[kPa] [kPa−ms] [ms] [ms] [ms]
Incident 1299 113,04 0,2377 0,8883 0,0978Reflected 7705 421,5 0,2377 0,8883 0,0586
Table 4.2: Peak pressure and the blast parameters obtained by ConWep program for thepresent weapon (DM51 hand grenade).
31

CHAPTER 4. PREDICTION OF BLAST LOADS
4.4 Comparison of the results obtained by the two ap-proaches
The analysis of the structure accounts only for the positive phase, thereby the arrival timeis of no interest and the pressure-time curves are plotted with peak pressure at time t = 0.In table 4.3 the results from the two calculations are tabulated. Graphically, the pressure-time history of the two calculations are shown on figure 4.4. The two approaches result indifferent peak pressures and different positive times. Kinney, Graham and Brode predictshigher peak pressure but much lower reflected impulse which is the main parameter forthe design at the high pressure range.
Calculationmethod
Peak reflectedPressure [kPa]
Specific reflectedImpulse [kPa−ms]
Time ofDuration [ms]
Kinney et. al. 8135 305,4 0,2185ConWep 7705 421,5 0,8883Triangular ConWep 7705 421,5 0,1094
Table 4.3: Comparison between the blast parameters obtained by ConWep and Kinney,Graham and Brode.
0 0.1 0.2 0.3 0.4 0.5 0.6 0.7 0.8 0.9 1
Time [msec]
0
1
2
3
4
5
6
7
8
Ref
lect
ed P
ress
ure
[Pa]
106
ConWepKinney et. al.Triangular ConWep
Figure 4.4: Reflected pressure versus time for two different calculation methods and Con-Wep equivalent triangular distribution.
It can be seen that the results obtained by ConWep are more conservative and therebyused for the design of the protective plate in this study.
32

4.5. PEAK PRESSURE DISTRIBUTION ON THE PLATE BY CONWEP
4.5 Peak pressure distribution on the plate by ConWep
By comparing the results obtained by Kinney et. al. and ConWep program, it can beseen that results from ConWep are more conservative with respect to the impulse. Onthe other hand the peak pressures obtained by ConWep are slightly lower than resultsobtained by Kinney et. al. For a peak reflected pressure exceeds 7 MPa, the magnitude ofthe impulse is of great importance in design, it is thereby chosen to use the results fromConWep which are more conservative.
The peak pressure distribution over the plate is conducted using ConWep softwarewhere the parameters used are:• Plate with dimensions of 1 × 1 m.• Back surface representing the area of the Humvee floor as illustrated in figure 1.2.• The distance between the plate and the explosive point is 0,5 m.• The explosive weapon, hand grenade DM51, has an equivalent TNT charge weight
of 1,2× 0,0979 = 0,1175 kg, where 1,2 is to increase the charge weight a 20% extraas a safety factor [Unified Facilities Criteria, 2008].• The explosive point is located exactly under the protective plate center at the surface
of the ground representing a hemispherical surface burst.A graphical presentation of the configuration is shown in figure 4.3. Among other
parameters the peak reflected pressure, the specific reflected impulse and the durationof positive phase are returned from the program. The solution procedure is explained inappendix B.
Figure 4.5 shows the reflected pressure distribution over all the target plate. Theseresults are obtained by implementing the graphical data in [Unified Facilities Criteria,2008] using Matlab which are the same data used in ConWep program.
-0.5 0 0.5
Length[m]
-0.4
-0.3
-0.2
-0.1
0
0.1
0.2
0.3
0.4
Wid
th[m
]
3000
3500
4000
4500
5000
5500
6000
6500
7000
7500
Ref
lect
ed P
ress
ure
[Kpa
]
Figure 4.5: The peak reflected pressure over the target plate based on ConWep software or[Unified Facilities Criteria, 2008].
The maximum reflected pressure is of course at the closest location of the plate to thedetonation point. The distribution follows non-linear relation with respect to the angleof incident and also depends on the distance between the detonation point and the pointof interest at the target plate as shown in appendix B.
33


5 | Investigation of foamed aluminium
In the following chapter, the effect of the cell structure, orientation, and density on theenergy absorbing properties of a metal foam is investigated. An alternative structureutilising trusses is also studied as an alternative for the foam as the sacrificial layer in thearmour panel, i.e. the energy absorber.
Foamed aluminium is characterised as a cellular solid - as the relative density often isρf/ρs < 0,3 - and is made up by a network of interconnected struts and plates formingthe edges and faces of the cells, [Gibson and Ashby, 1997]. The foam exists in two con-figurations of either opened-cell or closed-cell (fig. 5.1) depending on their manufacturingmethod, where the opened-cell configuration is regarded as inconvenient and expensive tomanufacture. The mechanical properties of the two configurations of foam are very similarwhereas the open-cell structures generally are used for cooling applications, [Ashby et al.,2000]. Furthermore, the manufacturing process might introduce smooth sides of the panelresulting in some degree of anisotropy due to these sides of solid material. The level ofanisotropy without the solid sides is investigated in appendix C, but the investigation isinconclusive tending to find the foam isotropic.
50 mm
30 mm
Figure 5.1: Example of closed-cell aluminium foam. One of the test specimens in appendixC. Note the highly inhomogeneous size of the voids which is a tendency for the entire foamplate from which the test specimens are made.
5.1 General properties of aluminium foam
The properties of the metal foams are mostly governed by the material used in the pro-duction of it and on the relative density. The internal structure of the foam is likewisegoverning, but is often stochastic and very difficult to account for/imperfectly understood,[Ashby et al., 2000].
As mentioned, when a closed cell deforms, the cell walls bend and the cell faces carrymembrane stresses, which often is seen by an increase in stress during the plateau region,figure 5.3(a). Open-cell foams usually show a constant value in this region, as the idealizedcase in figure 5.3(b). The contribution to the overall stiffness when the cell faces stretch
35

CHAPTER 5. INVESTIGATION OF FOAMED ALUMINIUM
is linear in the relative density, and the contribution to the stiffness due to bending of thecell walls is non-linear in the relative density, [Olurin et al., 2000]. In [Gibson and Ashby,1997], a relation between the material yield strength, σy, and the yield strength/plateaustress of the foam, σpl, is established from experiments as
σplσy
= 0,3φ3/2 ρ3/2 + (1− φ) ρ (5.1)
where φ is the ’distribution constant’ and indicates the fraction of solid in the foamcontained in the cell edges (ρ ≤ φ ≤ 1) and the remainder of the fraction (1 − φ) islocated in the cell face. ρ is the relative density of the foam. The definition of the cellfaces and edges is shown in figure 5.2 along with the difference between a closed-cell andopen-cell foam.
Figure 5.2: The nomenclature of foams, and the difference between closed-cell (a) andopen-cell (b) foams. [Kranzlin and Niederberger, 2015].
A similar relation for the modulus of elasticity exists as
E
Es= φ2 ρ2 + (1− φ) ρ (5.2)
where Es is the modulus of elasticity for the solid material.For eqs. 5.1 and 5.2, limiting cases are φ = 0 for closed-cell foams, and φ = 1 for
open-cell foams. However, it is difficult to quantify the degree closed-cellness, but canfor known values be used opposite to define the degrees of closed/open-cellness of thefoam. In the present case, a closed cell (φ = 0) yields larger plateau stress and Young’smodulus than measured. There is no relation between the common equations, and themeasured values, perhaps suggesting the foam has greater variance in the parametersthan commonly experienced. Increasing the value of φ, i.e. an open-cell foam, ensuresconvergence.
36

5.2. FOAM USED IN THE PROJECT
The energy absorption of foam is given by the area under the stress-strain curve as
u =
∫ εD
0
σ dε (5.3)
where u is the strain energy density. The densification strain is, in cases where thetransition is not obvious, determined as the strain at which the compressive stress is twicethe value of the plateau stress σpl. As the plateau stress also varies, a slight increase isseen for closed-cell foams, this value is determined as the average stress in the range of5% - 30% strain.
In general, the damping capacity of the foam is five to ten times greater than for themetal it is made of, [Ashby et al., 2000]. This damping capacity is even greater in polymerfoams.
5.2 Foam used in the project
A closed-cell aluminium foam of alloy 5556 is available for use in the amour plate as theblast absorbing component. The determined material parameters of the aluminium foamare given in table 5.1.
Material parameter Designation ValueDensity of plate ρalu−pla 458 kg/m3
Relative density ρf/ρs 0,172 – –Modulus of elasticity E 336 ± 48,8 MPaDensification strain εD 0,480 ± 0,0504 – –Plateau strength σpl 4,77 ± 2,18 MPaStrain energy density u 2,19 ± 0,573 MJ/m3
Specific strain energy e 4737 ± 1324 J/kgPoisson ratio νalu ≈ 0
Table 5.1: Material parameters for the aluminium foam plate, please note the high standarddeviation. The modulus of elasticity is determined from the unloading slope of the foam,following a plastic strain in the order of 1% as described in [Olurin et al., 2000] to makesure the cells set. This is shown in figure 5.3(c), and the material test is documentedin appendix C. As the standard deviation suggests, the variation in the data is large andindicates an inhomogeneous material. This variance is in some cases unacceptable, whyan alternative is sought in sec. 5.3.
The quasi-static engineering stress-strain curve, figure 5.3(a) for selected specimens,for the aluminium is determined in the material test, and resembles other material testson closed-cell aluminium foams, as there is a strong dependency on the density. For theremaining specimens, see appendix C. Furthermore, the stress-strain curve is dividableinto three regions; 1) linear elastic region, 2) collapse region and 3) densification region,[Gama et al., 2001].
37

CHAPTER 5. INVESTIGATION OF FOAMED ALUMINIUM
As is suggested, region 1 represents the elastic deformation, and is due to bending ofthe cell walls.
Initially in region 2, the first walls of the cells start to plastically collapse, which isindicated by the slight drop in stress. For the remainder of the region, the cell wallscollapse in bending at near constant stress in the foam, commonly known as the ’plateaustress’. For maximum energy absorption it is desired that this region is as long as possibleuntil it reaches the densification strain, εD. A slight increase in stress during region 2 isalso possible, as the cell faces carry membrane stresses.
In region 3, the foam progressively collapses, densifies, and behaves as the solid mate-rial. [Gama et al., 2001]. A quasi-static material test is sufficient, as closed-cell aluminiumfoams are found to be strain-rate independent, [Yu et al. [1998], Yu et al. [1999], Sriramet al. [2006]]. The test, appendix C, is conducted at a maximum strain rate of 3,33 · 10−2
s−1 which relative to the strain rates in a blast load is deemed quasi-static. However, thisis assumed to have little influence on the material parameters and they should be validfor a blast application. In compression, the foam behaves almost elastic-perfect plastic,as seen in the idealised stress-strain curve in figure 5.3(b).
A major advantage of the foam is, that as long as it is not completely densified, theplastic stress wave propagating in the material doesn’t pass through. As the plastic waveleaves the foam behind fully densified, the plastic wave passes through the foam at thesame moment as the full densification occurs.
38

5.2. FOAM USED IN THE PROJECT
Region 1 Region 2 Region 3
(a) Dependency of the quasi-static stress-strain curve on density for closed-cell alu-minium foam. 1) linear elastic region, 2) collapse region and 3) densification region.Notice the drop in load in the low density foam specimens following the linear elasticregion, contrary to the high density specimen. This is assessed to be down to thesensitivity of wall collapse and softening in low-density specimens.
Strain ε
Stress σ
εD
E
σpl
Energy wv
(b) Idealised stress-strain curve for closed-cell alu-minium foam. εD: densification strain, σpl:plateau stress, and wv: specific energy. [Ashbyet al., 2000].
0 0.01 0.02 0.03 0.04 0.05 0.06
Strain [mm/mm]
0
0.5
1
1.5
2
2.5
3
Str
ess
[MP
a]
Stress-StrainSlab specimen 2
(c) Determination of the modulus of elasticity fromthe unloading of the foam following a small plasticstrain.
Figure 5.3
39

CHAPTER 5. INVESTIGATION OF FOAMED ALUMINIUM
5.3 An option for replacing the aluminium foam
It is noted throughout the experiments on the aluminium foam, that a great variance inthe material parameters is present based on which part of the aluminium foam plate thetest specimen is cut from, due to inhomogeneous density distribution as the manufacturingprocedure, i.e. control of buble growth, is difficult to control. This is in some applicationsunsustainable and an alternative is sought, at least for applications requiring well definedmaterial parameters or enhanced material parameters e.g. the plateau strength, but wherea higher cost is tolerable, i.e. the mounting points for the armour plate on the chassis.
A micro-truss system is trialled as a replacement for the aluminium foam. The micro-truss plate in figure 5.4 has a core density of ρµ−truss = 274 kg/m3 which results ina relative density of ρ/ρs = 0,1014 as it is conceived from aluminium 6061-T6 with adensity of ρs = 2700 kg/m3. Comparable, this is a lower density than the aluminiumAlulight foam described previously, see table 5.1 for the material parameters.
The suggested geometry of the initial micro-truss concept, figure 5.4, is taken from[Queheillalt et al., 2008].
5 mm
19 mm 25 mm
3 mm 50⁰
Figure 5.4: A sketch of the initial micro-truss structure with the independent definingparameters; core thickness, truss width and face thickness. Density of the core is ρµ−truss =274 kg/m3. From [Queheillalt et al., 2008].
As the micro-truss structure is not manufactured, it is not possible to conduct a ma-terial test on a test specimen for determining the material parameters and compare themagainst the aluminium foam. A comparison by a numerical study is therefore the only op-tion. For the aluminium foam, both experimental and numerical data has been obtained.This data is used for verification of the stress-strain curve obtained using numerical sim-ulations, by comparing it against the data obtained in the foam material test describedearlier in section 5.2 and appendix C. This is seen in figure 5.5. It shows a good corre-lation between the numerically and experimentally obtained strees-strain curve, and it isassessed that numerically obtained stress-strain curves yields a sufficiently accurate rep-
40

5.3. AN OPTION FOR REPLACING THE ALUMINIUM FOAM
resentation of the reality in both the linear- (region 1) and plateau-region (2), and cantherefore be used for the micro-truss studies self-sufficient.
0 0.1 0.2 0.3 0.4 0.5 0.6
Strain [mm/mm]
0
2
4
6
8
10
12
14
Str
ess
[MP
a]
ExperimentalNumerical
Figure 5.5: Comparison of the experimental and numerical data for aluminium foam incompression. A satisfying correlation exists and permits a direct comparison of two setsof numerical data for the foam and the micro-truss structure respectively.
The stress strain curve for the micro-truss structure (fig. 5.4) is shown in figure 5.6. Itis seen that a single layer of the micro-truss structure shows relatively great strength untilthe bifurcation point at where initiation of inelastic buckling of the trusses takes placeand a plastic ’hinge’ forms. Hereafter the core softens until the deformed trusses makecontact with the face sheets, i.e. densification.
0 0.05 0.1 0.15 0.2 0.25 0.3 0.35 0.4 0.45 0.5
Strain [mm/mm]
3
4
5
6
7
8
9
10
Str
ess
[MP
a]
Figure 5.6: Compressive stress strain curve for the micro-truss structure in figure 5.4. Agreat amount of softening due to plastic buckling takes place in region 2, i.e. the plateauregion. Complete densification is reached at strain 0,44.
41

CHAPTER 5. INVESTIGATION OF FOAMED ALUMINIUM
5.3.1 Adjusting the structural response
It is possible to adjust the properties of the micro-truss structure by modifying the geom-etry of the trusses and adjusting the relative density. The structure is thereby modifiablefor a variety of applications, e.g. increasing the layers of the truss structure increase orcreate a plateau of collapse stresses, see figures 5.7. The boundary conditions, or sym-metry conditions, for the models mean that the trusses in the outer planes are restrictedfrom deformation in the outward direction, the effect of this is treated later.
(a) 2x2 structure. (b) 2x4 structure. (c) 2x6 structure.
0 0.1 0.2 0.3 0.4 0.5 0.6 0.7 0.8 0.9
Strain [mm/mm]
0
50
100
150
Str
ess
[MP
a]
2x22x42x4 fast2x6
(d) Stress-strain curve for the structures. Initial strain rate for fast: 816 s−1, and for regular: 408 s−1.This also explains the initial shift in the ’fast’ curve to a strain twice as large as the other curves.
Figure 5.7: The effect of multiple layers of micro-trusses. Note the plateau-like deforma-tion similar to the metallic foams, and the method to increase/decrease the duration ofthis region, i.e. the point of densification. The softening is due to plastic buckling of thetrusses. Strain rate independency seems to exists, but for the delayed response. The ef-fects of the boundary/symmetry conditions in the simulations are not exactly disclosed, butbelieved to indirectly cause the fluctuation in the stress/strain curve as deformed trussesengage/disengage. The effect of width has been tested, and shown negligible differences.
42

5.3. AN OPTION FOR REPLACING THE ALUMINIUM FOAM
Different adjustments of geometries are shown in figure 5.8. It is here seen, that therelative density of the core is very important. The two cases of identical relative densityshow the same level of plateau strength, but in the case of the thin structure, increas-ing the number of cells stabilise the core behaviour and yield a more constant plateaustrength. The aspect ratio in the two cases are identical, so it must be do to the trussessupporting each other. However, this effect is not seen for the 4x4 standard thicknessstructure, it infacts destabilize the core and thereby the plateau region and one couldtherefore suspect it is due to numerical discrepancies, i.e. arbitrary mesh generation foreach simulation. This might explain some of the fluctuation in the curves.
It is also shown, how the plateau strength can be altered by changing the thicknessof the trusses and thereby the bifurcation point and the relative density of the trussesand core geometry. Quite significant differences are achieved by halving or doubling thestandard thickness of 3 mm, both for the plateau strength and the densification strainas the increase in thickness of the trusses entail inter-contact sooner. The micro-trussstructure is thereby adjustable for specific uses, i.e. the micro-truss structure with a verylow plateau strength but a notable high densification strain can be used for protectionof delicate components. A normalization of the stresses with respect to the density isperformed on the same stress-strain data, and shown in figure 5.9.
0 0.1 0.2 0.3 0.4 0.5 0.6 0.7 0.8
Strain [mm/mm]
0
0.5
1
1.5
2
2.5
3
Nor
mal
ised
Str
ess
[Pa/
kg/m
3]
105
2x24x4 small cells2x2 thin walls4x4 small cells, thin walls2x2 thick walls4x4 small cells, thick walls
Figure 5.9: The stress-strain curve of figure 5.8(g) normalized with respect to density. Thesame tendencies as without the normalisation are seen.
43

CHAPTER 5. INVESTIGATION OF FOAMED ALUMINIUM
(a) 2x2 structure, standard.ρ/ρs = 0,242
(b) 4x4 structure, standard.ρ/ρs = 0,242
(c) 2x2 structure, thin.ρ/ρs = 0,200
(d) 4x4 structure, thin.ρ/ρs = 0,200
(e) 2x2 structure, thick.ρ/ρs = 0,298
(f) 4x4 structure, thick.ρ/ρs = 0,298
0 0.1 0.2 0.3 0.4 0.5 0.6 0.7 0.8
Strain [mm/mm]
0
20
40
60
80
100
Str
ess
[MP
a]
2x24x4 small cells2x2 thin walls4x4 small cells, thin walls2x2 thick walls4x4 small cells, thick walls
(g) Stress-strain curve for the three pair of cases of thickness and cell size. The plateau stress of the ’2x2thin’ version is 0,4 MPa.
Figure 5.8: Comparison of geometry effect on the micro-truss core structure.
44

5.3. AN OPTION FOR REPLACING THE ALUMINIUM FOAM
It was mentioned earlier, how the boundary conditions of the simulations are applied.An attempt is made to loosen this boundary or symmetry condition and investigate theeffects of doing this. It should be noted however, that the project group assess that usingthe boundary conditions is the closest resemblance of the actual case. Unfortunately, ithas been impossible to determine which of the boundary condition that is the most correctoption as experiments have not been performed. The effect of the stress-strain curve isshown in figure 5.10 where an unfortunate significant difference is seen.
0 0.1 0.2 0.3 0.4 0.5 0.6 0.7 0.8
Strain [mm/mm]
0
20
40
60
80
100
120
Str
ess
[MP
a]
2x22x2 free sides
Figure 5.10: Comparison of the effect of the boundary condition on the stress strain curvefor the simulations on the micro-truss cores.
The deformation of the micro-truss core happens as shown in figure 5.11 for the 4x4thin structure. The deformation propagates through the core layerwise, which is similarto the densification front for the metallic foam.
5.3.2 Tetrahedral truss core structure as an alternative
Investigations of the statics of respectively a tetrahedral and pyramidal core are conductedin [Deshpande and Fleck, 2001]. This study shows, that there is no difference in strengthand stiffness in the normal direction between the two core geometries. The only differ-ence is, that the pyramidal core shows a greater degree of anisotropy in shear strength,[Deshpande and Fleck, 2001], why a pyramidal truss core structure is maintained. Fur-thermore, the study showed that an inclination of the trusses of 45 maximises the shearstrength and stiffness whereas the normal stiffness and strength of course is maximised atan inclination of 90. The current configuration has an inclination of 50 which offers agood compromise between normal compression and shear strength.
45

CHAPTER 5. INVESTIGATION OF FOAMED ALUMINIUM
(a) 0 ms. (b) 0,192 ms. (c) 0,384 ms.
(d) 0,576 ms. (e) 0,768 ms. (f) 0,960 ms.
Figure 5.11: Propagation of the deformation front by layerwise plastic buckling in themicro-truss core structure. Simulation performed on the 4×4 thin structure. Boundarycondition is set to strict, i.e. no outwards movement of the side nodes.
5.3.3 Summary of micro-truss study
The study of the micro-truss structure is summarised in the following section.
- There is good correlation between experimental data and numerical data for themetallic foam. It is therefore decided, that an approach utilising only a numericalstudy of the micro-trusses is sufficient.
- The micro-truss core shows a varying degree of softening in the second region, i.e.the plateau region. This is due to the forming of a hinge or plastic buckling ofthe trusses. It seems to be a general observation in all the simulated models butit is indecisive how to remove this effect as introduction of e.g. smaller cells yieldsvarying results, see figure 5.8. This observation is the opposite of the metallic foamin which a slight hardening during region 2 is noticed.
- It is in these studies noticed, that the micro-truss structure, like the metallic foam,appears to be strain rate independent. Granted, a broad study of this phenomenahas been neglected, and a definitive conclusion is therefore premature.
46

5.3. AN OPTION FOR REPLACING THE ALUMINIUM FOAM
- The plateau region, i.e. region 2, is extendable by increasing the quantity of layers,i.e. increasing the thickness of the core, figure 5.7.
- It is possible to achieve a similar response by increasing/decreasing the thickness ofthe trusses in the core. However, this also influence the plateau strength of the corein upward or downwards direction respectively, i.e. there is a great dependency ofthe response on the relative density
- The material parameters for the 2x2 thin thickness micro-structure is shown intable 5.2, and a direct comparison with the foam (experimental data) is also shownin this table as the densities are close. However, the micro-truss structure is highlyconfigurable, as shown in the previous section
Material parameter Designation Value µ-truss Value foamDensity of plate ρµ−truss 539 458 kg/m3
Relative density ρµ/ρs 0,200 0,172 – –Modulus of elasticity E 419 336 ± 48,8 MPaDensification strain εD 0,75 0,480 ± 0,0504 – –Plateau strength σpl 3,16 4,77 ± 2,18 MPaStrain energy density u 2,28 2,19 ± 0,573 MJ/m3
Specific strain energy e 4229 4737 ± 1324 J/kg
Table 5.2: Comparison of the numerical obtained data for the micro-truss structure; 2x2thin thickness configuration, against the material parameters for the aluminium foam platefrom experimental data. See appendix C for the material test.
Finally, the manufacturing method used might entail different failure modes. In thecases studied above the manufacturing method is expected to be extrusion followed bywire electric discharge machining transverse to the extrusion direction. This entail nosignificant weaknesses in the interface of the truss and face-sheet, but is a costly manu-facturing method. Another manufacturing method is perforation of a plate, followed bya folding of the perforated plate into the desired pyramidal geometry. The layers andface-sheet are thereafter connected by brazing. This is a cheaper method, but in somecases entail failures in the nodes instead of buckling, [Queheillalt et al., 2008].
47


6 | Analytical study
This chapter includes an analytical study for deformation of the metallic foam underblast load. Parameters influencing the total capacity of energy absorption of the protec-tive plate are also investigated with the objective of enhancing the understanding of thegoverning parameters. The analysis is divided into two steps. For the first; two analyt-ical approaches for the response of the protective plate under uniform blast loading arepresented. For the second; the response of a protective plate under spherical blast load-ing is investigated. Furthermore, a comparison of the results with numerical simulations,comments and observations are presented.
6.1 Response of a protective plate subjected to a uni-form blast load
Analysis of metal foam response under blast load can be divided into two approaches[Zhou et al., 2015]. The first, the target is assumed at a sufficient distance from theexplosion where the blast load is considered uniformly applied to the target plate. Asa consequence, the response is one dimensional and the front panel doesn’t deform ordissipate any energy. This approach is investigated in subsequent sections. The second,the target is close to the detonation point and the blast load is distributed exponentiallyover the target plate as can be seen subsequently. This distribution requires a deformationof the front panel where the deformation profile is similar to the load profile and thereby,energy dissipated by the front panel deformation must be accounted for as explained laterin section 6.3.
For the first case, where the protective plate consists of a metallic foam covered by ametallic front panel figure 6.1, the optimal thickness of the foam and the front panel canbe found [Ashby et al., 2000].
p(t)
v
Ht
Reaction wall
Foam Front panel
mp
hp hf
mf
Figure 6.1: 1D model system of foam plate with front panel subjected to a blast load. Theplate is of total thickness Ht, cross-sectional area A. The initial velocity of the front panelis given by v.
49

CHAPTER 6. ANALYTICAL STUDY
A blast imparts an impulse i per unit area as given in eq. 1.2. Assuming that the frontpanel of density ρp and thickness hp accelerates from zero velocity to v instantaneouslywhere the specific impulse i imparts a momentum Mp for a unit area of the front panel
Mp = ρp hp v = i (6.1)
This initial velocity means an initial specific kinetic energy es [J/m2] of the front panel
es =1
2ρp hp v
2 =i2
2 ρp hp(6.2)
This energy must be dissipated by the foam. Assuming wv is the energy dissipated bya full densification of a unit volume of the foam and hf is the thickness of the foam, itcan be written
es = wv hf ⇒ hf =i2
2 ρp hpwv=D
εD(6.3)
this yields the deformation of the foam for given impulse
D =i2
2 ρp hp σpl(6.4)
where wv ≈ σpl εD is the area under the stress-strain curve, see figure 5.3(b), D is thedeformation distance the front panel crosses and εD is the densification strain of the foam.It is assumed here that the pressure is uniform at the front panel, this is sufficient whenthe target is far enough from the explosive point, thus, no energy consumption by bendingor membrane of the front panel is considered in this discussion.
For most design cases, reducing the total mass is the most important task where themass for a unit area on the protective plate mt is the sum of the front panel mass mp andthe foam mass mf per unit area
mt = mp +mf = ρp hp +ρf i
2
2 ρp hpwv(6.5)
and minimizing the mass mt with respect to the front panel mass mp leads to mp = mf .It means that for the best design (minimum mass) the foam and front panel must be
equal in mass, and hereby the thickness of the front panel is simply related to the foamthickness as
hp =ρfρphf (6.6)
and the total mass per unit area can be written as
mt = 2 mf = i
√2 ρfwv
(6.7)
The above discussion quickly shows the minimum mass of the plate to absorb thekinetic energy imparted in the front plate by the impulse of the blast wave and can be
50

6.1. RESPONSE OF A PROTECTIVE PLATE SUBJECTED TO A UNIFORMBLAST LOAD
used for a quick estimate of the necessary foam thickness for blast applications. On theother hand, the total thickness of the protective plate is
Ht = hp + hf = hp +i2
2 ρp hpwv(6.8)
Minimizing the total thickness Ht with respect to the front panel thickness hp leads tohp = hf . This can be applied for the cases where the size is more important than theweight of the protective panel.
6.1.1 Another approach for a response of aluminium foam bar
The model above describes the deformation based on kinetic energy saved in the frontpanel neglecting the effect of the densified foam inertia during deformation. This effectcan be significant especially for thin or even no front panel where the kinetic energy hasto be transferred to this densified layer of the foam.
This model is based on the work in [Hanssen et al., 2002] for determining the one-dimensional deformation in an aluminium foam bar under the assumption of a linearlydecaying blast load. The model is summarized here and explained in details in appendix D.This model accounts for the increase in mass at the proximal end during the deformationprocess. The model is shown in figure 6.2 and consists of a foam bar covered by a frontpanel of mass mp and area A loaded by a blast loading p(t) while it is fixed to a rigid wallin the distal end.
p(t)
u(t)
ρ
L
Reaction wall
Foam barFront panel
mp
Proximal end Distal end
Figure 6.2: 1D model system of foam bar with front panel subjected to a blast load. Thebar is of length L, cross-sectional area A and mass mf = ρAL. The deformation of thebar is given by u(t). [Hanssen et al., 2002].
In figure 6.3 the model system at time t and t + dt is shown. The foam bar startsdeforming in the loaded end/proximal end, and a densification front moves through thematerial resulting in the left part of the foam becoming completely densified achievingthe same velocity as the rigid front panel, whereas the remaining right part is not affectedby this deformation, [Hanssen et al., 2002].
51

CHAPTER 6. ANALYTICAL STUDY
p(t) A
p(t+dt) A
u u, u
mp ρs
x
σpl A σpl A
ρs
z = l–x–u
ρ
dx/(1-εD)
Reaction wall
u + du u+du, u+du
σD Aρs
x dx
σpl Aρ
Reaction wall
[Compacted zone] [Non-compacted zone]
σpl
σD
t t+dt
Stress at compacted distance x
[t:]
[t + dt:] mp
Figure 6.3: FBD at time t and t+ dt. [Hanssen et al., 2002].
Using conservation of mass, and the size of the compacted zone x, and the displacementof the front panel u for time t is
u =εD
1− εDx (6.9)
In the time interval of t to t+ dt, the impulse from the forces has to equal the change inmomentum of the element, [Hanssen et al., 2002].
ρsAdx (u+ du) = (σD − σpl)Adt (6.10)
Assuming that the second order term dx du is negligible, then by dividing with dt andtaking the limit dt→ 0
σD = σpl +ρ
1− εDx u note ρs =
ρ
1− εD(6.11)
Similarly, the conservation of momentum (Newton 2nd) for the front panel and compactedregion (rigid body) to the left of the element dx gives[
mp +ρA
1− εDx
]u+ (σD − p(t)) A = 0 (6.12)
By combining eqs. 6.9, 6.11 and 6.12, a single differential equation is obtained[1 +
ρA
mp εDu
]u+
ρA
mp εDu2 + (σpl − p(t))
A
mp
= 0 (6.13)
52

6.1. RESPONSE OF A PROTECTIVE PLATE SUBJECTED TO A UNIFORMBLAST LOAD
which is a second order differential equation and its solution, see appendix D, for theproper boundary conditions yields
Da ≥I2
(ρL+ 2 ρp hp) p0
(p0σpl− 4
3
),
p0σpl
> 2 (6.14)
which can be written as
b1Da2 + b2Da + b3 = 0 (6.15)
where
b1 =ρ
εDb2 = 2 ρp hp
b3 = − I2
P0
(P0
σpl− 4
3
)where Da = LεD is the deformation of the foam bar, I is the reflected impulse in Pa s,ρp, hp are the density and thickness of the front panel respectively and p0 is the peakpressure.
The main difference between eq. 6.4 and eq. 6.15 is that the first one doesn’t accountfor the inertia of the foam during deformation. The result of a numerical simulation of thesame case is plotted together with the results obtained by the two different approaches infigure 6.4. It can be seen that [Ashby et al., 2000] overestimates the deformation of thefoam as the mass of the foam and its inertia is absent from the eq. 6.4.
0 2 4 6 8 10 12 14
Front panel thickness [mm]
0
2
4
6
8
10
12
14
Def
orm
atio
n [m
m]
Ashby et al.Hansen et al.Numerical
Figure 6.4: Deformations obtained numerically and by eqs. 6.4 and 6.15 for differentfront panel thicknesses. The peak pressure pr = 13,7 MPa and the panel density ρp =2700 kg/m3.
53

CHAPTER 6. ANALYTICAL STUDY
For a relatively large front panel mass, the densified foam mass has less influence onthe results where the panel mass is dominant and the results of the two approaches seemto converge towards the numerical solution as hp −→∞. On the other hand, for a thinnerfront panel where the mass becomes small and the influence of the foam mass becomesvery noticed, the results become quite different and eq. 6.4 seems to overestimate thedeformation.
For a foam plate without a face sheet, eq. 6.4 cannot be used while eq. 6.15 is still ableto yield the deformation of the foam. However, both methods are only applicable for auniform loading case, why a model for the plate-response under a non-uniform distributedload is investigated next.
6.2 Response of a target plate subjected to a sphericalblast load
The solutions described above can be used to calculate the minimum length/deformationof a foam plate or bar covered by a front panel only when the load can be assumed uni-form. In this section the distribution of the load produced by relatively close range burstis considered. Thereby, the shape and depth of deformations over the protective plate areconsidered based on energy methods.
A structure can be disturbed from its normal position of static equilibrium by givingit an initial displacement or initial velocity. The structure vibrates with a period of oscil-lation dependent on its mass and a factor characterizing the resistance that the structuredevelops. For an elastic structure, this resistance is characterised by a stiffness of a spring.The amount of damping determines the amplitude of vibration. An initial velocity can bederived from an impulse applied to the structure [Smith and Hetherington, 1994]. When astructure is forced to vibrate by the application of a time dependent loading, the responseis termed forced vibration. A forcing function representing the blast load exciting thestructure can be found from the triangular load pulse as shown in figure 6.5 where t0 isthe positive phase duration of the blast wave which produces a peak force on the struc-ture F . Any impulse causes an increment in velocity of the system, in accordance withNewton’s second law, which states that an impulse I produces a change in momentum.Thus
velocity change =force× time
mass
Thus, the forces acting on a structure associated with a plane shock wave are dependentupon the impulse of the incident shock pressure where the force acting on any finite elementof the structure is a function of the impulse acting on that element.
54

6.2. RESPONSE OF A TARGET PLATE SUBJECTED TO A SPHERICAL BLASTLOAD
F(t)
t
F
t0
F(t) = F [1- t/t0]
Figure 6.5: Idealised blast load pulse [Smith and Hetherington, 1994].
6.2.1 Deformation Profile
A target plate consisting of a metallic foam, with or without a thin face sheet, undergoesplastic deformation when exposed to a blast wave producing a peak pressure higher thanthe strength of the foam material, i.e. the plateau stress. For a fully supported plate thedeformation profile must be similar to the load profile as in figure 6.6. The pressure-timecurve for a point of the target differs from that of another point located at a differentdistance from the detonation point. Besides this, the duration of the positive phase andthereby the impulse acting on the target plate is a spatial function, see appendix B.
Blast Load
Foam Plateau Stress
Metal foam
D0
η
Figure 6.6: Load and deformation profile of a metallic foam exposed to a blast load. D0
is the maximum depth of the bulge and η is the radius of the bulge. Modified from [Zhouet al., 2015].
55

CHAPTER 6. ANALYTICAL STUDY
As the blast load lasts for an extremely short duration, typically from several microsec-onds to 1 ms, it is often simplified as a triangular load with zero rise time [Smith andHetherington, 1994]. By using the equivalent triangular reflected pressure shown in figure4.4, which indicates that the reflected pressure is maximum at t = 0 and zero at t = t0
′ ,the reflected pressure at any point of the target is
pr(t) = prα
(1− t
t0′
)(6.16)
where prα is the peak reflected pressure at the point of interest which has an incidenceangle α. It must be noted that the equivalent triangular pressure depends on the impulseat the considered point which means that the equivalent positive time t0
′ has differentvalues for the different points.
A spatial function describing the impulse at any point can be approximated based onthe distribution shape of the impulse which is, sometimes, similar to a bell function andthereby can be fitted to a Gaussian function [Zhou et al., 2015].
Ir(r) = Ir(0) e− r2
2C12 (6.17)
where Ir(0) is the impulse value at the bulge center and C1 is the characteristic size ofthe blast loading area, following the standard deviation of the data – where the functionvalue becomes 1% of its peak value at the point r = 3C1 – which can be found from thedata obtained in section 4.5, r is the radius of a circle that concentric with the bulge areaexposed to the blast and Ir(r) is the reflected impulse at distance r from the center. Thedeformed area is defined by the reflected pressure and the total resistance of the targetplate Rt. This resistance consists of the plateau stress, the inertia of the front plate,bending resistance of the front plate and the membrane resistance of the front plate.
The plate undergoes a plastic deformation as long as the peak reflected pressure ishigher than the total resistance of the target plate.
6.2.2 Determination of the bulge profile for a protective plate
For a metallic foam with a very thin face sheet(skin), as the aluminium foam used in thisstudy, the only resistance to deformation comes by the plateau stress of the foam, wherebending and membrane forces are too small in this case and therefore neglected.At some distance η from the bulge center the reflected pressure is equal to the plateaustress and no deformation occurs after this point, see figure 6.7. As the reflected pressurestill has a value outside the area defined by η, although this value is less than the plateaustress, it causes an impulse which gives an initial velocity to the face sheet. This initialvelocity for all points outside the bulge area is not enough to produce a plastic deformationin the foam. When applying an energy method for obtaining deformations, only plasticdeformations are considered as seen subsequently.
56

6.2. RESPONSE OF A TARGET PLATE SUBJECTED TO A SPHERICAL BLASTLOAD
The distribution of the reflected peak pressure can also be approximated as a Gaussianfunction where it is rewritten as
prα = pr0 e− r2
2C12 (6.18)
where pr0 is the peak reflected pressure at zero angle of incidence, C1 is the characteristicsize of the deformed area as defined earlier, the data obtained in section 4.5 can be usedto find the radius r for any value of prα and thereby C1 can be determined. Note that thecharacteristic size C1 is assumed identical in both impulse and pressure functions whichis not the case for the whole set of data, but within the bulge area it is found to be areasonable approximation.
Equating the plateau stress with eq. 6.18 yields η, i.e the bulge radius
prα = σpl ⇒ η = C1
√2 ln
pr0σpl
(6.19)
It can be seen that the area outside a circle of radius η and center at the closest pointto the detonation point remains undeformed, see figure 6.7.
Foam Plateau Stress
Metal foam
Peak Pressure
Impulse
Velocity Profile
DeformationD0
η
Figure 6.7: Pressure, Impulse, Velocity and Deformation Profiles of a metallic foam withthin face sheet exposed to a Blast load, D0 is the maximum depth of the bulge and η is theradius of the bulge. Modified from [Zhou et al., 2015].
Each point within the deformed area of the target plate is subjected to an impulsewhich, if assumed that this impulse is imparted onto the face sheet before deformationstarts, gives this point an initial velocity v0 before deformation starts and comes to rest- by the action of the net forces as Newton second law states - when deformation ends.This initial velocity differs from one point to another as the impulse does.
57

CHAPTER 6. ANALYTICAL STUDY
For a bulge area A with radius r and velocity field v0(r) the momentum MA over theentire area can be obtained
MA =
∫A
ρp hp v0(r) dA (6.20)
where ρp and hp are the density and thickness of the face sheet respectively. This equationgives the momentum for the face sheet assuming that the impulse produced by the blastis converted into a momentum saved in the face sheet. The total impulse the bulge areaA is subjected to can be obtained by integrating eq. 6.17 over the area
IA =
∫A
Ir(r) dA (6.21)
Equating eqs. 6.20 and 6.21 yields the velocity as a function of r
v(r) =Ir(r)
ρp hp=Ir(0)
ρp hpe− r2
2C12 = v0(0) e
− r2
2C12 (6.22)
This equation shows that the initial velocity of the bulge center can be reduced by in-creasing the face sheet density and/or thickness. It is seen from eq. 6.22 that the velocityhas the same characteristic size C1 but peak value.
The total kinetic energy Ek carried by the bulge area of the face sheet is the summationof kinetic energies of all material points of the bulge area where
Ek =
∫A
1
2ρp hp v0
2(r) dA =π [Ir(0)]2C1
2
2 ρp hp
(1− σpl
2
pr02
)(6.23)
whee A = π η2 is the bulge area.
The metallic foam has to dissipate this kinetic energy during its plastic deformationwhere the energy absorbed by the plastic deformation of the front panel is neglected inthis section.
To obtain the deformation profile at any point of the plate, it is assumed that the workdone by the resistance of the foam within the bulge area is equal to the kinetic energycarried by the bulge area. At the bulge edge, the peak reflected pressure is equal to theplateau stress. Thus, no deformation occurs after that point. It can be assumed that thedeformation function has the general form
D(r) = D0 e− r2
2C22 (6.24)
where C2 = η/3 is the characteristic size of the function. At the bulge edge where r = η,the deformation is equal to 1% of the peak deformation value and thereby neglected.
58

6.2. RESPONSE OF A TARGET PLATE SUBJECTED TO A SPHERICAL BLASTLOAD
Hence, the work done by the foam resistance is
W =
∫A
σplDr dA = 2π σplD0C22 (6.25)
equating eqs. 6.23 and 6.25 yields the peak deformation value at the bulge centre
D0 =[Ir(0)]2 C1
2
4σpl ρp hpC22
(1− σpl
2
pr02
)(6.26)
and the minimum foam thickness needed at the bulge centre is
hf ≥D0
εD(6.27)
It is clear from eq. 6.26 that increasing the plateau stress, the face sheet density and/orthe face sheet thickness decreases the maximum deformation at the bulge center. This alsoincreases the weight of the plate which is not desired. Increasing the front panel thicknessand/or density leads to less foam thickness hf and mass mf . The relation between thefront plate thickness and the total thickness, for W = 0,1175 kg TNT and R = 0,5 m, isshown in figure 6.8(a) and the detailed results are listed in table 6.1.
Case Minimum Mass Minimum ThicknessMaximum deformation [mm] 7,7 3,1
Panel thickness [mm] 2,6 6,5Foam thickness [mm] 16 6,4Total thichness [mm] 18,6 12,9Panel mass [kg/m2] 7,03 17,55Foam mass [kg/m2] 7,32 2,93Total mass [kg/m2] 14,35 20,48
Table 6.1: Minimum values and associated thicknesses and masses of the protective plate.The results obtained by eq. 6.26. The explosive charge weight W = 0,1175 kg, the rangeR = 0,5 m, the front panel density ρp = 2700 kg/m3, the foam density ρf = 458 kg/m3,thepeak reflected impulse at the bulge center I0 = 421,5 Pa s and the plateau stress σpl = 4,77MPa.
It can be seen from table 6.1 that the total mass at the minimum point converges todistribute equally between the foam and the front panel, mp = mf which is consistentwith the result found in section 6, the same result is found for the minimum thickness aswell where the two thicknesses become equal at the minimum thickness of the plate, seefigure 6.8(a). However, a design point can be found between these two optimum pointsby weighting the two functions.
59

CHAPTER 6. ANALYTICAL STUDY
0 0.005 0.01 0.015
The Front Panel Thickness [m]
0
0.02
0.04
0.06
0.08
0.1
0.12
0.14
0.16
0.18
0.2
The
Tot
al P
late
Thi
ckne
ss [m
]
0.0065
0.013Min
(a) The minimum total thickness of the plate
0 0.005 0.01 0.015
The Front Panel Thickness [m]
0
20
40
60
80
100
120
140
Spe
cific
Tot
al m
ass
[kg/
m2]
14.34
0.0027
Min
(b) The minimum total mass of the plate
Figure 6.8: The optimum values of the protective plate, the charge weight W = 0,1175kg and the range R = 0,5 m: (a) The total specific mass mt = 20,48 kg/m2 when thethickness is minimum. (b) The total thickness Ht = 18,6 mm when the mass is minimum.
60

6.3. BENDING AND MEMBRANE ENERGY
6.3 Bending and membrane energy
The results obtained above contain a relatively thick front panel, around half the totalthickness, where the maximum deformation at the bulge center is D0 = hf εD. Figure 6.8shows that the deformation of the front panel is equal to half its thickness and approxi-mately three times the thickness for minimum thickness and minimum mass respectively.The bulging process is thereby governed by the membrane forces and the contributionfrom bending can be neglected [Goel et al., 2013]. Thus, including the membrane energyyields even lighter and/or thinner protective plate than the results shown in figure 6.8.
The plastic strain energy for large deformation of a rigid plastic membrane with anaxissymmetrical bulging is given in [Teeling-Smith and Nurick, 1991] as
Ed = π hp
∫ η
0
YD
(1− ν − ν2)12
(∂D
∂r
)2
r dr (6.28)
where YD is the dynamic yield stress for the front panel material, ν is Poisson’s ratio forthe panel and D is the deformation profile defined by eq. 6.24.
At time t = 0 before deformation starts, the initial velocity of the front panel is aspatial function defined by eq. 6.22. At time t = t1 < tm, the deformation at the bulgecenter is assumed to be x0 and the spatial deformation function x(r) is similar to eq.6.24, the deformation velocity at the bulge center is a function of deformation distancevD = f(x).The front panel decelerates from v = v0 at t = 0 to v = vD at t = t1. Assuming that thedeformation velocity is a linear function of the deformation distance yields
vD(r) = −v0(r)D(r)
x(r) + v0(r) =
(v0(0)− v0(0)
D0
x0
)e− r2
2C12 (6.29)
where v0(r) is given in eq. 6.22 hence, the deformation velocity is a two dimensionalfunction.
At maximum deformation x0 = D0 and the deformation velocity becomes zero over allthe bulge area. The work done by the resistance of the plateau stress within the bulgearea up to t = t1 is
W =
∫A
σpl x(r) dA = 2π σpl C22 x0 (6.30)
At time t1, the fully densified foam moves with the front panel at the same velocity vD(r).A conservation of energy yields
Ek = Ed +W +
∫A
1
2(ρp hp + ρf x) vD(r)2 dA (6.31)
where Ek is the total kinetic energy as given by eq. 6.23.
61

CHAPTER 6. ANALYTICAL STUDY
Substituting eqs. 6.23, 6.28, 6.29 and 6.30 in eq. 6.31 and manipulating the resultantequation yields
aD02 + bD0 + c = 0 (6.32)
where
a =hp YD
(1− ν − ν2)12
b = 4σpl C22
c = −ρp hpC12 v0(0)2
(1− σpl
2
pr02
)The required dynamic yield stress YD for the front panel is calculated using an iterative
procedure [Teeling-Smith and Nurick, 1991] by
96421,8 I2√YD
= 40
(YDσy− 1
)5
(6.33)
where I is the impulse imparted onto the front panel and σy is the static yield stress ofthe front panel material. Since I is not constant over the plate, the maximum peak valueis used which yields a more conservative results.
Solving eq. 6.32 for different thicknesses of the front panel yields the results listed intable 6.2.
Case Minimum Mass Minimum ThicknessMaximum deformation [mm] 6,8 2,9
Panel thickness [mm] 2,5 5,9Foam thickness [mm] 14,2 6Total thichness [mm] 16,7 11,9Panel mass [kg/m2] 6,75 16,06Foam mass [kg/m2] 6,53 2,74Total mass [kg/m2] 13,28 18,8
Table 6.2: Minimum values and associated thicknesses and masses of the protective plate.The results obtained by eq. 6.32. The explosive charge weight W = 0,1175 kg, the rangeR = 0,5 m, the front panel density ρp = 2700 kg/m3, the foam density ρf = 458 kg/m3, thepeak reflected impulse at the bulge center I0 = 421,5 Pa s and the plateau stress σpl = 4,77MPa.
It is seen by the comparison of results in tables 6.1 and 6.2 that the membrane resistancereduces the minimum weight of the protective plate by 7,5%.
62

6.4. COMPARISON AND VALIDATION OF THE RESULTS
6.4 Comparison and validation of the results
A validation of the analytical work can be done by a comparison with real tests represent-ing the blast load. This kind of experiment is, unfortunately, not possible at the Universitylab. Alternatively, a comparison with numerical results is shown in this section.
A numerical simulation for a protective plate, consisting of aluminum foam and frontpanel, fully supported and subjected to a peak reflected pressure and impulse equivalentto the blast load from an explosive charge W = 0,1175 kg TNT. The main objective is tovalidate the results obtained by eq. 6.24. The deformation vs. the front panel thickness isplotted in figure 6.9. A clear discrepancy in the results can be seen. It is noticed that thedifference decreases as the thickness/mass of the front panel increases. This observationneeds a further investigation as follows.
0 2 4 6 8 10 12
Front panel thickness [mm]
0
2
4
6
8
10
12
14
Def
orm
atio
n [m
m]
AnalyticalNumerical
Figure 6.9: Numerical and analytical results for the deformation vs. front panel thicknessof a plate subjected to a peak reflected pressure pr = 7,7 MPa and reflected impulse Ir = 421Pa s, The front panel density ρp = 2700 kg/m3 and foam material parameters are listedin table 5.1.
It is assumed in section 6.1 that the deformation doesn’t start before the front panelreaches its maximum initial velocity. However, the numerical simulation shows that thedeformation starts directly as the blast wave reaches the plate which is more realistic.
For the high pressure design range, figure 1.5, the response time (max deformationtime) is much longer than the duration time t0 and the load is considered impulsive.For low pressure design range, figure 1.6, the load is considered dynamic and thereby theimpulsive loading assumption is not valid. Hence, the ratio tm/t0 decides how sufficientthe assumption is. The structure reaches the maximum deformation after one quarter ofthe eigenperiod T which means that the duration time must be shorter than one twelfththe eigenperiod. Thereby, an investigation of the ratio t0/T and its influence on the resultsis needed.
63

CHAPTER 6. ANALYTICAL STUDY
Assume, that the protective plate system is equivalent to a single degree of freedommass-spring system loaded by a triangular blast load pulse, as shown in figure 6.10. Themass is equal to the front panel mass and the spring represents the foam stiffness.
F(t)
k
m
F
t0t
F(t)
x
Figure 6.10: Single degree of freedom system loaded by triangular blast load pulse, [Smithand Hetherington, 1994].
This blast load can deliver a total impulse I to the target
I =1
2F t0 (6.34)
The equation of motion for this system is [Smith and Hetherington, 1994]
m x+ k x = F
(1− t
t0
)(6.35)
The solution for eq. 6.35 is given in [Smith and Hetherington, 1994] as
x(t) =F
k ω t0[sin(ω t0)− sin (ω(t− t0))]−
F
kcos(ω t) (6.36)
where ω =√k/m is the radial velocity, m is the mass of the panel, F is the peak load
and k is the stiffness of the foam material
k =E A
L(6.37)
where A is the cross section area of the foam and L is the thickness of the foam and E isthe modulus of elasticity for the foam material.
The natural response period of the structure with a unit foam thickness is
T =2π
ω= 2π
√ρp hpE
(6.38)
where ρp and hp are the density and thickness of the front panel respectively.
64

6.4. COMPARISON AND VALIDATION OF THE RESULTS
Eq. 6.36 can be rewritten as
x(t) = xst
(T
2 π t0[sin(ω t0)− sin (ω(t− t0))]− cos(ω t)
)(6.39)
where xst = F/k is the static displacement produced by the load.A typical response for two values of t0/T are compared in figure 6.11. The structure
undergoes a number of vibrations while the load is still present for high t0/T ratio as canbe seen from the figure. This situation is categorized as a quasi-static or pressure loadingas described in section 1.3. For the low ratio, the loading finishes before the structurecompletes even a single cycle of response. This is the so called high pressure loading.
0 0.5 1 1.5 2 2.5 3 3.5 4 4.5
Time[sec] 10-3
-2
-1.5
-1
-0.5
0
0.5
1
1.5
2
x(t)
/xst
t0 2 t0 3 t0 4 t0
t0/T = 2
t0/T = 0.2
Minimum mass point t0/T = 1
Figure 6.11: Response of SDOF system to idealize blast loading for two different t0/Tratios and the case of the minimum mass point, for front panel thickness hp = 2,5 mm.Modified from [Smith and Hetherington, 1994].
It can be concluded that the ratio t0/T tells which design range is the closest to thesystem. For the minimum mass point seen on figure 6.8(b) it is found that t0/T ≈ 1. Theresponse curve plotted in figure 6.11 shows that the duration time and response period areapproximately equal which means that the maximum deformation time tm is even shorterthan the positive duration time t0. Thus, this case can’t be considered as a high pressuredesign range, i.e. the design based on impulsive loading overestimates the deformation ofthe plate.
65

CHAPTER 6. ANALYTICAL STUDY
The ratio between deformation results obtained numerically an analytically Dn/D0 isplotted against the ratio between the duration time and natural period t0/T in figure 6.12.
0.3 0.4 0.5 0.6 0.7 0.8 0.9
Dn/D
a
0
0.2
0.4
0.6
0.8
1
1.2
t 0/T
Minimum Mass Point
Trend lineData Points
Figure 6.12: Discrepancy ratio Dn/D0 vs. time ratio t0/T . D0 and Dn are deformationobtained analytically and numerically respectively. The fitting curve is a power function.
It can be seen from the figure that Dn/D0 −→ 1 as t0/T −→ 0. The minimum masspoint for the analytical results listed in table 6.1 is shown on figure 6.12. It is seen thatthe analytical solution overestimates the deformation by a factor of 2,7 relative to thenumerical solution why the plate period is almost equal to the positive duration time ofthe blast load.
66

6.5. SUMMARY
6.5 Summary
Analytical model describing the response of a protective plate, foam core and metallicfront panel, under blast load are described in the above sections. Some observations aremade.
The capacity of energy absorption can be increased by increasing the mass of the frontplate, the thickness of the foam, and the plateau stress of the foam. For practical reasons,it is preferred to keep the mass at a minimum why the effect of especially the front platehas to be a compromise. Furthermore, the front plate helps in preventing disintegrationof the foam during a blast loading.
The assumption of Gaussian distribution of the data is valid for the area within thebulge, wheres the accuracy of fitted data for some functions decreases as the distancefrom the bulge center increases. A better fit can be achieved by using second order (twoterms) Gaussian function which also increases complexity. It should be noted that forcases where the change in load is less dramatic, more flat curve, the Gaussian functionmay not be the best choice. However, polynomial, sinusoidal, rational, power functionscan also be used.
The bending energy can also be included in the final solution, especially for a thickfront panel and relative small deformation.
If the position of the charge relative to the plate is known, the plate can be designedbased on the deformation profile, where the thickness of the plate becomes a function ofdeformation. This reduces the total mass as the maximum thickness is only needed at thebulge center.
The results obtained analytically deviate from the numerical results for high values oft0/T . Hence, the impulsive loading assumption for high pressure design range must beapplied with caution.
67


7 | Numerical simulations
Numerical simulations by the use of Hydrocode are conducted on various systems. Theapplied Hydrocode is ANSYS Explicit Dynamics and ANSYS Autodyn where both usesthe Autodyn solver. A short description of the methods and some of the material modelsare found in appendix E. A quick overview and some additional description of relevantbehaviour and material models are included here.
7.1 Methods
Multiple methods for solving problems are available in Autodyn. This gives the possibilityof choosing the method most suitable for the specific structure/problem.
• Finite element for structural dynamics (Lagrange)
• Finite volume for transient fluid dynamics (Euler)
• Adaptive mesh for structural dynamics with large deformation (ALE)
• Mesh-free particle for large deformation and fragmentation (SPH)
The different methods can be combined so that each part of a system can be simulatedusing the most suitable method. The current project only makes use of Lagrange andEuler. Euler is used for simulating blast waves and Lagrange for everything else. Lagrangeparts can interact with Euler through an Euler-Lagrange coupling. This is achieved byregarding the Lagrange body as a moving boundary for the Euler domain. This results instress in the Euler material and reactions forces that are applied to the Lagrange part in afeedback system. It is important for Euler-Lagrange coupling that the Lagrange elementsare larger than the Euler cells as leakage of material in the Euler domain otherwise mayhappen. Euler cells should in general be smaller than Lagrange elements to obtain similaraccuracy.
7.2 Material models
Materials in hydrocodes consists of multiple parts which can each be one of several differentmodels, all materials contain an equation of state which models the elastic behaviourrelating pressure (p), density (ρ) and energy (e). Most material also contain a strengthmodel which models plastic behaviour. Failure is governed by a failure model and canalso contain erosion. Autodyn contains multiple different material models of which onlya few are relevant for this project. Appendix E contains a description of these but someof the more relevant ones are given here.
69

CHAPTER 7. NUMERICAL SIMULATIONS
7.2.1 Equation of State
Air is described by the use of the ideal gas law under the assumption of perfect gas. Thisis a simplification but has shown good results and requires few input parameters.
p = (γ − 1) ρ e (7.1)
where γ is the adiabatic index found as the ratio of specific heat at constant pressure andconstant volume, γ = Cp/Cv.
Explosives such as TNT are modelled with the Jones-Wilkins-Lee (JWL) EOS for rapidexpansion of detonation products, it converts to ideal gas EOS at sufficient expansion.The propagation of detonation is controlled by the detonation velocity moving from thedetonation point and happens linearly over time. Detonation can also be set to happeninstantaneously at the first cycle.
p = A
(1− ω µ
R1
)e−
R1µ +B
(1− ω µ
R2
)e−
R2µ + ω ρ e0 (7.2)
µ =ρ
ρ0(7.3)
where ρ0 is the reference density, A, B, R1, R2 and ω are semi-non-physical constantsdetermined from dynamic experiments.
7.2.2 Strength
The Crushable Foam model is a relatively simple model for modelling the behaviour ofporous materials like foams, see figure 7.1. It links the principal stress to the volumetricstrain by tabular data. Unloading and reloading is governed by the EOS, usually linear.A built in failure criteria is part of the model, namely a maximum tensile limit.
Principal stressσi
Volumetric strainεv
E
E
Tension cutoff
Figure 7.1: Visualisation of the Crushable Foam model.
70

7.3. CONSIDERATIONS WHEN PERFORMING HYDROCODE SIMULATION
7.3 Considerations when performing hydrocode simu-lation
When performing a simulation there are a number of options that must be consideredto obtain a simulation of sufficient accuracy and reasonable solve time. The solve timeis mainly dependent on the smallest element/cell size and number of nodes. Complexityof material models and interactions also effect the solve time. Accuracy is also effectedby these parameters, but in the opposite way. Finer mesh means smaller elements/cellsand more nodes mean longer solve time, but better accuracy. It should be noted thatan academic license is used during the project which limits the number of nodes in asimulation to 32000.
7.3.1 Detonation
Simulation of the effects of explosions and blast loads is often done by simulating theexplosion from the initial charge. The charge itself can be modelled in multiple ways butespecially two methods are common. Modelling the charge from undetonated explosive todetonation product from a detonation point and propagates from there, or as pure deto-nation product. The physical difference is that the detonation duration and propagationare included. This may prove important for large volumes and/or special geometries ofexplosive. The other method simulates the explosive as having detonated instantaneouslyand completely converted to detonation product. This may save some computation timebut this is usually not noticeable compared to the total solve time. The real advantageof the second method is that the charge can be modelled with the ideal gas EOS andthereby make use of a higher order Euler scheme. The disadvantage of using the ideal gasEOS for detonation product instead of e.g. JWL is that the material behaviour may beinaccurate. To investigate this issue a number of simulations are conducted.
Blast model comparison
A simple free-air blast can be considered to be one dimensional. This can easily bemodelled in Autodyn with the Euler wedge mesh in axisymmetric conditions. The wedgeis modelled with a minimum radius of 1 mm, a maximum radius of 1000 mm and meshedwith a cell size of 1 mm, the angle is controlled by the program (10). A flow out boundarycondition is put at the outer end and gauges are placed at an interval of 100 mm fromthe centre, see figure 7.2.
Two simulations are conducted with this setup, one with the TNT from the materiallibrary (JWL EOS) with a detonation progressing from the centre and one with the Airfrom the material library (Ideal Gas EOS) modified with the density and internal energyof TNT detonation product. The amount of explosive for the simulation is set to 0,5 kg.As the wedge has a minimum radius the outer radius of the charge is determined from
V =4
3π (R− r)3 (7.4)
where r is the minimum radius, here set to 1 mm for convenience, V being the volume
71

CHAPTER 7. NUMERICAL SIMULATIONS
Figure 7.2: Wedge used for "1D" blast simulation. Beige line indicates flow out boundarycondition and red diamonds indicate measuring gauges.
of 0,5 kg of TNT with a density of 1630 kg/m3 equal to 306,75 cm3. The outer radiusof the charge, R, is thereby determined to 42,8 mm. The simulation is solved until 2,1ms, which is the time of arrival and duration time for the last gauge, plus some margin,determined with ConWep. The gauge measurements are compared with each other andresults from ConWep, see figure 7.3. ConWep is used as a benchmark as it is deemedtrustworthy given the extensive experimental work the software is based on and wide useamong military and researchers.
It can be seen that there are general agreement between the three methods. However itappears that Autodyn slightly underestimates the pressure at most of the distances, butare still within reasonable tolerance for distances over 0,5 m. For the first three distancesthe difference between Ideal Gas and JWL is seen in that Ideal Gas curve is significantlylower than JWL but grows to comparable value. A slight difference in time of arrivalis observed between ConWep and Ideal Gas, while JWL follows ConWep closely in thebeginning, Ideal Gas converges closer to JWL while ConWep develops some difference toboth of them. Figure 7.4 shows the maximum pressure at each gauge and it is clear thatAutodyn underestimates for the short distances and are closer to ConWep for larger.
0.1 0.2 0.3 0.4 0.5 0.6 0.7 0.8 0.9 1
Gauge location [m]
0
5000
10000
15000
20000
25000
30000
Inci
dent
pre
ssur
e [k
Pa]
Max pressure at gauge locations
ConWepIdeal Gas EOSJWL EOS
Figure 7.4: The maximum overpressure for the three methods at each gauge point.
72

7.3. CONSIDERATIONS WHEN PERFORMING HYDROCODE SIMULATION
0 0.2 0.4
Time [ms]
0
10000
20000
30000
Pre
ssur
e [k
Pa]
0.1 m
0 0.2 0.4
Time [ms]
0
5000
10000
15000
Pre
ssur
e [k
Pa]
0.2 m
0 0.2 0.4 0.6 0.8 1
Time [ms]
0
2000
4000
6000
8000
Pre
ssur
e [k
Pa]
0.3 m
0 0.2 0.4 0.6 0.8 1
Time [ms]
0
1000
2000
3000
4000
Pre
ssur
e [k
Pa]
0.4 m
0 0.2 0.4 0.6 0.8 1
Time [ms]
0
1000
2000
3000
Pre
ssur
e [k
Pa]
0.5 m
0 0.2 0.4 0.6 0.8 1
Time [ms]
0
500
1000
1500
2000
Pre
ssur
e [k
Pa]
0.6 m
0 0.2 0.4 0.6 0.8 1
Time [ms]
0
500
1000
1500
Pre
ssur
e [k
Pa]
0.7 m
0 0.2 0.4 0.6 0.8 1
Time [ms]
0
500
1000
1500
Pre
ssur
e [k
Pa]
0.8 m
0 0.2 0.4 0.6 0.8 1
Time [ms]
0
200
400
600
800
1000
Pre
ssur
e [k
Pa]
0.9 m
0 0.2 0.4 0.6 0.8 1
Time [ms]
0
200
400
600
800
Pre
ssur
e [k
Pa]
1 m
ConWep Ideal Gas EOS JWL EOS
Figure 7.3: The pressure responds of 0,5 kg of TNT for different distances and methods.The lack of a curve from ConWep at 0,1 m is due to lack of data for this small scaleddistance.
Figure 7.5 shows the incident impulse at each gauge location and it is clear that IdealGas greatly overestimates the impulse at distance 0,1 m. It also shows that all methodsyield the same general tendency with a small bump around distance 0,5 m.
0.1 0.2 0.3 0.4 0.5 0.6 0.7 0.8 0.9 1
Gauge location [m]
0
200
400
600
800
Inci
dent
impu
lse
[kP
a m
s]
Impulse at gauge locations
ConWepIdeal Gas EOSJWL EOS
Figure 7.5: The incident impulse for the three methods at each gauge point.
73

CHAPTER 7. NUMERICAL SIMULATIONS
7.3.2 Mesh
The mesh is one of the most important factors in a simulation with regard to solve timeand accuracy, if not the most important. The size of the elements/cells directly impactthe solve time as the time step size is defined by the characteristic length of the smallestelement/cell and the sound speed in that element/cell. See appendix F. This means thatthe solve time can be quite long, even if the mesh is relatively coarse but a single element issmall. A finer mesh follows the geometry of the structure better and give a more detailedresult. Failure happens for full elements and a coarse mesh results in large sections of apart to be marked as such. If erosion is used and activates at failure, this yields largelosses of potential energy and physical boundary.
7.3.3 Boundary conditions
The boundary conditions are, as in most simulation tools, highly important for hydrocodesimulations. Different types of boundaries exist and what is equivalent to no boundarycondition. Lagrange treats no boundary as free and Euler as rigid, no flow in or out. Likethe rest of the simulation, the boundary conditions should mimic the real world as closeas possible, but still let the simulation finish in reasonable time. The boundary conditionsmay not affect the solve time by themselves, but in the grander scheme they can be aneffective way to reduce the size of the system.
Fixed
In Lagrange, a fixed boundary condition enforces a zero velocity for the selected nodes.No movement is thereby obtained. In the real world this is a very rare occurrence aseverything have some flexibility and stress waves may propagate through a mountingpoint and into the ground. If this point is modelled with a fixed boundary condition thesewaves will reflect back into the system. This must be taken into consideration when settingup the system. The equivalent condition in Euler is a rigid face that blocks material flowthrough a cell face. As it is applied to the cell it acts more like a rigid wall than a fixingof material.
Flow out
In Euler, a flow out boundary condition allows material movement out of a cell, usuallyat an edge of the domain. As the data for the material that leaves the domain is lost,possible re-entry, inflow, of the material is impossible.
Analytical blast load
Autodyn contains a special boundary condition named Analytical Blast Boundary Con-dition and is an implementation of the pressure calculations of TM 5-855-1, similar toConWep, described in chapter 4. This makes it possible to apply an accurate blast load toa Lagrange face without simulation the entire blast. Analytical blast load is not accessiblethrough ANSYS Explicit Dynamics and is not supported for parallel processing.
74

8 | Design of Humvee floor
The following chapter concerns the design of the floor of the Humvee capable of absorbingthe energy in a blast load.
Different concepts in blast absorbing armour design are to be tried and comparedagainst reference design. The reference design is a basic sandwich consisting of a disrupter-absorber-disrupter plate combination which is equivalent to a sandwich of 3 mm ARMOX500T steel plate, a 18 mm Alulight foamed aluminium plate, and 3 mm ARMOX 500Tsteel plate as backplate. This has a combined specific mass of 54,9 kg/m2 which is equiva-lent to a 7 mm ARMOX 500T steel plate, making the 18 mm of Alulight foam equivalentto 1 mm of ARMOX 500T with regard to mass. With a radius of 250 mm the areabecomes 196,4 · 103 mm2 and the total mass becomes 10,8 kg.
3.00
18.00
24.00
Figure 8.1: The basic sandwich design for comparison. Composition: ARMOX 500T -Alulight - ARMOX 500T. Mass: 10,8 kg. Area: 196,4 · 103 mm2.
In the preceding concept, the main task of the disrupter plate is to maintain structuralrigidity of the foam during the blast. It is mentioned in chap. 2 that advanced ballisticprotection is not necessary in the armour for the vehicle floor, and therefore it is tolerablewith a minimum of ballistic protection against e.g. fragments which the ARMOX offersin this case.
The design concepts showing the most promising effects are further investigated in anaugmented study.
8.1 Design concepts
A variety of very different concepts are presented in the following. Ideally, it is necessaryto fully optimise the specific design concept before a comparison against the basic designpresented in the preceding section. However, this is not an option within an appropriatetimeframe whereas the design concepts are simulated in a somewhat basic version, i.e. afirst iteration of a design along with some intuition, and evaluated based on the ability toreduce transferred force in the current iteration, and the potential of the design assessedby the members of this project. Granted, this is not ideal but a necessity.
75

CHAPTER 8. DESIGN OF HUMVEE FLOOR
Furthermore, a number of limitations are imposed on the design concept to make surea potential design comply with the requirements of an armour plate for the floor of amilitary vehicle, in this case the Humvee, see chapter 3 for the general limitation.
• Ballistic protection: The use of ARMOX as the disruptive plate is regarded assufficient protection against ballistic threats such as fragments. This assumptiongreatly reduces the number of configurations as decision and options regarding dis-ruptive layer (usually ceramic), backing plate (usually ARMOX) and spall liner(usually Aramid) are not considered. Composhield are experts in this field of study,and if ballistic protection in the future is deemed necessary, they have the solution.
• Blast load: The blast load is applied with the use of the analytical blast loadboundary available in Autodyn.
8.1.1 Concept 1: blast wave effect reduction system
This design concept utilises the property that flow at supersonic speed has different reflec-tion responds depending on angle and speed. Mainly two types of reflection are of interest,regular reflection and mach reflection. Mach reflection yields forces upon the target athigher magnitude than regular reflection. The design concept utilises this by shapingthe surface so that regular reflection occur at most of the exposed plate. The concept istherefore an add-on for the basic design and investigate if there is any noteworthy effect,[Kucherov and Hubler, 2014].
The design concept consists of alternating peaks and valleys of parabolic shape. Thepeaks alternates between high and low. The high peaks must have an angle, α, thatensures regular reflection while the low peaks must ensure that the exiting wave clearsthe high peak to avoid trapping the wave. See figure 8.2.
α
Figure 8.2: Example profile of the blast wave effect reduction system, [Kucherov andHubler, 2014].
8.1.2 Concept 2: elastomeric coating containing hollow spheres
This concept utilise an elastomeric coating in which hollow spheres of either ceramic orhard metal are encapsulated for blast protection, [Roland et al., 2015]. To maintain thecharacteristic rubber-like properties of the elastomer, it is desired to use an elastomer witha glass-transition temperature in the negative span. Despite the purpose of containingthe spheres, the elastomer distributes the singular pressure to a larger area in cases of akinetic threat for e.g. a projectile. This means one has to consider an impact-induced
76

8.1. DESIGN CONCEPTS
phase transition of the elastomer to the glassy state which is accompanied by large energyabsorption and brittle fracture, [Bogoslovov and Roland, 2007]. Furthermore the backplateis added for rigidity.
Elastomeric coating Hollow spheres
Backplate
Figure 8.3: Sketch of design concept. A single layer of spheres is shown, but two or threelayers etc. are also a possibility. From: [Roland et al., 2015].
Three mechanisms are thought to contribute to the blast resistance, [Roland et al.,2015];
1. Energy dissipation due to the visco-elasticity of the elastomer, an absorption thatbecomes even greater if it undergoes the phase transition.
2. Energy dissipation due to break-up of the spheres
3. Difference in acoustic impedance between the different compounds of the armourplate, i.e. spheres, elastomer, backup plate resulting in destructive interference anddispersion of the wave.
It is suggested in [Roland et al., 2015] to consider using spheres in the range of Ø1-5mm with a wall thickness so the areal density of elastomer and spheres are homogeneous.
8.1.3 Concept 3: hemispherical indentations
Following the above described concept, a similar concept utilising some of the same mecha-nism of wave dissipation through mechanical deformation is suggested using hemisphericalindentations in two opposite facing sheets, figure 8.4. The sheets are to be of an elasticallydeformable material, as stated in [Wagner et al., 2014].
Sheet
CavityHemispherical
indentation
Figure 8.4
77

CHAPTER 8. DESIGN OF HUMVEE FLOOR
8.1.4 Comparison of design concepts
To compare the different proposed concepts and their protective effects under blast loadsa number of hydrocode simulations are conducted. To simplify and reduce the number ofnodes and solve time, axisymmetry is applied. The concepts are modelled as plates witha radius of 250 mm, and are axially constrained at the distal 10 mm. The concepts areapplied an analytical blast load, as available in Autodyn and decribed in chapter 7, of 0,5kg equivalent TNT and a distance of 0,5 m to the back side of the back plate.
The comparison is made by two methods. A comparison of the design concept againstthe basic design in figure 8.1 in which the mass of the system is kept equal, i.e. acomparison of specific energy absorption. The other mean of comparison is keeping thethickness of the system equal. Hereby, the two main requirements for the floor panel isassessed in the design generation.
The different concepts as modelled in Autodyn are shown in figure 8.5. Figure 8.5also shows a model with a rubber sheet as front, a model with a thicker foam core andone with an additional aluminium front sheet. Displacement of the back sheet at thecentre is recorded as well as the reaction force at the support. The materials used for thesimulations are obtained from the ANSYS material library, except the ARMOX 500T andAlulight material which are described in appendix G.
Concept 1: Blast wave effect reduction system concept.
The blast wave effect reduction system, called the wave concept, is modelled so that themass of the system is the same as that of the base concept. The height of the high peaksis 10 mm and 2 mm for the low peaks with a distance of 20 mm between each high peak.The angle of the high peak is 19. Due to the nature of the effect of this concept, this cannot be modelled using the analytical blast load. It is therefore modelled with the blastload applied through an Euler domain modelling the explosion from a charge in the sameway as in section 7.3.1. To ensure that the effect of the wave concept can be properlycompared, a similar simulations are conducted for the base concept. The displacementsfor the two simulations are shown in figure 8.6.
0 0.5 1 1.5 2 2.5
Time [ms]
-2
0
2
4
6
8
10
12
14
Dis
plac
emen
t [m
m]
Displacement, backside.
Base, Euler BlastWave, Euler Blast
Figure 8.6: Displacement of the centre point of the back plate for the base concept andwave concept.
78

8.1. DESIGN CONCEPTS
(a) Base concept. (b) Blast wave effect re-duction system concept.
(c) Elastomeric coatingcontaining hollow spheresconcept.
(d) Elastomeric coatingconcept.
(e) Thick foam concept. (f) Hemispherical inden-tations concept.
(g) Additional aluminiumfront sheet concept.
Figure 8.5: The different concepts as modelled in Autodyn.
As is seen in figure 8.6, the effect of the concept is noticeable but small. It must benoted that simulating Euler-Lagrange integration requires a fine mesh in the Euler domainfor an accurate result. Again due to the constraint on number of nodes and time, themodel is relatively coarse. It is therefore likely that the effect would be greater in physicalexperiments. The concept is here implemented into the outer disruptive ARMOX plate,but according to the inventor it does work for softer materials.
79

CHAPTER 8. DESIGN OF HUMVEE FLOOR
Concept 2: Elastomeric coating containing hollow spheres concept.
The elastomeric coating containing hollow spheres concept is, as mentioned, meant tobe hollow ceramic spheres embedded in rubber. But as axisymmetry is used for thesimulation the spheres are instead modelled as hollow cylinders and is called ceramiccylinder concept. These are modelled as 14 mm in diameter, and an overall thickness of20 mm. It is desired to test the effect of cylinders of smaller diameter, approx Ø5 mm,but this is impossible due to the available number of nodes. The ceramic cylinder conceptis compared to the base concept, a similar one with a rubber sheet of the same thickness,and one with thicker foam core so that the overall thickness is the same. The four modelsare shown in figure 8.7.
0 0.5 1 1.5 2 2.5
Time [ms]
-5
0
5
10
15
Dis
plac
emen
t [m
m]
Displacement, backside.
BaseCeramic CylinderThick FoamRubber Face
Figure 8.7: Displacement of the back plate at the centre for the base concept, ceramiccylinder concept, a rubber face concept.
It is seen in figure 8.7 that the ceramic cylinders reduce the displacement significantlycompared to both the base concept and for a pure rubber face. It is noted that the rubberface delays the displacement but has little to no effect on the magnitude. The thickerfoam core reduces the displacement approximately as effective as the ceramic cylinders,but do not show the same delay. It should be noted that the ceramic cylinder conceptand the rubber face concept have the same mass and dimensions, while the thicker foamcore concept have the same dimensions it is less than half the mass making it superior tothe others.
Concept 3: Hemispherical indentations concept.
The hemispherical indentations concept is, like ceramic cylinder, modelled as axisym-metric, despite this making them half tubes instead of hemispherical indentations. Theindentations are modelled in aluminium 1100-O as is shown in figure 8.5(f). A similarconcept with a solid sheet of similar material and same mass is modelled for comparison.The displacement at the center of the back sheet of these two concepts and the baseconcept is shown in figure 8.8.
It is seen from figure 8.8 that, compared to the base concept, the hemispherical conceptsignificantly reduces the displacement at the centre of the back sheet. The added mass
80

8.1. DESIGN CONCEPTS
0 0.5 1 1.5 2 2.5
Time [ms]
0
5
10
15
Dis
plac
emen
t [m
m]
Displacement, backside.
BaseHemisphericalSolid Alu. Sheet
Figure 8.8: Displacement of the back plate at the centre for the base concept, hemisphericalindentations concept, and a thick front sheet concept.
and stiffness from the additional aluminium front sheet also reduces the displacement, butnot to the same extent.
Conclusion on concept comparison
It is important to note that the dimensions of each concept are dimensions in a veryinitial state and are in no way an optimum. The behaviour of each concept is observed toensure that they correspond with those described in the respective patents. Each conceptis compare to a concept with an equivalent base property, mass or thickness, but devotedthe critical feature of the specific concept. The maximum displacement of each conceptis shown in table 8.1 together with the displacement relative to the base concept.
Concept Max. displacement Relative displacementBase 14,83 mm 1Wave* 11,51 mm 0,95Ceramic cylinder 11,44 mm 0,77Rubber face 14,78 mm 0,99Thick foam 11,31 mm 0,76Hemispherical indentations 8,30 mm 0,57Extra aluminium sheet 12,48 mm 0,84
Table 8.1: Summary of the maximum displacement of the different concepts and the dis-placement relative to the base concept. *The wave concept is relative to the base conceptwith Euler load.
The wave concept shows little improvement compared to the mass equivalent baseconcept. The analysis is done in Autodyn with a Euler-Lagrange coupling. The natureof the concept requires a high level of detail and thereby a fine mesh. The restrictionsimposed by the academic license limits this and it is expected that the concept yieldsbetter result in physical experiments.
81

CHAPTER 8. DESIGN OF HUMVEE FLOOR
The ceramic cylinder concept shows improvement over the mass and thickness equiv-alent rubber face concept while it yields same deflection as the thickness equivalent butlighter thick foam concept. Manufacturing hollow ceramic spheres, as the patent describes,must be considered to be quite expensive compared to expanding the foam thickness. Theanalysed concept makes use of ceramic cylinder rather than spheres but it is not expectedthat the difference will be significant enough to justify the cost, compared to alternativeconcepts.
The hemispherical indentations concept shows very significant reduction in the deflec-tion compared to the lighter base concept and the mass equivalent solid aluminium sheetconcept. The concept is considered to be relatively cheap to manufacture as it can bemade by deep drawing aluminium sheets and then welded together.
From the analysed concepts it is clear that the hemispherical indentations yields themost significant improvement. The wave concept can be combined with this concept bymilling it into the front face for an enhancing effect. The ceramic cylinder/sphere conceptis dropped as it is not considered to yield improvements significant enough to justifyfurther work.
8.2 Further investigation of the indentations concept
The hemispherical indentations concept is in the following section investigated further.Parameters that affect the blast protective properties are identified and an ideal configu-ration is determined.
The original concept describes the indentations as hemispherical, but the ratio betweenthe height and radius of the indentations is found to have significant effect on the protec-tive properties. The indentations are therefore designed as hemiellipsoidal with the tworadii, denoted as height and radius, controlled independently. The indentations are fixedto the base sheet which they are formed from and are therefore of the same thickness,see figure 8.9. A sheet with indentations is called an indentation sheet. The height ofthe indentations is measured as the height of the indentation sheet, from top point ofindentation to opposite side of the base sheet. The indentations are evenly spaced with afixed, centre to centre, interval in a grid pattern.
thickness
height
radius
(a) The hemiellipsoidal indentations. (b) The indentations are placed in a regular gridpattern.
Figure 8.9: The indentations shape and placement.
82

8.2. FURTHER INVESTIGATION OF THE INDENTATIONS CONCEPT
The original concept places two indentation sheets opposite each other so the indenta-tions connect, apex on apex. This is hereafter called the mirrored configuration.
To provide some stiffness, and ballistic protection, armour plates are placed on eitherside of the indentation sheets. This is illustrated on the mirrored configuration in figure8.10.
armour plate
indentation sheet
Figure 8.10: The mirrored configuration of indentation sheets with armour plates.
Different configurations are also designed and tested. One configuration is a shiftingof the two indentation sheets relative to each other, hereafter called the shifted config-uration. Thereby making the indentations connect on the base sheet, as illustrated infigure 8.11(a). This configuration essentially doubles the ’density’ of indentations in theplane and halve the thickness. Another configuration is also based on shifting the indenta-tion sheets, but adding an additional sheet between the indentations, hereafter called theshifted w. middle sheet configuration, as illustrated in figure 8.11(b). This configurationretains the ’density’ of indentations if disregarding the slight increase in thickness.
Tegningsnummer:
Rev. nr:
Emne navn/beskrivelse:
Gruppe nr:
Projekt Titel:
FørsteKvadrantsProjektions-metode.
Ark 1 af 1
Rev. dato:
Materiale:
Vægt:
DatoInitialer
Tegnet
TjekketGodkendt
RVLRC
A
Kontakt Tlf: Antal til fremstilling: 0 stk.
1:2 på A4Skala:
(a) Shifted configuration with connection onbase.
Tegningsnummer:
Rev. nr:
Emne navn/beskrivelse:
Gruppe nr:
Projekt Titel:
FørsteKvadrantsProjektions-metode.
Ark 1 af 1
Rev. dato:
Materiale:
Vægt:
DatoInitialer
Tegnet
TjekketGodkendt
RVLRC
A
Kontakt Tlf: Antal til fremstilling: 0 stk.
1:2 på A4Skala:
(b) Shifted w. middle sheet configurationthat connects on the middle sheet.
Figure 8.11: Shifted indentations configurations.
All three configurations are simulated in ANSYS and compared on their blast protec-tive properties. The analyses are performed on 100x100 mm sections. The height andradius of the indentations are set to 15 mm, making them hemispherical. The thick-ness of the indentation sheet is set to 2 mm, likewise is the middle sheet for the latterconfiguration. The distance between each indentation is set to 50 mm which gives fourindentations in each indentation sheet. The shifted indentation sheets contain half andquarter indentations, but adds up to four in total. The armour plates on either side aregiven a thickness of 3 mm. This yields an overall thickness of 36 mm for the mirrored
83

CHAPTER 8. DESIGN OF HUMVEE FLOOR
configuration, 23 mm for the shifted configuration and 38 mm for the shifted w. middlesheet configuration.
The indentation sheets are modelled with the Al 1100-O material from the materiallibrary and the armour plates are modelled with the ARMOX 500T material, see app.G. An evenly distributed, linearly decaying pressure load is applied on one side of thesections. This represents a surface blast from a 0,5 kg charge at a distance of 0,5 m,this equals a peak reflective pressure of 24,8 MPa and a duration time of 0,108 ms. Thesections are fixed in the opposite end. The peak force load is thereby 248 kN. The chargesize and distance is chosen as a benchmark that is also used in other simulations. Theanalyses are made with an element size set to 2 mm to achieve a sufficient fine mesh andto avoid the constraint of maximum number of nodes.
The mirrored configuration yields a peak reaction force of 64,3 kN while the shiftedconfiguration yields 120,4 kN, and 92,3 kN for the shifted w. middle sheet configuration.
The ratio of roughly a factor of two between themirrored configuration and the shiftedconfiguration can be explained by considering that the indentation density of the shiftedconfiguration with connection at base is the double of that the mirrored configurationis.
The middle sheet in the shifted w. middle sheet configuration have a blending effecton the reaction force. Blending the responds of the configuration between the mirroredconfiguration, for a fully stiff middle sheet, and the shifted configuration with connectionon base, for a zero stiffness middle sheet.
The reduction in overall thickness for the shifted configuration gives the impressionthat it is sufficient with just a single indentation sheet and using the stiffer front armourplate as substitute for the second indentation sheet. This configuration is hereafter calledthe single sheet configuration and is shown in figure 8.12(a). This is investigated in thesame way as the other configurations, with an indentation height of 15 mm, radius of 15mm and thickness of 2 mm.
Ikke fæ
rdig!
Tegningsnummer:
Rev. nr:
Emne navn/beskrivelse:
Gruppe nr:
Projekt Titel:
FørsteKvadrantsProjektions-metode.
Ark 1 af 1
Rev. dato:
Materiale:
Vægt:
DatoInitialer
Tegnet
TjekketGodkendt
RVLRC
Kontakt Tlf: Antal til fremstilling: stk.
1:2 på A4Skala:
(a) The single sheet configuration.
Ikke fæ
rdig!
Tegningsnummer:
Rev. nr:
Emne navn/beskrivelse:
Gruppe nr:
Projekt Titel:
FørsteKvadrantsProjektions-metode.
Ark 1 af 1
Rev. dato:
Materiale:
Vægt:
DatoInitialer
Tegnet
TjekketGodkendt
RVLRC
Kontakt Tlf: Antal til fremstilling: stk.
1:2 på A4Skala:
(b) Indentations configuration with only one in-dentation sheet with packed indentations.
Figure 8.12: Single sheet configurations.
The single sheet configuration yield a reaction force of 123,9 kN which is more thantwice as high as for the mirrored configuration. This is due to a larger compression ofthe individual indentations and thereby larger force. Similarly a single sheet configurationwith twice the number of indentations is analysed to compare with the shifted configura-tions, this one is hereafter called the dense single sheet configuration. The indentationsare packed with middle indentations, see figure 8.12(b). This configuration yields a reac-tion force of 138,8 kN, slightly larger than for the shifted configuration. It is expectedthat these two configuration show similar result, but with the dense single sheet configu-ration yielding slightly higher as the shifted configuration have a base sheet against the
84

8.2. FURTHER INVESTIGATION OF THE INDENTATIONS CONCEPT
front armour plate and thereby putting more mass towards the blast load. As it is earlierexplained a higher mass of the front plate yields a lower energy which is converted to areaction force. Flipping the indentation sheet should yield a slightly lower reaction force.
The five different configurations and their results are summarised in table 8.2, massesand reaction forces are given with respect to area, thus specific mass and reaction stress.
Configuration Specific mass Reaction stressMirrored 60,23 kg/m2 6,43 MPaShifted 60,23 kg/m2 12,04 MPaShifted w. middle sheet 65,64 kg/m2 9,23 MPaSingle sheet 53,66 kg/m2 12,39 MPaDense single sheet 54,81 kg/m2 13,88 MPa
Table 8.2: Different indentation configuration with height and radius set to 15 mm, inden-tation sheet thickness set to 2 mm and armour plate thickness set to 2 mm. The massesand reaction forces are normalised with respect to area.
Further work with the indentation concept is focused on the mirrored configurationas this yields the lowest reaction force. A series of simulations are conducted to identifyand analyse parameters that affect the blast protective properties. The analyses are againperformed on a 100x100 mm section with 50 mm between each indentation and a thicknessof 3 mm for the armour plates. The height of the indentations are initially kept constantat 15 mm so that the outer dimensions are likewise kept constant. The radius of theindentations are varied between 7,5, 10, 15, 20 and 22,5 mm, and the sheet thickness isvaried between 1, 2 and 3 mm. This necessitate a total of 15 simulation. The recordedpeak reaction forces are visualised with a surface plot in figure 8.13
303
40
50
Rea
ctio
n fo
rce
[kN
]
60
22.520
Thickness [mm]
70
2
Radius [mm]
80
15107.51
35
40
45
50
55
60
65
70
Rea
ctio
n fo
rce
[kN
]
Figure 8.13: Largest reaction forces, for the mirrored configuration, with respect to in-dentation radius and sheet thickness, the indentation height is set to 15 mm.
It is seen from figure 8.13 that the smallest reaction force, 32,92 kN, of the analysed
85

CHAPTER 8. DESIGN OF HUMVEE FLOOR
dimensions, is obtained with a sheet thickness of 1 mm and indentation radius of 7,5 mm,meaning a height to radius ratio of 2. The force increases with both the sheet thicknessand the indentation radius. The largest reaction force, 71,02 kN, is found with a sheetthickness of 2 mm and indentation radius of 22,5 mm, meaning a height to radius ratioof 2/3.
It is worth noting that the indentation sheets can be manufactured by deep drawingthe indentations into stock sheets. This process can be made fast, relatively cheap andyield consistent results. The parameters can be finely controlled to produce a sheet withspecific properties. Compared to the process of foam manufacturing which, for the treatedAlulight specimen, yields quite inconsistent results throughout the specimen.
8.3 Final design of protective plate
The previous section analyse the indentation concepts’ blast protective properties withrespect to different parameters and configurations. The analyses are performed on 100x100mm sections which are fixed at one side, the final plate is to be a 1x1 m section that issupported on two 100 mm wide stripes on the back plate, running parallel on either side,see figure 8.14.
Figure 8.14: The support profile for the final panel design with the load direction indicated.The blast wave effect reduction system is shown as a possible add on for added protectiveeffect.
The blast load that is protected against is, as mentioned in earlier chapters, equivalentto a charge weight of 0,1175 kg and a distance of 0,5 m, this is included 20% safety. Thisresults in a peak pressure of 7,706 MPa and a duration time of 0,109 ms. The significantsmaller blast load gives the possibility of reducing the indentations on all parameters, butit must be taken into account that the protective plate should still be able to withstandeffects and loads from the environment other than the blast load. These effects mayarise from the normal use of the Humvee as it traverses rough terrain. As it is shown infigure 8.13 the lowest reaction forces are obtained with a sheet thickness of 1 mm, for theanalysed sizes. Thinner sheets are expected to yield an even lower reaction force until anoptimum is reached, but to avoid that the indentations become to flimsy to withstandloads from normal use the sheet thickness is set to 1 mm. Ideally an optimisation wouldbe performed to find the optimum indentation radius and height. But the computationalheavy nature of the simulations makes this option impossible due to time constraints.
86

8.3. FINAL DESIGN OF PROTECTIVE PLATE
Instead the parameters are set based on intuition obtained from the previous analysesand validated with simulations, first on the 100x100 mm section and finally in a full scalemodel of a 1x1 m sheet. The analysis of the 100x100 mm section is to ensure that theindentations do not compress completely and the full scale model is to determine thedisplacement of the back plate.
As the displacement of the back plate is of some importance it is desirable to give theplate sufficient bending stiffness. The bending stiffness is mainly governed by the twoouter armour plates, the thickness of the core and the height of the indentations. As it isdesired to minimise both the thickness and the mass of the protective plate a compromiseis needed. Simulations of simplified models show that 3 mm is a good compromise betweenstiffness and mass.
It is sought to lower the indentation height as this is the main contributor to thethickness of the design, but it is still important that the reaction force is also low. At leastthe reaction force must be lower than what is achievable with the foam. The indentationheight to radius ratio is set to 2 as it is shown to yield good result and a larger ratio mayprove difficult to manufacture. The indentation distance is kept at 50 mm as a higher’density’ would only increase the reaction force and lowering it risks inducing to little localsupport for small radius blast loads, which the design load is considered to be. After anumber of simulations with different indentation heights, the height in the final designis set to 10 mm and an indentation radius of 5 mm. Larger indentations height yieldslittle to no reduction in reaction force and lower height causes full compression of theindentations which has to be avoided.
The final design is thereby a mirrored configuration of the indentations concept withan indentation height of 10 mm, radius of 5 mm, with a distance of 50 mm between eachindentation and a sheet thickness of 1 mm, made from 1100-O aluminium. Two armourplates of 3 mm thickness each is placed in either side to form a sandwich structure. Forthe 100x100 mm section the reaction force is 10,8 kN and the mass is 0,528 kg resultingin a specific mass of 52,8 kg/m2. A full scale optimisation may yield different parameters,but this is found to be, at least, close. Additionally can the blast wave effect reductionsystem be added to the front of the panel, as illustrated in figure 8.14, for added protectiveeffect at little to no additional cost with respect to mass and thickness.
The parameters for the final panel are summarised in table 8.3.
87

CHAPTER 8. DESIGN OF HUMVEE FLOOR
Parameter ValueIndentation height 10 mmIndentation radius 5 mmIndentation sheet thickness 1 mmIndentation distance 50 mmArmour plate thickness 3 mmTotal thickness 26 mmSpecific panel mass 52,8 kg/m2
Reaction stress 1,08 MPa
Table 8.3: The best found parameters for the indentations for a blast load from a chargeof 0,1175 kg and at a distance of 0,5 m. The indentation sheets are made from 1100-Oaluminium and the armour plates are made from ARMOX 500T.
A simulation of a section with the same dimensions, but with a core of Alulight foaminstead of the indentation parts, is conducted, i.e. a sandwich of 20 mm foam with a 3mm ARMOX 500T sheet on either side with a mass of 0,563 kg, and thereby a specificmass of 56,3 kg/m2. Applied the same boundary conditions as for the indentation section,the largest compressive reaction force is recorded to 26,4 kN, or 2,64 MPa. Likewise, thesection is simulated with a foam core thickness of 12,52 mm making it mass equivalentto the indentation parts. The largest compressive reaction force is recorded to 26,5 kN,or 2,65 MPa for this foam thickness. The results for the foam sections and the finalindentations design as well as the best design from the parameter study are shown intable 8.4.
Configuration Specific mass Reaction stressIndentation - 15-7,5-1 53,3 kg/m2 1,09 MPaIndentation - 10-5-1 52,8 kg/m2 1,08 MPaFoam - equal mass 52,8 kg/m2 2,65 MPaFoam - equal thickness 56,3 kg/m2 2,64 MPa
Table 8.4: Comparison of the specific mass and reaction stress for the best configurationfrom the parameter study, the final configuration and two foam configurations. The in-dentations configurations are given with there height-radius-sheet thickness. The load isequal to a blast from a 0,1175 kg charge at 0,5 m distance. The ARMOX plates are 3 mmthick for all configurations.
It is noted, from table 8.4, that the indentation sections are capable of yielding lowerreaction forces, than the foam sections, for both configurations. Given that the mass ofthe aluminium foam sandwich is higher, or equal, than the indentation concept in themirrored configuration, it is thereby reasonable to conclude that the indentation conceptis superior to the treated Alulight foam in blast protection compared to both mass andvolume. The two indentation configurations in table 8.4 yields very similar reactions butthe final one is 2/3 the thickness.
The final 1x1 m panel is modelled and an analytical blast load, as described in chapter 7
88

8.3. FINAL DESIGN OF PROTECTIVE PLATE
is applied at the centre of the plate, with a charge weight of 0,1175 kg and a distance fromthe centre of the panel of 0,5 m. By the use of symmetry the model is reduced to a quartersection. As the model greatly exceeds the maximum number of nodes, it is impossible torun the simulation using the academic license. The more than 380.000 nodes, the smalltime step and the long simulation duration also makes it highly impractical to performeven with a full license on a fast computer. Additionally, the analytical blast load is notsupported for parallel processing, extending the solve time even more.
A way around this problem is to simulate a compression test of the indentations anduse the results to define a material model. This makes it possible to use significantlylarger elements and thereby reduce the number of nodes and achieve a larger time step.This procedure is not applied with sufficient successfully results due to time constraints,but a simulation using the Aluligth foam is performed. As the foam yields larger reactionforces than the indentations it is reasonable to assume that the indentations will performbetter.
The simulation of the foam panel yields a displacement at the centre of the backplate,directly opposite the explosion, of 17 mm and a time to maximum deformation of 3,2ms. That may not be considered to be much, but it could still prove to be dangerous forpersonnel inside the vehicle. The indentations are expected to at least half the result ofthe foam.
The micro-truss structure from section 5.3 is proposes as a replacement for the foamand is like the indentations highly modifiable to a specific load case. The micro-trussstructure shows a behaviour which is more like that of the foam, with a plateau stressand densification strain, than the indentations. The plateau stress behaviour is oftenconsidered to be favourable when treating blast loads, but the complex and costly manu-facturing process of the micro-truss structure make the indentations a better alternativein certain cases. The computationally heavy nature of the micro-truss structure, like theindentations, makes them impractical to simulate in full scale. The equivalent materialmethod may also be applicable in this case but are likewise not applied with sufficientsuccessfully results due to time constraints.
Experimental physical test of, indentations, micro-truss and foam are to be performed.It is expected that the indentations are to yield the most beneficial results based on thesimulations. The wave concept is of special interest as it is proven difficult to simulate thisreliably. Experimental test can be used to validate the simulation and expose unexpectedbehaviour.
89


9 | Plan for experimental work
The following chapter treats the planned experimental work of the project. It has notbeen possible to put up a deal to conduct a live-blast test of the armour plate, why smallvalidating laboratory experiments are utilised as replacements. This also means, that thelive-fire test only reached the planning phase which is documented in the following chapter.This includes considerations of possible implementations of measurements, assembly ofplate etc.
9.1 Laboratory experiments
The laboratory experiments are conducted in the terminal ballistics laboratory in thebasement of Fibigerstræde 14, Aalborg University. This lab possess a gas cannon approvedto a pressure up to 200 bar (20,0 · 106 Pa), capable of firing projectiles between Ø10 - 70mm. The propellant gas is in the present case atmospheric air compressed to the desiredpressure by an industrial compressor. The valve to release the pressure in the chamber isremotely operated in safety outside the room. Documentation of the impact is achievedusing a high speed camera capable of 200.000 fps, however at a very low resolution. Achronograph using photocells is present to measure the velocity of the projectile used forreplication of the blast wave.
Pressure chamber Barrel
Target fixture/pendulum
Camera
Figure 9.1: Terminal ballistics laboratory in the basement of fibigerstræde 14, AalborgUniversity.
91

CHAPTER 9. PLAN FOR EXPERIMENTAL WORK
9.1.1 Motivation for the experiment
In this section, a plan for the small validating experiments conducted in the laboratoryfor validation of some of the analytical and numerical parameters are described.
At the moment, a discrepancy between the analytical and numerical models exists,either the analytical model is overestimating or the numerical model is underestimatingthe deformation quite significantly. It is because of the assumptions taken in the twomethods, e.g. when the same initial velocity is applied to the front plate as a direct input,the deformation in the foam is equal using the two methods. However, when calculat-ing the kinetic energy transferred from the blast load to the front plate in the analyticalmodel, and using the ’analytical blast load ’ in the numerical study to calculate the kineticenergy transferred to the front plate, the results deviate significantly. The difference is,that the analytical model accumulate the kinetic energy in the front plate before deforma-tion starts assuming impulsive loading, in the numerical case, this happens gradually anddeformations are obtained for every time step based on the pressure loading, see appendixF, where the software solves the equation of motion for an element at every time step.Furthermore, the relation between the mass of the front plate and the deformation in thefoam is also to be investigated in this experimental work, i.e investigating eq. 6.26.A number of test specimens of the micro-truss structure is, at the time of hand-in, ex-pected to be manufactured using additive manufacturing (3D-printing), which is a greatcompromise for prototype manufacturing and should not entail any significant weaknessesin the nodes of the trusses. Experimental validation of the promising results of this struc-ture (sec. 5.3) is desired, and conducted in near-future.
9.1.2 Description of the experiment
An energy transfer from the front plate to the foam is desired replicated in the laboratory.It is assessed, that this is achievable by imparting the kinetic energy in the front plate bylaunching a projectile into the front plate using the air pressure from the cannon, figure9.2. The projectile transfers its kinetic energy and gives the front panel an initial velocity,equal to the impact velocity, representing the real case. Conservation of momentum yields
m1 u1 = m1 v1 +m2 v2 (9.1)
where m1 and u1 are the mass and preimpact velocity of the projectile respectively, v1 isthe projectile velocity just after impact and m2, v2 are the mass and the velocity afterimpact of the front plate respectively. To ensure a perfect elastic impact, the contact areamust be big enough to reduce the contact stresses to minimum. This allows to assume aconservation of kinetic energy of the system before and after impact which yields
m1 u12 = m1 v1
2 +m2 v22 (9.2)
Solving these two equations simultaneously and setting m1 = m2 yields
v1 = 0 and v2 = u1 (9.3)
The foam is attached to a ballistic pendulum as illustrated in figure 9.2. This is used fordetermination of the energy consumption by deformation of the foam by comparing it with
92

9.1. LABORATORY EXPERIMENTS
a shot against the plate-pendulum without foam. The perfect-elastic impact assumptioncan also be validated by comparing the kinetic energy of the projectile and the energytransferred to the pendulum when impacting the front plate without the foam.
ProjectileFoam
Gas cannon
Ballistic pendulum
Front plate
(a) A sketch of the experimental set-up.
Air flow and pressure Projectile w. guiding- and
contact surface rodFoam Ballistic
pendulum
Venting holes Front plate
(b) A detailed sketch of the set-up.
Figure 9.2: Opening the valve in the pressure chamber after pressure build-up ensuresairflow into the barrel due to the pressure difference supplying kinetic energy to the pro-jectile. The projectile has a rod attached for guiding to ensure a perfectly normal impactwith the front plate and foam. The rod furthermore acts as contact surface for the airflow maximising the energy transfer from the airflow. The lines on the rod are for velocitydetermination using the high-speed camera. The venting holes distribute the airflow awayfrom the target to avoid tilting of the projectile. Furthermore, they are a safety precautionagainst barrel explosion in case the rod doesn’t leave the barrel, on purpose or not. Theballistic pendulum is for measuring the energy consumption in deformation of the foambased on the swing. The pendulum is designed by the project group, and shown in appendixH.
Furthermore, the target foam is to be kept as small an area as possible for maximisingthe pressure applied on it, while remaining representative of the material parameters.Material test performed on cylindrical foam specimens of Ø25 mm, appendix C, showedgreat variation in material parameters not attributed to anisotropy which is the main testparameter for these specimens. It is therefore concluded, that an area of 419 mm2 is toolittle. Slab specimens in the area range 1250 mm2 − 3750 mm2 are likewise tested, andshowed small variation due to size effect. A foam target of 1250 mm2 is therefore thesmallest obtainable tested target size.
93

CHAPTER 9. PLAN FOR EXPERIMENTAL WORK
As the impact starts, the projectile comes to rest in very short time, while the frontplate accelerates from zero to the impact velocity at the same time. This experimentcan be repeated for different thicknesses of the front panel, i.e. different mass. With thesame kinetic energy imparted into the plate, the deformations of the foam vs. front platethickness can be recorded and used for validating the results obtained analytically andnumerically.
The above procedure is an attempt to represent a uniform blast load without using areal explosive. The physical nature of a wave pressure produced by an explosion is quitedifferent from that of a metallic projectile. However, in both cases some energy is trans-ferred to the front plate and accelerate this plate resulting in crushing and deformationof the foam.
94

9.2. A PLAN FOR LIVE-BLAST TEST
9.2 A plan for live-blast test
The following section treats the plan and procedure for conducting the live-fire test of thearmour floor panel if the opportunity at some point arises. This includes a descriptionof the test set-up including strain gauge measurements and preparation of the panel.The description of strain gauge measurements, including general theory, sources of error,sampling etc. is placed in appendix I.
9.2.1 Set-up
It is desired to replicate an explosion beneath a Humvee as close to real life as possiblealong with the replication of the analytical blast load.
The analytical blast calculations predict that the entire blast effect is deposit in a 1x1m plate, if the distance to the explosion is 0,5 m and a charge weight of the DM51 handgrenade with 20% additional margin meaning a TNT equivalent weight of 0,1175 kg isused, see figure 4.5 for the plot of the pressure due to this explosion. This is a sufficientrepresentation of the distances beneath the Humvee, as shown in figure 1.2, as the mainobjective of the test is to determine the behaviour of the armour panel against a real blastload, instead of the replicate in the laboratory tests.
A fixation of the armour panel is seen in figure 9.3. The fixation has to allow a fullyvented explosion which is equivalent to an explosion beneath a vehicle.
0,5 m
1 m Frame
Panel
Surface (soil)
To measurement equipment (18 m <)
Figure 9.3: Side view. Sketch of the test set-up for the live blast test. The frame isplanned to consist of two welded structures which are buried and anchored sufficiently intothe ground so the frame remains completely rigid. The armour panel is bolted to the frameas it is expected the final solution is to the chassis of the vehicle.
A similar blast test is performed by a former project group where the measurementequipment is placed 53 m away in a 2 m deep hole and the equipment is suspended inrubber bands to protect it against the ground shock and blast wave. Still, the harddrivewas affected by the ground shock and data was lost, [Christensen and Olesen, 2007].Granted, the test was performed with a 155 mm artillery shell with 6,620 kg of equivalentTNT. A similar safety distance is not necessary for conducting tests using the DM51
95

CHAPTER 9. PLAN FOR EXPERIMENTAL WORK
hand grenade. A quick study is conducted using ConWep’s ground shock plug-in forapproximating the necessary safety distances.
The case in [Christensen and Olesen, 2007] is replicated in ConWep using the followinginput parameters, and resulting in the output likewise shown in table 9.1.
Artillery shell 155 mmExplosive parameters
Surface burstTNT equivalent 6,620 kg
Distance parametersHorisontal 53 mVertical 2 m
Soil parameters †Dense sandDensity 2030 kg/m3
Seismic velocity 488 m/sImpedance 995 kPa/m/sAttenuation coef. 2.5 –No tensile reflection from surfaceNo reflections from deeper soil layers
OutputPeak pressure 0,1216 kPaImpulse 0,1309 · 10−1 kPa-sPeak particle velocity 0,1288 · 10−3 m/sPeak displacement 0,4169 · 10−4 m
Table 9.1: Ground shock parameters for artillery shell 155 mm calculation. †: a guess,which utilise median values of soil paramers.
100 150 200 250 300 350 400 450
Time [ms]
0
0.02
0.04
0.06
0.08
0.1
0.12
0.14
Pre
ssur
e [k
Pa]
4
6
8
10
12
14
Vel
ocity
[m/s
]
10-5Pressure and velocity vs. time for 155 mm artillery shell
Figure 9.4: Velocity and pressure vs. time at the measurement equipment for the 155 mmartillery shell at 53 m and 2 m depth.
96

9.2. A PLAN FOR LIVE-BLAST TEST
Similar ground shock parameters are obtained for the case using the DM51 grenade.Then, this will be the lower bound safety distance for protection of the measurementequipment, as it is unknown exactly what the harddrive etc. are capable of withstanding.The soil parameters are identical to the parameters in table 9.1. An approximation of therange to the measurement equipment is obtained using the Hopkinson-Cranz scaling law,eq. 2.3. The direct distance to the measurement equipment in the case of the artilleryshell is R = 53,04 m, and the equivalent TNT is W = 6,620 kg.
Z =R
W 1/3= 28,25 m/kg1/3 (9.4)
which is used to calculate the equivalent distance for the DM51 hand grenade explosionof TNT equivalent weight 0,0979 kg
28,25 =R
0,09791/3R = 13,01 m (9.5)
Using this distance where the depth of 2 m is preserved, along with the explosive andsoil input, and the following output is obtained, table 9.2.
DM51 hand grenadeExplosive parameters
Surface burstTNT equivalent 0,0979 kg
Distance parametersHorisontal 12,86 mVertical 2 m
OutputPeak pressure 0,1217 kPaImpulse 0,3213 · 10−2 kPa-sPeak particle velocity 0,1229 · 10−3 m/sPeak displacement 0,1024 · 10−4 m
Table 9.2: Ground shock parameters for DM51 hand grenade calculations.
It is seen, that the scaling law works as expected, as the peak pressure and velocityare near identical. The remaining parameters, impulse and displacement (tab. 9.1 andtab. 9.2 or fig. 9.4 and fig. 9.5), are smaller for the DM51 hand grenade case.
97

CHAPTER 9. PLAN FOR EXPERIMENTAL WORK
20 30 40 50 60 70 80 90 100 110
Time [ms]
0
0.02
0.04
0.06
0.08
0.1
0.12
0.14P
ress
ure
[kP
a]
4
6
8
10
12
14
Vel
ocity
[m/s
]
10-5Pressure and velocity vs. time for DM51 hand grenade
Figure 9.5: Velocity and pressure vs. time at the measurement equipment for the DM51hand grenade at 12,86 m and 2 m depth.
It is noted, that the harddrive in the case of [Christensen and Olesen, 2007] still failedfor these blast parameters, but is also assessed that the failure of the harddrive is dueto an acceleration and displacement, which in the case of the displacement is more thanfour times smaller. Therefore, it is assessed that an additional safety distance of 5 m issufficient based on the rapid decay in the blast parameters. A horisontal distance of 18 mis considered safe for the measurement equipment in testing the DM51 grenade. It shouldbe noted, that in the case of [Christensen and Olesen, 2007], the equipment is suspendedin rubber bands. This could also negatively influence the equipment as forced oscillationof these from external factors, e.g. the displacement, other than the ground shock couldbe to blame for the harddrive failure. This is however unconfirmed and guesswork.
For a description of the strain gauges and their location on the plate, see appendix I.
9.2.2 Results of the blast test
As the blast test has not been conducted, results specific for this study are unavailable.However, a noteworthy observation from the blast test conducted by [Christensen andOlesen, 2007] is the failure of the adhesive attaching the aluminium foam to the rest ofthe panel. They believe, it is due to the stress wave generated in the blast, or generatedas fragments hit the front plate, that delaminates the glue. Furthermore, the protectionof the measurement equipment, more specifically the mechanical hard drive in the laptop,was insufficient.
98

9.3. TEST PANEL
9.3 Test panel
The following section treats the considerations for manufacturing an assembly of a panelfor testing, and shortly present the considerations regarding a final armour panel.
Test specimens of the micro-truss structure, and a structure using honeycombs areplanned for manufacturing by 3D-printing. These specimens are to be used in the near-future experimental work in the terminal ballistics laboratory for validation and compar-ison of the results. The CAD-drawings are located in the annex.
9.3.1 Assembly of the different layers in the panel
As observed and stated in [Christensen and Olesen, 2007], the use of an adhesive bondingas coupling of the different layers of the armour panel has some limitations as a large mag-nitude of stress wave from the impinging blast load, or the resulting fragments, propagatesthrough the panel, and failure might be experienced in form of delamination. This is notdurable as e.g. separation of some of the components of the plate reduces the protectivecapabilities drastically, and alternative methods of bonding are used where possible.
Three different types of sacrificial layers are investigated in the project, the foammaterial, the micro-truss structure and the indentation sheets. All three of these areconsidered, until the experimental work has been conducted. The different methods ofcoupling these with the remainder of the armour panel are therefore needed.
Aluminium foam
When the foam is utilised as the sacrificial layer, it is inconvenient to e.g. use a boltconnection through the entire structure to keep it joined. Following some initial deforma-tion of the sacrificial layer, i.e. the foam, it remains compacted and the assembly of theother layers might become inconveniently loose. Another problem may rise by using boltsthrough the entire structure, for huge pressures acting on the bolt tip, although its areais small, the resultant force may push the bolt into the structure. It is therefore necessaryto couple the sacrificial layer to the rest of the panel by an adhesive or brazing of thefoam sheet and the steel front plate/back plate, figure 9.6. The foam is bought from amanufacture, and is manufactured as stated in appendix C. The ARMOX steel plate islikewise bought from a manufacture, and is assumed manufactured as regular steel plates.
Adhesive bonding or brazing
ARMOX
Aluminium foam
ARMOX
Figure 9.6: A suggestion on an assembly of a panel consisting of front and back plate ofARMOX steel, and aluminium foam as core material.
99

CHAPTER 9. PLAN FOR EXPERIMENTAL WORK
The weight of the steel plate and the foam core must be considered. During its lifeservice, the plate undergoes vibrations and accelerations upwards or downwards whichmay cause a failure in the adhesive or brazing.
Micro-truss
For the micro-truss structure, the same problem regarding the permanent deformationand a resulting loose assembly exists. However, as the structure is either extruded andthen wire electrical discharged, or punched, folded and then brazed, it has two face-sheetswhich permit bolt connections from opposite sides, figure 9.7. The unknown in this caseis whether the front plate fall off after heavy deformation of the core structure as thebeams might break. If this happens, the protection of the vehicle is greatly compromised.A concept of sort of a turnbuckle consisting of a wire to avoid the usual rod for beingejected into the cabin of the vehicle may be used in-between the armour panels. It bothkeeps the armour panels aligned, closing gaps between the panels, and it eliminates thepossibility of the front plate of the panel falling off, figure 9.7.
As a rule of thumb in cases the bolt thread engages with the aluminium, the engagementlength has to be two times the diameter of the bolt, to make sure the bolt, in case of failure,fails before the thread, [Norton, 2006]. For steel-steel, it is sufficient with one diameterlength of engagement.
ARMOX
Same material as micro-truss
Micro-truss
Brazing on ARMOX
(in case of punched + folded)
Part of front-/back plate
(extruded + WEDM) ARMOX
Turnbuckle wire
Figure 9.7: A suggestion on an assembly of a panel consisting of the micro-truss struc-ture. Dependent on whether the structure is punched from a plate, with additional folding,or whether the structure is extruded with additional wire electrical discharge machining(WEDM), the connection to the front and back plate is different. When possible, a boltconnection is used as these are very durable. A wire-turnbuckle concept may be used tokeep the front plate of the panel attached after heavy deformation.
100

9.3. TEST PANEL
Indentation sheet
The indentation sheet is similar to the micro-truss structure in permitting the use of boltconnections. As the indentation sheet solution consists of two sheets, it is possible to pullthe sheets apart in tension, and this of course has to be opposed. This can be done witha small welding, or brazing, figure 9.8, and if this couplings breaks due to deformation,the wire-turnbuckle system might be implemented as well.
ARMOX
ARMOX
Welding or brazing
Figure 9.8: A suggestion on the assembly of a panel consisting of the indentation sheet, andthe disruptive layer of ARMOX as front plate, and a backing plate likewise of ARMOX.This structure permits the use of a bolt connection, which is very durable.
9.3.2 The final panel
It is expected, that the test panel differs a bit from the final armour panel.For the test panels, the backing plate is primarily there to provide a rigidity in the
structure which ensures the deformation of the core structure as this is the primary testobjective. A back plate may also increase the ballistic protection of the entire plate besidesthe possibility to incorporate mounting points so the panel can be attached to the chassisof the vehicle. The disadvantage of using a back plate is the increase in mass, withoutimproving the blast protection, which as shown (chap. 6) is improved by increasing themass of the buffer plate in front of the sacrificial layer. To reduce the mass of the backplate, a grid of ribs with thin face sheet can be used as a back plate. The ribs must havea cross section with high moment of inertia to provide the required stiffness.
Another change might be, as mentioned previously, that a steel front plate is insufficientballistic protection, and Composhield might want to add a ballistic protection consistingof a fibre-ceramic composition. This can be added to the front of the amour panel, howeverthe ground clearance will be reduced.
Additionally, the panel needs to be shaped to fit the underside of the vehicle, includingthe location of mounting points, improving wear resistance and avoid galvanic corrosionbetween the aluminium and steel. The corrosion can be avoided by an electrical insulatorbetween the layers, e.g. a thin nylon sheet, and protection against water. However,aluminium and steel are not highly conductive towards each other but close contact suchas the steel bolts into the aluminium may for good measure be galvanized.
A suggestion of a final assembly of a armour panel is made in figure 9.9.
101

CHAPTER 9. PLAN FOR EXPERIMENTAL WORK
Weld
ing o
r b
razin
g
Ballistic p
rotectio
n +
b
uffer p
late
(ceram
ic, fibre, resin
, armox)
Blast d
eflector
Spall lin
er (a
ram
ide)
Insu
lator (n
ylon
)
Blast a
bso
rber
Backin
g plate
Galvan
ic bo
lts
Insu
lator (n
ylon
)
Fron
t side
Back sid
e
Figure
9.9:A
suggestionof
theassem
blyof
thefinalplate,
includinginsulator,
spallliner,blast
absorberand
deflectorand
possiblebolt
connections.A
suggestionof
abolt
connectionis
toweld
abushing
oneach
sideof
theARMOX
plate,and
thenfasten
thebolt
intothis
one.This
isifone
wants
toavoid
drillingahole
inthe
ARMOX.A
wire-turnbuckle
conceptmay
alsobe
usedto
keepthe
frontpanelattached
tothe
plate.
102

10 | Conclusion
The objective of this thesis was to develop an armour floor panel for protection againsta blast threat. The floor panel was to be mounted on a HMMWV vehicle, and the blastthreat came from a DM51 hand grenade. The project was proposed by Composhield A/Sin an effort to enhance the blast protection of their armour solutions for the military in-dustry. An aluminium foam and a suggestion of a sensible case load (DM51 grenade) wereprovided by Composhield with the desire of investigating the material properties of thealuminium foam before determining the possibility of using this material manufacturer infuture products. This worked as a start for the project along with a study of the resultingblast loading following a detonation of the 0,0979 kg equivalent TNT in a DM51 handgrenade. By using a material such as this foam, it is possible to reduce the transmittedload through the floor onto the vehicle structure during a blast loading. This is achievedthrough energy absorption by the compaction of the foam. Analytical models describingdeformation and affected parameters were developed and applied, along with numericalmodels. This yielded an in-depth understanding of the governing parameters. The mate-rial behaviour of the foam was inhomogeneous and at times disappointing why alternativeconcepts were studied. A variety of concepts were studied, and compared against thefoam at all time. A promising concept better than the foam on multiple parameters wasdetermined, but until the concepts have been experimentally validated, the final decisionregarding the armour panel is not made. A proposal of the necessary experimental workwas made and a part of this work is planned for the near future.
Thesis scope
Regarding the thesis scope, the following conclusions were achieved.1) Determine the temporal and spatial distribution of the load in both the armour plate,
and discrete fixation/mounting points.A comprehensive understanding of blast parameters and their effects were obtained dur-ing this study. It was found, that a lot of the available literature are based on empiricaldata which are then scaled for specific cases using scaling laws. This means, that the blastdata used in this thesis is based on similar equivalent data stored in the software ConWep.The pressure and impulse distribution and the effect of the different blast parameters in-vestigated for the case, and an impulsive loading was assumed during the analytical study.
2) Investigate the metallic foam presently used in the composite armour plate for de-termining the energy absorbing properties and ability to withstand multiple blast waves.Material tests were performed on the available closed-cell aluminium foam. The effect ofvariation in relative density was investigated and determined to be significant, see table5.1. All parameters were obtained by the tests and it was noted that the foam has arelatively high plateau stress of 4,77 MPa. The ability of withstanding multiple hits canbe achieved by controlling the foam thickness. However, it was concluded that betteralternatives than the foam exists for a blast absorbing design, e.g. the micro-truss struc-ture, figure 5.8(g).
103

CHAPTER 10. CONCLUSION
3) Investigate the effect of geometry and/or composition of the armour plate for theHumvee floor on energy absorption, structural integrity etc.Analytical models were developed and used for determining the deformation in the foamwhen exposed to the blast load. It was determined how the range and thereby the blastparameters govern the deformation profile; the buffer plate reduces the deformation andenhances the plate protection but increases the weight. Besides the pressure peak value,the eigenperiod of the plate and thereby the maximum deformation time must be ac-counted for in any design. Optimum design points were defined for minimum mass andminimum thickness.
4) Design the discrete energy absorption points for the assembly of the armour plateand the chassis.This task has not been fulfilled fully, as it halfway through the project was decided toshift focus. However, the alternative structure, i.e. the micro-truss structure, is capableof acting as a mounting point between chassis and armour panel, as it can be modifiedfor the specific needs. A parametric study conducted showed higher energy absorptioncapacity than the foam, and is seen from e.g. figure 5.8(g). The structure is suitable foradditive manufacturing (3D-printing), and can thereby be shaped to avoid e.g. suspensionarms etc. beneath the vehicle where e.g. a 4 × 4 micro-truss structure with less than halfthe foam thickness can sustain the same blast load.
5) Parametric study of the armour panel.The design concept and the micro-truss structure were more or less determined by para-metric studies. Investigating different designs and concepts showed a wide range of pos-sibilities for developing and improving the design properties for blast protection, onlythe cost and manufacturing difficulties can be concerns of these designs. However, animproved and easily manufacturable design was achieved, see figure 8.14. The advan-tages are the ability to control the parameters, and the option of an optimization of thestructure in future work. The final design was capable of reducing the transferred load to40% of what is transferred by the aluminium foam of equivalent mass as shown in table 8.3.
6) Experimental validation.The experimental work has unfortunately not been conducted in time. However, a planfor the near future experimental validation using the terminal ballistics laboratory wasdescribed in chapter 9. A plan for a live-blast tests was also described, but the prospect ofthese tests are very shallow. Until the experimental work has been conducted, all three ofthe concepts are maintained as it is desired to investigate all three of them experimentally.
104

Requirements
Regarding the requirements the indentation sheet concept achieved the following conclu-sions.
Blast threat. The concept is designed for protection of a blast load resulting froman explosion of a DM51 hand grenade. This means, the design has a classification ofSTANAG level 1 protection. This protection level can be higher by small modificationsto the design such as; doubling the layers, optimization of parameters or using a differentmaterial.
Lightweight. The design concept is significantly lighter (only 52,8 kg/m2 plus addi-tional ballistic protection), than a concept using the aluminium foam and achieving theequivalent residual reaction force. Other armour floor panel solutions are unknown, whythe only reference is the aluminium foam equivalent. For the same mass per unit area,the indentation sheet transfers a reaction force equal to only 40% of the reaction forcetransferred by the foam.
Ground clearance. The design is again significantly thinner than the equivalent foamdesign, why the indentation sheet performs better. An additional requirement is, that thearmour panel can only reduce the ground clearance with 10% or 40 mm. As the blastabsorbing layer is 26 mm, it leaves 14 mm room for additional ballistic or blast protectionif this is needed.
Mountable. This requirement has not been treated very much, as the design of the fix-ation points, as stated earlier, was abandoned during the project. However, as stated in9.3, the implementation of a rigid backplate permits the fitting of the mentioned fixationpoint, or any other mounting bracket one desire.
Environment. This requirement has likewise not been treated very much, but themethods of assembly suggested in sec. 9.3, consider the options for avoiding unnecessarygaps, resistant materials and galvanic corrosion.
It must be stated, that a greater blast load probably should have been chosen at anearlier stage, as the load from a hand grenade is exceedingly limited. However, the handgrenade was chosen as it produces a limited explosion and therefore controllable in atest-environment.
105

CHAPTER 10. CONCLUSION
Suggested future work
The future work includes carrying out the experiments described in chapter 9. The live-blast test is not an option at the moment, but is, as stated, necessary to finally concludewhich of the sacrificial layers and assembly methods are most capable of resisting the blastload.
The realisation of the armour panel, following the decision on the most suitable sacri-ficial layer, needs to be finished. This includes a correct method of assembly, integrationof mounting brackets and securing the panel for wear resistant as it is in a very exposedlocation.
The panel needs to be designed for a greater STANAG certificate. A blast load froma hand grenade is nothing against modern IED’s, and the scaling of the protective capa-bilities of the armour panel is unknown. Designing for STANAG level 2 certificate, tab.3.2, is a possibility. This includes an anti-tank mine of 6 kg TNT exploding beneath thebelly of the vehicle wheel. This is also comparable with the well-known IED’s from Iraqconsisting of old artillery shells, chapter 3.
A full solution including the ballistic part is also required as the buffer and back platescan be a part of the ballistic protection system.
"The bursting radius of a hand-grenade is always one foot greaterthan your jumping range."
— Unknown
106

Bibliography
Albertsson, H., S. Barrett, M. Dam, R. V. Christiansen, and A. Othman. 2015. Stressand Deformation Analysis of a Load Carrying Bracket. Technical report.
Alghamdi, A.. 2001. Collapsible impact energy absorbers: an overview. Thin-WalledStructures 39 (2), 189 – 213.
AM General. 2017. http://www.amgeneral.com/. Accessed: 2017-02-07.
ANSYS Inc.. 2016. ANSYS Release 17.2 Documentation. www.ansys.com: ANSYS Inc.
Ashby, M. F., A. G. Evans, N. A. Fleck, L. J. Gibson, J. W. Hutchinson, and H. N. G.Wadley. 2000. Metal Foams: A Design Guide. ISBN: 978-0-750-67219-1. Butherworth-Heinemann.
Barrett, S., R. V. Christiansen, and A. Othman. 2016. Ballistic Properties of Projectilematerial. Technical report.
Bogoslovov, R. B. and C. M. Roland. 2007. Impact-induced glass transition in elastomericcoatings. Applied Physics Letters 90 (22).
Brode, H. L.. 1977. Quick estimates of peak overpressure from two simultaneous blastwaves. Technical report, DTIC Document.
Christensen, C. B. and E. L. Olesen. 2007. M.Sc.: Design of Lightweight HMMWV Doorfor Ballistic and Blast Protection. Technical report.
Davison, L.. 2008. Fundamentals of Shock Wave Propagation in Solids. ISBN: 978-3-540-74568-6. Springer.
Deshpande, V. and N. Fleck. 2001. Collapse of truss core sandwich beams in 3-pointbending. International Journal of Solids and Structures 38 (36–37), 6275 – 6305.
Gama, B. A., T. A. Bogetti, B. K. Fink, C.-J. Yu, T. D. Claar, H. H. Eifert, and J. W. G.Jr. 2001. Aluminum foam integral armor: a new dimension in armor design. CompositeStructures 52 (3–4), 381 – 395. Design and Manufacturing of Composite Structures.
Gibson, L. J. and M. F. Ashby. 1997. Cellular solids: structure and properties (2nd ed.).ISBN: 052-1-495-601. Cambridge University Press.
Global Security. 2017. http://www.globalsecurity.org/. Accessed: 2017-02-17.
Goel, M. D., V. A. Matsagar, S. Marburg, and A. K. Gupta. 2013. Comparative Per-formance of Stiffened Sandwich Foam Panels under Impulsive Loading. Journal ofPerformance of Constructed Facilities 27 (5), 540–549.
Guruprasad, S. and A. Mukherjee. 2000. Layered sacrificial claddings under blast loadingPart I — analytical studies. International Journal of Impact Engineering 24 (9), 957 –973.
107

BIBLIOGRAPHY
Guzas, E. L. and C. J. Earls. 2010. Air blast load generation for simulating structuralresponse. Steel Compos. Struct 10 (5), 429–455.
Hanssen, A., L. Enstock, and M. Langseth. 2002. Close-range blast loading of aluminiumfoam panels. International Journal of Impact Engineering 27 (6), 593 – 618.
HBM. 2017. https://www.hbm.com/. Accessed: 2017-05-19.
HBM-S8. 2017. http://www.hottinger.sk/Prospekty/Elektronika/IMT/Spider8/p_Spider8_e.pdf. Accessed: 2017-05-19.
Hoffmann, K.. 1989. An Introduction to Measurement Using Strain Gages. HottingerBaldwin.
Jane’s Information Group. 1996. Jane’s Ammunition Handbook (5th ed.). ISBN: 978-0710613783. Jane’s Information Group.
Johnson, G. R. and W. H. Cook. 1983. A constitutive model and data for metals sub-jected to large strains, high strain rates and high temperatures. Proceedings of the 7thInternational Symposium on Ballistic, 541 – 547.
Karagiozova, D. and N. Jones. 2000. Energy absorption of a layered cladding under blastloading. Structures under Shock & Impact 6.
Karlos, V. and G. Solomos. 2013. Calculation of Blast Loads for Application to StructuralComponents. Technical Report EUR 26456 EN.
Kingery, C. N. and G. Bulmash. 1984. Airblast parameters from TNT spherical airburst and hemispherical surface burst. Technical report, U.S. Army Ballistic ResearchLaboratory.
Kinney, G. and K. Graham. 1985. Explosive shocks in air. Berlin and New York, Springer-Verlag, 1985, 282 p..
Kranzlin, N. and M. Niederberger. 2015. Controlled fabrication of porous metals from thenanometer to the macroscopic scale. Mater. Horiz. 2, 359–377.
Kucherov, Y. R. and G. K. Hubler. 2014, 02. Patent: Blast wave effects reduction system.(US 8646373).
Needham, C. E.. 2010. Blast Waves. ISBN: 978-3-642-05287-3. Springer.
Nilsson, M.. 2003. Constitutive Model for Armox 500T and Armox 600T at Low andMedium Strain Rates. Technical Report FOI-R-1068-SE.
Norton, R. L.. 2006. Machine Design An Integrated Approach. 0-13-148190-8. Pearson.
NSA. 2012. STANAG 4569. NATO Standardization Agency.
Olurin, O. B., N. A. Fleck, and M. F. Ashby. 2000. Deformation and fracture of aluminiumfoams. Materials Science and Engineering: A 291 (1–2), 136 – 146.
108

BIBLIOGRAPHY
Queheillalt, D. T., Y. Murty, and H. N. Wadley. 2008. Mechanical properties of anextruded pyramidal latticetruss sandwich structure. Scripta Materialia 58, 76–79.
Randers-Pehrson, G. and K. Bannister. 1997. Airblast loading model for DYNA2D andDYNA3D. Technical Report ARL-TR-1310.
Roland, C. M., D. M. Fragiadakis, R. M. Gamache, C. B. Giller, and R. G. S. Barsoum.2015, 06. Patent: Polymer Coatings with Embedded Hollow Spheres for Armor forBlast and Ballistic Mitigation. (US 20150377592 A1).
Smith, P. D. and J. G. Hetherington. 1994. Blast and Ballistic Loading of Structures.ISBN: 0-7506-2024-2. Redwood Books, Trowbridge.
Sriram, R., U. K. Vaidya, and J.-E. Kim. 2006. Blast impact response of aluminum foamsandwich composites. Journal of Materials Science 41 (13), 4023.
SSAB Oxelösund AB. 2007, 10. Data Sheet: ARMOX 500T. www.ssabox.com: SSABOxelösund AB.
Stankiewicz, M., A. Popławski, P. Bogusz, R. Gieleta, and G. Sławiński. 2015. Exper-imental Evaluation of Energy Absorbing Properties of Selected Elastomer Materials.KONES Powertrain and Transport 22 (3).
Szuladzinski, G.. 1940. Formulas for mechanical and structural shock and impact. ISBN:978-1-4200-6556-5. Taylor and Francis Group, LLC.
Teeling-Smith, R. and G. Nurick. 1991. The deformation and tearing of thin circular platessubjected to impulsive loads. International Journal of Impact Engineering 11 (1), 77 –91.
Unified Facilities Criteria. 2008. Structures to Resist the Effects of Accidental Explosions.http://www.wbdg.org/ffc/dod: Unified Facilities Criteria.
Wagner, L. L., R. A. Ash, C. Arnett, A. Ashley, and A. Bruco. 2014, 01. Patent: Spallliners in combination with blast mitigation materials for vehicles. (WO 2014/007872A2).
Yu, C. J., , T. Claar, H. H. Eifert, I. W. Hall, R. Franz, K. Leighton, and D. F. Hasson.1999. Deformation energy absorption of metal foams at high strain rates. Proc MetFoam.
Yu, C. J., H. H. Eifert, I. W. Hall, R. Franz, and K. Leighton. 1998. Feasibility Study onDeformation Energy Absorption of Metal Foams at High Strain Rates. FC-DE ReportNo. DAAG55-98-K-0002.
Zhou, H., G. Ma, J. Li, and Z. Zhao. 2015. Design of Metal Foam Cladding Subjected toClose-Range Blast. Journal of Performance of Constructed Facilities 29 (4).
Zukas, J. A. (Ed.). 2004. Introduction to Hydrocodes. ISBN-13: 978-0080443485. ElsevierScience.
109


A | Blast parameters following Kinney,Graham and Brode
The following appendix describe the methods of obtaining blast parameters using themethods of Kinney, Graham and Brode (KGB).
The air blast parameter equations presented in this section comprise a complete set ofparameter equations from open literature sources. The equations are taken from [Kinneyand Graham, 1985] and [Brode, 1977]. These equations are used in [Guzas and Earls,2010] with some modifications where the equations used in this project are taken from[Guzas and Earls, 2010].
The duration time of the blast t0 is given as
t0W 1/3
=
980
[1 +
(Z
0,54
)10][1 +
(Z
0,02
)3] [1 +
(Z
0,74
)6]√1 +
(Z6,9
)2 (A.1)
where t0 in ms and Z is the scaled distance given in eq. 2.3.Information about the peak overpressure in free air is also taken directly from [Kinney
and Graham, 1985] and is defined as
pso = 808 patm
[1 +
(Z4,5
)2]√[
1 +(
Z0,048
)2] [1 +
(Z
0,32
)2] [1 +
(Z
1,35
)2] (A.2)
where pso is the peak side-on overpressure in units of bars, and patm is the atmosphericpressure in bars (1 atm ≈ 1,013 bar).
Information regarding peak reflected overpressure, pr, is much harder to find thanfor incident overpressure in the open literature. All sources that do include parameterinformation for reflected overpressure present data for the normally reflected case, withangle of incidence effects treated separately, if at all. In the far field limit for explosions ofany size, or for small explosions, the air can be treated as an ideal gas in order to establisha relationship between the peak side-on overpressure and peak reflected overpressure at asurface. According to [Brode, 1977], this relationship is
pr = pso
(2 +
6 psopso + 7 patm
)for pso < 6,9 bar (A.3)
where pr is the maximum overpressure for normal reflection, pso is the peak side-on over-pressure, and patm is the ambient air pressure and all pressures in bar. An implicitassumption in this equation is that γ = 1,4, where γ is the heat capacity ratio of the airmedium. When overpressure values exceed 6,9 bar, molecules in the air start to interact
111

APPENDIX A. BLAST PARAMETERS FOLLOWING KINNEY, GRAHAM ANDBRODE
with one another and the ideal gas assumption is no longer valid. For this regime, [Brode,1977] defines the peak normally reflected overpressure as
pr = pso
(38,51 pso
1 + 25,1 pso · 10−4 + 4 · 10−7 pso2+
2
103
+4,218 + 701,1 pso + 1,44 pso
2
1 + 0,116 pso + 8,1 · 10−4 pso2
)· 103 (A.4)
for pso ≥ 6,9 bar which is again the peak side-on overpressure in bars.The following equations for arrival time and decay constant are developed in [Guzas and
Earls, 2010] by fitting piecewise polynomials to data for a 1 kg TNT reference explosionin [Kinney and Graham, 1985]. The data include arrival times and decay coefficients overa range of scaled distances. The resulting expression for the arrival time is
tAW 1/3
=4∑i=1
ai Zi−1 where 0,3 ≤ Z ≤ 500 m/kg1/3 (A.5)
where tA is the arrival time, in seconds, of the shock wave initiated by an air blast. Valuesfor the fitted polynomial coefficients, ai, are included in table A.1 for various ranges of Z.
Range a0 a1 a2 a3(m/kg1/3
)0,3 ≤ Z < 2,4 1,77 · 10−2 −2,03 · 10−2 5,39 · 10−1 −3,01 · 10−2
2,4 ≤ Z < 12 −2,25 · 100 1,77 · 100 1,14 · 10−1 −4,07 · 10−3
12,4 ≤ Z ≤ 500 −6,85 · 100 2,91 · 100 9,47 · 10−5 −9,34 · 10−8
Table A.1: Fitted polynomial coefficients to define the arrival time [Guzas and Earls,2010].
A higher order of polynomial is required to produce an accurate fit for the decayconstant over the range of scaled distances, especially for smaller scaled distances. Thedecay constant follows this relationship
b =6∑i=1
ci Zi−1 where 0,3 ≤ Z ≤ 500 m/kg1/3 (A.6)
where b is the dimensionless decay constant for side-on air blast. Values for the fittedpolynomial coefficients, ci, are shown for different ranges of Z in table A.2.
The decay constant is determined from the positive phase impulse, or the area under thepressure time history curve, for either side-on or reflected blast. [Guzas and Earls, 2010]assume similarity between time histories of side-on overpressure and normally reflectedoverpressure, demonstrated by
iris
=prpso
(A.7)
which means that the decay constant can be used interchangeably for side-on and normallyreflected cases.
112

Ran
gec 0
c 1c 2
c 3c 4
c 5( m
/kg1/3)
0,3≤Z<
0,95
3,08·1
02−
2,15·1
035,
95·1
03−
8,23·1
035,
69·1
03−
1,57·1
03
0,95≤Z<
2,4
1,76·1
01−
2,68·1
011,
79·1
01−
5,66·1
006,
94·1
0−1
02,
4≤Z<
6,5
4,43·1
00−
2,72·1
007,
42·1
0−1−
9,34·1
0−2
4,47·1
0−3
06,
5≤Z<
407,
12·1
0−1−
6,27·1
0−2
3,33·1
0−3−
8,24·1
0−5
7,62·1
0−7
040≤Z≤
5000
2,52·1
0−1−
1,77·1
0−3
9,52·1
0−6−
2,20·1
0−8
1,79·1
0−11
0
TableA.2:Fitted
polyno
mialcoefficients
todefin
ethedecaycoeffi
cient[G
uzas
andEarls,2010].
113


B | Procedure followed to obtain theblast parameters in ConWep
This appendix describes the steps to obtain the blast parameters and stress distributionfor the studied case. All graphical data, references and plots used to obtain the results inchapter 4 are stated here.
Determine hemispherical blast wave parameters at anypoint of the target plate.
The case where a hand grenade explodes under a vehicle can be represented as a sur-face burst located on the ground surface with a target plate parallel to the ground andsuspended in the air above the detonation point as can be seen in figure B.1.
HC
w
Plate
Ground
dPoint of interest
Figure B.1: Load case set up, protective plate located horizontally to the ground above anexplosive charge. Hemispherical air burst.
To determine the blast parameters for a hemispherical burst (surface burst), the fol-lowing steps from [Unified Facilities Criteria, 2008] are applied:
1. Determine the charge weight W , the distance R between the point of interest, thecharge center, and Hc the normal distance between the charge center and the targetplate.
2. Apply 20% safety factor to the charge weight.
3. Calculate the scaled distance Z and the angle of incidence α.
Z =R
W 1/3(B.1)
α = tan−1(d
Hc
)(B.2)
115

APPENDIX B. PROCEDURE FOLLOWED TO OBTAIN THE BLASTPARAMETERS IN CONWEP
4. Use figure B.2 to obtain blast parameters for the point of interest based on thescaled distance Z.
5. Use figure B.3 with interpolation techniques to obtain the reflected pressure coeffi-cient Cr at the angle of incidence α based on the side-on pressure pso value whichwas determined in the previous step, where
Cr =prαpso
(B.3)
6. Use figure B.4 with interpolation techniques to obtain the reflected scaled impulseassociated with α.
7. Discretize the target plate to a sufficient number of points and calculate the blastparameters for all points to obtain the distribution of any parameter over the plate.
Figure B.2: Positive phase shock wave parameters for a hemispherical TNT explosion onthe surface at sea level. [Unified Facilities Criteria, 2008].
116

Angle of incidence, Degrees
Cr
= P
r / P
so
Figure 2-193. Reflected pressure coefficientversus angle of incidence
0 10 20 30 40 50 60 70 80 901
2
3
4
5
6
7
8
9
10
11
12
13
Peak Incident Overpressure, psi5000300020001000500400300200150100
70503020105210.50.2
Figure B.3: Reflected pressure coefficient versus angle of incidence. [Unified FacilitiesCriteria, 2008].
117

APPENDIX B. PROCEDURE FOLLOWED TO OBTAIN THE BLASTPARAMETERS IN CONWEP
Angle of Incidence, Degrees
psi
-mse
c/lb
^(1/
3)
Figure 2-194a. Reflected scaled impulseversus angle of incidence
0 10 20 30 40 50 60 70 80 905
6
78
10
20
30
40
50
60
7080
100
200
300
400
500
600
700800
1000
2000
3000
4000
5000
6000
70008000
10000
Peak Incident Overpressure, psi70006000500040003000
200015001000700400
200100502010
Figure B.4: Reflected scaled impulse versus angle of incidence. [Unified Facilities Criteria,2008].
118

Blast Parameters distribution for the studied target
An application of the previous steps yields the results needed for all blast parameters andtheir distribution over all the plate. These results define the actual load case for the targetplate and thereby lead to a proper design.
For (1 × 1) square plate where; W = 1,2 × 0,0979 kg and Hc = 0,5 m, the blastparameters are obtained. Reflected pressure distribution is shown in figure B.5 and thereflected impulse distribution is shown in figure B.6.
Note that the technical manual [Unified Facilities Criteria, 2008] uses the US unitssystem as can be seen in the figures. However all results obtained are transferred into SIunits in this report.
-0.5 0 0.5
Length[m]
-0.4
-0.3
-0.2
-0.1
0
0.1
0.2
0.3
0.4
Wid
th[m
]
3000
3500
4000
4500
5000
5500
6000
6500
7000
7500
Ref
lect
ed P
ress
ure
[Kpa
]
Figure B.5: Reflected pressure distribution over the target plate. W = 0,1175 kg, R =0,5 m.
-0.5 0 0.5
Length[m]
-0.4
-0.3
-0.2
-0.1
0
0.1
0.2
0.3
0.4
Wid
th[m
]
280
300
320
340
360
380
400
420
Impu
lse
[Pa
s]
Figure B.6: Reflected impulse distribution over the target plate. W = 0,1175 kg, R =0,5 m.
119


C | Aluminium foam material test
The following appendix describe the material test of the aluminium foam used in theproject. The solid material of the foam is 5556 aluminium, and the plate has an averagedensity of 458 kg/m3, including the skin from the manufacturing process, and a poissonratio of ≈ 0.
Purpose
To determine the mechanical properties of the aluminium foam, including:
• Compressive stress-stain curve
• Modulus of elasticity
• Densification strain/point
• Anisotropy
Procedure
Cylindrical test specimens are manufactured from a plate with a thickness of 30 mm. Thecylinders are 30 mm long and have a diameter of 25 mm. The diameter is chosen to beless than the thickness as to avoid skin effects from the top and bottom in the specimensin the internal directions. The cylinders are cut a minimum distance of 20 mm from theedges of the plate to avoid skin effects, and in three orientations to investigate anisotropy,figure C.1.
Inplane direction 2
Inplane direction 1
Figure C.1: Aluminium foam plate, and the orientation of the cylindrical test specimens.
Furthermore, slab specimens are manufactured as well. These vary in size and arebeside the normal compression test used to test for variation in density and the effectfrom this, along with size effects and determination of the modulus of elasticity.
121
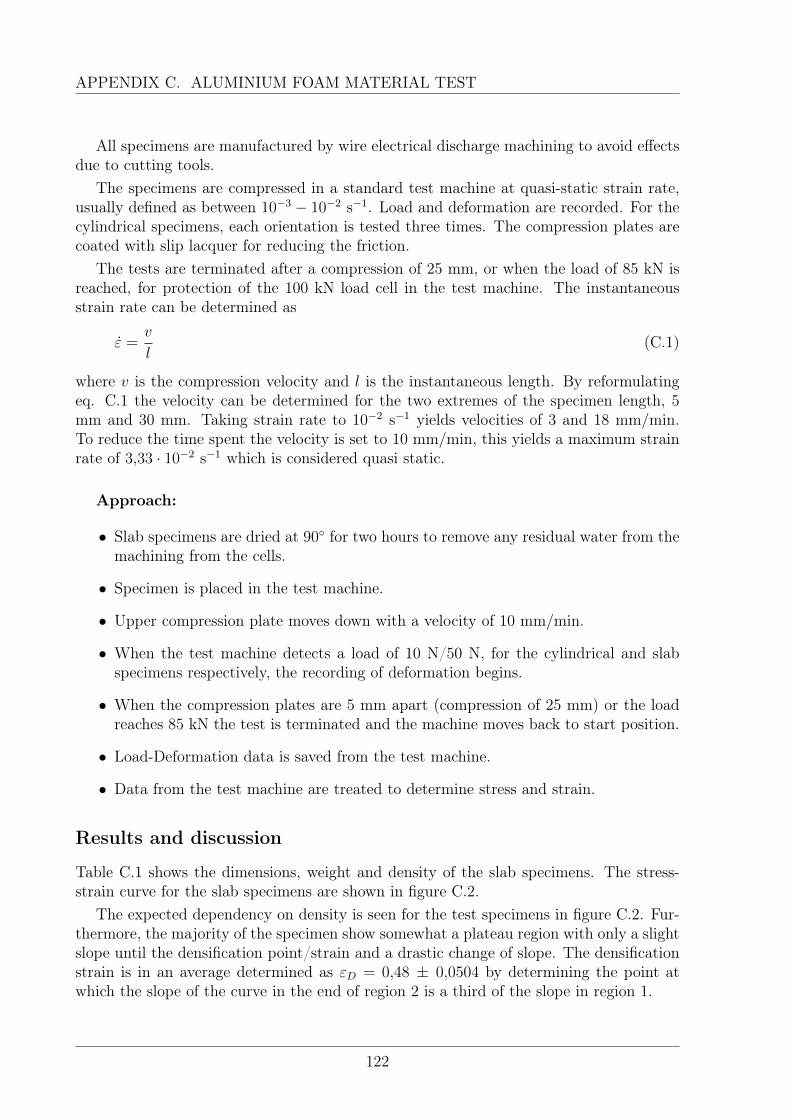
APPENDIX C. ALUMINIUM FOAM MATERIAL TEST
All specimens are manufactured by wire electrical discharge machining to avoid effectsdue to cutting tools.
The specimens are compressed in a standard test machine at quasi-static strain rate,usually defined as between 10−3 − 10−2 s−1. Load and deformation are recorded. For thecylindrical specimens, each orientation is tested three times. The compression plates arecoated with slip lacquer for reducing the friction.
The tests are terminated after a compression of 25 mm, or when the load of 85 kN isreached, for protection of the 100 kN load cell in the test machine. The instantaneousstrain rate can be determined as
ε =v
l(C.1)
where v is the compression velocity and l is the instantaneous length. By reformulatingeq. C.1 the velocity can be determined for the two extremes of the specimen length, 5mm and 30 mm. Taking strain rate to 10−2 s−1 yields velocities of 3 and 18 mm/min.To reduce the time spent the velocity is set to 10 mm/min, this yields a maximum strainrate of 3,33 · 10−2 s−1 which is considered quasi static.
Approach:
• Slab specimens are dried at 90 for two hours to remove any residual water from themachining from the cells.
• Specimen is placed in the test machine.
• Upper compression plate moves down with a velocity of 10 mm/min.
• When the test machine detects a load of 10 N/50 N, for the cylindrical and slabspecimens respectively, the recording of deformation begins.
• When the compression plates are 5 mm apart (compression of 25 mm) or the loadreaches 85 kN the test is terminated and the machine moves back to start position.
• Load-Deformation data is saved from the test machine.
• Data from the test machine are treated to determine stress and strain.
Results and discussion
Table C.1 shows the dimensions, weight and density of the slab specimens. The stress-strain curve for the slab specimens are shown in figure C.2.
The expected dependency on density is seen for the test specimens in figure C.2. Fur-thermore, the majority of the specimen show somewhat a plateau region with only a slightslope until the densification point/strain and a drastic change of slope. The densificationstrain is in an average determined as εD = 0,48 ± 0,0504 by determining the point atwhich the slope of the curve in the end of region 2 is a third of the slope in region 1.
122

Test specimen no. Weight Dimensions Density† 1 55,4 g 49,59 x 50,09 mm 743,4 kg/m3
2 36,7 g 49,87 x 50,32 mm 487,5 kg/m3
3 33,1 g 49,73 x 50,44 mm 439,9 kg/m3
4 49,6 g 50,59 x 74,75 mm 437.2 kg/m3
5 47,6 g 50,82 x 74,76 mm 419,5 kg/m3
6 38,0 g 49,36 x 49,73 mm 516,0 kg/m3
7 18,7 g 24,69 x 49,45 mm 510,5 kg/m3
8 20,0 g 24,75 x 49,53 mm 543,8 kg/m3
9 16,7 g 24,64 x 49,52 mm 456,2 kg/m3
10 44,6 g 45,61 x 74,74 mm 436,1 kg/m3
11 27,6 g 49,81 x 49,72 mm 371,5 kg/m3
12 30,1 g 49,92 x 49,77 mm 403,8 kg/m3
Avg. density for specimens:(with skin) 478,9±92,60 kg/m3
(without skin) 456,5±49,98 kg/m3
Density of plate: 458 kg/m3
Table C.1: Data on the slab specimen. Thickness: 30 mm. †: A single side was coveredin skin from the manufacturing. A relative great variation in the density of the foam fromdifferent parts of the plate is observed.
The modulus of elasticity is determined from the unloading curve, following a smallplastic deformation of the order of 1%, following guidelines in [Olurin et al., 2000], as thisis a more consistent representation of the elasticity due to cell collapses. An average ofthree measurements for both the loading and the unloading is given in eq. C.2 and shownin figure C.3(b).
Eloading = 183 ± 88,3 MPa Eunloading = 336 ± 48,8 MPa (C.2)
The strain energy density and specific strain energy are determined for an averagestress-strain curve. The energies are from zero to densification strain and given in eq.C.3.
u = 2,19 ± 0,573 MJ/m3 e = 4737 ± 1324 J/kg (C.3)
The average stress-strain curve is obtained by taking the average stress of all specimens,except specimen 1, at uniform strain intervals. This curve is used for representing thematerial in simulations. The average stress-strain curve is shown in figure C.3(a).
It is seen from figure C.3(a) that there are no clearly defined plateau stress. Foranalytical estimates and calculations an average value is used for simplicity, the averageis taken from the end of the linear region onto the densification strain and is determinedto σplateau = 4,77 ± 2,18 MPa.
123

APPENDIX C. ALUMINIUM FOAM MATERIAL TEST
0 0.1 0.2 0.3 0.4 0.5 0.6 0.7 0.8
Strain [mm/mm]
0
10
20
30
40
50
60
70
Str
ess
[MP
a]
Stress-StrainSlab specimens
01 - ; = 0.743 kg/dm3
02 - ; = 0.492 kg/dm3
03 - ; = 0.44 kg/dm3
04 - ; = 0.437 kg/dm3
05 - ; = 0.418 kg/dm3
06 - ; = 0.516 kg/dm3
07 - ; = 0.511 kg/dm3
08 - ; = 0.544 kg/dm3
09 - ; = 0.456 kg/dm3
10 - ; = 0.436 kg/dm3
11 - ; = 0.371 kg/dm3
12 - ; = 0.404 kg/dm3
Figure C.2: Stress-strain curve for the slab specimens as a function of density. Noticespecimen 12, 4, 6 and 8 for general tendency of density effect (increasing density). Notice,specimen 1 has a single side with skin, hence the outlier.
0 0.1 0.2 0.3 0.4 0.5 0.6
Strain [mm/mm]
0
2
4
6
8
10
12
14
Str
ess
[MP
a]
Average Stress-Strain
(a) The averaged stress-strain curve used for simula-tions. The red x marks the densification strain.
0 0.01 0.02 0.03 0.04 0.05 0.06
Strain [mm/mm]
0
0.5
1
1.5
2
2.5
3
Str
ess
[MP
a]
Stress-StrainSlab specimen 2
(b) A single cycle on slab specimen 2. There is adifference in the slope of the loading and unloadingpart of the test.
Figure C.3
124

As it is clear that the stress-strain relation and density varies from specimen to speci-men it is attempted to determine a stress-strain-density relation. To determine whethersuch a relation exist it is investigated if there is a correlation between densification strainand density, and strain energy density and density. These are plotted in figure C.4.
2 4 6 8
Density [g/mm 3] #10-4
0.45
0.5
0.55
0.6
0.65
Den
sific
atio
n st
rain
[mm
/mm
] Densification strain - Density010203040506070809101112
(a) Densification strain with respect to density.
2 4 6 8
Density [g/mm 3] #10-4
0
2
4
6
8
Str
ain
ener
gy d
ensi
ty [M
Pa]
Strain energy density - Density010203040506070809101112
(b) Strain energy density with respect to den-sity.
Figure C.4
It can be observed from figure C.4 that there are no clear correlation between neitherdensification strain and density, or strain energy density and density. Figure C.4(a) maygive the impression of a slight correlation but this is mainly due to specimen 1 and 12which both had skin on one side. From this and additional attempts no expression betweendensity and any other mechanical properties are found.
And, the stress-strain curve for the cylindrical specimens are shown in figure C.5.As is seen from figure C.5 there are quite large differences between the test specimens.
It is however difficult to conclude whether this is due to anisotropy as it is observed thatthere are large differences in the structure of the foam specimens, ranging from denseuniform cell structure to large voids, figure C.6. Furthermore, the specimens in the sameorientation, except for the ’through-the-thickness (blue)’, deviate significantly and theslight anisotropy which may exists is negligible compared to this density effect.It is also observed that the specimens contain water from the machining process, thewater is attempt removed by simple drying but the specimens still excrete water duringthe compression. The strain rate at which the test is performed should however permita steady flow of water from the cell, without drastically increasing the internal pressureof the cell and thereby hamper the collapse of these. It is however rectified for the slabspecimens for good measure.
The expected behaviour of the foam, including a plateau of near constant stress and adensification point, are observed in all the specimens.
125

APPENDIX C. ALUMINIUM FOAM MATERIAL TEST
-0.1 0 0.1 0.2 0.3 0.4 0.5 0.6 0.7 0.8 0.9
Strain [mm/mm]
0
10
20
30
40
50
60
70
80
90
Str
ess
[MP
a]
Stress-StrainCylindrical specimens
1: Through thickness2: Through thickness3: Through thickness4: Inplane 15: Inplane 16: Inplane 17: Inplane 28: Inplane 29: Inplane 2
Figure C.5: Stress-Strain curves from compression test of the cylindrical specimens.1-3 are Ø25 mm through the thickness, 4-6 and 7-9 are Ø25 mm in internal directions.
126

(a) Unevenness of cell sizes. (b) An example of cavities.
(c) Another example of cavities. (d) Excreted water during compression.
Figure C.6
127

APPENDIX C. ALUMINIUM FOAM MATERIAL TEST
Manufacturing of aluminium foam
Five different methods of making metal foams are established commercially and can bedivided into four classes: foam is formed from a vapour phase; foam is electro-depositedfrom an aqueous solution; from liguid-state processing; and when the foam is created froma solid state, [Ashby et al., 2000]. The main differences of the methods are whether thefoam topology is open-cell or closed-cell, and the difference in quality and thereby cost.
The available Alulight is manufactured from consolidation of metal powder added afoaming agent, i.e. solid state. This agent is unknown, but is commonly titanium hydride(TiH2) according to [Ashby et al., 2000], which releases the hydrogen when heated, andthereby creating the cells. Titanium hydride starts to decompose into Ti and H2 whenheated to 465 C. The melting point of pure aluminium is 660 C or thereabout for itsalloys, [Ashby et al., 2000]. A foam is thereby created, by heating the powders to atemperature somewhere in-between to release the hydrogen and allow bubble growth inthe partially melted/mushy aluminium (alloy). These voids have a high internal pressure,and disperse in the aluminium as it swells to fill the mold creating the foam. This isfollowed by a cooling procedure which stabilizes the shape of the foam. Usually, thediameter of the closed-cells following this procedure is Ø1 - 5 mm. [Ashby et al., 2000].
The foaming process using a powder metallurgy method creates a solid skin, whichcan be used for surface bonding to other materials, yields a high specific strength and adistinct non-linear behaviour in compression, [Gama et al., 2001].
128

D | Model for calculating foam thick-ness for blast loaded structure
The following appendix presents an analytical model developed by [Hanssen et al., 2002]of an aluminium foam bar in an effort to obtain a sound physical understanding of themechanics governing the deformation of the stated foam and determine an expression fordetermining the necessary thickness of the foam for avoiding complete densification duringan explosion and thereby direct transfer of the blast load into the structure.
The model is based on the work in [Hanssen et al., 2002] for determining the one-dimensional deformation in an aluminium foam bar under the assumption of a linearlydecaying blast load.
The model is shown in figure D.1 and consists of a foam bar covered by a front panelof mass mp and area A loaded by a blast loading p(t) while it is fixed to a rigid wall inthe distal end. Note, that p(t) does not account for spatial distribution, i.e. a reductionin magnitude as the foam bar deforms and thereby increases the distance to the source ofthe blast is not accounted for, [Hanssen et al., 2002]. Furthermore, the model is of single-degree-of-freedom (SDOF), and hereby does not include bending, shear, and membraneeffects of the front plate.
p(t)
u(t)
ρ
L
Reaction wall
Foam barFront panel
mp
Proximal end Distal end
Figure D.1: 1D model system of foam bar with front panel undergoing a blast load. Thebar is of length L, cross-sectional area A and mass mf = ρAL. The deformation of thebar is given by u(t). [Hanssen et al., 2002].
The front panel is considered as rigid, and the foam bar is considered as a r-p-p-lmaterial (rigid-perfect-plastic-locking) of strength σpl, i.e. the plateau stress. The r-p-p-lmodel behave as a rigid perfect plastic material until the densification strain of εD isreached where the material ’locks’ into a rigid solid and behaves as shown in figure D.2,[Hanssen et al., 2002].
129

APPENDIX D. MODEL FOR CALCULATING FOAM THICKNESS FOR BLASTLOADED STRUCTURE
L
σpl A
εD L
(1-εD) L
ρ
ρs
Strain
Stressσpl
εD
Figure D.2: Definition of the r-p-p-l material model. ρs is the density of the solid material.[Hanssen et al., 2002].
In figure D.3 the model system at time t and t + dt is shown. The foam bar startsdeforming in the loaded end/proximal end, and a densification front moves through thematerial resulting in the left part of the foam becoming completely densified achieving thesame velocity as the rigid front panel, whereas the remaining right part is not affected bythis deformation, [Hanssen et al., 2002]. However, due to the stiffness of the material, anear-instantaneous propagation of a stress wave (at time t = 0) from the proximal end tothe distal end has increased the stress in this part to σpl yielding a reaction wall force ofσplA. The densification front keeps proceeding as long as the necessary energy is supplied,as the plastic compression of the foam consumes kinetic energy, increasing the size of thecompacted region, [Hanssen et al., 2002].
p(t) A
p(t+dt) A
u u, u
mp ρs
x
σpl A σpl A
ρs
z = l–x–u
ρ
dx/(1-εD)
Reaction wall
u + du u+du, u+du
σD Aρs
x dx
σpl Aρ
Reaction wall
[Compacted zone] [Non-compacted zone]
σpl
σD
t t+dt
Stress at compacted distance x
[t:]
[t + dt:] mp
Figure D.3: FBD at time t and t+ dt. [Hanssen et al., 2002].
130

Using conservation of mass, and the size of the compacted zone x and the displacementof the front panel u for time t is
u =εD
1− εDx (D.1)
Using figure D.3, consider the element of length dx/(1−εD) in the non-compacted zonedirectly in front of the compacted zone. At time t, the stress at both sides of the elementis σpl. A time increment later, t + dt, the element has undergone a compression and hasthe velocity u+ du. To accelerate this element, the stress on the left side instantaneouslyincreases to σD at time t. In the time interval of t to t + dt, the impulse from the forceshas to equal the change in momentum of the element, [Hanssen et al., 2002].
ρsAdx (u+ du) = (σD − σpl)Adt (D.2)
Assuming that the second order term dx du is negligible, then by dividing with dt andtaking the limit dt→ 0
σD = σpl +ρ
1− εDx u note ρs =
ρ
1− εD(D.3)
where the relation of density between the solid/compacted part and the foam part is givenin figure D.2.
Similarly, the conservation of momentum (Newton 2nd) for the front panel and com-pacted region (rigid body) to the left of the element dx gives[
mp +ρA
1− εDx
]u+ (σD − p(t)) A = 0 (D.4)
By combining eqs. D.1, D.3 and D.4, a single differential equation is obtained[1 +
ρA
mp εDu
]u+
ρA
mp εDu2 + (σpl − p(t))
A
mp
= 0 (D.5)
which states that the change in momentum for the bar has to equal the impulse from theexternal forces, i.e. blast load and reaction force, [Hanssen et al., 2002].
The pressure of the blast loading is defined as
p(t) =
p0
(1− t
t′0
),
0,
t ≤ t′0
t > t′0
(D.6)
where p0 is the initial peak pressure and t′0 is the equivalent triangular duration of the
blast loading.
131

APPENDIX D. MODEL FOR CALCULATING FOAM THICKNESS FOR BLASTLOADED STRUCTURE
The initial conditions are
u(0) = 0 u(0) = 0
and the complete solution then becomes1
u
εD L= 0 t ≤ 0 or
p0σpl≤ 1,
u
εD L= −m+
√√√√m2 + 4ξ
(1− σpl
p0
)[t
t′0
]2− 1
3
[t
t′0
]30 < t ≤ t
′0 and
p0σpl
> 1,
u
εD L= −m+
√√√√m2 + 4ξ
−1
3+
[t
t′0
]− σplp0
[t
t′0
]2t′
0 < t ≤ 1
2
p0σpl
t′
0 andp0σpl
> 2
u
εD L= −m+
√m2 + ξ
p0σpl− 4
3
t >
1
2
p0σpl
t′
0 andp0σpl
> 2
(D.7)
where the two dimensionless numbers are the mass ratio m between the front panel andfoam bar, and the impact factor ξ
m =mp
mf
ξ =I2
mf F0 εD L
with I being the total impulse exerted on the front panel by the blast as I = 12p0 t
′0A and
F0 is the blast loading force of F0 = p0A, [Hanssen et al., 2002].As seen from the solution, if σpl > p0 then no deformation of the foam takes place as
the strength of the material is larger than the blast load. If the blast load is marginallylarger than the strength of the material σpl < p0, the deformation of the foam reaches itsmaximum and stops during the blast loading (t < t
′0) if
1 ≤ p0σpl≤ 2
And finally, if the blast load is a lot larger than the strength of the foam, the deformationof the foam reaches its maximum value at time tm given by
tmt′0
=1
2
p0σpl
,p0σpl
> 2
The duration of the blast load t′0 compared to the time the pressure of σpl acts on the walltm is seen in figure D.4, and the impulse inflicting the reaction wall is σplA tm = 1
2p0A t
′0.
This shows, that the impulse from the blast loading is exerted by the foam bar on thereaction wall, i.e. conservation of momentum, the force is reduced, but an increase in theduration induces the same impulse.
1using mathematical software
132

p0
σpl
t 0
tm
Time
Pressure
Blast loading
Pressure on reaction wall
Figure D.4: [Hanssen et al., 2002]
Using the lock-strain/densification strain, the maximum deformation in the foam is
0 ≤ u
εD L≤ 1
and using eq. D.7 the condition between the two dimensionless parameters m and ξ is
0 ≤ ξ ≤ 1 + 2m[p0σpl− 4
3
] , p0σpl
> 2 (D.8)
Following this, the minimum length of the foam bar to be able to fully absorb the blastload is
L ≥ I2
(mf + 2mp) p0AεD
(p0σpl− 4
3
),
p0σpl
> 2 (D.9)
In cases where these conditions are not met, the foam bar becomes fully compactedbefore the blast has been damped, and the blast load is transferred undamped into thereaction wall increasing the stress from σpl to the value of the blast loading.
The necessary model parameters such as p0 and t0 can be estimated from the softwareConWep, along with material tests to determine the strength σpl of the foam.
133


E | Basic hydrocode
The following appendix is an edited version of the "Numerical simulations" chapter in[Barrett et al., 2016]. Here included for completeness and reference.
Numerical simulations for impact and blast loads are usually conducted in hydrocodes.Hydrocodes are numeric programs specialised in solving impact problems. According to[Zukas, 2004] the name hydrocode stems from the earliest codes where hydrodynamicbehaviour was assumed for high strain rate impact problems. Most hydrocodes solvetransient problems by an explicit formulation as this is, usually, superior for small timesteps. For a brief summary of the solving process see appendix F.
The commercial hydrocodes ANSYS Autodyn and ANSYS Explicit Dynamics are usedto simulate the blast load effects. As the names suggest both programmes are part ofANSYS simulation suite, version 17.2. In fact, Explicit Dynamics is in reality only a pre-and post-processor, as it uses the Autodyn solver. Autodyn gives more possibilities andcontrol to the user, while Explicit Dynamics is easier to use and gives the possibility ofparametrising inputs and outputs. Parametrising is especially useful when conductingmultiple similar studies, such as convergence study, and also gives the possibility of usingoptimisation on a simulation. The modelling methods, material models, etc. are describedwith regards to Autodyn as these options and possibilities are dependent on the solver.The accessibility through Explicit Dynamics is mentioned when relevant.Both Autodyn and Explicit Dynamics are used during the project. Both also have accessto a library of explicit material models, this is subsequently called the ANSYS materiallibrary. It is of course also possible to implement custom materials based on user defineddata."
Methods
Autodyn contains multiple methods for solving problems of different characteristics, whichcan also be combined for highly complex problems. Some of them are:
• Finite element for structural dynamics (Lagrange)
• Finite volume for transient fluid dynamics (Euler)
• Adaptive mesh for structural dynamics with large deformation (ALE)
• Mesh-free particle for large deformation and fragmentation (SPH)
When using Explicit Dynamics only Lagrange and Euler are directly available. Systemscan be pre-processed in Explicit Dynamics and then migrated to Autodyn and converted toor have SPH and ALE parts added. Post-processing the results back in Explicit Dynamicshas not been found to be possible.
135

APPENDIX E. BASIC HYDROCODE
Lagrange
In Lagrange method the mesh follows the material as it deforms, the amound of materialin an element is the same before and after deformation. This makes it easy to keep trackof material and material flow during the simulation. Contact is also handled more easilyas it can be determined as contact between meshes with distinct nodes and element edges.The downside is when large deformations occur the elements can distort and thereby loseaccuracy and as the time step is determined from the smallest element length in thesystem the simulation can begin to use such a small time step that it effectively grindsto a halt. To counter this the method of erosion is often employed, this is different fromthe physical erosion and is simply the removal of elements that fulfil certain conditions,often related to the size of the time step. When employing erosion it is possible to retainthe nodes from eroded elements, as the nodes contain the mass of the element, as well asdisplacement, velocity and acceleration. It is therefore possible to keep the kinetic energyin the system, the potential energy from stresses is however lost.
Euler
In the Euler method the mesh is fixed and material flows through the mesh from cellto cell. The downsides of Lagrange are therefore omitted as the cells do not distort andlarge deformations do not affect the time step of the simulation. As material boundariesare not defined by the mesh these, and contact, must be defined and tracked by differentmeans. This adds extra complexity to the simulation and as the mesh is static it needsto be defined for the entire zone that material may move to. Euler is preferable for fluidmaterial, such as air and water, as these materials usually undergo very large distortions.Autodyn contains two Euler solvers, multi-material and flux-corrected-transport. Multi-material can be used for all types of materials, fluids as well as solids, and contacts withinthe Euler domain. Flux-corrected-transport (FCT) is a shock-capturing scheme useful fordiscontinues problems and yields more precise results. In the user interface of AutodynFCT is now called ideal-gas as only materials using an ideal-gas model are allowed. Thistypically restricts its used to blast waves and explosions.
ALE
Arbitrary Lagrange Euler is, as the name may suggest, a mixture of the Lagrange and theEuler method. It works as a Lagrange simulation, with deforming mesh, which at a setinterval of iterations restructures the mesh so that highly skewed elements are avoided.The restructuring is usually conducted on internal nodes so that the boundary of thematerial is kept. During the restructuring, the deformations and stresses are transferredfrom former nodes and elements to new nodes and elements. This process is similar todeformation with Euler method, hence the name, and if the restructuring is done at eachiteration ALE becomes, more or less, pure Euler. ALE gives the advantages of bothLagrange and Euler at the cost of higher computational demands, more complexity andloss of history of each node.
136

SPH
Smoothed-Particle Hydrodynamics, also known as mesh less simulation, is a method wherethe nodes are not connected by elements or cells and is thereby mesh less. By not con-necting the nodes by elements the problem of large distortion and infinitesimal time stepsare avoided. Break up and fracture of material are also handled more naturally. The SPHmethod is highly complex and have many tuning parameters. It is the most recent of thementioned methods and is still under heavy development.
Interactions
Both SPH and ALE are in essence derived from Lagrange formulations and contacts be-tween these three are handled in much the same way. Autodyn contains two types ofcontact detection, trajectory and proximity based. Trajectory based contact detectiontrack nodes and faces, and activates contact when a node crosses a face during a cycle.Proximity base contact detection encapsulates external nodes and faces in a contact de-tection zone, and activates contact when a node enters this zone. Trajectory does notaffect the size of the time step, but for proximity the time step must not be so large that anode can travel all the way through the detection zone. Proximity based contact requirean initial gap between geometry parts. Trajectory based contact is not available for SPHand structured grids.Lagrange and ALE parts can interact with Euler through an Euler-Lagrange coupling.This is achieved by regarding the Lagrange body as a moving boundary for the Eulerdomain. This results in stress in the Euler material and reactions forces that are appliedto the Lagrange part in a feedback system. It is important for Euler-Lagrange couplingthat the Lagrange elements are larger than the Euler cells as leakage of material in theEuler domain otherwise may happen. When using Lagrange shells an effective couplingthickness is employed.
Material models
The model for a material in dynamic simulations is build up of multiple parts. For eachpart there exist many different models depending on behaviour and application. Fromsimple linear model identical to static behaviour to complex ones taking many factors intoaccount, even lookup tables from extensive lab tests. Different parts can be mixed andmatched to fit a specific use or available data. All materials are, as minimum, suppliedwith an reference density (ρ0) and an Equation of State. Specific heat (at constant volume,Cv) and thermal conductivity are often specified but not necessarily.
Equation of State
Equation of State (EOS) is the relation between the pressure, or hydrostatic stress, thelocal density, and the local specific energy. The simplest EOS is Hooke’s law, in hydrocodeit is often formulated by means of the bulk modulus. The bulk modulus gives a linearrelation between hydrostatic stress and change in volume, and does not take temperature
137

APPENDIX E. BASIC HYDROCODE
into account. Hooke’s law is valid for linear elastic materials and yields good results forrelatively small volumetric change, around 2%.
σhyd = −p = 3K εhyd (E.1)
In ANSYS Autodyn this EOS is called: Linear EOS.
The aluminium models in ANSYS material library use a linear shock EOS. Accordingto [ANSYS Inc., 2016] this EOS is based on Rankine-Hugoniot equations for the shockjump conditions and relates the pressure to the change in density (change in volume),specific energy and particle velocity. It is formulated in eq. E.2.
p = pH + Γ ρ(e− eH) (E.2)
pH =p0 C
20 u(1 + µ)
(1− (S − 1)µ)2
eH =1
2
pHp0
(µ
1 + µ
)µ =
ρ
ρ0− 1
where p is pressure, e is specific energy, u is particle velocity, ρ is density, C0 is the bulksound speed called C1 in the library, S is the Hugoniot linear slope coefficient called S1 inthe library, and Γ is the Gruneisen coefficient and relates energy and volume to pressure.Both EOS are combined with a shear modulus for deviatoric distortion.
Strength
During large deformation the material often starts to yield and deform plastically. Whenand how this happens is often termed as strength of the material. One of the mostused ones for ductile materials is Johnson-Cook’s strength model, see [Johnson and Cook,1983], which takes strain, strain rate and temperature effects into account, eq. E.3. Thismakes it highly applicable for transient problems where strain rate hardening and thermalsoftening can not be ignored. The model contains five constants, A is the yield strength,B is the strain hardening constant, n is the strain hardening exponent, C is the strainrate constant and m is the thermal exponent. εp is the effective plastic strain, εp is theeffective plastic strain rate, ε0 is the reference strain rate, and T is temperature. A, Band n can be determined independently of C and m by testing at strain rate 1 s−1 atroom temperature, the strain rate term and thermal term thereby equates to one. Theremaining terms are typically determined by fitting to data at varying strain rates andtemperatures.
Y =[A+Bεnp
][1 + C ln(εp
∗)] [1− T ∗m] (E.3)
εp∗ =
εpε0
T ∗ =T − Troom
Tmelt − Troom
138

The Steinberg-Guinan model is another strength model often used in hydrocode. It isthe strength model used for most of the aluminium models in the ANSYS material library.Steinberg-Guinan takes the saturation of strain rate effects, compared to other factors,some materials exhibit at strain rates greater than 105 s−1, into account. It also accountsfor changing shear modulus due to pressure and temperature. It takes the form of eqs.E.4 and E.5.
G = G0
1 +
(G′PG0
)P
η1/3+
(G′tG0
)(T − 300)
(E.4)
Y = Y0
1 +
(Y ′PY0
)P
η1/3+
(G′tG0
)(T − 300)
(1 + βε)n (E.5)
Where Y is the yield strength, G is the shear modulus, G0 is the shear modulus at 300kelvin, Y0 is the yield strength at Hugoniot elastic limit, T is temperature in kelvin, εis effective plastic strain, η is compression ratio, η = V0/V, β is the strain hardeningconstant and n is the strain hardening exponent. Primed parameters subscripted withT and P are the derivatives of the parameter with respect to temperature and pressurerespectively, at a reference state with T = 300 K, P = 0 and ε = 0.In ANSYS it has an built-in failure mechanism as the shear modulus and yield strengthare set to zero if the temperature exceeds the specified melting temperature.
Failure
At a sufficiently high load, any material will fail. This is especially true in hydrocode wherestresses can reach very high magnitudes. Breakup of structures are often an importantfactor in hydrocode studies. To model this in hydrocode, failure is divided into two parts,failure initiation and post failure response. Failure initiation; model when failure occursin a given element. Several different criteria exist to determine failure initiation; plasticstrain, principle stress failure, Johnson-Cook failure and more. Post failure response;model a given element’s strength characteristics after failure. Two different models existfor post failure response, instantaneous failure and gradual failure. Gradual failure is alsocalled damage. For instantaneous failure the deviatoric stresses are set to zero immediatelyupon failure and subsequently kept there. The element is additionally only able to supportcompressive pressure. For gradual failure, the stresses in the element are gradually limited.Failure can also be used as a criterion for element erosion.
139


F | Hydrocode cycle process
The following appendix describe the cycle process in solving numerical problems usinghydrocode.
Hydrocodes makes use of an explicit formulation for solving high speed and/or highstrain problems. The explicit formulation is solved by cycling through a series of sub-processes, advancing forward one time step with each cycle. The cycle process describedin the following is based on the Lagrange method but the main idea is the same for allmethods. The appendix chapter is based on [ANSYS Inc., 2016] and [Zukas, 2004].
Time step
The time step is the step taken in each cycle which advances the simulation. The stepcan vary for each cycle to ensure stability, and is usually defined by the smallest elementsize in the mesh
δt = f
[h
c
]min
(F.1)
where δt is the time step, h is the characteristic height of an element, c is the speed ofsound of the material in the element, and f is a stability factor. The stability factor is asdefault f = 0,6666 in Autodyn and f = 0,9 in Explicit Dynamics.
Nodal Displacements
Element Strain Rates
Element Densities
Element Stresses
Sum Nodal Forces
Nodal Accelerations
Nodal Velocities
Initial Conditions
Apply Loads,Constraints andContact Forces
Figure F.1: The cyclic solve process for hydrocode solvers.
141

APPENDIX F. HYDROCODE CYCLE PROCESS
Figure F.1 illustrates the cyclic process used in hydrocode. The initial conditionsare determined during preprocessing, velocities, pre-stress, materials, loads, boundaryconditions. At this point time is, usually, set to t = 0.
• Nodal Velocities are determined explicitly from the accelerations, current veloci-ties and the time step. The central difference method is used for the velocity, thusit is displaced by half a time step.
u
(t+
δt
2
)= u
(t− δt
2
)+ u(t)δt (F.2)
• Nodal Displacements are calculated explicitly based on the velocity, current dis-placement and time.
u(t+ δt) = u(t) + u
(t+
δt
2
)δt (F.3)
• Element Strain Rates are calculated based on the velocity and element formula-tion. Element strains are based on strain rates and current strains.
ε(t+ δt) =∂u(t+ δt)
∂xi(F.4)
ε(t+ δt) = ε(t) + ε(t+ δt)δt (F.5)
• Element Densities are determined from the new element volumes determined fromthe new nodal locations.
• Element Stresses are calculated from the elements and the strain rates. Thesedepend on the material model. Elastic stresses based on bulk and shear modulus.
σHyd(t+ δt) = σHyd(t) +Kεv(t+ δt)δt (F.6)σ′ij(t+ δt) = σ′ij(t) + 2G( ˙εij(t+ δt)− δij εv(t+ δt))δt (F.7)
• Summing Nodal Forces from stresses in the elements by the use of the elementformulation. External forces from loads constraints and contacts are added to thenodes.
F =
∫σ dV + Fexternal (F.8)
• Nodal Accelerations are calculated from the nodal forces and masses.
u(t+ δt) =F
m(F.9)
• New Cycle is then ready, the time is updated, t = t + δt. A new time step isdetermined based on the new densities (for the speed of sound) and element sizes.If the end time is reached the simulation is terminated. Result and restart files arewritten.
142

G | Additional materials for numericsimulations
The following appendix document the addition of two materials to the ANSYS materiallibrary, for use in simulations.
The ANSYS material library contains a wide variety of materials for use in explicitsimulations. Two materials used in the simulations are added as these are not found inthe library. These are ARMOX 500T armour steel and the Alulight foam material.
The ARMOX 500T material is modelled with the linear equations of state and theJohnson Cook strength model. Data for the material models are obtained from SSABOxelösund AB [2007] and Nilsson [2003]. The parameters are shown in table G.1.
Parameter Value UnitDensity 7,85 g
cm3
Specific Heat 450 JkgK
Bulk Modulus 175000 MPaShear Modulus 80000 MPaInitial Yield Stress (A) 1470 MPaHardening Constant (B) 702 MPaHardening Exponent (n) 0,199Strain Rate Constant (C) 0,00549Thermal Softening Exponent (m) 0,811Melting Temperature (Tmelt) 1800 CReference Strain Rate (ε0) 1 s−1
Table G.1: Material parameters for ARMOX 500T.
The Alulight material (foam) is also modelled with the Isotropic Elasticity model inANSYS, which converts to the linear equations of state in Autodyn, and the CrushableFoam strength model. The data for the material models are obtained from the materialtest described in appendix C. The crushable foam strength model used table data for thestress-strain relation in the plastic domain. This is imputed from a file containing thedata shown in figure C.3(a) page 124.
Parameter Value UnitDensity 0,458 g
cm3
Bulk Modulus 112 MPaShear Modulus 168 MPaMax Tensile Stress 2 MPa
Table G.2: Material parameters for Alulight.
Both material are supplied in the annex as .xml files that can be imported into ANSYS.
143


H | Design of test setup expansion
The following appendix document the design of an expansion for the test setup in the ter-minal ballistics laboratory, Fibigerstræde 14, Aalborg University. This expansion permitsthe use of a ballistic pendulum.
To determine the effectiveness of a material’s energy absorbing properties under blastloads, a pendulum structure is often used. The energy taken by the pendulum can bedetermine from the swing of the pendulum. The swing is reduced by the energy absorbedby the target.At the start of the project, the test setup is not setup for this type of measurements, eventhough it is originally designed for this a relocation has striped it of this capability. Forthat reason an extension is designed and built to facilitate this type of measurements.
Target end test setup
The test setup for the target end is constructed of a number of components.
• Bottom frame
• Top frame (New)
• Frame connection plates (New)
• Bullet catcher
• Hangers
• Hanger rails (New)
At the onset of the project only the bottom frame, the bullet catcher and the hangersexist.Both top and bottom frame are constructed from 100x100x5 square steel tubes. The twoframes are bolted together with the use of the frame connection plates. The top frame arebuilt with a series of holes used for mounting the hanger rails at different heights. Theframe connection plates are 20 mm thick steel plates with six threaded holes, they connectthe two frames at each corner. The bullet catcher is a heavy steel pipe with a removableback lid of aluminium and two "ears" at the front for mounting impact dampers. Thebullet catcher is at the onset of the project fixed to the bottom frame despite beingdesigned to function as a pendulum. The hangers are constructed from square tube,c-bar and flat-bar, they are design to work with the bullet catcher as pendulum armsand are equipped with copper bearings. The hanger rails are made from 40x15 flat-ironand contains holes along the length for mounting the hangers. The complete assembly isshown on figure H.1, both CAD- and work-drawings are found in the annex.
145

APPENDIX H. DESIGN OF TEST SETUP EXPANSION
Figure H.1: The new target end test setup. New additions are coloured dark grey.
146

I | Strain gauge measurements
The following appendix describes the basic strain gauge theory needed for conductingstrain gauge measurements, along with necessary calibrations and sampling rates for prob-lem free data collection.
The method of obtaining data from the panel during the blast loading is by measuringand record the strain response in different locations on the panel. A basic understandingon the use of strain gauges is therefore necessary, and described in the following section.
Strain gauges utilise that the electrical resistance of wires is directly reliant on thelength of this wire, or in the cases of strain gauges, the change in resistance in the wireis proportional to the change in length pr. unit length, strain, of the wire. For the straingauge applies
ε =∆L
L(I.1)
where L is the original gauge length and ∆L is the elongation of the wire.As the cross-sectional area of the wire is very small, the resistance in the wire is very
sensitive to straining parallel to the ordered wire direction, shown in figure I.1. The straingauge yields an average measure of strain, which is interpreted as the strain of the pointin the center of the strain gauge.
ΔL L
Figure I.1: From [Christensen and Olesen, 2007].
The relation between the measured strain and the change in resistance is∆R
R= kSG ε
′a (I.2)
where ∆R/R is the relative change in resistance, ∆R is the change in resistance, R is theinitial resistance, kSG is the strain gauge factor and ε′ is the measured strain.
Due to this strain sensitivity, a strain gauge also detects the transverse strain whichis inconvenient as the two strain contributions, axial and transverse, is not measuredseparately. The transverse sensitivity, kt, of the strain gauge has to be accounted for.A very low transverse sensitivity for strain gauges is desired, as the measured strain ε′
and the actual strain ε is taken as equal and the relation between resistance and strainis, using eq. I.2
εa =∆R
R
1
kSG(I.3)
147

APPENDIX I. STRAIN GAUGE MEASUREMENTS
For cases where the transverse sensitivity is significant, one has to account for this usingthe strain gauge equation
εa =∆R
R
1
kSG
(1− kt ν01 + kt
εtεa
)= ε′a
(1− kt ν01 + kt
εtεa
)(I.4)
where εa and εt are the axial and transverse strain and ν0 = 0,285 is the Poisson’s ratioof the strain gauge calibration material, [Hoffmann, 1989].
As the strain gauges are so strain sensitive, thermal effects of the material may be anissue when conducting measurements. The issue can be reduced by utilising strain gaugesthat fit the material they are mounted on, i.e. similar thermal expansion coefficient.
The Wheatstone Bridge
A Wheatstone bridge is an electrical circuit used in measuring electrical resistance ex-tremely accurate. It is therefore suitable for use in combination with strain gauges. Aschematic of the Wheatstone bridge is shown in figure I.2.
1
4
23 V0
R1
R4R3
R2
Vs
V0
Figure I.2: A schematic of the Wheatstone Bridge. A full bridge is shown if you considerall the resistors are connected as strain gauges. Other configurations are a half- or quarterbridge utilising two or one leg for strain gauge(s) respectively.
The circuit is made up of four resistors of two serial connections in parallel. A supplyvoltage of Vs is applied and the output voltage of V0 depends on the equivalent resistanceof the four resistors as the following ratio shows, [Hoffmann, 1989]
V0Vs
=R1R3 −R2R4
(R1 +R2)(R3 +R4)(I.5)
Equation I.5 is nonlinear, and often the following linear approximation is used
V0Vs≈ 1
4
(∆R1
R1
− ∆R2
R2
+∆R3
R3
− ∆R4
R4
)(I.6)
148

This approximation is usually sufficient.A complete measurement system generally consists of a strain gauge amplifier in which
the Wheatstone bridge is include. This amplifier processes the signal and supply thebridge and thereby gauges with the necessary voltage. The strain gauges act as variableresistors in the chosen bridge configuration, figure I.2. The reading from the amplifier is
εi =4
kbridge
V0Vs
(I.7)
where kbridge is the bridge factor/amplification factor.This can be rewritten in terms of relative resistance change using eq. I.6 and eq. I.2
and substituting into eq. I.7
εi =1
kbridge
(∆R1
R1
− ∆R2
R2
+∆R3
R3
− ∆R4
R4
)(I.8)
=1
kbridge(kSG1 ε
′1 − kSG2 ε
′2 + kSG3 ε
′3 − kSG4 ε
′4) (I.9)
which is the equation for the full bridge configuration.
Influence of long cables
As the strain gauges are to be mounted on an armour panel for a live-blast test, a safetyzone for both equipment and personnel is to be expected. A blast test of a former projectgroup, [Christensen and Olesen, 2007], described a safety distance of 50 m when theequipment was suspended in rubber bands, and in the present case at least 18 m isnecessary as determined in chapter 9. This requires the use of very long cables comparedto laboratory experiments, and the effect of this on calibration and measurement errorshas to be considered.
The effect of long cables, and how to counteract it is investigated in [Christensen andOlesen, 2007]. The test of long cables (50 m) is compared against a reference test usingcables of 1,5 m on a beam in bending.The investigation found, that the use of a quarter bridge and a long cable is infeasible,as calibration of the strain gauge could not be achieved due to the resistance in the longcable resulting in an unbalance, which the amplifier is unable to correct, in the Wheatstonecircuit. Using just a quarter bridge configuration, it is impossible to cancel the resistancein the cable.A half bridge configuration was also investigated. Using this configuration it is possibleto cancel the resistance in the cable. This is achieved by mounting one of the straingauges on an unloaded metal piece, i.e. a dummy strain gauge. By subtracting thetwo measurements from each other, one effectively removes the strain-error due to theresistance in the cables. Furthermore, by mounting the dummy strain gauges on a similarmaterial and placing them in the same temperature, the temperature effect is likewisecancelled out. This is also seen by eq. I.8 considering only R1 and R2. [Christensen andOlesen, 2007] determined, that there still exists an error of approximately 6% from thereference measurement.
149

APPENDIX I. STRAIN GAUGE MEASUREMENTS
This error measurement can be eliminated by use of a correction formula, [Hoffmann,1989]. The correction formula require a measurement of the resistance in the feeder cable,the return cable and the strain gauge. For the half bridge configuration (fig. I.3), thecorrection formula is [Hoffmann, 1989]
ε1 − ε2 = εiRC1,feed +RSG1 +RC1,return +RC2,feed +RSG2 +RC2,return
RSG1 +RSG2
(I.10)
where RCX,feed and RCX,return are the cable out to (feeding) the strain gauge and returningfrom, respectively, and RSGX is the resistance of the chosen strain gauge, e.g. 120 Ω. Thevalidity of the correction formula was tested in [Christensen and Olesen, 2007].
2
1
3
RC1,feed
RC1,return
RC2,feed
RC2,return
RSG2
RSG1
Figure I.3: A half bridge configuration, and definition of parameters in eq. I.10. RCX,feed
etc. represent the resistance in the long cables. [Hoffmann, 1989].
Necessary sampling rate
The loading of the armour panel happens is a very short duration. The analyses show,that maximum deformation is achieved in approximately tm = 1,3 ms by the numericalmethods, and tm = 0,67 ms for the analytical methods. The eigenperiod is also determinedanalytically for a linear SDOF system to T = 2,69 ms. As a precaution the sampling timeis increased to 3 ms to not miss any interesting parts of the blast test. A high samplingrate is desired to create enough data points for detecting what happens during the loading,and compare results.
The available strain gauge amplifier, Spider8 from HBM [2017], has a maximum sam-pling rate of 9600 Hz, [HBM-S8, 2017]. With the maximum sampling rate, it is possible to
150

record 28 data points in the 3 ms time range. As four strain gauges are used, the samplingis furthermore conducted on four channels. This limits the duration of the measurementperiod due to restrictions governed by the laptop, this has to be considered. The laptopcan be set to run a loop, and first start recording the data after a set time, or at a set load,i.e. a pretrigger. In [Christensen and Olesen, 2007] with sampling on the same number ofchannels, a loop of 20 ms was possible.
Preparing the armour panel with strain gauges
The location of the strain gauges on the armour panel, the type of strain gauge used andthe bridge configuration is described in the following.
Different type of strain gauges are available, and these are shown in figure I.4. Thestrain gauges can be used for;
• Single gauge. Used to measure the axial strain in one point in the direction of thegauge orientation.
• Double gauge. Used to measure biaxial strain in one point, in the individualdirection of each gauge perpendicular to one another.
• Rosette. Used to measure all in-plane strains in a point, as shear strain is measuredby the gauge in the 45 direction.
• Chain gauge. Used to measure strain and strain gradient in the length of thechain.
(a) Single (b) Double (c) Rosette
(d) Chain
Figure I.4: Available strain gauge types. Reused from [Albertsson et al., 2015].
The strain gauges can also be combined, for detecting if a strain in the structure isfrom a tension/compression or a bending load. This is obtained by placing two singlegauges opposite each other in a symmetrical cross-section about the bending axis. In casethe rosette is used, one has to adjust the measured strains with the rotation equation fordetermining the transverse effect,
ε′(α) = ε′xx cos2 (α) + ε′yy sin2 (α) + 2 ε′xy cos (α) sin (α) (I.11)
151

APPENDIX I. STRAIN GAUGE MEASUREMENTS
and α is the angle of orientation on the strain gauge. Hereafter, the strain gauge equation,eq. I.4, is applied.
Placement and purpose of strain gauges
The strain gauges are glued onto the backside of the armour panel, i.e. the ARMOX back-ing plate, for immediate protection against the blast. They measure the elastic responseduring loading. An equal amount of dummy strain gauges are glued onto an unloadedARMOX structure and placed in the same environment for use as cable and temperaturecalibration as discussed previously.
The strain gauges are strategically placed to determine the elastic bulge developing onthe backside of the armour panel as the blast load impinges the target. Furthermore, astrain gauge is used for determining the residual load transferred to the fixture, i.e. thechassis of the vehicle.It is only possible to place the strain gauges on the backside to protect them againstthe blast wave. It is thereby only possible to measure the transverse strain in the panel,and by this determine whether the deformation of the test, analytical and simulation areconsistent. Strain gauge 1 and 2 are checking for double symmetry and should measurethe same strain. Strain gauge no. 2 is placed directly in front of no. 3 for measuring thestrain gradient to be used in determining the shape of the bulge. No. 4 is for determiningthe residual load transferred to the fixation structure.
1 m
1 m
Back side of armour panel
0,50 m
0,25 m
2 x 0,125 m
0,25 m
1
2 3
(a) Location of the strain gauges on the back side of the armourpanel.
4
(b) Backplate deformation from sim-ulation.
Figure I.5
152


In cooperation with