Plate Tectonics
25
125 124 Plate Tectonics SC.7.E.6.5: Explore the scientific theory of plate tectonics by describing how the movement of Earth’s crustal plates causes both slow and rapid changes in Earth’s surface, including volcanic erup- tions, earthquakes, and mountain building. SC.7.E.6.7: Recognize that heat flow and move- ment of material within Earth causes earthquakes and volcanic eruptions, and creates mountains and ocean basins. (Also SC.7.N.1.1, SC.SC.7.N.3.2) FPO FPO Will get some photoshop work here. HANDS-ON LAB VIDEO INTERACTIVITY VIRTUAL LAB ASSESSMENT ETEXT APP This island in the South Pacific formed as the result of a violent eruption of material from deep inside Earth. What role does this kind of event play in shaping Earth’s surface? How do geological processes change Earth’s surface? Explore how Earth's continents can be linked together. Engineering How did this island get here? LESSON 1 Evidence of Plate Motion uInvestigate Lab: Piecing Together a Supercontinent LESSON 2 Plate Tectonics and Earth’s Surface uInvestigate Lab: Plate Interactions LESSON 3 Earthquakes and Volcanoes uInvestigate Lab: Analyze Earthquake Data to Identify Patterns Designing to Prevent Destruction Plate Tectonics 4 TOPIC GO ONLINE to access your digital course It creates land, a physical place for organisms to exist. MGES19_SE_FL_PT_TO.indd All Pages 2/24/17 3:38 PM
-
Upload
khangminh22 -
Category
Documents
-
view
12 -
download
0
Transcript of Plate Tectonics

125124 Plate Tectonics
SC.7.E.6.5: Explore the scientific theory of plate tectonics by describing how the movement of Earth’s crustal plates causes both slow and rapid changes in Earth’s surface, including volcanic erup-tions, earthquakes, and mountain building.
SC.7.E.6.7: Recognize that heat flow and move-ment of material within Earth causes earthquakes and volcanic eruptions, and creates mountains and ocean basins. (Also SC.7.N.1.1, SC.SC.7.N.3.2)
FPO
FPOWill get some photoshop
work here. 124 Topic 6 Populations, Communities, and Ecosystems 125124 TOPIC 6 Populations, Communities, and Ecosystems
6
124 Topic 6 Populations, Communities, and Ecosystems 125
NA_H1NA_TXT NA_TXTNGSS PERFORMANCE EXPECTATIONSMS-LS2-1 Analyze and interpret data to provide evidence for the effects of resource availability on organisms and populations of organisms in an ecosystem.
MS-LS2-2 Construct an explanation that pre-dicts patterns of interactions among organ-isms across multiple ecosystems.
MS-LS2-4 Construct an argument supported by empirical evidence that changes to physical or biological components of an ecosystem affect populations.
MS-LS2-5 Evaluate competing design solutions for maintaining biodiversity and ecosystem services.
6
124 TOPIC 6 Populations, Communities, and Ecosystems124 Topic 6 Populations, Communities, and Ecosystems 125124 TOPIC 6 Populations, Communities, and Ecosystems
6
HANDS-ON LAB
VIDEO
INTERACTIVITY
VIRTUAL LAB
ASSESSMENT
ETEXT
APP
This island in the South Pacific formed as the result of a violent eruption of material from deep inside Earth. What role does this kind of event play in shaping Earth’s surface?
How do geological processes change Earth’s surface?
Explore how Earth's continents can be linked together.
EngineeringHow did this island get here?
LESSON 1Evidence of Plate MotionuInvestigate Lab: Piecing Together
a Supercontinent
LESSON 2Plate Tectonics and Earth’s SurfaceuInvestigate Lab: Plate Interactions
LESSON 3Earthquakes and Volcanoes uInvestigate Lab: Analyze Earthquake
Data to Identify Patterns
Designing to Prevent Destruction
Plate Tectonics4
TOPIC
Lab
GO ONLINE to access your digital course
It creates land, a physical place for organisms to exist.
1p4 min
3p
3p11
6p2
3p11
1p10
6p7
14p2 width and height
17p9
1p10
2p min
8p7 max
1p min
2p23p6
6p
3p
p6
p9
1p min
p9
Title_Topic This can run from 1 to 3 lines
H1_Topic
Topic_Num This can run from 1 to 11
SB_H1_greenSB1_H2_green
SB1
FL_STD_RIH
Lesson Panel: there can be 3-5 lessons.
FTL_white
TXT1_9_5pt
SB1_p1B
GO ONLINES: The color does not change. The icons are K-12 universal font. The colors are:40c70k: gray20m100y: yellow
Object Style:GreenYellow_Topic
MGES19_SE_FL_PT_TO.indd All Pages 2/24/17 3:38 PM
michaelwysession
Highlight
michaelwysession
Sticky Note
change Motion to Motions
michaelwysession
Sticky Note
This Topic is greatly improved!! Thank you for doing so much work to improve it. There are still some areas that need some work, but this is very close to being done. Thanks!!Michael

FINDINGS
VIDEO
KICKOFF
126 Plate Tectonics 127
SC.7.E.6.5: Explore the scientific theory of plate tectonics by describing how the movement of Earth’s crustal plates causes both slow and rapid changes in Earth’s surface, including volcanic eruptions, earthquakes, and mountain building. SC.7.E.6.7: Recognize that heat flow and movement of material within Earth causes earthquakes and volcanic eruptions, and creates mountains and ocean basins. (Also SC.7.N.1.1, SC.SC.7.N.3.2)
126 Topic 6 Populations, Communities, and Ecosystems 127126 TOPIC 6 Populations, Communities, and Ecosystems
6
126 Topic 6 Populations, Communities, and Ecosystems 127
NA_TXT_black NA_TXT_black
NGSS PERFORMANCE EXPECTATIONSMS-LS2-1 Analyze and interpret
data to provide evidence for the effects of resource availability on organisms and popula-tions of organisms in an ecosystem.
MS-LS2-2 Construct an explanation that pre-dicts patterns of interactions among organ-isms across multiple ecosystems.
MS-LS2-4 Construct an argument supported by empirical evidence that changes to physical or biological components of an ecosystem affect populations.
MS-LS2-5 Evaluate competing design solutions for maintaining biodiversity and ecosystem services.
6
126 TOPIC 6 Populations, Communities, and Ecosystems126 Topic 6 Populations, Communities, and Ecosystems 127126 TOPIC 6 Populations, Communities, and Ecosystems
6
IN LESSON 3What kinds of data
can be used to predict an eruption? Investigate the tools and methods that volcanologists use to study volcanoes. Then analyze some data to determine the likelihood of an eruption.
Monitoring a Volcano
INTERACTIVITY
IN LESSON 2How is volcanic activity related to tectonic plate movements? Explore the science behind the con-nection.
CHECK-IN
Mount Rainier’s Threat
INTERACTIVITY
To Hike or Not to Hike
INTERACTIVITY
Complete the Quest!Present information on Mount Rainier’s history and current geological research, along with your evidence-based argu-ment about whether it is safe to hike and camp there.
Reflect on Mount Rainier’s Safety
INTERACTIVITY
CHECK-INS
IN LESSON 1 What is Mount
Rainier’s history of erup-tion? Investigate the mountain range’s history and draw conclusions about the likelihood of an eruption.
HANDS-ON LABPatterns in the Cascade Range
CHECK-IN
The Cascade Range stretches from northern California all the way up through British Columbia, Canada. Mount Rainier is just one of many volcanoes that lie within the range and are considered “active.”
PROs
CONs
After watching the Quest kickoff video, which explains volcanic processes, think about the pros and cons of hiking on Mount Rainier. Record your ideas below.
How safe is it to hike around Mount Rainier?
Camping and hiking in the mountains are popular pastimes for people all over
the world. But what if the mountain is actually an active volcano? It hasn’t erupted for a couple of thou-sand years—but it could. Would a volcanologist say it is safe to hike? What kinds of data do they collect to predict eruptions?” In this problem-based Quest activ-ity, you will determine whether it is safe to take an extended camping and hiking trip on Mount Rainier. Through hands-on labs and digital activities, you’ll gather evidence about Rainier’s history and look into current research on the mountain’s volcanic activity. You will use this information to create a presentation that supports your claim and synthesizes your findings.
HANDS-ON LABSigns of Eruption?
1p4 min
3p
3p11
6p2
3p11
1p10
6p7
14p2 width and height
17p9
1p10
2p min
8p7 max
1p min
2p23p6
6p
3p
p6
p9
1p min
p9
Title_Topic This can run from 1 to 3 lines
H1_Topic
Topic_Num This can run from 1 to 11
SB_H1_greenSB1_H2_green
SB1
FL_STD_RIH
Lesson Panel: there can be 3-5 lessons.
FTL_white
TXT1_9_5pt
SB1_p1B
GO ONLINES: The color does not change. The icons are K-12 universal font. The colors are:40c70k: gray20m100y: yellow
Object Style:GreenYellow_Topic
MGES19_SE_FL_PT_QO.indd All Pages 2/23/17 1:08 PM
michaelwysession
Highlight

FPO
CONNECTION
129128 Plate Tectonics
SC.7.E.6.5: Explore the scientific theory of plate tectonics by describing how the movement of Earth’s crustal plates causes both slow and rapid changes in Earth’s surface, including volcanic erup-tions, earthquakes, and mountain building. (Also SC.7.N.2.1, SC.7.N.3.1)
128 Topic 6 Populations, Communities, and Ecosystems 129128 Topic 6 Interactions in Ecosystems128 TOPIC 6 Populations, Communities, and Ecosystems
6
128 Topic 6 Populations, Communities, and Ecosystems 129
NA_STD
NGSS PERFORMANCE EXPECTATIONSMS-LS2-1 Analyze and interpret data to provide evidence for the effects of resource availability on organisms and populations of organisms in an ecosystem.
MS-LS2-2 Construct an explanation that pre-dicts patterns of interactions among organ-isms across multiple ecosystems.
MS-LS2-4 Construct an argument supported by empirical evidence that changes to physical or biological components of an ecosystem affect populations.
MS-LS2-5 Evaluate competing design solutions for maintaining biodiversity and ecosystem services.
6
128 TOPIC 6 Populations, Communities, and Ecosystems128 Topic 6 Populations, Communities, and Ecosystems 129128 TOPIC 6 Populations, Communities, and Ecosystems
6Wegener’s HypothesisFor many centuries, scientists and map-makers have been curious about why some continents look as though they could fit together like the pieces of a jigsaw puzzle. The continents on the east and west sides of the South Atlantic Ocean, for exam-ple, looked like they would fit perfectly together (Figure 1). In 1596, Dutch map-maker Abraham Ortelius proposed that North America had once been pressed against Europe, and South America against Africa. He thought earthquakes and floods could have torn the landmasses apart. In the mid 1800s, scientists began to gather other clues that suggested the slow movement, or drift, of continents. In 1910, German meteo-rologist Alfred Wegener (VAY guh nur) further developed the hypothesis that all of of the continents had once been fused together, and that over time they had drifted apart. This hypothesis became known as “continental drift.”
In 1915, after gathering evidence that supported his hypoth-esis, Wegener published The Origin of Continents and Oceans. The book connected clues from studies of land features, fossils, and climate to make a compelling case for his hypothesis that a supercontinent called Pangaea (pan JEE uh) had broken up into the continents known today.
Pieces of the PuzzleFigure 1 Scientists won-dered if the continents’ coastlines seemed to fit like jigsaw puzzle pieces because they had once been joined together.
Draw lines between South America (continent on left side of globe) and Africa (on right) to show how the contours of the two continents could fit together.
Patterns What might you infer about South America and Africa if you thought the continents were movable objects?
Connect It
Learn about processes that affect Earth’s surface, including structures such as Mount Rainier.
Practice Vocabulary on a mobile device.
VOCABULARY APP
Academic Vocabularyhypothesis
Vocabularymid-ocean ridge sea-floor spreadingsubductionocean trench
Guiding Questions• What evidence supports the theory of
plate tectonics?• What roles do mid-ocean ridges and
ocean trenches play in the movement of continents?
Connections Literacy Cite Evidence
Math Use Variables
Evidence of Plate Motions
LESSON
Academic VocabularyIn science, a hypothesis is an idea that can be tested by experimentation or investigation. It is an evi-dence-based idea serves as a starting point, whereas a scientific theory is what science produces when a hypothesis has been shown to be true through a broad range of studies. As you read this lesson, highlight or underline the key compo-nents of the hypothesis of continental drift.
1 Try your hand at piecing together puzzles.
INTERACTIVITY
that they’d once been stuck together
1p4 min
3p
3p11
6p2
3p11
1p10
6p7
14p2 width and height
17p9
1p10
2p min
8p7 max
1p min
2p23p6
6p
3p
p6
p9
1p min
p9
Title_Topic This can run from 1 to 3 lines
H1_Topic
Topic_Num This can run from 1 to 11
SB_H1_greenSB1_H2_green
SB1
FL_STD_RIH
Lesson Panel: there can be 3-5 lessons.
FTL_white
TXT1_9_5pt
SB1_p1B
GO ONLINES: The color does not change. The icons are K-12 universal font. The colors are:40c70k: gray20m100y: yellow
Object Style:GreenYellow_Topic
MGES19_SE_FL_PT_L01.indd 128-129 2/24/17 3:55 PM
michaelwysession
Highlight
michaelwysession
Sticky Note
that serves
michaelwysession
Highlight
michaelwysession
Sticky Note
change have to had
michaelwysession
Highlight
michaelwysession
Sticky Note
JB. Change B-head to "Evidence from Continents" This follows the format of the later B-heads on ocean data. And it wasn't Wegener's hypothesis. That is a cute little story that has been propagated by middle school textbooks. There were many geologists involved in constructing continental drift. This discovery was NOT like Einstein and relativity. Einstein gets to have B-heads named for him. Wegener should not. He was just one of many.

HANDS-ON LAB
131130 Plate Tectonics130 Topic 6 Populations, Communities, and Ecosystems 131130 Topic 6 Interactions in Ecosystems130 Topic 6 Populations, Communities, and Ecosystems 131130 Topic 6 Populations, Communities, and Ecosystems 131
Evidence From Climate Wegener, whose own exper-tise was in the study of weather and climate and not geology, also gathered evidence that showed Earth’s continents had experienced different climates than the ones they have today. For example, Spitsbergen, an island in Arctic Ocean (Figure 2), has fossils of plants that could have survived only in a tropical climate. This doesn’t mean that the Arctic Ocean once had a tropical climate. That isn’t possible, because the poles do not receive enough sunlight to produce tropical weather or sup-port tropical plants. Instead, this evidence means Spitsbergen used to be at the equator, part of a supercontinent. The super-continent slowly broke apart, and the island now known as Spitsbergen drifted far to the north over the course of millions of years.
Evidence for Continental DriftFigure 2 Study the map key to see how Wegener pieced together similar pieces of evidence from separate sites to support his hypothesis.
Interpret Visuals Present-day India is in South Asia, at the northern end of the Indian Ocean. What evidence found in India matches that of other locations?
Evidence From Land Features There were other pieces of evidence to support the hypothesis of continental drift. Mountain ranges near those continents’ coasts seemed to line up, as though they had been made in the same place and at the same time. Coal deposits, made of the remains of plants that thrived in warm locations millions of years ago, were found on multiple continents and in regions that no longer sup-ported that kind of plantlife. The separate, scattered locations of these features (Figure 2) suggested that they hadn’t always been separate.
Evidence From Fossils Wegener also gathered evi-dence from the fossil record (Figure 2). Fossils are traces of organisms preserved in rock. Geologist Edward Suess noted that fossils of Glossopteris (glaw SAHP tuh ris), a fernlike plant from 250 million years ago, were found on five continents. This suggested that those landmasses had once been connected, as part of Pangaea. Fossils of animals told a similar story. Mesosaurus and Lystrosaurus were reptiles that lived in freshwa-ter habitats millions of years ago, yet their fossils were found in both South America and Africa.
Literacy ConnectionCite Evidence Use your science notebook to organize the evidence that supported the hypothesis of continental drift. Identify the a common theme among the different pieces of evidence.
Reflect Think of some-thing in your own life that you encountered in two different places that are many miles apart. Were the items from the same place? How did you know? What did the thing’s presence in two different places tell you about it?
READING CHECK Summarize What is the general pattern in the evidence that supports the hypothesis of continental drift?
Piece Pangaea together.
PACIFIC
OCEAN
ATLANTIC
OCEAN
ATLANTIC
OCEAN
INDIAN
OCEAN
PACIFIC
OCEAN
KEYFolded mountainsCoal bedsGlacial depositsGlossopteris fossilsLystrosaurus fossilsMesosaurus fossils
PE18 12MGES19_SE_FL_PT_A0000182Continental Drift Evidence
Second proof
Things found at multiple sites that are now thousands of kilometers apart can only be explained by continental drift.
Lystrosaurus and Glossopteris fossils were found in India, Africa, and Antarctica.
FPOMap is being resized to fit new layout. Labels and key
will be reduced to spec.
MGES19_SE_FL_PT_L01.indd 130-131 2/24/17 3:55 PM
michaelwysession
Highlight
michaelwysession
Sticky Note
michaelwysession
Highlight
michaelwysession
Sticky Note
JB. Change 1st sentence to: "Geologists noticed that evidence from the fossil record supported continental drift (Figure 2)."
michaelwysession
Highlight
michaelwysession
Sticky Note
JB. Change sentence to recognize that most of this work was NOT done by Wegener: "Study the map key to see how rock and fossil evidence from separate sites reveals the supercontinent of Pangaea."
michaelwysession
Highlight
michaelwysession
Sticky Note
JB.Change title to "Evidence for Pangaea"

Ocean surface
Upper mantle
Mantle
Oceanic crust
Lorem ipsum dolor sit amet, consectetuer adipiscing elit, sed diam nonummy nibh euismod tincidunt ut laoreet dolore maga aliquam erat volutpat. Ut wisi enim adLorem ipsum dolor sit amet, consectetuer adipis cing elit, sed diam nonummy nibh euismod tincidunt ut.
Lorem ipsum dolor sit amet, consectetuer adipiscing elit, sed diam nonummy nibh euismod tincidunt ut laoreet dolore maga aliquam erat volutpat. Ut wisi enim adLorem ipsum dolor sit amet, consectetuer adipis cing elit, sed diam nonummy nibh euismod tincidunt ut.
Mid-oceanic ridge
Molten material
133132 Plate Tectonics132 Topic 6 Populations, Communities, and Ecosystems 133132 Topic 6 Interactions in Ecosystems132 Topic 6 Populations, Communities, and Ecosystems 133132 Topic 6 Populations, Communities, and Ecosystems 133
Sea-Floor SpreadingFigure 4 Sea-floor spreadind continually adds material to the ocean floor on both sides of the ridge.
Develop Models Label the different features that result in sea-floor spreading.
Sea-Floor SpreadingWhile ocean floor mapping was underway, geologists began to gather samples of rock from the ocean floor. They learned that mid-ocean ridges are the sources of new spans of the ocean floor. In a process called sea-floor spreading, molten material flows up through a crack in Earth’s crust, spreads out on both sides of the crack, and hardens into solid strips of rock. The entire entire floor on either side of the ridge moves away when this occurs, meaning the older strips of rock move farther from the ridge over time. It’s like a two-way conveyer belt with new material appearing at the ridge while older material is carried farther away. Figure 4 shows a model and describes some spe-cific evidence of sea-floor spreading.
READING CHECK Cite Evidence Why was undersea explora-tion important to building on Wegener’s hypothesis?
Mid-Ocean RidgesWegener’s hypothesis included evidence from different areas of science, but it had a major flaw: It lacked a good explana-tion for how the continents could have broken up and moved apart. Many scientists rejected his hypothesis for that reason. By the middle of the twentieth century, advances in oceanog-raphy, or the study of Earth’s oceans, reinvigorated Wegener’s hypothesis.
One of the key advances was in mapping the ocean floor. By measuring distances from the sea surface to its floor, scien-tists now had a clear visual of what Earth’s surface looked like under the oceans. What surprised many was the presence of long, zipperlike chains of undersea mountains called mid-ocean ridges. One such chain, called the Mid-Atlantic Ridge, ran down the middle of the Atlantic Ocean, curving in a pattern that seemed to mirror the contours of the surrounding continental coastlines. Further modeling and mapping of the ocean floor in the 1990s showed that these mid-ocean ridges extend throughout Earth’s oceans for about 70,000 kilometers. If you could hold Earth in your hand, the mid-ocean ridges might resemble the seams on a baseball (Figure 3). Could these ridges be the actual seams of Earth’s crust?
Investigate patterns on land and on the seafloor.
INTERACTIVITY
Mid-Ocean RidgesFigure 3 Mapping of mid-ocean ridges in the mid 20th century, provided supporting evidence that Earth’s surface was com-posed of moving plates.Interpret Visuals Do any of the mid-ocean ridges appear to extend into continents? Which ones?
Mid-AtlanticRidge
East Pacific Ridge
ChileRidge
Juan de FucaRidge
SouthwestIndianRidge
CentralIndianRidge
SoutheastIndianRidge
PE18 17MGES19_SE_FL_PT_M0000184Mid Ocean Ridges
Third proof
Mid-AtlanticRidge
East PacificRidge
The East Pacific Ridge appears to run into the west coast of North America.
FPO
FP)Locator will
be gone.
FPO
It revealed mid-ocean ridges, where new crust is made.
MGES19_SE_FL_PT_L01.indd 132-133 2/24/17 3:55 PM
michaelwysession
Highlight
michaelwysession
Sticky Note
change to "...molten material flows up through a crack in Earth's crust and hardens into solid strips of new rock on both sides of the crack."
michaelwysession
Sticky Note
This diagram is mostly OK. But there are some problems. The striped gray ocean crust needs to be the same thickness everywhere. Here, it is thicker at the ridge. It should everywhere be the thickness that it is at the far left of the figure. Also, the Molten Material needs to be a very thin line all the way up, widening into a very small magma chamber in the bottom half of the ocean crust. There is actually VERY little magma under the ridge at any given time. Look at:https://www.uwgb.edu/dutchs/Graphics-Geol/PLATETEC/OPHIO2.GIF(in this figure, for scale, the purple, olive, and green layers are ALL part of the ocean crust (what we show as gray-banded). But it gives you a sense of what the magma chamber should look like.Also, change "Upper mantle" to "mantle" as the upper mantle extends down to 410 km in depth (so both the red and tan layers are mantle). The difference between the red and tan layers is that the tan layer is "Lithosphere mantle" and the red layer is "Asthenosphere mantle"
michaelwysession
Highlight
michaelwysession
Highlight
michaelwysession
Sticky Note
New. Change "oceans" to "ocean" [sorry - I missed this earlier]
michaelwysession
Highlight
michaelwysession
Sticky Note
change last clause to "allowed a mapping of the ocean floor that renewed interest in continental drift."
michaelwysession
Sticky Note
JB. After making, my correction, change "molten material" to "magma"
michaelwysession
Highlight
michaelwysession
Sticky Note
JB. Change question to "Why was undersea exploration important for developing the theory of plate tectonics?"

Subduction
Trench
Mid-ocean ridgeOcean
135134 Plate Tectonics134 Topic 6 Populations, Communities, and Ecosystems 135134 Topic 6 Interactions in Ecosystems134 Topic 6 Populations, Communities, and Ecosystems 135134 Topic 6 Populations, Communities, and Ecosystems 135
Subduction and the Oceans An ocean basin can have a either a spreading ridge, or subduction zones, or both, depending on its age. An ocean basin starts with just a spreading ridge. The Atlantic Ocean, for example, has the Mid-Atlantic Ridge running down its full length, but no subduc-tion zones. This means that the Atlantic Ocean is still getting wider—by about 2 to 5 centimeters per year. At some point, part of the oceanic plate will begin to sink back into the mantle and a subduction zone will form.
The Pacific Ocean is a more mature ocean basin. While it still has a spreading ridge, the Pacific basin is surrounded by subduction zones. Oceanic plate in the Pacific is being recycled back into the mantle faster than it is being created. This means that the Pacific Ocean basin is getting smaller as a whole.
Eventually, hundreds of millions of years from now, there could be another supercontinent, as Africa collides into Europe and the Pacific Ocean closes up.
READING CHECK Cite Evidence What features are evidence of the Pacific Ocean’s maturity?
SubductionFigure 5 Oceanic plates, which form from sea-floor spreading, sink back into the mantle at subduction zones.
Summarize Label the mantle, mid-ocean ridge, and ocean trench.
Ocean TrenchesYou may be wondering why all of the oceans aren’t getting wider, or why Earth as a whole is not expanding, with all of the sea-floor spreading going on. The answer to that is subduction (sub DUC shun), or the sinking movement of ocean floor back into the mantle. Subduction occurs where dense oce-anic crust goes under an adjacent section of Earth’s crust. This often occurs at ocean trenches, which are undersea valleys that are the deepest parts of the ocean.
The Process of Subduction A new area of oceanic plate is relatively warm. As it cools and moves away from a mid-ocean ridge, it gets denser. At some point, the dense slab of oceanic plate may meet another section of ocean floor, or a continent. What happens? The ocean plate is essentially the same as the rest of the mantle underneath. However, because it is colder, it is denser and heavier, and will sink into the mantle if given the chance. At an ocean trench, it has that chance, and the oceanic plate will sink under the edge of continental plate or a younger, less-dense slab of oceanic plate. This subduction deepens the trench between the converging plates. The oceanic plate that dives back into the mantle gets recycled. Water that leaves the subducting rock can cause mantle rock to melt and produce volcanic eruptions on the overlying plate (Figure 5). If the overlying plate is the edge of a continent, you will find a chain of volcanoes there. If it’s ocean floor, you will find a chain of volcanic islands.
Predict North America’s MovementThe map shows the layout of some of Earth’s landmasses and the mid-ocean ridges where plates are made and ocean trenches where plates are recycled.
Predict Use the map key to predict how North America will move in the future. Mark its future path by using arrows or circling an area where it will eventually be.
Model It
NORTHAMERICA
SOUTHAMERICA
AFRICA
EUROPEASIA
AUSTRALIA
KEYTrenchesRidges
PE18 14MGES19_SE_FL_PT_A0000187Partial map of Earth, Atlantic & Pacific ocean basins Map
Second proof
FPO
TK
INTERACTIVITY
Watch what happens at ocean ridges and trenches.
VIDEO
Subduction zones on many sides.
MGES19_SE_FL_PT_L01.indd 134-135 2/24/17 3:55 PM
michaelwysession
Highlight
michaelwysession
Sticky Note
remove "often" [subduction always occurs at an ocean trench]
michaelwysession
Highlight
michaelwysession
Sticky Note
This is not shown on Figure 5. We should either include volcanoes over the subduction zones in Figure 5, or omit the call-out to Figure 5 here.
michaelwysession
Highlight
michaelwysession
Sticky Note
it is
michaelwysession
Highlight
michaelwysession
Sticky Note
change to "..can have a spreading ridge, subduction zones, or both,..."
michaelwysession
Highlight
michaelwysession
Sticky Note
remove "as a whole"
michaelwysession
Highlight
michaelwysession
Sticky Note
JB.remove "slab of"
michaelwysession
Highlight
michaelwysession
Sticky Note
JB.Change "A new area of" to "New"
michaelwysession
Highlight
michaelwysession
Sticky Note
JB.Change "deepens the" to "creates a"
michaelwysession
Highlight
michaelwysession
Highlight
michaelwysession
Sticky Note
JB.Change to "Oceanic plates in the Pacfic are being recycled back into the mantle faster than they are"

CHECK-IN
136 Plate Tectonics
SC.7.E.6.5
136 Topic 6 Populations, Communities, and Ecosystems136 Topic 6 Interactions in Ecosystems136 Topic 6 Populations, Communities, and Ecosystems136 Topic 6 Populations, Communities, and Ecosystems
In this lesson you learned about Wegener’s hypothesis of continental drift, and how he pieced together evidence from different areas of natural history to support his hypothesis.
Connect to the Nature of Science How can the history of Mount Rainier’s eruptions help you decide whether hiking around Mount Rainier is safe?
1. Summarize Describe Alfred Wegener’s hypothesis of continental drift.
2. Evaluate Evidence How were fossils important to Wegener’s work in supporting his hypothesis?
3. Explain How did the discovery of mid-ocean ridges support Wegener’s hypothesis?
4. Predict A large oceanic plate collides with the edge of a continent. What will happen?
5. Infer A remotely-operated vehicle is sent to the deepest part of the Mariana Trench. It returns with a sample of rock from the ocean floor. Would this rock be old or young? Explain.
LESSON 1 Check
Analyze data to determine if there is a pattern to Mount Rainier’s eruptions and those of other nearby volcanoes in the Cascade Range of the Pacific Northwest.
HANDS-ON LABPatterns in the Cascade Range
Millions of years ago there was a single landmass called Pangaea. Over time, it broke into continents that drifted slowly into the positions we see them in now.
Finding the same types of fossils on different continents, especially fossils of organisms that couldn’t swim across oceans, suggested that the separate con-tinents had once been together. Fossils of tropical plant species in polar areas also suggested that the continents had moved from the equator to the poles.
It provided an explanation of how Earth’s crust was continually produced.
The oceanic plate will subduct under the continental plate and be recycled back into the mantle.
Very old. If it’s ocean floor at the deep-est part of a deep-ocean trench, then it’s oceanic crust that was made millions of years ago at a mid-ocean ridge that may be far away.
There may be a pattern in the history of the eruptions, such as frequency of eruptions or how much lava and ash are released. These data can help us make predictions and evaluate risk.
MGES19_SE_FL_PT_L01.indd 136 2/24/17 3:55 PM
michaelwysession
Highlight
michaelwysession
Sticky Note
JB.Change "to Wegener's work in supporting his hypothesis" to "to supporting the ideas of Pangaea"
michaelwysession
Highlight
michaelwysession
Sticky Note
JB.Change "Alfred Wegener's" to "the ideas behind the"
michaelwysession
Highlight
michaelwysession
Sticky Note
JB.Change "Wegener's hypothesis" to "the idea that continents move"
michaelwysession
Highlight
michaelwysession
Sticky Note
JB. Change to "In this lesson you learned about different lines of geologic and biologic evidence that supported continental drift and provided the basis for plate tectonics."

SCIENCE
IT’S ALL CONNECTED SOCIAL STUDIES
Wegener often took research trips to Greenland to research climate. By taking core samples of ice, climatologists can learn about the climate of the past.
137
SC.7.N.1.7, SC.7.N.2.1
137137137
CONNECT TO YOUCONNECT TO YOU
The Slow Acceptance of
“Utter rot,” a “fairy tale,” and “delirious ravings.” This is how some scientists in the early 1900s responded to Alfred Wegener’s theory of continental drift.
The case of Wegener demonstrates that scientific thought doesn't always advance neatly in a straight line. Long-held scientific attitudes can be slow to change when new evidence or interpretations are encountered.
Wegener’s hypothesis, for example, faced a number of challenges. Though he had plenty of evidence, Wegener did not have a convincing explanation of how continental drift actually occurred. Scientists who were already skeptical of the idea only heaped addi-tional ridicule on Wegener.
In addition, Wegener was a trained meteorologist, but his hypothesis crossed many scientific disciplines. Many experts in their respective fields were threatened because Wegener, viewed as an outsider, challenged their authority and expertise. After his death in 1930, the controversial theory was virtually ignored.
Over the next few decades, advances in technology led to a better understanding of the geological forces that shape Earth’s surface. By the early 1960s, younger geologists were able to explain the mechanism by which the continents moved. And, today, Wegener’s ideas about continental drift form one of the corner-stones of modern geology.
EURASIA
INDIA
ANTARCTICA
EQUATOR
PE18 15MGES19_SE_FL_PT_A0000188Pangaea, with plates labeled
Second proof
Do you think skepticism is an important quality for a scientist to have? Why or why not? Discuss your ideas with a partner.
FPO
MGES19_SE_FL_PT_CF.indd 137 2/24/17 3:58 PM

CONNECTION
SC.7.L.17.2w
HANDS-ON LAB
138 Plate Tectonics 139
SC.7.E.6.5: Explore the scientific theory of plate tecton-ics by describing how the movement of Earth’s crustal plates causes both slow and rapid changes in Earth’s surface, including volcanic eruptions, earthquakes, and mountain building. (Also SC.7.N.3.1, SC.7.N.2.2)
138 Topic 6 Populations, Communities, and Ecosystems 139138 Topic 6 Interactions in Ecosystems138 TOPIC 6 Populations, Communities, and Ecosystems
6
138 Topic 6 Populations, Communities, and Ecosystems 139
NA_STD
NGSS PERFORMANCE EXPECTATIONSMS-LS2-1 Analyze and interpret data to provide evidence for the effects of resource availability on organisms and populations of organisms in an ecosystem.
MS-LS2-2 Construct an explanation that pre-dicts patterns of interactions among organ-isms across multiple ecosystems.
MS-LS2-4 Construct an argument supported by empirical evidence that changes to physical or biological components of an ecosystem affect populations.
MS-LS2-5 Evaluate competing design solutions for maintaining biodiversity and ecosystem services.
6
138 TOPIC 6 Populations, Communities, and Ecosystems138 Topic 6 Populations, Communities, and Ecosystems 139138 TOPIC 6 Populations, Communities, and Ecosystems
6New Caption to ComeFigure 1 The tallest mountain on Earth, Mount Everest, is part of the Himalayas. When the landmass that is now known as India collided with Asia, these mountains began to form.
The Theory of Plate TectonicsWith observations of many geologists in the 1950s and 60s, particularly of the features of the ocean floor, the hypothesis of continental drift grew into the theory of plate tectonics. The theory, which was developed in the 1960s, states that Earth’s lithosphere—the crust and upper part of the mantle—is bro-ken up into distinct plates (Figure 1). The plates are puzzle-like pieces that are in slow, constant motion relative to each other due to forces within the mantle. The theory explains the spe-cific patterns of motion among the plates, including the differ-ent types of boundaries where they meet and the events and features that occur at their boundaries. The term tectonic refers to Earth’s crust and to the large-scale processes that occur within it.
Consider how the activity at plate boundaries could be related to the construction and behavior of Mount Rainier.
Identify where the Himalaya Mountains are, and circle them.
Predict Scientists are measuring Mount Everest to determine if its height has changed. Why would the Himalayas be getting taller?
Connect It
Practice Vocabulary on a mobile device.
VOCABULARY APP
Academic Vocabularytheory
Vocabularydivergent
boundaryconvergent
boundarytransform
boundary
Guiding Questions• How do Earth’s plates move?• How are Earth’s surface features evidence
of plate motion?• What are the products of plate movement
at different scales?
Connections Literacy Integrate With Visuals
Math Reason Quantitatively
Plate Tectonics and Earth’s Surface
LESSON
Academic VocabularyIn science, the term theory is applied only to the ideas that are supported by a vast, diverse array of evidence. How is the term used in everyday life?
2 Investigate the role of stress in changing Earth’s surface.
If India keeps moving into Asia, the mountains could keep crumpling and growing in height.
Answers will vary, but students should note that “theory” is used more casually in everyday life.
1p4 min
3p
3p11
6p2
3p11
1p10
6p7
14p2 width and height
17p9
1p10
2p min
8p7 max
1p min
2p23p6
6p
3p
p6
p9
1p min
p9
Title_Topic This can run from 1 to 3 lines
H1_Topic
Topic_Num This can run from 1 to 11
SB_H1_greenSB1_H2_green
SB1
FL_STD_RIH
Lesson Panel: there can be 3-5 lessons.
FTL_white
TXT1_9_5pt
SB1_p1B
GO ONLINES: The color does not change. The icons are K-12 universal font. The colors are:40c70k: gray20m100y: yellow
Object Style:GreenYellow_Topic
MGES19_SE_FL_PT_L02.indd 138-139 2/24/17 3:32 PM
michaelwysession
Highlight
michaelwysession
Sticky Note
JB.change "hypothesis...grew into" to "the ideas behind continental drift re-emerged as" [it is incorrect to say that continental drift grew into plate tectonics. They were totally different. CD was dead, gone for good. But the evidence that supported CD also supported PT]

Continentalcrust
Oceaniccrust
Convectioncurrent
Convectioncurrent
Outer core
Inner core
Equator
Equator
Pa
ngaea
200 Million Years Ago
115 Million Years Ago
Earth TodayEquator
NorthAmerica
Europe
Asia
Africa
SouthAmerica
Antarctica
Australia
NorthAmerica
Europe
Asia
AfricaSouthAmerica
Antarctica
Australia
200 Million Years of Plate MotionFigure 6 The continents have taken about 200 million years to move to their present locations since the breakup of Pangaea.
Interpret Visuals Label the plate map from 115 million years ago with present-day names and landmasses from the “Earth Today” map.
141140 Plate Tectonics140 Topic 6 Populations, Communities, and Ecosystems 141140 Topic 6 Interactions in Ecosystems140 Topic 6 Populations, Communities, and Ecosystems 141140 Topic 6 Populations, Communities, and Ecosystems 141
Convection Drives Plate Motions The tectonic plates move because they are part of convection currents in the mantle. You may recall that convection is a cyclical move-ment of fluid driven by temperature differences at the top and bottom, such as cold water sinking from the surface and warm water rising from the deep (Figure 2). The same phenomenon occurs in the mantle, but the fluid is rock, not water, and the currents are much slower. However, these currents are respon-sible for moving the continents great distances about Earth’s surface, even if they move at speeds too slow to be noticed.
Types of Crust Plates can be made of two types of crust, or just one (Figure 3). Oceanic crust is the dense type of crust that is found in the ocean floor. Some plates, such as the Pacific Plate, consist entirely of oceanic crust. The other type of crust is called continental crust. It is less dense than oceanic crust, which means it is thicker. This thickness is what allows for continents—large landmasses that are tall enough to be above sea level.
Convection CurrentsFigure 2 Convection can be demonstrated with a pot of heated water and a few floating objects. Warm fluid rises and cool fluids sinks to fill the void. Each convection current is a force on the underside of floating objects at the surface.
Oceanic and Continental CrustFigure 3 The very dense crust of the ocean floor is oceanic crust. Crust that is less dense can be thick enough that it’s above sea level. Continental crust gets its name from the fact that it tends to be above sea level, in the form of continents.
Interpret Visuals Use the directions in which the convection currents are moving in the figure to draw in arrows indicating the direction of the oceanic plates.
200 Million Years of Plate MotionFigure 4 It has taken the continents have taken about 200 million years to move to their present locations, since the breakup of Pangaea,
Interpret Visuals Label the plate map from 115 million years ago with the present-day names of landmasses from the “Earth Today” map.
Plate Motion Over Time Scientists use satellites to measure plate motions precisely. The plates move very slowly—about 1 to 10 centimeters per year. The North American and Eurasian plates, named for the continents they carry, move apart at a rate of 1-2 centimeters per year, or about as fast as your fingernails grow. Because the plates have been moving for billions of years, they have moved great distances.
Over time, the movement of Earth’s plates has greatly changed the locations of the continents and the size and shape of the ocean basins. Long before Pangaea existed, over billions of years, other supercontinents had formed and split apart. Pangaea itself formed when Earth’s landmasses moved together about 350 to 250 million years ago. Then, about 200 million years ago, Pangaea began to break apart, as shown in Figure 4.
READING CHECK Infer When might the continents we know today reform a supercontinent? Compare the relative rates
of motion of different plates.
INTERACTIVITY
FPO
maybe 200-300 million years from now
MGES19_SE_FL_PT_L02.indd 140-141 2/24/17 3:32 PM
michaelwysession
Highlight
michaelwysession
Sticky Note
Change these last two sentences to: "It is less dense than oceanic crust and is almost always thicker. Because continental crust is thicker than ocean crust, most of the surface of continents is above sea level." [About a fifth of continents is below sea level, as continental shelves][And it doesn't follow logically that one thing is thicker than another if it is less dense.]
michaelwysession
Highlight
michaelwysession
Sticky Note
change "is" to "provides"
michaelwysession
Highlight
michaelwysession
Sticky Note
Change last sentence to: "Continental crust gets its name from the fact that the surfaces of continents are mostly above sea level."
michaelwysession
Highlight
michaelwysession
Sticky Note
Change Motion to Motions
michaelwysession
Highlight
michaelwysession
Sticky Note
Change Motion to Motions
michaelwysession
Highlight
michaelwysession
Highlight
michaelwysession
Sticky Note
JB.The color of the mantle should not be red. It leads to the misconception that it is molten. It is as solid as the olive-colored ocean lithosphere slabs that are descending into it. Choose an earthy color that is distinct from the continent and ocean plates. I also just noticed that these labels should say plate, not crust.
michaelwysession
Highlight
michaelwysession
Highlight
michaelwysession
Sticky Note
New. (I just noticed this)These labels should say "Continental plate" and "Oceanic plate" [what you are showing is not the crust]
michaelwysession
Sticky Note
New. These two white arrows should not have their tails touching. That is a physical impossibility. It means that matter is springing from nothing. They should be parallel but not touching.
michaelwysession
Highlight
michaelwysession
Sticky Note
JB.Change "the" to "tectonic"
michaelwysession
Highlight
michaelwysession
Sticky Note
JB.This sentence is very awkward. Change "Long before.....formed when.." to "Over billions of years in a repeating cycle, continents come together to form supercontinents and then break apart. The most recent supercontinent, Pangaea, formed when…"

INDIAN-AUSTRALIANPLATE
PACIFICPLATE
PHILIPPINEPLATE
SCOTIAPLATE
CARIBBEANPLATE
JUAN DEFUCAPLATE
COCOSPLATE
NASCAPLATE
ARABIANPLATE
AFRICANPLATE
SOUTH AMERICAN
PLATE
NORTH AMERICAN
PLATE
PACIFICPLATE
EURASIANPLATE
ANTARCTIC PLATE
PACIFIC
OCEAN
ATLANTIC
OCEAN
ATLANTIC
OCEAN
INDIAN OCEAN
PACIFIC
OCEAN
KEYDivergent plate boundaryConvergent plate boundaryTransform plate boundaryDirection of plate movement
PE18 16MGES19_SE_FL_PT_A0000194Plate map
First proof
143142 Plate Tectonics142 Topic 6 Populations, Communities, and Ecosystems 143142 Topic 6 Interactions in Ecosystems142 Topic 6 Populations, Communities, and Ecosystems 143142 Topic 6 Populations, Communities, and Ecosystems 143
Plate MapFigure 6 Earth scientists have identified the different tectonic plates, many of which are named for the continents they carry. The boundaries have been identified as convergent, divergent, or trans-form. Plate movements at some of the boundaries are indicated with blue arrows.
Interpret Visuals Using the map key as a reference, supply the arrows that are missing around the Pacific Plate.
Infer What do you notice about the pattern of volcanic activity compared to the locations of the plate boundaries?
Plate BoundariesEarth’s plates meet and interact at boundaries. Along each boundary, plates move in one of three ways. Plates move apart, or diverge, from each other at a divergent boundary (dy VUR junt). Plates come together, or converge, at a convergent boundary (kun VER junt). Plates slip past each other along a transform boundary. The interactions of plates at boundaries produce great changes on land and on the ocean floor. These changes include the formation of volcanoes, mountain ranges, and deep-ocean trenches. Earthquakes and tsunamis are also more common at or near plate boundar-ies. Figure 7 depicts the major tectonic plates and the types of boundaries between them.
Literacy ConnectionIntegrate With Visuals In your science notebook, draw sketches of the dif-ferent interactions at plate boundaries. Work towards a visual presentation that sum-maries the plate boundaries in a single diagram.
Integrate With Visuals Which of the plates from the map would be a good starting point for a diagram that summaries the different boundaries? Why?
FPO
On Figure 5, draw the edges of different plates, including the Pacific plate. Explain Describe how the symbols on the map guided your mark-up of the map.
Tectonic Plates and the “Ring of Fire” As Wegener’s hypothesis was being shaped into a scientific theory, geologists noticed realized that features and events at Earth’s surface often marked the edges of plates. For example, the edges of the Pacific Plate, which is named for the ocean that is above, have been the sites of many volcanic eruptions and earthquakes (Figure 5).
Model It
Ring of FireFigure 5 Because the region around the Pacific Ocean is prone to volcanic activity and earthquakes, it is known as the “Ring of Fire.”
Interpret Maps Why do so many earthquakes seem to occur near volcanoes?
They occur at plate boundaries, especially around the Pacific Plate.
Sample answer: Pacific Plate, because it is large and has all three boundary types.
Sample answer: They are both products of activity at plate boundaries.
Sample: I used the locations of volcanoes and earth-quakes to help determine where to mark up the map.
MGES19_SE_FL_PT_L02.indd 142-143 2/24/17 3:32 PM
michaelwysession
Highlight
michaelwysession
Highlight
michaelwysession
Sticky Note
Change "Plate" to "Relative plate" [plate motion vectors can be done in one of two ways: absolute, or relative. Absolute is with respect to the hotspot reference frame (or no-net-rotation frame), which is close to being with respect to Earth's interior. But you have chosen to show vectors across plate boundaries, so this is a "relative plate motion" map.]
michaelwysession
Highlight
michaelwysession
Sticky Note
summarizes
michaelwysession
Highlight
michaelwysession
Sticky Note
summarizes
michaelwysession
Highlight
michaelwysession
Sticky Note
JB.It is inappropriate to keep talking about Wegener in a Lesson on plate tectonics. Change the first sentence to: “The theory of plate tectonics predicts that earthquakes and volcanoes should occur at plate boundaries and that some landforms such as mountain ranges should also mark plate boundaries.”
michaelwysession
Highlight
michaelwysession
Sticky Note
JB.change "tsunamis" to "the triggering of tsunamis"
Math Toolb x
144 Plate Tectonics 145144 Topic 6 Populations, Communities, and Ecosystems 145144 Topic 6 Interactions in Ecosystems144 Topic 6 Populations, Communities, and Ecosystems 145144 Topic 6 Populations, Communities, and Ecosystems 145
Collision at Convergent BoundaryFigure 9 When two continental plates collide, their collision can have a crumpling effect on the crust that produces tall mountains like when two cars crash in a head-on collision. That’s what’s been happening for more than 60 million years between the Indian and Eurasian Plates. If one plate is denser, such as a plate of oceanic crust, that denser plate will dive under the other. This can also produce mountains as the overlying plate edge is nudged upward.
Convergent Boundaries A boundary where two plates collide, or move toward each other, is called a conver-gent boundary. If two continents collide, then a mountain range will be pushed up. This is how the Himalayas formed, and are still being pushed up, in fact. What is now India used to be a separate continent that broke away from Antarctica and headed north. It began colliding with Asia more than 60 million years ago, and the edges of the two plates folded like the hoods of two cars in a head-on collision (Figure 9A). Mount Everest and the other Himalayas are the result (Figure 9B).
If one or both plates are oceanic, then subduction will occur. The ocean plate will always subduct if it collides with a conti-nent. If two oceanic plates collide, the older, colder, and denser plate will usually subduct beneath the younger plate, with an ocean trench marking the plate boundary. As the subducting plate sinks back into the mantle, water that was in the ocean crust rises into the overlying mantle, lowering its melting point. Magma forms and rises up through the overlying plate, pro-ducing volcanoes. On land, this results in the formation of vol-canic mountains. Mountains can also form as ocean seafloor sediments are scraped onto the edge of the overlying plate, forming a large wedge of rock.
Under the sea, subduction can produce undersea volca-noes, also known as seamounts. If they grow tall enough, these volcanoes can form a volcanic island chain. This is why there are often chains of volcanic islands where con-vergent boundaries are found in the ocean.
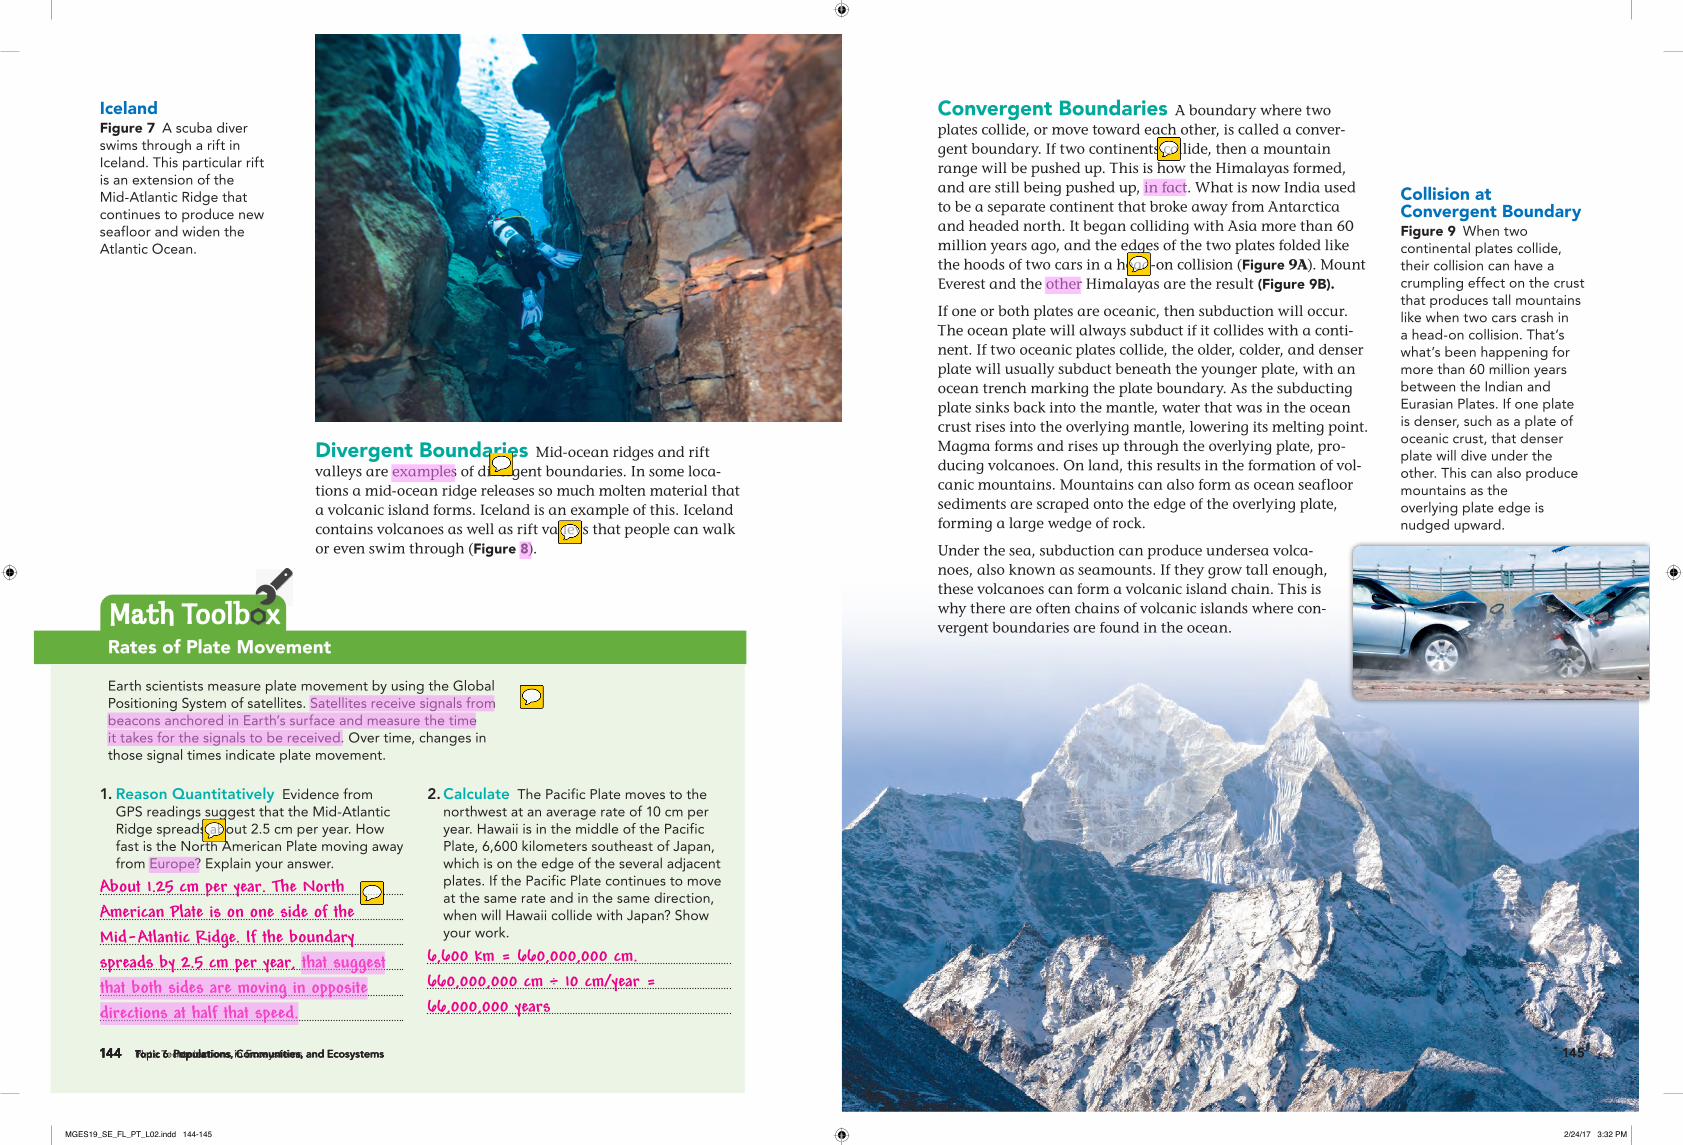
IcelandFigure 7 A scuba diver swims through a rift in Iceland. This particular rift is an extension of the Mid-Atlantic Ridge that continues to produce new seafloor and widen the Atlantic Ocean.
Divergent Boundaries Mid-ocean ridges and rift valleys are examples of divergent boundaries. In some loca-tions a mid-ocean ridge releases so much molten material that a volcanic island forms. Iceland is an example of this. Iceland contains volcanoes as well as rift valleys that people can walk or even swim through (Figure 8).
Rates of Plate Movement
Earth scientists measure plate movement by using the Global Positioning System of satellites. Satellites receive signals from beacons anchored in Earth’s surface and measure the time it takes for the signals to be received. Over time, changes in those signal times indicate plate movement.
1. Reason Quantitatively Evidence from GPS readings suggest that the Mid-Atlantic Ridge spreads about 2.5 cm per year. How fast is the North American Plate moving away from Europe? Explain your answer.
2. Calculate The Pacific Plate moves to the northwest at an average rate of 10 cm per year. Hawaii is in the middle of the Pacific Plate, 6,600 kilometers southeast of Japan, which is on the edge of the several adjacent plates. If the Pacific Plate continues to move at the same rate and in the same direction, when will Hawaii collide with Japan? Show your work.
About 1.25 cm per year. The North American Plate is on one side of the Mid-Atlantic Ridge. If the boundary spreads by 2.5 cm per year, that suggest that both sides are moving in opposite directions at half that speed.
6,600 km = 660,000,000 cm. 660,000,000 cm ÷ 10 cm/year = 66,000,000 years
MGES19_SE_FL_PT_L02.indd 144-145 2/24/17 3:32 PM
michaelwysession
Highlight
michaelwysession
Sticky Note
7
michaelwysession
Highlight
michaelwysession
Sticky Note
change "Europe" to "the ridge"
michaelwysession
Highlight
michaelwysession
Sticky Note
change the end to "that suggests that each side is moving away from the ridge at half that speed."
michaelwysession
Highlight
michaelwysession
Sticky Note
omit "in fact" [we only give facts. no alternative facts here]
michaelwysession
Highlight
michaelwysession
Sticky Note
change "other" to "rest of the" [if you need to cut, cut "the hoods of"
michaelwysession
Highlight
michaelwysession
Sticky Note
JB.Change "examples" to "features"
michaelwysession
Highlight
michaelwysession
Sticky Note
JB.Change this sentence to “Receivers anchored in Earth’s surface receive signals from satellites, and calculate their positions using the time it takes for signals to be received.”

Divergent boundary Convergent boundary Transform boundary
Divergent boundary Convergent boundary Transform boundary
Divergent boundary Convergent boundary Transform boundary
CHECK-IN
146 Plate Tectonics 147
SC.7.E.6.5
146 Topic 6 Populations, Communities, and Ecosystems 147146 Topic 6 Interactions in Ecosystems146 Topic 6 Populations, Communities, and Ecosystems 147
NA_STD
146 Topic 6 Populations, Communities, and Ecosystems 147
Go online to learn how Mount Rainer and other volca-nic mountains in the Cascade Range formed as a result of geologic activity at tectonic plate boundaries.
In this lesson, you learned about the specific mechanisms of continental drift, and how interactions of tectonic plates affect Earth’s surface.
Infer What’s the connection between Mount Rainier and the plate boundaries along the coast of the Pacific Northwest?
Mount Rainer’s Threat
INTERACTIVITY
1. Identify At what type of plate boundary would you find a rift valley that is growing wider?
2. Interpret Visuals What’s going on in this diagram?
3. Predict What other surface feature that is not shown in the diagram could be produced as a result of the process shown?
4. Calculate It takes 100,000 years for a plate to move about 2 kilometers. What is that plate’s rate of motion in centimeters per year?
5. Connect to the Nature of Science What does the theory of plate tectonics have that Wegener’s hypothesis of continental drift did not have?
Transform Boundaries When plates slip past each other, their boundary is called a transform fault. It is typical for plates at transform boundaries to get stuck together for a while. Stress builds up until there’s enough force to jolt the plates back into motion. This is what causes earthquakes along transform faults such as the San Andreas Fault in California. In some cases a surface feature, like a stream or road, that crossed a fault can be visibly offset after a major slippage of the plates (Figure 10). Depending on how the plate edges match up, a vertical offset can exist across the fault, like the end of a floorboard that’s collapsed in an old house.
Keep in mind that the tectonic plates of Earth’s lithosphere are three-dimensional objects that are moving around a sphere. The shapes of the plates are irregular. This means every plate will have some mixture of the different types of boundaries, and at some point the boundaries will change as the plates shrink, grow, collide, slip past each other, subduct, and so on. Interactions among tectonic plates continue to reshape Earth’s surface features.
New Caption to comeFigure 10 The three types of plate boundaries are modeled here. Label each illustration with the appropriate term that describes the boundary.
Investigate how stress is built up and released at faults.
INTERACTIVITY
READING CHECK Infer Suppose you are walking through a field of lettuce in a valley in California. You realize that the neat rows of plant seem to be offset, or out of line, and one half of the field is a few centimeters to the left or right of the other. What happened?
LESSON 2 Check
The mountain is likely a product of the plate interactions. Subduction of oceanic crust caused volcanoes to be built on the overlying North American Plate.
The field is probably on a transform boundary, and an earthquake occurred that knocked the two halves of the field out of alignment.
Two plates are converging at a convergent boundary. One plate is diving under the other, in a process called subduction. The other plate’s edge is being nudged upward, creating mountains.
The theory has an explanation for why and how the continents move: they’re part of plates that move across Earth, carried by mantle convection currents. Wegener’s hypothesis didn’t have a reasonable explanation for how the continents moved.
divergent volcanic mountains
2 cm per year
MGES19_SE_FL_PT_L02.indd 146-147 2/24/17 3:32 PM
michaelwysession
Highlight
michaelwysession
Sticky Note
this isn't shown in Figure 10
michaelwysession
Sticky Note
change to "Describe what is going on in this diagram."
michaelwysession
Sticky Note
JB.The diagram, and the version that is in the Lesson 2 Check, needs to be changed. The left plate should not be warped upward. It should the thickened to show the formation of a mountain range, the way that this is done: http://www.earth.northwestern.edu/public/seth/202/lectures/Paleo_Mag/Image80.gif
michaelwysession
Sticky Note
JB. See previous page.
michaelwysession
Highlight
michaelwysession
Sticky Note
JB. Change "When plates slip past eachother, their boundary is called a transform fault. It is typicalfor plates at transform boundaries to get stuck together fora while. Stress builds up until there’s enough force to jolt theplates back into motion."to"Plates slide past each other at a transform boundary. Earthquakes occur here on faults called transform faults. Bending across a fault occurs when the two sides remain locked together. When enough stress builds up, the fault ruptures and an earthquake occurs."
michaelwysession
Sticky Note
New.change "like" to "such as"
michaelwysession
Highlight
michaelwysession
Sticky Note
JB. Remove this clause. The example of a collapsed floorboard is wrong – it is not similar to the transform process. But the first part of the sentence is fine.
michaelwysession
Highlight
michaelwysession
Sticky Note
JB.Change "continental drift" to "that move continents"

KEYPredicted plate movement: 5cm/yr
PE18 18MGES19_SE_FL_PT_M0000201Direction and speed of plate movement
First proof
149
SC.7.E.6.5, SC.7.N.1.5
148 Case Study148 Topic 6 Populations, Communities, and Ecosystems 149148 TOPIC 6 Case Study148 TOPIC 6 Populations, Communities, and Ecosystems
6
148 Topic 6 Populations, Communities, and Ecosystems 149
NA_STD
148 TOPIC 6 Case Study
NGSS PERFORMANCE EXPECTATIONSMS-LS2-1 Analyze and interpret data to provide evidence for the effects of resource availability on organisms and populations of organisms in an ecosystem.
MS-LS2-2 Construct an explanation that pre-dicts patterns of interactions among organ-isms across multiple ecosystems.
MS-LS2-4 Construct an argument supported by empirical evidence that changes to physical or biological components of an ecosystem affect populations.
MS-LS2-5 Evaluate competing design solutions for maintaining biodiversity and ecosystem services.
6
148 TOPIC 6 Populations, Communities, and Ecosystems148 Topic 6 Populations, Communities, and Ecosystems 149148 TOPIC 6 Case Study148 TOPIC 6 Populations, Communities, and Ecosystems
6Use the map to answer the following questions.
1. Summarize What factors affect the speed at which a tectonic plate moves?
2. Interpret Data Which plate is moving fastest? Cite evidence to justify your answer.
3. Apply Concepts Would you expect a larger tectonic plate to move faster than a smaller plate? Explain.
4. Construct Explanations The Indo-Australian and Pacific plates are among the fastest of the planet’s plates. What conclusions can you draw about the subduction zone where the plate meets the Pacific Plate? Use evidence from the text and the map to support your explanation.
Located on one of the world’s fastest moving
tectonic plates—the Indo-Australian Plate—
Australia is moving at about 70 millimeters north,
and slightly east, each year.
Australia’s plate, of course, is not the only moving plate on Earth. But each of the planet’s plates moves at a different rate. Most move at a rate of a few centimeters a year. At 70 millimeters a year, Australia is one of the fastest.
Geologists in the 1960s confirmed that tectonic plates move along Earth’s mantle. But only recently, with the help of computer modeling, have they come to understand why the plates move at different speeds. As a plate sinks into the mantle at a subduction zone, it pulls along the rest of the plate. It’s similar to what happens to all the dishes and glasses on a dinner table when you pull the tablecloth down on one side. The size and structure of the subduction zone influence the strength of this pull. A large plate edge that is descending into the mantle at a large subduction zone would exert more force on the rest of the plate.
Measuring MovementNo one can feel the plates moving. They only move about as fast as your fingernails grow. But the movement adds up. In 50 million years, the Indo-Australian plate could collide with Southeast Asia.
Over time, the continent’s movement means that Australia’s latitude and longitude no longer match up with Global Positioning Systems (GPS). GPS navigation requires correc-tions to compensate for Australia’s movement.
Australia officially has changed its location four times in the last 50 years. At the beginning of 2017, Australia changed its location once again, this time moving it another 1.5 meters (about 5 feet) north.
AUSTRALIA on the Move on the Move FPO
sketch
FPO
A Kangaroo’s LengthFigure 1 The movement of Australia requires updates to its official location on maps. In 2017, it was moved 1.5 meters north. This is about the length of a gray kangaroo. The size and structure of the subduction zone influence the speed at
which a plate moves.
The many long arrows indicate that the Pacific Plate (between Australia and North America) is moving fastest.
Sample answer: A larger tectonic plate would probably move faster than a smaller plate. The larger plate has more mass, so there would be a bigger pull on the plate at the subduction zone.
The subduction zone is large and a great deal of rock from the Indo-Australian Plate is sinking into the mantle. This explains why Australia is moving so quickly.
1p4 min
3p
3p11
6p2
3p11
1p10
6p7
14p2 width and height
17p9
1p10
2p min
8p7 max
1p min
2p23p6
6p
3p
p6
p9
1p min
p9
Title_Topic This can run from 1 to 3 lines
H1_Topic
Topic_Num This can run from 1 to 11
SB_H1_greenSB1_H2_green
SB1
FL_STD_RIH
Lesson Panel: there can be 3-5 lessons.
FTL_white
TXT1_9_5pt
SB1_p1B
GO ONLINES: The color does not change. The icons are K-12 universal font. The colors are:40c70k: gray20m100y: yellow
Object Style:GreenYellow_Topic
MGES19_SE_FL_PT_CS.indd All Pages 2/24/17 5:36 PM
michaelwysession
Highlight
michaelwysession
Sticky Note
change to "7 centimeters" to be consistent with the rest of the topic
michaelwysession
Highlight
michaelwysession
Sticky Note
7 centimeters
michaelwysession
Highlight
michaelwysession
Sticky Note
change "the Indo-Australian plate" to "Australia" [the Indo-Australian plate has already been colliding with Southeast Asia for over 90 million years]
michaelwysession
Sticky Note
Nazca or Cocos plates would also be correct.
michaelwysession
Highlight
michaelwysession
Sticky Note
change to "Would you expect a largely oceanic plate to move faster than a largely continental plate? Explain." and the answer would be "Yes. Largely oceanic plates will likely be subducting along part of their edges, and subducting plates move faster. Continents do not subduct, so they tend to move slower." [Your current question is wrong. There is no correlation in speed between big or small plates. The amount of mass in a plate has nothing to do with its speed.]
michaelwysession
Sticky Note
Somewhere here there should be a label that says that this is a map of "absolute plate velocities" [in contrast to the map of relative plate motions shown earlier]
michaelwysession
Sticky Note
This map is a good idea, but you can't use it. It is wrong. The vectors on the continental plates are way too big. Here is a good figure to use as a guide:https://www.researchgate.net/profile/Thorsten_Becker2/publication/274782463/figure/fig3/AS:267640329469966@1440821835273/Figure-1-Global-plate-kinematics-Background-colors-and-white-arrows-show-magnitudes-and.pngYou can see how different your vectors are from theirs. Here is another, in a mercator projection:http://geodynamics.usc.edu/~becker/igmt/data/hs2_nuvel.vx.1.-1.gif
michaelwysession
Highlight
michaelwysession
Sticky Note
JB. Change "Indo-Australian" to "Australian" [The Indo-Australian plate is now commonly treated as separate plates. You can even see that they are separate plates in the map. Actually, there is a third plate, the Capricorn plate, that exists between them, but we don't have to get into that. Sufficient to say Australian plate.]
michaelwysession
Highlight
michaelwysession
Sticky Note
JB.Change "longitude" to "longitude on maps"
michaelwysession
Highlight
michaelwysession
Sticky Note
JB.Change "Indo-Australian" to "Australian"
michaelwysession
Highlight
michaelwysession
Sticky Note
JB. Change "the plate" to "the Australian Plate"

CONNECTION
150 Plate Tectonics 151
SC.7.E.6.7: Recognize that heat flow and movement of material within Earth causes earthquakes and volcanic eruptions, and creates mountains and ocean basins. (Also SC.7.N.3.2, SC.7.E.6.2)
150 Topic 6 Populations, Communities, and Ecosystems 151150 Topic 6 Interactions in Ecosystems150 TOPIC 6 Populations, Communities, and Ecosystems
6
150 Topic 6 Populations, Communities, and Ecosystems 151
NA_STD
NGSS PERFORMANCE EXPECTATIONSMS-LS2-1 Analyze and interpret data to provide evidence for the effects of resource availability on organisms and populations of organisms in an ecosystem.
MS-LS2-2 Construct an explanation that pre-dicts patterns of interactions among organ-isms across multiple ecosystems.
MS-LS2-4 Construct an argument supported by empirical evidence that changes to physical or biological components of an ecosystem affect populations.
MS-LS2-5 Evaluate competing design solutions for maintaining biodiversity and ecosystem services.
6
150 TOPIC 6 Populations, Communities, and Ecosystems150 Topic 6 Populations, Communities, and Ecosystems 151150 TOPIC 6 Populations, Communities, and Ecosystems
6Stress and Earth’s CrustThe movement of Earth’s massive tectonic plates generates tremendous force. This force can bend and break the rock of Earth’s crust. The force that acts on rock to change its shape or volume is called stress. There are three kinds of stress. Tension pulls on Earth’s crust, stretching the rock to make it thinner, especially at the point in the middle of the two pulling forces. Compression squeezes rock until it bends or breaks. When compression occurs at a large scale, rock can be folded into mountains (Figure 1). Shearing is when rock is being pushed in two opposite directions, to the point that it bends or breaks. These types of tension can produce both folds and faults.
Use a pencil to circle or outline the visible folds in the mountains in Figure 2.
Infer How were these mountains made out of rock in Earth’s crust?
Connect It
Think about how Mount Rainier may have been built, and how understanding its history and characteristics can help you stay safe while hiking it.
Practice Vocabulary on a mobile device.
VOCABULARY APP
Academic Vocabularyscalecomposite
Vocabularystresstensioncompressionshearingnormal faultreverse faultstrike-slip fault
Guiding Questions• How do plate movement and stress
produce new landforms?• What are earthquakes and why do
they occur?• How are plate tectonics connected
to volcanic eruptions and landforms?
Earthquakes and Volcanoes
LESSON
Connections Literacy Integrate With Visuals
Math Analyze Proportional RelationshipsMountain BuildingFigure 1 These mountains in Alberta, a province of Canada, are one of the products of plate tectonics.
Make Meaning As you go through the lesson, keep notes in your science notebook about how the physical tensions described here are involved in Earth processes that produce earthquakes, mountains, or volcanoes.
3 Respond to a poll about earthquakes.
INTERACTIVITY
Sample answer: At a convergent boundary, plates came together and crumpled, folding the layers of rock into these tall mountains.
1p4 min
3p
3p11
6p2
3p11
1p10
6p7
14p2 width and height
17p9
1p10
2p min
8p7 max
1p min
2p23p6
6p
3p
p6
p9
1p min
p9
Title_Topic This can run from 1 to 3 lines
H1_Topic
Topic_Num This can run from 1 to 11
SB_H1_greenSB1_H2_green
SB1
FL_STD_RIH
Lesson Panel: there can be 3-5 lessons.
FTL_white
TXT1_9_5pt
SB1_p1B
GO ONLINES: The color does not change. The icons are K-12 universal font. The colors are:40c70k: gray20m100y: yellow
Object Style:GreenYellow_Topic
MGES19_SE_FL_PT_L03.indd 150-151 2/24/17 4:13 PM
michaelwysession
Highlight
michaelwysession
Sticky Note
"is" ["plate tectonics" is singular]
michaelwysession
Highlight
michaelwysession
Sticky Note
I think you mean Figure 1, not 2. But there are few visible folds here, if any. Not a good question to ask with this picture. Or get a picture of a mountain range that shows folds, like:http://raider.mountunion.edu/~mcnaugma/images/Structures/7L95-3b_SM-Lewis_Thrust_fold.jpg
michaelwysession
Highlight
michaelwysession
Sticky Note
JB.Change "tension" to "stress"
michaelwysession
Highlight
michaelwysession
Sticky Note
JB.Change "tensions" to "stresses"

A Normal fault
B Reverse fault
C Strike-slip fault
KeyMovement along the faultForce deforming the crust
153152 Plate Tectonics152 Topic 6 Populations, Communities, and Ecosystems 153152 Topic 6 Interactions in Ecosystems152 Topic 6 Populations, Communities, and Ecosystems 153152 Topic 6 Populations, Communities, and Ecosystems 153
Plate Movements Make New LandformsOver millions of years, the forces of plate movement can change a flat plain into folded mountains, fault-block moun-tains, and other dramatic features of Earth’s surface.
Tension and Normal Faults To see how tension and normal faults can produce mountains, we need to zoom out and look at a series of at least two normal faults. Where two plates move away from each other, tension can form numer-ous faults that run parallel to each other over a wide area. A wedge-like slab of rock that has hanging walls at both faults can drop down as tension pulls the adjacent footwalls away (Figure 4). This leaves the other blocks higher up, as moun-tains. Mountains built this way are called fault-block mountains.
Folding Compression within a plate can cause the crust to deform without breaking. Folds are bends in rock that form when compression shortens and thickens Earth’s crust. Folds can be centimeters across or they can span many kilometers. The folds are often most visible and obvious when the rock is layered, as in Figure 5. When folding occurs on a large scale, folds that bend upward can become mountains and folds that bend downward can become valleys.
Normal Fault A fault is a break in the rock of Earth’s crust or mantle. Most faults occur along plate boundaries, where stress of one or more types is deforming the rock, lead-ing to changes at Earth’s surface. The two sides of a fault are referred to as walls. The wall whose rock is over the other is called the hanging wall, and the other is called the footwall. In a normal fault, the hanging wall slips down relative to the foot wall (Figure 3A). This usually occurs at a divergent plate boundary, where tension is pulling the walls away from each other. If there is a series of normal faults, a slab of crust that falls away can become a valley while the adjacent slabs can become mountains (Figure 2).
Reverse Fault At a convergent boundary, compression can produce a reverse fault, in which the hanging wall slides up and over the footwall (Figure 3B). The northern Rocky Mountains in the U.S. and Canada were gradually lifted by the action at a reverse fault.
Strike-Slip Fault California’s San Andreas Fault is a product of shearing. Walls of rock grind past each other in opposite directions, making a strike-slip fault (Figure 3C). Transform boundaries are home to strike-slip faults.
READING CHECK Identify Pair each fault type with the type of stress that produces it.
Death ValleyFigure 2 Tension can result in peaks around a sunken valley, such as Death Valley in California.
Valleys and MountainsFigure 4 As tension pulls rock apart along normal faults, some blocks will fall, leaving others elevated. Over time, the raised rock is weathered into mountains.
Interpret Visuals Where are the footwalls in Parts A and B of the diagram?
Types of FaultsFigure 3 The three types of faults are shown here.
Interpret Diagrams Complete the diagrams by labeling the hanging walls and footwalls of the first two fault types and drawing in arrows to indicate the direction of shearing force and the movement along the fault of the third fault type.
Valley Fault-block mountains
KeyMovement along the faultForce deforming the crust
Academic VocabularyThe processes of plate tectonics occur at different scales of time and space. List some different terms that are used to describe distance are time at vastly different scales.
normal fault: tension; reverse fault: compression; strike-slip fault: shearing
at letters a and c
Sample answer: kilome-ters, centimeters; years, second
MGES19_SE_FL_PT_L03.indd 152-153 2/24/17 4:13 PM
michaelwysession
Highlight
michaelwysession
Highlight
michaelwysession
Sticky Note
JB.Change "walls" to "plates"
michaelwysession
Highlight
michaelwysession
Sticky Note
JB.Change "At a convergent boundary, compression" to "Compression"
michaelwysession
Highlight
michaelwysession
Sticky Note
JB.Change "a reverse fault." to "several reverse faults. Reverse faults are common at convergent boundaries."
michaelwysession
Sticky Note
JB points out that this would make more sense as one diagram. An example is http://www.mrshannahsclassroom.com/uploads/2/3/0/4/23048160/327711_orig.pngBut it is not necessary. Would it save some space?
michaelwysession
Highlight
michaelwysession
Sticky Note
New.Change "Valley" to "Rift Valley"
michaelwysession
Highlight
michaelwysession
Sticky Note
New.Change "wedge-like slab" to "wedge"
michaelwysession
Highlight
michaelwysession
Sticky Note
JB.Change "away" to "away, creating a rift valley"

HANDS-ON LABHANDS-ON LAB
155154 Plate Tectonics154 Topic 6 Populations, Communities, and Ecosystems 155154 Topic 6 Interactions in Ecosystems154 Topic 6 Populations, Communities, and Ecosystems 155154 Topic 6 Populations, Communities, and Ecosystems 155
EarthquakesMany of the products of plate movements are gradual, quiet, and almost imperceptible. Others can be sudden, violent, loud, and destructive. At some faults, the interacting plates can grind to a halt and remain stuck in place for years. Stress can build up until a breaking point is reached. The plates then lurch into motion with great energy. This is an earthquake. A small amount of the stress in the crust is released as energy in the form of seismic waves, which are similar to sound waves. If a strong earthquake ruptures up into the ocean floor, it can trigger a kind of ocean wave called a tsunami.
Seismograph Seismic waves produced by earthquakes are measured by a device called a seismograph, or seismometer. A seismogram (Figure 7) shows both the timing and amplitudes of the different seismic waves created by the earthquake.
Anticlines and Synclines A fold in rock that bends upward into an arch is called an anticline (AN tih klyn). This may resemble the crest of wave. Weathering and erosion have shaped many large-scale anticlines into mountains, such as Wildhauser Schafberg in the Alps of Switzerland (Figure 5). The height of an anticline is exaggerated by the valley-like syncline (SIN klyn), which is a fold that bends downward. This is similar to the trough of a wave. Like a series of fault-block mountains, a series of folded mountains is often marked by valleys between rows of mountains. Viewed at a large scale, a wide area of compressed crust may have mountains and valleys made of anticlines and synclines (Figure 6) while the large-scale folds may themselves contain their own anticlines and synclines.
Folded MountainFigure 5 Wildhauser Schafberg is a folded moun-tain in the Alps, a mountain range in Europe that is the result of the small Adriatic Plate colliding with the much larger Eurasian Plate.
Anticlines and Synclines as Mountains and ValleysFigure 6 Label the anticlines and synclines in the diagram.
Evaluate Models How does this figure oversimplify how compression produces folds in Earth’s crust?
READING CHECK Summarize Describe how both compression and tension can create mountains and valleys.
SeismogramFigure 7 P waves travel through the ground in a compressional manner. S waves move from side to side in a shearing manner. P and S waves travel through Earth’s interior. Other waves, called surface waves, travel along Earth’s surface. Surface waves usually have the largest amplitudes —dis-tances between wave crests and resting position— and therefore cause the most damage.
Magnitude The amplitudes of the waves on a seismo-gram are used to quantify the size of the earthquake. The size of earthquakes is usually measured using the moment magnitude scale, which is a measure of the energy released. Each whole-number increase in this scale represents a roughly 32-fold increase in energy. So, the seismic waves of a Magnitude-9 earthquake are 10 times larger than for a Magnitude-8 earthquake, but the energy released is 32 times larger. (Figure 8).
READING CHECK Analyze Proportional Relationships How much stronger was the earthquake that struck Japan in 2004?
Earthquake MagnitudeFigure 8 The table shows moment magnitudes of major earthquakes of the last twenty years.
P waves travel fastest and arrive first.
S waves arrive shortly after P waves.
Surface waves produce the largest disturbance on the seismogram.
Magnitude Location Date
9.2 Sumatra 2004
7.9 China 2008
7.6 Turkey 1999
7.6 Japan 2004
7.6 California 2008
Investigate the frequency of earthquakes around the Ring of Fire.
VIDEO
Use seismic waves to pinpoint the location of an earthquake.
It shows large-scale folds, but they’re all very even and uniform. And it doesn’t show any of the small-scale folds that may be found within the larger folds. The real-world picture would be less neat.
Tension can pull crust apart. As blocks of rock slip up and down relative to each other at faults, fault-block mountains can be made; the sunken blocks will be valleys. Compression produces anticlines and synclines that can become mountains and valleys, respectively.
Approximately 32 times stronger.
MGES19_SE_FL_PT_L03.indd 154-155 2/24/17 4:13 PM
michaelwysession
Sticky Note
I don't really see the fold here. How about something like:https://s-media-cache-ak0.pinimg.com/originals/7d/8c/c1/7d8cc19b24b1922554895b1234fcbc8a.jpg
michaelwysession
Highlight
michaelwysession
Sticky Note
Change to "The table shows the moment magnitudes of some deadly earthquakes of the last 15 years."
michaelwysession
Highlight
michaelwysession
Sticky Note
This table is not good. It is old - a decade old! It is a random assortment of earthquakes. These are not the largest, nor the most deadly. Also, it would be impactful to show the #s of deaths. Change to:Mag Location Date Deaths9.2 Sumatra 2004 ~250,0009.0 Japan 2011 ~16,0007.9 China 2008 ~69,0007.9 Nepal 2015 ~9,0007.0 Haiti 2010 ~160,000
michaelwysession
Highlight
michaelwysession
Sticky Note
Change question to: "Is there a correlation between earthquake size and number of deaths?"Answer:"Not necessarily. The Haiti earthquake is the smallest, but had the second-most deaths."
michaelwysession
Highlight
michaelwysession
Sticky Note
JB.Change "motion with" to "motion, releasing"
michaelwysession
Highlight
michaelwysession
Sticky Note
JB. Change "A small amount....form of seismic waves" to "A small amount of the stress relieved by the earthquake is released as the energy of seismic waves"

157156 Plate Tectonics156 Topic 6 Populations, Communities, and Ecosystems 157156 Topic 6 Interactions in Ecosystems156 Topic 6 Populations, Communities, and Ecosystems 157156 Topic 6 Populations, Communities, and Ecosystems 157
Volcanoes and Plate BoundariesAt convergent boundaries, the subduction of oceanic crust under continental crust can produce volcanoes along the edge of the continent. Subduction of oceanic crust under an adjacent plate of oceanic crust can result in a volcanic island arc. At divergent boundaries, molten magma comes through the crust as lava, which quickly hardens into rock, but if the volume of molten material from the mantle is especially large then a vol-cano may form. Figure 9 summarizes these processes.
At Divergent Boundaries The Ngorongoro Crater is 20 kilometers wide and 600 meters deep in Tanzania, Africa. The crater is the opening of a dormant, or inactive, volcano that exploded several million years ago. The volcano was pro-duced by one of the rifts of the East African Rift System, a series of divergent boundaries within the larger African Plate.
At Convergent Boundaries When a plate dives into the mantle in the process of subduction, trapped water leaves the sinking plate and mixes with the material of the overlying mantle, causing it to melt. The buoyant magma starts to rise toward the surface. If the magma reaches the surface before cooling, a volcano will form. If the overlying plate is part of the ocean floor, the resulting volcano begins to form on the seafloor as a seamount. If it grows large enough to break the ocean surface, it will become volcanic island. If volcanism occurs at multiple spots along the edge of an oceanic plate, a whole chain of islands can form. This is called a volcanic island arc.
Volcanoes at Divergent and Convergent BoundariesFigure 9 Volcanic activity at plate boundaries can produce volcanoes on continents and volcanic island arcs.
Summarize Describe what is happening on the left side of the diagram, where ash is rising in the air over an active volcano.
Hot Spot Modeling
Model It
Island arc Subduction zone Subduction zoneMid-ocean ridge
Oceanic crust Subducting plate
Trench
Continental crust
Lithosphere
Asthenosphere
Hot Spot Volcanism In addition to mid-ocean ridges and subduction zones, there is a third source of volcanoes: hot spots. A hot spot is an area where magma frequently erupts at the surface as lava. The hot spot is relative fixed within the deep mantle. As a plate moves over the hot spot, a chain of volcanoes is created because existing volcanoes keep being car-ried away from the hot spot. The many islands and seamounts of Hawaii have formed because of the westward motion of the Pacific Plate. Another hot spot sits below Yellowstone National Park in Wyoming. The “supervolcano” beneath the park may erupt again someday. During past giant eruptions of Yellowstone, the last one being 640,000 years ago, all of North America was covered with volcanic ash.
READING CHECK Infer The Aleutian Islands of Alaska occur in a chain near a plate boundary. What type of boundary do you think it is?
Integrate With Visuals Using the diagram as inspiration, design a functioning physical model of how a hot spot makes volcanoes on a moving plate of oceanic crust. Sketch or describe your model in the space here, including details on how it would work.
Pacific Ocean
KauaiOahu
Maui
Hawaii
Hot spot
Hawaiian Islands
Motion of Pacific Plate
Learn more about volcanology.
VIDEO
Water in the subducting plate interacts with mantle rock to produce a plume of magma that is erupt-ing at the surface of the overlying plate and build-ing a volcano.
convergent
MGES19_SE_FL_PT_L03.indd 156-157 2/24/17 4:13 PM
michaelwysession
Highlight
michaelwysession
Sticky Note
change "crust" to "plate"
michaelwysession
Highlight
michaelwysession
Sticky Note
change "crust" to "plate"
michaelwysession
Highlight
michaelwysession
Sticky Note
change "crust" to "plate"
michaelwysession
Highlight
michaelwysession
Sticky Note
change "plate of oceanic crust" to "oceanic plate"
michaelwysession
Sticky Note
This paragraph is confusing crust and plate.
michaelwysession
Highlight
michaelwysession
Sticky Note
This is a bizarre paragraph. All the others are talking about general processes. This says nothing about volcanoes at divergent boundaries, and then goes into all this detail about a single volcano, with no accompanying pictures. Remove this paragraph. Change to: "Most volcanoes at divergent boundaries occur in the ocean, at mid-ocean ridges, so they are never seen. Only in places such as Iceland can you see ocean-ridge volcanoes. Less common are volcanoes at divergent boundaries on continents, such as the East African Rift System. Here, volcanoes such as Mt. Kilimanjaro, Mt. Kenya, and Erta Ale occur from magma rising toward the rift."
michaelwysession
Highlight
michaelwysession
Highlight
michaelwysession
Sticky Note
JB.Remove "molten" (redundant)
michaelwysession
Highlight
michaelwysession
Sticky Note
JB.Change "molten material" to "magma"
michaelwysession
Highlight
michaelwysession
Sticky Note
JB.Change "volcano" to "volcanic cone"
michaelwysession
Sticky Note
JB.Change the color of the asthenosphere to a different Earth tone. It should not be red, because it is not molten. At the left and right, within the volcanoes, you use this color of red to show magma rising through the volcanoes. This is fine. But you can't use the same color for the asthenosphere or mesosphere (the part below the asthenosphere). Choose another color. The mantle is largely olivine, which is green, so green is a good color. See a mantle peridotite: https://c1.staticflickr.com/6/5607/15428089790_2c7843fcc6_b.jpg
michaelwysession
Sticky Note
New.JB points out, correctly, that we don't say anything about why the volcanoes are there! The individual volcano names are not necessary. So, replace my previous correction with this one. This paragraph should read:"Volcanoes form at divergent boundaries when plates move apart and rock rises to fill the vacant space. Most volcanoes at divergent boundaries occur in the ocean, along mid-ocean ridges, so they are never seen. Only in places such as Iceland can you see ocean-ridge volcanoes. Less common are volcanoes like Mt. Kilimanjaro that occur at continental divergent boundaries such as the East African Rift."
michaelwysession
Highlight
michaelwysession
Sticky Note
New, with help from JB.Replace this entire paragraph with:"In addition to divergent and convergent plate boundaries, there is a third source of volcanoes: hot spots. A hot spot is an area where lava frequently erupts at the surface, independent of plate boundary processes. Most hot spots sit atop mantle plumes of hot rock. Hot spot plumes are fixed within the deep mantle. As a plate moves over the plume, a chain of volcanoes is created because older volcanoes keep being carried away from the hot spot. The many islands and seamounts of Hawaii have formed from the westward motion of the Pacific Plate. Another hot spot is found at Yellowstone National Park in Wyoming. The “supervolcano” beneath the park may erupt again someday. During past giant eruptions of Yellowstone, the last one being 640,000 years ago, most of North America was covered with volcanic ash."

Math Toolb x
159158 Plate Tectonics
CraterCentral vent
Lava flow
Magma chamber
Side vent
Pipe
158 Topic 6 Populations, Communities, and Ecosystems 159158 Topic 6 Interactions in Ecosystems158 Topic 6 Populations, Communities, and Ecosystems 159158 Topic 6 Populations, Communities, and Ecosystems 159
Magma Composition
Magma is classified according to the amount of silica it contains. The less silica that the magma contains, the more easily it flows. More silica makes magma stickier and thicker. Trapped gases can’t emerge easily, so eruptions are explosive.
1. Analyze Proportional Relationships How do the two magma types compare in terms of silica content?
2. Infer Which of the magma types would erupt more explosively? How would knowing the type of magma a volcano produces help nearby communities prepare for eruptions?
Types of Magma
All othersolids
All othersolids
Low-Silica High-Silica
Silica Silica Other oxides
Other oxides
Cinder Cone Volcano If lava emerges from a new vent in Earth’s crust as a mix of bombs, ash, and cinders, these materials will build up into a cinder cone volcano. The loose, ashy composition of this volcano means it tends erode quickly, because the material doesn’t solidify as well as the hardened lava-and-ash layers of a composite volcano.
Shield Volcano Some volcanoes have slow, steady erup-tions in which lava flows out and builds up over a broad area. These are called shield volcanoes, after the shape of a shield. Hot spot volcanoes tend to be shield volcanoes, and they can be massive. The island of Hawaii, which consists of several shield volcanoes, rises more than 10 kilometers from the ocean floor. This is even taller than Mount Everest!
Lava Plateau Lava can flow out of several long cracks in Earth’s crust and flood an area repeatedly over many years. Over time, these relatively flat layers of hardened lava can build up into a lava plateau.
Caldera If magma chamber empties, the lack of material in the chamber can cause the rock above to collapse. This makes a bowl-like caldera (kal DAIR uh) that may fill with water if the volcano becomes dormant. Oregon’s Crater Lake is an example.
Volcano Types and LandformsMagma usually forms in the somewhat soft layer of hot rock in the upper mantle, just below the solid lithosphere. Because the magma is less dense than the rock around it, it cracks its way up to the surface. Once the magma exits a volcano and is exposed to air or water, it is called lava.
Volcano Parts Inside a volcano (Figure 10) is a system of passageways through which magma can travel. Below the volcano is a magma chamber, which is where magma collects before an eruption. The volcano and surrounding landscape may swell slightly as the magma chamber fills, and volcanol-ogists can measure the swelling to determine if an eruption is going to happen. Magma moves up from the chamber through a pipe, which leads to the central vent—an opening at the top, which may be a bowl-shaped crater. Some volcanoes have side vents, too. When lava flows out from a vent, it begins to cool and harden as it is pulled by gravity down the slope of the volcano. If lava is thrown explosively into the air, it can harden and fall to Earth in different forms. Bombs are large chunks of hardened lava. Cinders are the size of pebbles. The finest particles are called ash. The type of lava-based material that emerges from a new volcano defines the type of volcano that is built.
Composite Volcano The volcano in Figure 10 is a composite volcano. Also called a stratovolcano, it is made of alternating layers of lava flows and ashfall. These tend to be cone shaped and tall. Mount Fuji in Japan is an example of a composite volcano.
Academic VocabularyThe term composite is a noun and an adjective. It refers to something being made of a mixture of dif-ferent parts or elements. In this book you may see composite figures made of both photographs and illus-trations. Many manufactured objects are made of com-posites: blends of different raw materials. How does this term help explain what a composite volcano is?
Explore different volcanic landforms.
INTERACTIVITY
Literacy ConnectionIntegrate With Visuals As you read about the anatomy of a volcano, pay attention to words that describe how the parts are connected.
Composite VolcanoFigure 10 A composite volcano has alternating layers of hardened lava and ash. Complete the diagram by reading the description of the volcano’s parts and writing in the missing labels.
Help determine the best location for a new stadium in an earthquake
INTERACTIVITY
A composite volcano is made of distinct layers of two different materi-als: lava and ash
High-silica magma is ~70% silica; low-silica magma is ~50% silica.
High-silica magma would be more explosive because it doesn’t flow as easily, or allow gases to bubble out as readily. If an active volcano was known to have high-silica magma, nearby communities should prepare to evacuate because bombs, cinders, and ash could be thrown far.
MGES19_SE_FL_PT_L03.indd 158-159 2/24/17 4:13 PM
michaelwysession
Highlight
michaelwysession
Sticky Note
ash falls
michaelwysession
Highlight
michaelwysession
Highlight
michaelwysession
Highlight
michaelwysession
Sticky Note
change to "rises more than 10 kilometers from the ocean floor, taller than Mount Everest. But it is also over 100 kilometers wide."
michaelwysession
Sticky Note
If a
michaelwysession
Sticky Note
add "The Columbia Plateau in Oregon and Washington is an example." if space allows
michaelwysession
Highlight
michaelwysession
Sticky Note
JB.change "be a" to "be in a"
michaelwysession
Highlight
michaelwysession
Sticky Note
JB.Change "lava" to "hardened lava"
michaelwysession
Highlight
michaelwysession
Sticky Note
JBChange "this volcano" to "this typically small volcano"
michaelwysession
Highlight
michaelwysession
Sticky Note
JBchange "after" to "because they have the shape of a shield"
michaelwysession
Highlight
michaelwysession
Sticky Note
JBChange "Hot" to "Ocean hot"
michaelwysession
Highlight
michaelwysession
Sticky Note
JBChange first sentence to: "After an eruption, the land surface can collapse into the empty magma chamber below."

CHECK-INS
160 Plate Tectonics
SC.7.E.6.7
160 Topic 6 Populations, Communities, and Ecosystems160 Topic 6 Interactions in Ecosystems160 Topic 6 Populations, Communities, and Ecosystems160 Topic 6 Populations, Communities, and Ecosystems
Go online to practice several data collection and analysis techniques to monitor a vol-cano and predict an eruption.
Monitoring A Volcano Virtual Activity
INTERACTIVITY
In this lesson, you learned about the connection between plate tectonics and features and events at Earth’s surface, including mountains, volcanoes, and earthquakes.
Evaluate Why is it important to understand the type of volcano Mount Rainier is and the patterns of activity at the nearest plate boundary?
1. Identify Which type of stress on Earth’s crust can make a slab of rock shorter and thicker?
2. Cause and Effect How do mountains and valleys form through folding?
3. Explain You hear about a magnitude 8.0 earthquake on the news. Someone says “That doesn’t sound too bad. An 8.0 is just one more than the 7.0 we had here last year.” Explain why that’s not the right way to think about the moment magnitude scale.
4. Interpret Data You are sailing in the South Pacific Ocean, far from any plate boundary. Looming on the horizon is a dark, broad, rounded island with sparse vegetation. A few thin flows of orange lava drip into the sea. Some smoky vapor unfurls from the center of the island. What kind of volcano is this? Explain.
5. Summarize How are volcanic island arcs formed?
LESSON 3 Check
HANDS-ON LAB
Signs of Eruption
Some volcanoes erupt slowly and steadily, and are more predictable. Others can be inactive for a while and then explode.
Compression of crust causes upward and downward bends. An anticline is an upward bend or fold of rock, while a syncline is the opposite. The exposed anticline can be weathered into a moun-tain, and the syncline nearby is the valley.
Most likely it’s a shield volcano, based on the shape, size, and slow eruption, and its distance from any plate boundary.
Subduction of oceanic crust results in plumes of magma rising up through the overlying plate. If the magma penetrates the crust it can form volcanoes that may grow tall enough to become islands. A series of these may form along the plate edge, in a row or arc.
Every whole number step on the moment magnitude scale isn’t just “one more”; it’s actually a 32-fold increase in released energy.
compression
MGES19_SE_FL_PT_L03.indd 160 2/24/17 4:13 PM
michaelwysession
Sticky Note
Should also accept "hot spot volcano"

SustainableDesignEngineer It!Engineer It!
161
SC.7.E.6.7, SC.7.N.1.5
161161161
How do you design buildings that can withstand the forceful waves of a tsunami? You engineer it! The new standards for building tsunami-safe structures can show us how.
The Challenge: To construct tsunami-safe buildings.
A seafloor earthquake can displace water above it, caus-ing a tsunami to form. When the tsunami reaches land, where the giant waves can cause widespread destruction.
Because parts of the United States are at risk for tsunamis, U.S. engineers have developed new building standards to save lives. They studied how to design columns to keep a building in place—even when struck with tons of water and debris. They also studied how to design buildings so that people could evacuate by escaping to higher floors.
To develop standards, engineers visited Japan, where a tsunami in 2011 caused terrible losses in life and property. The engineers also used a wave research lab, where tsuna-mis and their effects can be modeled, to study impacts on buildings.
DESIGNING TO PREVENT
Destruction
These engineers hope that hospitals, schools, and police sta-tions will be built to the new standards. These buildings can then be a refuge for people fleeing less safe places.
It can be a challenge to design and engineer structures that can withstand the force of a tsunami. Under the new standards, schools would be built to withstand the force of water and debris.
Tsunamisafe area Classrooms
Overset
Can you design a structure to withstand the force of a tsunami? Go to the Engineering Handbook to find out!
Design Challenge
Watch how underwater earthquakes displace water.
VIDEO
FPO
MGES19_SE_FL_PT_EF.indd 161 2/24/17 4:48 PM
michaelwysession
Highlight
michaelwysession
Highlight
michaelwysession
Sticky Note
change to "where an earthquake and tsunami in 2011"
michaelwysession
Sticky Note
Remove "where"

163162 Plate Tectonics
SC.7.E.6.5
TOPIC 4 Review and Assess
SC.7.E.6.5 SC.7.E.6.7
162 Topic 6 Populations, Communities, and Ecosystems 163162 Topic 6 Review and Assess162 TOPIC 6 Populations, Communities, and Ecosystems
6
162 Topic 6 Populations, Communities, and Ecosystems 163
NA_STD NA_STD
162 Topic 6 Review and Assess
Topic # Review and Assess
NGSS PERFORMANCE EXPECTATIONSMS-LS2-1 Analyze and interpret data to provide evidence for the effects of resource availability on organisms and populations of organisms in an ecosystem.
MS-LS2-2 Construct an explanation that pre-dicts patterns of interactions among organ-isms across multiple ecosystems.
MS-LS2-4 Construct an argument supported by empirical evidence that changes to physical or biological components of an ecosystem affect populations.
MS-LS2-5 Evaluate competing design solutions for maintaining biodiversity and ecosystem services.
6
162 TOPIC 6 Populations, Communities, and Ecosystems162 Topic 6 Populations, Communities, and Ecosystems 163162 Topic 6 Review and Assess162 TOPIC 6 Populations, Communities, and Ecosystems
61 Evidence of Plate Motion
1. Wegener hypothesized that Earth’s land-masses had once been fused together, and they slowly broke apart in a process he calledA. continental drift.B. subduction.C. Pangaea.D. divergence.
2. Wegener found supporting evidence for his idea in different forms, including fossils, land features, andA. ocean currents.B. solar activity.C. climate data.D. presence of bacteria.
3. The zipper-like cracks that run through the floors of the oceans are calledA. tectonic plates.B. mid-ocean ridges.C. subduction zones.D. convergent boundaries.
4. Develop Models In the space below, sketch one of the types of stress that affects Earth’s crust.
2 Plate Tectonics and Earth’s Surface
5. Which of the following explains how Mount Everest formed?A. The mountain formed from volcanic activity
at a divergent boundary.B. The mountain formed when two tectonic
plates collided at a convergent boundary.C. The mountain formed from volcanic activity
at a convergent boundary.D. The mountain formed as a result of an
earthquake when two plates slipped past each other.
6. The circular movement of material in the mantle that drives plate movement is calledA. conduction.B. subduction.C. compression.D. convection.
7. Plates move apart from each other at a A. divergent boundary.B. convergent boundary.C. transform boundary.D. subduction boundary.
8. Earthquakes often occur along __________ boundaries as a result of the build up of stress.
9. Construct Arguments A local official pledges to have a new highway built over a transform boundary. Explain why this may be a bad idea.
3 Earthquakes and Volcanoes
10. The type of stress than pulls on and thins an area of Earth’s crust is called
A. torsion.B. tension.C. shearing.D. diverging.
11. When a plate is compressed, it can create anticlines and synclines that can become
A. mountains and valleys.B. folds and breaks.C. plateaus and canyons.D. landmasses and oceans.
12. How much more energy is released by an earthquake with a magnitude of 8.0 on the moment magnitude scale than one with a 6.0 magnitude?
A. 32 times moreB. 1000 times moreC. 2 times moreD. 20 times more
13. Volcanoes can emerge at long cracks in Earth’s crust at _____________ ridges, on continents near convergent _____________, and at random locations on the ocean floor above _____________.
14. Predict Suppose a large shield volcano has a massive eruption that empties its magma chamber. What might happen to this land-form if the chamber remains empty and the overhanging rock is weakened from the eruption?
15. Cause and Effect What causes volcanoes to form along a mid-ocean ridge?
16. Explain Phenomena Why are volcanoes often found along both convergent and divergent plate boundaries?
Evaluate your understanding by taking a Topic Test.
ASSESSMENT
transformmid-ocean,
boundaries,
hot spots
The rock above could collapse into the empty space, forming a bowl-like caldera. Over time, the caldera could fill with water and becomes a crater lake.
A mid-ocean ridge forms long, under-water mountain ranges. Some have a rift valley down the center, and lava can pour out of cracks in the rift.
Both types of boundaries result in mol-ten rock coming to the surface, which can form a volcano. At convergent bound-aries, the subduction of one plate under another can cause molten rock to come to the surface. At divergent boundaries, magma comes to surface from the mantle.
Plates move in opposite directions at transform boundaries. Any structure that is built on or near such a boundary could be cut in half, offset, or otherwise damaged when the plates next move.
1p4 min
3p
3p11
6p2
3p11
1p10
6p7
14p2 width and height
17p9
1p10
2p min
8p7 max
1p min
2p23p6
6p
3p
p6
p9
1p min
p9
Title_Topic This can run from 1 to 3 lines
H1_Topic
Topic_Num This can run from 1 to 11
SB_H1_greenSB1_H2_green
SB1
FL_STD_RIH
Lesson Panel: there can be 3-5 lessons.
FTL_white
TXT1_9_5pt
SB1_p1B
GO ONLINES: The color does not change. The icons are K-12 universal font. The colors are:40c70k: gray20m100y: yellow
Object Style:GreenYellow_Topic
MGES19_SE_FL_PT_TREV.indd All Pages 2/24/17 4:53 PM
michaelwysession
Highlight
michaelwysession
Sticky Note
this is wrong. Earthquakes occur along all plate boundaries, not just transforms. Change to "....along _____ as a result..." with the answer being "plate boundaries"
michaelwysession
Highlight
michaelwysession
Highlight
michaelwysession
Sticky Note
JB change "cracks that run through" to "mountain ranges that run across"
michaelwysession
Highlight
michaelwysession
Highlight
michaelwysession
Sticky Note
New.Change "oceans" to "ocean"
michaelwysession
Highlight
michaelwysession
Sticky Note
JBChange "on the ocean floor above" to "away from plate boundaries called"

FINDINGS
165164 Plate Tectonics
SC.7.E.6.5, SC.7.E.6.7
SC.7.E.6.5, SC.7.E.6.7
164 Topic 6 Populations, Communities, and Ecosystems 165164 Topic 6 Florida Benchmarks Review164 TOPIC 6 Populations, Communities, and Ecosystems
6
164 Topic 6 Populations, Communities, and Ecosystems 165
NA_STD
164 Topic 6 Florida Benchmarks Review
NGSS PERFORMANCE EXPECTATIONSMS-LS2-1 Analyze and interpret data to provide evidence for the effects of resource availability on organisms and populations of organisms in an ecosystem.
MS-LS2-2 Construct an explanation that pre-dicts patterns of interactions among organ-isms across multiple ecosystems.
MS-LS2-4 Construct an argument supported by empirical evidence that changes to physical or biological components of an ecosystem affect populations.
MS-LS2-5 Evaluate competing design solutions for maintaining biodiversity and ecosystem services.
6
164 TOPIC 6 Populations, Communities, and Ecosystems164 Topic 6 Populations, Communities, and Ecosystems 165164 Topic 6 Florida Benchmarks Review164 TOPIC 6 Populations, Communities, and Ecosystems
6Florida Benchmarks Review
Circle the letter of the best answer.
The diagram shows a process in Earth’s crust.
1 Which of the following best describes the process shown?
A Diverging plates form a rift valley.B Converging plates form volcanoes.C Diverging plates form a canyon.D Converging plates form mountains.
2 Why did finding Lystrosaurus fossils in South America and Africa support Wegener’s hypothesis of continental drift?
F Lystrosaurus was a plant that could only have ended up fossilized on both conti-nents if they were once fused together.
G Lystrosaurus was unable to swim across oceans, so the fact that its fossils were found on distant continents suggested those continents had once been fused together and later moved apart.
H Lystrosaurus is now found in colder parts of the world, which means the continents have drifted in the many years that have passed since the fossils were made.
I Lystrosaurus wasn't found in Asia, which Wegener thought was the only stable continent that hadn’t moved from its original position.
3 The tectonic plates move as a result of
A convection currents.B the force of gravity.C hot spots.D earthquakes.
4 When magma reaches Earth’s surface, what is it known as?
F silicaG lavaH lithosphereI crust
5 Which of the following statements about mid-ocean ridges is true?
A They help to refute the theory of plate tectonics.
B They are the source of the material that forms new ocean floor.
C They occur where the oceanic crust is the most dense.
D They usually are major subduction zones.
6 A hot spot that remains active under a moving plate of oceanic crust will produce a(n)
F chain of seamounts and islands.G system of rift valleys.H mid-ocean ridge.I earthquake.
7 What kind of fault is shown in the diagram?
A normal faultB strike-slip faultC reverse faultD transform fault
8 An earthquake occurs along a fault when
F energy in the rock along the fault does not change for a long period of time.
G stress in the rock along the fault causes magma to rise up through the fault.
H enough energy builds up in the rock along the fault to cause the rock to break or slip.
I energy in the rock along the fault is changed to heat.
9 What might happen to the volcanic activity of the active volcano in the diagram if the subducting plate stopped moving?
A It would grow more intense.B It would slow down, and the volcano
might become dormant.C The lava would have more silica, leading
to more-violent eruptions.D It would remain the same.
10 How can subduction lead to new landforms?
F Water trapped in the subducting plate can form magma that rises up through the overlying plate and becomes a volcano.
G The recycling of crust at one end of a plate creates enough space for new crust to be made at the other end.
H The mantle gets more material with which to make magma to release at mid-ocean ridges.
I The crust melts and sticks to the underside of the overlying plate, forcing it upward as a mountain range.
Complete the Quest!Present information on Mount Rainier’s history and current geological research, along with your evidence-based argu-ment about whether it is safe to hike and camp there.
Reason Quantitatively What data will help you predict that Mount Rainier could erupt while you are on a two-week camping trip nearby? Explain.
Reflect on Mount Rainier’s Safety
INTERACTIVITY
Subducting plate
VolcanoTrench
Answers will vary with students analysis of the data from the Quest activities.
1p4 min
3p
3p11
6p2
3p11
1p10
6p7
14p2 width and height
17p9
1p10
2p min
8p7 max
1p min
2p23p6
6p
3p
p6
p9
1p min
p9
Title_Topic This can run from 1 to 3 lines
H1_Topic
Topic_Num This can run from 1 to 11
SB_H1_greenSB1_H2_green
SB1
FL_STD_RIH
Lesson Panel: there can be 3-5 lessons.
FTL_white
TXT1_9_5pt
SB1_p1B
GO ONLINES: The color does not change. The icons are K-12 universal font. The colors are:40c70k: gray20m100y: yellow
Object Style:GreenYellow_Topic
MGES19_SE_FL_PT_TTP.indd All Pages 2/24/17 4:30 PM
michaelwysession
Highlight
michaelwysession
Highlight
michaelwysession
Sticky Note
New, inspired by JB comment.change "under" to "on"

uuDemonstrate Lab
Use the space provided to sketch your group’s model and write notes for guiding its construction. Have your teacher approve your group’s plan, and then construct and demonstrate the model.
New rock addedto each side of themid-ocean ridge
LithosphereMolten material
167166 Plate Tectonics
SC.7.E.6.7, SC.7.N.1.1, SC.7.N.3.2
166 Topic 6 Populations, Communities, and Ecosystems 167166 Topic 6 uDemonstrate...Lab166 TOPIC 6 Populations, Communities, and Ecosystems
6
166 Topic 6 Populations, Communities, and Ecosystems 167
NA_STD
166 Topic 6 uDemonstrate...Lab
NGSS PERFORMANCE EXPECTATIONSMS-LS2-1 Analyze and interpret data to provide evidence for the effects of resource availability on organisms and populations of organisms in an ecosystem.
MS-LS2-2 Construct an explanation that pre-dicts patterns of interactions among organ-isms across multiple ecosystems.
MS-LS2-4 Construct an argument supported by empirical evidence that changes to physical or biological components of an ecosystem affect populations.
MS-LS2-5 Evaluate competing design solutions for maintaining biodiversity and ecosystem services.
6
166 TOPIC 6 Populations, Communities, and Ecosystems166 Topic 6 Populations, Communities, and Ecosystems 167166 Topic 6 uDemonstrate...Lab166 TOPIC 6 Populations, Communities, and Ecosystems
6
(per group)• scissors• transparent tape• colored marker• metric ruler• 2 sheets of unlined
letter-sized paper• Manila folder
or file
How can you prevent a major oil spill by
designing and building a model that demonstrates
sea-floor spreading?
BackgroundImagine you are a marine geologist reviewing a plan to construct a gas pipeline attached to the ocean floor. You notice that part of the pipeline will cross a mid-ocean ridge zone. In this investigation, you will design and build a model that demonstrates sea-floor spreading to show why this plan is not a good idea.
SpreadingModeling Sea-Floor
Plan Your InvestigationDiscuss with your group why building a pipeline that spans the mid-ocean ridge is a bad idea. Over time, what will happen to the pipeline?
With your group, take a look at the materials. How can you use the materials to construct a model that demonstrates why the pipeline plan is a problem?
Consider the following questions:
HANDS-ON LABGo online for a download-able worksheet of this lab.
• How can you use the manila folder to represent the mantle?
• How can you use the two pieces of plain letter-sized paper to create matching strips of striped sea floor?
• How can you represent the mid-ocean ridge and the subduction zones on either side of the ridge?
1p4 min
3p
3p11
6p2
3p11
1p10
6p7
14p2 width and height
17p9
1p10
2p min
8p7 max
1p min
2p23p6
6p
3p
p6
p9
1p min
p9
Title_Topic This can run from 1 to 3 lines
H1_Topic
Topic_Num This can run from 1 to 11
SB_H1_greenSB1_H2_green
SB1
FL_STD_RIH
Lesson Panel: there can be 3-5 lessons.
FTL_white
TXT1_9_5pt
SB1_p1B
GO ONLINES: The color does not change. The icons are K-12 universal font. The colors are:40c70k: gray20m100y: yellow
Object Style:GreenYellow_Topic
MGES19_SE_FL_PT_UDEM.indd 166-167 2/24/17 4:24 PM

uuDemonstrate Lab
169168 Plate Tectonics168 Topic 6 Populations, Communities, and Ecosystems 169168 Topic 6 uDemonstrate...Lab168 Topic 6 Populations, Communities, and Ecosystems 169168 Topic 6 uDemonstrate...Lab168 Topic 6 Populations, Communities, and Ecosystems 169168 Topic 6 uDemonstrate...Lab
Sketch of Model
Analyze and Interpret Data1. Apply Concepts Why was it important that your model have
identical patterns of stripes on both sides of the center slit?
2. Construct Explanations Use evidence from your model to support the claim that sea-floor spreading builds two different tectonic plates.
3. Refine Your Solution Look at the models created by other groups. How are the other solutions different? How might you revise your group’s model to better demonstrate sea-floor spreading?
4. Develop Models How could your group revise the model to reinforce the idea that the amount of crust that forms at the mid-ocean ridge is equal to the amount of crust recycled back into the mantle at subduction zones?
5. Infer How did your model support the claim that building an oil pipeline across a divergent boundary would be a bad idea?
Design Notes
The stripes represent bands of rock of the same age on either side of the ride. Spreading takes place at an equal rate in both directions, so the patterns on both sides should be the same.
When magma emerges as lava at a mid-ocean ridge, it settles, cools, and hardens on both sides of the ridge, at the edge of two different plates. Our model demon-strated this.
Some other groups folded the manila folder to represent the older ridges along the mid-ocean ridge. We could include the folds in our model to better demon-strate sea-floor spreading.
The two strips could be taped into loops that would endlessly go around and around, wheel-like, out of and back down into the “mantle.”
Because the plates (paper) on either side move apart, the pipeline would be stretched and broken, causing an oil spill.]
MGES19_SE_FL_PT_UDEM.indd 168-169 2/24/17 4:24 PM