Ultrafine particles cause cytoskeletal dysfunctions in macrophages
Upload
independentCategory
view
2download
0
The following document was submitted “for the record” to the Intermodal Container Transfer Facility (ICTF) Joint Powers Authority (JPA) during the Notice of Preparation/Initial Study (NOP/IS) comment period for the ICTF Modernization and Expansion Project.
The document was submitted by:
Andrea M. Hricko Assoc Prof Prev Med Keck School of Med & Director, Community Outreach and Education Southern CA Env Health Sciences Ctr 1540 Alcazar Street CHP 236 L.A. CA 90033 323-442-3077
-------------------------------------------- End Page ---------------------------------------------------
Zhu, Hinds, Kim, and Sioutas
1032 Journal of the Air & Waste Management Association Volume 52 September 2002
ISSN 1047-3289 J. Air & Waste Manage. Assoc. 52:1032-1042
Copyright 2002 Air & Waste Management Association
TECHNICAL PAPER
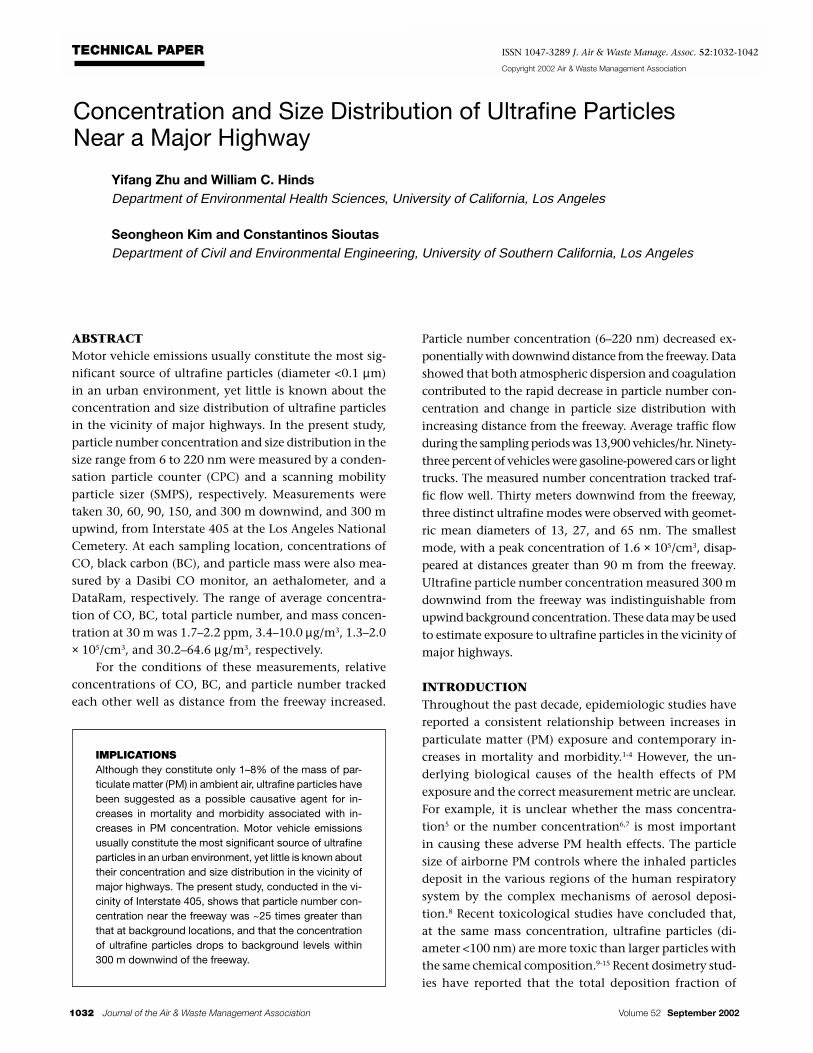
ABSTRACTMotor vehicle emissions usually constitute the most sig-nificant source of ultrafine particles (diameter <0.1 µm)in an urban environment, yet little is known about theconcentration and size distribution of ultrafine particlesin the vicinity of major highways. In the present study,particle number concentration and size distribution in thesize range from 6 to 220 nm were measured by a conden-sation particle counter (CPC) and a scanning mobilityparticle sizer (SMPS), respectively. Measurements weretaken 30, 60, 90, 150, and 300 m downwind, and 300 mupwind, from Interstate 405 at the Los Angeles NationalCemetery. At each sampling location, concentrations ofCO, black carbon (BC), and particle mass were also mea-sured by a Dasibi CO monitor, an aethalometer, and aDataRam, respectively. The range of average concentra-tion of CO, BC, total particle number, and mass concen-tration at 30 m was 1.7–2.2 ppm, 3.4–10.0 µg/m3, 1.3–2.0× 10⁵/cm3, and 30.2–64.6 µg/m3, respectively.
For the conditions of these measurements, relativeconcentrations of CO, BC, and particle number trackedeach other well as distance from the freeway increased.
Particle number concentration (6–220 nm) decreased ex-ponentially with downwind distance from the freeway. Datashowed that both atmospheric dispersion and coagulationcontributed to the rapid decrease in particle number con-centration and change in particle size distribution withincreasing distance from the freeway. Average traffic flowduring the sampling periods was 13,900 vehicles/hr. Ninety-three percent of vehicles were gasoline-powered cars or lighttrucks. The measured number concentration tracked traf-fic flow well. Thirty meters downwind from the freeway,three distinct ultrafine modes were observed with geomet-ric mean diameters of 13, 27, and 65 nm. The smallestmode, with a peak concentration of 1.6 × 10⁵/cm3, disap-peared at distances greater than 90 m from the freeway.Ultrafine particle number concentration measured 300 mdownwind from the freeway was indistinguishable fromupwind background concentration. These data may be usedto estimate exposure to ultrafine particles in the vicinity ofmajor highways.
INTRODUCTIONThroughout the past decade, epidemiologic studies havereported a consistent relationship between increases inparticulate matter (PM) exposure and contemporary in-creases in mortality and morbidity.1-4 However, the un-derlying biological causes of the health effects of PMexposure and the correct measurement metric are unclear.For example, it is unclear whether the mass concentra-tion5 or the number concentration6,7 is most importantin causing these adverse PM health effects. The particlesize of airborne PM controls where the inhaled particlesdeposit in the various regions of the human respiratorysystem by the complex mechanisms of aerosol deposi-tion.8 Recent toxicological studies have concluded that,at the same mass concentration, ultrafine particles (di-ameter <100 nm) are more toxic than larger particles withthe same chemical composition.9-15 Recent dosimetry stud-ies have reported that the total deposition fraction of
Concentration and Size Distribution of Ultrafine ParticlesNear a Major Highway
Yifang Zhu and William C. HindsDepartment of Environmental Health Sciences, University of California, Los Angeles
Seongheon Kim and Constantinos SioutasDepartment of Civil and Environmental Engineering, University of Southern California, Los Angeles
IMPLICATIONSAlthough they constitute only 1–8% of the mass of par-ticulate matter (PM) in ambient air, ultrafine particles havebeen suggested as a possible causative agent for in-creases in mortality and morbidity associated with in-creases in PM concentration. Motor vehicle emissionsusually constitute the most significant source of ultrafineparticles in an urban environment, yet little is known abouttheir concentration and size distribution in the vicinity ofmajor highways. The present study, conducted in the vi-cinity of Interstate 405, shows that particle number con-centration near the freeway was ~25 times greater thanthat at background locations, and that the concentrationof ultrafine particles drops to background levels within300 m downwind of the freeway.
Zhu, Hinds, Kim, and Sioutas
Volume 52 September 2002 Journal of the Air & Waste Management Association 1033
ultrafine particles increases as particle size decreases,16,17
with the greatest fractional deposition in the deep lungoccurring between 5 and 100 nm.17 Currently, however,only the mass of PM less than 10 µm (PM10) and less than2.5 µm (PM2.5) in aerodynamic diameter are regulated.Information about ultrafine particles is usually not avail-able, even though ultrafine particles represent 80% of theparticle number concentration in an urban environment.18
The less numerous but much heavier supermicrometerparticles dominate mass concentration measurements.Thus, both number concentration and the size distribu-tion of ultrafine particles are needed to better understandambient air quality and its potential health effects.
In an urban environment, motor vehicle emissionsusually constitute the most significant source of ultrafineparticles.19,20 Although traffic-related air pollution in ur-ban environments has been of increasing concern, moststudies have focused on gaseous pollutants and the totalmass concentration and chemical composition of particu-late pollutants.21-26 Because the majority of particles fromvehicle exhaust are in the size range of 20–130 nm fordiesel engines and 20–60 nm for gasoline engines,27,28 it isimportant and necessary to quantify ultrafine particleemission levels and to determine ultrafine particle behav-ior after emission as they are transported away from theemission source—busy roads and freeways. Previously, re-searchers have measured the horizontal and vertical pro-files of submicrometer particulates (16–626 nm) near amajor arterial route in the urban area of Brisbane, Austra-lia.29 They found that, with the exception of measurementsin close proximity to the road (~15 m), the horizontalprofile measurements did not show statistically signifi-cant differences in fine particle number concentration atground-level distances up to 200 m away from the road.
Hitchins et al. examined particle size distribution andconcentration in the size range from 15 nm to 20 µm atdistances from a road ranging from 15 to 375 m at twosites in Australia.19 They conducted measurements underdifferent wind conditions and found that when the windblew directly from the road, the concentration of the fineand ultrafine particles decayed to about half of their maxi-mum at a distance of 100–150 m from the road.19 Shi etal. measured ultrafine particle number concentrations andsize distributions at a busy roadside and at nearby urbanbackground sites in Birmingham, England.20 They ob-served a faster decline of particle number concentrationthan of mass concentration and concluded that dilutionwith background air is the main mechanism for the rapiddecrease in particle number concentration and changesin particle size distribution with distance from traffic.Recently, it was reported that the fraction less than 10nm constitutes more than ~40% of the total particle num-ber concentrations at 4 and 25 m from the curb.30
While recent studies have examined ultrafine particlesfrom traffic in other countries, no comparable work hasbeen done in the Los Angeles basin, home to more than15 million individuals and 10 million vehicles. Two stud-ies characterizing Los Angeles freeway aerosols date to the1970s.31,32 More recently, ambient ultrafine particles inPasadena, a city in the Los Angeles basin, have been stud-ied.33 Despite considerable improvements in air qualityover the past two decades, the Los Angeles basin contin-ues to exhibit the most severe particulate air quality prob-lem in the United States. Laboratory studies have foundthat new engine technology and fuel reformulation havedecreased particle mass concentrations emitted from ve-hicles, but ultrafine particle number concentrations haveremained unchanged or have even increased.27,28,34,35 Withthe advance of aerosol instrumentation, ultrafine particlesnow can be characterized much better than they could be30 years ago. Thus, it is necessary and timely to conduct acomprehensive study of ultrafine particles in the vicinityof freeways in the Los Angeles area.
In view of the growing concern about ultrafine par-ticle exposure, the need to assess exposure for epidemiol-ogy studies, and the high traffic density in the Los Angelesbasin, the aim of this article was to systematically evalu-ate ultrafine particles in the vicinity of a freeway, particu-larly as they are transported downwind from the freeway.Particle number concentration and size distribution rang-ing in size from 6 to 220 nm were measured along withCO, black carbon (BC), and PM concentration as a func-tion of distance from Interstate 405, one of the busiestfreeways in the United States.
METHODSDescription of Sampling Site
This study was conducted in the Los Angeles NationalCemetery adjacent to Interstate 405 between May 15 andJuly 18, 2001. Freeway 405 runs generally north and south(actual orientation 330º) along the western boundary ofthe cemetery, with a 1% upgrade going north. In the im-mediate vicinity of the sampling site, the terrain is flat-mowed lawn with scattered mature trees about 10 m highand 6 m apart. This flat region extends 0.7 km to the eastof the freeway and 1.3 km along the freeway with no sig-nificant local sources of PM emissions other than the free-way. Measurements were made along ConstitutionAvenue, which runs perpendicular to the freeway. It passesthrough a tunnel under the freeway, thereby providingaccess to upwind and downwind sides of the freeway. Atthe sampling site, the freeway is elevated ~4.5 m abovethe surrounding terrain.
The site lies 6.4 km east of Santa Monica Bay and thePacific Ocean. During the sampling period, a consistentsea breeze (eastward from the ocean) developed each day,
Zhu, Hinds, Kim, and Sioutas
1034 Journal of the Air & Waste Management Association Volume 52 September 2002
beginning in the mid-morning, reaching its maximum inearly to mid-afternoon, and dying out in the early evening.The region upwind of the freeway is a residential area withno industrial or other obvious PM sources. Backgroundmeasurements were taken ~300 m upwind of the freeway.
The only other freeways or major roads nearby areSepulveda Boulevard, which runs parallel and immedi-ately adjacent to the freeway, and Wilshire Boulevard,which runs perpendicular to the freeway more than 0.8km to the south. During the sampling periods, traffic onSepulveda Boulevard was light, ~5% of that on the free-way. For the usual wind direction (from southwest tonortheast), traffic on Wilshire Boulevard was more than2 km away along the wind vector and had little influenceon particle levels.
The freeway has nine lanes, five northbound and foursouthbound. It is ~30 m wide, including a 1-m-wide me-dian strip. The location of each measurement site for thisstudy was determined by measuring its distance from thecenter of the median strip. The distance from each of thefive sampling locations to the nearest traffic lane was 15 mless than the indicated distance.
Sampling and InstrumentationWind speed and directions were measured 6 m aboveground level 30 m downwind of the freeway, which alsoserved as a particle number concentration control site.Wind data were averaged over 1-min intervals and loggedinto a computerized weather station (Wizard III, WeatherSystems Company). Throughout each measurement, thetraffic strength on the freeway, defined as the number ofvehicles passing per minute, was continuously monitoredby a video recorder (camcorder) located on top of a 10-mtower close to the main gate of the Los Angeles NationalCemetery. The camcorder was high enough to capture allnine lanes on the freeway and on Sepulveda Boulevard.After each sampling session, the videotapes were replayed,and traffic density was counted manually. Three 1-minsamples were randomly selected from every 10-min in-terval. The data then were averaged for cars, light trucks,and heavy-duty trucks to estimate the traffic strength bytype of vehicle.
Particle number concentration and size distributionin the size range from 6 to 220 nm were measured by acondensation particle counter (CPC 3022A; TSI Inc.) anda scanning mobility particle sizer (SMPS 3936, TSI Inc.),respectively. The sampling flow rate of the SMPS was ad-justed to 1.5 L/min to measure particles as small as 6 nmand to minimize the diffusion losses of ultrafine particlesduring sampling.8 Flexible conductive tubing (Part3001940, TSI Inc.) was used for sampling to avoid par-ticle losses caused by electrostatic forces. The sizing accu-racy of the SMPS was verified in the laboratory by means
of monodisperse polystyrene latex spheres (PSL,Polysciences Inc.). Data reduction and analysis of the SMPSoutput were performed using Aerosol Instrument Man-ager software (version 4.0, TSI Inc.). Measurements weretaken 30, 60, 90, 150, and 300 m downwind and 300 mupwind from the center of the freeway. The distances werechosen based on preliminary measurements and previ-ously published literature.19 At each location, three sizedistribution samples were taken in sequence with theSMPS. Scanning time for each was 180 sec.
In addition to size distribution and total number con-centration, concentrations of BC, CO, and PM were moni-tored simultaneously at each sampling location. Before eachmeasurement, all instruments were synchronized. Datawere averaged later over the time periods correspondingto the scanning intervals of the SMPS. A dual-beamaethalometer (Model AE-20, Andersen Model RTAA-900,Andersen Instruments Inc.) was used to measure BC con-centrations every 5 min. CO concentrations were measuredby a near-continuous CO monitor (Dasibi Model 3008,Environmental Corp.) every minute. The CO monitor wascalibrated by means of standard CO gas (RAE Systems Inc.)in the laboratory and automatically zeroed each time thepower was turned on. A DataRam photometer (RAM-1, MIEInc.) was used as a continuous PM monitor. Because thePM concentrations measured by the DataRam were notactual gravimetric measurements, these values were usedas indicators of general trends in PM concentrations andoverall changes with distance from the freeway.
Electric power for the control site CPC and weatherstation was obtained by an extension cord to the cem-etery office. Electric power for other sampling instrumentsat locations further downwind was supplied by a 1.2-kWgasoline-powered portable generator (Model EU 1000i,Honda Motor Co.). The generator was placed ~50 m down-wind of each sampling location. Both total particle num-ber and CO concentrations were measured at the controlsite while the generator was turned on and off. No detect-able difference was observed.
Table 1 gives the sampling dates and times and sum-marizes the instruments that were used on each date.The weather station and the control CPC were placed atthe 30-m downwind control site and sampled through-out the experiment. All other applicable instrumentswere moved together and sampled simultaneously ateach sampling location. It took about 10 min to com-plete sampling at each location and 90 min to completea set at all six locations. Three or four sets were performedon each sampling date.
RESULTS AND DISCUSSIONThe measurements presented herein were conducted be-tween May 15 and July 18, 2001. During the sampling
Zhu, Hinds, Kim, and Sioutas
Volume 52 September 2002 Journal of the Air & Waste Management Association 1035
period, traffic density ranged from 140 to 250 vehicles/min passing the sampling site in both directions. Averagevehicle speed ranged from 2.5 to 30.0 m/sec (5–65 mph).Traffic primarily was dominated by gasoline-powered carsand light trucks, and less than 5% of vehicles observedwere heavy-duty diesel trucks. The results presented inthe next sections include measurements of total particlenumber concentrations by a control CPC and of windvelocity using a Weather Wizard III, both positioned at afixed location 30 m downwind of the freeway; of CO, BC,and PM concentrations; and of ultrafine particle size dis-tributions upwind and at five downwind distances fromthe freeway.
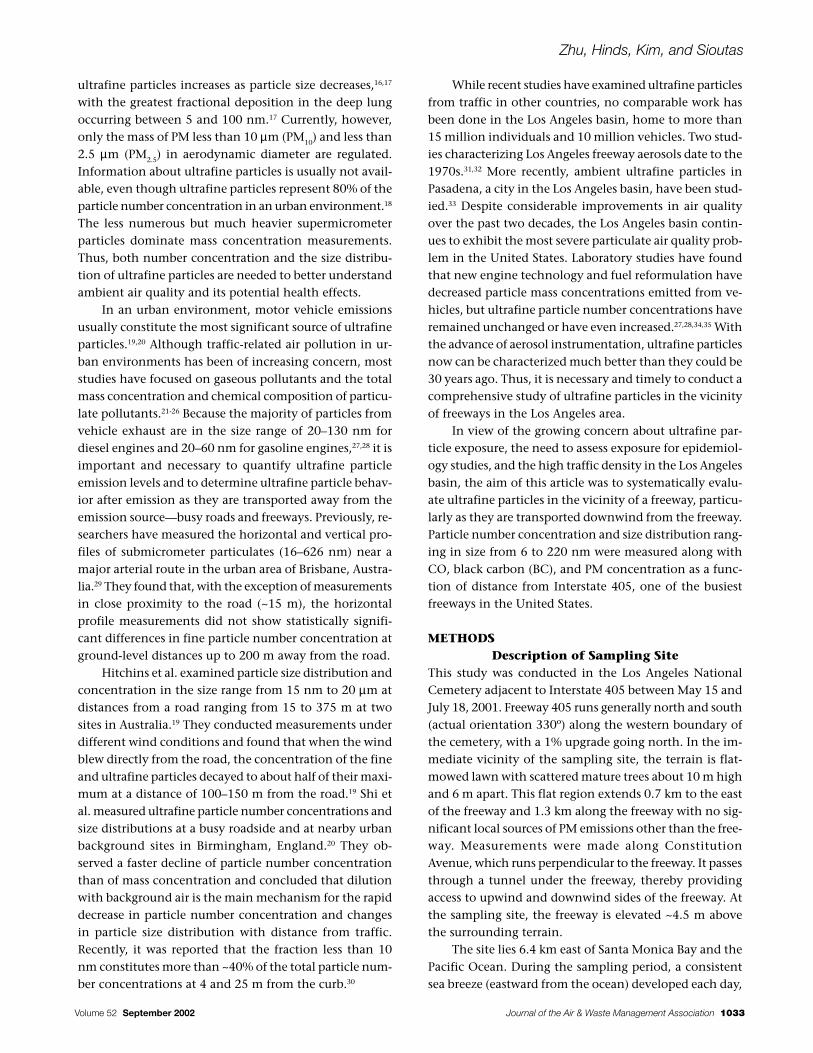
Wind EffectsWind speed and direction were measured, averaged, andlogged over every 1-min interval throughout each sam-pling period. Of more than 5000 observations from allthe sampling dates, 100 wind data points were randomlyselected and are plotted in Figure 1. The orientation ofthe freeway and the sampling road, Constitution Avenue,also are shown in the figure. Note that the Weather Wiz-ard III instrument recorded wind direction at a 22.5º in-terval (e.g., 11.25º on either side of N, NNE, etc.) and windspeed at 0.4 or 0.5 m/sec intervals. In the figure, dupli-cate observations are spread out slightly in both direc-tions to better illustrate how strong the wind was andhow often the wind came from certain directions. Basedon all 5000 observations, the percentage of sampling timethat the wind came from each 22.5º segment also is shownin Figure 1. As shown in the figure, for most of the sam-pling time, the wind came directly from the freeway to-ward the sampling road with a speed of 1–2 m/sec. Theconsistency of observed wind direction and speed is a re-sult of a generally low synoptic wind velocity and a reli-able sea breeze in the sampling area. For this study, theconsistency of the wind is important, because it alloweddata from different days to be averaged together. Hitchins
et al. found a completely differentcharacterization of changes in to-tal particle number concentrationwith increasing distances from amajor road when the wind wasblowing directly from, parallel to,or away from the sampling loca-tion.19 They observed no trendwhen the wind was blowing awayfrom the sampling location.19
In this study, we found thatboth wind direction and windspeed played an important role indetermining the characteristics ofultrafine particles near the freeway.
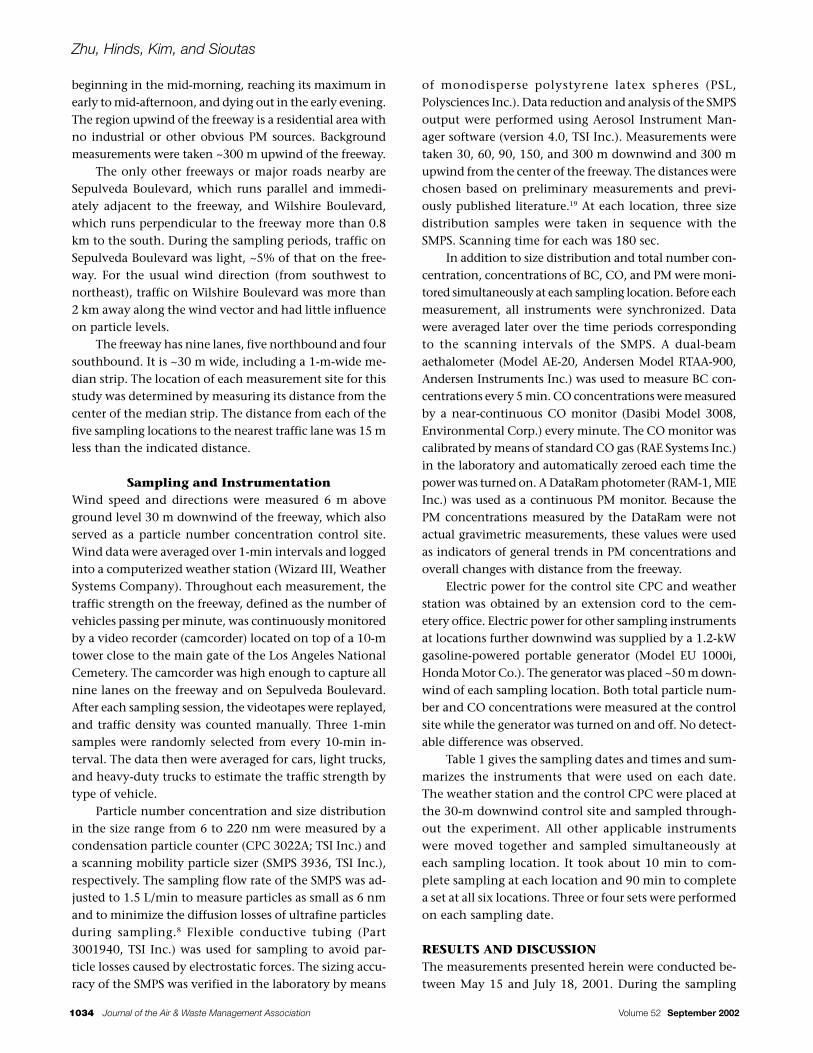
Figure 2 shows total particle number concentrations asmeasured by the control CPC, located 30 m downwind ofthe freeway, versus wind speed. A linear regression line,equation, and R2 value also are included in Figure 2. TheCPC was programmed to archive averaged total particlenumber concentrations at 1-min intervals in synchroni-zation with the averaging time of the meteorological data.Only wind data within 45º of normal to the freeway areused in this figure. This range accounts for more than80% of the total observations. In addition, Figure 2 in-cludes particle number concentrations ranging in size from15 to 697 nm, at 30 m, given by Figures 3a–c of Hitchinset al.,19 for comparison. It can be seen that total particlenumber concentration measurements near the freewayare in general 2–3 times greater than those observed byHitchins et al. at Tingalpa, Australia.19 This is mainly be-cause of the much heavier traffic density on the freeway,as discussed in the next sections. In addition, vehicle type,
Table 1. Sampling dates and instruments used.
Weather CODate Time Wizard III Control CPC SMPS Monitor Aethalometer DataRam
05/15/01 10:30–15:30 × × ×05/17/01 11:00–15:30 × × ×05/30/01 11:00–16:00 × × ×06/08/01 10:30–16:00 × × ×06/20/01 10:30–15:30 × × × × × ×06/21/01 11:00–16:00 × × × × × ×06/22/01 10:30–16:00 × × × × × ×07/17/01 10:30–15:30 × × × × ×07/18/01 10:30–16:00 × × × × ×
Figure 1. Wind direction and speed at the sampling site.
Zhu, Hinds, Kim, and Sioutas
1036 Journal of the Air & Waste Management Association Volume 52 September 2002
emission control equipment, and fuel type; utilizationparameters such as age, accumulated mileage, inspection,and maintenance; operating modes such as average speedand fraction of cold/hot starts; and ambient parameterssuch as temperature and humidity also may contribute tothe observed differences. Although the absolute particlenumber concentrations are quite different in these twostudies, the relative particle number concentrations as afunction of wind speed are quite similar. This indicatesthat atmospheric dilution of ultrafine particles by the windis comparable for both cases.
Traffic EffectsFreeway 405 passing through west Los Angeles is consid-ered one of the busiest freeways in the United States. Theaverage traffic volume per hour during the measurementperiod was 13,000 cars, 350 light trucks, and 550 heavytrucks, totaling 13,900 vehicles. More than 93% of thevehicles passing by the measurement site on the freewaywere gasoline-powered cars. This observed total trafficdensity was ~3 times higher than that reported by Hitchinset al. at Tingalpa, Australia,19 and accounts for the higherobserved total particle number concentrations.
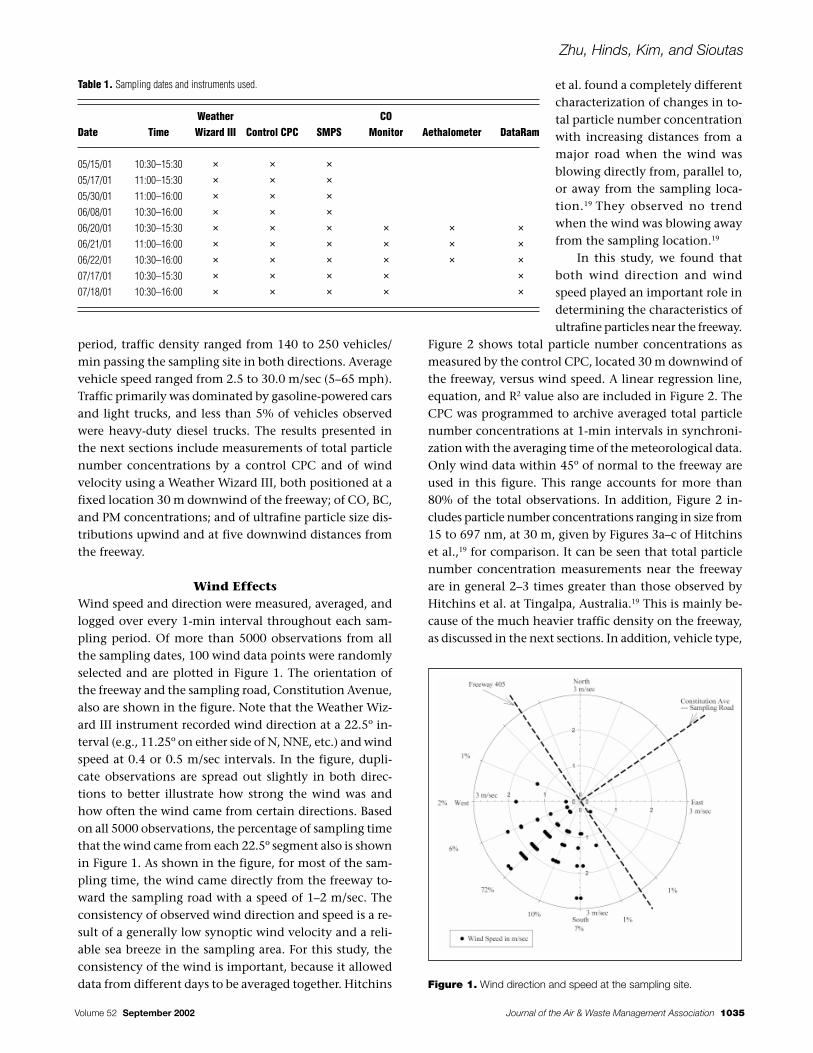
Figure 3 shows the change in measured particle num-ber concentration and the number of cars passing by thesampling site during those sampling periods when the windwas within 22.5º of normal to the freeway. Because windspeed played an important role in determining the totalparticle number concentrations, measured CPC readingswere corrected to 1 m/sec by the following equation:
(1)
where CN* is the corrected particle number concentration
used in Figure 3, CN is the CPC measured particle number
concentration, 213,000 is the intercept of the regression linein Figure 2, 171,900 cm–3 is the particle number concentra-tion at 1 m/sec velocity, –41,100 is the slope of the regres-sion line, and V is the wind speed in m/sec as measured bythe weather station. This correction will transform the mea-sured particle number concentration to approximately aconstant value at a relatively low wind speed (i.e., V < 3 m/sec). Because for most of the sampling time, average windspeed was in the range of 1–1.5 m/sec, this correction ap-plies to more than 95% of the observations.
As shown in Figure 3, normalized particle number con-centration tracked the traffic density very well, indicatingthat traffic is the major contributor to fine and ultrafineparticles. A traffic slowdown on the northbound side ofFreeway 405 usually developed on weekdays around 1:30p.m., as indicated by the sharp drop of the solid curve inFigure 3. During this traffic slowdown, the average vehiclespeed was usually less than 5 mph. The control CPC read-ing during that time period was observed to be much lowerthan normal, indicating that fewer ultrafine particles areproduced during such traffic slowdowns. One possible ex-planation lies in the fact that nanoparticles produced byidling engines have longer residence times before they areexhausted from the tailpipe. Kittleson found that coagula-tion may reduce output number concentrations dramati-cally if engine exhaust is not diluted rapidly.36,37
Because both wind speed and traffic density affectedthe characteristics of ultrafine particles near the freewayand the control CPC reacted to these effects reasonablywell, subsequent data for ultrafine particle analysis at in-creasing distances from the freeway were all normalizedto the control CPC reading. An average CPC reading, ,was obtained based on all the measurements. In Figures4, 5, and 6, number concentration size distribution datawere scaled to by dividing each measurement by theratio of the CPC reading for the period of measurement to .
Figure 2. Total particle number concentration measured by a CPClocated 30 m downwind from Freeway 405 vs. wind speeds. Barsindicate 1 standard deviation.
C C
VN N* ,
, ,= ×
− ×
171 900213 000 41 100
Figure 3. Correlation between traffic density and measured totalparticle number concentration, corrected for wind velocity, 30 mdownwind from the freeway.
CN
CN
CN
Zhu, Hinds, Kim, and Sioutas
Volume 52 September 2002 Journal of the Air & Waste Management Association 1037
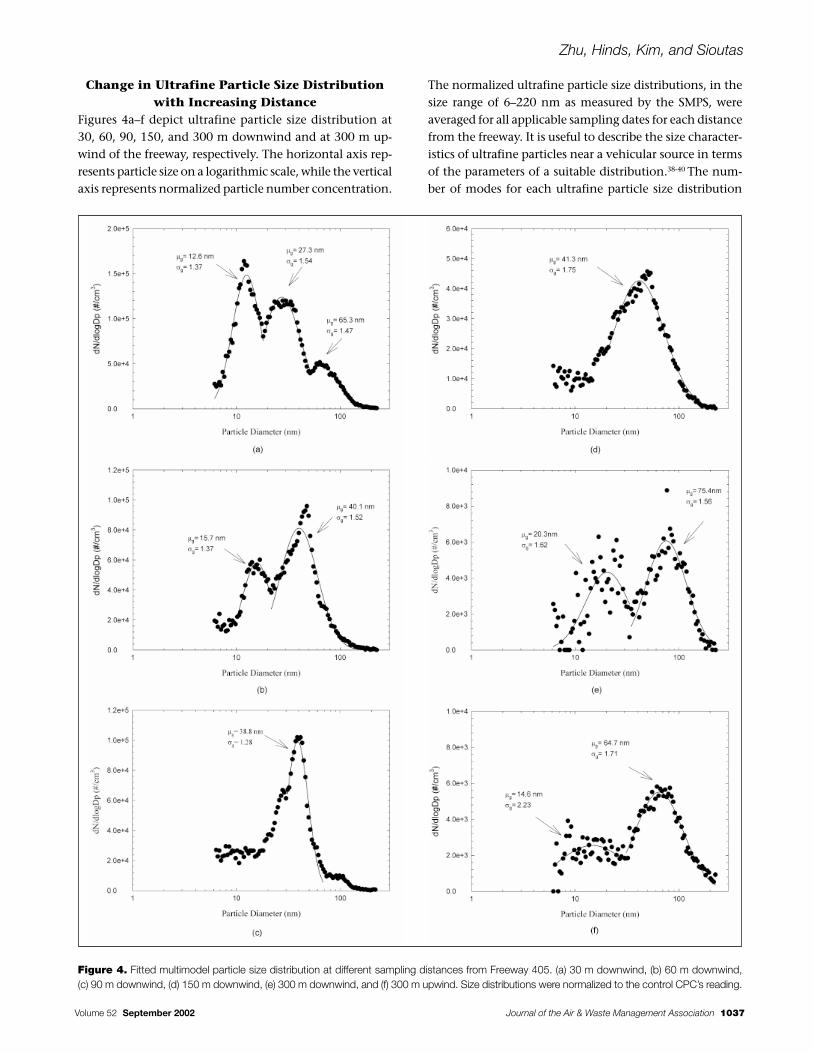
Change in Ultrafine Particle Size Distributionwith Increasing Distance
Figures 4a–f depict ultrafine particle size distribution at30, 60, 90, 150, and 300 m downwind and at 300 m up-wind of the freeway, respectively. The horizontal axis rep-resents particle size on a logarithmic scale, while the verticalaxis represents normalized particle number concentration.
The normalized ultrafine particle size distributions, in thesize range of 6–220 nm as measured by the SMPS, wereaveraged for all applicable sampling dates for each distancefrom the freeway. It is useful to describe the size character-istics of ultrafine particles near a vehicular source in termsof the parameters of a suitable distribution.38-40 The num-ber of modes for each ultrafine particle size distribution
Figure 4. Fitted multimodel particle size distribution at different sampling distances from Freeway 405. (a) 30 m downwind, (b) 60 m downwind,(c) 90 m downwind, (d) 150 m downwind, (e) 300 m downwind, and (f) 300 m upwind. Size distributions were normalized to the control CPC’s reading.
Zhu, Hinds, Kim, and Sioutas
1038 Journal of the Air & Waste Management Association Volume 52 September 2002
was determined by visual inspection of the size distribu-tion graphs. Then, the full spectrum was subdivided intoone, two, or three size-groups according to the number ofmodes. The data for each size-group then was fitted witha lognormal distribution using the SigmaPlot 2000 log-normal three-parameter fitting procedure.41 The fitted dis-tribution, the geometric mean diameter, µg, and thegeometric standard deviation, σg, also are shown in Fig-ures 4a–f for each observed mode.
As shown in Figure 4, ultrafine particle size distribu-tion from the freeways changed markedly and its num-ber concentration dropped dramatically with increasingdistance. In Figure 4a, at the nearest sampling location,30 m downwind from the freeway, three distinct modeswere observed with geometric mean diameters of 13, 27,and 65 nm, respectively. The mode for the smallest par-ticle sizes, with a peak concentration of 1.6 × 10⁵/cm3,was similar to that previously reported for direct labora-tory measurement of vehicle emissions.28 This modeshifted to a larger geometric mean diameter, 16 µm, andthe modal number concentration dropped to one-thirdof the maximum concentration at 60 m downwind (seeFigure 4b). This mode was not observed at greater down-wind distances (see Figures 4c–e). The dramatic decreasein particle number concentration at ~10 nm likely wascaused by several atmospheric aerosol particle mechanismsthat enhanced small particle loss, diffusion to surfaces,evaporation, and coagulation. The smaller the particle,the greater its diffusion coefficient and its Brownian mo-tion. Particles of 10 nm diffuse ~80 times faster than doparticles of 100 nm. As particle size gets smaller, the Kelvineffect becomes more important, making it easier for mol-ecules to leave the particle’s surface by evaporation. Inaddition, when two small particles collide because of theirBrownian motion (coagulate), they form a bigger particle.Thus, coagulation reduces number concentrations and shiftsthe size distribution to larger sizes.8,32 The coagulation effectwill be discussed in detail in the following paragraphs.
Because of atmospheric dilution, the number concen-tration for all sizes dropped dramatically with increaseddistance from the freeway. Number concentration droppedto approximately half its original value at 30 m some-where between 90 and 150 m, as shown in Figure 4d. Thisresult is in good agreement with Hitchins et al., who foundthat particle number concentrations decreased by 50% at100–150 m.19 Ultrafine particle concentration measuredat 300 m downwind of the freeway (see Figure 4e) wascomparable to what was measured at the background lo-cation 300 m upwind of the freeway (see Figure 4f). Themaximum number concentration that was observed nearthe freeway was ~25 times greater than that at the back-ground location. This suggests that people who live, work,or travel within 100 m downwind of major traffic sources
will have much higher ultrafine particle exposure thanthose will who live farther from such sources. This resultcan be used in epidemiologic studies to evaluate the healtheffects of ultrafine particles.
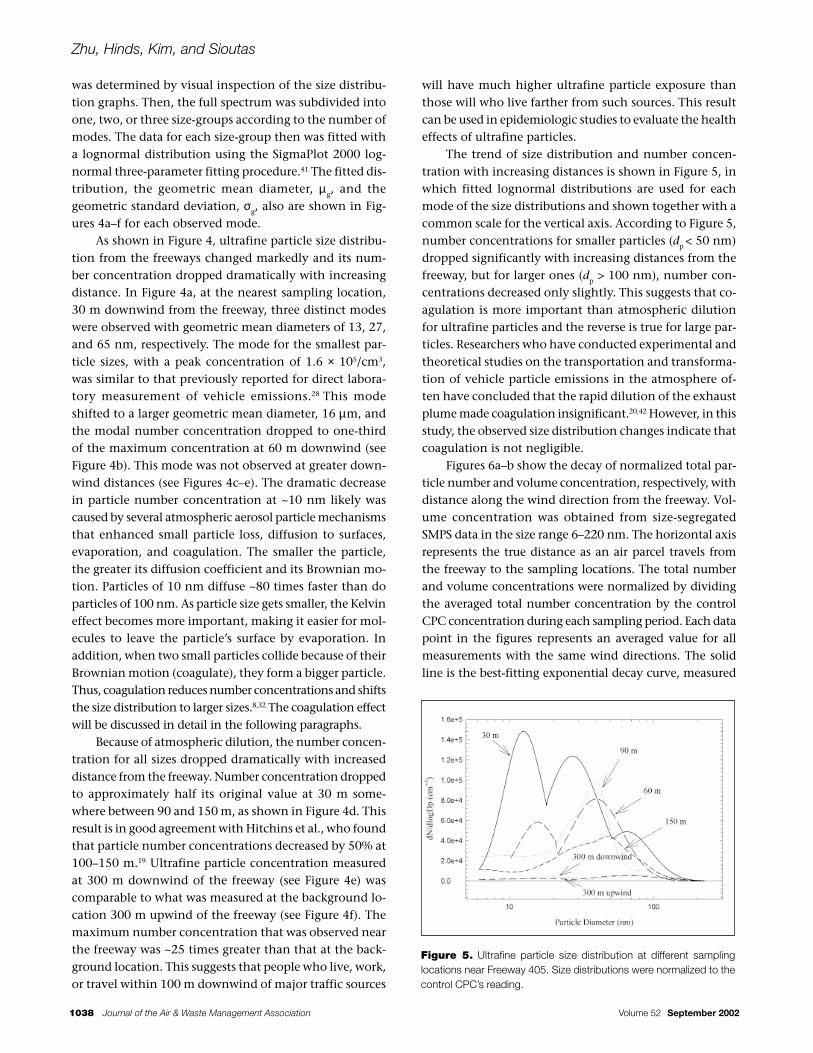
The trend of size distribution and number concen-tration with increasing distances is shown in Figure 5, inwhich fitted lognormal distributions are used for eachmode of the size distributions and shown together with acommon scale for the vertical axis. According to Figure 5,number concentrations for smaller particles (dp < 50 nm)dropped significantly with increasing distances from thefreeway, but for larger ones (dp > 100 nm), number con-centrations decreased only slightly. This suggests that co-agulation is more important than atmospheric dilutionfor ultrafine particles and the reverse is true for large par-ticles. Researchers who have conducted experimental andtheoretical studies on the transportation and transforma-tion of vehicle particle emissions in the atmosphere of-ten have concluded that the rapid dilution of the exhaustplume made coagulation insignificant.20,42 However, in thisstudy, the observed size distribution changes indicate thatcoagulation is not negligible.
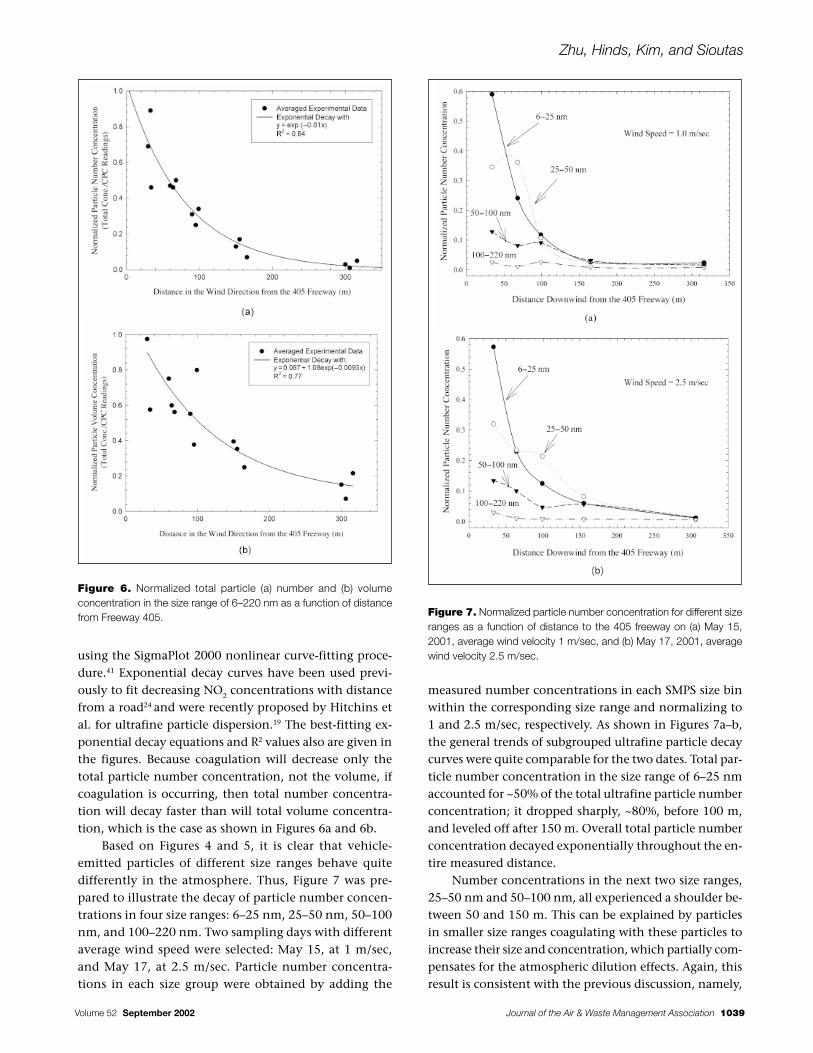
Figures 6a–b show the decay of normalized total par-ticle number and volume concentration, respectively, withdistance along the wind direction from the freeway. Vol-ume concentration was obtained from size-segregatedSMPS data in the size range 6–220 nm. The horizontal axisrepresents the true distance as an air parcel travels fromthe freeway to the sampling locations. The total numberand volume concentrations were normalized by dividingthe averaged total number concentration by the controlCPC concentration during each sampling period. Each datapoint in the figures represents an averaged value for allmeasurements with the same wind directions. The solidline is the best-fitting exponential decay curve, measured
Figure 5. Ultrafine particle size distribution at different samplinglocations near Freeway 405. Size distributions were normalized to thecontrol CPC’s reading.
Zhu, Hinds, Kim, and Sioutas
Volume 52 September 2002 Journal of the Air & Waste Management Association 1039
using the SigmaPlot 2000 nonlinear curve-fitting proce-dure.41 Exponential decay curves have been used previ-ously to fit decreasing NO2 concentrations with distancefrom a road24 and were recently proposed by Hitchins etal. for ultrafine particle dispersion.19 The best-fitting ex-ponential decay equations and R2 values also are given inthe figures. Because coagulation will decrease only thetotal particle number concentration, not the volume, ifcoagulation is occurring, then total number concentra-tion will decay faster than will total volume concentra-tion, which is the case as shown in Figures 6a and 6b.
Based on Figures 4 and 5, it is clear that vehicle-emitted particles of different size ranges behave quitedifferently in the atmosphere. Thus, Figure 7 was pre-pared to illustrate the decay of particle number concen-trations in four size ranges: 6–25 nm, 25–50 nm, 50–100nm, and 100–220 nm. Two sampling days with differentaverage wind speed were selected: May 15, at 1 m/sec,and May 17, at 2.5 m/sec. Particle number concentra-tions in each size group were obtained by adding the
measured number concentrations in each SMPS size binwithin the corresponding size range and normalizing to1 and 2.5 m/sec, respectively. As shown in Figures 7a–b,the general trends of subgrouped ultrafine particle decaycurves were quite comparable for the two dates. Total par-ticle number concentration in the size range of 6–25 nmaccounted for ~50% of the total ultrafine particle numberconcentration; it dropped sharply, ~80%, before 100 m,and leveled off after 150 m. Overall total particle numberconcentration decayed exponentially throughout the en-tire measured distance.
Number concentrations in the next two size ranges,25–50 nm and 50–100 nm, all experienced a shoulder be-tween 50 and 150 m. This can be explained by particlesin smaller size ranges coagulating with these particles toincrease their size and concentration, which partially com-pensates for the atmospheric dilution effects. Again, thisresult is consistent with the previous discussion, namely,
Figure 6. Normalized total particle (a) number and (b) volumeconcentration in the size range of 6–220 nm as a function of distancefrom Freeway 405. Figure 7. Normalized particle number concentration for different size
ranges as a function of distance to the 405 freeway on (a) May 15,2001, average wind velocity 1 m/sec, and (b) May 17, 2001, averagewind velocity 2.5 m/sec.
Zhu, Hinds, Kim, and Sioutas
1040 Journal of the Air & Waste Management Association Volume 52 September 2002
that coagulation played a significant role in vehicle-emit-ted ultrafine particle atmospheric transportation andtransformation. This observed result differs from modelpredictions by Shi et al.20 and Vignati et al.42 One rea-son is that the present study accurately measured freshlyemitted particles down to 6 nm, while the previousmodels usually assumed a much lower particle numberconcentration for particles smaller than 15 nm.20,42 Asshown in Figure 7, only particles in the smallest size
range coagulated with larger particle sizes. The numberconcentration of particles bigger than 100 nm did notchange significantly as distance from the freeway in-creased. Because the wind speed was considerably stron-ger on May 17 than on May 15, one would expect thatthe atmospheric dilution effect also would be stronger.Thus, it was not surprising to see that those shoulders inFigure 7b occurred farther from the freeway and were notas significant as those shown in Figure 7a.
Table 2. Measured average concentrations at increasing distances from the freeway.
Downwind Distance (m)Measurement 30 60 90 150 300
CO (ppm) 2.0 (1.7–2.2) 0.9 (0.7–1.0) 0.6 (0.5–0.7) 0.4 (0.3–0.5) 0.2 (0.1–0.3)BC (µg/m3) 5.4 (3.4–10.0) 3.2 (3.0–3.5) 2.5 (2.4–2.6) 1.6 (1.1–2.0) 1.3 (1.1–1.5)Number Concentration 1.5 (1.3–1.7) 0.88 (0.77–0.96) 0.70 (0.61–0.85) 0.50 (0.42–0.58) 0.37 (0.30–0.39)(× 10–5/cm3)Mass Concentration 49.0 (30.2–64.6) 48.0 (37.1–55.0) 47.5 (29.5–63.4) 46.9 (30.1–65.5) 46.5 (30.0–58.9)(µg/m3)
Note: Range given in parentheses.
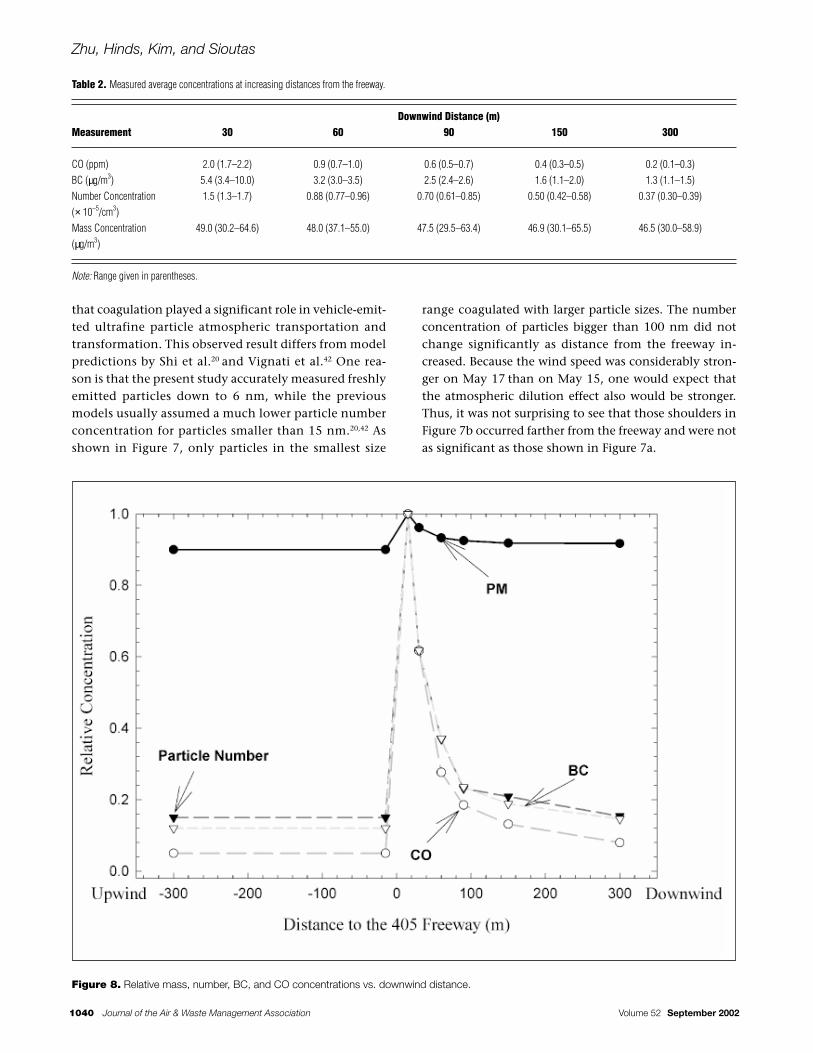
Figure 8. Relative mass, number, BC, and CO concentrations vs. downwind distance.
Zhu, Hinds, Kim, and Sioutas
Volume 52 September 2002 Journal of the Air & Waste Management Association 1041
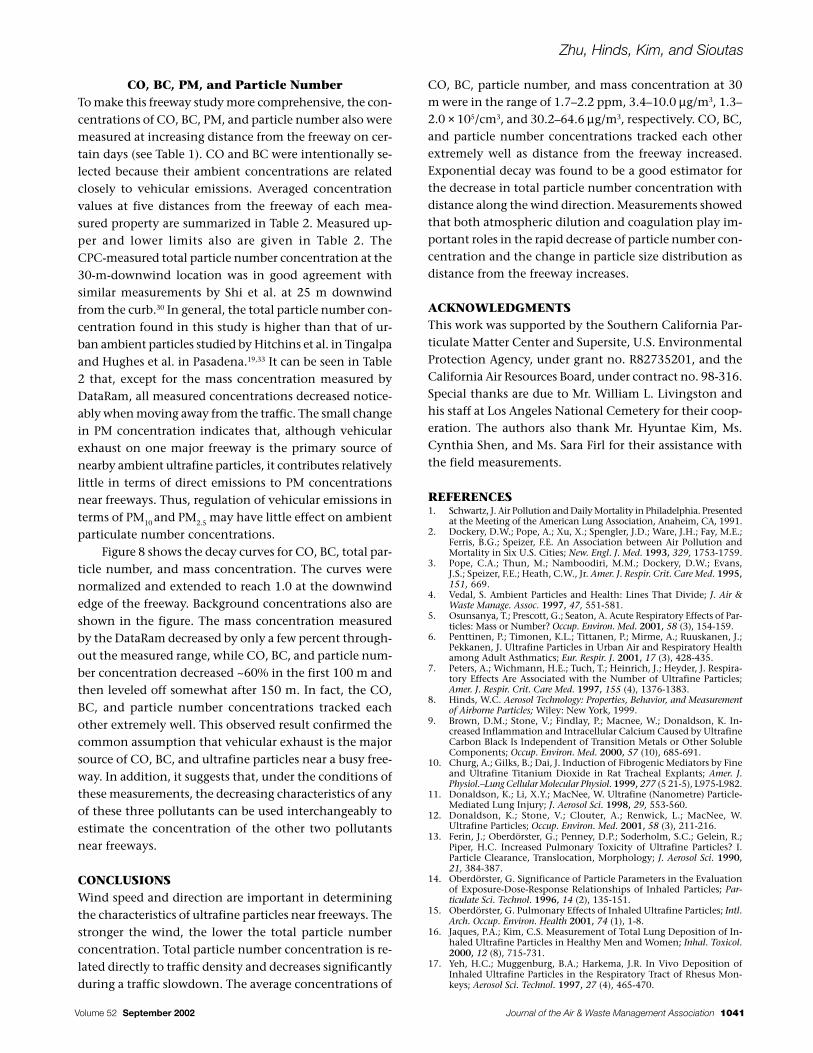
CO, BC, PM, and Particle NumberTo make this freeway study more comprehensive, the con-centrations of CO, BC, PM, and particle number also weremeasured at increasing distance from the freeway on cer-tain days (see Table 1). CO and BC were intentionally se-lected because their ambient concentrations are relatedclosely to vehicular emissions. Averaged concentrationvalues at five distances from the freeway of each mea-sured property are summarized in Table 2. Measured up-per and lower limits also are given in Table 2. TheCPC-measured total particle number concentration at the30-m-downwind location was in good agreement withsimilar measurements by Shi et al. at 25 m downwindfrom the curb.30 In general, the total particle number con-centration found in this study is higher than that of ur-ban ambient particles studied by Hitchins et al. in Tingalpaand Hughes et al. in Pasadena.19,33 It can be seen in Table2 that, except for the mass concentration measured byDataRam, all measured concentrations decreased notice-ably when moving away from the traffic. The small changein PM concentration indicates that, although vehicularexhaust on one major freeway is the primary source ofnearby ambient ultrafine particles, it contributes relativelylittle in terms of direct emissions to PM concentrationsnear freeways. Thus, regulation of vehicular emissions interms of PM10 and PM2.5 may have little effect on ambientparticulate number concentrations.
Figure 8 shows the decay curves for CO, BC, total par-ticle number, and mass concentration. The curves werenormalized and extended to reach 1.0 at the downwindedge of the freeway. Background concentrations also areshown in the figure. The mass concentration measuredby the DataRam decreased by only a few percent through-out the measured range, while CO, BC, and particle num-ber concentration decreased ~60% in the first 100 m andthen leveled off somewhat after 150 m. In fact, the CO,BC, and particle number concentrations tracked eachother extremely well. This observed result confirmed thecommon assumption that vehicular exhaust is the majorsource of CO, BC, and ultrafine particles near a busy free-way. In addition, it suggests that, under the conditions ofthese measurements, the decreasing characteristics of anyof these three pollutants can be used interchangeably toestimate the concentration of the other two pollutantsnear freeways.
CONCLUSIONSWind speed and direction are important in determiningthe characteristics of ultrafine particles near freeways. Thestronger the wind, the lower the total particle numberconcentration. Total particle number concentration is re-lated directly to traffic density and decreases significantlyduring a traffic slowdown. The average concentrations of
CO, BC, particle number, and mass concentration at 30m were in the range of 1.7–2.2 ppm, 3.4–10.0 µg/m3, 1.3–2.0 × 10⁵/cm3, and 30.2–64.6 µg/m3, respectively. CO, BC,and particle number concentrations tracked each otherextremely well as distance from the freeway increased.Exponential decay was found to be a good estimator forthe decrease in total particle number concentration withdistance along the wind direction. Measurements showedthat both atmospheric dilution and coagulation play im-portant roles in the rapid decrease of particle number con-centration and the change in particle size distribution asdistance from the freeway increases.
ACKNOWLEDGMENTSThis work was supported by the Southern California Par-ticulate Matter Center and Supersite, U.S. EnvironmentalProtection Agency, under grant no. R82735201, and theCalifornia Air Resources Board, under contract no. 98-316.Special thanks are due to Mr. William L. Livingston andhis staff at Los Angeles National Cemetery for their coop-eration. The authors also thank Mr. Hyuntae Kim, Ms.Cynthia Shen, and Ms. Sara Firl for their assistance withthe field measurements.
REFERENCES1. Schwartz, J. Air Pollution and Daily Mortality in Philadelphia. Presented
at the Meeting of the American Lung Association, Anaheim, CA, 1991.2. Dockery, D.W.; Pope, A.; Xu, X.; Spengler, J.D.; Ware, J.H.; Fay, M.E.;
Ferris, B.G.; Speizer, F.E. An Association between Air Pollution andMortality in Six U.S. Cities; New. Engl. J. Med. 1993, 329, 1753-1759.
3. Pope, C.A.; Thun, M.; Namboodiri, M.M.; Dockery, D.W.; Evans,J.S.; Speizer, F.E.; Heath, C.W., Jr. Amer. J. Respir. Crit. Care Med. 1995,151, 669.
4. Vedal, S. Ambient Particles and Health: Lines That Divide; J. Air &Waste Manage. Assoc. 1997, 47, 551-581.
5. Osunsanya, T.; Prescott, G.; Seaton, A. Acute Respiratory Effects of Par-ticles: Mass or Number? Occup. Environ. Med. 2001, 58 (3), 154-159.
6. Penttinen, P.; Timonen, K.L.; Tittanen, P.; Mirme, A.; Ruuskanen, J.;Pekkanen, J. Ultrafine Particles in Urban Air and Respiratory Healthamong Adult Asthmatics; Eur. Respir. J. 2001, 17 (3), 428-435.
7. Peters, A.; Wichmann, H.E.; Tuch, T.; Heinrich, J.; Heyder, J. Respira-tory Effects Are Associated with the Number of Ultrafine Particles;Amer. J. Respir. Crit. Care Med. 1997, 155 (4), 1376-1383.
8. Hinds, W.C. Aerosol Technology: Properties, Behavior, and Measurementof Airborne Particles; Wiley: New York, 1999.
9. Brown, D.M.; Stone, V.; Findlay, P.; Macnee, W.; Donaldson, K. In-creased Inflammation and Intracellular Calcium Caused by UltrafineCarbon Black Is Independent of Transition Metals or Other SolubleComponents; Occup. Environ. Med. 2000, 57 (10), 685-691.
10. Churg, A.; Gilks, B.; Dai, J. Induction of Fibrogenic Mediators by Fineand Ultrafine Titanium Dioxide in Rat Tracheal Explants; Amer. J.Physiol.–Lung Cellular Molecular Physiol. 1999, 277 (5 21-5), L975-L982.
11. Donaldson, K.; Li, X.Y.; MacNee, W. Ultrafine (Nanometre) Particle-Mediated Lung Injury; J. Aerosol Sci. 1998, 29, 553-560.
12. Donaldson, K.; Stone, V.; Clouter, A.; Renwick, L.; MacNee, W.Ultrafine Particles; Occup. Environ. Med. 2001, 58 (3), 211-216.
13. Ferin, J.; Oberdörster, G.; Penney, D.P.; Soderholm, S.C.; Gelein, R.;Piper, H.C. Increased Pulmonary Toxicity of Ultrafine Particles? I.Particle Clearance, Translocation, Morphology; J. Aerosol Sci. 1990,21, 384-387.
14. Oberdörster, G. Significance of Particle Parameters in the Evaluationof Exposure-Dose-Response Relationships of Inhaled Particles; Par-ticulate Sci. Technol. 1996, 14 (2), 135-151.
15. Oberdörster, G. Pulmonary Effects of Inhaled Ultrafine Particles; Intl.Arch. Occup. Environ. Health 2001, 74 (1), 1-8.
16. Jaques, P.A.; Kim, C.S. Measurement of Total Lung Deposition of In-haled Ultrafine Particles in Healthy Men and Women; Inhal. Toxicol.2000, 12 (8), 715-731.
17. Yeh, H.C.; Muggenburg, B.A.; Harkema, J.R. In Vivo Deposition ofInhaled Ultrafine Particles in the Respiratory Tract of Rhesus Mon-keys; Aerosol Sci. Technol. 1997, 27 (4), 465-470.
Zhu, Hinds, Kim, and Sioutas
1042 Journal of the Air & Waste Management Association Volume 52 September 2002
18. Morawska, L.; Thomas, S.; Bofinger, N.D.; Wainwright, D.; Neale, D.Comprehensive Characterisation of Aerosols in a Subtropical UrbanAtmosphere: Particle Size Distribution and Correlation with GaseousPollutants; Atmos. Environ. 1998, 32, 2461-2478.
19. Hitchins, J.; Morawska, L.; Wolff, R.; Gilbert, D. Concentrations ofSubmicrometre Particles from Vehicle Emissions Near a Major Road;Atmos. Environ. 2000, 34, 51-59.
20. Shi, J.P.; Khan, A.A.; Harrison, R.M. Measurements of Ultrafine Par-ticle Concentration and Size Distribution in the Urban Atmosphere;Sci. Total Environ. 1999, 235, 51-64.
21. Clairborn, C.; Mitra, A.; Adams, G.; Bamesberger, L.; Allwine, G.;Kantanmaneni, R.; Lamn, B.; Westberg, H. Evaluation of PM10 Emis-sion Rates from Paved and Unpaved Roads Using Tracer Technique;Atmos. Environ. 1995, 29, 1075-1089.
22. Janssen, N.; Vanmansom, D.; Vanderjagt, K.; Harssema, H.; Hoek, G.Mass Concentration and Elemental Composition of Airborne Par-ticulate Matter at Street and Background Locations; Atmos. Environ.1997, 31, 1185-1193.
23. Kuhler, M.; Kraft, J.; Bess, H.; Heeren, U.; Schurmann, D. Compari-son between Measured and Calculated Concentrations of NitrogenOxides and Ozone in the Vicinity of a Motorway; Sci. Total Environ.1994, 147, 387-394.
24. Roorda-Knape, M.; Janssen, N.; De Harthog, J.; VanVliet, P.; Harssema,H.; Brunekreef, B. Air Pollution from Traffic in City Districts NearMajor Motorways; Atmos. Environ. 1998, 32, 1921-1930.
25. Williams, I.D.; McCrae, I.S. Road Traffic Nuisance in Residential andCommercial Area; Sci. Total Environ. 1995, 169, 75-82.
26. Wrobel, A.; Rokita, E.; Maenhaut, W. Transport of Traffic-Related Aero-sols in Urban Areas; Sci. Total Environ. 2000, 257, 199-211.
27. Morawska, L.; Bofinger, N.D.; Kocis, L.; Nwankwoala, A.Submicrometer and Supermicrometer Particles from Diesel VehicleEmissions; Environ. Sci. Technol. 1998, 32, 2033-2042.
28. Ristovski, Z.D.; Morawska, L.; Bofinger, N.D.; Hitchins, J.Submicrometer and Supermicrometer Particles from Spark IgnitionVehicles; Environ. Sci. Technol. 1998, 32, 3845-3852.
29. Morawska, L.; Thomas, S.; Gilbert, D.; Greenaway, C.; Rijnders, E. AStudy of the Horizontal and Vertical Profile of Submicrometer Particlesin Relation to a Busy Road; Atmos. Environ. 1999, 33, 1261-1274.
30. Shi, J.P.; Evans, D.E.; Khan, A.A.; Harrison, R.M. Source and Concen-tration of Nanoparticles (<10 nm diameter) in the Urban Atmosphere;Atmos. Environ. 2001, 35, 1193-1202.
31. Dzubay, T.G.; Stevens, R.K.; Richards, L.W. Composition of Aerosolsover Los Angeles Freeways; Atmos. Environ. 1979, 13, 653-659.
32. Whitby, K.T.; Clark, W.E.; Marple, V.A.; et al. Characterization of Cali-fornia Aerosols. I. Size Distribution of Freeway Aerosol; Atmos. Environ.1975, 9, 463-482.
33. Hughes, L.S.; Cass, G.R.; Gone, J.; Ames, M.; Olmez, I. Physical andChemical Characterization of Atmospheric Ultrafine Particles in theLos Angeles Area; Environ. Sci. Technol. 1998, 32, 1153-1161.
About the AuthorsYifang Zhu is a doctoral candidate and William C. Hinds,Sc.D., is a professor, both at the Department of Environ-mental Health Sciences at the University of California, LosAngeles. Seongheon Kim, Ph.D., is a research professor atthe School of Earth and Environmental Sciences, SeoulNational University, Seoul, Korea. Constantinos Sioutas,Sc.D., is an associate professor in the Department of Civiland Environmental Engineering at the University of South-ern California. Address correspondence to Dr. Hinds, Uni-versity of California, Los Angeles, Department of Environ-mental Health Sciences, 650 Charles E. Young Dr. South,Los Angeles, CA 90095; e-mail: [email protected].
34. Bagley, S.T.; Baumgard, K.J.; Gratz, L.D.; Johnson, J.H.; Leddy, D.G. Char-acterization of Fuel and Aftertreatment Device Effects on Diesel Emission;Technical Report 76; Health Effects Institute: Cambridge, MA, 1996.
35. Baumgard, K.J.; Johnson, J.H. The Effect of Fuel and Engine Designon Diesel Exhaust Particle Size Distributions; SAE Technical PaperSeries 960131; Society of Automotive Engineers: Warrendale, PA, 1996.
36. Kittelson, D.B. Engines and Nanoparticles: A Review; J. Aerosol Sci.1998, 29, 575-588.
37. Kittelson, D.B.; Watts, W.F.; Johnson, J.P. Fine Particle (Nanoparticle)Emissions on Minnesota Highways; Final Report, Minnesota Depart-ment of Transportation, 2001.
38. Whitby, K.T. The Physical Characteristics of Sulfur Aerosols; Atmos.Environ. 1978, 12, 135-159.
39. Hoppel, W.A.; Frick, G.M.; Fitzgerald, J.W.; Larson, R.E. Marine Bound-ary Layer Measurements of New Particle Formation and the EffectsNonprecipitating Clouds Have on Aerosol Size Distribution; J. Geophys.Res. 1994, 99, 14443-14459.
40. Makela, J.M.; Koponen, I.K.; Aalto, P.; Kulmala, M. One-Year Data ofSubmicron Size Modes of Tropospheric Background Aerosol in South-ern Finland; J. Aerosol Sci. 2000, 31, 595-611.
41. Manual of SigmaPlot 2000 for Windows Version 6.0; SPSS Inc.: 2000.42. Vignati, E.; Berkowicz, R.; Palmgren, F.; Lyck, E.; Hummelshoj, P. Trans-
formation of Size Distributions of Emitted Particles in Streets; Sci.Total Environ. 1999, 235, 37-49.
Copyright © 2022 FDOKUMEN