On-road ultrafine particle concentration in the M5 East road tunnel, Sydney, Australia
39
QUT Digital Repository: http://eprints.qut.edu.au/27536 Knibbs, Luke D. and deDear, Richard and Mengersen, Kerrie and Morawska, Lidia (2009) On-road ultrafine particle concentration in the M5 East road tunnel, Sydney, Australia. Atmospheric Environment, 43(22-23). pp. 3510-3519. © Copyright 2009 Elsevier.
-
Upload
independent -
Category
Documents
-
view
1 -
download
0
Transcript of On-road ultrafine particle concentration in the M5 East road tunnel, Sydney, Australia
QUT Digital Repository: http://eprints.qut.edu.au/27536
Knibbs, Luke D. and deDear, Richard and Mengersen, Kerrie and Morawska, Lidia (2009) On-road ultrafine particle concentration in the M5 East road tunnel, Sydney, Australia. Atmospheric Environment, 43(22-23). pp. 3510-3519.
© Copyright 2009 Elsevier.
halla
Rectangle
halla
Rectangle
On-road ultrafine particle concentration in the M5 East road tunnel, Sydney, 1
Australia 2
3
Luke D. Knibbsa*, Richard J. de Deara, Lidia Morawskab and Kerrie L. 4
Mengersenc 5
6
a Division of Environmental and Life Sciences, Macquarie University, Sydney, 7
New South Wales, Australia 8
b International Laboratory for Air Quality and Health, Queensland University of 9
Technology, Brisbane, Queensland, Australia 10
c School of Mathematical Sciences, Queensland University of Technology, 11
Brisbane, Queensland, Australia 12
13
* Corresponding author: 14
Email: [email protected] 15
Postal address: Division of Environmental and Life Sciences, Macquarie 16
University, Sydney, New South Wales, 2109, Australia 17
Phone: 61 2 9850 9612, Fax: 61 2 9850 8420 18
19
KEYWORDS 20
21
On-road, tunnel, ultrafine particles, diesel, measurement 22
23

ABSTRACT 24
25
The human health effects following exposure to ultrafine (<100nm) particles 26
(UFPs) produced by fuel combustion, while not completely understood, are 27
generally regarded as detrimental. Road tunnels have emerged as locations 28
where maximum exposure to these particles may occur for the vehicle occupants 29
using them. This study aimed to quantify and investigate the determinants of 30
UFP concentrations in the 4km twin-bore (eastbound and westbound) M5 East 31
tunnel in Sydney, Australia. Sampling was undertaken using a condensation 32
particle counter (CPC) mounted in a vehicle traversing both tunnel bores at 33
various times of day from May through July, 2006. Supplementary 34
measurements were conducted in February, 2008. Over three hundred transects 35
of the tunnel were performed, and these were distributed evenly between the 36
bores. Additional comparative measurements were conducted on a mixed route 37
comprising major roads and shorter tunnels, all within Sydney. Individual trip 38
average UFP concentrations in the M5 East tunnel bores ranged from 5.53 × 10⁴ 39
p cm-3 to 5.95 × 10⁶ p cm-3. Data were sorted by hour of capture, and hourly 40
median trip average (HMA) UFP concentrations ranged from 7.81 × 10⁴ p cm-3 to 41
1.73 × 10⁶ p cm-3. Hourly median UFP concentrations measured on the mixed 42
route were between 3.71 × 10⁴ p cm-3 and 1.55 × 10⁵ p cm-3. Hourly heavy diesel 43
vehicle (HDV) traffic volume was a very good determinant of UFP concentration 44
in the eastbound tunnel bore (R2 = 0.87), but much less so in the westbound bore 45
(R2 = 0.26). In both bores, the volume of passenger vehicles (i.e. unleaded 46

gasoline-powered vehicles) was a significantly poorer determinant of particle 47
concentration. When compared with similar studies reported previously, the 48
measurements described here were among the highest recorded concentrations, 49
which further highlights the contribution road tunnels may make to the overall 50
UFP exposure of vehicle occupants. 51
52
1. INTRODUCTION 53
54
The range and implications of human health effects following exposure to 55
vehicular combustion-generated ultrafine (<100 nm) particles (UFPs) and 56
nanoparticles (<50 nm) remain to be fully elucidated, although they are typically 57
regarded as being deleterious. Whilst UFPs are the dominant constituent in 58
terms of total particle number in many locations, and exposures of varying 59
magnitude are ubiquitous, the roadway and tunnel environments present a 60
location where maximum exposures to UFPs may occur (see Gouriou et al., 61
2004; Westerdahl et al., 2005; Zhu et al., 2007; Fruin et al., 2008; Morawska et 62
al., 2008). Tunnels are an increasingly necessary infrastructure component in 63
many cities, and tunnel advance in Australia for civil purposes was predicted to 64
be 20 km y-1 from 2006 onwards (Day and Robertson, 2004). The health 65
significance of road tunnel exposures has been described by Svartengren et al. 66
(2000) and Larsson et al. (2007), who reported undesirable respiratory effects 67
following road tunnel air exposure in asthmatic and healthy test subjects, 68
respectively. Additionally, Mills et al. (2007) described negative cardiovascular 69

implications that could provide a mechanism for acute myocardial infarction in 70
subjects with existing heart complaints following exposure to UFP concentrations 71
typical of those encountered in tunnels. 72
73
Geller et al. (2005) reported elemental and organic carbon as the major 74
constituent species of UFPs emitted in tunnels featuring mixed gasoline and 75
diesel traffic. The same study reported that approximately 80% of particle 76
number was less than 40nm in diameter, with a peak at 15-20nm. The size 77
distribution of particles measured at the exit of a tunnel with diesel bus traffic only 78
was reported by Jamriska et al. (2004) to peak at 20-40nm, with a minor 79
secondary peak of accumulation mode particles at 100nm. 80
81
A number of studies focussed on vehicle-based quantification of on-road UFP 82
concentration, amongst other pollutants, have appeared in the literature in recent 83
years (Gouriou et al., 2004; Kittelson et al., 2004a; Kittelson et al., 2004b; Pirjola 84
et al., 2004; Weijers et al., 2004; Westerdahl et al., 2005; Zhu et al., 2007), as 85
equipment suitable for this challenging measurement environment has become 86
more readily available. This has led to the development of some advanced 87
mobile laboratories aimed at comprehensive assessment of on-road pollution. 88
Some well-documented examples have been described by Bukowiecki et al. 89
(2002), Kittelson et al. (2004a), Pirjola et al. (2004) and Westerdahl et al. (2005). 90
The mobile laboratory approach has been recently extended to incorporate an 91
exposure enclosure inside a van (Zhu et al., 2008), which affords the ability to 92

conduct on-road investigations of human subject health responses to 93
concentrations of UFPs and other pollutants representative of those encountered 94
by many vehicle occupants. 95
96
Given the emerging significance of road tunnel UFP exposure, this study aimed 97
to quantify on-road particle concentration in the M5 East road tunnel located in 98
Sydney, Australia, and relate these measurements to traffic volume and fleet 99
composition. The tunnel in question had been studied previously with a focus on 100
in-vehicle concentrations of gaseous pollutants and PM2.5 and in-tunnel 101
concentrations of gaseous pollutants (South Eastern Sydney Public Health Unit 102
and NSW Department of Health, 2003). The primary goal of this work was to 103
improve knowledge regarding the role of vehicle fleet volume and composition in 104
determining on-road UFP pollution in the M5 East tunnel, in order to better 105
understand potential exposures of its users, and fortify the prior work described 106
above. We sought to develop a sampling methodology to accomplish this, and 107
supplement the existing data on vehicle-based UFP sampling in tunnels, which is 108
somewhat limited in comparison to vehicle-based measurements on above-109
ground roadways and fixed-site measurement studies conducted in tunnels (such 110
as Kirchstetter et al., 1999; Abu-Allaban et al., 2002; Jamriska et al., 2004; 111
Kristensson et al., 2004; Geller et al., 2005, Imhof et al., 2006 and Lechowicz et 112
al., 2008). Vehicle-based on-road sampling has the ability to collect data that 113
represent UFP concentrations challenging the protection mechanisms (air 114
tightness, filtration capability, penetration characteristics) afforded by vehicles to 115
their occupants. This is not as easily accomplished during static sampling, which 116
is more suited to development of emission factors. Finally, we aimed to place the 117
measurements into context via comparison with measurements reported in 118
analogous studies, in addition to those reported for a range of other 119
environments, as well measurements performed on a local (Sydney) mixed roads 120
route. 121
122
2. METHODS 123
124
2.1 Sampling location 125
126
To fulfil the primary and additional aims of this study, two measurement roadway 127
environments were selected; the M5 East tunnel in Sydney, Australia and a 128
mixed route that commenced close to the tunnel site. The M5 East road tunnel 129
has been in operation since December 2001, and consists of two unidirectional 130
bores, each comprising two lanes. Maximum permitted vehicle speed during 131
normal conditions is 80 km h-1. The tunnel is used by approximately 93 000 132
vehicles per day, about 7% of which are heavy diesel vehicles (HDVs). The 133
tunnel is 4 km long, and reaches a maximum gradient of 1:12 at its eastern end, 134
proximate to the eastbound bore exit and westbound bore entry (NSW RTA, 135
2008a). Longitudinal ventilation is provided by 131 jet fans (NSW RTA, 2008a). 136
Air is extracted approximately 1/3 of the way along the westbound bore and 2/3 137
of the way along the eastbound bore, and exhausted through a nearby stack. 138
Fresh air is delivered into each bore slightly downstream of the extraction point. 139

At the exit portal of each bore, air is drawn via cross-shafts and diluted, before 140
being delivered to the entry portal of the other bore (Child and Associates, 2004; 141
NSW RTA, 2008a). Vehicles using the tunnel are not subject to a toll. 142
143
Although the construction of a tunnel air filtration plant is currently underway, no 144
such system was present during our measurements conducted from May to July, 145
2006. Supplemental measurements were performed in February, 2008. During 146
the main measurement campaign, 119 jet fans were present in the tunnel, whilst 147
during the supplemental campaign, an additional 12 fans had been installed 148
(NSW RTA, 2008a). 149
150
Additional measurements were conducted on a mixed route, the majority of which 151
consisted of Southern Cross Drive, which was characterised by an average 152
annual daily traffic volume of approximately 128 000 in 2005 (NSW RTA, 2008b). 153
A combination of major roads, toll roads and shorter tunnels were present on the 154
route, including the 2.3 km twin bore Sydney Harbour Tunnel, which carried 86 155
800 vehicles per day in 2005 (NSW RTA, 2008c). 156
157
2.2 Measurements 158
159
A TSI 3007 condensation particle counter (CPC) mounted in a research vehicle 160
was used to measure particle concentration. The manufacturer-stated particle 161
size measurement range of the unit is 10nm (50% detection threshold) to 162

>1000nm, with ± 20% accuracy and a response time of <9 s for 95% response 163
(TSI, 2004). The CPC was zero count checked prior to each use, and its 164
sampling interval set to 1 s. Pilot tests conducted in the tunnel showed the 165
maximum detectable concentration of the unit, 1.0 ×10⁵ particles per cm-3 (p cm-166
3), was often exceeded shortly after tunnel entry. A simple dilution system was 167
developed which allowed the unit to function at concentrations of combustion-168
derived particles up to 8.5 ×10⁶ p cm-3 (described in detail in Knibbs et al., 2007). 169
The CPC was placed on a raised stand designed to reduce vibration and the tilt 170
effects associated with traversing a roadway incline or decline, and mounted on 171
the passenger seat of a research vehicle. All research vehicles were powered by 172
unleaded petrol and were in very good mechanical condition. None exhibited any 173
signs of exhaust leakage or other sources of self-pollution that could potentially 174
bias the measurements. 175
176
To minimise the length of tubing required and associated sample residence time, 177
air samples were taken at the junction of the windscreen base and the rear edge 178
of the hood, which was about 1 to 1.5m above road height depending on the 179
research vehicle used. Samples were transported to the CPC via Tygon® R-180
3603 tubing. Tubing length from the sample point to the CPC inlet ranged from 181
0.75 to 1.1m for the research vehicles. Tubing was passed through a small gap 182
in the front passenger side window, which was then sealed. No attempt was 183
made to establish isokinetic sampling conditions despite the moving sampling 184
platform, due to the small size of particles being sampled (Morawska and 185

Salthammer, 2003). An automated Y-type pinch valve fitted with conductive 186
tubing was included in the sampling train, to permit alternate measurement of 187
outdoor and in-vehicle concentrations. However, the work described here is 188
focussed on the outdoor measurements only. As such, the measurements 189
presented are based on transient snapshot measurements of particle 190
concentration inside the tunnel. The valve operation interval was 20 or 25 s, 191
depending on the length of tubing required. The final 10 s of data in each sample 192
block were used for analyses, to account for sample clearance time which ranged 193
from 9-13 s due to the flow partitioning required to achieve sufficient dilution. An 194
overall correction factor for particle loss to the entire sampling train (tubing, 195
connectors, pinch valve and dilution system) was determined experimentally in a 196
test chamber, using 4 stroke spark combustion of standard unleaded gasoline 197
from a warm engine as the pollutant source. A TSI 3022A CPC with a maximum 198
concentration detection limit of 107 p cm-3 and minimum size detection threshold 199
of 7nm was used as the reference instrument during these tests, and the 200
maximum concentration detected by the TSI 3007 CPC was approximately 8.9 × 201
106 p cm-3. Although the specifications of the TSI 3007 CPC define it primarily as 202
an instrument for the measurement of submicrometer particles (<1000nm), due 203
to fuel combustion representing the major pollution source in the study location, 204
the use of UFPs as a descriptor for the measurements described here seems 205
warranted. 206
207

Temperature and relative humidity outside and inside of the vehicles was 208
measured by a set of calibrated dry (temp) and aspirated wet (RH) thermistors, or 209
in later tests, Vaisala HMP45A probes, all of which were sited in such that they 210
were not exposed to direct sunlight. Comments made by the investigator during 211
data collection were recorded to enable retrospective production of field notes. 212
Measurements were performed at varying times on from 02:00 to 00:00 h to 213
include a range of traffic conditions. Measurements were conducted primarily on 214
weekdays, although a small number were taken on weekends. Sampling trips 215
were distributed evenly between the two tunnel bores, and 306 tunnel trips were 216
completed in total. Forty one of these trips were completed during the 217
supplemental measurement campaign, with the remainder performed during the 218
main campaign. Each sampling exercise typically comprised 5 transects of each 219
bore. Additional measurements conducted on the mixed route were generally 220
performed after the conclusion of tunnel sampling. Sampling exercises were not 221
conducted during rain. 222
223
Traffic data were obtained from the New South Wales Roads and Traffic 224
Authority. Due to the unavailability of traffic data coinciding with the main 225
sampling period, traffic data from 2007 comprising hourly volume measurements 226
collected over the year were used as a surrogate. Annual average daily traffic 227
volume at the main study location exhibits minimal variation between years (New 228
South Wales Roads and Traffic Authority, 2008; personal communication). 229
Hourly traffic averages were computed for each tunnel bore based on 2007 230
volume data. As volume data were not available for all vehicle classes, heavy 231
vehicle volume (which included a range of vehicles from two axle light rigid trucks 232
to 7+ axle trucks) was determined by subtracting passenger vehicle volume from 233
overall vehicle volume. As the resultant measure was not tantamount to diesel-234
powered vehicles, the data were modified based on the 2006 Australian Motor 235
Vehicle Census (ABS, 2006), which reported that 73.9% of non-freight carrying 236
trucks, 76.7% of buses, 84.3% of light rigid trucks, 89.3% of heavy rigid trucks 237
and 97.7% of articulated trucks registered in Australia were diesel-powered. 238
Accordingly, hourly heavy vehicle counts were multiplied by the average of these 239
values (84.4%) to generate an estimated hourly heavy diesel vehicle (HDV) 240
count. No changes were made to passenger vehicle counts, as approximately 241
95% of the Australian passenger vehicle fleet operated on unleaded or 242
supplemented unleaded (lead replacement) fuel in 2006 (ABS, 2006). 243
244
2.3 Analyses 245
246
Individual trip average particle concentration measurements were split into 24 247
subsets, depending on hour of tunnel entry. Data collected during both the 248
primary and supplementary measurement campaigns were combined. 249
Temperature differences between the two campaigns for a given hour of day 250
were relatively small (see Section 3.1). Data collected on the mixed road and 251
tunnel route were processed similarly, although trip averages were not 252
calculated. Rather, the data captured on the mixed route were grouped 253

according to the hour during which they were collected and used to produce 254
descriptive statistics. As the in-tunnel data were skewed, the hourly median trip 255
average (HMA) UFP concentration was selected as the variable of choice. 256
Simple linear regression was applied to assess the relationship between the 257
hourly volume of passenger and HDVs and HMA particle concentration in each 258
bore. Regression was also used to examine the influence of average hourly 259
vehicle speed on HMA particle concentration in each bore. Following regression 260
analyses, the distributions of residuals were assessed for approximate normality 261
and homogeneity of variance. Student’s t-tests assuming unequal variance were 262
used throughout the analyses, appealing to the Central Limit Theorem for 263
robustness of this procedure. In all cases, the 5% level was used as an indicator 264
of statistical significance. Each pair of regression slopes were assessed for 265
significant differences. Data for each of the four scenarios (eastbound HDV vs. 266
westbound HDV, eastbound passenger vehicles vs. westbound passenger 267
vehicles, eastbound HDV vs. eastbound passenger vehicles, westbound HDV vs. 268
westbound passenger vehicles) were then grouped to assess if one combined 269
slope would better estimate HMA particle concentration compared to separate 270
slopes. To facilitate valid comparisons, HMA particle concentrations for each 271
bore and hourly median measures from the mixed roads route were log-272
transformed, resulting in close to linear normal scores plots. F-tests for variance 273
were then employed prior to the application of an appropriate student’s t-test. 274
275
3. RESULTS AND DISCUSSION 276

277
3.1 General 278
279
Of the 306 trips through the tunnel, successful data capture was achieved for 301 280
(98.4%) of these. This encompassed 1204 km and 21.25 h of tunnel travel. 281
Trips were distributed evenly between the eastbound (n = 150) and westbound (n 282
= 151) bores in terms of number, however, 8.5 h was spent in the eastbound 283
bore and 12.75 h was spent in the westbound bore. The longest trip time 284
recorded during sampling was 26m 23s, which occurred in the westbound bore 285
during heavy traffic following a vehicle breakdown. The average trip duration 286
when travelling through the eastbound bore was 3m 22s (average speed = 71 km 287
h-1), while the equivalent for westbound travel was 5m 7s (average speed = 47 288
km h-1). Data collection on the mixed roads route comprised approximately 5.5 289
hours of travel. 290
291
Measurements indicated that the temperature inside the tunnel during the main 292
sampling campaign (Australian winter) ranged from approximately 13°C, during 293
late night and early morning measurements, to 22°C during daytime 294
measurements. Relative humidity varied between 35 and 82%. The 295
supplemental measurement exercises were performed in the Australian summer, 296
when in-tunnel temperatures ranged from 19 to 29°C, with a humidity range 297
similar to that recorded during the main sampling period. Outside temperature on 298
the mixed road route was generally 2-4°C lower than the in-tunnel temperature 299

for a given season. In-vehicle temperatures were generally not substantially 300
different from outdoor temperature. Dilution air was therefore supplied at 301
temperatures similar to that of sample air, and the effect of thermophoretic 302
particle loss or condensation in the sampling line as it entered the vehicle cabin is 303
unlikely to have influenced the results. Eighty seven one second data points 304
exceeded the upper limit of the empirical particle loss correction factor 305
(approximately 8.9 × 10⁶ p cm-3). These data points were not discarded, 306
although their value was set to the system’s measurement limit. 307
308
3.2 UFP concentration in the tunnel bores 309
310
Figs. 1 and 2 provide box plots based on trip average particle concentration for 311
the eastbound and westbound tunnel bores, respectively. The peak trip average 312
recorded in the eastbound bore of 5.05 × 10⁶ p cm-3 (s.d. = 3.77 × 10⁶ p cm-3) 313
occurred between 15:00 and 16:00, while the minimum trip average of 5.53 × 10⁴ 314
p cm-3 (s.d. = 2.10 × 10⁴ p cm-3) was measured between 22:00 and 23:00. The 315
respective trip average maximum and minimum measures in the westbound bore 316
were 5.95 × 10⁶ p cm-3 (s.d. = 2.71 × 10⁶ p cm-3) between 13:00 and 14:00, and 317
6.59 × 10⁴ p cm-3 (s.d = 1.43 × 10⁴ p cm-3) between 21:00 and 22:00. Evidently, 318
the range of trip average measures in both bores comprised two orders of 319
magnitude. HMA particle concentration values in the eastbound bore ranged 320
from 9.04 × 10⁴ p cm-3 between 02:00 and 03:00, to 9.06 × 10⁵ p cm-3 between 321
08:00 and 09:00. In the westbound bore HMA concentration ranged from 7.81 × 322

104 p cm-3 between 02:00 and 03:00, to 1.73 × 10⁶ p cm-3 between 09:00 and 323
10:00. Average HMA concentration in the eastbound bore was 3.43 × 10⁵ p cm-3, 324
whilst the corresponding figure in the westbound bore was 3.98 × 10⁵ p cm-3. 325
326
1.0E+04
1.0E+05
1.0E+06
1.0E+07
00:0
0
01:0
0
02:0
0
03:0
0
04:0
0
05:0
0
06:0
0
07:0
0
08:0
0
09:0
0
10:0
0
11:0
0
12:0
0
13:0
0
14:0
0
15:0
0
16:0
0
17:0
0
18:0
0
19:0
0
20:0
0
21:0
0
22:0
0
23:0
0
Time
Tu
nn
el t
rip
ave
rag
e p
arti
cle
con
cen
trat
ion
(p
cm
-3)
1.0E+01
1.0E+02
1.0E+03
1.0E+04
Veh
icle
s h
-1
Passenger vehicles
Heavy diesel vehicles
327
Figure 1 – Trip average on-road UFP concentration by hour of tunnel entry and hourly passenger 328
and heavy diesel traffic volume in the eastbound bore, based on 150 individual trips. Box-and-329
whisker plots indicate median (thick horizontal line), average (diamond), first and third quartile 330
(bottom and top edge of box, respectively), minimum and maximum (lower and upper extent of 331
whiskers, respectively) trip average UFP concentration. 332

1.0E+04
1.0E+05
1.0E+06
1.0E+07
00:0
0
01:0
0
02:0
0
03:0
0
04:0
0
05:0
0
06:0
0
07:0
0
08:0
0
09:0
0
10:0
0
11:0
0
12:0
0
13:0
0
14:0
0
15:0
0
16:0
0
17:0
0
18:0
0
19:0
0
20:0
0
21:0
0
22:0
0
23:0
0
Time
Tu
nn
el t
rip
ave
rag
e p
arti
cle
con
cen
trat
ion
(p
cm
-3)
1.0E+01
1.0E+02
1.0E+03
1.0E+04
Veh
icle
s h
-1
Passenger vehicles
Heavy diesel vehicles
333
Figure 2 – Trip average on-road UFP concentration by hour of tunnel entry and hourly passenger 334
and heavy diesel traffic volume in the westbound bore, based on 151 individual trips. Box-and-335
whisker plots indicate median (thick horizontal line), average (diamond), first and third quartile 336
(bottom and top edge of box, respectively), minimum and maximum (lower and upper extent of 337
whiskers, respectively) trip average UFP concentration. 338
339
Results of the various statistical tests applied to the data are summarised in table 340
1. In three of four cases, the positive gradient of the linear regression model 341
fitted to the relationship between hourly vehicle volume and HMA particle 342
concentration was significantly different from zero. The exception to this was the 343
relationship between passenger vehicle volume and HMA particle concentration 344
in the westbound bore, indicating that passenger vehicles were not a significant 345
determinant of UFP particle concentration in this bore. HDV volume in the 346
westbound bore exhibited a significantly different influence on HMA particle 347
concentration compared to passenger vehicle volume (p = 0.0238). However, 348
although significant (p = 0.0256), the strength of HDV influence of HMA particle 349
concentration was not as substantial as might be expected (R2 = 0.26). 350
Conversely, HDV volume in the eastbound bore was a highly significant (p < 351
0.0001) determinant of HMA particle concentration (R2 = 0.87), although no 352
significant difference existed between bores in the influence of HDVs (p = 353
0.7919). Similar to the westbound bore, passenger vehicles in the eastbound 354
bore also exhibited a significantly weaker influence on HMA particle 355
concentration compared to HDVs (p < 0.0001). Comparison across both bores 356
indicated no significant difference in the influence of passenger vehicle volume 357
on HMA particle concentration (p = 0.9312). No significant difference existed 358
between bores in the log-transformed HMA particle concentration (p = 0.7620). 359
As shown in table 1, combining data from both bores for a given vehicle type, and 360
combining both vehicle types for a given bore both resulted in reduced predictive 361
ability compared to a single predictor in most cases, and accordingly justified the 362
use of the latter. 363
364
365
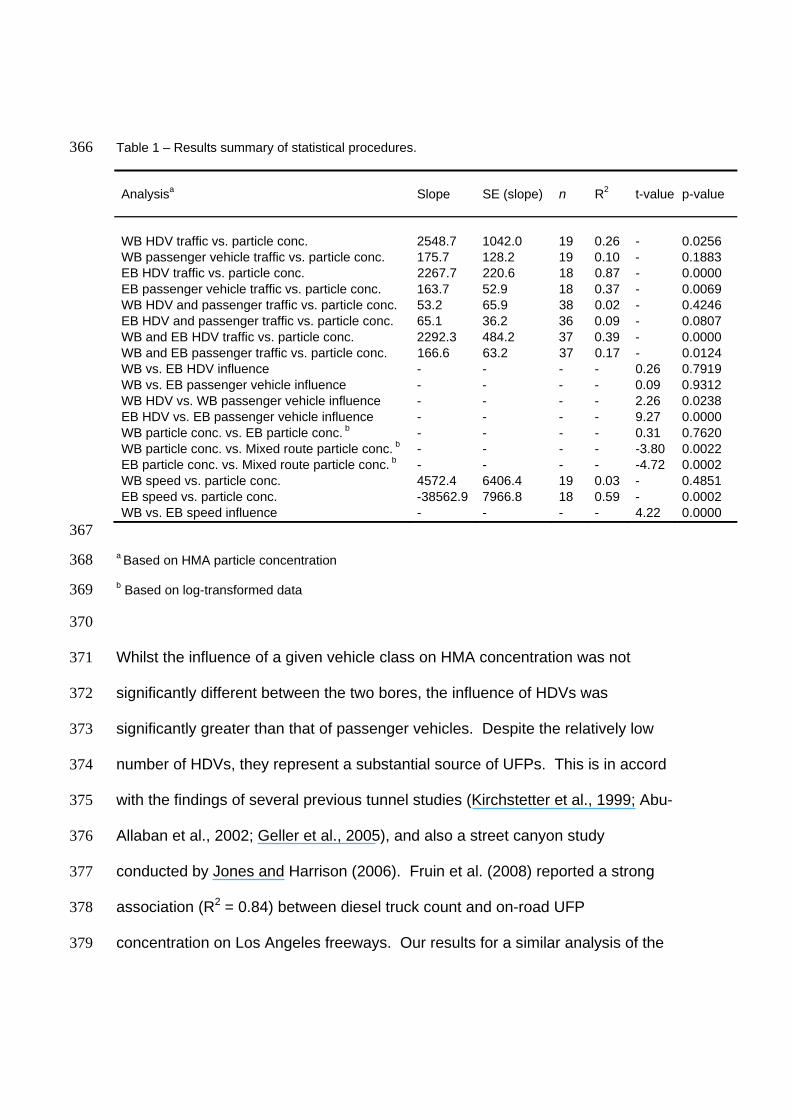
Table 1 – Results summary of statistical procedures. 366
Analysisa
Slope
SE (slope)
n
R2
t-value
p-value
WB HDV traffic vs. particle conc. 2548.7 1042.0 19 0.26 - 0.0256 WB passenger vehicle traffic vs. particle conc. 175.7 128.2 19 0.10 - 0.1883 EB HDV traffic vs. particle conc. 2267.7 220.6 18 0.87 - 0.0000 EB passenger vehicle traffic vs. particle conc. 163.7 52.9 18 0.37 - 0.0069 WB HDV and passenger traffic vs. particle conc. 53.2 65.9 38 0.02 - 0.4246 EB HDV and passenger traffic vs. particle conc. 65.1 36.2 36 0.09 - 0.0807 WB and EB HDV traffic vs. particle conc. 2292.3 484.2 37 0.39 - 0.0000 WB and EB passenger traffic vs. particle conc. 166.6 63.2 37 0.17 - 0.0124 WB vs. EB HDV influence - - - - 0.26 0.7919 WB vs. EB passenger vehicle influence - - - - 0.09 0.9312 WB HDV vs. WB passenger vehicle influence - - - - 2.26 0.0238 EB HDV vs. EB passenger vehicle influence - - - - 9.27 0.0000 WB particle conc. vs. EB particle conc. b - - - - 0.31 0.7620 WB particle conc. vs. Mixed route particle conc. b - - - - -3.80 0.0022 EB particle conc. vs. Mixed route particle conc. b - - - - -4.72 0.0002 WB speed vs. particle conc. 4572.4 6406.4 19 0.03 - 0.4851 EB speed vs. particle conc. -38562.9 7966.8 18 0.59 - 0.0002 WB vs. EB speed influence - - - - 4.22 0.0000
367
a Based on HMA particle concentration 368
b Based on log-transformed data 369
370
Whilst the influence of a given vehicle class on HMA concentration was not 371
significantly different between the two bores, the influence of HDVs was 372
significantly greater than that of passenger vehicles. Despite the relatively low 373
number of HDVs, they represent a substantial source of UFPs. This is in accord 374
with the findings of several previous tunnel studies (Kirchstetter et al., 1999; Abu-375
Allaban et al., 2002; Geller et al., 2005), and also a street canyon study 376
conducted by Jones and Harrison (2006). Fruin et al. (2008) reported a strong 377
association (R2 = 0.84) between diesel truck count and on-road UFP 378
concentration on Los Angeles freeways. Our results for a similar analysis of the 379
eastbound bore (R2 = 0.87) are in close agreement with the aforementioned 380
study. Fruin et al. (2008) also noted the generally poor ability of overall traffic 381
volume (r = 0.13), which is largely comprised of gasoline-powered vehicles, to 382
predict on-road UFP concentration. The relative weakness of passenger vehicles 383
as a determinant of in-tunnel HMA UFP concentration in this study (R2 = 0.37 and 384
0.10 for eastbound and westbound bores, respectively) generally support this 385
finding. Based on measurements at 2 roadside locations in Basel, Switzerland, 386
Junker et al. (2000) noted significant correlations between HDV number and UFP 387
concentration of r = 0.86 and r = 0.67, but did not observe such correlation 388
between light duty vehicle (LDV) number and UFP concentration (r = 0.59 and r = 389
0.43). Wang et al. (2008) reported correlations (R2 = 0.38 and 0.63) between 390
HDV count and UFP concentration for a busy road intersection in Corpus Christi, 391
Texas. Wang et al. (2008) also recorded comparatively poor associations 392
between total traffic count and UFP concentration (R2 = 0.01 and 0.19) at their 393
study site. Despite differences in measurement location, experimental equipment 394
and/or approach between our study and those described above, the general 395
findings of all studies are in concert with respect to the importance of HDV 396
volume, relative to LDV volume or total traffic volume, as a determinant of on or 397
near-road UFP concentration. 398
399
Average hourly vehicle speed through the eastbound bore was a moderate 400
predictor of HMA particle concentration (R2 = 0.57), although particle 401
concentration decreased with increasing vehicle speed. In the westbound bore, 402

average vehicle speed was an insignificant predictor of median average particle 403
concentration (R2 = 0.03). There was a highly significant difference in the 404
predictive strength of vehicle speed between bores (p < 0.0001) Kittelson et al. 405
(2004a) reported increased particle concentrations and a reduction in midpoint 406
particle diameter with increasing vehicle speed, whilst also noting the applicability 407
of this relationship to spark ignition vehicles more so than diesel vehicles. Geller 408
et al. (2005) reported a positive correlation (R2 = 0.53 prior to normalisation of 409
vehicle speed; R2 = 0.69 following normalisation) between vehicle speed and 410
particle concentration in a bore of the Caldecott Tunnel in Berkeley, California. 411
Morawska et al. (2005) found particle number emission factors increased with 412
vehicle speed, as did Kristensson et al. (2004), based on a tunnel study in 413
Stockholm, Sweden. In the above studies, the sampling platform was either 414
static (Kristensson et al. 2004; Geller et al., 2005; Morawska et al, 2005) or direct 415
sampling of exhaust plumes was deliberately avoided (Kittelson et al., 2004a). 416
Neither was the case in this study, and given the combination of a mobile 417
sampling platform and frequent proximity to HDV exhaust plumes in the enclosed 418
tunnel during periods of heavy traffic, the negative relationship we observed in 419
the eastbound bore seems plausible. The effect of higher speed vehicle travel on 420
tunnel ventilation rates and subsequent reductions in UFP concentration has 421
been raised in the literature, although it is not supported by experimental data 422
(Gidhagen et al., 2003; Geller et al., 2005). It is worth noting that due to the 423
factors described above, our measurement approach was not suited to 424
investigation of the influence of vehicle speed on UFP emission factors, nor was 425
it a goal of this study. 426
427
We made no attempt to avoid sampling the exhaust plume of vehicles in front of 428
our mobile sampling platform, however, apart from one exercise performed 429
outside of the M5 East tunnel described in a subsequent section, we did not 430
deliberately chase vehicles thought to be high emitters. Individual vehicles can 431
produce high on-road UFP concentrations (see section 3.3), particularly during 432
acceleration from a standing state (Fruin et al., 2008). However, the enclosed 433
characteristic of the tunnel and the associated ability to contain vehicle emissions 434
in a small space, coupled with the number of replicate trips made, largely mitigate 435
the effects of any trips where a single vehicle preceding the measurement 436
platform led to UFP concentration excursions substantially above the combined 437
plume of all preceding vehicles in the tunnel. 438
439
The strength of HDV traffic volume as a determinant of UFP concentrations was 440
relatively poor in the westbound bore. Possible, albeit speculative, explanations 441
for this include the fact that the westbound bore feeds traffic away from a major 442
shipping port, so freight trucks entering this bore may be less heavily laden than 443
their eastbound counterparts. However, the reverse could also be true 444
depending on the proportion of HDVs loading or unloading their cargo at the port. 445
Ventilation and air movement parameters may be of increased significance in this 446
bore. The relative position at which air is extracted and injected in each bore 447

could also potentially be of importance. The presence of a sustained (400m) 448
uphill road grade of 1:20 (NSW RTA, 2008a) coincident with the westbound bore 449
exit, and associated heavy vehicle emissions in this vicinity, may exert a 450
substantial influence that is not apparent in the present results which are based 451
on average hourly traffic volume and vehicle based on-road UFP sampling (i.e. 452
individual or multiple HDVs ascending towards the westbound exit may have 453
made a time-disproportionate contribution to measured trip average UFP 454
concentration). A systematic difference in HDV fleet mechanical condition 455
(Jayaratne et al., 2007), age or presence or type of exhaust cleaning device 456
(Jones and Harrison, 2006) between bores seems unlikely, although these 457
factors could exert some individual or combined influence on the disparity in HDV 458
influence observed between bores. As no significant difference in HMA UFP 459
particle concentration existed between the two bores, future research would 460
ideally further investigate the cause of this somewhat counter-intuitive finding. 461
Furthermore, as a filtration plant that will extract tunnel air approximately 500m 462
from the westbound bore exit portal prior to treatment and re-introduction slightly 463
downstream is currently under construction (NSW RTA, 2008a), a follow-up study 464
to assess the efficacy of this device at reduction of on-road UFP concentration 465
would be useful in examining the benefit(s) of such engineering remediation. 466
467
468
469
470
471
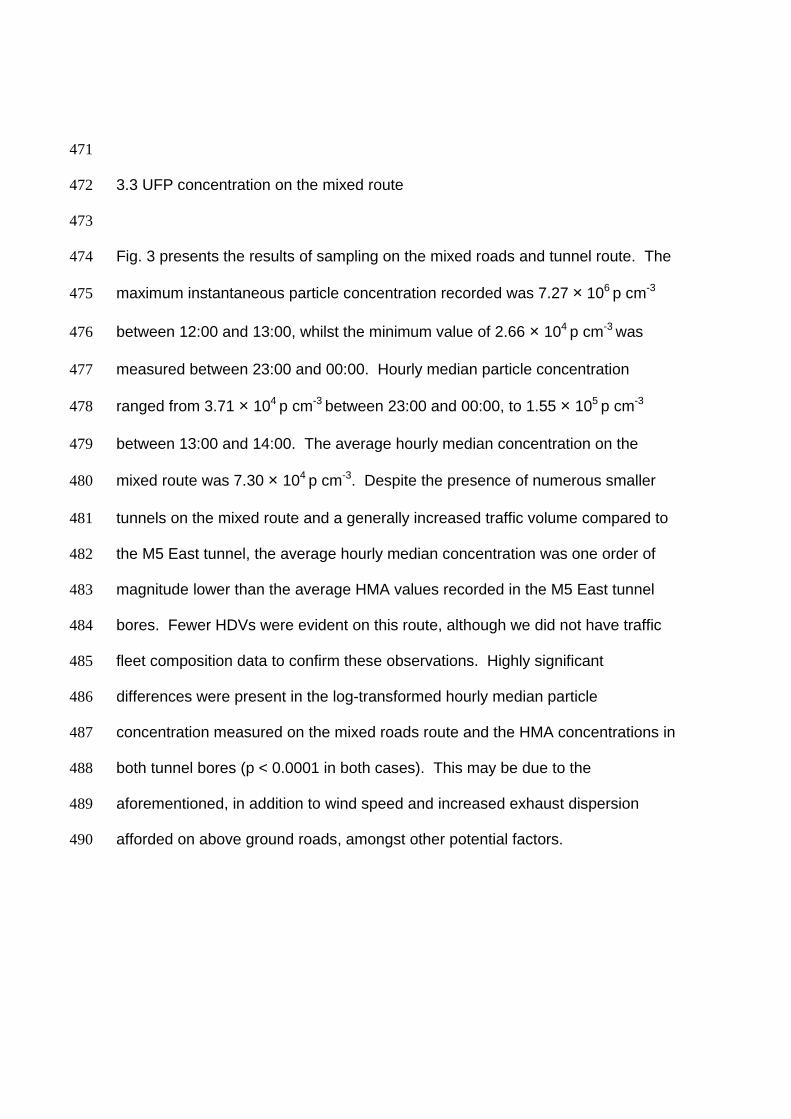
3.3 UFP concentration on the mixed route 472
473
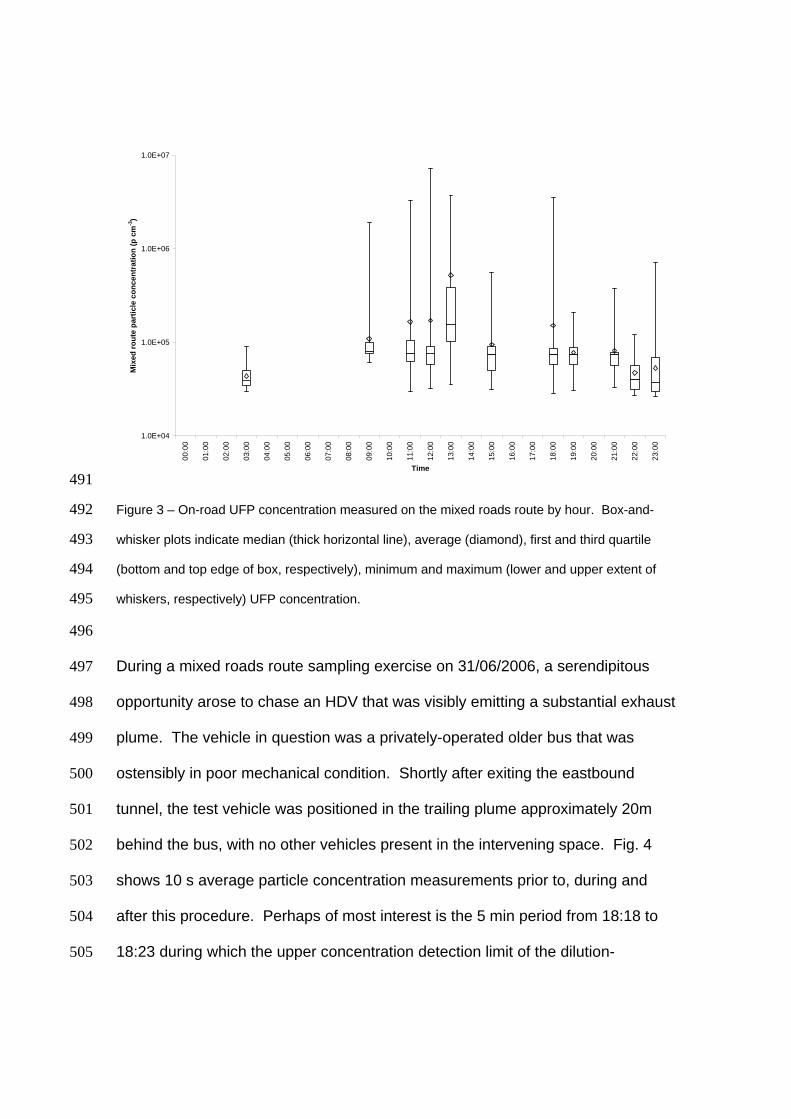
Fig. 3 presents the results of sampling on the mixed roads and tunnel route. The 474
maximum instantaneous particle concentration recorded was 7.27 × 10⁶ p cm-3 475
between 12:00 and 13:00, whilst the minimum value of 2.66 × 10⁴ p cm-3 was 476
measured between 23:00 and 00:00. Hourly median particle concentration 477
ranged from 3.71 × 10⁴ p cm-3 between 23:00 and 00:00, to 1.55 × 10⁵ p cm-3 478
between 13:00 and 14:00. The average hourly median concentration on the 479
mixed route was 7.30 × 10⁴ p cm-3. Despite the presence of numerous smaller 480
tunnels on the mixed route and a generally increased traffic volume compared to 481
the M5 East tunnel, the average hourly median concentration was one order of 482
magnitude lower than the average HMA values recorded in the M5 East tunnel 483
bores. Fewer HDVs were evident on this route, although we did not have traffic 484
fleet composition data to confirm these observations. Highly significant 485
differences were present in the log-transformed hourly median particle 486
concentration measured on the mixed roads route and the HMA concentrations in 487
both tunnel bores (p < 0.0001 in both cases). This may be due to the 488
aforementioned, in addition to wind speed and increased exhaust dispersion 489
afforded on above ground roads, amongst other potential factors. 490
1.0E+04
1.0E+05
1.0E+06
1.0E+07
00:0
0
01:0
0
02:0
0
03:0
0
04:0
0
05:0
0
06:0
0
07:0
0
08:0
0
09:0
0
10:0
0
11:0
0
12:0
0
13:0
0
14:0
0
15:0
0
16:0
0
17:0
0
18:0
0
19:0
0
20:0
0
21:0
0
22:0
0
23:0
0
Time
Mix
ed r
ou
te p
arti
cle
con
cen
trat
ion
(p
cm
-3)
491
Figure 3 – On-road UFP concentration measured on the mixed roads route by hour. Box-and-492
whisker plots indicate median (thick horizontal line), average (diamond), first and third quartile 493
(bottom and top edge of box, respectively), minimum and maximum (lower and upper extent of 494
whiskers, respectively) UFP concentration. 495
496
During a mixed roads route sampling exercise on 31/06/2006, a serendipitous 497
opportunity arose to chase an HDV that was visibly emitting a substantial exhaust 498
plume. The vehicle in question was a privately-operated older bus that was 499
ostensibly in poor mechanical condition. Shortly after exiting the eastbound 500
tunnel, the test vehicle was positioned in the trailing plume approximately 20m 501
behind the bus, with no other vehicles present in the intervening space. Fig. 4 502
shows 10 s average particle concentration measurements prior to, during and 503
after this procedure. Perhaps of most interest is the 5 min period from 18:18 to 504
18:23 during which the upper concentration detection limit of the dilution-505
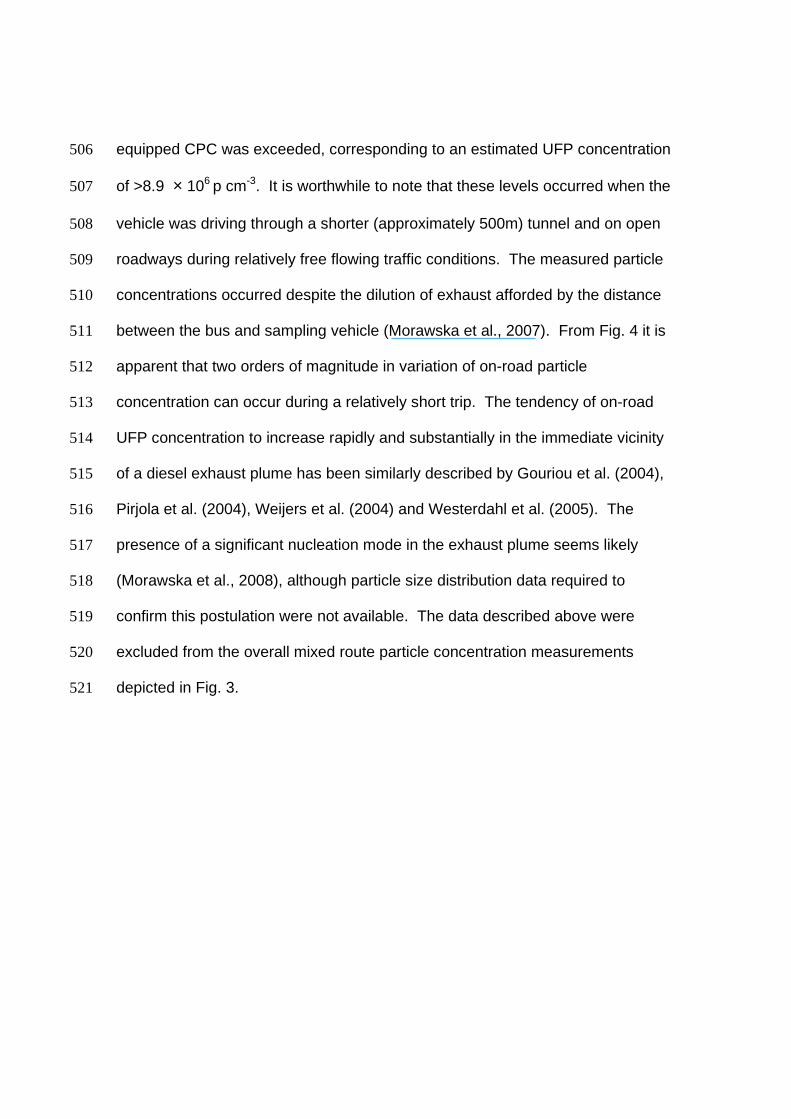
equipped CPC was exceeded, corresponding to an estimated UFP concentration 506
of >8.9 × 10⁶ p cm-3. It is worthwhile to note that these levels occurred when the 507
vehicle was driving through a shorter (approximately 500m) tunnel and on open 508
roadways during relatively free flowing traffic conditions. The measured particle 509
concentrations occurred despite the dilution of exhaust afforded by the distance 510
between the bus and sampling vehicle (Morawska et al., 2007). From Fig. 4 it is 511
apparent that two orders of magnitude in variation of on-road particle 512
concentration can occur during a relatively short trip. The tendency of on-road 513
UFP concentration to increase rapidly and substantially in the immediate vicinity 514
of a diesel exhaust plume has been similarly described by Gouriou et al. (2004), 515
Pirjola et al. (2004), Weijers et al. (2004) and Westerdahl et al. (2005). The 516
presence of a significant nucleation mode in the exhaust plume seems likely 517
(Morawska et al., 2008), although particle size distribution data required to 518
confirm this postulation were not available. The data described above were 519
excluded from the overall mixed route particle concentration measurements 520
depicted in Fig. 3. 521
1.0E+04
1.0E+05
1.0E+06
1.0E+07
18:08 18:10 18:12 18:14 18:16 18:18 18:20 18:22 18:24 18:26 18:28 18:30 18:32 18:34
Time
On
-ro
ad p
arti
cle
con
cen
trat
ion
(p
cm
-3)
10 s average
Max. concentration detection threshold of CPC
Entered M5 East eastbound tunnel bore
Exited M5 East eastbound tunnel bore
Positioned sampling vehicle ~20m behind bus Bus exited roadway
Remainder of mixed route
522
Figure 4 – Time-series of 10 s average on-road particle concentration recorded on 31/6/2006. 523
524
3.4 Comparison with other environments 525
526
Morawska et al. (2008) described the results of meta-analyses applied to 71 527
studies of UFP characterisation conducted in a wide range of environments, as 528
reported in the literature. Excluding their assessment of on-road and tunnel 529
studies, which are the subject of a separate section below, the values reported by 530
Morawska et al. (2008) ranged from 2.9 × 10³ p cm-3 to 3.9 × 10⁴ p cm-3 and 2.6 × 531
103 p cm-3 to 4.8 × 10⁴ p cm-3, for median and average levels, respectively. 532
Minimum median concentrations corresponded to studies of UFP concentration 533
in rural locations, whilst maximum median levels were measured in street canyon 534
environments. The minimum average particle concentrations were recorded in 535
clean background environments, such as boreal forests. Maximum average 536

concentrations were recorded in roadside locations. The minimum and maximum 537
HMA UFP concentrations we measured were both one order of magnitude 538
greater in the eastbound bore than the equivalent measurements reported by 539
Morawska et al. (2008). A similar trend existed for data collected in the 540
westbound bore, although the maximum HMA concentration there (1.73 × 10⁶ p 541
cm-3) was two orders of magnitude greater than the equivalent value described 542
by Morawska et al. (2008). The hourly median UFP concentrations recorded on 543
our mixed route (see Fig. 3) were generally of the same order as the median 544
reported by Morawska et al. (2008) for street canyon and roadside locations. 545
The relatively high UFP concentrations we recorded are not unexpected given 546
the proximity of diesel and gasoline emission sources when sampling on-road. 547
Coupled with the enclosed nature of the tunnel and the subsequent limitations on 548
exhaust plume dispersion imposed by this, tunnels clearly represent locations 549
where peak daily UFP exposures are likely to occur for the vehicle occupants 550
using them. The degree to which a person is exposed to levels commensurate 551
with those measured on-road is dependent on the rate and penetration efficiency 552
at which particles enter the vehicle cabin that they occupy. Particle deposition 553
within a vehicle cabin can also be of importance (Xu and Zhu, 2009). Newer 554
vehicles fitted with filtration devices have been shown to offer reasonable 555
protection against in-cabin UFP exposure, depending on the ventilation mode 556
used (Zhu et al, 2007; Pui et al., 2008; Qi et al., 2008). However, occupants of 557
older, less air-tight vehicles (Knibbs et al., in press), vehicles with open windows 558

(Ott et al., 2008), open convertible vehicles, motorcycles or other transportation 559
mode characterised by high air change rate and/or lack of filtration may be 560
afforded relatively small reductions in UFP concentration entering their breathing 561
zone. 562
563
3.5 Comparison with other on-road and tunnel studies 564
565
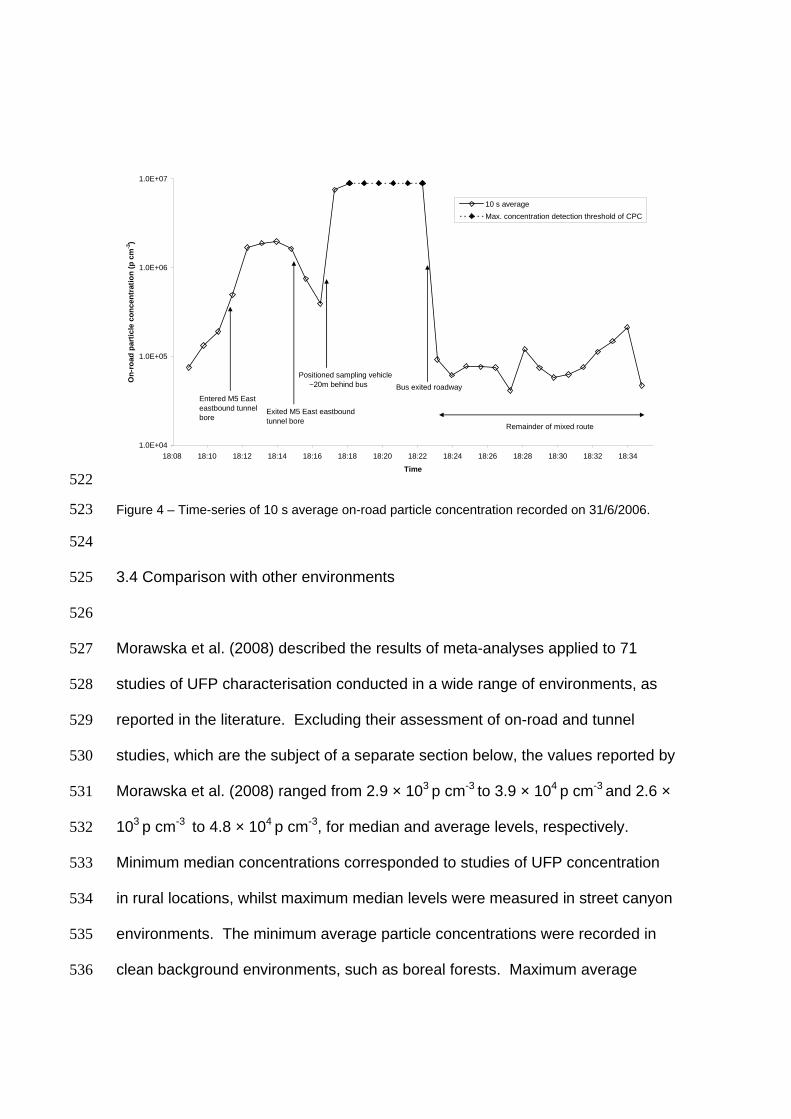
Table 2 presents a summary of related previous work. A similar comparison was 566
presented by Westerdahl et al. (2005), and given the relatively rapid progression 567
in reported on-road and tunnel-based studies, it seems useful to provide an 568
updated version. It is worth noting that the studies referred to in table 2 are not 569
intended to represent a comprehensive summary of all on-road or tunnel based 570
work, but rather a selection of those most relevant to the present study. 571
Variability existed between these studies in terms of experimental equipment, 572
particle size range of interest, study environment, whether a given on-road study 573
aimed to chase vehicles, and the reported particle concentration statistic. 574
Notwithstanding this, the peak in-tunnel concentrations measured in this study for 575
a given statistic (average, median, maximum) were up to two orders of 576
magnitude greater than those reported in other work. However, it should be 577
considered that our values reflect tunnel transects that generally took 3.5 to 5 min 578
to complete, which is a short averaging period relative to some other studies. As 579
table 2 highlights, compared to other work performed in tunnels from either a 580
static or vehicle-based platform, our results are toward the upper limit of 581

concentrations reported in the literature. Concentrations recorded on the mixed 582
route were more comparable with those reported in other studies, and more 583
specifically, exhibited good agreement with results presented by Weijers et al. 584
(2004) and Westerdahl et al. (2005), both of which employed similar equipment 585
and focussed on an analogous particle size range to the present study. 586
587
Table 2 – Summary of related previous work. 588
Study Location Measurement platform
Particle size range measured
Measurement equipment
Roadway environment
Diesel % of fleet
Avg. conc. (p cm-3)
Med. conc. (p cm-3)
Max. conc. (p cm-3)
This study Sydney, Australia Vehicle-based 10 to >1000nm TSI 3007 CPC 4km tunnel and mixed route (incl. tunnels)
~7%c 6.0 × 10⁶ace 1.7 × 10⁶ach 1.6 × 10⁵ab
>8.9 × 10⁶bci
Kirchstetter et al. (1999)
Berkeley, USA Static >10nm TSI 3760 CNC 1.1km tunnel 4.8%a 4.0 × 10⁵ - -
Abu-Allaban et al. (2002)
Pennsylvania, USA Static 10-400nm TSI SMPS 1.6km tunnel 86.5%a 1.9 × 10⁵e - -
Bukowiecki et al. (2002) Gidhagen et al. (2003)
Zürich, Switzerland Stockholm, Sweden
Vehicle-based Static
>3nm (CPC), 7-310nm (SMPS) 3-900nm
TSI 3025 UCPC, TSI SMPS DMPS
Non-tunnel routes 1.5km tunnel
- 5%
7.8 × 10⁴a
7.6 × 10⁵
- -
4.0 × 10⁵i
>1.3 × 10⁶d Gouriou et al. (2004)
Rouen, France Vehicle-based & static
30-10 000nm Dekati ELPI 1.6km tunnel and non-tunnel routes
- 9.5 × 10⁴b 5.1 × 10⁵ace
3.5 × 10⁴b 1.5 × 10⁶i
Jamriska et al. (2004)
Brisbane, Australia Static 17-700nm TSI SMPS 0.5km tunnel 100% - - ~1.3 × 10⁵e
Kittleson et al. (2004a)
Minnesota, USA Vehicle-based 3-1000nm (CPC), 8-300nm (SMPS)
TSI 3025A UCPC, TSI SMPS
Non-tunnel routes ~8 % 4.0 × 10⁵ 9.1 × 10⁴ 1.0 × 10⁷i
Kittleson et al. (2004b)
New York, USA Vehicle-based 3-1000nm (CPC) TSI 3025A UCPC, TSI SMPS
Non-tunnel routes - 5.6 × 10⁵a - -
Weijers et al. (2004)
Amsterdam/ Nijmegen, Netherlands
Vehicle-based >7nm TSI 3022 CPC Mixed routes (incl. ~2km tunnel)
- 1.6 × 10⁵ab - ~1.8 × 10⁶ci
Pirjola et al. (2004)
Helsinki, Finland Vehicle-based >3nm (CPC), 3-50nm (SMPS), 7-10 000nm (ELPI)
TSI 3025 UCPC, TSI SMPS, Dekati ELPI
Non-tunnel routes - - - 1.3 × 10⁶i
Geller et al. (2005)
Berkeley, USA Static 7-270nm TSI SMPS 1.1km tunnel 4.9%a 7.8 × 10⁵a - ~1.0 × 10⁶e
Westerdahl et al. (2005)
Los Angeles, USA Vehicle-based 10 to >1000nm (3007), 7-1000nm (3022A), 5-600nm (SMPS)
TSI 3007 CPC, TSI 3022A CPC, TSI SMPS
Non-tunnel routes 14%a - 1.9 × 10⁵af 8.0 × 10⁵i
Larsson et al. (2007)
Stockholm, Sweden Static 20 to 1000nm (CPC), 14-100nm (SMPS)
TSI P-Trak CPC, TSI SMPS
1.5km tunnel ~10% - 1.1 × 10⁵a -
Zhu et al. (2007)
Los Angeles, USA Vehicle-based >5nm (CPC), 7.9-217nm (SMPS)
TSI 3785 WCPC, TSI SMPS
Non-tunnel routes ~25%a 2.6 × 10⁵a - ~5.8 × 10⁵i
Lechowicz et al. (2008)
Brisbane, Australia Static >7nm TSI 3022 CPC 0.5km tunnel ~66% - 4.1 × 10⁴f 5.4 × 10⁴g
Rim et al. (2008)
Austin, USA Vehicle-based 20nm to 1000nm TSI P-Trak CPC Non-tunnel routes - 2.5 × 10⁴a 1.2 × 10⁴a ~1.6 × 10⁵i
a Maximum value of several reported, b Non-tunnel route, c In-tunnel route, d Maximum average reported, e Short term average, f Average of 589 median, g Maximum median, h Median of average, i Instantaneous or very short term peak590
591
4. CONCLUSIONS 592
593
(1) Based on 301 individual vehicle-based transects, hourly median average 594
(HMA) ultrafine particle (UFP) concentration in the 4km M5 East road tunnel 595
ranged from 9.04 × 10⁴ p cm-3 to 9.06 × 10⁵ p cm-3 in the eastbound bore, and 596
from 7.81 × 10⁴ p cm-3 to 1.73 × 10⁶ p cm-3 in the westbound bore. Maximum trip 597
average UFP concentrations exceeded 5.0 × 10⁶ p cm-3 in both tunnel bores. 598
Minimum trip average concentrations were two orders of magnitude lower. 599
600
(2) Hourly median concentrations recorded on a mixed route comprising major 601
roadways and shorter tunnels ranged from 3.71 × 10⁴ p cm-3 and 1.55 × 10⁵ p 602
cm-3. 603
604
(3) Hourly heavy diesel vehicle (HDV) volume was a highly significant 605
determinant (p < 0.0001) of HMA UFP concentration in the eastbound tunnel 606
bore (R2 = 0.87), whilst a significant (p = 0.0256), yet only poor-fair determinant 607
in the westbound bore (R2 = 0.26). The predictive ability of passenger vehicle 608
volume was significantly different to that of HDV volume in both bores, and was a 609
fair (R2 = 0.37) and poor (R2 = 0.10) determinant in the eastbound and 610
westbound bores, respectively. No significant difference (p = 0.7620) in HMA 611
UFP concentration existed between the two bores. 612
613

(4) The HMA UFP concentrations measured in-tunnel were one to two orders of 614
magnitude higher than equivalent measurements reported in the literature for a 615
variety of other environments. These results, coupled with those of recent 616
above-ground roadway studies which estimate that up to approximately 50% of 617
Los Angeles commuters daily ultrafine exposure occurs inside vehicles (Zhu et 618
al., 2007; Fruin et al., 2008), further highlight the significance road tunnel transit 619
may have on in-vehicle and overall UFP exposure. As road tunnel numbers and 620
length are likely to increase in many countries, the above issue may be a 621
persistent one, and it would seem beneficial to mitigate vehicle occupant 622
exposures to a range of pollutants encountered in tunnels. 623
624
(5) Given the relatively spartan sampling equipment and approach, this study 625
was quite successful from an operational standpoint, although an increased suite 626
of measurement instrumentation would be useful in any ensuing work. 627
Limitations of the present study included the absence of particle size distribution 628
information and lack of traffic data coincident with, and of a temporal resolution 629
analogous to, the measurement periods. Nonetheless, the results were generally 630
consistent with those reported in the limited number of comparable studies. 631
Further work would ideally focus on the cause of the disparity in determinant 632
factors of UFP concentration between the two tunnel bores. Particle size 633
distribution (including possible impacts of ambient temperature) and chemical 634
composition could both be assessed. Development of emission factors and 635
examination of the mechanical condition and age of a representative sample of 636
HDVs may also be of use. Given that two significant events are scheduled to 637
occur in the near future, namely, the reduction of sulphur content in Australian 638
diesel fuel to 10ppm from 2009 and the installation of a tunnel air filtration plant 639
for the M5 East, assessment of their individual or synergistic effects on in-tunnel 640
UFP concentration would be a prudent pathway for any subsequent study. 641
642
(6) In road tunnels such as the M5 East control of particle emissions at the 643
source, such as the installation of oxidation catalysts and particle traps in diesel 644
vehicles (Morawska et al., 2008), seems a logical and potentially more effective 645
approach to reduce emissions and subsequent on-road UFP concentrations 646
compared to reliance on tunnel air filtration devices. Developing particle number 647
emissions standards in Australia, similar to those being promulgated in Europe, 648
could prove to be efficacious at reducing UFP concentrations on above ground 649
and tunnel roadways. 650
651
ACKNOWLEDGEMENTS 652
653
Luke Knibbs gratefully acknowledges Macquarie University for providing an 654
MQRES scholarship and postgraduate research fund grant that partially funded 655
this research. The New South Wales Roads and Traffic Authority are thanked for 656
providing traffic data. We greatly appreciated the data logger programming 657
assistance provided by Jenny Spagnolo of Macquarie University. 658
659
REFERENCES 660 661 Abu-Allaban, M., Coulomb, W., Gertler, A.W., Gillies, J., Pierson, W.R., Rogers, 662 C.F., Sagebiel, J.C., Tarnay, L., 2002. Exhaust particle size distribution 663 measurements at the Tuscarora Mountain Tunnel. Aerosol Science and 664 Technology 36, 771-789. 665 666 ABS (Australian Bureau of Statistics), 2006. Motor vehicle census, Australia 667 http://www.ausstats.abs.gov.au/Ausstats/subscriber.nsf/0/61D1D30E79B4AF3BC668 A257234001C2654/$File/93090_31%20mar%202006.pdf (accessed 28.10.08). 669 670 Bukowiecki, N., Dommen, J., Prévôt, A.S.H., Richter, R., Weingartner, E., 671 Baltensperger, U., 2002. A mobile pollutant measurement laboratory – 672 measuring gas phase and aerosol ambient concentrations with high spatial and 673 temporal resolution. Atmospheric Environment 36, 5569-5579. 674 675 Child and Associates, 2004. M5 East freeway: a review of emission treatment 676 technologies, systems and applications. Review prepared for New South Wales 677 Roads and Traffic Authority. 678 http://www.rta.nsw.gov.au/constructionmaintenance/downloads/2004_10_childre679 pfiltration_dl1.html (accessed 28.10.08). 680 681 Day, A.S., Robertson, A.C., 2004. The future of civil and mining tunnelling and 682 underground space in Australia. Tunnelling and Underground Space Technology 683 19, 363. 684 685 Fruin, S., Westerdahl, D., Sax, T., Sioutas, C., Fine, P.M., 2008. Measurements 686 and predictors of on-road ultrafine particle concentrations and associated 687 pollutants in Los Angeles. Atmospheric Environment 42, 207-219. 688 689 Geller, M.D., Sardar, S.B., Phuleria, H., Fine, P.M., Sioutas, C., 2005. 690 Measurements of particle number and mass concentrations and size distributions 691 in a tunnel environment. Environmental Science and Technology 39, 8653-8663. 692 693 Gidhagen, L., Johansson, C., Ström, J., Kristensson, A., Swietlicki, E., Pirjola, L., 694 Hansson, H-C., 2003. Model simulation of ultrafine particles inside a road tunnel. 695 Atmospheric Environment 37, 2023-2036. 696 697 Gouriou, F., Morin. J-P., Weill, M-E., 2004. On-road measurements of particle 698 number concentrations and size distributions in urban and tunnel environments. 699 Atmospheric Environment 38, 2831-2840. 700 701 Imhof, D., Weingartner, E., Prévôt, A.S.H., Ordóñez, C., Kurtenbach, R., Wiesen, 702 P., Rodler, J., Sturm, P., McCrae, I., Ekström, M., Baltensperger, U., 2006. 703 Aerosol and NOx emission factors and submicron particle number size 704

distributions in two road tunnels with different traffic regimes. Atmospheric 705 Chemistry and Physics 6, 2215-2230. 706 707 Jamriska, M., Morawska, L., Thomas, S., He, C., 2004. Diesel bus emissions 708 measured in a tunnel study. Environmental Science and Technology 38, 6701-709 6709. 710 711 Jayaratne, E.R., Morawska, L., Ristovski, Z.D., He, C., 2007. Rapid identification 712 of high particle number emitting on-road vehicles and its application to a large 713 fleet of diesel buses. Environmental Science and Technology 41, 5022-5027. 714 715 Jones, A.M, Harrison, R.M., 2006. Estimation of the emission factors of particle 716 number and mass fractions from traffic at a site where average vehicle speeds 717 vary over short distances. Atmospheric Environment 40, 7125-7137. 718 719 Junker, M., Kasper, M., Röösli, M., Camenzind, M., Künzli, N., Monn, Ch., Theis, 720 G., Braun-Fahrländer, Ch., 2000. Airborne particle number profiles, particle 721 mass distributions and particle-bound PAH concentrations within the city 722 environment of Basel: an assessment as part of the BRISKA Project. 723 Atmospheric Environment 34, 3171-3181. 724 725 Kirchstetter, T.W., Harley, R.A., Kreisberg, N.M., Stolzenburg, M.R., Hering, S.V., 726 1999. On-road measurement of fine particle and nitrogen oxide emissions from 727 light- and heavy-duty motor vehicles. Atmospheric Environment 33, 2955-2968. 728 729 Kittelson, D.B., Watts, W.F., Johnson, J.P., 2004a. Nanoparticle emissions on 730 Minnesota highways. Atmospheric Environment 38, 9-19. 731 732 Kittelson, D.B., Watts, W.F., Johnson, J.P., Remerowki, M.L., Ische, E.E., 733 Oberdörster, G., Gelein, R.M., Elder, A., Hopke, P.K., Kim, E., Zhao, W., Zhou, 734 L., Jeong, C-H., 2004b. On-road exposure to highway aerosols. 1. Aerosol and 735 gas measurements. Inhalation Toxicology 16 (suppl. 1), 31-39. 736 737 Knibbs, L.D., de Dear, R.J., Morawska, L., Coote, P.M., 2007. A simple and 738 inexpensive dilution system for the TSI 3007 condensation particle counter. 739 Atmospheric Environment 41, 4553-4557. 740 741 Knibbs, L.D., de Dear, R.J., Atkinson, S.E. Field study of air change and flow 742 rate in six automobiles. Indoor Air, in press. 743 744 Kristensson, A., Johansson, C., Westerholm, R., Swietlicki, E., Gidhagen, L., 745 Wideqvist, U., Vesely, V., 2004. Real-world traffic emission factors of gases and 746 particles measured in a road tunnel in Stockholm, Sweden. Atmospheric 747 Environment 38, 657-673. 748 749 Larsson, B-M., Sehistedt, M., Grunewald, J., Sköld, C.M., Lundin, A., Blomberg, 750 A., Sandström, T., Eklund, A., Svartengren, M., 2007. Road tunnel air pollution 751
induces bronchoalveolar inflammation in healthy subjects. European Respiratory 752 Journal 29, 699-705. 753 754 Lechowicz, S., Jayaratne, R., Morawska, L., Jamriska, M., 2008. Development of 755 a methodology for the quantification of particle number and gaseous 756 concentrations in a bidirectional bus tunnel and the derivation of emission factors. 757 Atmospheric Environment 42, 8353-8357. 758 759 Mills, N.L., Törnqvist, H., Gonzalez, M.C., Vink, E., Robinson, S.D., Söderberg, 760 S., Boon, N.A., Donaldson, K.A., Sandström, T., Blomberg, A., Newby, D.E., 761 2007. Ischemic and thrombotic effects of dilute diesel-exhaust inhalation in men 762 with coronary heart disease. The New England Journal of Medicine 357, 1075-763 1082. 764 765 Morawska, L., Salthammer, T., 2003. Introduction to sampling and measurement 766 techniques, in: Morawska and Salthammer (eds.), Indoor environment: airborne 767 particles and settled dust, Wiley-VCH GmbH & Co. KGaA, Weinheim, pp. 49-55. 768 769 Morawska, L., Jamriska, M., Thomas, S., Ferreira, L., Mengersen, K., Wraith, D., 770 McGregor, F., 2005. Quantification of particle number emission factors for motor 771 vehicles from on-road measurements. Environmental Science and Technology 772 39, 9130-9139. 773 774 Morawska, L., Ristovski, Z.D., Johnson, G.R., Jayaratne, E.R., Mengersen, K., 775 2007. Novel method for on-road emission factor measurements using a plume 776 capture trailer. Environmental Science and Technology 41, 574-579. 777 778 Morawska, L., Ristovski, Z., Jayaratne, E.R., Keogh, D.U., Ling, X., 2008. 779 Ambient nano and ultrafine particles from motor vehicle emissions: 780 Characteristics, ambient processing and implications on human exposure. 781 Atmospheric Environment 42, 8113-8138. 782 783 NSW RTA (New South Wales Roads and Traffic Authority), 2008a. 784 http://www.rta.nsw.gov.au/constructionmaintenance/completedprojects/m5east/in785 dex.html (accessed 28.10.08). 786 787 NSW RTA (New South Wales Roads and Traffic Authority), 2008b. 2005 Sydney 788 region AADT Data. 789 http://www.rta.nsw.gov.au/trafficinformation/downloads/aadtdata_dl1.html 790 (accessed 28.10.08). 791 792 NSW RTA (New South Wales Roads and Traffic Authority), 2008c. 793 http://www.rta.nsw.gov.au/constructionmaintenance/completedprojects/sydneyha794 rbourtunnel/ (accessed 28.10.08). 795 796 797

Ott, W., Klepeis, N., Switzer, P., 2008. Air change rates of motor vehicles and in-798 vehicle pollutant concentrations from secondhand smoke. Journal of Exposure 799 Science and Environmental Epidemiology 18, 312-325. 800 801 Pirjola, L., Parviainen, H., Hussein, T., Valli, A., Hämeri, K., Aaalto, P., Virtanen, 802 A., Keskinen, J., Pakkanen, T.A., Mäkelä, T., Hillamo, R.E., 2004. “Sniffer” – a 803 novel tool for chasing vehicles and measuring traffic pollutants. Atmospheric 804 Environment 38, 3625-3635. 805 806 Pui, D.Y.H., Qi, C., Stanley, N., Oberdörster, G., Maynard, A., 2008. 807 Recirculating air filtration significantly reduces exposure to airborne 808 nanoparticles. Environmental Health Perspectives 116, 863-866. 809 810 Qi, C., Stanley, N., Pui, D.Y.H., Kuehn, T.H., 2008. Laboratory and on-road 811 evaluations of cabin air filters using number and surface area concentration 812 monitors. Environmental Science and Technology 42, 4128-4132. 813 814 Rim, D., Siegel, J., Spinhirne, J., Webb, A., McDonald-Buller, E., 2008. 815 Characteristics of cabin air quality in school buses in Central Texas. 816 Atmospheric Environment 42, 6453-6464. 817 South Eastern Sydney Public Health Unit and NSW Department of Health, 2003. 818 M5 East Tunnels Air Quality Monitoring Project. 819 http://www.health.nsw.gov.au/pubs/2003/m5complete.html (accessed 28.10.08). 820 821 Svartengren, M., Strand, V., Bylin, G., Järup, L., Pershagen, G., 2000. Short-822 term exposure to air pollution in a road tunnel enhances the asthmatic response 823 to allergen. European Respiratory Journal 15, 716-724. 824 825 TSI, 2004. Model 3007 condensation particle counter operation and service 826 manual. 827 828 Wang, Y., Zhu, Y., Salinas, R., Ramirez, D., Karnae, S., John, K., 2008. 829 Roadside measurements of ultrafine particles at a busy urban intersection. 830 Journal of the Air and Waste Management Association 58, 1449-1457. 831 832 Weijers, E.P., Khlystov, A.Y., Kos, G.P.A., Erisman, J.W., 2004. Variability of 833 particulate matter concentrations along roads and motorways determined by a 834 moving measurement unit. Atmospheric Environment 38, 2993-3002. 835 836 Westerdahl, D., Fruin, S., Sax, T., Fine, P.M., 2005. Mobile platform 837 measurements of ultrafine particles and associated pollutant concentrations on 838 freeways and residential streets in Los Angeles. Atmospheric Environment 39, 839 3597-3610. 840 841

Xu, B., Zhu, Y., 2009. Quantitative analysis of the parameters affecting in-cabin 842 to on-roadway (I/O) ultrafine particle concentration ratios. Aerosol Science and 843 Technology 43, 400-410. 844 845 Zhu, Y., Eiguren-Fernandez, A., Hinds, W.C., Miguel, A.H., 2007. In-cabin 846 commuter exposure to ultrafine particles on Los Angeles freeways. 847 Environmental Science and Technology 41, 2138-2145. 848 849 Zhu, Y., Fung, D.C., Kennedy, N., Hinds, W.C., Eiguren-Fernandez, A., 2008. 850 Measurements of ultrafine particles and other vehicular pollutants inside a mobile 851 exposure system on Los Angeles freeways. Journal of the Air and Waste 852 Management Association 58, 424-434. 853