Pseudo-simultaneous measurements for the vertical variation of coarse, fine and ultrafine particles...
39
Title 1 Pseudo-simultaneous measurements for the vertical variation of coarse, fine and ultrafine 2 particles in an urban street canyon 3 Authors 4 Prashant Kumar a* , Paul Fennell b , David Langley a , Rex Britter a 5 Affliation 6 a Department of Engineering, University of Cambridge, CB2 1PZ , UK 7 b Department of Chemical Engineering and Chemical Technology, Imperial College London, 8 SW7 2AZ, UK 9 *Corresponding Author 10 Hopkinson Laboratory 11 Department of Engineering 12 University of Cambridge 13 Trumpington Street, CB2 1PZ, Cambridge, UK 14 Tel.: +44 – (0)1223 332681 15 Fax: +44 – (0)1223 332662; +44 – (0)1223 765311 (Attention: Prashant Kumar) 16 E-mail address: [email protected] (Prashant Kumar), [email protected] (Rex Britter) 17
-
Upload
independent -
Category
Documents
-
view
9 -
download
0
Transcript of Pseudo-simultaneous measurements for the vertical variation of coarse, fine and ultrafine particles...
Title 1
Pseudo-simultaneous measurements for the vertical variation of coarse, fine and ultrafine 2
particles in an urban street canyon3
Authors4
Prashant Kumara*, Paul Fennellb, David Langleya, Rex Brittera5
Affliation6
aDepartment of Engineering, University of Cambridge, CB2 1PZ , UK7
bDepartment of Chemical Engineering and Chemical Technology, Imperial College London, 8
SW7 2AZ, UK9
*Corresponding Author10
Hopkinson Laboratory11
Department of Engineering12
University of Cambridge13
Trumpington Street, CB2 1PZ, Cambridge, UK14
Tel.: +44 – (0)1223 33268115
Fax: +44 – (0)1223 332662; +44 – (0)1223 765311 (Attention: Prashant Kumar)16
E-mail address: [email protected] (Prashant Kumar), [email protected] (Rex Britter)17
ManuscriptClick here to download Manuscript: AE_Revision_VertPaper_FINAL.doc
PKumar
Typewritten Text
Cite this article as: Kumar, P., Fennell, P., Langley, D., Britter, R., 2008. Pseudo–simultaneous measurements for vertical variation of coarse, fine and ultra fine particles in an urban street canyon. Atmospheric Environment 42, 4304–4319.
1
Abstract1
The vertical variation of particle number distributions and concentrations in a street 2
canyon is the result of the competing influences of meteorology, traffic and transformation 3
processes overall and for various particle size ranges. A recently developed instrument, the 4
‘fast response differential mobility spectrometer DMS500’, measured particle number 5
distributions (PNDs) in the 5-2738 nm range, pseudo-simultaneously, at four different heights 6
(z/H = 0.09, 0.19, 0.40 and 0.64) on the leeward side of an 11.6 m deep street canyon which 7
had a height to width ratio of near unity. Measurements were made in Cambridge, UK 8
between the 20th and 21st March 2007. 9
The PNDs were bimodal with the same shape at each height, and with similar values 10
of both the peak and geometric mean particle diameters in each mode. This suggested that 11
transformation processes were not important. Coagulation and condensation time scales were 12
comparable and large and these processes should have had a negligible effect on the PNDs.13
The particle number concentrations (PNCs) changed significantly with height from a 14
maximum at z/H = 0.19 and decreasing towards both the lowest (z/H = 0.09) and highest (z/H15
= 0.64) sampling points. The decrease in PNCs with height in the upper part of the canyon 16
was attributed to the removal of particles as a result of mass exchange between street canyon 17
and the wind above while the reduction in the PNC towards street level was thought to be due 18
to dilution and dry deposition. 19
Over 99% of the PNCs were found in 10-300 nm range whereas the particle mass 20
concentrations were almost equally distributed between the 10-1000 nm and 1000-2738 nm 21
size range at each height. The PNCs in the 10-30 nm and the 30-300 nm size range were 22
linearly correlated with the traffic volume but poorly correlated with the rooftop wind speed.23
Keywords: Street Canyon; Particle number distributions and concentrations; Vertical24
concentration profiles; Ultrafine particles25

2
1. Introduction1
Regulations to control the emission of atmospheric particulate matter (PM) are based 2
on limits for PM10 (Dp ≤10µm) and PM2.5 (Dp ≤2.5µm), using particle mass concentrations, 3
not particle number concentrations. Recent toxicological studies indicate greater toxicity for 4
ultrafine particles (Dp ≤100 nm) than coarser particles, per unit mass (Oberdorster, 2000);5
epidemiological studies suggest correlation between exposure to ambient ultrafine particles at 6
high number concentration, and adverse health effects (Davidson et al., 2005; Peters and 7
Wichmann, 2001). The ultrafine fraction of PM2.5 contributes significantly to particle number 8
concentrations (PNCs) but little to particle mass concentrations (AQEG, 2005). The lack of 9
standard methods and instrumentation for particle number measurements and detailed 10
understanding of the influence exerted on fine particle dispersion by ambient meteorology 11
and traffic flows have limited the scope for designing effective strategies for the mitigation of 12
particulate pollution in urban areas. 13
Vehicles are the major source of ultrafine particles in urban street canyons (Schauer et 14
al., 1996); high PNCs are common since the surrounding built-up environment limits 15
dispersion of exhaust emissions (Van Dingenen et al., 2004). Concentrations can be much 16
greater than in unobstructed locations (Bauman et al., 1982; Kumar et al., 2007). Over the 17
past two decades several groups have studied dispersion of vehicular emissions (gaseous 18
pollutants and particulates) in urban street canyons (Boddy et al., 2005; Kastner-Klein et al., 19
2004; Kim and Baik, 2004), but the vertical variation of particulate matter (both particle mass 20
and particle number concentrations) is still a matter of discussion. This variation is affected 21
by factors including traffic volume, meteorology (including flow and turbulence produced by 22
wind, traffic and atmospheric instability), the geometry of the street canyon (including the 23
aspect ratio and street orientation), and any advection from adjacent streets. Removal (dry 24
and wet deposition) and transformation (nucleation and condensation/evaporation) processes 25

3
may also play an important role in altering particle mass and number concentrations at 1
different heights in urban street canyons. 2
Studies of vertical variation in gaseous and particulate mass concentrations have 3
shown different vertical concentration profiles. Bauman et al. (1982) observed a decreasing 4
concentration of carbon monoxide (CO) with height above road level; Zoumakis (1995)5
found this decrease to be exponential. Similar findings were reported by Murena and Vorraro 6
(2003) for benzene. Few studies exist of vertical variations of particle number concentrations 7
in urban street canyons (Kumar et al., 2008; Li et al., 2007; Longley et al., 2004b). Kumar et 8
al. (2008) also found a decrease in particle number (in the 5-1000 nm range) concentration 9
with height in the lower part (first 2.60 m) of an approximately 20 m high street canyon; 10
similar results were reported for PNCs in the 10-487 nm range by Li et al. (2007) for an 11
asymmetric street canyon having sides 10-18 and 22-28 m high. Near-surface and rooftop 12
level studies for fine particles had also indicated the decrease of PNCs with height above road 13
level (Longley et al., 2004a; Vakeva et al., 1999). However, other studies (Micallef et al., 14
1998; Colls and Micallef, 1999; Park et al., 2004; Weber et al., 2006) reported increasing 15
mass concentration of PM10, PM2.5 and CO with height in the lower part of the canyon, and 16
then decreasing concentrations in the upper part of the canyon. Longley et al. (2004b)17
reported similar results for fine PNCs. 18
European Union directive 1999/30/EC (EC, 1999) suggests sampling heights between 19
1.5 and 4 m above road level, and up to 8 m above road level under specific local 20
circumstances. The variability of vertical concentration profiles described above raises the21
question: “What should be the recommended height(s) for pollutant measurements in street22

4
canyons in order to represent the exposure of the entire local population?”1
Very little information is available on the vertical variation of PNC in the coarse 2
(1000 and 2500 nm), fine (below 1000 nm) and ultrafine (fraction of fine particles those 3
below 100 nm) particles in urban street canyons. Here, pseudo-simultaneous measurements 4
were taken at four different heights (i.e., 1.00, 2.25, 4.62 and 7.37 m) of an 11.6 m deep street 5
canyon in Cambridge (UK). Unlike most other studies, real-time continuous measurements of 6
the particle number distributions in 5-2738 nm range were made, sampling at 0.5 Hz using a 7
4-way solenoid switching system together with a recently developed instrument, the ‘fast 8
response differential mobility spectrometer (DMS500)’. The aims were to determine the 9
vertical variations of mass and particle number concentrations in a typical European street 10
canyon and to evaluate the influences of meteorology, traffic volume, and transformation 11
processes on dispersion of particles in the coarse, fine and ultrafine size ranges. 12
2. Methodology13
2.1 Site Description14
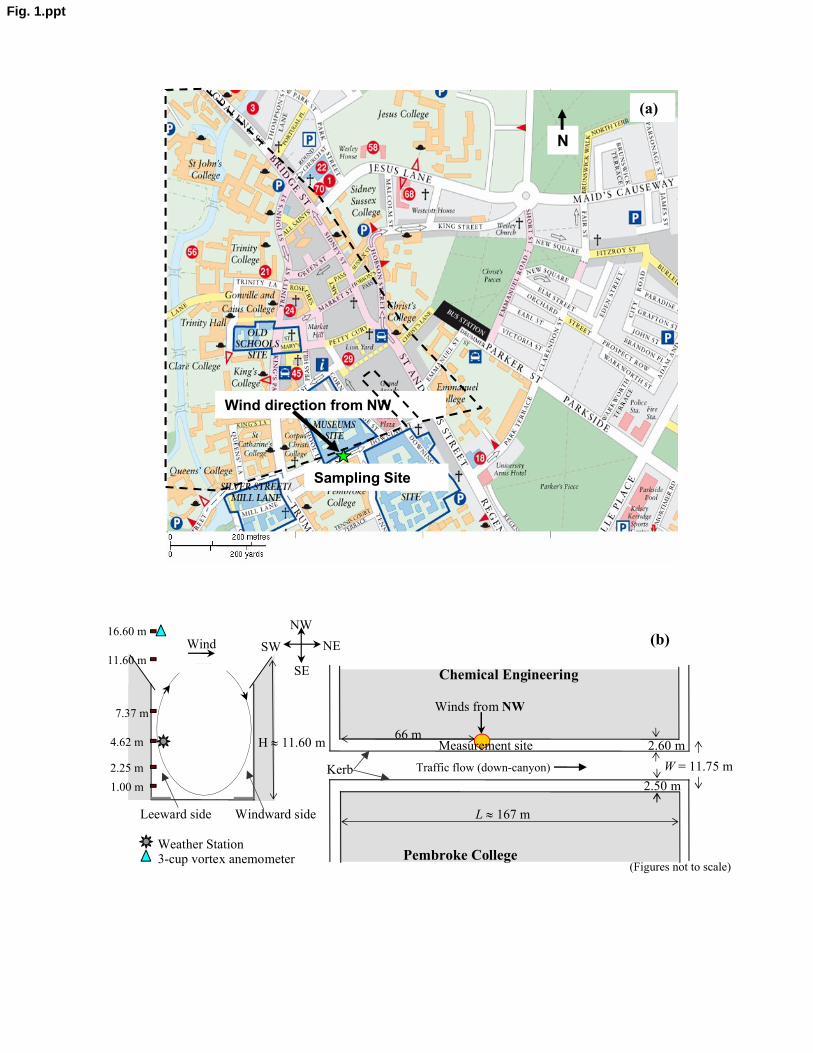
Field experiments were performed between 20th and 21st March 2007 in Pembroke 15
Street (Cambridge, UK; 52012′ N and 0010′ E) just outside the Chemical Engineering 16
Department building (Fig. 1a). Pembroke Street is close to the city centre; distinct peaks in 17
weekday traffic occur at 08:00-09:00 h, 11:00-12:00 h and 19:00-20:00 h local time. The 18
studied section of street canyon (Fig. 1b) is 167 m long, running approximately northeast to 19
southwest. The Chemical Engineering Department is on the northwest (NW) side of the street 20
and Pembroke College on the southeast (SE) with mean building heights (H) of about 11.6 m21
and 11.5 m respectively. The street canyon is nearly symmetrical, with pitched roofed (sloped 22
parallel to the street) buildings on either side of the street. The street canyon is 11.75 m wide 23
(W) with one lane (6.65 m wide) of traffic traveling towards the northeast. Traffic flow at the 24
northeast (NE) end of the street is regulated by traffic signals while the traffic flow is free at 25
5
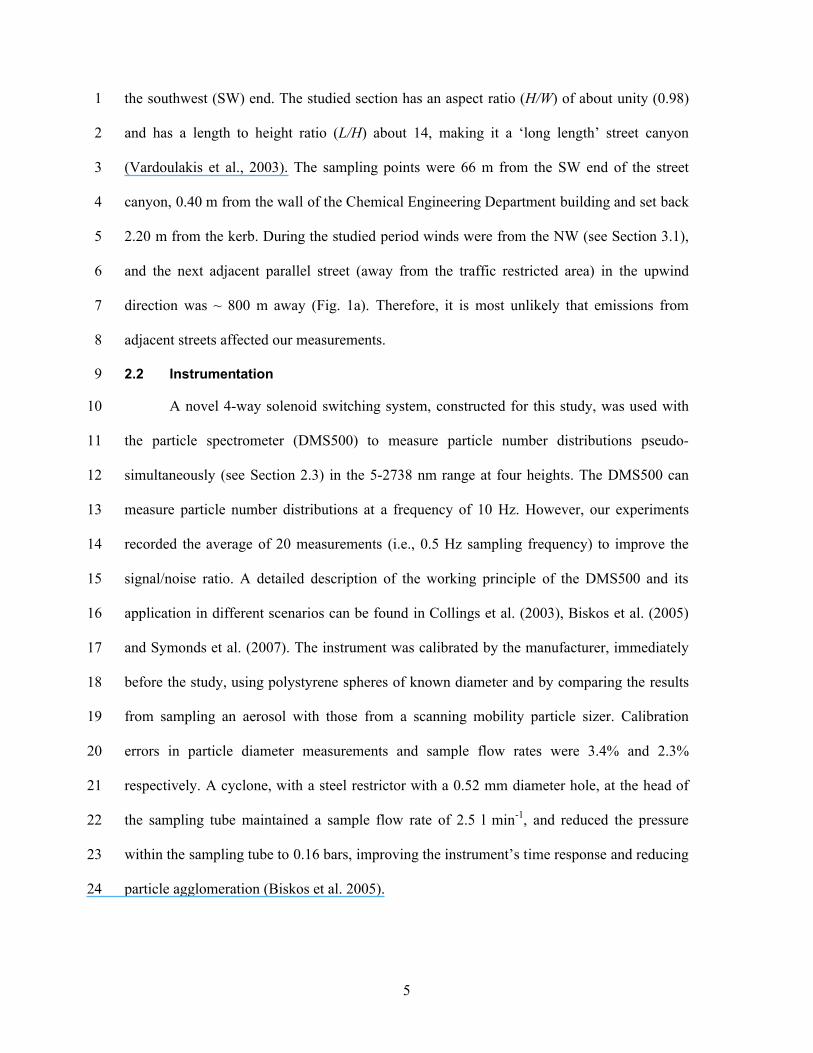
the southwest (SW) end. The studied section has an aspect ratio (H/W) of about unity (0.98) 1
and has a length to height ratio (L/H) about 14, making it a ‘long length’ street canyon 2
(Vardoulakis et al., 2003). The sampling points were 66 m from the SW end of the street 3
canyon, 0.40 m from the wall of the Chemical Engineering Department building and set back 4
2.20 m from the kerb. During the studied period winds were from the NW (see Section 3.1), 5
and the next adjacent parallel street (away from the traffic restricted area) in the upwind 6
direction was ~ 800 m away (Fig. 1a). Therefore, it is most unlikely that emissions from 7
adjacent streets affected our measurements.8
2.2 Instrumentation 9
A novel 4-way solenoid switching system, constructed for this study, was used with 10
the particle spectrometer (DMS500) to measure particle number distributions pseudo-11
simultaneously (see Section 2.3) in the 5-2738 nm range at four heights. The DMS500 can 12
measure particle number distributions at a frequency of 10 Hz. However, our experiments 13
recorded the average of 20 measurements (i.e., 0.5 Hz sampling frequency) to improve the 14
signal/noise ratio. A detailed description of the working principle of the DMS500 and its 15
application in different scenarios can be found in Collings et al. (2003), Biskos et al. (2005)16
and Symonds et al. (2007). The instrument was calibrated by the manufacturer, immediately 17
before the study, using polystyrene spheres of known diameter and by comparing the results 18
from sampling an aerosol with those from a scanning mobility particle sizer. Calibration 19
errors in particle diameter measurements and sample flow rates were 3.4% and 2.3% 20
respectively. A cyclone, with a steel restrictor with a 0.52 mm diameter hole, at the head of 21
the sampling tube maintained a sample flow rate of 2.5 l min-1, and reduced the pressure 22
within the sampling tube to 0.16 bars, improving the instrument’s time response and reducing23
particle agglomeration (Biskos et al. 2005). 24
6
The switching system was designed to take pseudo-simultaneous measurements by 1
automatically switching the sampling flow between each height once every 60 seconds, 2
though it was capable of switching times between 20 and 150 seconds. 3
An automatic vortex, pole mounted, 3-cup anemometer (Windware, UK, maximum 4
measurable wind speed 56 m s-1 ) recorded the wind speed 5 m above the rooftop (i.e., 16.60 5
m above road level). A wireless weather station (Thermor, UK) 4.62 m above road level6
recorded ambient temperature, humidity, atmospheric pressure, wind speed and direction. 7
Readings from the Cambridge University operated AT&T weather station were correlated 8
with these local observations, which were found to be in reasonable agreement, these 9
readings were used to determine the wind direction.10
2.3 Measurements11
Measurements were recorded continuously for 24 hours (16:00 to 16:00 h), between 12
the 20th and 21st March 2007, at four different heights (z) (1.00, 2.25, 4.62 and 7.37 m; 13
referred to as z/H = 0.09, 0.19, 0.40 and 0.64 respectively). To reduce particle losses in the 14
sampling tubes and to reduce the lag-times, four independent sampling heads were used, one 15
at each height. All four heads were mounted on a single pole, which was securely fastened to 16
the building using guy ropes. It was thought to be unwise to leave the pole and sampling 17
heads unattended so one or two of the researchers constantly observed the system. It is for 18
this reason that the study only took place over one 24-hour period. A DMS500 was used 19
with the switching system that changed the sample height once every 60 seconds taking a 20
total of 15 measurements in one hour at each height. The results for the first 15 seconds of 21
each 60-second sample were discarded to enable the previous sample to clear from the 22
sampling tube and to equilibrate the pressure within the sampling tube. Exactly simultaneous 23
measurements at each height could not be performed because only one instrument was 24
available, but since the sampling was done in 360 separate time periods in total during the 25

7
measurements whilst the PNC changed in an essentially random manner with respect to time, 1
sufficient measurements were made to draw conclusions on the vertical variations of the PNC 2
with height.3
The wind speed was recorded every minute during the entire sampling period both 4
within the street (at 4.62 m or z/H = 0.40; hereafter called Us) and above the rooftop (i.e., at 5
16.6 m or z/H =1.43; hereafter called Ur). Outdoor temperature, relative humidity and 6
pressure were recorded approximately every 15 minutes Traffic volumes were sampled 7
through the measurement period by a movement sensitive CCTV camera. Manual traffic 8
counts were also made throughout the day to ensure that the sampling was reliable. 9
2.4 Particle losses in tubes10
Four different lengths (5.17, 5.55, 8.90 and 13.40 m; referred to as L1, L2, L3 and L411
respectively, 7.85 mm internal diameter) of thermally and electrically conductive sampling 12
tube, made of silicon rubber to which carbon has been added, were used to obtain samples 13
from each of the sampling heights. To quantify the particle losses in these tubes together with 14
the switching system, particle measurements were made, using the same time frequency, etc,15
from a stationary diesel engined car’s exhaust (at a distance of approximately 500 mm), and 16
compared with separately taken measurements using a reference tube of much shorter length 17
(Lref = 1.0 m). We assumed that the losses in Lref would be equivalent to the losses in first 18
meter of each of the other 4 tubes, and determined the losses in each tube relative to their 19
“corrected” length (i.e. their actual length minus 1 m). The size-dependent penetrations for 20
the effective length of different tubes were then defined as the number concentration through 21
the effective L1, L2, L3 and L4 of tube divided by the number concentration through the Lref of 22
tube. A correlation for penetration as a function of effective length and particle diameter was 23
determined and was used to estimate the penetration for the actual lengths used. The 24
penetrations for each tube length are shown in Fig. 2. Particle losses below 10 nm diameter 25
8
are highly significant; as high as ~80% for L4, so have been discarded for subsequent 1
analysis. Particle losses between 10 nm and 20 nm ranges are significant; size dependent 2
corrections have been made for this range. No corrections were performed for particle sizes 3
greater than 20 nm. Comparison of experimental results with laminar and turbulent flow 4
regime models (Hinds, 1999) were also made. The results were better described by the 5
turbulent flow model, even though the Reynolds number in all the sample line lengths was 6
within the laminar regime. 7
3. Results and Discussions8
3.1 Meteorology and traffic volume during experiments9
The variation of the rooftop (Ur) and in-street (Us) wind speeds during the sampling 10
period is shown in Fig 3. The hourly-averaged values of Ur and Us over the entire sampling 11
period were 3.1 0.8 m s-1 and 0.3 0.2 m s-1 respectively. The values of Us were found to 12
be well correlated to Ur (i.e., Us ranged between 0.10 Ur and 0.15 Ur). This value of Us seems 13
to be considerably smaller than expected. The typical recirculation velocity is 1/3-1/2 of Ur14
for a street canyon of near unity aspect ratio with Ur perpendicular to the street axis and 15
exceeds 1.5-2 m s-1 (Britter and Hanna, 2003). 16
Figure 4 shows the wind rose diagram for the one-minute averaged Ur for the entire 17
sampling period. The predominant wind direction was from the NW (i.e. a cross-canyon flow 18
perpendicular to the street axis). Measurement points were on the leeward side of the street 19
canyon (Fig. 1). Table 1 shows the frequency of the one minute averaged Ur at different 20
heights. For most of the time (88%), Ur was between 1.5 m s-1 and 4.5 m s-1. It exceeded this 21
range for 8% of the time, and was less than 1.5 m s-1 for only 4%. 22
The hourly average traffic volume through the test site was determined over the 23
sampling period (mean 536 veh h-1, standard deviation 266 veh h-1). Traffic volume was 24
smallest between 00:00 h and 07:00 h (mean 204 veh h-1, standard deviation 70 veh h-1) and 25

9
was largest between 07:00 h and 16:00 h (mean 758 veh h-1, standard deviation190 veh h-1). 1
Between 17:00 h and 24:00 h the hourly average and standard deviation were 501 veh h-1 and 2
111 veh h-1 respectively. The maximum traffic volume occurred between 08:00 h and 09:00 h 3
at 1092 veh h-1; the minimum (140 veh h-1) was between 00:00 and 01:00 h. These traffic 4
volumes were generally consistent with traffic volumes on other weekdays that were 5
collected as a part of a wider experimental campaign. Traffic speed was manually measured 6
to be 30 ± 7 km h-1. Since the SW end of the street canyon had a free flow of traffic, periods 7
of congestion were rarely observed. 8
3.2 Vertical variations of particle number distributions (PND) and particle number 9
concentrations (PNC)10
Figure 5 (a-d) shows the mean PNDs at each height throughout the measurement 11
period. The PNDs could be described as consisting of distinct populations in different modes 12
and quantified with their total particle number, geometric mean diameter and shape. The 13
modes were categorized as nucleation (10 - 30 nm, N10-30), accumulation (30 - 300 nm, N30-14
300) or coarse (300 – 2738, N300-2738) particles. Nucleation mode particles are believed to be 15
formed by gas-to-particle conversion after rapid cooling and dilution of exhaust emissions 16
when the saturation ratio of gaseous compounds of low volatility (e.g., sulphuric acid) 17
reaches a maximum (Charron and Harrison, 2003). Accumulation mode particles are formed18
in the combustion chamber (with associated condensed organic matter); they are composed of 19
carbonaceous agglomerates (soot particles) and ash coming mainly from diesel engined or 20
direct injection gasoline engined vehicles (Graskow et al., 1998). A fraction of these particles 21
(those between 30 and 100 nm, called Aitken mode particles) arise from the growth or 22
coagulation of nucleation mode particles, and are also produced in high numbers by primary 23
combustion sources such as vehicle exhausts (Kulmala et al., 2004). Coarse particles are 24

10
mainly produced from brake wear, tyre wear and the resuspension of particles by traffic- and 1
wind-produced turbulence.2
The PNDs at each height were bimodal with each mode having a lognormal form. 3
Two distinct modes peaking at 13.3 nm (nucleation mode) and 86.6 nm (accumulation mode) 4
were seen at each height (Fig. 5 a-d). The shape of the PNDs at each height were similar but 5
the maximum height of PNDs was seen at z/H = 0.19 decreasing towards the lowest (z/H = 6
0.09) and the highest (z/H = 0.64) sampling heights. The similarity in shape and negligible 7
shift in peak and geometric mean diameter of PNDs in both modes at each height suggest that 8
transformation processes were generally complete by the time the particles were measured 9
and total particle numbers were conserved. Variations in PNDs with height were believed to 10
be due to dilution and mixing caused by wind-produced and traffic-produced turbulence, and 11
the removal processes at the road and rooftop levels and the walls rather than particle 12
transformation processes. The relevance of various particle transformation and removal 13
processes are estimated from time scale analyses in Section 3.5.14
It is expected that particle number concentrations will be larger in the lower part of 15
the canyon due to the presence of the emission sources. The PNCs are expected to decrease 16
with height due to removal of particles as a result of the mass exchange between the street 17
canyon and the (less polluted) wind above. Interestingly, the vertical profiles show smaller 18
PNC at z/H = 0.09 and a maximum at z/H = 0.19 in each size range, as seen in Fig. 6. It 19
should be noted that the background PNCs, which could be assumed to be the y-intercept of 20
the fit to the data (PNCs vs traffic volume) with zero traffic volume and emissions (see Table 21
3), are not subtracted before plotting the vertical profiles since these values were much 22
smaller (<10% of PNCs in each size range as shown in Table 3) than the values measured and 23
do not change the general shape of the profiles. 24

11
To compare our vertical profiles with other studies, we reviewed the literature 1
(Supplementary Table S1) showing the vertical profiles for PNCs, particle mass 2
concentrations (PM10, PM2.5) and gaseous pollutants (CO, NOx, Benzene). Most studies 3
provide data only above ~2.5 m, and above this height all show concentration decreasing with 4
height, as does our current study. However, a few studies (Micallef et al., 1998; Colls and 5
Micallef, 1999) measured PM10, PM2.5 in the lowest 3m of the canyon; their concentration 6
profiles were not monotonically decreasing with height; both the largest and the smallest 7
concentrations were observed at 1.0 m on some occasions. Conversely, our previous study 8
(Kumar et al., 2008) covered only the first 2.60 m of the canyon, and the concentrations were 9
found to be decreasing with height. Similarly, Li et al. (2007) reported concentrations at 1.5 10
m, and found the exponential decrease in concentrations with height though the difference in 11
the their first and second measurement points are quite high (i.e., 1.5 and 8 m). Both studies 12
represent asymmetric canyons where the mixing and flow conditions would be different from 13
the symmetric canyon studied here. Similar to our current work, profiles were shown by 14
Weber et al. (2006) with the largest PM10 and PM2.5 at 3.9 m, decreasing towards road level 15
(2.5 m) and rooftop (8.84 m). Furthermore, Longley et al. (2004b) reported the largest PNCs 16
(10-487 nm) at 10 m on some occasions, decreasing towards road (3.5 m) and rooftop (18 m) 17
levels. Apart from differences in canyon geometry, the main difference for our study is that 18
the traffic flow was one-way as compared with two-way traffic in most other studies. Also, 19
the present study only represents the cross canyon (NW, leeward situation) winds as 20
compared with several other wind conditions in other studies.21
Some possibilities are proposed for the smaller concentrations at z/H = 0.09 than at 22
z/H = 0.19. Firstly, ignoring the effect of traffic produced turbulence (likely to be similar at 23
the first two sampling heights), dilution and dry deposition are the important processes, as 24
evident from their time scales (see Section 3.5). Dilution can also be assumed to be 25
12
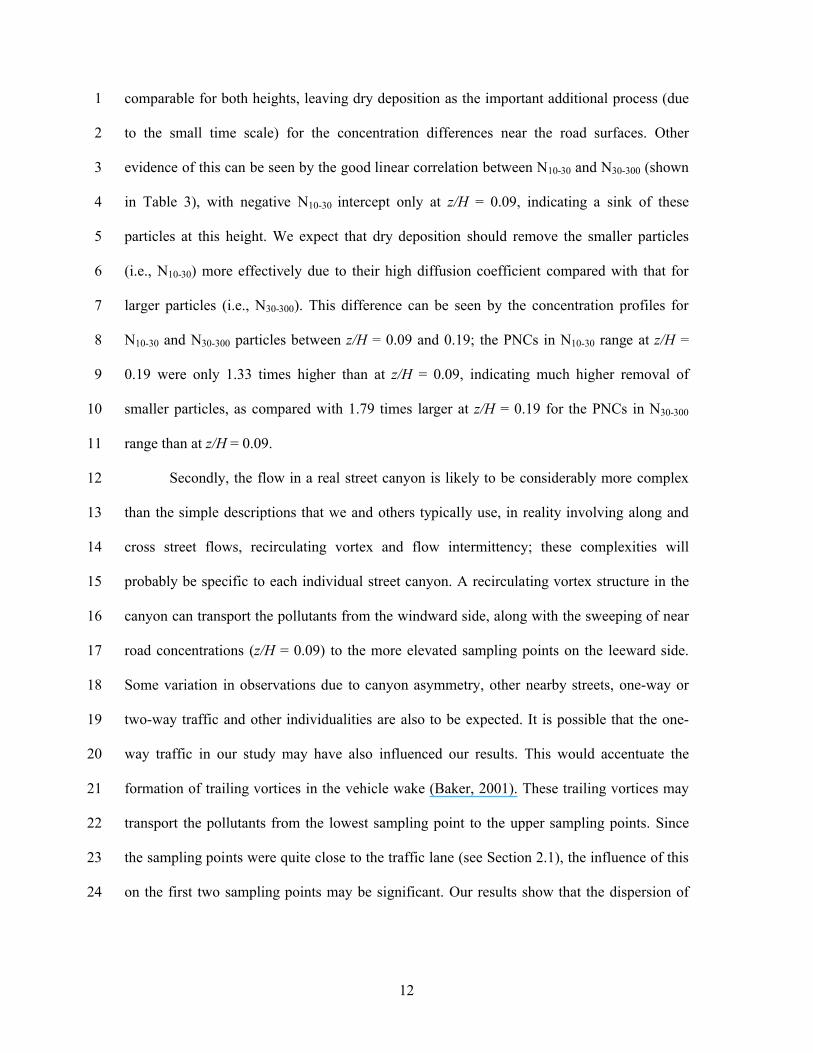
comparable for both heights, leaving dry deposition as the important additional process (due 1
to the small time scale) for the concentration differences near the road surfaces. Other 2
evidence of this can be seen by the good linear correlation between N10-30 and N30-300 (shown 3
in Table 3), with negative N10-30 intercept only at z/H = 0.09, indicating a sink of these 4
particles at this height. We expect that dry deposition should remove the smaller particles 5
(i.e., N10-30) more effectively due to their high diffusion coefficient compared with that for6
larger particles (i.e., N30-300). This difference can be seen by the concentration profiles for7
N10-30 and N30-300 particles between z/H = 0.09 and 0.19; the PNCs in N10-30 range at z/H = 8
0.19 were only 1.33 times higher than at z/H = 0.09, indicating much higher removal of 9
smaller particles, as compared with 1.79 times larger at z/H = 0.19 for the PNCs in N30-30010
range than at z/H = 0.09.11
Secondly, the flow in a real street canyon is likely to be considerably more complex 12
than the simple descriptions that we and others typically use, in reality involving along and 13
cross street flows, recirculating vortex and flow intermittency; these complexities will 14
probably be specific to each individual street canyon. A recirculating vortex structure in the 15
canyon can transport the pollutants from the windward side, along with the sweeping of near 16
road concentrations (z/H = 0.09) to the more elevated sampling points on the leeward side. 17
Some variation in observations due to canyon asymmetry, other nearby streets, one-way or 18
two-way traffic and other individualities are also to be expected. It is possible that the one-19
way traffic in our study may have also influenced our results. This would accentuate the 20
formation of trailing vortices in the vehicle wake (Baker, 2001). These trailing vortices may 21
transport the pollutants from the lowest sampling point to the upper sampling points. Since 22
the sampling points were quite close to the traffic lane (see Section 2.1), the influence of this 23
on the first two sampling points may be significant. Our results show that the dispersion of 24

13
pollutants in the lower part of the canyon may not be straightforward and there is clearly a 1
need for further more detailed studies.2
3.3 Vertical variations of particle mass distributions (PMDs) and concentrations 3
(PMCs) with height 4
Particle mass distributions (dM/dlogDp) were obtained by multiplying the “corrected” 5
number distribution (dN/dlogDp) by mass per particle M(Dp) (Park et al., 2003) i.e., 6
PP
P Dd
dNDM
Dd
dM
log)(
log (1)7
Detailed description of the estimation of M(Dp) can be seen in Symonds et al. (2007) and 8
Park et al. (2003). The density of particles is assumed to be 1 gm cm-3. The hourly-averaged 9
PMDs at each height for the entire sampling period are shown in Fig. 7 (a-d). The PMDs at 10
each height were similar in shape, with a large PMD peak at 183 ± 46 nm and another at 649 11
nm. As with the PNDs, the highest PMDs were observed at z/H = 0.19, with peaks at 237 nm 12
and 649 nm. Using the corrected PMDs, particle mass concentrations (PMC) were obtained 13
in two broad categories i.e., PM1 (mass concentrations of particles having Dp≤1000 nm) and 14
PM2.7 (mass concentrations for the fraction of particles having 1000 nm<Dp≤2738 nm) for 15
further analysis. Since at all heights, the PMDs showed maximum mass in the 30-300 nm 16
range, the PMCs in this range (PM0.03-0.3) were also derived (Fig. 9). Hourly-averaged values 17
for PM2.7 and PM1 over the entire sampling period at all heights were 51% and 49% of total 18
mass respectively. The proportion changed to 58% and 42% at z/H = 0.09; this was expected 19
because of the larger amount of coarse particles near to the street level. Otherwise, this 20
proportion was consistent at z/H = 0.19, 0.40 and 0.64 having about 48 ± 0.58% and 52 ± 21
0.58% of total mass for PM2.7 and PM1 respectively. As also expected, PM0.03-0.3 contributed 22
significantly (67 ± 9%) to PM1 mass at each height. The PMCs for the nucleation mode 23
(those between 10 and 30 nm range) contributed much less (4.1 ± 1.9%) to the PM1 at each 24
height. It is important to note that the PM2.7 mass, which is similar to the PM1 mass, 25
14
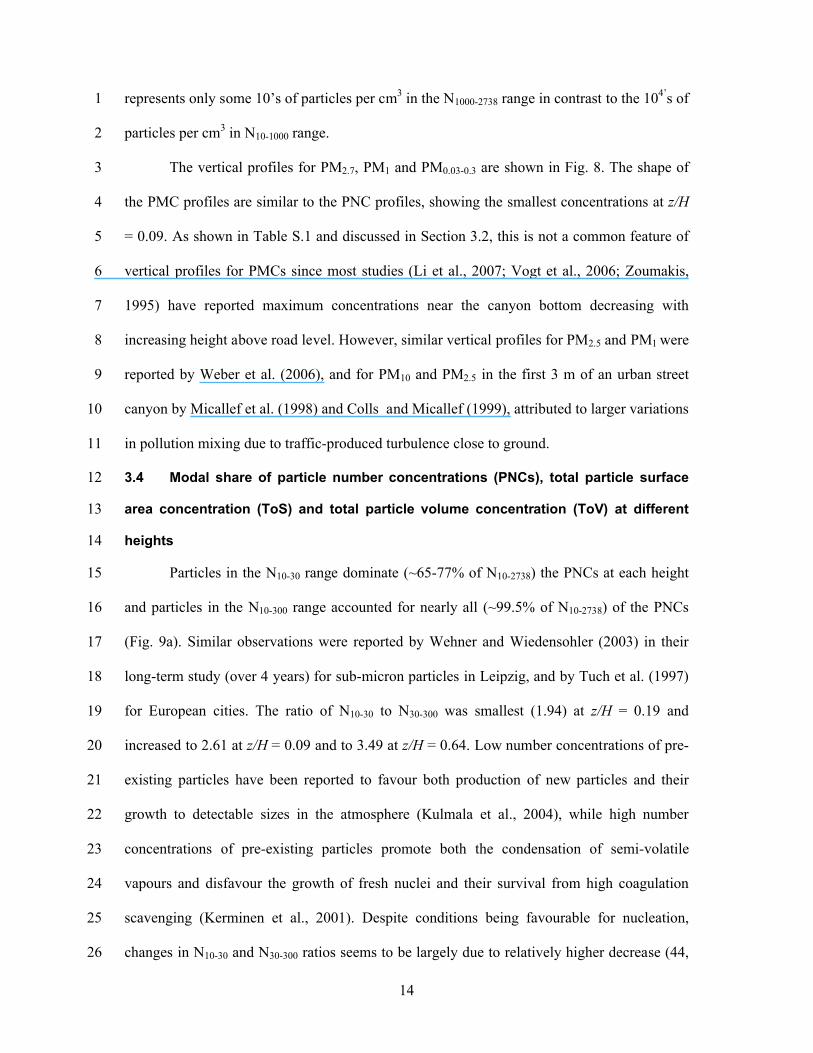
represents only some 10’s of particles per cm3 in the N1000-2738 range in contrast to the 104’s of 1
particles per cm3 in N10-1000 range.2
The vertical profiles for PM2.7, PM1 and PM0.03-0.3 are shown in Fig. 8. The shape of 3
the PMC profiles are similar to the PNC profiles, showing the smallest concentrations at z/H4
= 0.09. As shown in Table S.1 and discussed in Section 3.2, this is not a common feature of 5
vertical profiles for PMCs since most studies (Li et al., 2007; Vogt et al., 2006; Zoumakis, 6
1995) have reported maximum concentrations near the canyon bottom decreasing with 7
increasing height above road level. However, similar vertical profiles for PM2.5 and PM1 were 8
reported by Weber et al. (2006), and for PM10 and PM2.5 in the first 3 m of an urban street 9
canyon by Micallef et al. (1998) and Colls and Micallef (1999), attributed to larger variations 10
in pollution mixing due to traffic-produced turbulence close to ground. 11
3.4 Modal share of particle number concentrations (PNCs), total particle surface 12
area concentration (ToS) and total particle volume concentration (ToV) at different 13
heights14
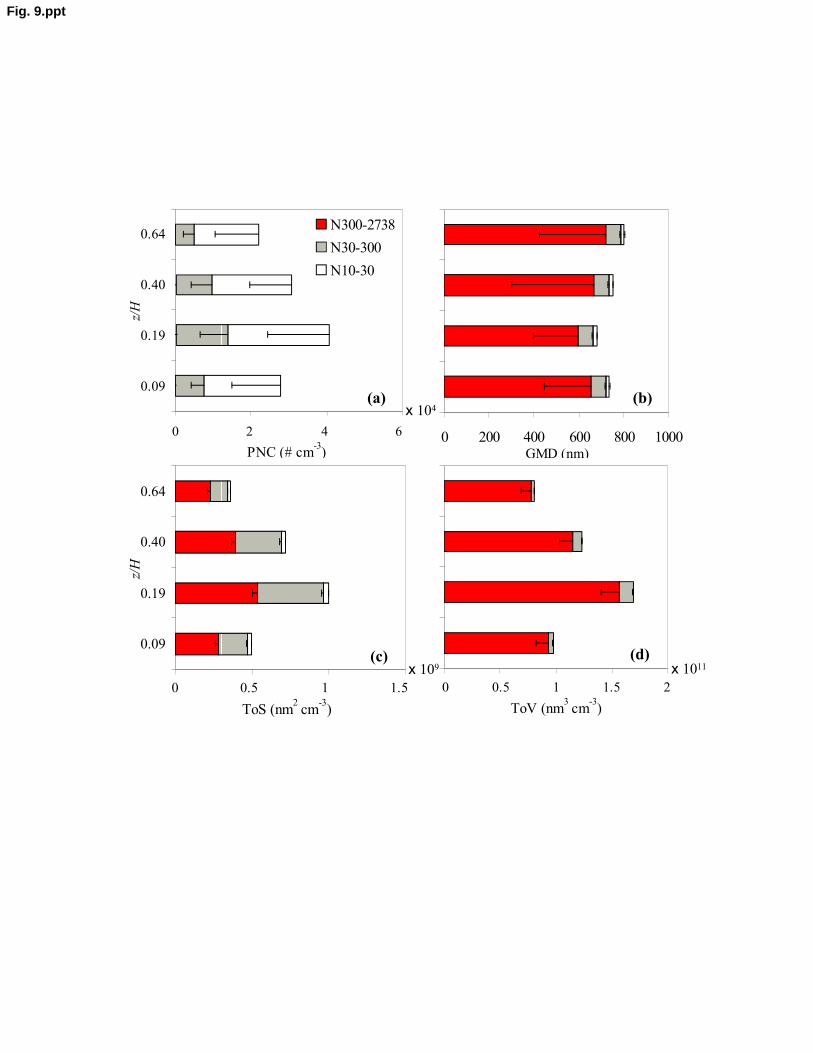
Particles in the N10-30 range dominate (~65-77% of N10-2738) the PNCs at each height 15
and particles in the N10-300 range accounted for nearly all (~99.5% of N10-2738) of the PNCs 16
(Fig. 9a). Similar observations were reported by Wehner and Wiedensohler (2003) in their 17
long-term study (over 4 years) for sub-micron particles in Leipzig, and by Tuch et al. (1997)18
for European cities. The ratio of N10-30 to N30-300 was smallest (1.94) at z/H = 0.19 and 19
increased to 2.61 at z/H = 0.09 and to 3.49 at z/H = 0.64. Low number concentrations of pre-20
existing particles have been reported to favour both production of new particles and their 21
growth to detectable sizes in the atmosphere (Kulmala et al., 2004), while high number 22
concentrations of pre-existing particles promote both the condensation of semi-volatile 23
vapours and disfavour the growth of fresh nuclei and their survival from high coagulation 24
scavenging (Kerminen et al., 2001). Despite conditions being favourable for nucleation, 25
changes in N10-30 and N30-300 ratios seems to be largely due to relatively higher decrease (44, 26

15
32 and 64% at z/H = 0.09, 0.40 and 0.64 respectively from z/H = 0.19) in PNCs in the N30-3001
range due to dilution as compared with PNCs decrease (25, 20 and 36% at z/H = 0.09, 0.40 2
and 0.64 respectively from z/H = 0.19) in N10-30 range.3
The geometric mean diameters (GMDs) in Fig. 9b, averaged over the entire sampling 4
period and all heights, in the N10-30 and N30-300 size ranges were consistently 16.4 ± 0.9 nm 5
and 64.7 ± 5.1 nm respectively. However, the GMD in the N300-2738 size range was 661 ± 268 6
nm, showing large variation, probably due to the limited number of particles in that data set. 7
The total particle surface area and volume concentrations (ToS and ToV) in Figures 9c and 8
9d reflect the PNC but with increased weighting towards larger particles. 9
3.5 Time scale analysis for various transformation processes10
As discussed in Section 3.4, removal and transformation processes such as dry 11
deposition, coagulation and condensation may be important for changing the particle number 12
concentrations and the associated total particle number (ToN), total particle surface area 13
concentrations (ToS) and total particle volume concentrations (ToV) in any size range. 14
Though these processes are not treated in detail here, we have estimated the time scales for 15
these processes to give a first indication of their relevance on the PNCs at different heights, 16
and to test the above assumed (Section 3.2) hypothesis that the transformation processes 17
(except possibly condensation) were generally complete by the time particles were measured 18
and the particle numbers were also conserved. These time scales might be thought of a 19
relative measure of the time taken to reduce the concentration of particles in the street, if the 20
source was turned off. Thus a short time scale indicates a strong process. The main body of 21
these detailed calculations is available in the supplementary Section S.1; the conclusions are 22
summarised here. 23
The deduced time scales were of the order of 40 s for dilution, 30s and 130s for dry 24
deposition to the road surface and 600s and 2600s for the dry deposition to the road walls for 25

16
the N10-30 and N30-300 ranges respectively. For coagulation the time scale for N10-30 particles 1
was of the order of 105 s and for N30-300 it was of order 5 x 10⁵ s. For condensation the time 2
scales were of the order of 105 s to 104 s for extreme growth rates 1 and 20 nm h-13
respectively.4
Comparison of the estimated dilution time scale with those for other processes shows 5
that dilution is comparatively quick and does not allow other processes (with the exception of 6
dry deposition on road surface) sufficient time to act and alter the particle number 7
distributions. This supports our proposed hypothesis that transformation processes are not 8
important for changing the PNDs at different heights. As noted, dry deposition on the road 9
surface does seem to be a major removal process, reducing the ToN near road level as is 10
clearly seen in vertical profiles nearest to the road level. 11
3.6 Effect of meteorology and traffic volume on particle number concentrations12
Some of the factors influencing the PNCs may be more important than others in 13
producing the hourly variations. The hourly variations of PNCs in each size range were quite 14
marked as shown in Figure 10 (a-d). The hourly average PNCs in the N10-2738 size range over 15
the entire sampling duration were maximum (4.95 x 10⁴ # cm-3) and minimum (2.19 x 10⁴ # 16
cm-3) at z/H = 0.19 and 0.64 respectively. As more than 99% of the total particles by number 17
were in the 10-300 nm size range (shown in Section 3.4) there was a negligible presence of 18
coarse particles suggesting that traffic was the main source of particles. A large peak at z/H = 19
0.19 was observed between 07:50:20 h and 07:50:48 h; this was caused by a heavy-duty 20
diesel truck standing near the sampling points. The average PNCs during this period 21
increased from overall average value of ~104 to ~107 # cm-3, resulting in an increase of 22
overall average PNCs for the entire hour (07:00-08:00 h) at this height. Similar to the diurnal 23
variation of traffic volume (Section 3.1), as expected, the lowest and the highest average 24

17
concentrations at all heights were during the periods of the lowest traffic (between 00:00 h 1
and 07:00 h) and the highest (between 07:00 h and 16:00 h) traffic volume respectively. 2
The PNCs at each height do not show strong correlation with the variation in rooftop 3
wind speed (Fig. 10 a-d). For example, the highest (17:00-18:00 h, 20th March) and the 4
lowest (16:00-17:00 h, 21st March) wind speeds correspond to very similar values (relatively 5
lower than over all average) of PNCs at each height. However, there were also the periods of 6
higher wind speeds (e.g., between 04:00-05:00 h) corresponding to the lowest PNCs, and 7
lower wind speeds (e.g., between 19:00-20:00 h) corresponding to the relatively higher 8
PNCs.9
The traffic volume and rooftop wind speed are generally the principle variables 10
influencing the PNCs in the street canyon. In order to show their effects on PNCs the PNCs 11
in N10-30, N30-300 and N300-2738 size ranges are correlated with traffic volume, as shown in 12
Table 3. PNCs linearly depended on traffic volume, showing stronger association between 13
PNCs in the N10-30 size range and traffic volume than the PNCs in N30-300 size range; however 14
the correlations were very poor for the largest particle size range (N300-2738) which could be 15
due to the limited data available for these particles, though it is also probable that many of 16
these particles were wind-blown rather than emitted directly from vehicles. Therefore, the 17
PNCs in N300-2738 size range are not considered for further analysis. 18
Considering the effects of both traffic volume and Ur on the PNCs, number 19
concentrations in any size range at various heights could be represented as:20
bUaTN nr
mji (2)21
where Ni-j are the PNCs in any size range, a, b, m and n are constants (here, m is assumed to 22
be unity), T is traffic volume; b represents background PNCs. The correlations using Eq. 523
are shown in Table 4. The values of R2 shown in Table 3 and 4 are broadly similar for both 24
18
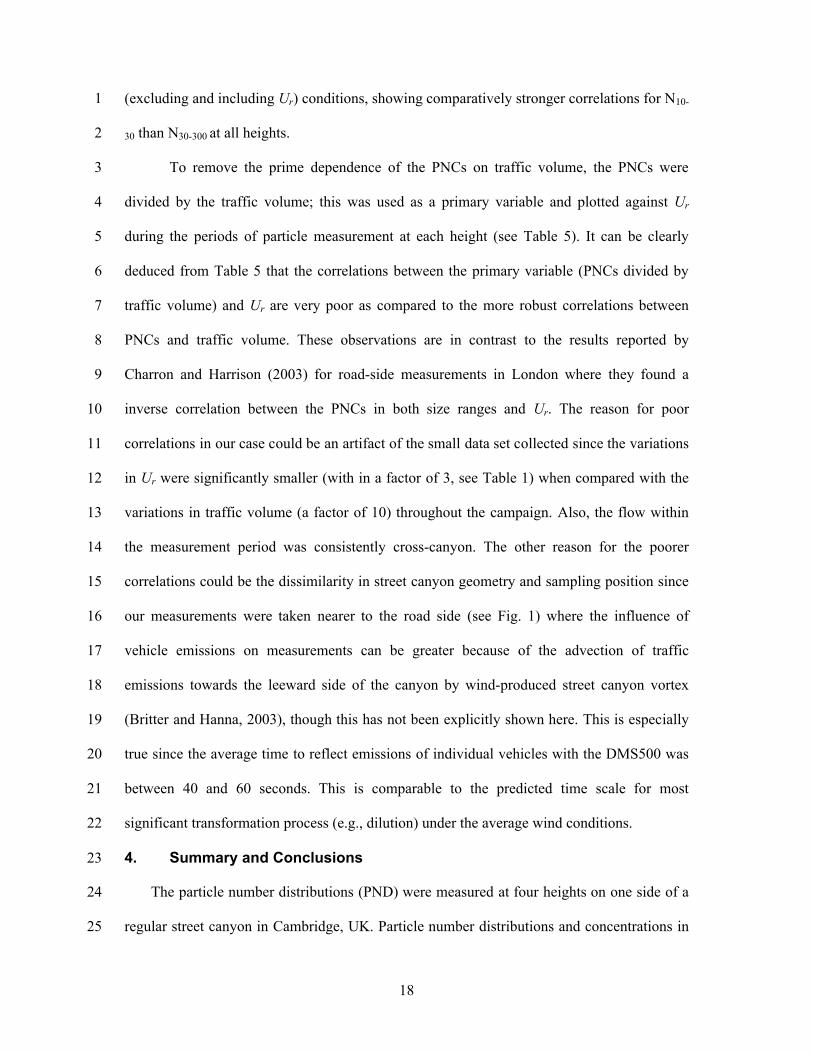
(excluding and including Ur) conditions, showing comparatively stronger correlations for N10-1
30 than N30-300 at all heights. 2
To remove the prime dependence of the PNCs on traffic volume, the PNCs were 3
divided by the traffic volume; this was used as a primary variable and plotted against Ur4
during the periods of particle measurement at each height (see Table 5). It can be clearly 5
deduced from Table 5 that the correlations between the primary variable (PNCs divided by 6
traffic volume) and Ur are very poor as compared to the more robust correlations between 7
PNCs and traffic volume. These observations are in contrast to the results reported by 8
Charron and Harrison (2003) for road-side measurements in London where they found a 9
inverse correlation between the PNCs in both size ranges and Ur. The reason for poor 10
correlations in our case could be an artifact of the small data set collected since the variations 11
in Ur were significantly smaller (with in a factor of 3, see Table 1) when compared with the 12
variations in traffic volume (a factor of 10) throughout the campaign. Also, the flow within 13
the measurement period was consistently cross-canyon. The other reason for the poorer 14
correlations could be the dissimilarity in street canyon geometry and sampling position since 15
our measurements were taken nearer to the road side (see Fig. 1) where the influence of 16
vehicle emissions on measurements can be greater because of the advection of traffic 17
emissions towards the leeward side of the canyon by wind-produced street canyon vortex 18
(Britter and Hanna, 2003), though this has not been explicitly shown here. This is especially 19
true since the average time to reflect emissions of individual vehicles with the DMS500 was 20
between 40 and 60 seconds. This is comparable to the predicted time scale for most 21
significant transformation process (e.g., dilution) under the average wind conditions. 22
4. Summary and Conclusions23
The particle number distributions (PND) were measured at four heights on one side of a 24
regular street canyon in Cambridge, UK. Particle number distributions and concentrations in 25
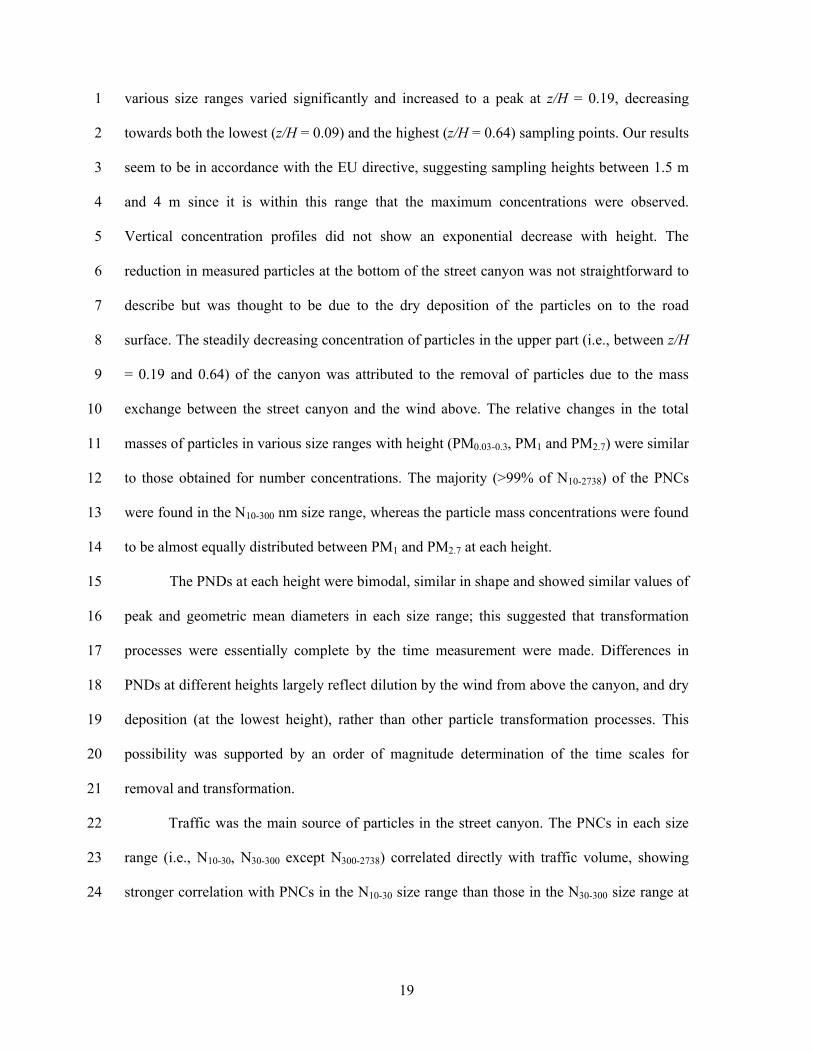
19
various size ranges varied significantly and increased to a peak at z/H = 0.19, decreasing 1
towards both the lowest (z/H = 0.09) and the highest (z/H = 0.64) sampling points. Our results 2
seem to be in accordance with the EU directive, suggesting sampling heights between 1.5 m 3
and 4 m since it is within this range that the maximum concentrations were observed. 4
Vertical concentration profiles did not show an exponential decrease with height. The 5
reduction in measured particles at the bottom of the street canyon was not straightforward to 6
describe but was thought to be due to the dry deposition of the particles on to the road 7
surface. The steadily decreasing concentration of particles in the upper part (i.e., between z/H 8
= 0.19 and 0.64) of the canyon was attributed to the removal of particles due to the mass 9
exchange between the street canyon and the wind above. The relative changes in the total 10
masses of particles in various size ranges with height (PM0.03-0.3, PM1 and PM2.7) were similar 11
to those obtained for number concentrations. The majority (>99% of N10-2738) of the PNCs 12
were found in the N10-300 nm size range, whereas the particle mass concentrations were found 13
to be almost equally distributed between PM1 and PM2.7 at each height. 14
The PNDs at each height were bimodal, similar in shape and showed similar values of 15
peak and geometric mean diameters in each size range; this suggested that transformation 16
processes were essentially complete by the time measurement were made. Differences in 17
PNDs at different heights largely reflect dilution by the wind from above the canyon, and dry 18
deposition (at the lowest height), rather than other particle transformation processes. This 19
possibility was supported by an order of magnitude determination of the time scales for 20
removal and transformation. 21
Traffic was the main source of particles in the street canyon. The PNCs in each size 22
range (i.e., N10-30, N30-300 except N300-2738) correlated directly with traffic volume, showing 23
stronger correlation with PNCs in the N10-30 size range than those in the N30-300 size range at 24

20
all heights. Little correlation was found between rooftop wind speeds and the PNC; most 1
probably due to the small range of the wind speed in our study. 2
5. Acknowledgements3
Prashant Kumar thanks the Cambridge Commonwealth Trust and Overseas Research 4
Scholarship Award for sponsoring his PhD. Professor A.N. Hayhurst and Dr. J.S. Dennis are 5
thanked for lending the DMS500. Dr. Jonathan Symonds (among others) from Cambustion 6
Ltd. is thanked for lending the sampling heads and for technical advice and assistance, as are 7
Surinder Sall and John Gannon for building the solenoid system, and John Blamey for 8
helping with the traffic measurements. 9
6. References10
AQEG, 2005. Particulate matter in the United Kingdom, AQEG. Defra London.11
Baker, C.J., 2001. Flow and dispersion in ground vehicle wakes. Journal of Fluids and Structures 15, 121031-1060.13
Bauman, S.E., Ferek, R., Williams, E.T., Finston, H.L., Ferrand, E.F., Santowski, J., 1982. Street level 14versus rooftop sampling: carbon monoxide and aerosol in New York city. Atmospheric 15Environment 16, 2489-2496.16
Biskos, G., Reavell, K., Collings, N., 2005. Description and theoretical analysis of a Differential 17Mobility Spectrometer. Aerosol Science and Technology 39 (6), 527-541.18
Boddy, J.W.D., Smalley, R.J., Dixon, N.S., Tate, J.E., Tomlin, A.S., 2005. The spatial variability in 19concentrations of a traffic-related pollutant in two street canyons in York, UK - Part I: the 20influence of background winds. Atmospheric Environment 39, 3147–3161.21
Britter, R.E., Hanna, S.R., 2003. Flow and dispersion in urban areas. Annual Review of Fluid 22Mechanics 35, 469-496.23
Charron, A., Harrison, R.M., 2003. Primary particle formation from vehicle emissions during exhaust 24dilution in the road side atmosphere. Atmospheric Environment 37, 4109-4119.25
Collings, N., Reavell, K., Hands, T., Tate, J., 2003. 194 Roadside aerosol measurements with a fast 26particle spectrometer. Society of Automobile Engineering 20035407.27
Colls, J.J., Micallef, A., 1999. Measured and modelled concentrations and vertical profiles of airborne 28particulate matter within the boundary layer of a street canyon. Science of the Total 29Environment 235, 221-233 30
Davidson, C., Phalen, R., Solomon, P., 2005. Airborne particulate matter and human health: a review. 31Aerosol Science and Technology 39, 737-749.32
EC, 1999. Council Directive 1999/30/EC of April 1999 relating to limit values for sulphur dioxide, 33nitrogen dioxide and oxides of nitrogen, particulate matter and lead in ambient air. Official 34Journal of the European Communities, 20pp.35

21
Graskow, B.R., Kittelson, D.B., Abdul-Khaleek, I.S., Ahmadi, M.R., Morris, J.E., 1998. 1Characterization of exhaust particulate emissions from a spark ignition engine. Society of 2Automotive Engineers, Warrendale, PA, 980528.3
Hinds, W.C., 1999. Aerosol technology: Properties, behaviour and measurement of airborne particles. 4John Wiley & Sons, UK.5
Kastner-Klein, P., Berkowicz, R., Britter, R., 2004. The influence of street architecture on flow and 6dispersion in street canyons. Meteorology and Atmospheric Physics 87, 121-131.7
Kerminen, V.-M., Pijrola, L., Kulmala, M., 2001. How significantly does coagulational scavenging 8limit atmospheric particle production? Journal of Geophysical Research 106, 24119-24125.9
Kim, J.-J., Baik, J.-J., 2004. A numerical study of the effects of ambient wind direction on flow and 10dispersion in urban street canyons using the RNG k-[epsiv] turbulence model. Atmospheric 11Environment 38, 3039-3048.12
Kulmala, M., Vehkamaki, H., Petaja, T., Dal Maso, M., Lauri, A., Kerminen, V.-M., Birmili, W., 13McMurry, P.H., 2004. Formation and growth rates of ultrafine particles: a review of 14observations. Journal of Aerosol Science 35, 143-176.15
Kumar, P., Britter, R., Langley, D., 2007. Street versus rooftop level concentrations of fine particles in 16a Cambridge street canyon. 6th International Conference on Urban Air Quality, Limassol, 17Cyprus, 27-29 March 2007. ISBN: 978-1-905313-46-4, 147: 135-138.18
Kumar, P., Fennell, P., Britter, R., 2008. Measurement of particles in the 5-1000 nm range close to 19road level in an urban street canyon. Science of the Total Environment 390, 437-447.20
Li, X.L., Wang, J.S., Tu, X.D., Liu, W., Huang, L., 2007. Vertical variations of particle number 21concentration and size distribution in a street canyon in Shanghai, China. Science of the Total 22Environment 378, 306-316.23
Longley, I.D., Gallagher, M.W., Dorsey, J.R., Flynn, M., 2004b. A case-study of fine particle 24concentrations and fluxes measured in a busy street canyon in Manchester, UK. Atmospheric 25Environment 38, 3595-3603.26
Longley, I.D., Gallagher, M.W., Dorsey, J.R., Flynn, M., Bower, K.N., Allan, J.D., 2004a. Street 27canyon aerosol pollutant transport measurements. Science of the Total Environment 334-335, 28327-336.29
Micallef, A., Deuchar, C.N., Colls, J.J., 1998. Indoor and outdoor measurements of vertical 30concentration profiles of airborne particulate matter. Science of the Total Environment 215, 31209-216.32
Murena, F., Vorraro, F., 2003. Vertical gradients of benzene concentration in a deep street canyon in 33the urban area of Naples. Atmospheric Environment 37, 4853-4859.34
Oberdorster, G., 2000. Toxicology of ultrafine particles: in vivo studies. Philosophical Transactions of 35the Royal Society of London A 358, 2719-2740.36
Park, K., Cao, F., Kittelson, D.B., McMurray, P.H., 2003. Relationship between particle mass and 37mobility for diesel exhaust particles. Environmental Science and Technology 37, 577-583.38
Park, S.K., Kim, S.D., Lee, H., 2004. Dispersion characteristics of vehicle emission in an urban street 39canyon. Science of the Total Environment 323, 263-271 40
Peters, A., Wichmann, H.E., 2001. Epidemiological basis for particulate air pollution health standards. 41Epidemiology 12, 544.42

22
Schauer, J.J., Hildermann, L.M., Mazurek, M.A., Cass, G.R., T., S.B.R., 1996. Source apportionment 1of airborne particulate matter using organic compounds as tracers. Atmospheric Environment 230, 3837-3855.3
Symonds, J.P.R., Reavell, K.S.J., Olfert, J.S., Campbell, B.W., Swift, S.J., 2007. Diesel soot mass 4calculations in real-time with a differential mobility spectrometer. Journal of Aerosol Science 538, 52-68.6
Tuch, T., Brand, P., Wichmann, H.E., Heyder, J., 1997. Variations of particle number and mass 7concentration in various size ranges of ambient aerosols in eastern Germany. Atmospheric 8Environment 31, 4193-4197.9
Vakeva, M., Hameri, K., Kulmala, M., Lahdes, R., Ruuskanen, J., Laitinen, T., 1999. Street level 10versus rooftop concentrations of submicron aerosol particles and gaseous pollutants in an 11urban street canyon. Atmospheric Environment 33, 1385-1397.12
Van Dingenen, R., Raes, F., Putaud, J.-P., Baltensperger, U., Charron, A., Facchini, M.-C., Decesari, 13S., Fuzzi, S., Gehrig, R., Hansson, H.-C., 2004. A European aerosol phenomenology - 1: 14physical characterstics of particulate matter at kerbside, urban, rural and background sites in 15Europe. Atmospheric Environment 38, 2561-2577.16
Vardoulakis, S., Fisher, B.R.A., Pericleous, K., Gonzalez-Flesca, N., 2003. Modelling air quality in 17street canyons: a review. Atmospheric Environment 37, 155-182.18
Vogt, R., Christen, A., Rotach, M.W., Roth, M., Satyanarayana, A.N.V., 2006. Temporal dynamics of 19CO2 fluxes and profiles over a Central European city. Theoretical and Applied Climatology 2084, 117-126.21
Weber, S., Kuttler, W., Weber, K., 2006. Flow characteristics and particle mass and number 22concentration variability within a busy street canyon. Atmospheric Environment 40, 7565-237578.24
Wehner, B., Weidensohler, A., 2003. Long term measurements of submicrometer urban aerosols: 25statistical analysis for correlations with meteorological conditions and trace gases867-879. 26Atmospheric Chemistry Physics 3, 867-879.27
Zoumakis, N.M., 1995. A note on average vertical profiles of vehicular pollutant concentrations in 28urban Street Canyons. Atmospheric Environment 29, 3719-3725.29

23
Figure Captions1
Fig. 1 (a) Map of the location of the street canyon in the Cambridge area. The measurement 2
site is marked by the green star and the dotted line covers the traffic restricted area. (b)3
Schematic diagram of Pembroke Street, showing the traffic flow and wind directions, as 4
described in text. 5
Fig. 2. Penetration of particles in different lengths of sampling tube, and their comparison 6
with laminar and turbulent regime models. Turbulent and laminar model estimates are made 7
for the following field conditions; ambient temperature 8.20C, sample flow 2.5 l min-1, 8
sample line pressure 0.16 bars, and Reynolds number 461.9
Fig. 3. Diurnal variation of hourly averaged Ur and Us. Bars show the standard deviation of 10
hourly averaged values. 11
Fig. 4. Wind rose diagram for the one minute averaged rooftop wind speed over the entire 12
sampling duration. The wind was blowing from NW during the entire sampling duration. The 13
thick black line represents the street canyon.14
Fig. 5. Hourly averaged corrected and measured particle number distributions at (a) z/H = 15
0.09 (b) z/H = 0.19 (c) z/H = 0.40 and (d) z/H = 0.64. Dotted lines represent mode fitting 16
curves to corrected PNDs. Bars show the standard deviation of the hourly averaged PNDs on 17
each height; only positive standard deviation values are plotted for the clarity of the figures.18
Fig. 6. Vertical profiles of particle number concentrations in N10-30, N30-300 and N300-2738 size 19
ranges. Bars show the standard deviation of the hourly averaged PNCs over the entire 20
sampling period. Only negative or positive standard deviations are plotted for the clarity of 21
the figures.22
Fig. 7. Hourly averaged corrected particle mass distributions at (a) z/H = 0.09 (b) z/H = 0.19 23
(c) z/H = 0.40 and (d) z/H = 0.64. The PMDs are estimated from “corrected” PNDs. Bars 24

24
show the standard deviation of the hourly averaged PMDs; only positive standard deviation 1
values are plotted for the clarity of the figures.2
Fig. 8. Vertical profiles of particle mass concentrations in various size ranges. Bars show the3
standard deviation of the hourly averaged PMCs. Only positive or negative standard 4
deviations are plotted for the clarity of the figures.5
Fig. 9. Hourly averaged (a) particle number concentrations (b) geometrical mean diameters of 6
PNCs (c) total particle surface area concentrations and (d) total particle volume 7
concentrations in different size ranges at each height. Bars show the standard deviation of the 8
hourly averaged values. Only negative standard deviations are plotted for the clarity of the 9
figures. 10
Fig. 10. Diurnal variation of the hourly averaged rooftop wind speed and particle number 11
concentrations in various size ranges at (a) z/H = 0.09 (b) z/H = 0.19 (c) z/H = 0.40 and (d) 12
z/H = 0.64, starting from 16:00 h on 20th March till 16:00 h on 21st March 2007. Particle 13
number concentrations are the one-minute average of measurements taken at each height 14
during each hour, and the wind speeds on each height are the one minute average during the 15
periods of particle measurements at each height.16
25
Tables1
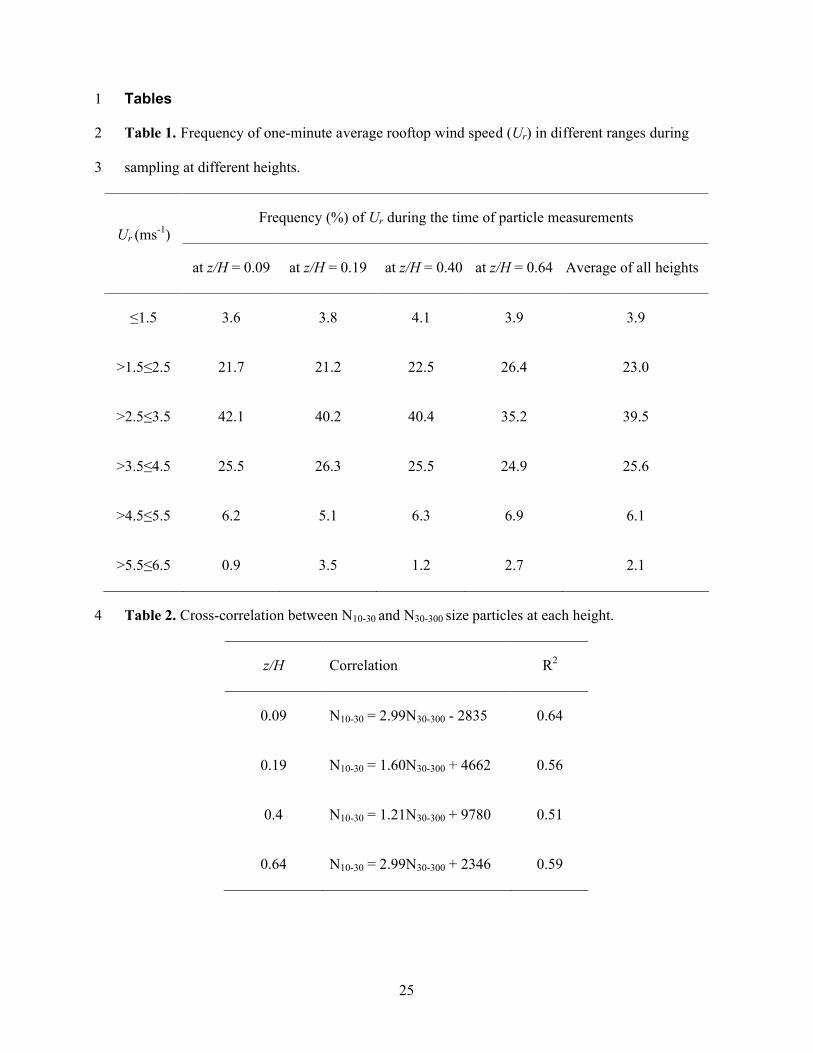
Table 1. Frequency of one-minute average rooftop wind speed (Ur) in different ranges during 2
sampling at different heights. 3
Frequency (%) of Ur during the time of particle measurements Ur (ms-1)
at z/H = 0.09 at z/H = 0.19 at z/H = 0.40 at z/H = 0.64 Average of all heights
≤1.5 3.6 3.8 4.1 3.9 3.9
>1.5≤2.5 21.7 21.2 22.5 26.4 23.0
>2.5≤3.5 42.1 40.2 40.4 35.2 39.5
>3.5≤4.5 25.5 26.3 25.5 24.9 25.6
>4.5≤5.5 6.2 5.1 6.3 6.9 6.1
>5.5≤6.5 0.9 3.5 1.2 2.7 2.1
Table 2. Cross-correlation between N10-30 and N30-300 size particles at each height.4
z/H Correlation R2
0.09 N10-30 = 2.99N30-300 - 2835 0.64
0.19 N10-30 = 1.60N30-300 + 4662 0.56
0.4 N10-30 = 1.21N30-300 + 9780 0.51
0.64 N10-30 = 2.99N30-300 + 2346 0.59

26
Table 3. Correlation between the PNCs in various size ranges and traffic volume (T) at 1
different sampling heights.2
z/H N10-30 = N30-300 = N300-2738 =
0.09 30.8 T + 1986 (R2 = 0.66) 7.7 T + 3321 (R2 = 0.58) -0.02 T + 90 (R2 = 0.01)
0.19 39.1 T + 3435 (R2 = 0.66) 16.1 T + 4053 (R2 = 0.50) 0.1 T + 210 (R2 = 0.04)
0.40 24.1 T + 6963 (R2 = 0.54) 8.7 T + 3970 (R2 = 0.31) 0.13 T + 111 (R2 = 0.09)
0.64 24.5 T + 2428 (R2 = 0.52) 4.6 T + 2062 (R2 = 0.28) -0.01 T + 34 (R2 = 0.01)
Table 4. Correlations of PNCs in various size ranges with traffic volume and Ur.3
For N10-30 For N30-300
z/H
a m n b R2 a m n b R2
0.09 39 1 -0.14 2044 0.67 6 1 -0.23 3186 0.54
0.19 133 1 -0.98 3095 0.76 35 1 -0.43 3980 0.52
0.40 70 1 -0.64 6481 0.55 15 1 -0.04 4329 0.30
0.64 74 1 -0.87 2228 0.57 7 1 -0.02 2061 0.28

27
Table 5. Correlations between the product of PNCs in various size ranges and inverse of 1
traffic volume, and the Ur at different heights.2
z/H N10-30/T = N30-300/T =
0.09 47.3 Ur-0.23 (R2 = 0.01) 19.5 Ur
-0.21 (R2 = 0.19)
0.19 107.1 Ur-0.67 (R2 = 0.12) 27.8 Ur
-0.01 (R2 = 0.01)
0.40 82.4 Ur-0.64 (R2 = 0.06) 19.1 Ur
-0.01 (R2 = 0.01)
0.64 42.7 Ur-0.33 (R2 = 0.01) 9.6 Ur
-0.01 (R2 = 0.04)
3
N
Wind direction from NW
Sampling Site
(a)
Kerb
Winds from NW
2.25 m
7.37 m
4.62 m
Weather Station3-cup vortex anemometer
Traffic flow (down-canyon) W = 11.75 m
66 m
Chemical Engineering
Measurement siteH 11.60 m 2.60 m
2.50 m
(Figures not to scale)
Leeward side Windward side
Pembroke College
L 167 m
NW
NE
SE
SWWind11.60 m
16.60 m
1.00 m
(b)
Fig. 1.ppt

0
20
40
60
80
100
1 10 100 1000 10000Dp (nm)
Pen
etra
tion
(%
) Experiments (L2)
0
20
40
60
80
100
1 10 100 1000 10000Dp (nm)
Pen
etra
tion
(%
)
Experiments (L1)Laminar modelTurbulent model
0
20
40
60
80
100
1 10 100 1000 10000
Pen
etra
tion
(%
)
Experiments (L3)
1 10 100 1000 10000Dp (nm)
Experiments (L4)
(a) (b)
(c) (d)
Dp (nm)
Pen
etra
tion
(%)
Fig. 2.ppt

0
2
4
6
16
:00
-17
:00
18
:00
-19
:00
20
:00
-21
:00
22
:00
-23
:00
00
:00
-01
:00
02
:00
-03
:00
04
:00
-05
:00
06
:00
-07
:00
08
:00
-09
:00
10
:00
-11
:00
12
:00
-13
:00
14
:00
-15
:00
Time (Hrs)
Ur
(m s
-1)
0
2
4
6
Us
(m s
-1)
UrUs
Fig. 3.ppt

25% 50% 75% 100%Wind Frequency (%)
≤1.5 m s-1
>1.5≤2.5 m s-1
>3.5≤4.5 m s-1
>2.5≤3.5 m s-1
N
S
>4.5≤5.5 m s-1
>5.5≤6.5 m s-1
Wind Speed
NW
Fig. 4.ppt

0.E+00
2.E+04
4.E+04
6.E+04
8.E+04
1.E+05
1 10 100 1000 10000Dp (nm)
dN
/dlo
gD
p (
cm-3
)
CorrectedMeasuredFitted modes
(a) z/H = 0.09
0.E+00
2.E+04
4.E+04
6.E+04
8.E+04
1.E+05
1 10 100 1000 10000
dN/d
logD
p (c
m-3
)
1 10 100 1000 10000
z/H = 0.19 (b)
z/H = 0.40 (c) z/H = 0.64 (d)
D p (nm)
dN/d
log
Dp
(cm
-3)
0
2
4
6
8
10
0
2
4
6
8
10
x 104
x 104
Fig. 5.ppt

0
0.2
0.4
0.6
0.8
1z/
HN10-30N30-300N300-2738
0 150 300 450
0 2 4 6
PNC (# cm-3
)
x 104
Fig. 6.ppt

0.E+00
2.E-06
4.E-06
6.E-06
8.E-06
1 10 100 1000 10000Dp (nm)
dM/d
logD
p (µ
gm c
m-3
) z/H=0.19
0.E+00
2.E-06
4.E-06
6.E-06
8.E-06
1 10 100 1000 10000Dp (nm)
dM/d
logD
p (µ
gm c
m-3
) z/H=0.64
(b)
(d)1 10 100 1000 10000
Dp (nm)
z/H=0.09
1 10 100 1000 10000Dp (nm)
z/H=0.40
dM/d
log
Dp
(µ
gm c
m-3
)
D p (nm)
(c)
(a)
0
2
4
6
8
0
2
4
6
8
x 10-6
x 10-6
z/H = 0.19
z/H = 0.40 z/H = 0.64
z/H = 0.09
Fig. 7.ppt

0 0.5 1 1.5 2
Particle mass concentrations (µgm cm-3)
0.0
0.2
0.4
0.6
0.8
1.0z/
HPM1PM2.5PM0.03-0.3
x 10-5
Fig. 8.ppt
(d)
0 200 400 600 800 1000GMD (nm)
(b)
0 0.5 1 1.5
ToS (nm2
cm-3
)
0 0.5 1 1.5 2
ToV (nm3
cm-3
)
0 2 4 6
PNC (# cm-3
)
0.09
0.19
0.40
0.64
z/H
N300-2738
N30-300
N10-30
x 104(a)
0.09
0.19
0.40
0.64
z/H
x 109 x 1011(c) (d)
Fig. 9.ppt

0
1
2
3
4
5N300-2738N30-300N10-30Ur
0
1
2
3
4
5
16:0
0-17
:00
18:0
0-19
:00
20:0
0-21
:00
22:0
0-23
:00
00:0
0-01
:00
02:0
0-03
:00
04:0
0-05
:00
06:0
0-07
:00
08:0
0-09
:00
10:0
0-11
:00
12:0
0-13
:00
14:0
0-15
:00
16:0
0-17
:00
18:0
0-19
:00
20:0
0-21
:00
22:0
0-23
:00
00:0
0-01
:00
02:0
0-03
:00
04:0
0-05
:00
06:0
0-07
:00
08:0
0-09
:00
10:0
0-11
:00
12:0
0-13
:00
14:0
0-15
:00
Ur
(m s
-1)
Time (Hrs)
z/H = 0.40 (c) z/H = 0.64 (d)
z/H = 0.19 (b)z/H = 0.09 (a)
PN
C (
# cm
-3)
0
0.3
0.6
0.9
1.2
1.5 x 10⁵
0
0.3
0.6
0.9
1.2
1.5 x 10⁵
Fig. 10.ppt

Supplementary Material (e-component)Click here to download e-component: Supplementary Material.doc