formal fire safety assessment of passenger ships
261
Liverpool John Moores University School of Engineering FORMAL FIRE SAFETY ASSESSMENT OF PASSENGER SHIPS By Soo W oong Kim BEng Thesis submitted for Degree of Doctor of Philosophy April, 2005
-
Upload
khangminh22 -
Category
Documents
-
view
5 -
download
0
Transcript of formal fire safety assessment of passenger ships
Liverpool John Moores University
School of Engineering
FORMAL FIRE SAFETY ASSESSMENT OF
PASSENGER SHIPS
By
Soo W oong Kim BEng
Thesis submitted for Degree of Doctor of Philosophy
April, 2005

ACKNOWLEDGEMENTS
During the course of the research, it is with much gratitude and sincere respect that I
acknowledge and thank my principal supervisor, Professor Jin Wang and co
supervisors, Dr. Alan Wall and Professor David Burton of the School of Engineering
at Liverpool John Moores University, for their encouragement, guidance and all they
have done for me.
I would also like to express my sincere gratitude to Professor Young-Sub K won of the
School of Aerospace and Naval Architecture at Cho-Sun University in Korea, for his
stimulating suggestions, constructive comments and encouragement.
I would like to express my gratitude to the Institute of Marine Engineering, Science
and Technology (lMarEST) for their financial support through a Stanley Gray
Fellowship award.
Last but not least, my utmost thanks go to my parents who have understood and
believed in me. Finally, my colleagues, especially Dr. Hyun-Seok Kim, who have
given support in times of hardship, deserve special thanks.
Soo Woong Kim
April, 2005
11

ABSTRACT
Fire has been a major cause of ship's accidents throughout maritime history. It is by
far the most serious threat to life and the environment as passenger ships get larger
and more sophisticated. It is also impossible to protect a passenger vessel against all
hazards. Despite the fact that a passenger ship contains potential fire hazards in the
engine room space, accommodation zone and electrical systems, etc, the single most
important fire hazard onboard a ship may be the man himself, either unintentionally or
intentionally. 'Fire safety on passenger vessel' has continued to be the focus of
attention on passenger ships.
The work described in this thesis is concerned with the application of Formal Fire
Safety Assessment to passenger ships. The traditional way of conducting a Formal
Safety Assessment (FSA) employs typical fire safety analysis methods that require a
certain amount of data. Most fire accident data available for passenger vessels is
associated with a high degree of uncertainty and considered to be unreliable. As such,
the research carried out in this thesis is directed at the development of novel fire safety
analysis methods to address this problem.
This thesis proposed several subjective fire safety analysis methods for passenger
vessels within the FSA methodology. Also, it concentrates on developing an advanced
approach for passenger ships.
A few novel safety analysis and synthesis methodologies are presented to integrate
fire safety assessment with decision-making techniques so that fire safety can be taken
into account from the concept design /operation stages of passenger ships. This is to
ensure a more controlled development process permitting decisions regarding design
and operation to be made based on fire safety assessment.
Finally, this thesis is concluded by summarising the results of this research project and
the areas where further effort is required to improve the developed methodologies.
III

TABLE OF CONTENTS
Acknowledgements ............................................................................ ii
Abstract .......................................................................................... iii
Table of Contents .............................................................................. i\
Abbreviations ................................................................................... xi
List of Figures .................................................................................. xiii
List of Tables ................................................................................... xv
CHAPTER 1 - INTRODUCTION
Summary
1.1 Background in Fire Safety ........................................................ 1
1.2 Background to Fire Safety Assessment. ........................................ 2
1.3 Aim and Objectives .............................................................. .4
1.4 Scope of the Work ................................................................ .4
1.5 Contributions and Dissemination ................................................ 6
References - CHAPTER 1 .................................................................. 7
CHAPTER 2 - A STATISTICAL STUDY OF PASSENGER VESSELS
Summary
2.1 Introduction ........................................................................ 9
2.2 Accident Data ...................................................................... 11
2.3 Data Analysis ...................................................................... 13
2.4 Conclusion ......................................................................... 15
References - CHAPTER 2 ................................................................... 15
CHAPTER 3 - SAFETY ANALYSIS METHODS AND FORMAL SAFETY
ASSESSMENT (FSA) OF A GENERIC PASSENGER
VESSEL
Summary
3.1 Safety Analysis Methods ......................................................... 17
3.1.1 Introduction .................................................................. 17
IV

3.1.2 Qualitative and quantitative safety analysis ........................... 18
3.1.2.1 Qualitative safety analysis ............................................. 18
3.1.2.2 Quantitative Risk Analysis (QRA) .................................... 19
3.1.2.2.1 Event Tree Analysis (ETA) .......................................... 22
3.1.2.2.2 Fault Tree Analysis (FTA) ........................................... 22
3.1.2.2.3 Cause-Consequence Analysis (CCA) ............................... 25
3.1.2.2.4 Failure Mode, Effects and Criticality Analysis (FMECA) ...... 25
3.1.2.2.5 Risk matrix approach ................................................. 28
3.1.2.2.5.1 Risk acceptability criteria .......................................... 28
3.1.2.2.6 Fuzzy sets theory ...................................................... 29
3.1.3 Fire safety modelling ..................................................... .31
3.1.4 Evacuation modelling .................................................... .33
3.1.5 Discussion .................................................................. 35
3.2 Formal Safety Assessment (FSA) .............................................. 36
3.2.1 Introduction ................................................................. 36
3.2.2 Formal Safety Assessment (FSA) ....................................... 37
3.2.3 Basic terminology ofFSA ............................................... .38
3.2.4 Methodology ofFSA ...................................................... 39
3.2.5 An example ................................................................. 40
3.2.6 Discussion .................................................................. 43
3.3 Conclusion ........................................................................ 44
References - CHAPTER 3 .................................................................. 45
CHAPTER 4 - FIRE SAFETY ASSESSMENT ON PASSENGER SHIPS:
APPLICATION TO AN ACCOMMODATION ZONE
Summary
4.1 Introduction ........................................................................ 50
4.2 Fire Safety Assessment .......................................................... 51
4.2.1 Goals of fire safety assessment .......................................... 51
4.2.2 Application ................................................................. 52
4.2.3 Methodology ............................................................... 52
4.3 Case Study ........................................................................ 55
4.3.1 Problem definition ........................................................ 55
4.3.1.1 Fire hazard ............................................................... 55
v

4.3.1.2 Limit criteria .............................................................. 56
4.3.1.3 Layout and data ......................................................... 56
4.3.2 Event Tree Analysis (ETA) ............................................. 60
4.3.3 Quantification of the outcomes ......................................... 62
4.3.3.1 Severity criteria ......................................................... 62
4.3.4 Simulation of the consequences ........................................ 63
4.3.5 Risk evaluation - Risk Matrix Approach .............................. 64
4.4 Conclusion ....................................................................... 75
References - CHAPTER 4 ................................................................ 76
CHAPTER 5 - DEVELOPMENTS IN SMOKE CONTROL SYSTEM FOR
PASSENGER SHIPS: APPLICATION TO AN
ACCOMMODATION ZONE
Summary
5.1 Introduction ....................................................................... 79
5.2 Background ....................................................................... 80
5.2.1 Regulations ................................................................ 80
5.2.2 Definition of smoke ...................................................... 80
5.2.3 Smoke movement. ........................................................ 82
5.2.4 Main criteria for design of smoke control system .................... 82
5.2.5 HVAC (Heating Ventilating and Air Conditioning) system for cabin
areas ........................................................................ 83
5.2.6 HVAC (Heating Ventilating and Air Conditioning) system for
stairways ................................................................... 84
5.2.7 Fire in cabin ............................................................... 84
5.2.8 Fire in stairway ........................................................... 85
5.2.9 Activation of smoke control system ................................... 86
5.2. 1 0 The control system ..................................................... 86
5.2.11 Abbreviated draft guidelines .......................................... 87
5.3 A Proposed Approach ......................................................... 88
5.4 Case Study ...................................................................... 95
5.5 Conclusion ...................................................................... 99
References - CHAPTER 5 ............................................................... 101
\ I

CHAPTER 6 - EVACUATION ANALYSIS OF PASSENGER SHIPS: USI:\G
COMPUTER SIMULATION TO PREDICT EVACUATIO:\
PERFORMANCE
Summary
6.1 Introduction ....................................................................... 1 04
6.2 Background ....................................................................... 1 06
6.2.1 The shipboard evacuation problem ..................................... 1 07
6.3 Methodology ..................................................................... l 07
6.4 Case Study ........................................................................ 109
6.5 Conclusion ........................................................................ 117
References - CHAPTER 6 ................................................................. 118
CHAPTER 7 - FIRE RISK MODELLING OF MACHINERY SPACE: AN
APPLICATION OF APPROXIMATE REASONING
APPROACH (FUZZY AVERAGING METHOD) IN
PASSENGER SHIP ENGINE ROOM
Summary
7.1 Introduction ........................................................................ 121
7.2 Fire Safety of Ship Engine Room ............................................... 123
7.2.1 Criteria for fire safety ...................................................... 123
7.2.2 Fire safety .................................................................... 125
7.2.3 Scope of research ........................................................... 125
7.3 Investigation of Previous Accidents Relative to Engine Room Fire ....... 126
7.3.1 Results of investigation .................................................... 126
7.3.2 Locations in the engine room with a high fire risk ..................... 128
7.3.3 Sources of ignition ......................................................... 130
7.3.4 Breakdown of causes of fires ............................................. 131
7.4 Approximate Reasoning Approach ............................................. 134
7.4.1 Approximate reasoning approach ....................................... 134
7.4.1.1 Membership functions .................................................. 134
7.4.1.1.1 A single deterministic value ......................................... 135
7.4.1.1.2 A closed intervaL ..................................................... 138
7.4.1.1.3 Triangular membership function ................................... 138
VII

7.4.1.1.4 Trapezoidal membership function .................................... 138
7.4.2 Background of fuzzy averaging for safety assessment. ................. 139
7.4.2.1 Statistical average ......................................................... 139
7.4.2.2 Arithmetic operations with fuzzy triangular and trapezoidal
numbers ................................................................... 140
7.4.2.2.1 Addition of fuzzy triangular numbers ................................ 140
7.4.2.2.2 Multiplication of a fuzzy triangular number by a real number ... 140
7.4.2.2.3 Division of a fuzzy triangular number by a real number ........... 140
7.4.2.2.4 Addition of fuzzy trapezoidal numbers ............................... 141
7.4.2.2.5 Multiplication of a fuzzy trapezoidal number by a real number.. 141
7.4.2.2.6 Division of a fuzzy trapezoidal number by a real number ......... 141
7.4.2.2.7 Sum of fuzzy triangular and trapezoidal numbers .................. 141
7.4.2.3 Fuzzy Averaging .......................................................... 142
7.4.2.3.1 Triangular average formula ........................................... 142
7.4.2.3.2 Weighted triangular average formula ................................ 142
7.4.2.3.3 Trapezoidal average formula .......................................... 143
7.4.2.3.4 Defuzzification of fuzzy average ..................................... 144
7.5 A Safety Model - A Framework for Modelling Fire Safety using
Approximate Reasoning and Fuzzy Averaging Method ..................... 146
7.6 Case Study: Fire Risk Analysis of Ship Engine Room ....................... 158
7.6.1 Risk modelling at the component leveL ................................. 164
7.6.2 Multi-attributes safety synthesis .......................................... 166
7.6.3 Safety synthesis of the system based on its sub-systems carrying
different weights ............................................................ 168
7.6.4 Ranking ...................................................................... 169
7.7 Conclusion ......................................................................... 170
References - CHAPTER 7 .................................................................. 171
CHAPTER 8 - A DESIGN-DECISION SUPPORT FRAMEWORK FOR
EVALUATION OF DESIGN OPTIONS IN PASSENGER
SHIP ENGINE ROOM
Summary
8.1 Introduction ........................................................................ 174
\' III

8.2 Concept of Fuzzy Logic & Delphi Method .................................... 178
8.2.1 Fuzzy logic .................................................................. 178
8.2.2 Application of the Delphi method in pooling expert judgement in
design option assessment. ................................................. 179
8.3 Development of Approximate Reasoning & MADM Model Based on
Evidential Reasoning Method ................................................... 180
8.3.1 Approximate reasoning (fuzzy logic: fuzzy averaging) model. ...... 180
8.3.2 MADM model based on evidential reasoning method ................. 181
8.4 A Design-Decision Support Framework Using a Composite Structure
Methodology for Design Options Evaluation .................................. 186
8.4.1 A design-decision support framework .................................. .186
8.5 Case Study ......................................................................... 192
8.6 Conclusion ......................................................................... 206
References - CHAPTER 8 ................................................................... 206
CHAPTER 9 - DECISION MAKING USING ANALYTICAL HIERARCHY
PROCESSING TO FIRE SAFETY ASSESSMENT OF A
PASSENGER SHIP
Summary
9.1 Introduction ........................................................................ 209
9.2 Statistics and Fire Safety Assessment of a Passenger Ship .................. 210
9.2.1 Accommodation zone ...................................................... 212
9.2.2 Public area .................................................................. 213
9.2.3 Machinery space ............................................................ 213
9.2.4 Evacuation ................................................................... 214
9.2.5 Analytical Hierarchy Processing (AHP) for fire safety assessment and
decision-making for passenger ships ..................................... 215
9.3 Analytical Hierarchy Processing (AHP) ........................................ 215
9.3.1 Background of AHP ....................................................... 216
9.3.2 Risk and AHP .............................................................. 218
9.4 Application of AHP to a Passenger Vessel Operation ....................... 219
9.5 Case Study ........................................................................ 220
9.5.1 Hierarchy set-up ............................................................ 221
9.5.2 Level two matrix ........................................................... 222
IX

9.5.3 Fire probability evaluation ................................................ 223
9.5.4 Fire severity evaluation ................................................... 225
9.5.5 Risk Control Options (RCO)s ............................................ 227
9.5.6 RCOs Evaluation to reduce probability of occurrence ............... 228
9.5.7 RCOs Evaluation to reduce severity of possible consequences ..... 229
9.5.8 Results ...................................................................... 230
9.6 Conclusion ........................................................................ 232
References - CHAPTER 9 .................................................................. 233
CHAPTER 10 - CONCLUSIONS AND FURTHER WORK
Summary
10.1 Conclusions ....................................................................... 236
10.1.1 Discussion of the main aim ............................................. 236
10.1.2 Evaluation of main objectives .......................................... 237
10.1.3 Discussion on effectiveness of this project ........................... 238
10.1.4 Definitive conclusion ................................................... 238
10.2 Further Work ..................................................................... 239
10.2.1 Recommendation for further research ................................. 239
10.2.2 Other important safety features ........................................ 241
References - CHAPTER 10 ............................................................... 242
APPENDIX
Poster Presentation, Refereed Papers Published and Waiting to be
Published ...................................................................................... 244

AHP
ALARP
ASCS
BSI
CA
CCA
CURR
EE
ET
ETA
EVI
FAST
FN
FMEA
FMECA
FO
FP
FRI
FSA
FSEG
FT
FTA
GIE
HRR
HVAC
lACS
ICAF
IDS
IMO
ISM
ABBREVIA TIONS
Analytical Hierarchy Processing
As Low As Reasonably Practicable
Active Smoke Control System
British Standards Institute
Criticality Analysis
Cause-Consequence Analysis
Cost per Unit Risk Reduction
Electrical Equipments
Event Tree
Event Tree Analysis
EVacuability Index
Fire-growth And Smoke Transport
Frequency-Number
Failure Mode and Effects Analysis
Failure Mode, Effects and Criticality Analysis
Fuel Oil
Fire Prevention
Full Room Involvement
Formal Safety Assessment
Fire Safety Engineering Group
Fault Tree
Fault Tree Analysis
Generator Engine
Heat Release Rate
Heating, Ventilation and Air Conditioning
International Association of Classification Societies
Implied Costs of Averting a Fatality
Intelligent Decision System
International Maritime Organization
International Safety Management
Xl

ISO
LLL
La
LR
MADM
MCA
MCDM
MIE
MVZ
NFPA
NIST
NK
PLL
PRA
QRA
RCM
RCa
RRN
RTI
RTS
SFSE
SaLAS
SSRC
TIC
WO
International Organization for Standardization
Low Location Lighting
Leakage Oil
Lloyd's Register
Multiple Attribute Decision-Making
Maritime Coastguard Agency
Multiple Criteria Decision-Making
Main Engine
Main Vertical Zone
National Fire Protection Association
National Institute of Standards and Technology
Nippon Kaiji
Potential Loss of Lives
Probabilistic Risk Assessment
Quantitative Risk Analysis
Risk Control Measure
Risk Control Option
Risk Ranking Number
Response Time Index
Run Time Simulator
Society of Fire Protection Engineers
Safety Of Life At Sea
Ship Stability Research Centre
Turbo Charger
Waste Oil
XII

Figure 1.1
Figure 2.1
Figure 3.1
Figure 3.2
Figure 3.3
Figure 3.4
Figure 3.5
Figure 4.1
Figure 4.2
Figure 4.3
Figure 4.4
Figure 4.5
Figure 4.6
Figure 4.7
Figure 4.8
Figure 4.9
Figure 5.1
Figure 5.2
Figure 5.3
Figure 5.4
Figure 5.5
Figure 5.6
Figure 6.1
Figure 6.2
Figure 6.3
Figure 6.4
Figure 6.5
Figure 6.6
LIST OF FIGURES
Structure of the thesis ..................................................... 8
Serious casualties ship losses (1990-1999) ............................ 12
QRA with the risk assessment process ................................. 21
A simple ET structure ..................................................... 23
Fault Tree example ........................................................ 24
The diagram of cause-consequence analysis ........................... 26
FSA methodology .................... " .......... '" ..................... .40
Event tree describing the eight scenarios ............................... 61
FAST results of scenario 1 ................................................ 65
FAST results of scenario 2 ................................................ 66
FAST results of scenario 3 ................................................ 67
FAST results of scenario 4 ................................................ 68
FAST results of scenario 5 ................................................ 69
FAST results of scenario 6 ................................................ 70
FAST results of scenario 7 ................................................ 71
FAST results of scenario 8 ................................................ 72
HVAC system for cabin areas (energy recovery by recirculation) ... 84
HV AC system for a stairs (energy recovery by recirculation) ....... 85
Pressure conditions during smoke control mode ....................... 89
Mechanical ventilation supplies air values .............................. 97
Test 1 result of smoke layer height ........................................ 98
Test results of smoke layer height ....................................... 100
Evi: Run time simulator during an evacuation ......................... 110
Case 1: from cabin to assembly station ................................. 112
Case 2: from cabin to embarkation station .............................. 113
Case 1 - 1: blockage of one fire door on assembly station ............ 114
Case 2 - 1: blockage of one staircase on embarkation station ........ 115
Travel time for the cases considered .................................... 116
Figure 7.1 Sources of fire in engine room ........................................... 129
Figure 7.2 (a) A single deterministic value of 5.0 with 100 % certainty ............ 136
XIII
Figure 7.2 (b) A closed interval defined by an equally likely range between 3.0 and
7.0 ........................................................................... 136
Figure 7.2 (c) A triangular distribution defined by a most likely value of 5.0, with a
lower least likely value of 2.0 and an upper least likely value of 8.0
.............................................................................. 137
Figure 7 .2 (d) A trapezoidal distribution defined by a most likely range between 4.0
and 6.0, with a lower least likely value of 2.0 and an upper least likely
value of 8.0 ................................................................ 137
Figure 7.3 The process of defuzzification of fuzzy average ..................... 144
Figure 7.4 A framework for modelling system safety using approximate reasoning
Figure 7.5
Figure 7.6
Figure 7.7
approach and fuzzy averaging method ................................. 147
Fuzzy failure rate set definition ........................................ .150
Fuzzy consequence severity set definition ............................ 151
Fuzzy failure consequence probability set definition ................ 152
Fuzzy control mechanism set definition .............................. .154 Figure 7.8
Figure 7.9 Multi-attribute safety synthesis of a sub-system due to a fire failure
caused by various components estimated by an expert ............. .163
Figure 7.10 Safety synthesis of a system due to a fire failure caused by various sub-
systems estimated by an expert ........................................ .163
Figure 7.11 A generic hierarchical structure of an engine room ................. .164
Figure 8.1 Subjective evaluation framework for various design options ...... 187
Figure 8.2 The composite procedure for evaluation of the passenger ship engine
room ........................................................................ 189
Figure 8.3 IDS main window for synthesis of safety, cost and technical
performance not weighted .............................................. 198
Figure 8.4 Performance estimates of the four design options (with weights for
both first and second level criteria) .................................... 204
Figure 8.5 Performance estimates of the four design options (without weights for
both first and second level criteria) .................................... 204
Figure 9.1 Flowchart of the approach .............................................. 219
Figure 9.2 Fire safety operation and its hierarchical levels ..................... 221
xiv
Table 2.1
Table 2.2
Table 3.1
Table 3.2
Table 3.3
Table 4.1
Table 4.2
Table 4.3
Table 4.4
Table 4.5
Table 4.6
Table 4.7
Table 6.1
Table 6.2
Table 7.1
Table 7.2
Table 7.3
LIST OF TABLES
Cruise ship fatalities (1963-1997) ......................................... 13
Cruise ship evacuation (1963-1997) ..................................... 13
Frequency indexes ......................................................... .41
Severity indexes ............................................................. 41
Risk matrix .................................................................. 41
Generalised risk matrix table ............................................. 53
Combustible items in the cabin .......................................... 56
ET nodes probability ...................................................... 61
ETA results ................................................................ 62
Key to the frequency bands for risk table .............................. 64
Key to the consequence bands for risk table .......................... 73
Fire ranking using risk matrix approach ............................... 73
Passenger and crew distributions ....................................... 111
Deck connectivity by stairs .............................................. 111
Failure rate ................................................................. 151
Consequence severity ..................................................... 152
Failure consequence probability ......................................... 153
Table 7.4 Control mechanism ....................................................... 154
Table 7.5 (a) Risk analysis for components associated with sub-system #1 - FO
(raw data) .................................................................. 161
Table 7.5 (b) Risk analysis for components associated with sub-system #2 - LO
(raw data) .................................................................. 161
Table 7.5 (c) Risk analysis for components associated with sub-system #3 -
Electrical Equipment (raw data) ........................................ 162
Table 7.5 (d) Risk analysis for components associated with sub-system #4 - TIC of
M/E (raw data) ............................................................ 162
Table 7.6 (a) Risk analysis for components associated with sub-system # 1 - FO
[converted all membership functions into trapezoidal and
normalised] ................................................................ 165
xv

Table 7.6 (b) Risk analysis for components associated with sub-system #2 - LO
[converted all membership functions into trapezoidal and
normalised] ................................................................ 165
Table 7.6 (c) Risk analysis for components associated with sub-system n3 _
Electrical Equipment [converted all membership functions into
trapezoidal and normalised] ............................. " ....... " ..... 166
Table 7.6 (d) Risk analysis for components associated with sub-system #4 - TIC of
MIE [converted all membership functions into trapezoidal and
Table 7.7
Table 8.1
Table 8.2
Table 8.3
Table 8.4
Table 8.5
Table 8.6
Table 8.7
Table 8.8
Table 9.1
Table 9.2
Table 9.3
Table 9.4
Table 9.5
Table 9.6
normalised] ..................................................... " ......... 166
Multi-attribute safety synthesis on fire risk of FO, LO, Electrical
Equipment and T/C ofM/E ............................................. 168
Assessment presented by experts for capital cost in design option # 1
(Delphi method round 1) ................................................ 194
Deviation from average ..... " ........................................... 194
Assessment presented by experts for capital cost in design option # 1
(Delphi method round 2) ................................................ 194
Weighting factors for each basic criterion (first level) .............. 197
Weighting factors for second-level criterion ......................... 197
Linguistic variables for utility expressions corresponding to cost, safety
and technical performance expressions ............................... 201
The results of system synthesis for each option ..................... 202
Computed preference estimate for each design option .............. 203
Reports of fires ........................................................... 211
Comparison scale ........................................................ 223
RCOs matrix ................................................................................. 228
Summary of results for probability element ...................... , .. 231
Summary of results for severity element. ............................ 231
Final ranking of RCOs ................................................. 232
xvi

CHAPTER 1 - INTRODUCTION
Summary
This chapter describes the concepts of fire safety assessment and reliability analysis
with some problems encountered in applying the existing reliability and safety
analysis methods in quantitative safety appraisal studies. especially in the early
concept design stage. This chapter also outlines a philosophy aimed at facilitating the
development of a formalised environment for safer ships by adopting an integrated
approach, involving the incorporation of fire safety assessment with technological
design and development in an iterative manner. Finally, the objectives of this work are
described and the scope of this thesis is outl ined.
1.1 Background in Fire Safety
Statistics indicate that a ship is lost to fire every ten days [LR, 1988]. The history,
philosophy and development of marine fire protection are best traced by focusing on
passenger ship. Passenger vessels have the largest potential for loss of life and are the
subject of long-standing international attention and regulatory effort [Ohnstad, 1991].
Therefore, the following overview primarily regards such passenger vessels and
should aid readers in understanding the philosophy that was employed in developing
the current international requirements.
The tragic sinking of the Titanic on the 14th April, 1912 focused international concern
on the Safety Of Life At Sea (SaLAS), and in 1914 the first international conference
was held to discuss shipboard safety [Ohnstad, 1991]. This conference focused on
subdivision and lifesaving. Concerns regarding fire safety were not addressed until
1929 when a second conference was held. This conference produced the Convention
for SaLAS that was later ratified in 1936.
A tragic fire aboard the US flag passenger vessel Morro Castle in 1934 claimed the
lives of 124 persons and fuelled public sentiment to improve vessel fire safety. The

US Senate Committee on Commerce formed a special subcommittee on fireproofing
and fire prevention to develop recommendations for fire safety standards on ships.
The subcommittee noted the vulnerability of complex automatic and manually
controlled fire detection, extinction systems and agreed that the most fool-proof
approach would be construction of such nature that it would confine any fire to the
space in which it originated. This remains a key principle in the current international
regulations. The latest Convention, SOlAS 1974, came into effect internationally in
May, 1980. It has been amended several times since then.
As far as the marine industry is concerned, tragic accidents have focused world
opinion on ship safety and operation. This demand for improved fire safety requires
comprehensive fire safety analyses to be developed in order to identify ways to
control risks. Such fire safety analysis models will ensure efficient, economic and safe
ship design and operation.
1.2 Background to Fire Safety Assessment
It is becoming necessary to develop and apply more rational techniques which permit
quantification of safety, reliability and risk of failure [Aldwinckle & Pomeroy, 1982].
By using a rational approach based on reliability techniques and the novel techniques
as proposed in this thesis, fire safety assessments can be conducted for any project at
the concept design stage, the later design stage and operational stage. The author does
not wish to suggest that these novel techniques should replace the well-proven
methods used in maritime and other industries for safety assurance but they might be
used as an enhancement where circumstances dictate, in particular at the early concept
design stage. These novel techniques can assist designers and operators in analysing
the effects of failure on safety and operability, especially for systems with a high level
of innovation.
Some commercial institutions have focused on developing databases of maritime
accidents [Hill, et aI., 1994] [OREDA, 2002] [P & I Club, 2003]. Unfortunately,
accident statistics were not gathered systematically in the past and there is a lack of
data. Furthermore, the available information is often not gathered consistently and as a
2

result its users cannot often be sure whether a set of data is really applicable to the
situation in question.
The reliability and safety assessment methods are well established and universally
applicable being a combination of logic and statistics. It is anticipated that ships, and
especially those passenger vessels will become more dependent on complex systems
of integrated components and such methods of analysis will not only be more relevant
but also become a necessary part of both design and operation. Owing to the growing
level of innovation of the modern engineering products such as passenger ships, novel
methods are required to deal with the reliability and fire safety aspects, in particular,
at the early concept design stage.
Fire safety analysis is a very complicated subject where safety is determined by
numerous factors including fire. Many fire safety assessment techniques currently
used in maritime industries are comparatively mature tools. However, in many
circumstances, the application of these tools may not be suitable or give satisfactory
results due to the lack of safety related data or the high level of uncertainty involved
in the safety data available. Novel fire safety analysis methods are therefore required
to identify major hazards and assess the associated risks in an acceptable way in
various environments where mature tools cannot be effectively or efficiently applied.
The literature search carried out by the investigator indicates that although some work
has been conducted in this area, very limited formal safety based decision support
tools have been developed and applied to a stable environment in the maritime
industry. Fire safety based decision support techniques may help the designers in
determining where risk reduction actions are required, defining appropriate risk
reduction measures and reducing cost without increased risks to the maritime system.
Some novel fire safety assessment methods and safety-based decision support tools
will be developed to facilitate fire safety analysis in such situations.
3

1.3 Aim and Objectives
The main aim of this project is to develop an environment that adopts an integrated
approach to the management and control of the passenger vessel design and fire safety
issues involved and their interaction.
The main objectives of this research are:
1. To identify fire safety assessment techniques currently used in the passenger
ships, which include methods for hazard identification, risk quantification and
decision-making.
2. To study the Formal Safety Assessment (FSA) approach In maritime safety
applications.
3. To develop novel fire safety assessment techniques and decision support
approaches to facilitate maritime safety analysis of passenger vessels.
4. To identify the best way whereby safety on board passenger ships can be assured
and to develop a suitable model to assist in its implementation.
5. To identify further research areas required to be exploited in the future.
1.4 Scope of the Work
The fire safety analysis and decision support methodologies developed and described
in this work are of general nature, therefore they are theoretically applicable to the
design and safety related assessment of a wide range of complex engineering products
such as passenger vessels. They are also appropriate for other disciplines of
engineering work, especially in situations when the relevant safety-related information
is lacking. The developed methodologies can be used together with the conventional
methods in fire safety assessment, in particular for engineering products with a high
level of innovation. The body of the thesis is structured in ten chapters. A brief outline
of the content of each chapter is given below.

Chapter 2 outlines a comprehensive statistical data analysis of the vessels. The data
that was collected and analysed from various sources, are presented in the form of
graphs and tables to enable easy reading. The findings of the accident data gathered
and the problems of lack or incomplete data to carry out passenger vessel fire safety
assessment are discussed.
Chapter 3 discusses the inception of FSA. The concept of FSA consists of five steps,
which are the identification of hazards; assessment of the risks associated with those
hazards; identification of ways of managing the risks; cost benefit assessment of the
identified risk control options; making decisions on which options to select. These
five steps are briefly discussed, highlighting the interaction and continuity of each
step. Reiteration within the FSA process is expressed by means of a flowchart. A
general framework for the application of the FSA to generic passenger vessel is
proposed and is demonstrated using a test case. The typical risk and fire safety
assessment techniques are also described. The advantages and disadvantages of each
method are reviewed.
Chapter 4 proposes an approach for fire modelling of accommodation zone of
passenger ships. The example performed summarises the basic assumptions, the
models and the calculation procedures employed to analyse a possible fire scenario in
an accommodation zone of a passenger ship.
One of the most important means to avoid catastrophes in case of fire onboard
passenger ships is to ensure that the passengers can escape in a quick and safe manner.
One of several precautions to take is to try to control the spread of the smoke in a
simple and reliable way. In this way the area where people are in contact with the
smoke can be minimised and better visibility to escape from the smoke can be
secured. Chapter 5 develops in smoke control philosophy for accommodation area.
Chapter 6 describes a new approach for evacuation analysis usmg computer
simulation. This chapter includes the simulation of 90 passengers and 10 crew
members mustering on a vessel with 6 decks. After this, simulation of different
scenarios is discussed.
5

Chapter 7 presents a risk modelling approach which incorporates the use of
approximate reasoning method in engine room applications. This chapter concentrates
on the fire risk evaluation of the major hazards threatening the engine room overall
rather than focusing on specific areas of the design. A case study of the risk to
passenger ship engine room due to fire during operation is used to illustrate the
application of the proposed risk assessment model.
Chapter 8 examines a new design-decision support framework for evaluation of
machinery space. In this chapter, a design-decision support framework using a
composite structure methodology grounded in approximate reasoning approach and
evidential reasoning method is suggested for design evaluation of machinery space of
a ship engine room at the initial stages.
Chapter 9 proposes a framework for the identification and quantification of fire in
passenger vessel operation. The method uses Analytical Hierarchy Processing (AHP)
theory to rank the preference of each risk control option. The advantages of
employing the AHP technique are discussed.
Finally conclusions and recommendations are provided in Chapter 10.
The logical sequence and interrelations among the chapters of the thesis are illustrated
in Figure 1.1.
1.5 Contributions and Dissemination
This thesis proposed several subjective fire safety analysis methods for passenger
vessels within the FSA methodology. Also, it concentrates on developing an advanced
approach for passenger ships.
A few novel safety analysis and synthesis methodologies are presented to integrate
fire safety assessment with decision-making techniques so that fire safety can be taken
into account from the concept design /operation stages of passenger ships. This is to
6

ensure a more controlled development process permitting decisions regarding design
and operation to be made based on fire safety assessment.
In general, the results of the project can be tailored for fire safety analysis of an:
maritime engineering product with domain-specific knowledge and therefore can be
used in many engineering applications.
Investigation results and findings are made available by publications in journals and
presentation at international conferences. Some publications arising from this
investigation are listed in Appendix 1 at the end of this thesis.
References
Aldwinckle, D. S. & Pomeroy, R. V. (1983), "Reliability and Safety Assessment
Methods for Ships and Other Installations", Lloyd's Register of Shipping Technical
Paper, London, UK.
Hill, S. G., Byres, J. C., Rothblum, A. M. & Booth, R. L. (1994), "Gathering and
Recording Human Related Casual Data in Marine and Other Accident Investigation",
Proceedings of the Human Factors and Ergonomics Society 38th
Annual Meeting,
Nashville, USA, pp 863-867.
LR (1988), "1986 and 1987 Casualty Records", Lloyd's Register of Shipping,
London, UK.
Ohnstad, S. J. (1991), "Fire Protection in Merchant Ships - An Overview", The
Management of Safety in Shipping, The Nautical Institute, London, UK.
OREDA (2002), "Offshore REliability DAta handbook (OREDA)", PennWell Books.
P & I Club (2003), "Protection & Indemnity Review 2003", MARSH Ltd.
7

Aim and Objectives (Chapter 1)
Statistical Analysis (Chapter 2)
I • + Review of Review of
Safety Assessment Techniques Formal Safety Assessment (Chapter 3.1) (Chapter 3.2)
I I ~ ~
Fire Modelling of Evacuation Fire Risk Modelling of Accommodation Modelling Machinery Space Zone (Chapter 4) (Chapter 6) (Chapter 7)
~Ir
Smoke Control of Design I Decision of Accommodation Ship Engine Room Area (Chapter 5) (Chapter 8)
~
Decision-Making using Analytical Hierarchy Processing
(Chapter 9)
Conclusions (Chapter 10)
Figure 1.1. Structure of the thesis.
8
CHAPTER 2 - A STATISTICAL STUDY OF PASSENGER
VESSELS
Summary
This chapter briefly reviews the current rules and regulations governing passenger
ships and presents the fire safety programmes implemented by the governing bodies.
This chapter demonstrates that there is a need for improvement in fire safety
performance.
2.1 Introduction
The most recent biggest passenger vessels have been designed to carry more than
3,000 passengers, 1,500 crew and other staff members. The needs of the market will
probably lead in the near future to the building and operation of passenger ships with
more and more passengers on board, suited to different types of clients (couples,
families and groups), with large public spaces (restaurants, cinemas, discos, casinos
and sports and other forms of entertainment) and very high comfort on board. The
setting inside the ship is to be at least as beautiful and impressive as the setting
outside.
Due to world cruise demand, which foresees doubling the number of passengers by
the year 2010, the building of large passenger ships is expected to growing carry on.
The International Maritime Organisation (IMO) Secretary General [IMO, 1999], while
recognising the achievements of the shipbuilding and ancillary industries in delivering
gigantic passenger ships embodying state-of-the-art technology, expressed the wish
that the IMO undertake a global consideration of safety issues pertaining to passenger
ships. with particular emphasis on large cruise ships.

Several questions may arise:
1. What are the necessary solutions to deal with safety of these vessels?
2. Can present rules and regulations, concerning the safety of the ship, passengers
and crew but derived from ships of smaller dimensions, cope with such an
explosion of needs and creativeness?
3. Safety records of incidents and accidents of passenger ships are good, especially
for the latest generation of ships, but are the present solutions adequate to cope
with the above mentioned growth and the needs of this industry?
The present large passenger ships are built in accordance with international
regulations derived from experience in the past for ships of smaller dimensions.
However, a lot of improvements have already been foreseen by the designers, often
going beyond the sole strict application of present rules and regulations, taking into
account the number of passengers and crew on board [Cazzulo & Fanciulli, 2000].
The most interesting features presently foreseen or under discussion for future new
buildings are about fire safety and means of escape and evacuation. For some of these
issues, IMO, International Organization for Standardization (ISO) and International
Association of Classification Societies (lACS) provide guidelines in order to clarify
the matter on an international basis and contribute to developing appropriate
regulations, rules and standards, where necessary.
The following innovative solutions are of instant relevance to fire safety:
1. Special purpose smoke detectors installed in potentially high fire risk spaces,
such as inside the galley greasy exhaust ducts, and additional automatic local
extinguishing (water-spraying) systems installed in machinery spaces.
2. Automatic/manual means to control the interaction between the smoke
extraction, fans, dampers, Heating, Ventilation and Air Conditioning (HV AC)
and the fire detection and extinguishing systems.
10

3. Use of visual display units to simplify and reduce the number of mimic control
panels and of audible and visual alarms for monitoring the status of generaVfire
alarm system, public address system, fire dampers, Hi-Fog system, CO2 release
and alarm system, etc.
The following innovative solutions are of instance relevance to escape and evacuation:
1. Means of escape to avoid bottle necks in corridors and stairways, theatres and
atriums designed to accommodate a large number of people, position and
dimensions of muster stations evaluated using evacuation analysis.
2. Escape routes designed to fit additional berths in cabins, exceeding the effective
total passenger capacity and allowing more flexible booking in relation to clients
need.
3. Use of alternative lifesaving appliances to lifeboats, such as chutes and slides
associated with life-rafts.
The above mentioned solutions are often based on rules, guidelines and industry
standards, which are not compulsory but are instead applied on a voluntary basis.
2.2 Accident Data
The information from international statistical sources shows that main casualty
categories are machinery damage, stranding, collision and fire and explosion
[Norman, 1997] [Waite & Aston, 1999] [Guillaume, et aI., 2003]. Fire accidents have,
however, not been reduced to the same extent as the other accident types during the
1988-1991. Fires and explosions have also caused great concern in relation to
passenger transport (cruise ships and ferries) [Rensvik, et aI., 1994].
The accident data presented in this section are predominantly gathered from the
Lloyd's Register [Aldwinckle & Mitchell, 2000]. The LR received 8,744 accident and
incident reports of all ships in 2000. Accidents to passenger ships accounted for 457
11

of those reports. The data presented here is collected from 1990 to 1999 and reflects
all the reported incidents and accidents relating to all kinds of vessels.
For all ships losses, in Figure 2.1 shows the 35% of these were caused by machinery
and hull damage, 20% by wrecked and stranded, 13% by frre/explosion, 13% by
foundered, 11 % by collision, 6% by contact and 2% by miscellaneous. Also, the graph
indicates that the percentage of each accident events involving the passenger ships.
Stranded/wrecked represents 26% of the total losses. Fire risks remain the second
largest contributor with 250/0, contributing 18% of hull/machinery damage 11% of
contact, 9% of collision, 8% of foundered and 3% of miscellaneous.
II
II
II
II
All ships II
• Pasaanger ships
II
c_, -. Figure 2.1. Serious casualties ship losses (1990-1999).
To determine the severity of the accidents on cruise ships, data reflecting the accidents
to vessels with the fatalities caused are gathered and presented in Table 2.1. This table
shows that 51.41 % of the total fatalities were caused by collision accidents on vessels
and 48.47% by fire accidents [Terje & Arnstein 2000].
12

Table 2.1. Cruise ship fatalities (1963-1997).
Cause Fatalities %
Collision 436 51.41
Grounding 1 0.12
Impact 0 0
Foundering 0 0
Fire 411 48.47
Total 848 100
Table 2.2 gives the detailed evacuations by accident cause from 1963 to 1997
[Skjong, et aI., 1997]. From this table, it is noted that a great proportion of cruise
vessel evacuation accidents (56.25%) is caused by fire.
Table 2.2. Cruise ship evacuation (1963-1997).
Cause Evacuation %
Collision 3 6.25
Grounding 15 31.25
Impact 2 4.17
Foundering 1 2.08
Fire 27 56.25
Total 48 100
2.3 Data Analysis
In many cases of the passenger vessel accidents examined, information is incomplete
or lacking. This makes it difficult to analyse the events that lead to the accident.
The changes to the SOLAS Convention which had arisen as a result of major
accidents such as Scandinavian Star (Fire). The Amendments to SOLAS as a result of
the Scandinavian Star disaster were balanced as follows:
1. 3 amendments preventing fires from starting ( 6% of regulation changes)
13

2. 21 amendments preventing fires from escalating (43% of regulation changes)
3. 25 amendments to evacuation arrangements (51 % of regulation changes)
It can be reasonably expected that if maritime regulators had been able to agree a
proactive approach with the industry, the regulatory effort might have concentrated on
the accident initiation and accident escalation prevention stages rather than on
mitigation. However it is not possible to take an objective view following a disaster.
Survivors accounts of how their escape could have been made easier if particular
equipment or systems have been in place cannot be ignored by regulators. The
regulator cannot argue against imposing additional safety requirements of little or no
value because the regulator has lost credibility as a result of the accident. It is after all
difficult to argue that there is little likelihood of a scenario re-occurring if the
regulator has failed to predict it in the first case. Also, in the wake of an accident the
operator will be represented by corporate spokespersons but making declarations to
the effect that 'the operation met every regulatory requirement' often with a subtext
that the regulator should have prevented the accident by imposing higher regulatory
requirements [Wright, 2000].
It is difficult to state what fire risks are to be counteracted, which measures are the
most needed, whether the current measures are effective without a clear definition of
the targets of the acceptable, tolerable or unacceptable risks. Answers to these
questions can be obtained by applying systematic risk based methodologies aimed at
considering the ship's fire safety as a whole, including protection of life, property and
the environment, such as the so called Formal Safety Assessment (FSA). The FSA
could be useful to identify the most appropriate risk control and mitigation options
and to compare different conventional and non-conventional solutions, for instance in
terms of their implications on safety and reliability.
However, to become useful, the FSA needs a lot of work to implement all necessary
information and tools. It is evident that such an exercise becomes effective if it is
carried out on a wide and cooperative basis, with the support of all interested parties.
e.g. owners, operators, insurers. administrations, classification societies. etc. FSA will
then play an important role in the design and operation of the next generation of
14

passenger ships and offer considerably help to identify the most appropriate fire risk
control options relevant to the transport of large numbers of passengers on board these
ships.
2.4 Conclusion
A review has been performed on available incident data relevant to passenger vessels.
However, the database still lacks sufficient information about the casual relationship
between the causes and effects of the accidents/incidents.
Data interpretation should be carried out with caution, as it is highly likely that there
is some degree of under reporting of incidents. This would entail that the actual
number of deaths, accidents and vessel losses, would be higher than the figures
presented here. However, the data gathered and analysed in this chapter show that
there is a real problem in the cruise industry. The frequency of fire accidents and the
associated severity are still high by maritime standards.
The work in this thesis attempts to provide fire safety assessment methods that could
identify the high-risk areas on a passenger ship, thereby justifying and implementing
fire risk management solutions. It can be concluded that due to the lack of proper
reporting of accidents/incidents on passenger vessels, subjective methods of risk and
safety analysis may be more favourable.
References
Aldwinckle, D. & Mitchell, A. (2000), "Guidance from the Assessor: Preparing for
the Unexpected", IMarEST International Conference on Safety of Large Passenger
Ships - Looking to the Future, Vol 112, Part 2, London, UK, 15-16 May.
Cazzulo, R. & Franciulli, F. (2000), "Safety of Large Passenger Ships Design - A
Classification Society's View", IMarEST International Conference on Safety of Large
Passenger Ships - Looking to the Future, Vol 112, Part 2, London, UK, 15-16 May.
IS

Guillaume, C., Elisabetta, N., Franco, Z. & Carlo, E. (2003), "Safety First Project
Probabilistic Models and Data", RINA International Conference on Passenger Ship
Safety, London, UK, 25-26 March.
IMO (1999), "Enhancing the Safety of Large Passenger Ships", Maritime Safety
Committee, Work Programme, MSC 72/21, London, UK.
Norman, H. (1997), "Maritime Casualties: 1963-1996", 2nd Edition Book, Informa
(Lloyd's of London Press), May.
Rensvik, E., M0rkve, O. T. & Kristiansen, S. (1994), "Development of An Integrated
Fire-fighting System", IMarEST International Conference on Fire Safety on Ships -
Developments into the 21 st Century, IMAS 94, London, UK, 26-27 May.
Skjong, R., Adamcik, P., Eknes, M. L., Gran, S. & Spouge, 1. (1997), "Formal Safety
Assessment of Helicopter Landing Area on Passenger Ships as a Safety Measure",
DNV Report 97-2053 (Available as IMOICOMSAR 3/2), Norway.
Terje, S. & Arnstein, E. (2000), "Complexity of Safety Considerations with Large
Passenger Vessels", IMarEST International Conference on Safety of Large Passenger
Ships - Looking to the Future, Vol 112, Part 2, London, UK, 15-16 May.
Waite, 1. B. & Aston, 1. G. L. (1999), "Do We Ever Learn? - The Perspective of the
Salvage Association", RINA International Conference on Learning from Marine
Incidents, London, UK, 20-21 October.
Wright, D. (2000), "The Safety of Large Passenger Vessels: Guidance from the
Regulator?", IMarEST International Conference on Safety of Large Passenger Ships -
Looking to the Future, Vol 112, Part 2, London, UK, 15-16 May.
16

CHAPTER 3 - SAFETY ANALYSIS METHODS AND FORMAL
SAFETY ASSESSMENT (FSA) OF A GENERIC PASSENGER
VESSEL
Summary
This chapter gives a detailed review of some of the typical safety analysis techniques
(including fire modelling and evacuation modelling techniques) currently in use. Each
method's characteristics are investigated. The FSA approach is described and
discussed in the context of a trial application to a generic passenger vessel.
3.1 Safety Analysis Methods
3.1.1 Introduction
When studying the safety aspects of a large ship, it is almost impossible to treat the
system in its entirety. A logical approach may be to break down the system into
functional entities comprising subsystems and components. Safety modelling of these
functional entities can be carried out in such a logical structure, then the
interrelationships can be examined and finally a system safety model can be
formulated to assess the safety parameters. The formulation of a system safety model
can be difficult for a large and sophisticated marine system and thus requires
approximations and judgement [Pillay & Wang, 2003].
It is very beneficial to apply safety analysis methods effectively and efficiently in the
design for safety process. This chapter specifies how to deal with such problems. This
requires an understanding of the concepts of qualitative and quantitative safety
analysis.
Safety assessment is a logical and systematic way to seek answers to a number of
questions about the system under consideration. The assessment of risk associated
17

with an engineering system or product may be summarised to answer the following
four questions:
1 . What can go wrong?
2. How likely are the potential problems to occur?
3. How severe might the potential problems be?
4. What lessens can/should be learn from the risk?
The answer obtained from these questions will provide the information about the
safety of the system. Such information is interesting but is of no practical significance
unless there is a method for controlling and managing the risk levels of specific
hazards to tolerable levels. Hence, a complete safety assessment will require a fifth
question to be answered:
5. What measures need to be undertaken to reduce the risks and how can this be
achieved?
Safety analysis can be generally divided into two broad categories, namely,
quantitative and qualitative analysis methods.
3.1.2 Qualitative and quantitative safety analysis
Depending on the requirements of safety analysts and the safety data available, either
a qualitative or a quantitative analysis can be carried out to study the risks of a system
in terms of the occurrence probability of each hazard and its possible consequences. A
severe hazard with a high occurrence probability requires priority attention and a
hazard which is not likely to occur and which results in negligible consequences
usually requires minimal attention [Aldwinckle & Pomeroy, 1983].
3.1.2.1 Qualitative safety analysis
Qualitative safety analysis is used to locate possible hazards and to identify proper
precautions (design changes, administrative procedures, etc.) that will reduce the
18

frequencies or consequences of such hazards. It should become an integral part of the
marine design process. It may be performed with one or more of the following
objectives [Pillay & Wang, 2003]:
• To identify hazards in the design.
• To document and assess the relative importance of the identified hazards.
• To provide a systematic compilation of data as a preliminary step to facilitate
quantitative analysis.
• To aid in the systematic assessment of the overall system safety.
Engineering judgement and past experience are required to carry out a qualitative
safety analysis. Measures can be taken to eliminate or control hazards based on the
information produced from qualitative safety analysis.
3.1.2.2 Quantitative Risk Analysis (QRA)
QRA is a valuable tool to establish valid and more precise relationships between the
costs of safety, maintenance, etc. and the benefits of maintaining production in a safe
and ecologically acceptable environment. These relationships can be used to compare
and evaluate different risk scenarios and different design or mitigation proposals so
that designs and operating procedures can be optimised to meet commercial
requirements and external standards at minimum cost. This leads to more realistic,
moderate and efficient conclusions than analysis based on regulations only, where the
issues are only good (if the regulation is applied) or bad (if not applied)
[SAFERRELNET, 2002].
Although QRA started in the nuclear and chemical process industries, the combined
effects of commercial pressure. statutory regulation, and public concerns mean that
increasingly it is seen to be of benefit, or at least potential benefit. in other industries
and activities.

The purpose of QRA is to describe the risk by a value that is measurable with criteria
or other values associated with an operation and design. Risk is a multi-dimensional
concept involving hazard frequency and its consequences. QRA involves the
estimation of the frequency and consequences of a range of hazard scenarios and of
individual and societal risk (or economical risk). QRA is normally a part of a risk
assessment. The risk assessment process is depicted in Figure 3.1 [Lee, 1996].
The purpose of risk assessment based on QRA is normally to [SAFERELNET, 2002]:
• Assess the risk of fatality or serious injury to persons (workforce or the members
of the public).
• Identify measures to reduce the overall risk and assess the effectiveness of such
measures.
• Assist in the selection of preferred options for enhanced safety.
• Assist in the setting of Performance Standards for design, monitoring and audit
purposes.
• Assist cost benefit assessment of possible safety expenditure.
• Assist in decision making on whether the risk is tolerable against the risk
acceptance criteria.
• Assess the environmental risk.
• Assess the risk to the asset and / or revenue.
The results of a QRA may not be precise and this should be recognised when they are
used for making decisions. This is not that important when comparing several designs,
but it can lead to substantial problems when the aim is to assess absolute figures.
Therefore, QRA results should always be carefully reviewed in the context of the
specific circumstances of a particular decision or requirement. There is no
standardised method for carrying out a QRA.
Sensitivity to variations in the assumptions made should be checked to provide an
indication of the criticality of the input data. Where necessary, a more detailed
analysis of the most critical data should be conducted to improve the confidence in the
results.
20

Define study scope and objectives and risk criteria
~ Describe process and plant
~ Identify hazards
~ Identify vulnerable targets
~ Develop hazardous incidents and source
~ - Develop escalation scenarios
QRA ~
Identify mitigating features
~ Estimate consequences
~ Estimate frequencies
~ Calculate risk
~ Compare with risk criteria
~ 1. Accept system
2. Modify system to reduce risk/cost 3. Abandon design/operation
Figure 3.1. QRA with the risk assessment process [Lee, 1996].
21

The typical methods used in a QRA to estimate the risk are:
• Event Tree Analysis (ETA).
• Fault Tree Analysis (FTA).
• Cause-Consequence Analysis (CCA).
• Failure Mode, Effects and Criticality Analysis (FMECA).
• Risk Matrix Approach.
• Fuzzy Sets Theory.
3.1.2.2.1 Event Tree Analysis (ETA)
ETA utilizes decision trees to graphically model the possible outcomes of an initiating
event capable of producing an end event of interest. This type of analysis can provide
(1) qualitative descriptions of potential problems (combinations of events producing
various types of problems from initiating events) and (2) quantitative estimates of
event frequencies or likelihoods, which assist in demonstrating the relative importance
of various failure sequences [Henley & Kumamoto, 1996] [Villemuer, 1992]. ETA
may be used to analyze almost any sequence of events, but is most effectively used to
address possible outcomes of initiating events for which multiple safeguards are in
line as protective features [ASS, 2003].
An example of a simple Event Tree (ET) is shown in Figure 3.2. The fire protection is
provided by a sprinkler system. A detector will either detect the rise in temperature or
not. If the detector succeeds the control box will either work correctly or not - and so
on. There is only one branch in the tree that indicates that all the subsystems have
succeeded.
The ET that calculates the outcomes of the scenario will be more detailed in Chapter 4.
3.1.2.2.2 Fault Tree Analysis (FTA)
Compared to an ET the Fault Tree (FT) analysis works in the opposite direction. It is a
deductive approach, which starts from an effect and aims at identifying its causes.
Therefore a FT is used to develop the causes of an undesirable event. It starts with the
22
event of interest, the top event, such as a hazardous event or equipment failure. and is
developed in a top down manner [SAFERRELNET. 2002].
Initiating Event
Fire starts
Fire detected
Yes
No
Fire alarm Works?
Yes
No
Sprinkler Works?
Yes
No
Yes
No
Figure 3.2. A simple ET structure.
Limited damage
Extensive damage People escape
Limited damage Wet people
Possible fatalities Extensive damage
Serious damage
FT A is both a qualitative and a quantitative technique. Qualitatively it is used to
identify the individual scenarios (so called paths or cut sets) that lead to the top (fault)
event, while quantitatively it is used to estimate the probability (frequency) of that
event.
A component of a FT has one of two binary states, either in the correct state or in a
fault state. In other words, the spectrum of states from total integrity to total failure is
reduced to just two states [SAFERRELNET, 2002].
A FT is basically a graphical representation of the Boolean (logical) equation which
links the individual component states to the whole system state. Therefore, it
encompasses all the possible states of the whole system. These states are split into two
classes according to that the top event is achieved (true) or not (false).
23

The basic elements of a FT may be classed as (1) the top event, (2) primary events, (3)
intermediate events and (4) logic gates.
An example of a simple FT with an "AND" gate and an "OR" gate, is shown in Figure
3.3.
Top Event
AND
Intermediate Event
Figure 3.3. Fault Tree example.
There are several benefits of employing FT A for use as a safety assessment tool.
These include:
• The Fault Tree (FT) construction focuses the attention of the analyst on one
particular undesired system failure mode, which is usually identified as the most
critical with respect to the desired function [Andrews & Moss, 2002].
• The FT diagram can be used to help communicate the results of the analysis to
peers, supervisors and subordinates. It is particularly useful in multi-disciplinary
teams with the numerical performance measures.
24

• Qualitative analysis often reveals the most important system features.
• Using component failure data, the FT can be quantified.
• The qualitative and quantitative results together provide the decision-makers with
an objective means of measuring the adequacy of the system design.
3.1.2.2.3 Cause-Consequence Analysis (CCA)
CCA is a marriage of fault tree analysis (to show causes) and event tree analysis (to
show consequences). CCA is a diagrammatic approach as shown in Figure 3.4.
Construction of cause-consequence diagrams starts with a choice of a critical event.
The "consequence tracing" part of a CCA involves taking the initial event and
following the resulting chains of events through the system. The "cause identification"
part of a CCA involves drawing the fault tree and identifying the minimal cut sets
leading to the identified critical event. CCA is extremely flexible as it can work
forward using event trees and backward using fault trees [Pillay & Wang, 2003].
Such a cause-consequence diagram is easy to modify and it can be split in several sub
diagrams. As such, CCA is a realistic and efficient tool to analyse a new system or a
new procedure. It is a means to gather in a practical way several FTs and it is possible,
when it has been built completely, to easily derive an equivalent ET.
3.1.2.2.4 Failure Mode, Effects and Criticality Analysis (FMECA)
FMECA is probably the most widely applied hazard identification method. It is a
combination of Failure Mode and Effects Analysis (FMEA) and Criticality Analysis
(CA). It can be carried out at any indenture level required to examine each failure
mode of an item and its possible consequences.

Independent causes Cause 1
Cause n
The defined undesired event
Construction direction of the diagram l1li
Logic clearing-up of
~ connections between events
and states
The input and output data of the cause diagram
Construction direction of the diagram
• • Logic clearing-up of
connections between events
and states
The input and output data of the consequence diagram
•
• • •
Figure 3.4. The diagram of cause-consequence analysis.
The objectives of a FMECA are:
The defined undesired event
Consequence 1
Consequence m
I. Identification of each failure mode, of the sequence of events associated with it
and of its causes and effects.
2. A classification of each failure mode by relevant characteristics, including
detectability, diagnosability, testability, item replaceability, compensating and
operating provisions.
3. An assessment of the criticality of each failure mode.
An FMECA may consist of the following steps [MIL-STD-1629 A, 1980]:
• Define the constraints and assumptions of the analysis.
• Break down the system to its indenture levels such as the sub-system level and the
component level.
• For each item at the level analysed, identify all possible modes of failures and
respective causes.
• For each identified failure mode, identify or provide the following information:
I. All the distinctive operating conditions under which failure may occur.
26

2. The failure rate of the identified failure mode.
3. The effects (consequences) on the safety and operability of the higher levels
(including the level analysed).
4. The possible means by which failure may be identified.
5. Design provisions and/or actions in operation to eliminate or control the
possible resulting effects.
6. The severity class of the possible effects where such a class may be defined by
one of the following linguistic variables:
Catastrophic:
Critical:
Marginal:
Negligible:
Involving death, system loss and/or severe environmental
damage.
Involving severe injury, major system damage and/or
major environmental damage.
Involving minor injury, minor system damage and/or
minor environmental damage.
Involving no injury and negligible damage to the system
and the environment.
• Failure consequence probability defining the likelihood that the effects of the
identified failure mode will occur, given that the failure mode has taken place.
• Criticality analysis
Criticality analysis allows a ranking of the criticality of the failure modes of items
as a function of the severity classification and occurrence likelihood.
If the probability of occurrence of each failure mode of an item can be obtained
from a reliable source, the criticality number of the item under a particular severity
class may be quantitatively calculated as follows:
where: C = criticality number,
E/ = failure consequence probability of failure mode i,
Li = likelihood of occurrence of failure mode i.

N = the number of the failure modes of the item, which fall under a particular
severity classification, and
t = duration of applicable mission phase.
Once the criticality numbers of the item under all severity classes have been
obtained, a criticality matrix can be constructed which provides a means of
comparing it to all other items. Such a matrix display shows the distributions of
criticality of the failure modes of the item and provides information for assigning
priority for corrective action. Criticality analysis can be performed at different
levels. Information produced at low levels may be used for criticality analysis at a
higher level.
An FMECA is an inductive process which involves the compilation of reliability data,
where available, for individual items. Information produced from FMEC A may be
used to assist in construction of fault trees and also in construction of Boolean
representation tables [Wang, et aI., 1995].
3.1.2.2.5 Risk matrix approach
The early form of the risk matrix methodology was presented in the [MIL-STD-882,
1969]. This methodology has founded wide application in many areas of technology.
The proposition of quantitative risk assessment presented to ships, which was based
on the risk matrix methodology [Kobylinski, 1997]. The following definition was
assumed: "Risk is defined as hazard probability times hazard severity
(consequences)". In generally used terminology risk means the product of the
probability of accident occurrence and the severity of damages being the results of
accident.
Further. the ordered two define the risk category: the level of probability and the
category of severity. The risk acceptance can be determ ined on the set of these two
(e.g. intolerable risk, As Low As Reasonably Practicable (ALARP) and negligible
risk).
28

Data needed to risk assessment by the risk matrix methodology can be obtained from
the historical records of the analysed system, similar systems or from expert
judgements.
The risk matrix approach will be evaluated and used in Chapter 3.2.4 and Chapter -t.
3.1.2.2.5.1 Risk acceptability criteria
Acceptance of risk is basically a problem of decision making, and is inevitably
influenced by many factors such as type of activity, level of loss, economic, political,
and social factors, confidence in risk estimation, etc. A risk estimate, in the simplest
form, is considered acceptable when below the level which divides the unacceptable
from acceptable risks. A better description of risk criteria is as the standards which are
used to translate risk estimates as produced by a risk analysis into value judgements.
As far as risk criteria for ships are concerned, the general criteria may include
[Spouse, 1997]:
1. The activity should not impose any risks which can reasonably be avoided.
2. The risks should not be disproportionate to the benefits.
3. The risks should not be unduly concentrated on particular individuals.
4. The risks of catastrophic accidents should be a small proportion of the total.
More specifically, individual risk criteria and social risk criteria need to be defined.
For example, an estimate of individual risk per annum of 10.7 can be considered as
"negligible risk"; similarly, an estimate of injuries occurring several times per year,
can be considered as "unacceptable" [Pillay & Wang, 2003].
In addition to the risk matrix, i.e. the boundaries of risk acceptability and
intolerability, risk criteria, in general, contain recommendations on the tolerability of
the overall system risk and the extent to which taking further risk reducing measures
may be justified.
29

3.1.2.2.6 Fuzzy sets theory
Problems of uncertainty in safety analysis can be treated using two principal types of
methods involving probability and possibility, respectively. Probability methods deal
with uncertainty which is essentially random in nature but of an ordered kind.
Probabilistic methods are based on a mature scientific theory [Apostolakis et aI.,
1993]. Possibility methods (non-probabilistic methods) study problems which are not
really probabilistic but cause uncertainty due to imprecision associated with the
complexity of a system as well as vagueness of human judgement. Possibility
methods often use fuzzy sets, possibility theory and belief functions [Apostolakis et
aI., 1993].
In probabilistic risk assessment, probability distributions are used to describe a set of
states for a system and to deal with uncertainty in order to evaluate potential hazards
and assessment system safety. In many cases, however, it may be difficult or even
impossible to precisely determine the parameters of a probability distribution for a
given event due to lack of evidence or due to the inability of the safety
engineer/designer to make firm assessments. Therefore one may have to describe a
given events in terms of vague and imprecise descriptors such as "likely" or
"impossible", terms that are commonly used by safety analysts/designers. Such
judgements are obviously fuzzy and non-probabilistic, and hence non-probabilistic
methods such as fuzzy set modelling may be more appropriate to analyse the safety of
systems with incomplete information of the kind described above.
Fuzzy set modelling can also be used together with Multiple Attribute Decision
Making (MADM) methods to assist decision makers in selecting the winning
design/procurement proposal that best satisfies the requirement in hand. It can also be
used together with Analytical Hierarchy Process (AHP) and the Delpli method In
carrying out design support evaluation [Sii et aI., 2002].
In maritime risk assessment. the application of numerical risk criteria may not always
be appropriate because of uncertainties in inputs [Wang & Kieran, 2000].
30

Accordingly, acceptance of a safety case/a formal safety assessment is unlikely to be
based solely on a numerical assessment of risk. In situations where there is a lack of
safety data for analysis or the level of uncertainty in safety data is unacceptably high,
fuzzy set modelling may be effectively used as a useful alternative approach by
maritime safety analysts to facilitate risk modelling and decision making.
3.1.3 Fire safety modelling
Zone models have been used since the mid 1970s to predict thermal hydraul ic
conditions in a fire compartment prior to flashover. The zone model approximation
treats the compartment atmosphere as two well mixed layers, namely a hot smoky
layer above a cooler and clearer layer. Such stratification often arises as a result of
buoyancy, but may be inapplicable in certain situations such as tall stairwells, long
corridors, or other situations where three dimensional effects are important. Zone
models apply conservation equations to each layer, with the user specified fire
providing a source of energy and mass.
Fire-growth And Smoke Transport (FAS1) is a zone model developed by the US
National Institute of Standards and Technology (NIST) to predict the smoke layer
interface height, layer temperatures, surface temperature and combustion product
concentrations during a fire in an enclosed space [Walter & Richard, 1989].
The aspects covered include:
I. Multiple connected compartments.
2. Multi fires (constrained or unconstrained).
3. Vertical and horizontal vents.
4. Mechanical ventilation.
5. Conduction through surfaces.
6. Radiation between fire, layers and surfaces.
7. Combustion chemistry and resulting toxic concentrations and optical density.
8. Attenuation by sprinklers.

At the outset, it is important to note that FAST is intended for use only by those
competent in the field of fire safety and is intended only to supplement the informed
judgment of the qualified user. The software is intended to provide quantitative
estimates of some of the likely consequences of a fire. The model has been subjected
to a range of verification tests to assess the accuracy of the calculations. Like any
computer calculation, however, the quality of the calculated result is directly related to
the quality of the inputs provided by the user. Lack of accurate predictions by the
model could lead to erroneous conclusions with regard to fire safety. All results
should be evaluated by an informed user.
SMARTFIRE has been developed at the University of Greenwich using a combination
of in-house and proprietary software building blocks [Wang, et aI., 200 1]. The
software produces reasonable agreement with experimental temperature
measurements derived for a non-spreading fire in a moderately large ventilated fire
compartment. The coarse mesh simulation, while performed on a relatively crude
computational mesh is able to represent the broad features of qualitative trends in the
observed temperature distributions at the locations quantitatively, temperatures are
generally over-predicted and the level of stratification within the compartment is not
well represented.
LUCIFER enables a deterministic appreciation of the step-by-step propagation of a
fire after a set time 't'. It also enables the identification of vital functions that will be
partially or totally destroyed and important zones affected by the fire [Garsmeur &
Anselme, 1998]. The time parameter 't' corresponds to the sum of the detection time
and the time needed for the fire crew to contain the fire, in other words to prevent it
spreading. LUCIFER does not calculate the fire duration through to its extinction by
quenching, lack of combustible material or through the action of fixed or mobile fire
fighting equipment within the volume formed by the burning zones.

3.1.4 Evacuation modelling
The computer simulation models for evacuation analysis that have appeared over the
last two decades have marked the evolution of evacuation models from 'hydraulic'
and/or 'ball-bearing' models to behavioural models with adaptive capabilities, which
can be represented as a simplified method and an advanced method. Today_ over 40
different evacuation models for aircraft, building, trains and ships exist. While each
model is very different, they all share common approaches in the way they represent
the geometrical environment, i.e. the configuration of the structure, the population and
the behaviour of evacuating individuals. These three constituent components are
pivotal in defining the nature of an evacuation model [Sharp, et aI., 2003]. Within the
modelling methodologies adopted, there are a number of ways in which to represent
the geometry, population and behaviour of the evacuees. To a certain extent, the range
of models reflects the purpose for which they were originally intended, the nature of
the developers, and also the availability of computing power at the time of the
development. In the following an attempt is made to review the computer-based
implementations of modelling approaches that are widely accepted as applications to
be used in the maritime environment.
SIMULEX was originally developed at the University of Edinburgh and is currently
maintained by IES Scotland. SIMULEX is a model that through the use of a detailed
spatial representation, concentrates on the physical aspects of the population and the
way these affect the outcome of the evacuation. It intended to be used as a design tool
by fire safety engineers and possibly architects and building engineers when devising
the geometric layout of buildings in the design stages [Thompson, et aI., 1995a,
1995b, 1996]. SIMULEX can be used to simulate the evacuation of large number of
people from large multi-floored structures.
EVACSIM and EVAC are both discrete time step models. EVACSIMwas developed in
1995 and has been used to model and analyse the evacuation flow for public and
private facilities (including buildings, stadiums, passenger terminals and offshore oil
platforms) [Soma, et ai, 1995]. EVAC was developed to comply with IMO regulations
in addition to Norwegian regulations, which are considerably stricter [Drager & Orset,
1999]. EVAC is a model that applies a coarse network method of geometry
33

representation. This would be supported in that passengers escape via means of an
escapeway, which is a series oflinked decision points
maritimeEXODUS is part of the EXODUS suite of software tools based on an
automatic model developed by the Fire Safety Engineering Group (FSEG) at the
University of Greenwich. [Galea, et aI., 1996, 1999] [Owen, et aI., 1996, 1998]. The
suite also exists for use in buildings and aircraft (for aircraft design and certification).
Recently, FSEG is extending the system for application of marine fields. In
collaboration with the Canadian company Fleet Technology and the Canadian
government, a detailed abandonment model is currently under development and a
series of full-scale trials is being developed in order to collect human performance
data under different conditions of list. This information will be incorporated with
maritimeEXODUS along with appropriate modifications to the behaviour sub-model.
The current prototype version of maritimeEXODUS does not posses marine specific
data for the performance of passengers under conditions of list and roll. However,
when this data is available it can easily be incorporated into the model framework. As
the model has the flexibility to allow the user to alter the entire preset default values,
it is easily adaptable when new data becomes available. Furthermore, the current
version of maritimeEXODUS does not include reliable data to represent the
preparation/ deployment of the escape system or the actual abandonment ofthe vessel.
Again, these aspects can be included when data become available.
Evacuability index (Evi) was developed by the Ship Stability Research Centre
(SSRC) at the Unversities of Glasgow and Strathclyde [Vassal os, et aI., 2001]. Evi is
passenger evacuation software developed specifically for a ship-sea environment,
capable of real time evacuation simulation of the most complex of scenarios in the
largest cruise ships. It represents the state-of-the-art computer simulation-based
capability for the prediction of passenger mustering and evacuation involving a
number of escape and rescue scenarios (abandon ship, transfer to refuge centres or a
combination of these) in a range of incidents (fire, collision, progressive flooding,
cargo shift, foundering) whilst accounting for ship motions in a sea environment.
Valuable input and feedback from the owners/operators can help refine and render the
model a practical tool which, coupled to modelling of uncertainty in all the parameters
that may affect evacuation times and the ability to play back a given scenario as video.
34

provides the analyst with wide-ranging capability in modelling realistically the most
complex of evacuation scenarios thus allowing for routine applications of passenger
evacuation analysis. The latter entails a wide range of evacuation capabilities
including evaluation of evacuation time, potential bottlenecks. assessment of
accommodation module layout and sensitivity analyses to assist design for ease of
evacuation, passenger familiarisation with a ship's environment, "what if' scenarios
for training, devising effective evacuation planning procedures/strategies and decision
support to manage a crisis. Evi is available in the form of a computer program that can
be readily customised to any vessel environment with an efficiently tailored user
interface and Run Time Simulator (RTS).
3.1 .5 Discussion
In this section, typical safety analysis methods, fire modelling and evacuation
modelling techniques are outlined in terms of their requirements, advantages and
limitations. Some of these techniques have been successfully used in the industry and
still continue to be used. However, the application of these conventional techniques to
passenger vessel fire safety assessment may not be as straightforward as it may seem.
Certain modifications are needed to enhance the application of such methods to
passenger ships. These modifications include the ability of the analysis methods to
handle data that is associated with a high degree of uncertainty and the integration of
expert opinion in a formal manner where there is no bias of opinion.
The conventional methods can be used individually or in a combined manner within
the framework of a Formal Safety Assessment (FSA) process. The FSA process will
be described and discussed in the next section, detailing how the analysis methods
outlined can be used effectively together with some of the novel techniques developed
in the following chapters of this thesis.
35

3.2 Formal Safety Assessment (FSA)
3.2.1 Introduction
Traditionally, improvements in shipping safety have emerged in response to major
accidents. Under FSA, the International Maritime Organisation (IMO),s approach to
regulation would aim to anticipate accidents through risk assessment and set standards
accordingly. The loss of the Alexander Kielland semi-submersible and the Piper
Alpha platforms focussed enormous attention on the unsatisfactory system which had
seen such structures built to comply with existing rules, but which had been unable to
prevent disasters costing several hundred lives [Department of Energy, 1992].
The Cullen inquiry [Department of Energy, 1992] into the loss of the Piper Alpha, in
the UK sector of North Sea firmly committed the offshore industry to altering its
design approval process to embrace formal safety assessment and the safety case. The
offshore operators have to demonstrate that each of their installations complies not
only with prescriptive rules, but also meets certain levels of safety. It is an expensive
and time consuming process, but against the public perceptions of offshore safety. It
has been heightened by the huge publicity of the Piper Alpha disaster, which clearly
left no choice for the industry.
In 1992, the Select Committee of the House of Lords published a report entitled
'Safety Aspects of Ship Design and Technology' [House of Lord, 1992]. The report
called for a more scientific approach to ship safety, with an emphasis on performance
or goal-based rather than prescriptive requirement or the so called safety case regime.
The UK government responded to the report agreeing that the concept was ideal to be
worked towards but recognising that it was not a practicable solution at present.
However, the UK recognised that a number of elements of the safety case approach
were being progressed, such as the introduction of the International Safety
Management (ISM) Code and a move towards greater use of performance based
regulations both at IMO and in Classification Society Rules. As a result, the UK
submitted a paper to the IMO Maritime Safety Committee drawing on the conclusions
of the House of Lords Report encouraging the application of the safety case approach
36

to the work of IMO and to shipping. In order to distinguish the approach as applied to
ships from elsewhere the paper used the term FSA [Sii, 2000]. This is a new approach
to maritime safety which involves using the techniques of risk assessment and cost
benefit assessment, not for individual ships, but as a basis for IMO's rule making
process for shipping in general. The UK reasoned that the adoption of FSA would
enable safety issues at IMO to be prioritised, and regulations derived that are cost
effective and proportional to risk.
FSA was seen by the UK in its proposal to the Maritime Safety Committee as
comprising five steps as follows: identification of hazards; assessment of risks
associated with those hazards; ways of managing the risks identified; cost benefit
assessment of the options identified in the previous step; and decisions on which
options to select [Peachey, 1995]. FSA is designed for application to common safety
issues for a generic vessel type. In this section, a trial application of the proposed
formal risk analysis techniques together with the FSA approach to a generic passenger
vessel is demonstrated.
3.2.2 Formal Safety Assessment (FSA)
FSA is a new approach to marine safety which involves using the techniques of risk
and cost-benefit assessment to assist in the decision making process. The FSA is
based on QRA and provides applications of QRA to marine transportation. It is a
structured methodology, aimed at enhancing maritime safety, including protection of
life, health, the maritime environment and property.
FSA is thought as a tool to help in the evaluation of new regulations for safety in
shipping and in comparisons between existing and possibly improved regulations. It
can be applied by Governmental Administrations and Organisations when proposing
amendments to safety. It is possible to apply the FSA on the level of classification
societies, shipyards and ship owners.
International teams have been developing FSA continuously. The "Interim Guidelines
for the Application of Formal Safety Assessment to the IMO Rule -Making Process"
37

was produced in 1997 [IMO, 1997a], and the "Draft Guidelines for FSA" was revised
in 2001 as the report of the Correspondence Group [IMO, 2001a, 2001 b]. The state
of-art report is based on the latter guidelines.
3.2.3 Basic terminology ofFSA
The following basic terminology is used within FSA [Wang, 1994]:
Accident An unintended event involving fatality, injury, ship loss or
damage, other property loss or damage, or environment damage.
Accident category A designation of accident reported in statistical tables according
to their nature, e.g. fire, collision, grounding, etc.
Accident scenario
Consequence
Frequency
Generic model
Hazard
Initiating event
Risk
A sequence of events from initiating event to one of final stages.
The outcome of an accident.
The number of occurrences per unit time (e.g. per year).
A set of functions common to all ships or areas under
consideration.
A physical situation with a potential for human injury, damage
to property, damage to the environment or some combination of
these.
The first event of the sequence leading to a hazardous situation
or accident.
The combination of the probability and the degree of the
possible injury or damage to health in a hazardous situation.
Risk contribution The combination of all fault trees and events trees that constitute
tree the risk model from hazard to outbreak of the categories and
sub-categories of accidents.
Risk control A means of controlling a single element of risk.
measure
Risk contribution A combination of risk control measures.
option
Risk evaluation Criteria used to evaluate the acceptability Itolerability of risk.
criteria
38

3.2.4 Methodology ofFSA
FSA methodology comprises the following five steps:
• Step 1: Identification of hazards.
• Step 2: Estimation of risk associated with those hazards.
• Step 3: Development and evaluation of alternative ways of managing those risks.
which need to be addressed.
• Step 4: Cost benefit assessment of these alternative risk management options.
• Step 5: Decision making and recommendations.
The flow chart between these steps is presented in Figure 3.5. The purpose in Step 1 is
to identify and generate a prioritised list of hazards, specific to the problem under
consideration. Hazard identification comprises both creative and analytical
techniques. The first one should ensure that the identification process is proactive,
directed not only to the past but also to the events possible in the future. It is carried
out by the group of experts of various appropriate areas (design, operation,
management, safety analysis) during structured reviews. The combination of available
data and judgements is usually used. The review session may last over a number of
days. The analytical techniques ensure that the previous experience is properly taken
into account. A coarse analysis of possible causes and outcomes of each identified
accident category is made by using standard techniques (ETA, FTA, CCA. and
FMECA. etc.).
39

Step 1. Hazard idetification
.. .. Step 2. Risk estimation
h ,r
Step 3. Risk control options
J~ ,r
Step 4. Cost benefit assessment
.. -
DECISION MAKER
t Step 5. Decision
making and recommendation
h j~
Figure 3.5. FSA methodology [IMO, 1997a].
3.2.5 An example
Using the risk matrix approach the screening of earlier identified hazards is carried
out. The available data on the frequency about different outcomes of accident
scenarios, supported by judgements, are used. The risk matrix and connected
taxonomies are shown in Tables 3.1-3.3 [IMO, 1997b]. The consequence and
probability indices used in the matrix are determined in logarithmic scale. A risk
index may therefore be established by adding the probability/ frequency and
consequence indices (risk is defined as the product of probability and severity of a
damage).
The purpose in step 2 is to estimate the distribution of risk, obviously connected with
the hazards, which were identified and selected in step 1, and to address high risk
areas. Risks to people, the environment and property are considered in dependency on
the issue under analysis.
40

Table 3.1. Frequency indexes.
Fi Frequency General interpretation
(Likelihood of occurrence of a
single event a vessel)
Fl 10,000 - 100,000 years Extremely remote to extremely improbable
F2 1,000 - 10,000 years Remote to extremely remote
F3 100 - 1,000 years Remote
F4 10 - 100 years Reasonably probable to remote
F5 1 to 10 years Reasonably probable
F6 Yearly Reasonably probable
F7 Monthly Frequent
Table 3.2. Severity indexes.
Si Severity Effects on human safety Effects on ship
1 Minor Minor injuries Local equipment damages
2 Significant Major injuries Non-severe ship damages
3 Severe 1 to 10 deaths Severe damages
4 Catastrophic >10 deaths Total loss
Table 3.3. Risk matrix.
Frequency
Fl F2 F3 F4 F5 F6 F7
SI Minor 1 2 3 4 5 6 7
S2 Significant 2 3 4 5 6 7 8
S3 Severe 3 4 5 6 7 8 9
S4 Catastrophic 4 5 6 7 8 9 10
The above purpose is achieved by constructing and quantifying a diagram to display
the distribution of risk, which is a typical cause-consequence model being a
combination of FT and ET trees. The quantification is begun from the accident
categories and then distributed down and up as deep as rationally. The available
statistic data supported by judgement are used for this quantification.
41

The high risk areas are also addressed by ranking the risks using Frequency-Number
(FN) diagrams or Potential Loss of Lives (PLL) values. The focus will be on them in
next step. The best practice is to distinguish three levels of risk: Intolerable, ALARP
and Negligible. The first level means that the risk cannot be justified except in
extraordinary circumstances. The third level means that the risk is so small that no
further precaution is necessary. The ALARP is situated between those two levels. The
risk of shipping on a vessel should therefore be situated in ALARP range because sea
travel can never be made so safe that the risk is Negligible [IMO, 2001a]. It is noted,
that levels of risk for shipping are not quantified to date, though several propositions
in this area have been elaborated [Skjong & Eknes, 2001] [Soares & Teixeira, 2001].
The purpose of step 3 is to propose effective and practical Risk Control Options
(RCOs). Risk areas needed control are focused, potential Risk Control Measures
(RCMs) are identified and then grouped into practical RCOs. The latter should
address both existing risks and risks introduced by future technology, methods of
operation and management.
The identification of RCMs is achieved by structured revIew techniques. These
techniques include risk attributes and casual chains. The first ones relate to how the
measure might control risk, and the second ones to where risk control can be
introduced in the sequence of events leading from basic events to damages.
Works are continued in IMO under development of techniques to identify the various
influencing factors to risk (connected with the environment, policy, organisation,
etc.), named 'Regulatory Impact Diagram' [IMO,2001b].
RCMs should be aimed at the following actions: (1) reducing the frequency of
failures, (2) mitigating the effect of failures, (3) alleviating the circumstances of
failures, (4) mitigating the consequences of accidents.
The RCMs are grouped into limited number of practical RCOs. When RCOs are
assigned. the interested entities (stakeholders - person, organization, company, coastal
state. flag state, etc.), which may be affected by the proposed measures. are identified.

The purpose of step 4 is to estimate and compare benefits and costs connected with
the implementation of each RCO. Costs should be expressed in the terms of the life
cycle costs of under analysis. Benefits may comprise reduction in fatalities, casualties.
environmental damages and clean-up, indemnity of third party liabilities, etc .. and
increase in the average life of ships. Using various methods the evaluation of costs
and benefits can be carried out.
The effectiveness of RCOs can be expressed by "Cost per Unit Risk Reduction
(CURR)" and "Implied Costs of Averting a Fatality (lCAF)".
The purpose of step 5 is to define the recommendations for relevant decision-makers.
The recommendations can be made in various kinds. The natural kind is the
comparison and ranking of RCOs in the light of associated costs and benefits and
identification of the most cost-effective RCO, which keep risk as low as reasonably
practicable.
The results of FSA should be evaluated using risk evaluation criteria, but they are not
set-ups up to now. In the Draft Guidelines [IMO, 2001b], it can be found that "It is
desirable to determine risk evaluation criteria after wide and deep consideration for
the use of the organisation and member government(s), which propose(s) new
regulations or modification to existing regulations."
3.2.6 Discussion
The FSA methodology is particularly appropriate to the analysis of regulatory regime
influencing the risk level of ships and searching safe solutions of them or their
management. Safety is expressed by risk level connected with the life cycle of an
analysed ship involving people, property and the environment. Also FSA fulfils the
postulates of safety science: it treats safety as an attribute of man-technology
environment system and applies the probabilistic apparatus of safety quantification.
Simultaneously FSA is adapted to analyses in the situations when historical data
43

needed for safety modelling are lacking, and is completed by subjective judgements.
However, FSA has some deficiencies.
Several problems have been identified with the use of the current method as proposed
by the Maritime Coastguard Agency (MCA) to the IMO. These include:
1. Reliable data is usually not available for passenger vessels - and when it IS
available, there is a high level of uncertainty associated with the data.
2. The risk matrix approach is a simple subjective method to quantify the probability
of occurrence of a hazard and severity of the associated consequences however it
lacks a formal approach to quantifying expert judgement and opinion. Conflicting
opinions of two different analysts on the severity of an accident could result in a
deadlock.
3. It is usually difficult to quantify the cost and benefits of each RCO for each of the
identified stakeholders. A more subjective approach is needed to express the
preference of one RCO over the others.
3.3 Conclusion
In this chapter, several safety assessment methods and FSA have been reviewed in
terms of their characteristics. Some typical fire safety models and evacuation models
have been briefly studied. The review carried out in this chapter should provide basis
for further research aimed at facilinating formal fire safety assessment of passenger
ship.
The setbacks of the FSA methodology and typical safety analysis techniques
discussed here are addressed by the development of various methods that are
presented in the following chapters of this thesis.
44

References
ABS (2003), "Risk Evaluations for the Classification of Marine-Related Facilities",
America Bureau of Shipping, June, USA.
Aldwinckle, D.S. & Pomeroy, R.V. (1983), "A Rational Assessment of Ship
Reliability and Safety", RINA Transactions and Annual Report, pp 269-288, London,
UK.
Andrews, J. D. & Moss, T. R. (2002), "Reliability and Risk Assessment", Longman
Scientific & Technical.
Apostolakis, G. E., Guedes, S. C., Kondo, S. & Mancini, G. (1993), "Are Reliability
and Risk Assessment Ready for Fuzzy Methods?", Reliability Engineering & System
Safety, Vol 42.
Department of Energy (1992), "Cullen Report: The Public Inquiry into the Piper
Alpha Disaster", ISBN 0 10 113102, London, UK.
Drager, H. K. & Orset, S. (1999), "EV AC - An Internet Software Program Solution
for Evacuation Analysis of Passenger Vessels", Quasar Consultants, Oslo, Norway.
Galea, E. R., Owen, M. & Lawrence, P. J. (1996), "Computer Modelling of Human
Behaviour in Aircraft Fire Accidents", Toxicology, Vol 115(1-3), pp 63-78.
Galea, E. R. (1999), "Principles and Practice of Evacuation Modelling", University of
Greenwich, ISBN 1-899991-42-5, London, UK.
Garsmeur, P. L. & Anselme, G. D. (1998), "Simulating the Spread of Fire - the
LUCIFER Software", INEC 1998 Surviving the War, IMarEST, London, UK, pp 133-
138,15-17 April.
45

Henley, E. J. & Kumamoto, H. (1996), "Probabilistic Risk Assessment and
Management for Engineers and Scientists", IEEE Press, Second Edition. "\ ew \' ork.
USA.
House of Lords (1992), "Safety Aspects of Ship Design and Technology", Carver
Report, Select Committee on Science and Technology, 2nd Report, HL Paper 30-1,
February.
IMO (1997a), "Interim Guidelines for the Application of Formal Safety Assessment to
the IMO Rule-Making Process", MSC/Circ.829. MEPC/Circ.335, London, UK.
IMO (1997b), "Formal Safety Assessment - Trial Application to High Speed
Passenger Catamaran Vessels", MSC 68/Informal Paper, London, UK, 27 May.
IMO (2001a), "Formal Safety Assessment". Report of the Correspondence Group Part
1: Minutes of the Discussion, MSC 74116, London, UK.
IMO (2001b), "Formal Safety Assessment". Report of the Correspondence Group Part
2: Draft Guidelines for FSA, MSC 74/1611, London, UK.
Kobylinski, L. K. (1997), "Rational Approach to Safety Requirements", Proceedings
of Marine Technology II Conference, Szczecin, Poland.
Lee, F. P. (1996), "Loss Prevention in the Process Industries", 2nd Edition,
Butterworth-Heinemann, ISBN 0 7506 1547 8.
MIL-STD-882 (1969), "System Safety Program for Systems and Associated
Subsystems and Equipment; Requirements", US Dept. of Defence, USA.
MIL-STD-1629A (1980), "Procedures for Performing a Failure Mode, Effects and
Criticality Analysis", Military Standard, Naval Ship Engineering Centre, Washington
DC, USA.
46

Owen, M. (1996), 'The EXODUS Evacuation Model applied to Building Evacuation
Scenarios", Journal of Fire Protection Engineers, Vol 8, No 2, pp 65-86.
Owen, M., Galea, E. R., Lawrence, P. 1. & Fillippidis, L. (1998), "The Numerical
Simulation of Aircraft Evacuation and Its Application to Aircraft Design and
Certification", The Aeronautical Journal, Vol 102, No 1016, pp 301-312.
Peachey, J. H. (1995), "Formal Safety Assessment for International Shipping",
Proceedings of Safety of Ships - Assessment and Regulation, Southampton, UK, 24-
25 May.
Pillay, A. & Wang, J. (2003), "Technology and Safety of Marine Systems", Elsevier
(Ocean Engineering Book Series), ISBN: 0080441483 Linacre House Jordan Hill,
Oxford, UK.
SAFERELNET (2002), "Quantitative Risk Analysis - Report on Current Practice",
Safety and Reliability of Industrial Products, Systems and Structures, September.
Sharp, G., Gwynne, S. & Galea, E. R. (2003), "The Effects of Ship Motion on the
Evacuation Process", Subsection 3.1 - Critical Review on Model of Evacuation
Analysis, Fire Safety Engineering Group, University of Greenwich, UK.
Sii, H. S. (2000), "Offshore Support Vessel Safety Assessment", PhD Thesis, School
of Engineering & Advanced Technology, Staffordshire University, UK, September.
Sii, H. S., Wang, J. & Ruxton, T. (2002), "A Safety Based Decision Support System for
the Design of Large Offshore Engineering Products", Final report submitted to the
United Kingdom Health & Safety Executive for research contract D3474, UK.
Skjong, R., & Eknes, M. (2001), "Economic Activity and Societal Risk Acceptance",
Proceedings of ESREL 2001 Conference, Torino, Italy.
47

Soares, G. C. & Teixeira, A. P. (2001), "Risk Assessment In Maritime
Transportation" Reliability Engineering & System Safety, Vol 74.
Soma, D., Drager, K. H. & Bj0rdal, P. (1995), "Computer Simulation for
Optimisation of Offshore Platform Evacuation", OMAE 1995, Copenhagen.
Denmark, June.
Spouse, J. (1997), "Risk Criteria for Use in Ship Safety Assessment", Proceeding of
Marine Risk Assessment: A better Way to Manage Your Business, IMarEST. London.
UK, 8-9 April.
Thompson, P. A. & Marchant, E. W. (1995a), "A Computer Model for the Evacuation
of Large Building Populations", Fire Safety Journal, Vol 24, pp 131-148.
Thompson, P. A. & Marchant, E. W. (1995b), "Testing and Application of the
Computer Model' SIMULEX''', Fire Safety Journal, Vol 24, pp 149-166.
Thompson, P. A., Marchant, E. W. & Wu, J. (1996), "Modelling Evacuation in Multi
Storey Buildings with 'SIMULEX"', Fire Engineering Journal, Vol 56, No 185, pp 6-
11.
Vassalos, D. (2001), Christiansen, G. & Kim, H., "Evi - Passenger Evacuation
Performance Assessment in Ship Design and Operation", 8th TIEMS International
Conference, Oslo, Norway.
Villemeur, A. (1992), "Reliability, Availability, Maintainability and Safety
Assessment - Methods and Techniques", Vol 1, John Wiley & Sons, Chichester, UK.
Walter, W. J. & Richard, D. P. (1989), "Technical Reference Guide for FAST Version
18", Center for Fire Research, National Engineering Laboratory, NIST Technical Note
1262, USA, May.
48
Wang, J. (1994), "Formal Safety Analysis Methods and Their Application to the
Design Process", PhD Thesis, Engineering Design Centre, University of "\:e\\ castle
Upon Tyne, UK, July.
Wang 1. & Kieran, O. (2000), "Offshore Safety Assessment and Safety Based Decision
Making - the Current Status and Future Aspects", Journal of Offshore Mechanics and
Arctic Engineering - Transactions of the ASME (American Society of Mechanical
Engineers), Vol 122, No 2, pp 63-69.
Wang, J., Ruxton, T. & Labrie, C. R. (1995), "Design for Safety of Marine
Engineering Systems with Multiple Failure State Variables", Reliability Engineering
and System Safety, Vol 50, No 3, pp 271-284.
Wang, Z. F., Galea, E. R., Patel, M. K. & Ewer J. (2001), "Simulation One of the CIB
W14 round Robin Test Cases Using the SMARTFIRE Fire Field Model", Fire Safety
Journal, Vol 36, pp 661-677.
49

CHAPTER 4 - FIRE SAFETY ASSESSMENT ON PASSENGER
SHIPS: APPLICATION TO AN ACCOMMODATION ZONE
Summary
This chapter provides an outlook on fire safety assessment, dealing with both its
applicability to passenger ships and work needed to reach practical applications. A
methodology is proposed for studying the fire scenarios in a typical ship cabin b)
using the currently available data including the specific fire load and the sprinkler
performance (according to SaLAS: Safety Of Life At Sea). An example is
demonstrated to show the basic assumptions, the models and the calculation
procedures required to analyse a possible fire scenario in an accommodation zone of a
passenger ship.
4.1 Introduction
Many of the greatest maritime tragedies have involved fire, especially fire onboard
passenger ships. "The Morro Castle", "The Lakonia", "The Scandinavian Star" and
"The Moby Prince" accidents are typical examples [Cowley, 1994]. Serious accidents
at sea over the last few years indicate that more research work needs to be carried out
on fire safety in ships.
Safety is the complement or antithesis of risk. Safety will be increased if the risk is
reduced. There is no such thing as absolute safety. Some level of fire risk is virtually
unavoidable. A passenger ship may be considered to be "very safe" from fire if a
sufficiently "low fire risk" is associated with its structure, contents and occupants. The
objective of fire safety assessment is therefore to reduce risk to life and property to
acceptable levels to a property owner and society at large. This aim can be achieved
by carrying out fire prevention activities, which would reduce the frequency of fires
significantly and installing passive and active fire protection measures which would
minimise the consequences if fire occurs [Ramachandran. 1999].
50

Fire safety on board passenger ships has come under scrutiny following a fire on
board 'The Scandinavian Star' in 1990, which revealed a number of flaws in the
International Maritime Organization (lMO) rules and regulations. This has led to the
development of more comprehensive rules and regulations concerning fire safety of
passenger ships [SNMA, 1996].
The new trend in the international regulations emphasizes the importance of the
Quantitative Risk Assessment (QRA) as a design tool to comply with rules and to
optimise specific solutions compatible with corporate strategies. In particular, it offers
the possibility to better appreciate the benefits resulting from the combined effects of
innovative solutions to a design problem [IMO, 1996]. QRA is a technique that can be
used both qualitatively and quantitatively. It is used to understand and assess different
hazards, and forms the basis of hazard management.
This chapter provides an overview on some of the typical techniques for fire risk
assessment, with special emphasis on a framework for fire safety assessment to
passenger ships.
4.2 Fire Safety Assessment
4.2.1 Goals of fire safety assessment
The main goals of fire safety assessment are:
1. To assess the fire risk by evaluating the frequency and possible consequences of
each scenario.
2. To rank the risk against acceptability criteria, in order to highlight the areas
needing risk reduction.
3. To compare different design solutions aimed at:
- Preventing the fire occurrence.
_ Delaying fire growth and propagation.
51
- Minimising the consequences of fire.
4.2.2 Application
Historical data indicates that fires in accommodation areas can be regarded as events
characterized by high specific impact on the people on a passenger ship, whose
consequences range from mere discomfort to the potential for fatalities. This is also
due to the absence of international maritime restriction on upholstered furniture and
cloths currently used in passenger vessel's accommodations, unlike the properties of
materials used for the boundaries of the spaces (bulkheads, floor and ceiling
components and coverings) [Anderson, et aI, 1993], subjected to fire restriction. Such
reasons have suggested the possible occurrence of a fire event in a cabin of a
passenger ship, constituting the initiating event for the analysis.
Investigations, available in literature, of fires on ships show that most injuries and
fatalities are due to the effects of smoke and toxic fumes [Jenner, 1994, Jensen, 1994].
In this context, the present application is concentrated on the quantification of the
severity degree of the various scenarios stemming from the initiating event. The
severity is related to the impairment of the escape from a fire zone caused by smoke,
on the basis of the time available to the passengers to leave the zone.
4.2.3 Methodology
A fire assessment framework is proposed to include the following steps:
1. Problem definition.
2. Construction of the Event Tree (ET).
3. Quanti fication of the outcomes.
4. Simulation of the consequences.
5. Risk evaluation.
52

They are detailed in the following:
1) The analysis is applied to a fire event in a cabin of a passenger ship. However,
for its intended purpose, the analysis is intentionally restricted to a single piece
of furniture burning in one cabin, allowing to screen the most critical scenarios.
For this reason, the severity of the scenarios is viewed in relative terms; actually,
in such conditions, the fire will self-terminate after some minutes. It is to be
underlined that such limitations by no means affect the basic outline of the
methodology; its application to broader scenarios only depends on the extent of
the available information and resources employed.
2) The initiating event of the ET is the occurrence of the fire in a cabin, which is
assigned a fictitious unitary frequency, as the absolute evaluation of fire risk is
out of the scope of this analysis. The definition of the ET nodes, on the other
hand, is set on the basis of the main factors affecting the fire escalation, namely:
- Ignition (immediate/delayed depending on the effectiveness of preventive
measures such as use of fire retarding materials).
- Ventilation (mechanical and/or natural).
- Correct operation of protective systems (effectiveness of control measures such
as fire detection systems and of mitigation measures such as sprinkler
systems).
- Fire spread to adjoining compartments (e.g., due to openings, air conduits,
etc.).
3) Once the ET is constructed, each node is assigned a probability of failure and
success, obtained from databases or expert judgement. As the nodes in this case
are independent, the probabilities of the ET outcomes occurring can be obtained
[Angelo & Giovanni, 1997].
53

4) Each ET outcome scenario is to be assigned a severity level of possible
consequences. In this case, this is carried out by means of a deterministic
simulation through the fire zone model implemented in the FAST computer code
[Peacock, et ai, 2000]. In particular, the simulation of every scenario is conducted
to yield results in terms of smoke interface height, temperature of upper layer and
heat release rate, which are used to evaluate the consequences against the severity
criteria.
5) Risk evaluation - Hazard screening.
Risk is concerned with the frequency (probability) coupled with the consequences
(number of deaths, cost of damage to property or the environment) that might be
caused.
Table 4.1. Generalised risk matrix table [IMO, 1999].
Frequency
Risk matrix table Low High
.. • Fl F2 F3 F4 F5 F6 F7
Minor Cl 1 2 3 4 5 6 7
Significant C2 2 3 4 5 6 7 8
Severe C3 3 4 5 6 7 8 9
Catastrophic C4 4 5 6 7 8 9 10
Notes:
Each Ci (i = 1 to 4) stands for either the personnel safety (Si),
environmental degradation (Ei) or business loss (Bi) consequence band.
Risk judgement can be based on a Probability-Consequence Interaction Table, which
is known as risk matrix table (see Table 4.1). The purpose of the hazard screening is
to provide a quick and simple way of ranking hazards, in terms of frequency and
severity of possible outcomes with a view to setting priorities for more detailed risk
evaluation. The risk matrix approach is a semi-quantitative risk ranking technique,
54

which is used in the hazard screening process. For each appropriate combination, an
assessment is made on the frequency (F) of the accident, and the severity of the
consequences in terms of the personnel safety (S), loss in business (B) and
environmental degradation or contamination (E).
In the risk matrix table, the magnitude of risk (defined as product of frequency and
consequence) is measured on a scale of 1 to 10 as depicted in Table 4.1. This is called
the Risk Ranking Number (RRN) which ranges from 1 (least frequent and least severe
consequence) to 10 (most frequent and most severe consequence). Ranking of the
various accidents determines their order in relation to one another. The RRN is
indicative of the relative order of magnitude of risk [IMO, 1999]. In this chapter, the
approach is used with reference to either historical data or expert judgements, and
indeed, the FAST results.
4.3 Case Study
4.3.1 Problem definition
4.3.1.1 Fire hazard
In general, the fire hazard is related to the expected level of harm associated with the
exposure to a fire or its eflluent. In the context of this work, the fire hazard is
associated with the loss of escape route.
An escape route is generally considered impassable when there are levels of
temperature and smoke concentration, which are unacceptable for life safety ('Smoke'
is used throughout this chapter to mean the total airborne eflluent from the fire; it
includes the gaseous aerosol and soot like products of fire) [USCG, 1995].
As a first step, only the height and temperature of upper layer were assumed to be
representative of the escape route impairment, neglecting the smoke concentration.
Within this assumption, this limited state approach adopted allows to associate
probability values with the different escape time margins. Obviously this is not a
55

measure of fatalities, which depends on the people's exposure to temperature and
smoke toxicity [Angelo & Giovanni, 1997].
4.3.1.2 Limit criteria
The smoke level values corresponding to unacceptable toxicity and visibility
reduction are different for each material and type of combustion process and many
data are needed to set criteria. Without available data on the smoke released by
furniture materials under the actual burning conditions (which affect the smoke mass
concentration factor and thus the smoke optical density), a conservative approach was
adopted, based on layer temperature and overall upper layer height from the floor.
rather than on opacity [Angelo & Giovanni, 1997].
4.3.1.3 Layout and data
The SOLAS philosophy is aimed at confining any fire within a vertical zone. This
analysis was applied to an area of a passenger ship compliant to 1997 Amendments of
SOLAS [IMO, 1997].
The following are the basic available data and assumptions:
Cabin description
Passenger cabin's area is 15m2(5mx3m), containing a trash can, an upholstered chair,
a bed, a table and a toilet, and provided with low flame spread covering as per SOLAS
II-2.Reg.34.3 [IMO, 1997].
Some information on the layout and fire load for a typical cabin was obtained from an
internal investigation and from NFPA 72E [NFP A, 1987].
56

The data relative to the fire and necessary for the fire simulation are summarized in
Table 4.2. They are relevant to the t-squared fire growth model and classified
according to the BSI Standards, 1994 [BSI, 1994].
Table 4.2. Combustible items in the cabin.
Item Fire Fire a Peak Virtual Source
Load Growth (KW/S2) Value Time
(MJ/m2) Label (MW) (S)
Chair F-29 372 Fast 0.1055 2.11 70 NBSIR 83-2787,
test 27
Bed 390 Medium 0.0086 0.66 90 NBSIR 83-2787,
test 67
Wardrobe 504 Medium 0.0117 5.50 100 NBSIR 83-2787,
test 42
[U S Department
of Commerce,
1983]
Table 671 Medium 0.0257 1.75 64 Fire Data (2
Panel
Workstation
Test)
[U S Department
of Commerce,
1983] Others 2890 Ultra- 0.3300 2.50 - Judgement
Fast
Total 4827
Specific 330
Fire Load mJ/m2
The t-squared fire growth model can be represented with a power law relation of the
following form:
where Q is the heat release rate of the ftre, a is the fire intensity coefficient, and t is
time [peacock, et ai, 2000].
57

The items called "Others" encompass toilet, TV set, refrigerator, luggage and
coverings. In order not to complicate the analysis too much, and since the simulation
does not account for the behaviour of distributed fire load, these items were grouped
in a single "dummy" object.
Ventilation
The cabin is equipped with a self-closing door as per the SOLAS regulations [IMO,
1997] and a window (with no restrictions about its constituting materials), depending
on the cabin row.
The door is not airtight. Therefore, it was assigned a leakage even when closed.
The window is made of standard materials, and for this reason, it was assumed that it
was unable to withstand the fire. This implies the window to be either open or broken,
in those scenarios when it is present.
To take into account the natural ventilation (including leakage through the door), the
following geometric characteristics of the openings were assumed:
- Door open: 0.6 m x 2.1 m,
- Door closed: 0.01 m x 2.1 m,
- Door grill: 0.2 m x 0.4 m, sill 0.2 m.
Mechanical ventilation supplies air into the cabins with a capacity of 277 kW,
according to the technique of oxygen consumption calorimetry [SFPE, 1993].
Sprinkler
The sprinkler characteristics (temperature intervention and specific flow rate) are
consistent to SOLAS [IMO, 1997].
58

The sprinkler has the following performances:
Flow rate: 5 litre/m2/min,
Spray density: 8.3 xl 0-5 mis,
It is the amount of water dispersed by a water spray-sprinkler. The units for
spray density are length/time. These units are derived by dividing the volumetric
rate of water flow by the area protected by the water spray.
Activation temperature range from 68°C to 79 DC.
Further, a Response Time Index (RTI) of 278 (m/s) 112 was assumed. The RTI
quantifies how rapidly the detector links temperature rises in response to immersion in
a hot ceiling jet.
Heat/smoke detectors
The cabin is equipped with an optical detector, whose actual response time should be
evaluated by assuming its activation if the temperature increases by 30°C above the
ambient temperature, Response Time Index (RTI) = 50 (m/s) y, [IMO, 1997]; if the
detection signal is not cleared within 120s, an alarm is activated in the affected zone.
Heat Release Rate (HRR) and fire growth
At first, the only presence of an upholstered chair was assumed to screen the most
relevant and critical event sequences. This allows applying the HRR reference curve
obtained by laboratory tests with the furniture cone calorimeter.
The models characteristic values are:
Fire growth rate: a = 0.1055 kW/s2, that is "fast" according to SFSE [SFPE, 1993)
and between "fast" and "ultra-fast" according to the BSI Standards [IMO, 1997).
Peak value: t = 140s, Q = 2.11 mW.
Transition to decay at t = 160s.
End combustion at t = 500s.
Total heat developed = 372 mJ.
59

The fire growth model of the upholstered chair was derived from the reference test for
the sprinkler performance verification as per IMO Resolution A800 (19) [Angelo &
Giovanni, 1997]. The chair was assumed to be in a corner of the room.
4.3.2 Event Tree Analysis (ETA)
The initiating event frequency should be evaluated on the basis of the available
historical data, adjusted appropriately if information relative to equipment, flammable
inventory and ignition sources of the case is examined. In this analysis the initiating
event frequency was not evaluated in order to emphasise the applicability of the
methodology instead of an absolute measure of the fire risk.
In the present example, the fire escalation was deemed to be mainly conditioned by:
Sprinkler performance.
Ventilation effects.
The main assumptions are as follows:
The outcomes of fire propagated to the whole fire load in the cabin (FRI : Full
Room Involvement) were investigated only for the worst scenario.
Only the natural ventilation was accounted for, due to the limited extent of the
forced ventilation.
The selected reference scenario is the fire of an upholstered chair in a cabin of a
main vertical zone above the embarkation deck of a cruise ship; this constitutes
the initiating event.
The ET was constructed on the basis of the above assumptions (see Figure 4.1). The
ET nodes. in this example where only the natural ventilation is dealt with. are:
60

Door status.
Alarm activation.
Sprinkler availability on demand.
The ET nodes probabilities are shown in Table 4.3 and the Event Tree Analysis
(ETA) results are as shown in Table 4.4.
Event
Door open
Door closed
Alarm activation
Alarm failure
Sprinkler available
Sprinkler
unavailable
Door Open
Yes
Initial Fire
No
Table 4.3. ET nodes probability.
Probability
0.01
0.99
0.9
0.1
0.9
0.1
Alarm A f f clvalon
Yes
No
Yes
No
Rationale
Engineering judgement: the door is
self-closing type [Angelo
Giovanni, 1997]
(1 - Door open)
Expert judgementlhistorical
[Magnusson, et aI, 1995]
(1 - Alarm activation)
Expert judgementlhistorical data
[Angelo & Giovanni, 1997]
(1 - Sprinkler available)
Sprinkler Available
Yes
No
Yes
No
Yes
No
Yes
No
...
.. ...
..
..
Scenario 1
Scenario 2
Scenario 3
Scenario 4
Scenario 5
Scenario 6
Scenario 7
Scenario 8
&
data
Figure 4.1. Event tree describing the eight scenarios.
61

Table 4.4. ETA results.
Scenario Door Alarm Sprinkler Probability
1 Open Success Success 8.1x10⁻³
(0.01) (0.9) (0.9) (0.01xO.9xO.9)
2 Open Success Failure 9.0x10⁻⁴
3 Open Failure Success 9.0x10⁻⁴
4 Open Failure Failure 1.0x10⁻⁴
5 Closed Success Success 8.019x10⁻¹
6 Closed Success Failure 8.91x10⁻²
7 Closed Failure Success 8.91x10⁻²
8 Closed Failure Failure 9.9x10⁻³
4.3.3 Quantification of the outcomes.
The evaluation of the consequences was accomplished by means of a physical
simulation of the outcome scenarios 1 to 8, obtained using the FAST code (shown in
Figures 4.2 to 4.9). The results of the simulation are displayed along with calculated
values for temperatures, the height of the smoke layer and heat release rate. The
graphs of heat release rate, upper layer temperature and layer depth can also be
displayed by simulation. The FAST code was a zone model specifically developed for
civil buildings [Richard, et aI, 2000]. Therefore, it provides some cursory indications
of the applicability to the shipping field.
4.3.3.1 Severity criteria
The criteria for estimating the severity of the consequences were thus defined as
follows:
1. The Full Room Involvement (FRI) temperature was assumed to be 500°C. By
comparing this value to the corresponding temperatures of the 8 scenarios,
considerations are made about the likelihood of FRI caused by the chair fire
only.
62
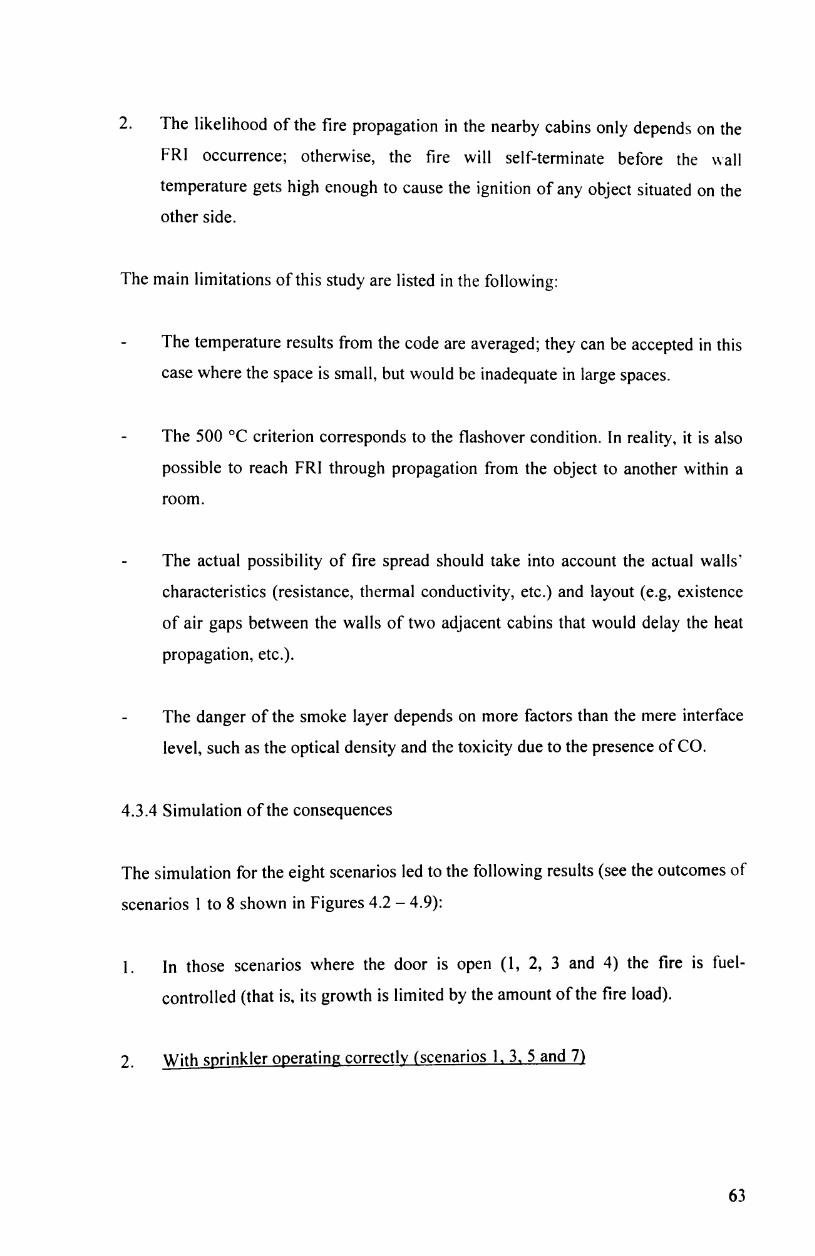
2. The likelihood of the fire propagation in the nearby cabins only depends on the
FRI occurrence; otherwise, the fire will self-terminate before the wall
temperature gets high enough to cause the ignition of any object situated on the
other side.
The main limitations of this study are listed in the following:
The temperature results from the code are averaged; they can be accepted in this
case where the space is small, but would be inadequate in large spaces.
The 500°C criterion corresponds to the flashover condition. In reality, it is also
possible to reach FRI through propagation from the object to another within a
room.
The actual possibility of fire spread should take into account the actual walls'
characteristics (resistance, thermal conductivity, etc.) and layout (e.g, existence
of air gaps between the walls of two adjacent cabins that would delay the heat
propagation, etc.).
The danger of the smoke layer depends on more factors than the mere interface
level, such as the optical density and the toxicity due to the presence of CO.
4.3.4 Simulation of the consequences
The simulation for the eight scenarios led to the following results (see the outcomes of
scenarios I to 8 shown in Figures 4.2 - 4.9):
1. In those scenarios where the door is open (l, 2, 3 and 4) the fire is fueI
controlled (that is, its growth is limited by the amount of the fire load).
2. With sprinkler operating correctly (scenarios 1, 3, 5 and 7)
63

The sprinkler is instrumental in reducing the fire heat release rate, and consequently
the possibility of FRI; as to the smoke layer, the consequences worsen according to
the air ingress (1 and 3 being more severe than 5 and 7).
With sprinkler unavailable (2, 4, 6 and 8)
The fire heat release rate increases, and consequently the possibility of FRL increases;
as to the smoke layer, in this case, scenarios 2 and 4 are more severe than 6 and 8.
3. In those scenarios where the door is closed (5, 6, 7 and 8) the fire is ventilation
controlled (that is, its growth is limited by the amount of oxygen). Due to the
limitations in the combustion the smoke produced depends on the time length of
the fire.
4.3.5 Risk evaluation - Risk Matrix Approach
According to the probability and to the simulation results, the overall ranking of the
eight scenarios is produced as follows:
Table 4.5 gives the interpretation of the frequencies F 1 to F7.
Table 4.5. Key to the frequency bands for risk table.
Frequency Probability
Fl 0.0000 - 0.0001
F2 0.0002 - 0.0010
F3 0.0011 - 0.0090
F4 0.0091 - 0.0100
F5 0.0101 - 0.0900
F6 0.0901 - 0.8020
F7 0.8021 - 1.0000
64

0\ v-
"'l1 _. CIQ
3 ~
~
> ell -i 3 (I)
c: =-0 ....,
~ !I. O -.
Heat 100000
-3= -cu -0 ex
j '" -0
:! 0.0
0.0
120.0 Upper
-0 -CL E Cit .... b >-0
....J ... :I
0.0 I
0.0
Release Rote
Fire Comportment 1
Time <a) 1200.0
Loyer Temp Interfoce Height 3.0
...... e ---§, 'ij :r It-G)
8 -~ ., :s
lh ~
1.0
Time (s> 1200.0 0.0 Time (s) 1200.0
OutcOtne of Scenario 1.
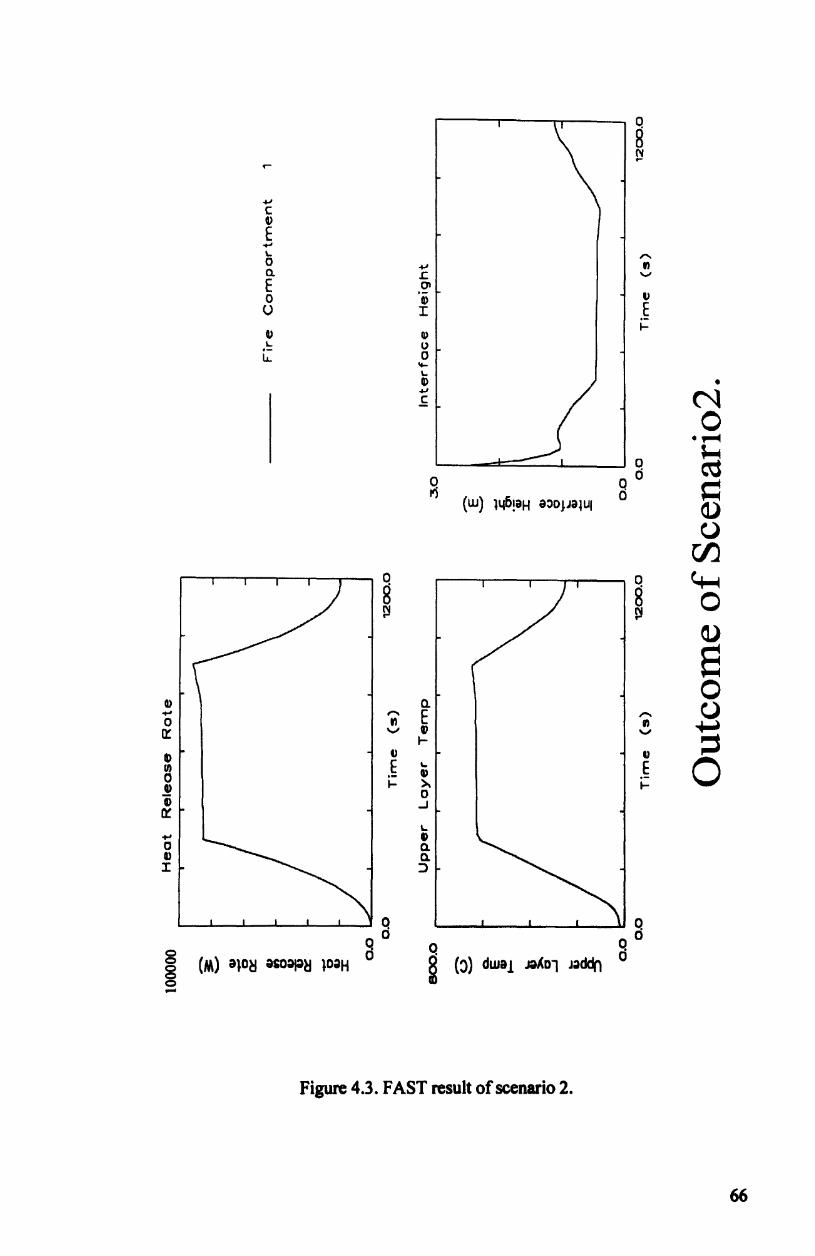
Q
B ~ .....
+' c: v E +' ~ -0 ..... " a. .r: '-' E 01 0 Q) u U I .~ V
~ Q)
.~ U lL. 0 ....
~ Q) • ..... N ,!;
0 .~
0 ~ 0 Q d
~ ftj (w) 14f>!9H a:>Opa~Uf
0 Q.) U
r::/'J. Q 0 ~ 8 8 0 ~ ~
Q)
8 Q) Q.
0 +' ,..... E - U 0 II " ~ a:: "wi' Q) ....,
I- ~ III u u I/) .~ ~ E 0 0 Q)
Q) ~ >. ~
i 0
a: oJ
'-+' Q) 0 0. Q) 0. J: :::>
~--~--~--~--~ Q o 0 d g
§ -
Figure 4.3. FAST result of scenario 2.
66

.....
+' C Q)
E .... ~
0 o4J a. .c E 0\ 0 Q) () I
Q) ll)
.~ u u.. 0 ....
~ Q)
o4J
C
g (w) NO!aH a:)D~JalUI
0 g N ....
Q) Q. .... ,..., E 0 III IY "" Q)
f-
Q) v II) E l-
0 Il)
Q) I- >-i 0
a:: ...J
'-+' Q) 0 a. Q) a. I ~
o S (J) dwal Jd~Ol Jdddn ....
Figure 4.4. FAST result of scenario 3.
0
8 N
" VI ....,
v E l-
0 0
0 .-I
q 8 N ....
,..., III
"" u E l-
Q o 0 d
• ("f')
0 .~
~ ~ C Q) CJ
C/)
~ 0 C)
8 0 U ~
~ 0
67

+J
C v E +' L 0 Q.
E 0 0
v L
LL
v .... 0
a:: Q) II)
0 !? II> ~
.... 0 II)
I
0
8 ~
"-+' VI .c: '-' 01
V V
I E ~
Q,) U 0 ..... L II>
+J
.f
0
~ o 0
(W) NO!aH a:>Opalul d
0 0 g g N N .... ....
a. ,..., E ,..., VI VI ....., v .....,
I-v v E L E Q)
~ >.. ~ 0 ..J
L Q) a. a.
:::>
~ __ ~ __ ~ ____ L-__ ~ 0
o ~ (~) dwa 1 J~'<Dl J~ddn
Figure 4.5. FAST result of scenario 4.
o 0 d
• ~ 0 .~
~ ro = Q) u
r/J ~ 0 Q)
8 0 U ~
~ 0
68
Q) +' 0 r:r Q) I/)
0 Q)
i 0:::
+' 0 0)
I
o o o o o -
....
~
c Q)
E +' \... a a. E 0 0
Q) I..
u..
0 g ~
,.... III
'-'"
v E I-
q o 0 d
~
.r: 0' Q)
I
ll> l)
0 ..... \... Q) ...., c
0 I'i
(w) l~f>!9H a:)OJ.J9IUI
Q.
E Q) I-
L
Q)
>. 0 ..J
I.. Q) a. a. :J
o ~ (~) dwa 1 Jd'<0l Jddd(l
Figure 4.6. FAST result of scenario 5.
0 g ~
,...... III
-..;
Q>
E l-
0
o d d
0 g ~
,.... II
'-'"
v E l-
o o 0 d
• l£)
0 .~
~ cd ~ ~ 0
(/)
~ 0 Q)
8 0 0 ~
~ 0
69

I I 0
8 ~
-oJ
C v E ...-L -0 a.
..., VI r. '-'
E 01
0 III V (J I E
f-III Q)
.:: u LL 0 .....
L III ..,;
\0 1;
~O 0 .~
~
0 o d ~ I"i
(w) l40!aH a:>0JJalUI (j d
0) u
r./) I I I 0 0 ~ g g 0 N ~ y-
O)
8 0
Q) Q. ...- - E ,..... U 0 VI VI ~
Ir: '-' III '-' f- ~
III V V III E l- E 0 0 II> III I- ~ I-
~ 0 -1
!r L
+' II> 0 .- a. III a. I ::J
I I ~ Q 0
0 o 0
0 o 0
0 (M) alo~ aSo~I~~ lOdH d g (:» dwal J~~Ol J;>dd(1 d
0 0 0 "
Figure 4.7. FAST result of scenario 6.
70

Q) +' 0
a:: Q) (I) 0 0> i !r
+' 0 Q)
I
o o o o o
.-
.... c Q)
E +' L 0 Q.
E 0 (J
Q) L
u..
I I 0
8 ~
'"' +.I VI 1: 'J
01 Q) v I E
I-Q) ()
0 '+-L Q) • +' t" c
~ 0 .~
~ 0 ~ g o d
~ (w) ND!aH a:>o~JaIUI d
C) U
rJJ 0 Q ~ g 8 0 N N 0- r-
Q)
a 0
a. U " E " III 1/1 ~ 'J 0> 'J
I- ~ v v E l- E 0 Q)
0-
I- ~ l-0 .J
L 0> a. a. :J
Figure 4.8. FAST result of scenario 7.
71

T I 0
8 ~
., C t> E +' L a " 0.
.... VI
E .r: \J
()l
a Q.) 1I
0 I E f-v Q.)
L ()
l.i.. 0 ..... \.. II> • +I 00 C
~o 0 .~
~
0 o 0 ~ r'i
(LU) ~4f>!aH aOO!JalUI d ~
aJ U
r/J 0 ~ I I I g g
0 N N f"" ...
a,)
E Q) a. 0
..... ...... E ...... U 0 VI VI ~ t:r '-" II> \J
I- ~ II> V V If) E l- E 0 0
Q)
II> I- ~ f-
a> 0 ...J
IY L
+' Q.) 0 0. 0) 0. I :>
I j ~ Q Q q 0
0 o 0
0 (M) alo~ dSOdld~ lOdH
0 g (:)) dwa 1 Jd'<0l J~dctn d
0 0 0 " 0 -
Figure 4.9. FAST result of scenario 8.
72

Table 4.6 shows the key to the consequence bands for Heat Release Rate (HRR),
Upper Layer Temperature and Interface Height.
Table 4.6. Key to the consequence bands for risk table.
Cl Minor Single or minor injuries
C2 Significant Multiple injuries
C3 Severe Single death
C4 Catastrophic Large number of deaths
Table 4.7 represents a fire accident in the cabin. This table is generated by analysing
the data in terms of its Occurrence and severity of consequences from the FAST
results shown in Figures 4.2 - 4.9.
For example,
Scenario 1 - Heat Release Rate:
Frequency band = F3 (Table 4.5)
Consequence band = Cl (Table 4.6 and expert judgement with FAST results)
Risk Matrix Scale = 3 (Table 4.1)
The judgement of frequency bands is based on the results obtained from Table 4.4.
The consequence bands (Le., CI-C4) are assessed by expert judgement with reference
made based on the results obtained from simulation for each scenario.
Table 4.7. Fire ranking using risk matrix approach.
Heat Release Upper layer Interface height
Rate (HRR) temperature
Scenario 1 F3 CI - 3 F3 C2 - 4 F3 CI - 3
Scenario2 F2 C2 - 3 F2C4 - S F2C2 3
Scenario3 F2 Cl - 2 F2 C3 - 4 F2C2 - 3
Scenari04 FI C2 - 2 FI C4 4 Fl C2 2
ScenarioS F6 CI - 6 F6C2 7 F6CI - 6
Scenario6 FS C3 - 7 FS C3 7 FSCI S
73

Scenario7 F5 CI = 5 F5 C2 = 6 F5 CI = 5
Scenario8 F4 C3 = 6 F4 C3 = 6 F4 CI = 4
Table 4.7 was then produced which gives a ranking number for each accident
category. Following the tabulation of this data, the 'equivalent total' of risk ranking
number can be derived as shown below. This is an approximate calculation based on
the individual risk ranking values for all the scenarios. The calculation makes use of
the fact that both the frequency and severity bands of the risk matrix are
approximately logarithmic (e.g. a risk level of 6 is treated as 106). This will enable the
process of ranking each scenario according to its influence on the safety of the cabin.
The high-risk areas are then distinguished and attention is drawn to them.
Based on the information obtained in Table 4.7, the ranking order is produced as
follows:
Heat Release Upper layer Interface height Total (same
Rate temperature weight)
Worst 6 5&6 5 5&6
scenario 5&8 7&8 6&7 7&8
1 7 2 8 2
1&2 1,3 & 4 1,2 & 3 1
Best 3&4 4 3
scenario 4
Calculation of 'Equivalent Total' for the Fire Accident in the Cabin:
The number of occurrences in the Risk Table of a risk ranking score of 4 is 4; a risk
ranking score of 5 is 4; a risk ranking score of 6 is 5; a risk ranking score of 7 is 3;
risk ranking scores of 3 and below have been ignored as not significant.
Using 7 as a base then: 'Equivalent Total' = 7 + log (3.544) = 7.55
74

Alternatively using the risk ranking score of 4 as the base, then: 'Equivalent Total' = -+
+ log (3544) = 7.55.
If there are several cabin design options available, the above procedure can be applied
to each of them to obtain the risk ranking score. The design option with the lowest
risk score may be chosen. If design criteria such as costs are considered in the design
process, the obtained risk scores can be combined with other design criteria to make
decisions.
4.4. Conclusion
The analysis has basically highlighted the following points:
1. From a simulation viewpoint, the fire growth model is of paramount importance
to really simulate different options in the ship materials and the sprinkler
intervention; the fire load basically gives indications of the heat energy stored,
thus of the likelihood ofFRI and fire spread.
2. In such constrained fires, the HRR is driven by the ventilation, which tends to
smooth down the peak values as obtained by the tests in fuel-controlled
conditions; on the other hand, the unburned paralysed fuel could be transported
with the smoke into other compartments, thus contributing to propagate the fire.
The assumption of free ventilation that would control the fire can be misleading,
as it could make the situation worse.
3. The test case demonstrates that sprinkler intervention and performance is a key
factor to increase the time available to evacuate without hazard for the people.
Generally speaking, the application of this methodology is demanding in terms of
specific fire data of the involved materials and robust simulation models and tools.
However, the performance based rules, which are being promoted by the new trends
in regulations, should necessarily also be based on risk estimations; these, in turn, will
75

be typically developed on models and parameters characterised by uncertainty and
described by statistical distributions.
In this analysis, many data not available at hand were evaluated by engineering
judgement. However, as fire safety engineering technology grows and matures, the
availability of data will increase, making this methodology an effective and useful
tool to focus on the most effective solutions among different designs.
References
Anderson, P., Robertsson, H. & Wikman, 1. (1993), "A Fire Safety Survey of
Materials Used in Passenger Vessels", Accommodations, Research Report MariTerm
AB, ISBN 91 630 1809N, Goteborg, Sweden, 8 April.
Angelo, T. & Giovanni, G. (1997), "Fire Risk Analysis on Cruise Ships - Application
to an Accommodation Zone", Paper 3, Fire at Sea, RINA, London, UK, 20-21
November.
BSI (1994), "The Application of Fire Safety Engineering Principles to Fire Safety in
Buildings", British Standards Institute Standards 94/340340 DC (draft), UK.
Cowley, 1. (1994), "Fire Casualties and Their Regulatory Repercussions", Paper 1,
IMAS 94, Fire Safety on Ships, Developments into 21 st Century, London, UK, 26-27
May.
IMO (1996), "Formal Safety Assessment - Draft Guidelines for FSA Application to
the IMO Rule-making Process", IMO Maritime Safety Committee, MSC 68/14,
London, UK, 18 December.
IMO (1997), "SOLAS, Consolidated Edition", London, UK.
IMO (1999), "Formal Safety Assessment - Trial Application to High Speed Passenger
Vessels", IMO Maritime Safety Committee, MSC 68IInformal Paper, London, UK, 27
May.
76

Jenner, B. P. (1994), "Technical and Human Factors in the Prevention and Control of
Shipboard Fires", Paper 2, IMAS 94, Fire Safety on Ships, Developments into 21 Sl
Century, London, UK, 26-27 May.
Jensen, K. H. (1994), "Smoke Control in Cruise and Passenger Vessels", Paper 13,
IMAS 94, Fire Safety on Ships, Developments into 21 st Century, London, UK, 26-27
May.
Magnusson, S. E., Frantzich, H. & Harada, K. (1995), "Fire Safety Design Based on
Calculations, Uncertainty Analysis and Safety Verification", Lund University,
Institute of Technology, Department of Fire Safety Engineering, Report 3078,
Sweden.
NFPA (1987), "National Fire Protection Association 72E - Standard on Automatic
Fire Detectors", USA.
Peacock, D. R., Reneke, A. P., Jones, W. W., Bukowski, W. R. & Forney, P. G.
(2000), "A User's Guide for FAST: Engineering Tools for Estimating Fire Growth
and Smoke Transport", NIST (National Institute of Standards and Technology),
Special Publication 921, USA.
Ramachandran, G. (1999), "Fire Safety Management and Risk Assessment",
Facilities, Vol 17, No 9/10, pp 363-376.
SFPE (1993), ''The SFPE Handbook of Fire Protection Engineering", Society of Fire
Protection Engineers, National Fire Protection Association, USA.
SNMA (1996), "FSA: Introduction of Modem Risk Assessment into Shipping",
Swedish National Maritime Administration, Sweden, 2 August.
USCG (1995), "Department of Transportation - Report of the Cruise Ship Safety
Review Task Force", United States Coast Guard, USA, 31 October.
77

US Department of Commerce (1983), National Bureau of Standard, National
Engineering Laboratory, "Fire Performance of Furnishings as Measured in the NBS
Furniture Calorimeter. Part 1 ", NBSIR 83-2787, USA.
78

CHAPTER 5 DEVELOPMENTS IN SMOKE CONTROL
SYSTEM FOR PASSENGER SHIPS: APPLICATION TO AN
ACCOMMODATION ZONE
Summary
One of the most important means to avoid catastrophes in case of fire onboard
passenger ships is to ensure that the passengers can escape in a quick and safe manner.
One of several precautions to take is to try to control the spread of the smoke in a
simple and reliable way. In this way the area where people are in contact with the
smoke can be minimised and better visibility to escape from the smoke can be
secured.
5.1 Introduction
Fires onboard a number of passenger ships including the 'Scandinavian Star', have
caused the International Maritime Organization (IMO) to tighten up the requirements
for fire safety. Therefore it has been decided that in the future it will be a requirement
that sprinklers and smoke detectors are installed in all the accommodation areas of
passenger ships [IMO, 1997].
A Danish investigation shows that approximately 90% of the persons killed in
shipboard fires have perished due to smoke exposure and only 10% due to heat
exposure. The disasters on board Scandinavian Star, MIS TOR Scandinavian and
other passenger ships, have further demonstrated that smoke could spread very
quickly inside the ships [Anderson, et aI., 1993].
Although shutting down the Heating, Ventilating and Air Conditioning (HVAC)
systems prevents fans from forcing smoke flow and stops supply of oxygen, it does
not prevent smoke movement due to smoke buoyancy, stack effect, expansion or
draught due to the wind. Therefore, it is not sufficient only to detect the toxic smoke.
Safety will be increased further if the spread of smoke inside the ship is also reduced.
79

In order to achieve this, additional requirements are needed, that is, automatic release
of fire doors into closed position and activation of the smoke control system when
smoke is detected [Abell, 1999].
Previous studies have shown that fire is extremely difficult to locate in cabin areas
[Jensen, 1994]. Fires in public spaces are often easier to locate and thus can be
extinguished more quickly. Further, evacuation of passengers from public spaces is
not as difficult as from cabin areas, where people may be sleeping. Therefore, smoke
control in cabin areas is emphasised in this chapter.
5.2 Background
5.2.1 Regulations
The fire aboard "Scandinavian Star" on passage between Oslo and Frederikshavn on 7
April 1990 prompted the IMO Fire Prevention (FP) sub-committee at FP37, 1992 to
establish the philosophy on smoke control and ventilation for eventual inclusion into
the revised version of Chapter 11-2 SOlAS (Safety Of life At Sea) 1974.
All passenger ships built after 1 January 1994, which have an atrium spanning three or
more decks and containing combustibles such as furniture, shops, offices, restaurants
etc. shall be equipped with a smoke extraction system. It shall be activated by the
smoke detection system automatically or manually such that the entire volume within
the space can be exhausted in 10 minutes or less, SOlAS Chapter II -2 Regulation 32
(Ventilation Systems) 1.7.
5.2.2 Definition of smoke
Smoke is identified as a key factor and smoke control has to be dealt with carefully
[Chow, 1995, 1997]. Sudden horrific explosions can maim, bum and subsequently kill
people but the insidious development of smoke containing its cocktail of deadly
poisonous gases invariably kills more [Graham, 1995].
80

The chemical reaction known as polymerisation begins with a monomer, perhaps the
most common of which is ethylene. Any substance that contains carbon can give off:
1. Carbon monoxide (CO), a narcotic gas, which is lethal. It is produced, in
copious amounts, as a result of incomplete combustion of materials containing
carbon and is present in most fires.
2. Carbon dioxide (C02), another highly poisonous gas, which is also produced in
large quantities. Inhalation stimulates respiration and this, in tum, increases
inhalation rates of both oxygen and possible toxic gases and vapours produced
by the fire.
If chlorine is added, the resultant molecule becomes PVC, polyvinyl chloride that is
used to make a vast array of products such as adhesives, anticorrosion sealants, blister
packages, bottles, electrical insulation, etc. Hydrogen chloride is evolved when these
substances burn [Fe & Hadjisophocleous, 2000].
High levels of prussic acid and hydrogen cyanide, which are given off when nylon,
wool or polyurethane bums, were found in the fatalities of the Scandinavian Star. This
led to immediate investigation into the content of laminates found aboard various
vessels. The mixture of these added gases increases the speed of the toxicity [Abell,
1999].
The way in which any substance bums depends on many parameters and conditions,
some of which may include:
Its shape and size.
The source of ignition.
The amount of oxygen needed.
The rate of flame spread.
Ventilation and other environmental conditions.
However, it is certain that, lack of visibility and disablement by toxic gases in smoke
often impedes the escape of occupants [Abell, 1999].
81

5.2.3 Smoke movement
Smoke spread has been a main interest of fire science and engineering [He & Beck,
1997]. The phenomenon of smoke spread, as an important factor in life safety design.
must be understood and estimated [Kim, et aI., 1998].
There are two main factors, which determine the movement of smoke and hot gases
from a fire. These are:
1. The buoyancy (or mobility) of the smoke due to pressure differentials developed
by:
a. Expansion of the gases heated by the fire.
b. Difference in density between the hot gases above the flames and the
cooler air, which is surrounding the fire.
2. The normal air movement inside the ship caused by:
a. The stack effect: the pressure differential due to the temperature of the
air inside a room being at a different temperature from the air outside the
room.
b. The wind pressure effect, due to penetration through leakages.
c. The mechanical air handing systems.
The smoke control system must be designed in such a way that it is not overpowered
by the forces mentioned above [Abell, 1999].
5.2.4 Main criteria for design of smoke control system
It is emphasised that only smoke control systems in the cabin areas and adjacent
stairways will be discussed in this chapter. There are a number of criteria. which are
82

of great importance for the design of a smoke control system. Among these criteria
are:
1. The system shall be designed to handle fire.
2. The fire doors close automatically when a fire is detected.
3. Entry of smoke into the areas adjacent to the burning area, such as a stairwell
and the other cabins, must be prevented.
4. Differences in pressure must not be so great that door opening forces will
become too excessive.
5. The smoke control system should be activated as required.
Further, as far as economy and space are concerned it is aimed at utilising the
traditional HV AC systems to the greatest possible extent [Jensen, 1994].
5.2.5 HVAC (Heating Ventilating and Air Conditioning) system for cabin areas
Normally supply air for the cabins is distributed from the air handling unit in a high
velocity, tubular, dual duct system. The air coming from the two pipes is mixed in an
air terminal device, often known as a cabin unit, which is normally located in the
ceiling. By means of a coupled two-valve system controlled by a thermostat, the air
coming from the two pipes can be mixed in such proportions that the temperature
required by the passenger can be obtained. The air enters the room through a diffuser
fastened to the air terminal device. Both constant air volume systems and variable air
volume systems are used (see Figure 5.1).
Normally there is a smaller positive pressure m the cabin in order to prevent
contaminated air from entering the air-conditioned cabin. Discharge of air normally
takes place partly through bathroom and partly to corridor. Typically 30-40% of the
air is exhausted through the exhaust valve mounted in the bathroom. The air enters the
bathroom through a slot under the door into the bathroom. The rest of the air passes
through a grille in door/under door/through duct under bathroom into the corridor.
Usually there are several air terminal units for exhaust in the corridor. This means that
normally there is negative pressure in the corridor and the bathroom.
83

Air Supply
Ship's Side
Cabin Recirculation Fan
Cabin Supply
Damper Fan
Cabin
Bathroom
Corridor
Cabin Exhaust Fan
Figure 5.1. HV AC system for cabin areas (energy recovery by recirculation).
There are two ways of designing the exhaust air system. The choice depends on the
energy recovery method. When a rotary enthalpy exchanger is chosen, usually all
exhaust air is exhausted through one exhaust fan. Energy recovery by using
recirculation of air is another method. In this case two separate exhaust systems are
necessary. Exhaust air from bathrooms is not used for recirculation [Jensen, 1994].
5.2.6 HVAC (Heating Ventilating and Air Conditioning) system for stairways
Halls and major stairwells are normally served by an air-handling unit, which does not
serve any other spaces in the ship. The air supplied is distributed from the air-handling
unit in a rectangular, single-duct system. The air enters the stairwell through diffusers.
Usually the air volume exhausted from the halls and stairwells is equal to the air
volume supplied - a balanced system (see Figure 5.2).
5.2.7 Fire in cabin
In case of fire in a cabin the optimal smoke control system would ensure that the
smoke is extracted by means of smoke extraction in the cabin. Smoke entering into
84

the corridor would be avoided by prohibiting surplus air from the cabin from entering
into the corridor.
Damper
Stairs Supply Fan
Recirculation
Corridor
Stairs
Stairs Exhaust Fan
Figure 5.2. HVAC system for a stairs (energy recovery by recirculation).
Large positive or negative pressures in the area consisting of the cabin and the
bathroom must be avoided. Therefore, the mass flow of air exhausted by the exhaust
system must be equal to the mass flow of air supplied by the air supply system.
This solution would require quite a complex and expensive HV AC system, especially
when a variable air volume system is used. Further, it is almost impossible for a
system traditionally built to extract additional air/smoke through the exhaust valve in
the bathroom, even by means of a bigger fan. This is primarily due to strict space
limitations and thus to limitations of the pipe sizes [Jensen, 1994].
5.2.8 Fire in stairway
In case of fire in the stairway the removal of smoke can take place through a
mechanical smoke extraction fan located at the top of the stairway. In order to prevent
smoke spread into the lower decks the exhaust duct system used during normal
HV AC operation in the stairway has to be shut ofT.
85

As in all smoke control systems replacement air must be allowed to enter the space. In
order to ensure an effective extraction arrangement the replacement air has to enter the
stairway through numerous openings at low levels. The inlets could be connected to
ducts leading directly to open air [Jensen, 1994].
5.2.9 Activation of smoke control system
Fire experience onboard ships shows that fire in cabin areas can develop extremely
quickly. Further, experience shows that fires in cabin areas onboard passenger ships
often start as smouldering fires. A smouldering fire develops only a small quantity of
heat and is, consequently, not detected by heat detectors/sprinklers, before it develops
into a flaming combustion. It may take a long time before this happens. During this
time the smouldering fire may have developed large amounts of smoke containing
dangerous gases and will then be a big risk for the passengers. Therefore, it is very
important to fight the fire as quickly as possible.
Bearing this in mind, and considering the fact that smoke detectors are to be installed
all over the accommodation, the addressable smoke detection system should be
capable of activating the smoke control system. If the smoke detectors are suitably
placed, this solution will give the shortest reaction time in case of fire [Jensen, 1994].
5.2.10 The control system
The smoke control system is to be an integral part of the HV AC control system.
Further, the system is to be connected to a fire detection system, including the smoke
detection system, so that signals from here can be used for activating the smoke
control system [He, et aI., 2002].
After having received and interpreted signals coming from the fire detection system
the smoke control system proposes a pre-programmed control action. When the action
performed by the smoke control system does not correspond to the required action,
r .- '''~~') -" ---...,......... ," j
,..-,' ., II , • ". , '-
86

that is, in case of a fan breakdown - an alarm will be triggered. All alarms must be
audible.
The system must allow the crew to override manually the actions suggested by the
smoke control system at any time. Misunderstandings by the crew have to be avoided.
The control system and all the components (fans, dampers, etc.), activated by the
system in a fire situation, must be connected to the emergency generator [Jensen,
1994].
5.2.11 Abbreviated draft guidelines
Fire Prevention (FP) 40 in 1995 established draft guidelines for approval of active
smoke control and ventilation systems in passenger ships [Abell, 1999]. These
include:
1. The main objective of an Active Smoke Control System (ASCS) is to keep the
escape routes free from smoke for escape and aid to fire fighting operations.
2. Passive Smoke Control means the utilisation of built in barriers within the ship
such as main vertical bulkheads, fire doors and fire dampers in order to enclose the
fire area and stop the spread of smoke.
3. Active Smoke Control uses mechanically created pressure differentials and flows
between smoke control zones to prevent smoke spread and remove smoke from
the ship by extraction.
4. Staircases shall be kept over-pressurised to prevent smoke rising up staircases.
5. An ASCS shall operate within two minutes of detection.
Many other points were drafted including design, types of spaces, test procedures and
performance criteria, which were submitted by the correspondence group who were
87

also concerned with the technical understanding of a smoke control system on board
[Abell, 1999].
5.3 A Proposed Approach
The general smoke control philosophy is described as follows:
1. Special smoke extract fans extract the smoke through grilles installed in the
ceiling in corridors on the burning deck in the fire zone. This means that there will
be a negative pressure in the corridor.
2. All cabins belonging to the fire zone on the deck on fire are to be continuously
supplied with air. Supplying air into the cabin creates a positive pressure in these
spaces.
3. In order to avoid spread of smoke from the burning zone to adjacent stairwells,
these spaces are to be pressurised.
It should be emphasised that it is not possible to create a smoke control system that is
capable of stopping the spread of smoke from any fire, irrespective of size or
development. There is no guarantee that the smoke extraction can be used to maintain
a clear layer of air; this depends on the burning material, the size of the fire, etc. In
case of fire in a corridor the smoke control system must work exactly in the same
way, as just described previously [Jensen, 1994].
The conditions of pressure in cabin, corridor and stairs are shown in Figure 5.3. It can
be seen that in cabins and stairs, there is a positive pressure while in corridors, there is
a negative pressure.
Several full scale tests have been carried out successfully according to the smoke
control philosophy described previously [Jensen, 1994]. The disadvantage of this
smoke control system is that the smoke from the cabin on fire enters the corridor
whilst the smoke will rise towards the ceiling and - depending on the smoke
88

production and the extracted air volume - will mainly be concentrated between the
two adjacent exhaust grilles. Tests, which have been performed, have also shown this.
Further, as previously mentioned, large quantities of heat and toxic smoke will be
extracted [Jensen, 1994].
Pressure
,~
+
.. Neutral p ressure
Cabm Corndor StaIrs
Figure 5.3. Pressure conditions during smoke control mode.
Smoke control will be a much better solution than previously described when the
HV AC systems were shut down in a fire situation. Further, the advantage of this
proposal is that to a large degree the traditional HV AC systems utilised are
supplemented with only a few special components, such as, for instance, special
smoke extractor fans.
Air supply at the ceiling in the corridor of the burning zone must be avoided in a fire
situation. This will result in mixing of air and smoke, which may cause considerable
reduction of visibility in the lower part of the corridor. If there is only extraction in the
ceiling and the air supply comes, for example, from grilles in the lower part of cabin
doors. a smoke layer at the ceiling is produced.
Due to the very limited space above the ceiling in the corridors it will, in practice, be
very difficult to have two different exhaust ducts - one for normal operation the other
for smoke extraction.
89

Unless the forthcoming regulations will require two sets of exhaust ducts, one exhaust
duct in the corridor serving both operations could be used. In order to install as few
smoke extraction fans as possible, an extra exhaust duct can be installed in the trunk -
a duct for smoke extraction only. The duct for smoke extraction is connected to the
corridor exhaust ducts on all the accommodation decks in the main vertical fire lone.
In case of fire, the damper between the duct(s) for normal extraction and the exhaust
duct in the corridor on the burning deck closes, and the damper between the duct for
smoke extraction and the exhaust duct(s) in the corridor in the burning
accommodation area opens. All ducts for smoke extraction are to be heat insulated.
Supplying air into the cabins creates a positive pressure in these spaces. This ensures
that the smoke is kept out of those cabins not on fire. Further, supply of air into the
cabins ensures that smoke will not pass from the burning cabin into other cabins via
the duct system.
The passage of smoke between the cabins via exhaust ducts from the bathroom must
also be prevented - either by extraction or supply through the system. In order to
secure positive pressure in the cabin, it must be ensured that the air volume, which
may be exhausted via the ducts in the bathroom, is always smaller than the air
volume, which is supplied to the cabin.
In this connection it should also be mentioned that in case of a smoke control
operation immediate shutdown of the recirculating air is required. Consequently, the
return air dampers in the air-handling units are to be equipped with remote control
connected to the control system.
Smoke detectors are to be installed in the supply part of the system. The supply fan is
to be equipped with remote control connected to the control system. In case of smoke
detection immediate shutdown of the supply fan is required in both normal and smoke
extraction modes.
Discharge of smoke ought to take place without the risk of smoke being sucked into
the inlet grilles. Therefore. discharge should take place vertically at the top of the ship.
90

It must be ensured that the components of the smoke control system can withstand
high temperatures. The authorities have to define these temperatures in the
regulations. The audible alarms in corridors must be sufficiently loud to drown the
noise from smoke extraction. These are some of the requirements, which the
authorities have to implement in the regulations regarding smoke control.
In order to maintain the escape routes (stairwells and halls) free of smoke, the use of a
mechanically driven extraction system to remove any smoke that may have entered
the escape route is not satisfactory. An extraction system will reduce the pressure
level in the escape route. Consequently, more smoke will be drawn into the escape
route and visibility will be reduced, rather than improved.
To prevent the smoke from entering the stairwells and halls an adequate air flow,
which will keep the smoke away from spaces, is needed. To obtain this air flow air is
to be injected into the area. The air leaks out of the space via door cracks, by a
specially provided opening or into the fire area, where it is extracted. This system is
called 'pressurisation', because in order to set up the required air flow the pressure in
the escape routes is raised [Jensen, 1994].
In connection with the design of the smoke control system, it is most important that
the authorities consider to what extent fire doors are automatically released into the
closed position when a fire is registered. Automatic closing of fire doors has been
investigated and is expected to become an IMO requirement [Jensen, 1994].
In case of closed fire doors the door opening forces resulting from the pressure
differences produced by the smoke control system and the door closers must be
considered. Over-pressurisation must be prevented because unreasonably high door
opening forces can result in escaping passenger having difficulties or being unable to
open doors to the escape routes.
91
As a point of information it should be mentioned that the National Fire Protection
Association (NFPA) states that the force required to open any door In an escape
situation is 100 N (UK) and 130 N (USA) [Abell, 1999].
Some methods to achieve pressure control are:
1. To supply air fan and damper reliefs.
2. To supply air fan with variable speed.
3. To supply air fan with by-pass dampers.
Water spray from sprinklers cools the smoke and reduces the pressure differences due
to buoyancy. Some of the literature recommends a minimum pressure difference of 10
Pa in this case [Abell, 1999]. Pressure differences across the fire door near the
injection point can also be excessive, making the door difficult to open. On the other
hand pressure difference far from the injection point can be minimal and may
therefore fail to prevent smoke infiltration. The flow resistance in the stairwell causes
the variation in pressurisation. This means that the stairwell pressurisation system
shall be designed with multiple injection points.
Another problem is the intermittent loss of effective pressurisation that occurs when
the escaping passengers enter and leave the stairwell during evacuation. The
pressurisation system should have a supply fan with sufficient capacity to provide
effective pressurisation to prevent smoke entry when doors are open. For the design of
the stair pressurisation system the number of doors that can be opened simultaneously
should be considered. A design that allows all doors to be open simultaneously may
ensure that the system always works, but it will probably add to the cost of the system.
If all the fire doors leading to the burning zone are closed in case of fire it must be
ensured that adequate replacement air is supplied into the burning zone. Depending on
the smoke volume that has to be extracted, it may be necessary to install duct(s) in the
trunk leading directly to open air. An alternative is to install an extra supply fan used
for the smoke control operation only.
92

The extracted smoke mass flow vanes with the temperature of the smoke.
Consequently, the speed of the above mentioned supply fan must be controlled by the
control system. Unless adequate air is supplied there is a risk that the smoke
extraction will create a huge negative pressure in the corridor. As a result of this, it
may be impossible for the escaping passengers to open the fire doors, depending on
which way the doors open. In order to prevent such a situation, the authorities ought
to require that fire doors between corridor and stairwell will open into the corridor.
Correctly there are no IMO regulations stating whether fire doors are to open into the
corridor or out into the stairwell.
If the fire doors are open it is possible to take advantage of the air flow coming from
the pressurised stairwell. In case of open fire doors the extra supply fan with variable
speed or the duct leading to open air is, in this case, not needed [Abell, 1999].
The requirements given by the authorities regarding design of pressurisation systems
must include: a required minimum and allowable maximum pressure difference
between corridor and stairwell; a minimum air flow velocity through open fire doors;
and the number of doors that are open simultaneously.
In this study, the ASCS is compared with the other two cases (i.e. HVAC system is
stopped and HV AC system is normal) in terms of smoke layer heights in the corridor,
given the occurrence of a fire in the cabin. To carry out this the following steps are
proposed:
Step 1 Present the available data and make appropriate assumptions. In this step, the
number of the cabins needs to be defined. The accommodation zone needs to
be specified. The dimension of the corridor and fire load also need to be
specified.
Step 2 Describe the ventilation system. In this step, it is required to define geometric
characteristics of the door openings and mechanical ventilation supplies.
93
Step 3 Use a deterministic simulation through the fire zone model implemented in
FAST (Fire growth And Smoke Transport) computer code [Peacock, et al..
2000] to study smoke layer heights. In this step, the data obtained in Steps 1 &
2 can be fed into the FAST software. Each of the three cases is studied
individually to obtain the characteristics.
The fire simulation shall demonstrate the possible burden and pollution created from
smoke, temperature and toxic loads in the ship spaces. Among other mathematical
modelling possibilities, so called "zone models" are available, which constitute a
simplified balance model of energy and mass flow, and offer a numerical solution.
With zone models it is possible today to reliably predict the spread of smoke layers
and the development of gas temperature, and to characterise with some degree of
accuracy the visual range within the smoke [Schreiter, et aI., 2003]. Zone models have
been used since the mid 1970s to predict thermal hydraulic conditions in a fire
compartment prior to flashover. The zone model approximation treats the
compartment atmosphere as two well mixed layer. Such stratification often arises as a
result of buoyancy, but may be inapplicable in certain situations such as tall stairwells,
long corridors or other situations where three dimensional effects are important. Zone
models apply conservation equations to each layer, with the user specified fire
providing a source of energy and mass [Ramsdale & Mawhinney, 2003].
The computer model FAST can be used to simulate physical conditions inside the
building during a set of predetermined fire scenarios. Zone models such as FAST are
relatively easy and quick to use and provide a reasonable engineering estimate of
smoke hazards in compartmented structures [He, et aI., 2002].
Step 4 Analyse the results. The results obtained are compared in terms of smoke layer
heights. Comments on the three cases are made.

5.4 Case Study
Step 1
The following are the basic available data and assumptions:
1. A Main Vertical Zone (MVZ) in a passenger ship compliant with the SOLAS
Convention as amended in 1997.
2. 10 cabins per deck
Passenger cabin's area is (6mx3m), containing a trash can, an upholstered chair. a
bed, a table, a wardrobe and a bathroom (2mx2m) and provided with low flame
spread covering as per SOLAS II-2.Reg.34.3 [IMO, 1997].
3. Total length of corridor: (I5m x1.5m) per deck
4. Fire load
At first, the only presence of an upholstered chair was assumed to screen the most
relevant and critical event sequences. This allows applying the Heat Release Rate
(HRR) reference curve obtained by laboratory tests with the furniture cone calorimeter
[US Department of Commerce, 1983, 1985, 1988].
The model characteristic values are:
Fire growth rate: ex = 0.1055 kW/s2, that is "fast" according to SFSE [SFPE, 1993]
and between "fast" and "ultra-fast" according to the BSI Standards [IMO, 1997].
Peak value: t = 140s, Q = 2.11 mW.
Transition to decay at t = 160s.
End combustion at t = 500s.
Total heat developed = 372 mJ [Angelo & Giovanni, 1997].
95

The chair was assumed to be in a comer of the room.
Step 2
1. Ventilation
The cabin is equipped with a self-closing door as per the SOLAS regulations [IMO,
1997] and a window (with no restrictions about its constituting material), depending
on the cabin row.
The door is not airtight, and therefore it was assigned a leakage even when closed.
The window is made of standard materials and for this reason, it was assumed unable
to withstand the fire. This implies the window to be either open or broken, in those
scenarios when it is present.
To take into account the natural ventilation (including leakage through the door), the
following geometric characteristics of the openings were assumed:
- Door open: O.6m x 2.0m.
- Door closed: O.Olm x 2.0m.
- Door grill: O.2m x O.4m, sill O.2m.
- Window open: 1 mx 1 m, 1 m from the floor.
- Window closed: O.Olmxlm.
- Ceiling height: 2.44m.
Figure 5.4 has the following characteristics [Abell, 1999]:
- Air outlet: 250m3/h per cabin.
_ Ceiling extraction bathroom: 50m3/h.
_ Ceiling extraction corridor: 3m3/s.
2. It was assumed that the smoke detector and sprinkler do not activate.
96

Step 3
Test 1
Bath room
Cabin
Stairs
...
Corridor
----.~ 4~-+--
Figure 5.4. Mechanical ventilation supplies air values.
For this test 1, the initial fire occurred in an upholstered chair corner of cabin
(compartment 1). The smoke then fills the corridor and venting in next cabin
(compartment 3). Cabin and corridor ventilation (HVAC System) is stopped.
The evaluation of the test 1 consequence (Smoke Layer Height after Imin) was
accomplished by means of a physical simulation using the FAST code. The result is
shown in Figure 5.5.
In a similar way, test 2 and test 3 are studied.
Test 2
Cabin and corridor ventilation (HV AC System) is normal.
97

3.0
0.0
0.0
\ \ , 1
,
Fire COrY'lportment 1
Corridor 2
Comportment .3
Interface Height
Time (5) 1000.0
Figure 5.5. Test 1 result of smoke layer height.
Test 3
ASCS is working. The following information is given:
• Ceiling extraction bathroom: 100m3!h .
• Ceiling extraction corridor: 6m3/s.
Step 4
Results
Test 1 (After Imin, Corridor Smoke Layer Height= 2.01m)
The calculation shows that if the ventilation is stopped the conidor becomes smoke
logged. Smoke overflows to stairs.
98

Test 2 (After Imin, Corridor Smoke Layer Height= 1.36m)
If the ventilation is kept in operation the smoke level is not significant and IS
contained at the corridor ceiling.
Further comments following test 2 indicated that smoke in the corridor is limited and
would not give great difficulties in passenger evacuation provided that the ventilation
is kept running.
Test 3 (After Imin, Corridor Smoke Layer Height= 1.03m)
When the ASCS is kept in operation the smoke level is much lower. Smoke spillage is
limited to stairwell.
The result of the smoke layer height for each test case is shown in Figure 5.6.
This appears to be over optimistic. All tests have to begin with a selected size of fire
and even slight variances, in reality, could change results.
Any smoke, which is detected in crew or passenger spaces means that immediate
evacuation is essential.
5.5 Conclusion
IMO is a well intentioned authoritative body, but in the past, by the nature of the
organisation's procedures, acceptance of regulations internationally was slow.
Although this process has been speeded up, technological advances and general
developments often overtake regulatory requirements.
The actual design and operation of ASCS does vary on the newer vessels but
essentially it is the risk to life that is the concern of this chapter rather than tactical
ventilation during fire fighting.
99

Stairs
Bath Cabin I Test 1: 2.01m room Test 2: 1.36m
Test 3: 1.03m
~ Corridor
Figure 5.6. Test results of smoke layer height.
Some of the new vessels, due to come into operation soon, have the following systems
built in:
If a fire is detected in any cabin,
1. The air supply fan automatically stops and its dampers close.
2. The recirculating air fan stops and its dampers close.
3. The exhaust fan from the bathroom continues to extract.
It is possible that smoke from a cabin may enter stairwells such that the escape by
personnel from different decks may be compromised. In this case:
1. The recirculation damper closes.
2. The relative fan speeds of the stairs supply and stairs exhaust change to a
predetermined point to create an over pressure from the stairs into the corridor.
100
The ship designer has a considerable problem in incorporating everything that is
required or expected for passengers. Assistance, during an emergency, may be non
existent so everything that ensures the safety of the passengers and crew is essential.
Smoke is one of the main killers at sea and this simple fact has been known for many
years.
The previous disasters proved to be an awakening and still there are a few regulations
to put in place to deal with the problems that the chapter has brought to light. The
regulatory process must be cautious but that also means it is ponderously slow. In this
chapter different philosophies and solutions on smoke control have been discussed.
The current regulations do not address the issue of smoke control in passenger ships
as well as they should. IMO and other regulatory authorities could usefully benefit
from using the techniques assessed in this chapter to improve smoke control in these
vessels. These include:
1. The smoke which has to handle all relevant data such as smoke volume to be
extracted and smoke temperature.
2. Required minimum and allowable maximum pressure differences between
corridors and stairways.
3. Criteria for temperature resistance of smoke extraction equipment.
4. Definitions and functions of the control system.
References
Abell, J. (1997), "Smoke and Human Behaviour - A Lethal Combination!", Fire At
Sea, RINA, London, UK, 20-21 November.
Abell, J. (1999), "Developments in Active Smoke Control Systems for Passenger
Vessels", Learning from Marine Incidents. RINA, London, UK, 20-21 October.
101

Anderson, P., Robertsson, H. & Wikman, J. (1993), "A Fire Safety Survey of
Materials Used in Passenger Vessels", Accommodations, Research Report MariTerm
AB, ISBN 91 630 1809N, Goteborg Sweden. 8 April.
Angelo, T. & Giovanni, G. (1997), "Fire Risk Analysis on Cruise Ships - Application
to an Accommodation Zone", Paper 3, Fire at Sea, RINA, London, UK, 20-21
November.
Chow, W. K. (1995), "A Comparison of the Use of Fire Zone and Field Models for
Simulating Atrium Smoke-filling Processes", Fire Safety Journal, Vol 25, pp 337-353.
Chow, W. K. (1997), "On the Use of Time Constants for Specifying the Smoke
Filling Process in Atrium Halls", Fire Safety Journal, Vol 28, pp 165-177.
Fu, Z. & Hadjisophocleous, G. (2000), "A Two-zone Fire Growth and Smoke
Movement Model for Multi-compartment Buildings", Fire Safety Journal, Vol 34, pp
257-285.
Graham, A. (1995), "Smoke Movement Driven by a Fire Under a Ceiling", Fire
Safety Journal, Vol 25, pp 261-275.
He, Y. & Beck, V. (1997), "Smoke Spread Experiment in a Multi-storey Building and
Computer Modelling", Fire Safety Journal, Vol 28, pp 139-164
He, Y., Wang, J., Wu, Z., Hu, L., Xiong, Y. & Fan, W. (2002), "Smoke Venting and
Fire Safety in an Industrial Warehouse", Fire Safety Journal, Vol 37, pp 191-215.
IMO (1997), "SOLAS, Consolidated Edition", London, UK.
Jensen, K. H. (1994), "Smoke Control in Cruise and Passenger Vessels", Paper 13,
IMAS 94, Fire Safety on Ships, Developments into 21st
Century, London, UK, 26-27,
May.
102

Kim, M. B., Han, Y. S. & Yoon, M. O. (1998), "Laser-assisted Visualization and
Measurement of Corridor Smoke Spread", Fire Safety Journal, Vol 31, pp 239-251.
Peacock, D. R., Reneke, A. P., Jones, W. W., Bukowski, W. R. & Forney, P. G.
(2000), "A User's Guide for FAST: Engineering Tools for Estimating Fire Gro\qh
and Smoke Transport", NIST (National Institute of Standards and Technology),
Special Publication 921, USA.
Ramsdale, S. & Mawhinney, R. N. (2003), "Fire Consequence Modelling for the
Safety First Project", Passenger Ship Safety, RINA, London, UK, 25-26 March.
Schreiter, J., Voelker, J. M., Nusser, S. & Meyer-Konig, T. (2003), "Demonstrating
Regulatory Compliance of Alternative Designs a Framework Concept", Passenger
Ship Safety, RINA, London, UK, 25-26 March.
SFPE (1993), "The SFPE Handbook of Fire Protection Engineering", Society of Fire
Protection Engineers, National Fire Protection Association, USA.
US Department of Commerce (1983), National Bureau of Standard, National
Engineering Laboratory, "Fire Performance of Furnishings as Measured in the NBS
Furniture Calorimeter, Part 1 ", NBSIR 83-2787, USA.
US Department of Commerce (1985), National Bureau of Standard, National
Engineering Laboratory, "Effect of Wall and Room Surfaces on the Rates of Heat,
Smoke and Carbon Monoxide Production in a Park Lodging Bedroom Fire", NBSIR
85-2998, USA.
US Department of Commerce (1988), National Bureau of Standard, National
Engineering Laboratory, "An Experimental Data set for the Accuracy Assessment of
Room Fire Models", NBSIR 88-3752. USA.
103

CHAPTER 6 - EVACUATION ANALYSIS OF PASSENGER
SHIPS: USING COMPUTER SIMULA TION TO PREDICT
EVACUATION PERFORMANCE
Summary
Several disasters with passengerlRo-Ro vessels over the last years have demonstrated
a need for evacuation analysis. This chapter presents a methodology for modelling an
evacuation. Ship evacuation models offer the promise to quickly and efficiently bring
evacuation considerations into the design or modify an existing design phase.
Typically, this chapter provides the simulation of 90 passengers and 10 crew members
mustering on a vessel of 6 decks. After this, simulation of different scenarios is
discussed.
6.1 Introduction
Recent well-published disasters of passengerlRo-Ro ships together with trends of
largely increased capacity of passenger carrying ships have brought the issue of
effective passenger evacuation, being the line of defence, in an emergency to the
centre of attention of the maritime industry worldwide. With numbers now ranging up
to 6,000 on a single large cruise liner, with ships often trading in pristine
environmental areas and with rapidly growing consciousness for safety and
environmental protection among ship operators, assurance of all these issues at the
highest levels has become the main targets for technological innovation in the
maritime industry as well as key factors for gaining and sustaining competitive
advantage [Simoes, et aI., 2000]. However, the process of evacuating a large
passenger ship is a very complex one, not least because it involves the management of
a large number of people on a complex moving platform, of which they normally have
very little knowledge. These characteristics make ship evacuation quite different to
evacuation from airplanes and buildings [Shields & Boyce, 2000] as the first only
involve relatively simple geometries, whilst the second imply steady platforms,
normally with no need for assistance to be given to its occupants during an evacuation
104

and no need for their preparation to survive a harsh environment following a
successful evacuation. These inherent problems, coupled to limitations in time to the
extent that evacuation may often be untenable, render decision making during a crisis
a key to successful evacuation and any passive or active support encompassing design
for ease of evacuation, crew training, evacuation plans/procedures and intelligent
systems on board critically important [Lopez & Perez, 2003].
Following a ship incident, a decision has to be taken as to whether an evacuation is
necessary. In many situations the safest course of action is to remain onboard the ship
as the environment outside can be more perilous than that on board [Rutgersson, et aI.,
2003]. In such cases the evacuation does not require passengers to abandon ship but to
seek safe refuge away from the immediate threat. However, uniquely to shipping
applications, the orientation of the escape paths may be time dependent due to roll
[Galea, 2000, Galea, et aI., 2002, Galea, et aI., 2004, Gwynne, et aI., 2001].
Uniquely to ship situations, a good deal of time consuming preparatory activities must
be completed prior to the actual evacuation. Passengers are instructed to collect life
jackets (usually located in cabins or muster stations) and are usually further required
to assemble in pre-defined muster stations prior to attempting to disembark. Even in
the well-orchestrated Exercise INVICT A, the mustering operation required between
11 and 20 minutes [Marine Safety Agency, 1996, Thompson & Wheatley, 2000]. In
addition, family groups separated prior to the emergency are likely to attempt to
reunite prior to attempting to evacuate, all of which effectively delays and prolongs
the evacuation process. Again uniquely to shipping situations, for the majority of
passengers, the evacuation path is often counter intuitive. In buildings where the way
out of a structure is to normally proceed to street level, while on board ship the way
off requires passengers to seek the muster station. This could require passengers to
travel to an apparently arbitrary location above or below their current position and to
the port or starboardside. Furthermore, the routes can be complex and confusing to
passengers not accustomed to the marine environment, even the term "muster station"
may be unfamiliar to some passengers [Koss, et aI., 1997].
105

Throughout the evacuation process complex contra-flows can develop within the
passageways and staircases. These can be formed by flows of passengers with
different goals, for example by passengers attempting to find companions, collect life
jackets and warm clothing and locate muster stations. Crew can also create contra
flow situations as they attempt to tackle the cause of the emergency or reach assigned
duty stations. Regardless how remote the possibility or difficult the task, ship
evacuations do occur and they can be the result of fire (e.g. Ecstasy), collision (e.g.
European Gateway), grounding (e.g. Saint Malo Ferry), equipment failure (Estonia) or
human error (Herald of Free Enterprise) [Glen, et aI., 2003].
6.2 Background
A number of drivers have brought passenger evacuation to the forefront of priorities
of the European shipbuilding industry triggering the need for the development of tools
[Soma, 2001] and procedures in support of performance-based design for evacuation
to ensure cost-effective treatment of this important issue:
1. Passenger ship/Ro-Ro ferry accidents have brought about the realisation that "ship
and cargo survival" might have to be addressed separately from "passenger
survival" in that these vessels can capsize very rapidly, when damaged, thus not
allowing sufficient time for evacuating passengers and crew.
2. An amendment to SOLAS (Safety Of Life At Sea) '74 requires "Ro-Ro passenger
ships constructed on or after 1 July 1999, to have escape routes evaluated by an
evacuation analysis early in the design process".
3. The consequences of accidents involving large loss of lives could drive shippers
out of business, as the Estonia tragedy has amply demonstrated. Such
consequences are bound to reach intolerable levels when addressing new concepts
such as cruise liners carrying well over 5000 passengers.
Deriving from the above, there is an immediate need to address the capability of the
whole passenger evacuation system pertaining to mustering routes and procedures,
106

life-saving appliances [Rodricks & Cooke, 1996], decision support and management.
In tum, this leads to the necessity to focus on the development of evacuation analysis
and simulation tools for the prediction of evacuation performance, thus allowing for a
meaningful evolution of passenger ship designs with enhanced evacuation
performance (minimum time for safe evacuation of passengers and crew). Successful
mustering and evacuation can avert disaster as the last lines of defence even after the
safety measures linked to structural reliability and enhanced ship survivability have
failed. In this respect, the development of tools in the form of computer simulation
models for the prediction of evacuation scenarios, evacuation time and probability of
success in different conditions must be addressed as a top priority. The same tools
could also be used to aid decision making onboard the ship, thus tackling the same
problem as an operational rather than a design issue [Vassalos, et aI., 2002].
6.2.1 The shipboard evacuation problem
Much as there are generic elements in the simulation of passenger evacuation equally
applicable to ships, buildings or aircraft, there exist critical differences between them,
which are likely to have a significant (and hence crucially important) effect on the
outcome that ought to be addressed at the outset [Majumder, 2000].
6.3 Methodology
An evacuation analysis framework is proposed to include the following steps:
1. Collection of information.
2. Simulation of evacuation process.
3. Simulation of the consequences.
They are detailed in the following:
107

1. A wide range of developments concerning design and operational "tools" have
been made possible including:
1) Evaluation of evacuation time for certification purposes.
2) Design/modification for ease of evacuation. This involves systematic
parametric investigation to identify governing parameters of the ship
environment (e.g., corridors, staircases, number and location of mustering
stations, life saving appliances, signage) within a pre-defined set of human
behaviour parameters and mustering and evacuation procedures. This would
allow design optimisation for enhancing evacuation performance, where
parameters being considered include: evacuation time and components
contributing to it; time history of occupancy of regions of interest; queue size
time history (bottlenecks); rate of crossing through doors. etc.
3) Mustering/evacuation routes and procedures. This involves the identification
of optimal passenger flow (minimum total evacuation time) concerning choice
of routes and procedures to achieving this. Heuristic approaches based on
experience and engineering judgement are used in combination with self
searching and tuning algorithms to automate this process.
4) Crisis management and decision support. This involves development of
effective management and decision support systems for risk containment
during a crisis as active means to averting catastrophes (e.g., an onboard
evacuation simulation platform to aid decision-making for effective
mustering/evacuation in a range of incidents).
5) "What if' scenarios for crew training.
6) Passenger familiarisation with a ship's environment - particularly the large
cruise liners and passenger/Ro-Ro vessels being built today.
108
2. The evacuation when applied to maritime applications refers to all that activity
which takes place from the sounding of an alarm to leaving the ship. To truly
model ship based evacuation it is essential to address all of components. To
perform the required simulation reliably requires an evacuation model with the
appropriate set of capabilities and access to the necessary data. Furthermore, the
scenario under consideration may be under conditions of calm or involve
situations with list or roll [Tsychkova, 2000]. This will affect not only the nature
of the data required but also the capabilities of the model. When modelling human
behaviour during evacuation it is essential that the enclosure geometry, population
and population behaviour be represented.
3. The simulation produces a range of output, both graphical and textual. Interactive
two-dimensional animated graphics are generated as the simulation is running.
This allows the user to observe the evacuation as it takes place. The graphics are
interactive allowing the user to interrogate occupants and events. In addition, a
data output file is produced containing all the relevant information generated by
the simulation, including a copy of the input data. For example, the output data
includes evaluation time need for individuals, total time to muster and evacuation,
distance travelled by individuals and time wasted in congestion by individuals.
These are intended to be used once a simulation has been completed and enable
large data output files to be searched and specific data selectively and efficiently
extracted.
6.4 Case Study
A typical page during the evacuation involving fire of 90 passengers and 10 crew
members from a passenger ship with some of the controls available in the simulation
software is shown in Figure 6.1.
In this case, the evacuation analysis is carried out by means of a deterministic
simulation through a multi-decks model implemented in the Evi [Vassalos, et a\.,
2001 a-c]. In particular, the simulation of every scenario yields results in terms of total
travel time (evacuees arriving at embarkation station).
109

no: ~ ~ ~ II ~ ~ I 0 T.(1Ie} n1 U2 n3 0.( ns ns [7 [8 [9 1 •• 1 ••• 11111.1 •••• ,111.1,', •••••• 1",,111.,1 ••• , ••••• 1.1.,11 ••• 1 •• 1 •• ,11.1, ' 11.1.111111111 ••• 1111 ••••
Figure 6.1. Evi: Run time simulator during an evacuation.
To demonstrate the use of the simulator, a number of scenarios are considered for a
passenger ship operating in international waters. The vessel consists of 6 manned
decks - 4 of which contain cabins. Each cabin size is 6mx3mx3m. The assembly
station is located within a centralised atrium on deck 3. The embarkation station is
located on deck 6. The detailed passenger and crew distributions are shown in Table
6.1.
110

Table 6.1. Passenger and crew distributions.
Deck Number of Number of Number of Remarks
cabins passengers crew
1 10 20 2 Cabins
2 10 20 2 Cabins
3 2 Assembly station
4 10 20 2 Cabins
5 10 30 2 Each cabin for 3 passengers
6 Embarkation station
The decks are connected by staircases and the width of each corridor is 2m, the
location and dimensions of which are given in Table 6.2.
Table 6.2. Deck connectivity by stairs.
Connecting deck Number of Width Remarks
staircases
1-2 2 1m
2-3 2 1m 4 - Fire doors
3-4 2 1m
4-5 2 1m
5-6 2 1m 4 - Fire doors
There are no arrows indicating the main escape route - this is due to the fact that there
is always an option of two routes to the assembly/embarkation station (such as
onboard Scandinavian Star where some passengers ended up entering areas affected
by the fire by following EXIT arrows). Instead of arrows, the corridors in
accommodation areas are marked by LLL (Low Location Lighting), luminous green
horizontal lights along the length of the corridor and vertical lights marking
doorframes along the escape routes.
Information on passenger and crew distribution and demographic details was obtained
from the IMO Interim Guidelines. All cases randomised passenger and crew gender.
The simulations were run with passengers present in their cabins at the start of the
III

simulation involving fire, which is referred to as 'night case ' in the IMO Interim
Guidelines. A 'day case' is one where passengers are situated in public areas (e.g.
restaurants, shopping mall, etc.) [IMO, 2002].
Case 1: From Cabin to Assembly Station
At the sound of the general alarm the passengers start moving from their respective
cabins to the assembly station. Reaction time and uncertainties concerning age and
gender, which affect speed of advance, are assigned (see Figure 6.2).
o 10 3) ]I II Sl ,.1.1".1 .. 11.1.11 ... 1 .. 1.1f.1I •• ,I" •• ,.,,,I, ........ 1 .. 11.11 ....... ~
Figure 6.2. Case 1: from cabin to assembly station.
112

Case 2: From Cabin to Embarkation Station
At the start of the simulation the passengers move from their cabins to the
Embarkation station on deck 6 following the shortest route and without stopping at the
assembly station. Passenger distribution and uncertainties associated with human
behaviour are applied. This case represents a real incident (see Figure 6.3).
o ~ ~ m m 11111111111 •• 111 •••• 11111111111 •••• ,1,.111.111" •• 1 .........
Figure 6.3. Case 2: from cabin to embarkation station.
113

Case 1-1: Blockage of One Fire Door on Assembly Station
The blockage on the evacuation is considering the loss of escape route. When
passengers arrive on the deck where there is the assembly station, they still have to
queue before arriving at their destination (see Figure 6.4).
o ~ ~ m m 100 1~ "'" I"" "'" I"" "'" I,,,,, ""I,,,, "'" I"" "'" I, """ "I"" "' __ ~
Figure 6.4. Case I - 1: blockage of one fire door on assembly station.
II

Case 2 - 1: Blockage of One Staircase on Embarkation Station
The passengers have to travel to reach an alternative stairway that much further than
their original choice (see Figure 6.5).
Figure 6.5. Case 2 - 1: blockage of one staircase on embarkation station.
115

Comments on the results
The results from the case studies presently considered are given in Figure 6.6.
Cumulative Travel Times
120
100T--,-r------------------------~----
80 --case 1
U) - --case 2 c 60 • at case 1-1 cC
40 - case 2-1
~T_,H_------------------------------------
o~--_,,_--_,----._----~--~----~--~
o 100 200 300 400 500 600 700
Time· Sec
Figure 6.6. Travel time for the cases considered.
Case 1 has the shortest travel time. Th is is due to the fact that the passengers are
simply moving from their cabins to an assembly station. This is illustrated by a steep,
'straight' curve.
Case 2 - here the passengers, rather than going to assembly stations, are instructed to
go directly to the embarkation station. Comparing with Case 1, this can be detected by
a less steep curve towards the end of the simulation.
The results of Case 1 - 1 indicate that the start of the simulation curve is similar to the
one in Case I - despite the fact that a less steep curve towards the middle and end of
simulation is detected. The bump' on the curve is caused by the fact that on deck 3
116

assembly station one of the doors was blocked (bottleneck). This means that there is
more queuing (compared to Case 1).
Case 2 - 1 has the longest travel time - due to the fact that passengers generally have
to travel a longer distance (as they may become lost at the blocked stair exit).
The areas in direct connection to assembly and embarkation station appear to be prone
to blockage due to the large number of passengers attempting to enter over a short
period of time. This problem may be solved in normal evacuation by assembling the
passengers in groups. The crew has to co-ordinate the assembly so that the passengers
do not move towards the assembly stations until there exists sufficient area to
accommodate the envisaged crowd capacity. Crew members by assembly station have
to monitor the number of people there and to communicate to the crew responsible for
a given group of passengers to start moving.
One should consider having people waiting for example in assembly area until their
passage to the embarkation station is clear. This is to prevent queuing in staircases or
corridors. Passengers will be more relaxed and co-operative if they rest in an
environment like a public area rather than a small and narrow corridor.
6.5 Conclusion
This chapter has demonstrated the evacuation process on passenger ship within
different scenarios. The proposed approach can be used to investigate issues such as
blockage exit, passengers and crew movements during emergency situations involving
fire. The results of this study have also shown how varies in different evacuation
scenarios.
The evacuation analysis by the methodology using computer modelling is a useful
tool. It can be used by ship designers during the concept phase, classification societies
for the certification of ship design and by ship operators for training both on shore and
at sea. In the stages of the design process such analysis will bring important issues of
fire safety, evacuation. staffing and procedures to the fore of vessel design in a
manner that is reliable. quantifiable and reproducible. In a similar process.
1 17

classification societies will be able to quickly assess a proposed design, including the
crew procedures and determine whether proposed designs meet acceptable standards.
Also, operators will be able to assess safety provision on board with respect to
number, type and location of passengers, number and location of crew, etc.
References
Galea, E. R. (2000), "Safer by Design: Using Computer Simulation to Predict the
Evacuation Performance of Passenger Ships", IMarEST International Conference
Safety of Large Passenger Ships - Looking to the Future, Vol 112, Part 2, London,
UK, 15-16 May.
Galea, E. R., Filippidis, L., Gwynne, S., Lawrence, P., Sharp, G., Blackshields, D. &
Glen, I. (2002), "The Development of an Advanced Ship Evacuation Simulation
Software Product and Associated Large Scale Testing Facility for the Collection of
Human Shipboard Behaviour Data", RINA Proceedings International Conference on
Human Factors in Ship Design and Operation, London, UK, pp 37-50.
Galea, E. R., Lawrence, P., Gwynne, S., Filippidis, L., Blackshields, D., Sharp, G.,
Hurst, N., Wang, Z. & Ewer, J. (2004), "The Simulation of Ship Evacuation Under
Fire Conditions", Proceedings International Conference Fire and Safety at Sea,
Melbourne, Australia, 17-19 March.
Glen, I., Igloliorte, G., Galea, E. R. & Gautier, C. (2003), "Experimental
Determination of Passenger Behaviour in Ship Evacuations in Support of Advanced
Evacuation Simulation", RINA International Conference Passenger Ship Safety,
London, UK, 25-26 March.
Gwynne, S., Galea, E. R., Lawrence, P. & Filippidis, L. (2001), "Modelling Occupant
Interaction with Fire Conditions Using the Building EXODUS Evacuation Model",
Fire Safety Journal, Vol 36, pp 327-357.
IMO (2002), MSC/Circ. 1033, "Interim Guidelines for Evacuation Analyses for New
and Existing Passenger Ships", London, UK, 6 June.
118

Koss, L., Moore, A. & Porteous, B. (1997), "Human Mobility Data for Movement on
Ships", RINA International Conference Fire at Sea, London, UK, 20-21 November.
Lopez, A. & Perez, F. (2003), "Designer and Master Aids to Improve the Evacuation
of Passenger Ships", SNAME World Maritime Technology Conference, San
Francisco, USA.
Majumder, J. (2000), "Behavioural Modelling of Emergency Evacuation from Ro-Ro
Passenger/Cruise Ships", Technical Report SSRC-05-00-JM-OI-ER, Glasgow, UK,
May.
Marine Safety Agency (1996), "Marine Safety Agency Report on 'Exercise
INVICTA' held in Dover Harbour; 13 Jan 1996", Southampton, UK, May.
Rodricks, B. & Cooke, P. (1996), "Life Safety Management Systems - Enhancing
Passenger Safety", IMarEST Trans, Vol 109, Part 2, pp 117-125.
Rutgersson, 0., Tsychkova, E. & Andersson, M. (2003), "Evacuation of Passenger
Ships in Rough Weather - A Study of the Behaviour of Equipment and the Interaction
with Human Performance", RINA International Conference Passenger Ship Safety,
London, UK, 25-26 March.
Shields, T. & Boyce, K. (2000), "A Study of Evacuation from Large Retail Stores",
Fire Safety Journal, Vol 35, pp 25-49.
Simoes, A., Lam, E., Veitch, B. & Igloliorte, G. (2003), "Quantitative Assessment of
Escape and Evacuation", RINA International Conference Passenger Ship Safety.
London, UK, 25-26 March.
Soma, H. (2001), "Computer Simulations of Passenger Ship Evacuation". ESREL
International Conference Towards a Safer World, Torino, Italy, 16-20 September.
119

Thompson, T. & Wheatley, N. (2000), "Evacuation of Large Passenger Vessels -
Passenger and Crew Drills", IMarEST International Conference Safety of Large
Passenger Ships - Looking to the Future, Vol 112, Part 2, London, UK, 15-16 May.
Tsychkova, E. (2000), "Influence of Waves and Ship Motions on Safe Evacuation of
Passenger Ships", Licentiate Thesis, Kungliga Tekniska Hogskolan (KTH), Sweden,
June.
Vassalos, D., Cristiansen, G. & Kim, H. (2001a), "Evi - Passenger Evacuation
Performance Assessment in Ship Design and Operation", TIEMS 2001, Oslo, Norway,
June.
Vassalos, D., Kim, H. & Cristiansen, G. (200 1 b), "Passenger Evacuation in a Virtual
Ship - Sea Environment and Performance - Based Evaluation", Cruise and Ferry, May.
Vassalos, D., Kim, H., Cristiansen, G. & Majumder, J. (2001 c), "A Mesoscopic
Model for Passenger Evacuation in a Virtual Ship - Sea Environment and
Performance - Based Evaluation", Duisburg, Germany, 4-6 April.
Vassalos, D., Cristiansen, G., Kim, H., Bole, M. & Majumder, J. (2002),
"Evacuability of Passenger Ships at Sea", SASMEX, Amsterdam, Netherlands, April.
120

CHAPTER 7 - FIRE RISK MODELLING OF MACHINERY
SPACE: AN APPLICATION OF APPROXIMATE REASONING
APPROACH (FUZZY AVERAGING METHOD) IN PASSENGER
SHIP ENGINE ROOM
Summary
Fire safety is built up of ignition prevention, early detection of fire, safe personnel
evacuation, containment of fire and efficient suppression. In addition, vital machinery
functions must be continued during the fire.
This preliminary fire safety study intends to assess the potential hazards that would
affect the operation of a ship engine room. The risks associated with such hazards are
quantified and ranked in order of priority and assessed for decision-making purposes.
This chapter concentrates on the fire risk evaluation of the major hazards threatening
the engine room overall rather than focusing on specific areas of the design. The main
objective is to propose a framework for modelling system fire safety using an
approximate reasoning approach. A case study of the risk to passenger ship engine
room due to fire during operation is used to illustrate the application of the proposed
risk assessment model.
7.1 Introduction
High fire safety in ships in general and machinery space in particular is a result of
correct design and careful crew operations. When either one of these is missing, fire
risks are significantly increased.
The available fuel in an engine room of a ship is usually limited to oil, which is stored
or used in engines, boilers, lubricants and stores. The tidiness of any engine room wi II.
of course, affect the ease with which a fire may start and develop. Unless an engine
room fire becomes serious, it may well be confined to the area in which the outbreak
of fire occurred. In the event that an escape of oil does become involved, the
1:21
probability of fire being communicated to the accommodation is very much higher
than fire spread in the reverse direction, because there is a good chance that there will
be combustible materials in contact with, or in close proximity to, the accommodation
side of the engine room casing. Heat rising from the engine room fire will cause the
engine room casing to become hot, which in tum leads to ignition of combustibles by
means of heat transfer by conduction or radiation.
The most serious engine room fires therefore occur when an escape of oil becomes
ignited. The ease with which oil can be ignited by the introduction of an external
source of ignition, depends upon the flash point temperature of that oil. The flash
point is the temperature to which the oil must be raised such that a flammable vapour
air mixture will be established at the surface of the liquid.
Heat blister patterns providing clear evidence of oil having burned in the engine room
may often be revealed after a fire by using diesel oil to clean soot and dirt deposits
from surfaces of machinery and floor plates, etc. [Foster, 1994].
Fires in electrical switchboards and other electrical machinery have the potential to
give rise to fire where cable connections and terminations become loose or damaged
or where switch or contactor contacts have become eroded. Fires originating in main
electrical switchboards seldom develop seriously, because usually only a small
amount of cable insulation is exposed within the switchboard area, and for the most
part the external portion of the cable is steel wire armoured or metal braided. Spare
components are, however, often stored in combustible packaging behind the
switchboard and this may extend the fire if it becomes involved [Foster, 1994].
When previous engine room fires are studied, it is apparent that no two fires are
identical. All engine rooms are different. Even sister ships have differences. Thus
slightly varying details or temporary changes may lead identically ignited fires to
totally different end results.
A fire resistant engine room displays lower ignition probability than an average one.
A fire resistant engine room remains by definition safer for personnel. This chapter
122

focuses on the fire resistant one. High fire safety and resistance are difficult to achieve
when capital and operational costs must be observed. True optimisation cannot be
done. Of course the additional costs of improved design can be measured but the
probabilistic gain from statistical likelihood of fire and expected damage costs are
usually only theoretical figures [Hakkinen, 1997].
In general, ship fires have been widely investigated. Single fires are analysed (with
varying accuracy) and reported to International Maritime Organization (IMO) related
committee. Both the IMO and classification societies issue statistics and summaries of
the fire reports. Increasing attention is also given today to the incidents and near miss
cases that could have lead to disastrous consequences. Some of the fire reports issued
by national safety authorities are really valuable materials for the fire safety
researcher.
Fortunately ship fires seldom result in catastrophes. Often the losses are mainly
economical with minor personnel injuries. However some 100 to 200 fires are
reported annually. Those fires involve human losses, significant ship damages or
traffic interruption. Among these fires a third were initiated in engine rooms.
Engine room fire safety has been considered by many parallel methods. IMO and
other authorities have guided the technical development by detailed regulations on
ship structures and equipment. Many rules and guidelines apply to the machinery
systems and machinery spaces [IMO, 1997].
7.2 Fire Safety of Ship Engine Room
7.2.1 Criteria for fire safety
In principle, general fire safety is presented by the following sequential criteria:
1. Fire ignition must be prevented.
2. However. if fire is ignited. alarm or other suitable indications must be triggered
without delay.
123

3. The indications must raise further action, like extinguishing, equipment shut
down, etc.
4. Fire suppression must be rapid, efficient and appropriate.
5. Personnel must be safely evacuated from the danger zone.
6. Fire must be confined in the compartment of ignition and not spread out to other
zones.
IMO and classification societies specify measures required to fulfil these criteria in
principle. Extensive experimental and theoretical research lies behind the regulations
and experience from the accidents is utilised. Yet regrettably engine room fires occur,
which are not fully controlled according to items 1 to 6 above.
Significant development work has been performed among the fire detection and
extinguishing equipment manufacturers. Some of them are complaining that
conservative regulations and acceptance tests are hindering the progress [Hakkinen,
1997]. However, this particular topic is not further discussed in this chapter.
'Normal conditions' refer commonly to cases when fire has been ignited by an
accidental mechanical failure or a technical cause. A frequently quoted example is the
crank case explosion of a medium speed diesel engine. In some cases the damage
included heavy drive gear parts breaking through the engine frame, hitting equipment
containing flammable oil and causing oil ignition. While such fires are commonly
regarded as totally unexpected, closer inspection may reveal that primary causes
included errors in engine design, prolonged operation on worn-out piston rings and/or
engine overload. Causes are widely different and they often occur simultaneously.
• Abnormal conditions' refer to circumstances where an unexpected and inherent
incident causes engine errors. Typical examples are temporary stowing of combustible
materials in a high fire risk area. leaving the exhaust gas manifold thermal insulation
124
uninstalled "only for the short coffee break", piping design where ruptures are
generated but they remain unnoticed, etc. [Hakkinen, 1997].
7.2.2 Fire safety
Fire safety can be defined and quantified in many ways. Statistical evaluation of fire
safety is usually derived from a number of reported fires. This data can be used to
calculate ignition probabilities with respect to figures for specified machinery spaces,
ships of certain age, various flags and categories. Yet this evaluation tool has some
drawbacks. Near miss-cases are ignored although they could produce valuable
information for producing fire risk control measures. Experience confirms that various
incidents are many times more frequent than actual fires. Furthermore some two thirds
of ignited fires are instantly suppressed and remain unreported.
Most of the statistical data contains very little information about the primary cause of
fire origin. Valuable information on spread-out and damages is sometimes given in
separate fire reports but summaries of such information are rare.
The number of casualties and extent of damages are given in statistics to describe how
serious the engine room fires typically are. These figures give unfortunately only
limited help for the design and operational aspects of improved fire resistance.
Profound analysis of single fire cases and their reports has appeared to be very
valuable. The fire has to be investigated as a process starting long before the ignition
and ending after the completion of investigation and damage repair [Hakkinen, 1997].
7.2.3 Scope of research
In this chapter, the main attention was given to ships with diesel propulsion and
mechanical and electrical power transmission. Besides the propulsion machinery was
electric and thermal energy generation with their auxiliaries included. The
investigated ship systems included steering gear. fire and bilge piping systems. The
selected steel structures in machinery spaces were evaluated.
125

Other propulsion machinery concepts were not included in this chapter. Gas turbines
have inherently good fire safety record, mainly due to the protective modular casing
and the simplified fuel system. In many respects the auxiliary machinery in turbine
driven ships has equivalent or better fire safety than diesel driven ships.
7.3 Investigation of Previous Accidents Relative to Engine Room Fire
This investigation comprises survey reports on 73 NK-classed ships involving engine
room fires during the period from 1980 to 1992 [NKK, 1994]. Ships damaged by
small fires or suffered sinking without being reported to the NK society are excluded
from this investigation. Internal fires or explosions in boilers, exhaust gas
economisers, waste oil incinerators, turbo-charges, crankcases, etc., without the fire
extending to the engine room were considered as fire damage to the machinery itself,
therefore, they are excluded from this investigation. Fire damage to the hull following
an engine room fire was considered and counted as an engine room fire and a fire
caused by rocket or missile attacks during a war was considered to be a fire in hull
compartments.
7.3.1 Results of investigation
The results of the investigation are summarised as follows [NKK, 1994]:
1. 73 ships were damaged by engine room fires during the period from 1980 to
1992.
2. About six ships per year were damaged by engine room fires, which are 0.1 % of
all 6,000 NK classed ships. As a comparison, about seven ships per year were
damaged by fire in hull compartments.
3. Engine room fires often occurred when ships were underway, which accounted
for about 750/0 of the total number of ships damaged by engine room fires. 52%
of ships with engine room fires when underway became unnavigable.
126
4. The main cause of fire resulting in an unnavigable condition is a main electric
source failure caused by the main switchboard or the main electric cables under
the ceiling burning due to the ignition of a spray of fuel oil or lubricating oil.
5. On average, one crew member per year was killed and one crew member was
injured or suffocated from carbon monoxide per year due to fires. Engine room
fires are mainly caused by flammable oil igniting and there are many cases of
human casualties due to evacuations delays from engine rooms where fire and
smoke had spread quickly.
6. Fire often occurred in daytime during maintenance work by the crew. There
were many fires caused by human error due to misoperation or overhauling of
machinery, incorrect repair, etc. Alternatively, it was found that in unmanned
ships, fires often occurred not only during daytime, but also early in the
morning.
7. There are no particular correlations between the number of fires and a ship's age
and gross tonnage.
8. Fires often occurred on reefer ships and car carriers having small engine rooms.
9. The fuel oil piping of main engines and generator engines and the main
switchboard are the main sources of fire followed by fuel oil piping ofthe boiler.
10. Fires at the fuel oil piping of main engines and generator engines are caused by
fuel oil spraying due to loose or broken fittings on fuel oil piping caused by
vibration. The main cause of fire on fuel oil piping of generator engines is fuel
oil spraying due to broken fittings on the fuel valve cooling oil piping.
11. Fires on lubricating oil piping account for 25% of fires on fuel oil piping.
12. No cases of engine room fire caused by a soot fire in an exhaust gas economizer
were reported.
127

13.
14.
The number of machinery fires was twice as many as that of electric equipment
fires.
No engine room fire extending to hull compartments was reported for ships
having keels laid after 1 st September, 1984. This may be because the 81' SOLAS
Amendment was adopted and the regulations on fire protection for hull and
electric cables were introduced from that date.
15. The percentages of fire casualties between MO (MO-ships are those provided
with alarm systems in accordance with the requirement of the "Rules for
Automatic and Remote Control Systems") and Non-MO ships are almost the
same. However, the percentage of fires detected by a fixed detector fire alarm
was 50% in MO ships and only 19% in Non-MO ships, because the installation of
fixed fire detection systems was not required for Non-MO ships having keels laid
before 1 st September, 1984, in accordance with the 81 'SOLAS Amendment.
16. There were fires caused by improper installation of machinery, exhaust gas pipes
and electric cables. The engine room arrangement should be considered in a
"Fire Risk Analysis" [NKK, 1994].
7.3.2 Locations in the engine room with a high fire risk
Figure 7.1 shows the identified locations in an engine room taken from data on fires
that have occurred in 73 ships classed with NK from 1980-1992 [NKK, 1994].
Fires did not occur uniformly at all the locations in the engine room space. Fires in the
engine room were concentrated in areas where flammable oils are liable to leak easily,
and in the vicinity of an ignition source such as a high-temperature surface or where
there is electric equipment liable to generate sparks or overheating. Fuel oil pipes
fitted to main engines, or generator engines, burner fuel injection pipes in boilers,
exhaust gas pipes, turbochargers, and main switchboards are locations with a high fire
risk. Countermeasures for preventing fires must be adopted on a top-priority basis at
such high fire risk areas.
128

WOTank Exhaust gas pipe UPPER DECK
Boiler FO mixing column 2ND DECK DO Tank
LOTank
Incinerator Boiler FO
.----
Generator Rocker arm LO
engine TIG
0 GIELO TIC
I D strainer
GIE LO cooler Main Engine
Oily bilge Thermal oil pipe Exhaust valve LO separator I
D D I
D Crank case door
Bilge well
Switchboard Transformer
JRD DECK
DO Tank FO Tank
Purifier r--
TIC strainer .....-
IX 0 ~ 0 4TH DECK
HlELO
0 2nd strainer 0 Cargo
D
starter
HlEFO LOWER elect. FLOOR heater
FO Tank >c-r--
>< Short sound pipe
Figure 7.1. Sources of fire in engine room [NKK. 1994].
129
ref

7.3.3 Sources of ignition
The sources of ignition are shown as follows [NKK, 1994]:
• Fuel Oil (FO): 30 ships
- Main Engine (MIE) FO piping: 8
- Generator Engine (G/E) FO piping: 8
- Boiler FO piping: 6
- FO tank: 3
- FO tank short sounding pipe: 2
- FO spray after GIE damage: 2
- Diesel oil purifier: 1
• Leakage Oil (LO): 8 ships
- MIE LO piping: 2
- GIE LO piping: 1
- LO tank: 1
- LO strainer: 3
- MIE crankcase explosion: 1
• MIE Turbo Charger (TIC) explosion: 5 ships
• Waste Oil (WO): 2 ships
- WO tank: 1
•
- Incinerator: 1
Electrical Equipment: 18 ships
- Main switchboard: 8
- Starter: 4
_ Control panel: 1
- Generator: 2
- Motor: 1
_ Transformer: 1
130

- FO electric heater: 1
• Others: 10 ships
- Repair at shipyard, loading: 7
- Unknown: 3
7.3.4 Breakdown of causes of fires
The number of ships in each category is presented within ( ) [NKK, 1994].
• FO (30)
o MIE FO piping (8)
Disconnection of drain valve in FO supply piping (1)
Breakage of air relief valve in FO supply piping (1)
Breakage of cock in FO return piping (1)
Disconnection of vinyl hose in FO return piping (1)
Crack in welding seam in FO pipe connection (1)
Breakage of fitting bolts between FO inlet pipe and FO injection pump
(2)
FO leakage from FO electric sheath heater due to mis-fitting (1)
o GIE FO piping (8)
Loosening ofFO supply piping (1)
Breakage of FO pressure gauge pipe in FO supply piping (1)
Breakage ofFO valve cooling oil pipe (3)
Breakage ofFO valve cooling oil pipe in way of brazing fitting (1)
Breakage of differential pressure gauge pipe for FO strainer due to
explosion of air inlet pipe (1)
Loosening ofFO injection pump flange (1)
o Boiler FO piping (6)
Burner mal-function (5)
Loosening and disconnection of threaded pipe connection in diesel oil
supply piping (1 )
o FO tank (3)
Breakage of glass level gauge (1 )
131

o
o
o
Diesel oil overflow from air vent pipe ofFO service tank for boiler (1)
FO tank short sounding pipe (1)
Ignition of FO vapour during bunkering (1)
G/E damage (2)
FO spraying due to damage of GIE connecting rod (2)
Diesel oil purifier (1)
FO spraying due to improper assembling of diesel oil purifier (1)
• LO (8)
o MIE LO piping (3)
Loosening and disconnection of LO supply pipe for exhaust valve
driving gear (1)
Disconnection of LO supply pipe for exhaust valve push rod and rocker
arm (1)
MIE crankcase explosion (1)
o MIE LO strainer (1)
Loosening of LO 2nd strainer cover (I)
oGlE LO piping (1)
Loosening of thermometer fitting of LO cooler (1)
o LO tanking for TIC ofM/E (1)
LO overflow from LO storage tank (1)
o Strainer for TIC of MIE (1)
Loosening of bolts for packing cover (1)
o LO strainer for GIE (1)
LO spraying from air relief valve during cleaning (1)
• Waste Oil (2)
Waste oil sprayed from the disconnected fitting cover of waste oil tank
float gauge (1)
Soot fire in incinerator (1)
• Electrical Equipment (18)
o Main switchboard (8)
Arc from air circuit breakers (2)

Short-circuit of non-fused breaker caused by overheating (1)
Short-circuit of non-fused breaker for shore connection caused b:
overheating (1)
o
Degradation of term inal for TurbolGenerator (1)
Unknown (2)
Starter Panels (4)
Short-circuit of internal wiring in starter panel for LO pump (1)
Short-circuit in starter panel for FO purifier (1)
Chattering of magnetic contactor in starter panel for refrigerating machine
and air compressor (1)
Short-circuit in control panel for refrigerating machine (1)
o Generator (2)
Short-circuit at cable terminal of generator (2)
o Motor (1)
Overheating of motor for main cooling sea water pump (1)
o Transformer (1)
Overheating of transformer (1)
o Electric heater (1)
Incorrect fitment of electric heater for FO service tank (1)
• Others (12)
oTIC ofMlE (5)
Explosion of TIC ofMlE (5)
o Mooring and repair work at shipyard (7)
Spark from welding (2)
Spark from gas cutting (4)
Explosion during cargo loading of Naphtha (1)
• Unknown (3)
Sinking (1)
No report (2)
133

7.4 Approximate Reasoning Approach
7.4.1 Approximate reasoning approach
7.4.1.1 Membership functions
The main artificial intelligence mechanism behind a typical fuzzy safety model is its
fuzzy inference engine. A fuzzy inference engine comprises the selection or
development of the type/types of fuzzy membership function used to represent risk
levels and fuzzy rule bases to generate fuzzy safety estimates. The linguistic variables
are employed in the development of fuzzy membership function for each input
parameter. The goal of fuzzy linguistic variables is to represent the condition of an
attribute/parameter at a given interval. The four attributes/parameters (input variables)
considered in this study are failure rate, consequence severity,failure consequence
probability of a cause to a technical failure, and control measure incorporated in the
design or operation.
The four fundamental parameters failure rate, consequence severity, failure
consequence probability and control mechanism are represented by natural
languages, which can be further described by different types of membership function.
A membership function is a curve that defines how each point in the input space is
mapped to a membership value (or degree of membership) between 0 and 1. Four
different types of membership function are used in this study. The simplest
membership functions are formed using straight lines. These straight-line membership
functions have the advantage of simplicity. All of these memberships are commonly
used to describe risks in safety assessment [Wang & Ruxton, 1997] [Sii, 2000] [Sii &
Wang, 2000] [Sii, et aI., 2001 a-b]. The fuzzy membership functions are generated
utilising the linguistic categories identified in the knowledge acquisition and
consisting of a set of overlapping curves.
Knowledge acquisition, development of fuzzy linguistic variables, development of
membership functions and Analytic Hierarchy Processing (AHP) analysis are usually
required to construct the linguistic safety levels and associated fuzzy membership
functions [Klir & Yuan. 1995]. In knowledge acquisition. data collection analysis.
134
expert and engineering judgements, fuzzy modelling and concept mapping are
performed sequentially to classify the knowledge. The goal is to establish linguistic
variables based on fuzzy set theory, for qualifying and quantifying the safety
estimates to develop fuzzy membership functions for representing risks. The
arbitrariness and variability associated with combining information from various data
and knowledge acquisition channels are the basis for utilising the approximate
reasoning approach in the decision making process. The approximate reasoning
analysis using fuzzy logic systems does perform such transformation and combination
of information from different sources [Wang L. X., 1997].
This section defines the following forms of membership function as perceived by
experts for risk analysis in this chapter:
•
•
•
•
A single deterministic value with 100 % certainty (Figure 7.2 (a)).
A closed interval defined by an equally likely range (Figure 7.2 (b)).
A triangular distribution defined by a most likely value, with lower and upper
least likely values (Figure 7.2 (c)).
A trapezoidal distribution defined by a most likely range, with lower and upper
least likely values (Figure 7.2 (d)).
Each type of membership function is described in detail as follows:
7.4.1.1.1 A single deterministic value
A single deterministic membership function is defined by a crisp parameter raj, in this
case the interval on x-axis is between 0 and 10.
135

1.0
Membership value
2 4
5.00
6 8 10 Fuzzy scale
Figure 7.2 (a). A single deterministic value of 5.0 with 100 % certainty.
1.0
Membership value I--
I I I
2 4
I I I I I
6 8 10 Fuzzy scale
Figure 7.2 (b). A closed interval defined by an equally likely range between 3.0 and
7.0.
136

1.0
Membership value
2 4 6 8 10 Fuzzy scale
Figure 7.2 (c). A triangular distribution defined by a most likely value of 5.0, with a
lower least likely value of2.0 and an upper least likely value of 8.0.
1.0
Membership value
2 4 6 8 10 Fuzzy scale
Figure 7.2 (d). A trapezoidal distribution defined by a most likely range between 4.0
and 6.0, with a lower least likely value of2.0 and an upper least likely value of8.0.
137

7.4.1.1.2 A closed interval
A closed interval membership function is represented in the form of [a, a, b, bj, where
the first a is the membership function's left intercept with grade equal to 0, the second
b is the membership function's right intercept with grade equal to 0, and the second a
and first b are the membership function's left and right intercepts at grade equal to 1.
The function y = closed interval (x, [a, a, b, bj) is written to return the membership
values corresponding to the defined universe of discourse x. The parameters that
define the closed interval membership function [a, a, b, bj must be in the discretely
defined universe of discourse.
7.4.1.1.3 Triangular membership function
A triangular membership function is normally defined by [a, b, cj, where a is the
membership function's left intercept with grade equal to 0, b is the centre peak where
the grade equals to 1 and c is the right intercept at grade equal to 0. The function y =
triangle (x, [a, b, c)) is written to return the membership values corresponding to the
defined universe of discourse x. The parameters that define the closed interval
membership function [a, b, cj must be in the discretely defined universe of discourse.
7.4.1.1.4 Trapezoidal membership function
A trapezoidal membership function is defined by [a, b, c, dj, where a is the
membership function's left intercept with grade equal to 0, b is the membership
function's left intercept with grade equal to 1, c is the membership function's right
intercept with grade equal to 1, and d is the membership function's right intercept
with grade equal to 0. The function y = trapezoidal (x, [a, b, c, dj), is written to return
the membership values corresponding to the defined universe of discourse x. The
parameters that define the closed interval membership function [a, b, c, dj must be in
the discretely defined universe of discourse.
138

7.4.2 Background of fuzzy averaging for safety assessment
Safety assessment provides the basic safety related information for any new project or
engineering product at the initial design stages. The ability to identify, assess and
evaluate anticipated hazards requires the study of imprecise data information coming
from a rapidly changing environment, a task for which fuzzy logic may be better
suited to deal with than classical methods. Analysis of complex situations needs the
efforts and opinions of many experts. The experts' opinions, almost never identical,
are either more or less close or alternatively more or less conflicting. They have to be
combined or aggregated in a rational way in order to produce one conclusion. In this
chapter the methodology of fuzzy averaging is introduced. It is also applied to fire risk
modelling.
7.4.2.1 Statistical average
One of the most important contributions of statistics in applications lies in its concepts
in the average or mean of n measurements, readings, or estimates expressed by real
numbers rp .... , rn . It is defined by:
(1)
The above measurements are considered to be of equal importance. The mean or
average which is typical or representative of n measurements is known as a measure
of central tendency.
If the measurements have various degree of importance, then the concept of weighted
average or weighted mean is introduced. The weights reflect the relative importance
or strength of the measurements. The concept of average (normally called as crisp
average) can be generalized by substituting fuzzy numbers for the real numbers in
Equation (1). The generalization process normally requires complicated computations
involving complex arithmetic operations with fuzzy numbers. Since the main
objective of this study is to explore the potential of fuzzy logic concept in safety
assessment and safety based decision support, the generalization procedure is
restricted to triangular and trapezoidal numbers. They are used very often in
139

applications and besides, it is easy to perform arithmetic operations with them. This is
demonstrated in a case study in the ensuing section.
7.4.2.2 Arithmetic operations with fuzzy triangular and trapezoidal numbers
7.4.2.2.1 Addition of fuzzy triangular numbers
It can be proved that the sum of two triangular numbers A = (a(l) a.(I) a(I)) and 1 I' If' 2
A - (2) (2) (2)). I . lb' "'2 - al ,aM' a2 ,IS a so a tnangu ar num er, I.e.,
This summation formula can be extended for n triangular numbers and also it can be
applied for both left and right values in a triangular number.
7.4.2.2.2 Multiplication of a fuzzy triangular number by a real number
The product of a fuzzy triangular number A with a real number r is also a triangular
number, i.e.,
(3)
7.4.2.2.3 Division of a fuzzy triangular number by a real number
This operation is defined as multiplication of A by l/r provided that r is not O. Hence
Equation (3) gives:
(4)
Operations with trapezoidal numbers can be performed similarly to those with
triangular numbers.
140
7.4.2.2.4 Addition of fuzzy trapezoidal numbers
The sum of trapezoidal numbers A = (a(l) b(l) b(l) a(I)) and A = (a(2) b(2) b(2) a(2)) I 1'1'2'2 2 1'1'2'2
is also a trapezoidal number, i.e.,
AI + A2 = (a(l) b(l) b(l) a(I))+ (a(2) b(2) b(2) a(2)) = (a(l) + a(2) b(1) + b(2) b(l) + b(2) a(l) + (2)) I , I , 2 , 2 I' I , 2 , 2 I I' I I' 2 2' 2 Q 2
(5)
Equation (5) can be generalized for n trapezoidal numbers.
7.4.2.2.5 Multiplication of a fuzzy trapezoidal number by a real number
The general operation involved in multiplication of a fuzzy trapezoidal number A by a
real number r is shown in Equation (6) as follows:
(6)
7.4.2.2.6 Division of a fuzzy trapezoidal number by a real number
The general operation involved in division of a fuzzy trapezoidal number A by a real
number r is shown in Equation (7) as follows:
A = ~A = (~,!2,!2,~J, r:;t: 0 r r r r r r
(7)
7.4.2.2.7 Sum of fuzzy triangular and trapezoidal numbers
. . A ((I) (I) (I)) h· h b t d Consider fuzzy tnangular number I = a l ,aM ,a2 w IC can e presen e as a
. . f ((I) (I) (I) (I)) d ·d I fuzzy trapezoidal number In the form 0 a( ,aM ,aM ,a2 an trapezol a
number A2 = (a}2), bl(2), b~2), a~2)). Applying Equation (5) gives Equation (8), which is a
natural extension of Equation (5).
141

AI + A2 = (a~I), at), at), a~I))+ (a~2), b\(2), bf), a~2)) = (a}1) + a}2), at) + bl(2). ar; + b~2). a~l) + a~2) ) (8)
7.4.2.3 Fuzzy Averaging
7.4.2.3.1 Triangular average formula
Consider n triangular numbers Ai = (a}i), at), a~i)), i = 1, ... , n. Fuzzy averaging of
triangular numbers can be performed by two steps. First, addition operation is used to
sum up the total triangular numbers and then division operation by a real number (the
total number of triangular numbers under study) to give the triangular average
(mean) Aave , which is a triangular number.
_ Al + ... +An _ (a}\),at),a~I))+ ... +(a}n),at),a;) Aave - - ~-~-:::........!..--~~---'.:-'--------=-..!..
n n
n
The general operation is shown in Equation (9).
(9)
7.4.2.3.2 Weighted triangular average formula
If each real numbers Ai represents the degree of importance of
A ( (i) (i) (i)) " = 1, .... n, then the weighted triangular average (mean) A;.e is i = a l ,aM' a 2 '
obtained as follows:
142
=(fJ)la~I),fJ)la2f,fJ)la~I»)+ ... +(fJ) al(n) fJ) a(n) ,., a(n») n 'n M' UJn 2
= (fJ)la~l) + ... + fJ)na~n), fJ)la2) + ... + fJ)nat) , fJ)la~l) + ... + fJ)na~n»)
Ai Where w· = U' - 1 ) I L n - , .... , n
A' }=I }
The generalized equation is shown as follows:
(10)
The average formulae for trapezoidal numbers can be derived similarly to Equations
(9) and (10) and are presented as below.
7.4.2.3.3 Trapezoidal average formula
If A ( i) b(') b(i) (i») , 1 'd I b i = al , 1 , 2 ,a2 , 1= , .... ,n, are trapezol anum ers, then
(a(l) b(l) b(l) a(I»)+ + (a(n) b(n) b(n) a(n») _ 1'1'2'2 ... 1'1'2'2
n
= (L:=1 a~I), L:=I b1(1), L:=1 b~i), L:=I a1i) ) (11)
n
Weighted trapezoidal average formula is shown in Equation (12).
_ (I) b(l) b(l) (I») ( (n) b(n) b(n) (n») - tVl al , 1 , 2 ,a2 + ... + tVn al , 1 , 2 , ill
(12)
The triangular and trapezoidal average and weighted average Equations (9) - (12)
produce a result which can be interpreted as a conclusion or an aggregation of all
143

meanings expressed by triangular or trapezoidal numbers A) , ... An
either of equal
importance or of different importance expressed by weights OJ; •
The process of averaging involving fuzzy triangular and trapezoidal numbers
presented here is a hybrid or cross section of classical statistics and fuzzy sets theory;
it belongs to a new branch of science - fuzzy statistics.
7.4.2.3.4 Defuzzification of fuzzy average
The aggregation defined by a triangular or trapezoidal average number obtained using
Equation (10) or (12) very often has to be expressed by a crisp value which best
represents the corresponding average. This operation is called defuzzification and is
demonstrated in Figure 7.3.
Triangular Fuzzy Aggregation Maximizing or .. average value trapezoidal numbers
Figure 7.3. The process of defuzzification of fuzzy average.
First consider the defuzzification of AOl'e = (m), mM , m2 ) given in Equation (9). It
looks plausible to select for that purpose the value mM in the supporting interval
[m m ] of A • m has the highest degree (one) of membership in Aave' In other \' 2 ave , M
words, Aove attains its maximum at mM , which is called maximizing value.
Xmax = mM (13)
However, the operation defuzzification cannot be defined uniquely. In another word,
there are various ways of defuzzification as proposed and adopted by different
144

researchers. Three options are presented for defuzzifying A = (m m m) which ave I'M' 2'
are essentially statistical average formulas:
(2) (2) =m1 +2mM +m2 xmax
4 (14)
Equation (14) takes into consideration the contribution of m1
and m2
but gives
different weight to mM only.
If the triangular number Aave is close to a central triangular number meaning that mM
is almost the middle of [ml' m2 ], then Equation (13) gives a good crisp
value xmax = mM • Then the three average formulas (1) to (3) in Equation (14) also
produce numbers (maximizing values) close to mM • Usually in applications the
triangular average numbers appear to be in central form. However, the experts dealing
with a given situation have to use their judgment when selecting a maximizing value.
The defuzzification procedure is presented as a block diagram shown in Figure 7.3.
For the defuzzification of A;e =(m~,m~,m:), Equations (13) and (14) remain valid
provided that m~, m~ and m: are substituted for m1, mM and m2 correspondingly.
performed by an extension of Equations (13) and (14) using instead of mAl the
midpoint of the flat segment mMI and mMz . The maximizing values are given as
follows:
Xmax = mM +mM I 2 (15)
2
and
145

(16)
For the defuzzification of A;e = (mt, m~, m~2' m; ), Equations (15) and (16) hold but
7.5 A Safety Model - A Framework for Modelling Fire Safety using
Approximate Reasoning and Fuzzy Averaging Method
A generic framework for modelling system safety using approximate reasoning and
fuzzy averaging approaches is suggested and depicted in Figure 7.4. It is a convenient
method for carrying out subjective assessment, therefore, it may provide a logical
solution as it emulates the human reasoning process through synthesising human
expert judgements within a specific domain of knowledge, codes and standards based
on the guidelines and company policy using an approximate reasoning approach. In
addition, a fuzzy averaging method is used in the later stage of the framework to deal
with safety synthesis of the system (at system and sub-system levels) with complexity
involving multi-experts, in a hierarchical structure. It provides a powerful and flexible
platform for aggregation or amalgamation of experts' opinions or judgments.
The proposed framework for modelling system safety for risk analysis consists of five
major steps. The first three outline all the necessary steps required for safety
evaluation at the bottom level using an approximate reasoning approach. The fourth
one describes the step involved in synthesising the estimates thus obtained in the first
three steps, using a fuzzy averaging method to synthesise or amalgamate fire safety at
higher levels of an engine room. A fuzzy averaging method is used to deal with
146

hierarchical evaluation propagation issues without any loss of useful information. The
final step describes the ranking and interpretation of the results.
Anticipated causes/factors to fire of an engine room
IDENTIFICA TION
1 L -=====--1----------..- r - - - - --Input variables to represent the 1 Output/solution 1 1 identified causes to fire I ..... variable definition 1 1 _I 1 J - ------- ------
1- - - - - - - - - - - - -., Possibility distribution for each variable in any I
1 forms shown in Figure 7.2(a) -7.2(d) L _____________ I
=:l I ~
1--------- ., Select fuzzy reasoning/inference 1 1 mechanism
L _________ I
-----------------~ I Aggregate resultant judgments with respect to all input variables 1 1 for a particular cause L _________________ I
Create resultant safety estimate using approximate reasoning method
1
DEFI NITION
DEVEL OPMENT AFETY OF AS
MODE L
Normalise safety estimate ~
Assign relative importance of experts
Create resultant multi--expert safety synthesis using fuzzy averaging
approach
1 ------Calculate overall risk level ranking
index
-l Rank potential causes based on the
ranking index values
-Create resultant multi-
attribute safety synthesis
_/ .,
Multi-attribute-multi-expert safety synthesis
SYNT HESIS
RANKING INTERPRE
& TATION TS OF RESUL
Figure 7.4. A framework for modelling system safety using approximate reasoning
approach and fuzzy averaging method.
147

The five steps used in the framework are outlined as follows:
Step 1: Identification.
• Identify all the anticipated causes/factors to fire of an engine room In a
hierarchical manner.
Step 2: Definition.
• Define fuzzy input variables (i.e., failure rate, consequence severi(v. failure
consequence probability and control mechanism) to describe the potential
risk linguistically.
• Define fuzzy output/solution variables (i.e., safety estimates).
• Select the type/types of fuzzy membership function used to delineate each
input variable, and provide interpretation for each fuzzy set of each variable
(in any forms shown in Figure 7.2(a) - (d)).
Step 3: Development of a safety model.
• Aggregate resultant judgments with respect to all input variables for a
particular cause to technical failure.
• Create resultant safety estimate using fuzzy averaging method.
• Normalise safety estimates.
• Assign relative importance of each expert.
Step 4: Safety synthesis.
• Perform multi-expert safety synthesis in a hierarchy using fuzzy averaging
method.
• Perform multi-attribute safety synthesis using fuzzy averaging method.
It is worth noting that in this step, in order to achieve a more effective and logical
evaluation process, it is necessary to break down a complex system into simpler sub
systems and components in a hierarchical manner. The hierarchical framework of
attributes or experts is used to guide the overall evaluation of multi-attributes or multi
experts or a combination of multi-attributes-multi-experts problems.
148

Step 5: Ranking and interpretation of results.
• • •
Calculate overall risk level ranking index.
Rank potential causes based on their ranking index values.
Alternatively perform multi-attribute-multi-expert safety synthesis.
In fire risk study of a ship engine room, in many cases, subjective assessment (using
linguistic variables instead of ultimate numbers in probabilistic terms) may be more
appropriate to conduct analysis on the four parameters (failure rate, consequence
severity, failure consequence probability and control mechanism) as they are always
associated with great uncertainty, especially for an engine room with a high level of
innovation.
Safety estimate is the only output fuzzy variable used in this study to produce safety
evaluation for each cause to a technical failure at the bottom level of a hierarchical
system. This variable is also described linguistically. In safety assessment, it is
common to express a safety level by degrees to which it belongs to such linguistic
variables as ''poor'', ''fair'', "average", and "good" that are referred to as safety
expressions. The output set can be defined using fuzzy safety estimate sets in the same
way as the fuzzy inputs.
Seven levels of linguistic variables may be used for failure rate; five levels for
consequence severity, seven levels for failure consequence probability, four levels
for control mechanism and four levels for safety estimates. The literature search
indicates that four to seven levels of linguistic variables are commonly used to
represents risk factors in risk analysis [Bell & Badiru, 1996] [Sii, et aI., 2001 c]
[Wang, et aI., 1995, 1996] [Wang, 1997].
It is possible to have some flexibility in the definition of membership functions to suit
different situations. The application of categorical judgements has been quite positive
in several practical situations [Schmucker, 1984]. It is also usually common and
convenient for safety analysts to use categories to articulate safety information.
149

When describingfailure rate, consequence severity,failure consequence probability,
control mechanism and safety estimate, a linguistic variable may then be assigned
with a membership function to a set of categories with regard to the particular
condition. The typical linguistic variables for failure rate, consequence severity,
failure consequence probability, control mechanism and the safety estimate of a
particular cause to a technical failure by an expert, or by a panel of experts may be
defined and characterised as follows:
Failure rate describes the failure frequency in a certain time, which directly
represents the number of failures anticipated during the design life span of a particular
system or an item. Table 7.1 describes the range of the frequencies of the failure
occurrence and defines the fuzzy set offailure rate. To estimate the failure rate, one
may choose to use such linguistic variables as "very low", "low", "reasonably low",
"average", "reasonably frequent ", "frequent" and "highly frequent". The failure rate
of this study is defined on the basis of the recorded fires from the NK investigation of
accidents related to engine room fire. Figure 7.5 shows the fuzzy failure rate set
definition.
1.0
o
V. low
2
Low R.low R.freq Freq H.freq
4 6 8 10
Failure rate
Figure 7.5. Fuzzy failure rate set definition.
150

Table 7.1. Failure rate.
Rank Failure rate Meaning (general interpretation) Failure rate (1 /25years)
(interpretation in the context of
engine room fire).
1,2,2.5 Very low Failure is unlikely but possible during <1
lifetime.
3.5 Low Likely to happen twice during lifetime. 2
4.5 Reasonably Between low and average. 5
low
5.5 Average Occasional failure. <10
6.5 Reasonably Likely to occur from time to time. <20
frequent
7.5 Frequent Repeated failure. <29
8.5,9,10 Highly Failure is almost inevitable or likely to >30
frequent exist repeatedly.
Consequence severity describes the magnitude of possible consequences, which is
ranked according to the severity of the failure effects. One may choose to use such
linguistic variables as "negligible", "marginal", "moderate", "critical" and
"catastrophic". The fuzzy consequence severity set definition is shown in Figure 7.6.
Negligible Marginal Moderate Critical Catastrophic
1.0
o 2 4 6 8 10
Consequence severity
Figure 7.6. Fuzzy consequence severity set definition.
Table 7.2 shows the criteria used to rank the consequence severity of fire effects.
151

Table 7.2. Consequence severity.
Rank Consequence Meaning (generic interpretation in the context of engine room
severity fire ).
I Negligible At most an unscheduled maintenance required (service and
operations can continue).
2,3 Marginal Possible single or multiple minor system damage. Operations
interrupted slightly, and resumed to its normal operational mode
within a short period of time (say less than 2 hours).
4,5,6 Moderate Possible moderate system damage. Operations and production
interrupted marginally, and resumed to its normal operational mode
within a certain period oftime (say no more than 4 hours).
7,8 Critical Possible major system damage.
9,10 Catastrophic Possible system loss.
The fuzzy failure consequence probability set definition is depicted in Figure 7.7 and
the criteria used to describe the failure consequence probability are shown in Table
7.3.
1.0
H. unlikely
o
Unlikely
2
Likely
R. unlikely
4
R. likely
6
Failure consequence probability
H. likely
Definite
8 10
Figure 7.7. Fuzzy failure consequence probability set definition.
152

Table 7.3. Failure consequence probability. Rank Failure Meaning
consequence
probability
1 Highly unlikely The occurrence likelihood of possible consequences is highly unlikely
given the occurrence of the failure event (extremely unlikely to exist on
the system or during operations).
2,3 Unlikely The occurrence likelihood of possible consequences is unlikely but
possible given that the failure event happens (improbable to exist even on
rare occasions on the system or during operations).
4 Reasonably The occurrence likelihood of possible consequences is reasonably unlikely
unlikely given the occurrence of the failure event (likely to exist on rare occasions
on the system or during operations).
5 Likely It is likely that consequences happen given that the failure event occurs (a
programme is not likely to detect a potential design or an operational
procedural weakness).
6,7 Reasonably It is reasonably likely that possible consequences occur given the
likely occurrence of the failure event (i.e. from time to time on the system or
during operations, possibly caused by a potential design or operational
procedural weakness).
8 Highly likely It is highly likely that possible consequences occur given the occurrence of
the failure event (i.e. often exist somewhere on the system or during
operations due to a highly likely potential hazardous situation or a design
and/or operational procedural drawback).
9,10 Definite Possible consequences happen given the occurrence of a failure event.
Figure 7.8 and Table 7.4 illustrate the criteria used to describe the level of control
mechanism (or availability of defence) in the design. The availability of control
mechanism refers to Table 7.4, for the scale of its readiness with availability of
mitigation measures. This is obviously an essential parameter to be considered in
system safety assessment, especially at the early design stage. The level of control is
described in linguistic terms such as "full control", "immediate control", "delayed
control" and "no control". For example, "full control" provides a linguistic
delineation that the failure or hazardous event can be detected at time of occurrence,
both preventive and mitigation measures are available, or control measurement
available and effective, or control not required as impact is very low. "Immediate
control" on the other hand indicates that the system cannot detect the failure or
IS3

hazardous event at time of occurrence but preventive measure is available, or it can be
detected at time of occurrence and mitigation measure is not available, or moderate
control measure is available, however it is not an infallible system.
1.0
Rank
1,2
3,4,5
6,7,8
9, 10
Full control
o 2
Immediate control
4 6
Control mechanism
Delayed control
8
No control
10
Figure 7.8. Fuzzy control mechanism set definition.
Table 7.4. Control mechanism.
Control Meaning
Mechanism
Full control Fire can be detected at time of its occurrence, both preventive and
mitigation measures are available, or control measure is available and
effective, or control is not required as impact is very low.
Immediate Fire cannot be detected at time of its occurrence but preventive
control measure is available, or fire can be detected at time of its occurrence
and mitigation measure is available, or moderate control measure is
available although not infallible.
Delayed control Fire can be detected only after its occurrence and mitigation measure is
available, or slight control measurement is available although not
effective.
No control Fire cannot be detected and no mitigation measure is available, or
control measure is not available even impact is not low.
With reference to the above fuzzy descriptions of/aUure rille, consequence severity,
/aUure consequence probability and control measure, it may be observed that the
linguistic variables are not exclusive, as there are intersections among the defined
linguistic variables. Inclusive expressions may make it more convenient for the safety
154

analyst to judge a safety level. Overlapping functions are used to represent various
linguistic variables because the experts and the literature concurred that in the analysis
of the risks associated with a failure event/mode, the risk levels may have "gray" or
ill-defined boundaries [Bell & Badiru, 1996].
Several sources such as historical records, operator's experience, statistical data,
expert judgment, etc. can be used to carry out the judgment based on fuzzy
descriptions. These approaches are mutually supporting each other and a combination
of them is often the most effective way to determine the judgement. In the statistical
data and information analysis the fuzzy descriptions may be derived based on
statistical studies of the information in previous incident and accident reports or
database systems. In-depth literature search may also be helpful. Skilled human
analysts often have a good, intuitive knowledge of the behaviour of a system and the
risks involved in various types of failures without having any quantitative model in
mind. Fuzzy descriptions provide a natural platform for abstracting information based
on expert judgements and engineering knowledge since they are expressed in a
linguistic form rather than numerical variables. Therefore, experts often find fuzzy
descriptions to be a convenient way to express their knowledge of a situation
[Zimmermann, 1991].
The importance of approximate reasoning stems from the fact that human expert
judgements and engineering knowledge can often be represented in the form of fuzzy
descriptions. Fuzzy descriptions based on these types of linguistic variables may be
more natural and expressive than numerical numbers and criticality calculations. It is
clear that such fuzzy descriptions can accommodate quantitative data such as failure
rate, failure consequence probability and qualitative and judgmental data such as the
consequence severity, control mechanism. The estimates can then be combined in
safety evaluation.
The criteria of selecting fuzzy reasoning/inference mechanisms are always subjective
issues and mainly based on user's preference. For the normal IF-THEN fuzzy rule
inference, the general approach adopted is similar to that used in fuzzy expert and
fuzzy control systems. However, in this chapter, a simplified fuzzy averaging method
is introduced to perform approximate reasoning and synthesis.
155

The first module of fuzzy inference operation is to take the inputs and determine the
degree to which they belong to each of the appropriate fuzzy sets via membership
functions. Inputs can be represented by one of the following membership functions to
suit the conditions under study:
• A single deterministic value.
• A closed interval defined.
• A triangular distribution.
• A trapezoidal distribution.
It is highly unlikely for selected experts to have the same importance, and weights of
importance need to be utilised. The assessment of weight for each expert is an
important decision for the analyst to make in view of the safety of the system under
scrutiny. Each expert is assigned with a weight to indicate the relative importance of
his or her judgment in contributing towards the overall safety evaluation process. The
analyst must decide which experts are more authoritative. Weights are then assigned
accordingly.
The fuzzy averaging method is used to perform safety synthesis at different levels
(component, sub-system and system levels) of an engine room with a structure that is
capable of being decomposed into hierarchy of levels. The number of levels required
in safety synthesis is solely decided by the degree of complexity of a system under
scrutiny.
The modelling framework of multi-attributes or multi-experts or a combination of
both based on fuzzy averaging method has been developed to deal with such problems
having a hierarchical structure of both qualitative and quantitative criteria with
uncertainty. The fuzzy averaging method is different from most conventional Multiple
Attribute Decision-Making (MADM) methods. Firstly, it employs a belief structure to
represent an assessment as a distribution instead of a single numerical score.
Secondly, it aggregates degrees of belief rather than scores. In this way, the fuzzy
averaging approach can preserve the qualitative feature of subjective criteria in the
156

process of criteria aggregation. The fuzzy averaging IS a convenient method to
aggregate or combine experts' opinions in producing a conclusion. It is a suitable tool
for aggregation in qualitative safety or risk-based decision-support models.
The first three steps of the framework mainly focus on safety assessment of a single
component of a particular sub-system. Step 4 is concerned with safety synthesis of a
system at various levels such as:
• Multi-attribute safety synthesis of a sub-system due to a technical failure caused
by various components done by an expert using an aggregation method - fuzzy
averaging methods.
• Safety synthesis of a system due to a technical failure caused by various sub
systems done by an expert using any other aggregation methods.
The final step of the framework describes the calculation of overall risk level ranking
index. Then the identified potential causes are ranked on the basis of their ranking
index values.
To calculate risk ranking index values associated with various causes to technical
failure, it is required to describe the four safety expressions, i.e., {good, average, fair,
poor} using numerical values. The numerical values associated with the defined safety
expressions can be designated by experts. Suppose K j , K2, K3, K4 represent the
unscaled numerical values associated with 'good', 'average', 'fair', 'poor',
respectively. Then K j , K2, K3, K4 can be represented as follows:
(17)
The safety estimate of cause i to technical failure can be obtained using the framework
described in this subsection as follows:
Safety Synthesis, = {,u,' "good", ,u,2 "average ", ,u,3 'yair", ,u,4 "poor"} (18)
157

The risk ranking index value R; associated with cause i to technical failure can be
defined as follows:
4
R, = I J-L; x K J , i = 1,2, ..... d , where d is the number of causes to technical failure. 1=1
(19)
Obviously, the R; values obtained using the above formula can only show the relative
risk level among all potential causes identified under study. The smallest R; is ranked
first as it deserves more attention to reduce its potential risk to As Low As Reasonably
Practicable (ALARP). The largest R; is ranked last to draw least attention and
minimum effort for risk reduction measure consideration. A smaller R; means that
cause i of a sub-system is having relatively higher risk level and deserves more
attention at the early design stages or the early stages of designing operational
strategies. The ranking for each potential cause is then produced.
7.6 Case Study: Fire Risk Analysis of Ship Engine Room
In this section, a preliminary safety assessment is carried out on fire risk introduced
by the malfunction of individual components associated with various sub-systems of a
generic engine room. Only hardware failure caused risk is assessed here, though
operational failure has been also recognised as one of the major causes of fire. In this
case study, at the preliminary design stage there is only one expert taking part in the
safety assessment. For the purpose of safety modelling, it is assumed that each input
parameter (Le., failure rate, consequence severity, failure consequence probability
and control mechanism) will be fed into the proposed safety model in terms of fuzzy
membership functions in anyone of the four forms as described in Figure 7.2 (a) -
(d).
The selection of forms of membership function by an expert is dependent upon
subjective judgment made pertaining to the level of ambiguity and uncertainty
associated with the case as perceived by the expert, as well as his experience
knowledge and understanding of the said system. The various forms of fuzzy
membership function are capable of describing both "calculated risk" (i.e., those
aspects with minimum uncertainty) and "uncertainty".
158

The safety critical elements were considered for an engine room. The generic engine
room shown in Figure 7.1 is chosen as the system to be assessed by using the
suggested framework. They consist of the following four main sub-systems:
1. Fuel Oil (FO).
2. Leakage Oil (LO).
3. Electrical Equipments (EE).
4. Turbo Charger (TIC) of Main Engine (M/E).
The expert judgment made on the four input parameters (i.e., failure rate,
consequence severity, failure consequence probability and control mechanism)
using different forms of membership functions for representing technical failures
associated with each sub-system is shown in Table 7.5 (a)-(d).
Table 7.5 (a) shows the assignment of membership functions and the result of risk
analysis for components associated with sub-system # 1 - FO and it is noted that only
7 major components are considered here. Table 7.5 (b) - (d) demonstrates the
assignment of membership functions and the results for sub-systems #2, 3 and 4 (i.e,
LO, Electrical Equipment and TIC of MIE). 6 components are considered for sub
system #2 - LO, 6 components assessed for sub-system #3 - Electrical Equipment,
only 1 component for sub-system #4 - TIC ofM/E.
The safety estimate for each component is computed by using fuzzy averaging
method. Before the actual computation can be performed, each form of membership
function has to be transformed into a trapezoidal membership function. For example,
for component 1.1 of sub-system # 1, the expert used the triangular membership
function to describe the 4 input variables. The details are listed as follows:
Component 1.1 - MIE FO piping
4 input variables are originally described In the form of triangular membership
function by the expert:
159
Failure rate = (6, 6.5, 7)
Consequence severity = (8, 9, 9.5)
Failure consequence probability = (7.5, 8, 8.25)
Control mechanism = (0.5,2,2.75)
After the transformation, the 4 input variables appear in the form of trapezoidal
membership function:
Failure rate = (6, 6.5, 6.5, 7)
Consequence severity = (8, 9, 9, 9.5)
Failure consequence probability = (7.5, 8, 8, 8.25)
Control mechanism = (0.5,2,2,2.75)
Applying the fuzzy averaging method, the safety estimate (Equation (11» is obtained
as:
S c.' { 6 + 8 + 7.5 + 0.5 alety estimate 1.1 = 4 =5.50 "Good";6.38 "Average";6.38 "Fair";6.81
"Poor"}
According to the framework found in Figure 7.4, the fuzzy averaging method is used
to synthesise the information thus produced to assess the safety of the whole system.
This step is concerned with safety synthesis of a system at various configurations such
as:
• Multi-attribute safety synthesis at the component level - The synthesis of the
four input variables to obtain the safety estimate of each component of each
subsystem.
• Multi-attribute safety synthesis at the subsystem level - The synthesis of safety
estimates of the components of the sub-systems of a generic engine room due to
the fire failure estimated by an expert (Figures 7.4, 7.9 & 7.11).
160

• Multi-attribute safety synthesis at the system level - The synthesis of safety
estimates of various subsystems of a generic engine room (Figures 7.4, 7.1 0 &
7.11).
Table 7.5 (a). Risk analysis for components associated with sub-system #1 - FO
(raw data).
Component! Failure Consequence Failure Control Safety
Activity Rate Severity Consequence Measure Estimate
Probability (Good,A verage,
Fair,Poor)
1.1 MIE FO (6,6.5, 7) (8,9,9.25) (7.5, 8, 8.25) (0.5,2,2.75) 5.50,6.38,
piping 6.38,6.81
1.2 OlE FO (5.25, 7.5, 9) (6,8.5, 10) (7.5,8,8.5) (0.25, 1, 1.5) 4.75,6.25,
piping 6.25,7.25
1.3 Boiler FO {5, 5.75,6, {6, 6.5, 8, {7, 7.75, 8, 9} { 1.5, 1.8, 2.1, 4.88,5.45,
piping 7.25} 8.25} 3} 6.03,6.88
1.4 FO tank [2,4] [7.5,8.5] [7, 7.5] [1, 1.7] 4.38,4.38,
5.43,5.43
1.5 FO tank [1.5,2.5] [5, 7] [6,8] [1.5, 1.8] 3.50,3.50,
sounding pipe 4.83,4.83
1.6 OlE (3,3.5,4) (7, 8,9) (6, 7.5, 8) (1.25 1.5, 1.75) 4.31,5.13,
damage 5.13,5.69
1.7 Diesel oil {I, 1.5,2, {5, 7, 8, 8.5} {5.s, 6, 7, {0.25,0.5, 2.94,3.75,
purifier 2.5} 7.5} 0.75, I} 4.38,4.88
Table 7 .5 (b). Risk analysis for components associated with sub-system #2 - LO
(raw data).
Component! Failure Consequence Failure Control Safety
Activity Rate Severity Consequence Measure Estimate
Probability (Good,Average,
Fair,Poor)
2.1 MIE LO (4.5,5, 7) (6, 7, 8.5) (7,8.5,9) (1,2.5,3) 4.63,5.75,
piping 5.75,6.88
2.2M1ELO (0.75, 1.25,2) (5.05,6, 7.75) (6.25, 8, 8.5) (3.05, 4, 4.5) 3.78,4.81,
strainer 4.81,5.69
2.3GIELO [2,3] [6.5,8.5] [7,7.5] [1.25, 1.75] 4.19,4.19,
piping 5.19,5.19
2.4LO {I, 1.5,2, 2.5} {6, 7, 8, 8.5} {6, 6.5, 8, 8.5} {0.5,O.75, I, 338,3.94,
161

tanking For 1.25} 4.75,5.19 TIIC ofMIE
2.5 Strainer (2.5,3,5) (4.5,5,6) (4.5,5.5,6) (1, 1.5,3) 3.13,3.75, for TIC of 3.75,5.00 MIE
2.6LO [1, 1.5] [5, 7] [6,6.75] [1.5, 1.75] 3.38,3.38, strainer For 4.25,4.25
GIE
Table 7.5 ( c). Risk analysis for components associated with sub-system #3 - Electrical
Equipment (raw data).
Component! Failure Consequence Failure Control Safety
Activity Rate Severity Consequence Measure Estimate
Probability (Good,A verage,
Fair,Poor)
3.1 Main (4.5,5,9) (6, 7, 7.25) (7, 8,9) (1.25, 1.5, 4.69,5.38,
switchboard 1.8) 5.38,6.76
3.2 Starter (4,5.5, 7) (5.12,6,6.5) (7.08, 7.5, 9) (1.1, 2.75, 4.33,5.44,
panels 3.5) 5.44,6.50
3.3 Generator [4,5] [7.5,8] [2,5] [1, 1.5] 3.63,3.63,
4.88,4.88
3.4 Motor {2, 3,4, 4.25} {5, 6, 6.5, {7.5, 7.75, {4, 4.12, 5, 4.63,5.22,
6.75} 8.25,9} 5.75} 5.94,6.44
3.5 (2,2.5,3) (4,6,8) (2,4,4.75) (1,2.5,2.75) 2.25,3.75,
Transformer 3.75,4.63
3.6 Electric {O.I, 2, 3, {2, 2.5,3, 6} {5, 6.5, 7, 7.5} {0.5, 0.75, 1, 1.90,2.94,
heater 3.5} 2} 3.50,4.75
Table 7.5 (d). Risk analysis for components associated with sub-system #4 - TIC of
MIE (raw data).
Component! Failure Consequence Failure Control Safety
Activity Rate Severity Consequence Measure Estimate
Probability (Good,Averale,
Falr,Poor)
4.1 TIC of (6, 7, 8) (7, 8.S, 9.S) (6, 6.2S, 6.7S) (2, 2.S, 3) S.2S, 6.06,
MIE 6.06,6.81
162
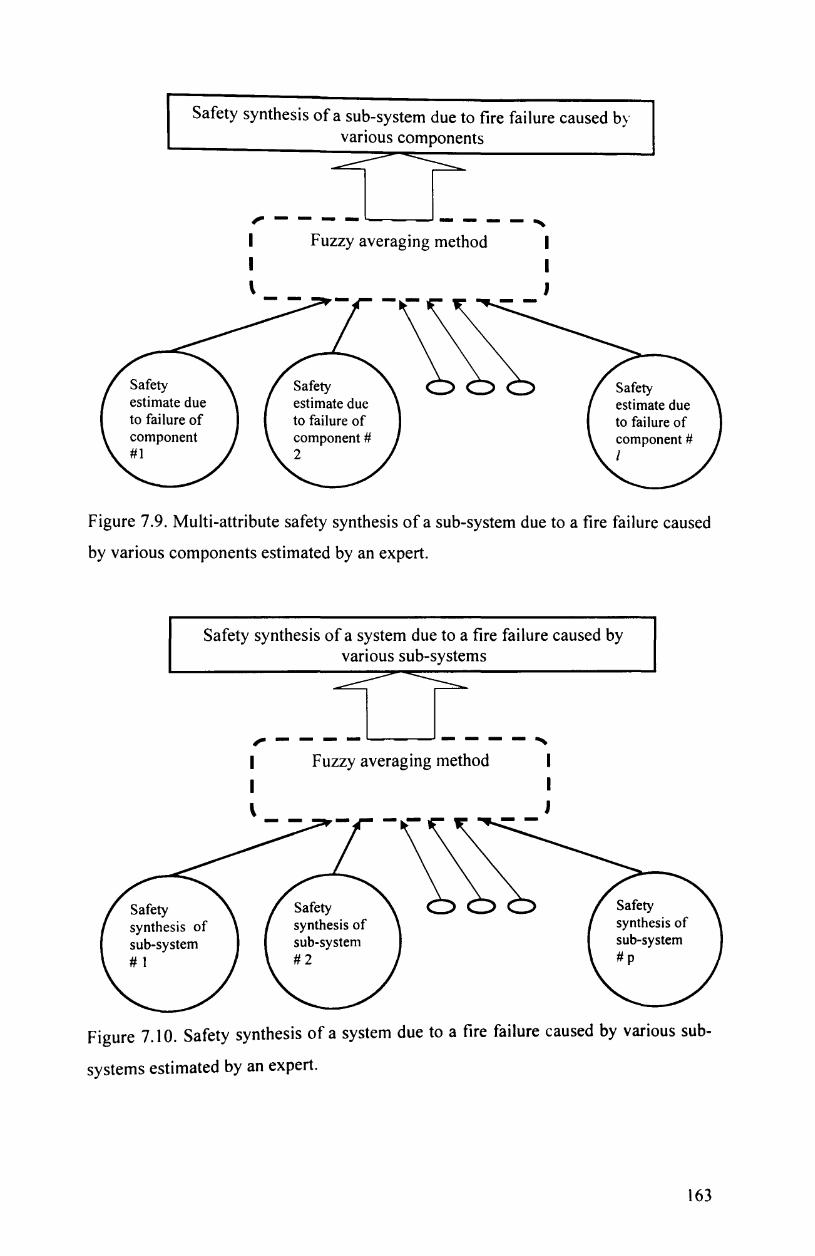
Safety
Safety synthesis of a sub-system due to fire failure caused by various components
I \
- - -'-~-"'- --Fuzzy averaging method
Safety
J
Safety estimate due estimate due estimate due to failure of to failure of to failure of component component # component # #1 2 I
Figure 7.9. Multi-attribute safety synthesis of a sub-system due to a fire failure caused
by various components estimated by an expert.
Safety synthesis of a system due to a fire failure caused by various sub-systems
Safety synthesis of sub-system # 1
I \
___ L-~_"' __ _
Fuzzy averaging method
Safety synthesis of sub-system #2
I J
Safety synthesis of sub-system #p
Figure 7.10. Safety synthesis of a system due to a fire failure caused by various sub
systems estimated by an expert.
163

FO LO
An Engine Room
TIC of MIE
System level
Electrical Equipment
Sub-system level
Component level
Figure 7.11. A generic hierarchical structure of an engine room.
7.6.1 Risk modelling at the component level
Upon normalization, the safety estimate for each component associated with each sub
system is shown in Table 7.6 (a) - (d). For example, the safety estimate for
component 1.1 - MIE FO piping is:
Safety estimate 1 1 = { 5.50 0.219 "Good";0.254 "Average";0.254 . 5.50+6.38+6.38+6.81
"Fair";0.273 "Poor"}
164

Table 7.6 (a). Risk analysis for components associated with sub-system #1 - FO
[converted all membership functions into trapezoidal and normalised].
Componentl Failure Consequence Failure Control Safety ! Activity Rate Severity Consequence Measure Estimate
Probability (Good,A verage, Fair,Poor)
1.1 M/E FO {6, 6.5, 6.5, {8, 9, 9, 9.25} {7.5, 8, 8, {0.5, 2, 2, 0.219,0.254, piping 7} 8.25} 2.75} 0.254,0.273 1.2 OlE FO {5.25,7.5, {6, 8.5, 8.5, {7.5, 8, 8, 8.5} {0.25, 1, 1, 0.194,0.255, piping 7.5,9} 10} 1.5} 0.255.0.296 1.3 Boiler FO {5, 5.75,6, {6, 6.5, 8, {7, 7.75, 8, 9} {1.5, 1.8, 2.1, 0.209, 0.235, piping 7.25} 8.25} 3} 0.259,0.296 1.4 FO tank {2,2,4,4} {7.5, 7.5, 8.5, {7, 7, 7.5, 7.5} {I, 1, 1.7, 0.223,0.223,
8.5} 1.7} 0.277,0.277 1.5 FO tank {1.5, 1.5, 2.5, {5, 5, 7, 7} {6,6,8,8} {1.5, 1.5, 1.8, 0.210,0.210, sounding pipe 2.5} 1.8} 0.290 0.290 1.6 OlE {3, 3.5, 3.5, {7,8,8,9} {6, 7.5, 7.5, 8} {1.25, 1.5, 0.213,0.253, damage 4} 1.5,1.75} 0.253, 0.281 1.7 Diesel oil {I, 1.5,2, {5, 7, 8, 8.5} {5.5, 6, 7, 7.5} {0.25,0.5, 0.184,0.235, Purifier 2.5} 0.75, I} 0.275, 0.306
Table 7.6 (b). Risk analysis for components associated with sub-system #2 - LO
[converted all membership functions into trapezoidal and normalised].
Component! Failure Consequence Failure Control Safety Activity Rate Severity Consequence Measure Estimate
Probability (Good,A verage, Fair,Poor)
2.1 MlE LO {4.5, 5, 5, 7} {6, 7, 7, 8.5} {7, 8.5,8.5, 9} {I, 2.5, 2.5, 0.201,0.249,
piping 3} 0.249,0.299
2.2 M/E LO {0.75, 1.25, {5.05, 6, 6, {6.25, 8, 8, {3.05, 4, 4, 0.198,0.252,
strainer 1.25,2} 7.75} 8.5} 4.5} 0.252, 0.298
2.3 OlE LO {2,2,3,3} {6.5, 6.5, 8.5, {7, 7, 7.5, 7.5} {1.25, 1.25, 0.223,0.223,
piping 8.5} 1.75,1.75} 0.277,0.277
2.4LO {1,1.5,2, {6, 7,8, 8.5} {6, 6.5, 8, 8.5} {0.5, 0.75, 1, 0.196,0.228,
tanking For 2.5} 1.25} 0.275,0.301
TIIC ofMIE 2.5 Strainer {2.5, 3, 3, 5} {4.5, 5, 5, 6} {4.5, 5.5, 5.5, {1, 1.5, 1.5, 0.200, 0.239,
for TIC of 6} 3} 0.239,0.319
M/E 2.6 LO {I, 1, 1.5, {5, 5, 7, 7} {6, 6, 6.75, {1.5, 1.5, 0.221,0.221,
strainer For 1.5} 6.75} 1.75, 1.75} 0.279, 0.279
OlE
165

Table 7.6 (c). Risk analysis for components associated with sub-system #3 - Electrical
Equipment [converted all membership functions into trapezoidal and
normalised].
Component! Failure Consequence Failure Control Safety
Activity Rate Severity Consequence Measure Estimate
Probability (Good,A verage,
Fair,Poor)
3.1 Main {4.5, 5, 5, 9} {6, 7, 7, 7.25} {7, 8, 8, 9} {1.25, 1.5, 0.211,0.242,
switchboard 1.5, 1.8} 0.242, 0.304
3.2 Starter {4, 5.5, 5.5, {5.12, 6, 6, {7.08,7.5, {1.1,2.75, 0.199,0.251,
panels 7} 6.5} 7.5,9} 2.75,3.5} 0.251,0.299
3.3 Generator {4, 4, 5, 5} {7.5, 7.5, 8, 8} {2, 2, 5, 5} {I, 1, 1.5, 0.213,0.213,
1.5} 0.287,0.287
3.4 Motor {2, 3, 4, 4.25} {5, 6, 6.5, {7.5,7.75, {4, 4.12, 5, 0.208, 0.235,
6.75} 8.25,9} 5.75} 0.267,0.289
3.5 {2, 2.5, 2.5, {4, 6, 6, 8} {2, 4,4, 4.75} {I, 2.5, 2.5, 0.156,0.261,
Transformer 3} 2.75} 0.261,0.322
3.6 Electric {0.1, 2, 3, {2, 2.5, 3, 6} {5, 6.5, 7, 7.5} {0.5, 0.75, 1, 0.145,0.224,
heater 3.5} 2} 0.267,0.363
Table 7.6 (d). Risk analysis for components associated with sub-system #4 - TIC of
MIE [converted all membership functions into trapezoidal and
normalised] .
Component! Failure Consequence Failure Control Safety
Activity Rate Severity Consequence Measure Estimate
Probability (Good,Average,
Fair,Poor)
4.1 TIC of {6, 7, 7, 8} {7, 8.5, 8.5, {6, 6.25, 6.25, {2, 2.5, 2.5, 3} 0.217,0.251,
MIE 9.5} 6.75} 0.251,0.281
7.6.2 Multi-attributes safety synthesis
Table 7.7 shows the results of multi-attributes safety synthesis (at the sub-system
level) on technical fire risk of an engine room due to the FO, LO, Electrical
166

Equipment and TIC of M/E caused fire using the fuzzy averaging method. The
synthesis is carried out without considering the relative weight of each sub
system/component, that is, using unity of weight.
Sub-system #1 - FO
Number of components = 7
Safety estimate (FO) = {0.219+0.194+0.209+0.223+0.210+0.213+0.184 = 0.207 7
"Good";0.238 "Average";0.266 "Fair";0.289 "Poor"}
Sub-system #2 - LO
Number of components = 6
Safety estimate (LO) = {0.207 "Good";0.235 "Average";0.262 "Fair";0.296 "Poor"}
Sub-system #3 - Electrical Equipment
Number of components = 6
Safety estimate (EE) = {0.189 "Good";0.238 "Average";0.263 "Fair";0.31 0 "Poor"}
Sub-system #4 - TIC ofMIE
Number of components = 1
S i.':' = {0.217 "Good···.0.251 ·'Average",·0.251 "Fair·'·,0.281 alety estImate (TIC of M1E)
"Poor"}
The safety synthesis of the whole system is derived using the fuzzy averaging method
as follows:
167

Safety synthesis of the whole system (i.e., the engine room) =
0.207 + 0.207 + 0.189 + 0.217 { 4 =0.205, "good"; 0.241, "average"; 0.261, "fair"; 0.293,
"poor"}
Table 7.7. Multi-attribute safety synthesis on fire risk of FO, LO, Electrical
Equipment and TIC ofM/E.
Safety Expressions
Sub-system Good Average Fair Poor
FO 0.207 0.238 0.266 0.289
LO 0.207 0.235 0.262 0.296
Electrical 0.189 0.238 0.263 0.310
Equipment
TIC ofMIE 0.217 0.251 0.251 0.281
Whole system 0.205 0.241 0.261 0.293
7.6.3 Safety synthesis of the system based on its sub-systems carrying different
weights
The above evaluation is based on the assumption that each sub-system is of equal
importance according to the opinions gathered from the expert. In practical
applications, the subsystems may carry different weights in safety synthesis. The
assignment of ranking scale in weight for each sub-system can be suggested by an
expert based on his or her engineering judgment and past experience. This is to reflect
his or her risk perception towards each sub-system. Suppose the four sub-systems are
evaluated differently by their peers on a scale in weight from 0 to 10 as follows:
r] = lOis given to sub - system] (sub-system #1, i.e., FO) in weight; r2 = 4 to
sub - system2
(sub-system #2, i.e., LO); r3 = 3 to sub - system3 (sub-system #3, i.e.,
Electrical Equipment); r4 = 3 to sub - system4 (sub-system #4, i.e., TIC of M/E). The
weights OJ" i = 1,2,3,4, which express the relative importance of sub - system, ,
i = 1,2,3,4 can be calculated using the following equation:
168

rj ())I=--~--
10 10 ())I = 1 0 + 4 + 3 + 3 = 20 = 0.5
4 4 ())2 = 1 0 + 4 + 3 + 3 = 20 = 0.2
3 3 ())3 = 1 0 + 4 + 3 + 3 = 20 = 0.15
3 3 ())4 = =-=0.15
10+ 4+3+3 20
(20)
Substituting these values into the weighted trapezoidal average Equation (12) gives:
Safety synthesis (at system level)W = 0.5 {sal"ety estimate ( )} + ave ~t suh-system I
0.2 {safety estimatesuh_System(2)} + 0.15 {safety estimatesuh_System(3)} +
0.15 {safety estimate.wh_System(4)}
= {(0.5xO.207 + 0.2xO.207 + 0.15xO.189 + 0.15xO.217, "Good"); (0.5x0.238 +
0.2xO.235 + 0.15x0.238 + 0.15xO.251, "Average"); (0.5x0.266 + 0.2xO.262 +
0.15xO.263 + 0.15xO.251, "Fair"); (0.5xO.289 + 0.2xO.296 +0.15x0.310
+0.15xO.281 , "Poor")}
= {0.206, "Good"; 0.239, "Average"; 0.263, "Fair"; 0.292, "Poor"}
The safety synthesis derived based on the weighted fuzzy averaging method as shown
above has revealed that the safety estimate of the whole system can be interpreted as
20.6% "Good", 23.9% "Average", 26.3% "Fair" and 29.2% "Poor".
7.6.4 Ranking
The risk ranking for each sub-system based on the safety synthesis (Equation (17)
(18» obtained by using fuzzy averaging method is shown as follows:
R b (I) = 1x0207+08 x0238+0.6 xO.266+0.2 x0.289 = 0.615 SII -system . ..
R slIb-system(2) = 1 xO.2(r+0.8 xO.235+0.6 xO.262+0.2 xO.296 = 0.6/ /
169

R sub-system(3) = 1 xO.189+0.8 xO.238+0.6 xO.263+0.2xO.310 = 0.599
R sub-system(4) = 1 xO.217+0.8xO.251+0.6xO.251+0.2xO.281 = 0.625
Ranking = sub-system #4: sub-system #1: sub-system #2: sub-system #3.
or
Ranking = TIC ofM/E: FO: LO: EE.
The smallest R(3) EE is ranked first as it deserves more attention to reduce its potential
risk to As Low As Reasonably Practicable (ALARP). The largest R(4) TIC of MIE is
ranked last to draw least attention and minimum effort for risk reduction measure
consideration.
7.7 Conclusion
Performing the evaluation and fire risk assessment at this early stage will possibly
provide further action learning opportunities which pennit the design team to identify
any fundamental deficiencies in the outline design of the selected concept. Moreover,
this will enable the design team to explore and identify particular areas which have to
be targeted during the various phases of design to prevent the occurrence of hazardous
events such as fire or, if prevention is not possible, to detect events and control and
mitigate their effects. Implementation of changes is always easier and economical
before detailed design gets underway. The evaluation and assessment process can be
repeated to study the effectiveness of any safety improvements which might be made
subsequently.
The attempt in application of interval mathematics and possibility distribution such as
approximate reasoning (based on fuzzy logic) method is different from conventional
probability-based techniques which rely rather heavily on randomness and frequency
on engineering systems. The safety modelling framework proposed in this chapter
outlines and explains a philosophy for subjective safety modelling for fire risk
analysis using approximate reasoning and fuzzy averaging methods. Various fonns of
membership functions that could be used effectively in representing fuzzy linguistic
170

variables to qualify risk levels are discussed. The background of fuzzy averaging
approach is also outlined.
The proposed framework offers a great potential in safety assessment and decision
support of engineering systems, especially in the initial concept design stages of a
relatively novel system where the related safety information is scanty or with great
uncertainty involved or only linguistic-related information is available. Fire safety
assessment using approximate reasoning approaches can integrate domain human
experts' experience and safety engineering knowledge; at the same time information
of difference properties from various sources can be transformed to become the
knowledge base, used in the fuzzy logic inference process.
The modelling framework of multi-attributes or multi-experts or a combination of
both based on fuzzy averaging method has been developed to deal with problems
having a hierarchical structure of both qualitative and quantitative criteria with
uncertainty. The fuzzy averaging method is different from most conventional Multiple
Attribute Decision-Making methods and it is a convenient method to aggregate or
combine experts' opinions in producing a conclusion.
The results obtained from a case study on an engine room have demonstrated that
such a modelling framework provides fire safety analysts and designers with a
convenient tool that can be used in a ship's engine room fire risk analysis.
References
Bell, P. M. & Badiru, A. B. (1996), "Fuzzy Modelling and Analytic Hierarchy
Processing to Quantify Risk Levels Associated With Occupational Injuries - Part I:
The Development of Fuzzy-Linguistic Risk Levels", IEEE Transactions on Fuzzy
Systems, Vol 4, No 2, pp 124-131.
Foster, C. D. (1994). "Scientihic Investigation of Marine Shipping Fires and
Explosions". Fire Safety on Ships: Developments into the 21 st Century, Paper14.
IMAS94, London, UK, 26-27 May.
171
Hakkinen, P. (1997), "Fire Resistant Engine Room", Fire at Sea International
Conference, RINA, London, UK, November.
IMO (1997), "SOLAS-Consolidated Edition", London, UK.
Klir, J. G. & Yuan, B. (1995), "Fuzzy Sets and Fuzzy Logic, Theory and
Applications", Prentice-Hall.
NKK (1994), "Engine Room Fire - Guidance for Prevention", Nippon Kaiji Kyokai,
161 pages, Japan.
Schmucker, K. J. (1984), "Fuzzy Sets, Natural Language Computations, and Risk
Analysis", Computer Science Press.
Sii, H. S. (2000), "A Safety Model for Risk Analysis of Offshore Engineering
Products Using Approximate reasoning and Evidential Reasoning Approaches", A
Project Funded by EPSRC (GRlM24967) and HSE (D3727)", School of Engineering,
Liverpool John Moores University, 81 pages, UK, December.
Sii, H. S. & Wang, J. (2000), "A Subjective Design for Safety Framework for
Offshore Engineering Products", Workshops on Reliability and Risk Based Inspection
Planning and ESRA Technical Committee on Offshore Safety, Zurich, Switzerland,
14-15 December.
Sii, H. S., Ruxton, T. & Wang, J. (2001a), "A Fuzzy-Logic-Based Approach to
Qualitative Safety Modelling for Marine Systems", Reliability Engineering & System
Safety, Vol 73, No 1, pp 19-34.
Sii, H. S., Ruxton, T. & Wang, J. (2001b), "Novel Risk Assessment Techniques for
Maritime Safety Management System", International Journal of Quality & Reliability
Management, Vol 7, No 2, pp 118-125.
172

Sii, H. S., Wang, J. & Ruxton, T. (2001e), "A Fuzzy-Logie-Based Approach to
Subjective Safety Modelling for Maritime Products", Journal of the UK Safety &
Reliability Society, Vo121, No 2, pp 65-78.
Wang, J., Yang, J. B. & Sen, P. (1995), "Safety Analysis and Synthesis Using Fuzzy
Sets and Evidential Reasoning", Reliability Engineering & System Safety, Vol 47, No
2, pp 103-118.
Wang, J., Yang, J. B. & Sen, P. (1996), "Multi-Person and Multi-Attribute Design
Evaluations Using Evidential Reasoning Based on Subjective Cost Analysis",
Reliability Engineering & System Safety, Vol 52, No 2, pp 113-129.
Wang, J. (1997), "A Subjective Methodology for Safety Analysis of Safety
Requirements Specifications", IEEE Trans. Fuzzy Systems, Vol 5, No 3, pp 418-430.
Wang, J. & Ruxton, T. (1997), "Design for Safety", Journal of American Society of
Safety Engineers, pp 23-29, January.
Wang, J. (Edited) (2001), "Marine and Offshore Safety Assessment", Journal of the
UK Safety & Reliability Society, Vol 21, No 2.
Wang, L. X. (1997), "A Course in Fuzzy Systems and Control", Prentice-Hall, ISBN
o 13 540882 2.
Zimmermann, H. J. (1991), "Fuzzy Set Theory and Its Applications", Kluwer-Nijhoff
Publishing, Hingham, Mass, USA.
173

CHAPTER 8 - A DESIGN-DECISION SUPPORT FRAMEWORK
FOR EVALUATION OF DESIGN OPTIONS IN PASSENGER
SHIP ENGINE ROOM
Summary
Most real world design evaluation and risk-based decision support combine
quantitative and qualitative (linguistic) variables. Decision-making based on
conventional mathematics that combines qualitative and quantitative concepts always
exhibit difficulty in modelling actual problems. The successful selection process for
choosing a design/procurement proposal is based on a high degree of technical
integrity, safety levels and low costs in construction, corrective measures,
maintenance, operation, inspection and preventive measures. However, the objectives
of maximising the degree of technical performance, maximising the safety levels and
minimising the costs incurred are usually in conflict, and the evaluation of the
technical performance, safety and costs is always associated with uncertainties,
especially for a novel system at the initial concept design stage. In this chapter, a
design-decision support framework using a composite structure methodology
grounded in approximate reasoning approach and evidential reasoning method is
suggested for design evaluation of machinery space of a ship engine room at the initial
stages. It is a Multiple Attribute Decision-Making (MADM) or Multiple Criteria
Decision Making (MCDM) framework, which provides a juxtaposition of cost, safety
and technical performance of a system during evaluation to assist decision makers in
selecting the winning design/procurement proposal that best satisfies the requirement
in hand. An illustrative example is used to demonstrate the application of the proposed
framework.
8.1 Introduction
The purpose of safety based decision making is to take system safety as a design
criterion to produce the best design with both technical and economical constraints
being satisfied. MCDM techniques can then be employed to process the constructed
174

model to produce efficient design solutions. In many cases, however, it may be
difficult or even impossible to precisely determine the parameters of a probability
distribution for a given event due to lack of evidence or due to the inability of the
safety engineer to make firm assessments [Wang, et al.. 1996].
The objective of risk-based design assessments during the preliminary design stage of
a large engineering system such as a ship engine room is to provide safety-related
input in the process of designing and developing a feasibly acceptable system. The
concept design should comply with the mission requirements and commercial targets,
as well as technical qualities together with the requirements given by the regulatory
bodies. At the initial design stages, there is often inadequate data or imprecise
information available when carrying out safety assessments for the system. Therefore,
conventional approaches may not be capable of modelling safety, cost aspects and
technical adequacy for design and operation decision support effectively and
efficiently.
One of the mam limitations associated with conventional Probabilistic Risk
Assessment (PRA) methods is the utilisation of a probability measure to evaluate
uncertainty. Much effort is required in defining and establishing the probability
distribution for each contributing risk factor using historical data in estimating relative
frequencies [Sii & Wang, 2003].
Uncertainty can be broadly classified into three categories, namely fuzziness,
incompleteness and randomness [Blockley & Godfrey, 2001]. However, most analysts
take it for granted that uncertainty is a model associated with randomness. In the
appropriate circumstances, probability theory can be a powerful tool. However, many
times the type of uncertainty encountered in marine projects does not fit the axiomatic
basis of probability theory, simply because uncertainty in these projects is usually
caused by the inherent fuzziness of the parameter estimate rather than randomness.
Uncertainty involved in real world situations is often relating to the knowledge of
systems rather than depending on chance.
One feasible way to deal with uncertainty in terms of fuzziness and incompleteness in
design evaluation is to use fuzzy set theory. The use of fuzzy production rules in fuzzy
175

inference system, where the conditional part and/or the conclusions contain linguistic
variables, can handle these types of uncertainty well [Zimmerman, 1991]. This greatly
reduces the need for an expert or a safety analyst, to know the precise point at which a
risk factor exists. In this context, a safety model using approximate reasoning based
on fuzzy logic approach may be more appropriate to model the risks of the system
associated with incomplete safety information. Conventional approaches such as Fault
Tree Analysis (FTA) and Failure Mode, Effects and Criticality Analysis (FMEC A)
have been widely used, but often fall short in their ability to permit the incorporation
of subjective and/or vague terms as they rely heavily on supporting statistical
information that may not be available.
The design process is one of choosing an overall design solution, deciding on the
details of the solution and then checking that the undesirable occurrences do not
occur. An assessment of the safety of systems may be carried out on the basis of
different known safety concepts such as global safety factors, semi-probabilistic
approach using partial safety factors, probabilistic approximation solution using first
and second order reliability theory and probabilistic 'exact' solution [Moller, et aI.,
1999]. Inaccuracies and statistically non-describable uncertainties are either ignored in
the application of these concepts or only accounted for approximately using crisp
bounds.
In the evaluation of the safety and reliability of systems, how one quantitatively
grasps the effects of uncertainty is important [Terano, et aI., 1997]. The causes of
uncertainty that one must consider, their origins, elements and other aspects are really
diverse, and regardless of what approach is applied, it is always dependent on human
judgements for their comprehensive evaluation. In another word, the lack of
information and deficiencies of models must be made up by means of the general
evaluation capacity of humans, who can grasp the essence of an object, even if it is
vague and unclear. In order to make use of this kind of human ability and to handle a
wide range of safety and reliability, a novel safety framework is required.
Often in marine engineering applications, engineers, safety analysts and managers are
asked to make decisions on the basis of widely divergent objectives. For instance.
contract proposals may be evaluated on the basis of technical merit, total cost
176

incurred, ability to meet schedule requirements, and intangible attributes such as
previous performance. In such situations experts are asked to evaluate the proposals
based on their experiences and engineering judgements. Often, especially in early
design stages for engineering systems with a high level of innovation, only qualitative
or vague statements can be made, such as 'good performance', or 'poor cost', or
'quite safe'. Experts then apply numerical ratings to these vague, or fuzzy terms to
assist in the evaluation.
Fuzzy logic provides a means for evaluating alternatives where the objectives and
criteria are vague and where the ranking criteria themselves vary in importance. Fuzzy
logic is a subset of conventional logic that has been extended to allow for degrees of
truth, i.e., truth-values between true and false [Sii & Wang, 2003].
Traditionally, in the marine industry, the primary objective in selecting a
design/procurement option has been to select the one with the lowest cost estimate.
However, in recent years, selection of the winning design/build proposal has been
complicated by a trade-off among safety, cost and technical performance. Establishing
criteria for the quantitative and qualitative selection of design/procurement proposals
will enable designers to choose the proposal that best meets the needs described in the
solicitation.
In the design/procurement proposal evaluation process, the assessment of technical
performance, safety and costs is subject to uncertainty, especially with a project
having a high level of innovation without much previous experience. In this chapter,
the uncertainty in values of the input variables such as technical performance, safety
and costs incurred and its impact on the aggregate evaluation results are characterised
by the means of an approximate reasoning approach using fuzzy averaging method
[Sii & Wang, 2003].
The proposed fuzzy-composite evaluation framework may be used as a useful tool to
solve decision-making problems in situations where traditional methods cannot be
applied satisfactorily. It is a multi-level, multi-objective programming method using
fuzzy theory to represent the uncertainty in input variables in terms of membership
functions or degrees of belief. The specific objectives of this chapter are twofold. The
177
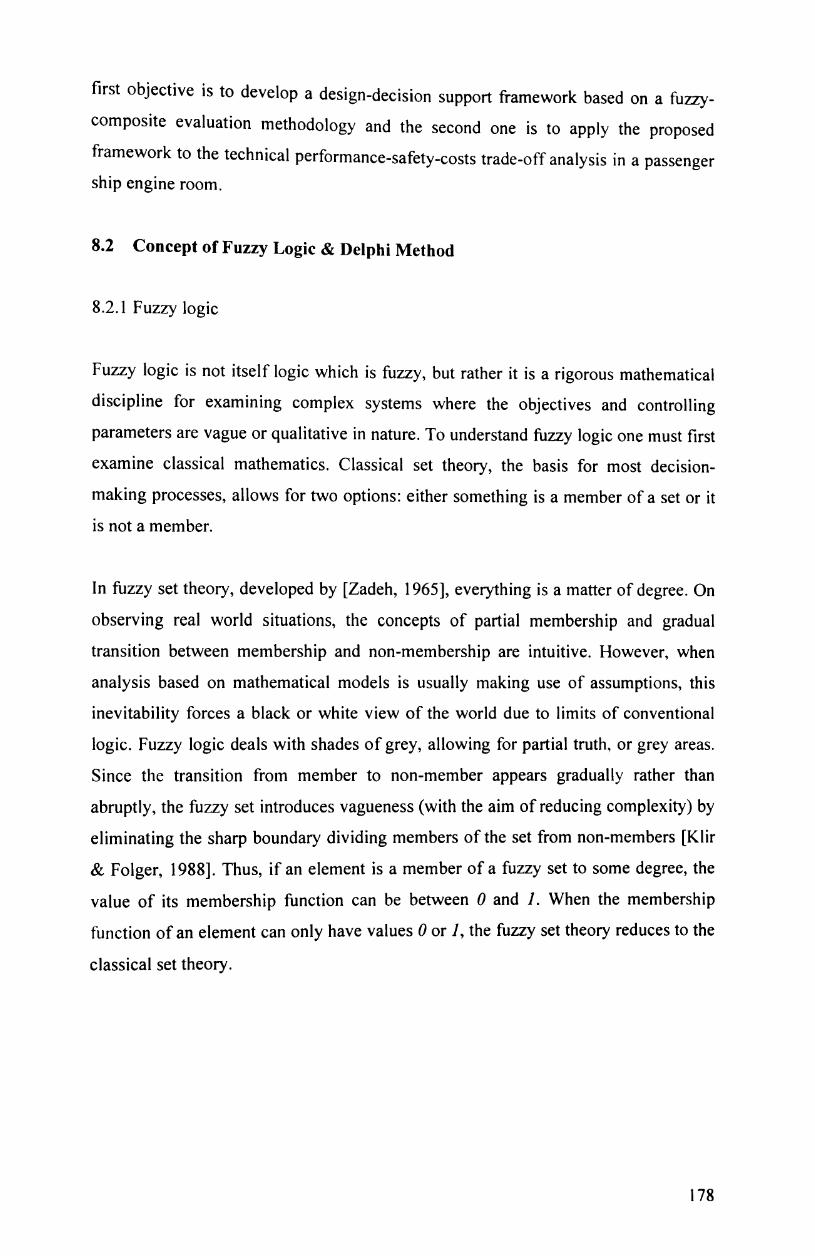
first objective is to develop a design-decision support framework based on a fuzzy
composite evaluation methodology and the second one is to apply the proposed
framework to the technical performance-safety-costs trade-off analysis in a passenger
ship engine room.
8.2 Concept of Fuzzy Logic & Delphi Method
8.2.1 Fuzzy logic
Fuzzy logic is not itself logic which is fuzzy, but rather it is a rigorous mathematical
discipline for examining complex systems where the objectives and controlling
parameters are vague or qualitative in nature. To understand fuzzy logic one must first
examine classical mathematics. Classical set theory, the basis for most decision
making processes, allows for two options: either something is a member of a set or it
is not a member.
In fuzzy set theory, developed by [Zadeh, 1965], everything is a matter of degree. On
observing real world situations, the concepts of partial membership and gradual
transition between membership and non-membership are intuitive. However, when
analysis based on mathematical models is usually making use of assumptions, this
inevitability forces a black or white view of the world due to limits of conventional
logic. Fuzzy logic deals with shades of grey, allowing for partial truth, or grey areas.
Since the transition from member to non-member appears gradually rather than
abruptly, the fuzzy set introduces vagueness (with the aim of reducing complexity) by
eliminating the sharp boundary dividing members of the set from non-members [Klir
& Folger, 1988]. Thus, if an element is a member of a fuzzy set to some degree, the
value of its membership function can be between 0 and 1. When the membership
function of an element can only have values 0 or 1, the fuzzy set theory reduces to the
classical set theory.
178

8.2.2 Application of the Delphi method in pooling expert judgement in design option
assessment
Delphi is an iterative forecasting procedure characterised by three features:
anonymity; iteration with controlled feedback; and statistical response [Dickey &
Watt, 1978]. The Delphi method was first developed for market research and sales
forecasting purposes [Goldstein, 1992] from the American defence industry. Project
of Delphi was the name of a study undertaken by the Rand Corporation for the US Air
Force in the early 1950s concerning the use of expert opinion [Robinson, 1991]. The
objective of the study was to obtain the most reliable consensus of opinion of a group
of experts by a series of intensive questionnaires interspersed with controlled opinion
feedback [Linstone & Turoff, 1975].
The Delphi method can be characterised as an approach for structuring a group
communication process so that the process is effective in allowing a group of
individuals as a whole to deal with complex problems. Delphi is primarily a
communication device, which is applied when the consensus of experts on an
uncertain issue, often intangible, is desired [Linstone & Turoff, 1975]. It is conducted
by rounds interspersed with group opinion and information feedback in the form of
relevant statistical data.
It is vital that panel members remain unknown to one another and respond to a series
of questionnaires. The iterative nature of the procedure generates new information for
panellists in each round, enabling them to modify their assessments and project them
beyond their own subjective opinions. It can represent the best forecast available from
a consensus of experts.
The Delphi approach offers an additional advantage in situations where it is important
to define areas of uncertainty or disagreement among experts. In these instances,
Delphi can highlight topics of concern and evaluate uncertainty in a quantitative
manner. Group evaluation of belief statements made by panel members is an explicit
part of Delphi [Robinson, 1991]. Goldstein correctly pointed out that. although the
group view has a higher probability of being correct than an individual, its success
179

depends principally on the careful selection of the panel and the fonnulation of
questions [Goldstein, 1975]. The major difficulties of Delphi, however, lie In
maintaining the high level of response and in reaching and implementing a consensus
[Robinson, 1991].
Prior to the design evaluation being perfonned by using the proposed composite
structure, a panel of experts can be selected to carry out cost and technical
performance assessments for each design option available subjectively using linguistic
variables such as 'very low' in capital cost and 'average' in system integration. Then
the panel is asked to assign degree of bel ief for each criterion based on the pre-defined
expressions. For instant, the maintenance cost is described by the expressions such as
{'very low', 'low', 'average', 'high'}. The Delphi method is used to guide and extract
the maximum amount of unbiased infonnation from a panel of experts. Therefore, it is
appropriate to adopt the Delphi method for obtaining assessments for each criterion
for each alternative design option [Sii & Wang, 2003].
8.3 Development of Approximate Reasoning & MADM Model Based on
Evidential Reasoning Method
8.3.1 Approximate reasoning (fuzzy logic: fuzzy averaging) model
Approximate reasoning and fuzzy logic are often used inter-changeably to indicate the
process of expressing imprecise or approximate concepts and relationships. The main
artificial intelligence mechanism behind a typical fuzzy safety model is its fuzzy
inference engine. A fuzzy inference engine comprises the selection or development of
the type/types of fuzzy membership function used to represent risk levels and fuzzy
rule bases to generate fuzzy safety estimates. Linguistic variables are employed in the
development of fuzzy membership function for each input parameter. The goal of
fuzzy linguistic variables is to represent the condition of an attribute/ a parameter at a
given interval. The attributes/parameters (input variables) considered in this study
include failure rate, consequence severity and failure consequence probability of a
cause to a technical failure. Another attribute considered is the associated control
mechanism incorporated in the design or operation.
180

The four fundamental parameters failure rate, consequence severity, failure
consequence probability and control mechanism are represented by natural
languages, which can be further described by different types of membership function.
A membership function is a curve that defines how each point in the input space is
mapped to a membership value (or degree of membership) between 0 and 1. Four
different types of membership function are used in this study. The simplest
membership functions are formed using straight lines. These straight-line membership
functions have the advantage of simplicity.
8.3.2 MADM model based on evidential reasoning method
MADM is defined as technical decision aids in evaluating and selecting alternative
options, which are characterised by multiple attributes or criteria. MADM problems
delineate a class of real world problems, which are having multiple attributes or
objectives. Multiple attributes/objectives are often conflicting with each other and
each attribute/objective is of different nature (based on different unit or scale of
measurement). The key function of MADM is to obtain an optimal decision under
certain constraints. This will help the decision-maker in evaluating alternative courses
of action to achieve a certain goal or set of goals [Sii & Wang, 2003].
In order to achieve a more effective and logical evaluation process, it is necessary to
break down the complex attributes into simpler sub-attributes in a hierarchical
manner. The hierarchical framework of attributes is used to guide the overall
evaluation of MADM problems.
Prior to the assessment undertaken by using an MADM model, a generalised set of
evaluation grades is required. An attribute can be either assessed numerically or
subjectively depending upon the nature and situation of the problem under study. The
measurement of what is good or desirable about a design is based on its attributes.
In utility theory. the best judgement possible is related to the numerical value of one
and the worst to zero. In this chapter. the general scale of evaluation grades, H. IS
defined as follows:
181

H = (HI, H2, H3, H4} = {'greatly preferred', 'preferred', 'moderately preferred'.
'slightly preferred' }
The modelling framework for the MADM based on an evidential reasoning method
has been developed to deal with MADM problems having a hierarchical structure of
both qualitative and quantitative criteria with uncertainty [Yang, 2001]. The evidential
reasoning framework is different from most conventional MADM methods. Firstly. it
employs a belief structure to represent an assessment as a distribution instead of as a
single numerical score. Secondly, it aggregates degrees of belief rather than scores. In
this way, the evidential reasoning approach can preserve the qualitative feature of
subjective criteria in the process of criteria aggregation. Using the four evaluation
grades, the assessment of an attribute Ai, denoted by S(AJ, can be represented using
the belief structure as follows:
S (A; ) = {( HI' fJ;,\) , (H2' fJ;,2)' (H3' fJ;,3)' (H4' fJ;,4)} (1)
where 1 2:: fJ;,n ~ 0 and /3;,n is the degree of belief that the attribute Ai is assessed to the
evaluation grade Hn. S(AJ reads that attribute Ai is assessed to the grade Hn to a degree
of fJ;,n xl 000/0 (n = 1, 2, 3 or 4).
There must not be I:=I fJ;,n > 1. S(Ai) can be considered to be a complete distributed
assessment if I:=I fJ;,n = 1 and an incomplete assessment if I:=I/3;.n < 1 . In the
evidential reasoning framework, both complete and incomplete assessments can be
accommodated [Yang, 2001]. In the case of an assessor, being unable to provide a
precise judgement due to inadequacy of information available, the evidential
reasoning approach allows a user to define a degree of belief of less than 1. No other
MADM approaches can deal with this level of uncertainty and this helps reduce any
inaccuracies introduced by further assumptions made. It is desirable that the
assessment of all attributes should be complete. In design evaluation of an engineering
artefact with a high level of innovation, at the initial concept stages. it is inevitable
that the assessments of some criteria will be incomplete due to the highly subjective
nature of the process and lack of available experience. The evidential reasoning model
182

can handle both complete and incomplete assessments in a consistent manner. It has
also been shown that numerical data can be modelled using belief structure through
the equivalent transformation of information [Yang, 2001].
In the evidential reasoning framework, an MADM problem with M attributes Ai (i =
J, ... ,M), K options OJ (j = J, ... . ,K) and N evaluation grades Hn (n = J, ... ,N) for each
attribute is represented using an extended decision matrix with S(A;(O)) as its element
at the lh row and/h column where S(A;(O)) is given as follows:
j = 1, ..... ,K (2)
It should be noted that an attribute is permitted to have its own set of evaluation
grades that may be different from those of other attributes.
Based on the evidential reasoning framework the degrees to which a criterion IS
evaluated, with respect to one of the N evaluation grades, is directly dependent on the
evidence that supports the evaluation. With the evidential reasoning approach, there is
little compromise between the data collection process and effective evaluation, since
the accuracy of the evaluation is directly proportional to the amount of accumulated
evidence.
The major differences between the evidential reasoning approach and the
conventional scoring methods come from the manner in which initial assessments are
provided and aggregated. The evidential reasoning approach operates on distributed
assessments (or evidence base mapping) instead of average scores and employs the
evidence combination rule of the Dempster-Shafer theory to aggregate belief degrees
[Yang, 2001]. This evidence based mapping process could be made less subjective by
using guidelines and expert knowledge. The degree of objectivity in pooling evidence
from various sources can be further improved by employing the Delphi method.
Suppose OJ; is the relative weight of the attribute A, and is normalised so that
1 ~ OJ, ~ 0 and I:=IOJ; = 1 . where L is the total number of attributes in the same
183

group for aggregation. To simplify the description, only the combination of
incomplete assessments is examined. The description of the recursive evidential
reasoning algorithm capable of aggregating both complete and incomplete
assessments can be found in literature [Yang & Xu, 2002]. Without loss of generality
and for brevity of illustration, the evidential reasoning algorithm is presented below
for combining two assessments only.
Suppose the two assessments S(AI) and S(A2 ) are given as follows:
(3 a)
(3b)
The problem is to aggregate the two assessments S(AI) and S(A2 ) to generate a
combined assessment S ( AI) + S (~). Suppose S(AI) and S(A2 ) are both incomplete.
Let
(4a)
(4b)
(4c)
(4d)
d - + .. "'tH = mlH + rhaH an m2H = ~H ~H
(4e)
In the evidential reasoning framework, "'t." and m2." are referred to as basic
probability masses. While "'tH and ~H are masses of the remaining belief
184

unassigned after commitment of belief to all Hn (n = 1, .... , 4), mlH
is the first part of
the remaining probability mass that is not yet assigned to individual grades due to the
fact that attribute Al only plays one part in the assessment relative to its weight and
mlH is the second part of the remaining probability mass unassigned to individual
grades, which is caused due to the incompleteness in the assessment S(A\). The
evidential reasoning algorithm is used to aggregate the basic probability masses to
generate combined probability masses, denoted by mJn = 1, ..... ,4), mH
and mH
using
the following equations [Yang & Xu, 2002]:
(5)
(6)
where (7)
The combined probability masses can then be aggregated with the additional
assessments in the same fashion. The process is repeated until all assessments in the
group are aggregated. The final combined probability masses are independent of the
order in which individual assessments are aggregated.
I f there are only two assessments, the combined degrees of belief f3n (n = 1, ..... ,4) and
f3H ' the later being the unassigned degree of belief representing the extent of
incompleteness in the overall assessment are generated by the following expression:
_ mn 4 d r:l mH f3. - ,n = 1, ..... , an PH = 1 -n 1 - -m
H -mH
(8)
185

8.4 A Design-Decision Support Framework Using a Composite Structure
Methodology for Design Options Evaluation
8.4.1 A design-decision support framework
This section proposes a design-decision support framework using a composite
structure methodology based on approximate reasoning approach and evidential
reasoning method for design options evaluation for marine engineering systems. The
framework is a multi-criteria decision-making methodology to assist decision makers
in solving the design options selection problems where there are conflicting
objectives, the objectives have different preferences (weights), and the value of each
input variable is having certain level of uncertainty. This is certainly the case that
occurs in the process for selecting the best design option, that is, the one that best
satisfies the requirements of design/procurement projects. The framework consists of
the following steps:
Step 1: Identify and define the hierarchical structure consisting of criteria, sub
criteria and sub-sub-criteria.
Step 2: Group basic or first-level criteria (sub-sub-criteria) into progressively fewer,
more general groups (second-level criteria or sub-criteria).
Step 3: Use approximate reasoning approach, Delphi method and fuzzy averaging to
represent the uncertainty in the basic criteria.
Step 4: Determine the relative weights of the criteria in the hierarchical structure and
use Intelligent Decision System (IDS) via Evidential Reasoning [Yang &
Xu, 2004]to synthesise all the related basic criteria into second level criteria.
Step 5: Define a utility space to evaluate the different second level criteria on the
same scale.
Step 6: Perform system synthesis for each design option using IDS.
186

Step 7: Compare the options by computing the preference estimate for each design
option using IDS.
Step 8: Rank the alternative options in order of preference.
Figure 8.1 depicts the generic framework.
Approximate reasoning to provide inputs in memberships
,~------~ r----~/ V
Safety estimate
l
Delphi method to pool experts' opinions in terms of degrees of belief
,~---------- ~--------~/ V
Cost Technical performance estimate estimate
~ ! ,
Evidential reasoning
~ Cost-safety-technical performance synthesis in the
utility space
Preference estimate
Figure 8.1. Subjective evaluation framework for various design options.
The following will delineate each step in detail:
Step 1: Identify and define the hierarchical structure consisting of criteria, sub
criteria and sub-sub-criteria.
The first step is to define all the basic criteria (first level) (sub-sub-criteria), second
level criteria (sub-criteria) and the system (criterion) that are used in the design
decision support evaluation process. It is essential to list all the basic criteria and the
salient characteristics of the system.
187

Step 2: Group basic criteria (first level)(sub-sub-criteria) into progressive" fe\\t:?r.
more general groups (second-Ievel)(sub-criteria).
Basic criteria are grouped into appropriate sub-criteria. The sub-criteria are then
further grouped in the system-criteria. For example, the eight basic criteria for
evaluation of a passenger ship engine room are shown in Figure 8.2. The set of basic
(first-level) criteria is grouped into a smaller subset of second-level criteria. For
example, the basic criteria such as capital cost, maintenance cost, operational cost and
inspection cost can be grouped into cost in general, which is an element of the subset
of the second level criteria. The other two second-level criteria are safety and
technical performance. The third-level is considered as the final-level or system-level.
The system criterion can be formed by combining the three second-level criteria (i.e.,
safety, costs and technical performance).
Step 3: Use approximate reasoning approach and Delphi method to evaluate the
basic criteria and use fuzzy averaging to represent the uncertainty in the
basic criteria.
Safety Modelling
The four fundamental parameters used to assess the safety level of a maritime system
on a subjective basis are the failure rate, consequence severity, failure consequence
probability and control mechanism. Safety estimate is the only output fuzzy variable
used in this study to produce the safety evaluation for each element at the bottom level
of a hierarchical system. In safety assessment, it is common to express a safety level
by degrees to which it belongs to such linguistic variables as "poor", "fair",
"average", and "good" that are referred to as safety expressions.
188

First-level criteria Second-level criteria System-level
Safety Safety
Capital t--
Maintenance I""-
Cost System Operational to-
Inspection I""-
Reliability I""-
Integration Technical
Supportability I--
Figure 8.2. The composite procedure for evaluation of the passenger ship engine
room.
Cost Modelling
The cost incurred for the safety and technical performance improvement associated
with a design option is usually affected by many factors. The capital cost,
maintenance cost, operational cost or inspection cost incurred for a design option can
be described using linguistic variable such as {'very low', 'low', 'average', 'high '},
which are referred to as cost expressions. The assignment of the four membership
degrees to the four cost expressions is based on the engineering judgement and
experience of the engineering team in terms of degrees of belief.
189

Technical Performance Modelling
The basic criteria related to technical performance such as reliability, system
integration and supportability are used to describe the technical strength of each
design option. These basic criteria are assessed in a similar way based on engineering
judgement and experiences of a team of personnel with strong technical background.
The reliability, system integration or supportability for a design option can be
described using linguistic terms such as those used for cost modelling, i.e .. {'very
low', 'low', 'average', 'high '}, which are referred to as technical performance
expressions.
The values of the basic criteria for each design option are described in degrees of
belief in accordance with the pre-defined fuzzy expressions. The Delphi method is
applied to improve the objectivity of degrees of belief assessment made by a panel of
experts.
Step 4: Determine the relative weights of the criteria in the hierarchical structure and
use IDS to synthesise all the related basic criteria into second level criteria.
Relative weights of the criteria at both the first level and second level of the
hierarchical structure are determined. Many methods including the Delphi technique
can be used to obtain such weights. The evidential reasoning method is then used to
synthesise all the basic criteria. This is to create second-level criteria for further
analysis.
Step 5: Define a utility space to evaluate the different second level criteria on the
same scale.
The selection of a design proposal relies on cost. safety and technical performance
implications in a particular situation. This requires the synthesis of cost. safety and
technical performance estimates for each design option in a rational manner. The cost.
190

safety and technical performance are described in such a way that the evidential
reasoning approach can be used to carry out such a synthesis in order to avoid loss of
useful information. However, the safety and technical performance associated with
and cost incurred for each design option are described in terms of safety, technical
performance and cost expressions, respectively. It is therefore necessary to define a
utility space to evaluate cost, safety and technical performance on the same scale to
expedite the synthesis process using evidential reasoning. Four utility expressions are
defined as {' greatly preferred'; 'preferred' ; 'moderately preferred'; 'slightly
preferred' }. The safety and technical performance expressions associated with and
cost incurred for each design option are then mapped onto the generalised utility space
and expressed in terms of utility expressions. For example, 'greatly preferred'
corresponds to 'good' in safety expressions, 'very low' in cost expressions and 'high'
in technical performance expressions.
This step defines a common utility space in order to convert all the second-level
criteria of different nature on the same scale. The second-level criteria are then
mapped onto the utility space and expressed in terms of the utility expressions.
Step 6: Perform system synthesis for each design option using IDS.
The IDS is applied to carry out the synthesis of various second-level criteria, i.e., cost,
safety, and technical performance. This is to achieve the final evaluation at the system
level.
Step 7: Compare the options by computing the preference estimate for each design
option using IDS.
The preference degrees associated with the available design options can be obtained
by synthesising the safety and technical perfonnance associated with and cost incurred
for each design options using the evidential reasoning approach. The numerical values
are assigned here to describe the four utility expressions (i.e. "greatly preferred';
''preferred'; "moderately preferred'; "slightly preferred') in nonnalised fonn as
U',,<
~ICi;:! ~\:,~, , t., ,:'-T -- -J" - .": <.:. -rn-ET J •• t ___ •• i:~ V&, _"::t-
lIVEEPCOL L2 2ER TEL 01512314022
191

follows: K = [K 1; K2; K3; K4] = [1; 0.8; 0.6; 0.2]. The attributes of cost. safety and
technical performance can be considered to carry different weights (i.e. having
different degrees of importance) for different situations while conducting the design
selection.
Step 8: Rank the alternative options in order of preference.
Design selection can be carried out on the basis of the preference degrees associated
with the available design options with regard to the particular considerations of cost,
safety and technical performance using IDS.
8.5 Case Study
Under most circumstances, assessments of options/alternatives are usually performed
on the basis of evaluation inputs that are crisp (single values are used) but subjective.
In this case the criteria may be presented as a range of possible values instead of crisp
values. The following example is used to illustrate the applicability of the proposed
framework in design option evaluation.
The machinery space of a passenger ship must be evaluated on the basis of a number
of factors, such as safety, cost and technical performance. Assume that four options
are being considered for an engine room. Option # 1 is a conventional ship engine
room design without much innovation involvement. Option # 2 is a new design with a
high safety and reliability level as well as novel fire alarms. Its capital and
maintenance costs are comparatively more expensive than the conventional design
(option # 1) as the design is capable of reducing the effect from fire accidental impact.
Option # 3 is another design associated with some novel design features such as high
technology fire extinguisher (i.e., C02, foam, chemical), which provides improved
system safety and supportability. However, these novel design features inevitably
increased the maintenance as well as capital costs. Option # 4 provides a generally
good safety and reliability margins with novel fire control systems. Its design also
provides improved system integration and supportability, but it requires higher costs
in both maintenance and inspection throughout its operational life.
192

All the four options are hypothetically prepared for illustration purposes. The
engineering design team will perform a technical review for acceptability in meeting
the mandatory requirements in terms of safety, cost and technical aspects of the
request for the four options. The engineering design team may be composed of
personnel with various professional expertise in the fields ranging from engineering
design, safety analysis, cost estimation, utility engineering, etc.
The design evaluation is performed using the proposed framework as follows:
Step 1: Identify and define the hierarchical structure consisting of criteria, sub
criteria and sub-sub-criteria.
The hierarchical structure of the design evaluation is depicted in Figure 8.2.
Step 2: Group basic criteria into progressively fewer, more general groups.
The second step in the evaluation is to group appropriate basic criteria (first-level)
such that they reduce to a single composite criterion (second-level). This grouping is
shown in Figure 8.2. The basic criteria are known as the first-level criteria, and
include safety, capital cost, maintenance cost, operational cost, inspection cost,
reliability, easy system integration and supportability. The second-level criteria are
safety, cost and technical performance. The final composite criterion is the system.
Step 3: Use approximate reasoning approach, Delphi method and fuzzy averaging to
represent the uncertainty in the basic criteria.
The experts are requested to assess degrees of belief for each criterion in each design
option according to the pre-defined fuzzy expressions. The Delphi method is then
used to extract the maximum amount of unbiased assessment from a panel of experts.
For example, the assessments made for capital cost for design option # 1 by five
experts is shown in Tables 8.1. The deviations of each expert's judgement from the
average are given in Table 8.2.
193

Table 8.1.
Expert, Ei
El E2 E3 E4 E5 Average
Table 8.2.
Expert, Ei
El E2 E3 E4 E5
Assessment presented by experts for capital cost in design option # 1
(Delphi method round I).
Fuzzy Expressions 'very low' 'low' 'averaKe' 'hiKh' 0.10 0.45 0.30 0.15 0.05 0.60 0.25 0.10 0.15 0.55 0.10 0.20 0.00 0.70 0.25 0.05 0.25 0.50 0.20 0.05 0.11 0.56 0.22 0.11
Deviation from average.
Fuzzy Expressions 'very low' 'low' 'averaKe' 'high' -0.01 -0.11 0.08 0.04 -0.06 0.04 0.03 -0.01 0.04 -0.01 -0.12 0.09 -0.11 0.14 0.03 -0.06 0.14 -0.06 -0.02 -0.06
Suppose the first round assessment is not satisfied with the level of deviations
presented. Then the results on deviation and average for each fuzzy expression are
given to each expert for reconsideration.
Table 8.3. Assessment presented by experts for capital cost in design option #1
(Delphi method round 2).
Expert. Ei Fuzzy Expressions 'very low' 'low' 'average' 'hiKh'
El 0.16 0.57 0.19 0.08
~ 0.14 0.53 0.22 0.11
E3 0.15 0.54 0.20 0.11
&. 0.13 0.56 0.21 0.10
Es 0.17 0.55 0.18 0.10
Average 0.15 0.55 0.20 0.10
The results obtained from the second round assessment (Table 8.3) are satisfactory
and the average in degree of belief for each fuzzy expression is rounded as {O.ls 'very
low', 0.55 'low', 0.20 'average', 0.10 'high'}.
The assessments for other first level criteria for both cost and technical performance
follow the same procedure by the engineering design team. Safety estimates can be
194

obtained using the fuzzy averaging method described in the previous chapter. The
results generated are depicted as follows:
Option #1:
Safety (option #1) = {0.205 'good', 0.241 'average', 0.261 'fair', 0.293 'poor'}
Capital cost (option #1) = {0.15 'very low', 0.55 'low', 0.2 'average', 0.1 'high'}
Maintenance cost (option #1) = {0.2 'very low', 0.3 'low', 0.35 'average', 0.15
'high'}
Operational cost (option #1) = {0.15 'very low', 0.2 'low', 0.3 'average', 0.35
'high'}
Inspection cost (option #1) = {0.05 'very low', 0.35 'low', 0.15 'average', 0.45
'high'}
Reliability (option #1) = {O 'very low', 0.15 'low', 0.25 'average', 0.6 'high'}
System integration (option #1) = {0.1 'very low', 0.25 'low', 0.3 'average', 0.35
'high'}
Supportability (option #1) = {0.1 'very low', 0.35 'low', 0.15 'average', 0.4 'high'}
Option #2:
Safety (option #2) = {O.501 'good', 0.171 'average', 0.197 'fair', 0.131 'poor'}
Capital cost (option #2) = {O 'very low', 0.25 'low', 0.3 'average', 0.45 'high'}
Maintenance cost (option #2) = {0.15 'very low', 0.15 'low', 0.25 'average', 0.45
'high'}
Operational cost (option #2) = {0.15 'very low', 0.2 'low', 0.35 'average', 0.3
'high'}
Inspection cost (option #2) = {0.1 'very low', 0.35 'low', 0.3 'average', 0.25 'high'}
Reliability (option #2) = {O 'very low', 0.05 'low', 0.15 'average', 0.8 'high'}
System integration (option #2) = {0.15 'very low', 0.25 'low', 0.25 'average', 0.35
'high'}
195

Supportability (option #2) = {0.1 'very low', 0.2 'low', 0.25 'average', 0.45 'high'}
Option #3:
Safety (option #3) = {0.437 'good', 0.112 'average', 0.352 'fair', 0.099 'poor'}
Capital cost (option #3) = {0.35 'very low', 0.45 'low', 0.2 'average', 0 'high'}
Maintenance cost (option #3) = {0.05 'very low', 0.15 'low', 0.35 'average', 0.45
'high'}
Operational cost (option #3) = {0.15 'very low', 0.15 'low', 0.25 'average', 0.45
'high'}
Inspection cost (option #3) = {0.05 'very low', 0.3 'low', 0.35 'average', 0.3 'high'}
Reliability (option #3) = {O 'very low', 0.05 'low', 0.2 'average', 0.75 'high'}
System integration (option #3) = {0.05 'very low', 0.15 'low', 0.25 'average', 0.55
'high'}
Supportability (option #3) = {0.1 'very low', 0.1 'low', 0.35 'average', 0.45 'high'}
Option # 4:
Safety (option #4) = {0.661 'good', 0.103 'average', 0.236 'fair', 0 'poor'}
Capital cost (option #4) = {0.1 'very low', 0.35 'low', 0.3 'average', 0.25 'high'}
Maintenance cost (option #4) = {0.05 'very low', 0.15 'low', 0.3 'average', 0.5
'high'}
Operational cost (option #4) = {0.05 'very low', 0.15 'low', 0.35 'average', 0.45
'high'}
Inspection cost (option #4) = {0.1 0 'very low' , 0.15 'low', 0.25 'average', 0.5 'high'}
Reliability (option #4) = {O 'very low', 0.05 'low', 0.3 'average', 0.65 'high'}
System integration (option #4) = {O 'very low', 0.15 'low', 0.35 'average', 0.5 'high'}
Supportability (option #4) = {0.05 'very low', 0.15 'low', 0.35 'average', 0.45 'high'}
196

These systems are to be evaluated and compared on the basis of safety, four basic
cost-related criteria and three technical performance related criteria.
Step 4: Determine the relative weights of the criteria in the hierarchical structure and
use IDS to synthesise all related basic criteria into second level criteria.
The weighting factors for each basic criterion (first level) and each second-level
criterion are shown in Tables 8.4 and 8.5 respectively.
Table 8.4. Weighting factors for each basic criterion (first level).
Basic Criterion Weighting factors
Safety 1
Capital 0.2
Maintenance 0.4
Operational 0.3
Inspection 0.1
Reliability 0.5
Integration 0.3
Supportability 0.2
Table 8.5. Weighting factors for second-level criterion.
Composite criterion Weighting factors
Safety 0.6
Cost 0.3
Technical 0.1
The proposed design-decision support framework is used to detennine which of the
four options best satisfies the requirements of the project. The evaluation is to be
conducted assuming that the reliability is 2.5 times as important to the evaluators as
the supportability, and 1.7 times as important as the easy system integration. The
capital cost is twice as important as inspection cost, maintenance cost is 4 times as
important as inspection cost and twice as importance as capital cost, operational cost
is 3 times as important as inspection cost. In the second level, safety is 6 times as
197

important as technical performance, twice as important as cost. The cost is 3 times as
important as technical performance. In addition, the evaluation criteria are only known
approximately because the design of the system is still in the initial stages. Moreover
there is a high level of uncertainty associated with these criteria.
The main window of IDS [Yang & Xu, 2004] for solving the design option problem is
shown in Figure 8.3.
OpUon1 I " 0.684666
Option 2 I 3 0.727333
Option 3 I 2 0.753474
Option ... I 1 0.766283
Figure 8.3. IDS main window for synthesis of safety, cost and technical performance
not weighted.
The synthesis of the second level criteria of cost, safety and technical performance for
the four options is shown as follows:
Option #1:
Safety expression
Safety (option #1)
good'
0.205
'average
0.241 0.261 0.293
1

Cost expression 'very low' 'low' 'average' 'high' Cost (option # 1) 0.157 0.328 0.295 0.220 [with weights]
Cost (option # 1) 0.129 0.363 0.248 0.260 [without weights]
Technical 'very low' 'low' 'average' 'high' performance
Technical 0.035 0.198 0.239 0.528 performance (option # 1) [with weights]
Technical 0.059 0.241 0.224 0.476 performance (option #1) [without weights]
It is noted that "with weights" means that criteria are given respective weights
according to their degrees of importance assigned by experts during design evaluation,
while "without weights" means that criteria are all of equal importance within their
corresponding group.
Option #2:
Safety expression 'good' 'average' 'fair' 'poor'
Safety (option 0.501 0.171 0.197 0.131 #2)
Cost expression 'very low' 'low' 'average' 'high'
Cost (option #2) 0.110 0.191 0.294 0.405 [with weights]
Cost (option #2) 0.091 0.231 0.302 0.376 [without weights]
199

Technical 'very low' 'low' 'average' 'high' performance
Technical 0.046 0.112 0.179 0.663 performance (option #2) [with weights]
Technical 0.073 0.151 0.203 0.573 performance (option #2) [without weights]
Option #3:
Safety expression 'good' 'average' 'fair' 'poor'
Safety (option 0.437 0.112 0.352 0.099 #3)
Cost expression 'very low' 'low' 'average' 'high'
Cost (option #3) 0.124 0.211 0.298 0.367 [with weights]
Cost (option #3) 0.141 0.263 0.294 0.302 [without weights]
Technical 'very low' 'low' 'average' 'high'
performance
Technical 0.023 0.071 0.218 0.688
performance (option #3) [with weights]
Technical 0.042 0.086 0.247 0.625
performance (option #3) [without weights]
Option #4:
Safety expression 'good' 'average' 'fair' 'poor'
Safety (option 0.661 0.103 0.236 0.000
#4)
200

Cost expression 'very low' 'low' 'average' 'high' Cost (option #4) 0.055 0.174 0.309 0.462 [with weights]
Cost (option #4) 0.067 0.188 0.298 0.447 [without weights]
Technical 'very low' 'low' 'average' 'high' performance
Technical 0.006 performance
0.079 0.309 0.606
(option #4) [with weights]
Technical 0.014 0.101 0.322 0.563 performance (option #4) [without weights]
Step 5: Define a utility space to evaluate the different second level criteria on the
same scale.
Safety, technical performance associated with and cost incurred for each design option
are mapped onto the utility space and expressed in terms of utility expressions as
shown in Table 8.6.
Table 8.6. Linguistic variables for utility expressions corresponding to cost, safety
and technical performance expressions.
Utility Safety Cost expressions Technical
expressions expressions performance
expressions
Greatly preferred Good Very low High
Preferred Average Low Average
Moderately Fair Average Low
preferred
Slightly preferred Poor High Very low
201
Step 6: Perfonn system (engine room) synthesis for each design option using IDS.
This step involves the synthesis of the three second-level criteria on the same scale of
a utility space. The system synthesis for each option is shown in Table 8.7.
Table 8.7. The results of system synthesis for each option.
'Greatly , Preferred' ' Moderately 'Slightly preferred' preferred' preferred'
Option #1 with weights for both 0.212 0.263 0.267 0.258 first and second levels criteria without weights for 0.269 0.281 0.252 0.198 both first and second levels criteria
Option #2 with weights for both 0.432 0.172 0.212 0.184 first and second levels criteria without weights for 0.404 0.198 0.213 0.185 both first and second levels criteria
Option #3 with weights for both 0.389 0.135 0.328 0.148 first and second levels criteria without weights for 0.420 0.202 0.240 0.138 both first and second levels criteria
Option #4 with weights for both 0.534 0.128 0.248 0.090 first and second levels criteria without weights for 0.454 0.200 0.208 0.138 both first and second levels criteria
Step 7: Compare the options by computing the preference estimate for each design
option using IDS.
The results of the computed preference estimate for each design option are shown in
Table 8.8, Figure 8.4 and Figure 8.5.
202

Table 8.8. Computed preference estimate for each design option.
Option Preference estimate
Option # 1
with weights for both first and second level 0.634
criteria
Without weights for both first and second 0.890
levels criteria
Option # 2
-~
with weights for both first and second level 0.734
criteria
without weights for both first and second levels 0.950
criteria I
Option # 3 !
with weights for both first and second level 0.724
criteria
without weights for both first and second levels 0.940 I
criteria I
Option # 4 !
I
with weights for both first and second level 0.803
criteria
without weights for both first and second levels 0.920
criteria ----
203

lOOlO
O9OJO
0 .8000
07000
06000 CD
05000 .... 0 0 0 .4000 U)
0.3000
0 .2000
0 .1000
0.0000
Figure 8.4.
1.0000
0.9000
0.8000
0.7000
0 .6000 CD 0.5000 .... 0 U 0 .4000 (I)
0.3000
0.2000
0.1000
00000
• 0\:ltI0n 2
Option 3
Ophon2 Option 1
Opuon4 Option 3 . ~4
Alternative .()pIIan1 • ()plan 2 . 0pIIQn3
0.6343 0 .7'338 0.7237 0.8030
Perfonnance estimates of the four design options (with weights for
both first and second level criteria).
• Option 1
• Optlon 2
• 0ptl0n:3
Option I Option 2
Option 3 • Optlan4
Alternative
Fo 85 Performance estimates of the four design options (without weights for Igure ° 0
both first and second level criteria).
204

Step 8: Rank the alternative design options in order of preference.
Based on the information obtained in Step 7, the ranking of the four design option is
produced as follows:
Ranking with involvement of without involvement of
weights for both first and weights for both first and
second level criteria second level criteria
1 st Preference Option #4 (0.803) Option #2 (0.950)
2nd Preference Option #2 (0.734) Option #3 (0.940)
3rd Preference Option #3 (0.724) Option #4 (0.920)
4th Preference Option #1 (0.634) Option #1 ((0.890)
In this example the order of selection was not clear from the original range of data.
This is often the case when decisions are made on the development of new systems
without past experience. However, the design-decision support framework provides a
systematic approach to making a selection when the criteria are vague and of varying
importance. The ranking of the design options with the consideration of weights for
both first and second level criteria is {option #4, option #2, option #3, and option # I}.
The ranking of the design options may change with the weights of the criteria. For
example, if the weights for both first and second level criteria are not considered, then
the ranking order of the four options is {option #2, option #3, option #4, and option
#1 }.
In this example only eight criteria were used to compare among four alternative
options; this process can easily be extended to many more criteria and alternatives.
This example shows the utility of the proposed framework in providing a method for
decision-making when the basic evaluating criteria are uncertain or information
available is incomplete.
205

8.6 Conclusion
The chapter was performed to demonstrate the use of a design-decision support
framework to assist in decision-making under conditions of vague or qualitative
criteria of unequal importance. The proposed framework uses criteria that are
sUbjective with a high level of uncertainty.
The suggested framework provides a powerful tool for comparing alternatives under
subjective and uncertain evaluation procedures. In the evaluation process, the
evaluating criteria or objectives are rated against each other, forcing the decision
maker to decide what is most important to the final result. Most importantly, the
process provides a result based on the degree to which each alternative meets each
objective, thereby allowing for a decision based on factors that may have been
overlooked in conventional procedures.
The final result (ranking of the design/procurement proposals) may vary with the
weights assigned to each criterion and group. Thus, a sensitivity analysis may be
required to investigate the effect for the weights. Because the selection of different
basic criteria may also lead to different results, care must be taken to select all of the
critical requirement criteria so that other criteria choices will not radically alter the
result of the analysis.
References
Blockley, D. & Godfrey, P. (2001), "Doing It Differently", Thomas Telford, London,
UK.
Dicky, J. & Watts, T. (1978), "Analytic Techniques in Urban and Regional Planning",
McGraw-Hill, NY, USA.
Goldstein, N. (1975), "A Delphi on the Future of the Steel and Ferroalloy Industries,
In the Delphi Techniques and Applications", Addison Wesley, Reading, pp.210-216,
MA, USA.
206

Goldstein, N. (1992), "Modified Delphi: a Concept for New Product Forecasting",
Journal of Business Forecasting, Vol 11, No 4, pp 10-11.
Klir, G. J. & Folger, T. A. (1988), "Fuzzy Sets, Uncertainty, and Infonnation",
Prentice-Hall, Eaglewood Cliffs, NJ, USA.
Linstone, H. & Turoff, M. (1975), "The Delphi Method: Techniques and
Applications", Addison Wesley, Reading, pp 3-12, MA, USA.
Moller, B., Beer M., Graf, W. & Hoffmann, A. (1999), "Possibility Theory Based
Safety Assessment", Computer-Aided Civil and Infrastructure Engineering, Vol 14,
pp 81-91.
Robinson, J, B. L. (1991), "Delphi Technology for Economic Impact Assessment",
Journal of Transportation Engineering, Vol 117, No 3.
Sii, H. S. & Wang, J. (2003), "A Design-Decision Support Framework for Evaluation
of Design Options/Proposals Using a Composite Structure Methodology Based on
The Approximate Reasoning Approach and The Evidential Reasoning Method,
IMechE Journal of Process Mechanical Engineering, Vol 217, pp 59-76.
Terano, T., Asai, K. & Sugeno, M. (1997), "Applied Fuzzy Systems", AP
Professional, NY, USA,
Wang, J., Yang, J. B, & Sen, p, (1996), "Multi-Person and Multi-Attribute Design
Evaluations Using Evidential Reasoning Based on Subjective Cost Analysis",
Reliability Engineering & System Safety, Vol 52, No 2, pp 113-129,
Yang, J. B. (2001), "Rule and Utility Based Evidential Reasoning Approach for
Multi-Attribute Decision Analysis under Uncertainties", European Journal of
Operational Research, Vol 131, No 1, pp 31-61.
207

Yang, J. B. & Xu, D. L. (2002), "On the Evidential Reasoning Algorithm for MUltiple
Attribute Decision Analysis under Uncertainty", IEEE Transaction of Systems, Man.
and Cybernetics - Part A: System and Humans, Vol 32, No 3, pp 289-304.
Yang, J. B. & Xu, D. L. (2004), "Intelligent Decision System via Evidential
Reasoning", IDSL, Cheshire, UK.
Zadeh, L. (1965), "Fuzzy Sets", Information and Control, Vol 8, pp 338-353.
Zimmermann, H. J. (1991), "Fuzzy Set Theory and Its Applications", Kluwer-Nijhoff
Publishing, Hingham, Massachusetts, USA.
208
CHAPTER 9 - DECISION MAKING USING ANALYTICAL
HIERARCHY PROCESSING TO FIRE SAFETY ASSESSMENT
OF A PASSENGER SHIP
Summary
An approach to integrate fire safety assessment and decision-making using the
Analytical Hierarchy Processing (AHP) method is described. The aim of this approach
is to reduce the occurrence probability and severity of fire during the operational
phase of a passenger vessel. It utilises AHP theory to rank the impacts of fires and
further integrates the available control options (to minimise these fires) within the
analysis. The result obtained from the analysis reflects the most favoured control
option that will address the possible fires within the ship to a satisfactory level. A test
case, which considers the operation of a passenger vessel, is used to demonstrate the
described approach.
9.1 Introduction
In the last 15 years there have been some severe fire accidents with passenger vessels,
such as Scandinavian Star tragedy of April 1990 with 158 deaths and Moby Prince
disaster of April 1991 with 140 fatalities. The accidents have demonstrated a clear
need for fire safety improvements.
The development of a fire from ignition to a major flammable incident usually takes a
very short time. The speed of combustion is dependent on many factors such as
oxygen, fuel, weather conditions, etc. Fire at sea, can have more serious and dramatic
implications than a land based fire. On seagoing passenger vessels fire could develop
quicker due to materials of construction, fuels, chemicals, petroleum gases, or other
hazardous cargoes, which are indigenous to ships and contained within a relatively
small area [Haisley. 1997].
209

The application of fire safety engineering principles allows a more coherent,
systematic and holistic approach to be used to address fire safety in passenger ship
design. Consequently, it is inevitable that specific expertise is required and that more
data and paperwork are to be generated, with direct impact on both designers and
administrations.
9.2 Statistics and Fire Safety Assessment of a Passenger Ship
The Lloyd's Register (LR) ship casualty database contains details of any reported fires
and explosions that occur on LR classed vessels. In the majority of cases the actual
raw data is obtained directly from the surveyors in the field, via the classification
reporting system. Press articles and casualty returns, reported in Lloyd's List and
similar publications are scanned as a secondary source of information [Mather &
Strang, 1997].
The following research criteria limits were applied to highlight passenger ship fires by
searching the LR ship casualty database [Mather & Strang, 1997]:
1. Fires.
The database search was limited to fires. Only if an explosion was followed by a
fire does the incidence of the explosion result in an entry in the data.
2. Passenger vessels built between 1 January 1982 and 31 December 1996.
The range of dates was chosen to provide a large enough sample of vessels and
ensured that the analysis was carried out on fires where the vessels were
constructed to current fire safety standards.
From the data obtained from the LR ship casualty database, Table 9.1 has been
complied. Table 9.1 lists the recorded fires and gives specific details of the locations
of the fire and where known the extinguishing used.
210

Table 9.1. Reports of fires.
Passenger Vessels
Total recorded fires 9 ships
Underway 6
Ship motion Port I
Anchored 0
New construction 2
Accommodation 2
Galley 1
Machinery space / pump room 5
Electrical installations 1
Location of fire Funnels and uptakes 0
outbreaks Stores 0
Oil tanks 0
Cargo space 0
Deck area 0
Electrical 1
Spontaneous combustion 0
Hot surface 5
Scavenge space 0
Heat source Repairs / cutting / welding 1
Cigarette / match 1
Cargo / coal 0
Outside the ship 0
Negligence 0
Heat source Collision 0
contributory factor Sabotage 1
Soot deposits 1
Fuel oil / leakage oil 1
Allowed to bum 0
Fixed water - main / sprinkler 1
Fixed gas 2
Fixed foam 0
211

Fire extinguishing Fixed dry powder 0 I
Portable water 1 I I !
Portable gas 0 l I
Portable foam I
1 I
Portable dry powder 1 1 I
Fire containment Additional help 2
Spread 1
Loss of life/injuries Loss of life 0
Serious injury 0
Major / serious 1
Degree Sank at sea 0
Temporarily disabled 2
9.2.1 Accommodation zone
In accommodation superstructures, it is sometimes found that all combustible
materials have been consumed leaving no identifiable patterns of fire spread,
particularly in older ships in which bulkheads are largely combustible.
Accommodation superstructures are divided into compartments designed to resist the
spread of fire from one to another. Factors affecting the speed with which a fire
develops in an accommodation should be identified. Open stairwells provide a route
by which fire may spread rapidly from one deck to another. Enclosed stairways are
fitted with self closing doors and a careful note of the condition of hinges and smoke
patterns on the door edges and jambs may assist in determining whether these doors
were open or closed at the time of the fire [Foster & Burgoyne, 1997].
Fire may be communicated from one deck to another or from one compartment to
another on the same deck, by heat conduction through a steel barrier (i.e. deckhead or
bulkhead). The speed with which a fire may develop in an adjacent compartment will
be dependent upon the nature of the combustible material which is in contact with
surface of the division on the opposite side of the existing fire. Sometimes a
smouldering fire may be initiated in the adjacent compartment and sometimes can
212

elapse before transition to flame occurs. Therefore, the nature and disposition of the
combustible contents in the adjacent compartment will determine the rate at which the
fire develops there. In this way, the fire may spread gradually or quickly through an
accommodation superstructure depending on the prevailing conditions [Foster &
Burgoyne, 1997].
In accommodation spaces, good housekeeping and common-sense are important in
preventing fires from occurring and spreading. Crew members should use cooking
facilities in a pantry with care, especially during night watches. Smoke detectors and
heat detectors should be maintained in good working order and fire doors should be
kept closed, especially in stairwell areas [Foster & Burgoyne, 1997].
Clearly the accommodation has a higher fire risk; it is where personnel are
concentrated owing to work and recreational activities, including smoking.
Additionally, there are many combustible materials in these spaces. However, because
the accommodation is a manned area, detection and extinction of a fire is usually
quickly dealt with, thus preventing any escalation of a fire [Mather & Strang, 1997].
9.2.2 Public area
There was one reported fire in a galley. However, because the galley is manned when
the main hazard is present, during cooking, any fire is quickly detected and
extinguished. Also the public areas (i.e. shopping malls, restaurants, cinemas) are well
equipped with fire extinguishing facilities [Mather & Strang, 1997].
9.2.3 Machinery space
The data analysis clearly indicates that the areas where the most fires can be expected
are the machinery spaces, despite the numerous fire safety measures provided in these
spaces.
The most common cause of fire in the machinery spaces is due to the contact of oil on
the hot surfaces of machinery. The fuel can be lubricating oil, diesel or fuel oil at high
or low pressure. There are regulatory requirements for high pressure fuel lines to he
213

sheathed or annoured. Most of the engine room fires are the result of low pressure or
lubricating oil leaks. The sources are rarely the line itself, but usually the joints or
filters. Frequently, the problem is poor access so that engineers working on routine
maintenance or repair work inadvertently trigger a fire [Waite, 2000].
A glib response would be that these problems are crew negligence. Even if that was
the case, it does not relieve the designer from the responsibility to attempt to
anticipate the circumstances under which fire could occur. Apart from the obvious
annouring or sheathing of all oil lines, they should be fitted with quick response low
pressure cut off. A fire may then start, but not continue to be fuel fed. Also, fuel lines
which run over machinery or adjacent machinery where atomisation may occur should
have limited lengths to limit the volume of fuel that can spray onto the engine [Waite.
2000].
Engine room fires also have a tendency to extend to the accommodation. The rules
and requirements are designed to provide time to prevent the spread of fire. The
principle is to either contain the fire to give time to fight it effectively or to give time
to evacuate the ship if it gets out of control. Clearly, there is no guarantee nor can
there be, to stop the fire completely within a space. It is inevitable, therefore, that
machinery fires can spread to the accommodation so that abandonment is necessary
[Waite, 2000].
9.2.4 Evacuation
The evacuation process of a passenger vessel may be divided into the following
phases: Mustering, Embarkation and Evacuation.
When the captain decides to muster the passengers, the alann will be activated and
announcements will infonn passengers and crew about the situation. The passengers
are guided to leave their cabins and walk along the marked escape-ways to their
muster areas, where the crew will support them. If the situation deteriorates.
embarkation of the lifeboats, which in the meantime have been swung out by crew,
will be started. The lifeboats will nonnally be sequentially launched.
214

Some of the crew will systematically search the cabins and others will be posted at
strategic positions to guide passengers to their muster stations. The crew members
shall be dressed in their uniforms to be perceived as authority persons by the
passengers. This contributes to preventing inappropriate or dysfunctional behaviour
among passengers. Otherwise, they may adopt the behaviour of other persons
appearing to behave with authority who in the worst case may be panicking people.
In case of a severe accident on a passenger vessel, the captain is responsible for
deciding whether the ship has to be evacuated. The history shows that several
examples that delay to take a decision or incorrect decisions have contributed to
creating disasters. On the other hand, premature evacuations may also cause loss of
lives.
9.2.5 Analytical Hierarchy Processing (AHP) for fire safety assessment and
decision-making for passenger ships
Quantification of the fire safety provision in new passenger ships is very difficult. In
the retrofitting of existing vessels much of the work associated with fire safety is
executed as an operation without the predetermination of the ships most at risk and a
priority ranking of the components which contribute to the achievement of the
required level of fire safety. Several spaces to quantify fire safety have been reviewed
in Sections 9.2.1 - 9.2.4 and also investigated in the previous chapters 4 - 8.
The use of the AHP method enables the solutions for each area with possible fire
identified, to be integrated within the analysis. The solutions to reduce the risk levels
(posed by fires) are evaluated in the first instance, and then are-iteration of the whole
analysis is performed (assuming the implementation of the solution) to confirm the
risk reduction.
9.3 Analytical Hierarchy Processing (AHP)
AHP is a powerful and flexible decision making process to help set priorities and
make the best decision when both qualitative and quantitative aspects of a decision
need to be considered. By reducing complex decisions to a series of one-on-one
215

comparisons, then synthesising the results. AHP not only helps decision-makers arrive
at the best decision, but also provides a clear rationale that it is the best. Designed to
reflect the way people actually think, AHP was developed more than 25 years ago b)
Dr. Thomas Saaty [Saaty, 1980], and continues to be a highly regarded and widely
used decision-making theory.
AHP is especially suitable for complex decisions, which involve the comparison of
decision elements that are difficult to quantify. It involves building a hierarchy
(ranking) of decision elements and then making comparisons between each possible
pair in each cluster (as a matrix). This gives a weighting for each element within a
cluster (or level of the hierarchy).
The AHP engages decision-makers in breaking down a decision into smaller parts,
proceeding from the goal to criteria to sub-criteria down to the alternative courses of
action. Decision-makers then make simple pair-wise comparison judgements
throughout the hierarchy to arrive at overall priorities for the alternatives.
The literature survey on AHP indicates that the method has been effective to a wide
range of applications. These include agricultural applications [Alho & Kangas, 1997],
[Braunschweig, 2000], industrial engineering applications [Alidi, 1996], [Bhattarai &
Fujiwara, 1997] and financial applications [Hachadorian, 1987]. The application of
AHP theory to ascertain business and financial risk has been relatively popular in the
past [Jensen, 1987a-b], [Nezhad, 1988], [Simkin et aI., 1990]. It has also found its
place in risk and safety assessment of engineering systems [Shields & SiIcock, 1986],
[Saaty, 1987], [Hamalainen & Karjalainen, 1989, 1992], [Shields et aI., 1990], [Frank,
1995], [PilIay, 2001].
9.3.1 Background of AHP
In AHP. the quantified judgements on pairs of activities C; and C} are represented by
an n-by-n matrix.
216

A = (aij) where i,} = 1,2, ... , n. (I)
The entries aij are defined by the following entry rules:
Rule 1. If aij = a., then aji = 1/a., a. =;; o.
Rule 2. If Ci is judged to be of equal relative importance as C· then a·· = a·· = 1 J , Ij ')1 •
Obviously au = 1 for all i. Thus the matrix A has the following form:
A = 1/ a12 1 (2)
where each aij is the relative importance of activity i to activity j. Having recorded the
quantified jUdgements of comparisons on pair (Ci, Cj ) as numerical entry Gij in the
matrix A, what is left is to assign to the n contingencies C) , C2 , C3 , ... , Cn a set of
numerical weights Wj, W2, W3, ... , Wn that should reflect the recorded judgements. The
eigenvector of the comparison matrix provides the priority ordering (weight), and the
eigenvalue is a measure of consistency [Pillay & Wang, 2003]. To find the priority
vector or the weight of each factor included in the priority ranking analysis, the
eigenvector corresponding to the maximum eigenvalue is to be determined from
matrix analysis.
In mathematical terms, the principal eigenvector is computed, and when normalised
becomes the vector of priorities (weights). To reduce the excessive computing time
needed to solve the problem exactly, and due to the results of complex numbers, a
good estimate of that vector can be obtained by dividing the elements of each column
in the comparison matrix by the sum of that column (i.e. normalise the column). The
elements in each resulting row are added and the sum is divided by the number of the
elements in the row. This is a process of averaging over the normalised columns.
Mathematically, the equation for calculating Wj is shown below:
(3)
217

In general, weights W j, W2, W3, ... , Wn can be calculated using the following equation
[Pi lIay & Wang, 2003]:
_ 1 n akj Wk--Lj=I(~n )(k=l, ...... n)
n L..i=1 aij (4)
where aij is the entry of row i and column j in a comparison matrix of order n.
Generally, if pairwise comparisons are provided for three or more criteria, they may
not be completely consistent and as such it is not straightforward to obtain relative
weights of criteria from the comparisons. The AHP method and several other methods
can be used to generate weights using pairwise comparisons.
9.3.2 Risk and AHP
Risks are by nature subjective, therefore, the AHP method may be suited for risk
assessment in many situations. This technique allows subjective and objective factors
to be considered in risk analysis and also provides a flexible and easily understood
way to annualise SUbjective risk factors. The elements in each level are compared
pair-wise with respect to their importance in making the decision under consideration.
The verbal scale used in AHP enables the decision-maker to incorporate subjectivity,
experience and knowledge in an intuitive and natural way [Pillay, 2001].
After the comparison matrices have been created, the process moves on to the phase in
which relative weights are derived for the various elements. The relative weights of
the elements of each level with respect to an element in the adjacent upper level are
computed as the components of the nonnalised eigenvector associated with the largest
eigenvalue of their comparison matrix. The composite weights of the decision
alternatives are then detennined by aggregating the weights through the hierarchy.
This is done by following a path from the top of the hierarchy to each alternative at
the lowest level, and multiplying the weights along each segment of the path. The
outcome of this aggregation is a normalised vector of the overall weights of the
options. The mathematical basis for determining the weights has been established by
Saaty [Saaty. 1988].
218

9.4 Application of AHP to a Passenger Vessel Operation
The flowchart in Figure 9.1 illustrates the steps involved In carrying out the
application of AHP to a passenger vessel operation.
Determine
Describe Operation
Identify areas to investigate
Determine the following for each area
severity / conseq uence Determine probability
Identify Risk Control Options (RCOs)
Carry out analysis using AHP method
Decision making (Most favourable RCO)
Figure 9.1. Flowchart of the approach.
This approach can be executed in the following seven distinct steps:
Step 1. Describe operation - The operation under consideration is described in detail,
highlighting all the areas that will be investigated to achieve the desired
objective of the defined operation.
219

Step 2. Identify areas to be investigated - Identify all areas that are to be investigated
to achieve the objective of the operation.
Step 3. Detennine the following for each area - For each of the areas identified in Step
2.
Step 4. Determine the probability of occurrence - Using the LR ship database,
detennine the probability that a fire might occur while investigating out the
area specified in Step 2.
Step 5. Determine the severity of possible consequence.
Step 6. Determine Risk Control Options (RCOs) - Considering the operation under
study, detennine several options that could address the risks estimated
(associated with each area defined in Step 2).
Step 7. AHP analysis - Using the data gathered in Steps 2, 4, 5 and 6, carry out the
AHP analysis to determine the most favourable RCO. This RCO will address
the risks associated with areas where fire could manifest.
Step 7 (AHP analysis) involves 4 distinct steps, which are described below:
(i) Set-up - Decision making criteria are generated, often by brainstorming or past
experience. Hierarchical relationships are drawn between the criteria and are
then represented in a matrix form.
(ii) Weighting - The matrices are filled with the criteria comparisons. The
comparisons allow calculation of the criteria-weighting vector.
(iii) Ranking - The different RCOs are ranked on their ability to satisfy the various
criteria.
(iv) Evaluation - The final solution ratings are then calculated using the ratings
detennined in (iii) and the weighting vector calculated in step (ii).
9.5 Case Study
The purpose of this analysis is to address the high risk areas of fire occurrence during
the passenger ship operation.
220

9.5.1 Hierarchy set-up
The hierarchy fire safety operation can be represented diagrammatically as shown in
Figure 9.2. The elements in level two are set to be the probability of a fire occurring
and its the severity. The sub-elements (level three) are determined by grouping the
whole area into public area, accommodation zone and machinery space. Each area
investigated in relation to the whole is considered within this level i.e. cabin,
bathroom, corridor, etc.
Goal { Fire safety operation
Fire Fire Level 2 probability of occurrence severity / consequence
, ,Ir
Public area Accommodation r-+ Machinery .. ... ..
zone space
. 1. Galley I ..
1. Cabin I ~ 1. Engine room / .. Pump room
Level 3
2. Shopping . ... I ~ 2. Electrical .. mall 2. Bathroom installations
.f ..J 'd I 3. Corrl or 3. Restaurant 3. Funnels f---+ and uptakes
... I
--"--4. Stairway J 4. Cinema --.
L.f 4. Evacuation --""" 5. Evacuation I --- 5. Evacuation ...
Figure 9.2. Fire safety operation and its hierarchical levels.
I
221

9.5.2 Level two matrix
Occurrence probability and severity make up the two elements in Level 2 as seen in
Figure 9.2. These two elements are compared against each other to determine the
weighting vector of each element. Considering the goal of the analysis, it is decided
that both these elements are equally important to a fire safety assessment. hence, the
Level 2 matrix is determined as:
Level Two = , and the Weighting Vector = . [1 1] [11(1 + 1) = 0 5] 1 1 1/(1+1)=0.5
The first column in the level two matrix, (1, 1) is normalised so that the sum of the
entries is 1.0. The weighting of Element 1 will be given as 1/( 1 + 1) = 0.5 or 50%.
Similarly Elements 2 can be calculated to be 50%. The normalised weighting vector
for Elements 1 and 2 is [0.5 0.5]. The sum of all two weightings is equal to 100%.
The comparison process is repeated for all the matrices to be used in the analysis. The
weighting vectors of the lower matrices will be normalised so that their total weight
will equal that of the previous level (level two). For example, for Element 1, sub
elements public area, accommodation zone and machinery space will be given a total
weight of 500/0. All sub-elements are analysed in the same fashion to the lowest level
possible and the results are normalised to reflect the weight of each sub-element in the
hierarchy.
The next step is to generate the possible solutions to achieve the problem
statement/goal. Each solution is compared against each of the lowest level sub
elements. The possible solutions are assumed to reduce the likelihood of fire
occurring and/or the possible consequences. The evaluation represents the
"effectiveness" of the solution in controlling the risks. These evaluations (of the
solutions) are recorded with a user defined numerical scale, as appropriate for the sub
elements. For any given element, a normalised score is determined for each solution
by taking the assigned score (which may have units) and dividing it by the sum of the
assigned scores across all of the solutions. This fraction is then multiplied by the
222

weighting coefficient for the element. This will give a normalised score for each
solution based on the element considered. These normalised results are then summed
for the different elements in the matrix, to arrive at a final rating for each solution.
The result of this series of operations is a weighted rating for each solution. The
highest rated solution will best meet the problem statement (goal) [Pillay & Wang,
2003].
9.5.3 Fire probability evaluation
First, the importance of each element (public area, accommodation zone or machinery
space) is determined. Considering the recorded fires from Table 9.1 and assuming
with Table 9.2 that machinery space is moderately more important than
accommodation zone and absolutely more important than public area. Then the level
two matrix may be represented as seen in the matrix below:
Table 9.2. Comparison scale.
1 Both elements of equal importance
3 Left weakly more important than
top
Left moderately more important 5
than top
7 Left strongly more important than
top
Left absolutely more important 9
than top
Public area: 1 fire (From Table 9.1)
Accommodation zone: 2 fires
Machinery space: 6 fires
113
115
117
119
Top weakly more important
than left
Top moderately more
important than left
Top strongly more important
than left
Top absolutely more
important than left
probability (From Table 9.2): 1
probability: 5
probability: 9
223

[
1.0000
Probability = 1/5 = 0.2000
1/9=0.1111
5.0000 9.0000] 5/5=1.0000 9/5=1.8000
5/9 = 0.5556 9/9 = 1.0000
The weighting vector is obtained as follows:
[
1/(1.0000+0.2000+0.1111) = 0.7627] Weighting vector = 1/(5.0000 + 1.0000 + 0.5556) = 0.1525
1/(9.0000 + 1.8000 + 0.5556) = 0.0848
The normalised vector is determined by considering the weighting vector at level two
as follows:
[
0.7627 x 0.5 = 0.3814] Normalised vector = 0.0763
0.0424
The probability of fire is considered for each of the areas investigated. Using Table
9.1 and Table 9.2, each area is assigned the fire probability. This data is then used to
compare each area against the others to determine the level three matrices. The
matrices for the probability of occurrence for each area are determined as follows:
Public area =
1.0000 0.2000
5.0000 1.0000
1.0000 0.2000
3.0000 0.6001
0.2000 0.0400
0.0980
0.4902
1.0000 0.3333
5.0000 1.6665
1.0000 0.3333
3.0000 1.0000
0.2000 0.0667
Weighting vector = 0.0980 ,Normalised vector = 0.2942
0.0196
5.0000
25.0000
5.0000
15.0000
1.0000
0.0980 x 0.3814 = 0.0374
0.1869
0.0374
0.1122
0.0075
224

1.0000 1.0000 1.0000 1.0000 7.0000 1.0000 1.0000 1.0000 1.0000 7.0000
Accommodation zone = 1.0000 1.0000 1.0000 1.0000 7.0000 1.0000 1.0000 1.0000 1.0000 7.0000 0.1429 0.1429 0.1429 0.1429 1.0000
0.2414
0.2414
We ighting vector = 0.2414 ,Normalised vector =
0.2414
0.2414 x 0.0763 = 0.01841 0.0184
0.0184 I
0.0344 0.0184 J 0.0026
1.0000 0.2000 0.2000 3.0000
Machinery space = 5.0000 1.0000 1.0000 15.0000
5.0000 1.0000 1.0000 15.0000
0.3333 0.0667 0.0667 1.0000
0.0882 0.0882 x 0.0424 = 0.0037
Weighting vector = 0.4412 0.0187
0.4412 ' Normalised vector =
0.0187
0.0294 0.0013
9.5.4 Fire severity evaluation
The importance of each element (public area, accommodation zone or machinery
space) is determined using the comparison scale in Table 9.2, the data in Table 9.1
and expert judgement. The matrix below is obtained for the severity importance of
each element.
[
1.0000
Severity = 0.2000
0.1111
5.0000 9.0000] 1.0000 1.8000
0.5556 1.0000
225

The weighting vector is obtained as follows:
rO.7627]
Weighting vector = 0.1525
0.0848
The normalised vector is determined by considering the weighting vector at level two
as follows:
[
0.7627 x 0.5 = 0.3814] Normalised vector = 0.0763
0.0424
The matrices for the severity of the consequences of fire for each area at level three
are determined as follows:
1.0000 1/5 = 0.2000 1/3 = 0.3333 1/9=0.1111 5.0000
5.0000 1.0000 1.6665 0.5555 25.0000
Public area = 3.0000 0.6000 1.0000 0.3333 15.0000
9.0000 1.8000 3.0000 1.0000 45.0000
0.2000 0.0400 0.0667 0.0222 1.0000
0.0549 0.0549 x 0.3814 = 0.0209
0.2748 0.1048
Weighting vector = 0.1648 ,Normalised vector = 0.0629
0.4945 0.1886
0.0110 0.0042
1.0000 0.3333 0.2000 0.1429 5.0000
3.0000 1.0000 0.6000 0.4287 15.0000
Accommodation zone = 5.0000 1.6665 1.0000 0.7145 25.0000
7.0000 2.3324 1.3996 1.0000 35.0000
0.2000 0.0667 0.0400 0.0286 1.0000
226

0.0617
0.1853 0.0617 x 0.0763 = 0.0047l
Weighting vector = 0.3087 ,Normalised vector =
0.4320
0.0123
1.0000 0.1111 0.3333 1.0000
Machinery space = 9.0000 1.0000 3.0000 9.0000
3.0000 0.3333 1.0000 3.0000
1.0000 0.1111 0.3333 1.0000
0.0141 I I I
0.0236 I
j 0.0330
0.0009
0.0714 0.0714xO.0424 = 0.0030
Weighting vector = 0.6429 0.0273
0.2143 ' Normalised vector =
0.0091
0.0714 0.0030
9.5.5 Risk Control Options (RCO)s
Several viable Risk Control Options (RCO)s are generated in order to reduce the level
of risks posed by fires during the operation. These risk control options are evaluated
for their effectiveness against each of the areas identified. For this example, an
arbitrary scale (1 to 10) is used to compare the RCOs, 1 being not effective and 10
being most effective. Six RCOs have been identified to reduce the probability and
severity of fire in the operation. These RCOs include:
RCO 1 - Training of crew.
RCO 2 - Reduce ignition sources.
RCO 3 - Maintenance work.
RCO 4 - Heat removal.
RCO 5 - Additional crewing.
RCO 6 - Quick fire detection and confirmation
(audio and visual alarms. TV monitoring, indications. etc.).
227

The matrices for the effectiveness of each RCO in reducing the probability of fire
occurrence in the accommodation zone are presented in the form as seen in Table 9.3.
Similarly all other areas are compared with the different RCOs in terms of reduction
in the probability of fire occurrence and its possible consequences.
Table 9.3. RCOs matrix.
Accommodation RCOI RC02 RC03 RC04 RC05 RC06
zone
Cabin 3 6 5 4 2 9
Bathroom 2 5 6 6 2 8
Corridor 5 6 7 8 7 9
Stairway 6 5 8 8 9 9
Evacuation 9 6 8 8 9 9
9.5.6 RCOs Evaluation to reduce probability of occurrence
The matrix for the effectiveness of each RCO in reducing the probability of fire
occurrence in the public area is formulated as follows:
9 9 8 8 6 9 0.0374
8 9 7 8 9 9 0.1869
Public area = 9 9 8 9 8 9 Normalised vector = 0.0374
9 9 8 8 8 9 0.1122
9 8 8 9 9 9 0.0075
Then the normalised results are obtained as follows:
0.0069 0.0069 0.0061 0.0061 0.0046 0.0069
0.0299 0.0336 0.0262 0.0299 0.0336 0.0336
Normalised results = 0.0065 0.0065 0.0058 0.0065 0.0058 0.0065
0.0198 0.0198 0.0176 0.0176 0.0176 0.0198
0.0013 0.0012 0.0012 0.0013 0.0013 0.0013
228

In the above matrix, the first column of the first row means that RCa 1 value is
normalised so that it will be given as 9/(9+9+8+8+6+9) = 0.1837 x 0.0374 = 0.0069.
In a similar way, the normalised matrices for the effectiveness of each RCa in
reducing the probability of fire occurrence in the accommodation zone and machinery
space are formulated as follows:
3 6 5 4 2 9
2 5 6 6 2 8
Accommodation zone = 5 6 7 8 7 9
6 5 8 8 9 9
9 6 8 8 9 9
0.0019 0.0038 0.0032 0.0025 0.0013 0.0057
0.0013 0.0032 0.0038 0.0038 0.0013 0.0051
Normalised results = 0.0022 0.0026 0.0031 0.0035 0.0031 0.0039
0.0025 0.0020 0.0033 0.0033 0.0037 0.0037
0.0005 0.0003 0.0004 0.0004 0.0005 0.0005
9 9 9 9 9 9
8 8 7 8 6 9 Machinery space =
6 7 8 7 6 8
5 7 8 7 8 9
0.0006 0.0006 0.0006 0.0006 0.0006 0.0006
0.0033 0.0033 0.0028 0.0033 0.0024 0.0037 Normalised results =
0.0027 0.0031 0.0036 0.0031 0.0027 0.0036
0.0001 0.0002 0.0002 0.0002 0.0002 0.0003
9.5.7 ReOs Evaluation to reduce severity of possible consequences
The normalised matrices for the effectiveness in reducing the severity of possible
consequences in the public area, accommodation zone and machinery space are
formulated as follows:
229

9 8 7 9 9 9
7 8 7 9 6 8 Public area = 9 9 8 8 7 9
8 8 7 9 7 9
9 9 8 8 7 9
0.0037 0.0033 0.0029 0.0037 0.0037 0.0037 0.0163 0.0186 0.0163 0.0210 0.0140 0.0186
Normalised results = 0.0113 0.0113 0.0101 0.0101 0.0088 0.0113 0.0314 0.0314 0.0275 0.0354 0.0275 0.0354 0.0008 0.0008 0.0007 0.0007 0.0006 0.0008
7 8 6 7 6 9
5 6 7 8 4 8
Accommodation zone = 6 7 6 7 5 8
7 6 8 8 7 9
9 8 8 9 9 9
0.0008 0.0009 0.0007 0.0008 0.0007 0.0010
0.0019 0.0022 0.0026 0.0030 0.0015 0.0030
Normalised results = 0.0036 0.0042 0.0036 0.0042 0.0030 0.0048
0.0051 0.0044 0.0059 0.0059 0.0051 0.0066
0.0002 0.0001 0.0001 0.0002 0.0002 0.0002
9 9 8 8 7 9
6 7 5 6 6 8 Machinery space =
5 4 6 6 7 8
6 8 7 8 7 9
0.0005 0.0005 0.0005 0.0005 0.0004 0.0005
0.0043 0.0050 0.0036 0.0043 0.0043 0.0058 Normalised results =
0.0013 0.0010 0.0015 0.0015 0.0018 0.0020
0.0004 0.0005 0.0005 0.0005 0.0005 0.0006
9.5.8 Results
The results obtained from Sections 9.5.6 and 9.5.7 are collated to determine the best
RCO. Tables 9.4 and 9.5 show the summary of these results obtained in percentage.
230

Table 9.4. Summary of results for probability element
Public area Accommodation Machinery
Total rating zone space
RCO 1 6.44% 0.84% 0.67% 7.95%
RC02 6.80% 1.19% 0.72% 8.71%
RC03 5.69% 1.38% 0.72% 7.79%
RC04 6.14% 1.35% 0.72% 8.21%
RC05 6.29% 0.99% 0.59% 7.87%
RC06 6.81% 1.89% 0.82% 9.52%
Table 9.5. Summary of results for severity element.
Public area Accommodation Machinery
Total rating zone space
RCO 1 6.35% 1.16% 0.65% 8.16%
RC02 6.54% 1.18% 0.70% 8.42%
RC03 5.75% 1.29% 0.61% 7.65%
RC04 7.09% 1.41% 0.68% 9.18%
RC05 5.46% 1.05% 0.70% 7.21%
RC06 6.98% 1.56% 0.89% 9.43%
For example, the score for RCO 6 in the category of the public area in Table 9.4 is
0.0069 + 0.0336 + 0.0065 + 0.0198 + 0.0013 = 0.0681 =6.81%. This represents the
effectiveness of RCO 6 to reduce the probability of fire occurring when the vessel is
operated. In Table 9.5, the same principles are applied for the evaluation of the
effectiveness of each RCO to reduce or mitigate the possible consequences of fire
occurring when the ship is operated.
Each of these tables (fables 9.4 and 9.5) represents 50% of the weight (as the ReO
evaluation has been normalised) of the elements in level two of the hierarchy. The
final ranking of the ReOs is achieved by adding the final ratings of these tables for
the respective ReOs. Table 9.6 shows the final results obtained for this analysis.
231

Table 9.6. Final ranking of RCOs.
Public area Accommodation Machinery
Total rating zone space
RCO 1 12.79% 2.00% 1.32% 16.11%
RC02 13.34% 2.37% 1.42% 17.13%
RC03 11.44% 2.67% 1.33% 15.44%
RC04 13.23% 2.76% 1.40% 17.39%
RC05 11.75% 2.04% 1.29% 15.08%
RCa 6 13.79% 3.45% 1.71% 18.95%
From Table 9.6, it can be determined that the best control option to reduce the
probability of occurrence and the severity of fire during the operation is RCO 6. The
results entail that by installing various warning and indication devices onto/for the
equipment used for the operation on a passenger vessel, the level of fire risk can be
reduced most effectively. The ranking order of the RCO in terms of effectiveness is
{RCa 6, RCa 4, RCa, 2, RCa 1, RCa 3 and RCa 5}. The ranking of the RCOs may
change with the weights.
9.6 Conclusion
Fire remains a great hazard to life at sea and there have been very serious incidents of
ship fires over the past. The rules and regulations primarily require fire safety for high
risk areas such as machinery spaces to be protected by structural fire resisting
divisions, detection and extinguishing systems. Furthermore, the importance of human
actions is not generally considered in the standards, although this aspect will be
addressed to a certain extent by the code.
Many uncertainties exist in fire safety assessment, e.g., the level of fire safety
achieved by compliance with existing prescriptive fire safety legislation. The AHP
can be used for analysing and prioritizing the effect of uncertainty and identifying the
uncertainties that influence outcomes more than others.
232

The suggested framework provides powerful tools for comparing alternatives under
subjective and uncertain evaluation procedures. The chapter was perfonned to
demonstrate the use of a design-decision support framework based on the AHP
methodology to assist in decision-making. The approach can be used to identify risk
control options and also detennine the best one for reducing fire hazards.
In this chapter, only fires are considered in the analysis. However, this can be
extended to include failures induced by other causes, such as collision or flooding.
References
Alho, J. M. & Kangas, J. (1997), "Analysing Uncertainties in Experts' Opinions of
Forest Plan Performance", Forest Science, Vol 43, No 4, pp 521-528.
Alidi, A. S. (1996), "Use of the Analytic Hierarchy Process to Measure the Initial
Viability of Industrial Projects", International Journal of Project Management, Vol 14,
No 4, pp 205-208.
Bhattarai, S. & Fujiwara, O. (1997), "Evaluation of Appropriate Scale of Hydropower
Development for Nepal: an Analytic Hierarchy Process Approach", Proceeding of
International Conference on Large Scale Water Resources Development in
Developing Countries: New Dimensions of Problems and Prospects, Kathmandu,
Nepal, 20-24 October.
Braunschweig, T. (2000), "Priority Setting in Agricultural Biotechnology Research:
Supporting Public Decisions in Developing Countries with the Analytic Hierarchy
Process", ISNAR Research Report No 16, International Service for National
Agricultural Research, Hague, Netherlands.
Foster, C. D. & Burgoyne, 1. H. (1997). "Scientific Investigation of Marine Shipping
Fires and Explosions". Proceeding of International Conference on Fire at Sea. The
RINA. London, UK, 20-21 November.
233

Frank, M. V. (1995), "Choosing Among Safety Improvement Strategies: a Discussion
with Example of Risk Assessment and Multi-Criteria Decision Approaches for
NASA", Reliability Engineering & Systems Safety, Vol 49, No 3, pp 311-324.
Hachadorian, G. E. (1987), "Hierarchical Determination of the Risk of Forced
Divestment to Foreign Owned Enterprises in LDC's", Mathematical Modelling Vol 8,
pp 163-166.
Haisley, J. (1997), "Escape Route Protection Nozzles for Seagoing Vessels",
Proceeding of International Conference on Fire at Sea, The RINA, London, UK, 20-
21 November.
Hamalainen, R. P. & Karjalainen, R. (1989), "Structuring the Risks of Energy
Production", Proc. of the International Conference on Multicriteria Decision-Making,
pp 677-689, Bangkok, Thailand, 6-8 December.
Hamalainen, R. P. & Karjalainen, R. (1992), "Decision Support for Risk Analysis in
Energy Policy", European Journal of Operational Research, Vol 56, No 2, pp 172-
183.
Jensen, R. E. (1987a), "International Investment Risk Analysis: Extensions for
Multinational Corporation Capital Budgeting Models", Mathematical Modelling, Vol
9, No 3, pp 265-284.
Jensen, R. E. (1987b), "A Dynamic Analytic Hierarchy Process Analysis of Capital
Budgeting under Stochastic Inflation Rates, Risk Premiums, Liquidity Preferences:
Theory", Advances in Financial Planning and Forecasting, Vol 2, pp 269-302.
Mather, P. & Strang, T. D. (1997), "Regulatory Requirements - Do These Adequately
Reflect Actual Fire Experience?", Proceeding of International Conference on Fire at
Sea, The RINA, London, UK, 20-21 November.
234

Nezhad, H. G. (] 988), "Risk Assessment for International Investment", Reprints of
the International Symposium on the Analytic Hierarchy Process, Sept. 6-9, pp 371-
380, Tianjin University, Tianjin, China.
PilIay, A. (2001), "Formal Safety Assessment of Fishing Vessels", PhD Thesis,
School of Engineering, Liverpool John Moores University, UK.
PiIlay, A. & Wang, J. (2003), "Technology and Safety of Marine Systems", Elsevier
(Ocean Engineering Book Series), ISBN: 0080441483, Linacre House Jordan Hill,
Oxford, UK.
Saaty, T. L. (1980), "The Analytic Hierarchy Process", McGraw Hill Company, NY,
USA.
Saaty, T. L. (1987), "Risk - Its Priority and Probability: the Analytic Hierarchy
Process", Risk Analysis, Vol 7, No 2, pp ]59-]72.
Saaty, T. L. (1988), "The Analytic Hierarchy Process" University of Pittsburgh, USA.
Shields, T. 1. & SiIcock, G. (1986), "Application of the Hierarchical Approach to Fire
Safety", Fire Safety Journal, Vol 1 I, No 3, pp 235-242.
Shields, T. J., Silcock, G. & Donegan, H. A. (I 990), "Towards the Development of a
Fire Safety Systems Evaluation for Public Assembly Buildings", Construction
Management and Economics, Vol 8, No 2, pp 147-158.
Simkin, M. G., Bagranoff, N. A. & Crawford P. J. (1990), "Using a Decision Support
System to Manage Exchange Rate Risk", Oklahoma Business Bulletin, Vol 58, No 3,
pp 32-35.
Waite, J. (2000), "Feeding Accident Experience into Design", IMarEST International
International Conference on Safety of Large Passenger Ships - Looking to the Future,
Vol 112, Part 2. London, UK. 15-16 May.
235

CHAPTER 10 - CONCLUSIONS AND FURTHER WORK
Summary
This chapter concludes the thesis by summarising the results of the research project
carried out by the author and outlining the contributions of the fire safety analysis
methodologies developed for passenger ships. The areas where further effort and
research are required to refine the developed methodologies are also reviewed.
Finally, other important safety features related to fire safety assessment are briefly
discussed.
10.1 Conclusions
10.1.1 Discussion of the main aim
The chapters of this thesis have thoroughly described the series of work covered in the
research project. The research started with the review of the development of fire
safety and reliability assessment techniques in the maritime industry. This is followed
by a comprehensive statistical study on casualty or failure data on passenger vessels.
The basic concept of the fire safety assessment approach and its application to the
passenger ships are discussed. The Fonnal Safety Assessment (FSA) proposed by the
UK Maritime Coastguard Agency (MCA) as a means to improve the safety of
international shipping is outlined. A range of novel fire safety analysis methodologies
has been developed and the reasons behind the development of such methodologies
have been explained.
The main aim of this research was to analyse fire issue concerning the passenger
vessel sector of the shipping industry. All the fire safety analysis methodologies
described in this thesis have been developed in a generic sense and theoretically they
are, in principle, applicable to all designs of maritime engineering products and
projects.
236

10.1.2 Evaluation of main objectives
The first objective (identification of fire safety techniques) has been identified and
investigated. Accident investigations over the years have provided valuable
information for fire safety assessment of passenger vessels. Lessons learnt from
previous accidents have been used as a guide to produce rules and regulations to
prevent similar accidents from happening. The various databases available concerning
these accidents and many more within the maritime industry are discussed. Most of
the databases described, lack vital information for a comprehensive and accurate
safety and reliability study. The missing information in these databases includes the
relationship between the cause and effect of an accident and the chain of events that
led to the accident. Specific component/equipment failure data is also lacking.
However, the data that is available requires certain amount of formatting if it is to be
used for a safety and reliability study. From the data analysis (Chapter 2), there is an
urgent need to address the fire safety issues plaguing the passenger vessel industry. In
order to analyse the fire safety issues, typical analysis techniques can be employed.
These are described in Chapter 3. The review of these typical analysis methods has
been carried out, highlighting the advantages and limitations of each method. These
methods can be broadly divided into two categories, namely, quantitative and
qualitative analysis.
The second objective (study the FSA) of this thesis has been examined in Chapter 3.
The third objective (development novel fire safety assessment) was to develop
techniques and decision support approaches for fire safety assessment. These novel
methods capable of performing fire risk quantification and risk ranking are presented
in Chapters 4, 5, 7 and 8.
The fourth objective (development of a suitable model) was achieved through
Chapters 6 and 9 where a suitable model was developed to assist in fire safety
implementation. A method using Analytical Hierarchy Processing (AHP) is proposed
in Chapter 9 to select the most favourable Risk Control Option (RCO). The AHP
method allows for flexible modelling and re-structuring of the hierarchy. Apart from
considering the effectiveness of the RCO. the proposed AHP method can be extended
237

to incorporate several other criteria such as collision and feasibility of
implementation. The evacuation modelling methodology proposed in Chapter 6
provides guidance in appraising capital projects relating to passenger ships. The fifth
objective (identification of further research areas) is discussed in Chapter 10.2.
10.1.3 Discussion on effectiveness of this project
The main aim was generally achieved but not to the extent that it was expected. This
was due to some difficulties. It was difficult to compare the real or test data and
results with industry due to the lack of access and confidentiality policy of companies.
Another negative aspect is that the information gathered from other researchers used
in the development of fire and evacuation modelling techniques was limited.
One of the major limitations of the fire safety analysis methodologies developed in
this thesis is that they require intensive computational effort in conducting fire safety
assessment, especially for maritime systems with a high level of complexity. It is
rather a time consuming task to learn and familiarise with such methodologies in
order to use them in fire safety assessment, however, advancement of computing and
man-machine interfacing technologies of the present time may resolve such problems.
The novel methods developed and presented in this thesis can be integrated into
various sections of the FSA framework. This ensures a structured approach to
identifying hazards, quantifying the risks and evaluating and deciding the best risk
control options.
It is believed that practical applications of these methodologies will result from
utilisation by organisations that deal with safety problems with high uncertainty and
insufficient data. In such cases, the implementation of the developed methodologies
could have a high beneficial effect.
10.1.4 Definitive conclusion
It is believed that the approaches and safety based decision-making techniques
developed in this thesis have great potential as effective aids and alternatives in the
238

areas of fire safety assessment. They will gain increased usage in the various stages of
maritime system design and operations. It is also emphasised that a close
collaboration with maritime industry is essential in promoting the practical
applications of these methodologies, especially with organisations dealing with safety
related problems with a high level of uncertainty as well as a lacking of safety and
reliability data. This will provide a positive ground and chance for the applications of
such methodologies to become established in order to prove their feasibility and
practicality, otherwise, it is more likely that their full potential will not be realised.
10.2 Further Work
10.2.1 Recommendation for further research
There are several areas that may be worthwhile exploring and exploiting on the basis
of the methodologies developed in this thesis. These can be summarised by the points
presented below:
• The confidence and effectiveness of the FSA approach is greatly dependent on the
reliability of system's failure/incident data. The quantitative risk assessments in
the FSA approach were required to access some detailed, reliable and consistent
incident, casualty or failure databases related to the system under scrutiny, such as
a generic passenger vessel. The availability of these data sources is one of the
major limitations of this study, as the data required for quantitative assessment is
either unavailable or insufficient. As noted by [Dobler, 1994], at present IMO and
the governments of its member countries have to rely on the statistical information
collated and published by private sources, or, they have recourse on a contractual
basis to the databases maintained by these sources, if more details are required. It
is hoped that the application of FSA may trigger the Flag States and Classification
Societies to collect data on operational experience, which can be very handy for
effective precaution risk analysis in the future. Furthermore, human reliability data
associated with maritime tasks is also a paramount area needed to be focused as
the availability of these data can be useful to conduct human error analysis since
human factors are considered to be one of the major contributors to maritime
incidents.
239

• Rules and regulation governing passenger vessels in the past seem to only
consider the structure and stability of the vessels. These rules have to be extended
to cover equipment, operating procedures, crew training and competency,
inspection requirements by coast guard agencies, etc. It has been noted that the
authorities have addressed some of these aspects. However, there is a need to
justify and rationalise each rule in order to account for the various costs that would
be incurred by the vessel owners/operators as well as any stakeholder of the
vessel. This can be achieved by using the FSA method. As such, the development
of rules applied to passenger ship using the formal fire safety assessment methods
needs to be researched and explored.
• Formal training and education programmes should be developed for crew and
passengers. This programme should not only highlight fire safety matters, but also
extend to cover competency issues. Such a programme will be a starting point to
cultivate a safety culture within the passenger ship industry. The outcome of the
formal fire safety analysis can be used to identify areas where such training and
education are lacking and the programme can be developed addressing these areas.
• Quantitative risk assessment of passenger vessels is frequently inhibited by the
lack of representative failure and repair statistics. Hence, there is a need to develop
a database specifically for this type of vessel. Most databases available are only
limited to failure data without identifying the chain of events or causes of failure.
These are useful information that is required for a fire risk assessment. The
reporting and recording format of accidents should be consistent and the data
presented in the database should be formatted in such a way that it can be directly
applied to the safety analysis techniques available. The current method of
manipulating data has been noted to cause inaccurate analysis and this translates to
a waste of time and resources [Vosburg, & Kumar, 2001].
• The decision making framework presented in Chapter 9 is inevitably a
computationally intensive method, however, the proposed algorithm could be
240

•
easily programmed and will definitely offer a convenient tool to evaluate option
selection in decision making.
Safety, cost and reliability may need to be considered simultaneously in an
integrated manner in various design process of a maritime system. One can fully
make use of the advancement in theory and applications of control engineering to
establish quantitative models for synthesising safety, cost and reliability in a
generic safety assessment framework. This generic framework will look very
similar to the safety models proposed in Chapter 8, but with more comprehensive
evaluation and further incorporation with cost and reliability models in order to
minimise risk, minimise cost and maximise reliability in system optimisation
study.
• In recent years, in order to reduce human error and to provide operators with a
improved working environment in maritime applications, advanced in computer
technology have been increasingly used to substitute control tasks which were
used to be performed by human operators. This inevitably has led to the
development of more software intensive systems. However, the employment of
software in control systems has introduced new failure modes and created
problems in the development of safety-critical systems. In maritime system
design, every safety-critical system in the software domain requires a thorough
investigation to ensure it is extremely unlikely for its behaviour to lead to a
catastrophic failure with catastrophic consequences. This is also to provide
evidence that the risk associated with the software is acceptable within the overall
system risks.
10.2.2 Other important safety features
Other important safety features related to the fire safety analysis methodologies
developed in this research project are described as follows:
• For the past century the marine industry has used prescriptive rules and
regulations for treating safety matters. If a change of approach is to be adopted,
the major hurdles to be overcome will need to be identified and possible solutions
241
suggested. The shift to more goal-setting regulations may encourage engineers and
designers to consider safety related issues more explicitly while carrying out
design optimisation studies.
• As life safety is a prime concern in the passenger ship industry, more effort should
be devoted to the life saving at sea in an attempt to estimate and evaluate the
associated risks more reliably and effectively.
• The passenger vessel companies should work together with the aim of improving
the safety culture in and around passenger ships. The human element can be
addressed in a holistic manner and not just by addressing a few areas that fall
within the competence of the IMO, such as training, prevention of pollution and
ship management [IMO, 1994]. Since safety is dominated by human factors, the
development of a positive safety culture is the only way to improve the standard of
safety. The analysis of accidents across different industries frequently points to
human error as being the cause in anything up to 80% of cases [Stansfeld, 1994],
[Pomeroy, 1998]. To ensure that there is a safety culture within an organisation it
is essential to develop a positive attitude to safety. The only effective way of
achieving this is through education and training. This is a long term process and it
requires significant resources. Human error is now receiving increasing attention,
particularly from industries concerned with design and use of maritime and other
high-tech engineering systems.
Fire safety is a complex subject and it involves management, engineering and
operation underpinned by human factors. Therefore, in order to deal with safety one
must have a proper understanding of all four aspects and competence in handling
them.
References Dobler, J. P. (1994), "The Requirement for the Publication of Detailed Global Marine
Casualty Statistics", Marine Policy & Management, Vol 21, No I, January.
IMO (1994), "International Safety Management Code (ISM Code)", IMO publication,
London, UK.
242

Pomeroy, R. V. (1998), "Classification - Adapting and Evolving to Meet the
Challenges of the New Safety Culture", IMarEST Conference on New Safety Culture,
London, UK, 4 December.
Stansfeld, J. T. (1994), "The Safety Case", Lloyd's Register Technical Association
(LRTA) No 3, Session 1994-95, London, UK.
Vosburg, J. & Kumar, A. (2001), "Managing Dirty Data in Organisations Using ERP:
Lessons from a Case Study", Industrial Management and Data Systems, Vol 101, No
l,pp21-31.
243

APPENDIX
Poster Presentation, Refereed Papers Published and Waiting to be Published
I. Wang, J., Saajedi, A., Pillay, A., Sii, H. S., Lois, P. & Kim, S. w., "Marine and
Offshore Technology Research at Liverpool John Moores University" Poster . . Presentation, Presented in the UK Universities for North Sea Hydrocarbons
Seminar and Workshop, Aberdeen Robert Gordon University, UK, 30
November-I December, 2000.
2. Wang, J., Yang, J. B., Sii, H. S., Pillay, A. & Kim, S. W .. "Marine and Offshore
Risk Assessment and Control Engineering", Proceeding of the Annual
Conference of Chinese Automation and Computer Society in the UK (CACSUK
2000), ISBN: 0953389022, Loughborough. UK, 23 September, 2000.
3. Wang, J., Maistralis, E., Sii, H. S., Kim, S. W., Wong, C., Kwon, Y. S. & Jung,
G. M., "Novel Risk Assessment Techniques and Their Application to Formal
Safety Assessment of Ships", Proceeding of the 5th International Conference on
Reliability, Maintainability & Safety. Dalian, P. R. China, 27-31 August, 2001.
4. Kim, S. w., Wang, 1., Sii, H. S., Kwon, Y. S. & Jung, G. M., "Fire Safety
Assessment on Passenger Ships: Application to an Accommodation Zone".
Proceeding of the New S-Tech 2002 (In APMC - Asia Pacific Maritime
Congress), Kobe, Japan, pp 271-282, 21-23 May, 2002.
5. Kim, S. w., Wang, 1., Kwon, Y. S. & Wall, A., "Developments in Smoke
Control System for Passenger Ships: Application to an Accommodation Zone",
Proceeding of the 8th Chinese Automation & Computer Society Conference in
the UK 2002 (CACSUK 2002), ISBN: 09533890 5 7. UMIST, Manchester, UK,
pp 1-6, 20-21 September. 2002.

6. Kim, S. W., Kim, H. S., Wang, J., Wall, A. & Kwon, Y. S., "Evacuation
Analysis of Passenger Ships: Using Computer Simulation to Predict Evacuation
Performance", Asia Pacific Symposium on Safety (APSS) 2003, Taipei, Taiwan.
18-20 November, 2003.
7. Kim, S. W., Kim, H. S., Wang, 1., Wall, A. & Kwon, Y. S .. "Evacuation
Analysis of Passenger Ships: Using Computer Simulation to Predict Evacuation
Performance", International Journal of Safety, Vol 2, No 2, pp 17-21, 2003.
8. Kim, S. w., Kwon, Y. S., Wall, A. & Wang, 1., "Fire Risk Modelling of
Machinery Space: An Application of Approximate Reasoning Approach (Fuzzy
Averaging Method) in Passenger Ship Engine Room", The 15 th International
Offshore and Polar Engineering Conference & Exhibition, Seoul, Korea. 19-24
June, 2005.
::!45