Bioconcentration factor estimates of polycyclic aromatic hydrocarbons in grains of corn plants...
7
Bioconcentration factor estimates of polycyclic aromatic hydrocarbons in grains of corn plants cultivated in soils treated with sewage sludge Lourival Costa Paraíba ⁎, Sônia Cláudia Nascimento Queiroz, Aline de Holanda Nunes Maia, Vera Lúcia Ferracini Embrapa Meio Ambiente — Embrapa Environment, CxP. 69, CEP 13820-000, Jaguariúna, São Paulo, Brazil abstract article info Article history: Received 27 October 2009 Received in revised form 13 April 2010 Accepted 14 April 2010 Available online 8 May 2010 Keywords: Zea mays Maize Bioconcentration factor PAHs Soil amendment This study presents a model to simulate the organic substance concentrations in corn grains assuming that the substances in soil solution are absorbed via the transpiration stream by plants growing in soils fertilized with sewage sludge (SS). The model was applied and validated using soil and corn grain samples from a long-term field experiment with six successive yearly applications of SS to the soil. The following polycyclic aromatic hydrocarbons (PAHs) were simulated and evaluated in soil and grain samples: acenaphthene, acenaphthylene, anthracene, benz(a)anthracene, benz(a)pyrene, benz(b)fluoranthene, benz(g,h,i)perylene, benz(k)fluoranthene, chrysene, dibenz(a,h)anthracene, fluoranthene, fluorene, indeno(1,2,3-c,d)pyrene, naphthalene, phenanthrene and pyrene. The PAH bioconcentration factors (BCF) in corn grains ranged from 1.57 to 10.97 L kg −1 . Polycyclic aromatic hydrocarbons with low soil distribution coefficients and high values of transpiration stream concentration factors (TSCF) are more likely to be absorbed by corn plants and accumulated in grains. It was possible to estimate and observe that highly lipophilic PAH molecules (heavy PAHs) show lower accumulative potential in corn grains than the less lipophilic ones (light PAHs). Sewage sludges containing significant concentrations of light PAHs with two, three or four benzene rings should be avoided as fertilizers in alimentary field crops. © 2010 Elsevier B.V. All rights reserved. 1. Introduction Polycyclic aromatic hydrocarbons (PAHs) are a group of non-polar hydrophobic organic compounds comprised of two or more fused benzene rings. Those containing up to four fused benzene rings are known as light PAHs; and heavy PAHs are those containing more than four rings. Heavy PAHs are more stable and toxic compared to the light ones (Wenzl et al., 2006), which are more volatile, water soluble and less lipophilic compounds (Ferrarese et al., 2008). According to the Scientific Committee on Food (2002), fifteen PAHs showed clear evidences of mutagenicity or genotoxicity in somatic cells of in vivo experimental animals. The PAH physical–chemical properties such as water solubility, molecular weight and vapor pressure are mainly defined by the number of double bonds, which is in turn dependent on the number of benzene rings. PAHs may be introduced into the environment through natural processes such as plant biomass combustion (Meyers and Ishiwatari, 1993). However, the anthropogenic processes generate much higher PAH amounts during wood pyrolysis activities for coal production; oil transport, storage and refining operations; domestic and industrial residue incineration; field and forest burning; energy produced via fossil-fuel burning; kerosene pyrolysis to and from benzene, toluene and other organic solvents; and vehicle motor emissions, particularly those from diesel. Regions near to urban and industrialized centers are the most affected by PAH pollution originated from petroleum or pyrolysis (WHO, 1998; Environment Canada, 1994). According to US-EPA (1993), the sixteen most toxic PAHs to aquatic and terrestrial life are: acenaphthene, acenaphthy- lene, anthracene, benz(a)anthracene, benz(a)pyrene, benz(b)fluor- anthene, benz(g,h,i)perylene, benz(k)fluoranthene, chrysene, dibenz (a,h)anthracene, fluoranthene, fluorene, indeno(1,2,3-c,d)pyrene, naphthalene, phenanthrene and pyrene. Human exposure to PAHs may occur via processed foods, contaminated water and green vegetables. Fismes et al. (2002) demonstrated that lettuce, potato and carrot plants can absorb PAHs from contaminated soils; Camargo and Toledo (2002) found signif- icant PAH levels in grapes, apples, pears, tomatoes, cabbages and lettuces grown in Brazilian rural areas nearby urban centers; Zohair et al. (2006) observed PAH-contaminated potatoes and carrots from plants grown in organic cultivation systems. Farhadian et al. (2010) studied polycyclic aromatic hydrocarbons in grilled meat. The highest concentrations of PAHs were detected in charcoal grilled followed by flame-gas and oven grilled dishes. Kulhánek et al. (2005) used models, statistical regressions and the PAH bioconcentration factors in foods to estimate the risk of human PAH intake via contaminated fruits, tubers and vegetables, in order to regulate the maximum food PAH Science of the Total Environment 408 (2010) 3270–3276 ⁎ Corresponding author. Tel.: + 55 19 33112667; fax: + 55 19 33112740. E-mail address: [email protected] (L.C. Paraíba). 0048-9697/$ – see front matter © 2010 Elsevier B.V. All rights reserved. doi:10.1016/j.scitotenv.2010.04.026 Contents lists available at ScienceDirect Science of the Total Environment journal homepage: www.elsevier.com/locate/scitotenv
-
Upload
independent -
Category
Documents
-
view
3 -
download
0
Transcript of Bioconcentration factor estimates of polycyclic aromatic hydrocarbons in grains of corn plants...
Science of the Total Environment 408 (2010) 3270–3276
Contents lists available at ScienceDirect
Science of the Total Environment
j ourna l homepage: www.e lsev ie r.com/ locate /sc i totenv
Bioconcentration factor estimates of polycyclic aromatic hydrocarbons in grains ofcorn plants cultivated in soils treated with sewage sludge
Lourival Costa Paraíba ⁎, Sônia Cláudia Nascimento Queiroz,Aline de Holanda Nunes Maia, Vera Lúcia FerraciniEmbrapa Meio Ambiente — Embrapa Environment, CxP. 69, CEP 13820-000, Jaguariúna, São Paulo, Brazil
⁎ Corresponding author. Tel.: +55 19 33112667; fax:E-mail address: [email protected] (L.C. Pa
0048-9697/$ – see front matter © 2010 Elsevier B.V. Adoi:10.1016/j.scitotenv.2010.04.026
a b s t r a c t
a r t i c l e i n f oArticle history:Received 27 October 2009Received in revised form 13 April 2010Accepted 14 April 2010Available online 8 May 2010
Keywords:Zea maysMaizeBioconcentration factorPAHsSoil amendment
This study presents a model to simulate the organic substance concentrations in corn grains assuming thatthe substances in soil solution are absorbed via the transpiration stream by plants growing in soils fertilizedwith sewage sludge (SS). The model was applied and validated using soil and corn grain samples from along-term field experiment with six successive yearly applications of SS to the soil. The following polycyclicaromatic hydrocarbons (PAHs) were simulated and evaluated in soil and grain samples: acenaphthene,acenaphthylene, anthracene, benz(a)anthracene, benz(a)pyrene, benz(b)fluoranthene, benz(g,h,i)perylene,benz(k)fluoranthene, chrysene, dibenz(a,h)anthracene, fluoranthene, fluorene, indeno(1,2,3-c,d)pyrene,naphthalene, phenanthrene and pyrene. The PAH bioconcentration factors (BCF) in corn grains ranged from1.57 to 10.97 L kg−1. Polycyclic aromatic hydrocarbons with low soil distribution coefficients and high valuesof transpiration stream concentration factors (TSCF) are more likely to be absorbed by corn plants andaccumulated in grains. It was possible to estimate and observe that highly lipophilic PAH molecules (heavyPAHs) show lower accumulative potential in corn grains than the less lipophilic ones (light PAHs). Sewagesludges containing significant concentrations of light PAHs with two, three or four benzene rings should beavoided as fertilizers in alimentary field crops.
+55 19 33112740.raíba).
ll rights reserved.
© 2010 Elsevier B.V. All rights reserved.
1. Introduction
Polycyclic aromatic hydrocarbons (PAHs) are a group of non-polarhydrophobic organic compounds comprised of two or more fusedbenzene rings. Those containing up to four fused benzene rings areknown as light PAHs; and heavy PAHs are those containing more thanfour rings. Heavy PAHs are more stable and toxic compared to thelight ones (Wenzl et al., 2006), which are more volatile, water solubleand less lipophilic compounds (Ferrarese et al., 2008). According tothe Scientific Committee on Food (2002), fifteen PAHs showed clearevidences of mutagenicity or genotoxicity in somatic cells of in vivoexperimental animals.
The PAH physical–chemical properties such as water solubility,molecular weight and vapor pressure are mainly defined by thenumber of double bonds, which is in turn dependent on the number ofbenzene rings. PAHsmay be introduced into the environment throughnatural processes such as plant biomass combustion (Meyers andIshiwatari, 1993). However, the anthropogenic processes generatemuch higher PAH amounts during wood pyrolysis activities for coalproduction; oil transport, storage and refining operations; domesticand industrial residue incineration; field and forest burning; energy
produced via fossil-fuel burning; kerosene pyrolysis to and frombenzene, toluene and other organic solvents; and vehicle motoremissions, particularly those from diesel. Regions near to urban andindustrialized centers are the most affected by PAH pollutionoriginated from petroleum or pyrolysis (WHO, 1998; EnvironmentCanada, 1994). According to US-EPA (1993), the sixteen most toxicPAHs to aquatic and terrestrial life are: acenaphthene, acenaphthy-lene, anthracene, benz(a)anthracene, benz(a)pyrene, benz(b)fluor-anthene, benz(g,h,i)perylene, benz(k)fluoranthene, chrysene, dibenz(a,h)anthracene, fluoranthene, fluorene, indeno(1,2,3-c,d)pyrene,naphthalene, phenanthrene and pyrene.
Human exposure to PAHs may occur via processed foods,contaminated water and green vegetables. Fismes et al. (2002)demonstrated that lettuce, potato and carrot plants can absorb PAHsfrom contaminated soils; Camargo and Toledo (2002) found signif-icant PAH levels in grapes, apples, pears, tomatoes, cabbages andlettuces grown in Brazilian rural areas nearby urban centers; Zohair etal. (2006) observed PAH-contaminated potatoes and carrots fromplants grown in organic cultivation systems. Farhadian et al. (2010)studied polycyclic aromatic hydrocarbons in grilled meat. The highestconcentrations of PAHs were detected in charcoal grilled followed byflame-gas and oven grilled dishes. Kulhánek et al. (2005) usedmodels,statistical regressions and the PAH bioconcentration factors in foodsto estimate the risk of human PAH intake via contaminated fruits,tubers and vegetables, in order to regulate the maximum food PAH

3271L.C. Paraíba et al. / Science of the Total Environment 408 (2010) 3270–3276
level in the European Community. Collins et al. (2006) described themain processes involved in the organic compound (including PAHs)accumulation by roots, leaves and fruits. Chouychai et al. (2007)studied the phenanthrene and pyrene phytotoxicity in corn andpeanut plants and concluded that corn plants can be used tophytoremediate contaminated soils, meaning that corn plants areable to take up and accumulate several PAHs from soil solution.
Sewage sludge (SS) is a complex organic by-product of thewastewater treatment process. Large amounts of SS are constantlyproduced and the disposal routes are a matter of worldwide concernand an environmental problem. This material is supposed to bepotentially useful in agricultural land amendment or degraded arearecovery due to its rich nutrient composition, especially in organicmatter (OM), nitrogen (N) and phosphorus (P) (Fernandes et al.,2005a). However, there are risks and benefits associated with SS usein soils, since it contains not only OM, N and P, but also metals,microorganisms and pollutant organic compounds such as the PAHs(Tsutiya et al., 2001; Alcantara et al., 2009). In general, the pollutantsubstances are associated with uncontrolledmixtures of domestic andindustrial wastes or with the waste treatment process used(Oleszczuk, 2006). SS used as a fertilizer might contaminate crops,soils, superficial and underground waters with nitrates, heavy metals,pathogens, various classes of organic compounds and persistentorganic compounds (Mantovi et al., 2005; Kinney et al., 2006;Alcantara et al., 2009). In Brazil, the use of SS in agriculture isregulated through the directive CONAMA 357/2005 (CONAMA, 2006).
There is little information on PAH uptake by plants from SS-treatedsoils, but there is evidence of plant accumulation of organiccontaminants as a result of continuous SS addition to agriculturalsoils. Research results have shown correlations between PAHconcentrations in several plant shoots and roots and soil PAHconcentrations (Oleszczuk and Baran, 2005; Oleszczuk, 2006).Oleszczuk and Baran (2005) investigated during three years thePAH absorption by Salix viminalis and concluded that the residueconcentrations found in leaves and stems were associated with thePAH content of SS added to the soil as fertilizers. The continuous PAHaccumulation in soils as a consequence of the various human activities(Jones et al., 1989; Oleszczuk, 2006) is also a matter of great concernand represents risk of plant contamination (Oleszczuk and Baran,2005; Tao et al., 2006).
The process of substance accumulation in an organism in relationto the substance concentration in the external medium is calledbioconcentration. The bioconcentration factor (BCF) is defined as thesubstance partition coefficient between the organism and the externalmedium, that is, it is calculated as the quotient between the organismand the external medium substance concentrations. Therefore, theBCF describes the organism substance accumulative potential or theorganism substance bioconcentration in a specific medium (Paraíba,2007; Paraíba and Kataguiri, 2008).
When food products originated from soil-grown plants and thesubstance concentration in the soil solution is known, the BCF valueallows estimating the daily substance intake through daily foodproduct intake (vegetables, fruits, tubers, etc). When food/substanceBCF is known and the daily substance admissible intake is also known,it is possible to estimate maximum admissible or tolerable substancelimits in the soil used to produce food (Trapp et al., 2003; Kulháneket al., 2005; Trapp, 2007; Paraíba, 2007; Paraíba and Kataguiri, 2008).
Many PAHs were found in SS samples obtained from WastewaterTreatment Plants in Brazilian cities (Tsutiya et al., 2001). In the Stateof São Paulo, the use of SS in agriculture is regulated through thetechnical directive P4230, created by CETESB (1999) — a governmentenvironmental sanitation agency — which limits the residue disposalin soils, according to the heavy metal and nitrogen soil contents, thecrop nutrient demands and the soil nitrogen mineralization rate. Inother Brazilian States, the use of SS in agriculture is regulated throughthe directive CONAMA 357/2005 (CONAMA, 2006).
Mathematical models might predict and prevent high toxicsubstance levels in field crops (fruits, tubers, vegetables, and grains)treated with pesticides or cultivated in polluted soils and indicate thatorganic substances must be systematically monitored through goodcrop management programs. Several mathematical models have beendeveloped to simulate organic substance uptake by plants (Trapp andMcFarlane, 1995; Trapp et al., 2003; Trapp, 2007; Paraíba, 2007;Paraíba and Kataguiri, 2008).
The aim of the present study was to use a mathematical model toestimate the values of corn grain-PAH bioconcentration factors (BCF)of plants grown in soils previously amended with SS for long periods,and also, to compare the estimates with experimentally measureddata. In this model, it was assumed that the PAH transport from soil tocorn grains occurs through the plant xylem/phloem flow and it iscalculated using a steady state equation expressing the compoundmass balance in the soil–plant system (Trapp and McFarlane, 1995).To achieve the objectives of this study, sixteen PAHs of concern to bemonitored in food, according to US-EPA (1993), were selected. Andmethods of residue analysis using a gas chromatograph coupled to amass spectrometer (CG/MS) were developed for the determination ofselected PAHs in soil and corn grain samples. Soil and corn grainsamples were obtained from an experimental area of Embrapa MeioAmbiente (Embrapa Environment), where a long-term experimentwas carried out with corn plants grown in soils amended with SS forsix consecutive years (Fernandes et al., 2005a,b; Dynia et al., 2006;Alcantara et al., 2009).
2. Material and methods
2.1. Hypothesis for the PAH-corn grain model
The model was built assuming that PAHs are degraded, dissipated,diluted and transformed in the soil–plant system according to firstorder kinetics due to plant growth and development, PHAs dissipationand degradation in the soil and PAH transformation through plantmetabolism. It was also assumed that PAH uptake, transport andaccumulation by corn plants are via plant transpiration stream fromthe contaminated soil solution (Trapp and McFarlane, 1995; Trappet al., 2003; Paraíba, 2007).
2.2. PAH-BCF-corn grain model development
2.2.1. Corn plant PAH concentrationThe plant PAH uptake kinetics in the soil–plant system was
estimated by the equation:
dCp
dt=
QxTSCFMp
×dCw
dt−
QxCp
Mp flklw + fckcwð Þ− kg + ke� �
Cp ð1Þ
where Cp (µg kg−1) is the plant tissue concentration,Qx (L day−1 ha−1)is the average daily soil solution volume transpired by corn plants perhectare, TSCF is the PAH concentration factor in the plant transpirationstream, Mp (kg ha−1) is the mature corn plant total fresh biomass, Cw(µg L−1) is the soil solution PAH concentration, kg (day−1) is the cornplant growth rate, and ke (day−1) is the corn plant PAH dissipation rate.The coefficients klw and kcw are the PAH lignin–water and cellulose–water partition coefficients, respectively. The constants fl and fc are thelignin and cellulose volumetric fractions in corn plant tissues,respectively.
The transpiration stream concentration factor (TSCF) was estimat-ed by the expression TSCF = 11
11 + 2:6logkow(Dettenmaier et al., 2009).
The PAH lignin–water partition coefficient (klw) was estimated by
klw=10(−0.04+0.74× logkow) (Trapp et al., 2001). The cellulose–waterpartition coefficient (kcw) was estimated by kcw=10(logkow−2.6)
3272 L.C. Paraíba et al. / Science of the Total Environment 408 (2010) 3270–3276
(Jonker, 2008), where logkow is the logarithm of PAH octanol–waterpartition coefficient (kow).
The PAH concentration in the corn plant rhizosphere wassupposed to dissipate according to a first order kinetics: Cs(t)=Cs(0)e− kst, where Cs(0) (µg kg−1) is the initial soil PAH concentration,Cs (µg kg−1) is the current soil concentration and ks (day−1) is thedissipation rate. The ks value was estimated using the expressionks=0.693/ t1/2, where t1/2 (day) is PAH half-life in the soil. The plantdissipation rate was estimated by ke=16×ks (Juraske et al., 2008).The PAH concentration in soil solution was estimated through theequation:
Cw tð Þ = ρwtCs 0ð Þe−kst
ρskd + fθ + fδkawð Þ ð2Þ
where Cw(t) (µg L−1) is the soil solution PAH; ρwt (kg L−1) and ρs(kg L−1) are the soil densities at humid and dry basis, respectively; fθand fδ coefficients are the soil water and air volumetric fractions at soilfield capacity, respectively; kaw coefficient, is the dimensionlessconstant of Henry's law estimated by kaw=(vpmw)/(s×8.314×T),where vp (Pa) is the vapor pressure,mw (g mol−1) is themolar mass, s(mg L−1) is PAH water solubility and T=298 K at room temperature.The kd (L kg−1) constant is the PAH soil distribution coefficientestimated by kd= fom×10(0.52logkow+0.64), where fom is the soil organicmatter volumetric fraction (Briggs, 1981).
Assuming Eq. (2), and supposing that Cw 0ð Þ = ρwtCs 0ð Þρskd + fθ + fδkawð Þ is
known, and that Cp(0)=0, thus, Eq. (1) is solved by:
Cp tð Þ = ACw 0ð ÞB−ksð Þ e −kstð Þ−e −Btð Þh i
ð3Þ
where, A (L kg day−1) and B (day−1) constants are given byA = Qf TSCF
Mpand B = ke + kg + Qx
Mp flklw + fckcwð Þ. The A constant repre-sents the PAH total uptake rate by corn plants and the B constant, thePAH total dissipation rate, both in the soil–plant system.
2.2.2. PAH concentration in corn grainsUsing Eq. (3), the corn grain PAH concentration was estimated by
the equation:
Cg t N teð Þ = ρwρg
Qf Cp tð Þ = ρwAQf Cw 0ð Þρg B−ksð Þ e −kstð Þ−e −Btð Þh i
ð4Þ
where Cg=Cg(tN te) (µg kg−1) is the corn grain PAH concentrationand Qf (L kg−1) is the average sap flow value necessary to produce1.0 kg fresh corn grains, estimated by Qf=dw20, where dw is the corngrain water volumetric fraction (Trapp et al., 2003); ρw (kg L−1) andρg, (kg L−1) are the soil solution (water) and corn grain densities,respectively; te (day) is the initial time of corn grain filling period,because Cg(t)=0 when t≤ te.
2.2.3. PAH bioconcentration factor — BCF — in corn grainsThe bioconcentration factors (BCF) were estimated as the quotient
between the grain and the soil solution PAH concentrations (Eq. (2)),according to the expression:
BCF th N teð Þ = Cg thð ÞCw thð Þ ð5Þ
where BCF (L kg−1) is the PAH bioconcentration factor in corn grainsand th (day) is the final time of corn grain filling period or days aftersowing.
Eq. (5) demonstrates that BCF depends on the PAH total uptakerate and total elimination rate in the soil–plant system; PAH half-lifeand distribution coefficient in the soil; PAH air–water partitioncoefficient; soil air, water and organic matter volumetric fractions;soil solution, humid and dry soil densities; corn grain density; plant
transpiration stream rate and total fresh biomass; phloem sap flowrate necessary to produce 1.0 kg fresh corn grains; cellulose and ligninvolumetric fractions and plant growth rate. Thus, the BCF valuedepends on the properties and characteristics of PAHs, soil, cornplants and grains.
2.2.4. Soil and plant samplings in the field experimentsField experiments were carried out in a clay texture distroferric
Red Oxisol (sand loam Rhodic Oxisol, Typic Haplustox) at theexperiment station of Embrapa Environment, at Jaguariúna City, SãoPaulo State, Brazil (22° 41′ S latitude, 47° W longitude and 570 melevation). The PAH residue determinations in soil and corn grainsamples were made in the Laboratory of Pesticide and ContaminantsResidues of Embrapa Environment. Four field plots were randomlyselected from a long-term experiment, in which SS was added to thesoil as fertilizer source for corn production for six consecutive years.From each plot, three soil samples from the 0–20 cm depth layer andthree corn samples at the fresh stage were collected for the PAHanalysis of residues in grains. Samples were prepared for analysis asfollows: soil samples were air-dried at room temperature and corngrains were oven-dried at 70 °C and ground in a laboratory grain-mill(1 mm sieve).
2.2.5. PAH determination in soil and corn grain samples
2.2.5.1. Standards and reagents. A standard solution obtained fromChemService (West Chester, PA,USA)was used, containing2.0 mg mL−1
of each PAH studied in dichloromethane: benzene (50:50, v/v).Dichloromethane and n-hexane (pesticide residual degree) wereobtained from Tedia Company Inc.; anhydrous sodium sulfate from J.T.Baker; and alumina (80–200 mesh) from Fisher Scientific.
2.2.5.2. PAH extraction. 10 g of dry soil and 5 g of ground corn grainswere transferred to 250 ml-centrifuge tubes; 20 mL of dichloro-methane (DCM) was added and the sample was shaken for 30 min,centrifuged and the organic supernatant was preserved; thisprocedure was repeated with 20 mL of n-hexane; the collectedorganic extract was submitted to evaporation to reduce the volume to3 mL.
2.2.5.3. PAH clean-up. The soil extract was cleaned up using a 1.5 cmdiameter glass column containing 2 g of alumina (activated Al2O3)and 1.0 g of anhydrous sodium sulfate (Na2SO4). The soil extract wastransferred into the glass column and PAHswere eluted with 10 mL ofn-hexane: DCM (19:1, v/v), and after, with 15 mL of n-hexane: DCM(1:2, v/v). All the percolate was collected and evaporated to reducethe volume to 1 mL. The corn grain extract was cleaned up using silicagel column conditioned with 40 mL of cyclohexane; the PAHs wereeluted with 85 mL of cyclohexane and the percolate collected wasevaporated to reduce the volume to 1 mL.
2.2.5.4. Quantification. PAHs were quantified using the method ofexternal standardization. An 80 mg L−1 dichloromethane standardstock solution was used to prepare the 1.0 mg L−1 diluted standardsolution. Afterwards, the work solutions were prepared by means ofsuccessive dilutions in n-hexane and they were used to determine thedetector linearity, fortify samples and obtain the standard analyticalcurves.
2.2.5.5. Soil and corn grain sample analysis by GC-MS/MS. Sixteen PAHswere analyzed using a gas chromatograph—model 3900— coupled toa mass spectrometer model 2100 T, and a Restek capillary column(RTX®-5 Sil MS, 30 m×0.25 mm DI×0.25 µm). The trap, manifold,transferline and injector temperature were 220 °C, 60 °C, 280 °C and250 °C, respectively. The oven temperature was initially 50 °C per1 min; 10 °C min−1 until 150 °C per 2 min; 6 °C min−1 until 220 °C;

Table 1Analytical method limits of detection (LOD) and limits of quantification (LOQ) of PAHs in soils, PAH concentrations in soils [dry weight]: minimum, maximum, average and medianresidual levels and number of soil samples showing PAH levels above the method limits of quantification (NLOQ).
PAH LODµg kg−1
LOQµg kg−1
Minimumn=12μg kg−1
Maximumn=12μg kg−1
Averageμg kg−1
Mediann=12μg kg−1
CountNLOQ
Acenaphthylene 0.4 1.2 bLOD bLOD – bLOD n.d.Acenaphthene 0.4 1.4 bLOD 2.1 2.1 bLOD 3Anthracene 0.3 1.1 bLOD 3.1 2.2 2.1 6Benz(a)anthracene 0.4 1.5 bLOD 7.4 3.0 2.3 8Benz(a)pyrene 2.5 8.4 bLOD bLOQ – bLOQ n.q.Benz(b)fluoranthene 1.6 5.4 bLOD 6.5 5.7 5.4 3Benz(g,h,i)perylene 0.8 2.8 bLOD 6.0 3.6 3.1 6Benz(k)fluoranthene 1.8 6.0 bLOD 8.5 8.5 bLOD 1Chrysene 0.4 1.4 bLOD 5.6 3.3 2.6 7Dibenz(a,h)anthracene 0.9 3.0 bLOD 6.0 4.4 bLOD 4Fluoranthene 0.2 0.5 bLOD 5.8 3.1 2.6 8Fluorene 0.4 1.3 bLOD 2.1 1.9 bLOD 2Indeno(1,2,3-c,d)pyrene 0.9 2.7 bLOD 5.8 4.5 bLOD 5Naphthalene 0.9 3.0 bLOQ 6.5 4.8 4.6 11Phenanthrene 0.3 0.9 bLOD 3.3 2.8 2.8 3Pyrene 0.2 0.5 bLOD 7.5 4.9 4.9 8
N = total number of samples; n.d. = not detected; n.q. = not quantified; bLOD — lower than the limit of detection; bLOQ — lower than the limit of quantification.
3273L.C. Paraíba et al. / Science of the Total Environment 408 (2010) 3270–3276
4 °C min−1 until 286 °C and 10 °C min−1 until 300 °C. The acquisitiondata were obtained in the MS/MS mode.
3. Results and discussion
3.1. Simulation, numerical results and model validation
The limits of detection — LOD (µg kg−1) — and limits ofquantification — LOQ (µg kg−1) — of analytical methods used forresidual PAH determination in soil and grain samples are presented inTables 1 and 5. The minimum, maximum, median and average PAHresidues in soil are presented in Table 1, as well as the number of SS-treated soil samples showing PAH levels above the method limits ofquantification (NLOQ). The physical–chemical characteristics of thesixteen PAHs used in the model to estimate the BCF values arepresented in Table 2. The soil, corn plant and grain physical–chemicalparameters used in the model to estimate the BCF values arepresented in Table 3. BCF values ranged between 1.51 [indeno(1,2,3-c,d)pyrene] and 10.97 L kg−1 [anthracene] (Table 4) or equivalentlythe corn grain PAH concentrations may range between 1.5 and 11 foldthe soil solution PAH concentrations.
Table 2Polycyclic aromatic hydrocarbons (PAH) physical–chemical properties applied to themathematical model to estimate the PAH bioconcentration factor (BCF) in corn grains.# rings: number of aromatic rings; mw molar mass; s: water solubility; logarithm ofoctanol–water partition coefficient kow; vp: vapor pressure; t1/2: half-life in the soil.
PAH # Rings mwa sa logkowa vp
a t1/2b
g mol−1 mg L−1 Pa day
Aenaphthene 3 154 3.90 3.92 2.87×10⁻¹ 102Aenaphthylene 3 152 16.10 3.94 8.91×10⁻¹ 60Athracene 3 178 0.04 4.45 8.71×10⁻⁴ 460Benz(a)anthracene 5 228 0.01 5.76 2.80×10⁻⁵ 670Benz(a)pyrene 6 252 0.00 6.13 7.32×10⁻⁷ 530Benz(b)fluoranthene 5 252 0.00 5.78 6.67×10⁻⁵ 610Benz(g,h,i)perylene 6 276 0.00 6.63 1.33×10⁻⁸ 650Benz(k)fluoranthene 5 252 0.00 6.11 1.29×10⁻⁷ 2140Crysene 4 228 0.00 5.81 8.31×10⁻⁷ 990Dibenz(a,h)anthracene 5 278 0.00 6.75 1.27×10⁻⁷ 940Fuoranthene 4 202 0.26 5.10 1.23×10⁻³ 60Fuorene 3 166 1.69 4.18 8.00×10⁻² 60Ideno(1,2,3-c,d)pyrene 6 276 0.00 6.70 1.67×10⁻⁸ 178Naphthalene 2 128 31.00 3.30 1.13×10−0 48Penanthrene 3 178 1.15 4.46 1.61×10⁻² 200Pyrene 4 202 0.14 4.88 6.00×10⁻⁴ 1870
aValues from SRC (2010) and bHoward et al. (1991).
The experimentally determined soil PAH concentrationswere usedto estimate the soil solution PAH concentrations Cw− exp (µg L−1),making Cw− exp = ρwtCs− exp
ρskd + fθ + fδkawð Þ, where Cs−exp (µg kg−1) is theaverage dry soil PAH concentration (Table 1). The BCF valuescalculated by means of Eq. (5) and the estimated soil solution concen-trations were used to estimate the modeled corn grain PAH concen-trations, making Cg−mod=BCF×Cw− exp / (1−dw), where Cg−mod
(µg kg−1) is themodeled corn grain PAH concentration. The estimatesof the soil PAHs distribution coefficient, kd (L kg−1), transpirationstream concentration factor (TSCF) and soil solution PAH concentra-tions (Cw− exp) are presented in Table 4.
A negative correlation was observed between kd values and thecorn grain BCF values and a positive correlation was found betweenthe TSCF and BCF values (see Table 4). The empirical linear regressionmodel between log kd (the logarithm of soil distribution coefficient)and log BCF (the logarithm of bioconcentration factor) obtained was:log BCF=1.49(±0.10)−0.45(±0.05×log kd with (n=12) andR2=0.83, correlation coefficient=−0.91 and pb0.001, indicating alinear regression and negative correlation between the dependentvariable (log BCF) and the independent variable (log kd). Theempirical linear regression model between log TSCF (the logarithmof transpiration stream concentration factor) and log BCF was: logBCF=1.11(±0.04)+0.27(±0.02)× log TSCF with (n=12) and
Table 3Soil, corn plant and grain physical–chemical parameters applied to the model toestimate the polycyclic aromatic hydrocarbons (PAH) bioconcentration factor (BCF) incorn grains.
Parameter Symbol Value Unity
Total daily volume of water lost by planttranspirationa
Qx 5.0×10⁴ L day−1 ha−1
Plant fresh biomassa Mp 2.0×10⁴ kg ha−1
Plant growth ratea ke 0.71 day−1
Corn grain cellulose volumetric fractionb fc 0.25 g g−1
Corn grain lignin volumetric fractionb fl 0.06 g g−1
Phloem sap flow rate necessary toproduce 1.0 kg fresh corn grains
Qf 3.0 L kg−1
Corn grain densityb ρg 1.2 kg L−1
Soil solution densityc ρw 0.98 kg L−1
Soil water volumetric fractionc fθ 0.25 g g−1
Soil air volumetric fractionc fδ 0.16 g g−1
Soil organic matter volumetric fractionc fom 0.027 g g−1
Dry soil densityc ρs 1.3 kg L−1
Humid soil densityc ρwt 1.5 kg L−1
Plant age at grain harvest (days after sowing) th 120 day
aValues from Bergamaschi et al. (2005), bRosa et al. (2004) and cDynia et al. (2006).
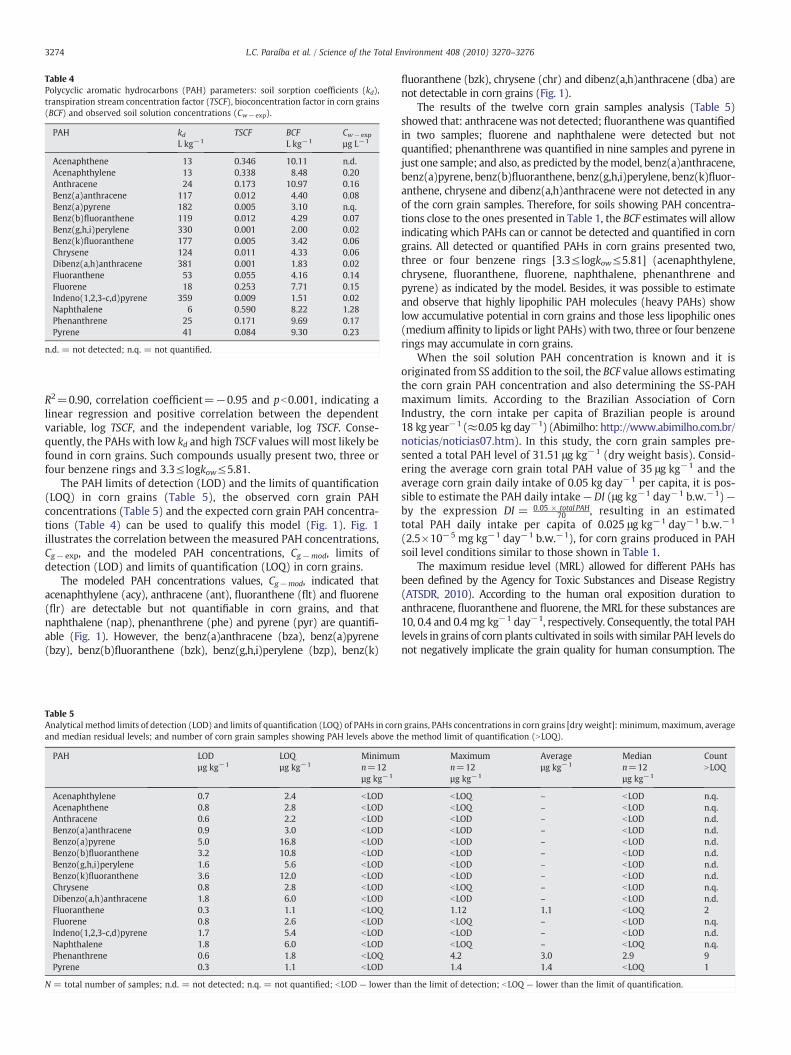
Table 4Polycyclic aromatic hydrocarbons (PAH) parameters: soil sorption coefficients (kd),transpiration stream concentration factor (TSCF), bioconcentration factor in corn grains(BCF) and observed soil solution concentrations (Cw− exp).
PAH kdL kg−1
TSCF BCFL kg−1
Cw− exp
µg L−1
Acenaphthene 13 0.346 10.11 n.d.Acenaphthylene 13 0.338 8.48 0.20Anthracene 24 0.173 10.97 0.16Benz(a)anthracene 117 0.012 4.40 0.08Benz(a)pyrene 182 0.005 3.10 n.q.Benz(b)fluoranthene 119 0.012 4.29 0.07Benz(g,h,i)perylene 330 0.001 2.00 0.02Benz(k)fluoranthene 177 0.005 3.42 0.06Chrysene 124 0.011 4.33 0.06Dibenz(a,h)anthracene 381 0.001 1.83 0.02Fluoranthene 53 0.055 4.16 0.14Fluorene 18 0.253 7.71 0.15Indeno(1,2,3-c,d)pyrene 359 0.009 1.51 0.02Naphthalene 6 0.590 8.22 1.28Phenanthrene 25 0.171 9.69 0.17Pyrene 41 0.084 9.30 0.23
n.d. = not detected; n.q. = not quantified.
3274 L.C. Paraíba et al. / Science of the Total Environment 408 (2010) 3270–3276
R2=0.90, correlation coefficient=−0.95 and pb0.001, indicating alinear regression and positive correlation between the dependentvariable, log TSCF, and the independent variable, log TSCF. Conse-quently, the PAHs with low kd and high TSCF values will most likely befound in corn grains. Such compounds usually present two, three orfour benzene rings and 3.3≤ logkow≤5.81.
The PAH limits of detection (LOD) and the limits of quantification(LOQ) in corn grains (Table 5), the observed corn grain PAHconcentrations (Table 5) and the expected corn grain PAH concentra-tions (Table 4) can be used to qualify this model (Fig. 1). Fig. 1illustrates the correlation between the measured PAH concentrations,Cg− exp, and the modeled PAH concentrations, Cg−mod, limits ofdetection (LOD) and limits of quantification (LOQ) in corn grains.
The modeled PAH concentrations values, Cg−mod, indicated thatacenaphthylene (acy), anthracene (ant), fluoranthene (flt) and fluorene(flr) are detectable but not quantifiable in corn grains, and thatnaphthalene (nap), phenanthrene (phe) and pyrene (pyr) are quantifi-able (Fig. 1). However, the benz(a)anthracene (bza), benz(a)pyrene(bzy), benz(b)fluoranthene (bzk), benz(g,h,i)perylene (bzp), benz(k)
Table 5Analytical method limits of detection (LOD) and limits of quantification (LOQ) of PAHs in cornand median residual levels; and number of corn grain samples showing PAH levels above t
PAH LODµg kg−1
LOQµg kg−1
Minimumn=12µg kg−1
Acenaphthylene 0.7 2.4 bLODAcenaphthene 0.8 2.8 bLODAnthracene 0.6 2.2 bLODBenzo(a)anthracene 0.9 3.0 bLODBenzo(a)pyrene 5.0 16.8 bLODBenzo(b)fluoranthene 3.2 10.8 bLODBenzo(g,h,i)perylene 1.6 5.6 bLODBenzo(k)fluoranthene 3.6 12.0 bLODChrysene 0.8 2.8 bLODDibenzo(a,h)anthracene 1.8 6.0 bLODFluoranthene 0.3 1.1 bLOQFluorene 0.8 2.6 bLODIndeno(1,2,3-c,d)pyrene 1.7 5.4 bLODNaphthalene 1.8 6.0 bLODPhenanthrene 0.6 1.8 bLOQPyrene 0.3 1.1 bLOD
N = total number of samples; n.d. = not detected; n.q. = not quantified; bLOD — lower th
fluoranthene (bzk), chrysene (chr) and dibenz(a,h)anthracene (dba) arenot detectable in corn grains (Fig. 1).
The results of the twelve corn grain samples analysis (Table 5)showed that: anthracenewas not detected; fluoranthenewas quantifiedin two samples; fluorene and naphthalene were detected but notquantified; phenanthrene was quantified in nine samples and pyrene injust one sample; and also, as predicted by themodel, benz(a)anthracene,benz(a)pyrene, benz(b)fluoranthene, benz(g,h,i)perylene, benz(k)fluor-anthene, chrysene and dibenz(a,h)anthracene were not detected in anyof the corn grain samples. Therefore, for soils showing PAH concentra-tions close to the ones presented in Table 1, the BCF estimates will allowindicating which PAHs can or cannot be detected and quantified in corngrains. All detected or quantified PAHs in corn grains presented two,three or four benzene rings [3.3≤ logkow≤5.81] (acenaphthylene,chrysene, fluoranthene, fluorene, naphthalene, phenanthrene andpyrene) as indicated by the model. Besides, it was possible to estimateand observe that highly lipophilic PAH molecules (heavy PAHs) showlow accumulative potential in corn grains and those less lipophilic ones(medium affinity to lipids or light PAHs) with two, three or four benzenerings may accumulate in corn grains.
When the soil solution PAH concentration is known and it isoriginated from SS addition to the soil, the BCF value allows estimatingthe corn grain PAH concentration and also determining the SS-PAHmaximum limits. According to the Brazilian Association of CornIndustry, the corn intake per capita of Brazilian people is around18 kg year−1 (≈0.05 kg day−1) (Abimilho:http://www.abimilho.com.br/noticias/noticias07.htm). In this study, the corn grain samples pre-sented a total PAH level of 31.51 μg kg−1 (dry weight basis). Consid-ering the average corn grain total PAH value of 35 μg kg−1 and theaverage corn grain daily intake of 0.05 kg day−1 per capita, it is pos-sible to estimate the PAH daily intake— DI (μg kg−1 day−1 b.w.−1)—by the expression DI = 0:05 × total PAH
70 , resulting in an estimatedtotal PAH daily intake per capita of 0.025 μg kg−1 day−1 b.w.−1
(2.5×10⁻⁵ mg kg−1 day−1 b.w.−1), for corn grains produced in PAHsoil level conditions similar to those shown in Table 1.
The maximum residue level (MRL) allowed for different PAHs hasbeen defined by the Agency for Toxic Substances and Disease Registry(ATSDR, 2010). According to the human oral exposition duration toanthracene, fluoranthene and fluorene, the MRL for these substances are10, 0.4 and 0.4 mg kg−1 day−1, respectively. Consequently, the total PAHlevels in grains of corn plants cultivated in soils with similar PAH levels donot negatively implicate the grain quality for human consumption. The
grains, PAHs concentrations in corn grains [dry weight]: minimum, maximum, averagehe method limit of quantification (NLOQ).
Maximumn=12µg kg−1
Averageµg kg−1
Mediann=12µg kg−1
CountNLOQ
bLOQ – bLOD n.q.bLOQ – bLOD n.q.bLOD – bLOD n.d.bLOD – bLOD n.d.bLOD – bLOD n.d.bLOD – bLOD n.d.bLOD – bLOD n.d.bLOD – bLOD n.d.bLOQ – bLOD n.q.bLOD – bLOD n.d.1.12 1.1 bLOQ 2bLOQ – bLOD n.q.bLOD – bLOD n.d.bLOQ – bLOQ n.q.4.2 3.0 2.9 91.4 1.4 bLOQ 1
an the limit of detection; bLOQ — lower than the limit of quantification.
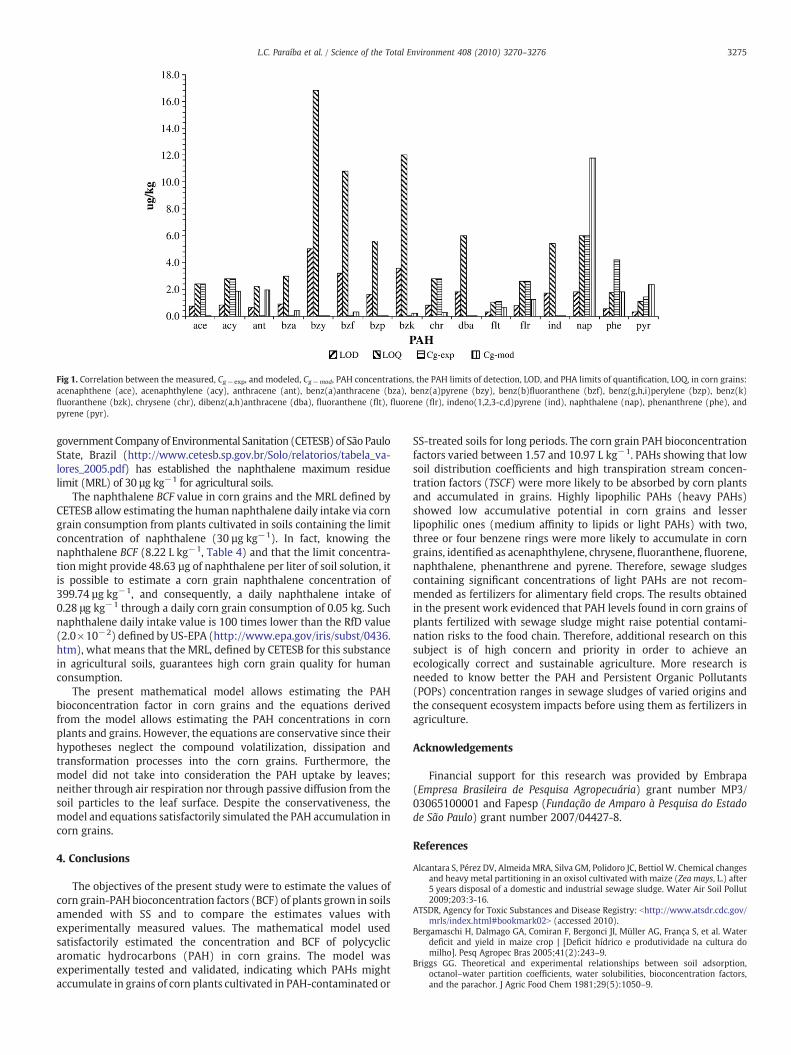
Fig 1. Correlation between the measured, Cg− exp, and modeled, Cg−mod, PAH concentrations, the PAH limits of detection, LOD, and PHA limits of quantification, LOQ, in corn grains:acenaphthene (ace), acenaphthylene (acy), anthracene (ant), benz(a)anthracene (bza), benz(a)pyrene (bzy), benz(b)fluoranthene (bzf), benz(g,h,i)perylene (bzp), benz(k)fluoranthene (bzk), chrysene (chr), dibenz(a,h)anthracene (dba), fluoranthene (flt), fluorene (flr), indeno(1,2,3-c,d)pyrene (ind), naphthalene (nap), phenanthrene (phe), andpyrene (pyr).
3275L.C. Paraíba et al. / Science of the Total Environment 408 (2010) 3270–3276
government Company of Environmental Sanitation (CETESB) of São PauloState, Brazil (http://www.cetesb.sp.gov.br/Solo/relatorios/tabela_va-lores_2005.pdf) has established the naphthalene maximum residuelimit (MRL) of 30 µg kg−1 for agricultural soils.
The naphthalene BCF value in corn grains and the MRL defined byCETESB allow estimating the human naphthalene daily intake via corngrain consumption from plants cultivated in soils containing the limitconcentration of naphthalene (30 µg kg−1). In fact, knowing thenaphthalene BCF (8.22 L kg−1, Table 4) and that the limit concentra-tion might provide 48.63 µg of naphthalene per liter of soil solution, itis possible to estimate a corn grain naphthalene concentration of399.74 µg kg−1, and consequently, a daily naphthalene intake of0.28 μg kg−1 through a daily corn grain consumption of 0.05 kg. Suchnaphthalene daily intake value is 100 times lower than the RfD value(2.0×10⁻²) defined by US-EPA (http://www.epa.gov/iris/subst/0436.htm), what means that the MRL, defined by CETESB for this substancein agricultural soils, guarantees high corn grain quality for humanconsumption.
The present mathematical model allows estimating the PAHbioconcentration factor in corn grains and the equations derivedfrom the model allows estimating the PAH concentrations in cornplants and grains. However, the equations are conservative since theirhypotheses neglect the compound volatilization, dissipation andtransformation processes into the corn grains. Furthermore, themodel did not take into consideration the PAH uptake by leaves;neither through air respiration nor through passive diffusion from thesoil particles to the leaf surface. Despite the conservativeness, themodel and equations satisfactorily simulated the PAH accumulation incorn grains.
4. Conclusions
The objectives of the present study were to estimate the values ofcorn grain-PAH bioconcentration factors (BCF) of plants grown in soilsamended with SS and to compare the estimates values withexperimentally measured values. The mathematical model usedsatisfactorily estimated the concentration and BCF of polycyclicaromatic hydrocarbons (PAH) in corn grains. The model wasexperimentally tested and validated, indicating which PAHs mightaccumulate in grains of corn plants cultivated in PAH-contaminated or
SS-treated soils for long periods. The corn grain PAH bioconcentrationfactors varied between 1.57 and 10.97 L kg−1. PAHs showing that lowsoil distribution coefficients and high transpiration stream concen-tration factors (TSCF) were more likely to be absorbed by corn plantsand accumulated in grains. Highly lipophilic PAHs (heavy PAHs)showed low accumulative potential in corn grains and lesserlipophilic ones (medium affinity to lipids or light PAHs) with two,three or four benzene rings were more likely to accumulate in corngrains, identified as acenaphthylene, chrysene, fluoranthene, fluorene,naphthalene, phenanthrene and pyrene. Therefore, sewage sludgescontaining significant concentrations of light PAHs are not recom-mended as fertilizers for alimentary field crops. The results obtainedin the present work evidenced that PAH levels found in corn grains ofplants fertilized with sewage sludge might raise potential contami-nation risks to the food chain. Therefore, additional research on thissubject is of high concern and priority in order to achieve anecologically correct and sustainable agriculture. More research isneeded to know better the PAH and Persistent Organic Pollutants(POPs) concentration ranges in sewage sludges of varied origins andthe consequent ecosystem impacts before using them as fertilizers inagriculture.
Acknowledgements
Financial support for this research was provided by Embrapa(Empresa Brasileira de Pesquisa Agropecuária) grant number MP3/03065100001 and Fapesp (Fundação de Amparo à Pesquisa do Estadode São Paulo) grant number 2007/04427-8.
References
Alcantara S, Pérez DV, Almeida MRA, Silva GM, Polidoro JC, Bettiol W. Chemical changesand heavy metal partitioning in an oxisol cultivated with maize (Zea mays, L.) after5 years disposal of a domestic and industrial sewage sludge. Water Air Soil Pollut2009;203:3-16.
ATSDR, Agency for Toxic Substances and Disease Registry: bhttp://www.atsdr.cdc.gov/mrls/index.html#bookmark02N (accessed 2010).
Bergamaschi H, Dalmago GA, Comiran F, Bergonci JI, Müller AG, França S, et al. Waterdeficit and yield in maize crop | [Deficit hídrico e produtividade na cultura domilho]. Pesq Agropec Bras 2005;41(2):243–9.
Briggs GG. Theoretical and experimental relationships between soil adsorption,octanol–water partition coefficients, water solubilities, bioconcentration factors,and the parachor. J Agric Food Chem 1981;29(5):1050–9.

3276 L.C. Paraíba et al. / Science of the Total Environment 408 (2010) 3270–3276
Camargo MCR, Toledo MCF. Avaliação da contaminação de diferentes grupos dealimentos por hidrocarbonetos policíclicos aromáticos. Braz J Food Technol 2002;5:19–26.
CETESB (1999). Aplicação de Biossólidos de Sistemas de Tratamento Biológico em ÁreasAgrícolas — Critérios para Projeto e Operação (P4230). São Paulo, Brazil: Availableonline at: bhttp://www.cetesb.sp.gov.br/N.
Chouychai W, Thongkukiatkul A, Upatham S, Lee H, Pokethitiyook P, Kruatrachue M.Phytotoxicity assay of crop plants to phenanthrene and pyrene contaminants inacidic soil. Environ Toxicol 2007;22:597–604.
Collins C, Fryer M, Grosso A. Plant uptake of non-ionic organic chemicals. Environ SciTechnol 2006;40:45–52.
CONAMA, (2006). Conselho Nacional do Meio Ambiente. Resolução no. 375, de 29 deagosto de 2006: define critérios e procedimentos para o uso agrícola de lodos deesgoto gerados em estações de tratamento de esgoto sanitário e seus produtosderivados, e dá outras providências. Available online at: bftp://ftp.sp.gov.br/ftpcomitepcj/Res-CONAMA-375-06.PDFN.
Dettenmaier EM, Doucette WJ, Bugbee B. Chemical hydrophobicity and uptake by plantroots. Environ Sci Technol 2009;43:324–9.
Dynia JF, Souza MD, Boeira RC. Nitrate leaching in a Typic Haplustox planted withmayze after successive applications of sewage sludge | [Lixiviação de nitrato emLatossolo cultivado com milho após aplicações sucessivas de lodo de esgoto]. PesqAgropec Bras 2006;41:855–62.
Environment Canada. Canadian Environmental Protection Act Priority Substances ListAssessment Report: Polycyclic Aromatic Hydrocarbons. Ottawa, Ontario: Ministryof Supply & Services; 1994.
Farhadian A, Jinap S, Faridah A, Sakar ZI. Determination of polycyclic aromatichydrocarbons in grilled meat. Food Control 2010;21:606–10.
Fernandes SAP, Bettiol W, Cerri CC, Camargo P. Sewage sludge effects on gas fluxes atthe soil–atmosphere interface, on soil δ13C and on total soil carbon and nitrogen.Geoderma 2005a;125:49–57.
Fernandes SAP, Bettiol W, Cerri CC. Effect of sewage sludge on microbial biomass, basalrespiration, metabolic quotient and soil enzymatic activity. Appl Soil Ecol2005b;30:65–77.
Ferrarese E, Andreottola G, Oprea IA. Remediation of PAH contaminated sediments bychemical oxidation. J Hazard Mater 2008;152:128–39.
Fismes J, Perrin-Ganier C, Empereur-Bissonnet P, Morel JL. Soil-to-root transfer andtranslocation of polycyclic aromatic hydrocarbons by vegetables grown onindustrial contaminated soils. J Environ Qual 2002;31:1649–56.
Howard PH, Boethling RS, Jarvis WF, Meylan WM, Michalenko EM. Handbook ofenvironmental degradation rates. Chelsea: Lewis Publishers; 1991.
Jones KC, Stratford JA, Tidridge P, Waterhouse KS, Johnston AE. Polynuclear aromatichydrocarbons in an agricultural soil: long-term changes in profile distribution.Environ Pollut 1989;56:337–51.
JonkerMTO. Absorption of polycyclic aromatic hydrocarbons to cellulose. Chemosphere2008;70:778–82.
Juraske R, Antón A, Castells F. Estimating half-lives of pesticides in/on vegetation for usein multimedia fate and exposure models. Chemosphere 2008;70:1748–55.
Kinney CA, Furlong ET, Zaugg SD, Burkhardt MR, Werner SL, Cahill JD, et al. Survey oforganic wastewater contaminants in biosolids destined for land application.Environ Sci Technol 2006;40:7207–15.
Kulhánek A, Trapp S, Sismilich M, Janků J, Zimová M. Crop-specific human exposureassessment for polycyclic aromatic hydrocarbons in Czech soils. Sci Total Environ2005;339:71–80.
Mantovi P, Baldoni G, Toderi G. Reuse of liquid, dewatered, and composted sewagesludge on agricultural land: effects of long-term application on soil and crop. WaterRes 2005;39:289–96.
Meyers PA, Ishiwatari R. Lacustrine organic chemistry: an overview of indicators oforganic matter sources and diagenesis in lake-sediments. Org Geochem 1993;20(7):867–900.
Oleszczuk P. Persistence of polycyclic aromatic hydrocarbons (HPAs) in sewage sludge-amended soils. Chemosphere 2006;65:1616–26.
Oleszczuk P, Baran S. Polycyclic aromatic hydrocarbons content in shoots and leaves ofwillow (Salix viminalis) cultivated on the sewage sludge-amended soil. Water AirSoil Pollut 2005;168:91-111.
Paraíba LC. Pesticide bioconcentration modelling for fruit trees. Chemosphere 2007;66:1468–75.
Paraíba LC, Kataguiri K. Model approach for estimating potato pesticide bioconcentra-tion factor. Chemosphere 2008;73:1247–52.
Rosa JRP, da Silva JHS, Restle J, Pascoal LL, Brondani IL, Alves Filho DC, et al. Evaluation ofsilages of different corn hybrids (Zea mays, L.) by feedlot performance of calves,during the growing phase | [Avaliação da silagem de diferentes híbridos de milho(Zea mays, L.) por meio do desempenho de bezerros confinados em fase decrescimento]. Rev Bras Zootec 2004;33(2):302–12.
Scientific Committee on Food. Opinion of the Scientific Committee on Food on the risksto human health of polycyclic aromatic hydrocarbons in food. SCF/CS/CNTM/PAH/29 Final. Brussels: European Commission, Health and Consumer ProtectionDirectorate-General; 2002.
SRC, Syracuse Research Corporation, (2010) bhttp://www.syrres.com/what-we-do/databaseforms.aspx?id=386N (accessed 10/21/02).
Tao S, Jiao XC, Chen SH, Liu WX, Coveney Jr RM, Zhu LZ, et al. Accumulation anddistribution of polycyclic aromatic hydrocarbons in rice (Oryza sativa). EnvironPollut 2006;140:406–15.
Trapp S. Fruit tree model for uptake of organic compounds from soil and air. SAR QSAREnviron Res 2007;18(3–4):367–87.
Trapp S, McFarlane JC. Plant contamination: modelling and simulation of organicchemical processes. Boca Raton: CRC Press; 1995.
Trapp S, Miglioranza KSB, Mosbæk H. Sorption of lipophilic organic compounds towoodand implications for their environmental fate. Environ Sci Technol 2001;35:1561–6.
Trapp S, Rasmussen D, Samsøe-Petersen L. Fruit tree model for uptake of organiccompounds from soil. SAR QSAR Environ Res 2003;14:17–26.
TsutiyaMT, Comparini JB, Sobrinho AP, Hespanol I, Carvalho PCTde, Melfi AJ. Biossólidosna Agricultura. São Paulo, Brazil: SABESP; 2001.
US-EPA. Provisional guidance for qualitative risk assessment of polycyclic aromatichydrocarbons. Washington, DC: U.S. Environmental Protection Agency. Office ofResearch and Development; 1993 (EPA/600/R-93/089).
Wenzl T, Simon R, Anklam E, Kleiner J. Analytical methods for polycyclic aromatichydrocarbons (PAHs) in food and the environment needed for new food legislationin the European Union. Trends Anal Chem 2006;25(7):716–25.
WHO. Environmental Health Criteria 202: Selected Non-Heterocyclic PolycyclicAromatic Hydrocarbons. Geneva: WHO; 1998.
Zohair A, Salim AB, Soyibo AA, Beck AJ. Residues of polycyclic aromatic hydrocarbons(HPAs), polychlorinated biphenyls (PCBs) and organochlorine pesticides inorganically-farmed vegetables. Chemosphere 2006;63:541–53.