Food ingredients from cultivated seaweeds-Improving storage ...
88
THESIS FOR THE DEGREE OF DOCTOR OF PHILOSOPHY Food ingredients from cultivated seaweeds Improving storage stability and protein recovery HANNA HARRYSSON Food and Nutrition Science Department of Biology and Biological Engineering CHALMERS UNIVERSITY OF TECHNOLOGY Gothenburg, Sweden 2019
-
Upload
khangminh22 -
Category
Documents
-
view
0 -
download
0
Transcript of Food ingredients from cultivated seaweeds-Improving storage ...
THESIS FOR THE DEGREE OF DOCTOR OF PHILOSOPHY
Food ingredients from cultivated seaweeds Improving storage stability and protein recovery
HANNA HARRYSSON
Food and Nutrition Science
Department of Biology and Biological Engineering CHALMERS UNIVERSITY OF TECHNOLOGY
Gothenburg, Sweden 2019

ii
FOOD INGREDIENTS FROM CULTIVATED SEAWEEDS Improving storage stability and protein recovery
HANNA HARRYSSON ISBN: 978-91-7905-144-0
© HANNA HARRYSSON, 2019
Doktorsavhandlingar vid Chalmers Tekniska Högskola Ny serie Nr 4611 ISSN 0346-718X
Department of Biology and Biological Engineering Food and Nutrition Science Chalmers University of Technology SE-412 96 Gothenburg Sweden Telephone: + 46 (0) 31 772 10 00
Cover: Cultivated Porphyra umbilicalis, Ulva lactuca and Saccharina latissima as sources for potential food ingredients. Illustrated by Kenth Harrysson.
Printed by Chalmers Reproservice Gothenburg, Sweden 2019
iii
FOOD INGREDIENTS FROM CULTIVATED SEAWEEDS Improving storage stability and protein recovery
HANNA HARRYSSON
Department of Biology and Biological Engineering Chalmers University of Technology, Gothenburg, Sweden
ABSTRACT
There is a global demand for new vegetarian protein sources, and seaweed have for multiple reasons been identified as a promising candidate. The overall aim of this thesis was to evaluate the potential of three different Swedish seaweed species as food protein sources, but also as sources of unsaturated fatty acids, vitamins and minerals. To accomplish this, the goals were to i) obtain a seaweed biomass high in protein and lipids, ii) find strategies to maintain the quality of the seaweed biomass during drying and storage and iii) develop an efficient method for recovering seaweed proteins.
The protein and lipid content in seaweed is related, e.g. to the nutrient access and physical parameters of the surrounding environment. By applying alterative cultivation, the protein and fatty acid content in U. lactuca were increased 3.4 respective 1.5 times by nitrate addition. Furthermore, the protein content was increased by cultivation at low temperature (12 °C) and light (50 μmol photons m-2 s-1), and the fatty acid content was increased by low light and high temperature (18°C).
The polyunsaturated fatty acids (PUFAs) in seaweed could make the dried biomass susceptible to lipid oxidation, with co-oxidation of pigments and vitamins. However, during long-term storage (≤520 days)
of oven- and freeze-dried P. umbilicalis and U. lactuca, there was only a moderate development of the lipid oxidation-derived aldehydes, malondialdehyde, 4-hydroxy-trans-2-hexenal and 4-hydryoxy-trans-2-nonenal, while there was a great loss of unsaturated fatty acids and ascorbic acid. Light stimulated the fatty acid loss as well as bleaching of chlorophyll.
Several advantages are foreseen from concentrating the seaweed proteins. This calls for food grade and scalable fractionation methods. The pH-shift process, using alkaline protein solubilisation followed by isoelectric precipitation, was in this work adapted and improved for P. umbilicalis, U. lactuca and S. latissima, e.g. by including freeze-thawing-stimulated protein precipitation. When then comparing the new pH-shift process to two other fractionation methods, the pH-shift method resulted in extracts with the highest protein content: 71%, 51% and 41% per dry weight for P. umbilicalis, U. lactuca and S. latissima, respectively. The protein contained 37-41% essential amino acids. The highest achieved protein yields using the pH-shift method were 23%, 6% and 25%, respectively, for the listed species. For U. lactuca, the yield was further raised to 29% by incorporating a pre-incubation step at pH 8.5 prior to further protein solubilisation at pH 12. The pH-shift process was also successfully used as a first step in a sequential recovery of proteins, carrageenan, pectin and cellulose from P. umbilicalis, showing potential as a biorefinery tool. Throughout the work, the effect of different protein analysis methods on the achieved concentrations of protein in seaweed and seaweed protein extracts was evaluated. This revealed that the analytical choice has a profound impact on the results, especially for the extracts.
To summarise, it was possible to increase the level of proteins and lipids in seaweed through alterative cultivation protocols, and the seaweed proteins could then be further concentrated using the pH-shift process. These results strengthen the possibility that seaweed biomass can be a valuable complement to terrestrial vegetarian food protein sources. If considering the seaweed PUFAs as an added value to recover along with proteins, caution must, however, be taken when it comes to pre-processing storage of the seaweed biomass; these nutrients easily degrade during storage of dried seaweeds, especially in the presence of light.
Keywords: Seaweed, macroalgae, proteins, unsaturated fatty acids, lipid oxidation, ascorbic acid, alterative cultivation, long-term storage, protein extraction, pH-shift, sequential recovery

iv
LIST OF PUBLICATIONS
I. Toth, G.B., H. Harrysson, N. Wahlström, J. Olsson, A. Oerbekke, S. Steinhagen, A. Kinnby, J. White, I. Undeland, U. Edlund, E. Albers, H. Pavia, Effects of irradiance, temperature, nutrients, and pCO2 on the growth and biochemical composition of cultivated Ulva fenestrata. Manuscript
II. Harrysson, H., J. Liberg Krook, K. Larsson, C. Tullberg, A. Oerbekke, G.B. Toth, H. Pavia and I. Undeland, Effect of storage conditions on lipid oxidation, nutrient loss and colour of dried seaweeds, Porphyra umbilicalis Kützing and Ulva lactuca Linnaeus, subjected to different pretreatments. Manuscript
III. Harrysson, H., M. Hayes, F. Eimer, N.-G. Carlsson, G. B. Toth and I. Undeland, Production of protein extracts from Swedish red, green, and brown seaweeds, Porphyra umbilicalis Kützing, Ulva lactuca Linnaeus, and Saccharina latissima (Linnaeus) J. V. Lamouroux using three different methods. Journal of Applied Phycology, 2018. 30(6): p. 3565‐3580.
IV. Wahlström, N., H. Harrysson, I. Undeland and U. Edlund, A Strategy for the Sequential Recovery of Biomacromolecules from Red Macroalgae Porphyra umbilicalis Kützing. Industrial & Engineering Chemistry Research, 2018. 57(1): 42-53.
V. Harrysson, H., V.R. Konasani, G.B. Toth, H. Pavia, E. Albers and I. Undeland, Strategies for Improving the Protein Yield in pH-Shift Processing of Ulva lactuca Linnaeus: Effects of Ulvan Lyases, pH-Exposure Time, and Temperature. ACS Sustainable Chemistry & Engineering, 2019. 7(15): p. 12688-12691.
Published paper not included in the thesis:
Larsson, K., H. Harrysson, R. Havenaar, M. Alminger and I. Undeland, Formation of malondialdehyde (MDA), 4-hydroxy-2-hexenal (HHE) and 4-hydroxy-2-nonenal (HNE) in fish and fish oil during dynamic gastrointestinal in vitro digestion. Food & function, 2016. 7(2): p. 1176-1187.
Submitted manuscript not included in the thesis:
Harrysson, H., B. Swolin, M Axelsson M. and I. Undeland, A perfusion model approach to elucidate the role of blood removal for lipid oxidation and color changes in muscle of rainbow trout (Ocorhynchus mykiss).
v
CONTRIBUTION REPORT
Paper I: Hanna Harrysson (HH) participated in the design of the study, analysed the protein content, coordinated the analyses of fatty acids and wrote parts of the manuscript.
Paper II: HH participated in the design of the study, participated in a minor part of the experimental work, interpreted the data and was responsible for writing the manuscript.
Paper III: HH participated in the design of the study, performed the pH-shift experiments, analysed the composition of biomasses and protein extracts, interpreted the data and was responsible for writing the manuscript.
Paper IV: HH performed the pH-shift experiments, analysed the protein content and wrote the protein part of the manuscript.
Paper V: HH planned the design of the study, performed all pH-shift experiments and protein analyses, interpreted the data and was responsible for writing the manuscript.
vi
ABBREVIATIONS
ALA Alfa-linolenic acid ASE Accelerated solvent extraction CEAA Conditionally essential DHA Docosahexaenoic acid DPA Docosapentaenoic acid dw Dry weight EAA Essential amino acids EPA Eicosapentaenoic acid FAME Fatty acid methyl esters FTIR Fourier Transform Infrared HHE 4-hydroxy-trans-2-hexenal HNE 4-hydryoxy-trans-2-nonenal HNMR Nuclear Magnetic Resonance HPAEC-PAD High-Performance Anion Exchange Chromatography with pulsed
Amperiometric Detection LA Linoleic acid LC Long chained LOOH Lipid hydroperoxide MDA Malondialdehyde MUFA Monounsaturated fatty acids n-3 Omega 3 n-6 Omega 6 PLE Pressurised liquid extraction PUFA Polyunsaturated fatty acids PV Peroxide value RT Room temperature SEC Size-Exclusion Chromatography sp. Species (singular) spp. Species (plural) stdv Standard deviation TBARS Thiobarbituric acid reactive substances TCEP Tris[2-carboxyethyl]phosphine hydrochloride TGA Thermogravimetric analysis ww Wet weight

vii
TABLE OF CONTENTS
ABSTRACT .............................................................................................................................. iii
LIST OF PUBLICATIONS ...................................................................................................... iv
CONTRIBUTION REPORT ...................................................................................................... v
ABBREVIATIONS ................................................................................................................... vi
TABLE OF CONTENTS ......................................................................................................... vii
1. INTRODUCTION .............................................................................................................. 1
2. OBJECTIVES ..................................................................................................................... 3
3. BACKGROUND ................................................................................................................ 4
3.1 Seaweed ............................................................................................................................ 4
3.2 Cultivation of seaweed for food use ................................................................................. 5
3.3 Seaweed as food ............................................................................................................... 6
3.3.1 Composition of seaweed ............................................................................................ 6
3.4 Postharvest handling of seaweed and its impact on quality ............................................. 9
3.4.1 Lipid oxidation and its occurrence in seaweed ........................................................ 10
3.5 Use of edible coatings to improve the quality of seaweeds ............................................ 11
3.5.1 Whey-based coatings ............................................................................................... 11
3.6 Protein recovery from seaweed ...................................................................................... 11
3.6.1 Challenges ................................................................................................................ 11
3.6.2 Principles of protein extraction and precipitation .................................................... 11
3.7 Protein analysis methods for seaweed ............................................................................ 12
4. METHODS AND METHODOLOGY CONSIDERATIONS .......................................... 14
4.1 Study design ................................................................................................................... 14
4.2 Seaweed raw material ..................................................................................................... 15
4.2.1 Species used in the different studies ........................................................................ 15
4.3 Cultivation conditions during alterative cultivation of U. lactuca (study I) .................. 16
4.4 Postharvest handling and storage of seaweeds (study II) ............................................... 16
4.4.1 Pretreatments prior to drying ................................................................................... 16
4.4.2 Drying temperatures ................................................................................................. 17
4.4.3 Storage conditions for dried seaweeds ..................................................................... 17
4.5 Methods to determine the seaweeds quality during storage (study II) ........................... 17
4.5.1 Determination of lipid oxidation products ............................................................... 17
4.5.2 Determination of fatty acids ..................................................................................... 18
4.5.3 Determination of ascorbic acid ................................................................................ 18

viii
4.5.4 Determination of colour ........................................................................................... 19
4.6 Methods for recovery of seaweed proteins (studies III-V) ............................................. 20
4.6.1 The traditional method ............................................................................................. 20
4.6.2 The pH-shift process ................................................................................................ 21
4.6.3 The accelerated solvent extraction (ASE) method ................................................... 22
4.6.4 Calculation of achieved protein yield during the recovery processes ...................... 24
4.7 Seaweed polysaccharide extraction methods (study IV) ................................................ 25
4.8 Analysis methods to determine the composition of seaweeds and seaweed extracts (studies I-V) .......................................................................................................................... 25
4.8.1 Protein measurement methods (studies I-V) ............................................................ 25
4.8.2 Estimation of protein nutritional quality .................................................................. 28
4.8.3 Fatty acids (studies I and III) ................................................................................... 28
4.8.4 Ash (studies I-IV) .................................................................................................... 28
4.8.5 Methods for evaluating the polysaccharide extracts (study IV) .............................. 28
4.9 Statistical analysis ........................................................................................................... 29
5. RESULTS AND DISCUSSION ....................................................................................... 30
5.1 Composition of seaweed biomasses (P. umbilicalis, U. lactuca and S. latissima) and effects of cultivation conditions, pretreatments and drying ................................................. 30
5.1.1 Protein ...................................................................................................................... 30
5.1.2 Fatty acids ................................................................................................................ 34
5.1.3 Ash ........................................................................................................................... 37
5.2 Influence of pretreatments, drying techniques and storage conditions on the quality of P. umbilicalis and U. lactuca (study II) .................................................................................... 37
5.2.1 Formation of lipid oxidation products ..................................................................... 37
5.2.2 Fatty acid degradation .............................................................................................. 38
5.2.3 Ascorbic acid ........................................................................................................... 39
5.2.4 Change in colour ...................................................................................................... 41
5.3 Adaption and improvements of the pH-shift process to P. umbilicalis and U. lactuca . 44
5.3.1 The final pH-shift method used (study III) .............................................................. 46
5.4 Influence of analysis method on protein content in seaweeds and protein extracts ....... 47
5.5 Influence of protein extraction method on achieved protein yield ................................. 49
5.5.1 The traditional method (study III) ............................................................................ 49
5.5.2 The pH-shift method (studies III-V) ........................................................................ 50
5.5.3 The ASE method ...................................................................................................... 52
5.6 Differences in protein yield from seaweeds compared to crops and legumes ................ 53
5.7 Composition differences between protein extracts and dry biomasses (study III) ......... 53
ix
5.7.1 Protein content ......................................................................................................... 53
5.7.2 Amino acid composition .......................................................................................... 54
5.7.3 Fatty acid composition ............................................................................................. 55
5.7.4 Ash content .............................................................................................................. 56
5.8 Qualitative characterisation of polysaccharide fractions from the sequential recovery of macromolecules in study IV ................................................................................................. 56
6. CONCLUSIONS ............................................................................................................... 58
7. FUTURE PERSPECTIVES .............................................................................................. 60
8. ACKNOWLEDGEMENTS .............................................................................................. 62
9. REFERENCES ................................................................................................................. 64

x
1
1. INTRODUCTION
By the year 2050, the global population is estimated to be near 10 billion [1], and the food requirement is estimated by FAO [2] to be 60% higher than today. Currently, food production is responsible for up 29% [3] of the emitted greenhouse gases, half of which comes from animal-derived food production [4, 5]. According to the International Water Management Institute, food production is also responsible for 70% [6] of all freshwater used globally. In Europe, 42% of the land area is used for agriculture, and a large portion of the produced crops is used for feed production [7]. Agriculture also consumes large amounts of pesticides [8]. Beyond the environmental effects of livestock production, high meat intake has been associated with a variety of health issues such as cardiovascular diseases and type 2 diabetes [9]. Taken together, the awareness of environmental and health-related consequences of meat consumption have created an increased demand for novel vegetarian protein sources for food, something which is often referred to as the protein shift. However, based on the arguments stated above, terrestrial sources of vegetarian protein need to be supplemented with other sustainable protein sources produced via alternative routes not requiring arable land, freshwater and pesticides.
In the present thesis, it is hypothesised that seaweed could become an important contribution to the protein shift, while also contributing with unsaturated fatty acids, vitamins, and minerals. Some seaweed species contain high levels of proteins (up to 47% of the dry weight (dw)) [10], making them a promising source of vegetable protein. Aquaculture of marine seaweed could, thereby, become a good complement to land-based crops since it does not require the use of freshwater, pesticides and land [11]. A positive side-effect of cultivating seaweed is its ability to counteract eutrophication [12] and remediate carbon dioxide [13, 14]. However, aquaculture of marine seaweed in Sweden is small, despite the long coastline, and there is a need for strategies to establish cultivation techniques to produce a nutrient-rich seaweed biomass suitable for food and feed purposes.
The shelf-life of fresh seaweed is short, ≤ 14 days [15-17]. A challenge to having a large-scale production of food ingredients from seaweed is to find mild and cost-effective preservation and storage solutions to use before processing of the biomass. Currently, sun drying and conventional air-drying are the most common preservation techniques for seaweeds [18]. However, such handling has been shown to affect the quality negatively, e.g. by reducing ascorbic acid and unsaturated fatty acid content [19]. The unsaturated nature of seaweed lipids [20] makes them susceptible to oxidation both during drying and subsequent storage, something that also could initiate co-oxidation of vitamins and pigments. Choe and Oh [21, 22] found that lipid oxidation in dried Porphyra sp. correlated with decreased tocopherol, eicosapentaenoic acid (EPA) and pigment content over two weeks. However, to the best of our knowledge, no studies are published in which lipid oxidation as well as vitamin and pigment losses in dried seaweed are followed during a prolonged storage period.
Despite the relatively high protein content of seaweed, the digestibility of proteins has been described as low due to the tough polysaccharide-rich cell walls [23-29] and abundance of polyphenols [23, 24, 29, 30]. Also, to market seaweed as a protein ingredient, the proteins need to be concentrated, similar to what is done with soy [31, 32]. This applies to both food and feed settings [33]. Therefore, food-grade, scalable, and environmentally friendly techniques for extracting the proteins from the seaweed matrix are desirable. A mapping of the best process-species combinations for extracting proteins from seaweed would be of help when building

2
future seaweed biorefineries. Today, most extraction protocols for seaweed, both for proteins and polysaccharides, target only one compound, which leads to a major waste of biomass. A biorefinery approach with the recovery of many valuable compounds from the harvested biomass would therefore be a more sustainable approach for full seaweed utilisation.
This work has been a part of the larger Sweaweed project which has the overall aim to develop novel strains of Porphyra umbilicalis (red algae) and Ulva lactuca (green algae) and to apply novel techniques for extraction of high-value compounds. U. lactuca in this work refers to the northern-hemisphere U. lactuca, which recently was changed to Ulva fenestrata [34]. However, in this thesis, it will be referred to as U. lactuca for reasons of general understanding. This thesis has focused on seaweeds as a potential food protein source, which also has several added values such as high levels of polyunsaturated fatty acids (PUFAs), vitamins, and minerals. To broaden the variety of seaweed species for this purpose, the brown species Saccharina latissima has also been included for comparative purposes.
3
2. OBJECTIVES
The overall goals of this thesis were to i) achieve a seaweed biomass high in protein and PUFA-rich lipids, ii) evaluate different strategies for retaining the quality of the seaweed raw material during drying and storage and iii) find an efficient method for recovering seaweed proteins, which also could be integrated in a sequential recovery process for seaweed macromolecules. To achieve those goals, the specific objectives were to:
Investigate how the cultivation conditions affect the content of proteins and lipids in U. lactuca. (study I)
Evaluate how drying and storage, with and without different pretreatments, affect composition, lipid oxidation, nutrient loss and the colour of U. lactuca and P. umbilicalis. (study II)
Investigate which total protein yields can be obtained from U. lactuca, P. umbilicalis and S. latissima by using three different protein extraction methods: i) water extraction followed by ammonium sulphate precipitation, ii) pH-shift processing and iii) accelerated solvent extraction (ASE). (study III)
Evaluate how the composition in terms of total proteins, amino acids, fatty acids and ash is changing from the crude seaweeds to the final protein extracts for U. lactuca, P. umbilicalis and S. latissima. (study III)
Investigate how different protein analysis methods affect the achieved protein content in seaweeds and in protein extracts thereof.
Evaluate the power of the pH-shift process as a first step in a sequential recovery of macromolecules from P. umbilicalis. (study IV)
Evaluate the effect of the enzyme ulvan lyase, prolonged pH-exposure and changed time and temperature profiles on the solubility, precipitation and yield of proteins during pH-shift processing of U. lactuca. (study V)
4
3. BACKGROUND
3.1 Seaweed Seaweeds, also called macroalgae, include all multicellular macroscopic algae [35]. Most seaweed are found in the oceans, although there are a few freshwater species. Seaweed have a broad variety of pigments compared to plants since these are needed to accomplish photosynthesis under aquatic conditions. Based on their pigmentation, seaweed are divided into three groups: Rhodophyta (red), Chlorophyta (green) and Ochrophyta (brown) [35].
The seaweed multicellular body is called a thallus and is different from vascular plants in the sense that it lacks conducting tissues and root systems [35]. As a result, uptake of nutrients and water, as well as the photosynthesis, take place all over the algal thallus.
The basic lifecycle pattern of seaweed alters between haploid (n) gametophytes and the diploid (2n) sporophytes [35]. Description of life cycles will be limited to the seaweed groups; within the species used in this work belong to, the red Porphyra, the green Ulva, and the brown Saccharina.
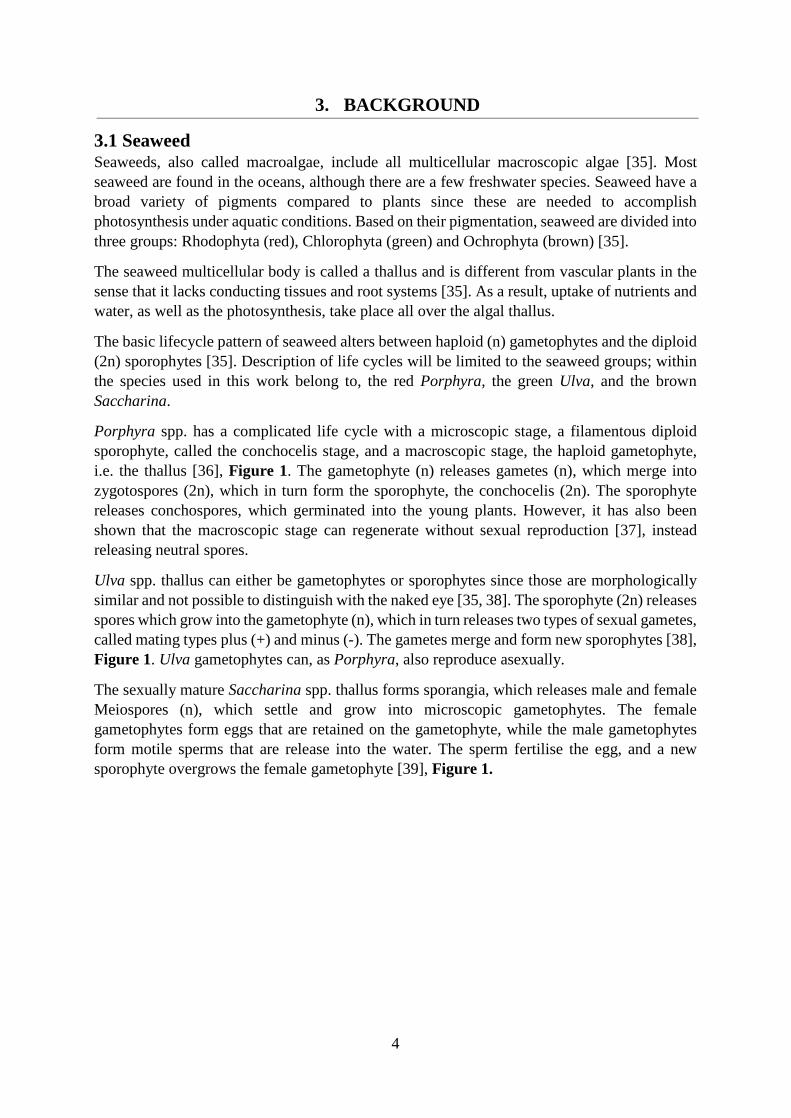
Porphyra spp. has a complicated life cycle with a microscopic stage, a filamentous diploid sporophyte, called the conchocelis stage, and a macroscopic stage, the haploid gametophyte, i.e. the thallus [36], Figure 1. The gametophyte (n) releases gametes (n), which merge into zygotospores (2n), which in turn form the sporophyte, the conchocelis (2n). The sporophyte releases conchospores, which germinated into the young plants. However, it has also been shown that the macroscopic stage can regenerate without sexual reproduction [37], instead releasing neutral spores.
Ulva spp. thallus can either be gametophytes or sporophytes since those are morphologically similar and not possible to distinguish with the naked eye [35, 38]. The sporophyte (2n) releases spores which grow into the gametophyte (n), which in turn releases two types of sexual gametes, called mating types plus (+) and minus (-). The gametes merge and form new sporophytes [38], Figure 1. Ulva gametophytes can, as Porphyra, also reproduce asexually.
The sexually mature Saccharina spp. thallus forms sporangia, which releases male and female Meiospores (n), which settle and grow into microscopic gametophytes. The female gametophytes form eggs that are retained on the gametophyte, while the male gametophytes form motile sperms that are release into the water. The sperm fertilise the egg, and a new sporophyte overgrows the female gametophyte [39], Figure 1.
5
Figure 1: Life cycles of a) Porphyra umbilicalis, b) Ulva lactuca and c) Saccharina latissima.
3.2 Cultivation of seaweed for food use In the past, seaweed for food use was harvested from the natural populations [40], but today, cultivation of seaweed is widely spread, with Asia dominating [41]. The yearly biomass production of seaweed was around 30 million tonnes in 2016 [42] and the five genera � Saccharina, Undaria, Porphyra, Eucheuma/Kappaphycus and Gracilaria � are responsible for 81-98% of this production [40, 43]. In the European countries, there is so far no, or little, cultivation and the seaweed used by the European industry comes mainly from natural populations. Different cultivation techniques, such as tank cultivation and cultivation in ponds offshore have been evaluated, finding that the former has the highest productivity per area unit but a high operational cost [41].
Seaweed aquaculture does not require freshwater or fertilisers and can remediate nutrients such as nitrogen and phosphorous [12] as well as carbon dioxide [13, 14] from the surrounding water. Hereby, seaweed cultivations can counteract eutrophication of the oceans [12, 44] and capture atmospheric carbon dioxide [13, 14]. The productivity of seaweed beds is also often higher than for terrestrial plants [45].
Both Porphyra spp. and Saccharina spp. are cultivated on a large scale, mainly in Asia [43]. For Saccharina spp., the seeding starts with setting of meiospores on seed strings, which later are placed on long lines off shore [43]. Due to the complicated life cycle of Porphyra spp., it requires a two-step cultivation [41]. In nature, the conchocelis grow in shells, something that complicates the cultivation. Simplified, cultivation starts with inserting gametophytes into tanks, whereupon they release spores. The spores then settle on shells, or another artificial substrate [37]. However, the use of free-living conchocelis is also occurring [43]. The conchocelis releases spores, which settle on nets, which later are placed offshore. To control the growth of epiphytes, Porphyra spp. are either desiccated or treated with acid during cultivation [43]. The finding that the macroscopic stage of Porphyra spp. can regenerate without sexual reproduction [37] could possibly simplify the cultivation in the future.
6
Even if Asia dominates seaweed cultivation, several attempts to cultivate both Porphyra spp. and Saccharina spp. have been made in the United States and in several European countries [43], indicating the growing interest in seaweed as a food raw material. Also, several efforts have been made to cultivate species beyond today�s five dominating genera, such as e.g. Ulva species [46-48]. Several Ulva spp. have the ability to grow unattached, which makes them suitable for tank cultivation [49].
3.3 Seaweed as food In the eastern world, seaweed has been used for food since ancient times [43]. In the western world, seaweed in its intact form is mainly used for sushi. However, there is a large industry for the production of thickening ingredients such as agar, alginate and carrageenan [50]. Beyond these hydrocolloids, seaweeds contain numerous other interesting components such as proteins, specific amino acids, lipids, vitamins, minerals and polyphenols, which provide seaweed with nutritious, sensorial and techno-functional properties. The abundance of glutamic acid in seaweed [51-54], the amino acid giving rise to the typical umami taste [55, 56], have led to an increased interest in seaweed within gastronomy [57]. Seaweed extracts have also been attributed e.g. antioxidative [58-61] and anti-inflammatory properties [62]. Further, it is suggested that specific nutrients and bioactive substances make seaweed a potential ingredient in so-called functional foods [63-65], i.e. foods with documented health effects beyond the basic nutritional properties.
3.3.1 Composition of seaweed The variation in macro composition of the three different seaweed groups (red, green and brown) can be seen in Table 1.
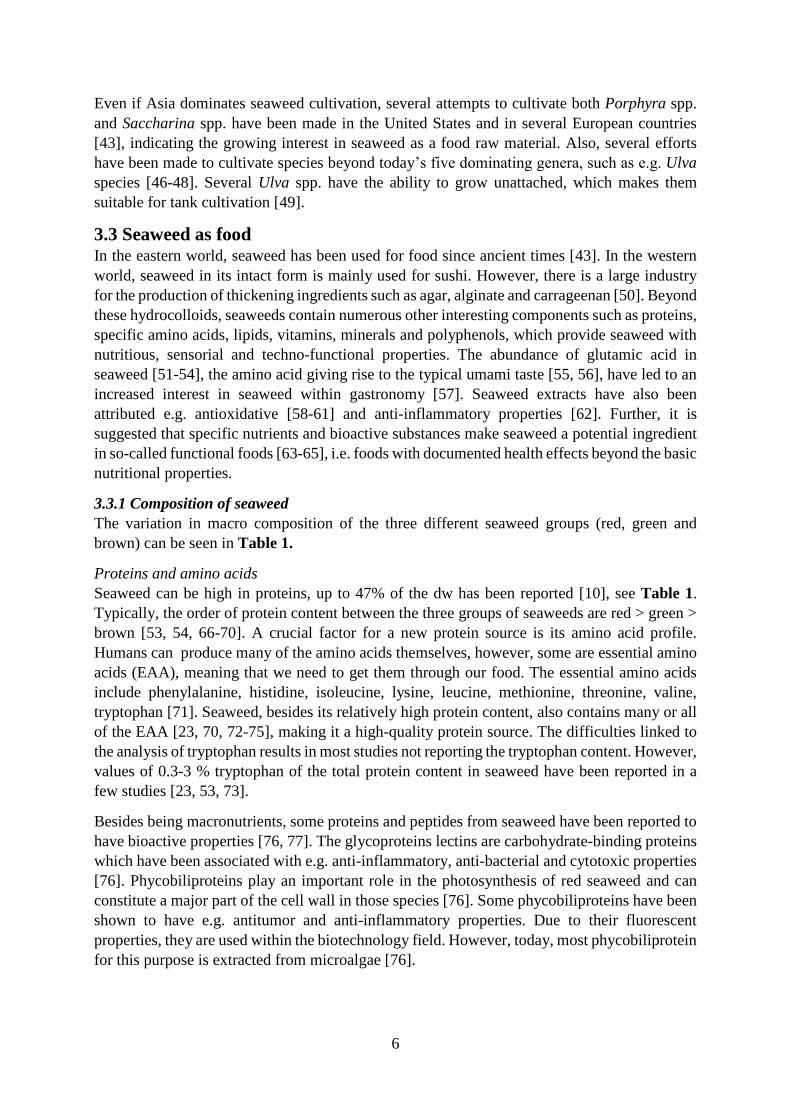
Proteins and amino acids Seaweed can be high in proteins, up to 47% of the dw has been reported [10], see Table 1. Typically, the order of protein content between the three groups of seaweeds are red > green > brown [53, 54, 66-70]. A crucial factor for a new protein source is its amino acid profile. Humans can produce many of the amino acids themselves, however, some are essential amino acids (EAA), meaning that we need to get them through our food. The essential amino acids include phenylalanine, histidine, isoleucine, lysine, leucine, methionine, threonine, valine, tryptophan [71]. Seaweed, besides its relatively high protein content, also contains many or all of the EAA [23, 70, 72-75], making it a high-quality protein source. The difficulties linked to the analysis of tryptophan results in most studies not reporting the tryptophan content. However, values of 0.3-3 % tryptophan of the total protein content in seaweed have been reported in a few studies [23, 53, 73].
Besides being macronutrients, some proteins and peptides from seaweed have been reported to have bioactive properties [76, 77]. The glycoproteins lectins are carbohydrate-binding proteins which have been associated with e.g. anti-inflammatory, anti-bacterial and cytotoxic properties [76]. Phycobiliproteins play an important role in the photosynthesis of red seaweed and can constitute a major part of the cell wall in those species [76]. Some phycobiliproteins have been shown to have e.g. antitumor and anti-inflammatory properties. Due to their fluorescent properties, they are used within the biotechnology field. However, today, most phycobiliprotein for this purpose is extracted from microalgae [76].
7
Table 1: Macro composition and amount of EPA and DHA reported in the literature for red, green and brown seaweed. EPA= eicosapentaenoic acid, DHA= docosahexaenoic acid.
Red Green Brown Protein (% dw)
5-47
[10, 52, 70, 78-81]
3-28
[67, 70, 73, 74, 79, 81-84]
3-20
[52, 70, 74, 78, 80, 81, 85, 86]
Lipids (% dw) 0.3-4
[20, 53, 66, 70, 80, 81, 87]
0.3-8
[20, 66, 68, 70, 73, 74, 80, 81, 84, 87]
0.3-20
[20, 66, 70, 74, 80, 81, 87, 88]
EPA (% of total fatty acids)
8-59
[20, 53, 66, 70, 80, 87]
0.8-6
[20, 66, 68, 70, 74, 80, 87]
2-14
[20, 66, 70, 74, 80, 85, 87, 88]
DHA (% of total fatty acids)
0.0-0.5
[20, 70, 80, 87] 0.0-1.1
[20, 68, 70, 74, 80, 84, 87]
0-13
[20, 70, 74, 80, 85, 87, 88]
Carbohydrates (% dw) 27-68
[52, 66, 78-80] 33-62
[66, 67, 74, 79, 80, 84]
26-69
[52, 66, 74, 78, 80, 85]
Ash (% dw) 7-53
[52, 53, 66, 70, 78-81, 89, 90]
11-78
[66-68, 70, 73, 74, 79-81, 84]
13-44
[52, 66, 70, 74, 78, 80, 81, 85, 86, 90]
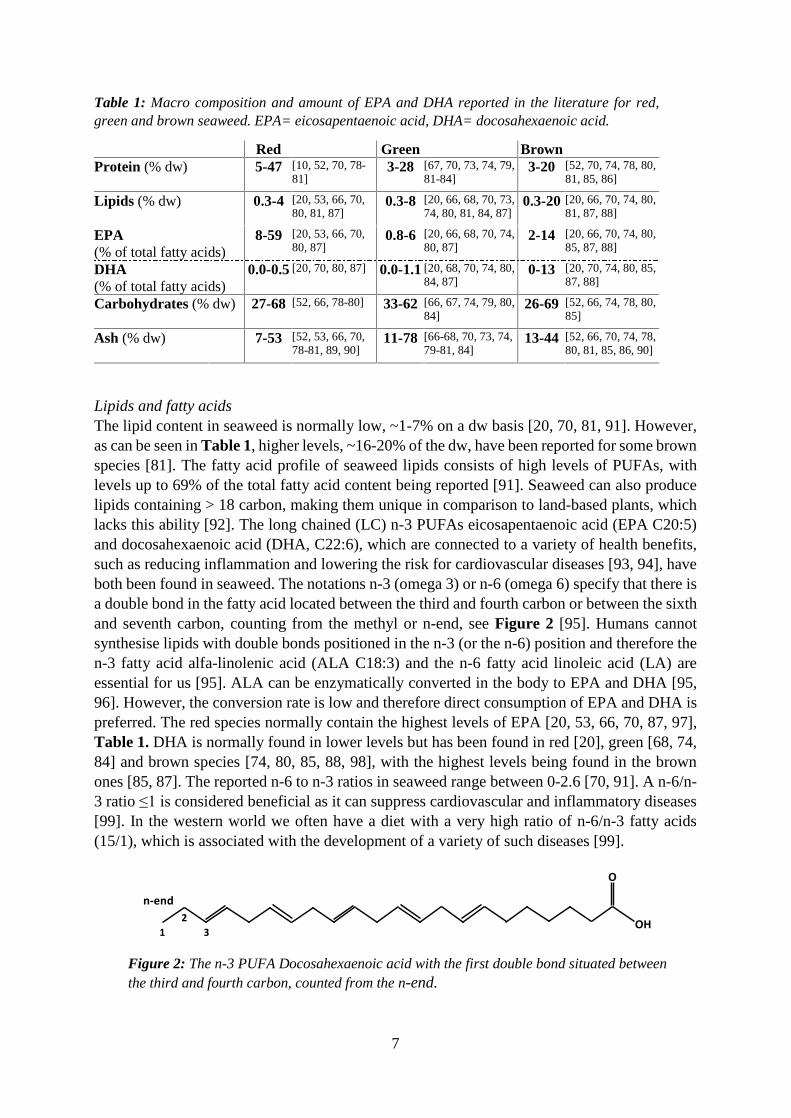
Lipids and fatty acids The lipid content in seaweed is normally low, ~1-7% on a dw basis [20, 70, 81, 91]. However, as can be seen in Table 1, higher levels, ~16-20% of the dw, have been reported for some brown species [81]. The fatty acid profile of seaweed lipids consists of high levels of PUFAs, with levels up to 69% of the total fatty acid content being reported [91]. Seaweed can also produce lipids containing > 18 carbon, making them unique in comparison to land-based plants, which lacks this ability [92]. The long chained (LC) n-3 PUFAs eicosapentaenoic acid (EPA C20:5) and docosahexaenoic acid (DHA, C22:6), which are connected to a variety of health benefits, such as reducing inflammation and lowering the risk for cardiovascular diseases [93, 94], have both been found in seaweed. The notations n-3 (omega 3) or n-6 (omega 6) specify that there is a double bond in the fatty acid located between the third and fourth carbon or between the sixth and seventh carbon, counting from the methyl or n-end, see Figure 2 [95]. Humans cannot synthesise lipids with double bonds positioned in the n-3 (or the n-6) position and therefore the n-3 fatty acid alfa-linolenic acid (ALA C18:3) and the n-6 fatty acid linoleic acid (LA) are essential for us [95]. ALA can be enzymatically converted in the body to EPA and DHA [95, 96]. However, the conversion rate is low and therefore direct consumption of EPA and DHA is preferred. The red species normally contain the highest levels of EPA [20, 53, 66, 70, 87, 97], Table 1. DHA is normally found in lower levels but has been found in red [20], green [68, 74, 84] and brown species [74, 80, 85, 88, 98], with the highest levels being found in the brown ones [85, 87]. The reported n-6 to n-3 ratios in seaweed range between 0-2.6 [70, 91]. A n-6/n-3 ratio ≤1 is considered beneficial as it can suppress cardiovascular and inflammatory diseases [99]. In the western world we often have a diet with a very high ratio of n-6/n-3 fatty acids (15/1), which is associated with the development of a variety of such diseases [99].
Figure 2: The n-3 PUFA Docosahexaenoic acid with the first double bond situated between the third and fourth carbon, counted from the n-end.
n-end
12
3
O
OH

8
Carbohydrates A vast part of the seaweed biomass is made up of polysaccharides, Table 1. However, the types of polysaccharides differ from the ones found in terrestrial plants [100]. The diversity of polysaccharides between seaweed species is high [35] and could be dived into storage polymers and constituents of the cell wall. Respective main storage polymer in red, green and brown seaweed is floridean starch, starch and laminarin [35]. In this thesis work, however, the sulphated polysaccharides making up the cell wall of the seaweeds, such as carrageenan and agar found in red species [35, 101] and alginate found in brown species [35, 102], have been in particular focus. Those polysaccharides have gel-forming properties, which gives both rigidity and elasticity to the cell wall. The polysaccharides are also of great commercial interest [64, 101, 103-105]. Today there is large industry developed to extract carrageenan, agar and alginate from seaweed, based on their use as thickening and emulsifying agents in food and pharmaceutical products [64, 101, 104, 105].
The polysaccharides in green seaweed have not been so thoroughly studied as the polysaccharides found in red and brown seaweed species. However, for green seaweed species, the major polysaccharide in the cell wall is ulvan, which contains glucuronic acid, rhamnose, iduronic acid and xylose [106].
Besides the above-mentioned polysaccharides, cellulose can also be found in the biomass from red, green and brown seaweed [35, 107]. The main source of cellulose today is terrestrial plants [108]. However, it is suggested that some seaweed species could be used for industrial production of cellulose [107].
Micronutrients The term micronutrients includes vitamins and minerals, which are essential for human health. Seaweed contains a variety of vitamins and are especially rich in ascorbic acid, with reported levels ranging between 0.026-3mg/g dw [81, 109]. The highest values in seaweed are not far away from the ascorbic acid content in lemons (4.8mg/g dw), stated by the Swedish Food Agency [110]. Animal-derived food is today an important source of vitamin B12 (cobalamin) [9]. According to the recent report by Parodi et al. [11], the B12 level per gram protein is, however, much higher for S. latissima than for different animal-derived sources. MacArtain [109] reported levels of B12 in seaweed between 0.005-0.63ug/g, where Ulva spp. contained the highest amounts. Other vitamins found in seaweed are e.g. B1 (thiamine), B2 (riboflavin) and E (tocopherol) [111, 112]. Seaweed also contain carotenoids [64] with vitamin A-activity [112].
The mineral content in seaweed is high, which is reflected by high ash content, Table 1. Provided that the minerals are bioavailable, seaweed could therefore be a good source of essential minerals and trace elements. The most abundant minerals are Na, K, Ca, Mg [90, 113]. The high mineral content, together with the high glutamic acid content, make seaweed interesting also from a salt-replacer perspective [114]. High iodine levels have been reported in, especially, brown seaweed species [69, 115, 116]. Iodine is essential for humans but can become toxic in high doses. Therefore, seaweeds, depending on species, could both be a valuable source for iodine but also constitute a risk for a too high iodine intake.
9
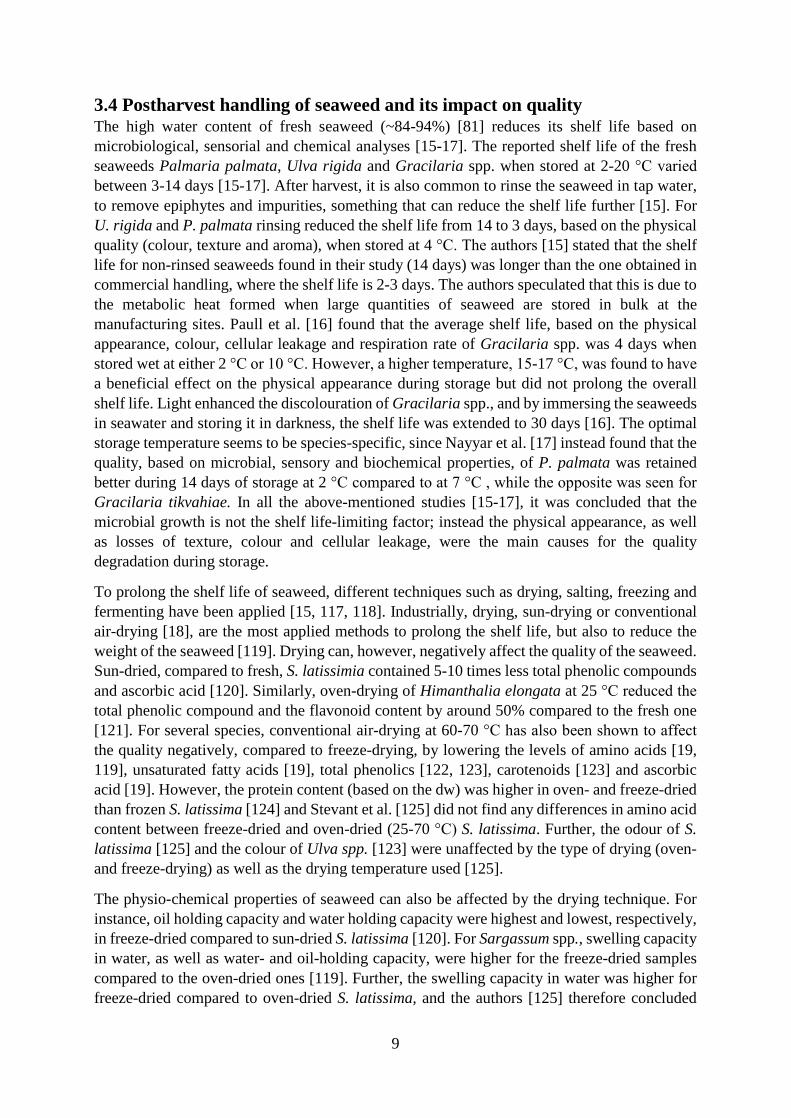
3.4 Postharvest handling of seaweed and its impact on quality The high water content of fresh seaweed (~84-94%) [81] reduces its shelf life based on microbiological, sensorial and chemical analyses [15-17]. The reported shelf life of the fresh seaweeds Palmaria palmata, Ulva rigida and Gracilaria spp. when stored at 2-20 °C varied
between 3-14 days [15-17]. After harvest, it is also common to rinse the seaweed in tap water, to remove epiphytes and impurities, something that can reduce the shelf life further [15]. For U. rigida and P. palmata rinsing reduced the shelf life from 14 to 3 days, based on the physical quality (colour, texture and aroma), when stored at 4 °C. The authors [15] stated that the shelf life for non-rinsed seaweeds found in their study (14 days) was longer than the one obtained in commercial handling, where the shelf life is 2-3 days. The authors speculated that this is due to the metabolic heat formed when large quantities of seaweed are stored in bulk at the manufacturing sites. Paull et al. [16] found that the average shelf life, based on the physical appearance, colour, cellular leakage and respiration rate of Gracilaria spp. was 4 days when stored wet at either 2 °C or 10 °C. However, a higher temperature, 15-17 °C, was found to have
a beneficial effect on the physical appearance during storage but did not prolong the overall shelf life. Light enhanced the discolouration of Gracilaria spp., and by immersing the seaweeds in seawater and storing it in darkness, the shelf life was extended to 30 days [16]. The optimal storage temperature seems to be species-specific, since Nayyar et al. [17] instead found that the quality, based on microbial, sensory and biochemical properties, of P. palmata was retained better during 14 days of storage at 2 °C compared to at 7 °C , while the opposite was seen for
Gracilaria tikvahiae. In all the above-mentioned studies [15-17], it was concluded that the microbial growth is not the shelf life-limiting factor; instead the physical appearance, as well as losses of texture, colour and cellular leakage, were the main causes for the quality degradation during storage.
To prolong the shelf life of seaweed, different techniques such as drying, salting, freezing and fermenting have been applied [15, 117, 118]. Industrially, drying, sun-drying or conventional air-drying [18], are the most applied methods to prolong the shelf life, but also to reduce the weight of the seaweed [119]. Drying can, however, negatively affect the quality of the seaweed. Sun-dried, compared to fresh, S. latissimia contained 5-10 times less total phenolic compounds and ascorbic acid [120]. Similarly, oven-drying of Himanthalia elongata at 25 °C reduced the
total phenolic compound and the flavonoid content by around 50% compared to the fresh one [121]. For several species, conventional air-drying at 60-70 °C has also been shown to affect
the quality negatively, compared to freeze-drying, by lowering the levels of amino acids [19, 119], unsaturated fatty acids [19], total phenolics [122, 123], carotenoids [123] and ascorbic acid [19]. However, the protein content (based on the dw) was higher in oven- and freeze-dried than frozen S. latissima [124] and Stevant et al. [125] did not find any differences in amino acid content between freeze-dried and oven-dried (25-70 °C) S. latissima. Further, the odour of S. latissima [125] and the colour of Ulva spp. [123] were unaffected by the type of drying (oven- and freeze-drying) as well as the drying temperature used [125].
The physio-chemical properties of seaweed can also be affected by the drying technique. For instance, oil holding capacity and water holding capacity were highest and lowest, respectively, in freeze-dried compared to sun-dried S. latissima [120]. For Sargassum spp., swelling capacity in water, as well as water- and oil-holding capacity, were higher for the freeze-dried samples compared to the oven-dried ones [119]. Further, the swelling capacity in water was higher for freeze-dried compared to oven-dried S. latissima, and the authors [125] therefore concluded

10
that, for food applications, freeze-drying or drying at low temperatures (25 °C) is preferred. Abdollahi et al. [124] found higher protein recovery from freeze-dried than oven-dried S. latissima when using the pH-shift method. For Sargassum spp., protein extractability was instead higher for oven-dried than freeze-dried biomass and correlated with a lower phenolic content in the former one [119].
3.4.1 Lipid oxidation and its occurrence in seaweed Lipid oxidation is a chain reaction that can be initiated by free radicals such as the hydroxyl radical (�OH), photosensitisers such as chlorophyll or enzymes such as lipoxygenases [126]. Free radical initiated lipid oxidation is often referred to as autoxidation and results in a lipid radical (L�), which quickly reacts with oxygen, forming a lipid peroxyl radical (LOO�). This
radical in turn extracts hydrogen from another fatty acid, forming a new lipid radical (L�) and
a lipid hydroperoxide (LOOH), which is also called primary lipid oxidation product [127].
Termination can occur when an antioxidant donates hydrogen to a free radical, forming less reactive molecules or when two radicals react with each other [127]. Lipid hydroperoxides are unstable and easily decompose further in the presence of trace metals into secondary lipid oxidation products, such as a variety of aldehydes, ketones and organic acids, which give raise to unpleasant taste and odour, often referred to as rancidity [126]. Both primary and secondary oxidation products can also react with proteins and amino acids forming protein cross-links as well as modifications on the amino acid side chains, which could change both structure and colour [126, 128-130]. During different steps of the lipid oxidation reaction, pigments, antioxidants and vitamins can also co-oxidise with fatty acids, resulting in colour loss and further loss of the nutritional value.
Despite the relatively high amount of PUFAs in seaweed lipids, as well as the presence of e.g. chlorophyll and lipoxygenase [131], lipid oxidation in seaweed is recorded in only a few studies, targeting only primary oxidisation products. In dried Porphyra sp., development of lipid hydroperoxides and conjugated dienes correlated with a decrease in α-tocopherol and polyphenols during both dark and light storage for 14 days at 40 °C [21, 22]. Light stimulated the lipid oxidation along with a decrease in polyphenols and pigments, especially chlorophyll [22]. At aw ≥ 0.51, the formation of hydroperoxides and conjugated dienes, as well as the loss
of EPA, increased remarkably [21]. Although they did not analyse lipid oxidation products, Schmid et al. [132] showed that the PUFA content of freeze-dried Laminaria digitata and P. palamata was less than half of the initial value after 22 months of storage at 20 °C in darkness,
indicating that lipid oxidation has occurred.
To the best of our knowledge, no one has previously analysed any specific oxidation products in seaweed, something that potentially could give valuable information about the route of lipid oxidation in this type of biomass. The aldehydes hydroxy-trans-2-hexenal (HHE), 4-hydroxy-trans-2-nonenal (HNE) and malondialdehyde (MDA) have gained increasing interest in recent years as markers for lipid oxidation [129]. HHE is derived from n-3 fatty acids, whereas HNE is specific for oxidation of n-6 fatty acids [133]. MDA, on the other hand, forms from oxidation of both n-3 and n-6 fatty acids [127]. HHE, HNE and MDA have also received attention due to their high reactivity with e.g. proteins, free amino acids and phospholipids [128] which in vivo can be linked e.g. to cytotoxic, genotoxic and mutagenic effects [134, 135]. HHE, HNE and MDA are known to react with the side chain of lysine, cysteine and histidine and thus induce protein carbonylation [136].
11
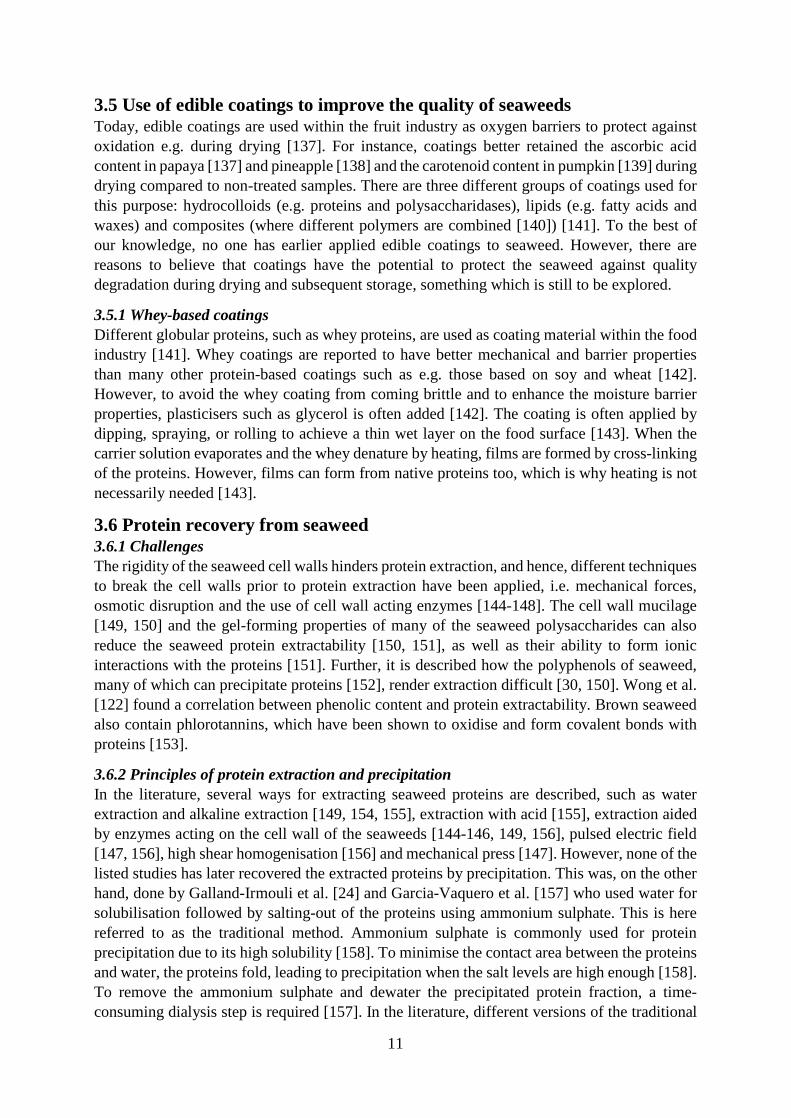
3.5 Use of edible coatings to improve the quality of seaweeds Today, edible coatings are used within the fruit industry as oxygen barriers to protect against oxidation e.g. during drying [137]. For instance, coatings better retained the ascorbic acid content in papaya [137] and pineapple [138] and the carotenoid content in pumpkin [139] during drying compared to non-treated samples. There are three different groups of coatings used for this purpose: hydrocolloids (e.g. proteins and polysaccharidases), lipids (e.g. fatty acids and waxes) and composites (where different polymers are combined [140]) [141]. To the best of our knowledge, no one has earlier applied edible coatings to seaweed. However, there are reasons to believe that coatings have the potential to protect the seaweed against quality degradation during drying and subsequent storage, something which is still to be explored.
3.5.1 Whey-based coatings Different globular proteins, such as whey proteins, are used as coating material within the food industry [141]. Whey coatings are reported to have better mechanical and barrier properties than many other protein-based coatings such as e.g. those based on soy and wheat [142]. However, to avoid the whey coating from coming brittle and to enhance the moisture barrier properties, plasticisers such as glycerol is often added [142]. The coating is often applied by dipping, spraying, or rolling to achieve a thin wet layer on the food surface [143]. When the carrier solution evaporates and the whey denature by heating, films are formed by cross-linking of the proteins. However, films can form from native proteins too, which is why heating is not necessarily needed [143].
3.6 Protein recovery from seaweed 3.6.1 Challenges The rigidity of the seaweed cell walls hinders protein extraction, and hence, different techniques to break the cell walls prior to protein extraction have been applied, i.e. mechanical forces, osmotic disruption and the use of cell wall acting enzymes [144-148]. The cell wall mucilage [149, 150] and the gel-forming properties of many of the seaweed polysaccharides can also reduce the seaweed protein extractability [150, 151], as well as their ability to form ionic interactions with the proteins [151]. Further, it is described how the polyphenols of seaweed, many of which can precipitate proteins [152], render extraction difficult [30, 150]. Wong et al. [122] found a correlation between phenolic content and protein extractability. Brown seaweed also contain phlorotannins, which have been shown to oxidise and form covalent bonds with proteins [153].
3.6.2 Principles of protein extraction and precipitation In the literature, several ways for extracting seaweed proteins are described, such as water extraction and alkaline extraction [149, 154, 155], extraction with acid [155], extraction aided by enzymes acting on the cell wall of the seaweeds [144-146, 149, 156], pulsed electric field [147, 156], high shear homogenisation [156] and mechanical press [147]. However, none of the listed studies has later recovered the extracted proteins by precipitation. This was, on the other hand, done by Galland-Irmouli et al. [24] and Garcia-Vaquero et al. [157] who used water for solubilisation followed by salting-out of the proteins using ammonium sulphate. This is here referred to as the traditional method. Ammonium sulphate is commonly used for protein precipitation due to its high solubility [158]. To minimise the contact area between the proteins and water, the proteins fold, leading to precipitation when the salt levels are high enough [158]. To remove the ammonium sulphate and dewater the precipitated protein fraction, a time-consuming dialysis step is required [157]. In the literature, different versions of the traditional

12
method are described for seaweed, e.g. with solubilisation at alkaline pHs and the use of 2-mercaptoethanol to break disulphide bonds as ways to further increase the yield [30, 159-161]. Protein yields reported with the traditional method range from 5-46% [30, 157, 159, 160]. However, different ways of reporting protein yields (e.g. as per ingoing protein or ingoing total weight) and the lack of definition of the stated yields make direct comparisons difficult. Also, the recovery of alkali extracted proteins using filtration followed by dialysis against water is described [161]. Using this method, the achieved protein extracts contained 86% and 62% protein from Gracilaria spp. and Ulva spp., respectively, compared to 25% and 9%, respectively, in the crude seaweeds.
Another described route for precipitating solubilised seaweed proteins is via isoelectric precipitation [148]. Thus, after separating alkali-solubilised proteins from non-solubles, the pH of the soluble phase is decreased to the isoelectric point of the proteins where the proteins are precipitated. After a centrifugation step, the proteins will end up in the pellet. This strategy is often referred to as the pH-shift method. The pH-shift method with alkaline protein solubilisation followed by isoelectric precipitation has also successfully been used for extracting proteins from fish muscle [162-165], shellfish [166] and soybeans [32]. It has also been used for protein extraction from beans [167] and micro-algae [168]. In 2017, it was applied to seaweed for the first time [148] with the addition of an initial osmotic shock to disrupt the cell walls and facilitate protein solubility. The yield of proteins when S. latissima was subjected to the pH-shift process was 16% based on the initial protein content of the raw material. A similar procedure has been applied to Ulva ohnoi, where first both aqueous and alkaline extracts were prepared, followed by precipitation of the proteins at the isoelectric point [169]. In this study, the reported protein yields were ~12-22%. Veide Vilg and Undeland [148] revealed that the low yields with the pH-shift method, when applied to S. latissima, primarily were due to low yields in the precipitation step rather than the extraction step. Ways of increasing the precipitation by food-grade methods should therefore be developed.
Based on the massive interest in vegetarian proteins, completely new strategies for recovering proteins should be evaluated. One possible principle would be to removed lipids, phlorotannins and carbohydrates via accelerated solvent extraction (ASE), also referred to as pressurised liquid extraction (PLE) [170]. In this technique, solvents are used under both high temperature and pressure [171], decreasing surface tension of the solvents to more easily penetrate the tissue or matrix to be extracted. ASE is fast and demands little solvent compared to other extraction methods [170]. This technique has so far not been used for seaweed protein extraction but could have potential to be tested.
3.7 Protein analysis methods for seaweed There is a variety of methods for quantitative protein determination, and it is well known that the method of choice has an impact on the results [172]. A common method for estimating protein content in seaweed is based on analysis of the total nitrogen. Thereafter, the total protein content is calculated based on a nitrogen-to-protein conversion factor. A common factor used is 6.25. For seaweed, it has, however, been shown that using this factor overestimates the protein content [173], and instead, a universal nitrogen-to-protein conversion of 5 has been suggested by Angell et al. [173]. Colorimetric methods, like Lowry [174], are both sensitive and fast, however, the result can be affected by interfering substances [175]. Amino acid analysis is the most time-consuming protein analysis method. However, amino acid analysis is the only protein measurement method that is not affected by interfering substances, such as

13
pigments [172] and non-protein nitrogen. Analysis of the total amino acid content is also used as a reference method when compiling nitrogen-to-protein conversion factors [72, 75, 82, 176].
14
4. METHODS AND METHODOLOGY CONSIDERATIONS
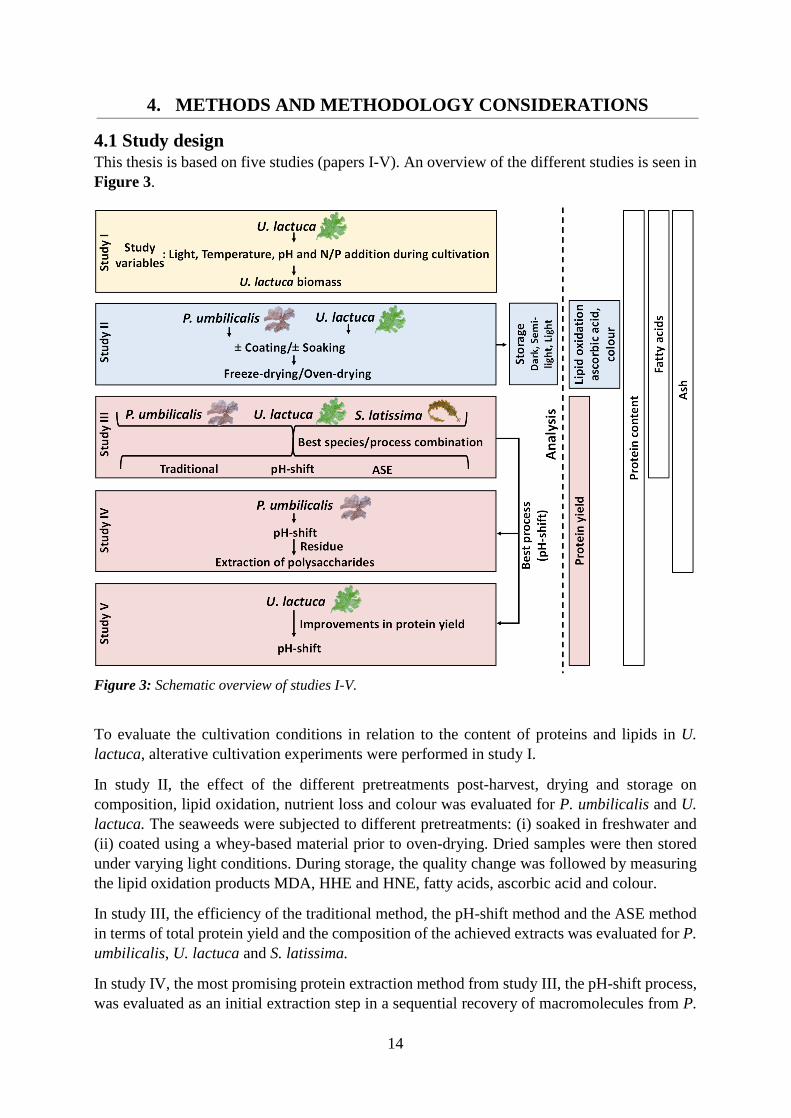
4.1 Study design This thesis is based on five studies (papers I-V). An overview of the different studies is seen in Figure 3.
Figure 3: Schematic overview of studies I-V.
To evaluate the cultivation conditions in relation to the content of proteins and lipids in U. lactuca, alterative cultivation experiments were performed in study I.
In study II, the effect of the different pretreatments post-harvest, drying and storage on composition, lipid oxidation, nutrient loss and colour was evaluated for P. umbilicalis and U. lactuca. The seaweeds were subjected to different pretreatments: (i) soaked in freshwater and (ii) coated using a whey-based material prior to oven-drying. Dried samples were then stored under varying light conditions. During storage, the quality change was followed by measuring the lipid oxidation products MDA, HHE and HNE, fatty acids, ascorbic acid and colour.
In study III, the efficiency of the traditional method, the pH-shift method and the ASE method in terms of total protein yield and the composition of the achieved extracts was evaluated for P. umbilicalis, U. lactuca and S. latissima.
In study IV, the most promising protein extraction method from study III, the pH-shift process, was evaluated as an initial extraction step in a sequential recovery of macromolecules from P.

15
umbilicalis. The residue from the pH-shift process was used for further extraction of carrageenan, pectin and cellulose.
In study V, strategies to improve the protein yield during the pH-shift process for U. lactuca was investigated. The strategies evaluated were: i) addition of the enzyme ulvan lyase, ii) prolonged incubation at pH 8.5 and iii) different temperatures.
4.2 Seaweed raw material All seaweeds used in this work were cultivated at the Sven Loven Center for Marine Infrastructure at Tjärnö, Sweden (58°52�33.2724��N, 11°8�47.202��E). U. lactuca and S. latissima were both fully cultivated in indoor tanks. For P. umbilicalis, turfs were collected for study II at Tjärnö (58°52�33.272�N, 11°8�47.202�E), and for study III at Inre Vattenholmen (58°52.622N; 11°6.876E), rinsed to remove epiphytes and further tank-cultivated.
In study I, light intensity, temperature, pCO2 and the addition of nitrate and phosphate were varied to evaluate the effect of those parameters on growth rate and the intracellular concentration of protein, lipids and carbohydrates in U. lactuca. In studies II-IV, seaweeds were grown under a neutral light cycle (16 h daylight, 8 h darkness) in a light intensity of 50µM
photons m-2s-1 at 12 °C. During cultivation, the seaweeds received continuous filtered (1 µm)
seawater without additional medium. The same biomass was used in studies III and IV. In study V, the light intensity used was 140µM photons m-2s-1; otherwise, the conditions were the same as in study II-IV.
After harvest, all seaweeds were dried (oven-dried in studies I and V and freeze- dried in studies III and IV) and ground using a coffee grinder. For study II, where drying per se was evaluated, both freeze-dried and oven-dried samples were prepared. In this study, the seaweeds were stored whole and milled after the storage. For all studies (I-V), the milled samples were kept at -80 °C until further process or analysis.
4.2.1 Species used in the different studies The cultivation experiments in study I were performed on U. lactuca alone. This was because P. umbilicalis could not be kept alive during tank cultivation for a prolonged time and eventually collapsed, probably due to the need for that species to dry out regularly.
Study II comprised both P. umbilicalis and U. lactuca, since their lipid composition, as well as pigments, vary a lot, and hence they were therefore expected to respond differently, both during drying and storage.
To evaluate how seaweeds from the three main groups red, green and brown, responded to different protein extraction methods (the traditional method, the pH-shift method and the ASE method) the brown species S. latissima was also included in study III (together with P. umbilicalis and U. lactuca). Even if the protein content in S. latissima is normally lower than in P. umbilicalis and U. lactuca, the productivity of biomass per area is high [177, 178], making S. latissima a promising alternative for protein production, in addition to the well-established alginate production [64].
P. umbilicalis was used in study IV for a sequential recovery of proteins, carrageenan, pectin and cellulose, since the results from study III, showed that P. umbilicalis was the species resulting in the protein extract with highest protein concentration. Further, P. umbilicalis is rich in carrageenan, an already commercial polysaccharide [64, 101].
16
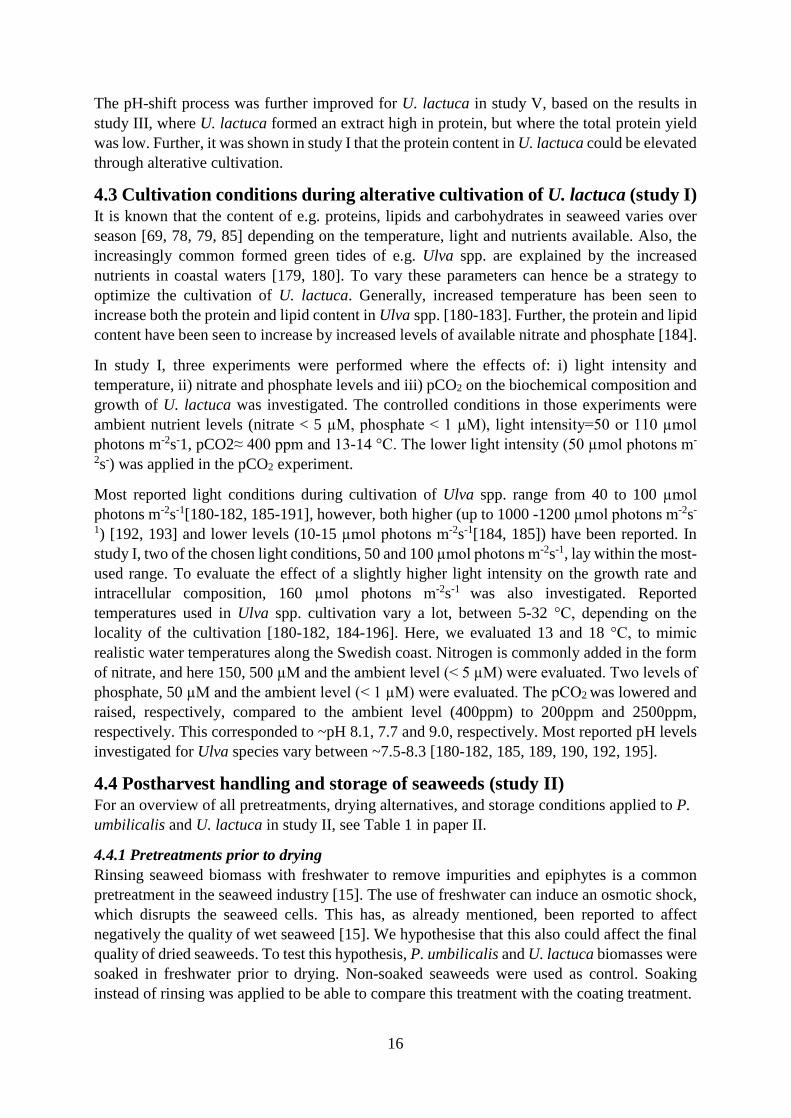
The pH-shift process was further improved for U. lactuca in study V, based on the results in study III, where U. lactuca formed an extract high in protein, but where the total protein yield was low. Further, it was shown in study I that the protein content in U. lactuca could be elevated through alterative cultivation.
4.3 Cultivation conditions during alterative cultivation of U. lactuca (study I) It is known that the content of e.g. proteins, lipids and carbohydrates in seaweed varies over season [69, 78, 79, 85] depending on the temperature, light and nutrients available. Also, the increasingly common formed green tides of e.g. Ulva spp. are explained by the increased nutrients in coastal waters [179, 180]. To vary these parameters can hence be a strategy to optimize the cultivation of U. lactuca. Generally, increased temperature has been seen to increase both the protein and lipid content in Ulva spp. [180-183]. Further, the protein and lipid content have been seen to increase by increased levels of available nitrate and phosphate [184].
In study I, three experiments were performed where the effects of: i) light intensity and temperature, ii) nitrate and phosphate levels and iii) pCO2 on the biochemical composition and growth of U. lactuca was investigated. The controlled conditions in those experiments were ambient nutrient levels (nitrate < 5 µM, phosphate < 1 µM), light intensity=50 or 110 µmol
photons m-2s-1, pCO2≈ 400 ppm and 13-14 °C. The lower light intensity (50 µmol photons m-
2s-) was applied in the pCO2 experiment.
Most reported light conditions during cultivation of Ulva spp. range from 40 to 100 µmol
photons m-2s-1[180-182, 185-191], however, both higher (up to 1000 -1200 µmol photons m-2s-
1) [192, 193] and lower levels (10-15 µmol photons m-2s-1[184, 185]) have been reported. In study I, two of the chosen light conditions, 50 and 100 µmol photons m-2s-1, lay within the most-used range. To evaluate the effect of a slightly higher light intensity on the growth rate and intracellular composition, 160 µmol photons m-2s-1 was also investigated. Reported temperatures used in Ulva spp. cultivation vary a lot, between 5-32 °C, depending on the
locality of the cultivation [180-182, 184-196]. Here, we evaluated 13 and 18 °C, to mimic
realistic water temperatures along the Swedish coast. Nitrogen is commonly added in the form of nitrate, and here 150, 500 µM and the ambient level (< 5 µM) were evaluated. Two levels of
phosphate, 50 µM and the ambient level (< 1 µM) were evaluated. The pCO2 was lowered and raised, respectively, compared to the ambient level (400ppm) to 200ppm and 2500ppm, respectively. This corresponded to ~pH 8.1, 7.7 and 9.0, respectively. Most reported pH levels investigated for Ulva species vary between ~7.5-8.3 [180-182, 185, 189, 190, 192, 195].
4.4 Postharvest handling and storage of seaweeds (study II) For an overview of all pretreatments, drying alternatives, and storage conditions applied to P. umbilicalis and U. lactuca in study II, see Table 1 in paper II.
4.4.1 Pretreatments prior to drying Rinsing seaweed biomass with freshwater to remove impurities and epiphytes is a common pretreatment in the seaweed industry [15]. The use of freshwater can induce an osmotic shock, which disrupts the seaweed cells. This has, as already mentioned, been reported to affect negatively the quality of wet seaweed [15]. We hypothesise that this also could affect the final quality of dried seaweeds. To test this hypothesis, P. umbilicalis and U. lactuca biomasses were soaked in freshwater prior to drying. Non-soaked seaweeds were used as control. Soaking instead of rinsing was applied to be able to compare this treatment with the coating treatment.
17
According to the suppliers of the whey coating, the coating should be dissolved in freshwater. However, to also investigate whether the type of water used for the coating solution had any effect on the final quality, the whey coating was dissolved in both fresh- and saltwater before the seaweeds were merged into the solutions.
4.4.2 Drying temperatures In previous studies addressing the effect of drying on seaweed quality, the used temperatures vary between 25-80°C [19, 119-121, 123, 125, 197, 198]. In study II, we dried the seaweed at 40 °C based on the sensitivity of both ascorbic acid and unsaturated lipids to elevated
temperatures, and further to avoid negative changes in the protein fraction, such as formation of di-sulphide bonds. Also, the supplier of the whey-based coating suggested 40 °C as an
appropriate drying temperature. Since several earlier studies have reported negative effects on the quality of seaweed from oven-drying [19, 119, 122, 123], freeze-drying was included as a control in study II.
4.4.3 Storage conditions for dried seaweeds In study II, storage of the dried seaweeds was done in room temperature (RT) to mimic the storage conditions used by a supplier, in supermarkets, or by consumers after purchase.
The effect of light on the quality of seaweed during storage is, to date, not well studied and therefore we evaluated different degrees of light during storage of the dried U. lactuca and P. umbilicalis. Our hypothesis was that light would enhance both lipid oxidation and the degradation of ascorbic acid. At the start of the storage, complete darkness and semi-light conditions were used. The latter were obtained in a room with windows and with occasional extra light from lamps. No constant light intensity was thus achievable. To fully investigate our hypothesis, a portion of the samples was therefore moved after 90 days from the dark storage to a locality without windows, where light (869±9 LUX) was turned on for 24 hours. This
resulted in three storage conditions: dark, semi-light and light (after first 90 days of dark storage).
4.5 Methods to determine the seaweeds quality during storage (study II) 4.5.1 Determination of lipid oxidation products There are several methods for analysing lipid oxidation. The primary oxidation products, i.e. the LOOH, can be analysed colorimetrically after reaction with ferric thiocyanate [199], referred to as the peroxide value (PV). Carbonyls can also be analysed colorimetrically after reaction with thiobarbituric acid [200], as a measurement of secondary oxidation products. The method is referred to as the thiobarbituric acid reactive substances (TBARS) test. Both PV and TBARS are among the most common measures of lipid oxidation in foods. However, the strong pigments in seaweed make many colorimetric methods incompatible with this kind of biomass. In study II, the specific oxidation-derived aldehydes MDA, HHE and HNE were therefore analysed by an LC-MS method developed in-house [201]. Analyses were done directly after drying as well as regularly during the storage. It is important to stress that this method analyses free aldehydes and hence, aldehydes that have bound to e.g. proteins were not detected.
18
4.5.2 Determination of fatty acids Fatty acids of dried seaweeds were directly trans-esterified based on the earlier work on microalgae by Cavonius et al. (2014). The fatty acid methyl esters (FAME) were further analysed using GC-MS. Direct transesterification requires less solvent and is faster than the more traditional method, which first extracts the lipids using chloroform and methanol according to e.g. Bligh and Dyer [202] or Folch et al. [203] followed by esterification. In study II, fatty acids were analysed both before and after one year of storage, to follow tentative degradation.
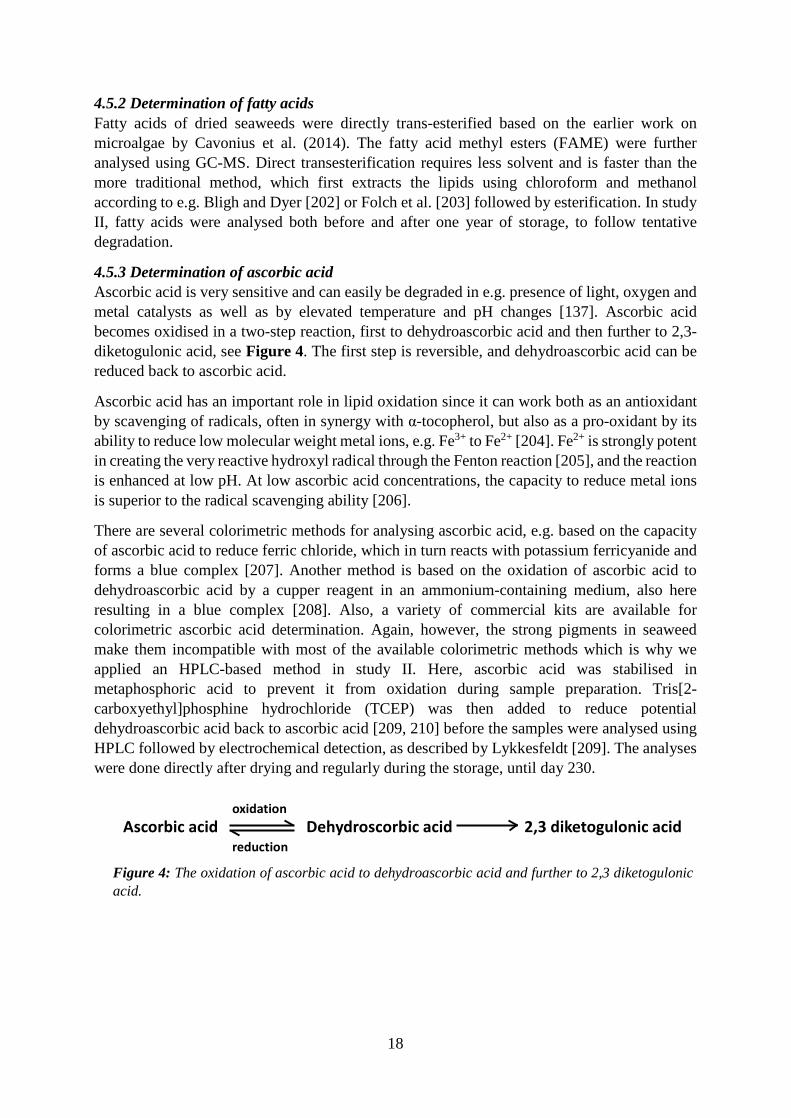
4.5.3 Determination of ascorbic acid Ascorbic acid is very sensitive and can easily be degraded in e.g. presence of light, oxygen and metal catalysts as well as by elevated temperature and pH changes [137]. Ascorbic acid becomes oxidised in a two-step reaction, first to dehydroascorbic acid and then further to 2,3-diketogulonic acid, see Figure 4. The first step is reversible, and dehydroascorbic acid can be reduced back to ascorbic acid.
Ascorbic acid has an important role in lipid oxidation since it can work both as an antioxidant by scavenging of radicals, often in synergy with α-tocopherol, but also as a pro-oxidant by its ability to reduce low molecular weight metal ions, e.g. Fe3+ to Fe2+ [204]. Fe2+ is strongly potent in creating the very reactive hydroxyl radical through the Fenton reaction [205], and the reaction is enhanced at low pH. At low ascorbic acid concentrations, the capacity to reduce metal ions is superior to the radical scavenging ability [206].
There are several colorimetric methods for analysing ascorbic acid, e.g. based on the capacity of ascorbic acid to reduce ferric chloride, which in turn reacts with potassium ferricyanide and forms a blue complex [207]. Another method is based on the oxidation of ascorbic acid to dehydroascorbic acid by a cupper reagent in an ammonium-containing medium, also here resulting in a blue complex [208]. Also, a variety of commercial kits are available for colorimetric ascorbic acid determination. Again, however, the strong pigments in seaweed make them incompatible with most of the available colorimetric methods which is why we applied an HPLC-based method in study II. Here, ascorbic acid was stabilised in metaphosphoric acid to prevent it from oxidation during sample preparation. Tris[2-carboxyethyl]phosphine hydrochloride (TCEP) was then added to reduce potential dehydroascorbic acid back to ascorbic acid [209, 210] before the samples were analysed using HPLC followed by electrochemical detection, as described by Lykkesfeldt [209]. The analyses were done directly after drying and regularly during the storage, until day 230.
Figure 4: The oxidation of ascorbic acid to dehydroascorbic acid and further to 2,3 diketogulonic acid.
Ascorbic acid Dehydroscorbic acid 2,3 diketogulonic acidoxidation
reduction
19
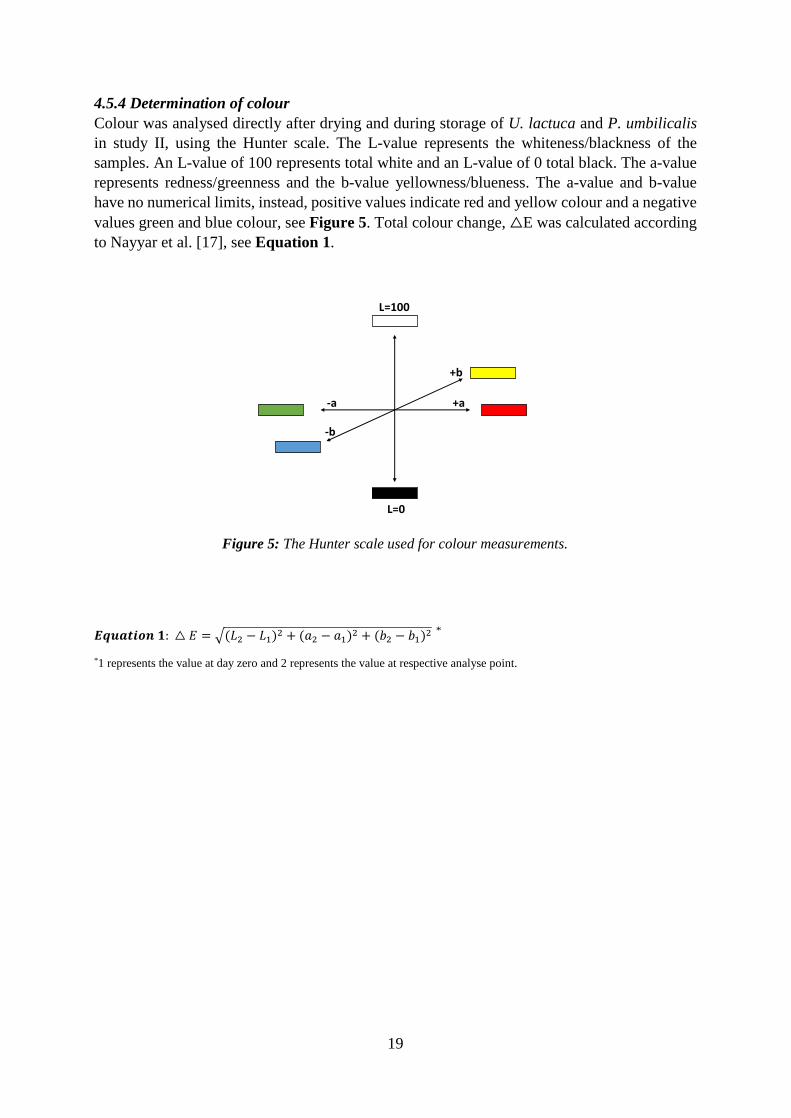
4.5.4 Determination of colour Colour was analysed directly after drying and during storage of U. lactuca and P. umbilicalis in study II, using the Hunter scale. The L-value represents the whiteness/blackness of the samples. An L-value of 100 represents total white and an L-value of 0 total black. The a-value represents redness/greenness and the b-value yellowness/blueness. The a-value and b-value have no numerical limits, instead, positive values indicate red and yellow colour and a negative values green and blue colour, see Figure 5. Total colour change, △E was calculated according to Nayyar et al. [17], see Equation 1.
Figure 5: The Hunter scale used for colour measurements.
: △ = ( − ) + ( − ) + ( − ) * *1 represents the value at day zero and 2 represents the value at respective analyse point.
+b
-b
+a-a
L=100
L=0

20
4.6 Methods for recovery of seaweed proteins (studies III-V) In study III, three different techniques were used for recovery of the seaweed proteins: i) the more traditional method with water extraction and ammonium sulphate precipitation, ii) the pH-shift process, commonly used for extracting proteins from e.g. soybeans or fish muscle, and iii) the ASE technique, which has not previously been used for seaweed protein extraction.
4.6.1 The traditional method The traditional method, as earlier described by Galland-Irmouli [24], with solubilisation of the proteins in water followed by salting-out using ammonium sulphate, was applied in study III. This method [24, 157] or variations of it [30, 159-161] has been used several times for protein recovery from seaweed but not for P. umbilicalis and S. latissima. To aid the extraction of proteins into water, sonication was used, and centrifugation was applied to remove non-solubles, Figure 6. The supernatant was saved, and the pellet subjected to a second extraction, and the achieved supernatant was pooled with the first one. Ammonium sulphate (80%w/v) was then added to the pooled supernatants followed by stirring and centrifugation. The recovered pellet was dialysed against Milli-Q water to get rid of the ammonium sulphate.
Figure 6: Schematic picture over the traditional method used for protein extraction from Porphyra umbilicalis, Ulva lactuca and Saccharina latissimia in study III. Green boxes indicate the fractions of the extractable proteins.
Ultrasonication of seaweed in water
Stirring
Centrifugation
Centrifugation
SupernatantContaining soluble proteins
Pellet 1
Supernatant 2Pellet 2Containing proteins
Ammonium sulphate (80% w/v)
Dialysis
Recovered proteins
Stirring

21
4.6.2 The pH-shift process The pH-shift method, with the addition of an initial osmotic shock, was recently shown to be a promising method for extracting proteins from S. latissima [148] and was therefore chosen to be applied in study III. The process has also been scaled up with success for e.g. soybean and fish and is Generally Regarded as Safe (GRAS), which is important in order to be applied in human food production.
Since the method had not previously been applied to either P. umbilicalis or U. lactuca, the method had first to be adapted to those species (study III). The protocol described by Veide Vilg and Undeland for S. latissima was used as a basis [148], see Figure 7. Initially, the seaweeds were homogenised in distilled water (homogenate). Thereafter, the proteins were solubilised at alkaline conditions for 20 minutes, followed by centrifugation to recover the solubilised proteins into the supernatant (supernatant 1), while insoluble material precipitated into a pellet (pellet 1). In the third step of the process, the pH of supernatant 1 was decreased to the isoelectric point of the proteins. After a second centrifugation step, the proteins were recovered into the pellet (pellet 2).
The adaption of the pH-shift protocol to P. umbilicalis and U. lactuca included finding the optimal pHs for protein solubilisation and precipitation for the two species. The adaption of the process was done using 4 volumes of water based on the dw of each of the two species, which was the same amount of water used as when the process was adapted to S. latissima [148]. Also, according to Veide Vilg and Undeland [148], the homogenisation of the seaweed in distilled water was followed by an incubation period (1h), exerting an osmotic shock which disrupts the cell walls. Solubility maxima (within the pH-range 2-13) and precipitation maxima (within the pH-range 1.5-8 for P. umbilicalis and 1.5-7 for U. lactuca) were then investigated. The protein solubility and precipitation at respective pH were calculated according to Equations 2-3. Based on the conclusion of Veide Vilg and Undeland [148] that the protein yield increases with increased amounts of water in the solubility step, a higher ratio of water was investigated also for P. umbilicalis and U. lactuca (6 volumes vs. 4 volumes). To increase the yield further, a freeze-thawing step was added between the adjustment of supernatant 1 to pH 2 and the second centrifugation step in order to stimulate precipitation of proteins. The effect of freeze-thawing was also investigated for S. latissima.
Different terminology in the literature concerning protein extraction could lead to confusion. As mentioned earlier, many have done protein extraction with no further recovery of the extracted proteins [144-147, 149, 154-156]. The extractability of proteins in many studies could therefore be compared to what in this thesis work is referred to as the solubility (Equation 2) or yield 1 (Equation 7) during the pH-shift process, depending on how the calculations were done in the specific study.
: = 100 ∗ 1 ℎ
: = 100 ∗ 1 − 2 1

22
In study IV, the adapted pH-shift process from study III was applied to P. umbilicalis followed by a series of extractions of the polysaccharides: carrageenan, pectin and cellulose (section 4.7).
In study V, the pH-shift process was further improved for U. lactuca. A recent study [211] described a novel ulvan lyase from the bacteria Formosa agariphila, which was overexpressed in a strain of the bacteria Escherichia coli and subsequently purified. The ulvan lyase enzyme is specific against ulvan, which is the major polysaccharide in U. lactuca [106]. By applying the ulvan lyase in the first step of the pH-shift process, it was hypothesised that the enzyme should hydrolyse the ulvan in the U. lactuca cell wall and hence aid the protein solubility. To adjust the process conditions to the use of enzymes, also the effect of an extract incubation step at pH 8.5 during the first solubility step and different process temperatures were examined.
Figure 7: Schematic picture over the pH-shift process. The figure is based on the procedure described by Veide Vilg and Undeland [148] which was used when adapting/improving the process for Porphyra umbilicalis, Ulva lactuca and Saccharina latissimia in study III. Green boxes indicate the fractions of the extractable proteins.
4.6.3 The accelerated solvent extraction (ASE) method The ASE method has earlier been used for extraction of e.g. fucoxanthin [212] and polyphenols [213, 214] from seaweed, but not proteins. The idea behind using it for protein extraction in study III was the possible advantage of a sequential recovery of lipids and proteins. Also, the possible separation of phlorotannins from S. latissima before protein recovery could have a positive impact on the digestibility of the achieved protein extract. Food-grade solvents could be used during the process, and the method produces little waste [171]. Before protein extraction, the seaweed samples were de-fatted using hexane, after which carbohydrates and
Step 3
Step 2
Homogenization of seaweed in water
Solubilization of proteins at alkaline pH
Centrifugation
Precipitation of proteins at the isoelectric point
Centrifugation
Step 1
Supernatant 1Containing soluble proteins
Pellet 1Insoluble material
Supernatant 2Pellet 2Recovered proteins
Withdraw
samples for analysis of protein content for
calculating protein solubility, precipitation and yield

23
phlorotannins were extracted together using ASE with 70% acetone. The residual was extracted for proteins using ASE with 50% methanol as solvent, Figure 8.
Figure 8: Schematic picture of the ASE method, which was used for extracting proteins from Porphyra umbilicalis, Ulva lactuca and Saccharina latissimia in study III. Green boxes indicate the fractions of the extractable proteins.
Seaweed
HexaneLipids
Defatted Seaweed
AcetonePhlorotannins/
Carbohydrates fraction
Residue containing proteins
Protein fraction
Evaporation of methanol
Recovered proteins
Methanol
Final residue
Extr
acti
on u
nder
hig
h pr
essu
re

24
4.6.4 Calculation of achieved protein yield during the recovery processes In the literature, yields from seaweed protein extractions are commonly reported in three different ways. The first way is weight yield (Equation 4), not taking the protein concentration of the starting material or extract into account. The second way is using the amount of extracted proteins divided by the amount of protein present in the raw material from the start (Equation 5), i.e. the true protein yield, sometimes also referred to as percent recovered proteins. A third way is to divide the absolute amount of protein extracted by the weight of the starting material (Equation 6). Since the protein concentration in the achieved extracts was of high importance in study III, and since study IV focused on how much of the initial seaweed proteins we could recover, we have calculated the true protein yield, according to Equation 5. However, during adaption of the pH-shift process protocol to U. lactuca and P. umbilicalis in study III and during improvements of the process for U. lactuca in study V, we chose to use Equations 7-9 to calculate the true protein yield. This was because we thereby could base the yield calculations on protein measurements of the supernatants. The different ways of reporting protein yields, as well as the lack of definitions of the terms �yield� and �protein yield� in studies on protein
extraction often make direct comparisons between studies difficult.
: ℎ = 100 ∗
: = 100 ∗ ∗ ∗
: = 100 ∗
: 1 = 100 ∗ 1 ∗ 1 ℎ ∗ ℎ
: 2 = 100 ∗ 1 − 2 ∗ 2 1 ∗ 1
: = 100 ∗ 1100 ∗ 2100
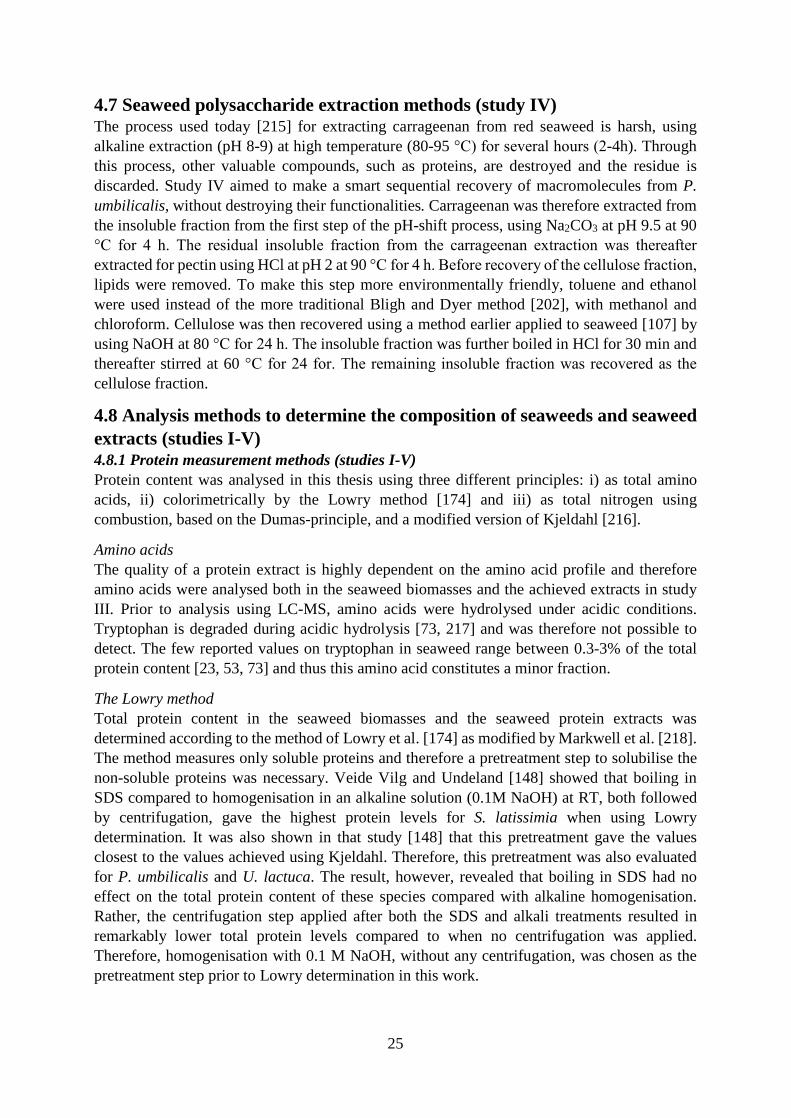
25
4.7 Seaweed polysaccharide extraction methods (study IV) The process used today [215] for extracting carrageenan from red seaweed is harsh, using alkaline extraction (pH 8-9) at high temperature (80-95 °C) for several hours (2-4h). Through this process, other valuable compounds, such as proteins, are destroyed and the residue is discarded. Study IV aimed to make a smart sequential recovery of macromolecules from P. umbilicalis, without destroying their functionalities. Carrageenan was therefore extracted from the insoluble fraction from the first step of the pH-shift process, using Na2CO3 at pH 9.5 at 90 °C for 4 h. The residual insoluble fraction from the carrageenan extraction was thereafter
extracted for pectin using HCl at pH 2 at 90 °C for 4 h. Before recovery of the cellulose fraction,
lipids were removed. To make this step more environmentally friendly, toluene and ethanol were used instead of the more traditional Bligh and Dyer method [202], with methanol and chloroform. Cellulose was then recovered using a method earlier applied to seaweed [107] by using NaOH at 80 °C for 24 h. The insoluble fraction was further boiled in HCl for 30 min and thereafter stirred at 60 °C for 24 for. The remaining insoluble fraction was recovered as the
cellulose fraction.
4.8 Analysis methods to determine the composition of seaweeds and seaweed extracts (studies I-V) 4.8.1 Protein measurement methods (studies I-V) Protein content was analysed in this thesis using three different principles: i) as total amino acids, ii) colorimetrically by the Lowry method [174] and iii) as total nitrogen using combustion, based on the Dumas-principle, and a modified version of Kjeldahl [216].
Amino acids The quality of a protein extract is highly dependent on the amino acid profile and therefore amino acids were analysed both in the seaweed biomasses and the achieved extracts in study III. Prior to analysis using LC-MS, amino acids were hydrolysed under acidic conditions. Tryptophan is degraded during acidic hydrolysis [73, 217] and was therefore not possible to detect. The few reported values on tryptophan in seaweed range between 0.3-3% of the total protein content [23, 53, 73] and thus this amino acid constitutes a minor fraction.
The Lowry method Total protein content in the seaweed biomasses and the seaweed protein extracts was determined according to the method of Lowry et al. [174] as modified by Markwell et al. [218]. The method measures only soluble proteins and therefore a pretreatment step to solubilise the non-soluble proteins was necessary. Veide Vilg and Undeland [148] showed that boiling in SDS compared to homogenisation in an alkaline solution (0.1M NaOH) at RT, both followed by centrifugation, gave the highest protein levels for S. latissimia when using Lowry determination. It was also shown in that study [148] that this pretreatment gave the values closest to the values achieved using Kjeldahl. Therefore, this pretreatment was also evaluated for P. umbilicalis and U. lactuca. The result, however, revealed that boiling in SDS had no effect on the total protein content of these species compared with alkaline homogenisation. Rather, the centrifugation step applied after both the SDS and alkali treatments resulted in remarkably lower total protein levels compared to when no centrifugation was applied. Therefore, homogenisation with 0.1 M NaOH, without any centrifugation, was chosen as the pretreatment step prior to Lowry determination in this work.
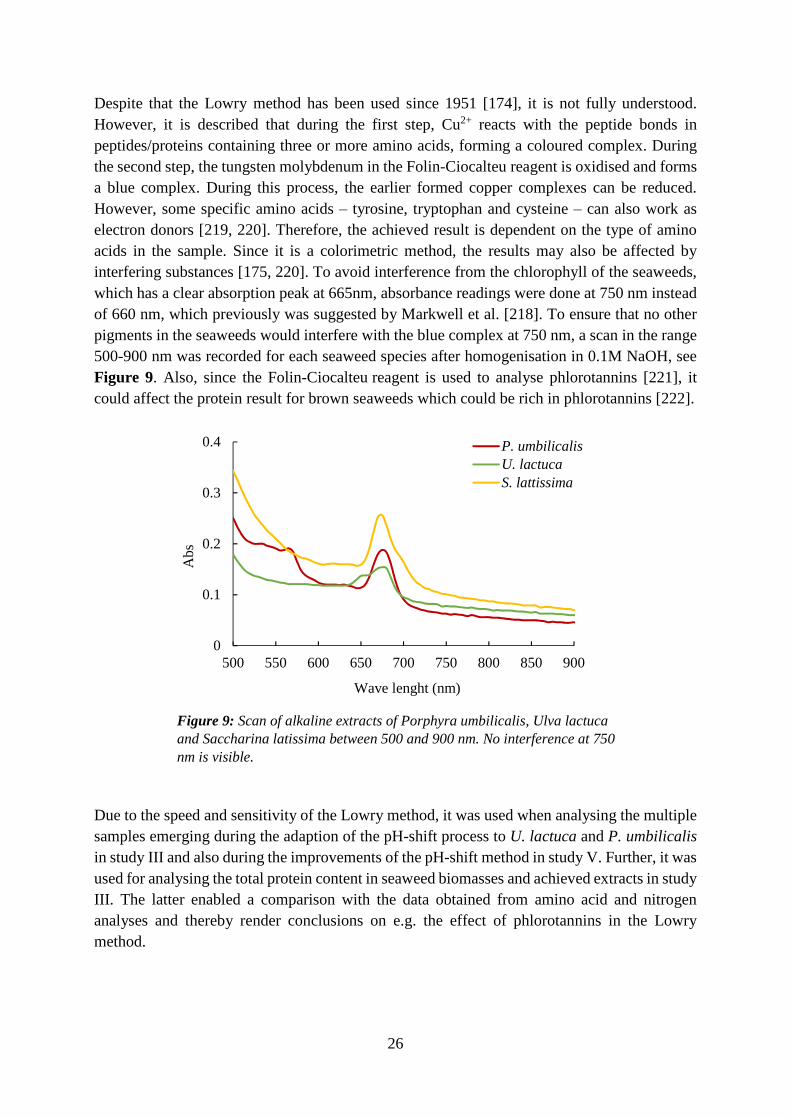
26
Despite that the Lowry method has been used since 1951 [174], it is not fully understood. However, it is described that during the first step, Cu2+ reacts with the peptide bonds in peptides/proteins containing three or more amino acids, forming a coloured complex. During the second step, the tungsten molybdenum in the Folin-Ciocalteu reagent is oxidised and forms a blue complex. During this process, the earlier formed copper complexes can be reduced. However, some specific amino acids � tyrosine, tryptophan and cysteine � can also work as electron donors [219, 220]. Therefore, the achieved result is dependent on the type of amino acids in the sample. Since it is a colorimetric method, the results may also be affected by interfering substances [175, 220]. To avoid interference from the chlorophyll of the seaweeds, which has a clear absorption peak at 665nm, absorbance readings were done at 750 nm instead of 660 nm, which previously was suggested by Markwell et al. [218]. To ensure that no other pigments in the seaweeds would interfere with the blue complex at 750 nm, a scan in the range 500-900 nm was recorded for each seaweed species after homogenisation in 0.1M NaOH, see Figure 9. Also, since the Folin-Ciocalteu reagent is used to analyse phlorotannins [221], it could affect the protein result for brown seaweeds which could be rich in phlorotannins [222].
Figure 9: Scan of alkaline extracts of Porphyra umbilicalis, Ulva lactuca and Saccharina latissima between 500 and 900 nm. No interference at 750 nm is visible.
Due to the speed and sensitivity of the Lowry method, it was used when analysing the multiple samples emerging during the adaption of the pH-shift process to U. lactuca and P. umbilicalis in study III and also during the improvements of the pH-shift method in study V. Further, it was used for analysing the total protein content in seaweed biomasses and achieved extracts in study III. The latter enabled a comparison with the data obtained from amino acid and nitrogen analyses and thereby render conclusions on e.g. the effect of phlorotannins in the Lowry method.
0
0.1
0.2
0.3
0.4
500 550 600 650 700 750 800 850 900
Abs
Wave lenght (nm)
P. umbilicalisU. lactucaS. lattissima

27
Total nitrogen Two different methods, the Kjeldahl method and the Dumas method, were used for analysing total nitrogen in this thesis. Differences between the methods lie particularly in the fact that Kjeldahl measures only organic nitrogen while the Dumas technique measures all nitrogenous compounds [220]. Therefore, when using the same nitrogen-to-protein conversion factors for these two methods, the Dumas method has been reported to yield 1.4% higher protein content in foods compared to the Kjeldahl method [223].
The Dumas method analyses total nitrogen through combustion. The sample is combusted in the presence of oxygen, forming H2O, N2, NO2, SO2 and CO2 [224]. H2O, SO2 and CO2 are absorbed, while NO2 is reduced to N2 by copper before nitrogen is analysed by a thermal conductor. In this study, total nitrogen was analysed using combustion by a LECO Trumac nitrogen analyser. A standard curve made of EDTA was used for quantification. A nitrogen-to-protein conversion factor of 5 [173] was used.
The Dumas method is the fastest protein determination method and was therefore used when analysing protein of all seaweed samples in study I. It was also used for comparison with the amino acid data in study III, which allowed us to compile our own nitrogen-to-protein conversion factors for the three species. Those factors were not used further, but were an attempt to investigate how well the suggested universal conversion factor of 5 for seaweed [173] corresponds to the particular species used in this work. The Dumas method was also used in studies II and IV, where analyses were done on the initial seaweed biomass as well as on the protein extract. To be able to compare the total protein content between the biomasses used in studies I-V, the Dumas method was also applied to the biomass in study V.
During digestion using H2SO4, according to Kjeldahl [216], the organic nitrogen in a sample is converted into ammonium sulphate [220]. In this thesis, the ammonium content was thereafter analysed using HPIC, in contrast to the original version in which titration is used. Differently from the Dumas method, inorganic nitrogen will not be detected since it is incompletely converted to ammonium [223]. A standard curve made of (NH4)2SO4 was used for quantification and, as for the Dumas method, a nitrogen-to-protein conversion factor of 5 [173] was used. Total nitrogen using Kjeldahl was determined for selected samples emerging in study III in order to compare with the results obtained using Dumas.
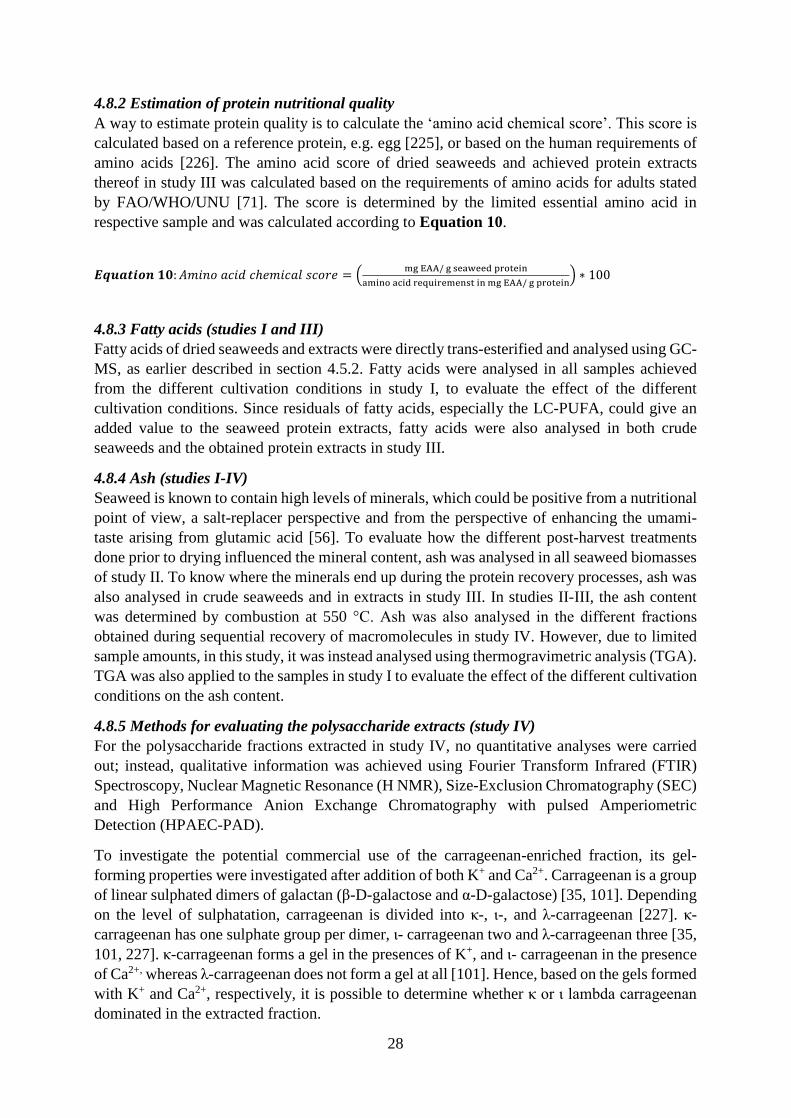
28
4.8.2 Estimation of protein nutritional quality A way to estimate protein quality is to calculate the �amino acid chemical score�. This score is
calculated based on a reference protein, e.g. egg [225], or based on the human requirements of amino acids [226]. The amino acid score of dried seaweeds and achieved protein extracts thereof in study III was calculated based on the requirements of amino acids for adults stated by FAO/WHO/UNU [71]. The score is determined by the limited essential amino acid in respective sample and was calculated according to Equation 10. : ℎ = / / ∗ 100
4.8.3 Fatty acids (studies I and III) Fatty acids of dried seaweeds and extracts were directly trans-esterified and analysed using GC-MS, as earlier described in section 4.5.2. Fatty acids were analysed in all samples achieved from the different cultivation conditions in study I, to evaluate the effect of the different cultivation conditions. Since residuals of fatty acids, especially the LC-PUFA, could give an added value to the seaweed protein extracts, fatty acids were also analysed in both crude seaweeds and the obtained protein extracts in study III.
4.8.4 Ash (studies I-IV) Seaweed is known to contain high levels of minerals, which could be positive from a nutritional point of view, a salt-replacer perspective and from the perspective of enhancing the umami-taste arising from glutamic acid [56]. To evaluate how the different post-harvest treatments done prior to drying influenced the mineral content, ash was analysed in all seaweed biomasses of study II. To know where the minerals end up during the protein recovery processes, ash was also analysed in crude seaweeds and in extracts in study III. In studies II-III, the ash content was determined by combustion at 550 °C. Ash was also analysed in the different fractions
obtained during sequential recovery of macromolecules in study IV. However, due to limited sample amounts, in this study, it was instead analysed using thermogravimetric analysis (TGA). TGA was also applied to the samples in study I to evaluate the effect of the different cultivation conditions on the ash content.
4.8.5 Methods for evaluating the polysaccharide extracts (study IV) For the polysaccharide fractions extracted in study IV, no quantitative analyses were carried out; instead, qualitative information was achieved using Fourier Transform Infrared (FTIR) Spectroscopy, Nuclear Magnetic Resonance (H NMR), Size-Exclusion Chromatography (SEC) and High Performance Anion Exchange Chromatography with pulsed Amperiometric Detection (HPAEC-PAD).
To investigate the potential commercial use of the carrageenan-enriched fraction, its gel-forming properties were investigated after addition of both K+ and Ca2+. Carrageenan is a group of linear sulphated dimers of galactan (β-D-galactose and α-D-galactose) [35, 101]. Depending on the level of sulphatation, carrageenan is divided into κ-, ι-, and λ-carrageenan [227]. κ-carrageenan has one sulphate group per dimer, ι- carrageenan two and λ-carrageenan three [35, 101, 227]. κ-carrageenan forms a gel in the presences of K+, and ι- carrageenan in the presence of Ca2+, whereas λ-carrageenan does not form a gel at all [101]. Hence, based on the gels formed with K+ and Ca2+, respectively, it is possible to determine whether κ or ι lambda carrageenan
dominated in the extracted fraction.
29
4.9 Statistical analysis Data are presented as mean values. Error bars show standard deviations (stdv) when n > 2 and (max value-minimum value)/2 when n=2. Statistical analyses were performed using SPSS (IBM Corp., Armonk, NY, USA), R [228] or JMP 13. To determine if there were significant differences between >2 data groups, ANOVA was performed. t-test was used when only two groups were to be compared. Differences were denoted as significant when p ≤ 0.05. More
specific information can be found in the respective papers I-V.
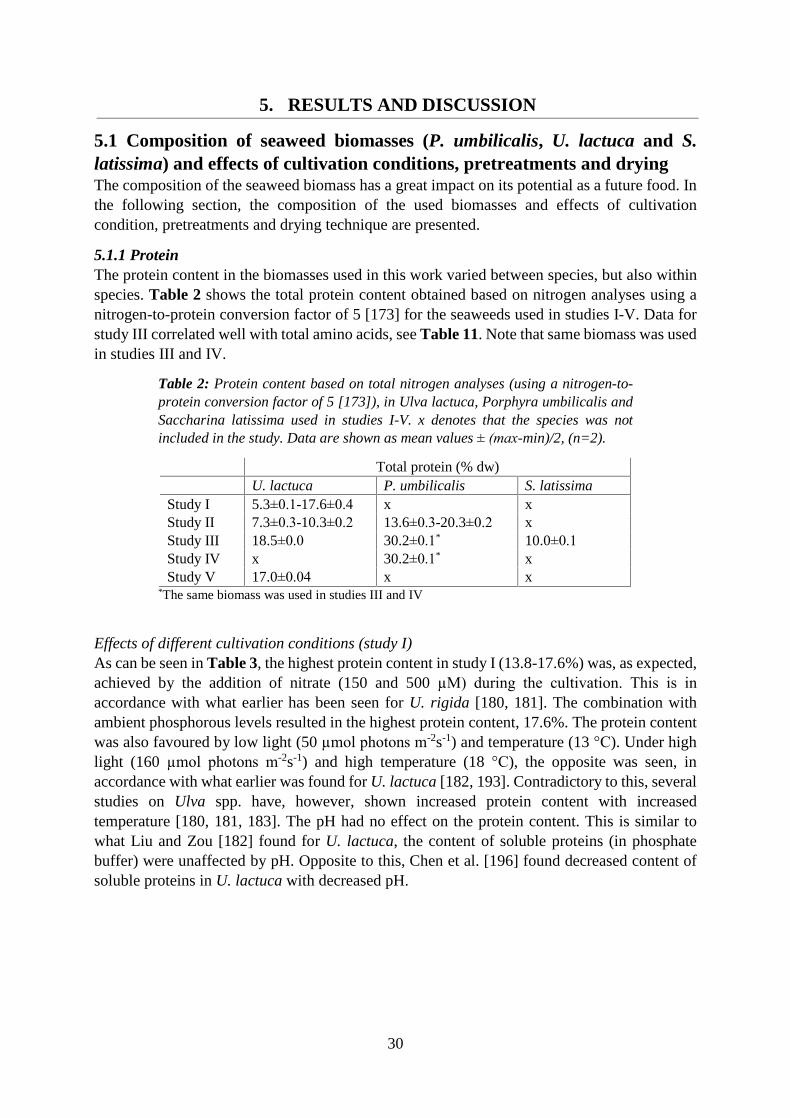
30
5. RESULTS AND DISCUSSION
5.1 Composition of seaweed biomasses (P. umbilicalis, U. lactuca and S. latissima) and effects of cultivation conditions, pretreatments and drying The composition of the seaweed biomass has a great impact on its potential as a future food. In the following section, the composition of the used biomasses and effects of cultivation condition, pretreatments and drying technique are presented.
5.1.1 Protein The protein content in the biomasses used in this work varied between species, but also within species. Table 2 shows the total protein content obtained based on nitrogen analyses using a nitrogen-to-protein conversion factor of 5 [173] for the seaweeds used in studies I-V. Data for study III correlated well with total amino acids, see Table 11. Note that same biomass was used in studies III and IV.
Table 2: Protein content based on total nitrogen analyses (using a nitrogen-to-protein conversion factor of 5 [173]), in Ulva lactuca, Porphyra umbilicalis and Saccharina latissima used in studies I-V. x denotes that the species was not included in the study. Data are shown as mean values ± (max-min)/2, (n=2).
Total protein (% dw) U. lactuca P. umbilicalis S. latissima Study I 5.3±0.1-17.6±0.4 x x Study II 7.3±0.3-10.3±0.2 13.6±0.3-20.3±0.2 x Study III 18.5±0.0 30.2±0.1* 10.0±0.1 Study IV x 30.2±0.1* x Study V 17.0±0.04 x x
*The same biomass was used in studies III and IV
Effects of different cultivation conditions (study I) As can be seen in Table 3, the highest protein content in study I (13.8-17.6%) was, as expected, achieved by the addition of nitrate (150 and 500 µM) during the cultivation. This is in
accordance with what earlier has been seen for U. rigida [180, 181]. The combination with ambient phosphorous levels resulted in the highest protein content, 17.6%. The protein content was also favoured by low light (50 µmol photons m-2s-1) and temperature (13 °C). Under high light (160 µmol photons m-2s-1) and high temperature (18 °C), the opposite was seen, in accordance with what earlier was found for U. lactuca [182, 193]. Contradictory to this, several studies on Ulva spp. have, however, shown increased protein content with increased temperature [180, 181, 183]. The pH had no effect on the protein content. This is similar to what Liu and Zou [182] found for U. lactuca, the content of soluble proteins (in phosphate buffer) were unaffected by pH. Opposite to this, Chen et al. [196] found decreased content of soluble proteins in U. lactuca with decreased pH.

31
Table 3: Protein content in Ulva lactuca biomass obtained during alterative cultivation in study I. H denotes the highest level used, M the medium level used, L the lowest level used and A the ambient level for each varied parameter, see section 4.3. Data are shown as mean values ± stdv, (n=4-6 for light and temperature experiments, n=8 for pH experiments and n=4 for nutrient experiments).
Experiment Light/Temperature
Levels of light and temperature H/H H/L L/H L/L M/H M/L
Protein (% dw) 5.9±0.5 7.8±1.6 8.1±1.6 10.7±2.2 6.9±0.7 9.1±1.1
Experiment pCO2
Levels of pCO2 L A H
Protein (% dw) 10.7±1.2 11.9±1.2 11.4±0.9
Experiment Nitrate/Phosphate Levels of Nitrate/Phosphate A/A M/H H/A H/H M/A A/H
Protein (% dw) 5.1±0.2 13.8±1.2 17.6±0.4 16.2±0.8 16.2±1.1 5.3±0.1
Effects of pretreatments and drying techniques (study II) The wash-out of minerals during soaking of the seaweed in freshwater changed the mass balance within the crude composition and explains the variation in protein content of study II, Figure 10. Soaking in freshwater could hence be a quick alternative to increase the protein content in seaweed by the partial removal of minerals and potential other non-protein compounds. However, care must be taken so that no key nutrients such as water-soluble vitamins are lost in such a treatment. The drying type (freeze-drying or oven-drying) had no effect on the total protein content of untreated U. lactuca and P. umbilicalis, in accordance with what has earlier been seen for Sargassum hemiphyllum, Sargassum hemislowianum, Sargassum patens and S.latissima [119, 122, 124, 229]. In those studies, drying was performed at 60 °C
[119, 122, 229] and 40 °C [124]. For Ulva spp., higher protein content was found in oven-dried samples (70 °C) compared to freeze-dried ones, which is explained by the authors by the longer drying time used for the freeze-dried sample [123]. However, both in study II and the other above-mentioned studies [119, 122, 124, 229], the freeze-drying required a longer time than the oven-drying, and there this effect was not seen. Hence, no clear pattern is seen in the literature on how the protein content in seaweed varies with different drying techniques. Differences between species and specific drying temperature used is most likely contributing to the discrepancies.
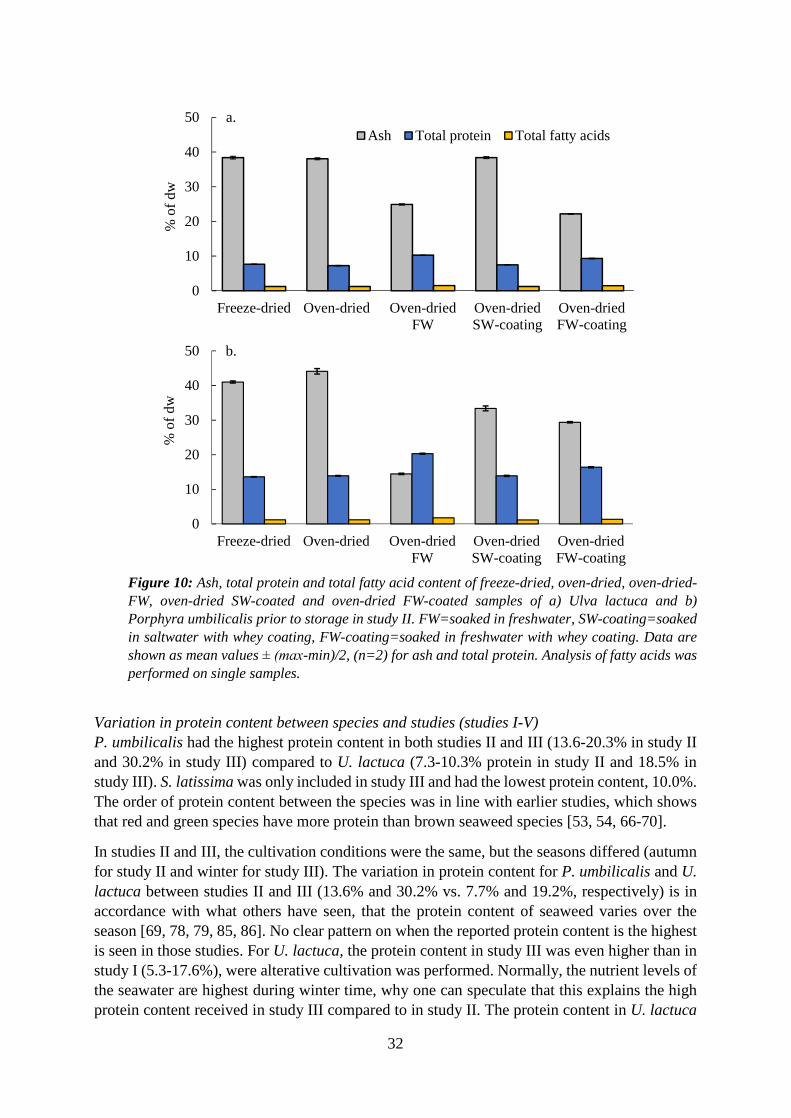
32
Figure 10: Ash, total protein and total fatty acid content of freeze-dried, oven-dried, oven-dried-FW, oven-dried SW-coated and oven-dried FW-coated samples of a) Ulva lactuca and b) Porphyra umbilicalis prior to storage in study II. FW=soaked in freshwater, SW-coating=soaked in saltwater with whey coating, FW-coating=soaked in freshwater with whey coating. Data are shown as mean values ± (max-min)/2, (n=2) for ash and total protein. Analysis of fatty acids was performed on single samples.
Variation in protein content between species and studies (studies I-V) P. umbilicalis had the highest protein content in both studies II and III (13.6-20.3% in study II and 30.2% in study III) compared to U. lactuca (7.3-10.3% protein in study II and 18.5% in study III). S. latissima was only included in study III and had the lowest protein content, 10.0%. The order of protein content between the species was in line with earlier studies, which shows that red and green species have more protein than brown seaweed species [53, 54, 66-70].
In studies II and III, the cultivation conditions were the same, but the seasons differed (autumn for study II and winter for study III). The variation in protein content for P. umbilicalis and U. lactuca between studies II and III (13.6% and 30.2% vs. 7.7% and 19.2%, respectively) is in accordance with what others have seen, that the protein content of seaweed varies over the season [69, 78, 79, 85, 86]. No clear pattern on when the reported protein content is the highest is seen in those studies. For U. lactuca, the protein content in study III was even higher than in study I (5.3-17.6%), were alterative cultivation was performed. Normally, the nutrient levels of the seawater are highest during winter time, why one can speculate that this explains the high protein content received in study III compared to in study II. The protein content in U. lactuca
0
10
20
30
40
50
Freeze-dried Oven-dried Oven-driedFW
Oven-driedSW-coating
Oven-driedFW-coating
% o
f dw
a.Ash Total protein Total fatty acids
0
10
20
30
40
50
Freeze-dried Oven-dried Oven-driedFW
Oven-driedSW-coating
Oven-driedFW-coating
% o
f dw
b.
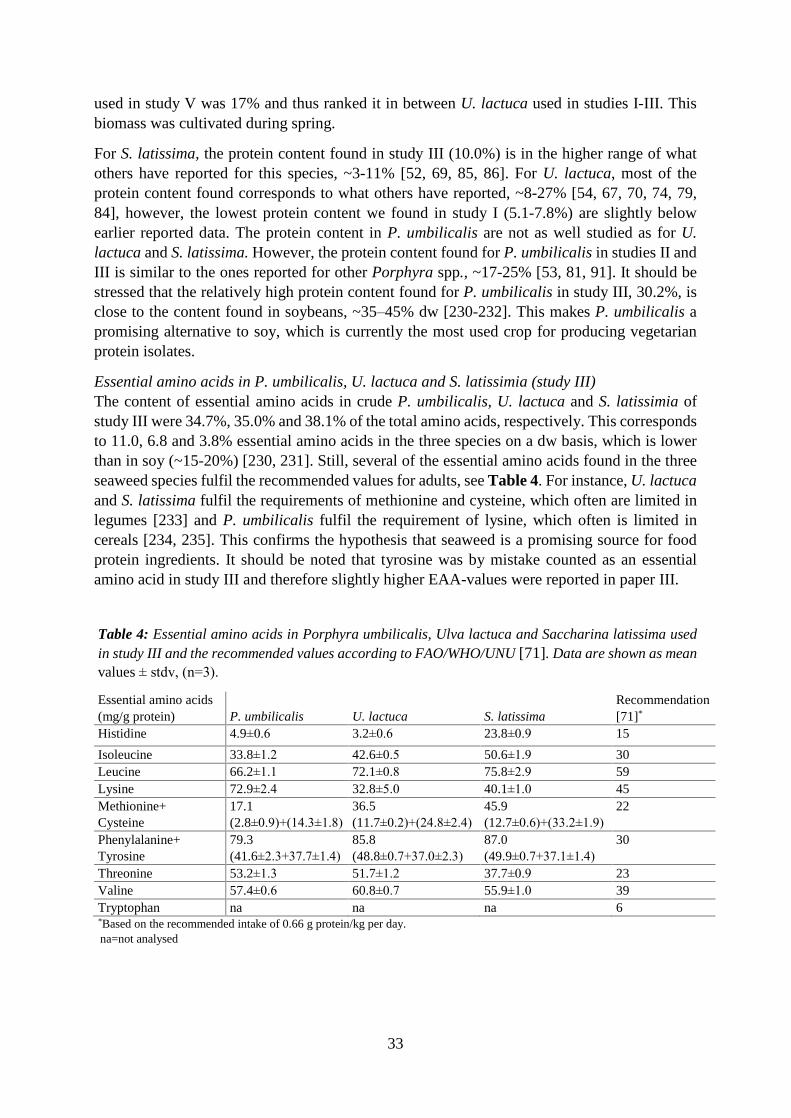
33
used in study V was 17% and thus ranked it in between U. lactuca used in studies I-III. This biomass was cultivated during spring.
For S. latissima, the protein content found in study III (10.0%) is in the higher range of what others have reported for this species, ~3-11% [52, 69, 85, 86]. For U. lactuca, most of the protein content found corresponds to what others have reported, ~8-27% [54, 67, 70, 74, 79, 84], however, the lowest protein content we found in study I (5.1-7.8%) are slightly below earlier reported data. The protein content in P. umbilicalis are not as well studied as for U. lactuca and S. latissima. However, the protein content found for P. umbilicalis in studies II and III is similar to the ones reported for other Porphyra spp., ~17-25% [53, 81, 91]. It should be stressed that the relatively high protein content found for P. umbilicalis in study III, 30.2%, is close to the content found in soybeans, ~35�45% dw [230-232]. This makes P. umbilicalis a promising alternative to soy, which is currently the most used crop for producing vegetarian protein isolates.
Essential amino acids in P. umbilicalis, U. lactuca and S. latissimia (study III) The content of essential amino acids in crude P. umbilicalis, U. lactuca and S. latissimia of study III were 34.7%, 35.0% and 38.1% of the total amino acids, respectively. This corresponds to 11.0, 6.8 and 3.8% essential amino acids in the three species on a dw basis, which is lower than in soy (~15-20%) [230, 231]. Still, several of the essential amino acids found in the three seaweed species fulfil the recommended values for adults, see Table 4. For instance, U. lactuca and S. latissima fulfil the requirements of methionine and cysteine, which often are limited in legumes [233] and P. umbilicalis fulfil the requirement of lysine, which often is limited in cereals [234, 235]. This confirms the hypothesis that seaweed is a promising source for food protein ingredients. It should be noted that tyrosine was by mistake counted as an essential amino acid in study III and therefore slightly higher EAA-values were reported in paper III.
Table 4: Essential amino acids in Porphyra umbilicalis, Ulva lactuca and Saccharina latissima used in study III and the recommended values according to FAO/WHO/UNU [71]. Data are shown as mean values ± stdv, (n=3).
Essential amino acids (mg/g protein) P. umbilicalis U. lactuca S. latissima
Recommendation [71]*
Histidine 4.9±0.6 3.2±0.6 23.8±0.9 15
Isoleucine 33.8±1.2 42.6±0.5 50.6±1.9 30 Leucine 66.2±1.1 72.1±0.8 75.8±2.9 59 Lysine 72.9±2.4 32.8±5.0 40.1±1.0 45 Methionine+ Cysteine
17.1 (2.8±0.9)+(14.3±1.8)
36.5 (11.7±0.2)+(24.8±2.4)
45.9 (12.7±0.6)+(33.2±1.9)
22
Phenylalanine+ Tyrosine
79.3 (41.6±2.3+37.7±1.4)
85.8 (48.8±0.7+37.0±2.3)
87.0 (49.9±0.7+37.1±1.4)
30
Threonine 53.2±1.3 51.7±1.2 37.7±0.9 23 Valine 57.4±0.6 60.8±0.7 55.9±1.0 39 Tryptophan na na na 6 *Based on the recommended intake of 0.66 g protein/kg per day. na=not analysed

34
5.1.2 Fatty acids Effects of different cultivation conditions (study I) The total fatty acid content in study I was positively affected by low light (50 µmol photons m-
2s-1), high temperature (18 °C) and addition of nitrate (150 and 500 µM). This is in accordance with the findings of Goa et al. [180] that higher temperature (18 °C compared to 14 °C) and
higher nitrate levels (150 µM compared to 6 µM) increased the lipid content in U. rigida.
Effects of pretreatments and drying techniques (study II) As described for the proteins, the washout of minerals during soaking in freshwater in study II, resulted in slightly higher fatty acids content in soaked samples compared to the un-soaked ones, see Figure 10. No effect of drying method was seen on the total fatty acid content in study II, which is in accordance with what earlier has been seen for Ulva sp. [123]. For S. hemiphyllum, higher fatty acid content was recorded in freeze-dried samples than in oven-dried samples [229]. The higher drying temperature (60 °C) used in that study compared to in study
II (40 °C) could have induced lipid oxidation and thus loss of fatty acids.
Variation in fatty acid content between species and studies (studies I-III) The total fatty acid content in the crude seaweeds in studies I-III was low, 1.1-2.5% of the dw, (Table 5-7), which is in agreement with what has been reported by others [20, 66, 70, 74, 85]. However, the relative amount of PUFAs was high, 31.9-73.9% of total fatty acids, which still makes the lipid pool interesting from a nutritional perspective.
In studies II and III, the n-6/n-3 ratio was < 1 for all crude seaweeds (0.27-0.87), which, as mentioned earlier, is considered good since a diet with a low n-6/n-3 is associated with a reduced risk for cardiovascular and inflammatory diseases [99]. In study I, the n-6/n-3 ratio varied from 0.39 to 1.61, depending on the cultivation conditions. Lowest n-6/n-3 ratios (0.40-0.44) were obtained by nitrate addition, Table 5, which corresponded well with those samples having the highest ALA and docosapentaenoic acid (DPA) levels.
In P. umbilicalis, the content of the LC n-3 PUFA EPA was especially high, exerting 32-44% of the total fatty acids in studies II and III. In U. lactuca, no or low levels of EPA were found, although it contained a substantial amount of ALA (11-25% of total fatty acids), a precursor to the LC n-3 PUFAs. Also, low levels of DPA were found in U. lactuca, while this fatty acid was absent in P. umbilicalis and S. latissima. DPA has earlier been detected in U. lactuca by both Maehre et al. [70] and Ortiz et al. [74], but similar to us, these studies did not report on DPA in brown [70, 74] or red seaweed [70]. In S. latissima, both ALA and EPA were found. They constituted 8.5 and 18.5% of total fatty acids, respectively. Our results are in accordance with other studies, reporting that red seaweed contain more EPA than both green and brown seaweed [20, 53, 66, 70, 97]. Veide Vilg et al. [85] reported that the LC n-3 PUFA DHA was recorded in wild S. latissima harvested at the Swedish west coast in August. However, no DHA was found in S. latissima in June in the same study [85]. No DHA was found in the semi-cultivated S. latissima used in study III, which was cultivated during winter time.
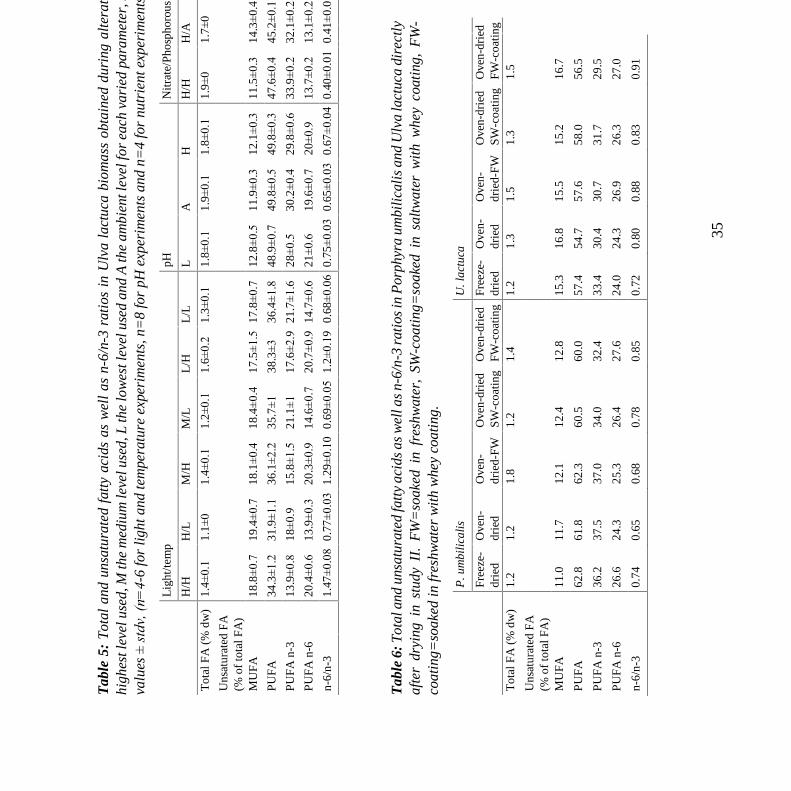
35
Tab
le 5
: T
otal
and
uns
atur
ated
fat
ty a
cids
as
wel
l as
n-6
/n-3
rat
ios
in U
lva
lact
uca
biom
ass
obta
ined
dur
ing
alte
rati
ve c
ulti
vati
on i
n st
udy
I. H
den
otes
the
hi
ghes
t lev
el u
sed,
M th
e m
ediu
m le
vel u
sed,
L th
e lo
wes
t lev
el u
sed
and
A th
e am
bien
t lev
el fo
r ea
ch v
arie
d pa
ram
eter
, see
sec
tion
4.3
. Dat
a ar
e sh
own
as m
ean
valu
es ±
std
v, (n
=4-6
for
light
and
tem
pera
ture
exp
erim
ents
, n=
8 fo
r pH
exp
erim
ents
and
n=
4 fo
r nu
trie
nt e
xper
imen
ts).
L
ight
/tem
p pH
N
itra
te/P
hosp
horo
us
H
/H
H/L
M
/H
M/L
L
/H
L/L
L
A
H
H
/H
H/A
M
/H
M/A
A
/H
A/A
Tot
al F
A (
% d
w)
1.4±
0.1
1.
1±0
1.4±
0.1
1.
2±0
.1
1.6±
0.2
1.
3±0
.1
1.8±
0.1
1.
9±0
.1
1.8±
0.1
1.
9±0
1.7±
0
1.8±
0.1
1.
6±0
.1
1.3±
0
1.3±
0
Uns
atur
ated
FA
(%
of
tota
l FA
)
MU
FA
18
.8±
0.7
19
.4±
0.7
18
.1±
0.4
18
.4±
0.4
17
.5±
1.5
17
.8±
0.7
12
.8±
0.5
11
.9±
0.3
12
.1±
0.3
11
.5±
0.3
14
.3±
0.4
11
.9±
0.3
14
.3±
0.7
14
.6±
0.2
14
.7±
0.3
PU
FA
34
.3±
1.2
31
.9±
1.1
36
.1±
2.2
35
.7±
1
38.3
±3
36.4
±1
.8
48.9
±0
.7
49.8
±0
.5
49.8
±0
.3
47.6
±0
.4
45.2
±0
.1
47±
0.6
44
.8±
0.3
45
.4±
0.4
45
±0.4
PU
FA
n-3
13
.9±
0.8
18
±0.9
15
.8±
1.5
21
.1±
1
17.6
±2
.9
21.7
±1
.6
28±
0.5
30
.2±
0.4
29
.8±
0.6
33
.9±
0.2
32
.1±
0.2
33
.3±
0.2
31
.2±
0.6
28
.3±
0.6
28
.5±
0.7
PU
FA
n-6
20
.4±
0.6
13
.9±
0.3
20
.3±
0.9
14
.6±
0.7
20
.7±
0.9
14
.7±
0.6
21
±0.6
19
.6±
0.7
20
±0.9
13
.7±
0.2
13
.1±
0.2
13
.7±
0.6
13
.6±
0.5
17
±0.3
16
.6±
0.3
n-6/
n-3
1.47
±0
.08
0.77
±0
.03
1.29
±0
.10
0.69
±0
.05
1.2±
0.1
9
0.68
±0
.06
0.75
±0
.03
0.65
±0
.03
0.67
±0
.04
0.40
±0
.01
0.41
±0
.01
0.41
±0
.02
0.44
±0
.02
0.60
±0
.02
0.58
±0
.02
T
able
6: T
otal
and
uns
atur
ated
fatt
y ac
ids
as w
ell a
s n-
6/n-
3 ra
tios
in P
orph
yra
umbi
lica
lis
and
Ulv
a la
ctuc
a di
rect
ly
afte
r dr
ying
in
stud
y II
. F
W=
soak
ed i
n fr
eshw
ater
, SW
-coa
ting
=so
aked
in
salt
wat
er w
ith
whe
y co
atin
g, F
W-
coat
ing=
soak
ed in
fres
hwat
er w
ith
whe
y co
atin
g.
P
. um
bili
calis
U
. lac
tuca
Fre
eze-
drie
d
Ove
n-
drie
d O
ven-
drie
d-F
W
Ove
n-dr
ied
SW
-coa
ting
O
ven-
drie
d F
W-c
oati
ng
Fre
eze-
drie
d
Ove
n-
drie
d O
ven-
drie
d-F
W
Ove
n-dr
ied
S
W-c
oati
ng
Ove
n-dr
ied
FW
-coa
ting
T
otal
FA
(%
dw
) 1.
2 1.
2 1.
8 1.
2 1.
4 1.
2 1.
3 1.
5 1.
3 1.
5
Uns
atur
ated
FA
(%
of
tota
l FA
)
MU
FA
11
.0
11.7
12
.1
12.4
12
.8
15.3
16
.8
15.5
15
.2
16.7
PU
FA
62
.8
61.8
62
.3
60.5
60
.0
57.4
54
.7
57.6
58
.0
56.5
PU
FA
n-3
36
.2
37.5
37
.0
34.0
32
.4
33.4
30
.4
30.7
31
.7
29.5
PU
FA
n-6
26
.6
24.3
25
.3
26.4
27
.6
24.0
24
.3
26.9
26
.3
27.0
n-6/
n-3
0.74
0.
65
0.68
0.
78
0.85
0.
72
0.80
0.
88
0.83
0.
91

36
Tab
le 7
: Tot
al a
nd u
nsat
urat
ed fa
tty
acid
s as
wel
l as
n-6/
n-3
rati
os in
Por
phyr
a um
bili
cali
s, U
lva
lact
uca
and
Sacc
hari
na la
tiss
ima
and
extr
acts
th
ereo
f in
stud
y II
I. D
ata
are
show
n as
mea
n va
lues
± s
tdv,
(n=
3 if
not
oth
er s
tate
d).
P
. um
bili
calis
U
. lac
tuca
S.
lati
ssim
a
Dry
T
radi
tion
al
pH-s
hift
A
SE
D
ry
Tra
diti
onal
pH
-shi
ft
AS
E
Dry
T
radi
tion
al
pH-s
hift
A
SE
Tot
al F
A (
% d
w)
2.
5±0
* 0.
5±0
.2
2.2±
0.1
0.
7±0
* 2.
3±0
0.7±
0
5.0±
0.4
1.
8±0
* 2.
1±0
.4
0.1±
0
3.3±
0.2
1.
6±0
#
Uns
atur
ated
FA
(%
of
tota
l FA
)
MU
FA
2.
6±0
9.4±
0.2
5.
2±1
.1
2±1
11.4
±0
.1
16.5
±0
.1
13±
0.1
4.
4±0
.2
2.4±
0.2
2.
2±2
.2
5.4±
0.4
4.
5±0
PU
FA
73
.9±
0
40.4
±2
.6
60.2
±3
.1
44.2
±1
.7
68.8
±1
53.8
±1
.3
63.7
±0
.7
51.1
±0
69.6
±3
.2
36.8
±5
.2
35.6
±2
.6
9.3±
0
PU
FA
n-3
46
.7±
0
22.1
±1
.6
39.1
±1
.8
24.8
±0
.9
54.4
±0
.5
41.5
±0
.9
50.3
±0
.6
39.6
±0
47.1
±2
.3
17.5
±0
.7
16.3
±1
.3
5.2±
0
PU
FA
n-6
27
.2±
0.1
18
.3±
1
21.1
±1
.4
19.3
±0
.8
14.5
±0
.5
12.2
±0
.4
13.5
±0
.2
11.4
±0
22.5
±0
.9
19.3
±4
.5
19.3
±1
.3
4.1±
0
n-6/
n-3
0.58
±0
.0
0.83
±0
.02
0.54
±0
.01
0.78
±0
.0
0.27
±0
.01
0.29
±0
.0
0.27
±0
.0
0.29
±0
.0
0.48
±0
.0
1.1±
0.2
2
1.18
±0
.02
0.78
±0
* Ana
lysi
s w
as p
erfo
rmed
in d
uplic
ate.
Dat
a ar
e sh
own
as m
ean
valu
es ±
(m
ax-m
in)/
2.
# A
naly
sis
was
per
form
ed o
n sin
gle
sam
ples
.

37
5.1.3 Ash Effects of pretreatments and drying techniques (study II) As mentioned above, study II revealed that there was a significant washout of minerals during soaking in freshwater, see Figure 10. The ash content in the soaked samples was therefore significantly lower than in corresponding non-soaked samples.
Variation in ash content between species and studies (studies I-IV) The ash content in study II for both non-soaked and uncoated P. umbilicalis (41-44 %) and U. lactuca (38%) was higher than in study III (23% and 26%, respectively) and for U. lactuca, also than in study I (~20%). For S. latissima, the ash content in study III was as high as 50%. It is well known that seaweed can have very high ash content [79, 80, 90] since it contains a variety of minerals [90, 109, 113, 236]. It has also been shown that the ash content can vary e.g. with season [78, 79, 85, 86].
When reanalysing the P. umbilicalis biomass from study III using TGA combustion in study IV, the achieved ash content was lower (9.1% compared to 23%). TGA combustion is done at 800 °C, while in study III, combustion was done at 550 °C. Also, during TGA combustion, the char content is determined at 800 °C under N2-atmosphere prior to the determination of ash. At this stage, polysaccharides depolymerise into monosaccharides, which in turn decompose into carbon and water. Protein decompose into amino acids and then further to ammonium and carbon dioxide. Possibly, a temperature of 550 °C is not enough to fully combust the char of
the sample, why some char could end up in the ash-fraction. Another reason for the differences in ash content for P. umbilicalis between studies IV and III could be that the composition of seaweed differs within the thallus. In study IV, a very low sample quantity (4mg) was used in TGA-analysis, providing uncertainty in how representative such a small sample is.
5.2 Influence of pretreatments, drying techniques and storage conditions on the quality of P. umbilicalis and U. lactuca (study II) 5.2.1 Formation of lipid oxidation products Lipid oxidation could affect both the nutritional value and the flavour of the seaweed biomass and is therefore an important quality parameter. To the best of our knowledge, no other studies have reported any specific oxidation products in seaweed. In study II, analyses of free aldehydes in the seaweeds directly after drying revealed 1.0-4.9 µg MDA/g, 0.1-0.3 µg HHE/g and 0.02-0.2 µg HNE/g. Due to the novelty in analysing these compounds in seaweed, the figures cannot
be compared with others. However, Chen et al. [196] analysed TBARS in fresh Pyropia haitanensis and U. lactuca. Achieved TBARS levels in that study [196], when recalculated based on µg/g dw, were ~ 5.4-11.9 µg MDA-equivalents/g, hence somewhat higher than the obtained MDA levels in study II. This agrees with the fact that the non-specific TBARS method includes all carbonyls, not only MDA.
When recalculating reported levels of MDA and HHE in herring and salmon (280µg HHE and 10µg MDA/100g and 16µg MDA and 0.83µg HHE/100g wet weight (ww), respectively) [237] to a dw basis, using moisture content levels reported by the Swedish Food Agency (~71% in both herring [238] and salmon [239]), it corresponds to 0.6-9.7µg MDA/g and 0.03-0.3µg
HHE/g. When doing the same calculation for HHE and HNE values reported for mackerel (11µg HHE/kg ww and 7µg HNE/kg ww [240] and using a moisture content of ~55% [241]), it corresponds to 0.024µg HHE/g and 0.0156µg HNE/g. For fresh walnuts and peanuts, the

38
reported MDA levels are 0.44 and 0.72µg/g, respectively [242]. Hence, the initial aldehyde levels in the seaweeds lay in the upper range of the reported values in various foods.
Effects of pretreatments and drying techniques Both for U. lactuca and P. umbilicalis the freeze-dried samples had higher initial levels of aldehydes (MDA and HHE for U. lactuca and HHE and HNE for P. umbilicalis) than the oven-dried samples, see Figure 1-3 in study II. The freeze-drying per se thus unexpectedly induced more lipid oxidation than oven-drying, or, the oven-drying stimulated binding of the free aldehydes to other macromolecules. MDA, HHE and HNE are all very reactive and can cross-link, e.g. to proteins [243-245], something that could be enhanced during the elevated oven-drying temperatures (40 C). Soaking in freshwater had no effect on the initial levels of aldehydes. For U. lactuca the coated samples had lower initial levels of aldehydes compared to uncoated samples. This was, however, not seen for P. umbilicalis. Generally, the magnitude of HHE reached in the samples was higher than for HNE, which is in accordance with the higher levels of n-3 fatty acids compared to n-6 fatty acids in the seaweeds, Table 6.
Effects of storage conditions Throughout the whole storage, the formation of MDA, HHE and HNE was moderate for all samples. Nevertheless, there are some interesting trends worth mentioning. Light had a larger impact on the aldehyde development in U. lactuca than in P. umbilicalis, which could be due to a higher chlorophyll content in green compared to red seaweeds [246, 247]. The kinetics for HHE and HNE development, Figure 2-3 study II, (especially for light and semi-light stored U. lactuca) were similar, with a lag phase between day 0-150, a log phase between day 150 and day 230 or 300, and thereafter a more stationary phase. This pattern is typical for the lipid oxidation reaction and has been seen in many other studies, e.g. of fish muscle [248-250]. For U. lactuca, the start of the log phase corresponded to the time point where the ascorbic acid loss also accelerated, i.e. > day 150. Which is the hen and the egg here is difficult to pinpoint; either the accelerated lipid oxidation induced co-oxidation of the ascorbic acid or the levels of ascorbic acid had decreased to a level where it no longer could provide any antioxidative capacities. Despite the moderate development of MDA, HHE and HNE during storage, their high reactivity [136, 243-245] could have affected the seaweed protein quality, something that is still to be explored.
5.2.2 Fatty acid degradation Along with lipid oxidation, fatty acids are destroyed, something that reduces the nutritional value of the biomass. The change in fatty acid content by the different pretreatments and drying techniques as well as after one year of storage was therefore considered an important quality parameter.
Effects of pretreatments and drying techniques As mentioned above (see 5.1.2), the major effect of the different pretreatments was that the washout of ash during soaking in freshwater resulted in higher fatty acid levels in those samples, see Figure 10. The drying technique did not affect the fatty acid content.
Effects of storage conditions There was a great loss of fatty acids during the storage, which was more pronounced for unsaturated fatty acids and for the samples stored in light. In the latter samples, 53.0-98.6% of all PUFAs degraded, the exact amount depending on species and sample type. However, also during storage in darkness, the PUFA were not fully retained, and the loss there varied between

39
20.3-80.1%, which is accordance with what Schmid et al. [132] showed for L. digitata and P. palamata. In these species, the PUFA content was less than half of the initial value after 22 months of storage in darkness at RT. The difference between samples stored light and dark in study II was more pronounced regarding their loss of PUFA than their obtained levels of oxidation products. Thus, it is likely that lipid oxidation of the dried seaweeds primarily yielded other lipid oxidation products than free MDA, HHE and HNE. Examples are hexanal, pentanal, nonanal, butanal and pentenol, which are common lipid oxidation markers for muscle tissues and vegetable food sources [251, 252]. The greatest difference in loss for PUFA between dark and light storage (3.3 times) was seen in freeze-dried U. lactuca. For freeze-dried P. umbilicalis, the difference was less (1.2 times). This is due to that the dark-stored P. umbilicalis sample lost 80.1% of the initial PUFA content, which can be compared to 29.5% for U. lactuca stored dark. Generally, the P. umbilicalis samples stored both dark and semi-light lost more PUFA than the U. lactuca samples stored under the same conditions. Thus, the specific light condition used had a larger impact on the loss of PUFA for U. lactuca than for P. umbilicalis. Green seaweed generally contains more chlorophyll than red seaweed [246, 247]. Even if chlorophyll acts as a photosensitiser in light [126], it has also been shown to work as an antioxidant in darkness [253, 254], and hence could explain why U. lactuca lost less PUFAs than P. umbilicalis when stored dark. For U. lactuca, the coated samples lost less PUFAs compared to uncoated samples, and hence the coating seemed to protect the PUFAs in U. lactuca during storage. For P. umbilicalis, the coated samples were stored only in semi-light, and no protective effect was seen compared to the un-coted samples stored under the same conditions.
5.2.3 Ascorbic acid Ascorbic acid is often used as a quality indicator of food since it is very sensitive and can easily be degraded [137]. Since it can work both as an antioxidant and a pro-oxidant during lipid oxidation, it is an interesting marker to follow along with this.
Effects of pretreatments and drying techniques The soaking of U. lactuca and P. umbilicalis in freshwater concentrated the ascorbic acid levels, just as it concentrated proteins and fatty acids, Table 8. This indicates that the soaking acted only on the surface and did not wash away intracellular water-soluble components. For P. umbilicalis, the choice of drying method did not affect the ascorbic acid level, contrary to what has been seen for S. hemiphyllum, where freeze-dried biomass contained significantly more ascorbic acid than the oven-dried counterpart [229]. For U. lactuca, the oven-dried control had a lower ascorbic acid value (335 µg/g) directly after drying compared to the freeze-dried sample (547 µg/g). However, due to the similar levels seen after 90 days of storage (552 µg/g and 570
µg/g, respectively), it is hypothesised that this rather is a result of better extractability from the freeze-dried than oven-dried sample at that point. Hamid et al. [197] found higher extractability of metabolites from freeze-dried than oven-dried biomass for Cladosiphon okamuranus, Saccharina japonica and Undaria pinnatifida.
The initial ascorbic acid levels were significantly lower in freshwater coated U. lactuca and in saltwater coated and freshwater coated P. umbilicalis compared to the respective uncoated samples, see Table 8. The pH of the coating solution made from freshwater was lower (4.55) than the ambient pH of the seawater in study I (8.1) and lower than the pH of the U. lactuca and P. umbilicalis used in study III, 4.8 and 6.1, respectively. Ascorbic acid is sensitive to pH changes, and this could explain the lower initial levels in the coated samples. Ascorbic acid is known to reduce Fe3+ to Fe2+ and Cu3+ to Cu2+ in the presence of oxygen and is thereby oxidised
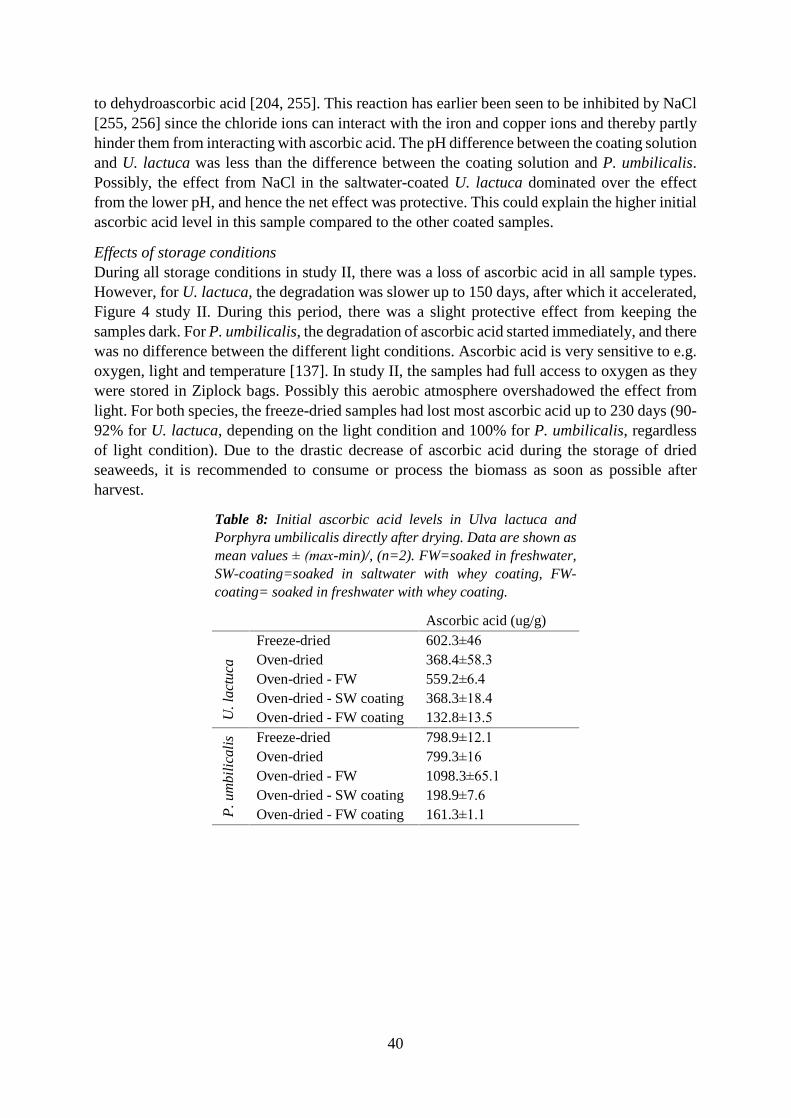
40
to dehydroascorbic acid [204, 255]. This reaction has earlier been seen to be inhibited by NaCl [255, 256] since the chloride ions can interact with the iron and copper ions and thereby partly hinder them from interacting with ascorbic acid. The pH difference between the coating solution and U. lactuca was less than the difference between the coating solution and P. umbilicalis. Possibly, the effect from NaCl in the saltwater-coated U. lactuca dominated over the effect from the lower pH, and hence the net effect was protective. This could explain the higher initial ascorbic acid level in this sample compared to the other coated samples.
Effects of storage conditions During all storage conditions in study II, there was a loss of ascorbic acid in all sample types. However, for U. lactuca, the degradation was slower up to 150 days, after which it accelerated, Figure 4 study II. During this period, there was a slight protective effect from keeping the samples dark. For P. umbilicalis, the degradation of ascorbic acid started immediately, and there was no difference between the different light conditions. Ascorbic acid is very sensitive to e.g. oxygen, light and temperature [137]. In study II, the samples had full access to oxygen as they were stored in Ziplock bags. Possibly this aerobic atmosphere overshadowed the effect from light. For both species, the freeze-dried samples had lost most ascorbic acid up to 230 days (90-92% for U. lactuca, depending on the light condition and 100% for P. umbilicalis, regardless of light condition). Due to the drastic decrease of ascorbic acid during the storage of dried seaweeds, it is recommended to consume or process the biomass as soon as possible after harvest.
Table 8: Initial ascorbic acid levels in Ulva lactuca and Porphyra umbilicalis directly after drying. Data are shown as mean values ± (max-min)/, (n=2). FW=soaked in freshwater, SW-coating=soaked in saltwater with whey coating, FW-coating= soaked in freshwater with whey coating.
Ascorbic acid (ug/g)
U. l
actu
ca
Freeze-dried 602.3±46 Oven-dried 368.4±58.3 Oven-dried - FW 559.2±6.4 Oven-dried - SW coating 368.3±18.4 Oven-dried - FW coating 132.8±13.5
P. u
mbi
lica
lis Freeze-dried 798.9±12.1
Oven-dried 799.3±16 Oven-dried - FW 1098.3±65.1 Oven-dried - SW coating 198.9±7.6 Oven-dried - FW coating 161.3±1.1
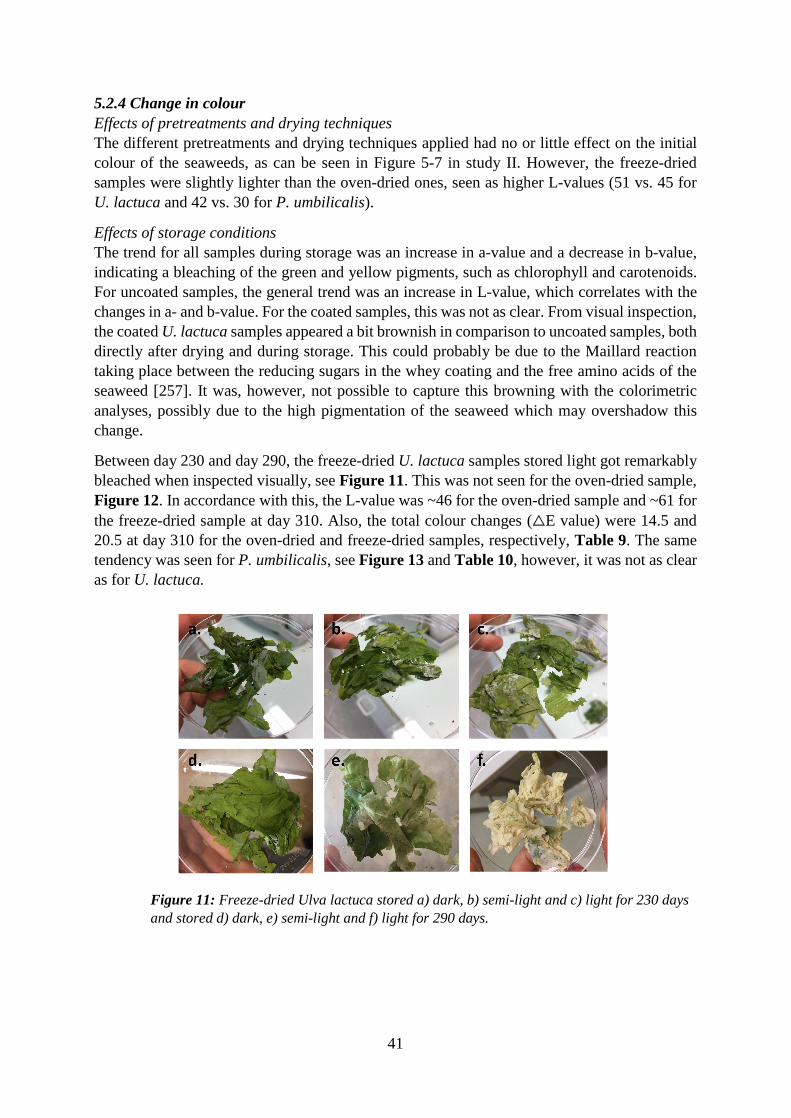
41
5.2.4 Change in colour Effects of pretreatments and drying techniques The different pretreatments and drying techniques applied had no or little effect on the initial colour of the seaweeds, as can be seen in Figure 5-7 in study II. However, the freeze-dried samples were slightly lighter than the oven-dried ones, seen as higher L-values (51 vs. 45 for U. lactuca and 42 vs. 30 for P. umbilicalis).
Effects of storage conditions The trend for all samples during storage was an increase in a-value and a decrease in b-value, indicating a bleaching of the green and yellow pigments, such as chlorophyll and carotenoids. For uncoated samples, the general trend was an increase in L-value, which correlates with the changes in a- and b-value. For the coated samples, this was not as clear. From visual inspection, the coated U. lactuca samples appeared a bit brownish in comparison to uncoated samples, both directly after drying and during storage. This could probably be due to the Maillard reaction taking place between the reducing sugars in the whey coating and the free amino acids of the seaweed [257]. It was, however, not possible to capture this browning with the colorimetric analyses, possibly due to the high pigmentation of the seaweed which may overshadow this change.
Between day 230 and day 290, the freeze-dried U. lactuca samples stored light got remarkably bleached when inspected visually, see Figure 11. This was not seen for the oven-dried sample, Figure 12. In accordance with this, the L-value was ~46 for the oven-dried sample and ~61 for the freeze-dried sample at day 310. Also, the total colour changes (△E value) were 14.5 and 20.5 at day 310 for the oven-dried and freeze-dried samples, respectively, Table 9. The same tendency was seen for P. umbilicalis, see Figure 13 and Table 10, however, it was not as clear as for U. lactuca.
Figure 11: Freeze-dried Ulva lactuca stored a) dark, b) semi-light and c) light for 230 days and stored d) dark, e) semi-light and f) light for 290 days.
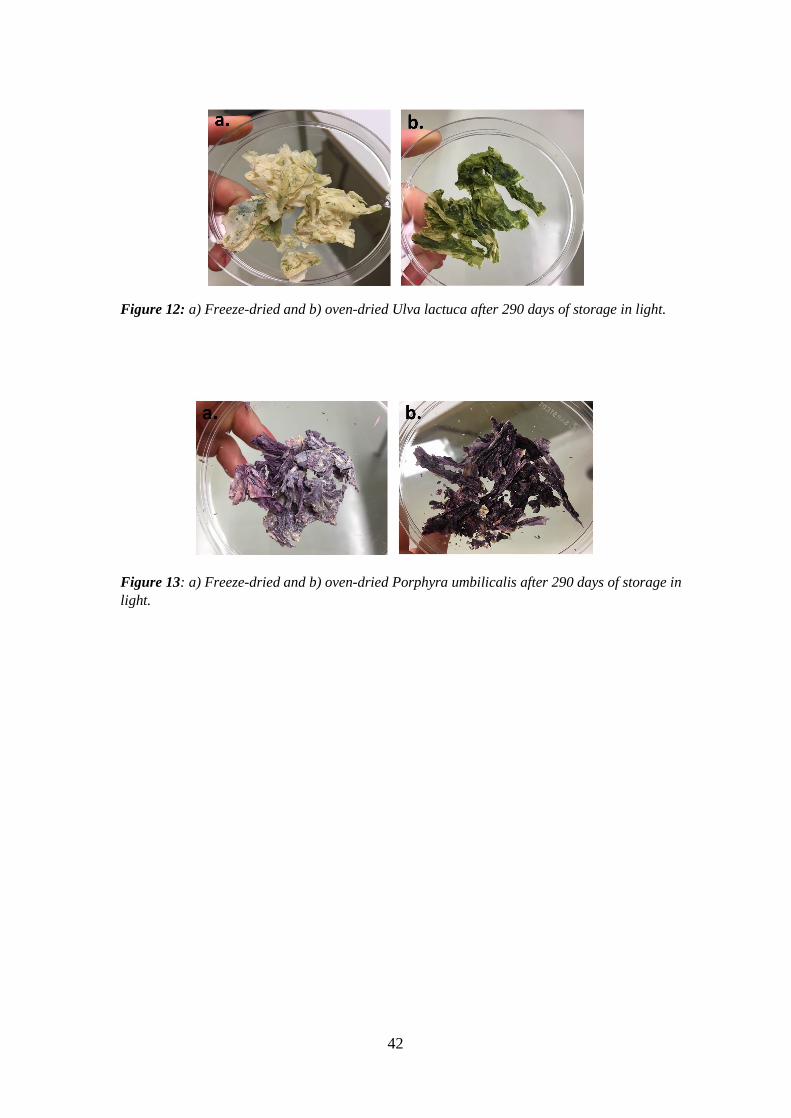
42
Figure 12: a) Freeze-dried and b) oven-dried Ulva lactuca after 290 days of storage in light.
Figure 13: a) Freeze-dried and b) oven-dried Porphyra umbilicalis after 290 days of storage in light.

43
Tab
le 9
: Tot
al c
olou
r ch
ange
, △E, for
free
ze-d
ried
, ove
n-dr
ied,
ove
n-dr
ied-
FW
, ove
n-dr
ied
SW-c
oate
d an
d ov
en-d
ried
FW
-coa
ted
U.
lact
uca
duri
ng s
tora
ge. N
ote
that
the
two
firs
t val
ues
for
the
ligh
t sto
rage
(gre
y) is
the
sam
e as
for
the
dark
sto
rage
sin
ce th
ose
sam
ples
w
ere
mov
ed to
ligh
t fir
st a
fter
90 d
ays
of d
ark
stor
age.
FW
=so
aked
in fr
eshw
ater
, SW
-coa
ting
=so
aked
in s
altw
ater
wit
h w
hey
coat
ing,
F
W-c
oati
ng=
soak
ed in
fres
hwat
er w
ith
whe
y co
atin
g.
Fr
eeze
-dri
ed
Ove
n-dr
ied
Ove
n-dr
ied-
FW
Ove
n-dr
ied
SW-
coat
ing
Ove
n-dr
ied
FW-
coat
ing
Day
D
ark
Sem
i-lig
ht
Lig
ht
Dar
k Se
mi-
light
L
ight
D
ark
Sem
i-lig
ht
Lig
ht
Dar
k Se
mi-
lig
ht
Lig
ht
Dar
k Se
mi-
lig
ht
Lig
ht
30
8.2
10.7
8.
2 3.
9 5.
4 3.
9 1.
6 3.
0 1.
6 3.
7 4.
9 3.
7 4.
5 6.
1 4.
5 90
11
.0
10.8
11
.0
2.3
5.3
2.3
3.4
1.8
3.4
3.1
5.5
3.1
2.2
3.2
2.2
150
7.2
11.7
9.
5 5.
0 5.
9 4.
2 4.
6 1.
2 3.
1 3.
4 5.
8 5.
6 5.
4 3.
5 8.
7 23
0 5.
9 8.
1 6.
7 4.
7 2.
5 3.
8 8.
4 3.
8 8.
3 9.
3 5.
2 4.
9 4.
8 5.
7 6.
8 31
0 8.
9 11
.5
20.5
7.
2 10
.5
14.5
10
.8
9.1
12.2
8.
8 11
.8
14.1
6.
7 3.
2 8.
2 37
0 10
.4
15.1
23
.2
12.9
14
.6
15.1
8.
0 13
.6
14.5
19
.7
18.2
18
.7
17.1
13
.2
17.0
52
0 12
.3
15.2
22
.6
9.0
14.8
23
.5
6.8
13.9
24
.0
16.3
19
.9
18.1
13
.0
14.0
14
.4
Tab
le 1
0: T
otal
col
our
chan
ge, △E, fo
r fr
eeze
-dri
ed, o
ven-
drie
d, o
ven-
drie
d-F
W, o
ven-
drie
d SW
-coa
ting
and
ove
n-dr
ied
FW
-coa
ting
P. u
mbi
lica
lis
duri
ng s
tora
ge. N
ote
that
the
two
firs
t val
ues
for
the
ligh
t sto
rage
(gr
ey)
is th
e sa
me
as f
or t
he d
ark
stor
age
sinc
e th
ose
sam
ples
wer
e m
oved
to
ligh
t fi
rst
afte
r 90
day
s of
dar
k st
orag
e. F
W=
soak
ed i
n fr
eshw
ater
, SW
-coa
ting
=so
aked
in s
altw
ater
wit
h w
hey
coat
ing,
FW
-coa
ting
=so
aked
in fr
eshw
ater
wit
h w
hey
coat
ing.
Fr
eeze
-dri
ed
Ove
n-dr
ied
Ove
n-dr
ied-
FW
Ove
n-dr
ied
SW-c
oatin
g O
ven-
drie
d FW
-coa
ting
Day
D
ark
Se
mi-
light
L
ight
D
ark
Se
mi-
light
L
ight
D
ark
Se
mi-
light
L
ight
Se
mi-
light
Se
mi-
light
30
3.
2 4.
4 3.
2 7.
0 13
.6
7.0
10.5
3.
2 10
.5
8.5
10.7
90
2.
9 2.
8 2.
9 11
.1
16.0
11
.1
14.9
0.
3 14
.9
1.8
12.9
15
0 7.
8 8.
5 10
.3
13.8
4.
7 9.
1 2.
4 2.
0 0.
3 2.
6 10
.9
230
3.5
2.6
8.8
6.9
5.9
12.5
5.
5 3.
5 14
.1
7.4
6.9
370
10.2
11
.7
15.8
16
.5
14.7
19
.7
10.1
14
.4
21.2
12
.4
13.6
52
0
9.1
16.0
16
.8
11
.8
12.1

44
5.3 Adaption and improvements of the pH-shift process to P. umbilicalis and U. lactuca During the adaption of the pH-shift process to P. umbilicalis and U. lactuca, it was found that the protein solubility increased with increasing pH in the first step of the process, Figure 14, while precipitation of recovered solubilised proteins increased with decreasing pH, Figure 15, equal to what was found for S. latissima [148]. The latter is different from e.g. fish and bean proteins, which normally have high solubility at both high and low pH values [258-260]. The trend with high solubility at high pH values and low solubility at low pH values has, however, earlier been reported for microalgae (Nannochloropsis oculata) [168].
Figure 14: Protein solubility of a.) Porphyra umbilicalis and b.) Ulva lactuca at different pHs. Data are shown as mean values ± (max-min)/2, (n=2).
Figure 15: Protein precipitation of a.) Porphyra umbilicalis and b.) Ulva lactuca at different pHs after initial protein solubilisation at pH 12 followed by centrifugation at 8000xg. Data are shown as mean values ± (max-min)/2, (n=2).
0
20
40
60
80
2 3 4 5 6 7 8 9 10 11 12 13
Prot
ein
solu
bili
ty (
%)
pH
a.
0
20
40
60
80
2 3 4 5 6 7 8 9 10 11 12 13
Prot
ein
solu
bili
ty (
%)
pH
b.
0
10
20
30
40
1.5 2 3 4 6 7
Prot
ein
prec
ipit
atio
n (%
)
pH
a.
0
10
20
30
40
1.5 2 3 4 6
Prot
ein
prec
ipit
atio
n (%
)
pH
b.
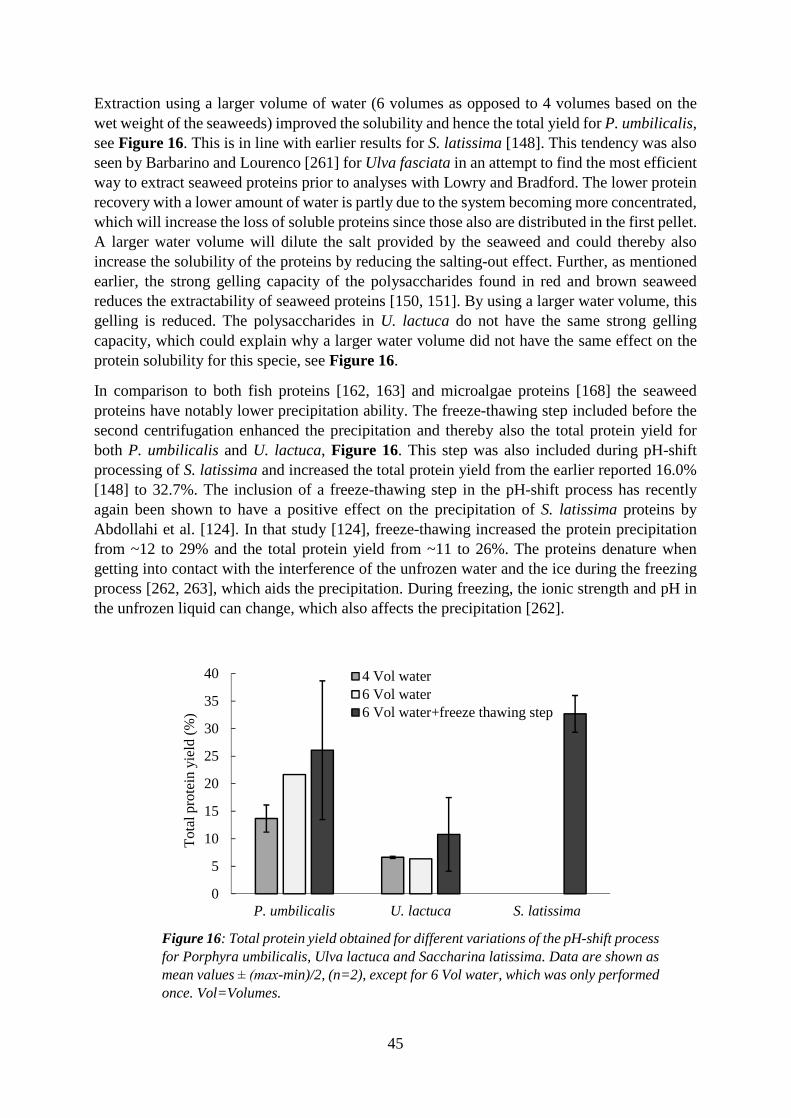
45
Extraction using a larger volume of water (6 volumes as opposed to 4 volumes based on the wet weight of the seaweeds) improved the solubility and hence the total yield for P. umbilicalis, see Figure 16. This is in line with earlier results for S. latissima [148]. This tendency was also seen by Barbarino and Lourenco [261] for Ulva fasciata in an attempt to find the most efficient way to extract seaweed proteins prior to analyses with Lowry and Bradford. The lower protein recovery with a lower amount of water is partly due to the system becoming more concentrated, which will increase the loss of soluble proteins since those also are distributed in the first pellet. A larger water volume will dilute the salt provided by the seaweed and could thereby also increase the solubility of the proteins by reducing the salting-out effect. Further, as mentioned earlier, the strong gelling capacity of the polysaccharides found in red and brown seaweed reduces the extractability of seaweed proteins [150, 151]. By using a larger water volume, this gelling is reduced. The polysaccharides in U. lactuca do not have the same strong gelling capacity, which could explain why a larger water volume did not have the same effect on the protein solubility for this specie, see Figure 16.
In comparison to both fish proteins [162, 163] and microalgae proteins [168] the seaweed proteins have notably lower precipitation ability. The freeze-thawing step included before the second centrifugation enhanced the precipitation and thereby also the total protein yield for both P. umbilicalis and U. lactuca, Figure 16. This step was also included during pH-shift processing of S. latissima and increased the total protein yield from the earlier reported 16.0% [148] to 32.7%. The inclusion of a freeze-thawing step in the pH-shift process has recently again been shown to have a positive effect on the precipitation of S. latissima proteins by Abdollahi et al. [124]. In that study [124], freeze-thawing increased the protein precipitation from ~12 to 29% and the total protein yield from ~11 to 26%. The proteins denature when getting into contact with the interference of the unfrozen water and the ice during the freezing process [262, 263], which aids the precipitation. During freezing, the ionic strength and pH in the unfrozen liquid can change, which also affects the precipitation [262].
Figure 16: Total protein yield obtained for different variations of the pH-shift process for Porphyra umbilicalis, Ulva lactuca and Saccharina latissima. Data are shown as mean values ± (max-min)/2, (n=2), except for 6 Vol water, which was only performed once. Vol=Volumes.
0
5
10
15
20
25
30
35
40
P. umbilicalis U. lactuca S. latissima
Tot
al p
rote
in y
ield
(%
)
4 Vol water6 Vol water6 Vol water+freeze thawing step

46
5.3.1 The final pH-shift method used (study III) Based on the results presented above, it was chosen to use 6 volumes of water based on the wet weight of the used seaweeds for homogenisation followed by an osmotic shock. Solubility was performed at pH 12 and precipitation at pH 2. A freeze-thawing step before the second centrifugation step was also included.
During the production of seaweed protein extracts in study III, the solubility at pH 12 was equal for all three species (53-68%), Figure 17. The reported solubility of proteins (measured as soluble nitrogen) for Enteromorpha sp.at pH 12 varied between ~20-25% [159], hence lower than in study III. For Sargassum nodosum, alkaline extraction by incubating in 0.1 M NaOH for 1h resulted in 61% protein solubility [155]. In the same study, by replacing the incubation with 10 min sonication in 0.1 M NaOH, the solubility was increased to 73%, which indicates that sonication could be a way both to increase the solubility and reduce the process time.
The precipitation during study III was remarkably higher for S. latissima (67%) compared to P. umbilicalis (41%) and U. lactuca (12%), Figure 17. Also, the variation in the precipitation step was remarkably lower for S. latissima, which could be linked to the recovered protein extract being much firmer for S. latissima compared to the other two species. Brown seaweed could, in contrast to red and green species, contain high levels of phlorotannins [222, 264]. Phlorotannins are known to bind to, and precipitate proteins [153], and thus, could explain the higher precipitation of the proteins from S. latissima. However, from a protein digestibility and bioavailability perspective, the phlorotannins could be negative. The phlorotannin levels in S. latissima are, however, low compared to other brown species such as Fucus vesiculosus and Ascophyllum nodosum [265].
Figure 17: Protein solubility, precipitation and total yield during the pH-shift process of Porphyra umbilicalis, Ulva lactuca and Saccharina latissima using 6 volumes of water based on the wet weight of respective species, together with a freeze-thawing step before the second centrifugation. Data are shown as mean values. Results are based on analyses in homogenates and supernatants. Error bar show max-min/2 for P. umbilicalis and S. latissima (n=2) and stdv for U. lactuca (n=3).
0
20
40
60
80
100
P. umbilicalis U. lactuca S. latissima
%
Solubility Precipitation Total yield
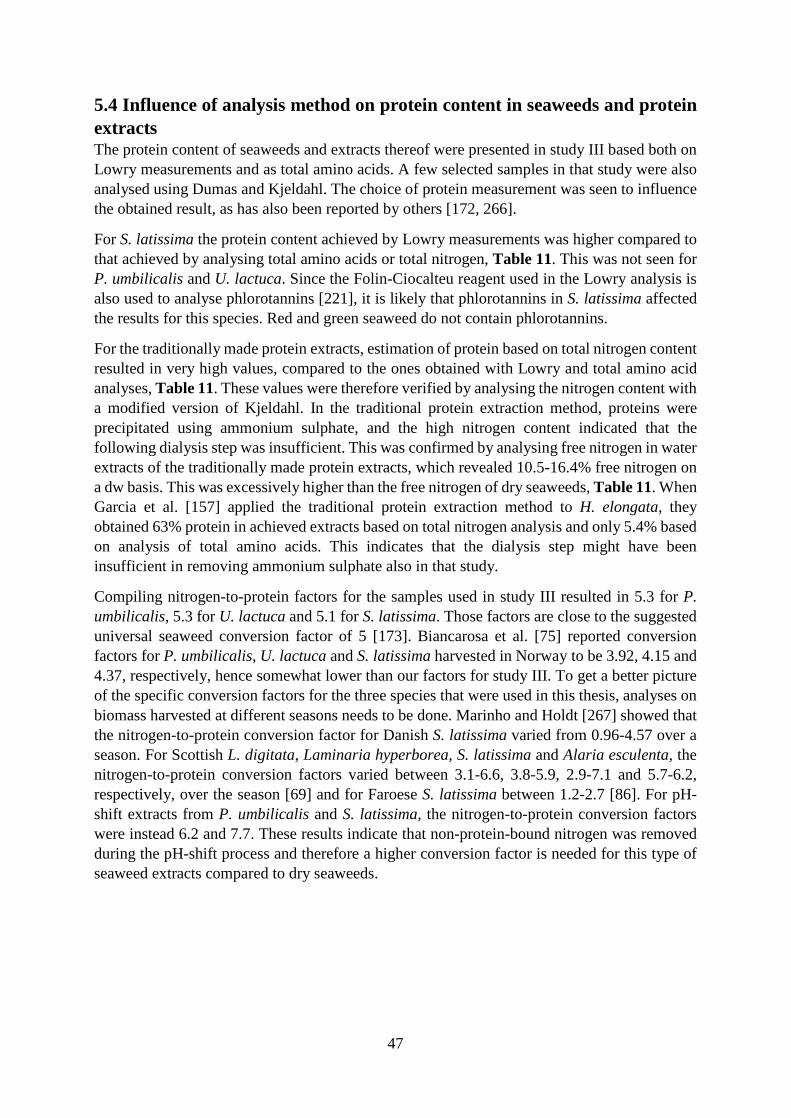
47
5.4 Influence of analysis method on protein content in seaweeds and protein extracts The protein content of seaweeds and extracts thereof were presented in study III based both on Lowry measurements and as total amino acids. A few selected samples in that study were also analysed using Dumas and Kjeldahl. The choice of protein measurement was seen to influence the obtained result, as has also been reported by others [172, 266].
For S. latissima the protein content achieved by Lowry measurements was higher compared to that achieved by analysing total amino acids or total nitrogen, Table 11. This was not seen for P. umbilicalis and U. lactuca. Since the Folin-Ciocalteu reagent used in the Lowry analysis is also used to analyse phlorotannins [221], it is likely that phlorotannins in S. latissima affected the results for this species. Red and green seaweed do not contain phlorotannins.
For the traditionally made protein extracts, estimation of protein based on total nitrogen content resulted in very high values, compared to the ones obtained with Lowry and total amino acid analyses, Table 11. These values were therefore verified by analysing the nitrogen content with a modified version of Kjeldahl. In the traditional protein extraction method, proteins were precipitated using ammonium sulphate, and the high nitrogen content indicated that the following dialysis step was insufficient. This was confirmed by analysing free nitrogen in water extracts of the traditionally made protein extracts, which revealed 10.5-16.4% free nitrogen on a dw basis. This was excessively higher than the free nitrogen of dry seaweeds, Table 11. When Garcia et al. [157] applied the traditional protein extraction method to H. elongata, they obtained 63% protein in achieved extracts based on total nitrogen analysis and only 5.4% based on analysis of total amino acids. This indicates that the dialysis step might have been insufficient in removing ammonium sulphate also in that study.
Compiling nitrogen-to-protein factors for the samples used in study III resulted in 5.3 for P. umbilicalis, 5.3 for U. lactuca and 5.1 for S. latissima. Those factors are close to the suggested universal seaweed conversion factor of 5 [173]. Biancarosa et al. [75] reported conversion factors for P. umbilicalis, U. lactuca and S. latissima harvested in Norway to be 3.92, 4.15 and 4.37, respectively, hence somewhat lower than our factors for study III. To get a better picture of the specific conversion factors for the three species that were used in this thesis, analyses on biomass harvested at different seasons needs to be done. Marinho and Holdt [267] showed that the nitrogen-to-protein conversion factor for Danish S. latissima varied from 0.96-4.57 over a season. For Scottish L. digitata, Laminaria hyperborea, S. latissima and Alaria esculenta, the nitrogen-to-protein conversion factors varied between 3.1-6.6, 3.8-5.9, 2.9-7.1 and 5.7-6.2, respectively, over the season [69] and for Faroese S. latissima between 1.2-2.7 [86]. For pH-shift extracts from P. umbilicalis and S. latissima, the nitrogen-to-protein conversion factors were instead 6.2 and 7.7. These results indicate that non-protein-bound nitrogen was removed during the pH-shift process and therefore a higher conversion factor is needed for this type of seaweed extracts compared to dry seaweeds.
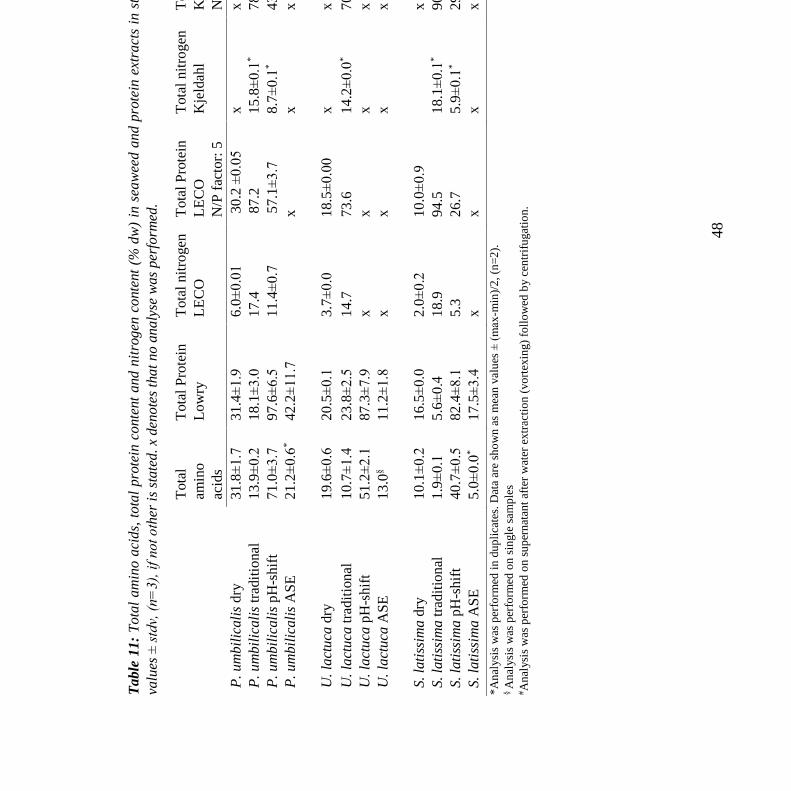
48
Tab
le 1
1: T
otal
am
ino
acid
s, t
otal
pro
tein
con
tent
and
nit
roge
n co
nten
t (%
dw
) in
sea
wee
d an
d pr
otei
n ex
trac
ts i
n st
udy
III.
Dat
a ar
e sh
own
as m
ean
valu
es ±
std
v, (n
=3),
if
not
oth
er is
sta
ted.
x d
enot
es th
at n
o an
alys
e w
as p
erfo
rmed
.
*Ana
lysi
s w
as p
erfo
rmed
in d
uplic
ates
. Dat
a ar
e sh
own
as m
ean
valu
es ±
(m
ax-m
in)/
2, (
n=2)
. §
Ana
lysi
s w
as p
erfo
rmed
on
sing
le s
ampl
es
# Ana
lysi
s w
as p
erfo
rmed
on
supe
rnat
ant a
fter
wat
er e
xtra
ctio
n (v
orte
) fo
llow
ed b
y ce
ntri
fuga
tion
.
Tot
al
amin
o ac
ids
Tot
al P
rote
in
Low
ry
Tot
al n
itrog
en
LE
CO
T
otal
Pro
tein
L
EC
O
N/P
fac
tor:
5
Tot
al n
itrog
en
Kje
ldah
l T
otal
Pro
tein
K
jeld
ahl
N/P
fac
tor:
5
Free
nitr
ogen
K
jeld
ahl#
P. u
mbi
lica
lis
dry
31
.8±
1.7
31
.4±
1.9
6.
0±0.0
1
30.
2 ±
0.0
5
x x
0.00
3§
P. u
mbi
lica
lis
trad
ition
al
13.9
±0.2
18
.1±
3.0
17
.4
87.
2 15
.8±
0.1
* 78
.9±
0.3
* 11
.7§
P. u
mbi
lica
lis
pH-s
hift
71
.0±
3.7
97
.6±
6.5
11
.4±
0.7
5
7.1±
3.7
8.
7±0.1
* 43
.3±
0.4
* 0.
001§
P
. um
bili
cali
s A
SE
21.2
±0.6
* 42
.2±
11.7
x x
x x
U. l
actu
ca d
ry
19.6
±0.6
20
.5±
0.1
3.
7±0.0
18
.5±
0.0
0
x x
0 U
. lac
tuca
trad
ition
al
10.7
±1.4
23
.8±
2.5
14
.7
73.6
14
.2±
0.0
* 70
.8±
0.1
* 10
.5±
0.4
* U
. lac
tuca
pH
-shi
ft
51.2
±2.1
87
.3±
7.9
x
x x
x x
U. l
actu
ca A
SE
13.0
§
11.2
±1.8
x
x x
x x
S. la
tiss
ima
dry
10.1
±0.2
16
.5±
0.0
2.
0±0.2
10
.0±
0.9
x 0.
001§
S.
lati
ssim
a tr
aditi
onal
1.
9±0.1
5.
6±0.4
18
.9
94.5
18
.1±
0.1
* 90
.4±
0.5
* 16
.4±
0.8
* S.
lati
ssim
a pH
-shi
ft
40.7
±0.5
82
.4±
8.1
5.
3
26.7
5.
9±0.1
* 29
.3±
0.4
* x
S. la
tiss
ima
ASE
5.
0±0.0
* 17
.5±
3.4
x
x x
x x
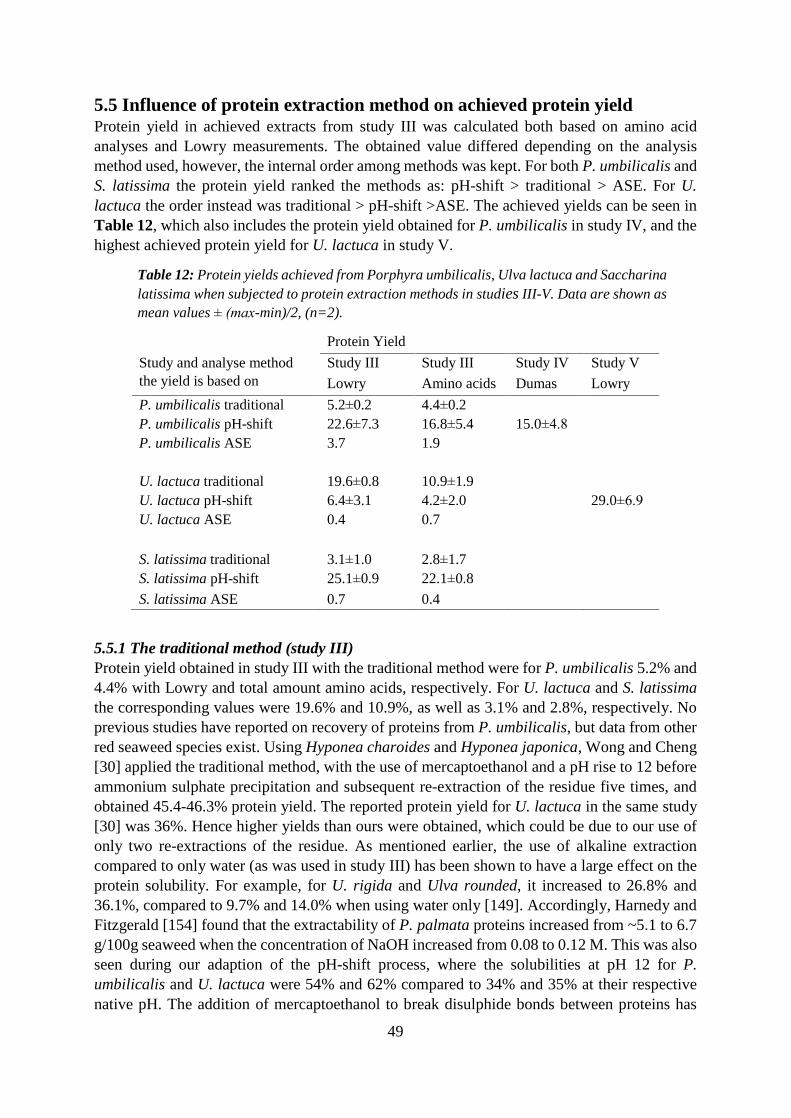
49
5.5 Influence of protein extraction method on achieved protein yield Protein yield in achieved extracts from study III was calculated both based on amino acid analyses and Lowry measurements. The obtained value differed depending on the analysis method used, however, the internal order among methods was kept. For both P. umbilicalis and S. latissima the protein yield ranked the methods as: pH-shift > traditional > ASE. For U. lactuca the order instead was traditional > pH-shift >ASE. The achieved yields can be seen in Table 12, which also includes the protein yield obtained for P. umbilicalis in study IV, and the highest achieved protein yield for U. lactuca in study V.
Table 12: Protein yields achieved from Porphyra umbilicalis, Ulva lactuca and Saccharina latissima when subjected to protein extraction methods in studies III-V. Data are shown as mean values ± (max-min)/2, (n=2).
Protein Yield
Study and analyse method the yield is based on
Study III Study III Study IV Study V
Lowry Amino acids Dumas Lowry
P. umbilicalis traditional 5.2±0.2 4.4±0.2 P. umbilicalis pH-shift 22.6±7.3 16.8±5.4 15.0±4.8 P. umbilicalis ASE 3.7 1.9
U. lactuca traditional 19.6±0.8 10.9±1.9 U. lactuca pH-shift 6.4±3.1 4.2±2.0 29.0±6.9 U. lactuca ASE 0.4 0.7
S. latissima traditional 3.1±1.0 2.8±1.7 S. latissima pH-shift 25.1±0.9 22.1±0.8
S. latissima ASE 0.7 0.4
5.5.1 The traditional method (study III) Protein yield obtained in study III with the traditional method were for P. umbilicalis 5.2% and 4.4% with Lowry and total amount amino acids, respectively. For U. lactuca and S. latissima the corresponding values were 19.6% and 10.9%, as well as 3.1% and 2.8%, respectively. No previous studies have reported on recovery of proteins from P. umbilicalis, but data from other red seaweed species exist. Using Hyponea charoides and Hyponea japonica, Wong and Cheng [30] applied the traditional method, with the use of mercaptoethanol and a pH rise to 12 before ammonium sulphate precipitation and subsequent re-extraction of the residue five times, and obtained 45.4-46.3% protein yield. The reported protein yield for U. lactuca in the same study [30] was 36%. Hence higher yields than ours were obtained, which could be due to our use of only two re-extractions of the residue. As mentioned earlier, the use of alkaline extraction compared to only water (as was used in study III) has been shown to have a large effect on the protein solubility. For example, for U. rigida and Ulva rounded, it increased to 26.8% and 36.1%, compared to 9.7% and 14.0% when using water only [149]. Accordingly, Harnedy and Fitzgerald [154] found that the extractability of P. palmata proteins increased from ~5.1 to 6.7 g/100g seaweed when the concentration of NaOH increased from 0.08 to 0.12 M. This was also seen during our adaption of the pH-shift process, where the solubilities at pH 12 for P. umbilicalis and U. lactuca were 54% and 62% compared to 34% and 35% at their respective native pH. The addition of mercaptoethanol to break disulphide bonds between proteins has

50
earlier been found to facilitate the extractability further [268]. However, the use of mercaptoethanol will render the process non-food-grade and was therefore not an alternative to use in study III.
Using the same method as Wong and Cheung [30], Kandasamy et al. [159] and Suresh Kumar et al. [160] reported protein yields for Enteromorpha species (E.compressa, E.linza and E. tubulose) of 5.71-6.48% [159] and for Kappaphycus alvarezii, 7.81% [160], hence in the same range as we obtained in study III for P. umbilicalis and S. latissima, but lower than for U. lactuca. Reported protein yield when using ammonium sulphate for precipitation without addition of 2-mercaptoethanol was 6.5% using the brown seaweed H. elongate [157]. However, in the latter study, it is not stated if the yield is per weight or initial protein content, rendering comparisons between methods difficult.
5.5.2 The pH-shift method (studies III-V) The pH-shift process gave the highest total protein yield for P. umbilicalis (22.6% and 16.8% with Lowry and total amount amino acids, respectively) and S. latissima (25.1% and 22.1% with Lowry and total amount amino acids, respectively) in study III. For U. lactuca, the yield was significantly lower (6.4% and 4.2% with Lowry and total amount of amino acids, respectively). Using a similar process as the pH-shift process, but without a freeze-thawing step, Angell et al. [169] obtained a protein yield of 12.3% from Ulva ohnoi, hence higher than our results for U. lactuca in study III. They initially stirred the biomass in de-ionised water for 16h compared to the 1h we used in study III. A longer osmotic shock has been shown to facilitate protein solubilisation for U. lactuca at its native pH [156], something which was not seen for S.latissima at pH 12 by Veide Vilg and Undeland [148]. Other reported protein yields from dry S. latissima using the pH-shift process without a freeze-thawing step [124, 148] vary between 7.2 and 16.0%, and with a freeze-thawing step [124], from 12.0 to 26.4%. Using wet S. latissima biomass, the corresponding range, when a freeze-thawing step was included, was 16.6-19.3% [124]. Our obtained protein yield for S. latissima with the pH-shift process is thus placed in the higher end of the reported values.
Effect of the enzyme ulvan lyase on the protein yield for U. lactuca during the pH-shift process (study V) The hypothesis in study V was that the use of ulvan lyase would break the cell wall and thereby increase the solubility of the proteins, however, this hypothesis could not be confirmed. Instead, when adding the enzyme into the process, the protein solubility unexpectedly decreased while the precipitation increased. This result could be explained in three different ways. Firstly, the shorter sulphated ulvan fragments formed during hydrolysis would be soluble in the water phase. Those charged fragments could have a salting-out effect on the proteins and thereby decrease the solubility and increase the precipitation. Secondly, at the low pH used for precipitation, it is likely that some of the extracted proteins will be positively charged and hence attracted to the charged sulphated groups. The lager complexes formed could more easily sediment. Lastly, the enzyme could have released some of the large structural proteins incorporated into the cell wall of U. lactuca [269], which could then work as �seeds� for the smaller proteins stimulating co-precipitation. A similar phenomenon has been suggested for fish proteins during the pH-shift process, where myofibrilliar proteins are suggested to act as seeds for the sarcoplasmic proteins and hence facilitate the precipitation [270].
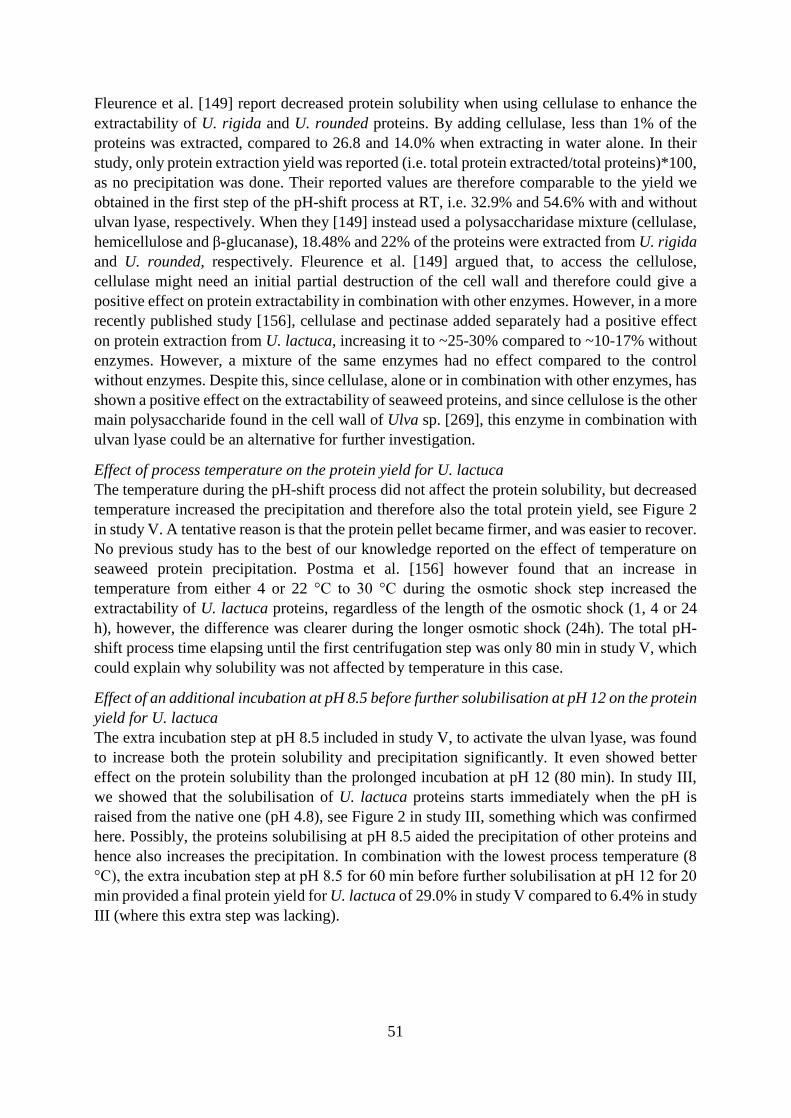
51
Fleurence et al. [149] report decreased protein solubility when using cellulase to enhance the extractability of U. rigida and U. rounded proteins. By adding cellulase, less than 1% of the proteins was extracted, compared to 26.8 and 14.0% when extracting in water alone. In their study, only protein extraction yield was reported (i.e. total protein extracted/total proteins)*100, as no precipitation was done. Their reported values are therefore comparable to the yield we obtained in the first step of the pH-shift process at RT, i.e. 32.9% and 54.6% with and without ulvan lyase, respectively. When they [149] instead used a polysaccharidase mixture (cellulase, hemicellulose and β-glucanase), 18.48% and 22% of the proteins were extracted from U. rigida and U. rounded, respectively. Fleurence et al. [149] argued that, to access the cellulose, cellulase might need an initial partial destruction of the cell wall and therefore could give a positive effect on protein extractability in combination with other enzymes. However, in a more recently published study [156], cellulase and pectinase added separately had a positive effect on protein extraction from U. lactuca, increasing it to ~25-30% compared to ~10-17% without enzymes. However, a mixture of the same enzymes had no effect compared to the control without enzymes. Despite this, since cellulase, alone or in combination with other enzymes, has shown a positive effect on the extractability of seaweed proteins, and since cellulose is the other main polysaccharide found in the cell wall of Ulva sp. [269], this enzyme in combination with ulvan lyase could be an alternative for further investigation.
Effect of process temperature on the protein yield for U. lactuca The temperature during the pH-shift process did not affect the protein solubility, but decreased temperature increased the precipitation and therefore also the total protein yield, see Figure 2 in study V. A tentative reason is that the protein pellet became firmer, and was easier to recover. No previous study has to the best of our knowledge reported on the effect of temperature on seaweed protein precipitation. Postma et al. [156] however found that an increase in temperature from either 4 or 22 °C to 30 °C during the osmotic shock step increased the extractability of U. lactuca proteins, regardless of the length of the osmotic shock (1, 4 or 24 h), however, the difference was clearer during the longer osmotic shock (24h). The total pH-shift process time elapsing until the first centrifugation step was only 80 min in study V, which could explain why solubility was not affected by temperature in this case.
Effect of an additional incubation at pH 8.5 before further solubilisation at pH 12 on the protein yield for U. lactuca The extra incubation step at pH 8.5 included in study V, to activate the ulvan lyase, was found to increase both the protein solubility and precipitation significantly. It even showed better effect on the protein solubility than the prolonged incubation at pH 12 (80 min). In study III, we showed that the solubilisation of U. lactuca proteins starts immediately when the pH is raised from the native one (pH 4.8), see Figure 2 in study III, something which was confirmed here. Possibly, the proteins solubilising at pH 8.5 aided the precipitation of other proteins and hence also increases the precipitation. In combination with the lowest process temperature (8 °C), the extra incubation step at pH 8.5 for 60 min before further solubilisation at pH 12 for 20
min provided a final protein yield for U. lactuca of 29.0% in study V compared to 6.4% in study III (where this extra step was lacking).
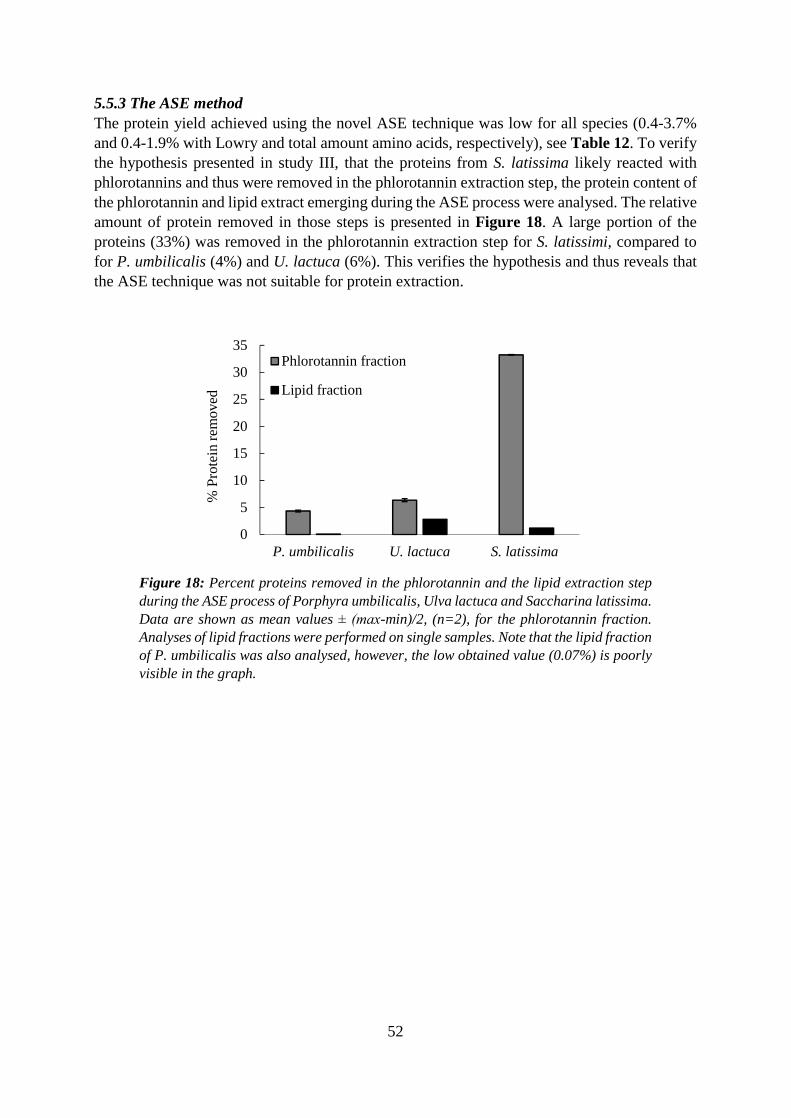
52
5.5.3 The ASE method The protein yield achieved using the novel ASE technique was low for all species (0.4-3.7% and 0.4-1.9% with Lowry and total amount amino acids, respectively), see Table 12. To verify the hypothesis presented in study III, that the proteins from S. latissima likely reacted with phlorotannins and thus were removed in the phlorotannin extraction step, the protein content of the phlorotannin and lipid extract emerging during the ASE process were analysed. The relative amount of protein removed in those steps is presented in Figure 18. A large portion of the proteins (33%) was removed in the phlorotannin extraction step for S. latissimi, compared to for P. umbilicalis (4%) and U. lactuca (6%). This verifies the hypothesis and thus reveals that the ASE technique was not suitable for protein extraction.
Figure 18: Percent proteins removed in the phlorotannin and the lipid extraction step during the ASE process of Porphyra umbilicalis, Ulva lactuca and Saccharina latissima. Data are shown as mean values ± (max-min)/2, (n=2), for the phlorotannin fraction. Analyses of lipid fractions were performed on single samples. Note that the lipid fraction of P. umbilicalis was also analysed, however, the low obtained value (0.07%) is poorly visible in the graph.
0
5
10
15
20
25
30
35
P. umbilicalis U. lactuca S. latissima
% P
rote
in r
emov
ed
Phlorotannin fraction
Lipid fraction

53
5.6 Differences in protein yield from seaweeds compared to crops and legumes Our data for protein yields from seaweed in studies III-V, along with other reported seaweed protein yields, are generally low compared to reported values from protein extraction of legumes, such as soy [271]. In legumes, proteins are found in storage entities, hence making extraction easier. In comparison, protein storage is low in seaweed. Seaweed are photosynthetic organisms and therefore carry a large quantity of their proteins inside the thylakoid membrane in highly interconnected structures.
The type of proteins differs between seaweed and legumes. Storage proteins mainly consist of four types of proteins [272]. For example, in soy and pea, 40-80% of the storage proteins is globulin, which is salt-soluble. The uniformity of the storage proteins makes the extraction easier. In photosynthetic tissue, the main classes of proteins are instead structural and enzymatic proteins. The enzymatic proteins are mainly found inside the thylakoids, connected to chlorophyll and carotenoids. Within this pool of proteins, there is a large heterogeneity due to their different roles in the photosynthesis. Therefore, it is not possible to use one or two extraction steps as for legumes and crops to extract the majority of the proteins from a photosynthetic matrix.
Also, as mentioned earlier, the polysaccharide-rich cell walls and the abundance of phenolic compounds in seaweed reduce the protein extractability [30, 150, 151]. Polyphenols can oxidise amino groups of peptides, leading to cross-links and the formation of reactive quinines. Quinines can react further with proteins, leading to the formation of large complexes [152]. Also, the phlorotannins found in brown seaweed reduce protein extractability by forming covalent bonds to them [153].
5.7 Composition differences between protein extracts and dry biomasses (study III) To allow for a relatively simple extraction method which can be up-scaled, our goal has been to produce semi-pure multi-functional seaweed protein extracts with interesting nutritional and techno-functional properties, rather than very pure protein isolates. The latter would call for numerous purification steps and would create a very costly and complex process. The same approach has also been suggested by Tamayo Tenorio et al. [271]. The co-extraction of e.g. LC n-3 PUFAs, minerals and vitamins could enhance the value of the extracts. Therefore, besides the total protein and amino acid composition of the achieved extracts in study III, also their fatty acid composition and ash content were analysed.
5.7.1 Protein content The obtained protein content (based on total amino acids) in the achieved extracts in study III varied from 1.9-71% depending on the species and protein extraction method applied, Table 11 (section 5.4). Only the pH-shift process could concentrate the proteins in the produced extracts, and the concentration factors were 2.2, 2.6 and 4.0 for P. umbilicalis, U. lactuca and S. latissima, respectively. Few previous studies on protein extraction from seaweed have also precipitated the proteins after the extraction step and therefore there is limited data available on protein content in seaweed extracts to make a comparison with.
The total amino acid content in the extracts produced with the traditional method was 13.9%, 19.6% and 1.9% (dw basis) for P. umbilicalis, U. lactuca and S. latissima, respectively. In
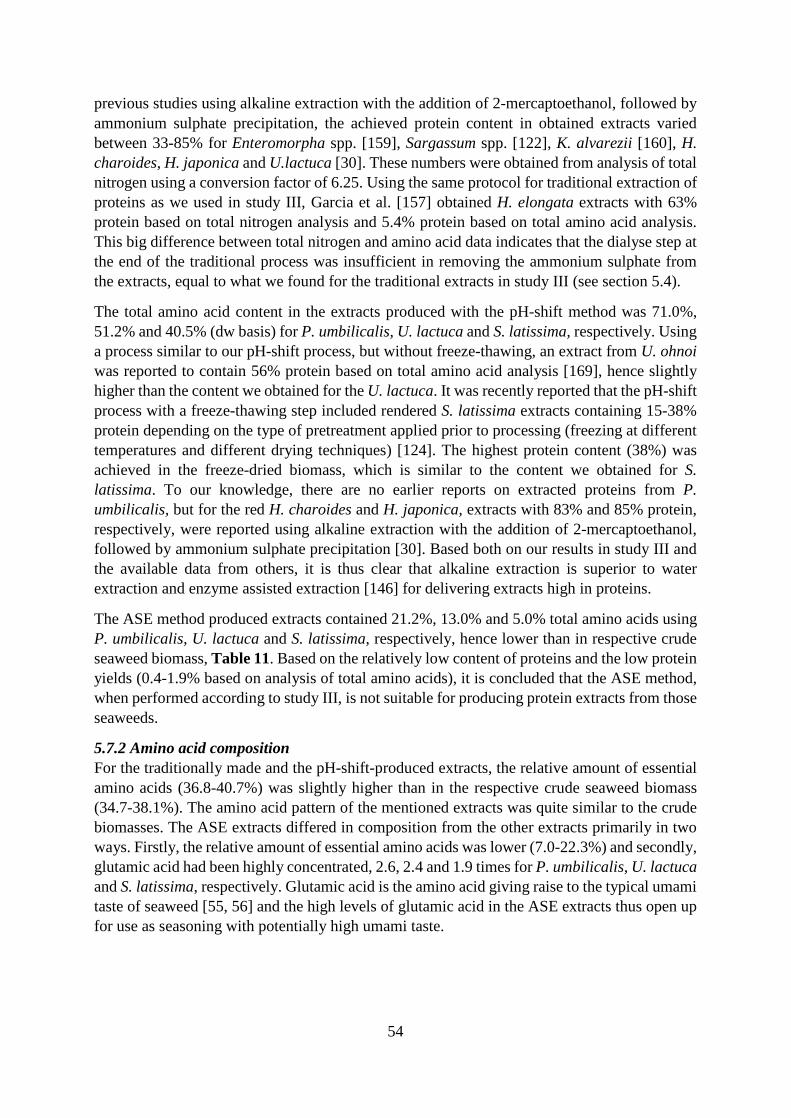
54
previous studies using alkaline extraction with the addition of 2-mercaptoethanol, followed by ammonium sulphate precipitation, the achieved protein content in obtained extracts varied between 33-85% for Enteromorpha spp. [159], Sargassum spp. [122], K. alvarezii [160], H. charoides, H. japonica and U.lactuca [30]. These numbers were obtained from analysis of total nitrogen using a conversion factor of 6.25. Using the same protocol for traditional extraction of proteins as we used in study III, Garcia et al. [157] obtained H. elongata extracts with 63% protein based on total nitrogen analysis and 5.4% protein based on total amino acid analysis. This big difference between total nitrogen and amino acid data indicates that the dialyse step at the end of the traditional process was insufficient in removing the ammonium sulphate from the extracts, equal to what we found for the traditional extracts in study III (see section 5.4).
The total amino acid content in the extracts produced with the pH-shift method was 71.0%, 51.2% and 40.5% (dw basis) for P. umbilicalis, U. lactuca and S. latissima, respectively. Using a process similar to our pH-shift process, but without freeze-thawing, an extract from U. ohnoi was reported to contain 56% protein based on total amino acid analysis [169], hence slightly higher than the content we obtained for the U. lactuca. It was recently reported that the pH-shift process with a freeze-thawing step included rendered S. latissima extracts containing 15-38% protein depending on the type of pretreatment applied prior to processing (freezing at different temperatures and different drying techniques) [124]. The highest protein content (38%) was achieved in the freeze-dried biomass, which is similar to the content we obtained for S. latissima. To our knowledge, there are no earlier reports on extracted proteins from P. umbilicalis, but for the red H. charoides and H. japonica, extracts with 83% and 85% protein, respectively, were reported using alkaline extraction with the addition of 2-mercaptoethanol, followed by ammonium sulphate precipitation [30]. Based both on our results in study III and the available data from others, it is thus clear that alkaline extraction is superior to water extraction and enzyme assisted extraction [146] for delivering extracts high in proteins.
The ASE method produced extracts contained 21.2%, 13.0% and 5.0% total amino acids using P. umbilicalis, U. lactuca and S. latissima, respectively, hence lower than in respective crude seaweed biomass, Table 11. Based on the relatively low content of proteins and the low protein yields (0.4-1.9% based on analysis of total amino acids), it is concluded that the ASE method, when performed according to study III, is not suitable for producing protein extracts from those seaweeds.
5.7.2 Amino acid composition For the traditionally made and the pH-shift-produced extracts, the relative amount of essential amino acids (36.8-40.7%) was slightly higher than in the respective crude seaweed biomass (34.7-38.1%). The amino acid pattern of the mentioned extracts was quite similar to the crude biomasses. The ASE extracts differed in composition from the other extracts primarily in two ways. Firstly, the relative amount of essential amino acids was lower (7.0-22.3%) and secondly, glutamic acid had been highly concentrated, 2.6, 2.4 and 1.9 times for P. umbilicalis, U. lactuca and S. latissima, respectively. Glutamic acid is the amino acid giving raise to the typical umami taste of seaweed [55, 56] and the high levels of glutamic acid in the ASE extracts thus open up for use as seasoning with potentially high umami taste.
55
Amino acid chemical score The achieved amino acid chemical score for the dry seaweeds used in study III, 22-89, Table 13, is lower or equal to numbers earlier reported for seaweed (51-106) [86, 273]. Since tryptophan was not detected with the used amino acid analysis method, this amino acid was not included in the calculations. For the pH-shift extracts, the scores were notably higher, 97-108, compared to the crude biomasses. This corresponds well with that the essential amino acids were concentrated during the pH-shift process and strengthens the hypothesis that seaweed is a promising source for new vegetarian proteins. For the traditional extracts, the amino acid chemical score increased for P. umbilicalis and U.lactuca, despite the fact that the total amino acid content in the extracts was lower than in corresponding seaweed biomasses. For all ASE extracts, the scores were lower, in accordance with their lower levels of essential amino acids compared to the crude seaweeds.
Table 13: Amino acid chemical score for Porphyra umbilicalis, Ulva lactuca and Saccharina latissima biomasses and protein extracts thereof in study III.
5.7.3 Fatty acid composition For the pH-shift extracts of U. lactuca and S. latissima the total fatty acid content was significantly higher than in the crude seaweeds. For U. lactuca, it went from 2.3% dw in crude biomass to 5.0% dw in the pH-shift extract and for S. latissima it went from 2.1% in crude biomass to 3.3% in the pH-shift extract. For U. lactuca, the low n-6/n-3 ratio (0.27) found in the biomass was kept in the pH-shift extracts, Table 7 (section 5.1.2). The relative amount of ALA was lower in the U. lactuca pH-shift extract (19.6%) compared to the crude biomass (25.0%), but instead, C16:4n3 was concentrated. For S. latissima the n-3 fatty acids exerted only 16.3% of total fatty acids in the pH-shift extract compared to 47.1% in the crude seaweed, resulting in a n-6/n-3 ratio of 1.18 for the pH-shift extracts compared to 0.48 for the crude seaweed. There was no significant difference in total fatty acids between crude P. umbilicalis and the pH-shift extract, and these samples also had similar n-6/n-3 ratios (0.58 respective 0.54). The co-extraction of fatty acids, especially of the n-3 family, could give an added value to the protein extracts. However, it is well known that PUFAs are susceptible towards oxidation, which could cause both an unpleasant off-flavour and the formation of unwanted oxidation
Amino acid chemical score
Limited amino acid/s
P. umbilicalis dry 33 Histidine P. umbilicalis traditional 91 Histidine P. umbilicalis pH-shift 117 Lysine P. umbilicalis ASE 5 Leucine
U. lactuca dry 22 Histidine U. lactuca traditional 77 Lysine U. lactuca pH-shift 97 Lysine U. lactuca ASE 13 Lysine
S. latissima dry 89 Lysine S. latissima traditional 40 Histidine S. latissima pH-shift 108 Lysine S. latissima ASE 38 Leucine
56
products [126, 129]. Therefore, the stability of the fatty acids, both during the actual process and during subsequent storage of the extracts, needs to be investigated. The traditionally made seaweed extracts and the ASE extracts had significantly lower fatty acid content than the respective crude seaweeds. In the case of the ASE method, it comprises an initial de-fatting step which probably explains the lower fatty acid content in those extracts
5.7.4 Ash content The ash content of both the traditional extracts and the pH-shift extracts was significantly lower than in the crude seaweeds. This is probably due to the relatively large water volumes used during these processes, which dilute the minerals. The ash content in the ASE extracts was significantly higher than in respective crude seaweeds. In this process, there is no dilution since the extraction is made with acetone and water followed by evaporation. The ASE extracts could therefore rather be interesting from a mineral and salt-replacer point of view, contributing with a high saltiness and umami taste due to the high levels of minerals and glutamic acid (section 5.7.2).
5.8 Qualitative characterisation of polysaccharide fractions from the sequential recovery of macromolecules in study IV It was successfully proven in study IV that a biorefinery approach for recovery of several valuable compounds from P. umbilicalis is possible. A biorefinery concept would facilitate better use of the raw material compared to extractions targeting only single compounds. It also minimises transportation of residues, since all extractions would be done in the same location, meanwhile contributing to the concept of circular economy [274, 275]. Depending on the specific seaweed species, a wide range of high-value products could be produced. In study IV, we applied sequential extraction of proteins, carrageenan, pectin and cellulose from P. umbilicalis and thus demonstrated an example of a biorefinery approach. Baghel et al. [276] recovered phycobilin pigments, lipids, agar, and a mineral-rich liquid from Gracilaria corticate using cold aqueous extraction, organic solvent extraction and hot aqueous extraction. Bioethanol was produced from the residual after the extractions using saccharification and fermentation. The authors [276] also concluded that the final residue could be used as a soil conditioner. Further, Glasson et al. [277] extracted salt, pigments and ulvan from U. ohnoi using aqueous extraction, ethanol extraction and acidic extraction. These examples illustrate the variety of valuable compounds that can be extracted from seaweed biomass using a biorefinery concept. An important aspect to consider in such biorefining is, however, to recover sensitive molecules first, so that e.g. harsh solvents or high temperatures do not cause degradation or, in the case of proteins, denaturation. In study IV, we applied the pH-shift process first for this reason and then subjected the non-soluble fraction to hot alkaline, acidic and organic solvent extractions, all of which could denature or cause other non-favourable reactions to the proteins.
The carrageen-rich fraction extracted in study IV formed a gel with K+ but not Ca2+, Figure 7 in study IV, indicating that the major form was κ-carrageenan. The ability of the carrageenan fraction to form a gel makes it interesting to investigate further, for future use as a thickening agent in e.g. food and/or in hydrogel applications. Food-grade carrageen is today produced industrially from other red species (Kappaphycus spp. and Eucheuma spp.) [43, 103] and therefore it is not likely that P. umbilicalis would be used for this purpose only. However, in a biorefinery approach where carrageenan is one out of several targeted compounds, it could add value to the Porphyra umbilicalis biomass.

57
A pectin fraction was unexpectedly recovered from P. umbilicalis. No one has to our knowledge previously reported on pectin extraction from seaweed, although it has earlier been reported in the cell wall of Ulva compressa [278]. Pectin, normally produced from citrus [279], is used within the food industry as a thickening agent due to its ability to form gels together with Ca2+. The obtained pectin fraction in study IV had a low galacturonic acid content compared to the pectin obtained from citrus peel, and hence, the gelling capacity of this fraction could be different, which is still to be explored.
A small cellulose fraction was recovered at the end of the sequential extraction of proteins, carrageenan and pectin; it contributed to 1.2% of the initial weight of the biomass. Due to the very low amount, P. umbilicalis is not a promising source for cellulose production. Other seaweed species such as Gelidiella acerosa and Sargassum tenerrimum might be more suitable for this purpose [107].
58
6. CONCLUSIONS
This thesis evaluated seaweeds as a potential food protein source. The results strengthen the hypothesis that seaweed could be an important contributor to the protein shift, meanwhile also contributing with PUFAs, vitamins and minerals. More precisely, the results showed that:
The protein and fatty acid content in U. lactuca biomass were increased by low light and the addition of nitrate during cultivation. Lower temperature (13 °C) increased the
protein content, while high temperature (18 °C) increased the fatty acid content. These
results show that by alterative cultivation, protein-enriched U. lactuca could be obtained for further use e.g. in protein extractions.
There was a moderate development of the aldehydes MDA, HHE and HNE in U. lactuca and P. umbilicalis up to 520 days of storage. Along with this, there was a drastic loss of fatty acids. Further, ascorbic acid decreased in all samples during a storage period of 230 days and it was found that the whey coating significantly reduced the levels of ascorbic acid in both P. umbilicalis and U. lactuca during the actual drying step. There were also significant losses of green and yellow colour during storage of the dried seaweeds. Light stimulated the development of aldehydes as well as the loss of ascorbic acid (in U. lactuca), fatty acids and colour. Thus, dried seaweed should be stored in darkness to keep nutrients intact and the storage period should be as short as possible.
The three seaweed species responded differently to the three protein extraction methods evaluated. The pH-shift method gave the highest total protein yield for P. umbilicalis (23%) and S. latissima (25%), while the traditional method gave the highest total protein yield for U. lactuca (20%). The ASE method resulted in very low protein yields for all three species and it is concluded that this method is not suitable for protein extraction from these seaweed species.
The protein yield during pH-shift processing of U. lactuca could be increased from 9.2% to 29%, hence higher than achieved with the traditional method, by an extra incubation step at pH 8.5 and 8 °C, before further protein solubilisation at pH 12. Surprisingly, the
addition of the enzyme ulvan lyase during pH-shift processing of U. lactuca significantly decreased the protein solubility but increased the precipitation. The net effect was that the total protein yield was not raised beyond the yield provided by the extra incubation step alone.
All pH-shift extracts contained significantly more proteins (up to 71% dw) than the crude seaweed biomasses. The U. lactuca and S. latissima pH-shift extracts also contained significantly higher amounts of fatty acids than the crude seaweed biomasses. The traditional method did not concentrate proteins, fatty acids or ash for any of the used seaweed species. The ASE method concentrated the ash for all three species, but not proteins and lipids. Based on these results, the pH-shift method is identified to be a promising strategy for concentrating proteins from P. umbilicalis, U. lactuca and S. latissima.
59
The protein analysis methods used: total amino acids, Lowry or nitrogen analysis using a nitrogen-to-protein conversion factor of 5, had little effect on the obtained results for crude P. umbilicalis and U. lactuca. However, for S. latissima the Lowry method resulted in higher values compared to the other methods, probably due to the abundance of phlorotannins. For the protein extracts the achieved protein content varied excessively with protein analysis method. Those results emphasise the importance of carefully selecting a protein analysis method to apply on seaweed and seaweed protein extracts.
The pH-shift method could successfully be used as the first step in a sequential recovery of protein, carrageenan, pectin and cellulose from P. umbilicalis. The extracted carrageenan-fraction could be useful e.g. in hydrogel applications due to its gel-forming capacity together with K+. These results pinpoint the possibilities to fully use the seaweed biomass for multiple products, without creating side streams.
60
7. FUTURE PERSPECTIVES
The results presented in this work showed that the pH-shift process produced protein extracts high in proteins from seaweeds. The major incentive for extracting the proteins was that the seaweed protein digestibility is described to be low due to the polysaccharide-rich cell wall and the abundance of polyphenols in seaweed [23-30]. By extracting the proteins, we hypothesised that the digestibility could be increased. To test this hypothesis, a follow-up study should be performed were the digestibility of our produced seaweed extracts is to be compared to the digestibility of crude seaweeds. This is similar to what earlier has been done for pH-shift extracts from microalgae [280]. Furthermore, the protein bioavailability of extracts and crude seaweed should be investigated, for instance, using a caco-2 cell model.
To further raise the potential of the pH-shift process, additional experiments to increase the protein yield, both by increasing the solubility and the precipitation, should be carried out. For U. lactuca, it has previously been shown that an extended osmotic shock could increase the total yield [156], something that was not seen for S. latissima [148]. Based on this result, it could be interesting to further evaluate the combination of an extended osmotic shock and the pH-shift process for both U. lactuca and P. umbilicalis. In several studies [144, 151, 156] it has been shown that cellulase alone, or enzyme mixtures containing cellulase, have increased the extractability of seaweed proteins. This should be evaluated further by combining cellulase with ulvan lyase for U. lactuca, to increase the yield further. The use of polyphenol oxidase inhibitors could be an alternative to increase the protein yield by limiting interactions between proteins and polyphenols. To increase the protein precipitation, the use of flocculants at the end of the process is an interesting approach to evaluate.
We hypothesise that the observed concentration of lipids together with the proteins for U. lactuca and S. latissima in the pH-shift process is an extra added value to the extracts. Due to the unsaturated character of the lipids, their stability, during processing, subsequent handling and storage of the extracts must, however, be ensured. This is a point of further investigation. The value of the extracts could also be raised by the occurrence of vitamins and specific bioactive compounds, such as peptides and therefore a more thorough characterisation of the extracts is warranted. Also, due to the relatively low protein yield in the pH-shift process, it is very important to look into the side fractions of the process and evaluate also their potential application as high-value food or feed ingredients. This would secure economic revenue from investing in costly process equipment.
The techno-functionality, such as gelling capacity, water- and oil-holding capacity of the protein extracts is still to be explored. These properties are extremely important for the possible application areas of the protein extracts. Furthermore, sensory evaluation of the achieved extracts should be carried out to explore their suitability as potential food ingredients.
High iodine levels have been reported from brown seaweed species [115, 116]. Iodine is essential for us but could in high doses be toxic and therefore careful mapping of the partitioning of iodine during the pH-shift process is needed. Also, the ability of the seaweeds to take up heavy metals from the surrounding waters requires a very careful control of their partitioning in the pH-shift process. This is especially important in a potential future commercialisation.
61
Highest protein content was achieved in the biomasses cultivated during winter time. Also, addition of nutrients and low light and low temperature had a beneficial effect on the protein content during alterative cultivation of U. lactuca. More experiments where temperature and light are thoroughly explored together with the addition of nutrients could give a better understanding of the relationship between those parameters for the intracellular composition of U. lactuca.
In this work, only a moderate development of MDA, HHE and HNE was detected during storage of P. umbilicalis and U. lactuca, despite the substantial decrease in unsaturated fatty acid during storage, especially in light. A more expanded analysis of lipid oxidation products, such as e.g. hexanal, pentanal, nonanal, butanal and pentenol, could give additional answers regarding the stability of seaweed lipids during storage. α-tocopherol is an efficient antioxidant by its ability to scavenge free radicals in synergy with ascorbic acid [281]. This quality makes it an interesting parameter to follow as an early oxidation marker during storage of seaweed.
For the carbohydrate fractions resulting from the sequential recovery of macromolecules from P. umbilicalis, no quantitative analysis was possible to perform. Because of this, only weight yields were reported for these fractions. Quantitative analysis methods would be required to further evaluate the yields of these polysaccharides, and hence make better conclusions on the biorefinery potential of P. umbilicalis.
62
8. ACKNOWLEDGEMENTS
Först vill jag tacka mina handledare Ingrid Undeland och Gunilla Toth för all hjälp och goda
råd. Ingrid, din dörr har alltid stått öppen och jag har alltid känt mig välkommen. Tack för all
kunskap du har delat med dig av och för att du alltid har uppmuntrat och stöttat mig. Men
framförallt tack för alla möjligheter du har gett mig att utvecklas och anta nya utmaningar.
Gunilla, tack för att du tålmodigt svarat på mina alg- och statistikfrågor, om och om igen.
Tack till Rikard Landberg, Bo Ekstrand och Ann-Sofie Sandberg för er konstruktiva feedback
på avhandlingen. Tack Assi och Rikard L för er support, speciellt i slutet av min doktorandtid.
Nisse och Annette, tack för all er hjälp men framförallt tack för att ni alltid har brytt er. Att prata med er har alltid varit lika roligt. Nisse, din kunskap har löst många problem i labbet åt
mig. Mi-Lo, du har varit en stabil klippa och jag har uppskattat alla trevliga tillställningar och
fikastunder du har fixat under åren.
Karin L, bättre kollega är svårt att hitta. Tack för all din hjälp, men framförallt tack för att du
är en så bra vän och för att du alltid får mig att skratta. Linnea, min vän, tack för att du alltid
finns där och uppmuntrar och peppar mig. Tack för att du svarar ögonblickligen på alla mina
panikfrågor på messenger och ser till att vi firar både små och stora framsteg.
Tack till mitt gamla kontor, Karin J, Nikul och Cecilia T, vi hade en härlig tid tillsammans och
jag minns den som att vi ständigt skrattade. Karin J, vi har avhandlat många minnesvärda, roliga
och ibland onämnbara samtalsämnen. Nikul, jag kommer aldrig glömma när du stannade kvar
sent en kväll för att hjälpa mig färdigställa rapporter. Cecilia T, tack för att du är en fin vän och
för allt ditt stöd i olika �krissituationer�. Jag kommer heller aldrig glömma när du kom in på
din lediga dag för att hjälpa mig på labbet. Thanks to my new room: Mohsen, Swarnim and Olle, we have shared many laughs and crazy �research ideas�. Mohsen, thank you for always smiling and all the joy you brought to the office. Swarnim, thank you for always being such a caring and warm hearted person. Olle, tack för alla trevliga pratstunder om allt mellan himmel
och jord och för den delade vårdnaden om blommorna. Ta hand om ananasen! Jingnan, thank you for sharing my last stressful time at FNS.
Johanna och Marcus, det var ett rent nöje att ha er som mastersstudenter. Johanna, tack för
minnesvärda nätter med algtorkning och lördagar med algmalning och fotbollstittande.
Lillie, tack för alla trevliga stunder på labb, värdefull språkhjälp och för att du alltid ser till att
mitt strösselförråd är välfyllt. Cecilia M, tack för din öppenhet, våra förtroliga samtal och för
att du försett mig med en skyddande amulett. Rikard F, tack för all hjälp och alla stunder när vi
gemensamt slitit vårt hår över MassHunter. Tack till Niklas, Izabela, Nathalie, Malin, Semhar och Angela för alla trevliga pratstunder, de har förgyllt min vardag.
Thank you, Maria Hayes, for a nice collaboration but also for all fun moments and laughs we have shared.
Thanks to all co-workers in the Sweaweed-project, Henrik, Gunilla, Susanne, Friederike, Sophie, Göran, Gunnar, Alastair, Eva, Venky, Jocke, Eric, Suzana, Ulrica and Niklas, for nice collaborations, I have learnt a lot from all of you. Thanks to all present and past members of the FNS, for making our work environment friendly.
63
Tack till LIFT, för alla trevliga och lärorika kurser och resor genom åren. Tack till min mentor
Sara Malmström, det har alltid varit lika trevligt att prata med dig.
Ett stort tack till mina fina vänner, Emelie, Sanna, Niada, Ida, Linnea, Agnes, Sara, Cecilia,
Cecilia, Karin och Yvonne för att ni alltid finns där och för all glädje och kärlek ni ger mig.
Tack till min älskade familj. Mamma och pappa, tack för allt ni gör och för att ni alltid finns
där, ni får mig att känna mig älskad. Mamma, tack för alla tusentals sidor av tråkiga skolarbeten
du har läst de senaste 24 åren. Pappa, tack för din outtröttliga humor och för att du alltid får mig
på bättre humör. Tack för alla otaliga timmar du har lagt på att få till den perfekta algbilden.
Kia, världens bästa syster, tack för allt ditt stöd och för ditt tålamod när jag sätter igång och
ältar och oroar mig. Krischan, även om vi gnabbas ibland ska du veta att jag alltid uppskattar dig och att du alltid får mig att tro på mig själv. Isabelle, tack för att du alltid är en sådan solstråle
och lyser upp min tillvaro. Rikard, mitt hjärtas blomster, tack för att du alltid tror på mig, stöttar
mig och för allt du gör för mig. Allt känns mycket bättre i din närvaro, du är bäst!

64
9. REFERENCES
1. United Nations, Department of Economic and Social Affairs, Population Division (2019). World Population Prospects 2019: Highlights (ST/ESA/SER.A/423).
2. Alexandratos, N. and J. Bruinsma. 2012. World agriculture towards 2030/2050: the 2012 revision. ESA Working paper No. 12-03. Rome, FAO.
3. Vermeulen, S.J., B.M. Campbell, and J.S.I. Ingram, Climate Change and Food Systems. Annual Review of Environment and Resources, 2012. 37(1): p. 195-222.
4. Gerber, P.J., H. Steinfeld, B. Henderson, A. Mottet, C. Opio, J. Dijkman, A. Falcucci, and Tempio, G. 2013. Tackling climate change through livestock � A global assessment of emissions and mitigation opportunities. Food and Agriculture Organization of the United Nations (FAO), Rome.
5. Persson U. M, D.J.A Johansson, C. Cederberg, F. Hedenus, and D. Bryngelsson, Climate metrics and the carbon footprint of livestock products: wheres the beef?. Environmental Research Letters, 2015. 10 (3): 034005
6. Comprehensive Assessment of Water Management in Agriculture. 2007. Water for Food, Water for Life: A Comprehensive Assessment of Water Management in Agriculture. London: Earthscan, and Colombo: International Water Management Institute.
7. Leip, A., G. Billen, J. Garnier, B. Grizzetti, L. Lassaletta, S. Reis, D. Simpson, M.A. Sutton, W. de Vries, F. Weiss, and H. Westhoek, Impacts of European livestock production: nitrogen, sulphur, phosphorus and greenhouse gas emissions, land-use, water eutrophication and biodiversity. Environmental Research Letters, 2015. 10(11): 115004.
8. Carvalho, F.P., Agriculture, pesticides, food security and food safety. Environmental Science & Policy, 2006. 9(7): p. 685-692.
9. Richi, E.B., B. Baumer, B. Conrad, R. Darioli, A. Schmid, and U. Keller, Health Risks Associated with Meat Consumption: A Review of Epidemiological Studies. International Journal for Vitamin and Nutrition Research, 2015. 85(1-2): p. 70-78.
10. Černá, M., Seaweed Proteins and Amino Acids as Nutraceuticals, in Advances in Food and Nutrition Research, K. Se-Kwon, Editor. 2011, Academic Press. p. 297-312.
11. Parodi, A., A. Leip, I.J.M. De Boer, P.M. Slegers, F. Ziegler, E.H.M. Temme, M. Herrero, H. Tuomisto, H. Valin, C.E. Van Middelaar, J.J.A. Van Loon, and H.H.E. Van Zanten, The potential of future foods for sustainable and healthy diets. Nature Sustainability, 2018. 1(12): p. 782-789.
12. Kraan, S., Mass-cultivation of carbohydrate rich macroalgae, a possible solution for sustainable biofuel production. Mitigation and Adaptation Strategies for Global Change, 2013. 18(1): p. 27-46.
13. Moreira, D. and J.C.M. Pires, Atmospheric CO2 capture by algae: Negative carbon dioxide emission path. Bioresource Technology, 2016. 215: p. 371-379.
14. Kader, A.S.A., O.S. Olanrewaju, and W.W. Shamsuri, Potential of macro algae for biomass energy source and green house gas emission carbon capture. Biosciences Biotechnology Research Asia, 2013. 10(2): p. 653-658.
15. Liot, F., A. Colin, and S. Mabeau, Microbiology and storage life of fresh edible seaweeds. Journal of applied phycology, 1993. 5(2): p. 243-247.
16. Paull, R.E. and N.J. Chen, Postharvest handling and storage of the edible red seaweed Gracilaria. Postharvest biology and technology, 2008. 48(2): p. 302-308.
17. Nayyar, D. and D.I. Skonberg, Contrasting effects of two storage temperatures on the microbial, physicochemical, and sensory properties of two fresh red seaweeds, Palmaria palmata and Gracilaria tikvahiae. Journal of Applied Phycology, 2019. 31(1): p. 731-739.
18. Kadam, S.U., C. Alvarez, B.K. Tiwari, and C.P. O´Donnell, Processing of seaweed, in Seaweed Sustainability Food and Non-Food Applications, B.K. Tiwari and D.J. Troy, Editors. 2015, Academic Press. p. 61-74.
65
19. Chan, J.C.C., P.C.K. Cheung, and P.O. Ang, Comparative studies on the effect of three drying methods on the nutritional composition of seaweed Sargassum hemiphyllum (Turn) C Ag. Journal of Agricultural and Food Chemistry, 1997. 45(8): p. 3056-3059.
20. Fleurence, J., G. Gutbier, S. Mabeau, and C. Leray, Fatty acids from 11 marine macroalgae of the French Brittany coast. Journal of Applied Phycology, 1994. 6(5): p. 527-532.
21. Choe, E. and S. Oh, Effects of Water Activity on the Lipid Oxidation and Antioxidants of Dried Laver (Porphyra) During Storage in the Dark. Journal of Food Science, 2013. 78(8): p. C1144-C1151.
22. Oh, S., E. Lee, and E. Choe, Light effects on lipid oxidation, antioxidants, and pigments in dried laver (Porphyra) during storage. Food Science and Biotechnology, 2014. 23(3): p. 701-709.
23. Fleurence, J., Seaweed proteins: biochemical, nutritional aspects and potential uses. Trends in Food Science & Technology, 1999. 10(1): p. 25-28.
24. Galland-Irmouli, A.-V., J. Fleurence, R. Lamghari, M. Luçon, C. Rouxel, O. Barbaroux, J.-P. Bronowicki, C. Villaume, and J.-L. Guéant, Nutritional value of proteins from edible seaweed Palmaria palmata (dulse). The Journal of Nutritional Biochemistry, 1999. 10(6): p. 353-359.
25. Machu, L., L. Misurcova, D. Samek, J. Hrabe, and M. Fisera, In Vitro Digestibility of Different Commercial Edible Algae Products. Journal of Aquatic Food Product Technology, 2014. 23(5): p. 423-435.
26. MacArtain, P., C.I. Gill, M. Brooks, R. Campbell, and I.R. Rowland, Nutritional value of edible seaweeds. Nutrition reviews, 2007. 65(12): p. 535-543.
27. Marrion, O., J. Fleurence, A. Schwertz, J.-L. Guéant, L. Mamelouk, J. Ksouri, and C. Villaume, Evaluation of protein in vitro digestibility of Palmaria palmata and Gracilaria verrucosa. Journal of Applied Phycology. 17(2): p. 99-102.
28. Marrion, O., A. Schwertz, J. Fleurence, J.L. Guéant, and C. Villaume, Improvement of the digestibility of the proteins of the red alga Palmaria palmata by physical processes and fermentation. Food/Nahrung, 2003. 47(5): p. 339-344.
29. Misurcova, L., Seaweed Digestibility and Methods used for Digestibility Determination, in Handbook of Marine Macroalgae, K. Se-Kwon, Editor. 2012, John Wiley & Sons. p. 285-301.
30. Wong, K.H. and P.C.K. Cheung, Nutritional evaluation of some subtropical red and green seaweeds Part II. In vitro protein digestibility and amino acid profiles of protein concentrates. Food Chemistry, 2001. 72(1): p. 11-17.
31. Preece, K.E., N. Hooshyar, and N.J. Zuidam, Whole soybean protein extraction processes: A review. Innovative Food Science & Emerging Technologies, 2017. 43: p. 163-172.
32. Damodaran, S., Amino Acids, Peptides, and Proteins, in Fennema´s Food Chemistry, S. Damodaran, K.L. Parkin, and O.R. Fennema, Editors. 2008. p. 217-329.
33. Angell, A.R., S.F. Angell, R. de Nys, and N.A. Paul, Seaweed as a protein source for mono-gastric livestock. Trends in Food Science & Technology, 2016. 54: p. 74-84.
34. Hughey, J.R., C.A. Maggs, F. Mineur, C. Jarvis, K.A. Miller, S.H. Shabaka, and P.W. Gabrielson, Genetic analysis of the Linnaean Ulva lactuca (Ulvales, Chlorophyta) holotype and related type specimens reveals name misapplications, unexpected origins, and new synonymies. Journal of Phycology, 2019. 55(3): p. 503-508.
35. Hurd, C.L., P.J. Harrisson, K. Bischof, and C.S. Lobban, Seaweed Ecology and Physiology. 2014, Cambridge University Press.
36. Blouin, N.A., J.A. Brodie, A.C. Grossman, P. Xu, and S.H. Brawley, Porphyra: a marine crop shaped by stress. Trends in Plant Science, 2011. 16(1): p. 29-37.
37. Blouin, N., F. Xiugeng, J. Peng, C. Yarish, and S.H. Brawley, Seeding nets with neutral spores of the red alga Porphyra umbilicalis (L.) Kützing for use in integrated multi-trophic aquaculture (IMTA). Aquaculture, 2007. 270(1): p. 77-91.
38. Potter, E.E., C.S. Thornber, J.-D. Swanson, and M. McFarland, Ploidy Distribution of the Harmful Bloom Forming Macroalgae Ulva spp. in Narragansett Bay, Rhode Island, USA, Using Flow Cytometry Methods. PloS one, 2016. 11(2): p. e0149182.
66
39. Bast, F., An Illustrated Review on Cultivation and Life History of Agronomically Important Seaplants, in Seaweed: Mineral Composition, Nutritional and Antioxidant Benefits and Agricultural Uses, V.H. Pomin, Editor. 2014, Nova Publishers. p. 39-70.
40. Buschmann, A.H., C. Camus, J. Infante, A. Neori, Á. Israel, M.C. Hernández-González, S.V. Pereda, J.L. Gomez-Pinchetti, A. Golberg, N. Tadmor-Shalev, and A.T. Critchley, Seaweed production: overview of the global state of exploitation, farming and emerging research activity. European Journal of Phycology, 2017. 52(4): p. 391-406.
41. Sahoo, D. and C. Yarish, Mariculture of seaweeds, in Algal Culturing Techniques, R.A. Andersen, Editor. 2005, Elsevier Academic Press. p. 219-237.
42. FAO. 2018. The State of World Fisheries and Aquaculture 2018 - Meeting the sustainable development goals. Rome. Licence: CC BY-NC-SA 3.0 IGO.
43. Kim, J.K., C. Yarish, E.K. Hwang, M. Park, and Y. Kim, Seaweed aquaculture: cultivation technologies, challenges and its ecosystem services. Algae, 2017. 32(1): p. 1-13.
44. Fei, X., Solving the coastal eutrophication problem by large scale seaweed cultivation. Hydrobiologia, 2004. 512(1): p. 145-151.
45. Leigh, E.G., R.T. Paine, J.F. Quinn, and T.H. Suchanek, Wave energy and intertidal productivity. Proceedings of the National Academy of Sciences, 1987. 84(5): p. 1314-1318.
46. Schuenhoff, A., M. Shpigel, I. Lupatsch, A. Ashkenazi, F.E. Msuya, and A. Neori, A semi-recirculating, integrated system for the culture of fish and seaweed. Aquaculture, 2003. 221(1-4): p. 167-181.
47. Neori, A., F.E. Msuya, L. Shauli, A. Schuenhoff, F. Kopel, and M. Shpigel, A novel three-stage seaweed (Ulva lactuca) biofilter design for integrated mariculture. Journal of Applied Phycology, 2003. 15(6): p. 543-553.
48. Israel, A., M. Friedlander, and A. Neori, Biomass yield, photosynthesis and morphological expression of Ulva lactuca. Botanica marina, 1995. 38(1-6): p. 297-302.
49. Bolton, J., D. Robertson-Andersson, D. Shuuluka, and L. Kandjengo, Growing Ulva (Chlorophyta) in integrated systems as a commercial crop for abalone feed in South Africa: a SWOT analysis. Journal of Applied Phycology, 2009. 21(5): p. 575-583.
50. Kumar, C.S., P. Ganesan, P.V. Suresh, and N. Bhaskar, Seaweeds as a source of nutritionally beneficial compounds - A review. Journal of Food Science and Technology, 2008. 45(1): p. 1-13.
51. Mouritsen, O.G., L. Duelund, M.A. Petersen, A.L. Hartmann, and M.B. Frøst, Umami taste, free amino acid composition, and volatile compounds of brown seaweeds. Journal of Applied Phycology, 2019. 31(2): p. 1213-1232.
52. Tibbetts, S.M., J.E. Milley, and S.P. Lall, Nutritional quality of some wild and cultivated seaweeds: Nutrient composition, total phenolic content and in vitro digestibility. Journal of Applied Phycology, 2016: p. 1-11.
53. Cian, R.E., M.A. Fajardo, M. Alaiz, J. Vioque, R.J. González, and S.R. Drago, Chemical composition, nutritional and antioxidant properties of the red edible seaweed Porphyra columbina. International Journal of Food Sciences and Nutrition, 2014. 65(3): p. 299-305.
54. Wong, K.H. and P.C.K. Cheung, Nutritional evaluation of some subtropical red and green seaweeds: Part I � proximate composition, amino acid profiles and some physico-chemical properties. Food Chemistry, 2000. 71(4): p. 475-482.
55. Yamaguchi, S. and K. Ninomiya, Umami and Food Palatability. The Journal of Nutrition, 2000. 130(4): p. 921S-926S.
56. Ikeda, K., New Seasonings. Chemical Senses, 2002. 27(9): p. 847-849. 57. Mouritsen, O.G., P. Rhatigan, and J.L. Pérez-Lloréns, World cuisine of seaweeds: Science meets
gastronomy. International Journal of Gastronomy and Food Science, 2018. 14: p. 55-65. 58. Babakhani, A., K.H.S. Farvin, and C. Jacobsen, Antioxidative Effect of Seaweed Extracts in
Chilled Storage of Minced Atlantic Mackerel (Scomber scombrus): Effect on Lipid and Protein Oxidation. Food and Bioprocess Technology, 2015: p. 1-13.
67
59. Farasat, M., R.-A. Khavari-Nejad, S.M.B. Nabavi, and F. Namjooyan, Antioxidant Activity, Total Phenolics and Flavonoid Contents of some Edible Green Seaweeds from Northern Coasts of the Persian Gulf. Iranian journal of pharmaceutical research, 2014. 13(1): p. 163-170.
60. Marinho, G.S., A.-D.M. Sørensen, H. Safafar, A.H. Pedersen, and S.L. Holdt, Antioxidant content and activity of the seaweed Saccharina latissima: a seasonal perspective. Journal of Applied Phycology, 2019. 31(2): p. 1343-1354.
61. Yan, X., T. Nagata, and X. Fan, Antioxidative activities in some common seaweeds. Plant Foods for Human Nutrition, 1998. 52(3): p. 253-262.
62. Isaka, S., K. Cho, S. Nakazono, R. Abu, M. Ueno, D. Kim, and T. Oda, Antioxidant and anti-inflammatory activities of porphyran isolated from discolored nori (Porphyra yezoensis). International Journal of Biological Macromolecules, 2015. 74: p. 68-75.
63. Mohamed, S., S.N. Hashim, and H.A. Rahman, Seaweeds: A sustainable functional food for complementary and alternative therapy. Trends in Food Science & Technology, 2012. 23(2): p. 83-96.
64. Holdt, S. and S. Kraan, Bioactive compounds in seaweed: functional food applications and legislation. Journal of Applied Phycology, 2011. 23(3): p. 543-597.
65. Wells, M.L., P. Potin, J.S. Craigie, J.A. Raven, S.S. Merchant, K.E. Helliwell, A.G. Smith, M.E. Camire, and S.H. Brawley, Algae as nutritional and functional food sources: revisiting our understanding. Journal of Applied Phycology, 2017. 29(2): p. 949-982.
66. Rodrigues, D., A.C. Freitas, L. Pereira, T.A.P. Rocha-Santos, M.W. Vasconcelos, M. Roriz, L.M. Rodríguez-Alcalá, A.M.P. Gomes, and A.C. Duarte, Chemical composition of red, brown and green macroalgae from Buarcos bay in Central West Coast of Portugal. Food Chemistry, 2015. 183: p. 197-207.
67. Rasyid, A., Evaluation of nutritional composition of the dried seaweed Ulva lactuca from Pameungpeuk waters, Indonesia. Tropical life sciences research, 2017. 28(2): p. 119.
68. Aguilera-Morales, M., M. Casas-Valdez, S. Carrillo-Domınguez, B. González-Acosta, and F. Pérez-Gil, Chemical composition and microbiological assays of marine algae Enteromorpha spp. as a potential food source. Journal of Food Composition and Analysis, 2005. 18(1): p. 79-88.
69. Schiener, P., K.D. Black, M.S. Stanley, and D.H. Green, The seasonal variation in the chemical composition of the kelp species Laminaria digitata, Laminaria hyperborea, Saccharina latissima and Alaria esculenta. Journal of Applied Phycology, 2015. 27(1): p. 363-373.
70. Maehre, H.K., M.K. Malde, K.-E. Eilertsen, and E.O. Elvevoll, Characterization of protein, lipid and mineral contents in common Norwegian seaweeds and evaluation of their potential as food and feed. Journal of the science of food and agriculture, 2014. 94(15): p. 3281-3290.
71. WHO/FAO/UNU, Protein and amino acid requirements in Human nutrition, WHO Technical Report Series 935, Report of a Joint WHO/FAO/UNU Expert Consultation. 2007.
72. Lourenço, S.O., E. Barbarino, J.C. De-Paula, L.O.d.S. Pereira, and U.M.L. Marquez, Amino acid composition, protein content and calculation of nitrogen-to-protein conversion factors for 19 tropical seaweeds. Phycological Research, 2002. 50(3): p. 233-241.
73. Peña-Rodríguez, A., T.P. Mawhinney, D. Ricque-Marie, and L.E. Cruz-Suárez, Chemical composition of cultivated seaweed Ulva clathrata (Roth) C. Agardh. Food Chemistry, 2011. 129(2): p. 491-498.
74. Ortiz, J., N. Romero, P. Robert, J. Araya, J. Lopez-Hernández, C. Bozzo, E. Navarrete, A. Osorio, and A. Rios, Dietary fiber, amino acid, fatty acid and tocopherol contents of the edible seaweeds Ulva lactuca and Durvillaea antarctica. Food Chemistry, 2006. 99(1): p. 98-104.
75. Biancarosa, I., M. Espe, C.G. Bruckner, S. Heesch, N. Liland, R. Waagbø, B. Torstensen, and E.J. Lock, Amino acid composition, protein content, and nitrogen-to-protein conversion factors of 21 seaweed species from Norwegian waters. Journal of Applied Phycology, 2017. 29(2): p. 1001-1009.
76. Harnedy, P.A. and R.J. FitzGerald, Bioactive proteins, peptides, and amino acids from macroalgae. Journal of Phycology, 2011. 47(2): p. 218-232.
68
77. Bleakley, S. and M. Hayes, Algal Proteins: Extraction, Application, and Challenges Concerning Production. Foods 2017. 6(5): p. 33.
78. Marinho-Soriano, E., P.C. Fonseca, M.A.A. Carneiro, and W.S.C. Moreira, Seasonal variation in the chemical composition of two tropical seaweeds. Bioresource Technology, 2006. 97(18): p. 2402-2406.
79. Khairy, H.M. and S.M. El-Shafay, Seasonal variations in the biochemical composition of some common seaweed species from the coast of Abu Qir Bay, Alexandria, Egypt. Oceanologia, 2013. 55(2): p. 435-452.
80. Matanjun, P., S. Mohamed, N.M. Mustapha, and K. Muhammad, Nutrient content of tropical edible seaweeds, Eucheuma cottonii, Caulerpa lentillifera and Sargassum polycystum. Journal of Applied Phycology, 2009. 21(1): p. 75-80.
81. McDermid, K.J. and B. Stuercke, Nutritional composition of edible Hawaiian seaweeds. Journal of Applied Phycology, 2003. 15(6): p. 513-524.
82. Shuuluka, D., J.J. Bolton, and R.J. Anderson, Protein content, amino acid composition and nitrogen-to-protein conversion factors of Ulva rigida and Ulva capensis from natural populations and Ulva lactuca from an aquaculture system, in South Africa. Journal of Applied Phycology, 2013. 25(2): p. 677-685.
83. Kendel, M., G. Wielgosz-Collin, S. Bertrand, C. Roussakis, N. Bourgougnon, and G. Bedoux, Lipid Composition, Fatty Acids and Sterols in the Seaweeds Ulva armoricana, and Solieria chordalis from Brittany (France): An Analysis from Nutritional, Chemotaxonomic, and Antiproliferative Activity Perspectives. Marine Drugs, 2015. 13(9): p. 5606-5628.
84. Yaich, H., H. Garna, S. Besbes, M. Paquot, C. Blecker, and H. Attia, Chemical composition and functional properties of Ulva lactuca seaweed collected in Tunisia. Food Chemistry, 2011. 128(4): p. 895-901.
85. Vilg, J.V., G.M. Nylund, T. Werner, L. Qvirist, J.J. Mayers, H. Pavia, I. Undeland, and E. Albers, Seasonal and spatial variation in biochemical composition of Saccharina latissima during a potential harvesting season for Western Sweden. Botanica Marina, 2015. 58(6): p. 435-447.
86. Bak, U.G., C.W. Nielsen, G.S. Marinho, Ó. Gregersen, R. Jónsdóttir, and S.L. Holdt, The seasonal variation in nitrogen, amino acid, protein and nitrogen-to-protein conversion factors of commercially cultivated Faroese Saccharina latissima. Algal Research, 2019. 42: p. 101576.
87. van Ginneken, V.J., J.P. Helsper, W. de Visser, H. van Keulen, and W.A. Brandenburg, Polyunsaturated fatty acids in various macroalgal species from north Atlantic and tropical seas. Lipids in health and disease, 2011. 10(1): p. 104.
88. Marinho, G.S., S.L. Holdt, C. Jacobsen, and I. Angelidaki, Lipids and Composition of Fatty Acids of Saccharina latissima Cultivated Year-Round in Integrated Multi-Trophic Aquaculture. Marine drugs, 2015. 13(7): p. 4357-4374.
89. Norziah, M.H. and C.Y. Ching, Nutritional composition of edible seaweed Gracilaria changgi. Food Chemistry, 2000. 68(1): p. 69-76.
90. Rupérez, P., Mineral content of edible marine seaweeds. Food Chemistry, 2002. 79(1): p. 23-26.
91. Sánchez-Machado, D.I., J. López-Cervantes, J. López-Hernández, and P. Paseiro-Losada, Fatty acids, total lipid, protein and ash contents of processed edible seaweeds. Food Chemistry, 2004. 85(3): p. 439-444.
92. Gill, I. and R. Valivety, Polyunsaturated fatty acids, part 1: Occurrence, biological activities and applications. Trends in Biotechnology, 1997. 15(10): p. 401-409.
93. Maehre, H.K., I.J. Jensen, E.O. Elvevoll, and K.E. Eilertsen, ω-3 fatty acids and cardiovascular diseases: Effects, mechanisms and dietary relevance. International Journal of Molecular Sciences, 2015. 16(9): p. 22636-22661.
94. Calder, P.C., Omega-3 fatty acids and inflammatory processes. Nutrients, 2010. 2(3): p. 355-374.
69
95. Serini, S., E. Fasano, E. Piccioni, A.R.M. Cittadini, and G. Calviello, Dietary n-3 Polyunsaturated Fatty Acids and the Paradox of Their Health Benefits and Potential Harmful Effects. Chemical Research in Toxicology, 2011. 24(12): p. 2093-2105.
96. Guillou, H., D. Zadravec, P.G.P. Martin, and A. Jacobsson, The key roles of elongases and desaturases in mammalian fatty acid metabolism: Insights from transgenic mice. Progress in Lipid Research, 2010. 49(2): p. 186-199.
97. Colombo, M.L., P. RISÈ, F. giavarinI, L. De Angelis, C. Galli, and C.L. Bolis, Marine Macroalgae as Sources of Polyunsaturated Fatty Acids. Plant Foods for Human Nutrition, 2006. 61(2): p. 64-69.
98. Silva, G., R.B. Pereira, P. Valentão, P.B. Andrade, and C. Sousa, Distinct fatty acid profile of ten brown macroalgae. Revista Brasileira de Farmacognosia, 2013. 23(4): p. 608-613.
99. Simopoulos, A.P., Evolutionary aspects of diet, the omega-6/omega-3 ratio and genetic variation: nutritional implications for chronic diseases. Biomedicine & Pharmacotherapy, 2006. 60(9): p. 502-507.
100. Coultate, T., Polysaccharides, in FOOD The Chemistry of its Components, T. Coultate, Editor. 2009, RSC Publishing. p. 49-96.
101. Necas, J. and L. Bartosikova, Carrageenan: a review. Veterinární Medicína, 2013. 58(6): p. 187-205.
102. Inoue, A. and T. Ojima, Functional identification of alginate lyase from the brown alga Saccharina japonica. Scientific Reports, 2019. 9(1): p. 4937.
103. Bixler, H.J. and H. Porse, A decade of change in the seaweed hydrocolloids industry. Journal of Applied Phycology, 2011. 23(3): p. 321-335.
104. Marinho-Soriano, E. and E. Bourret, Polysaccharides from the red seaweed Gracilaria dura (Gracilariales, Rhodophyta). Bioresource Technology, 2005. 96(3): p. 379-382.
105. Fertah, M., Isolation and Characterization of Alginate from Seaweed, in Seaweed Polysaccharides, J. Venkatesan, S. Anil, and S.-K. Kim, Editors. 2017, Elsevier. p. 11-26.
106. Konasani, V.R., C. Jin, N.G. Karlsson, and E. Albers, A novel ulvan lyase family with broad-spectrum activity from the ulvan utilisation loci of Formosa agariphila KMM 3901. Scientific Reports, 2018. 8(1): p. 14713.
107. Siddhanta, A.K., K. Prasad, R. Meena, G. Prasad, G.K. Mehta, M.U. Chhatbar, M.D. Oza, S. Kumar, and N.D. Sanandiya, Profiling of cellulose content in Indian seaweed species. Bioresource Technology, 2009. 100(24): p. 6669-6673.
108. Ioelovich, M., Cellulose as an Nanostructured Polymer: A short review. BioResources, 2008. 3(4): p. 1403-1418.
109. MacArtain, P., C.I.R. Gill, M. Brooks, R. Campbell, and I.R. Rowland, Nutritional Value of Edible Seaweeds. Nutrition Reviews, 2007. 65(12): p. 535-543.
110. The national Food Agency database, Citron. 2019, National Food Agency, Sweden. http://www7.slv.se/SokNaringsinnehall/Home/FoodDetails/559# Accessed 13 August 2019.
111. Rajapakse, N. and S.-K. Kim, Nutritional and Digestive Health Benefits of Seaweed, in Advances in Food and Nutrition Research, S.-K. Kim, Editor. 2011, Academic Press. p. 17-28.
112. �krovánková, S., Seaweed Vitamins as Nutraceuticals, in Advances in Food and Nutrition Research, S.-K. Kim, Editor. 2011, Academic Press. p. 357-369.
113. El-Said, G.F. and A. El-Sikaily, Chemical composition of some seaweed from Mediterranean Sea coast, Egypt. Environmental monitoring and assessment, 2013. 185(7): p. 6089-6099.
114. Hotchkiss, S., Edible seaweeds: A rich source of flavour components for sodium replacement. Agro Food Industry Hi-Tech, 2012. 23(6): p. 30-32.
115. Andersen, S., P. Noahsen, K.F. Rex, H.C. Florian-Sørensen, and G. Mulvad, Iodine in Edible Seaweed, Its Absorption, Dietary Use, and Relation to Iodine Nutrition in Arctic People. Journal of medicinal food, 2019. 22(4): p. 421-426.
116. Teas, J., S. Pino, A. Critchley, and L.E. Braverman, Variability of iodine content in common commercially available edible seaweeds. Thyroid, 2004. 14(10): p. 836-841.
70
117. LePape, M.-A., J. Grua-Priol, and M. Demaimay, Effect of Two Storage Conditions on the Odor of an Edible Seaweed, Palmaria palmata, and Optimization of an Extraction Procedure Preserving its Odor Characteristics. Journal of Food Science, 2002. 67(8): p. 3135-3139.
118. del Olmo, A., A. Picon, and M. Nuñez, High pressure processing for the extension of Laminaria ochroleuca (kombu) shelf-life: A comparative study with seaweed salting and freezing. Innovative Food Science & Emerging Technologies, 2019. 52: p. 420-428.
119. Wong, K. and P.C. Cheung, Influence of drying treatment on three Sargassum species. Journal of Applied Phycology, 2001. 13(1): p. 43-50.
120. Sappati, P.K., B. Nayak, G.P. VanWalsum, and O.T. Mulrey, Combined effects of seasonal variation and drying methods on the physicochemical properties and antioxidant activity of sugar kelp (Saccharina latissima). Journal of Applied Phycology, 2019. 31(2): p. 1311-1332.
121. Gupta, S., S. Cox, and N. Abu-Ghannam, Effect of different drying temperatures on the moisture and phytochemical constituents of edible Irish brown seaweed. LWT - Food Science and Technology, 2011. 44(5): p. 1266-1272.
122. Wong, K. and P. Chikeung Cheung, Influence of drying treatment on three Sargassum species 2. Protein extractability, in vitro protein digestibility and amino acid profile of protein concentrates. Journal of Applied Phycology, 2001. 13(1): p. 51-58.
123. Uribe, E., A. Vega-Gálvez, V. García, A. Pastén, J. López, and G. Goñi, Effect of different drying methods on phytochemical content and amino acid and fatty acid profiles of the green seaweed, Ulva spp. Journal of Applied Phycology, 2018. 31(3): p. 1967-1979.
124. Abdollahi, M., J. Axelsson, N.-G. Carlsson, G.M. Nylund, E. Albers, and I. Undeland, Effect of stabilization method and freeze/thaw-aided precipitation on structural and functional properties of proteins recovered from brown seaweed (Saccharina latissima). Food Hydrocolloids, 2019. 96: p. 140-150.
125. Stévant, P., H. Marfaing, T. Rustad, I. Sandbakken, J. Fleurence, and A. Chapman, Nutritional value of the kelps Alaria esculenta and Saccharina latissima and effects of short-term storage on biomass quality. Journal of Applied Phycology, 2017. 29(5): p. 2417-2426.
126. Hu, M. and C. Jacobsen, Oxidative Stability and Shelf Life of Foods Containing Oils and Fats. 2016: Academic Press.
127. Ayala, A., M.F. Muñoz, and S. Argüelles, Lipid Peroxidation: Production, Metabolism, and Signaling Mechanisms of Malondialdehyde and 4-Hydroxy-2-Nonenal. Oxidative Medicine and Cellular Longevity, 2014. 2014: p. 31.
128. Domingues, R.M., P. Domingues, T. Melo, D. Pérez-Sala, A. Reis, and C.M. Spickett, Lipoxidation adducts with peptides and proteins: Deleterious modifications or signaling mechanisms? Journal of Proteomics, 2013. 92: p. 110-131.
129. Esterbauer, H., R.J. Schaur, and H. Zollner, Chemistry and biochemistry of 4-hydroxynonenal, malonaldehyde and related aldehydes. Free Radical Biology and Medicine, 1991. 11(1): p. 81-128.
130. Guichardant, M., P. Taibi-Tronche, L.B. Fay, and M. Lagarde, Covalent modifications of aminophospholipids by 4-hydroxynonenal. Free Radical Biology and Medicine, 1998. 25(9): p. 1049-1056.
131. Teng, L., W. Han, X. Fan, D. Xu, X. Zhang, S.M. Dittami, and N. Ye, Evolution and Expansion of the Prokaryote-Like Lipoxygenase Family in the Brown Alga Saccharina japonica. Frontiers in Plant Science, 2017. 8(2018).
132. Schmid, M., F. Guihéneuf, and D.B. Stengel, Evaluation of food grade solvents for lipid extraction and impact of storage temperature on fatty acid composition of edible seaweeds Laminaria digitata (Phaeophyceae) and Palmaria palmata (Rhodophyta). Food Chemistry, 2016. 208: p. 161-168.
133. Long, E.K. and M.J. Picklo, Trans-4-hydroxy-2-hexenal, a product of n-3 fatty acid peroxidation: Make some room HNE�. Free Radical Biology and Medicine, 2010. 49(1): p. 1-8.

71
134. Riahi, Y., G. Cohen, O. Shamni, and S. Sasson, Signaling and cytotoxic functions of 4-hydroxyalkenals. American Journal of Physiology-Endocrinology and Metabolism, 2010. 299(6): p. E879-E886.
135. Esterbauer, H., Cytotoxicity and genotoxicity of lipid-oxidation products. The American Journal of Clinical Nutrition, 1993. 57(5): p. 779S-786S.
136. Fedorova, M., R.C. Bollineni, and R. Hoffmann, Protein carbonylation as a major hallmark of oxidative damage: update of analytical strategies. Mass spectrometry reviews, 2014. 33(2): p. 79-97.
137. Garcia, C.C., L.C. Caetano, K. de Souza Silva, and M.A. Mauro, Influence of edible coating on the drying and quality of papaya (Carica papaya). Food and bioprocess technology, 2014. 7(10): p. 2828-2839.
138. Silva, K.S., C.C. Garcia, L.R. Amado, and M.A. Mauro, Effects of Edible Coatings on Convective Drying and Characteristics of the Dried Pineapple. Food and Bioprocess Technology, 2015. 8(7): p. 1465-1475.
139. Lago-Vanzela, E., P. Do Nascimento, E. Fontes, M. Mauro, and M. Kimura, Edible coatings from native and modified starches retain carotenoids in pumpkin during drying. LWT-Food Science and Technology, 2013. 50(2): p. 420-425.
140. Dhumal, C.V. and P. Sarkar, Composite edible films and coatings from food-grade biopolymers. Journal of Food Science and Technology, 2018. 55(11): p. 4369-4383.
141. Bourtoom, T., Edible films and coatings: characteristics and properties. International Food Research Journal, 2008. 15(3): p. 237-248.
142. Ramos, Ó.L., J.C. Fernandes, S.I. Silva, M.E. Pintado, and F.X. Malcata, Edible films and coatings from whey proteins: a review on formulation, and on mechanical and bioactive properties. Critical reviews in food science and nutrition, 2012. 52(6): p. 533-552.
143. Schmid, M. and K. Müller, Whey Protein-Based Packaging Films and Coatings, in Whey Proteins, H.C. Deeth and N. Bansal, Editors. 2019, Academic Press. p. 407-437.
144. Fleurence, J., L. Massiani, O. Guyader, and S. Mabeau, Use of enzymatic cell wall degradation for improvement of protein extraction from Chondrus crispus, Gracilaria verrucosa and Palmaria palmata. Journal of Applied Phycology, 1995. 7(4): p. 393.
145. Vásquez, V., R. Martínez, and C. Bernal, Enzyme-assisted extraction of proteins from the seaweeds Macrocystis pyrifera and Chondracanthus chamissoi: characterization of the extracts and their bioactive potential. Journal of Applied Phycology, 2019. 31(3): p. 1999-2010.
146. Bjarnadóttir, M., B.V. Aðalbjörnsson, A. Nilsson, R. Slizyte, M.Y. Roleda, G.Ó. Hreggviðsson, Ó.H. Friðjónsson, and R. Jónsdóttir, Palmaria palmata as an alternative protein source: enzymatic protein extraction, amino acid composition, and nitrogen-to-protein conversion factor. Journal of Applied Phycology, 2018. 30(3): p. 2061-2070.
147. Robin, A., M. Kazir, M. Sack, A. Israel, W. Frey, G. Mueller, Y.D. Livney, and A. Golberg, Functional Protein Concentrates Extracted from the Green Marine Macroalga Ulva sp., by High Voltage Pulsed Electric Fields and Mechanical Press. ACS Sustainable Chemistry & Engineering, 2018. 6(11): p. 13696-13705.
148. Vilg, J.V. and I. Undeland, pH-driven solubilization and isoelectric precipitation of proteins from the brown seaweed Saccharina latissima�effects of osmotic shock, water volume and temperature. Journal of Applied Phycology, 2017. 29(1): p. 585-593.
149. Fleurence, J., C. Le Coeur, S. Mabeau, M. Maurice, and A. Landrein, Comparison of different extractive procedures for proteins from the edible seaweeds Ulva rigida and Ulva rotundata. Journal of Applied Phycology, 1995. 7(6): p. 577-582.
150. Jordan, P. and H. Vilter, Extraction of proteins from material rich in anionic mucilages: Partition and fractionation of vanadate-dependent bromoperoxidases from the brown algae Laminaria digitata and L. saccharina in aqueous polymer two-phase systems. Biochimica et Biophysica Acta (BBA) - General Subjects, 1991. 1073(1): p. 98-106.
72
151. Joubert, Y. and J. Fleurence, Simultaneous extraction of proteins and DNA by an enzymatic treatment of the cell wall of Palmaria palmata (Rhodophyta). Journal of Applied Phycology, 2008. 20(1): p. 55-61.
152. Ozdal, T., E. Capanoglu, and F. Altay, A review on protein-phenolic interactions and associated changes. Food Research International, 2013. 51(2): p. 954-970.
153. Stern, J.L., A.E. Hagerman, P.D. Steinberg, and P.K. Mason, Phlorotannin-protein interactions. Journal of Chemical Ecology, 1996. 22(10): p. 1877-1899.
154. Harnedy, P.A. and R.J. FitzGerald, Extraction of protein from the macroalga Palmaria palmata. LWT - Food Science and Technology, 2013. 51(1): p. 375-382.
155. Kadam, S.U., C. Álvarez, B.K. Tiwari, and C.P. O'Donnell, Extraction and characterization of protein from Irish brown seaweed Ascophyllum nodosum. Food Research International, 2017. 99(3): p. 1021-1027.
156. Postma, P.R., O. Cerezo-Chinarro, R.J. Akkerman, G. Olivieri, R.H. Wijffels, W.A. Brandenburg, and M.H.M. Eppink, Biorefinery of the macroalgae Ulva lactuca: extraction of proteins and carbohydrates by mild disintegration. Journal of Applied Phycology, 2018. 30(2): p. 1281-1293.
157. Garcia-Vaquero, M., M. Lopez-Alonso, and M. Hayes, Assessment of the functional properties of protein extracted from the brown seaweed Himanthalia elongata (Linnaeus) S. F. Gray. Food Research International, 2017. 99(3): p. 971-978.
158. Wingfield, P., Protein precipitation using ammonium sulfate. Current protocols in protein science, 2001. 13(1): p. Appendix 3F 1-8.
159. Kandasamy, G., S.K. Karuppiah, and P.V.S. Rao, Salt- and pH-induced functional changes in protein concentrate of edible green seaweed Enteromorpha species. Fisheries Science, 2012. 78(1): p. 169-176.
160. Suresh Kumar, K., K. Ganesan, K. Selvaraj, and P.V. Subba Rao, Studies on the functional properties of protein concentrate of Kappaphycus alvarezii (Doty) Doty � An edible seaweed. Food Chemistry, 2014. 153: p. 353-360.
161. Kazir, M., Y. Abuhassira, A. Robin, O. Nahor, J. Luo, A. Israel, A. Golberg, and Y.D. Livney, Extraction of proteins from two marine macroalgae, Ulva sp. and Gracilaria sp., for food application, and evaluating digestibility, amino acid composition and antioxidant properties of the protein concentrates. Food Hydrocolloids, 2019. 87: p. 194-203.
162. Marmon, S.K. and I. Undeland, Protein Isolation from Gutted Herring (Clupea harengus) Using pH-Shift Processes. Journal of Agricultural and Food Chemistry, 2010. 58(19): p. 10480-10486.
163. Undeland, I., S.D. Kelleher, and H.O. Hultin, Recovery of functional proteins from herring (Clupea harengus) light muscle by an acid or alkaline solubilization process. Journal of Agricultural and Food Chemistry, 2002. 50(25): p. 7371-7379.
164. Chomnawang, C. and J. Yongsawatdigul, Protein Recovery of Tilapia Frame By-Products by pH-Shift Method. Journal of Aquatic Food Product Technology, 2013. 22(2): p. 112-120.
165. Kristinsson, H.G. and B. Ingadottir, Recovery and Properties of Muscle Proteins Extracted from Tilapia (Oreochromis niloticus) Light Muscle by pH Shift Processing. Journal of Food Science, 2006. 71(3): p. E132-E141.
166. Vareltzis, P.K. and I. Undeland, Protein isolation from blue mussels (Mytilus edulis) using an acid and alkaline solubilisation technique�process characteristics and functionality of the isolates. Journal of the Science of Food and Agriculture, 2012. 92(15): p. 3055-3064.
167. Shevkani, K. and N. Singh, Influence of kidney bean, field pea and amaranth protein isolates on the characteristics of starch-based gluten-free muffins. International Journal of Food Science & Technology, 2014. 49(10): p. 2237-2244.
168. Cavonius, L.R., E. Albers, and I. Undeland, pH-shift processing of Nannochloropsis oculata microalgal biomass to obtain a protein-enriched food or feed ingredient. Algal Research, 2015. 11: p. 95-102.
169. Angell, A.R., N.A. Paul, and R. de Nys, A comparison of protocols for isolating and concentrating protein from the green seaweed Ulva ohnoi. Journal of Applied Phycology, 2017. 29(2): p. 1011-1026.

73
170. Herrero, M., A.D.P. Sánchez-Camargo, A. Cifuentes, and E. Ibáñez, Plants, seaweeds, microalgae and food by-products as natural sources of functional ingredients obtained using pressurized liquid extraction and supercritical fluid extraction. TrAC - Trends in Analytical Chemistry, 2015. 71: p. 26-38.
171. Vazquez-Roig, P. and Y. Picó, Pressurized liquid extraction of organic contaminants in environmental and food samples. Trends in Analytical Chemistry, 2015. 71: p. 55-64.
172. Mæhre, H.K., L. Dalheim, G.K. Edvinsen, E.O. Elvevoll, and I.-J. Jensen, Protein Determination�Method Matters. Foods, 2018. 7(1): p. 5.
173. Angell, A.R., L. Mata, R. de Nys, and N.A. Paul, The protein content of seaweeds: a universal nitrogen-to-protein conversion factor of five. Journal of Applied Phycology, 2016. 28(1): p. 511-524.
174. Lowry, O.H., N.J. Rosebrough, A.L. Farr, and R.J. Randall, Protein measurement with the Folin Phenol reagent. The Journal of biological chemistry, 1951. 193(1): p. 265-275.
175. Bensadoun, A. and D. Weinstein, Assay of proteins in the presence of interfering materials. Analytical Biochemistry, 1976. 70(1): p. 241-250.
176. Graciela S. Diniz, E.B., João Oiano-Neto, Sidney Pacheco, Sergio O. Lourenço, Gross Chemical Profile and Calculation of Nitrogen-to-Protein Conversion Factors for Five Tropical Seaweeds American Journal of Plant Sciences, 2011. 2(3): p. 287-296.
177. Hughes, A.D., M.S. Kelly, K.D. Black, and M.S. Stanley, Biogas from Macroalgae: is it time to revisit the idea? Biotechnology for Biofuels, 2012. 5(1): p. 86.
178. Sanderson, J.C., M.J. Dring, K. Davidson, and M.S. Kelly, Culture, yield and bioremediation potential of Palmaria palmata (Linnaeus) Weber & Mohr and Saccharina latissima (Linnaeus) C.E. Lane, C. Mayes, Druehl & G.W. Saunders adjacent to fish farm cages in northwest Scotland. Aquaculture, 2012. 354-355: p. 128-135.
179. Bermejo, R., S. Heesch, M. Mac Monagail, M. O'Donnell, E. Daly, R.J. Wilkes, and L. Morrison, Spatial and temporal variability of biomass and composition of green tides in Ireland. Harmful Algae, 2019. 81: p. 94-105.
180. Gao, G., A.S. Clare, C. Rose, and G.S. Caldwell, Eutrophication and warming-driven green tides (Ulva rigida) are predicted to increase under future climate change scenarios. Marine Pollution Bulletin, 2017. 114(1): p. 439-447.
181. Gao, G., A.S. Clare, E. Chatzidimitriou, C. Rose, and G. Caldwell, Effects of ocean warming and acidification, combined with nutrient enrichment, on chemical composition and functional properties of Ulva rigida. Food Chemistry, 2018. 258: p. 71-78.
182. Liu, C. and D. Zou, Responses of elevated CO2 on photosynthesis and nitrogen metabolism in Ulva lactuca (Chlorophyta) at different temperature levels. Marine Biology Research, 2015. 11(10): p. 1043-1052.
183. Gao, G., A.S. Clare, C. Rose, and G.S. Caldwell, Ulva rigida in the future ocean: potential for carbon capture, bioremediation and biomethane production. GCB Bioenergy, 2018. 10(1): p. 39-51.
184. Kumari, P., M. Kumar, C.R.K. Reddy, and B. Jha, Nitrate and Phosphate Regimes Induced Lipidomic and Biochemical Changes in the Intertidal Macroalga Ulva lactuca (Ulvophyceae, Chlorophyta). Plant and Cell Physiology, 2013. 55(1): p. 52-63.
185. Fu, G., J. Yao, F. Liu, J. Liu, X. Wang, W. Fu, D. Li, M. Zhou, S. Sun, and D. Duan, Effect of temperature and irradiance on the growth and reproduction of Enteromorpha prolifera J. Ag.(Chlorophycophyta, Chlorophyceae). Chinese Journal of Oceanology and Limnology, 2008. 26(4): p. 357-362.
186. Gao, G., A.S. Clare, C. Rose, and G.S. Caldwell, Reproductive sterility increases the capacity to exploit the green seaweed Ulva rigida for commercial applications. Algal Research, 2017. 24: p. 64-71.
187. Kalita, T.L. and E.A. Titlyanov, Influence of temperature on the infradian growth rhythm in Ulva lactuca (Chlorophyta). European Journal of Phycology, 2013. 48(2): p. 210-220.
74
188. Xiao, J., X. Zhang, C. Gao, M. Jiang, R. Li, Z. Wang, Y. Li, S. Fan, and X. Zhang, Effect of temperature, salinity and irradiance on growth and photosynthesis of Ulva prolifera. Acta Oceanologica Sinica, 2016. 35(10): p. 114-121.
189. Li, Y.H., D. Wang, X.T. Xu, X.X. Gao, X. Sun, and N.J. Xu, Physiological responses of a green algae (Ulva prolifera) exposed to simulated acid rain and decreased salinity. Photosynthetica, 2017. 55(4): p. 623-629.
190. Kang, J.W. and I.K. Chung, The effects of eutrophication and acidification on the ecophysiology of Ulva pertusa Kjellman. Journal of applied phycology, 2017. 29(5): p. 2675-2683.
191. Chen, B., D. Zou, and M. Zhu, Growth and photosynthetic responses of Ulva lactuca (Ulvales, Chlorophyta) germlings to different pH levels. Marine Biology Research, 2017. 13(3): p. 351-357.
192. Young, C.S. and C.J. Gobler, Ocean acidification accelerates the growth of two bloom-forming macroalgae. PLoS One, 2016. 11(5).
193. Mhatre, A., S. Patil, A. Agarwal, R. Pandit, and A.M. Lali, Influence of nitrogen source on photochemistry and antenna size of the photosystems in marine green macroalgae, Ulva lactuca. Photosynthesis Research, 2019. 139(1): p. 539-551.
194. Castelar, B., R.P. Reis, and A.C. dos Santos Calheiros, Ulva lactuca and U. flexuosa (Chlorophyta, Ulvophyceae) cultivation in Brazilian tropical waters: recruitment, growth, and ulvan yield. Journal of applied phycology, 2014. 26(5): p. 1989-1999.
195. Kim, J.-H., E.J. Kang, M.S. Edwards, K. Lee, H.J. Jeong, and K.Y. Kim, Species-specific responses of temperate macroalgae with different photosynthetic strategies to ocean acidification: a mesocosm study. ALGAE, 2016. 31(3): p. 243-256.
196. Chen, B., L. Lin, Z. Ma, T. Zhang, W. Chen, and D. Zou, Carbon and nitrogen accumulation and interspecific competition in two algae species, Pyropia haitanensis and Ulva lactuca, under ocean acidification conditions. Aquaculture International, 2019. 27(3): p. 721-733.
197. Hamid, S.S., M. Wakayama, T. Soga, and M. Tomita, Drying and extraction effects on three edible brown seaweeds for metabolomics. Journal of Applied Phycology, 2018. 30(6): p. 3335-3350.
198. Jiménez-Escrig, A., I. Jiménez-Jiménez, R. Pulido, and F. Saura-Calixto, Antioxidant activity of fresh and processed edible seaweeds. Journal of the Science of Food and Agriculture, 2001. 81(5): p. 530-534.
199. Undeland, I., H.O. Hultin, and M.P. Richards, Added triacylglycerols do not hasten hemoglobin-mediated lipid oxidation in washed minced cod muscle. Journal of agricultural and food chemistry, 2002. 50(23): p. 6847-6853.
200. Schmedes, A. and G. Hølmer, A new thiobarbituric acid (TBA) method for determining free malondialdehyde (MDA) and hydroperoxides selectively as a measure of lipid peroxidation. Journal of the American Oil Chemists' Society, 1989. 66(6): p. 813-817.
201. Tullberg, C., K. Larsson, N.-G. Carlsson, I. Comi, N. Scheers, G. Vegarud, and I. Undeland, Formation of reactive aldehydes (MDA, HHE, HNE) during the digestion of cod liver oil: comparison of human and porcine in vitro digestion models. Food & function, 2016. 7(3): p. 1401-1412.
202. Bligh, E.G. and W.J. Dyer, A rapid method of total lipid extraction and purification. Canadian journal of biochemistry and physiology, 1959. 37(8): p. 911-917.
203. Folch, J., M. Lees, and G. Sloane Stanley, A simple method for the isolation and purification of total lipides from animal tissues. J biol Chem, 1957. 226(1): p. 497-509.
204. Kojo, S., Vitamin C: basic metabolism and its function as an index of oxidative stress. Current medicinal chemistry, 2004. 11(8): p. 1041-1064.
205. Giannakis, S., A review of the concepts, recent advances and niche applications of the (photo) Fenton process, beyond water/wastewater treatment: Surface functionalization, biomass treatment, combatting cancer and other medical uses. Applied Catalysis B: Environmental, 2019. 248: p. 309-319.
75
206. Uluata, S., D.J. McClements, and E.A. Decker, How the Multiple Antioxidant Properties of Ascorbic Acid Affect Lipid Oxidation in Oil-in-Water Emulsions. Journal of Agricultural and Food Chemistry, 2015. 63(6): p. 1819-1824.
207. Teepoo, S. and W. Nolykad, Analysis of Vitamin C in Fruit Juices Based on Prussian Blue. Journal of Applied Sciences, 2012. 12(6): p. 568-574.
208. Güçlü, K., K. Sözgen, E. Tütem, M. Özyürek, and R. Apak, Spectrophotometric determination of ascorbic acid using copper(II)�neocuproine reagent in beverages and pharmaceuticals. Talanta, 2005. 65(5): p. 1226-1232.
209. Lykkesfeldt, J., Determination of Ascorbic Acid and Dehydroascorbic Acid in Biological Samples by High-Performance Liquid Chromatography Using Subtraction Methods: Reliable Reduction with Tris[2-carboxyethyl]phosphine Hydrochloride. Analytical Biochemistry, 2000. 282(1): p. 89-93.
210. Coultate, T., Proteins, in FOOD The Chemstry of its Components, T. Coultate, Editor. 2009, RSC Publishing. p. 159-213.
211. Konasani, V.R., C. Jin, N.G. Karlsson, and E. Albers, Ulvan lyase from Formosa agariphila and its applicability in depolymerisation of ulvan extracted from three different Ulva species. Algal Research, 2018. 36: p. 106-114.
212. Shang, Y.F., S.M. Kim, W.J. Lee, and B.-H. Um, Pressurized liquid method for fucoxanthin extraction from Eisenia bicyclis (Kjellman) Setchell. Journal of Bioscience and Bioengineering, 2011. 111(2): p. 237-241.
213. Heffernan, N., T.J. Smyth, R.J. FitzGerald, A. Soler-Vila, and N. Brunton, Antioxidant activity and phenolic content of pressurised liquid and solid�liquid extracts from four Irish origin macroalgae. International Journal of Food Science & Technology, 2014. 49(7): p. 1765-1772.
214. Anaëlle, T., E. Serrano Leon, V. Laurent, I. Elena, J.A. Mendiola, C. Stéphane, K. Nelly, L.B. Stéphane, M. Luc, and S.-P. Valérie, Green improved processes to extract bioactive phenolic compounds from brown macroalgae using Sargassum muticum as model. Talanta, 2013. 104: p. 44-52.
215. Hilliou, L., F.D.S. Larotonda, P. Abreu, A.M. Ramos, A.M. Sereno, and M.P. Gonçalves, Effect of extraction parameters on the chemical structure and gel properties of κ/ι-hybrid carrageenans obtained from Mastocarpus stellatus. Biomolecular Engineering, 2006. 23(4): p. 201-208.
216. Kjeldahl, J., A new method for the determination of nitrogen in organic matter. Zeitschrift für Analytische Chemie, 1883. 22: p. 366-372.
217. Yust, M.a.M., J. Pedroche, J. Girón-Calle, J. Vioque, F. Millán, and M. Alaiz, Determination of tryptophan by high-performance liquid chromatography of alkaline hydrolysates with spectrophotometric detection. Food Chemistry, 2004. 85(2): p. 317-320.
218. Markwell, M.A.K., S.M. Haas, L.L. Bieber, and N.E. Tolbert, A modification of the Lowry procedure to simplify protein determination in membrane and lipoprotein samples. Analytical Biochemistry, 1978. 87(1): p. 206-210.
219. Legler, G., C. Mueller-Platz, M. Mentges-Hettkamp, G. Pflieger, and E. Jülich, On the chemical basis of the Lowry protein determination. 1985. 150(2): p. 278-287.
220. Moore, J.C., J.W. DeVries, M. Lipp, J.C. Griffiths, and D.R. Abernethy, Total Protein Methods and Their Potential Utility to Reduce the Risk of Food Protein Adulteration. Comprehensive Reviews in Food Science and Food Safety, 2010. 9(4): p. 330-357.
221. Gall, E.A., F. Lelchat, M. Hupel, C. Jégou, and V. Stiger-Pouvreau, Extraction and purification of phlorotannins from brown algae, in Natural Products From Marine Algae, D.B. Stengel and S. Connan, Editors. 2015, Springer. p. 131-143.
222. Li, Y.-X., I. Wijesekara, Y. Li, and S.-K. Kim, Phlorotannins as bioactive agents from brown algae. Process Biochemistry, 2011. 46(12): p. 2219-2224.
223. Thompson, M., L. Owen, K. Wilkinson, R. Wood, and A. Damant, A comparison of the Kjeldahl and Dumas methods for the determination of protein in foods, using data from a proficiency testing scheme. Analyst, 2002. 127(12): p. 1666-1668.
76
224. Owusu-Apenten, R.K., Kjeldahl Method, Quantitative Amino Acid Analysis and Combustion Analysis, in Food protein analysis Quatitative effects on processing, R.K. Owusu-Apenten, Editor. 2002, Marcel Dekker. p. 1-45.
225. FAO/WHO, Energy and protein requirements : report of a Joint FAO/WHO ad hoc expert committee 1973.
226. FAO, Dietary Protein Quality Evaluation in Human Nutrition, Auckland, 2011. 227. De Ruiter, G.A. and B. Rudolph, Carrageenan biotechnology. Trends in Food Science &
Technology, 1997. 8(12): p. 389-395. 228. 2019, R.C.T. and R: A language and environment for statistical computing. 2019, R Foundation
for Statistical Computing: Vienna, Austria. 229. Chan, J.C.C., P.C.K. Cheung, and P.O. Ang, Comparative Studies on the Effect of Three Drying
Methods on the Nutritional Composition of Seaweed Sargassum hemiphyllum (Turn.) C. Ag. Journal of Agricultural and Food Chemistry, 1997. 45(8): p. 3056-3059.
230. Goldflus, F., M.L. Ceccantini, and W. Santos, Amino acid content of soybean samples collected in different Brazilian States - Harvest 2003/2004. Revista Brasileira de Ciencia Avicola, 2006. 8(2): p. 105-111.
231. Grieshop, C.M. and G.C. Fahey, Comparison of Quality Characteristics of Soybeans from Brazil, China, and the United States. Journal of Agricultural and Food Chemistry, 2001. 49(5): p. 2669-2673.
232. Wolf, R., J. Cavins, R. Kleiman, and L. Black, Effect of temperature on soybean seed constituents: oil, protein, moisture, fatty acids, amino acids and sugars. Journal of the American Oil Chemists' Society, 1982. 59(5): p. 230-232.
233. Pastor-Cavada, E., R. Juan, J.E. Pastor, M. Alaiz, and J. Vioque, Protein and amino acid composition of select wild legume species of tribe Fabeae. Food Chemistry, 2014. 163: p. 97-102.
234. Zheng, Y., N. Gao, J. Wu, and B. Yin, Rice Bran Protein: Extraction, Nutraceutical Properties, and Potential Applications, in Rice Bran and Rice Bran Oil, L.-Z. Cheong and X. Xu, Editors. 2019, AOCS Press. p. 271-293.
235. Anjum, F.M., I. Ahmad, M.S. Butt, M.A. Sheikh, and I. Pasha, Amino acid composition of spring wheats and losses of lysine during chapati baking. Journal of Food Composition and Analysis, 2005. 18(6): p. 523-532.
236. Mi�urcová, L., L. Machů, and J. Orsavová, Seaweed Minerals as Nutraceuticals, in Advances in Food and Nutrition Research, S.-K. Kim, Editor. 2011, Academic Press. p. 371-390.
237. Larsson, K., H. Harrysson, R. Havenaar, M. Alminger, and I. Undeland, Formation of malondialdehyde (MDA), 4-hydroxy-2-hexenal (HHE) and 4-hydroxy-2-nonenal (HNE) in fish and fish oil during dynamic gastrointestinal in vitro digestion. Food and Function, 2016. 7(2): p. 1176-1187.
238. The national Food Agency database, Sill rå. 2019, National Food Agency, Sweden. http://www7.slv.se/SokNaringsinnehall/Home/FoodDetails/1241# Accessed 16 August 2019.
239. The National Food Agency database, Regnbågslax rå 2019, National Food Agency, Sweden. https://www7.slv.se/SokNaringsinnehall/Home/FoodDetails/1201# Accessed 9 June 2019.
240. Surh, J. and H. Kwon, Estimation of daily exposure to 4-hydroxy-2-alkenals in Korean foods containing n-3 and n-6 polyunsaturated fatty acids. Food additives and contaminants, 2005. 22(8): p. 701-708.
241. The national Food Agency database, Makrill rå. 2019, National Food Agency, Sweden. https://www7.slv.se/SokNaringsinnehall/Home/FoodDetails/1260 Accessed 9 June 2019.
242. Papastergiadis, A., E. Mubiru, H. Van Langenhove, and B. De Meulenaer, Malondialdehyde Measurement in Oxidized Foods: Evaluation of the Spectrophotometric Thiobarbituric Acid Reactive Substances (TBARS) Test in Various Foods. Journal of Agricultural and Food Chemistry, 2012. 60(38): p. 9589-9594.
243. Guillén, M.D. and E. Goicoechea, Toxic Oxygenated α,β-Unsaturated Aldehydes and their Study in Foods: A Review. Critical Reviews in Food Science and Nutrition, 2008. 48(2): p. 119-136.
77
244. Catalá, A., Lipid peroxidation of membrane phospholipids generates hydroxy-alkenals and oxidized phospholipids active in physiological and/or pathological conditions. Chemistry and Physics of Lipids, 2009. 157(1): p. 1-11.
245. Belitz, H.-D., W. Grosch, and P. Schieberle, Lipids, in Food Chemistry, B. H.-D., W. Grosch, and P. Schieberle, Editors. 2004, Springer. p. 157-244.
246. Ismail, M.M., G.M. El Zokm, and A.A.M. El-Sayed, Variation in biochemical constituents and master elements in common seaweeds from Alexandria Coast, Egypt, with special reference to their antioxidant activity and potential food uses: prospective equations. Environmental Monitoring and Assessment, 2017. 189(12): p. 648.
247. Turan, F., S. Ozgun, S. Sayın, and G. Ozyılmaz, Biochemical composition of some red and green seaweeds from Iskenderun Bay, the northeastern Mediterranean coast of Turkey. Nature, 2015. 21(3): p. 239-249.
248. Ramanathan, L. and N. Das, Studies on the control of lipid oxidation in ground fish by some polyphenolic natural products. Journal of Agricultural and Food Chemistry, 1992. 40(1): p. 17-21.
249. Sannaveerappa, T., H. Cai, M.P. Richards, and I. Undeland, Factors affecting the binding of trout HbI and HbIV to washed cod mince model system and their influence on lipid oxidation. Food chemistry, 2014. 143: p. 392-397.
250. Sannaveerappa, T., N.-G. Carlsson, A.-S. Sandberg, and I. Undeland, Antioxidative properties of press juice from herring (Clupea harengus) against hemoglobin (Hb) mediated oxidation of washed cod mince. Journal of agricultural and food chemistry, 2007. 55(23): p. 9581-9591.
251. Ross, C.F. and D.M. Smith, Use of Volatiles as Indicators of Lipid Oxidation in Muscle Foods. Comprehensive Reviews in Food Science and Food Safety, 2006. 5(1): p. 18-25.
252. Choe, E. and D.B. Min, Mechanisms and Factors for Edible Oil Oxidation. Comprehensive Reviews in Food Science and Food Safety, 2006. 5(4): p. 169-186.
253. Gutiérrez-Rosales, F., J. Garrido-Fernández, L. Gallardo-Guerrero, B. Gandul-Rojas, and M.I. Minguez-Mosquera, Action of chlorophylls on the stability of virgin olive oil. Journal of the American Oil Chemists Society, 1992. 69(9): p. 866-871.
254. Endo, Y., R. Usuki, and T. Kaneda, Antioxidant effects of chlorophyll and pheophytin on the autoxidation of oils in the dark. II. The mechanism of antioxidative action of chlorophyll. Journal of the American Oil Chemists� Society, 1985. 62(9): p. 1387-1390.
255. Harel, S., Oxidation of ascorbic acid and metal ions as affected by NaCl. Journal of agricultural and food chemistry, 1994. 42(11): p. 2402-2406.
256. Mapson, L., The influence of halides on the oxidation of ascorbic acid. Biochemical Journal, 1941. 35(12): p. 1332-1353.
257. Martins, S.I.F.S., W.M.F. Jongen, and M.A.J.S. van Boekel, A review of Maillard reaction in food and implications to kinetic modelling. Trends in Food Science & Technology, 2000. 11(9): p. 364-373.
258. Yongsawatdigul, J., Protein Recovery of Tilapia Frame By-Products by pH-Shift Method AU - Chomnawang, Channarong. Journal of Aquatic Food Product Technology, 2013. 22(2): p. 112-120.
259. Jiang, J., Y.L. Xiong, and J. Chen, pH Shifting Alters Solubility Characteristics and Thermal Stability of Soy Protein Isolate and Its Globulin Fractions in Different pH, Salt Concentration, and Temperature Conditions. Journal of Agricultural and Food Chemistry, 2010. 58(13): p. 8035-8042.
260. Shevkani, K., N. Singh, A. Kaur, and J.C. Rana, Structural and functional characterization of kidney bean and field pea protein isolates: A comparative study. Food Hydrocolloids, 2015. 43: p. 679-689.
261. Barbarino, E. and S. Lourenço, An evaluation of methods for extraction and quantification of protein from marine macro- and microalgae. Journal of Applied Phycology, 2005. 17(5): p. 447-460.

78
262. Cao, E., Y. Chen, Z. Cui, and P.R. Foster, Effect of freezing and thawing rates on denaturation of proteins in aqueous solutions. Biotechnology and Bioengineering, 2003. 82(6): p. 684-690.
263. Chang, B.S., B.S. Kendrick, and J.F. Carpenter, Surface-induced denaturation of proteins during freezing and its inhibition by surfactants. Journal of pharmaceutical sciences, 1996. 85(12): p. 1325-1330.
264. Jacobsen, C., A.-D.M. Sørensen, S.L. Holdt, C.C. Akoh, and D.B. Hermund, Source, Extraction, Characterization, and Applications of Novel Antioxidants from Seaweed. Annual Review of Food Science and Technology, 2019. 10(1): p. 541-568.
265. Liu, X., W. Yuan, and X. Meng, Extraction and quantification of phlorotannins from edible brown algae. Transactions of the ASABE, 2017. 60(1): p. 265-271.
266. Fiset, C., J. Liefer, A.J. Irwin, and Z.V. Finkel, Methodological biases in estimates of macroalgal macromolecular composition. Limnology and Oceanography: Methods, 2017. 15(7): p. 618-630.
267. Marinho, G.S. and S.L. Holdt, Is nitrogen-to-protein conversion factor for seaweed dependent on season? Abstract from the 6th congress of international society for applied phycology. 2017: Nantes.
268. Venkataraman, L. and S. Shivashankar, Studies on the extractability of proteins from the alga Scenedesmus acutus. Algological Studies/Archiv für Hydrobiologie, 1979. 22: p. 114-126.
269. Lahaye, M. and A. Robic, Structure and Functional Properties of Ulvan, a Polysaccharide from Green Seaweeds. Biomacromolecules, 2007. 8(6): p. 1765-1774.
270. Kelleher, S.D., Physical Characteristics of muscle protein extracts prepared using low ionic strenght, acid solubilization/precipitation. 2000, Ph.D. Thesis, University of Massachusetts.
271. Tamayo Tenorio, A., K.E. Kyriakopoulou, E. Suarez-Garcia, C. van den Berg, and A.J. van der Goot, Understanding differences in protein fractionation from conventional crops, and herbaceous and aquatic biomass - Consequences for industrial use. Trends in Food Science & Technology, 2018. 71: p. 235-245.
272. Day, L., Proteins from land plants�potential resources for human nutrition and food security. Trends in Food Science & Technology, 2013. 32(1): p. 25-42.
273. Murata, M. and J.-i. Nakazoe, Production and use of marine aIgae in Japan. Japan Agricultural Research Quarterly: JARQ, 2001. 35(4): p. 281-290.
274. Balina, K., F. Romagnoli, and D. Blumberga, Seaweed biorefinery concept for sustainable use of marine resources. Energy Procedia, 2017. 128: p. 504-511.
275. Torres, M.D., S. Kraan, and H. Domínguez, Seaweed biorefinery. Reviews in Environmental Science and Bio/Technology, 2019. 18(2): p. 335-388.
276. Baghel, R.S., N. Trivedi, and C.R.K. Reddy, A simple process for recovery of a stream of products from marine macroalgal biomass. Bioresource Technology, 2016. 203: p. 160-165.
277. Glasson, C.R.K., I.M. Sims, S.M. Carnachan, R. de Nys, and M. Magnusson, A cascading biorefinery process targeting sulfated polysaccharides (ulvan) from Ulva ohnoi. Algal Research, 2017. 27: p. 383-391.
278. Holzinger, A., K. Herburger, F. Kaplan, and L.A. Lewis, Desiccation tolerance in the chlorophyte green alga Ulva compressa: does cell wall architecture contribute to ecological success? Planta, 2015. 242(2): p. 477-492.
279. Thakur, B.R., R.K. Singh, A.K. Handa, and M.A. Rao, Chemistry and uses of pectin � A review. Critical Reviews in Food Science and Nutrition, 1997. 37(1): p. 47-73.
280. Cavonius, L.R., E. Albers, and I. Undeland, In vitro bioaccessibility of proteins and lipids of pH-shift processed Nannochloropsis oculata microalga. Food & function, 2016. 7(4): p. 2016-2024
281. Carocho, M., P. Morales, and I.C.F.R. Ferreira, Antioxidants: Reviewing the chemistry, food applications, legislation and role as preservatives. Trends in Food Science & Technology, 2018. 71: p. 107-120.