Spatial Differentiation of Non-Grain Production on Cultivated ...
18
sustainability Article Spatial Differentiation of Non-Grain Production on Cultivated Land and Its Driving Factors in Coastal China Yan Sun 1 , Yuanyuan Chang 2 , Junna Liu 2 , Xiaoping Ge 3 , Gang-Jun Liu 4 and Fu Chen 1,2, * Citation: Sun, Y.; Chang, Y.; Liu, J.; Ge, X.; Liu, G.-J.; Chen, F. Spatial Differentiation of Non-Grain Production on Cultivated Land and Its Driving Factors in Coastal China. Sustainability 2021, 13, 13064. https:// doi.org/10.3390/su132313064 Academic Editors: Jie Xu, Hongchao Zhang and Juzhong Tan Received: 31 October 2021 Accepted: 23 November 2021 Published: 25 November 2021 Publisher’s Note: MDPI stays neutral with regard to jurisdictional claims in published maps and institutional affil- iations. Copyright: © 2021 by the authors. Licensee MDPI, Basel, Switzerland. This article is an open access article distributed under the terms and conditions of the Creative Commons Attribution (CC BY) license (https:// creativecommons.org/licenses/by/ 4.0/). 1 College of Public Policy and Management, Hohai University, Nanjing 210098, China; [email protected] 2 School of Public Policy, China University of Mining and Technology, Xuzhou 221043, China; [email protected] (Y.C.); [email protected] (J.L.) 3 College of Hydrology and Water Resources, Hohai University, Nanjing 210098, China; [email protected] 4 Geospatial Science, School of Science, STEM College, RMIT University, Melbourne 3000, Australia; [email protected] * Correspondence: [email protected]; Tel.: +86-5168-388-3501 Abstract: The rapid development of urbanization and industrialization in coastal China in the past 20 years has exerted a huge squeezing effect on agricultural land use. The phenomenon of non-grain production on cultivated land (NGP) is very common, seriously threatening the protection of high- quality arable land and national food security. In order to find out the overall situation regarding NGP on cultivated land in coastal China, this study revealed the spatial differentiation of NGP and its main driving factors by spatial autocorrelation analysis, multiple linear regression models and geographically weighted regression analysis (GWR). The results show that: (1) in 2018, the non-grain cultivated land area of 11 provinces along the coast of China was about 15.82 × 10 6 hm 2 , accounting for 33.65% of the total cultivated land area. (2) The NGP rate in 11 provinces gradually decreased from south to north, but the NGP area showed two peak centers in Guangxi province and Shandong province, then decreased gradually outwards. (3) The low economic benefit of the planting industry (per capita GDP and urban-to-rural disposable income ratio) was the most important driving force, leading to the spatial differentiation of NGP, while the number of rural laborers and land transfer areas also acted as the main driving factors for the spatial differentiation of NGP. However, the influence of each driving factor has obvious spatial heterogeneity. The non-grained area and the non- grain production rate at the municipal level were completely different from those at the provincial level, and the spatial heterogeneity was more prominent. In the future, the local government should control the disorganized spread of NGP, scientifically set the bottom line of NGP, reduce the external pressure of NGP, regulate multi-party land transfer behavior, and strengthen land-use responsibilities. This study can provide a scientific foundation for adjusting land-use planning and cultivated land protection policies in China and other developing countries. Keywords: non-grain production; cultivated land protection; spatial autocorrelation; geographically weighted regression (GWR); driving factor 1. Introduction China has been in a stage of rapid industrialization and urbanization since 1990, resulting in the non-agriculturalization of 2.94 × 10 5 hm 2 of cultivated land every year [1,2], which directly threatens food security in China. In fact, in addition to the dominant loss of cultivated land, some high-yield cash crops are driven by economic interests, encouraging farmers to replace grain crops on a large scale [3]. The recessive loss of grain production capacity, also referred to as NGP, should not be ignored. In 2019 alone, China’s grain- planted acreage dropped by 9.70 × 10 5 hm 2 , which not only seriously threatened national food security but also caused huge risks to rural social stability, the agricultural landscape and ecosystem health [4–7]. How to properly solve the problem of NGP has become the focus of attention of the government, academia and the public [8–11]. In addition, Sustainability 2021, 13, 13064. https://doi.org/10.3390/su132313064 https://www.mdpi.com/journal/sustainability
-
Upload
khangminh22 -
Category
Documents
-
view
0 -
download
0
Transcript of Spatial Differentiation of Non-Grain Production on Cultivated ...
sustainability
Article
Spatial Differentiation of Non-Grain Production on CultivatedLand and Its Driving Factors in Coastal China
Yan Sun 1, Yuanyuan Chang 2, Junna Liu 2, Xiaoping Ge 3, Gang-Jun Liu 4 and Fu Chen 1,2,*
�����������������
Citation: Sun, Y.; Chang, Y.; Liu, J.;
Ge, X.; Liu, G.-J.; Chen, F. Spatial
Differentiation of Non-Grain
Production on Cultivated Land and
Its Driving Factors in Coastal China.
Sustainability 2021, 13, 13064. https://
doi.org/10.3390/su132313064
Academic Editors: Jie Xu, Hongchao
Zhang and Juzhong Tan
Received: 31 October 2021
Accepted: 23 November 2021
Published: 25 November 2021
Publisher’s Note: MDPI stays neutral
with regard to jurisdictional claims in
published maps and institutional affil-
iations.
Copyright: © 2021 by the authors.
Licensee MDPI, Basel, Switzerland.
This article is an open access article
distributed under the terms and
conditions of the Creative Commons
Attribution (CC BY) license (https://
creativecommons.org/licenses/by/
4.0/).
1 College of Public Policy and Management, Hohai University, Nanjing 210098, China; [email protected] School of Public Policy, China University of Mining and Technology, Xuzhou 221043, China;
[email protected] (Y.C.); [email protected] (J.L.)3 College of Hydrology and Water Resources, Hohai University, Nanjing 210098, China; [email protected] Geospatial Science, School of Science, STEM College, RMIT University, Melbourne 3000, Australia;
[email protected]* Correspondence: [email protected]; Tel.: +86-5168-388-3501
Abstract: The rapid development of urbanization and industrialization in coastal China in the past20 years has exerted a huge squeezing effect on agricultural land use. The phenomenon of non-grainproduction on cultivated land (NGP) is very common, seriously threatening the protection of high-quality arable land and national food security. In order to find out the overall situation regardingNGP on cultivated land in coastal China, this study revealed the spatial differentiation of NGP andits main driving factors by spatial autocorrelation analysis, multiple linear regression models andgeographically weighted regression analysis (GWR). The results show that: (1) in 2018, the non-graincultivated land area of 11 provinces along the coast of China was about 15.82 × 10⁶ hm2, accountingfor 33.65% of the total cultivated land area. (2) The NGP rate in 11 provinces gradually decreasedfrom south to north, but the NGP area showed two peak centers in Guangxi province and Shandongprovince, then decreased gradually outwards. (3) The low economic benefit of the planting industry(per capita GDP and urban-to-rural disposable income ratio) was the most important driving force,leading to the spatial differentiation of NGP, while the number of rural laborers and land transferareas also acted as the main driving factors for the spatial differentiation of NGP. However, theinfluence of each driving factor has obvious spatial heterogeneity. The non-grained area and the non-grain production rate at the municipal level were completely different from those at the provinciallevel, and the spatial heterogeneity was more prominent. In the future, the local government shouldcontrol the disorganized spread of NGP, scientifically set the bottom line of NGP, reduce the externalpressure of NGP, regulate multi-party land transfer behavior, and strengthen land-use responsibilities.This study can provide a scientific foundation for adjusting land-use planning and cultivated landprotection policies in China and other developing countries.
Keywords: non-grain production; cultivated land protection; spatial autocorrelation; geographicallyweighted regression (GWR); driving factor
1. Introduction
China has been in a stage of rapid industrialization and urbanization since 1990,resulting in the non-agriculturalization of 2.94 × 10⁵ hm2 of cultivated land every year [1,2],which directly threatens food security in China. In fact, in addition to the dominant loss ofcultivated land, some high-yield cash crops are driven by economic interests, encouragingfarmers to replace grain crops on a large scale [3]. The recessive loss of grain productioncapacity, also referred to as NGP, should not be ignored. In 2019 alone, China’s grain-planted acreage dropped by 9.70 × 10⁵ hm2, which not only seriously threatened nationalfood security but also caused huge risks to rural social stability, the agricultural landscapeand ecosystem health [4–7]. How to properly solve the problem of NGP has becomethe focus of attention of the government, academia and the public [8–11]. In addition,
Sustainability 2021, 13, 13064. https://doi.org/10.3390/su132313064 https://www.mdpi.com/journal/sustainability
Sustainability 2021, 13, 13064 2 of 18
the influx of industrial and commercial capital into rural areas in recent years has alsoaccelerated NGP [12,13]. Cultivated land protection is the cornerstone of food security, andemergencies such as the global spread of COVID-19, the acceleration of climate change,and the blockading of international food trade have further demonstrated that restrainingNGP is urgent.
NGP has been a common phenomenon of land-use conversion on a global scale. NGPis different from non-agriculturalization, does not cause the loss of cultivated land [14], andis different from farmland marginalization [15]. Generally, NGP refers to the phenomenonwhereby the farmland intended for grain cultivation is occupied by cash crops, forests,fruits or the stock-breeding industry. NGP is mainly attributable to the low economicbenefit of planting grain, and is also affected by regional resource endowments, economicdevelopment, social factors and agricultural production habits. European and Ameri-can countries rarely intervene in land-use conversion within the agricultural sector, andmainly rely on the market to adjust the planting structure. The United States, based onits international and domestic food supply and demand conditions, formulated a lowerlimit for the planting scale of major crops every year, which not only guaranteed foodsecurity but also fully protected the farmland ecology and high-efficiency utilization offarmland resources [16]. Most EU countries and Japan adjusted their fallow scale accordingto market supply and demand conditions, to cope with fluctuations in international foodprices [17–20]. The agricultural planting structure in some developing countries suchas Brazil is not only affected by their own needs but also by the investment motives ofmultinational companies [21]. The Chinese government discourages NGP because it needsto use 8% of the world’s cultivated land to feed 18.4% of the world’s population.
Food security is the primary consideration of the Chinese government. The Chi-nese government has long discouraged NGP and issued an order prohibiting NGP on 17November 2020 (http://www.gov.cn/zhengce/content/2020-11/17/content_5562053.htm(accessed on 22 November 2021)). The General Office of the State Council issued the“Opinions on Preventing Non-Grain Production on Cultivated Land and Stabilizing GrainProduction”, clearly understanding the profound urgency of preventing NGP and sta-bilizing grain production, earnestly grasping the national food security initiative, andestablishing the reporting system of NGP so as to keep it strictly controlled. However, it isvery difficult to enforce the policy ban regarding NGP. Firstly, both local governments andfarmers lack motivation because of the low economic benefits of crop plantation. Someresearchers have validated the drive function of the low economic benefits of crop planta-tion on NGP and analyzed the negative effect of NGP on national food security [22–25].Secondly, the land transfer and profit-seeking of industrial and commercial capital haspromoted the conversion to NGP. Seto et al. found that the pulling of foreign investment,unscientific planning, and improper management have led to a serious loss of cultivatedland and grain production capability in the Pearl River Delta [26]. Liao et al. analyzed theeffects of the profit-seeking behaviors of contractors on NGP in the land transfer processand proposed related measures and suggestions for preventing excess NGP, from the per-spective of restricting improper land transfer [27]. Thirdly, unlike non-agriculturalization,NGP did not directly lead to the loss of cultivated lands, with less hazard. NGP canbe mostly regarded as an internal structural adjustment of agriculture and cannot becompletely prohibited because of the involvement of farmers’ interests. In addition, cer-tain specific factors, including cultivation scale [28–30], industrial structure [31], familycharacteristics [32–34] and benefit farming policies [35] have also affected NGP in China.
Remote sensing and UAV technology have provided an effective means of monitoringNGP [36]. Some studies have focused on the spatial characteristics of cultivated land,non-agriculturalization, and farmland marginalization [37,38]. However, its workload andcost are huge. Remote-sensing data with a resolution greater than 1 m is also not suitablefor monitoring specific crops such as garlic and wheat, which cannot be distinguished atall in the winter. Currently, it is almost impossible to use remote-sensing technology toaccurately monitor NGP on a national scale with a country as large as China. Authoritative
Sustainability 2021, 13, 13064 3 of 18
statistical data is indispensable for studying the spatial characteristics of NGP on a nationalscale. Moreover, cultivated land is widely distributed, with large differences in natural,social and economic conditions across China. The behavior and causes of NGP in differentregions are not the same. On such a large scale, clarifying the spatial pattern of NGP andits causes, in terms of the current, specific, cultivated land protection and national foodsecurity is particularly important.
Although previous studies have encompassed many issues regarding NGP, NGP is aresult of complex behavior involving multiple factors and myriad stakeholders [39–42]. Thespatial scale is particularly important for the management and interpretation of NGP. Atpresent, the literature focusing on the spatial pattern differentiation of NGP and its causesat different scales is almost blank, which is unfavorable for the governance of NGP behaviorand human-land-grain production nexus under the conditions of economic and social de-velopment differences. Therefore, 11 provinces and 130 cities in coastal China were selectedas the research objects in this study, because they are most severely affected by the loweconomic efficiency of grain planting, the intervention of industrial and commercial capital,and urbanization. The aims of this study are following as: (1) Explore the spatial patternand differentiation characteristics of non-grain farmland scales at the provincial scales andmunicipal scales; (2) Identify the influencing factors of non-grain farmland; (3) Interpret thedriving mechanism of non-grain farmland. This study is expected to provide a scientificfoundation for global food security and farmland protection decision-making.
2. Materials and Methods2.1. Concept Definition and Research Framework2.1.1. Concept Definitions
The definition and calculation methods of NGP have always been very vague in China.Some studies have used indicators such as “grain-to-grain ratio” [43], “non-grain sownarea to crop sown area” [44,45], “non-food cultivation and circulating farmland area tocirculating farmland area” [46] to describe the rate of NGP, but these concepts are notvery accurate. According to the documents issued by the Ministry of Natural Resources(http://www.gov.cn/zhengce/zhengceku/2021-04/12/content_5599101.htm (accessed on1 April 2021)) the gain crops in this study only include three types of rice, wheat, and corn.All the farming behaviors of planting other crops on cultivated land except for three typesof rice, wheat, and corn are defined as NGP. The area and ratio of NGP can be definedas follows:
Aingc = Ai
t × Ci − Aic (1)
Ringc = 1 − Ai
c/(
Ait × Ci
)(2)
where Aingc denotes the NGP area of the i-th unit, Ai
t denotes the cultivated area of the i-thunit, Ci denotes the multiple crop index of the i-th unit, Ai
c denotes the grain-sowing areaof the i-th unit, and Ri
ngc denotes the NGP rate of the i-th unit. The cultivated area, thegrain-sowing area, and the multiple crop index of each municipal unit are directly derivedfrom the 2019 Statistical Yearbooks for each municipal unit. The advantage of the definitionof NGP used in this study is that the aforementioned three indicators are furnished withaccurate and authoritative statistical data in China; at the same time, it also encountersthe confounding factors of the existence of arable land and facility agricultural land invegetable production, and the existence of arable land and garden land in fruit production.Therefore, we can only rely on authoritative statistical data to monitor NGP in China. Inaddition, considering the multiple cropping index also brings the rate of NGP closer to theactual situation.
2.1.2. Research Framework
Multiple variables, including economy, society, and resource endowment, have in-exhaustible links with NGP, and the interaction of different elements together drives the
Sustainability 2021, 13, 13064 4 of 18
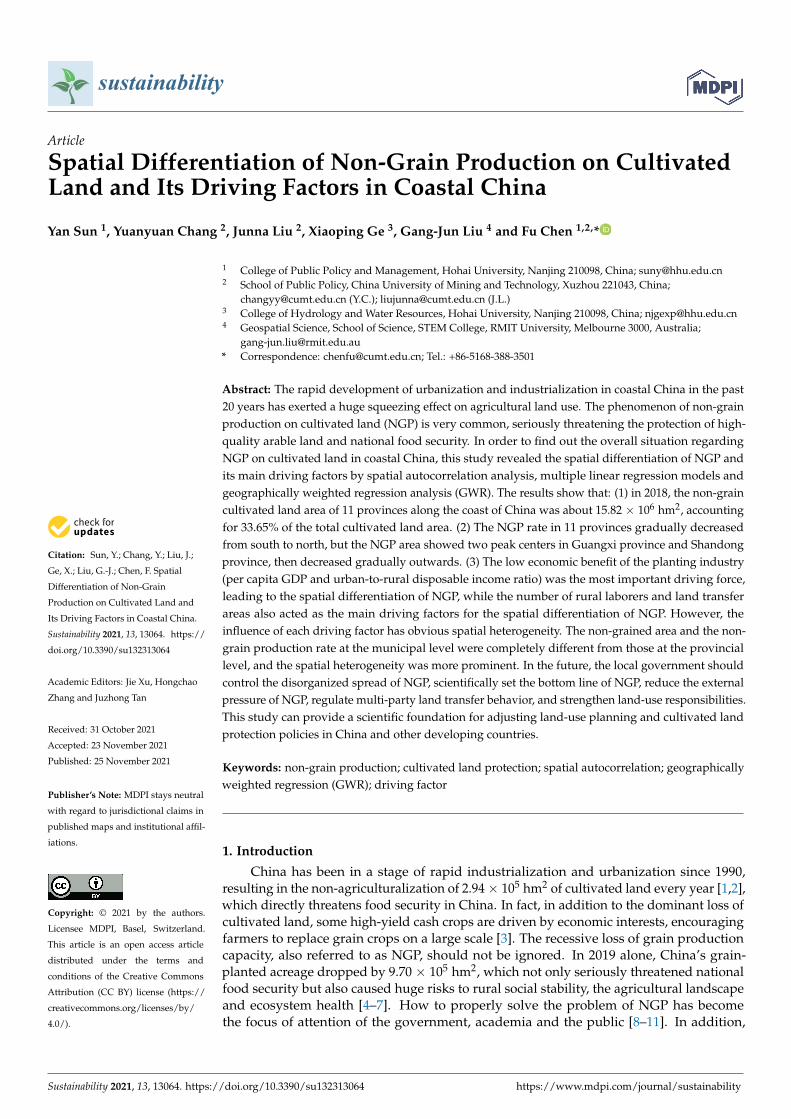
situation of NGP in China. The research framework includes the following steps (Figure 1).Step 1: the related datasets of NGP were established so as to get a clear knowledge of boththe quantity and spatial distribution of NGP. Step 2: the spatial pattern and distributioncharacteristics of NGP, and the spatial distribution, the global agglomeration degree, andthe local agglomeration difference were analyzed with ArcGIS 10.2 (ESRI, Sacramento,CA, USA) and Stata 17.0 (StataCorp, Houston, TX, USA). Step 3: the driving mechanismand regional difference of NGP were identified and the main influencing factors wereexplored via the use of a multiple linear regression model. Moreover, the variation ofthe main driving factors of NGP according to the local geographic position was analyzedusing the GWR model. Finally, related policy suggestions on controlling or reducing NGPwere developed.
Sustainability 2021, 13, x FOR PEER REVIEW 4 of 19
2.1.2. Research Framework Multiple variables, including economy, society, and resource endowment, have
inexhaustible links with NGP, and the interaction of different elements together drives the situation of NGP in China. The research framework includes the following steps (Figure 1). Step 1: the related datasets of NGP were established so as to get a clear knowledge of both the quantity and spatial distribution of NGP. Step 2: the spatial pattern and distribution characteristics of NGP, and the spatial distribution, the global agglomeration degree, and the local agglomeration difference were analyzed with ArcGIS 10.2 (ESRI, Sacramento, CA, USA) and Stata 17.0 (StataCorp, Houston, TX, USA). Step 3: the driving mechanism and regional difference of NGP were identified and the main influencing factors were explored via the use of a multiple linear regression model. Moreover, the variation of the main driving factors of NGP according to the local geographic position was analyzed using the GWR model. Finally, related policy suggestions on controlling or reducing NGP were developed.
Figure 1. Research framework of this study.
2.2. The Study Area, Variable Selection and Data Processing 2.2.1. The Study Area
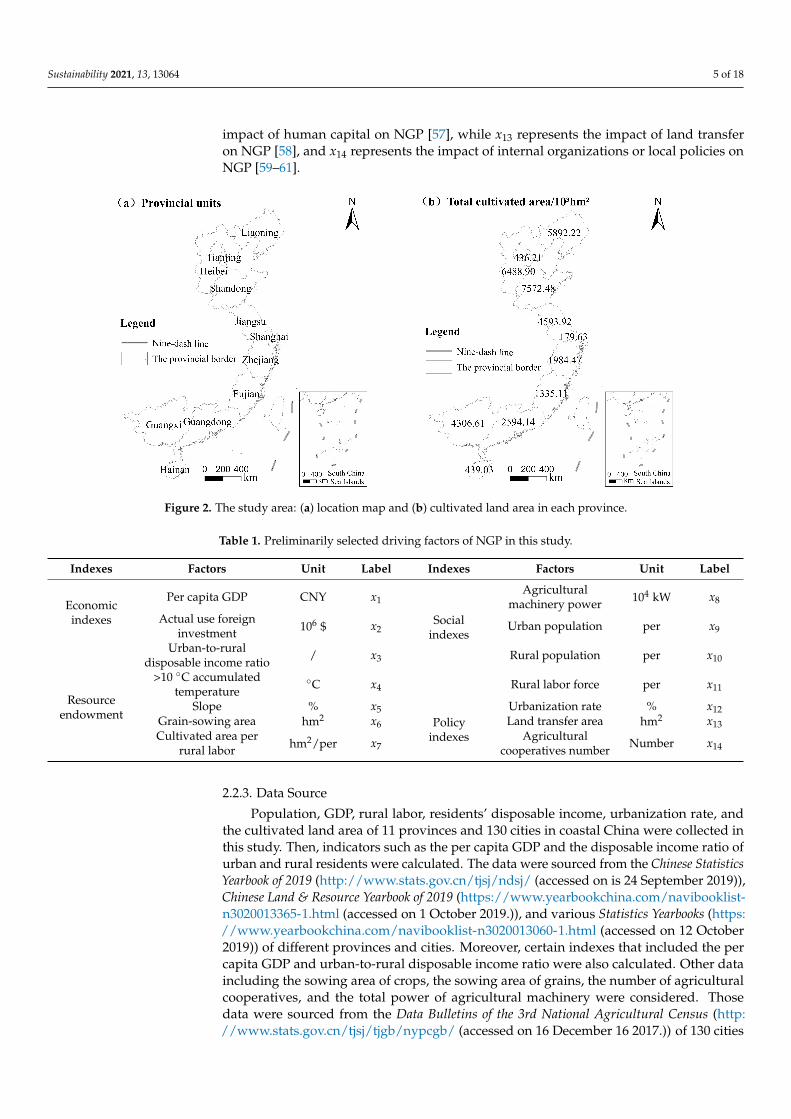
Coastal China has 11 provincial units, including Liaoning, Hebei, Tianjin, Shandong, Jiangsu, Shanghai, Zhejiang, Fujian, Guangdong, Guangxi, and Hainan, with a total area of 950,000 km2 (Figure 2). The coastal area straddles the tropical, subtropical and temperate zones, and belongs to a typical maritime monsoon climate. The annual precipitation is 750–1700 mm, decreasing from south to north. In 2020, the coastal area had a population of approximately 643 million, accounting for 44.5% of the total population of China, with an urbanization rate of over 60.0% in 130 municipal units, and a per capita GDP close to USD 20,000, including almost all of China’s most economically developed provincial units. The cultivated land per capita is small, at only 0.08 ha in coastal China. Being adversely affected by the low economic efficiency of the farming industry, the intervention of industrial and commercial capital, and urbanization, the situation regarding grain planting in coastal China is not good, and the phenomenon of NGP has become very common.
Figure 1. Research framework of this study.
2.2. The Study Area, Variable Selection and Data Processing2.2.1. The Study Area
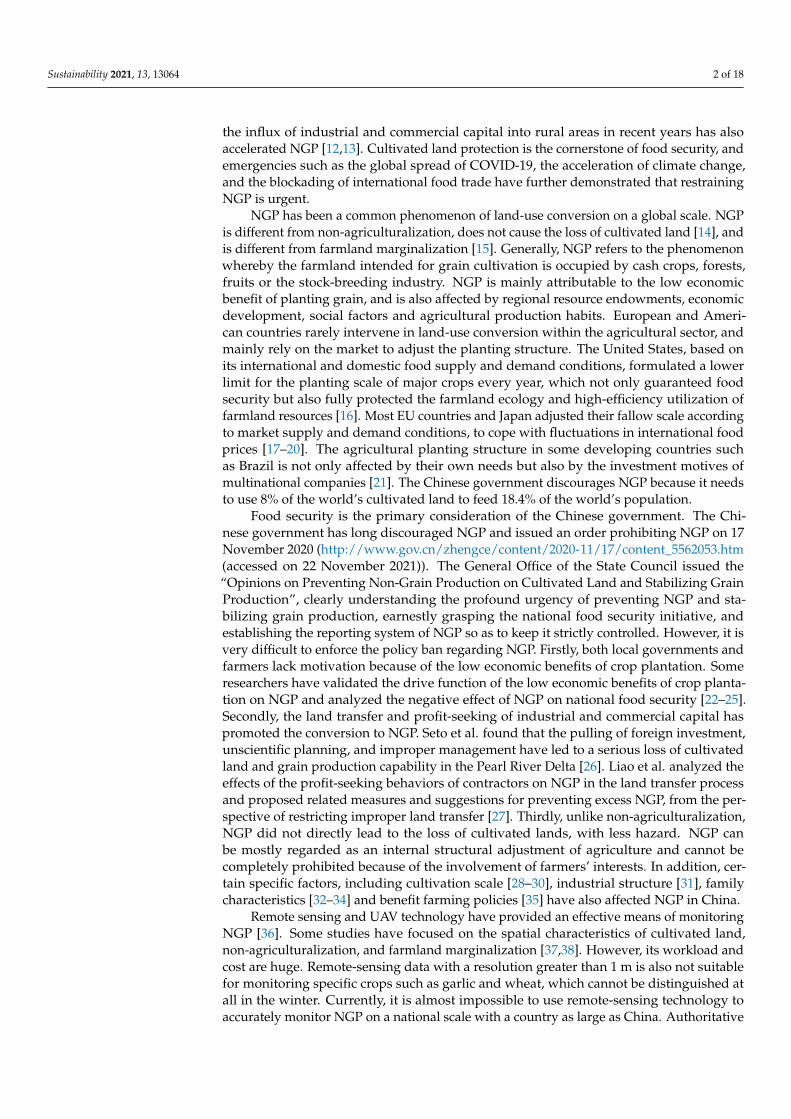
Coastal China has 11 provincial units, including Liaoning, Hebei, Tianjin, Shandong,Jiangsu, Shanghai, Zhejiang, Fujian, Guangdong, Guangxi, and Hainan, with a total area of950,000 km2 (Figure 2). The coastal area straddles the tropical, subtropical and temperatezones, and belongs to a typical maritime monsoon climate. The annual precipitation is750–1700 mm, decreasing from south to north. In 2020, the coastal area had a population ofapproximately 643 million, accounting for 44.5% of the total population of China, with anurbanization rate of over 60.0% in 130 municipal units, and a per capita GDP close to USD20,000, including almost all of China’s most economically developed provincial units. Thecultivated land per capita is small, at only 0.08 ha in coastal China. Being adversely affectedby the low economic efficiency of the farming industry, the intervention of industrial andcommercial capital, and urbanization, the situation regarding grain planting in coastalChina is not good, and the phenomenon of NGP has become very common.
2.2.2. Selection of Variables
This study refers to previous research results, based on the research framework andcombined with the availability of data and taking into account classic variables, to deter-mine the primary driving factors for NGP. These factors can better explain the impetusdriving NGP from different viewpoints, such as economic level, social development,resource allocation, and policy regulation (Table 1). Label x1 represents the impact of eco-nomic development on NGP [47,48], x2 represents the impact of industrial and commercialcapital on NGP [49–52], x3 represents the impact of low planting efficiency on NGP [53,54],x4, x5 and x6 represent the impact of resource endowments on NGP [55], and x7 representsthe impact of material capital on NGP [56]. Labels x8, x9, x10, x11, and x12 represent the
Sustainability 2021, 13, 13064 5 of 18
impact of human capital on NGP [57], while x13 represents the impact of land transferon NGP [58], and x14 represents the impact of internal organizations or local policies onNGP [59–61].
Sustainability 2021, 13, x FOR PEER REVIEW 5 of 19
Figure 2. The study area: (a) location map and (b) cultivated land area in each province.
2.2.2. Selection of Variables This study refers to previous research results, based on the research framework and
combined with the availability of data and taking into account classic variables, to determine the primary driving factors for NGP. These factors can better explain the impetus driving NGP from different viewpoints, such as economic level, social development, resource allocation, and policy regulation (Table 1). Label x1 represents the impact of economic development on NGP [47,48], x2 represents the impact of industrial and commercial capital on NGP [49–52], x3 represents the impact of low planting efficiency on NGP [53,54], x4, x5 and x6 represent the impact of resource endowments on NGP [55], and x7 represents the impact of material capital on NGP [56]. Labels x8, x9, x10, x11, and x12 represent the impact of human capital on NGP [57], while x13 represents the impact of land transfer on NGP [58], and x14 represents the impact of internal organizations or local policies on NGP [59–61].
Table 1. Preliminarily selected driving factors of NGP in this study.
Indexes Factors Unit Label Indexes Factors Unit Label
Economic indexes
Per capita GDP CNY x1
Social indexes
Agricultural machinery power
104 kW x8
Actual use foreign investment 106 $ x2 Urban population per x9 Urban-to-rural disposable
income ratio / x3 Rural population per x10
Resource endowment
> 10 °C accumulated temperature °C x4 Rural labor force per x11 Slope % x5 Urbanization rate % x12
Grain-sowing area hm2 x6 Policy indexes
Land transfer area hm2 x13
Cultivated area per rural labor hm2/per x7 Agricultural cooperatives number
Number x14
2.2.3. Data Source Population, GDP, rural labor, residents’ disposable income, urbanization rate, and
the cultivated land area of 11 provinces and 130 cities in coastal China were collected in
Figure 2. The study area: (a) location map and (b) cultivated land area in each province.
Table 1. Preliminarily selected driving factors of NGP in this study.
Indexes Factors Unit Label Indexes Factors Unit Label
Economicindexes
Per capita GDP CNY x1
Socialindexes
Agriculturalmachinery power 104 kW x8
Actual use foreigninvestment 106 $ x2 Urban population per x9
Urban-to-ruraldisposable income ratio / x3 Rural population per x10
Resourceendowment
>10 ◦C accumulatedtemperature
◦C x4 Rural labor force per x11
Slope % x5 Urbanization rate % x12Grain-sowing area hm2 x6 Policy
indexesLand transfer area hm2 x13
Cultivated area perrural labor hm2/per x7
Agriculturalcooperatives number Number x14
2.2.3. Data Source
Population, GDP, rural labor, residents’ disposable income, urbanization rate, andthe cultivated land area of 11 provinces and 130 cities in coastal China were collected inthis study. Then, indicators such as the per capita GDP and the disposable income ratio ofurban and rural residents were calculated. The data were sourced from the Chinese StatisticsYearbook of 2019 (http://www.stats.gov.cn/tjsj/ndsj/ (accessed on is 24 September 2019)),Chinese Land & Resource Yearbook of 2019 (https://www.yearbookchina.com/navibooklist-n3020013365-1.html (accessed on 1 October 2019.)), and various Statistics Yearbooks (https://www.yearbookchina.com/navibooklist-n3020013060-1.html (accessed on 12 October2019)) of different provinces and cities. Moreover, certain indexes that included the percapita GDP and urban-to-rural disposable income ratio were also calculated. Other dataincluding the sowing area of crops, the sowing area of grains, the number of agriculturalcooperatives, and the total power of agricultural machinery were considered. Thosedata were sourced from the Data Bulletins of the 3rd National Agricultural Census (http://www.stats.gov.cn/tjsj/tjgb/nypcgb/ (accessed on 16 December 16 2017.)) of 130 cities
Sustainability 2021, 13, 13064 6 of 18
and The Statistical Bulletin of National Economic and Social Development, based on whichthe cultivated area per capita of rural labor was calculated. The actual utilized foreigninvestment of agriculture was sourced from the Chinese Foreign Economic and Trade Yearbookin 2019 (https://www.yearbookchina.com/navibooklist-n3020031901-1.html (accessed on25 October 2019)), and the land transfer area was sourced from the rural property rightstrading information service platform by the Ministry of Agriculture and Rural Affairsof China.
2.3. Research Method2.3.1. Spatial Auto-Correlation Analysis Method
Global Moran’s I, denoted as Ig, can directly reflect the existence of a correlationbetween a region and the neighboring regions, in terms of the spatial distribution ofa property and the related correlation degree [47]. Ig falls into the range of [–1, 1]. Apositive value of Ig suggests aggregated distribution, accompanied by a positive correlationbetween spatial factors, and a negative value of Ig is indicative of discrete distribution,with a negative correlation between spatial factors. When Ig = 0, the spatial factor followsa random distribution without correlation. However, Global Moran’s I can only reflectthe overall distribution of spatial factors and cannot measure local agglomeration andspatial heterogeneity. Accordingly, the Local Moran’s I, denoted as Il , is introduced foranalyzing the difference between the spatial factor and the neighboring regions [47,62].When Il > 0, the observed value of the i-th unit shows a significantly slight difference fromthe surrounding units, i.e., a high observed value is surrounded by high values, or a lowobserved value is surrounded by low values. When Il < 0, the observed value of the i-thunit shows a significant difference from the surrounding units, i.e., a low observed value issurrounded by high values or a high observed value is surrounded by low values. To bespecific, Ig and Il can be calculated as:
Ig =n·∑n
i=1 ∑nj=1 Wij(xi − x)
(xj − x
)∑n
i=1 ∑nj=1 Wij ∑n
i=1 (xi − x)2 (3)
Il =(xi − x)∑n
j=1 Wij(
xj − x)
1n × ∑n
i=1 (xi − x)2 (4)
where n denotes the number of research units; xi and xj are the observed values of thei-th and the j-th units; x denotes the mean observed value of all units; and Wi denotesthe spatial weight matrix of each unit. If unit i is adjacent to unit j, the weight equals 1;otherwise, the weight equals 0.
2.3.2. Ordinary Least Square (OLS) Linear Regression Analysis
Firstly, the multi-nonlinearity was diagnosed. A multi-collinearity test was performedon the independent variables by a variance inflation factor (VIF). It is generally acknowl-edged that VIF = 10 is a standard value. When VLF > 10, the independent variables inthe regression model show serious collinearity. The independent variables with VLF > 10were removed for further stepwise regression and optimal solution, until VLF < 10 for allindependent variables. Next, the following multiple linear regression was performed:
y = β0 + β1x1 + β2x2 + · · ·+ βkxk + ε (5)
where y denotes the dependent variables; x1 · · · and xk are independent variables; β0 isa constant; β1 · · · and βk are the regression coefficients; and ε denotes the random error.Finally, the independent variables are ranked in accordance with their importance. Thecontribution degrees of different independent variables on the coefficient of determination,R2, can reflect the degree of contribution to the variance of dependent variables. Gen-
Sustainability 2021, 13, 13064 7 of 18
erally, a larger value of R2 is indicative of greater effect on and more importance to thedependent variable.
2.3.3. Geographically Weighted Regression (GWR)
GWR is the development of the ordinary least squares (OLS) test. The OLS regressionmodel is a global regression model. Using OLS, the estimated values of the regressioncoefficient is the mean value of the whole research area. Accordingly, local characteristicsof the relation among variables may easily be neglected and the regression results cannotreflect the real spatial characteristics of the regression parameters. By embedding the spatialpositions of the data into the regression model, GWR performs local regression based onthe subsample data obtained via adjacent observation, so as to reflect the variation of therelationship among variables with the local geographic position [49,63]. This study adoptedGWR to explore the spatial heterogeneity of the influencing factors of NGP in different regionsof coastal China, and the related rules. The detailed formula can be written as [43,46]:
yi = β0(µi, ϑi) + ∑ βk(µi, ϑi)xik + εi (6)
where yi denotes the dependent variable of the i-th spatial position (NGP area); xi denotesthe explanatory variable of the i-th spatial position (the driving factor); k denotes the setof the explanatory variables; (µi, ϑi) denotes the geographic center coordinate of the i-thspatial position; βk(µi, ϑi) denotes the regression coefficient of the spatial unit i; εi is theerror item; β0 denotes the regression constant at the spatial unit i. GWR generally adoptsthe weighted least squares test to perform local regression on each spatial unit, establishesthe weighting function with a Gaussian function, calculates the bandwidth using an Akaikeinformation criterion (AICc) and kernel density method, and finally, performs the GWRcalculation. The Gaussian function can be written as:
ωij = exp[−(dij/b
)2]
(7)
where b denotes the bandwidth and denotes the distance between the sampling points iand j. When observing the data at the sampling point i, the weights of the other samplingpoints can drop with the distance, dij, in accordance with the Gaussian curve. For the givenbandwidth, b, the weight of the sampling point, j, is lower at a larger distance of dij; theweight of the sampling point, when at a quite great distance from point I, tends to be 0.
The parameters should be set before the operation of GWR model. The longitudesand latitudes of the centroids of the municipal units were set as the coordinates. Thefixed Gaussian function was set as the kernel function, and the optimal bandwidth wasdetermined via CV cross-validation [55]. The bandwidth was determined, based on thecriterion of AICc. Moreover, when using the adaptive bandwidth selection method, theminimum bandwidth should be the most adaptive bandwidth in this study:
AICc = 2nln(σ) + nln(2π) + nn + tr(s)
n − 2 − tr(s)(8)
where n denotes the number of the sampling points, σ denotes the standard error of theerror estimated item, and tr(s) is the function of bandwidth and the trace of the matrix, s.The bandwidth corresponding to a minimum value of AICc is the optimal value.
3. Results3.1. Overall Pattern of NGP in Coastal China
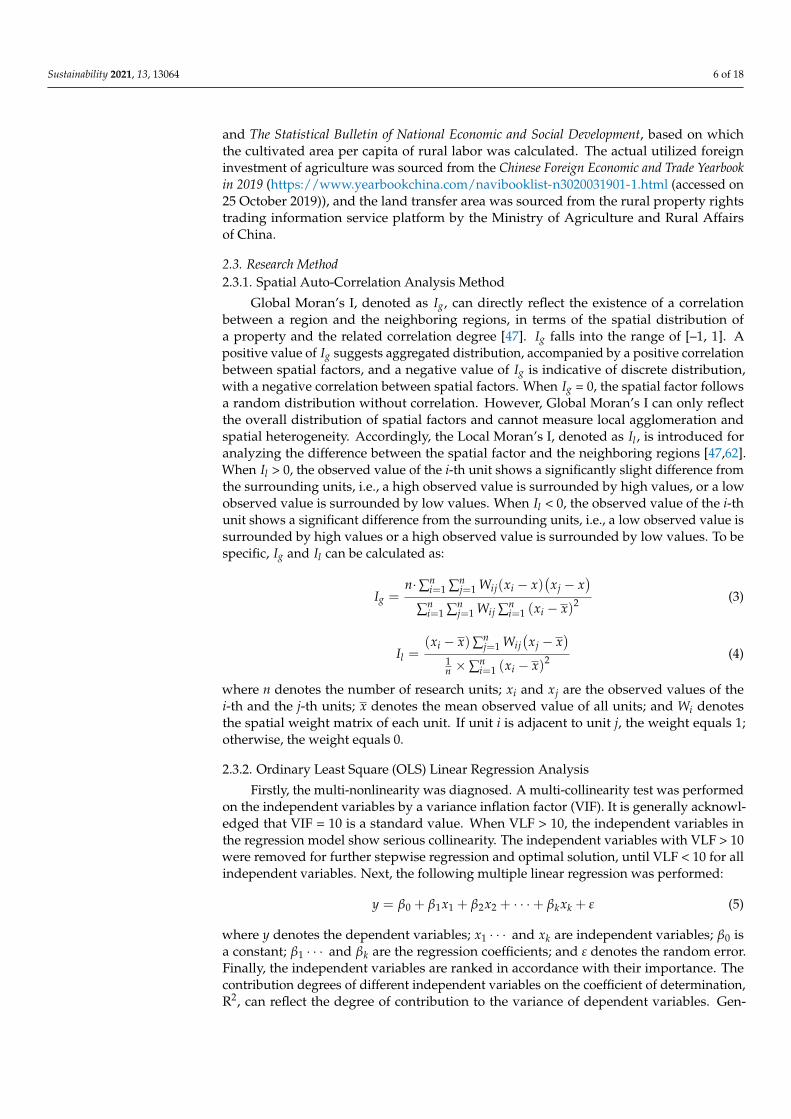
The area of NGP in 2018 reached up to 15.82 × 10⁶ hm2, which took up 33.65% ofthe total cultivation area. As shown in Figure 3a, the area of NGP differed obviouslyamong different provinces. In terms of the area of NGP, Guangdong, Guangxi, Shandong,Hebei, and Jiangsu can be classified as high- and medium-value units (with an area ofNGP over 1200 × 103 hm2), among which Shandong ranked the first (with an area of NGP
Sustainability 2021, 13, 13064 8 of 18
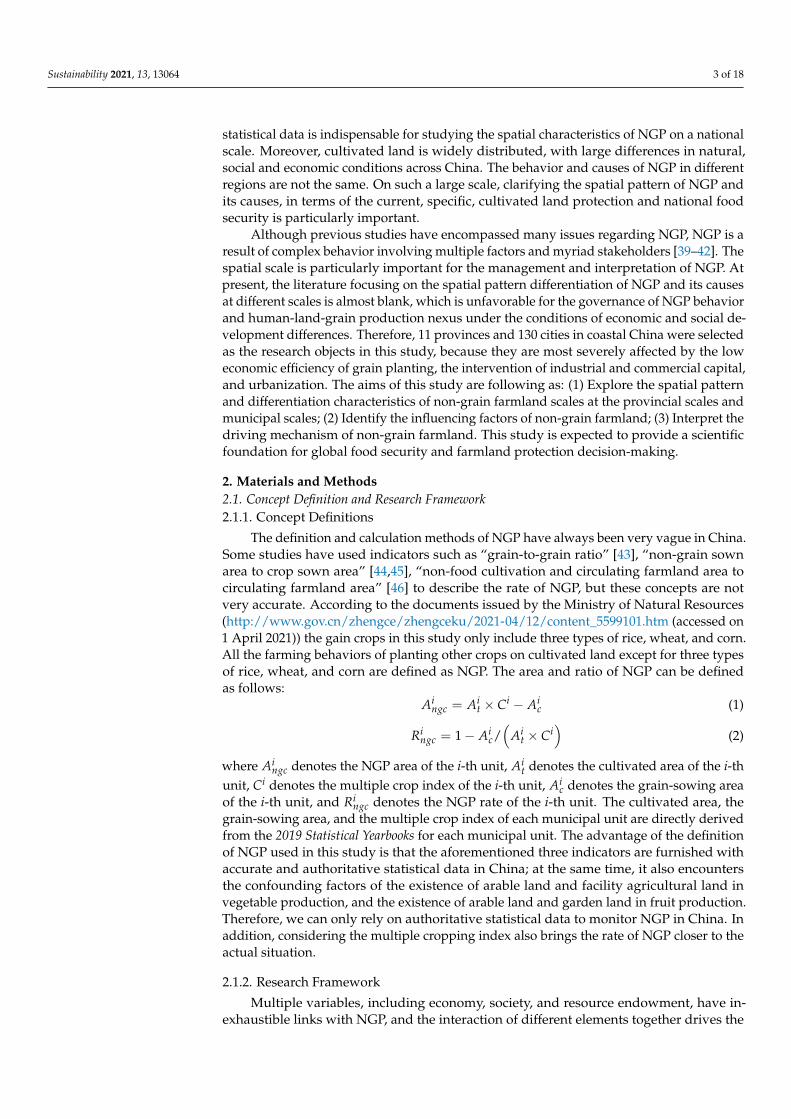
of 2693 × 103 hm2); Shanghai, Zhejiang, Fujian, Tianjin and Liaoning can be classified aslow-value units (with an area of NGP of over 800 × 103 hm2), among which Tianjin showedthe lowest area of 79.1 × 10³ hm2. The rate of NGP dropped gradually from south to north.To be specific, Hainan exhibited the highest rate of 59.87%, while Shanghai, Zhejiang,Guangxi, Guangdong, and Fujian all exhibited a rate of over 45% (see Figure 3b). The highrates in Hainan, Guangxi, and Guangdong can mainly be attributed to favorable climaticconditions, which are suitable for the cultivation of both tropical- and subtropical fruitsand commercial crops. Shanghai demonstrated an extremely low cultivation area, in whichvegetables, agricultural and sideline products, and agricultural sightseeing were welldeveloped, thereby showing a high NGP rate. Zhejiang and Fujian had small NGP areasbut a high NGP rate. Zhejiang and Fujian featured low rates of per capita cultivated land,a high proportion of hilly areas and relatively developed regional economies. Therefore,farmers were likely motivated by profit and were more likely to develop characteristicagriculture and commercial crops with higher economic benefits, such as vegetables or fishculture in paddy field [59]. Overall, the NGP area was not synchronous with the NGP ratein terms of spatial distribution at the provincial level. The NGP rate dropped graduallyfrom south to north, while the non-grain cultivated area showed two peaks at Shandongand Guangxi, weakening toward the surrounding area.
Sustainability 2021, 13, x FOR PEER REVIEW 9 of 19
Figure 3. Spatial distribution of NGP in 11 provinces along coastal China in 2018: (a) NGP area and (b) NGP rate.
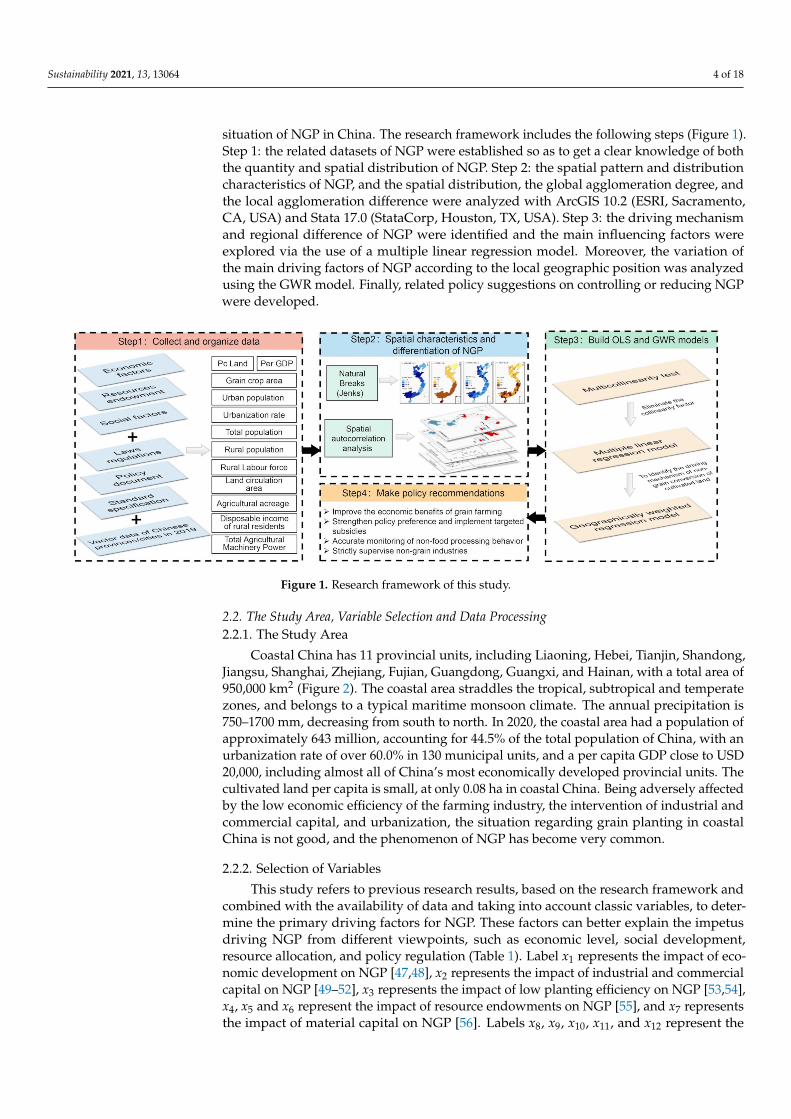
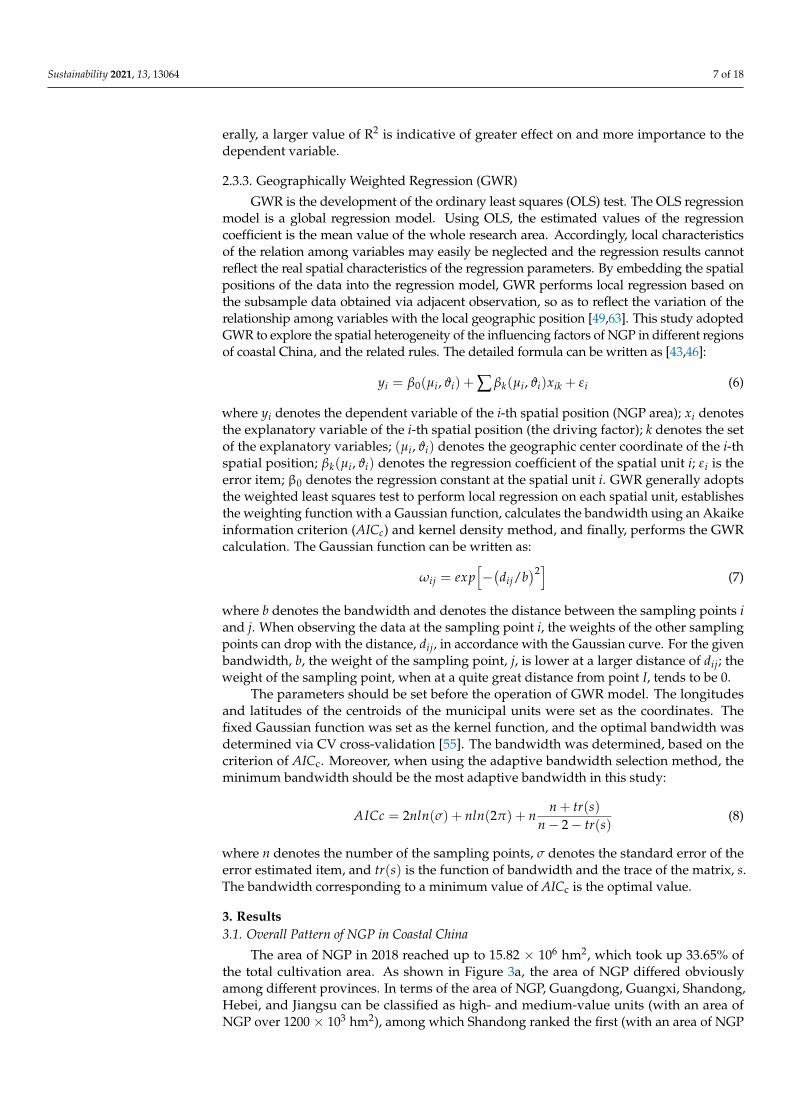
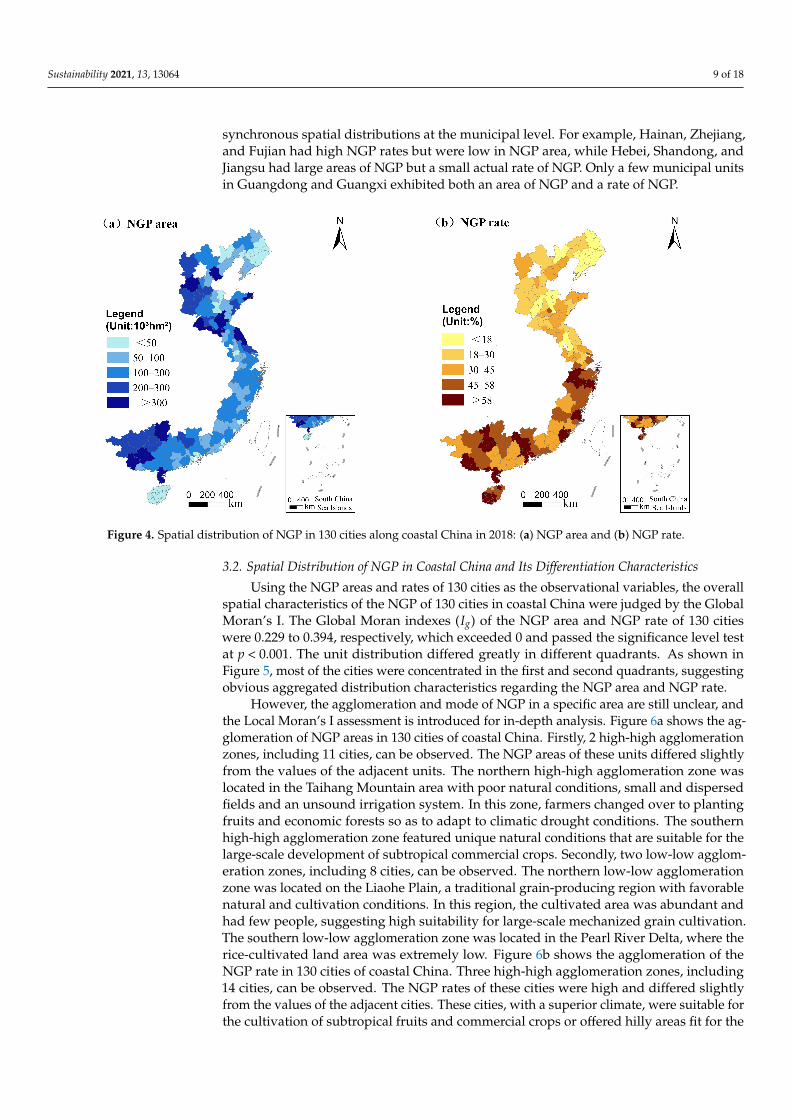
Both the area of NGP and the rate of NGP on a municipal scale showed different spatial patterns from the value at a provincial scale. Firstly, the area of NGP showed a dispersed distribution pattern with multiple centers. In terms of their NGP area, 11 cities can be classified as high-value cities, and are dispersed in Guangxi, Shandong and Liaoning. In total, 39 cities can be classified as low-value cities, which are relatively concentrated in eastern Liaoning, the coastal areas of Zhejiang and Fujian, the Pearl River Delta, and Hainan (Figure 4a). Secondly, the NGP rate also dropped from south to north, with greater spatial heterogeneity at a municipal level. The NGP rates of 31 municipal cities all exceeded 58%. These 31 municipal units, with NGP rates of over 58%, exhibited concentrated distribution in the vicinity of the East China Sea (Figure 4b). These units were mostly located in hilly areas, with small cultivation plots and per capita cultivation areas that were unfavorable for mechanized operation. In addition, favorable climatic conditions were suitable for the plantation of tropical and sub-tropical fruits. Overall, the NGP area and rate showed no synchronous spatial distributions at the municipal level. For example, Hainan, Zhejiang, and Fujian had high NGP rates but were low in NGP area, while Hebei, Shandong, and Jiangsu had large areas of NGP but a small actual rate of NGP. Only a few municipal units in Guangdong and Guangxi exhibited both an area of NGP and a rate of NGP.
Figure 3. Spatial distribution of NGP in 11 provinces along coastal China in 2018: (a) NGP area and (b) NGP rate.
Both the area of NGP and the rate of NGP on a municipal scale showed differentspatial patterns from the value at a provincial scale. Firstly, the area of NGP showed adispersed distribution pattern with multiple centers. In terms of their NGP area, 11 citiescan be classified as high-value cities, and are dispersed in Guangxi, Shandong and Liaoning.In total, 39 cities can be classified as low-value cities, which are relatively concentrated ineastern Liaoning, the coastal areas of Zhejiang and Fujian, the Pearl River Delta, and Hainan(Figure 4a). Secondly, the NGP rate also dropped from south to north, with greater spatialheterogeneity at a municipal level. The NGP rates of 31 municipal cities all exceeded 58%.These 31 municipal units, with NGP rates of over 58%, exhibited concentrated distributionin the vicinity of the East China Sea (Figure 4b). These units were mostly located in hillyareas, with small cultivation plots and per capita cultivation areas that were unfavorablefor mechanized operation. In addition, favorable climatic conditions were suitable for theplantation of tropical and sub-tropical fruits. Overall, the NGP area and rate showed no
Sustainability 2021, 13, 13064 9 of 18
synchronous spatial distributions at the municipal level. For example, Hainan, Zhejiang,and Fujian had high NGP rates but were low in NGP area, while Hebei, Shandong, andJiangsu had large areas of NGP but a small actual rate of NGP. Only a few municipal unitsin Guangdong and Guangxi exhibited both an area of NGP and a rate of NGP.
Sustainability 2021, 13, x FOR PEER REVIEW 10 of 19
Figure 4. Spatial distribution of NGP in 130 cities along coastal China in 2018: (a) NGP area and (b) NGP rate.
3.2. Spatial Distribution of NGP in Coastal China and Its Differentiation Characteristics Using the NGP areas and rates of 130 cities as the observational variables, the overall
spatial characteristics of the NGP of 130 cities in coastal China were judged by the Global Moran’s I. The Global Moran indexes (𝐼 ) of the NGP area and NGP rate of 130 cities were 0.229 to 0.394, respectively, which exceeded 0 and passed the significance level test at p < 0.001. The unit distribution differed greatly in different quadrants. As shown in Figure 5, most of the cities were concentrated in the first and second quadrants, suggesting obvious aggregated distribution characteristics regarding the NGP area and NGP rate.
Figure 5. Scatter diagram of the Global Moran’s I values of the NGP area and NGP rate of 130 cities in coastal China.
However, the agglomeration and mode of NGP in a specific area are still unclear, and the Local Moran’s I assessment is introduced for in-depth analysis. Figure 6a shows the agglomeration of NGP areas in 130 cities of coastal China. Firstly, 2 high-high agglomeration zones, including 11 cities, can be observed. The NGP areas of these units differed slightly from the values of the adjacent units. The northern high-high
Figure 4. Spatial distribution of NGP in 130 cities along coastal China in 2018: (a) NGP area and (b) NGP rate.
3.2. Spatial Distribution of NGP in Coastal China and Its Differentiation Characteristics
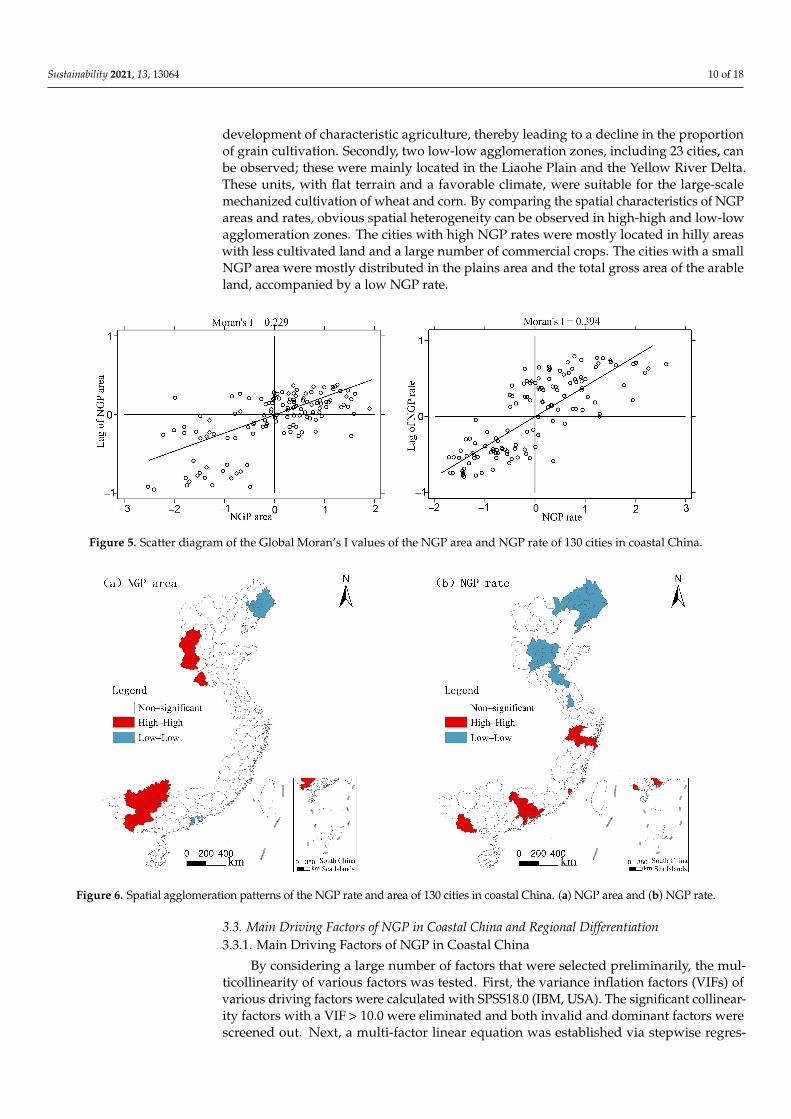
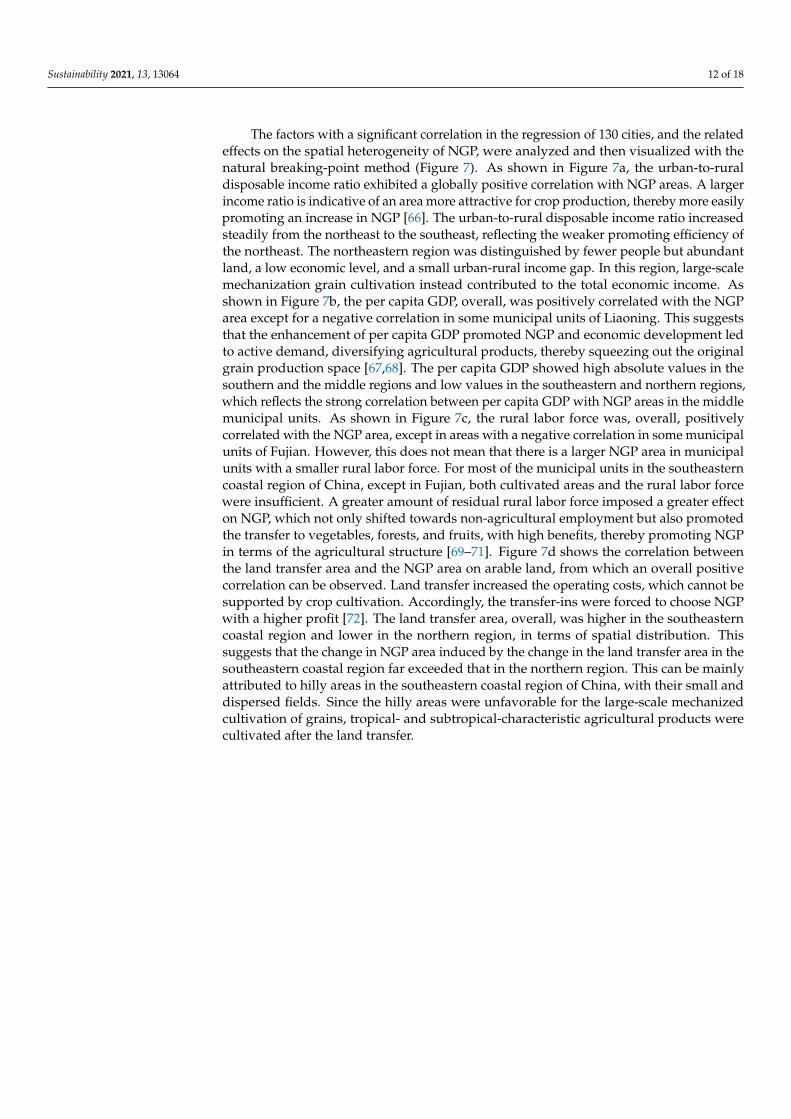
Using the NGP areas and rates of 130 cities as the observational variables, the overallspatial characteristics of the NGP of 130 cities in coastal China were judged by the GlobalMoran’s I. The Global Moran indexes (Ig) of the NGP area and NGP rate of 130 citieswere 0.229 to 0.394, respectively, which exceeded 0 and passed the significance level testat p < 0.001. The unit distribution differed greatly in different quadrants. As shown inFigure 5, most of the cities were concentrated in the first and second quadrants, suggestingobvious aggregated distribution characteristics regarding the NGP area and NGP rate.
However, the agglomeration and mode of NGP in a specific area are still unclear, andthe Local Moran’s I assessment is introduced for in-depth analysis. Figure 6a shows the ag-glomeration of NGP areas in 130 cities of coastal China. Firstly, 2 high-high agglomerationzones, including 11 cities, can be observed. The NGP areas of these units differed slightlyfrom the values of the adjacent units. The northern high-high agglomeration zone waslocated in the Taihang Mountain area with poor natural conditions, small and dispersedfields and an unsound irrigation system. In this zone, farmers changed over to plantingfruits and economic forests so as to adapt to climatic drought conditions. The southernhigh-high agglomeration zone featured unique natural conditions that are suitable for thelarge-scale development of subtropical commercial crops. Secondly, two low-low agglom-eration zones, including 8 cities, can be observed. The northern low-low agglomerationzone was located on the Liaohe Plain, a traditional grain-producing region with favorablenatural and cultivation conditions. In this region, the cultivated area was abundant andhad few people, suggesting high suitability for large-scale mechanized grain cultivation.The southern low-low agglomeration zone was located in the Pearl River Delta, where therice-cultivated land area was extremely low. Figure 6b shows the agglomeration of theNGP rate in 130 cities of coastal China. Three high-high agglomeration zones, including14 cities, can be observed. The NGP rates of these cities were high and differed slightlyfrom the values of the adjacent cities. These cities, with a superior climate, were suitable forthe cultivation of subtropical fruits and commercial crops or offered hilly areas fit for the
Sustainability 2021, 13, 13064 10 of 18
development of characteristic agriculture, thereby leading to a decline in the proportionof grain cultivation. Secondly, two low-low agglomeration zones, including 23 cities, canbe observed; these were mainly located in the Liaohe Plain and the Yellow River Delta.These units, with flat terrain and a favorable climate, were suitable for the large-scalemechanized cultivation of wheat and corn. By comparing the spatial characteristics of NGPareas and rates, obvious spatial heterogeneity can be observed in high-high and low-lowagglomeration zones. The cities with high NGP rates were mostly located in hilly areaswith less cultivated land and a large number of commercial crops. The cities with a smallNGP area were mostly distributed in the plains area and the total gross area of the arableland, accompanied by a low NGP rate.
Sustainability 2021, 13, x FOR PEER REVIEW 10 of 19
Figure 4. Spatial distribution of NGP in 130 cities along coastal China in 2018: (a) NGP area and (b) NGP rate.
3.2. Spatial Distribution of NGP in Coastal China and Its Differentiation Characteristics Using the NGP areas and rates of 130 cities as the observational variables, the overall
spatial characteristics of the NGP of 130 cities in coastal China were judged by the Global Moran’s I. The Global Moran indexes (𝐼 ) of the NGP area and NGP rate of 130 cities were 0.229 to 0.394, respectively, which exceeded 0 and passed the significance level test at p < 0.001. The unit distribution differed greatly in different quadrants. As shown in Figure 5, most of the cities were concentrated in the first and second quadrants, suggesting obvious aggregated distribution characteristics regarding the NGP area and NGP rate.
Figure 5. Scatter diagram of the Global Moran’s I values of the NGP area and NGP rate of 130 cities in coastal China.
However, the agglomeration and mode of NGP in a specific area are still unclear, and the Local Moran’s I assessment is introduced for in-depth analysis. Figure 6a shows the agglomeration of NGP areas in 130 cities of coastal China. Firstly, 2 high-high agglomeration zones, including 11 cities, can be observed. The NGP areas of these units differed slightly from the values of the adjacent units. The northern high-high
Figure 5. Scatter diagram of the Global Moran’s I values of the NGP area and NGP rate of 130 cities in coastal China.
Sustainability 2021, 13, x FOR PEER REVIEW 11 of 19
agglomeration zone was located in the Taihang Mountain area with poor natural conditions, small and dispersed fields and an unsound irrigation system. In this zone, farmers changed over to planting fruits and economic forests so as to adapt to climatic drought conditions. The southern high-high agglomeration zone featured unique natural conditions that are suitable for the large-scale development of subtropical commercial crops. Secondly, two low-low agglomeration zones, including 8 cities, can be observed. The northern low-low agglomeration zone was located on the Liaohe Plain, a traditional grain-producing region with favorable natural and cultivation conditions. In this region, the cultivated area was abundant and had few people, suggesting high suitability for large-scale mechanized grain cultivation. The southern low-low agglomeration zone was located in the Pearl River Delta, where the rice-cultivated land area was extremely low. Figure 6b shows the agglomeration of the NGP rate in 130 cities of coastal China. Three high-high agglomeration zones, including 14 cities, can be observed. The NGP rates of these cities were high and differed slightly from the values of the adjacent cities. These cities, with a superior climate, were suitable for the cultivation of subtropical fruits and commercial crops or offered hilly areas fit for the development of characteristic agriculture, thereby leading to a decline in the proportion of grain cultivation. Secondly, two low-low agglomeration zones, including 23 cities, can be observed; these were mainly located in the Liaohe Plain and the Yellow River Delta. These units, with flat terrain and a favorable climate, were suitable for the large-scale mechanized cultivation of wheat and corn. By comparing the spatial characteristics of NGP areas and rates, obvious spatial heterogeneity can be observed in high-high and low-low agglomeration zones. The cities with high NGP rates were mostly located in hilly areas with less cultivated land and a large number of commercial crops. The cities with a small NGP area were mostly distributed in the plains area and the total gross area of the arable land, accompanied by a low NGP rate.
Figure 6. Spatial agglomeration patterns of the NGP rate and area of 130 cities in coastal China.
3.3. Main Driving Factors of NGP in Coastal China and Regional Differentiation 3.3.1. Main Driving Factors of NGP in Coastal China
Figure 6. Spatial agglomeration patterns of the NGP rate and area of 130 cities in coastal China. (a) NGP area and (b) NGP rate.
3.3. Main Driving Factors of NGP in Coastal China and Regional Differentiation3.3.1. Main Driving Factors of NGP in Coastal China
By considering a large number of factors that were selected preliminarily, the mul-ticollinearity of various factors was tested. First, the variance inflation factors (VIFs) ofvarious driving factors were calculated with SPSS18.0 (IBM, USA). The significant collinear-ity factors with a VIF > 10.0 were eliminated and both invalid and dominant factors werescreened out. Next, a multi-factor linear equation was established via stepwise regres-

Sustainability 2021, 13, 13064 11 of 18
sion. It was found that the values of R2 in the direct fitting models between the NGParea/rate and various driving factors were all low, suggesting that there was no greatstatistical significance. Then, logarithmic transformation of the independent variables wasperformed. However, when performing fitting on the regression model of the NGP rate, theJarque-Bera test results were significant, suggesting that the residual cannot be describedby a normal distribution, i.e., the fitting was distorted [64]. Therefore, only the logarithmicmodel of the NGP area was considered.
The value of R2 of the regression model was 0.7149, suggesting favorable fitting results.The VIF values of various driving factors were all below 5.0, suggesting that there wereno redundant variables in the model and no multi-collinearity among various factors.Meanwhile, various factors were at a high significance level, and the value passed throughthe significance test at a level of 0.001. This indicates that the probabilities of the effectsof all dependent variables on independent variables equaled 0, i.e., the model showedstatistical significance. Finally, using Stata software, these driving factors were rankedin terms of importance. Table 2 lists the effects of various driving factors on the NGParea and the related importance degrees. In terms of the degree of relative importance:urban-to-rural disposable income ratio > per capita GDP > rural labor force > land transferarea > total agricultural machinery power > rural available foreign capital investment> urbanization rate. All the above factors except the urbanization rate were positivelycorrelated with the NGP area. The urban-to-rural disposable income ratio, per capita GDPand rural labor force were in positive correlation with the independent variables, at asignificance level of 1.0%.
Table 2. OLS-based model fitting results between the NGP area in coastal China and its driving factors.
ExplanatoryVariable Coefficient Standard
Errort Sig. F
Collinearity Statistics Importance-Based Rank
Tolerance VIF ContributionDegree Ranking
Interception 6.786 2.114 3.210 0.002 **x1 0.239 0.089 3.293 0.001 *** 0.326 1.767 0.182 2x2 0.248 0.492 1.569 0.077 * 0.189 5.295 0.069 6x3 0.373 0.092 4.643 0.000 *** 0.221 2.532 0.301 1x8 0.284 0.176 1.781 0.072 * 0.171 3.29 0.076 5x11 0.129 0.175 3.215 0.001 *** 0.302 3.267 0.172 3x12 −1.134 0.538 −2.107 0.035 ** 0.414 2.255 0.028 7x13 0.356 0.368 1.987 0.059 * 0.218 2.412 0.109 4
OLS diagnosis Joint F-value 0.0000 ***Joint Chi-square value 212.4581, 0.0000 ***
Note: ***, ** and * show the significance at a level of 1%, 5% and 10%, respectively; the same applies to Table 3, below.
Table 3. Comparison between OLS-based and GWR-based models regarding fitting performance.
Model AICc Goodness of Fit (R2) Adjusted Goodness of Fit (R2) p Value
OLS 222.326 0.714 0.704 0GWR 138.266 0.905 0.872 0
3.3.2. Spatial Heterogeneity of the Driving Factors of NGP in Coastal China
The average value of Ig of the NGP area of 130 cities was 0.229, which indicates anobvious spatial agglomeration of NGP areas in coastal China. Therefore, the effects ofvarious driving factors on the dependent variable space were analyzed via GWR. Thisstudy has adopted the opinion proposed by Brunsdon et al. [65]: if the value of the AICcin the GWR-based fitting results is lower than the value in the OLS-based regressionresults, GWR is more effective than OLR regression in regression fitting performance andapplicability. It can be observed from Table 3 that the GWR-based regression model showsa more ideal fitting performance.
Sustainability 2021, 13, 13064 12 of 18
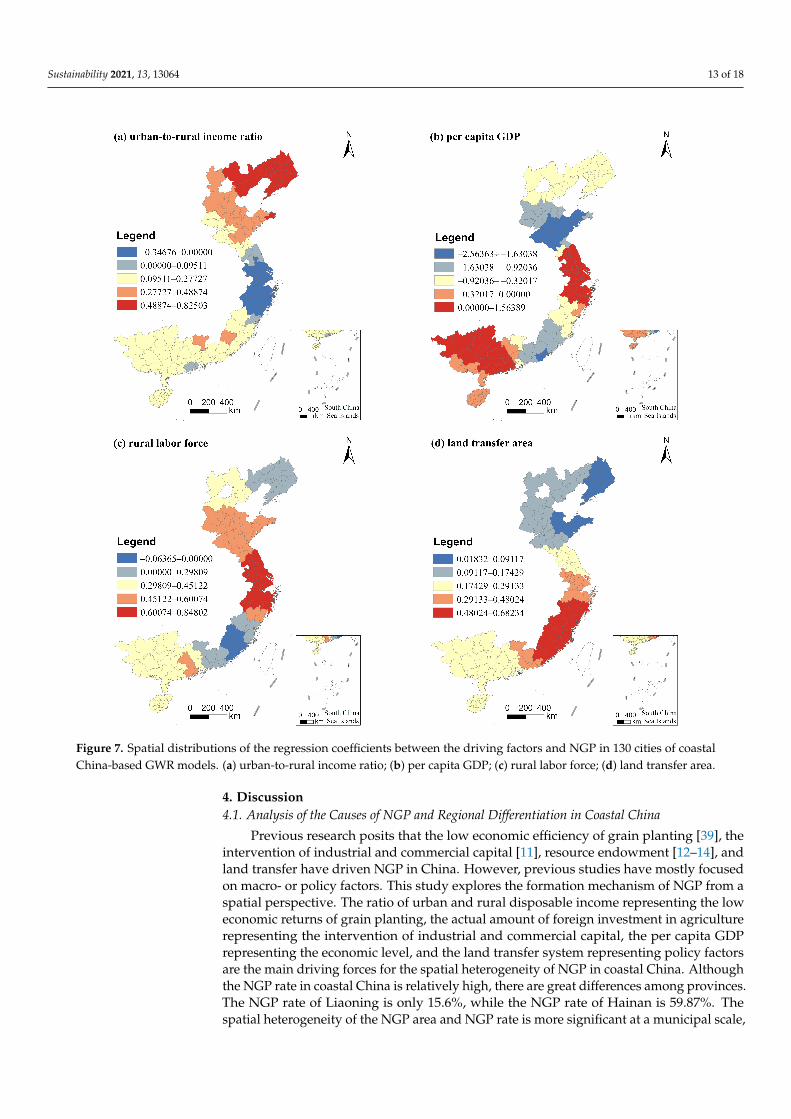
The factors with a significant correlation in the regression of 130 cities, and the relatedeffects on the spatial heterogeneity of NGP, were analyzed and then visualized with thenatural breaking-point method (Figure 7). As shown in Figure 7a, the urban-to-ruraldisposable income ratio exhibited a globally positive correlation with NGP areas. A largerincome ratio is indicative of an area more attractive for crop production, thereby more easilypromoting an increase in NGP [66]. The urban-to-rural disposable income ratio increasedsteadily from the northeast to the southeast, reflecting the weaker promoting efficiency ofthe northeast. The northeastern region was distinguished by fewer people but abundantland, a low economic level, and a small urban-rural income gap. In this region, large-scalemechanization grain cultivation instead contributed to the total economic income. Asshown in Figure 7b, the per capita GDP, overall, was positively correlated with the NGParea except for a negative correlation in some municipal units of Liaoning. This suggeststhat the enhancement of per capita GDP promoted NGP and economic development ledto active demand, diversifying agricultural products, thereby squeezing out the originalgrain production space [67,68]. The per capita GDP showed high absolute values in thesouthern and the middle regions and low values in the southeastern and northern regions,which reflects the strong correlation between per capita GDP with NGP areas in the middlemunicipal units. As shown in Figure 7c, the rural labor force was, overall, positivelycorrelated with the NGP area, except in areas with a negative correlation in some municipalunits of Fujian. However, this does not mean that there is a larger NGP area in municipalunits with a smaller rural labor force. For most of the municipal units in the southeasterncoastal region of China, except in Fujian, both cultivated areas and the rural labor forcewere insufficient. A greater amount of residual rural labor force imposed a greater effecton NGP, which not only shifted towards non-agricultural employment but also promotedthe transfer to vegetables, forests, and fruits, with high benefits, thereby promoting NGPin terms of the agricultural structure [69–71]. Figure 7d shows the correlation betweenthe land transfer area and the NGP area on arable land, from which an overall positivecorrelation can be observed. Land transfer increased the operating costs, which cannot besupported by crop cultivation. Accordingly, the transfer-ins were forced to choose NGPwith a higher profit [72]. The land transfer area, overall, was higher in the southeasterncoastal region and lower in the northern region, in terms of spatial distribution. Thissuggests that the change in NGP area induced by the change in the land transfer area in thesoutheastern coastal region far exceeded that in the northern region. This can be mainlyattributed to hilly areas in the southeastern coastal region of China, with their small anddispersed fields. Since the hilly areas were unfavorable for the large-scale mechanizedcultivation of grains, tropical- and subtropical-characteristic agricultural products werecultivated after the land transfer.
Sustainability 2021, 13, 13064 13 of 18Sustainability 2021, 13, x FOR PEER REVIEW 14 of 19
Figure 7. Spatial distributions of the regression coefficients between the driving factors and NGP in 130 cities of coastal China-based GWR models. (a) urban-to-rural income ratio; (b) per capita GDP; (c) rural labor force; (d) land transfer area.
4. Discussion 4.1. Analysis of the Causes of NGP and Regional Differentiation in Coastal China
Previous research posits that the low economic efficiency of grain planting [39], the intervention of industrial and commercial capital [11], resource endowment [12–14], and land transfer have driven NGP in China. However, previous studies have mostly focused on macro- or policy factors. This study explores the formation mechanism of NGP from a spatial perspective. The ratio of urban and rural disposable income representing the low economic returns of grain planting, the actual amount of foreign investment in agriculture representing the intervention of industrial and commercial capital, the per capita GDP representing the economic level, and the land transfer system representing policy factors are the main driving forces for the spatial heterogeneity of NGP in coastal China. Although the NGP rate in coastal China is relatively high, there are great differences among provinces. The NGP rate of Liaoning is only 15.6%, while the NGP rate of Hainan is 59.87%. The spatial heterogeneity of the NGP area and NGP rate is more significant at
Figure 7. Spatial distributions of the regression coefficients between the driving factors and NGP in 130 cities of coastalChina-based GWR models. (a) urban-to-rural income ratio; (b) per capita GDP; (c) rural labor force; (d) land transfer area.
4. Discussion4.1. Analysis of the Causes of NGP and Regional Differentiation in Coastal China
Previous research posits that the low economic efficiency of grain planting [39], theintervention of industrial and commercial capital [11], resource endowment [12–14], andland transfer have driven NGP in China. However, previous studies have mostly focusedon macro- or policy factors. This study explores the formation mechanism of NGP from aspatial perspective. The ratio of urban and rural disposable income representing the loweconomic returns of grain planting, the actual amount of foreign investment in agriculturerepresenting the intervention of industrial and commercial capital, the per capita GDPrepresenting the economic level, and the land transfer system representing policy factorsare the main driving forces for the spatial heterogeneity of NGP in coastal China. Althoughthe NGP rate in coastal China is relatively high, there are great differences among provinces.The NGP rate of Liaoning is only 15.6%, while the NGP rate of Hainan is 59.87%. Thespatial heterogeneity of the NGP area and NGP rate is more significant at a municipal scale,
Sustainability 2021, 13, 13064 14 of 18
which is mainly attributable to differences in the economic, social, policy and resourceendowments of each unit. The regression coefficients of the influencing factors based onthe GWR model, as shown in Figure 7, revealed the effects of various driving factors ofNGP to varying degrees in different cities of coastal China.
In addition, Hainan, Guangdong, Guangxi and Fujian are located in tropical andsubtropical zones, with quite favorable climatological conditions for the plantation ofagricultural products and fruits, thereby resulting in a more widespread NGP phenomenon.Taking Hainan as an example, its regional climate is still over 20 ◦C when most of theregions of China are in the middle of a cold winter. Accordingly, Hainan is the most suitablecandidate as China’s vegetable-production base. Moreover, a stable production-logistics-sales network has been established for some time. Meanwhile, NGP is quite ubiquitous insome hilly areas, which can be regarded as the result of inconvenient traffic flow, low-costland transfer, and a lack of effective supervision of land use control. Zhu et al. foundthat convenient transportation links led to the high cost of land conversion, while the useof agricultural machinery and rising energy prices resulted in a greater cost of farming;the combined action of the above two factors caused a decline in the economic benefitsof the planting industry [23]. For some villages and towns, both land transfer costs andagricultural labor costs are low because of relatively inconvenient transportation, whichmay instead increase the planting yield and promote a higher land transfer rate, meanwhileenhancing the probability of NGP on arable land. The conclusion also supports the presentresearch results.
4.2. The Potential Impact of NGP on China’s Food Security
Coastal China is the most economically developed area of the country. The industrialand commercial capital in this area is constraining agriculture and rural areas, and theproportion of land transfer area to the total cultivated area is much higher than the nationalaverage level [73]. Thus, its NGP rate is as high as 33.65%. For example, in Shanghai, themain types of NGP are vegetables and sightseeing agriculture. This is related to Shanghai’sspecial status as the economic center of China, and agriculture is completely subordinateto urban development. The NGP rate in this study area is higher than the mean value ofChina (27.0%) [39], and significantly exceeded the values of traditional grain-producingareas [59]. However, this is compatible with the level of economic development in coastalChina. In fact, China’s cultivated land per capita is only 0.09 ha. [74]. In order to meetthe demand for rice, wheat and corn, approximately 118 million ha. of cultivated land isrequired, which accounts for 90.0% of the total cultivated land in China [75]. The NGP incoastal China is much higher than 10.0%. Therefore, coastal China has become the mostimportant area in terms of diversified agricultural products and food imports [76].
Planting diversity may have a positive effect on the ecological environment, especiallysmall-scale afforestation [77–79]. However, the purpose of the farmers’ adoption of NGPin China has nothing to do with maintaining the sustainability of the agricultural spatialpattern and structure. The NGP behavior is divided into economic incentives (such aslucrative planting) and policy incentives (such as abandonment and afforestation) in China.The NGP in China is completely different from planting diversification in some developingcountries of South Asia and Africa, which is intended more for diversifying natural risksand using land resources efficiently. Some NGP behaviors have harmed the soil fertility ofcultivated land, such as the abandonment of farming and afforestation. In addition, diggingponds to farm fish has directly destroyed the fertile layer. Therefore, the government’sbanning of NGP is intended for long-term food security in China.
4.3. How to Effectively Control NGP in Coastal China
According to the causes behind NGP, we should proceed, bearing in mind the fol-lowing aspects, to effectively control NGP and ensure national food security. (1) Theunmonitored spread of NGP should be controlled and given a scientifically set bottomline. The diversified demands of agricultural products determine the inevitable trend
Sustainability 2021, 13, 13064 15 of 18
of NGP. China’s government should take into account multiple requirements, includingfuture grain demand, natural conditions, ecological protection, and rural revitalization.This kind of assessment should carefully measure the minimum requirements of varioustypes of food and agricultural products from top to bottom, and scientifically set thebottom line of NGP. (2) The external pressure on grain-growing should be reduced andthe government should increase farmers’ willingness to continue grain-growing. China’sgovernment should optimize the regional allocation of agricultural resources, increaseinvestment in agricultural infrastructure, and make high-standard basic farmland. Then,current agricultural subsidy policies should be revised and the traditional subsidy policyaccording to cultivated area should be abandoned. The agricultural subsidies only provideincentives for grain growers. Meanwhile, the subsidies for NGP should be reduced orcanceled, so as to enhance the grain cultivation initiative and remedy the low economicbenefits to grain cultivation. (3) The local government should normalize land transferbehaviors, especially the involvement of industrial and commercial capital, preventingfree-riding or touching-ball behaviors. Agricultural and natural resource managementdepartments should implement the full supervision of cultivated land that is transferredand should severely punish unauthorized changes of cultivated land use or the destruc-tion of cultivated land, in accordance with the law, and thoroughly curb NGP caused byland transfer.
In addition, based on various statistical data, this study attempted to determine the ex-planatory contributions of various factors on NGP behaviors in coastal China and establishspatial heterogeneity with the related model. However, the change of NGP on cultivatedland is as a result of the combined action of various factors, which should be describedin terms of a complex nonlinear relationship rather than a simple positive or negativecorrelation. Only relying on a particular model may cause deviation in the knowledge ofNGP, and the changing processes, the environmental effects, and the mechanism of NGPshould be further explored in future studies [73,76,80,81].
5. Conclusions
Food security is seriously threatened by NGP in coastal China. This study takes13 provinces and 130 cities in coastal China as research objects and explores the spatialpatterns and distinguishing characteristics of NGP, as recorded in 2018. The results areas follows. (1) The NGP area in coastal China in 2018 reached up to 15.82 × 10⁶ hm2,occupying 33.65% of the total cultivation area. Nearly one-third of the cultivated landhas already been occupied by NGP. (2) The NGP area and rate in coastal China showeddifferent spatial agglomeration characteristics. Overall, the NGP rate dropped graduallyfrom south to north, but had two peaks at Shandong and Guangxi and then weakenedtoward the surrounding area. (3) The low economic benefit of crop production (the ratio ofper capita GDP to urban and rural disposable income) is the most significant driving forceof NGP on arable land in coastal China. The social factor (the amount of rural labor force)and the policy factor (land transfer area) are the main driving factors that accounted for thedifferentiation in the spatial distribution pattern of NGP. However, the driving factors hadan obvious spatial heterogeneity.
Author Contributions: Conceptualization, F.C.; data curation, X.G. and J.L.; funding acquisition,F.C.; investigation, J.L. and Y.C.; methodology, J.L. and Y.C.; project administration, F.C.; software,X.G. and Y.S.; supervision, F.C.; visualization, G.-J.L.; writing—original draft, Y.S. and Y.C.; writing—review and editing, G.-J.L. and F.C. All authors have read and agreed to the published version ofthe manuscript.
Funding: This work was supported by the Key Projects in the National Science and Technology PillarProgram during the Twelfth Five-year Plan Period (2015BAD06B02). In addition, the authors wouldlike to thank the Institute of Land Surveying and Planning of Jiangsu for their support during theresearch. There is no conflict of interest in this manuscript.
Institutional Review Board Statement: Not applicable.

Sustainability 2021, 13, 13064 16 of 18
Informed Consent Statement: Not applicable.
Data Availability Statement: Not applicable.
Acknowledgments: The authors would like to thank MDPI English Service for providing linguisticassistance during the preparation of this manuscript.
Conflicts of Interest: The authors declare no conflict of interest.
References1. Chen, F.; Liu, J.N.; Chang, Y.Y.; Zhang, Q.; Yu, H.C.; Zhang, S.L. Spatial pattern differentiation of cultivated land non-grain
conversion and its driving factors in china. China Land Sci. 2021, 35, 35–45.2. Zhou, Y.; Li, X.H.; Liu, Y.S. Land use change and driving factors in rural China during the period 1995–2015. Land Use Policy 2020,
99, 105048. [CrossRef]3. Liu, Y.S.; Li, Y.H. Revitalize the world’s countryside. Nature 2017, 548, 275–277. [CrossRef] [PubMed]4. Li, C.; Wang, W.; Li, W.C. Effect of non-grain utilization on cultivated land quality. China Land 2021, 3, 17–19.5. Zhang, L.X.; Song, B.; Chen, B. Emergy-based analysis of four farming systems: Insight into agricultural diversification in rural
China. J. Clean. Prod. 2012, 28, 33–44. [CrossRef]6. Prishchepov, A.V.; Müller, D.; Dubinin, M.; Baumann, M.; Radeloff, V.C. Determinants of agricultural land abandonment in
post-Soviet European Russia. Land Use Policy 2013, 30, 873–884. [CrossRef]7. Su, Y.; Li, C.L.; Wang, K.; Deng, J.S.; Shahtahmassebi, A.R.; Zhang, L.P.; Ao, W.J.; Guan, T.; Pan, Y.; Gan, M.Y. Quantifying the
spatiotemporal dynamics and multi-aspect performance of NGP during 2000–2015 at a fine scale. Ecol. Indic. 2019, 101, 410–419.[CrossRef]
8. Van Vliet, J.; de Groot, H.L.F.; Rietveld, P.; Verburg, P.H. Manifestations and underlying drivers of agricultural land use change inEurope. Landsc. Urban Plan. 2015, 133, 24–36. [CrossRef]
9. Zhong, T.Y.; Zhu, Q.; Huang, X.J.; Zhao, Y.T.; Zhou, Y.; Zhao, Z.H. Impact of the top-down quota-oriented farmland preservationplanning on the change of urban land-use intensity in China. Habitat Int. 2018, 77, 71–79. [CrossRef]
10. Armsworth, P.R.; Daily, G.C.; Kareiva, P. Land market feedbacks can undermine biodiversity conservation. Proc. Natl. Acad. Sci.USA 2006, 103, 5403–5408. [CrossRef]
11. Lewis, D.J.; Wu, P.J. Targeting incentives to reduce habitat fragmentation. Am. J. Agric. Econ. 2010, 91, 1080–1096. [CrossRef]12. Xu, G.; Huang, X.; Zhong, T.; Yi, C.; Jin, Y. Assessment on the effect of city arable land protection under the implementation of
China’s National General Land Use Plan (2006–2020). Habitat Int. 2015, 49, 466–473. [CrossRef]13. Wu, Y.; Zhang, X.; Skitmore, M.; Song, Y.; Hui, E.C. Industrial land price and its impact on urban growth: A Chinese case study.
Land Use Policy 2014, 36, 199–209. [CrossRef]14. Lyle, G.; Bryan, B.A.; Ostendorf, B. Identifying the spatial and temporal variability of economic opportunity costs to promote
the adoption of alternative land uses in grain growing agricultural areas: An Australian example. J. Environ. Manag. 2015, 155,123–135. [CrossRef] [PubMed]
15. Li, H.; Wu, Y.; Huang, X.; Sloan, M.; Skitmore, M. Spatial-temporal evolution and classification of marginalization of cultivatedland in the process of urbanization. Habitat Int. 2017, 61, 1–8. [CrossRef]
16. Chaifetz, A.; Jagger, P. 40 Years of dialogue on food sovereignty: A review and a look ahead. Glob. Food Secur. 2014, 3, 85–91.[CrossRef]
17. Zambon, I.; Serra, P.; Salvia, R. Fallow land, recession and Socio-Demographic local contexts: Recent dynamics in a mediterraneanurban fringe. Agriculture 2018, 8, 159. [CrossRef]
18. Zhu, G.F.; Li, X.C.; Shi, Y.R.; Zhang, Y.; Li, Z.Y. Comparison of crop rotation and land fallow between China and foreign countriesand it’s policy implications. Chin. J. Agric. Resour. Reg. Plan. 2018, 39, 35–41.
19. Han, H.Y.; Lin, H. Patterns of agricultural diversification in China and its policy implications for agricultural modernization.Int. J. Environ. Res. Public Health 2021, 18, 4978. [CrossRef]
20. Barnes, A.P.; Hansson, H.; Manevska-Tasevska, G. The influence of diversification on long-term viability of the agricultural sector.Land Use Policy 2015, 49, 404–412. [CrossRef]
21. Angelo, C. Brazil’s fund for low-carbon agriculture lies fallow. Nature 2012. [CrossRef]22. Kong, X.B. Cultivated land “Non-grain” problem, cause and countermeasure. China Land 2020, 11, 17–19. (In Chinese)23. Zhu, H.Z. A review of the research on non-grain conversion of farmland transfer and its impact on food security. Econ. Manag. J.
2016, 17, 82–84.24. Zhu, D.; Gao, Y. An analysis of farmers’s declining will to produce grains and recession of grain producing-a survey of 346
households in 32 villages from Fujian, Jiangxi, Hubei and Zhejiang province. J. Jimei Univ. (Philos. Soc. Sci.) 2013, 16, 41–48.25. Deng, X.Z.; Huang, J.K.; Rozelle, S.; Zhang, J.P.; Li, Z.H. Impact of urbanization on cultivated land changes in China. Land Use
Policy 2015, 45, 1–7. [CrossRef]26. Seto, K.C.; Kaufmann, R.K.; Woodcock, C.E. Landsat reveals China’s farmland reserves, but they’re vanishing fast. Nature 2000,
406, 121. [CrossRef]27. Liao, F.Z.; Liao, J.Y.; Yang, C. Research on the problems and countermeasures of “Non-grain” in farmland transfer. Trib. Study
2015, 31, 37–40.
Sustainability 2021, 13, 13064 17 of 18
28. Zhou, Y.L.; Song, Y.Q. Causes and solving measures of non-food during the process of farmland circulation: From the perspectiveof national food security. Guangdong Agric. Sci. 2016, 43, 189–192.
29. Xiao, J.Z.; Zhao, X.J.; Ye, Y. Analysis of temporal and spatial evolution and influence factors of cultivated land in Pearl River Deltabased on GIS. In IOP Conference Series: Earth and Environmental Science, Changsha, China, 18–20 September 2020; IOP Publishing:Bristol, UK, 2020; Volume 615, p. 012042.
30. Qiu, L.F.; Zhu, J.X.; Pan, Y.; Wu, S.H.; Dang, Y.X.; Xu, B.G.; Yang, H. The positive impacts of landscape fragmentation on thediversification of agricultural production in Zhejiang province, China. J. Clean. Prod. 2020, 251, 119722. [CrossRef]
31. Huang, W.; Yu, Z.X. Current Situations and Recommendations for Non-grain Tendency of Farmland in Anhui Province. AsianAgric. Res. 2016, 4, 50–57.
32. Chen, S.; Zeng, F.; Liu, H.; Xu, H. Factors affecting farmers’ willingness to grow grain in key grain-producing areas: Based on theinvestigation of 475 rural households of Hunan Province. J. Hum. Agric. Univ. (Soc. Sci.) 2012, 13, 29–35.
33. Tang, J. Empirical analysis on influencing factors of peasant households’ willingness to grow crops-the survey data of 520 peasanthouseholds from Shanxi province. J. Jiangxi Agric. Univ. 2013, 12, 438–444.
34. Gu, L. An analysis on influencing factors of farmers’ willingness to produce grains in major grain producing areas. J. JiangsuAgric. Sci. 2013, 41, 405–407.
35. Lang, W.; Long, Y.; Chen, T.T. Rediscovering Chinese cities through the lens of land-use patterns. Land Use Policy 2018, 79, 362–374.[CrossRef]
36. Stampini, M.; Davis, B. Does nonagricultural labor relax farmers’ credit constraints? Evidence from longitudinal data for Vietnam.Agric. Econ. 2009, 40, 177–188. [CrossRef]
37. Wang, Q.Z.; Guan, Q.Y.; Lin, J.K.; Luo, H.P.; Tan, Z.; Ma, Y.R. Simulating land use/land cover change in an arid region with thecoupling models. Ecol. Indic. 2021, 122, 107231. [CrossRef]
38. Bekele, A.E.; Drabik, D.; Dries, L.; Heijman, W. Large-scale land investments, household displacement, and the effect on landdegradation in semiarid agro-pastoral areas of Ethiopia. Land Degrad. Dev. 2021, 32, 777–791. [CrossRef]
39. Yang, R.Z.; Chen, Y.J.; Yi, X.Y.; Fang, L.N. The causes and countermeasures on the excessive “Non-grain” tendency in the processof land transfer. Chin. J. Agric. Resour. Reg. Plan. 2012, 33, 14–17.
40. Zhang, W.; Jin, W. In Some Areas, only 6% of the Land Leased to Grow Grain Was Used. National Business Daily. 2013. Availableonline: http://www.nbd.com.cn/articles/2013-12-24/797403.html (accessed on 22 November 2021).
41. Widowaty, Y.; Artanto, I.O. Protection of Agricultural Land Sustainable Food for the Realization of Food Security in the Special Region ofYogyakarta; Atlantis Press: Paris, France, 2018; pp. 36–41.
42. Maryati, S.; Humaira, A.N.S.; Pratiwi, F. Spatial Pattern of Agricultural Land Conversion in West Java Province. Earth Environ.Sci. 2018, 131, 012034. [CrossRef]
43. Ziegler, A.D.; Fox, J.M.; Xu, J. Agriculture. The rubber juggernaut. Science 2009, 324, 1024–1025. [CrossRef]44. Rui, X.; Su, S.; Mai, G.; Zhang, Z.; Yang, C. Quantifying determinants of cash crop expansion and their relative effects using
logistic regression modeling and variance partitioning. Int. J. Appl. Earth Obs. Geoinf. 2015, 34, 258–263.45. Li, M.H. Research on non-grainization of cultivated land in grain-producing country in Henan province under new situation.
Research Institute of Management Science and Industrial Engineering. In Proceedings of the 2017 4th International Conference onEducation, Management and Computing Technology, Hangzhou, China, 15–16 April 2017; Chu, X., Ed.; Volume 101, pp. 953–957.
46. Baumann, M.; Kuemmerle, T.; Elbakidze, M.; Ozdogan, M.; Radeloff, V.C.; Keuler, N.S.; Prishchepov, A.V.; Kruhlov, I.; Hostert, P.Patterns and drivers of post-socialist farmland abandonment in Western Ukraine. Land Use Policy 2011, 28, 552–562. [CrossRef]
47. Yao, X.W.; Zeng, J.; Li, W.J. Spatial correlation characteristics of urbanization and land ecosystem service value in Wuhan UrbanAgglomeration. Trans. Chin. Soc. Agric. Eng. 2015, 31, 249–256.
48. Anuja, A.R.; Kumar, A.; Saroj, S. The impact of crop diversification towards high-value crops on economic welfare of agriculturalhouseholds in eastern India. Curr. Sci. 2020, 118, 1575–1582. [CrossRef]
49. Geng, T.W.; Chen, H.; Zhang, H.; Shi, Q.Q.; Liu, D. Spatiotemporal evolution of land ecosystem service value and its influencingfactors in Shaanxi province based on GWR. J. Nat. Resour. 2020, 35, 1714–1727.
50. Ma, Y.; Tong, Y.; Ren, J.; Liu, J. Spatial-temporal pattern and driving factors of public participation in environmental regulation:Taking the Yangtze River economic belt as an example. Chin. Geogr. Sci. 2018, 38, 1799–1808.
51. Chen, M.; Xiao, H.; He, W.; Deng, A. Empirical analysis on the influencing factors of farm household’s behavior in landtransfer-investigation on the circulation of farmland of 1396 households in Jiangxi province. J. Nat. Resour. 2008, 23, 369–374.
52. Zhao, X.; Zheng, Y.; Huang, X. The effect of urbanization and farmland transfer on the spatial patterns of non-grain farmland inChina. Sustainability 2017, 9, 1438. [CrossRef]
53. Pan, J.H.; Zhang, J.H.; Hu, Y.X. Spatial-temporal pattern of per capital grain possession and its driving forces in Gansu Province.J. Nat. Resour. 2016, 31, 124–134.
54. Su, B.; Li, Y.; Li, L. How does nonfarm employment stability influence farmers’ farmland transfer decisions? Implications forChina’s land use policy. Land Use Policy 2018, 74, 66–72. [CrossRef]
55. Camacho-Valdez, V.; Ruiz-Luna, A.; Ghermandi, A.; Nunes, P.A.L.D. Valuation of ecosystem services provided by coastalwetlands in northwest Mexico. Ocean Coast. Manag. 2013, 2, 17. [CrossRef]
56. Su, S.; Xiao, R.; Li, D. Impacts of transportation routes on landscape diversity: A comparison of different route types and theircombined effects. Environ. Manag. 2014, 53, 636–647. [CrossRef]
Sustainability 2021, 13, 13064 18 of 18
57. Yang, Q.; Zhang, D.J. The influence of agricultural industrial policy on non-grain production of cultivated land: A case study ofthe “one village, one product” strategy implemented in Guanzhong Plain of China. Land Use Policy. 2021, 108, 105579. [CrossRef]
58. Kogo, B.K.; Kumar, L.; Koech, R. Analysis of spatio-temporal dynamics of land use and cover changes in Western Kenya. GeocartoInt. 2021, 36, 376–391. [CrossRef]
59. Chang, Y.Y.; Liu, J.N.; Zhang, Q.; Yu, H.C.; Bian, Z.F.; Chen, F. Spatial pattern differentiation of cultivated land non-grainconversion in major grain-producing areas. J. Agric. Resour. Environ. 2021, 7, 337.
60. Brunsdon, C.; Fotheringham, S.; Charlton, M. Geographically Weighted Regression. J. R. Stat. Soc. Ser. A 1998, 47, 431–443.[CrossRef]
61. Li, J.; Zhou, K.; Dong, H.; Xie, B. Cultivated land change, driving forces and its impact on landscape pattern changes in theDongting Lake Basin. Int. J. Environ. Res. Public Health 2020, 17, 7988. [CrossRef]
62. Hu, Y. An analysis of land-use and land-cover change in the Zhujiang–Xijiang Economic Belt, China, from 1990 to 2017. Appl. Sci.2018, 8, 1524. [CrossRef]
63. Dadashpoor, H.; Azizi, P.; Moghadasi, M. Land use change, urbanization, and change in landscape pattern in a metropolitan area.Sci. Total Environ. 2019, 655, 707–719. [CrossRef]
64. Song, W.; Liu, M.L. Farmland Conversion decreases regional and national land quality in China. Land Degrad. Dev. 2017, 28,459–471. [CrossRef]
65. Xiao, D.Q.; Xu, X.C.; Duan, L.; Lee, J.Y. Spatial-temporal analysis of injury severity with Geographically Weighted Panel LogisticRegression Model. J. Adv. Transport. 2019, 8, 8521649. [CrossRef]
66. Meraner, M.; Polling, B.; Finger, R. Diversification in peri-urban agriculture: A case study in the Ruhr metropolitan region. J. LandUse Sci. 2018, 13, 284–300. [CrossRef]
67. Lu, C.X.; Liu, A.M.; Xiao, Y.; Liu, X.J.; Xie, G.D.; Cheng, S.K. Changes in China’s grain production pattern and the effects ofurbanization and dietary structure. J. Resour. Ecol. 2020, 11, 358–365.
68. Li, W.B.; Wang, D.Y.; Liu, S.H.; Zhu, Y.L. Measuring urbanization-occupation and internal conversion of peri-urban cultivatedland to determine changes in the peri-urban agriculture of the black soil region. Ecol. Indic. 2019, 102, 328–337. [CrossRef]
69. Xiao, L.Q.; Chen, W.; Wu, Q.; MA, S.H. Impact of cultivated land quantity change on grain productive capacity of Yangtze RiverDelta in the next 10 years-from the perspective of cultivated land quality grade. J. Nat. Resour. 2012, 27, 565–576.
70. Leng, Z.H.; Wang, Y.N.; Hou, X.S. Structural and efficiency effects of land transfers on food planting: A comparative perspectiveon north and south of China. Sustainability 2021, 13, 3327. [CrossRef]
71. Wang, J.Y.; Xin, L.J.; Wang, Y.H. How farmers’ non-agricultural employment affects rural land circulation in China? J. Geogr. Sci.2020, 30, 378–400. [CrossRef]
72. Li, S.; Nadolnyak, D.; Hartarska, V. Agricultural land conversion: Impacts of economic and natural risk factors in a coastal area.Land Use Policy 2019, 80, 380–390. [CrossRef]
73. Long, H.; Qu, Y. Land use transitions and land management: A mutual feedback perspective. Land Use Policy 2018, 74, 111–120.[CrossRef]
74. Chen, F.; Yu, M.; Zhu, F.W.; Shen, C.Y.; Zhang, S.L.; Yang, Y.J. Rethinking rural transformation caused by comprehensive landconsolidation: Insight from program of whole village restructuring in Jiangsu province, China. Sustainability 2018, 10, 2029.[CrossRef]
75. Yu, H.C.; Zeng, S.Y.; Wang, Q.B.; Dai, J.; Bian, Z.F.; Chen, F. Forecast on China’s cultivated land protection baseline in the new eraby multi-scenario simulations. Res. Sci. 2021, 43, 1222–1233.
76. Liang, X.; Jin, X.; Sun, R.; Bo, H.; Liu, J.; Zhou, Y. A typical phenomenon of cultivated land use in China’s economically developedareas: Anti-intensification in Jiangsu Province. Land Use Policy 2021, 102, 105223. [CrossRef]
77. Wen, Z.; Zheng, H.; Zhao, H.; Ouyang, Z.Y. The mediatory roles of species diversity and tree height diversity for linking theimpact of land tensity on soil erosion. Land Degrad. Dev. 2020, 32, 1127–1134. [CrossRef]
78. Hautier, Y.; Isbell, F.; Borer, E.T.; Seabloom, E.W. Local loss and spatial homogenization of plant diversity reduce ecosystemmultifunctionality. Nat. Ecol. Evol. 2018, 2, 50–56. [CrossRef] [PubMed]
79. Xie, H.; Wang, G.G.; Yu, M. Ecosystem multifunctionality is highly related to the shelterbelt structure and plant species diversityin mixed shelterbelts of eastern China. Glob. Ecol. Conserv. 2018, 16, e00470. [CrossRef]
80. Koch, J.; Schaldach, R.; Göpel, J. Can agricultural intensification help to conserve biodiversity? A scenario study for the Africancontinent. J. Environ. Manag. 2019, 247, 29–37. [CrossRef]
81. Zabel, F.; Delzeit, R.; Schneider, J.M.; Seppelt, R.; Mauser, W.; Václavík, T. Global impacts of future cropland expansion andintensification on agricultural markets and biodiversity. Nat. Commun. 2019, 10, 2844. [CrossRef]