Natural antibodies of cod ( Gadus morhua L.): Specificity, activity and affinity
Upload
khangminh22Category
view
0download
0
University of California, San Diego
RNA Affinity and Specificity of ModifiedAminoglycosides, Metal Complexes, and IntercalatingAgents That Target the HIV-1 Rev Response Element
A dissertation submitted in partial satisfaction of the
requirements for the degree
Doctor of Philosophy
in Chemistry
by
Nathan W. Luedtke
Committee in charge:
Professor Yitzhak Tor, ChairProfessor Murray GoodmanProfessor Simpson JosephProfessor Roger TsienProfessor Flossie Wong-Staal
2003

ii
Copyright
by
Nathan W. Luedtke, 2003All rights reserved

iii
The dissertation of Nathan W. Luedtke is approved,and is acceptable in quality and form
for publication.
University of California, San Diego
2003

iv
Dedicated to Ross Cortese, Charles Liu, and Heidi Thomsen

Table of Contents
Signature Page.................................................................................................iii
Dedication........................................................................................................ iv
Table of Contents ............................................................................................. v
List of Figures ..................................................................................................vii
List of Tables ..................................................................................................xiii
List of Abbreviations ........................................................................................xv
Acknowledgments...........................................................................................xvi
Vita & Publications......................................................................................... xvii
Abstract ...........................................................................................................xx
1.0 Introduction ............................................................................................ 1
1.1 Translation ..................................................................................... 2
1.2 RNA Viruses .................................................................................. 3
1.3 Small Molecules That Modulate RNA Activity ................................ 4
1.4 Magnesium (II) ............................................................................... 5
1.5 Aminoglycosides............................................................................ 7
1.6 Ligand Specificity ......................................................................... 10
1.7 Goals ........................................................................................... 11
2.0 Background: The HIV Lifecycle ............................................................. 13
2.1 The Rev-RRE Interaction and HIV's Late Replication Phase...... 14
2.2 Minimized RRE Constructs ......................................................... 18
2.3 Other RNA Constructs ................................................................ 19
v

vi
3.0 Methods for Measuring RNA-Ligand Affinity and Specificity ................. 24
3.1 Fluorescence Polarization Anisotropy......................................... 24
3.2 Solid-Phase Peptide Displacement Assay .................................. 31
3.3 Ethidium Bromide Displacement................................................. 40
3.4 Direct Observation of Small Molecule-Nucleic AcidAssociation: Monitoring Photophysical Changesof the Small Molecule.................................................................. 42
3.5 Direct Observation of Small Molecule-Nucleic AcidAssociation: Monitoring Photophysical Changesof the Nucleic Acid ...................................................................... 45
3.6 Analysis of Binding Data ............................................................. 53
4.0 New RRE Ligands: [Ru(bpy)2Eilatin]2+................................................... 60
5.0 Ethidium Bromide: Biological Activities and Nucleic Acid Binding ......... 86
5.1 Electronic Properties of Ethidium and its Derivatives.................. 90
5.2 Synthesis of Ethidium Bromide Derivatives .............................. 118
5.3 Acid-Base Properties of Ethidium and itsGuanidino Derivatives............................................................... 124
5.4 Preliminary Evaluation of the Nucleic Acid Affinity andSpecificity of Ethidium Derivatives ............................................ 127
6.0 Aminoglycoside-Based Ligands .......................................................... 135
6.1 Neomycin-Acridine Conjugates................................................. 136
6.2 Other Aminoglycoside-Acridine Conjugates.............................. 145
6.3 Dimeric Aminoglycosides.......................................................... 147
6.4 Guanidinoglycosides................................................................. 154
6.5 Acridine-Containing Guanidinoglycosides................................. 165
6.6 Platinum-Containing Aminoglycosides andGuanidinoglycosides................................................................. 167

vii
6.7 BODIPY- and Fluorescein-Linked Glycosidesas RNA Probes ......................................................................... 175
6.8 Cellular Uptakes of Aminoglycosides andGuanidinoglycosides ................................................................ 179
6.9 Conclusions .............................................................................. 188
E 1.0 Compound sources, references, and all known IC50
values for HIV-1 Inhibition......................................................... 189
E 2.0 Experimental procedures for RNA synthesisand quantification ..................................................................... 193
E 2.1 Experimental procedures for Rev peptide synthesis................. 196
E 3.0 Experimental procedures and conditions for binding assays.... 201
E 4.0 Raw spectal data for Λ- and ∆-[Ru(bpy)2Eilatin]2+ upontitration of nucleic acids............................................................. 213
E 5.0 Synthesis and Characterization of Ethidium Derivatives .......... 217
E 6.0 Synthesis and Characterization of AminoglycosideDerivatives................................................................................ 247
References ................................................................................................... 294
List of Figures
Figure 1.0 Molecular recognition of RNA and the centraldogma of biology........................................................................ 1
Figure 1.1 Deactivation of mRNA translation by small-molecule binding .... 5
Figure 1.2 Representative aminoglycosides ............................................... 8
Figure 1.3 Summary of HH16 inhibition by deoxy-tobramycin derivatives .. 9
Figure 2.0 The HIV-1 lifecycle................................................................... 13

viii
Figure 2.1 HIV's late replication phase and the Rev-RRE interaction.. ..... 14
Figure 2.2 A domain map of the Rev protein and the secondarystructure of the 351 ntd. RRE................................................... 15
Figure 2.3 RRE sequence alignments and the Rev binding site ............... 17
Figure 2.4 Minimized RRE constructs ....................................................... 18
Figure 2.5 RRE JW mutants "3I RREJW" and "dRREJW" ........................ 19
Figure 2.6 Secondary structures of "other" RNAs used in these studies... 20
Figure 3.0 Fluorescence polarization anisotropy....................................... 25
Figure 3.1 Relationships between the concentration of RevFl and theemission intensity and anisotropy of the sample........................ 25
Figure 3.2 Binding of RevFl to three different RRE constructs.................. 27
Figure 3.3 Linear relationship between Gibbs free energy and thesize of each RRE construct...................................................... 28
Figure 3.4 Fluorescence anisotropy displacement experiments ............... 30
Figure 3.5 Assembly of the solid-phase immobilized Rev-RRE complex.. 32
Figure 3.6 Measuring the relative RRE affinity and specificity of aligand using the solid-phase assay .......................................... 34
Figure 3.7 Known small-molecule inhibitors of Rev-RRE binding ............. 36
Figure 3.8 Raw data from solid-phase displacement experiments............ 37
Figure 3.9 Native gel-shift electrophoresis proves the efficacyof the phase assay................................................................... 38
Figure 3.10 Octahedral metal complexes evaluated for RRE affinityand specificity using the solid-phase assay ............................. 39
Figure 3.11 Structures of two classic intercalating agents thatbind the RRE............................................................................ 40
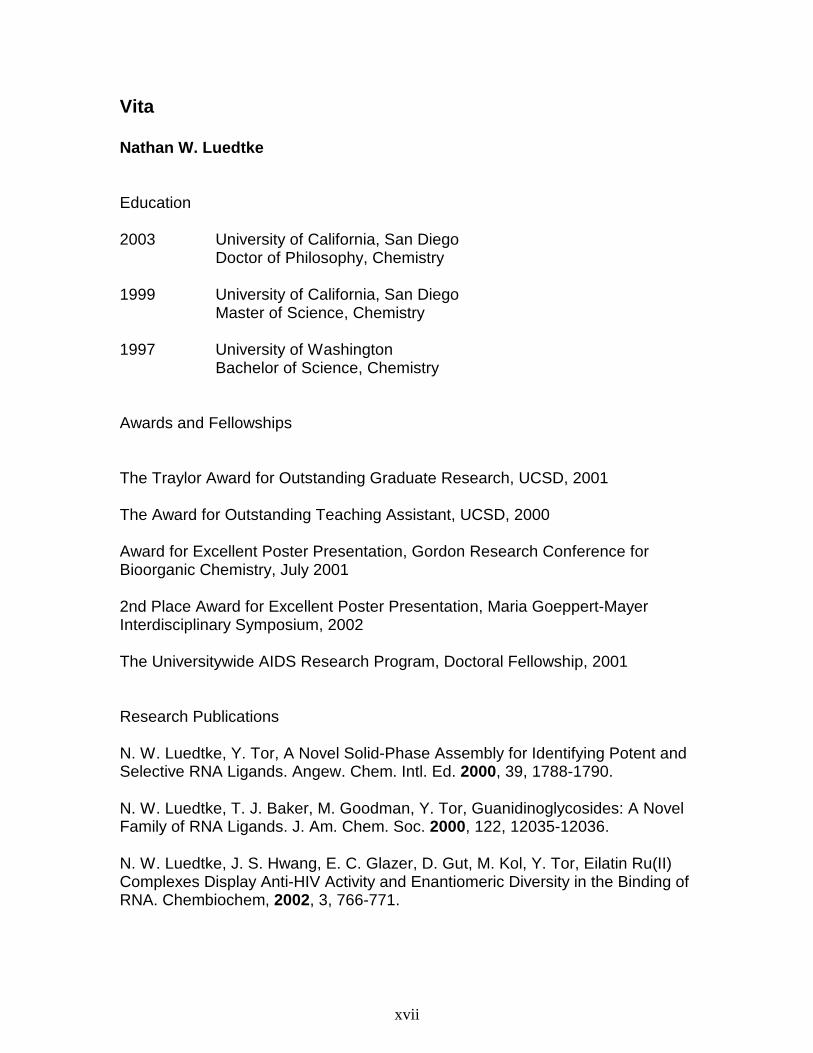
Figure 3.12 Raw emission data from ethidium displacement experiments.. 41

ix
Figure 3.13 Binding of eilatin to the RRE .................................................... 44
Figure 3.14 Binding of ethidium bromide to the RRE .................................. 44
Figure 3.15 Examples of thermal denaturation experiments ....................... 46
Figure 3.16 Adenosine-uracil and 2AP-uracil base pairs ............................ 47
Figure 3.17 Enzyme-substrate association and cleavage of the HH16....... 49
Figure 3.18 Enzyme-substrate association of the HH16 ribozymeat three different ionic strengths............................................... 49
Figure 3.19 Real-time cleavage of the HH16 as evidenced from theincrease in fluorescence emission of 2AP ............................... 50
Figure 3.20 Binding of neomycin B to the fluorescent HH16 complex ........ 51
Figure 3.21 Three hypothetical binding isotherms for different ratiosof the observable's concentration versus affinity...................... 54
Figure 3.22 Three theortical binding isothers showing positive,negative, and non-cooperative binding .................................... 55
Figure 3.23 Scatchard plot for ethidium bromide binding to the RRE JW ... 57
Figure 4.0 Structures of eilatin and eilatin-containing metal complexes.... 60
Figure 4.1 CD spectra of eilatin-containing metal complexes 9 and 10 .... 61
Figure 4.2 Anti-HIV activities of eilatin-containing metal complexes ......... 62
Figure 4.3 Viscosity of changes of DNA solutions upon addition ofethidium bromide or eilatin-containing metal complexes.......... 67
Figure 4.4 UV-vis absorption spectra of ∆-[Ru(bpy)2Eilatin]2+(10)upon addition of DNA............................................................... 70
Figure 4.5 Binding isotherm for poly r(U) at a high concentration of 10 .... 74
Figure 4.6 Binding of poly r(U) at three concetrations of 10 ...................... 75
Figure 4.7 Thermal denaturation of a poly r(U) - 10 complex.................... 76
Figure 4.8 van't Hoff plot for the hermal denaturation ofa poly r(U) - 10 complex .......................................................... 77
x
Figure 4.9 Scatchard analysis for the binding of 10 to RRE JW,TAR31, and tRNAPhe ................................................................ 78
Figure 4.10 Changes in the emission specrtum of eilatin (14)upon addition of DNA............................................................... 80
Figure 4.11 Direct binding of 14 to the RRE versus its ability todisplace RevFl from the RRE................................................... 81
Figure 5.1 New ethidium derivatives and a summary oftheir spectral properties ........................................................... 89
Figure 5.2 1H NMR spectra of 3,8-diamino-6-phenylphenanthridineand ethidium chloride (12) ....................................................... 96
Figure 5.3 1H NMR spectra of ethidium chloride (12), and its cbzprotected derivatives 16, 17, and 18 ........................................ 98
Figure 5.4 13C DEPT NMR spectra of ethidium chloride (12) .................. 100
Figure 5.5 13C-1H HETCOR NMR spectrum of ethidium chloride (12) .... 101
Figure 5.6 HMBC NMR spectrum of ethidium chloride (12) .................... 102
Figure 5.7 13C NMR spectra of ethidium chloride (12), and its cbzprotected derivatives 16 and 17 ............................................. 103
Figure 5.8 Bond lengths for three recent crystal structures ofphenanthridine and phenanthridinium-containing molecules . 105
Figure 5.9 All possible Clar and Kekulé depictions of ethidium (12) ...... 106
Figure 5.10 A summary of phenanthridine's π-bond order ........................ 106
Figure 5.11 Bond lengths for three crystal structures of ethidium (12)...... 108
Figure 5.12 Bond lengths observed in the crystal structures of themono-cbz ethidium derivatives 16 and 17.............................. 111
Figure 5.13 Charge delocalization to the 3-amine of ethidium .................. 112
Figure 5.14 Resonance structures showing charge separation in 12........ 113
Figure 5.15 A summary of partial positive and negative charges in 12 ..... 115

xi
Figure 5.16 Protection of ethidium bromide with benzyl chloroformate..... 119
Figure 5.17 Synthesis of 3-guanidino ethidium chloride (19) ................... 120
Figure 5.18 Unsuccessful attempts at synthesizing 3-urea ethidium ........ 121
Figure 5.19 Typical synthetic route for urea-ethidium derivatives ............. 122
Figure 5.20 Examples of ethidium-urea-conjugates.................................. 123
Figure 5.21 Synthesis of 3,8-bis pyrole ethidium acetate (27) .................. 124
Figure 5.22 Changes in the maximum absorbance wavelength ofethidium (12) as a function of pH ........................................... 125
Figure 5.23 Changes in the maximum absorbance wavelength of theguanidino ethidium derivatives 19, 20, and 21as a function of pH. ................................................................ 125
Figure 5.24 A summary of the pKa values for 12, 19, 20, and 21 ............. 127
Figure 6.0 Secondary structure of the RRE 66 showing theneomycin B footprinting site and potentialhigh-affinity intercalation sites................................................ 136
Figure 6.1 Structures of three neomycin-acridine conjugates ................. 137
Figure 6.2 Gel-shift electrophoresis and footprinting site forneo-S-acridine and Rev-IA on the RRE 66 ............................ 138
Figure 6.3 Structures of acridine conjugates of tobramycin andkanamycin A (41 and 42) ....................................................... 146
Figure 6.4 Structures of the dimeric aminoglycosides43, 44, 45, 46, and 47 ............................................................ 149
Figure 6.5 Structures of the aminoglycosides 1 - 5 andof the guanidinoglycosides 48 - 52......................................... 155
Figure 6.6 The anti-HIV activities of 3, 5, 50, and 52 .............................. 161
Figure 6.7 Structures of the tobramycin-Arg conjugates 53 and 54 ........ 162
Figure 6.8 Structures of the kanamycin A - amino acid conjugates53 and 54 ............................................................................... 164

xii
Figure 6.9 Structures of guanidinylated tobra-N-acridine andneo-N-acridine compounds 58 - 61........................................ 166
Figure 6.10 Structures of the cisplatin-neomycin conjugates 62 and 63 ... 168
Figure 6.11 DPAGE of RRE JW showing multiple adducts withthe cisplatin-neomycin conjugates 62 and 63 ........................ 169
Figure 6.12 MALDI TOF MS of RRE JW, its mutants, andthe cisplatin-neomycin conjugate 62 ...................................... 171
Figure 6.13 MALDI TOF MS of enzymatic digest reactions containingthe RRE JW and the neomycin conjugates 62 and 63........... 172
Figure 6.14 A summary of the enzymatic stop sites on the RRE JWdue to cross-linking of 62 and 63 ........................................... 173
Figure 6.15 Native gel-shift electrophoresis showing displacementof Rev by either neomycin B or Neo-Pt.................................. 174
Figure 6.16 New fluorescent aminoglycosides based upon BODIPYor fluorescein conjugation ...................................................... 176
Figure 6.17 Examples of binding experiments using the BODIPY-containing guanidinoglycoside ............................................... 177
Figure 6.18 FACS histograms showing the cellular uptakes of BODIPY-containing aminoglycosides and guanidinoglycosides ........... 182
Figure 6.19 FACS histograms showing the cellular uptakes of BODIPY-containing guanidino-neomycin and a poly Arg peptide......... 184
Figure 6.20 Fluorescence emission spectroscopy of cells exposed tofluorescein-containing aminoglycosides,guanidinoglycosides, and the poly-Arg peptide...................... 185
Figure 6.21 Thiol-reactive neomycin and guanidino-neomycinderivatives as cellular transport substrates ............................ 187
Figure E2.0 UV-vis absorption spectrum of RRE66 beforeand after hydrolysis................................................................ 194
Figure E2.1 Sequences of modified Rev34-50 peptides............................... 196

xiii
Figure E2.2 Synthesis of N-terminus and C-terminus modifiedRev peptides.......................................................................... 197
Figure E3.1 Synthesis of biotinylated RRE66............................................ 204
Figure E5.0 ORTEP drawing of ethidium chloride (12).............................. 217
Figure E5.1 ORTEP drawing of 3-cbz ethidium chloride (16) .................... 219
Figure E5.2 ORTEP drawing of 8-cbz ethidium chloride (17) .................... 220
Figure E6.1 1H NMR spectrum of neo-neo before andafter dimerization (43) ............................................................ 259
List of Tables
Table 3.0 RevFl binding constants and free energies for tRNAPhe,CT DNA, TAR 31, and three RRE constructs........................... 27
Table 3.1 IC50 values for Rev-RRE inhibition by twofamilies of known Rev-RRE inhibitors ...................................... 35
Table 3.2 IC50 values for Rev-RRE inhibition by the eilatin-containing metal complexes 9 and 10 ...................................... 39
Table 4.1 IC50 values for HIV-1 inhibition by the eilatin-containingmetal complexes 9 and 10 and for RevFl displacementfrom RRE 66 and TAR31 by the Ru complexes 11 and 15 ...... 63
Table 4.2 IC50 values for ethidium displcement bb 9, 10, and 15using 8 different nucleic acids.................................................. 65
Table 4.3 C50 values for the binding of 9, 10, 12, and 14 to17 different polymeric nucleic acids ........................................ 72
Table 4.4 Summary of binding stoichiometries and affinities between9 and 10 for the RRE JW, tRNAPhe, and TAR 31 ..................... 78
Table 4.5 Estimated Kd values for the binding of 9, 10, 12, and 14 to17 different polymeric nucleic acids ........................................ 82
Table 5.1 Summary of 13C assignments and chemical shifts of

xiv
ethdium (12) and 3,8-bis cbz ethidium chloride (18) ............. 117
Table 5.2 Summary of IC50 values for RevFl displacement and C50
values for CT DNA binding for 14 differentethidium derivatives ............................................................... 129
Table 5.3 Summary of the changes in spectral properties ofethidium bromide derivatives upon binding CT DNA.............. 131
Table 5.4 C50 values for binding of the deoxyneamine-ethidiumconjugate 37 to six different nucleic acids.............................. 133
Table 6.0 IC50 and Ki values for Rev-IA, neo-S-acridine, neo-neo,and neomycin B for binding to the RRE 66 ............................ 139
Table 6.1 IC50 values and RRE selectivities of aminoglycosides,aminoglycoside-acridine conjugates, aminoglycosidedimers, and Rev-IA, according to the solid-phase assay ...... 142
Table 6.2 RevFl IC50 values, RRE 66 Ki values, and ethidiumdisplacement IC50 values for aminoglycosdies,aminoglycoside-acridine conjugates and aminoglycosidedimers using CT DNA and poly r(A) - r(U) ............................. 144
Table 6.3 RevFl IC50 values for aminoglycosides andguanidinoglycosides at 10 nM and 100 nM of RRE 66 .......... 156
Table 6.4 IC50 values and RRE selectivities of the aminoglycosidesand guanidinoglycosides according to the solid-phase assay........................................................................... 157
Table 6.5 IC50 values and approximate RRE 66 Ki values foraminoglycoside - amino acid conjugates 53 - 57 ................... 163
Table 6.6 Preliminary RRE 66 affinitites of the guanidinylatedtobra-N-acridine and neo-N-acridine compounds 58 - 61 ...... 166
Table 6.7 C50 values for the neomycin-BODIPY conjugates 67 and68 for binding to the RRE JW and two RRE JW mutants....... 177
Table 6.8 IC50 values for the displacement of the neomycin-BODIPYconjugates 67 and 68 from the RRE JW................................ 179
Table 6.9 Qualitative assessment of the cellular uptakes of acridine-containing aminoglycosides and guanidinoglycosides ........... 180

xv
Table 6.10 Quantum yields of acridine- and BODIPY-containingaminoglycosides and guanidinoglycosides ............................ 181
Table 6.11 Summary of the mean fluorescence intensities of individualcells after exposure to BODIPY-containingaminoglycosides and guanidinoglycosides ............................ 183
Table E1.0 Compound source index ........................................................ 189
Table E1.1 Summary of all IC50 values for HIV-1 inhibition ..................... 192
Table E2.0 Extinction coefficients used for RNA and DNA quantification. 195
Table E5.1 Crystallographic parameters for ethidium chloride ................. 218
Table E5.2 Crystallographic parameters for 3-cbz ethidium chloride ....... 219
Table E5.3 Crystallographic parameters for 8-cbz ethidium chloride ....... 221
List of Abbreviations
Ar argon gasBoc tert-butyloxycarbonylBODIPY N-(4,4-difluoro-5,7-dimethyl-4-bora-3a,4a-diaza-s-indacene)bpy 2,2'-bipyridinecbz benzyl chloroformateCD circular dichroismDMAP 4-(dimethylamino)pyridineDMF N,N-dimethylformamideDMSO dimethylsulfoxideDNA deoxyribonucleic acidDPAGE denaturing polyacrylamine gel electrophoresisESI MS electrospray ionization mass spectrumFAB MS fast atom bombardment mass spectrumHPLC high performance liquid chromatographyMALDI TOF matrix-assisted laser desorption/ionization time-of-flightNMR nuclear magnetic resonancentd nucleotidephen 1,10-phenanthrolineRNA ribonucleic acidTEA triethylamineTFA trifluoroacetic acidTm thermal melting temperatureUV-Vis ultraviolet-visible

xvi
Acknowledgments
Many people have made essential contributions to this work. I would like to thank
my mentor Dr. Yitzhak Tor for his constant support, wisdom, and for planting the
seeds from which this work has grown. I am also very grateful to the many
talented chemists who have contributed compounds and/or data to this thesis,
especially Mr. Qi (Charles) Liu, Ms. Judy S. Hwang, Dr. Sarah R. Kirk, Dr. Hai
Wang, Dr. Tracy J. Baker, Ms. Phoebe C. Glazer, Mr. Peter Carmichael, and Dr.
Jürgen Boer. I thank all of my science teachers, mentors, and other “scientific
heros”, especially Mr. S. Koepp, Dr. P. L. Fischhaber, Dr. P. B. Hopkins, Dr. E.
O. Wilson, Dr. J. E. Kyte, Dr. J. S. Siegel, and Dr. M. Goodman. I also want to
thank all of my family for giving me the love, freedom, and means to pursue my
own interests, especially my parents, William D. Luedtke, Lorna L. Luedtke, my
brother David P. Luedtke, my grandmother Louise Rigelman, and my uncles and
aunts, especially Ross Cortese and Ellie Cortese. Last, and certainly not least,
thank you Heidi W. Thomsen for all of your support, encouragement, and
understanding during this long adventure.
xvii
Vita
Nathan W. Luedtke
Education
2003 University of California, San DiegoDoctor of Philosophy, Chemistry
1999 University of California, San DiegoMaster of Science, Chemistry
1997 University of WashingtonBachelor of Science, Chemistry
Awards and Fellowships
The Traylor Award for Outstanding Graduate Research, UCSD, 2001
The Award for Outstanding Teaching Assistant, UCSD, 2000
Award for Excellent Poster Presentation, Gordon Research Conference forBioorganic Chemistry, July 2001
2nd Place Award for Excellent Poster Presentation, Maria Goeppert-MayerInterdisciplinary Symposium, 2002
The Universitywide AIDS Research Program, Doctoral Fellowship, 2001
Research Publications
N. W. Luedtke, Y. Tor, A Novel Solid-Phase Assembly for Identifying Potent andSelective RNA Ligands. Angew. Chem. Intl. Ed. 2000, 39, 1788-1790.
N. W. Luedtke, T. J. Baker, M. Goodman, Y. Tor, Guanidinoglycosides: A NovelFamily of RNA Ligands. J. Am. Chem. Soc. 2000, 122, 12035-12036.
N. W. Luedtke, J. S. Hwang, E. C. Glazer, D. Gut, M. Kol, Y. Tor, Eilatin Ru(II)Complexes Display Anti-HIV Activity and Enantiomeric Diversity in the Binding ofRNA. Chembiochem, 2002, 3, 766-771.

xviii
Research Publications (cont.)
N. W. Luedtke, Y. Tor, Targeting HIV RNA with Small Molecules. In: DNA andRNA Binders Vol.1, M. Demeunynck, C. Bailly, W. D. Wilson (Eds.), 2002, Wiley-VCH, 18-40.
N. W. Luedtke, Y. Tor, Fluorescence-Based Methods for Evaluating the RNAAffinity and Specificity of HIV-1 Rev-RRE Inhibitors. Biopolymers, In Press
N. W. Luedtke, Q. Liu, Y. Tor, The Electronic Structure of Ethidium BromideReveals Charge Separation in an Organic Cation. In preparation
N. W. Luedtke, Y. Tor, Synthesis, Nucleic Acid Binding, and PhotophysicalProperties of Phenanthridine Derivatives Based Upon Ethidium Bromide. Inpreparation
N. W. Luedtke, J. S. Hwang, E. C. Glazer, D. Gut, M. Kol, Y. Tor, Nucleic AcidSpecificity and Binding Mode of Specificities of Eilatin Ru(II) Complexes. Inpreparation
N. W. Luedtke, P. Carmichael, Y. Tor, Impressive Cellular Translocation ofGuanidine-Modified Natural Products, In preparation
N. W. Luedtke, Q. Liu, Y. Tor, Affinity and Specificity of Aminoglycoside Dimersand Acridine Conjugates That Bind the HIV-1 Rev Response Element . Inpreparation
T. J. Baker, N. W. Luedtke, Y. Tor, M. Goodman, Synthesis and Anti-HIV Activityof Guanidinoglycosides. J. Org. Chem., 2000, 65, 9054-9058.
S. R. Kirk, N. W. Luedtke, Y. Tor, Neomycin-Acridine Conjugate: A PotentInhibitor of Rev-RRE Binding, J. Am. Chem. Soc. 2000, 122, 980-981.
J. Boer, N. W. Luedtke, Y. Tor, RNA-Selective Covalent Modification by Neo-platin (A Neomycin-Cisplatin Conjugate), In preparation.
Q. Liu, N. W. Luedtke, Y. Tor, A Simple Conversion of Amines intoMonosubstituted Ureas in Organic and Aqueous Solvents. Tetrahedron Lett.2001, 42, 1445-1447.
S. R. Kirk, N. W. Luedtke, Y. Tor, 2-Aminopurine as a Real-Time Probe ofEnzymatic Cleavage and Inhibition of Hammerhead Ribozymes. Bioorg. Med.Chem. 2001, 9, 2295-2301.

xix
Research Publications (cont.)
J. T. Millard, N. W. Luedtke, R. J. Spencer, The 5'-GNC Preference for MustardCross-Linking is Preserved in a Restriction Fragment. Anti-Cancer Drug Des.,1996, 11, 485-492.
A. Friedler, D. Friedler, N. W. Luedtke, Y. Tor, A. Loyter, C. Gilon, Developmentof a Functional Backbone Cyclic Mimetic of the HIV-1 Tat Arginine-rich Motife. J.Biol. Chem. 2000, 275, 23783-23789.
K. Fineberg, T. Finberg, A. Graessmann, N. W. Luedtke, Y. Tor, R. Lixin, D. A.Jans, A. Loyter, Inhibition of Nuclear Import Mediated by the Rev-Arginine RichMotif by RNA Molecules, Biochemistry, 2003, 42, 2625-2633.

xx
Abstract
RNA Affinity and Specificity of Modified Aminoglycosides, Metal Complexes, and
Intercalating Agents That Target the HIV-1 Rev Response Element
by
Nathan W. Luedtke
Doctor of Philosophy in Chemistry
University of California, San Diego, 2003
Professor Yitzhak Tor, Chair
RNA plays a pivotal role in the replication of all organisms, including viral and
bacterial pathogens. The development of small molecules that can selectively
interfere with undesired RNA activity is a promising new direction for drug design.
Systematic studies of the binding interactions between small molecules and RNA
are essential for deciphering the parameters that govern RNA recognition. The
synthesis of new ligands with high RNA affinity is relatively easy compared to
discovering new ligands with high specificity for the desired RNA target. The
RRE affinity and specificity of every small molecule is not necessarily
proportional to its anti-HIV activity. Issues related to cellular uptake, localization,
and the non-specific binding of other cellular components can dramatically affect
the biological activities of small molecules.

1
1.0 Introduction
The central dogma of biology states that from DNA, RNA is transcribed to serve
as an information messenger that is translated into proteins.1 Messenger RNA
(mRNA) accounts, however, for only a small fraction of the RNA present within a
cell. Far from being a passive carrier of genetic code, RNA exhibits vast
structural and functional diversity and is intimately involved in a wide range of
biological activities, including information storage and chemical catalysis.
Figure 1.0: Molecular recognition of RNA often precedes catalytic events that areessential to a wide range of cellular activities including: (a) initiation of DNAreplication,2 (b) extension of the telomeric regions of chromosomes,3 (c) splicingof pre-mRNA,4 and iron chelation.5 In addition, RNA serves as the primarygenome of most pathogenic viruses.6
A more “modern” interpretation of the central dogma of biology is that RNA has
structural and functional characteristics that are, in many ways, similar to both

2
DNA and proteins. RNA is, therefore, an intermediate between DNA and proteins
in more than one respect.
1.1 Translation
Gene expression relies upon an interplay between recognition events and
catalytic activities that are mediated by RNA-protein complexes. Ribosomal RNA
(rRNA) accounts for the vast majority of total cellular RNA (80%) and provides
both the molecular scaffold and enzymatic activities needed for protein
translation.7 The key step of translation occurs in the ribosome’s A-site, where
codon-anticodon recognition decodes mRNA. Upon a correct codon-anticodon
match between mRNA and the anticodon loop of tRNA, the ribosome’s peptidyl
transferase activity catalyzes the formation of a new peptide bond between the
amino acid-charged tRNA in the A-site and the growing protein chain on the
tRNA in the P-site.7 Studies have shown that prokaryotic ribosomes that are
stripped of protein are still capable of limited peptidyl transferase activity.8 In
accordance with this result, recent crystal structures show that the peptidyl
transferase active site is composed entirely of rRNA.9 A single, unusually basic
adenosine may be the key player in the mechanism of peptidyl transfer.10
Transfer RNAs, at 15% of total cellular RNA, are the most common type of
“soluble” RNA (i.e. lacking any associated proteins). The binding of tRNA to the
ribosomal A-site is mediated by extensive RNA-RNA interactions (including
rRNA-tRNA, and mRNA-tRNA binding). Through these, and other important

3
interactions, the ribosome amplifies the relatively small energetic differences
between cognate and non-cognate codon-anticodon pairing to achieve an
astounding 99.9% accuracy in its translation of mRNA.7,11
The transport, translation efficiency, and stability of individual messenger RNAs
is controlled by numerous protein-RNA, ribonucleoprotein-RNA, and RNA-RNA
interactions.12 Upon transcription from DNA, ribonucleoprotein complexes called
splisosomes excise the introns from pre-mRNA and from other heterogeneous
RNAs (Figure 1.0). Some organisms are capable of intron excision (splicing)
without protein assistance, and have provided the first examples of RNA
enzymes (or ribozymes).13 The translation efficiency of individual mRNAs is
regulated at many levels, including the binding of the 5' and 3' untranslated
regions (UTRs) of the mRNA by proteins,14 microRNAs,15 and by small
molecules.16
1.2 RNA Viruses
Viral epidemics have accounted for more human deaths than all known wars and
famine combined. About 65% of the known families of viruses use RNA for a
primary genome and cause many modern-day plagues including AIDS, cancer,
hepatitis, smallpox, ebola, and influenza.6 Most viruses are, however, benign.
Interestingly, approximately 42% of the human genome is composed of
transposable elements that multiply by reverse transcription, using an RNA
intermediate similar to that of a retrovirus.17 In general, reverse transcription is a

4
highly error-prone process allowing viral elements to evolve rapidly under
selective pressures (such as anti-viral drugs). An additional 8% of the human
genome is composed of repetitive genomic elements known as “retrovirus-like
elements”.17 Their structures very closely resemble those of retroviruses, carrying
the open reading frames common to all retroviruses (Gag, Pol, Env), flanked by
5' and 3' long terminal repeats. Overall, the human genome is composed of
approximately 50% self-repeating parasitic sequences. Compare this with the
unique (non-repeated) genes, representing only ~5% of the human genome!17
1.3 Small Molecules That Modulate RNA Activity
The ability of RNA to facilitate the essential biochemical activities needed for
information storage, signal transduction, replication, and enzymatic catalysis has
distinguished it as a candidate for being the central biomolecule in a prebiotic
world.18 If such an “RNA world” ever did exist, then small molecule-RNA
interactions certainly played a key role in the regulation of RNA replication,
processing, as well as other enzymatic and regulatory activities.19
The conceptual proof demonstrating the ability of small organic molecules to
regulate gene expression was first revealed in the context of an artificial gene
construct.16a An RNA aptamer (see endnote [20]) located in the 5' untranslated
region (UTR) of an mRNA, was shown to inactivate the translation of a down-
stream reporter gene upon binding to its cognate small molecule (Figure 1.1).

5
The mechanism proposed for the small molecule-dependent translation
inactivation involves a structural rearrangement of the 5'-UTR into a rigid
complex that cannot be scanned by the ribosomal pre-initiation machinery.
Recent studies have shown that natural systems use small molecule-RNA
binding (accompanied by RNA structural rearrangements) to directly modulate
mRNA translational efficiencies.16 b,c
Figure 1.1: The mature mRNA of an artificial gene construct is actively translatedin the absence of small-molecule binding (Top). Upon binding the 5'-UTR by itscognate small molecule, the translation of the gene is deactivated (Bottom).16a
Recent studies indicate that similar mRNA-small molecule control mechanismsoccur in vivo and appear, therefore, to represent a normal aspect ofmetabolism16b,c
1.4 Magnesium (II)
Much like proteins, the primary sequence of an RNA directs its folding into a
unique 3-D structure.21 Correct RNA folding, however, typically relies upon the
binding of divalent metal ions (especially Mg2+). The Mg2+ induced folding of the

6
Tertrahymena thermophila group I intron has become an important paradigm for
RNA folding.22 In the absence of Mg2+, it occupies an ensemble of highly dynamic
secondary structures that are dominated by duplex regions interrupted by internal
bulges and stem loops. The group 1 intron secondary structure can be predicted
from its nucleotide sequence using base-pairing and nearest neighbor rules.23
Upon Mg2+ binding it collapses into a more rigid, enzymatically active, tertiary
structure with fewer conformations available. In at least one region of the group 1
intron, Mg2+ binding induces a rearrangement of the RNA secondary structure
itself.24 These cation-mediated “higher-order” folding interactions remain a major
obstacle in the prediction of a 3-dimensional RNA structure given only its primary
sequence.
Mg2+ exhibits a low to moderate affinity to many unrelated RNAs. Mg2+ binding
affinities (Kd) range from 0.01 mM through 10 mM in the presence of 0.1 – 0.2 M
of monovalent ions.25 Given the 3-dimensional structure of an RNA, an
electrostatic contour map can be calculated, allowing for the theoretical
prediction of Mg2+ binding sites.26 The accuracy of such predictions is
complicated by issues related to induced fit and by the limited understanding of
the characteristics of the cations themselves. Crystal structures of tRNAPhe, for
example, indicate that different cations bind at different RNA sites, depending
upon the identity of the ion.27 Few of the metal cation binding sites overlap with
one another (as would be predicted by electrostatic contour mapping).27
Tremendous diversity in the position, size, and affinity provided by RNA

7
coordination sites, suggests that metal ion-RNA complexes may have exhibited
diverse catalytic activities in a prebiotic “RNA world”.
RNA-cation binding interactions are essential for the proper folding and catalytic
function of RNA.22 There are some cases, however, where small molecules other
than metal cations can be used to facilitate the folding and enzymatic activity of
RNA. Linear polyamines (like spermine) and aminoglycosides (Figure 1.2) can
displace Mg2+ from RNA, and have been shown to directly facilitate the
enzymatic activities of the hairpin and hammerhead ribozymes even in the
absence of divalent metal ions.28 Structurally complex and semi-rigid polycations
may have once served as RNA scaffolds, similar to the ribosomal proteins of
today.
1.5 Aminoglycosides
Aminoglycoside antibiotics are a diverse family of natural products that interfere
with prokaryotic protein biosynthesis (Figure 1.2). Their ability to non-specifically
bind to RNA through electrostatic interactions was described over 20 years
ago.29 The aminoglycosides are also capable, however, of site-specific
recognition of prokaryotic rRNA. Early footprinting experiments indicated that
aminoglycosides bind to discrete locations within the ribosome.30 Later
experiments showed that aminoglycosides increase the affinity of tRNA to the
30S ribosomal A-site,31 thus providing an attractive mechanism to explain their
ability to selectively decrease the fidelity of prokaryotic translation.32 A recent

8
crystal structure of three aminoglycosides (streptomycin, paromomycin, and
spectinomycin) bound to the Thermus thermophilus 30S ribosomal subunit
confirms the location of the aminoglycoside binding sites and provides a high-
resolution picture of how RNA-small molecule recognition occurs within a
ribonucleoprotein complex.33 This type of structural information will prove
indispensable for the structure-based design of aminoglycoside derivatives that
have an improved “fit” within their ribosomal binding pockets. Structural
information by itself cannot, however, answer basic questions related to the
energetics involved in the binding of small molecules to RNA. Equilibrium binding
constants must be measured in order to establish the actual energetic values
associated with RNA-small molecule recognition.
OHO
HO
NH2
H2N
O
NH2
OH
OH2N
O HN
OH
OH
HO
OHO
H2N
NH2
OHH2NHO
NH2
O
HO
OO
NH2
HOO
HOO
HO
H2N
OMe
HO
NH2
H2N
O
NH2O
OH
MeHN
OH2N
HO
HNHO OH
NHCH3HOHO
HOO
NH
OO
OHOH3C
H2NNH
HN
NH2OH
O H
Amikacin
Sisomycin
Neomycin B
StreptomycinO
H2N
HO
O
OH
O
HOHO
H2NNH2
NH2
OH2N
HO
OH
O
HNO
OH Me
Apramycin
Figure 1.2: Representative aminoglycosides. Five out of the six amino groups ofneomycin B have pKa values over 7.0, giving it a highly positive charge underphysiological conditions.34

9
Despite the structural details provided by aminoglycoside-RNA complexes, the
energetic contributions made by the pendant hydroxyl groups of the
aminoglycosides remain unclear. Hydrogen bonding between these groups and
RNA are apparent in some structures,33 but the energetic contributions made by
hydrogen bonding in aqueous media is still debated.35 In an attempt to determine
their role in RNA affinity, the hydroxyl groups of tobramycin were systematically
removed (Figure 1.3). RNA binding was then tested by measuring the HH16
ribozyme inhibitory activity of each tobramycin derivative.36
Figure 1.3: Summary of hammerhead inhibition by deoxy-tobramycinderivatives.36 A lower relative rate suggests better RNA binding.
Interestingly, the removal of hydroxyls at positions R2, R3, and R4 (Figure 1.3)
lead to aminoglycosides with better RNA cleavage inhibition. The current
explanation for this “unexpected” result is that certain hydroxyl groups decrease
the basicity of neighboring amines. Therefore, removing hydroxyls typically
increases the overall positive charge, and hence the RNA affinity of the deoxy-
O
NH2O
OR2
H2N
H2NO
HO
H2NNH2
R3
R4
R1
OH
OH
2''-Deoxytobramycin
OH
Aminoglycoside
OH
R3
OH
R2
H OH6''-Deoxytobramycin
Tobramycin
H
OH
OH
R1
4'-Deoxytobramycin OH
4''-Deoxytobramycin H
OH
R4
OH
H
0.17
OH
OH
OH OH
OH
Relative RibozymeCleavage Rate
1.0
0.33
1.4
0.33

10
derivatives. These de-hydroxylated tobramycin derivatives have not yet been
tested for the binding of other RNAs, so the roles of the hydroxyls in RNA
specificity remain unclear.
1.6 Ligand Specificity
For the purposes of this thesis, specificity will be defined as the binding affinity
(Keq) of a small molecule to a particular RNA site, divided by its average affinity to
“all” other potential binding sites:
specificity = Keq(interaction of interest)average Keq(other sites of interaction)
Specificity is proportional to occupancy of the “desired” RNA site, versus the
occupancy of all other potential binding sites. For practical reasons, specificity is
a relative term, where the affinity between a small molecule and its RNA “target”
is weighted by its affinity to “other” nucleic acids. The reported specificity is,
therefore, always dependent on the selection of the competitor or “non-specific”
nucleic acids used for the comparison.
High specificity is a prerequisite for the effective modulation of RNA activity in
vivo. Since non-specific binding sites are typically present at much higher
concentrations as compared to the desired target, the bioavailability of a small
molecule may suffer even if it has a moderate affinity to “other” sites. The binding

11
of the small molecules to tRNA, rRNA, DNA, proteins, phospholipids, etc., may
also cause undesired biological “side effects” including toxicity and mutagenicity.
Aminoglycosides, for example, are not ideal antibiotics. Their promiscuous
binding of RNA and/or membrane components may be related to the multiple
therapeutic side effects and the low-moderate bacteriacidal potency exhibited by
these compounds.37,38 Aminoglycosides bind to and inhibit the function of a wide
range of unrelated RNAs with moderate activities (IC50 = 0.1 – 100 µM).19,28c,39
Aminoglycosdies, therefore, exhibit a low specificity for most of these RNA sites.
Aminoglycosides do, however, show excellent specificity for RNA over DNA
(Section 6.0). For this reason, we have used aminoglycosides as “scaffolds” for
the synthesis of new small molecules targeted towards specific RNA sites. These
derivatives are found to exhibit dramatically different RNA specificities and
altered biological activities when compared to their aminoglycoside precursors.
1.7 Goals
There are still no "rules" for the structure-based design of small molecules that
are targeted to a specific RNA tertiary fold. One obstacle is that there are still
very few examples of small molecules that bind to natural RNA structures with
high specificity. There are other potential reasons as well. For example, RNA is a
highly dynamic molecule known to occupy multiple conformations. The structural
details of an RNA do not typically entail the potential structural changes it can

12
adopt upon ligand binding. This adds additional complexity to the structure-based
design of RNA ligands.40
Despite recent progress in the understanding of how small molecules recognize
RNA,41 the following fundamental questions remain largely unanswered:
1. How do electrostatic interactions affect the RNA affinity and specificity ofaminoglycoside-based ligands?
2. How does one design small molecules that exhibit high affinity and highspecificity for a pre-determined RNA target?
To help answer these questions, we have addressed a number of goals:
1. Design and synthesize new small molecules that are targeted to a pre-determined RNA site.
2. Rapidly characterize the affinity and specificity of new RNA ligands usingfluorescence-based methodologies.
3. Conduct experiments in a systematic fashion so that trends in RNA-smallmolecule recognition can be identified.
To evaluate the “higher-order” biological impacts of RNA binding, we have
chosen the HIV-1 Rev-RRE interaction as our model system. This way, new RNA
ligands that show promising activities may eventually prove themselves as future
antiviral agents. Our work, along with the efforts by many other groups,
contributes to the growing body of knowledge that will aid in the future design,
synthesis, and application of small molecules directed to RNA.

13
2.0 Background: The HIV Lifecycle
HIV, the virus responsible for AIDS, relies upon the transcription and translation
machinery of its host cell.6 There are, however, a number of protein-RNA
interactions that are unique and essential to the HIV lifecycle (Figure 2.0).42
Inhibition of these key binding interactions may eventually provide a new class of
therapeutic compounds for the treatment of AIDS.
Figure 2.0: The HIV-1 lifecycle begins with the CD4-dependent invasion of thehost cell (a). The viral particle "tricks" a CD4+ host cell with the gp120 domain ofthe "Env" protein, which mimics a normal component of the human immunesystem (the major histocompatibility complex). Binding of CD4 to gp120 initiatesendocytosis and fusion of the viral and host membranes. Fusion is mediated bygp41 (the membrane-bound component of the Env protein). Upon fusion, theviral capsid is partially degraded and reverse transcriptase (Pol), transcribes the9 kilo-base single-stranded viral RNA genome into double-stranded DNA (b). Thedouble-stranded DNA copy of the HIV genetic code is then imported into thehost's nucleus, where it is permanently integrated into the host's genome (c). Atthis point, viral activity can remain dormant for years. Eventually, an RNA copy ofthe HIV DNA will be transcribed (d). Early in the replication cycle, this viral mRNAbecomes highly spliced and is translated into three regulatory proteins: Rev, Tat,and Nef (e). The Tat protein binds to its cognate RNA site termed TAR andfacilitates the transcription of full-length HIV RNA (d); since Tat itself is aneventual product of this transcription, Tat’s biosynthesis is in a positive feedbackloop, leading to a rapid accumulation of viral RNA as well as the Tat, Rev, andNef proteins. Once the concentration of Rev is sufficient, it polymerizes along theHIV RNA at a site termed the Rev response element (RRE), and initiates HIV’s“late replication” phase.

14
Figure 2.1: HIV’s “late” replication phase is initiated by the Rev-RRE interactionwhich prevents the splicing of the HIV RNA (a). From the unspliced and singlyspliced HIV RNA, the proteins needed for viroid construction are translated (b).Unspliced RNA is then packaged into outgoing viral particles to serve as theprimary genome (c).
2.1 The Rev-RRE interaction and HIV’s Late Replication Phase
The Rev response element (RRE) is an HIV-1 RNA structure essential to viral
replication.43 The Rev protein binds to the RRE and facilitates the export of HIV
RNA out of the host nucleus, while protecting it from the cell’s splicing machinery
(Figure 2.1). The importance of the "underspliced" HIV RNA is two-fold. First, it
serves as an open reading frame for the proteins that are essential to the
construction of new viral particles (Gag, Pol, and Env). Second, the unspliced
HIV RNA is packaged into the outgoing viroid, serving as its primary genome.
Successful inhibition of Rev-RRE binding, therefore, prevents the production of

15
new viral particles in two ways: the proteins essential for viroid construction are
never translated, and the future HIV genomic RNA becomes highly spliced.
Through the efforts of a number of research groups, many details regarding the
sequences, structures, and dynamics of the Rev-RRE interaction have been
revealed.44a-e The 116 amino acid Rev protein has at least three functional
domains, including an arginine-rich motif spanning amino acids #34-50 (Figure
2.2a). This positively charged domain binds to a single high-affinity site on the
RRE (bolded in Figure 2.2b) with high affinity (Kd = ~1 nM) and high specificity
(average Kd to a yeast tRNA mixture = ~1,000 nM).
Figure 2.2: (a) A domain-map of Rev protein is shown with the sequence of itsRRE binding domain (amino acids 34-50). This “arginine-rich motif” also servesas Rev’s nuclear localization signal, allowing Rev to shuttle continuously betweenthe cytoplasm and nucleus.45 The peptide RevFl, used for fluorescence-basedassays, is succinylated at its N-terminus, amidated at its C-terminus, andcontains a four alanine spacer to fluorescein (a). These modifications have beenshown to increase the helicity of this peptide, resulting in a greater RRE affinityand specificity.46 (b) The RRE, as defined by Mann,47 spans a total of 351 basesand contains a single high-affinity Rev binding site in the “Stem II” of the RRE(bolded bases between #97-162).44d

16
The RRE serves as the high-affinity Rev binding site and is part of the highly
conserved open reading frame of the gp41 “fusion domain” of the Env protein
(Figure 2.0).48 This dual function is likely responsible for the unusually low
mutation rate found in the RRE (Figure 2.3 A & B).49 The bases directly involved
in Rev binding are almost invariable, even for genetically diverse groups of HIV-1
isolates (Figure 2.3 A & B). The Rev binding site within the RRE is, therefore, a
highly attractive target for small molecule therapeutics, since small molecules
that are targeted to this site should possess consistent activities for diverse HIV-1
groups. In addition, the mutations that can lead to drug resistance should be
strongly impeded by the RRE’s dual function.
Following association of Rev with the high-affinity RRE “nucleation site” (bold
Figure 2.3 B), additional Rev molecules (approximately 10) can polymerize along
the length of the RRE in a step-wise fashion by utilization of both protein-protein
and protein-RNA interactions.47 Other groups have shown, however, that Rev
can first polymerize, then bind to the RRE in its polymeric form.44e Despite this
ambiguity, minimal mutations of the RRE within the high-affinity Rev binding site
(bold Figure 2.3 B) prevent polymerization of Rev along the entire length of
RRE.47 Without high-affinity Rev-RRE binding, the “late-phase” HIV proteins are
not expressed and the viral replication cycle is broken.44a For these reasons, we
have chosen the high-affinity Rev binding site on the RRE as our target for small
molecules (bold Figure 2.3 B).

17
Figure 2.3 A: Sequence homology for Stem II of the RRE from 5 representativeisolates from HIV-1 group M (SF2, HXB2, MAL, ELI, HIVU455), and 2 from groupO (HIVANT70, MVP5180). Sequence alignments were adopted from J-H Chen etal.50 The high affinity Rev binding site is shown in blue.
Figure 2.3 B: Secondary structure of the 66 nucleotide RRE Stem II fragment“RRE 66” from the HIV strain HXB3. The bases essential for binding the firstequivalent of Rev are shown in bold.43 A summary of homology alignment is
shown: (*) indicates a highly mutable position, (*) indicates conserved orinfrequent mutations, no symbol indicates no significant variation. The secondequivalent of Rev is proposed to bind, in vivo, to Stem IIA.51 It is interesting thatboth of the Rev binding sites within Stem II are essentially immutable.
U
GA
G
C
G GG
CG
C
A GU A
C
G U
G
C
C
G
G
C
U
A
AC A
AUG
A
*
** *
****
*
*
**
*****
**
***
**
Stem IIA
Stem IIB
Stem IIC
GCACUAUGGGCGCAGCG UCAAUGACGCUGACGGUACAGGCCAGACAAUUAUUGUCUGGUAUAGUGCGCACUAUGGGCGCAGUG.UCAUUGACGCUGACGGUACAGGCCAGACAAUUAUUGUCUGGUAUAGUGC
GCACUAUGGGCGCAGCC.UCAAUGACGCUGACGGUACAGGCCAGACAAUUAUUGUCUGGUAUAGUGC
GCACGAUGGGCGCAGCG.UCACUAACGCUGACGGUACAGGCCAGACAGUUACUGUCUGGUAUAGUGCGCACGAUGGGCGCA.CGGUCAGUGACGCUGACGGUACAGGCCAGACAAUUAAUGUCUGGUAUAGUGCGCACAAUGGGCGCGGCG.UCAAUAACGCUGACGGUACAGGCCAGACAAUUAUUGUCUGGUAUAGUGCGCACUAUGGGCGCAGCG.GCAACAACGCUGGCGGUACAGACCCACACUUUGCUGAAGGGUAUAGUGC
HXB3SF2
HXB2
MALELIHIVU455HIVANT70MVP5180 GCACUAUGGGCGCAGCG.GCAACAGCGCUGACGGUACGGACCCACAGUGUACUGAAGGGUAUAGUGC

18
2.2 Minimized RRE Constructs
To facilitate biophysical analysis of the Rev-RRE interaction, numerous groups
have minimized the Rev response element into smaller, more manageable
fragments (figure 2.4).
Figure 2.4: Removal of stem loop IIA from the 66 ntd. RRE Stem II fragmentresults in the 47 ntd. construct “RRE IIB”.52 Additional minimization of RRE IIBproduces a construct small enough (34 ntd.) to be used for NMR structuredetermination (RRE JW).53 A duplex version of the RRE allows for thermaldenaturation studies (RRE DW).54
We have found that the “core element” of the RRE (bold Figure 2.4) contributes
the same Rev-peptide binding energy for different RRE constructs, including:
RRE 66, RRE IIB, and the RRE JW (Section 3.1).
U
GA
G
C
G GG
CG
C
A GU A
C
G U
G
C
C
G
G
C
U
A
AC A
AUG
A
RRE 66
U
A
G
C
G GG
CG
C
A GU A
C
G U
G
C
C
G
A CA
A
G
G
C
G
UG
C
G
C
RRE JW
U
A
G
C
G GG
CG
C
A GU A
C
G U
G
C
C
G
G
C
U
A
AC A
AUG
G
AG
UG
C
G
C
U
A
C
G
G
C
G
C
RRE IIB
U
A
G
C
G GG
CG
C
A GU
C
G U
G
C
C
G
AG
C
U
A
G
CG
C
RRE DW
Stem IIB
Stem IIC
Stem IIA

19
2.3 Other RNA Constructs
Mutation of the minimized construct “RRE JW” can reveal which bases of the
RRE core element are essential for ligand binding. The G-rich bulge of RRE JW
has been substituted with inosine to generate “3I RRE JW” (Figure 2.5). A deoxy
version of the RRE “dRRE JW” allows a direct comparison between RNA and
DNA stem-loop recognition (Figure 2.5).
U
A C
G
CG
C
A GU A
C
G U
G
C
C
G
A C
AA
G
G
C
G
UG
C
G
C
3I RRE JW
A
G
C
G GG
CG
C
A GA
C
G
G
C
C
G
A C
AA
G
G
C
G
TG
C
G
C
dRRE JW
I I I
TT
T
Figure 2.5: RRE JW mutants used in these studies.
To evaluate the RRE specificity of a small molecule, its affinity to many different
nucleic acids must be evaluated (Section 1.6). A mixture of tRNAs (Sigma type-
X) provides a convenient and biologically relevant mixture of RNA (over 30
different mature and pre-tRNAs). Evaluation of such mixtures, however, is often
problematic (the binding constant of a small molecule to a mixture of nucleic
acids cannot be calculated). For this reason, a number of well-defined and
biologically relevant RNA constructs have also been used to examine small
molecule specificity (Figure 2.6).

20
Figure 2.6: Secondary structures of “other” RNAs used in these studies,including the 31 ntd. “TAR31” and the 27 ntd. prokaryotic “A-site27” constructs.
2.3.1 TAR31
“TAR31” is a model of the TransActivation Control Region of HIV-1.55 The Tat-
TAR interaction is necessary for the transcription of full-length HIV RNA (Figure
2.0). Inhibition of this RNA-protein interaction is another important target for drug
design.56 Both the TAR and the RRE recognize a homologous arginine-rich
domain within their respective binding partners (Tat and Rev, respectively). Both
RNAs do, in fact, have similar affinities for the Rev peptide “RevFl” (section 3.1,
Table 3.0). The RRE and TAR, however, are known to exhibit different types of
binding interactions with small molecules. The TAR has, for example, a high
affinity cation binding pocket that upon binding to guanidinium or Ca2+, facilitates
an alternate fold of the TAR.57,58 There is no evidence that such a binding pocket
G
G
G
G
GGG
G G
G
G
G
G
G
G G
G G
3'
3'
5'
5'
cleavage site
"Substrate" (S)
"Enzyme" (E) C
U
A
CC
C
C
CC
C
C
CA A A
A
A
A AA
AA
A
U
U
U
UU
C
U
UC
C
C CCG
HH16 Ribozyme
G G
GG
G G G
GG
G
C C
C C
C
C
C
CC
A A A
AU U
U U U
U CG
TAR31
C
G
G
G
GG
G GG G
CC
C
CC
C C
C C C
AU
AA
A A
A
A
A A
A
A
UU
U
U
U
UU U
U
UU
DD
G
GG
G
G GG
G
G
Cm
GmY
Ψ
T
m5C
A AAA
A
A
m5C
m7GΨ
m1A
C
C
CC
22m G
G
tRNAPhe
A-Site27
G G
G GC C
C
G G
CU A A
U
U
U GG
G C
AC
C C U
CA

21
exists on the RRE.59,60 No direct comparison of aminoglycoside affinities for the
TAR versus the RRE has been published; preliminary evaluations in our lab,
however, indicate that the trends in aminoglycoside affinity are similar for the
TAR and the RRE (as well as the HH16 Ribozyme).
2.3.2 The HH16 Ribozyme
RNA enzymes (ribozymes) are intriguing biopolymers capable of catalyzing a
variety of transformations.61 Their functional diversity can be attributed to the
complex three-dimensional folds that RNA can assume via a multitude of
secondary structures and tertiary interactions.62 Ribozymes, therefore, provide a
unique opportunity to correlate RNA structure and function. The hammerhead
ribozyme (HH16) is among the best characterized RNA enzymes.63,64 Following
association and proper folding of the enzyme and substrate strands,
phosphodiester hydrolysis is catalyzed at a specific location (Figure 2.6). Small
molecule ligands, including aminoglycosides, have been shown to inhibit the
enzymatic activity of hammerhead ribozymes.36,65,66 Two models are currently
proposed for the mechanism by which aminoglycosides inhibit enzymatic
cleavage: 1) direct displacement of enzymatically essential Mg+2 by the
ammonium groups of the aminoglycoside,65,67 2) upon binding the
aminoglycoside, RNA structural perturbations prevent the ribozyme from
adopting an enzymatically active conformation. Since Mg+2 is needed for proper
folding and cleavage of HH16,64 these mechanisms may be intimately linked.

22
2.3.3 A-site27
Many aminoglycosides exert their anti-bacterial activity by binding to the
decoding region of the 30S ribosomal subunit.30 “A-site27” is a hairpin model of
the prokaryotic ribosomal A-site, and has been shown to form a well-defined
complex with paromomycin.68 The NMR structure of parmomycin bound by the A-
site27 provided one of the first high-resolution views of a biologically relevant
RNA-small molecule complex.68 Recent crystal structures of the ribosome
indicate, however, that this region of the A-site is significantly distorted when
compared to NMR structure of A-site27.33 In addition, the binding of the A-site by
aminoglycosides may be affected by interactions mediated by tRNA residing in
the A-site.33 These “higher-order” interactions can complicate the relationships
observed in RNA-small molecule studies when minimized RNA constructs are
used. Indeed, Wong’s data demonstrates that there is no correlation between the
A-site27 affinity and the antibacterial activities of a large library of aminoglycoside
derivatives.69 Despite this, the A-site27 hairpin continues to serve as a model for
the development of small molecules with antibiotic activities.
2.3.4 tRNAPhe
tRNAPhe (Figure 2.6) has only recently been shown to bind to aminoglycosides.70
While tRNAPhe may not be an important target of drug design, it provides perhaps
one of the most extensively studied RNAs ever.71 Efficient commercial production
has allowed the widespread study of tRNAPhe for over 30 years. These studies

23
indicate that tRNAPhe has diverse structural features that provide well-defined
binding sites for small molecules.27
2.3.5 Duplex DNA and RNA
Simple duplex DNA and RNA also serve as convenient sources of “other” nucleic
acids as well. These commercially available duplexes are enzymatically
synthesized and will contain only a small fraction of hairpins and other structural
imperfections. These polymers will typically extend, unbroken, for thousands of
bases. Examples of the nomenclature used for these duplexes is as follows:
Name Type Structure
Poly r[A] – r[U] RNA duplex
Poly d[AT] – d[AT] DNA duplex
Poly r[A] RNA single strand
Oligo d[T]15 DNA single strand
By evaluating the binding affinity of a small molecule to many different nucleic
acids, the RRE specificity of new ligands can be determined, and the overall
nucleic acid selectivity of the ligand becomes apparent.
AU
A A A AU U U U
.
...
.
...
AT
T A T AA T A T
.
...
.
...
A A A A A. .. .
T (T)13T

24
3.0 Methods for Measuring RNA-Ligand Affinity and Specificity
Numerous methods are available for evaluating a small molecule’s ability to
inhibit the binding of two macromolecules. Traditional techniques such as gel-
shift electrophoresis and analytical ultracentrifugation are limited by their inability
to rapidly screen large numbers of potential inhibitors. Newer methodologies
such as mass spectrometry and surface plasmon resonance are powerful tools,
but hardware costs and data analysis can be vexing. Fluorescence-based
techniques have proven to be highly sensitive, versatile, and relatively
inexpensive for the examination of RNA-ligand binding interactions.72 Five
fluorescence-based techniques are described for the evaluation of both affinity
and specificity of RNA ligands.
3.1 Fluorescence Polarization Anisotropy
Organic fluorophores possess a transition dipole moment that is related to the
differences between the dipole moments of the ground state versus the excited
state.73 In order for a fluorophore to absorb energy from light, the oscillating
electronic vector of the photon must be parallel to the transition dipole of the
molecule. Following excitation, the photon that can be emitted from the excited
state will also be parallel to the transition dipole of excitation. Plane polarized
light that is absorbed by a fluorophore immobilized into a solid state will,
therefore, retain its polarization in the emitted photon. For fluorophores in
solution, the tumbling rate of the fluorophore is proportional to the degree of
depolarization. Polarization anisotropy is measured by comparing the

25
fluorescence emission intensity that passes through parallel versus perpendicular
polarizing filters (relative to the plane polarized excitation source (Figure 3.0)).
Figure 3.0: Fluorescence polarization anisotropy. The extent of polarization (the“anisotropy” value) is inversely proportional to the tumbling rate of thefluorophore in solution.74 The tumbling rate of the fluorophore is proportional tothe total size and shape of the fluorophore, as well as to the temperature andviscosity of the solvent.74
Figure 3.1: (A) Linear relationship between the concentration of the fluorescentpeptide “RevFl” and the total fluorescence intensity. (B) Fluorescence anisotropyof the fluorescent peptide “RevFl” as a function of the total emission intensity ofthe sample. Excitation is at 490 nm. Error bars for anisotropy reflect the standarddeviation for 10 anisotropy measurements made on the same day using thesame sample reflecting, therefore, only those errors related to the instrumentitself (Perkin Elmer LS-50B Luminescence Spectrometer). Systematic errorsassociated with macromolecular and small molecule quantifications are typicallythe largest sources of errors for the experiments described within this thesis(typically ± 30%). Errors associated with volume and weight measurements arerelatively small and random (typically ± 15%).
I
I
Anisotropy =I
I
I
I
-
+2
Emission Intensity (530nm)
0 200 400 600 800
Ani
sotr
opy
ofR
evF
l
0.070
0.075
0.080
0.085
0.090
0.095
0.100B)
Concentration of RevFl (nM)
0 5 10 15 20 25 30 35
Em
issi
onIn
tens
ity(5
30nm
)
0
200
400
600
800A)

26
In theory, the fluorescence anisotropy of a fluorophore is an intensive property,
and therefore not dependent of the total fluorescence intensity of the sample.74 In
practice, however, a significant perturbation is found at low emission intensities
(Figure 3.1 B).75 This effect is due in part to instrumental limitations, but is easily
avoided by keeping emission intensities above 100 (arbitrary units) using a
Perkin Elmer LS-50B Luminescence Spectrometer with maximum slit widths.
Fluorescence anisotropy provides a useful tool to follow the real-time association
and subsequent inhibition of the Rev-RRE interaction.76 The tumbling rate of the
fluorescein labeled Rev peptide “RevFl” decreases upon binding to the RRE (see
Figure 2.2 and Section E 2.1 for the sequence and structure of RevFl). As the
RRE is added to a 10 nM solution of RevFl, their association is observed by an
increased anisotropy value (Figure 3.2 A). Three of the RRE constructs shown in
Figure 2.4 (RRE 66, RRE IIB, and RRE JW) were evaluated for RevFl affinity.
Since the binding stoichiometry between Rev34-50 and RRE is known to be 1:1
(for all three of these RRE constructs), the association curves can be used to
calculate binding constants for each RNA (Figure 3.2 B, Table 3.0). The largest
RRE construct (RRE 66) has a 4-fold higher affinity for RevFl than RRE IIB and a
12-fold higher affinity than RRE JW (Table 3.0). Detailed kinetic analysis of Rev-
RRE binding reveals the association rate for 7 different RRE constructs is very
similar (near diffusion-limited at 106 M-1 s-1); the differences in affinity between
these different RRE constructs were attributed to different dissociation rates.77

27
Figure 3.2: (A) Binding of RevFl to three different RRE constructs, according tothe changes in the fluorescence anisotropy of RevFl (See section E 3.1 – E 3.2for experimental details). Notice how the magnitude of the anisotropy change atsaturation is roughly proportional to the size of each RNA construct (Figure 2.4).(B) Since these binding interactions have been shown to be simple two-statesystems, the change in fluorescence anisotropy is directly proportional to thefraction of RevFl bound by the RRE, allowing for simple analysis of the bindingdata (Section 3.6).
Table 3.0: RevFl Binding Constants (Kd) and Free Energies (Kcal/mol) at 22 °C.
RRE 66* RRE IIB* RRE JW* tRNAPhe* C.T. DNA** TAR 31*
Kd 3 ± .5nM 10 ± 3nM 35 ± 5nM 2.4 ± .4µM 25.6 /- 4µM 35 ± 5nM
∆G -11.6 ± .2 -10.8 ± .2 -10.0 ± .2 -7.5 ± .1 -6.18 ± .1 -10.0 ± .2
* Kd calculated per construct** Kd calculated per helical repeat (20 bases)*** ∆G = -RT ln(1/Kd)
A)
RNA Concentration (nM)
0 200 400 600
Flu
ores
cenc
eA
niso
trop
yof
Rev
Fl
0.075
0.080
0.085
0.090
0.095
0.100
0.105
0.110
0.115
RRE 66RRE IIBRRE JW
B)
Concentration of RNA (nM)
1 10 100 1000 10000
Fra
ctio
nof
Rev
FlB
ound
0.0
0.2
0.4
0.6
0.8
1.0
RRE 66RRE IIBRRE JW

28
Larger RNA constructs possess a greater total negative charge. It is not
surprising, therefore, that RRE 66 shows the highest affinity for the polycationic
Rev peptide (Table 3.0). By comparing the Rev binding energies to the size of
each RRE construct, an interesting trend is revealed (Figure 3.3). A plot of ∆G
versus the size of each RRE (in nucleotides) reveals a straight line that allows
one to extrapolate the binding energy of the RRE when the size of the RRE = 0
nucleotides (Figure 3.3). This indicates that the energetic contribution of the RRE
“core element” for all three constructs is ∆G = -8.4 Kcals / mole. The slope of this
line indicates that ∆G = -0.05 Kcal/ mole*nucleotide. This value may represent
the intra-complex electrostatic “advantage” provided by each additional base and
may be related to the magnitude of non-contact or “medium-range” electrostatic
interactions in this system. This type of binding data may assist future
computational modeling of electrostatically-driven RNA-ligand binding
interactions.78
Figure 3.3: A linear fit of ∆G (per nucleotide) versus RRE size (in nucleotides)has a Y-intercept of 8.4 Kcal/mole and a slope of –0.05 Kcal/mole*nucleotide.
0 10 20 30 40 50 60 70 80 90-13
-12
-11
-10
-9
-8
-7
-6
Size of RRE Construct (Nucleotides)
∆∆ ∆∆G
(Kca
l/mol
e)

29
The affinity of RevFl to a number of other nucleic acids has been evaluated. Both
tRNAPhe and a mixture of yeast tRNAs (Sigma type-X) have similar binding
isotherms that indicate a 1,000-fold lower affinity for RevFl as compared to a
similarly sized RRE (RRE 66, Table 3.0). Each helical repeat of calf thymus DNA
has approximately a 10,000-fold lower affinity to RevFl than the RRE (assuming
one peptide binding site per helical repeat of DNA). Rev’s low affinity to most
other nucleic acids indicates a high specificity for the RRE (Section 1.6). RevFl
does, however, bind to TAR31 with high affinity (Table 3.0), this finding has also
been reported by other groups.79 Since both the TAR and the RRE bind to
homologous arginine-rich domains within their respective proteins, the high
affinity of RevFl for TAR31 is not surprising. The full-sized Rev protein, however,
is reported to effectively discriminate between the TAR and the RRE, suggesting
that the Rev-protein has a higher RRE specificity as compared to RevFl.77 The
Rev protein cannot, however, easily be studied using fluorescence anisotropy
due to its tendency to self-associate and to bind the RRE in greater than 1:1
stoichiometry.80 In addition, significant changes in fluorescence anisotropy are
typically only observed when a small fluorescent ligand binds to a much larger
macromolecule (like the RevFl- RRE respectively). The mass of the Rev-protein
is on the same order as the 66 nt. stem II of the RRE; therefore upon binding the
RRE66, only a small change in the anisotropy of a fluorescent Rev protein would
be expected.

30
Fluorescence anisotropy provides a fast and accurate method for the evaluation
of molecules that can bind to the RRE and displace the Rev peptide (Figure 3.4).
Figure 3.4: Fluorescence anisotropy displacement experiments. Once the RevFl-RRE complex is formed (top), an inhibitor "X" can be added (bottom).Competitive inhibitors will bind to the free RRE, and shift the 3-way bindingequilbria towards release of the free RevFl peptide (causing a decreasedanisotropy of RevFl). If a single inhibitor binding site on the RRE displaces Rev,the absolute affinity of the RRE – “X” binding interaction can be calculated (Ki isequivalent to Kd). In most cases, however, the binding stoichiometry of theinhibitor is not known, so its affinity to the RRE is evaluated by measuring theconcentration of inhibitor needed to displace ½ of the Rev peptide from the RRE(defined as its IC50 value). See Section E 3.1 for experimental details.
To evaluate what impact, if any, the addition of fluorescein to the Rev peptide
has on RRE binding, a Rev peptide without fluorescein (“Rev-IA”) was used to
displace RevFl (see Section E 2.1 for the sequence and synthesis of each
peptide). Using fluorescence anisotropy, a Ki of 2 ± 1 nM was measured for Rev-
IA (see Section E 3.1 for details). This indicates that only a small perturbation
0 2 4 6 8 10 12 14 16
0 .0 80
0 .0 82
0 .0 84
0 .0 86
0 .0 88
0 .0 90
0 .0 92
0 .0 94
0 .0 96
0 .0 98
Concentration of "X"
0 50 10 0 15 0 200
0.0 80
0.0 85
0.0 90
0.0 95
0.1 00
0.1 05
0.1 10
Concentration ofRRE (nM)
0 .115
X
X
+Kd
Kd = 2 nM
+
Ki
Ki
RRE RevFl Rev-RRE Complex
=
=
[RRE] [X]
[X - RRE]
[RevFl]
Kd [Rev-RRE Complex] [X]
[X - RRE]A
niso
trop
yA
niso
trop
y
Kd =[RRE] [RevFl]
[Complex]
IC50 = 1 µM
Kd = 3 nM

31
(less than 2-fold) is introduced by the addition of fluorescein to the Rev peptide.
Native polyacrylamide gel-shift experiments also indicate that only a small
perturbation in affinity is introduced by the addition of fluorescein to the C-
terminus (data not shown). Compared to RevFl, a 5-fold lower affinity is observed
when fluorescein is attached to the N-terminus of the Rev peptide (see section E
2.1 and reference 76 for “FlRev”). The differences between the N- and C- termini
can be rationalized by examining the NMR structure of the Rev-peptide RRE
complex.53 The N-terminus of the α-helical Rev peptide is buried in the major
groove of the RRE, while the C-terminus is free in solution.53 Modification of
Rev’s N-terminus, therefore, interferes with RRE binding.
3.2 Solid-Phase Peptide Displacement Assay
A novel biophysical approach has been developed to characterize the affinity and
specificity of small molecules for the RRE. The assay is based on the competition
between potential RRE binders and RevFl for binding to an immobilized RRE 66
construct (Figure 3.5 – 3.6). Ligands that bind to the Rev binding site on the
RRE will displace RevFl into solution. The emission intensity of the solution is
then measured to evaluate the RRE affinity of the ligand.
The components of the assay are schematically shown in Figure 3.5 and include:
(a) insoluble agarose beads covalently modified with streptavidin, (b) a
biotinylated RRE fragment, and (c) the fluorescein-labeled Rev peptide “RevFl”.
Assembly of these components forms an immobilized “ternary complex”, where

32
the biotinylated RRE binds to streptavidin, and RevFl binds to the RRE with a
dissociation constant that is the same as measured in solution.
Figure 3.5: Assembly of the complex used for the solid-phase assay. Seesection E 3.2 for technical details regarding the solid-phase assay.
Calculating the binding constant for RevFl and the RRE66 on the solid-phase is
different than in solution, since the “surface volume” of free RRE is the same as
the surface volume of Rev-RRE complex. The equation for Kd is simplified:
Kd (on a surface) = [RRE][Rev-Fl] = (moles of free RRE)[Rev-Fl][complex] (moles of complex)
The concentration of RevFl in the supernatant “[Rev-Fl]” is calculated by
comparing the fluorescence intensity of the supernatant to a calibration curve of
known concentration versus fluorescence emission intensity (Figure 3.1 A). The
total moles of RNA on the solid support “(moles RRE)” is determined during the
immobilization of the biotinylated RRE: the UV absorbance of the supernatant is
used to calculate the amount of RNA absorbed by the agarose/streptavidin gel.

33
The moles of RRE-bound by RevFl “(moles complex)” is determined by stripping
RevFl from the gel with 8M guanidinium HCl, then quantifying the supernatant in
a buffered solution (see section E 3.2 for additional details).
The “solid-phase” Kd for RevFl-RRE66 is found to be 3 ± 2 nM, and is
independent of the effective loading of the RRE onto the agarose beads (from
0.1 – 2.0 nmoles RRE/mL agarose), suggesting that the immobilized RRE
complexes are non-interacting over this loading range.
As in solution, RevFl binds to the RRE with high specificity. The immobilized
Rev-RRE complex is not significantly inhibited by the addition of large excesses
(200-fold) of tRNA or DNA (low µM concentrations). Titration of the RRE or Rev-
IA, however, efficiently displaces RevFl from the solid-support (IC50 = 90 nM and
35 nM, respectively). Importantly, RevFl shows no binding of
argarose/strapavidin gel that lacks immobilized RRE. See section E 3.2 for
technical details regarding the solid-phase assay.
Following formation of the immobilized Rev-RRE complex, small molecule
inhibitors are added, and the fraction of RevFl in solution is monitored as a
function of inhibitor concentration (Figure 3.6 A). The concentration of inhibitor
needed to displace ½ of the peptide (the IC50 value) is measured in the presence
and absence of an excess of competitor nucleic acids (Figure 3.6 A and B).

34
Figure 3.6: Measuring the relative RRE affinity and specificity of a ligand usingthe solid-phase assay.
The ratio of these IC50 values reflects the affinity of the small molecule to the
competitor nucleic acids relative to the RRE (Figure 3.6 A and B). To evaluate
the RRE specificity of a small molecule, numerous mixtures of competing nucleic
acids are used (tRNAMIX, C.T. DNA, etc.). Weighting the RRE affinity of the small
molecule by its affinity to a large number of other potential binding sites allows
the RRE specificity of a small molecule to be established (Section 1.6). Indeed,
the RRE specificity, as we have defined it, is proportional to the Rev-RRE

35
inhibitory activity of a ligand in the presence of “all” other potential nucleic acids
targets (Section 1.6). Most biophysical methods (including fluorescence
anisotropy, surface plasmon resonance, NMR) are not amenable to the analysis
of complex mixtures of biomolecules, making the examination of specificity an
arduous task.
To examine the effectiveness and dependability of this novel assay, two families
of known Rev-RRE inhibitors have been evaluated: the aminoglycoside
antibiotics and the aromatic diamidines (Figure 3.7). An example of the raw
displacement data is shown in Figure 3.8, where increasing concentrations of
neomycin B displace the RevFl peptide. Table 3.1 summarizes the IC50 values
obtained by the solid-phase assay in comparison to fluorescence anisotropy
measurements. An excellent agreement between the two assays is observed for
the aminoglycosides.
Table 3.1: IC50 Values (µM) for Rev-RRE inhibition*
Compound Anisotropy** Solid-Phase Solid-Phase Solid-Phasewith DNA with tRNA
Neomycin B 7 7 8 20Tobramycin 47 45 50 100Kanamycin B 80 90 90 170Kanamycin A 780 750 750 1200
"DB340" 0.3 0.1 1.3 0.7"DB182" 1.5 0.4 4 0.8"A132" 10*** 1.2 10 3
* Standard deviation of all measurements are within ± 25% of reported value.** Using 10 nM RevFl and 100 nM RRE66.*** Significant fluorescence quenching during course of titration.

36
OHOH2N
OH2N NH2
O
O
OH
R1
NH2
OH
HTobramycin (3)
R2OH
R1
HO
Kanamycin A (1)
HO
OHKanamycin B (2)
R2
OH
NH2
NH2
R O R
R OR NH R
HN
N
R
NH2
"A132" (6)
"BD182" (8)
"DB340" (7)
R =NH (CH2)3NH(CH3)2
(A)
(B)
O
NH2
H2NO
HOHO
OO
NH2
OH
R
OHO
HOO
HO
HO
NH2
H2N
Neomycin B (5)
OHR1
Paromomycin (4)
NH2
Figure 3.7: Known small-molecule inhibitors of Rev-RRE binding: theaminoglycosides (A)82 and the “aromatic diamidines” (B).83
The aromatic diamidines are more potent Rev-RRE inhibitors than the
aminoglycosides, and their previously reported trends in RRE affinity are again
accurately reproduced (DB340 > BD182 > A132).83a A 10-fold increase in IC50
values in the presence of competing DNA indicates that these compounds also
have a high affinity for double-stranded DNA (Table 3.1). In addition, these
compounds have a moderate affinity for a mixture of tRNA. Taken together, this
indicates that these compounds are only moderately selective for the RRE.
DB340, however, forms a well-defined complex with the RRE that has been
characterized by NMR.84 Interestingly, this compound binds as a dimer in the

37
minor groove of the RRE.84 Since Rev binds in the major groove of the RRE,53
the displacement of RevFl by DB340 must involve an allosteric mechanism.
Figure 3.8: Raw data from solid-phase displacement experiments showing thefluorescence emission of the supernatant as a function of neomycin Bconcentration. To reduce light scattering at 500 nm, excitation of RevFl is at470nm. Excitation at 490nm also yields the same IC50 values. See E 3.2 foradditional details.
Systematic discrepancies between IC50 values determined from the solid-phase
assay versus fluorescence anisotropy (Table 3.1) reflect a general problem
associated with applying fluorescence anisotropy to binders that are either
fluorescent or fluorescence quenchers. Fluorescent inhibitors will themselves
have a fluorescence anisotropy value. In addition, significant quenching of the
RevFl peptide can affect the measured anisotropy (Figure 3.1 B). The solid-
phase assay easily adapts to these problems: the supernatant (containing
excess inhibitor and displaced RevFl) can be removed, and the fluorescence
500.0 520 540 560 580 600 620 640 660 680 700.5
0.0
5
10
15
20
25
30
35
40
45
7.1In
tens
ity(a
rbitr
ary
units
)
Wavelength (nm)
Control (no neomycin )
4.3 µM
10 µM
21 µM
43 µM
100 µM
2000 µMControl (8M guanidinium HCl)

38
remaining on the solid support can be quantified. After removing the supernatant,
isopropyl alcohol is used to wash the support (this effectively “locks” the
remaining RevFl onto the immobilized RRE, due to salt-bridge formation). The
peptide remaining on the support is quantified by “stripping” the gel with 8M
guanidinium HCl and quantifying the supernatant in buffer. Gel mobility shift
assays were conducted to confirm that for inhibitors that interfere with RevFl
fluorescence, IC50 values obtained from the solid-phase assay are, indeed, more
accurate than the IC50 values derived from fluorescence anisotropy (Figure 3.9).
Figure 3.9: Native gel-shift electrophoresis is used to visualize formation andsubsequent inhibition of the Rev-RRE complex, thereby providing an orthogonalmethod to measure the approximate IC50 values of Rev-RRE inhibitors. Thenumerical values indicate the concentration of each ligand (µM). Interestingly, akinetically stable complex is formed between DB340 and the RRE66, resulting ina small shift compared to the free RRE. See E 3.2.3 for experimental details.
The solid-phase assay is used to discover and characterize new RRE
ligands.81,85 For example, the enantiomeric octahedral metal complexes ∆- and
Λ- [Ru (bpy)2 Eilatin]+2 are found to be potent inhibitors of the Rev-RRE complex
and exhibit very interesting selectivities (see Figure 3.10 and Table 3.2). Both
fluorescence anisotropy and the solid phase assay indicate that each enantiomer
has approximately the same RRE affinity. In the presence of DNA, however, the
Λ enantiomer loses its potency by a factor of 25, and the ∆ enantiomer by a
RRE
RRE+
Rev
Neomycin
100101
"A132" "DB340" "BD182" Ru(bpy)3 EilatinRu(bpy)20.1 1 10 0.1 1 10 0.1 101 10,0001,000100 0.1 1 10

39
factor of 5. This indicates that the Λ enantiomer has a higher affinity for double-
stranded DNA as compared to the ∆ enantiomer. In the presence of tRNAMIX, the
potency of neither compound is affected. This indicates that these metal
complexes have a high specificity for the RRE as compared to other RNAs, but
also exhibit high affinity for DNA. Eilatin-containing metal complexes also
possess anti-HIV activities and some very surprising trends in nucleic acid
specificity (Section 4).
FIgure 3.10: Octahedral metal complexes evaluated by the solid-phase assay.
Table 3.2: IC50 Values (µM) for Rev-RRE inhibition*
Compound Anisotropy Solid-Phase Solid-Phase Solid-Phase+DNA +tRNA
∆-[Ru(bpy)2Eilatin]2+ 1 2 10 2Λ-[Ru(bpy)2Eilatin]2+ 1 2 50 2[Ru(bpy)3]
2+ 170** >10,000 n.d. n.d.
* Standard deviation of all measurements are within ± 30% of reported value.**Significant fluorescence quenching during course of titration.
Both affinity and specificity are crucial for the design and evaluation of RNA-
protein inhibitors. The assembly of an immobilized Rev-RRE complex has
generated a simple, rapid, and quantitative assay that has facilitated the
∆-[Ru(bpy)2Eilatin]2+ (10)Λ-[Ru(bpy)2Eilatin]2+ (9) rac-[Ru(bpy)3]2+ (11)
Ru
N
N
N
N
N
N
N
N
Ru
N
N
N
N
N
N
2+
Ru
N
N
N
N
N
N
N
N
2+ 2+

40
discovery and characterization of new RNA ligands. Critical evaluation of the
assay itself has shown that the expected inhibitory activities of diverse and
potentially problematic families of molecules are faithfully reproduced. Since the
solid-phase assay can be conducted in complex mixtures of biomolecules, it is a
powerful tool for the characterization of an inhibitor's specificity. This type of
assembly should be useful in other nucleic-acid protein systems and amenable to
high throughput automation.
3.3 Ethidium Bromide Displacement
The fluorescence intensity of ethidium bromide (Figure 3.11) typically increases
upon the binding of nucleic acids.86 Subsequent displacement of ethidium is
apparent by a decrease in emission intensity upon addition of a competitive
inhibitor (Figure 3.12). Since it binds to most DNAs and RNAs, ethidium
displacement experiments can be conducted using a wide range of nucleic
acids.72b
Figure 3.11: Two classic intercalating agents that bind to the RRE. 9-aminoacridine also carries a positive charge under neutral conditions (pKa = 8.1).88
BrN
NH2H2N
ethidium bromide (12)
N
NH2
9-amino acridine (13)
- +
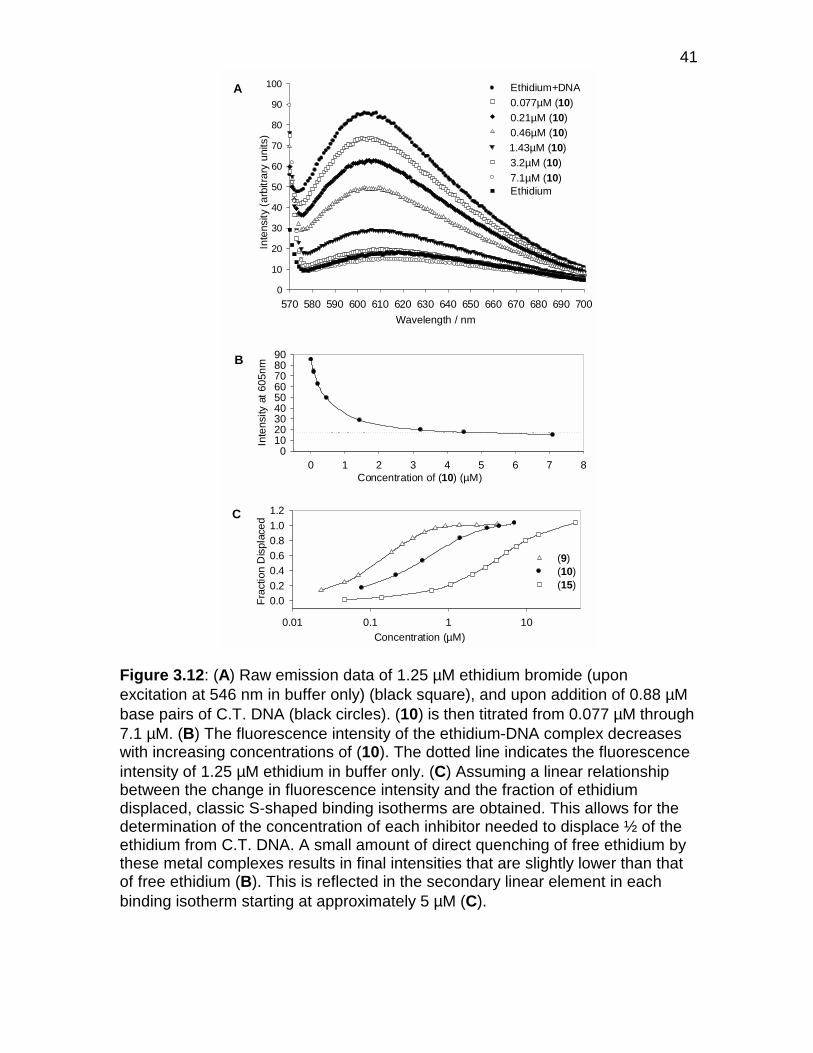
41
Figure 3.12: (A) Raw emission data of 1.25 µM ethidium bromide (uponexcitation at 546 nm in buffer only) (black square), and upon addition of 0.88 µMbase pairs of C.T. DNA (black circles). (10) is then titrated from 0.077 µM through7.1 µM. (B) The fluorescence intensity of the ethidium-DNA complex decreaseswith increasing concentrations of (10). The dotted line indicates the fluorescenceintensity of 1.25 µM ethidium in buffer only. (C) Assuming a linear relationshipbetween the change in fluorescence intensity and the fraction of ethidiumdisplaced, classic S-shaped binding isotherms are obtained. This allows for thedetermination of the concentration of each inhibitor needed to displace ½ of theethidium from C.T. DNA. A small amount of direct quenching of free ethidium bythese metal complexes results in final intensities that are slightly lower than thatof free ethidium (B). This is reflected in the secondary linear element in eachbinding isotherm starting at approximately 5 µM (C).
Wavelength / nm
570 580 590 600 610 620 630 640 650 660 670 680 690 700
Inte
nsity
(arb
itrar
yun
its)
0
10
20
30
40
50
60
70
80
90
100 Ethidium+DNA0.077µM (10)0.21µM (10)0.46µM (10)1.43µM (10)3.2µM (10)7.1µM (10)Ethidium
Concentration of (10) (µM)0 1 2 3 4 5 6 7 8
Inte
nsity
at60
5nm
0102030405060708090
Concentration (µM)0.01 0.1 1 10
Fra
ctio
nD
ispl
aced
0.00.20.40.60.81.01.2
(9)(10)(15)
A
B
C

42
Ethidium is known to have variable binding stoichiometries and a wide range of
affinities to different nucleic acids.87 The IC50 values for a given inhibitor,
therefore, cannot be compared between different nucleic acids (unless Ki values
are calculated, requiring a rigorous assessment of both the ethidium-nucleic acid
affinity, and the binding stoichiometries involved in displacement). Comparing the
IC50 values for ethidium displacement from the same nucleic acid, however, is
useful for comparing the relative affinity of each ligand. Representative examples
of ethidium displacement experiments are shown in Figure 3.12. In agreement
with the solid-phase assay, ethidium displacement indicates that the Λ
enantiomer of [Ru(bpy)2Eilatin]2+ (9) has a significantly higher affinity to calf
thymus DNA as compared to the ∆ enantiomer (10).
3.4 Direct Observation of Small Molecule - Nucleic Acid Association:Monitoring Photophysical Changes of the Small Molecule
A number of Rev-RRE inhibitors exhibit changes in their photophysical properties
upon binding nucleic acids (some examples of “direct binding studies” using
fluorescence anisotropy have already been presented in Section 3.1). In addition
to fluorescence anisotropy, UV-vis absorbance and/or fluorescence emission
spectroscopy are routinely used to probe RNA or DNA binding of small
molecules. The sensitivity of each technique is, however, significantly different.
Fluorescence emission measurements are often 100 – 1,000 fold more sensitive
than absorbance spectroscopy. By measuring the spectral changes of the ligand
as a function of nucleic acid concentration, binding isotherms can be generated

43
and used to calculate affinities. Direct binding analysis offers some advantages
over the displacement assays described above. Direct binding isotherms can be
used to calculate absolute binding affinities (Kd), which are more
thermodynamically meaningful than activity measures (IC50 values). Direct
observation of small molecule - RRE binding cannot, however, determine the
functional inhibition of an RNA or DNA. Some small molecules, for example, can
bind the RRE with high affinity, but not displace the Rev peptide. For example
eilatin (14) binds to the RRE with sub-µM affinity (as evidenced from its changes
in fluorescence anisotropy), but it does not displace the Rev peptide at these
concentrations (Figure 3.13). This indicates that eilatin’s high-affinity binding
site(s) on the RRE are not disruptive to Rev binding. Neomycin B is another
example of a ligand that has a high-affinity binding site on the RRE, but
association to this site is not sufficient to displace Rev.89
Some small molecules, including ethidium bromide (12), show more consistency
between direct binding and Rev displacement isotherms (Figure 3.14). It
appears, therefore, that ethidium’s highest affinity binding site(s) on the RRE are
capable of displacing Rev.
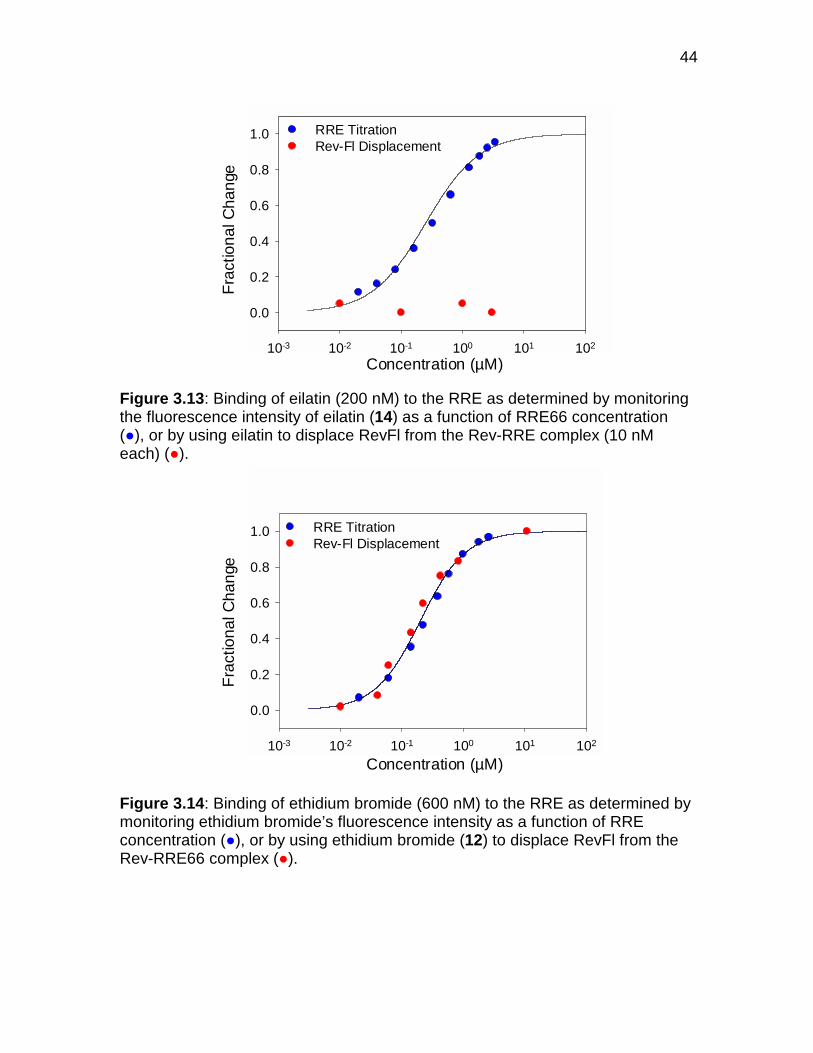
44
Figure 3.13: Binding of eilatin (200 nM) to the RRE as determined by monitoringthe fluorescence intensity of eilatin (14) as a function of RRE66 concentration(●), or by using eilatin to displace RevFl from the Rev-RRE complex (10 nMeach) (●).
Figure 3.14: Binding of ethidium bromide (600 nM) to the RRE as determined bymonitoring ethidium bromide’s fluorescence intensity as a function of RREconcentration (●), or by using ethidium bromide (12) to displace RevFl from theRev-RRE66 complex (●).
10-3 10-2 10-1 100 101 102
0.0
0.2
0.4
0.6
0.8
1.0 RRE TitrationRev-Fl Displacement
10-3 10-2 10-1 100 101 102
0.0
0.2
0.4
0.6
0.8
1.0 RRE TitrationRev-Fl Displacement
Concentration (µM)
Concentration (µM)
Fra
ctio
n alC
hang
eF
ract
ion a
lCha
nge

45
The interpretation of direct binding data is critically dependent on the
experimental conditions, especially the concentration of the observable species
relative to the affinity of the RNA-ligand interaction. Most small molecules will
have more than one binding site on any given RNA construct, and each of these
binding sites will typically have a different affinity for the small molecule.89 If the
concentration of the observable ligand is low compared to the concentration of
nucleic acid added to bind ½ of the ligand, the binding isotherm will reflect the
ligand’s association to its highest affinity binding site. At higher ligand
concentrations, the binding isotherm may also reflect binding to some of its
lower-affinity binding sites as well. If the concentration of the ligand is very high
compared to its nucleic acid affinity, the binding isotherm will reflect its binding to
all potential sites. The information provided by each these three situations is very
different, and the binding isotherms must be interpreted accordingly (Section
3.6).
3.5 Direct Observation of Small Molecule - Nucleic Acid Association:Monitoring Photophysical Changes of the Nucleic Acid
3.5.1 Thermal Denaturation
The bases of RNA and DNA are active chromophores. The thermal denaturation
of nucleic acid can be monitored by measuring the change in UV absorbance of
a nucleic acid solution as a function of temperature. A significant hyperchromicity
(a higher molar extinction coefficient) of the nucleic acid at 260 nm is observed
upon the melting of duplex regions into single stands (usually a 5 – 15%

46
increase, depending on the specific base composition and initial structure). The
temperature of melting (Tm) is defined as the temperature where ½ of the DNA or
RNA becomes denatured; for duplex nucleic acids this transition is highly
cooperative and appears as an inflection point in the plot of absorbance versus
temperature (Figure 3.15).
Figure 3.15: Thermal denaturation of calf thymus DNA (20 µM of bp) (A). The Tm
appears as an inflection point at 88.5 °C. Upon addition of 10 µM of ∆- [Ru (bpy)2
Eilatin]+2 a ∆Tm = +4.3 °C increase is observed (B), or upon addition of 10 µM ofΛ- [Ru (bpy)2 Eilatin]+2 a ∆Tm = >+9 °C increase is observed (C). See E 3.5 forexperimental details.
Temperature (oC)
50 60 70 80 90 100
Cha
nge
inA
bsor
banc
e(2
60nm
)
0.00
0.05
0.10
0.15
0.20Tm = 92.8 oC
50 60 70 80 90 100
Cha
nge
inA
bsor
banc
e(2
60nm
)
0.00
0.05
0.10
0.15
0.20
Tm > 97.6 oC
Tm = 88.5oC
50 60 70 80 90 1000.00
0.05
0.10
0.15
0.20
A
B
C
Cha
nge
inA
bsor
banc
e(2
60nm
)

47
The Tm can be monitored in the presence of small molecule ligands to examine
relative binding energies (Figure 3.15). In most cases, the small molecule binds
to the duplex nucleic acid with a higher affinity than the single-stranded form,
thus stabilizing the duplex form. Stabilization shifts the Tm to higher
temperatures.90 The change in the Tm (∆Tm ) is proportional to the ligand’s affinity
to the folded form of nucleic acid weighed by its affinity to the melted form.
Consistent with ethidium displacement and the solid-phase assay, Tm
experiments indicate that Λ- [Ru (bpy)2 Elatin]+2 (9) has a higher affinity for
duplex DNA as compared to ∆- [Ru (bpy)2 Elatin]+2 (10) (Figure 3.15).
3.5.1 Fluorescent Nucleoside Mimics
A recent and significant improvement in the direct spectroscopic observation of
nucleic acids has proven to be the incorporation of fluorescent base analogs into
nucleic acids.91 Currently, 2-aminopurine (2-AP) is unmatched in its desirable
fluorescence properties along with its minimal perturbation of nucleic acid
structure.92 2-AP is capable of base-pairing with both uracil and thymidine and
introduces little or no disruption of RNA and DNA duplexes (Figure 3.16).92,93
Figure 3.16: Adensine-uracil base pair and 2AP-uracil base pair.
NN H
O
R O
R
HNH
NN
N
N
AU
NN H
O
R O
RNN
N
N
H NH
U 2AP

48
2-AP’s fluorescence emission intensity is highly sensitive to environmental
changes, making it an attractive probe for nucleic acid structure and dynamics.92
A number of interesting studies have been made possible by site-specific
incorporation of 2-AP into RNA, including: the analysis of RNA-RNA binding,94
folding and catalysis,95 and Mg+2 binding.96 When 2-AP was incorporated into
the RRE IIB, important new insights were gained regarding the mechanism
responsible for Rev peptide displacement from the RRE by neomycin B.89
In our continuing investigation into the mechanism(s) responsible for the
inhibition of the enzymatic activity of the HH16 ribozyme (section 2.2 and refs
35,64), we have incorporated 2-AP into the substrate strand of HH16 ribozyme
(Figure 3.17). By placing 2-AP immediately adjacent to the cleavage site, it was
hoped that the cleavage chemistry of HH16 could be monitored in real time.97
Both enzyme-substrate association and enzymatic cleavage can be followed by
monitoring the fluorescence of emission of 2-AP (Figure 3.18 and 3.19). Upon
titration of the enzyme strand, the emission intensity of the 2-AP-containing
substrate is significantly quenched, allowing for the measurement of enzyme-
substrate affinity at three different salt concentrations (Figure 3.18).

49
Figure 3.17: Enzyme-substrate association, followed by enzymatic cleavage forthe hammerhead HH16 ribozyme (M = G, N = C) and for the fluorescent HH16ribozyme (M = 2-AP, N = U).
Figure 3.18: Conducted in the absence of Mg2+, the fluorescence intensity of the2-AP modified HH16 substrate is monitored as a function of enzymeconcentration. At 50 mM NaCl, Kd = 17 ± 2 nM, at 200 mM NaCl Kd = 5.7 ± 1 nM,and at 500 mM NaCl Kd = 1 ± 0.7 nM. Curve fitting was conducted with Prism 3.0(using exponential decay fit). See section E 3.5.1 for experimental conditions.
1 10 100 10000
10
2050mM NaCl200mM NaCl500 mM NaCl
Enzyme Concentration (nM)
Em
issi
onIn
ten
sity
G
G
G
G
GGG
G G
G
G
G
G
G
G G
G G
3'
3'
5'
5'
cleavage siteC
U
A
CC
C
C
CC
C
C
CA A A
A
A
A AA
A
A
A
U
U
U
UU
N
U
UC
C
C CCM
G
G
G GG
GG
G G
G
G
G
G
GG G
G G
3'
3'
5'
5'
C
U
A
CC
C
C
CC
C
C
CA
A AA
A
A AA
A
A
A
UU U
UU
N
U
UC
C
C CCM
E•S
Product (P2)
Product (P1)
E•P1P2
k2
"Substrate" (S)"Enzyme" (E)
+G
G
G
G
GGG
G G G
GG
G
G
G GG G
3'
3'
5'
5'
C
U
A
CC
C
C
CC
C
C
CA A A
A
A
A AA
AA
A
U
U
UUU
N
U
UC
CC CCM
Keq

50
As expected, the enzyme-substrate affinity increases at higher ionic strengths.
Interestingly, the fluorescence intensity at the end-point of titration is different for
each ionic strength. This suggests that at higher NaCl concentrations, 2-AP
stacks better with neighboring bases (Figure 3.18).
Following enzyme-substrate association, cleavage chemistry can be initiated by
the addition of Mg2+ (Figure 3.19). Substrate cleavage is evident by an
approximate 3-fold increase fluorescence intensity of 2-AP (Figure 3.19 black
circles). A large excess of the enzyme relative to the substrate is used, allowing
for pseudo first-order kinetic analysis of the cleavage data, and yields a cleavage
rate of 0.23 ± 0.01 min-1 for the fluorescent HH16 ribozyme. This value is
identical to the rate constant measured for the non-fluorescent HH16 ribozyme,
as determined by polyacrylamide gel electrophoresis.97
Figure 3.19: Real-time cleavage of an ensemble of fluorescent HH16 ribozymesin the presence of 200 mM NaCl and10 mM MgCl2, as evidenced by the increasein emission intensity of the 2-AP containing substrate (black circles). Increasingconcentrations of neomycin decreases the cleavage rate (red = 100 µM, blue =250 µM, green = 500 µM, pink = 1000 µM). See Section E 3.5.1 forexperimental details.
0
10
20
30
40
50
0 5 10 15 20
0
Time (min)
Cha
nge
inem
issi
onin
tens
ity

51
At physiologically relevant ionic strengths, neomycin B is a poor inhibitor of HH16
cleavage. Approximately 250 – 500 µM of neomycin is needed to decrease the
HH16 cleavage rate by 50% (at 200 mM NaCl and 10 mM Mg2+).97 At lower ionic
strengths (50 mM NaCl), neomycin is 5-10 fold more effective.66 This is
consistent with its electrostatically-driven binding of RNA.36
Figure 3.20: Binding of neomycin to the fluorescent HH16 complex in theabsence of Mg2+ (1.8 µM of substrate and 10 µM of enzyme in 200 mM NaCl). Athird neomycin binding isotherm becomes obvious at higher concentrations (notshown). See E 3.5.1 for experimental details.
Interestingly, neomycin binds to at least one site on the HH16 ribozyme with a
much higher affinity as compared to the concentrations needed for functional
inhibition of enzymatic cleavage. To prevent cleavage chemistry, the fluorescent
HH16 substrate-enzyme complex is formed in the absence of Mg2+, and upon
titration of neomycin two different responses from the fluorescent ribozyme are
observed (Figure 3.20). At low neomycin concentrations, the emission intensity
decreases (Figure 3.20 Left); as more neomycin is added, the emission intensity
recovers back to its original level (Figure 3.20 Right).
0 500 1000 1500 200025
30
35
40
45
Neomycin concentration (µµµµM)
Em
issi
onIn
ten
sity
(arb
)
0 10 20 30 40 50 6025
30
35
40
45
Em
issi
on
Inte
nsi
ty(a
rb.)
Neomycin concentration (µµµµM)

52
Assuming that the first binding isotherm (Figure 3.20 Left) represents association
to a single neomycin binding site, the neomycin affinity (Kd) of this site is 4.3 µM
(at 200 mM NaCl) and Kd = 2.2 µM (at 50 mM NaCl). Interestingly, no inhibition of
enzymatic cleavage is observed at low neomycin concentrations (through 10
µM). A low concentration of neomycin (2 µM) may slightly increase the cleavage
rate of the HH16 ribozyme to 0.25 ± 0.02 min-1 (at 200 mM NaCl). These results
indicate that neomycin binds to the HH16 at one or more non-inhibitory binding
sites.
If the second binding isotherm (Figure 3.20 Right) represents another
independent binding site, the affinity of neomycin to this site is Kd = 400 µM (at
200 mM NaCl), and Kd = 60 µM (at 50 mM NaCl). This represents a 100-fold
lower affinity compared to neomycin’s higher affinity binding site(s). A third
binding isotherm is sometimes observed at high neomycin concentrations,
suggesting either non-specific binding or aggregation can occur at concentrations
over 1 mM (not shown). The second binding isotherm of neomycin (Figure 3.20
Right) correlates with its HH16 inhibitory activity, where the affinity of the second
binding site is approximately equal to the concentration of neomycin needed to
slow ribozyme cleavage by 50% (IEC50).
Neomycin exhibits a similar behavior with the RRE, where its high-affinity site is
not capable of displacing the Rev peptide.89 This may represent a general feature

53
for aminoglycosides, where many potential binding sites are available and
multiple equivalents of the small molecule are needed for functional inhibition.
3.6 Analysis of Binding Data
Analysis of direct binding data must take into account the concentration of the
observable species relative to the affinity of the small molecule - RNA interaction
being studied. Three extreme theoretical cases illustrate how the “concentration
versus affinity ratio” dictates the relative sensitivity of each binding isotherm to
affinity versus stoichiometry (Figure 3.21). For most titrations, the concentration
of the observable species is kept constant, while the non-observable species is
titrated in. If the concentration of the observable species is much lower than the
Kd of the interaction, then the binding isotherm is sensitive only to the highest
affinity binding site. In this case, the binding stoichiometry can be assumed to be
1:1, and the Kd at this site is equal to the concentration of the non-observable
species needed to bind ½ of the observable species (defined as the C50 value)
(Figure 3.21 A). On the other hand, if the concentration of observable species is
much higher than the Kd of the interaction, the binding isotherm is sensitive only
to the maximum binding stoichiometry of the interaction (Figure 3.21 B). The
stoichiometry is determined by taking a ratio of concentrations at the intersection
of the two linear elements apparent within the binding isotherm (Figure 3.21 B). If
the concentration of the observable ligand is approximately equal to the Kd of the
interaction, then the binding isotherm reflects both the affinity and stoichiometry
of the interaction (Figure 3.21 C).

54
Figure 3.21: Three hypothetical binding isotherms for the addition of RNA into asolution containing an observable ligand. If the ligand concentration is very lowcompared to its affinity for the RNA, the binding curve is hyperbolic, and theconcentration of RNA needed to bind ½ of the ligand is equal to its affinity (A). Ifthe ligand concentration is very high compared to the affinity of the interaction,then the binding isotherm is composed of two linear elements. The point ofintersection indicates the binding stoichiometry (B). If the ligand concentration isapproximately equal to the affinity, then the binding isotherm reflects both thestoichiometry and affinity of the interaction.
0 1 2 3 4 50.00
0.25
0.50
0.75
1.00
RNA Concentration
Fra
ctio
nB
ou
nd
0 1 2 3 4 50.00
0.25
0.50
0.75
1.00
RNA Concentration
Fra
ctio
nB
oun
d
0 1 2 3 4 50.00
0.25
0.50
0.75
1.00
RNA Concentration
Fra
ctio
nB
oun
d
A
B
C
Kd
Stoichiometry =RNA concentration
ligand concentration
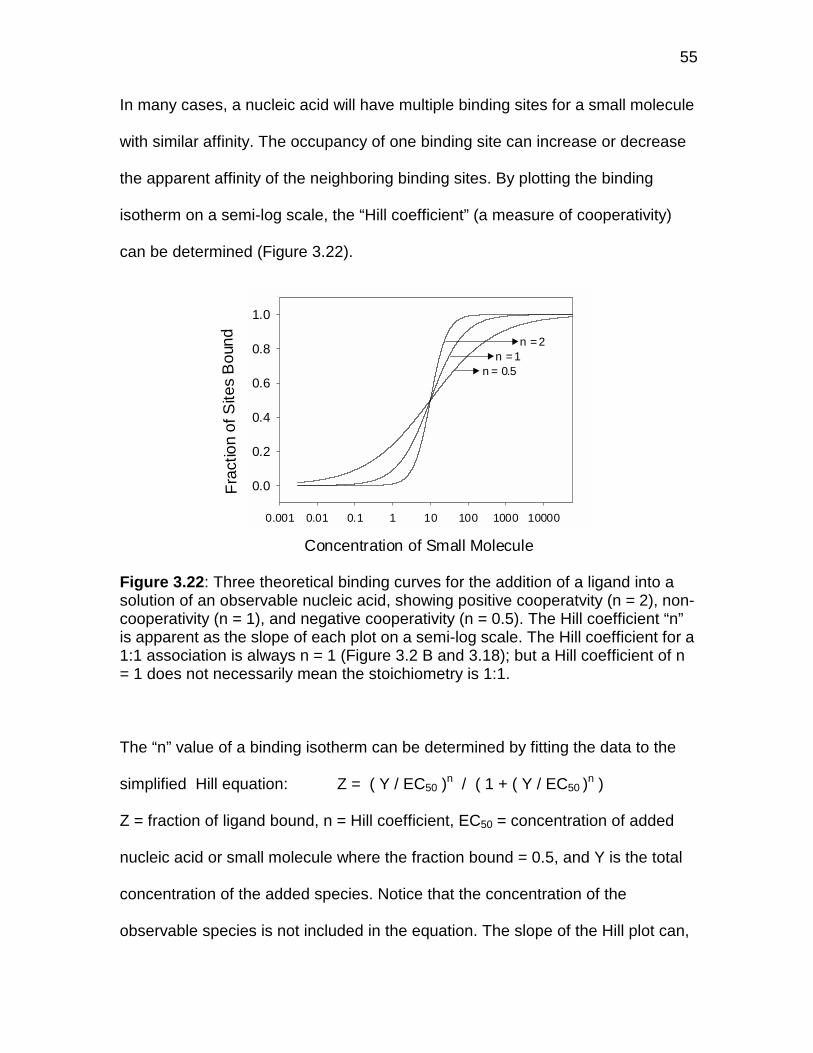
55
In many cases, a nucleic acid will have multiple binding sites for a small molecule
with similar affinity. The occupancy of one binding site can increase or decrease
the apparent affinity of the neighboring binding sites. By plotting the binding
isotherm on a semi-log scale, the “Hill coefficient” (a measure of cooperativity)
can be determined (Figure 3.22).
Figure 3.22: Three theoretical binding curves for the addition of a ligand into asolution of an observable nucleic acid, showing positive cooperatvity (n = 2), non-cooperativity (n = 1), and negative cooperativity (n = 0.5). The Hill coefficient “n”is apparent as the slope of each plot on a semi-log scale. The Hill coefficient for a1:1 association is always n = 1 (Figure 3.2 B and 3.18); but a Hill coefficient of n= 1 does not necessarily mean the stoichiometry is 1:1.
The “n” value of a binding isotherm can be determined by fitting the data to the
simplified Hill equation: Z = ( Y / EC50 )n / ( 1 + ( Y / EC50 )n )
Z = fraction of ligand bound, n = Hill coefficient, EC50 = concentration of added
nucleic acid or small molecule where the fraction bound = 0.5, and Y is the total
concentration of the added species. Notice that the concentration of the
observable species is not included in the equation. The slope of the Hill plot can,
0.001 0.01 0.1 1 10 100 1000 10000
0.0
0.2
0.4
0.6
0.8
1.0
n = 2
n = 0.5n = 1
Concentration of Small Molecule
Fra
ctio
nof
Site
sB
ound

56
therefore, be affected by the concentration of observable species (especially if
the concentration is high compared to the affinity of the interaction being
studied). If the nucleic acid is the observable species, the lower its concentration
compared to the affinity of the interaction, the better. When the small molecule is
the observable species, the situation is inherently more difficult, and the best
conditions for observing cooperativity is when the concentration of the small
molecule is approximately equal to the affinity of the interaction(s) (Kd). In this
case, titrations must be conducted at different concentrations of the small
molecule to observe what dependence on concentration is observed (if any).
3.6.1 Linear Analysis
If the binding interaction is non-cooperative (Hill coefficient n = 1), and if the
isotherm is sensitive to both affinity and stoichiometry (3.21 C), direct binding
data can be analyzed using a Scatchard plot. This plot can simultaneously
determine both binding stoichiometry and the average affinity of each site.
The Scatchard equation: r/Cf = Keq (N-r)
where r = concentration of bound small moleculetotal concentration of nucleic acid
Cf = concentration of unbound small molecule, and N = number of binding sites.
A Scatchard plot is made by plotting r versus r/Cf. The slope of this plot will equal
Keq, and the X-intercept will equal the number of binding sites. The direct binding
data from Figure 3.14 can be incorporated into a Scatchard plot (Figure 3.23).

57
Figure 3.23: Scatchard plot for ethidium bromide (600 nM) binding to RRE JWsuggests the presence of two similar binding sites with an average affinity of Kd =160 nM.
Large errors with Scatchard analysis are often encountered.98 Since the
concentration of observable species can determine the number of binding sites
reflected in the isotherm (Figure 3.21), the apparent stoichiometry can change
based upon the concentration of the observable species. In addition, the errors
associated with assigning spectral properties of the 100% “free“ versus the 100%
“bound” become amplified in all the data points, since the fraction bound at each
data point is calculated from these two extremes. The data points for the 100%
free and the 100% bound states are, therefore, “weighed” much more heavily
than the points in the middle of the titration. Non-linear analysis of binding data
can help reduce the errors associated with quantifying the spectral properties of
these “extreme” (and often inaccurate) data points.
0.0 0.5 1.0 1.5 2.0 2.5 3.0 3.5 4.00.0×10 -00
5.0×10 06
1.0×10 07
1.5×10 07
r
r/C
f

58
3.6.2 Non-Linear Analysis
Line shape analysis can eliminate much of the error associated with quantifying
the spectral properties of the 100% “free“ versus the 100% “bound” states of the
observable species. Non-linear analysis typically weighs all data points equally
and fits all the points to a theoretical curve.
In the case where the concentration of ligand is much lower than the Kd (Figure
3.21A), a hyperbolic curve is used to fit both the affinity and end-point of the
titration: Y = (Bmax*X) / (Kd + X)
Where X = nucleic acid concentration, Y = change in the spectroscopic signal of
the ligand, Kd = EC50, and Bmax = the end-point of the titration (maximum change
in the spectroscopic signal of the ligand).
In cases where binding stoichiometry is experimentally determined to be 1:1, raw
spectroscopic data can be fit with the following equation to determine affinity
(Kd):99,100
Where “RevFl” is the observable species that has an initial anisotropy or
fluorescence value of A0, [RNA] is the concentration of added species, and ∆A =
the total change upon saturation.
A = A0 + ∆A([RNA]total+[RevFl]total+Kd) - ([RNA]total+[RevFl]total+Kd)2 - 4[RNA]total [RevFl]total
2[RevFl]total

59
In many cases, binding isotherms are complex and do not fit any of these simple
theoretical models. Issues such as small molecule - small molecule association,
multiple binding sites, etc. can complicate analysis such that binding constants
cannot be calculated with confidence. In some cases, more advanced models
can assist with analysis.98 In other cases, however, no model can be applied with
any degree of confidence, and trends in activity (IC50 or C50 values) must be used
to evaluate relative binding affinities.
Fluorescence-based assays are important new tools to measure macromolecular
association and inhibition. Potential problems arise, however, when evaluating
Rev-RRE inhibitors that are themselves fluorescent or quenchers of
fluorescence. These problems can be overcome by using two or more orthogonal
methods when evaluating new ligands, including displacement of ethidium and
(when possible) the direct spectroscopic observations of the small molecule or
nucleic acid. Such “direct binding” studies can elucidate the RNA affinity and
stoichiometry of a ligand, but cannot be used to examine the ability of a ligand to
interfere with the function of the RRE. Rev displacement experiments are
essential, therefore, for evaluating the functional inhibition of the RRE.

60
4.0 New RRE Ligands: [Ru(bpy)2Eilatin]2+
Eilatin (14) is a fused, heptacyclic aromatic alkaloid that was isolated from the
Red Sea tunicate Eudistoma sp.101 It is reported to posses cytotoxic and
antiproliferation activities in a broad range of tissue cultures.102-104 Eilatin is
potentially a bi-facial metal chelator. Upon incorporation into octahedral metal
complexes of the type [Ru(L)2eilatin]2+ (where L= bpy, phen, etc.), only the less
hindered face of eilatin binds to the metal ion (Figure 4.0).105,106 The
enantiomerically pure metal complexes Λ-[Ru(bpy)2eilatin]2+ (9) and ∆-
[Ru(bpy)2eilatin]2+ (10) were synthesized from chiral precursors.106 To confirm
their correct assignment as Λ and ∆, respectively, circular dichroism
spectroscopy was employed (Figure 4.1).
Figure 4.0: Eilatin and eilatin-containing metal complexes. Unlike “free” eilatin(14), the chloride salts of 9, 10, 11, and 15 are freely soluble in water. 15 is asynthetic pre-cursor of rac-9/10 and provides an analog where the eilatin moietyis non-planar.107
Eilatin (14)
NN
NN
2+
Ru
N
N
N
N
N
N
N
N
∆-[Ru(bpy)2Eilatin]2+ (10)Λ-[Ru(bpy)2Eilatin]2+ (9)
rac-[Ru(bpy)3]2+ (11) rac-[Ru(bpy)2Pre-Eilatin]2+ (15)
Ru
N
N
N
N
N
N
N
N
Ru
N
N
N
N
N
N
2+
Ru
N
N
N
N
N
N
N
N
2+2+

61
Figure 4.1: CD spectra of the dichloride salts of Λ-[Ru(bpy)2eilatin]2+ (9) and ∆-[Ru(bpy)2eilatin]2+ (10) in 50 mM sodium phosphate pH 7.5. See section E 4.0.1for further experimental details. The dominant CD transitions (between 260 and300 nm) for 9 and 10 match those predicted by the exciton theory for the correctassignment of the absolute configuration.108
Λ-[Ru(bpy)2eilatin]2+ (9) and ∆-[Ru(bpy)2eilatin]2+ (10) bind to the RRE with
moderate affinity and high specificity (relative to a mixture of tRNAs, see Section
3.2 and reference 81). Fluorescence anisotropy, native gel-shift electrophoresis,
and the solid-phase binding assay all indicate that 9 and 10 bind to the RRE and
displace a Rev protein fragment with approximately 10-times greater activities as
compared to the widely studied RNA ligand neomycin B (Section 3.2 – 3.3). The
ability of 9 and 10 to inhibit Rev-RRE binding implicated their potential use as
anti-HIV agents. To explore this possibility, the anti-HIV activities of 9, 10, 11,
and 15 were measured in cell cultures, using HIV-1 infected CD4+ HeLa cells.
The dose-dependent decrease in plaques (syncytia) is shown in Figure 4.2 and
IC50 values are summarized in Table 4.1. Plaques are multinucleated cellular
Wavelength (nm)
250 300 350 400 450 500 550 600 650 700
[Θ]x
10-3
-300
-200
-100
0
100
200
300
(9)(10)

62
masses that are initiated by HIV-infected cells due to the surface expression of
the ENV protein, which allows CD4+ cells to fuse with infected cells, resulting in
large multinucleated cell masses. Plaque formation may be the primary cause of
T-cell death in vivo.109
Figure 4.2: The anti-HIV activity of compounds 9, 10, 11, and 15 as evidencedby the fractional decrease in plaque formation in CD4+ HeLa cells. Assays wereconducted at the Center for AIDS Research, San Diego. See experimentalsection E 4.0.2 and reference 110 for details. Free eilatin (14) was not evaluatedfor anti-HIV activity due to its poor solubility in DMSO/water and its high toxicityto cell cultures. 9 was also evaluated for anti-HIV activity in human peripheralblood monocytes (PBMC) by measuring the dose-dependent decrease in HIV-1p24 expression using ELISA (as described in E 4.0.3 and reference 110); thisassay also yielded an IC50 = 1 µM.
Compounds 9 and 10 have anti-HIV activities that are from 15 to over 100-fold
greater than those of 11 and 15. This clearly illustrates the significance of the
eilatin moiety to the anti-HIV activities of 9 and 10. To date, only one other family
Concentration (µM)
0.1 1 10 100
Fra
ctio
nalD
ecre
ase
ofP
laqu
es
-0.2
0.0
0.2
0.4
0.6
0.8
1.0
1.2
(9)(10)rac-(15)rac-(11)

63
of polypyridine-containing metal complexes has been shown to inhibit HIV
replication.111 These compounds, however, are chemically reactive, create
covalent cross-links to DNA, and are highly toxic.111a In contrast, compounds 9
and 10 are chemically inert, and show no sign of toxicity to HeLa cells (through
100 µM).
Table 4.1: IC50 values (µM) for HIV inhibition and for RevFl displacementexperiments from RRE66 and TAR31 (determined by fluorescence anisotropy).
Compound HIV-1a RRE66b TAR31b
9 0.8 0.9 5.3
10 2.0 1.1 3.5
rac-9/10 0.9 1.0 3.9
rac-15 30 20 30
rac-11 >100 >170c >86c
a Concentration needed to decrease HIV-1 activity by 50% in HeLa plaqueassay, standard deviation is less than ± 40% of reported value.b Concentration needed to displace 50% of RevFl from 100 nM of eachRNA construct, standard deviation is less than ± 20% of reported value.c Only limits can be determined with this method due to fluorescenceinterference from Ru(bpy)3.
To investigate the ability of 9, 10, 11, and 15 to interfere with the function of the
RRE66 and the TAR31, fluorescence anisotropy (Section 3.1) was used to
monitor the ability of each compound to displace RevFl from each RNA. A
summary of RevFl displacement data is given in Table 4.1. Overall, a correlation
exists between the anti-HIV activity of each compound and its affinity for HIV
RNA. Compared to 9 and 10, the non-planar analog [Ru(bpy)2pre-eilatin]2+ (15)
has approximately a 20-fold lower RNA affinity and lower anti-HIV activity (Table

64
4.1). The poor nucleic acid affinity of [Ru(bpy)3]2+ (11) appears to be a general
phenomenon.112 Gel shift electrophoresis confirms that [Ru(bpy)3]2+ shows no
inhibition of the Rev-RRE complex through 10 mM (Figure 3.9). This indicates
that complementary electrostatic interactions are not the primary energetic
driving force for the binding of eilatin-containing metal complexes (9 and 10) to
the RRE. The poor anti-HIV activities and poor HIV RNA affinities of 11 and 14
support a correlation between the nucleic acid affinity and anti-HIV activity of
these octahedral metal complexes (Table 4.1). There are, of course, other
potential mechanisms that explain the anti-HIV activities of 9 and 10. In
conjunction with Immusol Inc. (Sorrento Valley, CA) the mechanism(s) that
govern the anti-HIV activities of 9 and 10 are currently being examined in vivo.
Preferential binding of both 9 and 10 to the RRE66 as compared to the TAR31, is
suggested by the 3-5 fold lower IC50 values observed for RevFl peptide
displacement for RRE66 versus TAR31 (Table 4.1). Compared to TAR31, the
RRE66 has a higher affinity to RevFl (Table 3.0), so it should be “more difficult”
to displace RevFl from the RRE66 than TAR31. Differences in the binding
stoichiometries could, in principle, make the trends in IC50 values inconsistent
with the trends in affinity (Kd). Direct binding studies have been utilized to confirm
the higher affinity of 9 and 10 for the RRE versus TAR (presented later).
To confirm the trends indicated by peptide displacement and to expand the study
to include simple duplex RNAs and DNAs, ethidium bromide displacement

65
assays were conducted using the RRE66, TAR31, and 6 other nucleic acids (see
Section 3.3 and Figure 3.12 for examples of ethidium displacement experiments
using 9, 10, and 15). Table 4.2 summarizes the IC50 values for ethidium
displacement from the RRE66, TAR31, poly r[I] – poly r[C], poly r[A] – poly r[U],
calf thymus (C.T.) DNA, poly d[AT] – poly d[AT], and poly d[GC] – poly d[GC].
Since ethidium has variable binding stoichiometries and a broad range of
affinities to different nucleic acids, the IC50 values in Table 4.2 are not directly
comparable between different nucleic acids. Rather a comparison of each
compound for each nucleic acid is more appropriate (comparisons should be
made vertically, not horizontally).
Table 4.2: IC50 values (µM) for ethidium displacement.a See E 3.3 for experimental details.
Compound RRE66b TAR31bpoly r[I] -poly r[C]c
Poly r[I] -poly r[C]d
poly r[A]-poly r[U]d
C.T.DNAd
polyd[AT]d
polyd[GC]d
9 0.25 1.8 10.5 1.5 2.0 0.1 0.07 0.25
10 0.4 1.6 7.7 1.4 5.0 0.4 0.2 0.4
rac-15 10 9.0 22 4.0 23 7.0 n.d.e n.d.e
a Errors associated with measurement within ± 25% of reported value.b IC50 values measured using 50 nM of RNA construct.c IC50 values measured using 11 µM of duplex base pairs.d IC50 values measured using 0.88 µM of duplex base pairs.e Not determined.
Consistent with RevFl displacement experiments, ethidium displacement
suggests that the RRE66 has a small preferential binding of 9 over 10, while the
TAR31 has a slight preference for the other enantiomer (Table 4.2). Simple
duplex RNAs also exhibit variable selectivity between 9 and 10. Poly r[A] – poly
r[U] shows better binding of 9 over 10, while poly r[I] – poly r[C] shows a small,

66
yet consistent, selectivity for 10 over 9. To our knowledge these are the first
reported examples of octahedral metal complexes that exhibit variable chiral
discrimination between simple duplex RNAs. Consistent with conclusions from
the solid-phase assay (Section 3.2), all three of the simple duplex DNAs exhibit
preferential binding of 9 over 10 (Table 4.2). Interestingly, this is the opposite
enantiomeric selectivity as reported for most other metal complex-DNA
interactions to date.115a-e
Ethidium displacement experiments indicate that, in general, 9 and 10 have
higher affinity to all nucleic acids as compared to 15. The absence of a single
carbon-carbon bond in [Ru(bpy)2pre-eilatin]2+ (15) should impart a fluctuating
dihedral twist averaging 25° between the two tricyclic ring systems in the pre-
eilatin ligand.113 Prior to these studies, it was unknown how this twisting would
affect nucleic acid affinity.114 A crystal structure of rac-(9/10) shows the RMS
deviation of eilatin from planarity (including hydrogen atoms) is 0.130 Å.106
Without hydrogen atoms, the RMS deviation from planarity is 0.098 Å.106 The
deviation of eilatin itself (14) from planarity is 0.044 Å (without H’s).101 Eilatin is,
therefore, nearly a planar ligand. These studies indicate that the planarity of the
eilatin ligand is necessary for the anti-HIV activities and the nucleic acid binding
exhibited by 9 and 10.

67
Octahedral metal complexes can bind to nucleic acids through various modes,
including: intercalation, electrostatic, and groove binding.115a-k Given the apparent
“planarity requirement” for the high-affinity binding of 9 and 10 to nucleic acids,
we investigated the possibility that 9 and 10 bind by intercalation. The viscosity of
a DNA solution was measured with increasing concentrations of rac- 9/10 (Figure
4.3). In accordance with the hypothesis proposed by Lerman,116 the viscosity of a
DNA solution increases upon the addition of an intercalating agent.117 Upon
intercalation of a small molecule, the axial length of DNA increases and it
becomes more rigid. Both factors increase the frictional coefficient, and hence,
the viscosity of the DNA in solution.117
Figure 4.3: Changes in the viscosity of a solution of calf thymus DNA (500 µMb.p.) with increasing concentrations of ligand. The viscosity of a DNA solution isdetermined by measuring the time needed for it to flow through a capillaryviscometer. η is the viscosity of the solution in the presence of a ligand, ηo is theviscosity of the DNA-only solution. Random errors for this experiment areapproximately the size of the symbols used for each point. A low-salt buffer (50mM sodium phosphate pH 7.5) was used. See Section E 4.0.4 for additionalexperimental details.
ratio [ligand / b.p.DNA]
0.0 0.2 0.4 0.6 0.8 1.0
η /η o
0
1
2
3
4
5Ethidium Bromiderac-(9/10)
ratio [ligand / b.p.DNA]
0.0 0.2 0.4 0.6 0.8 1.0
(η/η
ο)1/
3
0.9
1.0
1.1
1.2
1.3
1.4
1.5
1.6
1.7Ethidium Bromiderac-(9/10)

68
Since the change in viscosity should be proportional to the change in the axial
length of a rigid DNA molecule to the third power, viscosity results are often
reported as (η/ηo)1/3 versus molar fraction of the ligand (Figure 4.3 Right).117
Theory predicts that for an “ideal” intercalating agent, this plot will be linear with a
slope of 1.0.117 Interestingly, rac-(9/10) has a slope of 1.0 and ethidium has a
slope of 0.7. Other groups have also observed a slope of less than 1.0 for
ethidium.115i At low ionic strengths, ethidium can bind to DNA by both
intercalation and by surface-binding via electrostatic interactions.86 Compounds
that bind to duplexes through electrostatic interactions, such as tobramycin (3),
can decrease the viscosity of the nucleic acid solution.118 This may explain why,
under these conditions, viscometric analysis of the ethidium-DNA complex yields
a slope significantly lower than 1.0 (Figure 4.3 Right).
Other interesting differences between rac-9/10 versus ethidium (12) are also
apparent in the viscosity titrations (Figure 4.3). The ratio at which the DNA
becomes saturated is significantly different for each compound. The curve for
ethidium reaches saturation at ~3 ethidium molecules / 10 base pairs. This value
is consistent with the reported binding stoichiometry of ethidium to C.T. DNA.87
This is also the same binding stoichiometry reported by Chaires for
[Ru(phen)2DPPZ]2+ (a metal complex very similar to 9 and 10).115c For rac-9/10,
however, saturation is reached at much higher ratios (Figure 4.5), suggesting a
maximum binding stoichiometry of ~ 6 equivalents of ligand for every 10 base-
pairs of DNA. This is an unusually high binding stoichiometry for such a large

69
metal complex! Only one other example of such a high binding stoichiometry for
a metal complex is found in the literature.119 Barton and Lippard report ~6.7
equivalents of [(terpy)Pt(HET)]1+ per every 10 base-pairs of poly r(A) – poly
r(U).119 This metal complex is, however, square planar, and the intercalation of
this compound into duplexes should be much less sterically hindered as
compared to 9 and 10.
To better examine the nucleic acid sequence and structure specificity of 9 and
10, direct binding studies have been conducted by monitoring the UV
absorbance spectrum of either 9 or 10 as a function of nucleic acid concentration
(Figure 4.4). Compounds 9 and 10 exhibit multiple electronic transitions in their
absorbance spectra that are sensitive to nucleic acid binding. The presence of
multiple isosbestic points, and saturation at high DNA concentrations, suggests a
simple two-state transition exists between the “bound” versus “free” states of the
ligand upon titration of nucleic acid (Figure 4.4). The concentration of nucleic acid
needed to bind ½ of each compound (defined as the C50 value) is determined by
assuming a linear relationship between the spectral changes and the fraction of
ligand bound. A lower C50 value suggests a higher binding affinity and/or more
binding sites.
Titrations were conducted using many different nucleic acids by observing the
UV-vis absorption changes of either 9, 10, or 12 as a function of nucleic acid
concentration (Table 4.3). For all duplex nucleic acids tested, the UV-vis

70
absorbance spectra of 9 and 10 show changes similar to those observed upon
titration of Calf Thymus (CT) DNA (Figure 4.4). The absolute change in intensity
and degree of red-shifting are slightly different for each nucleic acid tested, but all
titrations exhibit simple two state transitions (see section E 4.0.5 for the “raw”
spectral data of 9 and 10 upon titration of each nucleic acid). Each nucleic acid
endows unique spectral changes to 9 and 10, but no obvious correlation is found
between the composition of the nucleic acid and the spectral changes exhibited
by ligand (see section E 4.0.5).
Figure 4.4: Uv-vis absorbance spectrum of 10 (8 µM) as a function of calfthymus DNA (concentration in base-pairs). See E 4.0.5 for additionalexperimental details and the raw data for all polymeric nucleic acids tested.
Consistent with the results from the solid-phase assay (Section 3.3), thermal
denaturation (Section 3.5), and ethidium bromide displacement experiments
(Table 4.2), the direct titration experiments indicate that 9 has a higher affinity for
CT DNA as compared to 10 (Table 4.3). Interestingly, both 9 and 10 exhibit
300 350 400 450 500 550 600 650 700 7500.00
0.02
0.04
0.06
0.08
0.10
0.12
0.14
0.16
0.18
0.20
0.22∆-Eilatin Ru (bpy)2
+2 µM C.T. DNA+4 µM C.T. DNA+10 µM C.T. DNA+20 µM C.T. DNA+40 µM C.T. DNA+60 µM C.T. DNA+100µM C.T. DNA
Wavelength (nm)
Abs
orba
nce

71
sequence selectivity in the binding double-stranded DNA and RNA. For example,
10 has over a 5-fold higher affinity for poly d(G) – d(C) as compared to poly
d(GC) – d(GC), and both 9 and 10 have a higher affinity to poly d(AT) – d(AT) as
compared to poly d(A) – d(T) (Table 4.3).
The classic intercalating agent ethidium bromide (12) has been evaluated for
nucleic acid selectivity by monitoring its changes in UV-vis absorption spectrum,
and the eilatin “free ligand” (14) has been evaluated using fluorescence emission
spectroscopy (presented below). All four compounds have a much higher affinity
to poly r(A) – r(U) as compared to both poly r(I) – r(C), and r(G) – r(C). This may
indicate that some duplex nucleic acids have, in general, a low affinity for “any”
intercalating agent. Some nucleic acids, on the other hand, are highly sensitive to
the identity of the intercalating agent. For example, poly d(A) – d(T), has a very
low affinity for ethidium (12), a modest affinity for the metal complexes (9 and
10), and a very high affinity for the free eilatin ligand (14) (Table 4.3) All four
compounds exhibit a moderate selectivity for duplex DNA over duplex RNA.
Each compound, for example, has approximately a 10-fold higher affinity for poly
d(G) – d(C) versus poly r(G) – r(C) (Table 4.3). We conclude that, for the most
part, the trends in the nucleic acid affinity for 9, 10, and 12 are similar for all the
duplex nucleic acids tested. We interpret this as additional evidence that 9 and
10 bind to duplex nucleic acids via intercalation.

72
Table 4.3: C50 values (µM)* for 8 µM of Λ−[Ru(bpy)2eilatin]2+ (9), 8 µM∆−[Ru(bpy)2eilatin]2+ (10), 8 µM ethidium bromide (12), and 0.1 µM eilatin (14).
Nucleic Acid Λ−[Ru(bpy)2eilatin]2+
(9)∆−[Ru(bpy)2eilatin]2+
(10)ethidium bromide
(12)**eilatin(14)***
C.T. DNA 18 27 20 3
Poly d(A) –Poly d(T)
13 23 105 1
Poly d(AT) –Poly d(AT)
9 8 13 5
Poly d(G) –Poly d(C)
15 13 22 5
Poly d(GC) –Poly d(GC)
18 55 16 8
Poly r(A) –Poly r(U) 13 22 18 12
Poly r(G) –Poly r(C)
125 85 400 20
Poly r(I) –Poly r(C)
200 180 170 150
Poly r(U)8 8 4000 >2000
Poly r(C)52 75 8000 >1000
Poly r(A)14 13 1500 70
Poly r(G)18 20 240 4
Poly r(I)13 10 950 0.2
Oligo r(I)15 68 53 n.d. n.d.
Poly d(A) 20 ~200 n.d. n.d.
Oligo d(A)15 ~200 70 n.d. n.d.
Oligo d(T)15 21 21 n.d. n.d
* C50 values for duplexes are reported per base pair, the values for single-stranded polymers are reported per base. The approximate experimentaldeviation for all values is less than or equal to ±35% of the reported C50 value.** Changes in UV-vis absorption monitored for duplex nucleic acids, and changesin emission monitored for single-stranded nucleic acids.*** Compared to 9, 10, 12, a much lower concentration of 14 was used forspectroscopic measurements (8.0 µM versus 0.1µM, respectively), the C50
values for 14, cannot, therefore, be directly compared to those of 9, 10, and 12.

73
The eilatin-containing metal complexes 9 and 10 do, however, demonstrate
some interesting differences when compared to ethidium bromide (12); the most
surprising revelation is their high affinity for single-stranded nucleic acids (Table
4.3). Classic intercalating agents, like ethidium bromide, exhibit a relatively low
affinity for single-stranded RNAs and DNAs. Ethidium has a 1,000-fold lower
affinity for most single-stranded nucleic acids as compared to duplex nucleic
acids (Table 4.3). 9 and 10, however, exhibit a higher apparent affinity for both
poly r(U), and poly r(I) as compared to most duplex nucleic acids. In terms of
RNA selectivity, 9 and 10 have a higher apparent affinity for the single-stranded
versus double-stranded polymeric RNA. Since most natural RNAs, including the
RRE, have bulged regions and other features with single-strand characteristics, it
is possible that the single-stranded regions bind, with high affinity, to 9 and 10.
Differences in binding stoichiometry could, however, make the C50 values in
Table 4.3 disproportionate to the actual affinities (Kd). To determine the single
stranded binding stoichiometeries of 9 and 10, the UV-vis absorbance spectrum
of a high concentration of 10 (40 µM) was monitored upon titration poly r(U)
(Figure 4.5). Interestingly, a very high stoichiometry is indicated, where
approximately 5 equivalents of 9 or 10 are bound per every 10 bases of poly r(U).
This is very similar to the stoichiometry observed for CT DNA, where 6
equivalents of rac-9/10 bind for every 10 base pairs (Figure 4.5). Another duplex
DNA, poly d(AT) – poly d(AT), also exhibits the same binding stoichiometry for
both 9 and 10 (at 5 equivalents per every 10 base pairs) (not shown).

74
Figure 4.5: At high concentrations of 10 (40 µM), the binding isotherm for polyr(U) is composed of two linear elements, the intersection of these lines (at 80 µMof poly r(U)) indicates the maximum binding stoichiometry for 10 is 1 equivalentfor every 2 bases of poly r(U). The other enantiomer 9 yields the same result.The same experiment was conducted with duplex DNA and also yielded abinding stoichiometry of 1 equivalent of either 9 or 10 for every 2 base pairs ofpoly d(AT) – d(AT).
Titrations using poly r(U) were also conducted with either 4 µM or 8 µM of 10
(Figure 4.6). At 4 µM and 8 µM of 10, the binding data fit very well to Hill
coefficients of n =2 (Figure 4.6). This suggests positive cooperativity for these
binding interactions (Section 3.6). Duplex nucleic acids can also show positive
cooperativity in their binding of 9 and 10. For example, both poly d(AT) – d(AT)
and poly d(A) – d(T) have Hill coefficients of n = 2 for binding to both 9 and 10.
Indeed, all of the “higher affinity” interactions (C50 < 30 µM, Table 4.3) show some
degree of positive cooperativity in their binding of 9 and 10 (Hill coefficients range
from 1.5 to 2.2).
0 100 200 300 400-0.2
0.0
0.2
0.4
0.6
0.8
1.0
1.2
Concentration of poly r(U) (ntds.)
Fra
ctio
nof
10bo
und

75
Figure 4.6: Association of poly r(U) with 10 at three different concentrations. At 4µM and 8 µM a good fit is found for a Hill coefficient of n = 2. As expected, a poorfit is found at 40 µM.
To further investigate the high affinity and cooperative binding of 9 and 10 to
single-stranded poly r(U), thermal denaturation experiments were conducted
(Figure 4.7). By themselves, the UV adsorption of 9, 10, and poly r(U) (260 nm)
show only small non-cooperative changes as a function of temperature (Figure
4.7). The complex formed between 10 and poly r(U), however, shows a highly
cooperative melting behavior reminiscent of duplex denaturation (Figure 4.7 solid
line). The complex formed between 9 and poly r(U), however, shows multiple,
non-reversible transitions (Figure 4.7 dotted line). It is possible that under these
conditions, some non-specific aggregation between 9 and poly r(U) occurs. The
complex between 10 and poly r(U), however, appears well-behaved (Figure 4.7).
Concentration of poly r(U) (µM ntds.)
0.1 1 10 100 1000
Fra
ctio
nof
10B
ound
-0.2
0.0
0.2
0.4
0.6
0.8
1.0
1.24 µM 108 µM 1040 µM 10

76
Figure 4.7: Change in adsorption of poly r(U) (30 µM of bases) with or without, 9or 10 (15 µM). See section E 4.0.6 for experimental details.
The thermodynamic parameters of the melting transition (70 – 90 °C) for the poly
r(U)-10 complex can be fit to a van’t Hoff plot (Figure 4.8). This analysis assumes
that the melting of the complex represents a simple two-state transition. Based
upon their known binding stoichiometry (Figure 4.5), a 2:1 ratio of poly r(U) bases
to 10 was used for the Tm experiment so that excess ligand would not drive
complex formation. From the van’t Hoff plot (Figure 4.8), a large enthalpy of
formation (∆H0 = -84 kcal / mole) and a modest entropy of formation (∆S0 = -240
cal / mole K-1) are calculated. These values represent the energetic parameters
for the complex as a whole and do not reflect the binding of individual molecules
of 10 to poly r(U). These ∆H0 to ∆S0 values are similar to those for the melting of
Temperature (oC)
20 30 40 50 60 70 80 90 100
Cha
nge
inad
sorp
tion
(260
nm)
-0.25
-0.20
-0.15
-0.10
-0.05
0.00
0.05
0.10
0.15
0.209 only10 onlypoly r(U) only9 + poly r(U)10 + poly r(U)

77
long polymeric nucleic acids. For example, CT DNA, under these same
conditions has enthalpy of formation (∆H0 = -82 kcal / mole) and a entropy of
formation (∆S0 = -280 kcal / mole K-1) (data not shown). Compared to the poly
r(U)-10 complex and to CT DNA, shorter duplex nucleic acids have smaller ∆S0
terms and, therefore, exhibit less cooperative melting transitions. 120
Figure 4.8: van’t Hoff plot of the thermal melting of the poly r(U)-10 complex. Keq
is taken as the fraction of folded complex relative to unfolded complex. ∆H0 = -(R*slope) and ∆S0 = ∆H0 / Tm (°K).
The melting transition of the poly r(U)-10 complex provides additional evidence
that the binding interaction between 10 and poly r(U) is highly cooperative and
large binding energies (∆Gcomplex = 8 – 12 kcal / mole) are involved. This raises
the possibility that the poly r(U)-10 complex is a well-ordered supermolecular
structure suitable for crystallization and subsequent analysis by X-ray
crystallography.
0.0027 0.0028 0.0029 0.0030 0.0031
-5.0
-2.5
0.0
2.5
5.0
ln(K
eq)
1 / T (K-1)

78
Interestingly, the non-polymeric nucleic acids (RRE JW, TAR 31, and tRNAPhe)
do not show cooperativity in their binding of 9 and 10 (Hill coefficients range from
1.1 – 1.4). Scatchard plots can, therefore, be used to establish the average
affinity and stoichiometry of 9 and 10 for binding these RNA transcripts (Figure
4.9 and Table 4.4).
Figure 4.9: Scatchard analysis of the interaction between 9 and the RRE JW,tRNAPhe, and TAR31. The slope of the graph = 1/Kd (ave), and the r value at r / Cf= 0 is the number of apparent binding sites.
Table 4.4: Summary of the binding stoichiometries and average affinity of 9 and10 for RRE JW, tRNAPhe and TAR 31.Nucleic Acid Binding sites
for 9Average Kd
(µM) for 9Binding sites
for 10Average Kd
(µM) for 10RRE JW 2.4 1.9 3.8 1
tRNAPhe 9 5.6 10 5.6
TAR 31 3 4.6 4 9
Non-whole numbers for the binding stoichiometry are obtained for some of the
interactions (Table 4.4). This suggests that some RNAs have multiple,
nonequivalent binding sites, and therefore, the reported affinity (Kd) represents
0 1 2 3 4 5 6 7 8 9
250000
500000
750000
1000000
1250000
1500000
RRE JWtRNAPheTAR31
r
r/
Cf

79
the average affinity to all of the “active” binding sites. Consistent with the Rev
peptide and ethidium displacement experiments as well as the solid-phase
assay, 9 and 10 have a higher affinity for the RRE as compared to both TAR31
and tRNAPhe. Unfortunately, due to the limited sensitivity of monitoring changes in
UV-vis absorption, it is difficult to probe the highest affinity binding site(s) on the
RRE. Since 9 and 10 are non-emissive, low µM concentrations are needed to
observe the spectral changes of these compounds. For example, even if the
RRE possesses a 10 nM binding site, it cannot be characterized under these
conditions since the metal complex is at a much higher concentration compared
to the affinity. This limitation is also reflected in some of the C50 values reported
in Table 4.3. Since the concentration of 9 and 10 used for these titrations is 8 µM,
and the binding stoichiometry is approximately 1 ligand per every 2 bases (or
every 2 base-pairs), the theoretical minimum C50 value for all polymeric nucleic
acids is 8 µM (Table 4.3). We can only report, therefore, that the interaction
between poly r(U) and both 9 and 10 exhibit affinities of Kd < 0.5 µM (Table 4.5).
Given the unusual nucleic acid selectivities of 9 and 10, we decided to
investigate the nucleic acid affinity and specificity of “free” eilatin (14). Unlike the
eilatin-containing metal complexes (9 and 10), eilatin itself (14) is highly emissive
and shows changes in its emission spectrum upon addition of nucleic acids
(Figure 4.11). For all nucleic acids tested, a decrease in emission intensity is
observed, allowing for C50 values to be established (Figure 4.10 and Table 4.3).

80
Figure 4.10: Changes in the fluorescence emission spectrum of 0.1 µM eilatin(14) upon addition of CT DNA. Nearly identical changes are seen for all othernucleic acids tested. Excitation is at 417 nm, see Section E 4.0.7 for additionalexperimental details.
The C50 values measured for eilatin (14) are not directly comparable with those
determined for 9, 10, and 12 (Table 4.3). Due to detection limits of 9 and 10, and
the limited water solubility of 14, the concentration of eilatin (14) used for the
fluorescence experiments is 80-fold lower than the concentrations needed for the
UV-vis titrations of 9, 10, and 12 (Table 4.3). Binding constants for all of the
compounds can be estimated from the C50 values (summarized in Table 4.5). For
eilatin (14), the Kd ≈ (C50 / 2)-0.05 (this assumes that binding is non-cooperative
and that the neighbor exclusion limit of 14 is one molecule per 2 base pairs). Kd
values have also been estimated for the eilatin-containing metal complexes (9
and 10), and for ethidium bromide (12) (Table 4.5). All estimates are equal to the
C50 value divided by the binding stoichiometry, minus half the concentration of
the ligand. Issues related to the cooperative binding of 9 and 10 do, however,
Wavelength (nm)
450 500 550 600
Inte
nsity
(arb
.)
0
100
200
300
400100 nM Eilatin (14)1 µM CT DNA3 µM CT DNA7 µM CT DNA15 µM CT DNA30 µM CT DNA60 µM CT DNA120 µM CT DNA240 µM CT DNA480 µM CT DNA

81
complicate this estimate. Nonetheless, these Kd estimates allow for a more direct
comparison of the binding affinities of all four compounds (Table 4.5).
Unlike the eilatin-containing metal complexes (9 and 10), eilatin (14) is not very
soluble in water (maximum concentration of 14 at pH 7.5 = 3 µM). Limited water
solubility prevents Rev peptide and ethidium displacement experiments from
reaching saturation. The IC50 value of 14 for Rev-RRE inhibition, for example, is
>3 µM (Figure 4.11). This represents, however, at least a 3-fold lower Rev-RRE
inhibition activity as compared to 9 and 10. Eilatin (14) does, however, bind to the
RRE with high affinity (Figure 4.11). Fluorescence binding studies indicate that
eilatin (14) binds to one or more sites on the RREJW with a Kd of approximately
0.5 µM, but cannot displace Rev by binding to these site(s).
Figure 4.11: A comparisons between the “direct” binding of eilatin (14) to theRRE JW and its ability to inhibit Rev-RRE66 binding. For the direct bindingexperiment, the fluorescence intensity of eilatin was monitored as a function ofRRE JW concentration. The direct binding data is fit to a C50 value of 0.5 µM withno cooperativity (Hill coefficient = 1.0). For the RevFl displacement experiment,fluorescence anisotropy was used to monitor the fraction of RevFl bound to theRRE66 (10 nM of each).
Concentration (µM)
10-3 10-2 10-1 100 101 102 103 104 105
Frac
tiona
lCha
nge
0.0
0.2
0.4
0.6
0.8
1.0
Direct Binding to RRERevFl Displacement

82
Table 4.5: Approximate Kd values (µM)* of Λ−[Ru(bpy)2eilatin]2+ (9),∆[Ru(bpy)2eilatin]2+ (10), ethidium bromide (12), and eilatin (14) as calculatedfrom C50 values (Table 4.3).*
Nucleic Acid Λ−[Ru(bpy)2eilatin]2+
(9)∆−[Ru(bpy)2eilatin]2+
(10)ethidium bromide
(12)eilatin(14)
C.T. DNA 5 9.5 2.7 1.5
Poly d(A) –Poly d(T)
2.5 7.5 31 0.5
Poly d(AT) –Poly d(AT)
0.5 < 0.5 0.33 2.5
Poly d(G) –Poly d(C)
3.5 2.5 3.3 2.5
Poly d(GC) –Poly d(GC)
5 24 1.3 4
Poly r(A) –Poly r(U) 2.5 7 2 6
Poly r(G) –Poly r(C)
59 39 130 10
Poly r(I) –Poly r(C)
96 86 53 75
Poly r(U)< 0.5 < 0.5 1,300 > 1,000
Poly r(C)22 34 2,700 > 500
Poly r(A)3 2.5 500 35
Poly r(G) 5 6 76 2
Poly r(I)2.5 1 310 0.1
Oligo r(I)15 30 23 n.d. n.d.
Poly d(A)6 96 n.d. n.d.
Oligo d(A)15 96 31 n.d. n.d.
Oligo d(T)15 6.5 6.5 n.d. n.d
* The Kd values for 14 are estimated to = ((C50 / 2)-0.05). Consistent with earlierstudies, the Kd values for 12 are (Kd ≅ ((C50 / 3) – 4)).87 For 9 and 10, the Kd
values are approximately ≅ ((C50 / 2) – 4). These values serve as estimates only,as differences in binding stoichiometries and cooperativity will affect thecalculated Kd values.

83
Tables 4.4 and 4.5 represent, to the best of our knowledge, the most
comprehensive study of ethidium bromide and its affinity to different nucleic acids
to date. Bresloff and Crothers used equilibrium dialysis to study the binding of
ethidium to 12 different nucleic acids, five of which appear in Table 4.5.87 These
studies were conducted at 1M NaNO3, and our studies are conducted at
physiological ionic strength (see section E 4.0.2 for experimental conditions).
Despite the different conditions, we report similar trends in ethidium affinity for all
five nucleic acids.87
Tables 4.4 and 4.5 highlight how the nucleic acid specificity of an intercalating
ligand can change upon incorporation into an octahedral metal complex. For
most, but not all duplex nucleic acids, free eilatin (14) has a slightly higher DNA
and RNA affinity compared to 9 and 10 (Table 4.5). A notable exception is poly
d(AT) – poly d(AT). The eilatin-containing metal complexes (9 and 10) have a
much higher affinity for poly d(AT) – poly d(AT) as compared to poly d(A) – poly
d(T), while eilatin (14) has the opposite selectivity (Table 4.5).
The trends observed for single-stranded versus double-stranded nucleic acids
are strikingly different for 9, 10, 11, and 14 (Table 4.5). Ethidium (12) is a
“classic” intercalating agent and, hence, has a low affinity for all the single-
stranded nucleic acids evaluated (Table 4.5). Molecules with extended aromatic
surfaces can, however, show appreciable affinity for single-stranded nucleic
acids.121,122 Both eilatin (14) and the eilatin metal complexes bind to single-

84
stranded nucleic acids, but with very different trends in affinity. Eilatin (14)
exhibits a high degree of differentiation among the three homopurine single-
stranded nucleic acids (poly r(I) > poly r(G) > poly r(A)). This suggests a
preference for electron-poor purines. Both eilatin (14) and ethidium (12) have a
much lower affinity for the homopyrimidines (poly r(U) and poly r(C)) as
compared to the homopurines (poly r(I), poly r(G), poly r(A)). In contrast, no clear
preference of purines versus pyrimidines is seen for 9 and 10 (Table 4.5).
The eilatin metal complexes (9 and 10) have, in general, a much higher affinity to
single-stranded nucleic acids as compared to both eilatin (14) and ethidium (12).
Compounds 9 and 10 bind to poly r(U) with sub-µM affinities. Only one other
small molecule, to our knowledge, has been reported to possess high affinity for
poly r(U).121 Given the preferential binding of 9 and 10 to single-stranded nucleic
acids, we examined the possibility that the eilatin-containing metal complexes
recognize the internal bulge of the RRE (Figure 2.4). This bulge is known to
possess single-stranded characteristics in the absence of Rev binding.123 We
have conducted titrations using an inosine-substituted RRE JW (Figure 2.5). This
mutant RRE binds to the RevFl peptide with the approximately same affinity (2
nM), but it has over a 2-fold higher affinity for 9 as compared to the RRE JW.
This is consistent with these metal complexes exhibiting a higher affinity for
single-stranded r(I) versus r(G) (Table 4.5), and suggests that the internal bulge
of the RRE is the preferred binding site of these complexes.

85
To the best of our knowledge, only one other group has examined the nucleic
acid affinity of eilatin (14), and they reported very different results as compared to
ours.104 Ethidium bromide displacement experiments were conducted using CT
DNA, but only a low DNA affinity was suggested (IC50 > 100 µM).104 The limited
solubility of eilatin (solubility in water < 3 µM) may explain this result. The same
report also used fluorescence experiments to monitor the change in “emission” of
a solution of 14 as a function of CT DNA concentration.104 They showed an
increase in the fluorescence intensity of eilatin upon addition of CT DNA. We find
a decrease for all nucleic acids tested (Figure 4.10). In their case, however, the
sample was both excited and monitored at 520 nm.104 Eilatin shows no
absorption at this wavelength.101 Since the sample was excited and monitored at
the same wavelength, the increase in “emission” was actually the increased light
scattering by the solution upon titration of DNA.104
Eilatin-containing metal complexes are new anti-HIV agents with unusual nucleic
acid specificities. The eilatin ligand is essential for nucleic acid binding and the
anti-HIV activity of these compounds, but the free ligand exhibits drastically
different trends in nucleic acid affinity as compared to the eilatin-containing metal
complexes. Unusual trends in enantiomeric selectivity, single-stranded nucleic
acid binding, and sequence specificity make the eilatin-containing metal
complexes two of the most unusual, and best characterized, RRE ligands to
date.

86
5.0 Ethidium Bromide: Biological Activities and Nucleic Acid Binding
Ethidium bromide is the common name for 3,8-diamino-5-ethyl-6-
phenylphenanthridinium bromide (12). First reported in 1952, it was developed by
the Boots company as an anti-trypanosomal agent.124 Homidium bromide
(ethidium) is prepared in large quantities by alkylation of 3,8-dinitro-6-phenyl
phenanthridine with ethyl-p-toluene sulfonate, followed with reduction by Fe, and
precipitation using ammonium bromide.125 Ethidium is a common stain for
double-stranded DNA and RNA.126 It is also reported to possess significant anti-
cancer,127 and anti-parasitic activities.124 Its potential applications in human
treatment have been prevented, however, due to its mutagenic and carcinogenic
activities in model systems.128-129 For example, Frog larvae (Xenpous laevis)
exposed to near toxic concentrations of ethidium develop gross malformations of
all major organ systems.128 Upon metabolic activation with liver homogenate,
ethidium causes frame shift mutations in the Ames assay.129 From these, and
similar studies, it has been concluded that long-term exposure to ethidium may
cause inheritable genetic damage and/or cancer in humans. Despite this,
ethidium is still marketed by Laprovet as a safe and inexpensive treatment for
cattle suffering from trypanosomosis.130
A possible relationship between ethidium’s nucleic acid binding and its biological
activities has been examined both in vivo and in vitro. Experiments by Nass
indicated that the growth of both mouse fibroblasts and hamster kidney cells is
inhibited by 0.3 – 13 µM of ethidium, and that mitochondrial, not nuclear, DNA

87
synthesis is inhibited by ethidium.131 Other studies showed that ethidium
accumulates in isolated rat mitochodrion and interferes with normal respiration.132
Ethidium is, however, only moderately toxic to mammals, with an LD50 in mice of
~300 µM (100 mg/kg, subcutaneous);133 and it is an effective trypanocide in
cattle at ~ 3 µM (1mg/kg, intravenous).124,130
The in vitro study of ethidium-nucleic acid binding can be conducted by
monitoring the photophysical changes of ethidium upon addition of nucleic
acids.134-135 Ethidium binds to DNA and RNA duplexes with moderate affinity (Kd
ranges from 0.2 – 200 µM) and variable stoichiometry (3 – 6 equivalents of
ethidium per helical repeat) depending on the sequence of the duplex.87 It was
proposed that ethidium binds to nucleic acids via two distinct modes: electrostatic
surface binding (at low ionic strengths) and intercalation (at higher,
physiologically relevant ionic strengths).135 Crystal structures and NMR studies of
tRNA bound to ethidium have confirmed its ability to both intercalate and to bind
the surface of nucleic acids.136-138 Ethidium is reported to bind to duplexes that
contain bulged bases with a higher affinity as compared to the same duplexes
without a bulge.139 This could potentially explain ethidium’s high affinity for the
RRE. Ethidium has two high-affinity binding sites on the RRE (with an average Kd
= 0.2 µM), and it displaces the Rev peptide with similar activity (Section 3.4 and
Figure 3.14). In addition, we have found ethidium to be a potent inhibitor of HIV-1
replication. Using the plaque-formation assay described in figure 4.1, an IC50
value of 0.2 µM is measured for ethidium. This activity is only ~20-fold lower than

88
the well-know HIV inhibitor AZT (see E 1.1 for a summary of anti-HIV IC50
values). The HeLa cells used in these assays, however, detach from their plates
after a three-day exposure to 3 – 10 µM of ethidium bromide. This is indicative of
toxicity and is not observed for the other compounds evaluated in this thesis. In
an attempt to simultaneously decrease its toxic/mutagentic properties while
increasing its anti-HIV activity, a number of ethidium derivatives have been
synthesized and are currently being evaluated for nucleic acid affinity and
biological activities (Figure 5.1).
To date, only a small number of ethidium derivatives have been reported.125,140-
146 Early modifications included variation of the alkyl chain with groups other than
ethyl (methyl, propyl, etc).125 Compared to ethidium, these derivatives have the
same DNA affinity,140 but are significantly more toxic.124 The 6-phenyl ring of
ethidium has been substituted with other groups (hydrogen, 4-amino phenyl, 4-
nitro phenyl, methyl, napthyl, etc).141 Again, similar DNA affinities were measured
for these derivatives.140 Ethidium’s exocyclic amines have been converted to
azido (N3),142 leading to highly reactive photo-crosslinking agents.143 These
compounds are also reported to have similar DNA affinity as compared to
ethidium,142 and are highly mutagenic.144 Amino acids have been conjugated to
ethidium through its exocyclic amines and through its phenyl ring, but the nucleic
acid affinities of these derivatives have not been reported.145,146

89
Figure 5.1. New ethidium derivatives and a summary of the wavelengths ofmaximum adsorption (λ-abs), emission maximum (λ-em), and the approximatequantum efficiency (emission intensity) relative to ethidium (φrel). All valuesdetermined at 10 µM of each compound in 50 mM sodium phosphate (pH = 7.5).
N
R2R1
R1 R2
N
N N
X-
H2N
O
NH
NH2
O
NH
H2N
O
NH
NH2
O
NH
H2N
NH2
H2N
Number Compound
N NH2
NH2H2N
NN
H2N
NH
NH
NH2
NH
NH
H2N
NH
NH
NH2
NH
NH
NH2
H2N
O Ph
O
HN
OPh
O
HN
(25)
8-pyrole ethidium
3,8-bis pyrole ethidium
3-pyrole ethidium
3-urea ethidium
8-urea ethidium
3,8-bis urea ethidium
λ-abs (nm)
(26)
(27)
(22)
(23)
(24) 434
455
466
(12) ethidium 486
(28) tetramethyl ethidium 534
3-guanidino ethidium
8-guanidino ethidium
3,8-bis guanidino ethidium
(19)
(20)
(21)
443
455
398
428
458
464
OPh
O
HN
NH2(16)
(17)
(18)
3-cbz ethidium
8-cbz ethidium
3,8-bis cbz ethidium
468
473
430
+
O Ph
O
HNH2N
φrel
57
0.8
0.09
1.0
0.08
0.5
0.08
3.1
1.2
1.0
0.2
1.0
0.2
57
λ-em (nm)
521
594
607
606
643
593
606
504
504
589
603
589
603
510

90
Surprisingly, the exocyclic amines of ethidium have not, until now, been
systematically substituted with other functional groups. Modification of one, or
both, of these amines provides a “modular” approach for introducing new
chemical diversity into ethidium (Figure 5.1). These modifications are found to
dramatically affect the electronic structure, nucleic acid affinity, and the biological
activities of the resulting derivatives.
5.1 Electronic Properties of Ethidium and its Derivatives
The charge distribution in ethidium is believed to be important for its high affinity
intercalation into nucleic acids.142, 147 Significant efforts have been invested in
constructing electrostatic models that can simulate the stacking interactions of
ethidium with base pairs.148-150 These models are based upon quantum
mechanical calculations and have not, to date, been able to predict or rationalize
the sequence specificity of ethidium bromide (Table 4.5).
π-stacking interactions are sometimes modeled as having partial covalent
character, where the interactions between the LUMO of the intercalator and the
HOMO base-pair are used to predict stacking energies.150 The LUMO of the
intercalator is believed, by some, to be electrostatically relevant, as the ability to
accept electrons should be related to the electron density at each position.149
Some groups have interpreted the spectral changes of ethidium, upon binding
nucleic acids, as having some of the characteristics of a charge transfer complex;
and they have suggested that HOMO-LUMO stabilization may be involved.150

91
This would provide evidence that Mulliken theory is applicable for evaluating the
aromatic stacking interactions in ethidium-base pair complexes.151
The theoretical electrostatic potential around an intercalator or a base pair can be
calculated by evaluating the interactions between individual atoms upon fitting
the molecule in an electrostatic force field.149,152,153 These calculations are useful
for examining the potential electronic charge of each atom, but do not reflect the
actual electrostatic field emanating from the molecule itself. Consequently, the
polarizability and the induced dipoles of the base stacking interaction are
weighted much more heavily than any complementation between the
electrostatic field of the intercalator with the base pair. As a result of these, and
similar theoretical studies, some groups believe that dispersion forces (induced
dipole-dipole interactions) dominate nucleic acid intercalation and have
concluded: “there is no need to consider any out of plane πcharges (“sandwich”
model) to account for aromatic intercalator-base pair stacking”.149
Dispersion forces depend, mostly, on the total shared surface area of the
interaction and on the polarizability of each surface. These effects may, in fact,
be a dominant driving force for intercalation.149 They cannot, however, explain
the sequence specificity of ethidium bromide. Crystal structures of ethidium
bound by different dinucleotides, show that about the same surface contacts are
made between ethidium and different intercalation sites.138 In addition, the larger,

92
more polarizable base pairs (G-C) do not exhibit the highest binding affinity for
ethidium (Table 4.5).
Ethidium binds to different duplex nucleic acids with a free energy range of 5.3 –
8.8 kcal/mole, depending on the structure and sequence of the nucleic acid
(Table 4.5). It is possible that this sequence selectivity is related to electrostatic
complementation between the unique distribution of π-electron charge density of
ethidium’s phenanthridinium “core” with the different electronic features of each
intercalation site. Electrostatic complementation is known to be an important
component of π-stacking interactions.151 For phenyl-phenyl stacking, electron-
withdrawing groups lower the Coulombic repulsion between the πelectrons of
each ring. 154,155 Coulombic attraction is often observed when an electron-rich
ring and an electron-poor ring are stacked face-to-face.151,156 This type of
electrostatic attraction may involve interactions between the opposite
quadrupolar moments of each ring, and, unlike charge transfer complexes, does
not necessarily involve direct orbital-orbital overlap between each of the π
systems.156 To date, most of the systems that have been used to examine π-
stacking interactions involve molecules that are formally neutral.151,153 Ethidium
has a formal charge of +1, so Coulombic interactions, not charge transfer, may
dominate its π-stacking interactions. We believe that current modeling efforts,
and hence the rational design of new intercalating agents, can be significantly
improved by a more detailed understanding of ethidium’s electronic structure.
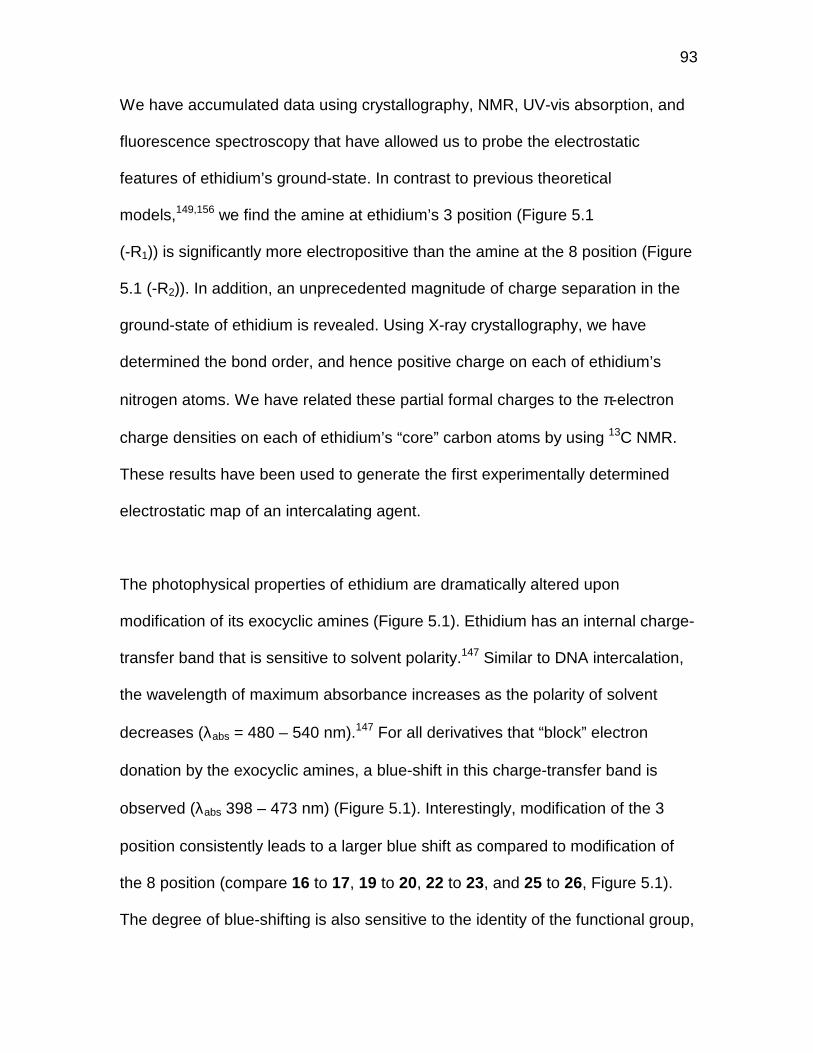
93
We have accumulated data using crystallography, NMR, UV-vis absorption, and
fluorescence spectroscopy that have allowed us to probe the electrostatic
features of ethidium’s ground-state. In contrast to previous theoretical
models,149,156 we find the amine at ethidium’s 3 position (Figure 5.1
(-R1)) is significantly more electropositive than the amine at the 8 position (Figure
5.1 (-R2)). In addition, an unprecedented magnitude of charge separation in the
ground-state of ethidium is revealed. Using X-ray crystallography, we have
determined the bond order, and hence positive charge on each of ethidium’s
nitrogen atoms. We have related these partial formal charges to the π-electron
charge densities on each of ethidium’s “core” carbon atoms by using 13C NMR.
These results have been used to generate the first experimentally determined
electrostatic map of an intercalating agent.
The photophysical properties of ethidium are dramatically altered upon
modification of its exocyclic amines (Figure 5.1). Ethidium has an internal charge-
transfer band that is sensitive to solvent polarity.147 Similar to DNA intercalation,
the wavelength of maximum absorbance increases as the polarity of solvent
decreases (λabs = 480 – 540 nm).147 For all derivatives that “block” electron
donation by the exocyclic amines, a blue-shift in this charge-transfer band is
observed (λabs 398 – 473 nm) (Figure 5.1). Interestingly, modification of the 3
position consistently leads to a larger blue shift as compared to modification of
the 8 position (compare 16 to 17, 19 to 20, 22 to 23, and 25 to 26, Figure 5.1).
The degree of blue-shifting is also sensitive to the identity of the functional group,

94
where electron withdrawing functional groups lead to larger blue shifts as
compared to functional groups that merely “block” electron donation (compare
the guanidinium derivatives 19, 20 and 21, to the urea derivatives 22, 23, 24).
The only derivative that augments electron donation (28) exhibits a red-shifted
wavelength of maximum absorbance (Figure 5.1).
These derivatives also show interesting trends in their fluorescence properties.
Ethidium has a weak emission band (quantum yield < 0.01) that is sensitive to
solvent polarity (λem 610 – 645 nm, longer wavelengths in less polar solvents).147
As before, all derivatives of ethidium that effectively “block” electron donation by
its exocyclic amines, shift the emission maxima to the blue. Again, the blue-shift
is more pronounced when the 3 position is modified as compared to the 8
position; but unlike the absorbance maxima, the changes in emission maxima
are not very sensitive to the identity of the functional group. For all 3-modified
derivatives λem = 591 ± 3 nM; for all 8-modified derivatives λem = 605 ± 2 nM.
Trends in the relative quantum efficiencies of each compound also indicate
significant electronic differences between the 3 and 8 positions. The modification
of the 8 position leads to a significant decrease (3 – 15 fold) in emission intensity
(relative to ethidium). Modification of the 3 position, however, shows little to no
effect (Figure 5.1). For the bis-substituted derivatives that block electron donation
from the nitrogens (18 and 24), significantly higher quantum yields are measured
(57-fold greater compared to ethidium). The only derivative that augments
95
electron donation (28) exhibits a much lower quantum efficiency as compared to
ethidium (12). These observations suggest that electron donation by ethidium’s
exocyclic amines quenches its excited state through an internal charge transfer.
The differences observed between the amines at the 3 and 8 positions suggest
that electron donation from the 3 position amine lowers the energy of excitation
and emission, but also lowers the quantum efficiency of emission (much more so
than the 8 position). Additional interpretations of these photophysical trends are
complicated by the likelihood that the energetic levels of both the ground-state(s)
and excited state(s) are changed upon derivatization. Other groups have also
observed spectral differences between 3 and 8 modified positions, but have
attributed it to the differences in LUMO energy levels of the two positions.147 This
is an inadequate explanation, as we have found significant differences in the
ground-state electronic properties of these two amines that present some
explanations for the spectral differences at these positions. To probe the
structural and electronic properties of ethidium’s ground-state, NMR
spectroscopy and X-ray crystallography have been used.
It is clear, from 1H-NMR, that the chemical environments of ethidium’s exocyclic
amines are significantly different (Figure 5.2). As compared to ethidium, the
proton NMR spectrum of ethidium’s uncharged analog (3,8-diamino-6-
phenylphenanthridine) shows much higher symmetry across the phananthridine
core where similar chemical environments are seen for each of its exocyclic
amines and for protons a1 & a2, b1 & b2, and c1 & c2 (Figure 5.2 A). Interestingly,

96
ethylation of 3,8-diamino-6-phenylphenanthridine introduces significant electronic
asymmetry (Figure 5.2 B). Upon ethylation, most protons are downfield shifted
by 0.2 – 0.5 ppm (Figure 5.2 B). There are two notable exceptions: proton a2 is
upfield shifted by 0.7 ppm, and the protons on one of the two exocyclic amines
are downfield shifted by 1.0 ppm (compare A and B Figure 5.2).
Figure 5.2. 1H NMR of 3,8-diamino-6-phenylphenanthridine (A) and of ethidiumchloride (B) in DMSO-d6. A partial assignment of ethidium (B) has previouslybeen made,157,158 but assignments for the exocyclic amines have not yet beenreported.
The upfield shift of proton a2 is highly sensitive to modifications of the 8 position,
but not sensitive to modifications of the 3 position. The conversion of the 8-amine
into any group that blocks electron donation (including compounds 17, 18, 20,
21, 23, 24, 26, 27) results in a downfield shift of a2 to a more “normal” aromatic
4.55.05.56.06.57.07.58.08.59.09.5
N
NH2H2N
a1 a2
b2c2c1b1
Phd d
N
NH2H2N
a1 a2
b2c2c1b1
Ph
c1 & c2
c1 & c2
Ph
Ph
b2
a2
a1 & a2b1 & b2
a1
b1
NH2 NH2
NH2NH2
d
A)
B)
4.55.05.56.06.57.07.58.08.59.09.5
+

97
frequency (δ = 7 – 7.4 ppm). The modification of the 8-amine with groups that
augment electron donation, results in an even further upfield shift of a2 (∆δ = -0.2
ppm for 28). This suggests that the 8-amine donates electron density directly
onto the carbon attached to the a2 proton. 13C NMR experiments support this
conclusion (presented below). Previous groups have assigned ethidium’s 1H
NMR spectrum based upon the highly shielded proton a2.157-158 It has always
been assumed that the phenyl ring at the 6 position shields the a2 proton via a
ring current effect.145, 157-159 This is not a sufficient explanation, as ethidium’s un-
charged analog (3,8-diamino-6-phenylphenanthridine) shows no unusual
shielding of a2 (Figure 5.2A). 160 Our results indicate that the presence of the
quarternary amine and the electron donation from the 8-amine are largely
responsible for the unusually high electron density at a2.13C NMR experiments
(presented below) confirm this conclusion.
The differences in the 1H chemical shifts of ethidium’s two exocyclic amines
indicate that one amine is significantly more electropositive than the other (Figure
5.2 B). The identity of each of ethidium’s exocyclic amines is apparent by
comparing the proton NMR spectra of the cbz derivatives (16-18) (Figure 5.3). By
comparing the chemical shifts of the unblocked amine present in 8-cbz ethidium
chloride (Figure 5.3 A) to that of 3-cbz ethidium chloride (Figure 5.3 B), it is clear
that the 3 position of ethidium is more electron poor than the 8 position. All other
chemical shifts (such as protons e1 versus e2, and f1 versus f2) are consistent
with this conclusion (Figure 5.3 A – C). The 1H NMR assignment of ethidium

98
was confirmed using 1H-13C Heteronuclear Multiple Bond Correlation (HMBC)
experiments (presented below).
Figure 5.3: 1H NMR of (A): 8-cbz ethidium chloride (17), (B): 3-cbz ethidiumchloride (16), (C): 3,8-bis cbz ethidium chloride (16), (D): ethidium chloride (12) ind6-DMSO. Sample (A) is doped with 5% of sample (16) to serve as an internalreference.
The 3 and 8 positions of ethidium are not equivalent, but electronic
communication between the positions is apparent. The e1 and e2 protons are
shielded in both of the mono-cbz derivatives relative to bis-cbz ethidium
(compare Figures 5.3 A & B to C). Conversely, the amines at the 3 and 8
4.55.05.56.06.57.07.58.08.59.09.510.010.511.0
4.55.05.56.06.57.07.58.08.59.09.510.010.511.0
4.55.05.56.06.57.07.58.08.59.09.510.010.511.0
4.55.05.56.06.57.07.58.08.59.09.510.010.511.0
N
NN
a1 a2
b2c2c1b1
Phd d
O
O
O
Oe1 e2
f1f1 f2f2
PhPh
N
NH2N
a1 a2
b2c2c1b1
Phd d
O
Oe2
f2f2
Ph
N
NH2N
a1 a2
b2c2c1b1
Phd d
O
Oe1
f1f1
Ph
c1 & c2
c1 & c2
c1 & c2
c1 & c2
3-NH2
8-NH2
8-NH23-NH2
d
d
d
d
a2
a1
f2
f1
Pha2
Ph
Phb1
Ph
Ph
Ph
f2f1
e2
e1
e1
e2
Ph
a2
b1
b2
b2
b2 b1
b2
N
NH2H2N
a1 a2
b2c2c1b1
Phd d
A)
B)
C)
D)
a1
a1b1
a2a1
+
+
+
+

99
positions are deshielded upon cbz modification of the other position (compare
Figures 5.3 A & B to D). This indicates that upon blocking electron donation of
one amine, the other amine can “compensate” by donating more of its electron
density into the phenanthridinium core. This conclusion is confirmed by
comparing the nitrogen-carbon bond lengths in the X-ray crystal structures of 12,
17, and 18 (presented below).
Importantly, protons a1 & a2 are much more sensitive to cbz-modification as
compared to both b1 & b2 and c1 & c2 (Figure 5.3). Both the a and b protons are
ortho- to each amine, however, upon cbz modification the a proton is shifted
downfield by 1.4 ppm, and the b proton is shifted downfield by 0.7 ppm (compare
Figures 5.3 A & B to D). This is true for both the 3 and 8 amines, and indicates
that electron density from each amine is preferentially drawn towards the positive
center, thus shielding the a protons more so than the b protons. This conclusion
is supported by 13C NMR (presented below).
As for its 1H NMR spectrum, ethidium’s 13C spectrum shows an unusually wide
disbursal of peaks in the aromatic region (Figure 5.4, Bottom). We have fully
assigned ethidium’s 13C spectrum by using Distortionless Enhancement by
Polarization Transfer (DEPT), Carbon-Hydrogen Correlation spectroscopy
(HETCOR), and Heteronuclear Multiple Bond Correlation (HMBC) experiments.

100
Figure 5.4: 13C NMR spectra of ethidium chloride in DMSO. DEPT was used toidentify the primary, secondary, tertiary, and quarternary carbons.
DEPT experiments reveal the number of hydrogens attached to each carbon
(Figure 5.4). Interestingly, five of ethidium’s tertiary core carbons “13C-(1H)” are
upfield relative to typical phenyl carbons (Figure 5.4). The δ for benzene, for
comparison, is 129 ppm. This suggests that, despite ethidium’s positive charge,
these carbons possess high electron densities. All of the carbons that are
electron poor, relative to benzene, are found to be quarternary (Figure 5.4).
Full 13C spectrum
All 13C - 1H
13C - (1H)
13C - (1H)2
13C - (1H)3

101
Carbon-Hydrogen Correlation spectroscopy (HETCOR) has been used to assign
the identity of each carbon that is directly bound to a single hydrogen (Figure
5.5). We find that the most electron-rich carbons are C4 and C7 (see Figure 5.7
for the numbering scheme and a summary of assignments). Assignments of the
carbons at the 1, 2, 9, and 10 positions were also determined by HETCOR, and
confirmed by HMBC. These assignments are consistent with those determined
by NOE experiments.161
Figure 5.5: 13C-1H HETCOR NMR spectrum of ethidium chloride in DMSO withthe 1H spectrum (left) and the “13C – (1H)” DEPT spectra added for reference.
HMBC experiments have been used to identify all the quarternary carbons and to
confirm the assignment of the 1H NMR spectrum of ethidium (Figure 5.6). For
ppm8090100110120130140150160170
ppm
5.05.25.45.65.86.06.26.46.66.87.07.27.47.67.88.08.28.48.68.89.09.29.49.69.8

102
HMBC, cross peaks are not observed between carbons and hydrogens that are
directly bound to each other; rather, HMBC gives cross peaks between a
hydrogen and the carbons that are ortho- or meta- to the atom that is bound to
that hydrogen. In our case, the ortho- carbons have been decoupled so that all
cross peaks traverse exactly three bonds. Three cross peaks are observed for
each 1H-C type hydrogen; two are meta- relative to the 1H-C and one is on an
adjacent ring. Two cross peaks are observed for each 1H-N type hydrogen, both
from the carbons meta- to each amine.
Figure 5.6: HMBC spectrum of ethidium chloride in DMSO with 13C and 1Hspectra added for reference. Coupling between the “d” hydrogens of the ethylgroup and C6 allows unambiguous assignment of C6 at 157.5 ppm (highfieldregion not shown).

103
The most striking features of ethidium’s 13C spectrum are the highly shielded
carbons at positions 4 and 7. At 97 and 107 ppm, respectively, these carbons are
in the same chemical shift region observed for aromatic carboanions.162
Consistent with the trends observed in the 1H NMR spectra, the modification of
ethidium’s 8-amino position with cbz results in a large downfield shift of C7 (∆δ =
+10 ppm). The modification of ethidium’s 3-amino position results in the same
downfield shift of C4 (∆δ = +10 ppm) (Figure 5.7 A and C). This indicates that the
high electron density at these positions depends largely on electron donation
from the neighboring exocyclic amines.
Figure 5.7: 13C NMR spectra of (A): ethidium chloride (12), (B): 8-cbz ethidiumchloride (17), (C): 3-cbz ethidium chloride (16), each in d6-DMSO. See Table 5.1for the full 13C assignment of 12.
5060708090100110120130140150160170
5060708090100110120130140150160170
5060708090100110120130140150160170
A)
B)
C)
C3
C2 C1
C12
C13C4
C11
C14
C6N
C10 C9
C8
C7
NH2H2N
PhC15C16
+
O
OCZ
C3
C2 C1
C12
C13C4
C11
C14
C6N
C10 C9
C8
C7
NH
H2N
PhC15C16
+
Ph
O
O
CZ
C3
C2 C1
C12
C13C4
C11
C14
C6N
C10 C9
C8
C7
NH2NH
P hC15C16
+
Ph
C6 C3
C8
C4 C15C7C12C2
C14C1C13
Ph
C10

104
The only carbons in ethidium with chemical shifts that are significantly downfield
shifted, relative to benzene, are the carbons that are bound directly to nitrogens
(Figure 5.7 A). C3 and C8 have chemical shifts similar to the nitrogen-bound
carbon of aniline (148 ppm).162 Interestingly, C6 is significantly more deshielded,
and C13 is significantly more shielded as compared to both C3 and C8 (Figure
5.7A).
To relate ethidium’s electronic features to the bond orders between its C and N
atoms, X-ray crystallography was used to solve the 3-D structure of ethidium
chloride and of the mono-cbz derivatives 16 and 17. The bond lengths observed
in the phenanthridinium core of ethidium chloride are similar to those of two
recent structures of phenanthridine, and 5,6-dimethyl phenylphenanthridinium
chloride (Figure 5.8 A – C).163-164 For all three compounds, the carbon-carbon
bond lengths in the phenyl rings of phenanthridine alternate between relatively
short and relatively long (for comparison, benzene’s C-C bond lengths are 1.39
Å). The patterns of bond orders that contribute to ethidium’s phenanthridinium
core are summarized in Figure 5.9. Another group has recently calculated the
bond orders for phenanthridine (Figure 5.10).164 Significant double-bond
character exists between C3-C4 and C7-C8 carbons, while some single-bond
character is observed at C2-C3 and C8-C9. This may, in part, explain the greater
electron donation from the exocyclic amines to the 4 and 7 positions versus the 2
and 9 positions.

105
A) Phenanthridine (Brett, Rademacher, and Boese)163
B) 5,6-dimethyl phenylphenanthridinium chloride (Kiralj, Kojic-Pordic, Zinic,Alihodzic, and Trinajstic)164
C) Ethidium chloride (Luedtke, Liu, Tor)165
Figure 5.8. Bond lengths (Å) observed for three recent crystal structures ofphenanthridine and phenanthridinium-containing molecules. Errors in bondlengths are approximately ± 0.003 Å for (A) and (C) and ± 0.005 Å for (B). See E5.1.1 for the ORTEP drawing and crystallographic parameters for ethidiumchloride (C).
N 1.296
1.377
1.407
1.374
1.446
1.407
1.418
1.41
6
1.37
3
1.401
1.381
1.40
3
1.408
1.41
31.
396
1.432
N
1.5011.322
1.370
1.416
1.374
1.440
1.415
1.409
1.41
2
1.35
1
1.391
1.357
1.38
9
1.394
1.40
91.
422
1.410
1.49
0
N
NH2H2N
1.517 1.488
1.337
1.48
9
1.371 1.381
1.365
1.402
1.369
1.431
1.412
1.417 1.41
4
1.38
4
1.417
1.378
1.386
1.38
41.38
4
1.394
1.389
1.378
1.41
6
1.417
1.41
41.
406
1.416

106
Figure 5.9. All possible Clar and Kekulé depictions of ethidium. Theexperimentally determined bond lengths in ethidium indicate that somedepictions contribute more to the actual structure (near Bottom), while otherscontribute much less (near Top).
Figure 5.10. A summary of phenanthridine’s π-bond orders as determined byKiralj.163 Pauling bond orders were calculated by analyzing the bond lengths of ahigh-resolution crystal structure of phenanthridine (Figure 5.5 A).162 Ethidium hasapproximately the same bond lengths as phenanthridine and, therefore, similarbond orders (Figure 5.5 C).
Crystallographic data indicates that both phenanthridine and 5,6-dimethyl
phenanthridinum are perfectly planar.163,164 In contrast, ethidium is found to have
a 4o twist in its phenanathridinium core (the angle between two vectors defined
N .8
.2.2
.2
.4.4
.4.4
.6
.4
.6
.4 .4
.6
.4
.6
N
NH2H2N
N
NH2H2N
N
NH2H2N
+
+
+
N
NH2H2N
+
N
NH2H2N
+
N
NH2H2N
+
N
NH2H2N
+
ContributesLess
ContributesMore

107
by protons b1c1 and b2c2, relative to the central axis of the biphenyl “core” of
ethidium). Taken together this suggests that some sp3 character is introduced
into the phenanthridinium core of ethidium by the exocyclic amines. Significant
differences are observed in the C-N bond lengths of ethidium’s two exocyclic
amines. A shorter bond length is found for the amine at the 3 position, compared
to the amine at the 8 position (Figure 5.8 C and 5.11 C). This indicates that more
C=N double bond character, and hence positive charge, is at the 3 position
versus the 8 position. Both positions, however, have significantly shorter N-C
bond lengths as compared to aniline (1.40 Å), and therefore, both amines carry
partial positive charges. This is consistent with the chemical shifts of these
amines in the 1H NMR spectrum of ethidium (Figure 5.3 D).
Two other groups have also solved the crystal structure of ethidium. The first,
and most cited structure, was published by Hospital et. al. in 1969.165 It shows no
differences in the C-N bond lengths of its two exocyclic amines, and predicts the
phenanthridine core of ethidium to be perfectly planar (Figure 5.11 A).165 Unlike
the modern crystal structures of phenanthirdine-containing compounds (Figure
5.8), this structure has significant asymmetry in the C-C bond length/bond orders
in the biphenyl core of phenanthidinium. The deviation from symmetry for the two
phenyl rings (with respect to each other) is ca. 0.011 Å for the Hospital structure
compared to 0.004 Å for all the recent phenanthridine-containing compounds.

108
A) Courseille, Busetta, & Hospital (1969, 1974)165
B) Subramanian, Trotter, & Bugg (1971)166
C) Luedtke, Liu, & Tor (2002)167
Figure 5.11: Bond lengths (Å) observed for three crystal structures of ethidium.The crystal system is the same for all three structures (monoclinic), even thoughdifferent solvent molecules and anions are co-crystalized in each.
N
NH2H2N
1.500 1.499
1.338
1.48
0
1.364 1.395
1.353
1.416
1.362
1.424
1.407
1.397
1.41
7
1.36
9
1.395
1.377
1.370
1.35
91.36
8
1.379
1.394
1.367
1.40
0
1.413
1.42
61.
409
1.417
N
NH2H2N
1.500 1.497
1.333
1.50
1
1.378 1.375
1.340
1.395
1.362
1.431
1.421
1.4051.
415
1.38
1
1.415
1.378
1.383
1.39
51.36
9
1.393
1.369
1.377
1.41
5
1.4151.
413
1.41
11.406
N
NH2H2N
1.517 1.488
1.337
1.48
9
1.371 1.381
1.365
1.402
1.369
1.431
1.412
1.417 1.41
4
1.38
4
1.417
1.378
1.386
1.38
41.38
4
1.394
1.389
1.378
1.41
6
1.417
1.41
41.
406
1.416

109
The second crystal structure of ethidium, by Subramanian, Trotter & Bugg, is
much more consistent with ours (Figure 5.11 B). It shows a shorter N-C bond and
hence, greater positive charge at the 3 position as compared to the 8 position. In
addition, the phenanathidinium core in this structure is twisted out of planarity by
4o. Interestingly, the Subramanian crystal structure shows a different
hybridization at each of its exocyclic amines. The 3- and 8-amino groups are
predicted to be sp2 and sp3, respectively.166 We also find unusual hybridizations
of the exocyclic amines. Electron difference maps indicate that both the 3- and 8-
amino groups are intermediate between sp2 and sp3 hybridized.
Both of the older crystal structures of ethidium (Figure 5.11 A & B) unexpectedly
show C-C bond lengths in the 6-phenyl ring that deviate substantially from that of
benzene (1.39 Å). The average deviation in bond lengths of the 6-phenyl ring,
compared to benzene, is 0.013 Å for the Subramanian and Courseille structures,
and 0.006 Å for our structure (Figure 5.11). Both 1H and 13C NMR indicate that, in
solution, the 6-phenyl of ethidium has the typical chemical shifts of a mono
substituted phenyl ring, and therefore, no unusual bond orders are expected.
Ethidium is an electronically and structurally plastic molecule. Evidence for
electronic plasticity can be found in the crystal structures of 3-cbz ethidium
chloride (16) and 8-cbz ethidium chloride (17) (Figure 5.12). For both mono-cbz
derivatives, the cbz group merely “blocks” electron donation of the exocyclic
amine without making it an electron withdrawing group, as the C-N bond length

110
for both the 3 and 8 cbz-protected amine is 1.399 Å (Figure 5.12). This is the
same C-N bond length for aniline. The C-N bond lengths for the “unblocked”
amines are shorter compared to the same bond lengths in the parent structure
(compare Figure 5.11 C and Figure 5.12). This indicates that upon “blocking”
electron donation from one amine (by cbz protection) the other side can
compensate by donating more of its electron density into the phenanthridinium
core. This is consistent with the changes in 1H chemical shifts of the amines of
compound 12 as compared to 16 and 17 (Figure 5.3 A, B, D). It is possible that
this increased electron donation from the 3 position leads to lower quantum yield
for the 8 cbz derivative (Figure 5.1). The increased electron donation from the 8
position does not, however, change the quantum yield of the 3 cbz derivative
relative to ethidium (Figure 5.1). Both NMR and the changes in bond order
suggest that the magnitude of increased electron donation is approximately equal
for both derivatives (upon “blocking” the other side with cbz). It is possible that
the charge transfer observed between the 3 position and the quaternary amine is
related to the differences in quantum yield upon cbz modification (Figre 5.13).
The relative planarity of each derivative may also be a factor.
Structural flexibility of the phanathidinium ion can be inferred by comparing the
crystal structures of 8-cbz and 3-cbz ethidium chloride. As for the parent
compound, the phenanthridinium cores of these molecules are not planar. The
twist angle is, however, different for each cbz derivative. The crystal structure of
3-cbz ethidium chloride has the same twist as the parent compound (4°). 8-cbz

111
ethidium, however, shows a greater twist of the phenenthiridine core (8°). This is
consistent with more sp3 character residing on the phenanthridinium core when
the 8 position is blocked. This may, in part, explain the differences in quantum
yield of emission for these derivatives (Figure 5.1). Blocking the 8 position with
cbz increases the electron donation by the 3-amine and induces a greater twist of
the phenanathridinium core (relative to ethidium), while modification of the 3
position changes neither the twist nor the quantum yield of the cbz derivative
(relative to ethidium) (Figure 5.1).
Figure 5.12: Bond lengths (Å) found in the crystal structures of 3-cbz ethidium(16) (Top) and 8-cbz ethidium chloride (17) (Bottom). Errors in bond lengths are+/- 0.002 Å. See section E 5.1 – E 5.2 for ORTEP drawings and crystallographicparameters for 16 and 17.
N
NH2NH
O
O
1.513 1.497
1.333
1.49
21.399 1.364
1.371
1.397
1.369
1.437
1.412
1.415 1.41
3
1.38
0
1.4131.385
1.385
1.38
91.39
1
1.393
1.395
1.393
1.41
9
1.419
1.41
31.
405
1.429
1.3541.348
1.21
2
1.4551.503
1.391
1.3861.392
1.3921.385
1.38
4
N
NH
H2N
O
O
1.525 1.491
1.333
1.49
7
1.356 1.399
1.366
1.394
1.371
1.429
1.416
1.413
1.42
1
1.39
3
1.418
1.383
1.382
1.39
31.39
2
1.391
1.392
1.374
1.41
9
1.414
1.41
91.
412
1.419
1.365
1.207
1.3511.457 1.500
1.38
4 1.384
1.394
1.374
1.367
1.385

112
The crystal structure of 8-cbz ethidium chloride (17) shows that the C-N bond
length at the 3 position is shorter compared to the C-N bond at the 8 position
length for 3-cbz ethidium chloride 16 (Figure 5.12). This is consistent with 1H
NMR experiments (Figure 5.3), and indicates that even for these mono-cbz
derivatives, a greater total positive charge is on the 3-amine as compared to the
8-amine (for the 8-cbz and 3-cbz derivatives, respectively). 13C NMR indicates,
however, that the 3- and 8-amines donate the same amount of electron density
onto their neighboring carbons (C4 and C7, respectively) (Figure 5.7).
We believe the electronic differences between ethidium’s 3 and 8 positions are
consistent with simple resonance theory. The positive charge on ethidium’s
quarternary amine can delocalize to the 3 position but not to the 8 position
(Figure 5.13). No matter which Kekulé structure is used (Figure 5.9), it is not
possible to push the lone pair of electrons from the 8-amine directly onto the
quarternary amine.
Figure 5.13. Resonance structures showing charge transfer between thequarternary amine and the 3- amino.
Both of the ethidium’s exocyclic amines, however, carry a partial positive charge.
We have found that both of these amines donate electron density onto the
carbon atoms of the phenanthridinium core of ethidium (especially C4 and C7).
N
NH2H2N+
N
NH2H2N
+

113
We propose, therefore, that charge-separated states make significant
contributions to the overall electronic structure of ethidium (Figure 5.14).
Figure 5.14. Two examples of charge separation that contribute to ethidium’sground-state electronic structure.
For most uncharged molecules, charge-separated states contribute very little to
the overall electronic structure. It appears, however, that for ethidium, charge
separation is an essential component of its ground-state electronic structure.
Using data from crystallography, NMR, and computation we have estimated the
partial positive and partial negative charges on each of the carbon and nitrogen
atoms on ethidium’s phenanthridine core. A summary of the charges are
presented in Figure 5.15. The partial formal charges at each of ethidium’s
nitrogens are calculated from the N-C bond lengths obtained from the high-
resolution X-ray crystal structure (Figure 5.8 C). A linear correlation between the
bond length and bond order has already been proven for aromatic nitrogen-
carbon bonds of phenanthiride-containing molecules.164 As a standard for the
exocyclic amines, the N-C bond length for the cbz-blocked amines (1.40 Å) is
taken as 0 (no charge separation) (Figure 5.9). This is the same bond length as
N
NH2HN
+N
NH2H2N
+
_+
N
NH2H2N
+N
NH2H2N
+_
+

114
aniline, and, therefore, the charges on each amine are relative to aniline. The
N=C bond length of dimetyl iminium chloride and phenanthridine (both 1.30 Å)
are taken as standards to equal +1 (a full double bond). For the endocyclic
amine, the N5-C6 bond length is used to assign its charge, taking a bond length
of 1.47 Å as a single bond and 1.30 Å as a double bond (based upon published
crystal structures of similar compounds). Using these bond lengths as standards,
a linear correlation is used to assign the magnitude of positive charge on each
nitrogen (Figure 5.12 A). The partial formal positive charge on each carbon
(Figure 5.12 A) was assigned by a summation of all the nitrogen partial charges
and subsequent distribution of the remaining positive charge to each carbon
atom according to a Penderson-Parr calculation of ethidium. According to both
13C and 1H NMR the 8-amine and 3-amine donate the same magnitude of
electron density onto the carbon atoms of ethidium. The difference in charge
between each amine is, therefore, the total magnitude of charge delocalization
between the 3-amine and quarternary amine (Figure 5.13). This value (+0.10) is
added to the partial charge on the quarternary amine (+0.60) and subtracted from
(+1.0) to obtain the total positive charge on all of the ethidium’s carbon atoms
(+0.30). This assumes that all of the electron density from the 8 position is
transferred onto carbon atoms, and that the total charge of the molecule (ignoring
the charge separation) equals (+1.0). The total positive charge on the carbon
atoms (+0.30) was then distributed to each carbon atom using the theoretical
partial charge on each atom as previously determined by a 18 π-electron
Penderson-Parr calculation of ethidium bromide.156
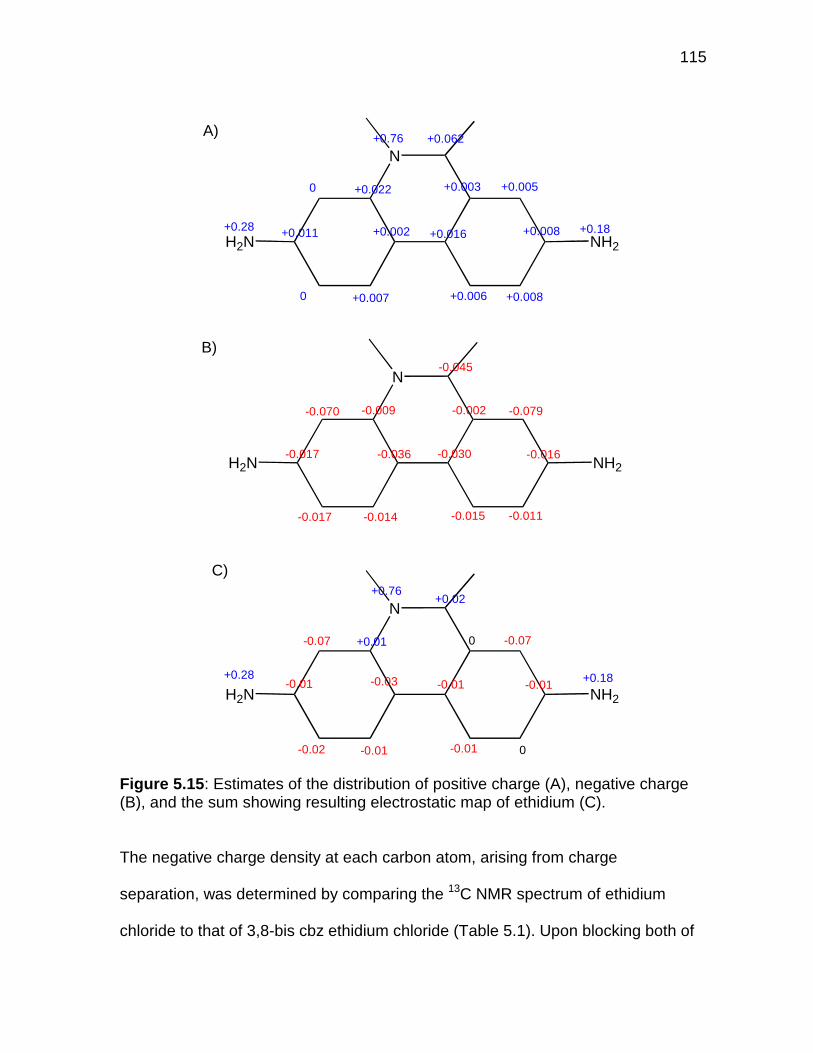
115
Figure 5.15: Estimates of the distribution of positive charge (A), negative charge(B), and the sum showing resulting electrostatic map of ethidium (C).
The negative charge density at each carbon atom, arising from charge
separation, was determined by comparing the 13C NMR spectrum of ethidium
chloride to that of 3,8-bis cbz ethidium chloride (Table 5.1). Upon blocking both of
-0.036
-0.079-0.070
-0.030
-0.009 -0.002
-0.014 -0.015-0.017 -0.011
+0.76
+0.18+0.28
N
NH2H2N
-0.045N
NH2H2N
+0.062
+0.022
+0.016+0.011
+0.007 +0.008
+0.008
N
NH2H2N
+0.76+0.02
0 -0.07
-0.03
+0.01-0.07
-0.02
+0.18+0.28
A)
B)
C)
+0.003 +0.005
+0.0060
0
+0.002
-0.017 -0.016
-0.01
-0.01-0.01 -0.01
-0.01 0

116
its exocyclic amines with cbz, ethidium’s carbon atoms shift by a total of +47.5
ppm. This total change in chemical shifts was correlated to the partial charges on
the amines by adding the total charges on the exocyclic amines (+0.45) and
subtracting the contribution by charge delocalization at the 3 position (+0.10).
The total amount of π-electron charge density provided by the amines is -0.36
formal units. A linear correlation between the π-electron charge density and the
change in 13C chemical shift has already been established.162 Interestingly, our
finding that ∆δ 48 ppm = 0.36 charge units is the same relationship (per carbon
atom) as previously reported for a series of simple anionic and cationic aromatic
rings.162 The total negative charge from charge separation (-0.36) was distributed
over the phenanathridinium core of ethidium by multiplying this value by the
fractional change in chemical shift for each carbon upon blocking the electron
donation from the exocyclic amines (Table 5.1 and Figure 5.15 B). The C3 and C8
carbons are excluded from this analysis, as the changes in their chemical shifts
are dominated by the substitution of the nitrogen atom to which they are
attached. These positions are not, however, expected to receive electron density
from the amine to which they are directly attached. Instead, C3 receives electron
density from the 8-amine, and C8 receives electron density from the 3-amine
(Figure 5.3 A – C). We have used, therefore, the chemical shifts of the mono-cbz
derivatives (relative to ethidium) to estimate the electron donation to these two
positions (Table 5.1).

117
Table 5.1: Summary of 13C assignments and chemical shifts of ethidium (12) and3,8-bis cbz ethidium chloride (18). HETCOR and HMBC experiments were usedto assign all carbon atoms in the phenanthridinium core of 12 and 18.
Carbon 12 δ (ppm) 18 δ (ppm) ∆∆∆∆ δ (ppm) π-electron density
1 123.7 125.5 1.8 -0.0142 119.2 121.4 2.2 -0.0173 150.5 142.3 2.2* -0.0174 97.7 107.0 9.3 -0.0706 157.5 163.4 5.9 -0.0457 107.1 117.5 10.4 -0.0798 147.2 140.3 2.1** -0.0169 127.1 128.6 1.5 -0.011
10 121.8 123.8 2 -0.01511 126.6 130.5 3.9 -0.03012 116.6 121.4 4.8 -0.03613 133.3 134.5 1.2 -0.00914 125.4 125.7 0.3 -0.002
*Change is the difference between 8-cbz ethidium and ethidium chloride.**Change is the difference between 3-cbz ethidium and ethidium chloride.
We have combined the contributions of cation distribution (Figure 5.15 A) with
charge separation (Figure 5.15 B) to create the first experimentally determined
electrostatic map of ethidium (Figure 5.15 C). This map illustrates the π-electron
distribution of partial positive and negative charges over the phenanthridinium
core of ethidium. As expected, the most electron-poor carbons are ortho- and
para- relative to the quarternary amine (C6, C11 and C13). Interestingly, these
carbons are directly bound by the four most electron-rich carbons (C4, C7, C12,
and C14). The electron density of the exocyclic amines, therefore, appears to be
directed onto carbons that can diminish the electrostatic repulsion between these
positively charged positions.
118
Crystal structures of ethidium intercalated into nucleotide diphosphates show that
the C6 and the quarternary amine are not involved in base stacking
interactions.138 We can consider, therefore, only the biphenyl “core” of ethidium
for modeling stacking interactions with base pairs. It is interesting that formal
negative charges dominate most of the carbons in the phenthidinium core of
ethidium. These electron-rich positions may base-stack with the electron poor
positions of the base pairs (the exocyclic amines). In collaboration with Dr. Kim
Baldridge, we are comparing possible electrostatic complementation between
ethidium and different intercalation sites. Previous electrostatic models of
ethidium neglect the significant electronic differences between the 3 and 8
positions and vastly underestimate the contributions made by “directed” charge
separation.149,156 We find that the differences in partial positive charges on the
exocyclic amines correlates with the differences in reactivity and basicicity of
these positions (next section).
5.2 Synthesis of Ethidium Bromide Derivatives
The exocyclic amines of ethidium, especially the 3 position, are poor
nucleophiles and weakly basic (pKa3 = 0.8, pKa8 = 2) (Section 5.3). The electron
withdrawing effect of phenanthridinium requires the use of highly reactive
electrophiles to modify ethidium’s exocyclic amines. Until now, no general
method for the systematic protection and “modular” modification of ethidium’s
exocyclic amines has been reported. The exocyclic amines of ethidium can be
protected by a reaction with benzyl choroformate (Figure 5.16). By using one

119
equivalent of cbz-chloride, a mixture of products is obtained that can be
separated using standard silica gel chromatography on gram-scale quantities
(see E 5.2 for synthetic details). The main products are 8-cbz ethidium chloride
(50%) and 3-cbz ethidium chloride (10%). The remainder is 3,8-bis cbz ethidium
chloride (2%) and unreacted starting material (Figure 5.16).
Figure 5.16: Protection of ethidium bromide with benzyl chloroformate. Seesection E 5.2.1 for synthetic details. The assignment of each isomer (16) and(17) was confirmed by X-ray crystallography (Section 5.2).
Other less electrophilic reagents, including Boc anhydride, are capable of
reacting only with the 8 position and give none of the 3 protected or bis-protected
products (even using a large excess of Boc anhydride and with catalytic DMAP).
Other research groups have also observed a greater reactivity of the 8 position
Br
N
NHH2N
Cl
O
N
NH2HN
Cl
N
NHHN
Cl
N
NH2H2N
ethidium bromide (12)
8-cbz ethidium (17)(50%)
3-cbz ethidium (16)(10%)
3,8-bis cbz ethidium (18)( 2%)
-
-
-
-
+
+
+
+
PhCH2OCOCl
O
O
O
O
O
O
O

120
relative to the 3 position and have attributed the differences to steric constraints
imposed by dimerization of ethdium in solution.145 It is more likely, however, that
the inherent electronic differences between the these two exocyclic amines are
responsible for the differences in reactivity (Section 5.1).
Figure 5.17: Synthesis of 3-guanidino ethidium chloride (19). Isolated yields arereported. See E 5.2.2 for experimental details and characterization.
N
HNH2N
Cl
O
O
S
NHNN
HNHN
Cl
O
ONH
N
OO
O
O
N
NH2HN
NH2
N
Cl
Cl
H
H
HgCl2(70%)
6M HCl / MeOH
O
O
HNO
O
NH
NS
O
OFFF
N
NHN
NN
NHNHN
Cl
O
ONH
N
OO
O
O(20%)
Cl
(70%)
8-cbz ethidium (17)
No reaction
OO
OO
OO
OO
3-guanidino ethidium dichloride (19)
3-diBoc guanidino8-cbz ethidium chloride
8-cbz ethidium (17)
8-cbz ethidium (17)
3-diBoc guanidino8-cbz ethidium chloride
+-
N
HNH2N
Cl
O
O
+-
N
HNH2N
Cl
O
O
+-
+
+-
-
-
-

121
Guanidinylation of ethidium was conducted using three different methods (Figure
5.17). The best reagent for guanidinylation of ethidium proved to be N,N’-bis-
Boc-S-methyl-isothiourea (activated with mercury dichloride) to afford a 70%
isolated yield of the protected product (3-diBoc-guanidino 8-cbz ethidium
chloride) (Figure 5.17). Removal of both the cbz and Boc groups was performed
simultaneously by refluxing 3-diBoc-guanidino 8-cbz ethidium chloride in 6M HCl
/ MeOH (1 hr). Reversed-phase chromatography was used to purify the desired
product 19 that was obtained in 70% yield. The other guanidino-ethidium
derivatives 20 and 21 were also synthesized by this method with similar yields
(see Section E 5.2.3 and E 5.2.4 for details and characterization).
Figure 5.18: Unsuccessful attempts at synthesizing urea derivatives of ethidium.
Urea is a non-charged isostructural analog of guanidine, and provides an
important comparison for guanidinium-containing ethidium derivatives. Once
again, the limited reactivity of ethidium’s electron-poor exocyclic amines rendered
some urea-forming reagents ineffective (Figure 5.18). By using phenyl
No reaction
OHN
O
O2N
NC
O
Multiple products
NHNH2N
Cl
O
O8-cbz ethidium (17)
+-
NHNH2N
Cl
O
O8-cbz ethidium (17)
+-

122
chloroformate, however, the exocyclic amine can be successfully activated for
urea formation (Figure 5.19). This two-step approach allows for facile synthesis
of substituted and unsubstituted ureas (Figure 5.19 and 5.20).
Figure 5.19: Typical synthetic route for urea derivatives. Amines other thanammonia produce substituted ureas. Harsh deprotection conditions (refluxing 6M HCl) result in partial urea hydrolysis (last step), but the phenanthridinium“core” of ethidium is susceptible to reduction with the standard method of cbzremoval (H2/Pd).
Various amines have been conjugated to ethidium through urea linkages (Figure
5.20). All of these derivatives have photophysical properties similar to their
“simple” urea ethidium counterparts (Figure 5.1), but these compounds exhibit
dramatically different nucleic acid affinities and specificities (next section).
O
ClO
H2PO4
O
O
NH3 / MeOH
(90%)
(70%)
3-phenoxy carbamate8-cbz ethidium phosphate
acetone/phosphate buffer pH 6.6
6M HCl / MeOH
(20%)
3-urea ethidium chloride (22)
Cl
ethidium chloride (12)
N
HNH2N
Cl
O
O
8-cbz ethidium (17)
+-
N
HNN
HO
O
+
(not isolated)
H2PO4
N
HNN
HO
O
+
-
-
O
H2N
N
NH2NH
+O
H2N
-
ClN
NH2H2N
+-

123
Figure 5.20: Examples of ethidium-urea conjugates and isolated yields (seesection E 5.2.11 – E 5.2.16 for synthesis and characterization). A “*” indicatessynthesized and characterized by Charles Liu.
Pyrrole-containing ethidium derivatives have been prepared using dimethoxy-
tetrahydrofuran (Figure 5.21). As for urea and guanidine, pyrrole is a flat
functional group that should be capable of intercalating into nucleic acids. Pyrrole
modification may facilitate stacking interactions, while the possibility of hydrogen-
bonding interactions is eliminated. The lone pair of electrons on the nitrogen of
the pyrrole are part of the aromatic sextet of the pyrrole ring system and are,
N
NH2NH
O
NH2H2NHO
HOO
O
H2N OHNH
N
NH
H2N
H2NNH2
OHOH
O
O
NH2HO
HN
O
N
NH
NH
OO
NN
N
NH
O
NH
H2NHO
HOOH
NH
O
NH
NH2OH
OHHO
3,8-bisurea pyrrolidineethidium (30) (100%)
3,8-bisurea 2-DOSethidium (33) (25%)
3-urea-ethidium-6'-3'deoxyneamine (37)(20%)
HO
N
NH
NH
OO
NH
NH
H2N NH2
3,8-bisurea ethylene diamineethidium (31) (91%)
N
NH
NH
OO
NH
NH
OHOHN
NH
H2NO OH
HN
NH
NH2
3,8-bisurea arginineethidium (32) (31%)
+ +
++
+
+
N
NH2NH
O
NH2H2NHO
HOO
O
H2N OHNH
3-urea-ethidium-6'-neamineethidium (35)*
HO
+
N
NHH2N
O
H2N NH2OHOH
O
O
NH2HO
HN
8-urea-ethidium-6'-3'deoxyneamine (36)(20%)
+
8-urea-ethidium-6'-neamine (34)*

124
therefore, not available for electron donation into the phenanthridinium system or
for hydrogen bonding with nucleic acids. Interestingly, the UV absorbance
maximum of 27 is very similar to both 3, 8-bis cbz ethidium (18) and to 3, 8-bis
cbz ethidium (22), but it is approximately 50-fold less emissive compared to
these compounds (Figure 5.1). This suggests that charge transfer from pyrrole
into phenanthridinium may occur in the excited state of 27, but electron donation
into phenanthridinium does not occur in the ground-state.
Figure 5.21: Synthesis of 3,8-bis pyrrole ethidium acetate. The mono pyrrolederivatives 25 and 26 were synthesized under similar conditions (using the monocbz derivatives as starting materials). See section E 5.2.9 for full synthetic detailsand characterization).
5.3 Acid-Base Properties of Ethidium and its Guanidino Derivatives
The UV-vis spectrum of ethidium changes as a function of pH. The wavelength of
its visible adsorption band (λabs) is blue-shifted upon addition of acid (Figure
5.22). A plot of λabs versus pH reveals a fully reversible, biphasic curve between
pH 0.5 and 3.0. Since the 3 position of ethidium is electron poor and not very
reactive (relative to the 8 position) we have assigned the transition at pH = 0.8 to
protonation of the 3 position, and the transition at pH = 2.0 to protonation of the 8
position. This assumption is supported by measuring the pKa values of 3-
N
NH2H2N
BrN
N N
O OOCH3
H3C
ethidium bromide (12) 3,8-bis pyrrole ethidium (27)
acetic acid, 130oC(90%)
OAc+--

125
guanidino ethidium (19) and 8-guanidino ethidium (20) by using the same
method (Figure 5.23, Left).
Figure 5.22: Changes in the λabs of ethidium as a function of pH; no changes inλabs are observed between pH 5.0 – 12.8. By taking the pH at each inflectionpoint as equal to the pKa, a pKa of 0.8 and 2.0 are measured for 3 and 8 amines,respectively. These values are similar to those reported by Zimmerman (at 0.7and 2.4, respectively).168
Figure 5.23: Changes in the λabs of 3-guanidino ethidium (19) and 8-guanidinoethidium (20) as a function of pH (left). Changes in the λabs of 3,8-bis guanidinoethidium (21) and 3, 8-bis urea ethidium (24) as a function of pH (right). Theerrors for each point are approximately ±1 nm and ± 0.05 pH units. See SectionE 5.3 for additional experimental details.
0.0 0.5 1.0 1.5 2.0 2.5 3.0 3.5 4.0 4.5 5.0425
450
475
500
525
pKa1
pKa2
pH
λλ λλa
bs
(nm
)
0.0 2.5 5.0 7.5 10.0 12.5390
400
410
420
430
440
450
(21)(24)
pH
λλ λλa
bs
(nm
)
6.5 7.0 7.5 8.0 8.5 9.0 9.5 10.0 10.5 11.0440
445
450
455
460
465
(19)(20)
pH
λλ λλa
bs
(nm
)

126
Both 19 and 20 exhibit monophasic titration curves (Figure 5.23, Left). By taking
the pH of each inflection point as equal to the pKa, a pKa of 9.2 and 9.9 are
measured for 3-guanidino ethidium (19) and 8-guanidino ethidium (20),
respectively. 8-guanidino ethidium (20) is, therefore, significantly more basic than
3-guanidino ethidium (19). This is consistent with the 8 position of ethidium
having more electron density and greater reactivity as compared to the 3 position
(Sections 5.1 – 5.2). 3,8-bis guanidino ethidium (21) has a biphasic titration curve
(Figure 5.23, Right). Since 8-guanidino ethidium (20) is more basic than 3-
guanidino ethidium (19), the inflection points at pH 6.2 and pH 9.5 are assigned
as the 3 and 8 positions of 21, respectively. These results are consistent with the
pKa values of the mono-guanidino derivatives 19 and 20, since protonation of the
8 position should significantly lower the pKa of the 3 position. As a control 3, 8-
bis urea ethidium (24) was also monitored as a function of pH, and shows no
changes in its absorption spectrum over this pH range (Figure 5.23, Right).
These studies indicate that at pH 7.5 all three of the guanidino derivatives 19, 20,
and 24 exist as dications and ethidium (12) exists as a monocation. A summary
of the pKa values for each compound is presented in Figure 5.24.

127
Figure 5.24: A summary of pKa values as determined by UV-vis absorption. Thecounterions for 12 are biphthalate, and the counterions for 19, 20, and 21 arephosphate.
5.4 Preliminary Evaluation of the Nucleic Acid Affinity and Specificity ofEthidium Derivatives
A-G and G-G base pairs in the internal bulge of the RRE may present unique
recognition elements for small-molecule binding (Figure 2.3 B). By increasing the
dimensions of an intercalating agent, it may become too large to intercalate into
“normal” duplex regions but still “fit” into the unusually wide purine-purine base
pairs of the RRE. This may lead to intercalating agents with improved RRE
selectivity. Importantly, by decreasing its affinity to “nonspecific” nucleic acids,
the mutagenic activities of ethidium-based compounds may be minimized.
N
NH
H2N
N
NH2NH
N
NH3H3N
N
NH
NHH2N
N
H
H
pKa = 0.8pKa = 9.2
pKa = 9.8pKa = 9.5pKa = 6.2
pKa = 2.0
H2N
N
H
H
NH2
N
H
H
NH2
N
H
H
3-guanidino ethidium (19)
8-guanidino ethidium (20)3,8-bis guanidino ethidium (21)
ethidium (12)
+
++
+
+ +
+
+
+

128
The positive charge afforded by ethidium’s quarternary amine is essential for its
high-affinity binding of the RRE. 3,8-diamino-6-phenylphenanthridine, an
uncharged analog of ethidium, has over a 20-fold lower affinity to the RRE
compared to ethidium. It was hypothesized, therefore, that conversion of the
amino groups on ethidium into guanidinium would increase the positive charge of
ethidium and, therefore, increase its affinity to the RRE. The guanidino
derivatives 19, 20, and 21 are 105 – 108 times more basic compared to ethidium,
and each compound exists as a dication at pH 7.5. The binding of these
compounds to the RRE was evaluated by using a Rev peptide displacement
assay (Section E 3.1), and the results are summarized in Table 5.2
According to fluorescence anisotropy RevFl peptide displacement experiments
(Section 3.1), the guanidino derivatives (19, 20, and 21) have approximately 20 –
60 fold lower RRE affinities as compared to ethidium (Table 5.2). It is possible,
that the introduction of guanidino groups lowers RRE affinity due to unfavorable
steric interactions. To test this, the urea derivatives 22, 23, and 24 were
evaluated for RRE affinity (Table 5.2). Interestingly, the urea derivatives have
much better RRE affinities as compared to the guanidino derivatives. It appears
that the introduction of an additional charge actually decreases RRE affinity. This
is the opposite trend as observed for compounds that bind in the grooves of RNA
(next section).

129
Table 5.2: Summary of RevFl displacement experiments (by anisotropy) and ofdirect binding experiments with calf thymus (CT) DNA.
Compound Rev-RREIC50 (µM)I
CT DNAC50 (µM)II
ApproximateCT DNAKd (µM)V
SpecificityRatioVI
Ethidium (12) 0.2 12 3.1 0.065
3-guanidino ethidium (19) 4.1 30 8.6 0.48
8-guanidino ethidium (20) 8.1 120 36 0.23
3,8-bis guanidino ethidium (21) 11 70 21 0.52
3-urea ethidium (22) 0.4 120 36 0.011
8-urea ethidium (23) 4.0 60 18 0.22
3,8-bisurea ethidium (24) >1III 350 106 n.d.
3-pyrrole ethidium (25) 0.6 40 12 0.05
8-pyrrole ethidium (26) 0.4 20 5.6 0.071
3,8-bispyrrole ethidium (27) >4III n.d.IV n.d. n.d.
3,8-bis urea-2-DOS ethidium (33) 0.2 10 2.5 0.08
8-urea-ethidium-6'-neamine (34) 0.016 10 2.5 0.0064
3-urea-ethdium-6'-neamine (35) 0.010 20 5.6 0.0017
8-urea-ethidium-6'-3'deoxyneamine (36) 0.0014 10 2.5 0.00056
3-urea-ethidium-6'-3'deoxyneamine (37) 0.00080 18 5.0 0.00016
Neo-S-acridine (39) 0.016 1.2 < 0.1 >0.16
I 10 nM each RevFl and RRE66II Concentration of CT DNA (in b.p.) needed to bind ½ of a 1 µM solution of each ligand asmonitored by the fluorescence intensity of the ligand.III Fluorescence interference with RevFl allows only a limit to be reported.IV No significant changes in fluorescence intensity upon binding DNA.V Approximate Kd = ((C50 / 3.3) – 0.5)VI Ratio of (Rev-RRE IC50 / CT DNA C50)
The introduction of an additional positive charge onto ethidium may disrupt the
charge distribution on the core of ethidium (Section 5.1), resulting in less
favorable electrostatic complementation with its intercalation site(s) on the RRE.

130
Or, the desolvation of the guanidinium group (upon intercalation) may impose a
significant energetic penalty such that the guanidino derivatives may actually
surface-bind to nucleic acids. The changes in spectral properties of 3,8-bis
guanidino ethidium upon saturation with CT DNA, however, are very similar to
those for both the bis-pyrrole and bis-urea derivatives, suggesting a common
binding mode for all three derivatives (Table 5.3).
To evaluate the affinities of these compounds to “non-specific” nucleic acids, C50
values were measured by monitoring the fluorescence of each ethidium
derivative upon titration of CT DNA. Most derivatives show significant changes in
their spectral features upon binding DNA (Table 5.3). The concentration of CT
DNA needed to bind ½ of each derivative (C50 value) is summarized in Table 5.2.
Compounds that have a high specificity for the RRE will have a low affinity to CT
DNA and a high Rev-RRE inhibition activity. Among the “simple” ethidium
derivatives (Figure 5.1), 3-urea ethidium has the best RRE specificity (relative to
CT DNA). By taking the ratio of Rev-RRE IC50 divided by CT DNA C50 for each
compound, a “specificity ratio” can be calculated for each compound (Table 5.2).
A lower “specificity ratio” indicates a higher RRE specificity (relative to CT DNA).
The specificity ratio for 3-urea ethidium is 5-fold better than ethidium, due to its
low affinity for CT DNA (Table 5.2).
The conjugation of ethidium to neamine and to 3'deoxyneamine produces
compounds with extremely high RRE affinity and specificity. Compounds 34 – 37

131
(Figure 5.20) have 13 – 250 fold higher Rev-RRE inhibition activities as
compared to ethidium (Table 5.2). Upon saturation with CT DNA, the spectral
changes of 34 – 37, especially for emission intensity, are almost identical to the
changes exhibited by their respective “simple” urea derivatives 22 and 23 (Table
5.3). This suggests that the ethidium moiety in compounds 34 – 37 does, in fact,
intercalate upon binding nucleic acids.
Table 5.3: Summary of the spectral changes upon saturation with CT DNA.Compare with Figure 5.1 to obtain absolute values.
Compound Change in λ-abs (nm)
Change in λ-em (nm)
Change inemission intensity
Ethidium (12) +34 -7 +700%
3-guanidino ethidium (19) +27 -4 +180%
8-guanidino ethidium (20) +32 0 +200%
3,8-bis guanidino ethidium (21) +20 0 -30%
3-urea ethidium (22) +32 -16 +360%
8-urea ethidium (23) +29 -7 +740%
3,8-bisurea ethidium (24) +11 0 -400%
3-pyrrole ethidium (25) +35 -16 +230%
8-pyrrole ethidium (26) +28 -12 +730%
3,8-bis pyrrole ethidium (27) +18 0 0%
8-urea-ethidium-6'-neamine (34) +28 -17 +630%
3-urea-ethidium-6'-neamine (35) +26 -17 +340%
8-urea-ethidium-6'-3'deoxyneamine (36) +26 -18 +690%
3- urea-ethidium-6'-3'deoxyneamine (37) +26 -14 +370%

132
Interestingly, conjugation at the 3 position of ethidium is more favorable than
conjugation at the 8 position (compare 34 to 35 and 36 to 37). This is the same
trend as observed with the “simple” urea-derivatives 22 and 23 (Table 5.2).
The deoxyneamine derivatives have about a 10-fold higher RRE affinity
compared to the neamine conjugates (compare 34 to 36 and 35 to 37). This is
the same trend as observed for deoxytobramycin derivatives, where the removal
of hydroxyl groups increases the HH16 affinity of most derivatives.36
Importantly, compounds 34 – 37 have a much higher affinity to the RRE
compared to ethidium, but the same or lower affinity for CT DNA. These
compounds, therefore, have a high RRE specificity, relative to CT DNA.
Included in Table 5.2 is the fully characterized RRE ligand “Neo-S-acridine”
(presented in the next section).169 This compound is typical of most glycoside-
intercalator conjugates. Neo-acridine has a high RRE affinity, but also binds to all
“non-specific” nucleic acids with very high affinity, and therefore exhibits a low
RRE specificity. Compared to neo-acridine, 3-urea-deoxy-neamine ethidium (37)
has, at least, a 1,000-fold higher RRE specificity (relative to CT DNA). 37 has
also been evaluated for its affinity to poly r(A) – r(U), poly r(I) – r(C), tRNAMIX, and
tRNAPhe (Table 5.3). It has about the same or an even lower affinity to all of these
“non-specific” RNAs as compared to CT DNA (Table 5.3). The C50 value for
RRE66 (0.25 µM) represents the minimum theoretical C50 value if 2 high-affinity
binding sites for 37 are on the RRE (since 1 µM of 37 was used). When a 5-fold

133
lower concentration of 37 is used (200 nM), the C50 for RRE66 is 50 nM. This
confirms that 37 has 2 high-affinity binding sites (Kd < 20 nM) on the RRE66. This
represents a least a 10,000-fold higher affinity for the RRE as compared to
tRNAPhe (Table 5.4). In collaboration with Q. Liu (Tor Lab), we are continuing the
investigation of the RRE affinity and specificity of compounds 34 – 37.
Table 5.4: C50 values for 1 µM of 37.Nucleic Acid C50 (µM)
CT DNA 18*
Poly r(A) – r(U) 10*
Poly r(I) – r(C) 65*
tRNAMIX 17**
tRNAPhe 250***
RRE66 0.25***
* Reported in base-pairs** Reported in bases*** Reported in strands
New derivatives of ethidium bromide have provided a fascinating collection of
small molecules. The electronic structure of ethidium has, for the first time, been
thoroughly characterized and has provided some surprising revelations. The
presence of carbons atoms with partial anionic charges in the phenanthridinium
core of ethidium may be an important determinant of base stacking interactions.
Other groups have shown that ethidium thermally stabilizes duplex RNA, more so
than all other “classic” intercalating agents.170 Ethidium’s unusual electronic
features may eventually explain this finding. The substitution of ethidium’s

134
exocyclic amines with other functional groups significantly perturbs its electronic
structure. Most of the new derivatives have much lower nucleic acid affinities and
may, therefore, prove less mutagenic as compared to ethidium. The conjugation
of neamine and deoxyneamine to ethidium, especially through the 3 amine,
however, provides compounds with truly impressive RRE affinities and
specificity. The anti-HIV activity of these conjugates and of the “simple” urea
derivatives 23 and 24 are currently being evaluated at the Center for AIDS
Research, UCSD.
Much has been learned about ethidium, but some mysteries still remain. For
example, upon binding DNA, the visible absorbance spectrum of ethidium red-
shifts and the emission spectrum blue-shifts (Table 5.3). This suggests that upon
intercalation, the energetic gap between the ground-state and the first excited (or
“Frank Condon”) state becomes smaller, but the energy difference between the
emissive state and the ground state becomes larger. The quantum yield, upon
intercalation, increases by 700% (Table 5.3). There is still no accepted
explanation for all three of these photophysical changes. The new derivatives of
ethidium show diverse spectral changes upon binding CT DNA (Table 5.3).
Trends are apparent between the 3 and 8 positions, and differences between
functional groups are also observed. An astute reader may, one day, use this
data to construct a model that can fully explain the spectral changes of ethidium
upon intercalation.

135
6.0 Aminoglycoside-Based Ligands
Aminoglycosides are highly selective in their preferential binding of RNA over
DNA, but show much less discrimination between different RNA molecules.
Aminoglycosides bind to a wide range of unrelated RNAs including simple duplex
RNA,118 16S and 18S rRNAs,30,171 mRNA transcripts,172 tRNA,70 and a large
number of autocatalytic RNAs.173 This general affinity for RNA is related to the
ability of aminoglycosides to bind the major groove of RNA through electrostatic
interactions mediated by ammonium groups.36,118,174-175,176 Aminoglycosides are
selective for A-form over B-form type duplexes, and can facilitate the
conformational change of calf thymus (CT) DNA from a B-form into an A-form
double helix.176
In 1993, an important demonstration of viral RNA targeting was established for
the aminoglycoside family of antibiotics.82 Zapp et al. reported that certain
aminoglycosides bind to the RRE and displace Rev with moderate activities (1 µM
<IC50<100 µM).82 Later studies, by Hendrix et al., showed that the most active
aminoglycoside, neomycin B, binds non-specifically to multiple sites on the
RRE.175 Unfortunately, adverse side effects and poor anti-HIV activities have
prevented the use of aminoglycosides as anti-viral agents. In attempts to improve
these properties, modifications to aminoglycosides have been made. The
resulting compounds exhibit dramatically enhanced RRE affinity, interesting
trends in nucleic acid specificity, and some derivatives possess highly potent anti-
HIV activities.

136
6.1 Neomycin-Acridine Conjugates
Neomycin B was reported to bind near the purine-rich bulge of the RRE.82
Flanking this internal bulge is a single adenosine bulge (Figure 6.0). Intercalating
agents are known to preferentially bind to duplex regions containing single-base
bulges.139 Indeed, both 9-aminoacridine and ethidium bromide bind, with high
affinity to the RRE (Section 3.4 Figures 3.13 & 3.14). In an attempt to create an
RRE ligand that will simultaneously recognize both the internal bulge and the
single-base bulge of the RRE, 9-aminoacridine was conjugated to neomycin B
(Figure 6.1). In collaboration with Dr. Sarah Kirk, neo-S-acridine (39) was the first
aminoglycoside – acridine conjugate to be synthesized and fully characterized for
RNA binding.177
Figure 6.0: High-affinity Rev binding site (bold),43 enzymatic foot-printing ofneomycin B (*),82 and potential high-affinity intercalation sites (arrows).139
U
GA
G
C
G GG
CG
C
A GU A
C
G U
G
C
C
G
G
C
U
A
AC A
AUG
A
* **
*
*Neomycin B Footprinting
Potential High-Affinity Intercalation Sites

137
Figure 6.1: Structures of three Neo-acridine conjugates. See section E 6.1 forthe synthesis and characterization of compounds 38 and 40.
Native gel-shift electrophoresis and enzymatic footprinting experiments suggest
that neo-S-acridine binds to a single high-affinity site on the RRE and displaces
the Rev peptide with a 10-fold higher activity compared to neomycin B (Figure
6.2 A & B). Conducted in the presence of a large excess of tRNA, native gel-shift
experiments show that Neo-S-acridine displaces ½ of the Rev peptide at about
0.75 µM (lane 16, Figure 6.2 A) and the IC50 value for neomycin B is
approximately 10 µM (lane 9 Figure 6.2 A). These results are similar to the IC50
values measured by the solid-phase assay when RevFl displacement
experiments are conducted in the presence of a large excess of tRNA (Table
6.1).
SNH
NNH2
H2NO
OO
H2N
OH
HOO
HOO
HO
NH2
OHO
HO
NH2
H2N
HN
N
NH2
H2NO
OO
H2N
OH
HOO
HOO
HO
NH2
OHO
HO
NH2
H2N
S NH2
H2NO
OO
H2N
OH
HOO
HOO
HO
NH2
OHO
HO
NH2
H2N
NH
N
Neo-S-acridine (39)
Neo-N-acridine (38)
Neo-C-acridine (40)
S

138
(a)
(b)
Figure 6.2: (a): Conducted in the presence of a large excess of tRNAMIX (50 µg /mL), gel-shift mobility assays have been employed to qualitatively study theinteractions of neo-S-acridine (39) with the RRE 66. All lanes contained 25 nM ofRRE66 with a trace of 5'-32P labeled RRE, lanes 2–19 contain 2 µM Rev-IA.Lane 1, RRE only; lane 2 and 19, RRE + Rev only; lanes 3–10, RRE + Rev with0.5 µM, 1 µM, 1.25 µM, 2.5 µM, 3.75 µM, 5 µM, 7.5 µM, 10 µM neomycin B,respectively; lanes 11–18 RRE + Rev with 25 nM, 50 nM, 100 nM, 200 nM, 500nM, 750 nM, 1.25 µM, 2.5 µM neo–acridine, respectively. While not observed forneomycin B, a binary neo–acridine-RRE complex is formed at 2.5 µM (lane 18).(b) Summary of enzymatic footprinting experiments conducted at 2.5 µM of 39and in the presence of a large excess of tRNA. Three ribonucleases (RNase T1,RNase A, and RNase V1) were used in this study.177 A second equivalent ofNeo-S-acridine can bind to the RRE at higher concentrations (10 µM) andenzymatic footprinting indicates that this second binding site is in the sameregion as the first binding site.177
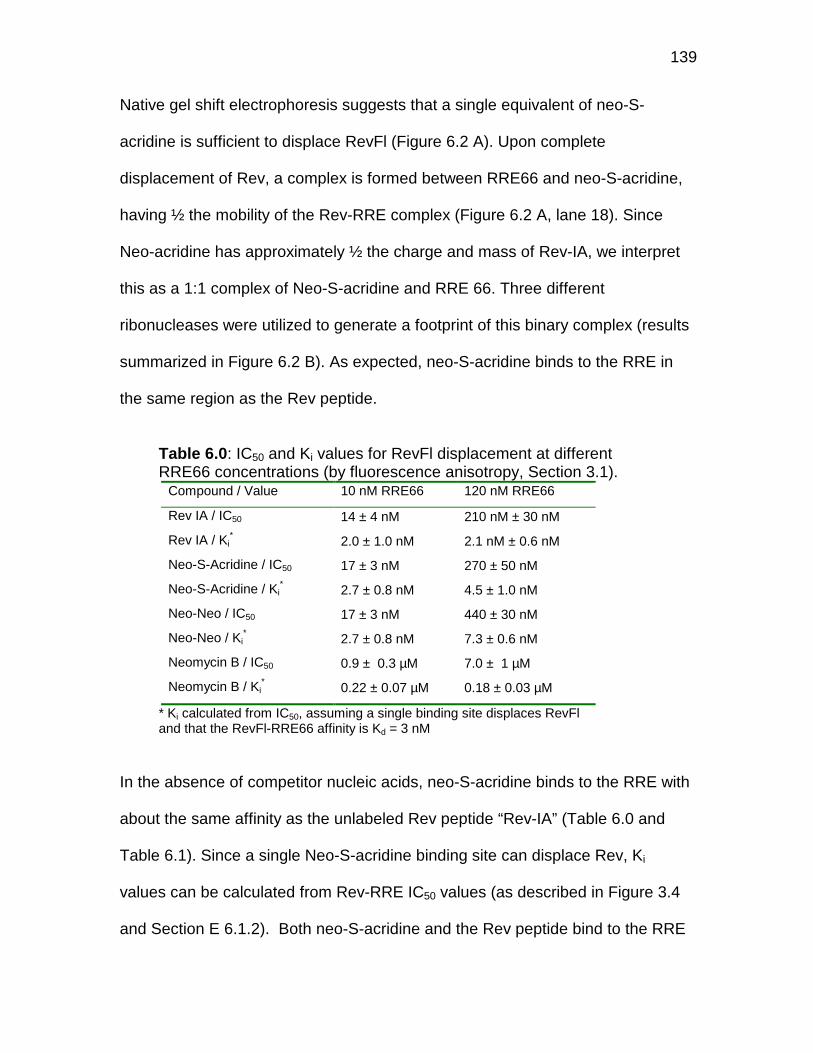
139
Native gel shift electrophoresis suggests that a single equivalent of neo-S-
acridine is sufficient to displace RevFl (Figure 6.2 A). Upon complete
displacement of Rev, a complex is formed between RRE66 and neo-S-acridine,
having ½ the mobility of the Rev-RRE complex (Figure 6.2 A, lane 18). Since
Neo-acridine has approximately ½ the charge and mass of Rev-IA, we interpret
this as a 1:1 complex of Neo-S-acridine and RRE 66. Three different
ribonucleases were utilized to generate a footprint of this binary complex (results
summarized in Figure 6.2 B). As expected, neo-S-acridine binds to the RRE in
the same region as the Rev peptide.
Table 6.0: IC50 and Ki values for RevFl displacement at differentRRE66 concentrations (by fluorescence anisotropy, Section 3.1).
Compound / Value 10 nM RRE66 120 nM RRE66
Rev IA / IC50 14 ± 4 nM 210 nM ± 30 nM
Rev IA / Ki*
2.0 ± 1.0 nM 2.1 nM ± 0.6 nM
Neo-S-Acridine / IC50 17 ± 3 nM 270 ± 50 nM
Neo-S-Acridine / Ki*
2.7 ± 0.8 nM 4.5 ± 1.0 nM
Neo-Neo / IC50 17 ± 3 nM 440 ± 30 nM
Neo-Neo / Ki*
2.7 ± 0.8 nM 7.3 ± 0.6 nM
Neomycin B / IC50 0.9 ± 0.3 µM 7.0 ± 1 µM
Neomycin B / Ki*
0.22 ± 0.07 µM 0.18 ± 0.03 µM
* Ki calculated from IC50, assuming a single binding site displaces RevFland that the RevFl-RRE66 affinity is Kd = 3 nM
In the absence of competitor nucleic acids, neo-S-acridine binds to the RRE with
about the same affinity as the unlabeled Rev peptide “Rev-IA” (Table 6.0 and
Table 6.1). Since a single Neo-S-acridine binding site can displace Rev, Ki
values can be calculated from Rev-RRE IC50 values (as described in Figure 3.4
and Section E 6.1.2). Both neo-S-acridine and the Rev peptide bind to the RRE

140
66 with high affinity (Table 6.0). Ki values calculated for neo-S-acridine and Rev-
IA are similar even at different concentrations of RRE 66 (Table 6.0). A Ki = 3 ± 2
nM is calculated for neo-S-acridine (39), and a Ki = 2 ± 1 nM is calculated for the
unlabeled Rev peptide Rev-IA.
Based on fluorescence anisotropy measurements, neomycin B has a slightly
lower Ki value when calculated at 120 nM of RRE compared to 10 nM of RRE
(Table 6.0). This effect is much more pronounced for tobramycin (Table 6.2).
This suggests that at higher RRE concentrations, the “regular” aminoglycosides
have additional (lower affinity) binding sites on the RRE that are capable of
displacing the Rev peptide. Indeed, other groups have concluded that neomycin
B has multiple binding sites and that more than one equivalent of neomycin is
necessary to displace Rev from the RRE.89,175 As opposed to the unmodified
aminoglycosides, neo-S-acridine has a slightly higher Ki value at higher RRE
concentrations (Table 6.0). This effect is also seen for the other two neomycin-
acridine conjugates 38 and 40 (Table 6.2) and suggests that neo-S-acridine has
one or more non-inhibitory binding sites on the RRE that become more apparent
at higher RRE concentrations. Interestingly, this effect is much more pronounced
for the neomycin B dimer “neo-neo” (presented later). In contrast, the Ki value for
the unlabeled Rev peptide (Rev-IA) is consistent at both RNA concentrations
(Table 6.0).

141
At the time of publication, the binding between Neo-S-acridine and the RRE66
was the highest affinity interaction between a natural RNA and synthetic ligand
ever reported.177 Two other groups have also reported aminoglycoside –
intercalator conjugates, but neither group has disclosed compounds with such a
high RNA affinity.178,179 Gel shift electrophoresis and enzymatic footprinting
experiments indicate that neo-S-acridine forms a well-defined complex with the
RRE (Figure 6.2), and its affinity for the RRE is similar to that of the Rev peptide
(Table 6.0). It was surprising, therefore, to discover that neo-S-acridine has a
very low specificity for the RRE.
To evaluate the RRE specificity of neo-S-acridine, the solid-phase assay (Section
6.2) was used to measure IC50 values in the presence or absence of other
nucleic acids (Table 6.1). By dividing the average IC50 values measured in the
presence of competing nucleic acids by the IC50 values measured in the absence
of competing nucleic acids, a “selectivity ratio” is determined (Table 6.1). The
lower this value is, the more selective the ligand is for the RRE. The absolute
RRE specificity of the compound, as we have defined it (Section 1.6), is a
combination of both the RRE selectivity and the absolute affinity for the RRE.
Consistent with fluorescence anisotropy, the solid-phase assay indicates that
both neo-S-acridine and the unlabeled Rev peptide have approximately the same
affinities for the RRE (Table 6.1). Upon addition of CT DNA or tRNAMIX, however,
the activity of neo-S-acridine drops by 10 – 40 fold. Under the same conditions,

142
the IC50 values for the unlabeled Rev peptide drop by only 2 – 3 fold (Table 6.1).
This indicates that neo-S-acridine has a much higher affinity to non-specific
RNAs and DNAs as compared to the Rev peptide. Indeed, by monitoring the
fluorescence of either the RevFl peptide or neo-S-acridine as a function of DNA
concentration, a low affinity between RevFl and CT DNA is measured (Kd = ~250
µM, Table 3.1), while a very high affinity between neo-S-acridine and CT DNA is
seen (Kd < 100 nM, Table 5.2).
Table 6.1: IC50 Values(µM) according to solid-phase assay.*
Compound IC50 IC50 withC.T. DNA**
IC50 withtRNAmix***
RRESelectivityRatio****
Neo-N-acridine (38) 0.040 0.15 1.2 17
Neo-S-acridine (39) 0.040 0.45 1.6 26
Neo-C-acridine (40) 0.040 1.7 2.3 50
Tobra-N-acridine (41) 0.24 4.0 2.8 14
KanaA-N-acridine (42) 0.61 2.5 2.2 3.9
Neo-Neo (43) 0.050 0.11 4.8 49
Tobra-Tobra (45) 0.13 0.20 2.6 11
KanaA-KanaA (47) 0.24 0.60 2.5 6.5
Rev-IA 0.035 0.080 0.085 2.3
* Approximate error for each value +/- 35% of IC50 value.** 230 µM (bases) of a tRNA mixture (Sigma type X) included.*** 115 µM (base pairs) of CT DNA included.**** Selectivity ratio = (average IC50 in the presence of DNA and tRNAMIX)
(IC50 in the absence of other nucleic acids)
The RRE specificity of neo-S-acridine can be improved by decreasing the linker
length between its two moieties. Neo-N-acridine (38) has approximately the
same RRE affinity, but compared to neo-S-acridine, it retains more of its activity
in the presence of a vast excess of DNA and tRNAMIX (Table 6.1). The three neo-

143
acridine conjugates 38 – 40 each have the same RRE affinity, so the differences
in selectivity are directly proportional to the differences in RRE specificity (Table
6.1). An obvious trend in RRE specificity is observed for these three conjugates
(Figure 6.1). Neo-N-acridine has the shortest linker and an improved RRE
specificity as compared to neo-S-acridine, and neo-C-acridine has the longest
linker and the worst RRE specificity (Table 6.1). The linker length, therefore, is
inversely proportional to RRE specificity exhibited by these compounds. The
short linker length provided by neo-N-acridine may provide fewer degrees of
freedom to the conjugate and, therefore, fewer nucleic acids can bind to it with
high affinity.
Ethidium bromide displacement experiments (as described in Section 3.3)
confirm that both neo-C-acridine and neo-S-acridine have much higher affinities
to “non-specific” competitors (including calf thymus DNA and poly r(A) – r(U)) as
compared to neo-N-acridine (Table 6.2). One interesting difference does exist,
however, between tRNAMIX and poly r(A) – r(U) (compare Table 6.1 and 6.2).
Neo-S-acridine has the “optimal” linker length for binding to poly r(A) – r(U)
(Table 6.2). It has 3- and 13-fold higher affinities to poly r(A) – r(U) as compared
to neo-C-acridine and neo-N-acridine, respectively (Table 6.2). This may indicate
that neo-N-acridine has too short of a linker for both the acridine and the
neomycin moieties to bind the duplex simultaneously. On the other hand, the
extremely long linker of neo-C-acridine may impose an entropic disadvantage for
the simultaneous binding of both moieties to poly r(A) – r(U).

144
Table 6.2: RevFl-RRE66 IC50 values (µM) and approximate RRE affinity (Ki), andthe IC50 values for ethidium displacement from RNA and DNA.
Compound
RevFl(10nM)
+ RRE66(100nM)
IC50
RRE66Affinity**
(Ki)(100 nM)
RevFl(10nM)
+ RRE66(10nM)
IC50
RRE66Affinity***
(Ki)(10 nM)
Ethidium+ poly
r(A)-r(U)IC50****
Ethidium+ C.T. DNA
IC50****
Kanamycin A (1) 750 1.9x10-05 100 2.5x10-05 450 >15,000
Tobramycin (3) 45 1.1x10-06 10 2.5x10-06 25 >800
Neomycin B (5) 6.7 1.7x10-07 0.9 2.2x10-07 6.0 60
Neo-N-acridine (38) 0.23 3.5x10-09 0.016 2.5x10-09 0.65 0.85
Neo-S-acridine (39) 0.25 4.0x10-09 0.017 2.8x10-09 0.05 0.14
Neo-C-acridine (40) 0.27 4.5x10-09 0.017 2.8x10-09 0.13 0.08
Tobra-N-acridine (41) 0.33 6.0x10-09 0.030 6.0x10-09 1.3 0.49
KanaA-N-acridine (42) 0.48 9.8x10-09 0.045 9.8x10-09 4.4 2.1
Neo-Neo (43) 0.40 7.8x10-09 0.017 2.8x10-09 0.067 0.65
Neo-N-Neo (44) 0.26 4.3x10-09 0.015 2.3x10-09 0.035 0.45
Tobra-Tobra (45) 0.64 1.4x10-08 0.040 8.5x10-09 0.61 1.0
Tobra-N-Tobra (46) 0.80 1.8x10-08 0.043 9.3x10-09 0.47 1.5
KanaA-KanaA (47) 1.2 2.8x10-08 0.050 1.1x10-08 6.0 12.0
* Random errors are less than or equal to ± 35% of each IC50 value.** Calculated from Rev-RRE IC50 values at 10 nM of RRE, these estimates assume that 1equivalent of the small molecule is sufficient to displace RevFl.*** Calculated from Rev-RRE IC50 values at 100 nM of RRE, these estimates assume that 1equivalent of the small molecule is sufficient to displace RevFl.**** 1.3 µM of ethidium bromide + 300 nM (base pairs) of the duplex nucleic acid.
As indicated by the solid-phase assay, ethidium displacement experiments show
that neo-C-acridine has the highest affinity for CT DNA, followed by neo-S-
acridine, and neo-N-acridine has the lowest affinity (among the neomycin-
acridine conjugates). The longer linker provided by neo-C-acridine may give DNA
better “access” to the intercalating agent, as neomycin B is an RNA-selective
molecule and acridine is essentially a non-specific intercalating agent.

145
Another group has also synthesized intercalator-glycoside conjugates with
variable linkers.178 Their approach, however, involves incorporation of a variable-
length methylene spacer to link the 6" amine of paromomycin to either pyrene or
thiazole orange. Subsequent evaluation of these compounds as A-site
antagonists indicated that as the number of atoms in the linker increases, the A-
site affinity decreases.178 This is a very different trend as observed with our
conjugates. All of the neo-acridine conjugates have, within error, the same RRE
affinities (Table 6.1 and Table 6.2). In addition, the neo-acridine conjugates with
a longer linker have a higher DNA affinity. It is possible that highly flexible,
hydrophobic linkers (including poly methylene chains) introduce a significant
penalty for RNA binding. Indeed, other groups have found that linker composition
is an important determinant for RNA binding.69b Ethylene glycol and thioether
linkers are well-hydrated flexible linkages that should not, by themselves, exhibit
significant favorable (or unfavorable) interactions with RNA.
6.2 Other Aminoglycoside-Acridine Conjugates
We have conjugated aminoacridine to the 6'' hydroxyls of both tobramycin and
kanamycin A (Figure 6.3). RevFl displacement experiments indicate that tobra-N-
acridine has a 300-fold higher affinity, and kanaA-N-acridine has over a 2,200-
fold higher affinity to the RRE, as compared to their “parent” aminoglycosides
(Table 6.2). In comparison, the conjugation of acridine to neomycin B only
increases its affinity to the RRE by a factor of 65 (Table 6.2).

146
Figure 6.3: Structures of kanamycin A and tobramycin acridine-conjugates. Seesection E 6.2.1 for synthesis and characterization of 41.
KanaA-N-acridine (42) has a slightly lower RRE affinity, but exhibits a much
better RRE selectivity ratio as compared to the other aminoglycoside-acridine
conjugates (Table 6.1). Ethidium displacement experiments confirm that,
compared to the other acridine conjugates, kanaA-N-acridine has a much lower
affinity to other nucleic acids, including CT DNA and poly r(A) – r(U) (Table 6.2).
Compared to neo-S-acridine, kanaA-N-acridine has about a 4-fold lower affinity
for the RRE, but a 90-fold lower affinity to poly r(A) – r(U) and a 15-fold lower
affinity to CT DNA (Table 6.2). This illustrates why kanaA-N-acridine is
significantly more selective for the RRE as compared to the neo-acridine
conjugates (Table 6.1).
Tobra-N-acridine (41) has an RRE affinity and selectivity that is intermediate
between the neo-acridine conjugates and kanaA-N-acridine (Table 6.1 and Table
6.2). It appears, therefore, that there is an inverse relationship between the RRE
affinity and the RRE selectivity of these compounds: as the affinity for the RRE
O
NH2
HO
H2N
H2NO
HOHOO
O
H2N OH
NH2
NH
Tobra-N-acridine (41)
O
NH2
HO
H2N
H2NO
HOHOO
O
HO OH
NH2
NH
N
KanaA-N-acridine (42)
HO
N
147
increases, the selectivity for the RRE typically decreases. This trend is observed
in two other families of compounds and may, therefore, reflect a general trend
(presented later).
Interestingly, the calculated RRE66 affinities (Ki) for kanaA-N-acridine and tobra-
N-acridine are identical at 10 nM and 100 nM of RRE66 (Table 6.2). This
suggests that these compounds, unlike all three neo-acridine conjugates, do not
have multiple non-inhibitory binding sites on the RRE over this concentration
range. This is fully consistent with the improved RRE selectivity of these
compounds as compared to the neo-acridine conjugates (Table 6.1), and
illustrates how the non-inhibitory binding sites on the RRE can exert the same
effect as the addition of competitor nucleic acids. These results illustrate the
importance of varying the nucleic acid concentration when evaluating the affinity
and specificity of small molecule - RNA binding interactions.
6.3 Dimeric Aminoglycosides
The synthetic dimerization of aminoglycosides was first reported by Wang and
Tor.180 Neomycin B , kanamycin, and tobramycin dimers, like the parent
compounds, bind to a wide range of different RNAs, including the HH16
ribozyme,180 tRNAPhe,70 a dimerized A-site,181 and the Tetrahymena ribozyme.182
No systematic studies, until now, have examined the RNA specificity of these
compounds.

148
The RRE contains multiple binding sites for neomycin B (Section 6.1). 89,175
Neomycin dimers could, in principal, simultaneously occupy multiple binding
sites, resulting in entropic and enthapic advantages relative to the monomeric
species. Indeed, the RRE affinity of neomycin B is enhanced 20 – 80 fold upon
dimerization (Table 6.0). As for the neo-acridine conjugates, neo-neo (43)
exhibits a similar RRE affinity as the unlabeled Rev peptide (Table 6.0). A range
in affinity enhancement is reported for all the aminoglycoside dimers because a
lower apparent affinity (Ki) is measured at 100 nM versus 10 nM of RRE (Table
6.2). This suggests that the dimers, like the neo-acridine conjugates, have
multiple non-inhibitory binding sites on the RRE that become more apparent at
higher RRE concentrations. In some ways, these non-inhibitory binding sites act
as competing nucleic acids and, at higher concentrations of RRE, serve to
decrease the Rev-RRE inhibition activities of these compounds. The Ki values
measured at 10 nM of RRE, therefore, better reflect the actual affinity of these
compounds for the Rev binding site (Table 6.2).
Unlike the neo-acridine conjugates, neo-neo (Figure 6.4) maintains most of its
activity even in the presence of a vast excess of CT DNA (Table 6.1). A relatively
low affinity for CT DNA is confirmed by ethidium displacement experiments
(Table 6.2). Neo-neo, however, compared to the neo-acridine conjugates, loses
much more of its Rev-RRE inhibition activity in the presence of tRNAMIX (Table
6.1).

149
Figure 6.4: Dimeric aminoglycosides evaluated for RRE affinity and specificity.See Section E 6.3.1 for the synthesis and characterization of neo-N-neo (44).
Overall, neo-neo exhibits the worst RRE selectivity (relative to tRNAMIX) as
compared to all other high-affinity RRE affinity ligands (Table 6.1). Its high affinity
for non-specific RNA may explain why the differences in Ki values at 10 nM
SS
NH2
H2NO
OO
H2N
OH
HOO
HOO
HO
NH2
OHO
HO
NH2
H2N
SS
H2N
NH2O
OO
NH2
HO
OH O
HO O
OH
H2N
OOHOH
H2N
H2N
SO
H2N
NH2O
OO
NH2
HO
OH O
HO O
OH
H2N
OOHOH
H2N
H2N
SO
NH2
H2NO
OO
H2N
OH
HOO
HOO
HO
NH2
OHO
HO
NH2
H2N
S S
O
NH2
HOH2N
H2NO
HOHO
O
O
H2N OH
NH2
O
H2N
OHNH2
NH2O
OH HOO
O
NH2HO
H2N
O
NH2
HOH2N
H2NO
HOHO
O
O
H2N OH
NH2
O
H2N
OHNH2
NH2O
OH HO
O
O
NH2HO
H2N
O
NH2
HOH2N
H2NO HOHO
O
O
HO OH
NH2
O
H2N
OHNH2
NH2O
OH HO
O
O
OHHO
H2N
HOOH
Neo-Neo (43)
Neo-N-Neo (44)
Tobra-Tobra (45)
Tobra-N-Tobra (46)
KanaA-KanaA (47)
SO S
OS S
SSS S
SO S
OS S

150
versus 100 nM of RRE are much more pronounced when compared to the neo-
acridine conjugates (Table 6.1).
Dimerization effectively doubles the total charge and hence, increases the affinity
of neomycin to all nucleic acids (tested so far). Ethidium displacement
experiments indicate that, compared to neomycin B (5), neo-neo (43) has a 90-
fold higher affinity for both duplex DNA and RNA (Table 6.2). Since ethidium
bromide has approximately the same affinity and the same number of binding
sites on both CT DNA and poly r(A) – r(U),87 the ethidium displacement values
are, in this case, comparable between CT DNA and poly r(A) – r(U). The ratios of
IC50 values for ethidium displacement from poly r(A)-r(U) and CT DNA are 1 : 10
for both neo-neo and for neomycin B (Table 6.2). This indicates that, indeed, the
RNA over DNA selectivity of neomycin is maintained upon dimerization.
The 90-fold higher affinity to simple duplex nucleic acids may explain why the
dimerization of neomycin B dramatically lowers its RRE selectivity (Table 6.1).
This increase is larger than the affinity enhancement observed for the RRE66 (20
– 80 fold). Other aminoglycoside dimers do, however, show much better RRE
selectivities, as compared to neo-neo.
Tobra-tobra (45) (Figure 6.4) has a 80-300 fold higher affinity to the RRE as
compared to tobramycin (3) (Table 6.2). As observed for neo-neo, tobra-tobra
retains most of its Rev-RRE inhibition activity in the presence of excess CT DNA,

151
but still loses activity in the presence of other RNAs (Table 6.1). The RRE
selectivity of tobra-tobra is, however, much better than neo-neo (Table 6.1). It is
interesting that compared to neo-neo, tobra-tobra has about a 5-fold lower RRE
affinity, but it is more active for Rev-RRE inhibition in the presence of tRNAMIX
(Table 6.1). This indicates that tobra-tobra has a higher specificity for the RRE as
compared to neo-neo. Ethidium displacement experiments confirm that upon
dimerization of tobramycin, only a 40-fold increase in affinity for simple duplex
RNA is seen (Table 6.2). This is much smaller than the 80 – 300 fold increase for
the RRE, and may explain the improved RRE selectivity of tobra-tobra, as
compared to neo-neo (Table 6.1).
The kanamycin A dimer (47), as compared to kanamycin A (1) has a 700 – 2,200
fold higher affinity for the RRE, but only a 75-fold higher affinity for poly r(A) –
r(U) (Table 6.2). Compared to all the aminoglycoside dimers evaluated, the
kanaA-kanaA dimer has the best RRE selectivity (Table 6.1). Ethidium
displacement experiments confirm that, compared to all of the high-affinity RRE
ligands (Kd < 10 nM), the kanaA-kanaA dimer has the lowest affinity to simple
duplex DNA and RNA (Table 6.2). These trends are similar to those observed for
the aminoglycoside-acridine conjugates, where the dimers with lower RRE
affinity exhibit much better RRE selectivity. The kanaA-kanaA dimer exhibits a
higher Rev-RRE inhibition activity in the presence of a tRNA mixture, as
compared to some compounds that have 2-5 folder higher affinities for the RRE
(Table 6.1). This illustrates the inherent difficulty of measuring the RNA affinity of

152
a small molecule in the presence of non-specific competitor nucleic acids, as
these measurements reflect more the specificity of the interaction as opposed to
the actual affinity.
Another group has recently published the binding of neo-neo and tobra-tobra to
RREIIB.183 Tok reports that the dimerization of neomycin increases its RRE
affinity by 17-fold (compared to the 80-fold increase reported here). There are
many potential reasons for this difference. Tok uses the displacement of a
fluorescent aminoglycoside to determine RREIIB affinities of the dimeric and
monomeric aminoglycosides. 600 nM of the RREIIB and curve-fitting was used to
measure an RRE affinity (Ki) of 10 nM for neo-neo. This should not, theoretically,
be possible. Examination of Tok’s raw data suggests that 10 nM of neo-neo
binds to 300 nM of RRE IIB.183 In our experiments, we use 10 nM of the RRE66
to measure an RRE affinity (Ki) of 2.5 nM (Table 6.2). At higher RRE66
concentrations (100 nM), the apparent RRE affinity is significantly higher (Ki = 7.8
nM, Table 6.2). Tok’s data provides additional evidence that at high RRE
concentrations, the low-affinity non-specific binding sites exhibit more influence
on the displacement isotherms, and in extreme cases can cause aggregation.
Tok measures an affinity for tobra-tobra that is approximately the same as
monomeric tobramycin (Ki = 3.9 µM).183 Our experiments, however, indicate that
tobra-tobra binds to the RRE with a Ki = 8.5 nM (Table 6.2). There is no obvious
explanation for this 500-fold difference. It is possible, of course, that tobra-tobra
does not bind to the same sites on the RREIIB versus the RRE 66. This does

153
not, however, seem to be a plausible explaination, as Tok reports the same RRE
affinities for each of the monomeric species (neomycin B and tobramycin) as we
have measured (Table 6.2).183
Linker lengths have been shown to play a major role in the RRE specificity of the
Neo-acridine conjugates, where shorter linkers provide higher RRE specificity
(Section 6.1). Neomycin B and tobramycin dimers were, therefore, synthesized
with shorter linker lengths as compared to neo-neo and tobra-tobra (Figure 6.4).
Compared to neo-neo, neo-N-neo has approximately a 2-fold higher RRE affinity,
but only a slightly higher affinity for CT DNA. This suggests that compared to CT
DNA, neo-N-neo is more selective for the RRE. Neo-N-neo also has, however, a
2-fold higher affinity for the simple duplex RNA, as compared to neo-neo (Table
6.2). This suggests that, relative to poly r(A) – r(U) , neo-N-neo has the same
RRE selectivity as neo-neo. Surprisingly, no significant differences are observed
between tobra-tobra and tobra-N-tobra (Table 6.2).
The dimeric aminoglycosides have, in general, a lower RRE affinity as compared
to the corresponding acridine conjugates (Table 6.2). This suggests that, under
these conditions, the acridine moiety contributes more binding energy to the
conjugate as compared to the aminoglycoside moiety. This is somewhat
surprising, as 9-amino acridine appears to have higher RRE affinity as compared
to neomycin B (not shown). It is possible that the combination of binding modes
(intercalation and electrostatic groove binding) is the reason for the unusually

154
high nucleic acid affinity of the acridine conjugates. The acridine moiety provides
significant binding energy to the conjugate, but it also confers DNA affinity to the
aminoglycoside moiety. Bringing these moieties closer together partially reverses
this trend and restores the RNA over DNA selectivity of the conjugate.
In summary, new high-affinity RRE ligands have been synthesized by the
conjugation of acridine or dimerization of aminoglycosides. The thorough study of
these ligands with a variety of nucleic acids has revealed interesting trends in
affinity and specificity. Neomycin-based ligands exhibit the highest RRE affinities,
but display high affinities to many other nucleic acids as well. These neomycin-
based ligands, therefore, exhibit the lowest RRE selectivity. Among all of the
“high affinity” small molecule RRE ligands presented, the kanamycinA-based
derivatives have the lowest RRE affinities, but exhibit the highest RRE
selectivities. The RRE affinities and specificities of the tobramycin derivatives are
intermediate between those of the neomycin and kanamycin A derivatives. This
indicates that, for these compounds, an inverse relationship exists between the
RNA affinity and selectivity of each small molecule. This trend highlights the true
challenge of this field: it is relatively difficult to synthesize a new ligand that has
both high affinity and high selectivity for the desired RNA target.
6.4 Guanidinoglycosides
The guanidinium group plays a key role at many RNA–protein binding interfaces,
including the complexes formed between transcriptional elongation factors with

155
mRNA, tRNA synthetases with tRNAs, ribosomal proteins with rRNA, and viral
regulatory proteins with their cognate RNA binding sites.184 In contrast to amines,
guanidines are highly basic, planar, and exhibit directionality in their H-bonding
interactions. Effective recognition between the Rev and the RRE is mediated,
largely, by the guanidinium groups present in the Rev’s arginine-rich domain.46,53
Substitution of arginine at position 35, 38, 39, or 44 with lysine leads to an over
20-fold loss of RRE binding in vivo.185 Since many competitor nucleic acids are
present in vivo, this represents a large decrease in RRE specificity. We
speculated, therefore, that the transformation of the amines on the
aminoglycosides into guanidinium groups would increase both the affinity and
specificity of these compounds for the RRE.
Figure 6.5: Structures of some aminoglycosides and guanidinoglycosides.
In collaboration with Prof. Murray Goodman and Dr. Tracy Baker, we
guanidinylated five aminoglycosides and used fluorescence anisotropy to
evaluate the RRE affinity of the resulting “guanidinoglycosides” (Figure 6.5 and
Table 6.3).186 IC50 values were measured at both 10 nM and 100 nM RRE
OHOR3
OR3 R3O
OR1
R3OH
R2OH
HO HO
OH
HTobramycin (3)
R1
Kanamycin A (1)
OHKanamycin B (2)
R2
OH
NH2
NH2
R3
OHGuanidino-kanamycin A (48) OH NH(C=NH)NH2
OHGuanidino-kanamycin B (49) NH(C=NH)NH2
H NH(C=NH)NH2Guanidino-tobramycin (50) NH(C=NH)NH2
NH(C=NH)NH2
NH2
NH2
NH2
Glycoside
O
R2
R2 O
HOHO
OO
R2
OH
R1
OHO
HOO
HO
HO
R2
R2
OH
R1
Paromomycin (4)
Neomycin B (5)
R2
OHGuanidino-paromomycin (51)
Guanidino-neomycin B (52) NH(C=NH)NH2
NH2
NH(C=NH)NH2
NH(C=NH)NH2
NH2
NH2
Glycoside

156
(consistently using 10 nM of RevFl) (Table 6.3). By taking the ratio of these IC50
values, some information regarding the small molecule – RRE binding
stoichiometries can be gleaned (Table 6.3). A lower ratio suggests that at higher
RRE concentrations there are more binding sites capable of displacing the
peptide.
Table 6.3: IC50 Values (µM)* for RevFl displacement by anisotropy.
Glycoside 10 nM RRE 100 nM RRERatio
(100nM/10nM)
Kanamycin A (1) 100 750 7.5
Guanidino-kanamycin A (48) 8 65 8.1
Kanamycin B (2) 15 80 5.3
Guanidino-kanamycin B (49) 0.7 3.5 5.0
Tobramycin (3) 10 45 4.5
Guanidino-tobramycin (50) 0.8 3.8 4.7
Paromomycin (4) 12 65 5.4
Guanidino-paromomycin (51) 3.4 18 5.3
Neomycin B (5) 0.9 6.7 7.4
Guanidino-neomycin B (52) 0.18 1.3 7.2
* Random errors are less than or equal to ± 30% of each IC50 value.
Surprisingly, the changes in binding stoichiometries for peptide displacement are
significantly different for molecules with similar sizes (including kanamycin A
versus kanamycin B, and paromomycin versus neomycin B). This ratio, however,
does not change for each compound upon guanidinylation, indicating that the
number and relative importance of the binding sites on the RRE are similar for
each guanidinoglycoside and its aminoglycoside precursor. The differences in

157
Rev-RRE IC50 values, upon guanidinylation, are therefore directly proportional to
the change in RRE affinity. Upon guanidinylation of neomycin B and
paromomycin, a 3 – 5 fold increase in RRE affinity is obtained. Upon
guanidinylation of the kanamycin family of glycosides, a 12 – 22 fold increase in
affinity is gained (Table 6.3).
Table 6.4: IC50 Values (µM) for RevFl Displacement by solid-phase assay.*
Glycoside IC50
IC50
with DNA**IC50
with RNA**RRE
SelectivityRatio***
Kanamycin A (1) 700 750 1300 1.5
Guanidino-kanamycin A (48) 55 55 60 1.1
Kanamycin B (2) 90 90 170 1.5
Guanidino-kanamycin B (49) 3 3 4.7 1.3
Tobramycin (3) 45 50 130 2.0
Guanidino-tobramycin (50) 3 3 4.7 1.3
Paromomycin (4) 55 60 110 1.6
Guanidino-paromomycin (51) 15 18 18 1.2
Neomycin B (5) 7 8 16 1.8
Guanidino-neomycin B (52) 1 1.2 4.5 2.9
* Random errors are equal to or less than 30% of each reported value.** 115 µM (base pairs) of either plasmid DNA or poly r(A) – r(U) included, representing a 100-foldmolar excess of bases relative to the RRE. Similar results were also obtained using CT DNA anda tRNA mixture.*** Selectivity ratio = (average IC50 in the presence of DNA and RNA)
(IC50 in the absence of other nucleic acids)
The solid-phase assay (Section 3.2) indicates that guanidinylation also improves
RRE specificity (Table 6.4). By dividing the average IC50 values obtained in the
presence of competitor RNA and DNA by the IC50 values obtained in the absence

158
of other nucleic acids, a selectivity ratio is calculated (Table 6.4). A lower ratio
indicates better RRE selectivity. Upon guanidinylation, this ratio decreases for all
the glycosides (except for neomycin B), showing that, in general, guanidinylation
improves the RRE specificity of the aminoglycosides. Importantly, guanidinylation
does not affect the RNA over DNA selectivity of these glycosides (Table 6.4).
The IC50 values for RevFl displacement do not change significantly upon addition
of an excess of DNA (Table 6.4). This is, to our knowledge, the first indication
that the identity of the basic group is not an important factor for the ability of
aminoglycosides to preferentially bind RNA over DNA.
Analysis of the activity trends, apparent for both the aminoglycosides and the
guanidinoglycosides (Table 6.4), suggests some fundamental relationships
relating the total charge of a ligand to its RNA affinity and specificity. By
comparing either the aminoglycosides or guanidinoglycosides with other
compounds in the same family, it is clear that the total number of basic groups is
roughly proportional to the RRE affinity, and the higher this affinity, the less likely
it is to be selective for the RRE. These same trends are also exhibited by the
dimeric aminoglycosides and aminoglycoside-acridine conjugates and may,
therefore, reflect a general rule. Unlike the dimeric aminoglycosides and
aminoglycoside-acridine conjugates, however, most of the guanidinoglycosides
show improved RRE affinity and specificity as compared to the parent
aminoglycosides. Guanidino-neomycin is the only exception as it is significantly
less selective for the RRE as compared to regular neomycin (Table 6.4). This is

159
consistent with the trends observed for the dimeric aminoglycosides and
aminoglycoside-acridine conjugates (Section 6.3). We conclude, therefore, that
neomycin-based compounds, in general, have a low specificity for the RRE, and
that all modifications, to date, further decrease its RRE selectivity.
Other interesting trends in RRE affinity and selectivity are revealed by the solid-
phase assay (Table 6.4). By comparing aminoglycosides that possess the same
number of basic groups (like kanamycin B, tobramycin and, paromomycin),
additional structure-activity relationships can be examined. For example,
tobramycin and kanamycin B differ only by a single hydroxyl (Figure 6.3), but
tobramycin is found to have a higher RRE affinity as compared to kanamycin B.
This finding is consistent with the ability of hydroxyls to decrease the basicity of
their neighboring amines (giving tobramycin a higher overall charge and a lower
RRE specificity as compared to kanamycin B).36 Upon guanidinylation, the
differences between kanamycin B and tobramycin are lost, because the pKa
values of aliphatic guanidinium groups are significantly less variable than those
of amines.
Guanidino-tobramycin (50) and guanidino-paromomycin (51) each have five
guanidinium groups, but guanidino-tobramycin has approximately a 5-fold higher
affinity for the RRE. It appears, therefore, that the RRE is more selective for
guanidinoglycosides from the kanamycin family as compared to the
guanidinoglycosides from the neomycin family. This may explain why the

160
guanidinylation of the kanamycin family provides a much larger increase in RRE
affinity as compared to the guanidinylation of the neomycin family of glycosides
(Table 6.3 and Table 6.4). It is possible that, compared to guanidino-
paromomycin, the 3-dimensional arrangements of guanidinium groups presented
by guanidino-tobramycin and guanidino-kanamycin better mimic the Rev peptide.
Another possibility is that the guanidinium groups on these compounds are closer
together in space, and therefore exhibit a higher charge density as compared to
guanidino-paromomycin.
Guanidinium groups are highly basic, capable of defined multi-directional
hydrogen bonding, and have planar surfaces that may facilitate stacking
interactions. The higher basicity of the guanidinoglycosides, as compared to the
aminoglycosides, should impart a higher total charge, and therefore higher RNA
affinity as compared to the aminoglycosides. Indeed, the aminoglycosides are
known to be only partially protonated at neutral pH.34 The higher overall positive
charge of the guanidinoglycosides cannot, however, explain their improved RRE
selectivity (this would oppose the general relationships stated above). To
understand why the guanidinoglycosides show improved RRE affinity and
specificity (relative to the aminoglycosides), a number of urea-containing
glycosides were synthesized.188 Urea is an uncharged structural analog of
guanidine. Since both urea and guanidinium solutions can denature nucleic
acids, the urea-glycosides may have bound to RNAs that possess single-
stranded characteristics (such as the purine-rich bulge of the RRE). The urea

161
glycosides are, however, unable to inhibit Rev-RRE binding (through 1 mM). This
indicates that electrostatic interactions are an essential driving force for
guanidinoglycoside – RRE binding. Guanidinoglycoside – RNA binding has,
however, been shown (for the HH16 ribozyme) to be much less dependent on
the total ionic strength of the media, when compared to the aminoglycosides.97
Taken together this suggests that stacking and/or other hydrophobic
interaction(s) mediate binding, but that electrostatic forces are still essential for
guanidinoglycoside-RNA RNA binding.
Figure 6.6: The anti-HIV activities of aminoglycosides and guanidinoglycosidesas evidenced by fractional decrease in plaque formation (as described in Figure4.1). Anti-HIV activities were also evaluated by using ELISA to monitor thedecrease in HIV-1 p24 expression in human PBMC and yielded similar results.Both assays were conducted as described.110 It is possible that at lowconcentrations of the aminoglycosides, the replication of HIV is slightly better.Linear polyamines, like polybrene, are often added to these assays to increasethe infectivity of the HIV particles.110 For these assays, however, no polybrene isadded. This does not affect the IC50 value measured for the positive control (AZTIC50 = ~10 nM).
0.01 0.1 1 10 100
-0.2
0.0
0.2
0.4
0.6
0.8
1.0
1.2
Guanidino-tobramycinGuanidino-neomycin BTobramycinNeomycin B
Concentration (µM)
Fra
ctio
nalD
ecre
ase
inP
laqu
es

162
The guanidinoglycosides are found to possess significantly improved RRE
affinity, specificity, and anti-HIV activities when compared to the aminoglycosides
(Figure 6.6).187 The guanidinoglycosides exhibit 100-fold improved anti-HIV
activities when compared to the parent aminoglycosides (Figure 6.6). It is
possible that the enhanced anti-HIV activities of these compounds are related to
their improved RRE affinity and specificity. The guanidinoglycosides are shown,
however, to be transported into eukaryotic cell cultures much more efficiently
than aminoglycosides (presented in Section 6.8). In addition, the
guanidinoglycosides bind to other HIV viral sites (including the TAR) with good to
moderate affinities (not shown). The exact mechanism(s) responsible for the anti-
HIV activities of the guanidinoglycosides are currently under investigation in
collaboration with Immusol Inc.
Other groups have conjugated amino acids to aminoglycosides in order to mimic
the Tat protein arginine-rich motif, with similar reported results.189 Conjugation of
arginine to kanamycin B is reported to increase its affinity for the HIV-1 TAR
RNA.189 This synthetic modification effectively doubles the number of basic
groups present.
Figure 6.7: Structures of tobramycin-arginine conjugates (see section E 6.4.1 –E 6.4.2 for synthesis and characterization).
O
HN
HOHN
HN
OHOHO
O
O
NH
OHNH
OH
NHO
HNHN NH2
HN
O
NH NH
NH2
HN
ONH NH
NH2HN
O
HNHN NH2
NH
O
HN NH
NH2
O
OO
O
O
O
HN
HOHN
HN
OHOHO
O
O
NH
OHNH
OH
H2NO
HNHN NH2
H2N
O
NH NH
NH2
NH2
ONH NH
NH2NH2
O
HNHN NH2
H2N
O
HN NH
NH2
ace-Tobra-Arg (54)Tobra-Arg (53)

163
Their findings suggest, however, that the guanidinium-containing side chains do
not play the dominant role in RNA binding.189 The α-amines of the amino acids,
in close proximity to the “core” glycoside, are reported to be essential for TAR
binding.189 We have made similar observations with tobramycin-arginine
conjugates in the Rev-RRE system (Figure 6.7). The conjugate “Tobra-Arg” has
the same number of basic groups and a similar RRE affinity as the tobramycin
dimer “Tobra-Tobra” (compare Table 6.2 and Table 6.5). If the α-amines of the
arginine-tobramycin conjugate are blocked by acetylation, the resulting
compound “ace-Tobra-Arg“ has the same number of basic groups as guanidino-
tobramycin (50). Both guanidino-tobramycin and the aceylated tobramycin-
arginine conjugate possess 5 guanidinium groups; their comparison allows us to
establish the contributions made by the flexible, hydrophobic, methylene linkages
present in the arginine-conjugates. We find that the aceylated tobramycin
arginine conjugate (54) has a 30-fold lower RRE affinity as compared to
guanidino-tobramycin (50) (Table 6.5 and 6.3).
Table 6.5: IC50 values and approximate RRE66 affinities (Ki)according to fluorescence anisotropy.
Compound RevFl-RRE66 IC50* RRE66 Ki**
Tobra-Arg (53) 15 nM 2.3 x 10-09
Ace-Tobra-Arg (54) 24 µM 6.0 x 10-06
Kana A-Dab (55) 1.5 µM 3.7 x 10-07
Kana A-Lys (56) 1.7 µM 4.2 x 10-07
γ-Guanidino Kana A-Dab (57) 350 µM 8.6 x 10-08
* IC50 values are for 10 nM of RevFl and 10 nM of RRE66, approximaterandom errors are ± 30% of each reported value.** Calculated from Rev-RRE IC50 values at 10 nM of RRE, these estimatesassume that 1 equivalent of the small molecule is sufficient to displace RevFl.

164
This indicates that a significant energetic penalty is introduced by the flexible
methylene linkages of the amino acids. Both the density and rigidity of the five
guanidino groups presented by 50 should both be greater than those presented
by 54. This may, in part, explain the energetic penalty introduced by the flexible
methylene chains in 54. To address the effects of charge density, a number of
kanamycinA-amino acid conjugates have been synthesized and evaluated for
their RRE affinity (Figure 6.8 and Table 6.5).
Figure 6.8: Structures of kanamycin A-amino acid conjugates (see sections E6.4.1 – E 6.4.3 for the synthesis and characterization of 53-57).
Both kana A-Dab (55) and kana A-Lys (56) have 8 amines, but they exhibit a
much lower RRE affinity as compared to the kanaA-kanaA dimer (Table 6.2 and
Table 6.5). This suggests that no simple relationship exists between the density
of the 8 amines and the RRE affinity exhibited by each compound, as the
kanamycin dimer should have a lower density of its 8 amines. Compared to
kanaA-Dab, the longer methylene linkers provided by kanaA-Lys were expected
to give this compound a lower overall charge density (Figure 6.8). Both
O
HN
HOHN
HN
OHOHO
O
O
HO OHNH
OH
H2NO
NH2
ONH2
NH2
O
H2N
O
Kana A-Dab (55)
HO
H2N
NH2
NH2
O
HN
HOHN
HN
OHOHO
O
O
HO OHNH
OH
H2NO
NH2
ONH
NH2
O
H2N
O
γ-Guanidino Kana A-Dab (57)
HO
HN
NH
NHNH
H2N
HN NH2
HNNH2
NH
NH2
O
HN
HOHN
HN
OHOHO
O
O
HO OHNH
OH
H2NO
NH2
ONH2
O
H2N
O
HO
NH2
H2N
H2N
NH2
Kana A-Lys (56)

165
compounds, however, have approximately the same RRE affinity (Table 6.5). It is
possible that, due to the plasticity of the pKa values of amines, kanaA-Lys and
the kanaA-kanaA dimer may have higher total charges, but the same or lower
charge densities as compared to kanaA-Dab. These effects may for kanaA-Lys
and kanaA-Dab cancel out, explaining perhaps, the similar RRE affinities of
these compounds. Upon guanidinylation of the γ-amines of kanaA-Dab, a 5-fold
increase in RRE affinity is realized (Table 6.5). This is a much smaller increase
as compared to the 12-fold increase upon guanidinylation of kanamycinA (Table
6.3 and Table 6.4). It appears therefore, that guanidinylation of the amines closer
to the “core” of the glycoside is more advantageous as compared to
guanidinlyation of the amines distal to the core. This is consistent with the proven
importance of the α-amines of tobra-Arg (Table 6.3) and the kanamycinA-Arg
conjugates.189
6.5 Acridine-Containing Guanidinoglycosides
In an attempt to increase the RRE affinity and selectivity of neo-N-acridine and
tobra-N-acridine (Section 6.1 – 6.2), these compounds were guanidinylated using
N,N'-diBoc-N''-triflylguanidine (Section E 6.5.1). The main side products for both
reactions are the “n-1” guanidinylated products 59 and 61. Interestingly, these
compounds have a higher RRE affinities compared to the fully guanidinylated
compounds 58 and 60. Fluorescence anisotropy was used to evaluate the RRE
affinity of compounds 58 – 61 (Table 6.6). Limits must be reported for 60 and 61,
as these compounds have higher RRE affinities compared to RevFl.

166
Figure 6.9: Structures of guanidininylated acridine-containing glycosides. SeeSection E 6.5.1 for synthesis and characterization. *For compounds 59 and 61,the non-guanidinylated site has not, unambiguously, been assigned. COSY andROESY NMR experiments of 59, have proven the nonguanidinylated site is onthe 2-DOS ring. Similarly, for 61, the least basic amine is likely the non-guanidinylated position.34
Table 6.6: Preliminary RRE66 affinities, according to RevFldisplacement experiments using fluorescence anisotropy.
Compound RRE66 Ki
58* 6.5 ± 1 x 10⁻⁹
59* 4.8 ± 2 x 10⁻⁹
60** < 1.1 ± 0.9 x 10⁻⁹
61** < 0.7 ± 0.5 x 10⁻⁹
* Calculated from RevFl-RRE66 (10 nM / 100 nM, respectively) IC50 values.** Calculated from RevFl-RRE66 (10 nM each) IC50 values.
O
HN
HO HN
H2NO
HOHOO
O
NH
OHNH
NH
H2N
NHNH2
NH
NH2
NH
H2N
NH
N
HN
N
HN
HNO
OO
HN
OH
HOO
HOO
HO
HN
OHO
HO
NH
NH
H2NNH
HNNH2
NH
NH2
NH
NH2NH
H2N
HNNH2
Guanidino4 Tobra-N-acridine (59)*
Guanidino6 Neo-N-acridine (60)
O
HN
HO HN
HN
OHO
HOO
O
NH
OHNH
NH
H2N
NH
H2NNH
NH2
NH
NH2
NH
H2N
NH
N
Guanidino5 Tobra-N-acridine (58)
HN
N
HN
HNO
OO
H2N
OH
HOO
HOO
HO
HN
OHO
HO
NH
NH
H2NNH
NH
NH2
NH
NH2NH
H2N
HNNH2
Guanidino5 Neo-N-acridine (61)*

167
Compounds 58 – 60 have been evaluated for anti-HIV activities; guanidino5
tobra-N-acridine (58) has an IC50 value of 0.2 µM in both HeLa cells and human
HMBC (summarized in Table E 1.2). This represents a modest (5-fold)
improvement over guanidino-tobramycin (50). Interestingly, guanidino4 tobra-N-
acridine (59) has, according to the PBMC assay, little or no anti-HIV activity at all
(through 10 µM, Table E 1.2). This result can be understood by the differences in
cellular uptakes of these two compounds (presented in Section 6.8).
6.6 Platinum-Containing Aminoglycosides and Guanidinoglycosides
Binding of the anticancer drug cisplatin (cis-Pt) to nucleic acids is believed to
favor DNA over RNA.190 The bifunctional covalent modification of DNA by cis-Pt
produces intrastrand cross-links (at GpG, ApG, and GpNpC),191 and interstrand
cross-links (at GpC).192 Cisplatin also reacts with other cellular components
including: proteins,193 phospholipids,194 and small molecules.195 To enhance the
DNA targeting of cis-Pt, numerous conjugates have been prepared, where the
cis-Pt moiety has been tethered to high-affinity nucleic acid ligands (e.g.,
acridine, ethidium, and short oligonucleotides).196 In an attempt to “reverse” the
nucleic acid selectivity of cis-Pt, and to covalently inactivate the RRE, the
cisplatin-glycoside conjugates Neo-platin (Neo-Pt) and Guanidino Neo-platin (G.
Neo-Pt) were synthesized in good yields and fully characterized by Dr. Jürgen
Boer (Figure 6.10).197

168
Figure 6.10: Structures of cis-platin, neoplatin, and guanidino-neoplatin.
The non-covalent inhibition of the Rev-RRE interaction may result in the splicing
of newly transcribed HIV RNA into smaller fragments. From these RNA
fragments, the proteins Rev, Tat, and Nef are translated (Section 2.0 – 2.1).
Inhibition of Rev-RRE binding may, therefore, actually increase Rev production,
leading to a higher cellular concentration Rev. This would make the continued
non-covalent inhibition of the Rev-RRE interaction increasingly difficult. Covalent
modification of the RRE may provide a mechanism to irreversibly inactivate the
RRE, and thus permanently eliminate its abilities to bind Rev or to be translated
into protein.
To explore the ability of Neo-Pt to form covalent cross-links to the RRE JW,
denaturing polyacrylamide gel-shift electrophoresis (DPAGE) and matrix assisted
laser desorption ionization time of flight mass spectrometry (MALDI TOF MS)
have been utilized. Upon titration of Neo-platin with RRE JW, DPAGE indicates
R
NH2
HN
NH
NH2
Compound
Neo-platin (62)
Guanidino-neo-platin (63)
NH2
NH2
Pt
Cl
Cl
Cisplatin (64)
N
O
R
RO
HOHO
OO
R
OH
HOO
HOO
HO
R
R
R
NH2 O
H2N
Pt
Cl
Cl
H

169
that multiple equivalents of Neo-platin bind to the RRE, while the addition of
neomycin B produces no effect (Figure 6.11 A). Cross-linking is rapid (less than
30 min) and kinetically stable adducts are formed (persist greater than 20 h at 25
°C). Consistent with earlier studies, G. Neo-Pt appears to be five times more
active for cross-linking the RRE as compared to Neo-Pt (Figure 6.11B).
Figure 6.11: DPAGE results with 25 nM of 32P 5'-labeled RRE JW. A) lane 1:RNA only, lanes 2 – 7: Neo-Pt at 12.5 nM, 125 nM, 625 nM, 1.25 µM, 12.5 µM,125 µM, respectively, lanes 8 – 11: neomycin B at 625 nM, 1.25 µM, 12.5 µM,125 µM, respectively, lanes 12 – 17: 625 nM of Neo-Pt at 0.5 hr, 1 hr, 2 hr, 3 hr,4 hr, 5 hr, respectively. B) lane 1: RNA only, lanes 2 –9: Neo-Pt at 50 nM, 100nM, 500 nM, 1 µM, 2.5 µM, 5 µM, 7.5 µM, 10 µM, respectively, lane 10: RRE JWonly, lanes 11 – 16: G. Neo-Pt at 50 nM, 100 nM, 500 nM, 1 µM, 2.5 µM, 5 µM,respectively. C) lane 1: RNA only, lanes 2 – 8: 1 µM of G. Neo-Pt with CT DNA at8.5 mM, 4.25 mM, 850 µM, 85 µM, 8.5 µM, and 0 µM b.p., respectively, lanes 9and 17 RRE JW only, lanes 10 – 16: 1 µM of Neo-Pt with CT DNA at 8.5 mM,4.25 mM, 850 µM, 85 µM, 8.5 µM, 0 µM, respectively.
A)
B)
C)
1 2 3 4 5 6 7 8 9 10 11 12 13 14 15 16 17
1 2 3 4 5 6 7 8 9 10 11 12 13 14 15 16
1 2 3 4 5 6 7 8 9 10 11 12 13 14 15 16 17

170
Neo-Pt cross-links to the RRE even in the presence of a vast excess of calf
thymus (C.T) DNA (Figure 6.11 C). Approximately a 5,000-fold excess of C.T.
DNA (relative to the number of bases in RRE JW) must be added to inhibit cross-
linking of the RRE (Figure 6.11C). This suggests that the RNA over DNA
selectivity of these compounds is dominated by the neomycin moiety. Indeed, a
CN− deactivated Neo-Pt shows approximately the same RRE affinity and
selectivity as unmodified neomycin B (presented in Section 6.7).
To further explore the RRE cross-linking specificity of Neo-Pt and G. Neo-Pt,
another strongly denaturing technique MALDI TOF MS has been used in
conjunction with two RRE JW mutants (Figure 2.5). MALDI confirms the
formation of the covalent adducts between the RRE JW and Neo-Pt as well as G.
Neo-Pt (Figure 6.12 A and B, respectively). After the same 1 hr incubations, both
an inosine-substituted RRE (3I RREJW) and a DNA version of the RRE JW
(dRREJW) show little to no cross-linking of Neo-Pt (compare Figure 6.12A to
6.12C and 6.12D). At a longer incubation time (18 hrs), significant cross-link
formation is observed between Neo-Pt and dRREJW (similar magnitude as 6.12
A). Both dRREJW and 3I RREJW have much lower affinities to neomycin as
compared to the RRE JW (presented next section). This may explain the slower
cross-linking of these constructs to Neo-Platin. G. Neo-Pt, however, has a high
affinity for all three RRE constructs (next section) and shows approximately the
same cross-linking efficiencies to all three RRE constructs (similar to 6.12 B).
This confirms the decrease in RRE selectivity upon guanidinylation of neomycin

171
B (Section 6.4). Neo-Pt, however, exhibits a clear selectivity for RREJW over
both the 3I RREJW and the dRREJW constructs.
Figure 6.12: MALDI TOF MS of 1 µM of RRE JW treated with 0.75 µM of either:Neo-Pt (A) or G. Neo-Pt (B), and 1 µM of 3I RRE JW (C) or dRRE JW (D) treatedwith 0.75 µM of Neo-Pt and incubated for 1 hr. cis-Pt (64) shows no reactivitytowards any of the RRE constructs under these conditions (even after overnightwater activation and 15 hr incubations with the nucleic acids). See section E6.6.1 for reaction conditions and sample preparation.
To determine the cross-linking site(s) for Neo-Pt and G. Neo-Pt on the RRE JW,
enzymatic digestions of 1:1 glycoside-RRE adducts were performed using either
Snake Venom Phosphodiesterase (3’! 5’ exonuclease) or Bovine Spleen
Phosphodiesterase (5’! 3’ exonuclease). The Neo-Pt adducts are found to
generate stop-sites for these enzymes, resulting in RRE fragments that can be
characterized by MALDI TOF MS (Figure 6.13 and 6.14).
Neo-platin + RRE JW
4 000 6 000 8 000 10 000 12 000 14 000 16 000 18 000 20000
Co
unts
0
2000
4000
6000
Guanidino-Neo-platin+ RRE JW
Co
unts
0
4000
8000
12000
M+2
M+2
11,103
12,046
11,104
12,380
4000 6000 8000 10000 12000 14000 16000 18000 20000
M/Z
4 000 6000 8000 10000 12000 14 000 16000 18 000 20 000
Neo-platin +3I RRE JW
4 000 6000 8000 10000 12000 14 000 16000 18 000 20 000
Co
unts
0
10000
20000
Neo-platin +dRRE JW
4000 6000 8000 10000 12000 1 4000 16000 18000 2 0000
Co
unts
2000
4000
6000
8000
M/Z
M+2
M+2
11,024
10,582
A)
B)
C)
D)

172
Figure 6.13: Snake Venom Phosphodiesterase digestion of RRE JW control (A),Neo-Pt cross-linked (B), or G. Neo-Pt cross-linked (C) RRE JW. Bovine SerumPhosphodiesterase digestion of RRE JW control (D), Neo-Pt cross-linked (E), orG. Neo-Pt cross-linked (F) RRE JW. See E 6.6.1 for reaction conditions andsample preparation.
Interestingly, the nuclease-resistant fragments for both Neo-Pt and G. Neo-Pt
adducts are identical for both enzymes (Figure 6.13). This indicates that the Neo-
Pt and G. Neo-Pt adducts are absent in the nuclease-resistant RNA fragments.
The stop sites for each phosphodiesterase are summarized (Figure 6.14 Left).
The initial site of covalent cross-linking is near the loop region of the RRE JW for
both Neo-Pt and G. Neo-Pt. This data suggest that a single G-G cross-link is
responsible for the pattern of enzymatic stop sites. The proposed cross-linking
BSP Control Digestion
2000 4000 6000 8000 10000 12000
Co
unts
10000
20000
30000
Neo-platin / RRE JWBSP Digestion
2000 4000 6000 8000 10000 12000
Co
unts
5000
10000
15000
Guanidino-Neo-platin / RRE JWBSP Digestion
M / Z
2000 4000 6000 8000 10000 12000
Co
unts
3000
6000
9000
8,57
68,
2 30
7,8 8
37,
576
6,26
55,
923
5,61
55,
267
2,86
92,
527
2 ,21
5
5,75
06,
108
6 ,46
8
5,38
7
6,4 8
3
6,1 1
05,72
35 ,35
1
Guanidino-Neo-platin / RRE JWSVP Digestion
M / Z
2000 4000 6000 8000 10000 12000
Co
unts
3000
6000
90005,044
SVP Control Digestion
Co
unts
10000
20000
1,10
21,
470
1,83
82,
213
2,58
5
5,08
05,
458
Neo-platin / RRE JWSVP Digestion
Co
unts
10000
20000
30000 5,040
5,138
M+2
A)
B)
C)
D)
E)
F)

173
site (Figure 6.14, Right) is a typical 5’GpC3’ interstrand-like cross-link that has
been well characterized for cis-Pt and DNA duplexes.192 It is interesting that both
enzymes appear to “read through” the first modified G, but stop before the
second G of the cross-link. It is possible that the enzymes initiate cleavage in the
loop of the RRE, and therefore bypass the “first” cross-linked G.
Figure 6.14: Enzymatic stop sites for both Neo-Pt and G. Neo-Pt (Left). Theopen arrow indicates the stop site for Snake Venom Phosphodiesterase; theclosed arrows indicate position and relative intensity of stop sites for BovineSpleen Phosphodiesterase. Proposed site of cross-linking (Right).
Consistent with earlier studies,89 multiple equivalents of Neo-Pt are needed to
displace the Rev peptide from the RRE. Native gel-shift electrophoresis was
used to monitor the displacement of Rev-IA from the RRE JW (Figure 6.15). At
low concentrations, Neo-Pt can cross-link the Rev-RRE complex without
displacing the peptide. It appears that three equivalents of Neo-Pt are necessary
for peptide displacement (Figure 6.15). Marino has proposed that two equivalents
of neomycin B are sufficient to displace the Rev peptide from the RRE.89 No Rev-
RRE-neomycin B tertiary complex is observed by electrophoresis and may
indicate the poor kinetic stability of such a complex (Figure 6.15). The IC50 values
for both Neo-Pt and neomycin B are approximately 2.5 µM, but Neo-Pt covalently
CA
A
U U
A
G
C
G GG
CG
C
A GU A
C
G U
G
C
C
G
A G
G
C
G
G
C
G
C
RRE JW
CA
A
U U
A
G
C
G GG
CG
C
A GU A
C
G U
G
C
C
G
A G
G
C
G
G
C
G
C
RRE JW

174
modifies the RRE and retards its mobility even after the Rev peptide has
dissociated (Figure 6.15).
Figure 6.15: Native gel-shift electrophoresis. 25 nM of RRE JW is mixed with 2µM of “Rev-IA“, then Neomycin B is titrated (0.5 µM, 1.0 µM, 1.25 µM, 2.5 µM,3.75 µM, 5.0 µM, 7.5 µM, 10 µM) or Neo-Pt is titrated (0.25 µM, 0.5 µM, 0.75 µM,1.0 µM, 1.25 µM, 2.5 µM, 5.0 µM, 10 µM). On a denaturing gel, RREJW appearsas a single band (Figure 6.11), on the native gel it consistently appears as adouble band, this suggests two alternate folds of the RRE JW are possible.
Neo-platin (62), guanidino-neoplatin (63), and cis-platin (64) have each been
evaluated for their ability to inhibit HIV replication in HeLa cells (using a syncytia-
formation assay).110 These experiments suggest that all three compounds are
highly potent inhibitors of HIV-1 replication with IC50 values similar to AZT (10 –
100 nM) (Table E 1.1). Experiments using different methodologies (conducted at
Immusol Inc.) suggest, however, that these compounds are not very active.
Clearly, more tested is needed to establish the biological activities of 62 and 63.
Neo-platin and G. Neo-platin are found to create site-specific, RNA-selective
covalent cross-links to the RRE. These molecules are, to the best of our
knowledge, the first examples of small molecules that covalently modify RNA
RRERev+RRE
Neomycin B Neo-Pt

175
over DNA. These results also serve as an important precedent for the selective
covalent modification of therapeutically relevant RNA targets by small molecules.
6.7 BODIPY- and Fluorescein-Linked Glycosides as RNA Probes
Fluorescent dyes have been attached to aminoglycosdies to facilitate the
analysis of RNA binding interactions.72a,76a,183 In all previous cases, the amino
positions of aminoglycosides were used for one-step conjugation reactions,
resulting in an amide-bond at that position. The amines of the aminoglycosides
are, however, essential for RNA binding. 36,118,174-175 We use, therefore, the
primary alcohols of aminoglycosdies for conjugation reactions. Indeed, the
hydroxyl groups of tobramycin have been shown to be non-essential for RNA-
binding.36 Both BODIPY and fluorescein have been conjugated to the 6"
positions of tobramycin, guanidino-tobramycin, neomycin B, and guanidino-
neomycin B (Figure 6.16). BODIPY is an uncharged, non-intercalative dye that
has proven itself an ideal probe for the study of RNA-aminoglycoside binding.
To further explore the RRE affinity and specificity of neomycin and guanidino-
neomycin, the fluorescence anisotropy of A. Neo-BODIPY (67) and G. Neo-
BODIPY (68) were monitored as a function of increasing RREJW, 3IRREJW, or
dRREJW concentrations (Figure 2.4 and Figure 2.5). The fluorescence
anisotropy of the BODIPY-conjugates increases upon binding of each RRE
construct (see Figure 6.17 for an example). These association curves are used to
determine C50 values (defined as the concentration of RNA needed to bind ½ of

176
the BODIPY conjugate). The C50 value is approximately equal to the Kd if the C50
value is significantly higher than the concentration of the fluorescent probe (10
nM). C50 values that are in the same order as the concentration of fluorescent
probe can also be used to calculate Kd values, but a robust assessment of
binding stoichiometery should be taken into consideration (Section 3.6). Table
6.7 summarizes the C50 values for A. Neo-BODIPY and G. Neo-BODIPY for
binding to the RRE JW, the 3I RRE JW, and the dRRE JW.
Figure 6.16: New fluorescent aminoglycosides based upon BODIPY (65 – 68)and fluorescein (69 – 71). See Section 6.7.1 – 6.7.7 for the synthesis andcharacterization of these compounds.
O
R
RO
HOHO
OO
R
OH
R
OHO
HOO
S
HO
R
R
OS
Guanidino Neo-Fl (71)NH
NH
NH2
R Compound
OHOR
OR R
O
ORR
OH
HO HO
S
NNB
FF
OS
NH
O
Amino Tobra-BODIPY (65)
Guanidino Tobra-BODIPY (66)NH
NH
NH2
NH2
R Compound
O CO2H
HO
O
NH
O
OHOR
OR R
O
ORR
OH
HO HO
S
OS
Amino Tobra-Fl (69)
Guanidino Tobra-Fl (70)HN
NH
NH2
NH2
R Compound
O CO2H
HO
O
NH
O
O
R
RO
HOHO
OO
R
OH
R
OHO
HOO
S
HO
R
RNN
BFF
OS
NH
O
Amino Neo-BODIPY (67)
Guanidino Neo-BODIPY (68)NH
NH
NH2
NH2
R Compound

177
Figure 6.17: Changes in fluorescence anisotropy of G. Neo-BODIPY (68) as afunction of RRE concentration.
Consistent with the peptide displacement experiments using the unlabeled
glycosides (Section 6.4), G. BODIPY-Neo has about a 5-fold higher RRE affinity
compared to A. BODIPY-Neo (Table 6.7). Interestingly, Guanidino BODIPY-Neo
has a much higher affinity to the mutant RRE constructs as compared to Amino
BODIPY-Neo (Table 6.7). This is also consistent with the decrease in RRE
specificity of neomycin B, upon guanidinylation (as indicated by the solid phase
assay, Table 6.4).
Table 6.7: C50 values (nM) according to fluorescence anisotropy.*RRE Construct Amino Neo-BODIPY Guanidino Neo-BODIPY
RRE JW 60 153I RRE JW 800 17dRRE JW 12,000 250
*Estimated error ± 30% of each reported C50 value.
Concentration of RRE (nM)
0 1000 2000 3000 4000 5000 6000
Ave
rage
Ani
sotr
opy
Val
ue(u
nitle
ss)
0.02
0.04
0.06
0.08
0.10
RRE JWdRRE JW

178
Since the size, and hence negative charge, for all three of these RREJW
constructs is the same, the differences in affinities likely reflect differences in the
BODIPY neomycin off-rates from each construct. Differences in off rates are also
the most likely explanation for the different cross-linking rates for Neo-Pt and the
three RREJW constructs (Section 6.8).
To probe how Pt-modification affects the RRE affinity of neomycin; Neo-Pt, G.
Neo-Pt, neomycin B, and guanidino-neomycin B, were used to displace the
BODIPY-Neo compounds 67 and 68 from the RRE. To deactivate the covalent
cross-linking abilities of Neo-Pt and G. Neo-Pt, 10 mM stocks of these
compounds were prepared in 40 mM KCN. DPAGE experiments confirm that
these stocks are not capable of forming covalent cross-links with the RRE (not
shown). Displacement experiments are conducted by mixing 10 nM of either A.
Neo-BODIPY or G. Neo-BODIPY with 50 nM of RRE JW. By monitoring the
fluorescence anisotropy of the BODIPY conjugate, its displacement from the
RREJW becomes apparent. The IC50 values for each compound are summarized
in Table 6.8. Since multiple equivalents of neomycin can bind to the RRE, the Ki
values estimated in Table 6.8 are for comparison purposes only and may not
reflect the actual affinities. The calculated Ki value for the displacement of A.
Neo-BODIPY from the RREJW by neomycin B is, however, nearly the same
value as determined by the displacement of RevFl from the RRE66 (Table 6.0
and Table 6.8).

179
Table 6.8: Summary of IC50 values (nM) for displacement from RRE JW.Compound Compound
Displaced IC50* Ki
**
Neomycin B (67) 400 240
Neo-Pt*** (67) 120 60
Guanidino Neomycin B (68) 155 22
Guanidino Neo-Pt*** (68) 120 15
* Estimated error ± 30% of reported value.** Calculated assuming a single binding site on RRE JW for both the Neo-BODIPY probe andfor each compound evaluated, and assuming the Kd for Amino Neo-BODIPY / RRE JW = 55 nMand the Kd for Guanidino Neo-BODIPY / RRE JW = 10 nM (Table 6.7).*** CN− treated (see above).
These values suggest that the addition of BODIPY to Neomycin introduces a
small (2 – 7 fold) increase in affinity for RRE JW. The conjugation of Pt to
neomycin, likewise, introduces a very small (2 – 4 fold) increase in affinity for the
RRE JW. These differences are small enough to be explained by potential
differences in displacement stoichiometries.
In summary, the conjugation of BODIPY to neomycin B and guanidino-neomycin
B is found to introduce only a small perturbation for RNA binding. These
conjugates should, therefore, be useful probes for the future study of other RNA
-aminoglycoside and RNA-guanidinoglycoside binding interactions.
6.8 Cellular Uptake of Aminoglycosides and Guanidinoglycosides
Despite their high affinity for the RRE, neither tobra-N-acridine (41), nor neo-N-
acridine (38) possess anti-HIV activity. The guanidino forms of these compounds,
however, are active for HIV inhibition (compounds 58 and 60, Table E 1.2).

180
Differences in cellular uptakes may, potentially, explain the different anti-HIV
activities of these compounds. Fluorescence microscopy was used to monitor the
uptake of these compounds into COS cells (Table 6.9). These qualitative
observations suggest that mammalian cells show significant cellular uptake of the
guanidinoglycoside-acridine conjugates but not the aminoglycoside-acridine
conjugates (Table 6.9).
Table 6.9: Qualitative and preliminary assessment of cellular uptake.*
Compound Cellular Uptake into COS Cells?
RevFl Yes
9-amino acridine Yes
Guanidino5 Tobra-N-acridine Yes
Neo-N-acridine No
Guanidino4 Tobra-N-acridine No
* Based upon fluorescence microscopy of COS cells after a2 hr exposure to 5 µM of each compound (1 µM of RevFl).
Acridine is not, however, an ideal fluorescent probe for cellular uptake studies. A
short wavelength of excitation (440 nm) causes significant background
fluorescence. In addition, the acridine-conjugates themselves have a wide range
of quantum yields (Table 6.10). Indeed, the guanidino-containing conjugates
have 2 – 5 fold higher quantum yields compared to the aminoglycoside-acridine
conjugates (Table 6.10). In addition, the quantum efficiencies of the acridine
conjugates change upon binding cellular components (including nucleic acids).
For these reasons, the BODIPY fluorophore was used for quantitative
assessments of the cellular uptakes of amino- and guanidinoglycosides.
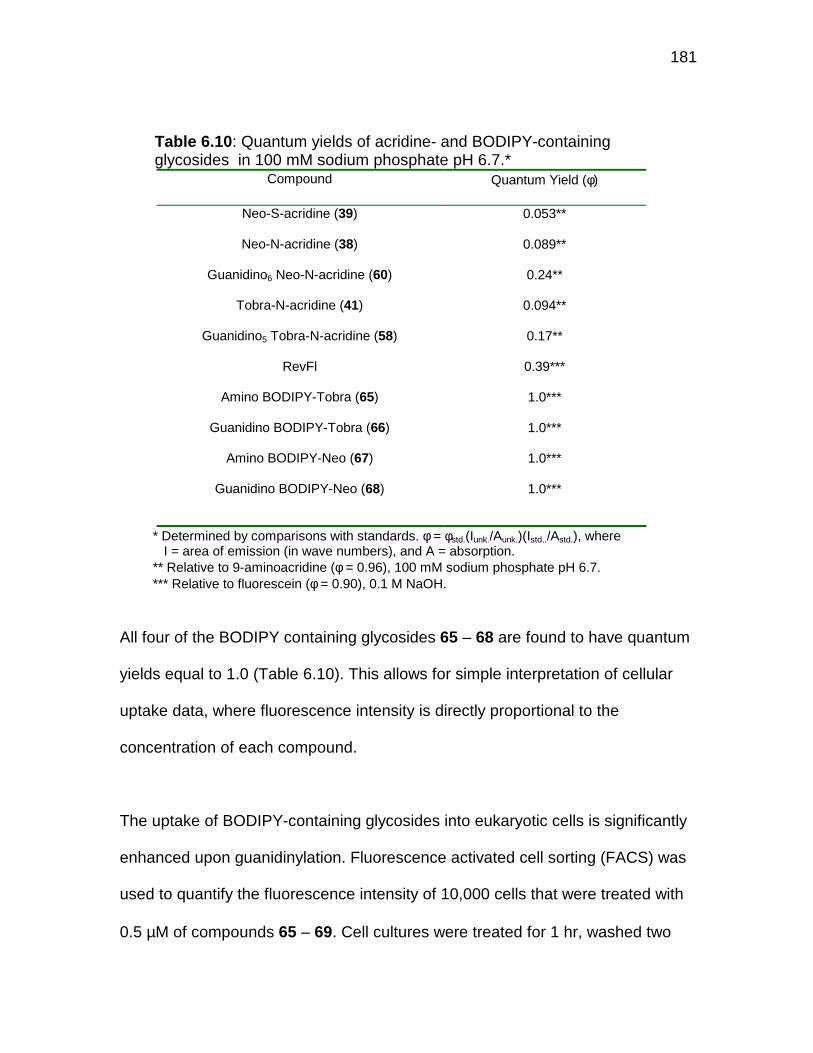
181
Table 6.10: Quantum yields of acridine- and BODIPY-containingglycosides in 100 mM sodium phosphate pH 6.7.*
Compound Quantum Yield (φ)
Neo-S-acridine (39) 0.053**
Neo-N-acridine (38) 0.089**
Guanidino6 Neo-N-acridine (60) 0.24**
Tobra-N-acridine (41) 0.094**
Guanidino5 Tobra-N-acridine (58) 0.17**
RevFl 0.39***
Amino BODIPY-Tobra (65) 1.0***
Guanidino BODIPY-Tobra (66) 1.0***
Amino BODIPY-Neo (67) 1.0***
Guanidino BODIPY-Neo (68) 1.0***
* Determined by comparisons with standards. φ = φstd.(Iunk./Aunk.)(Istd../Astd.), whereI = area of emission (in wave numbers), and A = absorption.
** Relative to 9-aminoacridine (φ = 0.96), 100 mM sodium phosphate pH 6.7.*** Relative to fluorescein (φ = 0.90), 0.1 M NaOH.
All four of the BODIPY containing glycosides 65 – 68 are found to have quantum
yields equal to 1.0 (Table 6.10). This allows for simple interpretation of cellular
uptake data, where fluorescence intensity is directly proportional to the
concentration of each compound.
The uptake of BODIPY-containing glycosides into eukaryotic cells is significantly
enhanced upon guanidinylation. Fluorescence activated cell sorting (FACS) was
used to quantify the fluorescence intensity of 10,000 cells that were treated with
0.5 µM of compounds 65 – 69. Cell cultures were treated for 1 hr, washed two

182
times with buffer, cleaved with trypsin, and quantified for fluorescence. Upon
guanidinylation, the cellular uptake of tobramycin is enhanced, on average, by 4-
fold. The enhancement for neomycin is over 7-fold (Figure 6.18 and Table 6.11).
Interestingly, both A. Tobra-BODIPY (65) and A. Neo-BODIPY (67) have
approximately the same cellular uptakes, but G. Neo-BODIPY (68) exhibits 2-fold
better uptake as compared to G. Tobra-BODIPY (66) (Figure 6.18 and Table
6.11).
A number of poly-arginine containing proteins, peptides, and peptoids have
recently been found to exhibit highly efficient uptake into a wide range of
mammalian cell types.198 We were interested, therefore, to compare the uptake
of a poly-Arg peptide to the uptake of the guanidinoglycosides. The BODIPY-
containing poly (Arg)9 peptide “BODIPY-CR9” (72) was synthesized (see E 6.8.1)
and evaluated for cellular uptake efficiency (Figure 6.19 A and Table 6.11).
Figure 6.18: FACS histograms showing the fluorescence intensity and cell countfor 10,000 individual10T1/2 cells following a 1 hr incubation with 0.5 µM of: A)Amino Tobra-BODIPY (65) (Red) and Guanidino Tobra-BODIPY (66) (White). B)Amino Neo-BODIPY (67) (Red) and Guanidino Neo-BODIPY (68) (White).Similar results were also observed for HeLa cells (not shown).
101 104102 103100
Fluorescence Intensity (530 nm)
Num
ber
ofC
ells
128
64
101 104102 103100
Fluorescence Intensity (530 nm )
Num
ber
ofC
ells
128
64
A) B)

183
Table 6.11: Summary of the cellular uptake efficiencies of 0.5 µMof each BODIPY-containing compound.
Compound Mean fluorescenceintensity (FACS)
A. Tobra-BODIPY (65) 61
G. Tobra-BODIPY (66) 241
A. Neo-BODIPY (67) 58
G. Neo-BODIPY (68) 431
BODIPY-CR9 (72) 284
BODIPY-CR9 (72) + 10 µM G. Neo (52) 105
BODIPY-CR9 (72) + 50 µM G. Neo (52) 88
BODIPY-CR9 (72) + 200 µM G. Neo (52) 69
Guanidino tobramycin-BODIPY (66), compared to BODIPY-CR9 (72), has 4 fewer
guanidinium groups but still shows the same transport efficiency (Table 6.11).
This indicates that the flexible, amphipathic properties provided by the methylene
chain of Arginine residues are not needed for effective membrane transport.
Importantly, guanidino Neo-BODIPY (68) has a better cellular uptake as
compared to the poly-Arg peptide BODIPY-CR9 (72) (Figure 6.19, Table 6.11).
This suggests that the semi-rigid pre-organization of the guanidinium groups on
the glycoside core may better facilitate translocation across the cell membrane.
Indeed, other groups have found that for peptides secondary structure formation
increases transport efficiency.199 Other groups have found that poly Arginine
exhibits better uptake properties as compared to poly Lysine.200 Taken together,
it appears that no matter what type of scaffold is used, amines exhibit poor
transport properties into mammalian tissue cultures, as compared to the
corresponding guanidino compounds.

184
Figure 6.19: FACS histograms showing the fluorescence intensity and cell countfor 10,000 individual10T1/2 cells following a 1 hr incubation with: A) 0.5 µM ofBODIPY CR9 (72) (Red), or Guanidino Neo-BODIPY (68) (White). B) 0.5 µM ofBODIPY CR9 transport inhibited by guanidino-neomycin B (52), at 0 µM (red), 10µM (black), 200 µM (green).
To examine the mechanism by which guanidinoglycosides enter eukaryotic cells,
a competition experiment was conducted with unlabeled guanidino-neomycin B
(52) and BODIPY-CR9 (72). FACS analysis shows that guanidino-neomycin B
(52) effectively inhibits the transport of BODIPY-CR9 (Figure 6.16 B and Table
6.11). This may indicate that guanidinoglycosides competitively bind to the same
cellular receptor(s) responsible for the transport of poly-Arg peptides, suggesting
a common pathway responsible for the uptake of both compounds.
In collaboration with Peter Carmichael, fluorescence microscopy has been used
to examine the cellular localization of compounds (65) – (73). All of the
guanidinium-containing BODIPY-conjugates (66, 68, 72) and the fluorescein
versions of these molecules (70, 71, 73) are found, under these conditions, to
have diffuse, cytoplasmic and nuclear distributions (Figure 6.19 A, B, D). A
101 104102 103100
Fluorescence Intensity (530 nm)
Num
ber
ofC
ells
128
64
A)
101 104102 103100
Fluorescence Intensity (530 nm)
Num
ber
ofC
ells
128
64
B)

185
phase-contrasted reflected light image allows for detailed visualization of all cells
present in each field (Figure 6.20 E – H).
Figure 6.20: (A – D): Fluorescence emission microscopy of 10T1/2 cellsexposed to: (A) Guanidino Neo-Fl, (B) Guanidino Tobra-Fl, (C) Amino Tobra-Fl,and (D) Fl-CR9. For image (C) the sensitivity of detection is increased to allowimaging of the cellular localization of Amino Tobra-Fl. (A – D): Phase contrastmicroscopy of (E) Guanidino Neo-Fl, (F) Guanidino Tobra-Fl, (G) Amino Tobra-Fl, and (H) Fl-CR9. These particular images are made with the fluoresceinversions of these compounds (69 – 73), as binding of the BODIPY compounds tothe culture dishes made for poor fluorescence contrast.
Interestingly, the fluorescent aminoglycoside-conjugates appear to exhibit a
different cellular localization as compared to the guanidino-conjugates. The
fluorescent aminoglycoside-conjugates (65, 67, and 69) have punctate,
perinuclear localizations, which may correspond to acidic vesicles (Figure 6.20 C
& G). Confocal microscopy has been used to take optical cross sections through
cells that have been exposed to the guanidinium-containing BODIPY-conjugates
(66, 68, 72) and the fluorescein versions of these molecules (70, 71, 73); this
process confirms that these compounds are localized inside of cells (not shown).
A) B) C) D)
E) F) G) H)

186
The vesicular trafficking activities of these cells were also visually inspected over
time, and indicate that these compounds are accumulated by healthy living cells
(not shown). Similar experiments with other cell types, however, (including COS
and HeLa) suggest that the cellular localization, vesicular trafficking, and even
the toxicity of these compounds may change as a function of incubation time, cell
type, media, and the identity and concentration of the fluorescent transport
substrate used (not shown).
In summary, we have found that guanidinoglycosides show highly efficient
uptake into eukaryotic cell cultures via a similar mechanism as poly-Arginine.
Guanidino-neomycin exhibits a more efficient transport than the poly-Arginine
peptide BODIPY-CR9. Guanidinoglycosides may also provide other advantages
as transport substrates, including resistance to proteases, and serving as tools
for the elucidation of the currently unknown poly Arg transport mechanism(s).
Interestingly, a report on aminoglycoside-cholesterol conjugates recently
described the incorporation of these compounds into liposomal phospholipid
complexes capable of the delivery of DNA into living cells. They report, however,
that the guanidinylation of a kanamycin A-cholesterol conjugate actually
decreased its efficiency as a DNA delivery agent. Our preliminary results indicate
that 5 guanidinium groups are the minimum number needed to stimulate efficient
cellular uptake of the tobramycin – acridine conjugates (Table 6.9).

187
The conjugation of poly-arginine peptides to large molecules can facilitate the
transport of peptide, protein, and nucleic acid conjugates into cells.202 We were
interested, therefore, in synthesizing thiol-reactive guanidinoglycosides that can
be used for one-step conjugation reactions with various “cargo” molecules. The
pyridyl-disulfide activated compounds “Amino Neo-Pyridyl Disulfide” (74) and
“Guanidino Neo-Pyridyl Disulfide” (75) have recently been synthesized and
characterized (Figure 6.21). These compounds should, under aqueous or
methanolic conditions, readily form disulfide bonds with potential transport
substrates. Upon successful translocation of the transport conjugate, reductive
conditions inside of the cell should reduce the disulfide bond, thus releasing the
“cargo” molecule into the cytoplasm and nucleus of the cell.
Figure 6.21: Thiol-reactive amino- and guanidino-neomycin B derivatives showgood solubility in both water and methanol (see Sections E 6.8.3 and E 6.8.4 forsynthesis and characterization of 74 and 75).
O
R
RO
HOHO
OO
R
OH
R
OHO
HOO
S
HO
R
R
OS
Amino Neo-Pyridyl Disulfide (74)
Guanidino Neo-Pyridyl Disulfide (75)NH
NH
NH2
NH2
R Compound
N
S

188
6.9 Conclusions
RNA plays a pivotal role in the replication of all organisms, including viral and
bacterial pathogens. The development of small molecules that can selectively
interfere with undesired RNA activity is a promising new direction for drug
development. Continuing progress in the understanding of small molecule – RNA
recognition may provide future scientists a means for selective targeting of a pre-
determined RNA regulatory element.
Systematic studies of the binding interactions between small molecules and RNA
are essential for deciphering the parameters that govern RNA recognition. The
RRE affinity, specificity, and anti-viral activities of aminoglycosides, intercalating
agents, and metal complexes can be dramatically altered through synthetic
modifications. The synthesis of new ligands with high RNA affinity is relatively
easy compared to discovering new ligands with high specificity for the desired
target. The RRE affinity and specificity of every small molecule is not, however,
always proportional to its anti-HIV activity. Issues related to cellular uptake,
localization, and non-specific binding to other cellular components (especially
membranes) can dramatically affect the biological activities of small molecules.
We have found that guanidinoglycosides exhibit impressive cellular uptake and
desirable cellular localization. These compounds may, one day, prove
indispensable for the delivery of therapeutic agents.

189
Table E 1.0 Compound Source Index
Number Name(s) Source / Reference #
- RevFl (peptide) This thesis, Section E 2.1
- Rev-IA (peptide) This thesis, Section E 2.1
- Rev-TR (peptide) This thesis, Section E 2.1
- Fl-Rev (peptide) This thesis, Section E 2.1
- NH2-Rev (peptide) This thesis, Section E 2.1
(1) – (5) Aminoglycosides Commercially Available
(6) – (8) “Diphenyl furan” or “Aromatic diamindines” Profs. W.D. Wilson and D.W. Boykin83
(9) Λ-[Ru(bpy)2Eilatin]2+ Dr. Moshe Kol and Dalia Gut106
(10) ∆-[Ru(bpy)2Eilatin]2+ Dr. Moshe Kol and Dalia Gut106
(11) rac-[Ru(bpy)3]2+ Commercially Available
(12) ethidium bromide Commercially Available
(13) 9-amino acridine Commercially Available
(14) eilatin Moshe Kol101
(15) rac-[Ru(bpy)2pre-Eilatin]2+ P. Glazer (Tor lab)107
(16) 3-cbz ethidium This thesis, Section E 5.2.1
(17) 8-cbz ethidium This thesis, Section E 5.2.1
(18) 3,8-bis cbz ethidium This thesis, Section E 5.2.1
(19) 3-guanidino ethidium This thesis, Section E 5.2.2
(20) 8-guanidino ethidium This thesis, Section E 5.2.3
(21) 3,8-bis guanidino ethidium This thesis, Section E 5.2.4
(22) 3-urea ethidium This thesis, Section E 5.2.5
(23) 8-urea ethidium This thesis, Section E 5.2.6
(24) 3,8-bis urea ethidium This thesis, Section E 5.2.7
(25) 3-pyrrole ethidium This thesis, Section E 5.2.8

190
Table E 1.0 Compound Source Index (cont.)
(26) 8-pyrrole ethidium This thesis, Section E 5.2.8
(27) 3,8-bis pyrrole ethidium This thesis, Section E 5.2.9
(28) tetramethyl ethidium This thesis, Section E 5.2.10
(29) 3,8-diamino-6-phenylphenanthridine Commercially available; must desaltbefore use.
(30) 3,8-bis urea-pyrrolidine ethidium This thesis, Section E 5.2.11
(31) 3,8-bis-urea-ethylene diamine ethidium This thesis, Section E 5.2.12
(32) 3,8-bisurea-arginine ethidium This thesis, Section E 5.2.13
(33) 3,8-bisurea-2-DOS ethidium This thesis, Section E 5.2.14
(34) 8-urea-ethidium-6'-neamine Charles Liu (Tor lab)*
(35) 3-urea-ethidium-6'-neamine Charles Liu (Tor lab)*
(36) 8-urea-ethidium-6'-3'deoxyneamine This thesis, Section E 5.2.15
(37) 3-urea-ethidium-6'-3'deoxyneamine This thesis, Section E 5.2.16
(38) Neo-N-acridine This thesis, Section E 6.1.1
(39) Neo-S-acridine Sarah Kirk (Tor lab)177
(40) Neo-C-acridine This thesis, Section E 6.1.2
(41) Tobra-N-acridine This thesis, Section E 6.2.1
(42) KanaA-N-acridine Charles Liu (Tor lab)*
(43) Neo-Neo Hai Wang (Tor lab)180 and E 6.3.1
(44) Neo-N-Neo This thesis, Section E 6.3.2
(45) Tobra-Tobra Hai Wang (Tor lab)180
(46) Tobra-N-Tobra Charles Liu (Tor lab)*
(47) KanaA-KanaA Hai Wang (Tor lab)180
(48) – (52) Guanidinoglycosides Tracy Baker (Goodman lab)187
(53) Tobra-Arg This thesis, Section E 6.4.1
(54) ace-Tobra-Arg This thesis, Section E 6.4.2
(55) Kana-A-Dab This thesis, Section E 6.4.3

191
Table E 1.0 Compound Source Index (cont.)
(56) Kana-A-Lys This thesis, Section E 6.4.4
(57) γ-guanidino- Kana-A-Dab This thesis, Section E 6.4.5
(58) guanidino5-Tobra-N-acridine This thesis, Section E 6.5.1
(59) guanidino4-Tobra-N-acridine This thesis, Section E 6.5.1
(60) guanidino6-Neo-N-acridine This thesis, Section E 6.5.2
(61) guanidino5-Neo-N-acridine This thesis, Section E 6.5.2
(62) amino-Neo-Pt Jürgen Boer (Tor lab)197
(63) guanidino-Neo-Pt Jürgen Boer (Tor lab)197
(64) cisplatin Commercially Available
(65) amino-Tobra-BODIPY This thesis, Section E 6.7.1
(66) guanidino-Tobra-BODIPY This thesis, Section E 6.7.2
(67) amino-Neo-BODIPY This thesis, Section E 6.7.3
(68) guanidino-Neo-BODIPY This thesis, Section E 6.7.4
(69) amino-Tobra-Fluorescein This thesis, Section E 6.7.5
(70) guanidino-Tobra-Fluorescein This thesis, Section E 6.7.6
(71) guanidino-Neo-Fluorescein This thesis, Section E 6.7.7
(72) BODIPY-CR9 This thesis, Section E 6.8.1
(73) Fluorescein-CR9 This thesis, Section E 6.8.2
(74) amino-Neo-pyridyl disulfide This thesis, Section E 6.8.3
(75) guanidino-Neo-pyridyl disulfide This thesis, Section E 6.8.4
*Manuscript in preparation.

192
Table E 1.1 Summary of IC50 values (µµµµM)* for HIV-1 inhibition (x794LAI)Compound HeLa Plaque Assay** PBMC / p24**
tobramycin (3) >30 >10
neomycin B (5) >30 n.d.***
Λ-[Ru(bpy)2Eilatin]2+ (9) 0.8 1.4
∆-[Ru(bpy)2Eilatin]2+ (10) 2.0 n.d.***
rac-[Ru(bpy)3]2+ (11) >100 n.d.***
ethidium bromide (12) 0.2 n.d.***
rac-[Ru(bpy)2pre-Eilatin]2+ (15) 30 n.d.***
3-urea ethidium (22) 1.5 n.d.***
8-urea ethidium (23) 3.0 n.d.***
3,8-bis urea ethidium (24) 1.5 n.d.***
8-pyrrole ethidium (25) 1.5 n.d.***
8-urea-ethidium-6'-neamine (34) >10 n.d.***
3-urea-ethidium-6'-neamine (35) >10 n.d.***
neo-N-acridine (38) >10 n.d.***
tobra-N-acridine (41) >10 n.d.***
guanidino-tobramycin (50) 1 2
guanidino-neomycin B (52) 1 n.d.***
guanidino5-Tobra-N-acridine (58) 0.2 0.4
guanidino4-Tobra-N-acridine (59) n.d.*** >10
guanidino6-Neo-N-acridine (60) 1 2
amino-Neo-Pt (62) 0.01 n.d.***
guanidino-Neo-Pt (63) 0.1 n.d.***
cisplatin (64) 0.01 n.d.***
AZT 0.01 <0.001
* Errors do not exceed ± 70% of each reported value.** Conducted as described,110 at CFAR, UCSD.*** n.d. = not determined

193
E 2.0 Synthesis and Quantification of RRE Constructs
For the RRE66, T7 RNA polymerase was utilized for "run-off" in vitro transcription
with a complementary, 83-nt DNA template as described.203 Synthesis of the 83-
nt DNA template was carried out using standard phosphoramidite chemistry.
The DNA oligonucleotide was purified using denaturing polyacrylamide gel
electrophoresis (PAGE), followed by extraction into 200 mM potassium acetate /
10 mM EDTA and two rounds of ethanol precipitation (3 volumes of ethanol).
The sequence and homogeneity of the DNA template was confirmed using di-
deoxy sequencing techniques. Transcription products were also purified using
denaturing PAGE, extraction and multiple rounds of ethanol precipitation. The
expected sequence of the 66-nt RNA transcript was verified by 5' end labeling
with 32P and subsequent enzymatic digestions (RNase T1, A, and U2).177 The
molecular extinction coefficient (260 nm) for the RNA transcripts are calculated
by a summation of the number of each nucleotide multiplied by the number of
times it appears in the sequence (A = 15,400 cm-1 M-1, G = 11,700 cm-1 M-1, C =
7,300 cm-1 M-1 , U = 10,100 cm-1 M-1, T = 8,700 cm-1 M-1, I (inosine) = 7,200 cm-1
M-1, X (modified base of unknown extinction coefficient) = 11,125 cm-1 M-1) .
These values are the extinction coefficients for each nucleotide at 260 nm in
neutral water. In order for the calculated extinction coefficient for each transcript
to be accurate, the transcript must be first hydrolyzed into free nucleotides before
quantification. Procedure for hydrolysis: 1 µl of RNA solution is added to 10 µl of
1 M NaOH and heated 90 °C for 10 min. The reaction is quenched in 10 µl of 1 M
HCl and diluted into 500 µl of 50 mM sodium phosphate pH 7.5 for quantification

194
by spectrophotometry. By comparing the UV-vis absorbance spectrum of RRE 66
both before and after base hydrolysis, the extinction coefficient of the non-
hydrolyzed transcript can be calculated at 560,000 cm-1 M-1 (Figure E 2.0 and
Table E 2.0). Shorter RNA constructs (including RREJW and RREIIB) have been
purchased (Dharmacon Research Inc.), purified as above, and quantified with the
extinction coefficients in Table E 2.0. All RNAs were folded in neutral buffer by
heating at 90 °C for 3 min, then cooling to R.T. over 10 min. MALDI TOF is used
to confirm the expected masses of all RNA transcripts. Duplex nucleic acids are
purchased from either Sigma-Aldrich or Amersham-Pharmacia, dissolved in 10
mM Tris pH 7.5, 1 mM EDTA and quantified in their native form using the
reported extinction coefficients (summarized in reference #87 and the 2002
Amersham-Pharmacia catalog).
Figure E 2.0: UV-vis absorption spectra of RRE 66 before and after basehydrolysis, both spectra are taken in 50 mM sodium phosphate pH 7.5.
Wavelength (nm)
150 200 250 300 350 400 450
Abs
orba
nce
(uni
tless
)
-0.05
0.00
0.05
0.10
0.15
0.20
0.25
0.30RRE 66 before hydrolysisRRE 66 after base hydrolysis

195
Table E 2.0: Extinction coefficients (ε) used for quantification.
Nucleic Acid Base-hydrolyzedε (cm-1 M-1)
Not-hydrolyzedε (cm-1 M-1)
RRE 66 741,400 560,000
RRE IIB 515,000 331,000
RRE JW 371,000 267,000
3I RRE JW 358,000 267,000
deoxy-RRE JW n.d. 267,000
TAR 31 323,900 264,000
A-site 27 276,000 n.d.
tRNAPhe 859,400 733,000
tRNAMIX 11,125* 9,640*
Calf Thymus DNA n.d. 13,100**
Poly (dA) – Poly (dT) n.d. 12,200**
Poly (dG) – Poly (dC) n.d. 14,800**
Poly (dAT) – Poly (dAT) n.d. 13,300**
Poly (dGC) – Poly (dGC) n.d. 16,800**
Poly (rA) – Poly (rU) n.d. 14,280**
Poly (rG) – Poly (rC) n.d. 14,800**
Poly (rI) – Poly (rC) n.d. 10,000**
Poly (rA) n.d. 10,500*
Poly (rC) n.d. 6,200*
Poly (rU) n.d. 9,500*
Poly (dA) n.d. 8,600*
Poly (dT) n.d. 8,520*
Poly (rI) n.d. 10,200*
* = per base** = per base pair

196
Section E 2.1 Design and Synthesis of Rev Peptides
Both N-terminus and C-terminus modified Rev34-50 peptides were synthesized
and studied. Succinylation of the N-terminus, amidation of the C-terminus, and
addition of four alanines has been shown to increase the α helicity of the Rev
peptide, and thereby increase the affinity and specificity to the RRE.46 In our
case, these four alanines also serve as a spacer for subsequent fluorescein
modification.
N-terminus modified: NH2AAAATRQARRNRRRRWRERQRam
C-terminus modified: sucTRQARRNRRRRWRERQRAAAACam
Figure E 2.1: Modified Rev peptides based upon Rev34-50 (bold).
The N-terminus free amine of the "N-terminus modified" peptide is used for an
on-resin conjugation to fluorescein, resulting in “Fl-Rev” (Figure E 2.2). The "C-
terminus modified" peptides are first cleaved from the resin, purified, then the
Cys residue is used for a conjugation to fluorescein (resulting in “Rev-Fl”), or
conjugation to Texas Red (resulting in “Rev-TR”). For the non-fluorescent C-
terminus modified Rev peptide (“Rev-IA”), the C-terminal Cys is capped as a
thioether acetamide derivative (SCH2CONH2) to prevent dimerization (Figure E
2.2).

197
Figure E 2.2: Synthetic scheme for N-terminus and C-terminus modified Rev 34-50
peptides.
N-terminus modification:NH -AAAA-Rev34-50
Rink Amide ResinO
O2C
O O N
O
"Fl-Rev"
NH-AAAA-TRQARRNRRRRWRERQR-am
2
NH -AAAA-TRQARRNRRRRWRERQR-am
"NH -Rev"
cleavage from resinand purification
2
2
DMSO, 1hfollowed by cleavage
from resin and purification
OO
O
O
O2C
O
OO
OO O
O2C
N O
I
H
C-terminus modifications:
suc-Rev34-50AAAAC-amsynthesis, succinylation,
cleavage fronm resin, and purification
suc-TRQARRNRRRRWRERQRAAAAC-am
S
O OO
CO2
NOH
N O
I
H
Aq. Buffer(pH 8.0)
DMF
SH
suc-TRQARRNRRRRWRERQRAAAAC-am
S
H
"Rev-IA"
"Rev-Fl"
Aq. Buffer(pH 8.0)DMSO
NOH
H
“Rev-TR”
suc-TRQARRNRRRRWRERQRAAAAC-am
S
O N
SO3-
SO
O
HN
NHO
S
+N

198
Peptide synthesis was carried out using standard Fmoc/HBTU chemistry on ABI
Applied Biosystems 431A peptide synthesizer using protected amino acids
purchased from Calbiochem. Protected amino acids used in the synthesis were:
Fmoc-Arg-(Pbf)-OH, Fmoc-Asn-(Trt)-OH, Fmoc-Gln-(Trt)-OH, Fmoc-Trp-(Boc)-
OH, Fmoc-Thr-(tBu)-OH, Fmoc-Glu-(OtBu), and Fmoc-Cys-(Trt)-OH. For the C-
terminus modified peptide, the first peptide coupling was done manually to avoid
isomerization problems associated with Cys. Fmoc-Cys-(Trt)-OH was converted
into its symmetric anhydride by reaction with 0.45 equivalents of DCC in dry
methylene chloride for 10 min. The anhydride was separated from the DCU
precipitate by vacuum filtration and methylene chloride was subsequently
removed in vacuo. The solid anhydride was then dissolved in 30% N-
methylpyrrolidone (NMP) in DMF and added to deprotected Rink Amide MBHA
resin. The coupling lasted 2.5 hours at 25 °C and was monitored by ninhydrin
(Kaiser Test). Upon completion, the resin was washed with methylene chloride
followed by NMP, and loaded onto the ABI synthesizer. The remainder of the
peptide synthesis was carried out using standard HOBt/HBTU chemistry and
monitored with a built-in conductivity meter. For both peptides, the first round of
automated coupling reactions was done as a "double coupling" to ensure
efficiency. Upon completion of the automated synthesis, the N-terminus modified
resin was washed (with methylene chloride) and coupled to fluorescein by
reaction with ~100 equivalents of 5-carboxyfluorescein succimidyl ester
(Molecular Probes) in DMSO for 1 h at room temperature. The C-terminus
modified resin was washed with DMF and reacted with 0.3 M succinic anhydride,

199
0.3 M 1-hydroxybenztrizole hydrate, and 0.03 M DMAP in DMF, for 1 h at room
temperature. Both reactions were monitored using the Kaiser Test. Upon
completion of each reaction, the resin was washed (in methylene chloride) and
cleaved from the resin at room temperature for 2.5 h in a "cleavage cocktail"
containing 88% TFA, 5% water, 5% phenol, and 2% triisopropylsilane (v/v). The
filtrate was then mixed with 15 volumes of 2% acetic acid, and extracted 4 times
with diethyl ether. Crude peptides were purified on a C-18 semiprep HPLC
column with an isocratic mixture of either 19% or 14% acetonitrile (0.1% TFA) in
water (0.1% TFA) (for the fluorescein and non-fluorescein containing peptides
respectively). The purified peptides were lyophilized and the C-terminus
modified peptide was reacted with 100 equivalents of 5-iodoacetamidofluorescein
(or Texas Red C5 bromoacetamide) in 100 mM sodium phosphate (pH 8.0), 2
mM EDTA, and 30% (v/v) DMSO at room temperature in the dark for 2 h. Or,
separately, the purified C-terminus modified peptide was reacted with
iodoacetamide (85 mM in 75% DMF/water (v/v) and 20 mM HEPES, pH 8.0) at
25 °C in the dark for 2 h. The resulting peptides ("Rev-Fl", “Rev-TR”, and "Rev-
IA", respectively) were then purified on a C-18 semiprep HPLC column with an
mixture of acetonitrile (0.1% TFA) and water (0.1% TFA); isocratic conditions
were 19% acetonitrile for Rev-Fl, 30% acetonitrile for Rev-TR, and 14%
acetonitrile for Rev-IA. Electrospray mass spectrometry confirmed masses for
Fl-Rev (3,079 amu), NH2-Rev (2,721 amu), RevFl (3,312 amu), Rev-TR (3,656
amu), and Rev-IA (2,982 amu). Analytical HPLC confirmed a greater than 98%
purity for each peptide. Molecular extinction coefficients for the fluorescein

200
labeled peptides were taken as 73,500 cm-1 M-1 for Fl-Rev (498 nm), 77,000 cm-1
M-1 for Rev-Fl (498 nm), 115,000 for Rev-TR (586 nm) (based upon the extinction
coefficients of the free dyes). The extinction coefficients for un-labeled peptides
have been taken as 5,600 cm-1 M-1 for both NH2-Rev and Rev-IA (280 nm) (based
upon the presence of a single Trp residue.46 Amino acid analysis of Rev-IA
(complete acid hydrolysis, followed by ninhydrin modification, and HPLC
quantification of each amino acid compared the HPLC integration of known
concentration of a standard) suggests, however, that the extinction coefficient of
Rev-IA is closer to 9,600 cm-1 M-1. The average values of amino acid hydrolysis
and UV-absorbance (7,600 cm-1 M-1) have been used for these studies.
Section E 2.3 Evaluation of Rev Peptides
The C-terminus modified peptides are found to be superior to the N-terminus
peptides. Gel shift mobility assays indicate that perturbation of RRE affinity is
significantly worse when the N-terminus modified peptide is conjugated to
fluorescein compared to the addition of fluorescein to the C-terminus modified
peptide (not shown). Furthermore, upon binding the RRE, fluorescence
quenching of "Fl-Rev" is much more significant (~30%) than quenching of "Rev-
Fl" (~10%) (this makes Rev-Fl better suited for fluorescence anisotropy
experiments). These differences can be rationalized by examining the solution
structure of the Rev-RRE complex which shows the N-terminus of the Rev
peptide buried in the major groove of the RRE and the C-terminus free in
solution.53

201
Section E 3.0 Conditions for Peptide Displacement Binding Assays
All RevFl peptide displacement experiments (including those using the solid-
phase assay and fluorescence anisotropy) were conducted at 22 °C in a buffer
containing 30 mM HEPES (pH 7.5), KCl (100 mM), sodium phosphate (10 mM),
NH4OAc (10 or 20 mM), guanidinium HCl (10 or 20 mM), MgCl2 (2 mM), NaCl (20
mM), EDTA (0.5 mM), and Nonidet P-40 (0.001%). This complex mixture of
cations and anions is found to minimize the non-specific binding of ligands to the
Rev-RRE complex and to maximize the reversibility of the Rev-RRE interaction
(as evident in both anisotropy and solid-phase assays).
Section E 3.1 Fluorescence Anisotropy
In a Perkin Elmer LS-50B luminometer equipped with polarizing filters, 10 nM of
RevFl in buffer, is excited at 490 nm and its emission is monitored at 530 nm.
Maximum slit widths and a Gf value of 1.006 are used for taking, at least, 6
anisotropy values for each data point. A RevFl-RNA complex is then formed by
adding 10 nM, 100 nM, or 120 nM of the pre-folded RNA. Upon binding the RRE
or TAR, only minor changes in the emission spectrum of fluorescein were seen
(about 10% quenching of RevFl). We have, therefore, taken the change in
anisotropy as being directly proportional to the fraction of RevFl bound. Upon
titration of the inhibitor, sufficient mixing time must be provided to allow for
equilibrium to be reached. For compounds that bind through electrostatic
interactions, equilibrium is reached almost immediately. For compounds that

202
bind, primarily, through hydrophobic interactions, 1-2 minutes is sometimes
needed to reach equilibrium.
Ki values have been calculated, from IC50 values by considering the following
equation:
Upon mixing 10 nM of RRE66 with 10 nM of RevFl, the concentration of RevFl-
RRE complex [RevFl-RRE] = 5.8 nM, and the concentrations of free RRE and
free RevFl are each 4.2 nM. Upon reaching the IC50 of the titration, the
concentration of the complex [RevFl-RRE] = 2.9 nM, [I-RRE] = 5 nM, [RevFl] =
7.1 nM and the concentration of free inhibitor [I] = (IC50 value – [I-RRE]).
Therefore, at 10 nM of RRE, Ki = ((IC50 – 5 nM) / 4)). Upon mixing 100 nM of
RRE66 with 10 nM of RevFl, the concentration of complex [RevFl-RRE] = 9.6
nM, the concentration of free RRE = 90 nM and free RevFl is 0.4 nM . Upon
reaching the IC50 of the titration, the concentration of the complex [RevFl-RRE] =
4.8 nM, [I-RRE] = 94 nM, [RevFl] = 5.2 nM and the concentration of free inhibitor
[I] = (IC50 value – [I-RRE]). Therefore, at 100 nM of RRE, Ki = ((IC50 – 94 nM) /
34)). Upon mixing 120 nM of RRE66 with 10 nM of RevFl, the concentration of
+
[ RRE ] + [ RevFl ] [ RevFl - RRE ]
[ I ]
Ki
[ I - RRE ]
[ RevFl ]
Kd [ RevFl-RRE ]
[ I - RRE ]Ki =
[ I ]
Kd = nM

203
complex [RevFl-RRE] = 9.7 nM, the concentration of free RRE = 110 nM and free
RevFl is 0.3 nM . Upon reaching the IC50 of the titration, the concentration of the
complex [RevFl-RRE] = 4.9 nM, [I-RRE] = 114 nM, [RevFl] = 5.1 nM and the
concentration of free inhibitor [I] = IC50 value – [I-RRE]. Therefore, at 120 nM of
RRE, Ki = ((IC50 – 114) / 40)).
E 3.2 The Solid-Phase Assay
E 3.2.1 Synthesis of biotinylated 66-nt RRE
See Figure E 3.1 for a flow chart of biotin-RRE synthesis. The synthesis of the 5'
biotinylated RRE transcripts is a modification of the procedure described.175 To
generate RNA transcripts with a phosphorothioate 5'-end, 8 mM guanosine
monophosphorothioate (purchased from USB) was included in the transcription
reaction (along with 2 mM of each NTP), this approach was found to be more
efficient than the previously described method.175 T7 RNA polymerase was
utilized for "run-off" in vitro transcription with a complementary, 83-nt DNA
template as described (Section E 2.0). Transcripts with a phosphorothioate 5’
end were reacted with Iodoacetyl-LC-Biotin (purchased from Pierce) as
described,175 purified and quantified as described in E 2.0. Before use, RRE
transcripts were folded in a buffer containing 30 mM HEPES (pH 7.5), KCl (100
mM), MgCl2 (2 mM), and EDTA (0.5 mM) by heating to 90 °C and cooling to
room temperature.

204
Figure E 3.1: Synthesis of biotinylated RRE66.
E 3.2.1 Assembly of the Solid-Phase Immobilized Rev-RRE Complex
“ImmunoPure” beaded agarose covalently modified with stretavidin was
purchased from Pierce. Immediately before use, the resin is washed with 3
volumes of buffer (Section E 3.0) with gentle mixing (by inversion of the tube).
After each wash (4 total) the slurry of solid-support and buffer is gently
centrifuged (1,000 rpm 30 s) to settle the agarose beads, and the buffer removed
by pipette. Following the last wash, 500 µl of dilute biotinylated RRE (400 nM in
buffer) is added to 1 mL of a 40% slurry (400 µl of beads and 600 µl of buffer)
and immediately inverted to mix. The slurry is incubated at room temperature for
1.5 h with constant inversion for mixing. By monitoring absorbance of the
HN NH
S
O
O
HN
NH
I
O
HN NH
SO
HN
NH
SO
OP
O
O
SP
O
OO
O
DNA Template
5'3'
T7 Promoter (18 mer)
5'
RNA Transcript3'
GMPS, NTPsT7 RNA Polymerase
5'
5'3'
Aq. buffer (pH 8.0)DMF
Biotinylated RNA Transcript

205
supernatant at 260 nm, the efficiency of RRE immobilization is calculated. The
loading efficiency is >95% for biotinylated RRE and is <1% for non-biotinylated
RRE. Following RRE immobilization, 1 equivalent of RevFl is added, incubated
for 1 h, and the supernatant quantified for fluorescence intensity. Under these
conditions, non-specific binding of RevFl to the solid-support is not observed (as
determined by addition of RevFl to streptavidin-agarose which lacks immobilized
RRE). Since a linear relationship between fluorescence intensity and
concentration of RevFl can be established by a calibration of UV absorbance
versus fluorescence emission (Figure 3.1), the concentration of RevFl in the
supernatant (following incubation with the immobilized RRE) can be calculated
from its fluorescence intensity. It is found that under the above loading
conditions, ~85% of RevFl is bound by the immobilized RRE. The Kd of the
RevFl-RRE interaction on solid support is then calculated by assuming that 85%
of the RRE is bound by RevFl (which is confirmed by mixing a known volume of
gel with 8M guanidinum HCl and quantifying the amount of RevFl present on the
gel itself).
E 3.2.2 Conducting the Solid-Phase Assay
In 0.75 mL siliconized tubes, 200 µL of buffer (see Section E 3.0) is added,
followed by 30 µL of a 30% Rev-RRE slurry (at 0.5 pmole RRE/µL of gel). A
small volume of concentrated inhibitor and/or competitor is added, mixed gently,
and incubated at room temperature for 90 minutes with constant inversion for
mixing. The tube is then gently centrifuged (1,000 rpm for 30 s) to settle the

206
beads. 200 µL of supernatant is then added to 800 µL of “quantification buffer”
(4M guanidinium HCl, 250 mM Tris/HCl (pH 9.0), 250 mM KCl, 50 mM MgCl2,
0.01% Nonidet P-40), and quantified for fluorescence intensity (Perkin Elmer LS-
50B fluorimeter, maximum slit widths, Excitation 490 nm). For the maximum
signal control (Figure 3.8), 200 µL of 8M guanidinium HCl is added instead of
buffer. For inhibitors that interfere with emission of RevFl, the quantity of RevFl
remaining on the agarose beads is quantified by removing the supernatant (as
above) then washing the beads 2 times with 200 µL of isopropanol. After each
wash the mixture is gently centrifuged (1,000 rpm, 30 s) to settle the agarose
beads, and isopropanol removed by pipette. 200 µL of 8M guanidinium HCl is
then added to the beads, mixed, heated to 55 °C, mixed again, then centrifuged
to settle the agarose beads. 200 µL of supernatant is then added to 800 µL of
“quantification buffer” (see above) and quantified for fluorescence intensity (as
above).
E 3.2.3 Gel Shift Experiments
To address the discrepancies between IC50 values derived from the solid-phase
assay and those from fluorescence anisotropy, gel shift experiments were
conducted (Figure 3.9). A Rev-RRE complex was formed by mixing 10 nM RRE
(a fraction 5'-end labeled with 32P) with 80 nM “Rev-IA” (see above) in buffer
(Section E 3.0). This mixture was incubated at room temperature for 15 min then
9 µL aliquots were added to tubes containing 1 µL of a inhibitor solution, the
mixture was incubated for an additional 15 min at RT and loaded onto a native

207
17% polyacryamide gel. The running buffer and gel (1:29 bis:acrylamide) were
both at 1X TBE. The gel was run overnight at a constant 300 V and exposed to a
Molecular Dynamics Phosphor Screen and Phosphorimager™ 445 SI and
analyzed with Imagequant™ software (Molecular Dynamics).
E 3.3 Ethidium Bromide Displacement
A 1.25 µM solution of ethidium bromide is excited at 546 nm, and its fluorescence
emission is monitored at 605 nm before and after the addition of nucleic acids.
For the RRE and TAR constructs, 50 nM of each stand is used, for the polymeric
nucleic acids, 0.3 µM, 0.88 µM, or 11 µM of base pairs is used. Under these
conditions, only a small fraction of the ethidium bromide is bound (less than
20%). Inhibitors are then titrated until the fluorescence decrease reaches
saturation (Figure 3.12).
E 3.4 Direct Observation of Small Molecule Nucleic Acid Association : 9-Amino Acridine Fluorescence Anisotropy
Similar to E 3.1, a 20 nM solution of 9-aminoacridine, in buffer (Section E 3.0),
was excited at 400 nm and emission monitored 431 nm with maximum slit widths
and Gf set to 1.000. RRE 66 was then titrated. The fluorescence intensity of 9-
aminoacridine remains constant (111 arb. units) through out the titration.
Interestingly, under these conditions, the acridine-glycoside conjugates (38 – 42)
show significant quenching upon binding nucleic acids. The “direct” binding
isotherms for these compounds, therefore, are determined by monitoring the
changes in fluorescence intensity.

208
E 3.5 Direct Observation of Small Molecule Nucleic Acid Association :Thermal Denaturation:
Tm experiments are conducted with a Varian Cary 1E UV-vis spectrophotometer
equipped with a temperature control unit. 23 µM (base pairs) of Calf Thymus, in
buffer, is denatured at 0.5 °C/min and absorbance is monitored at 260 nm in
either the presence or absence of 10 µM of either 9 or 10. The temperature of
melting is taken at the inflection point of the transition.
E 3.5.1 Direct Observation of Small Molecule Nucleic Acid Association: 2-AP and the HH16 Ribozyme:
2-AP containing substrates were purchased from Dharmacon. All deprotected
RNA sequences were purified by preparative 20% denaturing polyacrylamide gel
electrophoresis and quantified as described (Section E 2.0). The following molar
extinction coefficient of 2-AP was taken as 1,000 cm-1M-1. RNAs were quantified
in 8 M urea instead of using base-hydrolysis. All HH16 experiments were
conducted at 37 °C in a buffer containing 50 mM Tris-HCl (pH 6.5–8.5) and NaCl
(0–500 mM), cleavage reactions contain 10 mM MgCl2. Fluorescence emission
measurements were taken by exciting the samples at 305 nm and monitoring
emission at 370 nm. Enzyme-substrate association experiments were conducted
in 3 mL solution of buffer (with no MgCl2) containing 20 nM of the 2-AP-
containing substrate. The fluorescence emission intensity of the substrate was
monitored upon titration of the 38-mer enzyme. A 5 minute equilibration time was
allowed after each addition of enzyme, before quantifying the emission intensity
of the substrate (Figure 3.18). Cleavage experiments were conducted in a
masked micro fluorescence cuvette thermoregulated at 37 °C. Buffered solutions

209
(35 µl) of the substrate and enzyme were denatured separately by heating to 90
°C for 90 sec and cooling to room temperature over 10 min to allow for refolding.
MgCl2 (10 mM) and inhibitors (when appropriate) were added to both the enzyme
and substrate and allowed to equilibrate at 37 °C for 5 min. The cleavage
reaction was then initiated by manually mixing the substrate with the enzyme in a
heat block or a fluorescence cuvette preheated to 37 °C. For all cleavage
experiments the final concentration of substrate and enzyme is 1.85 µM and 10.3
µM, respectively. Since cleavage is conducted under single-turnover conditions,
the pseudo first order rate constant k2 can be easily extracted from
measurements of the ribozyme’s initial rate of cleavage. Since the cleavage
reaction occurs within the hammerhead complex, it can be treated as a first order
intramolecular reaction. Rate constants (k2) were calculated as the slope of ln(1–
S/S0) vs. time, where S/S0 is the fraction of cleaved substrate. For experiments
utilizing a radioactively labeled substrate, S/S0 was determined by dividing the
amount of cleaved substrate by the sum of the full length and cleaved substrate.
The initial point (y0) of the fluorescently-monitored reactions was derived by fitting
the raw data to an exponential curve fit y = y0 + a(1 – e–bx), where y =
fluorescence intensity, a = the rise, b = the rate and x = time. The end point (f)
was separately determined by measuring the fluorescence of individually
synthesized cleavage products (P1 and P2) annealed to the enzyme (E) under
the same reaction conditions; hence S/S0 (fraction cleaved) = (y – y0)/(f – y0).
Using this method the percent cleavage after 20 min was essentially the same for
the radioactive- and fluorescence-generated data; both reactions were found to
210
reach 75% of completion. The IEC50 values (concentration of inhibitor leading to
a 50% reduction of ribozyme cleavage rate) were determined by measuring the
concentration of inhibitor needed to decrease the initial slope (between 30
seconds and two minutes) by 50%. The IEC50 values are used only for
comparative purposes and are not to be confused with actual k2 values.
E 4.0.1 Circular Dichroism of Metal Complexes
CD spectra were collected on an AVIV model 303A Circular Dichroism
Spectrometer using a 1cm pathlength quartz cell containing 50 mM sodium
phosphate pH 7.5. Spectra were collected with 16 µM of either 9 or 10 and these
spectra were corrected by subtraction of a “buffer-only” spectrum. The raw data
(ellipticity in mdeg) was converted into molar ellipticity ([Θ]) with the following
formula: [Θ] = Θ (mdeg) / (10*C*l)
Where C = concentration and l = path length in cm.
The units for [Θ] are deg * cm2 * decimole-1
E 4.0.2 HeLa Plaque Assay.
Two independent sets of duplicate points were collected at the CFAR, UCSD as
described.110 HT-6C cells were grown and assayed for plaque forming units
(PFUs), in Dulbecco's Modified Eagle's Medium containing: 10% fetal calf serum
(FCS), 2 mM glutamine, and 100 µg/mL penicillin and streptomycin. 9 and 10
were tested in the presence and absence of Polybrene© and the same IC50
values were measured. Cells were seeded in 24-well Falcon plates at 2.5 × 10⁴

211
cells/well and incubated overnight (37 oC in the presence of CO2). The HIV-1
strain LAI X794 was then added such that 70 ± 10 PFUs/well were apparent after
an additional 3 d incubation. Inhibitors were added 2 h following the addition of
HIV-1 and incubated (as above) for 3 d. Cells were then washed in MeOH and
stained with Crystal Violet (0.5% in H2O). Cell density and PFUs were counted
and compared to no-inhibitor controls. As a control, AZT is included in each
round of testing and consistently shows an IC50 value of approximately 0.01 µM.
E 4.0.3 PBMC Assay
Experiments were conducted at the CFAR, UCSD as described.110 Peripheral
blood monoocytes (PBMCs) were obtained from an HIV- negative human donor
and maintained in RPMI 1640 (Bio Wittaker Corp.) containing: 10% FCS,
100µg/ml pen/strep, 10 units/ml IL-2 and were stimulated with 3µg/ml PHA lectin
(Sigma) from 48 to 72 hours following isolation. The HIV-1 strain X794 LAI, is
then added to a 1/1000 multiplicity of infection, incubated for two hours at 37 °C
(in the presence of CO2), washed two times in PBS, resuspended in media
(above), and added to 96-well plates at 2x10⁵ cells per well. Inhibitor is then
added (pre-suspendended in media and filtered). Plates are then incubated an
additional 4 days and the concentration of p24 is measured for each sample and
compared to a no-drug controls. As a control, AZT was included and showed an
IC50 value of less than 0.001 µM.

212
E 4.0.4 Viscosity Experiments
A Cannon-Manning semi-micro size 75 viscometer was submerged in a glass
beaker and thermoregulated at 25.9 ± 0.1 °C. Concentrated stocks (10 mM) of
either ethidium (12) or rac-(9/10) were titrated into 0.5 mL buffered solutions (50
mM sodium phosphate pH 7.5) of CT DNA (0.5 mM bases). Flow times ranged
between 126.4 and 160.5 seconds depending the concentration of small
molecule. The η is the viscosity of the solution in the presence of a ligand, ηo is
the viscosity of the DNA-only solution. Viscosity is calculated as η = t – to where t
= time for the sample to flow through the viscometer and to is the time needed for
the buffer only.
E 4.0.5 UV-Vis Titrations
UV-vis spectra were collected using a Hewlett Packard 8452A diode array
spectrophotometer. 8 µM of either 9 or 10 in buffer (Section E 3.0) were
monitored as small volumes of concentrated nucleic acids were added. See E
2.0 for source and quantification of nucleic acids. The fractional change at
multiple wavelengths were averaged to calculate each IC50 value. Upon titration
of TAR31, RREJW, and tRNAPhe both 9 and 10 exhibited the same spectral
changes as observed for CT DNA (Figure 4.4). Significant diversity, however, is
observed in the magnitudes of red-shifting and the changes in epsilon upon
addition of the polymeric nucleic acids (especially for the single stranded
polymers):

213
ΛΛΛΛ-[Ru(bpy)2Eilatin]2+ / poly r[A]–r[U] ∆∆∆∆-[Ru(bpy)2Eilatin]2+ / poly r[A]–r[U]
ΛΛΛΛ-[Ru(bpy)2Eilatin]2+ / poly r[G]–r[C] ∆∆∆∆-[Ru(bpy)2Eilatin]2+ / poly r[G]–r[C]
ΛΛΛΛ-[Ru(bpy)2Eilatin]2+ / poly d[AT]–d[AT] ∆∆∆∆-[Ru(bpy)2Eilatin]2+ / poly d[AT]–d[AT]
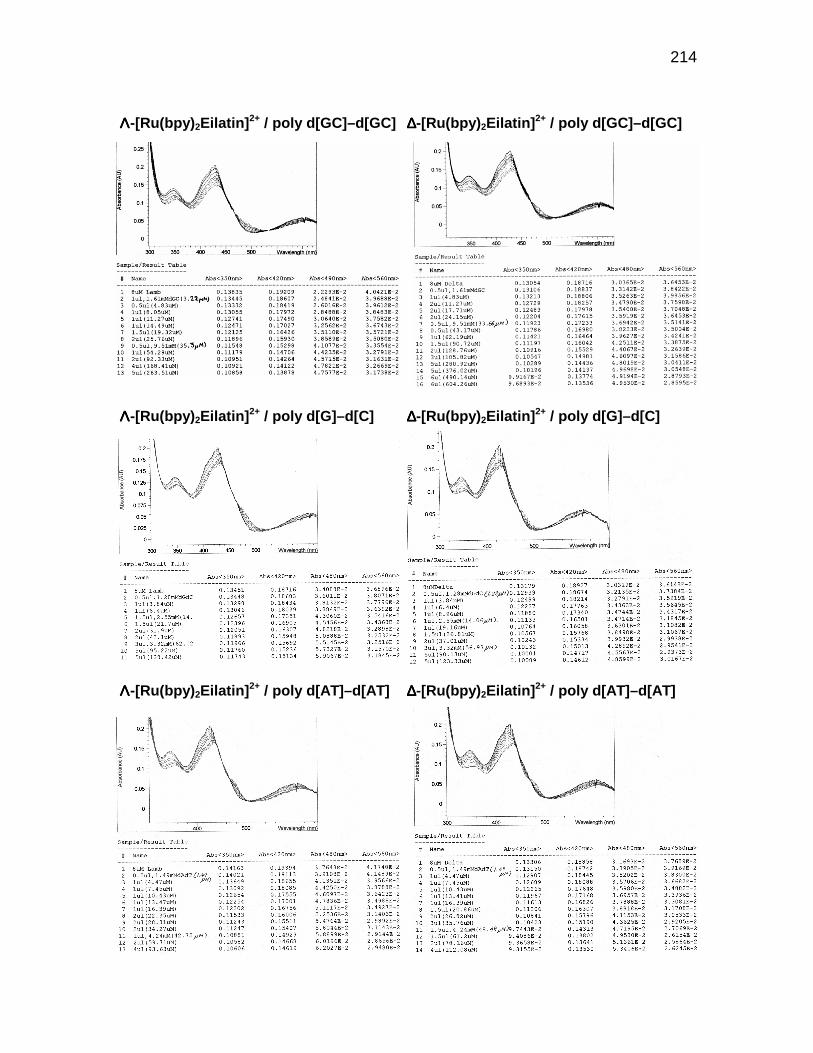
214
ΛΛΛΛ-[Ru(bpy)2Eilatin]2+ / poly d[GC]–d[GC] ∆∆∆∆-[Ru(bpy)2Eilatin]2+ / poly d[GC]–d[GC]
ΛΛΛΛ-[Ru(bpy)2Eilatin]2+ / poly d[G]–d[C] ∆∆∆∆-[Ru(bpy)2Eilatin]2+ / poly d[G]–d[C]
ΛΛΛΛ-[Ru(bpy)2Eilatin]2+ / poly d[AT]–d[AT] ∆∆∆∆-[Ru(bpy)2Eilatin]2+ / poly d[AT]–d[AT]

215
ΛΛΛΛ-[Ru(bpy)2Eilatin]2+ / poly r[I]–r[C] ∆∆∆∆-[Ru(bpy)2Eilatin]2+ / poly r[I]–r[C]
ΛΛΛΛ-[Ru(bpy)2Eilatin]2+ / poly r[A] ∆∆∆∆-[Ru(bpy)2Eilatin]2+ / poly r[A]
ΛΛΛΛ-[Ru(bpy)2Eilatin]2+ / poly r[U] ∆∆∆∆-[Ru(bpy)2Eilatin]2+ / poly r[U]

216
ΛΛΛΛ-[Ru(bpy)2Eilatin]2+ / poly r[C] ∆∆∆∆-[Ru(bpy)2Eilatin]2+ / poly r[C]
ΛΛΛΛ-[Ru(bpy)2Eilatin]2+ / poly r[G] ∆∆∆∆-[Ru(bpy)2Eilatin]2+ / poly r[G]
E 4.0.6 Thermal Denaturation Experiments
A Beckman Coulter DU 640 spectrophotometer equipped with a Peltier was used
to monitor buffered solutions (10 mM sodium phosphate pH 7.5, 1 mM MgCl2, 50
mM KCl) containing 30 µM (bases) of poly r(U), and/or 15 µM of either 9 or 10.
Heating was at the rate of 0.5 °C/min and all samples were monitored at 260 nm
(Figure 4.7).

217
E 4.0.7 Eilatin Titrations
In a Perkin Elmer LS-50B luminometer a dilute solution of eilatin (14) (0.1 µM) in
buffer (Section E3.0) was excited at 417 nm using maximum slit widths. The
emission of the solution was the monitored as small volumes of highly
concentrated nucleic acids are titrated (Figure 4.10).
E 5.1.1 Ethidium Chloride Crystal Structure
Ethidium chloride was crystallized by vapor infusion. In a test tube, ethidium was
mixed with chloroform, then methanol was added drop-wise until the ethidium
was fully dissolved. The tube was then sealed in a container containing diethyl
ether. Crystal growth was apparent after approximately 5-7 days. A trace of
bromide counter ion (13 %) was observed in place of chloride (87%).
Figure E 5.0: ORTEP drawing of ethidium chloride.

218
Table E 5.1: Crystallographic parameters for ethidium chloride.
Formula weight 389.34
Temperature 100(2) K
Wavelength 0.71073 Å
Crystal system Monoclinic
Space group P2(1)/n
Unit cell dimensions a = 9.6706(9) Å α= 90°.
b = 10.4323(10) Å β= 100.786(2)°.
c = 19.6144(19) Å γ = 90°.
Volume 1943.9(3) Å3
Z 4
Density (calculated) 1.330 Mg/m3
Absorption coefficient 0.535 mm-1
F(000) 820
Crystal size 0.644 x 0.199 x 0.156 mm3
Theta range for data collection 2.11 to 27.54°.
Index ranges -12<=h<=12, -12<=k<=13, -25<=l<=25
Reflections collected 16036
Independent reflections 4381 [R(int) = 0.0275]
Completeness to theta = 27.54° 97.6 %
Absorption correction None
Refinement method Full-matrix least-squares on F2
Data / restraints / parameters 4381 / 0 / 266
Goodness-of-fit on F2 1.051
Final R indices [I>2sigma(I)] R1 = 0.0375, wR2 = 0.0970
R indices (all data) R1 = 0.0432, wR2 = 0.1004
Largest diff. peak and hole 0.483 and -0.228 e.Å-3
E 5.1.2 3-Cbz Ethidium Chloride Crystal Structure
3-Cbz ethidium chloride (16) was crystallized by vapor infusion. In a test tube, it
was mixed with chloroform, then a few drops of methanol were added until 16

219
was fully dissolved. The tube was then sealed in a container containing diethyl
ether. Crystal growth was apparent after approximately 1-2 days.
Figure E 5.1: ORTEP drawing of 3-cbz ethidium chloride.
Figure E 5.1 ORTEP drawing of 3-cbz ethidium chloride.
Table E 5.2: Crystallographic parameters for 3-cbz ethidium chloride.
Formula weight 530.05
Temperature 100(2) K
Wavelength 0.71073 Å
Crystal system Monoclinic
Space group P2(1)/n
Unit cell dimensions a = 13.2854(17) Å α= 90°.
b = 10.5945(13) Å β= 90.567(2)°.
c = 18.976(2) Å γ = 90°.
Volume 2670.8(6) Å3
Z 4
Density (calculated) 1.318 Mg/m3
Absorption coefficient 0.181 mm-1
F(000) 1120
Crystal size 0.73 x 0.17 x 0.17 mm3
Theta range for data collection 1.86 to 27.50°.
Index ranges -17<=h<=17, -13<=k<=13, -24<=l<=23
Reflections collected 21640
Independent reflections 5982 [R(int) = 0.0315]

220
Completeness to theta = 27.50° 97.6 %
Absorption correction None
Max. and min. transmission 0.9700 and 0.8787
Refinement method Full-matrix least-squares on F2
Data / restraints / parameters 5982 / 0 / 348
Goodness-of-fit on F2 1.045
Final R indices [I>2sigma(I)] R1 = 0.0463, wR2 = 0.1265
R indices (all data) R1 = 0.0536, wR2 = 0.1333
Largest diff. peak and hole 1.047 and -0.387 e.Å-3
E 5.1.3 8-Cbz Ethidium Chloride Crystal Structure
8-Cbz ethidium chloride (17) was crystallized by vapor infusion. In a test tube, it
was mixed with chloroform, then a few drops of ethanol were added until 17 was
fully dissolved. The tube was then sealed in a container containing diethyl ether.
Crystal growth was apparent after approximately 1-2 days.
Figure E 5.2: ORTEP drawing of 8-cbz ethidium chloride.

221
Table E 5.2: Crystallographic parameters for 8-cbz ethidium chloride.Formula weight 603.35
Temperature 100(2) K
Wavelength 0.71073 Å
Crystal system Monoclinic
Space group P2(1)/c
Unit cell dimensions a = 12.6040(8) Å α= 90°.
b = 13.3162(9) Å β= 107.8060(10)°.
c = 17.4523(11) Å γ = 90°.
Volume 2788.8(3) Å3
Z 4
Density (calculated) 1.437 Mg/m3
Absorption coefficient 0.459 mm-1
F(000) 1248
Crystal size 0.47 x 0.11 x 0.10 mm3
Theta range for data collection 1.70 to 27.52°.
Index ranges -16<=h<=16, -17<=k<=17, -21<=l<=22
Reflections collected 23292
Independent reflections 6310 [R(int) = 0.0252]
Completeness to theta = 27.52° 98.3 %
Absorption correction None
Refinement method Full-matrix least-squares on F2
Data / restraints / parameters 6310 / 0 / 354
Goodness-of-fit on F2 0.951
Final R indices [I>2sigma(I)] R1 = 0.0418, wR2 = 0.1094
R indices (all data) R1 = 0.0464, wR2 = 0.1129
Extinction coefficient 0.0000(3)
Largest diff. peak and hole 0.538 and -0.364 e.Å-3

222
E 5.2.1 Cbz Protection of Ethidium:
8-Cbz ethidium · Cl (17), 3-cbz ethidium · Cl (16), and 3,8-bis cbz ethidium ·
Cl (18). Ethidium bromide containing 8% water (4.13 g, 9.64 mmoles) was
dissolved in 0.2 M sodium phosphate pH 6.6 (100 mL), acetone (80 mL) and
warmed to 32 °C. To this, a solution containing 1.43 mL of cbz chloride (10
mmoles, 1 equiv) in 20 mL of acetone was slowly added and the reaction
warmed to 40 °C for 20 min. AG1-X4 (Cl-) exchange resin was then added (20 g,
70 mmoles, 7 mequiv) and stirred 5 min, 40 °C. The slurry was loaded onto a
column containing another 20 g (7 mequiv) of AG1-X4 (Cl-) exchange resin and
the eluent collected. The resin was washed with 30 mL of 1:1 water/acetone, and
the eluents were combined and reduced to a solid under reduced pressure. The
products were separated on silica gel using three consecutive columns (8 – 10%
Br
N
HNH2N
ClO
Cl O
O
N
NH2HN
Cl
O
O
N
HN
HN
Cl
O
OO
O
ON
NH2H2N acetone/phosphate bufferpH 6.6
(1 equiv.)
ethidium bromide (12)
8-cbz ethidium chloride (17)
3-cbz ethidium chloride (16)
3,8-bis cbz ethidium chloride (18)
(50%)
(10%)
(4%)
+
+
+
+
-
-
-
-

223
MeOH / CH2Cl2, 5 – 12% MeOH / CH2Cl2, and 10% MeOH / CH2Cl2). The pure
fractions from each column were combined to yield : 2.3 g of the purple solid, 8-
cbz ethidium · Cl (17) (50%). Rf = 0.38 (20% MeOH / CHCl3).1H NMR (400
MHz, d6-DMSO, 25 °C): δ 10.31 (s, 1H), δ 8.83 (d, J = 9.6 Hz, 1H), δ 8.78 (d, J =
9.2 Hz, 1H), δ 8.11 (d,d J1 = 9.6 Hz, J2 = 1.6 Hz, 1H), δ 7.71-7.77 (m, 5H), δ 7.64
(d, J = 1.6 Hz, 1H), 7.44 (s, 1H), δ 7.36-7.42 (m, 6H), 6.66 (s, 2H), 5.08 (s, 2H), δ
4.49 (q, J = 7.2 Hz, 2H), δ 1.42 (t, J = 7.2 Hz, 3H). ESI MS calculated for
C29H26N3O2: 448.2, found 448.3 [M]+. UV-vis (50 mM sodium phosphate pH 7.5):
λmax (nm) and ε (cm-1M-1): 214 (3.4x10⁴), 286 (4.4x10⁴), 460 (4.5x10³). 0.48 g of
the orange-red solid, 3-cbz ethidium · Cl (16) (10%). Rf = 0.5 (20% MeOH /
CHCl3).1H NMR (400 MHz, d6-DMSO, 25 °C): δ 10.61 (s, 1H), δ 8.92 (d, J = 9.2
Hz, 1H), δ 8.76 (d, J = 9.2 Hz, 1H), δ 8.67 (s, 1H), δ 7.97 (d, J = 9.2 Hz, 1H), δ
7.72-7.79 (m, 5H), δ 7.58 (d,d J1 = 9.2 Hz, J2 = 2.2 Hz, 1H), δ 7.36-7.48 (m, 5H),
δ 6.38 (d, J = 2.2 Hz, 1H), 6.22 (s, 2H), 5.24 (s, 2H), δ 4.54 (q, J = 7.0 Hz, 2H), δ
1.45 (t, J = 7.0 Hz, 3H). ESI MS calculated for C29H26N3O2: 448.2, found 448.3
[M]+. UV-vis (50 mM sodium phosphate pH 7.5): λmax (nm) and ε (cm-1M-1): 212
(4.1x10⁴), 284 (5.6x10⁴), 454 (4.9x10³). 0.23 g of the yellow solid, 3,8-bis cbz
ethidium · Cl (18) (4%). Rf = 0.67 (20% MeOH / CHCl3).1H NMR (400 MHz, d6-
DMSO, 25 °C): δ 10.76 (s, 1H), δ 10.45 (s, 1H), δ 8.85 (d, J = 9.2 Hz, 1H), δ 9.03
(d, J = 9.2 Hz, 1H), δ 8.78 (s, 1H), δ 8.28 (d,d J1 = 9.2 Hz, J2 = 2.0 Hz, 1H), δ
8.10 (d, J = 9.2 Hz, 1H), δ 7.74-7.81 (m, 6H), δ 7.33-7.49 (m, 10H), δ 5.26 (s,

224
2H), 5.10 (s, 2H), δ 4.62 (q, J = 7.0 Hz, 2H), δ 1.49 (t, J = 7.2 Hz, 3H). ESI MS
calculated for C37H32N3O4 : 582, found 582 [M]+.
E 5.2.2 Synthesis of 3-Guanidino Ethidium Dichloride (19):
3-diBoc guanidino 8-Cbz ethidium · Cl. 8-cbz ethidium · Cl (17) (48 mg, 100
µmoles, DMF (4 mL), N,N’ bis BOC-S-methyl-isothiourea (145 mg, 500 µmoles, 5
equiv), and mercury dichloride (227 mg, 837 µmoles, 8.4 equiv) were combined
and sonicated. 2,4,6 collidine (177 µL, 1.34 mmoles, 13.3 equiv) was added
drop-wise and the reaction was stirred RT, 15 min with occasional sonication.
The reaction was then moved into CHCl3 (150 mL) and washed with 0.1 M citric
acid (4x40 mL), brine (40 mL), dried over sodium sulfate and concentrated to a
solid under reduced pressure. The product was purified on a short (2 in) silica gel
column (20 mL) using a gradient (0-5% MeOH/CHCl3) to yield 47 mg of a solid
S
HNN NHNHN
Cl
O
ONH
N
OO
OO
N
NH2HN
NH2
N
ClCl
H
H
DMF, HgCl2, collidine (70%)
6M HCl / MeOH (99%)
OO
OO
3-guanidino ethidium dichloride (19)
NHNH2N
Cl
O
O8-cbz ethidium chloride (17) 3-diBoc guanidino
8-cbz ethidium chloride
+ +- -
+-

225
yellow product (70%). 1H NMR (400 MHz, d6-DMSO, 25 °C): δ 11.32 (s, 1H), δ
10.51 (s, 1H), δ 10.44 (s, 1H), δ 9.23 (s, 1H), δ 9.06-9.09 (m, 2H), δ 8.26 (d, J =
9.2 Hz, 1H), δ 8.17 (d, J = 8.4 Hz, 1H), δ 7.77-7.80 (m, 7H), δ 7.35-7.38 (m, 5H),
δ 5.10 (s, 2H), δ 4.68 (q, J = 7.2 Hz, 2H), δ 1.33-1.56 (m, 19H).
3-Guanidino ethidium · 2HCl (19). 3-diBoc guanidino 8-cbz ethidium · Cl. (20
mg, 29 µmoles) was dissolved in methanol (2 mL), saturated HCl (2 mL) and
heated at 120 °C for 40 min. The reaction was then moved onto ice and 2 M
NaOH was added drop-wise until the yellow solution started to turn orange. The
solution was loaded directly onto an activated Water’s “Sep-pack” C-18 reversed
phase column (activated with 10 mL acetonitrile, 10 mL water) and washed with
water (5 mL), and the product was eluted with 20-30% acetonitrile/water (0.01M
HCl) and lyophilized to 13 mg (99%) of an orange solid. 1H NMR (300 MHz, d6-
DMSO, 25 °C): δ 10.61 (s, 1H), δ 9.01 (d, J = 9.0 Hz, 1H), δ 8.85 (d, J = 9.3 Hz,
1H), δ 8.34 (s, 1H), δ 7.74-7.91 (m, 10H), δ 7.62 (d,d J1 = 9.0 Hz, J2 = 2.1 Hz,
1H), δ 6.43 (d, J = 2.1 Hz, 1H), δ 6.35 (br s, 2H), δ 4.66 (q, J = 6.9 Hz, 2H), δ 1.43
(t, J = 7.1 Hz, 3H). FAB MS calculated for C22H22N5 : 356.1876, found 356.1892
[M]+. UV-vis (50 mM sodium phosphate pH 7.5): λmax (nm) and ε (cm-1M-1): 214
(3.3x10⁴), 284 (4.8x10⁴), 444 (4.1x10³).

226
E 5.2.3 Synthesis of 8-Guanidino Ethidium Dichloride (20):
8- diBoc guanidino 3-cbz ethidium · Cl. 3-cbz ethidium · Cl (16) (37 mg, 76
µmoles, DMF (4 mL), N,N’ bis BOC-S-methyl-isothiurea (112 mg, 290 µmoles,
3.8 equiv), and mercury dichloride (175 mg, 645 µmoles, 8.5 equiv) were
combined, sonicated, and 2,4,6 collidine (136 µL, 1.03 mmoles, 13.5 equiv) was
added drop-wise and the reaction was stirred at RT for 30 min with occasional
sonication. The reaction was them moved into CHCl3 (200 mL) and washed with
0.1 M citric acid (3x50 mL), brine (50 mL), dried over sodium sulfate and
concentrated to a solid under reduced pressure. The product was purified on a
short (2 in) silica gel column (20 mL) using a gradient (0-5% MeOH/CHCl3) to
yield 40 mg of a solid yellow product (76%). 1H NMR (300 MHz, d6-DMSO, 25
°C): δ 10.92 (s, 1H), δ 10.74 (s, 1H), δ 10.14 (s, 1H), δ 9.13 (d, J = 9.3 Hz, 1H), δ
9.04 (d, J = 9.3 Hz, 1H), δ 8.78 (s, 1H), δ 8.31 (d,d J1 = 9.0 Hz, J2 = 2.1 Hz, 1H),
S
HNNN
HN
HN
Cl
N
HNH2N
Cl
DMF, HgCl2, collidine (76%)
OO
OON
NH2HN
Cl
O
O
O
O HN
N
OO
O
O
H2N
N
Cl
H
H
6M HCl (95%)
8-guanidino ethidium dichloride (20)
8-diBoc guanidino3-cbz ethidium3-cbz ethidium (16)
+
+
+
-
-
-

227
δ 8.08 (d, J = 8.7 Hz, 1H), δ 7.85 (d, J = 2.1 Hz, 1H), δ 7.75-7.77 (m, 5H), δ 7.37-
7.49 (m, 5H), δ 5.26 (s, 2H), δ 4.59 (q, J = 6.3 Hz, 2H), δ 1.31-1.51 (m, 19H).
8-Guanidino ethidium · 2HCl (20). 8-diBoc guanidino 3-cbz ethidium · Cl. (6 mg,
8.7 µmoles) was dissolved in 6M HCl (2 mL) and heated to 100 °C for 1 hr. The
reaction was then moved onto ice and NaHCO3 was added until the yellow
solution turned orange. The solution was loaded directly onto an activated
Water’s “Sep-pack” C-18 reversed phase column (activated with 10 mL
acetonitrile, 10 mL water). The column was washed with 1M NaCl (5 mL), water
(5 mL) and the product eluted with 25% acetonitrile/water (0.01M HCl) and
lyophilized to 3.5 mg (95%) of an orange solid. 1H NMR (300 MHz, d6-DMSO, 20
°C): δ 10.28 (s, 1H), δ 8.91 (d, J = 9.6 Hz, 1H), δ 8.88 (d, J = 9.3 Hz, 1H), δ 8.02
(d,d J1 = 9.3 Hz, J2 = 2.1 Hz, 1H), δ 7.72-7.85 (m, 9H), δ 7.47 (s, 1H), δ 7.43 (d, J
= 8.7 Hz, 1H), 7.02 (d, J = 2.1 Hz, 1H), δ 6.78 (br s, 2H), δ 4.52 (q, J = 6.9 Hz,
2H), δ 1.43 (t, J = 6.9 Hz, 3H). FAB MS calculated for C22H22N5: 356.1876, found
356.1862 [M]+. UV-vis (50 mM sodium phosphate pH 7.5): λmax (nm) and ε (cm-
1M-1): 213 (2.8x10⁴), 242 (1.5x10⁴), 288 (3.6x10⁴), 453 (4.4x10³).

228
E 5.2.4 Synthesis of 3,8-bis Guanidino Ethidium Dichloride (21):
3,8-bis Guanidino ethidium · 2HCl (21). Ethidium bromide / 8% water (12) (30
mg, 70 µmoles) was dissolved in DMF (3 mL), brought to 0 °C, and N, N’ bis
BOC-S-methyl-isothiourea (180 mg, 620 mmoles, 4.4 mequiv), mercury
dichloride (282 mg, 1.04 mmoles, 7.4 mequiv) and 2,4,6 collidine (220 µL, 1.67
mmoles, 12 mequiv) were added. The reaction was slowly warmed to RT, stirred
for an additional 12 h., then diluted into 150 mL CHCl3 and washed with 0.1 M
citric acid (3x50 mL), 50 g/L of EDTA (40 mL), brine (40 mL) dried over sodium
sulfate and concentrated to a solid under reduced pressure. Silica gel (40 mL)
was used to purify the BOC-protected product (1.5 – 5% MeOH / CHCl3) to yield
40 mg of a yellow solid. All of the product was then deprotected by adding TFA (4
mL, containing 2.5 % (v/v) of triisopropyl silane) and mixing for 1 hr at RT, it was
then diluted into 150 mL water and washed with diethyl ether (3x40 mL) and
CHCl3 (3x40 mL). The aqueous phase was concentrated to a solid, then
dissolved in water (5 mL) and treated with 1.5 g of AG1-X4 (Cl-) exchange resin
(20 g, 5.2 mmoles, 74 mequiv) for 5 min RT. and filtered over an activated
Water’s “Sep-pack” C-18 reversed phase column (activated with 10 mL
acetonitrile, 10 mL water), the remainder of the product eluted from the column
S
HNNN
HN
HN
Cl
DMF, HgCl2, collidineOO
OO
3,8-bis guanidino ethidium dichloride (21)
N
NH2H2NH2N
N
Cl
H
H
Br
NH2
N
H
2) TFA/TIPS (76% 2 steps)
1)
Ethidium bromide (12)
++
- --
+

229
using 20% acetonitrile / water and lyophilized to 25 mg of a yellow solid (76%).
1H NMR (300 MHz, D2O, 25 °C): δ 8.90 (d, J = 9.0 Hz, 1H), δ 8.83 (d, J = 9.3 Hz,
1H), δ 8.22 (d, J = 1.8 Hz, 1H), δ 7.96 (d,d J1 = 8.7 Hz, J2 = 2.1 Hz, 1H), δ 7.84
(d,d J1 = 9.0 Hz, J2 = 1.8 Hz, 1H), δ 7.57-7.65 (m, 3H), δ 7.42-7.46 (m, 2H), 7.32
(d, J = 2.4 Hz, 1H), δ 4.73 (q, J = 7.2 Hz, 2H), δ 1.39 (t, J = 7.2 Hz, 3H). ESI MS
calculated for C23H24N7: 398.2, found 398.3 [M]+. UV-vis (50 mM sodium
phosphate pH 7.5): λmax (nm) and ε (cm-1M-1): 213 (3.6x10⁴), 278 (5.4x10⁴), 398
(5.0x10³).
E 5.2.5 Synthesis of 3-Urea Ethidium Chloride (22)
Ethidium Activation for Urea Formation:
3-Phenoxycarbamate 8-cbz ethidium · H2PO4. 8-cbz ethidium · Cl (17) (180
mg, 372 µmoles), acetone (12 mL), and 500 mM sodium phosphate pH 6.6 (4
mL) were combined and phenyl chloroformate (200 µL, 1.58 mmoles, 4.2
mequiv, diluted into 2 mL of acetone) was added drop-wise and stirred for 2h at
RT. Water (5 mL) was then added drop-wise and the precipitate was collected by
vacuum filtration. The precipitate was then washed with water (10 mL), 3:1 water
/ acetone (10 mL) and eluted from the filter with methanol (200 mL). The
N
HNH2N
Cl
O
O
O
ClO
N
HNN
H
H2PO4
O
O
O
O
8-cbz ethidium (17)3-phenoxy carbamate8-cbz ethidium phosphate
acetone/ phosphatebuffer pH 6.6 (90%)
+
+
-
-
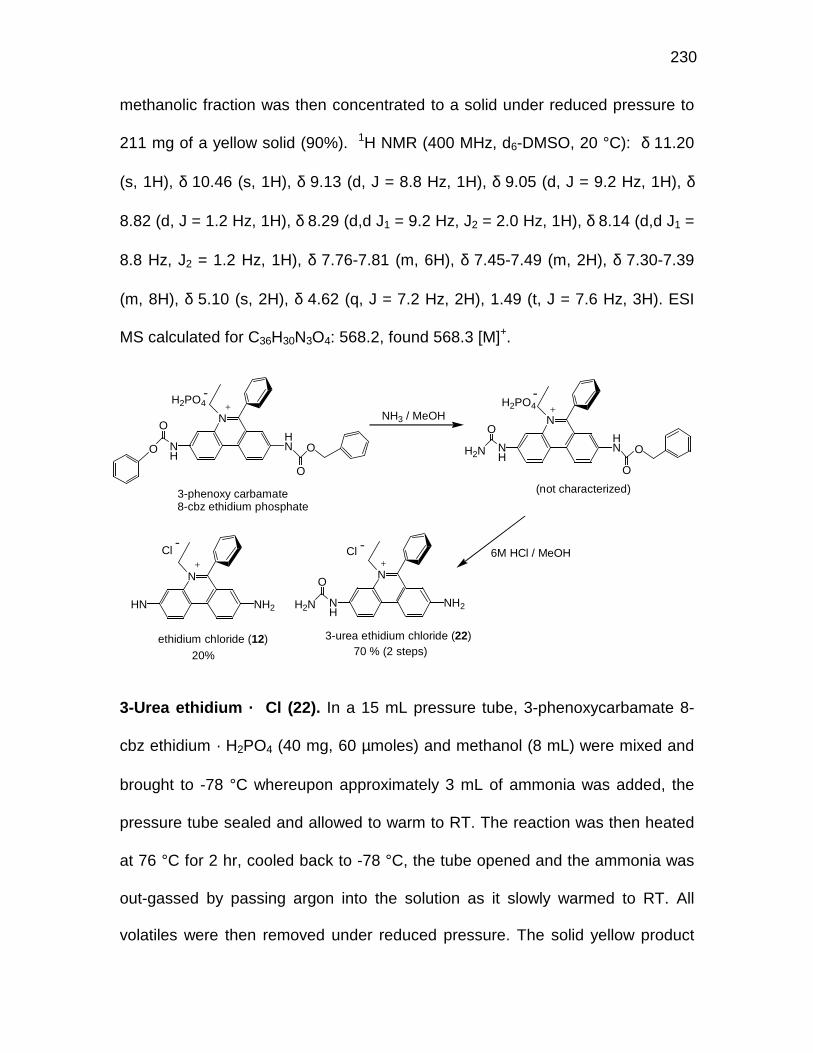
230
methanolic fraction was then concentrated to a solid under reduced pressure to
211 mg of a yellow solid (90%). 1H NMR (400 MHz, d6-DMSO, 20 °C): δ 11.20
(s, 1H), δ 10.46 (s, 1H), δ 9.13 (d, J = 8.8 Hz, 1H), δ 9.05 (d, J = 9.2 Hz, 1H), δ
8.82 (d, J = 1.2 Hz, 1H), δ 8.29 (d,d J1 = 9.2 Hz, J2 = 2.0 Hz, 1H), δ 8.14 (d,d J1 =
8.8 Hz, J2 = 1.2 Hz, 1H), δ 7.76-7.81 (m, 6H), δ 7.45-7.49 (m, 2H), δ 7.30-7.39
(m, 8H), δ 5.10 (s, 2H), δ 4.62 (q, J = 7.2 Hz, 2H), 1.49 (t, J = 7.6 Hz, 3H). ESI
MS calculated for C36H30N3O4: 568.2, found 568.3 [M]+.
3-Urea ethidium · Cl (22). In a 15 mL pressure tube, 3-phenoxycarbamate 8-
cbz ethidium · H2PO4 (40 mg, 60 µmoles) and methanol (8 mL) were mixed and
brought to -78 °C whereupon approximately 3 mL of ammonia was added, the
pressure tube sealed and allowed to warm to RT. The reaction was then heated
at 76 °C for 2 hr, cooled back to -78 °C, the tube opened and the ammonia was
out-gassed by passing argon into the solution as it slowly warmed to RT. All
volatiles were then removed under reduced pressure. The solid yellow product
N
HNN
H
H2PO4
O
O
O
O N
HNN
HO
O
H2N
O
H2PO4
N
NH2NH
H2N
ON
NH2HN
ClCl
NH3 / MeOH
70 % (2 steps)
3-phenoxy carbamate8-cbz ethidium phosphate
6M HCl / MeOH
(not characterized)
20%
3-urea ethidium chloride (22)ethidium chloride (12)
++
++
--
- -

231
was then deprotected with of 1:1 methanol / saturated HCl (8 mL) by heating at
96 °C for 1 hr. The reaction was then concentrated to a solid under reduced
pressure and purified by reversed-phase chromatography (C-18 silica gel 60).
The column was conditioned with methanol, water, and the crude product was
then loaded in water (0.01M HCl) and a methanol gradient (0-10% methanol /
water (0.01M HCl)) was used to separate ethidium chloride (elutes first) from the
desired product (elutes second) to yield 16.5 mg of an orange solid (70%). 1H
NMR (400 MHz, d6-DMSO, 20 °C): δ 9.58 (s, 1H), δ 8.83 (d, J = 9.2 Hz, 1H), δ
8.75 (d, J = 1.2 Hz, 1H), δ 8.73 (d, J = 9.2 Hz, 1H), δ 7.85 (d,d J1 = 9.2 Hz, J2 =
2.0 Hz, 1H), δ 7.73-7.78 (m, 5H), δ 7.57 (d,d J1 = 8.8 Hz, J2 = 2.4 Hz, 1H), δ 6.35
(d, J = 2.0 Hz, 1H), 6.29 (br s, 2H), 6.04 (br s, 2H), δ 4.53 (q, J = 7.6 Hz, 2H), δ
1.45 (t, J = 7.0 Hz, 3H). ESI MS calculated for C22H21N4O: 357.2, found 357.3
[M]+. UV-vis (50 mM sodium phosphate pH 7.5): λmax (nm) and ε (cm-1M-1): 214
(2.4x10⁴), 284 (3.5x10⁴), 458 (3.1x10³).
E 5.2.6 Synthesis of 8-Urea Ethidium Chloride (23):
Ethidium Activation for Urea Formation:
O
ClO
acetone/ phosphatebuffer pH 6.6 (79%)
N
NH2HN
Cl
O
O
3-cbz ethidium (16)
N
NH
HNO
O
O
O
3-cbz 8-phenoxycarbamateethidium phosphate
H2PO4 ++-
-

232
3-Cbz 8-phenoxycarbamate ethidium · H2PO4. 3-cbz Ethidium · Cl (16) (180
mg, 372 µmoles), acetone (10 mL), and 500 mM sodium phosphate pH 6.6 (4
mL) were combined and phenyl chloroformate (200 µL, 1.58 mmoles, 4.2
mequiv, diluted into 2 mL of acetone) was added drop-wise and stirred for 30 min
at RT. Water was then added (6 mL) drop-wise and the precipitate collected by
vacuum filtration and washed with water (20 mL). The precipitate was dried
under reduced pressure for 30 min to yield 195 mg (79%) of a yellow solid. 1H
NMR (300 MHz, d6-DMSO, 20 °C): δ 10.88 (s, 1H), δ 10.74 (s, 1H), δ 9.11 (d, J =
9.3 Hz, 1H), δ 9.07 (d, J = 9.0 Hz, 1H), δ 8.29 (d,d J1 = 9.0 Hz, J2 = 1.8 Hz, 1H), δ
8.09 (d, J = 8.4 Hz, 1H), δ 7.74-7.76 (m, 5H), δ 7.37-7.49 (m, 7H), δ 7.16-7.29 (m,
3H), δ 5.26 (s, 2H), δ 4.62 (q, J = 7.5 Hz, 2H), 1.49 (t, J = 7.2 Hz, 1H). ESI MS
calculated for C36H30N3O4: 568.2, found 568.3 [M]+.
8-Urea ethidium · Cl (23). In a 15 mL pressure tube, 3-cbz 8-phenoxy-
carbamate ethidium · H2PO4 (45 mg, 67 µmoles) and methanol (8 mL) were
N
HNN
H
H2PO4
O
O
O N
HNN
HNH2
O
O
H2PO4
N
HNH2N
N
NH2HN
ClCl
NH3 / MeOH
80 %
3-cbz 8-phenoxy carbamateethidium phosphate
6M HCl / MeOH
(not characterized)
10%
8- urea ethidium chloride (23)ethidium chloride (12)
O O
NH2
O
++
++
--
- -

233
mixed and brought to -78 °C whereupon approximately 2 mL of ammonia was
added, the pressure tube sealed and allowed to warm to RT. The reaction was
then heated at 80 °C for 1 hr, cooled back to -78 °C, the tube opened and the
ammonia was out-gassed by passing argon into the solution as it slowly warmed
to RT. All volatiles were then removed under reduced pressure. The solid yellow
product was then deprotected with of 10 mL of 1:1 methanol / saturated HCl and
heating to 96 °C for 1 hr. The reaction was then concentrated to a solid under
reduced pressure and purified by reversed-phase chromatography (C-18 silica
gel 60). The column was conditioned with methanol, water, and the crude
product was loaded in 2% methanol / water (0.01M HCl) and a methanol gradient
(2-10% methanol / water (0.01M HCl)) was used to separate ethidium chloride
(elutes first) from the desired product (elutes second), to afford 21 mg of an
orange solid (80%). 1H NMR (300 MHz, d6-DMSO, 20 °C): δ 9.12 (s, 1H), δ 8.76
(d, J = 9.0 Hz, 2H), δ 8.22 (d,d J1 = 9.0 Hz, J2 = 2.1 Hz, 1H), δ 7.71-7.77 (m, 5H),
δ 7.33-7.39 (m, 5H), δ 6.55 (br s, 2H), 5.97 (br s, 2H), δ 4.48 (q, J = 7.2 Hz, 2H),
δ 1.41 (t, J = 6.9 Hz, 3H). ESI MS calculated for C22H21N4O: 357.2, found 357.3
[M]+. UV-vis (50 mM sodium phosphate pH 7.5): λmax (nm) and ε (cm-1M-1): 286
(4.9x10⁴), 464 (4.7x10³).

234
E 5.2.7 Synthesis of 3,8-bis Urea Ethidium Chloride (24)
Ethidium Activation for Urea Formation:
3,8-bis Phenoxycarbamate ethidium · H2PO4. Ethidium bromide / 8% water
(200 mg, 466 µmoles), 500 mM sodium phosphate pH 6.6 (5 mL), and acetone (8
mL) were combined and phenyl chloroformate (587 µL, 4.66 mmoles, 5 mequiv,
pre-dissolved in 2.5 mL acetone) was added drop-wise. The reaction preceded
10 min. RT. then cooled to -80 °C, and vacuum filtered to collect the precipitate.
The precipitate was washed with 20% acetone / water (10 mL), 100% acetone
(-80 °C, 10 mL), and dried under reduced pressure to yield 300 mg (98%) of a
yellow solid. 1H NMR (400 MHz, d6-DMSO, 20 °C): δ 11.36 (s, 1H), δ 10.98 (s,
1H), δ 9.17 (d, J = 9.2 Hz, 1H), δ 9.12 (d, J = 8.8 Hz, 1H), δ 8.87 (s, 1H), δ 8.36
(d,d J1 = 9.2 Hz, J2 = 2.0 Hz, 1H), δ 8.22 (d, J = 9.2 Hz, 1H), δ 7.85 (d, J = 2.4
Hz, 1H), δ 7.77 (s, 5H), δ 7.38-7.50 (m, 4H), δ 7.24-7.43 (m, 4H), δ 7.15-7.19 (m,
2H), δ 4.64 (q, J = 7.6 Hz, 2H), 1.48 (t, J = 7.2 Hz, 3H). ESI MS calculated for
C36H30N3O4: 554.2, found 554.3 [M]+.
O
ClON
NH2HN
Br
acetone/ phosphatebuffer pH 6.6 (98%)
ethidium bromide (12)
N
HN
HN
H2PO4
O
O
O
O
3,8-bis phenoxycarbamateethidium phosphate
-+
+-

235
3,8-bis urea ethidium · Cl (23). In a 15 mL pressure tube, 3,8-bis
phenoxycarbamate ethidium · H2PO4 (48 mg, 74 µmoles) and methanol (10 mL)
were mixed and brought to -78 °C whereupon approximately 2 mL of ammonia
was added, the pressure tube sealed and allowed to warm to RT. The reaction
was then heated at 80 °C for 1 hr, cooled back to -78 °C. The tube opened and
the ammonia was out-gassed by passing argon into the solution as it slowly
warmed to RT. All volatiles were then removed under reduced pressure. The
solid product was washed in diethyl ether (2x20 mL) then dissolved in 20%
acetonitrile / water and treated with AG1-X4 (Cl-) exchange resin (1 g, 3.5
mmoles, 47 mequiv) for 5 min. RT. The resin was removed by filtration, and the
solution lyophilized to yield 32 mg (99%) of a yellow solid. 1H NMR (300 MHz, d6-
DMSO, 20 °C): δ 9.76 (s, 1H), δ 9.34 (s, 1H), δ 8.97 (d, J = 9.3 Hz, 1H), δ 8.92
(d, J = 9.3 Hz, 1H), δ 8.85 (d, J = 1.2 Hz, 1H), δ 8.30 (d,d J1 = 9.3 Hz, J2 = 2.4
Hz, 1H), δ 7.93 (d,d J1 = 9.3 Hz, J2 = 1.2 Hz, 1H), δ 7.74-7.78 (m, 5H), δ 7.55 (d,
J = 2.1 Hz, 1H), δ 6.36 (s, 2H), 6.05 (s, 2H), δ 4.58 (q, J = 7.8 Hz, 2H), δ 1.48 (t, J
= 6.9 Hz, 3H). ESI MS calculated for C23H22N5O2: 400.2, found 400.3 [M]+. UV-vis
N
HN
Cl
(99%)3,8-bis urea ethidium chloride (23)
NH2
O
+
-
N
HN
HN
H2PO4
O
O
O
O
3,8-bis phenoxycarbamateethidium phosphate
-+
HNH2N
O
NH3 / MeOH

236
(50 mM sodium phosphate pH 7.5): λmax (nm) and ε (cm-1M-1): 280 (4.3x10⁴),
434 (3.6x10³).
E 5.2.8 Synthesis of the Mono-Pyrrole Ethidium Derivatives 25 & 26:
3-Pyrrole ethidium · TFA (25), and 8- pyrrole ethidium · TFA (26). A mixture
(5:1 respectively) of 8-cbz ethidium · Cl (17) and 3-cbz ethidium · Cl (16) (90 mg,
186 µmoles) was added to glacial acetic acid (4 mL), heated to 120 °C, and 3
additions (15 minutes apart) of dimethoxy-tetrahydrofuran (3x15 µL, 348 µmoles
total, 1.87 mequiv) were added over 30 min and the reaction was kept at 120 °C
for an additional 45 min then cooled to RT, diluted into CHCl3 (100 mL), and
washed with saturated sodium bicarbonate (3x50 mL), brine (50 mL), dried over
sodium sulfate, and concentrated to a solid under reduced pressure. The mixture
of cbz-protected products was purified using a neutral alumina column using pure
acetone as an eluent and concentrated to a yellow solid. This mixture was
carried over, directly to the next step. Deprotection was conducted in a 3 : 1 mix
N
HNH2N
Cl
O
O
N
NH2HN
Cl
O
O
8-cbz ethidium (17)
3-cbz ethidium (16)
O OO
acetic acid, 100 oC
H2 / Pdo
N
NH2N
N
NH2N
TFA
TFA
3-pyrrole ethidium (25)
8-pyrrole ethidium (26)
+
+
+
+
-
--
-

237
of methanol/acetic acid (4 mL), with Pd black (30 mg), and rigorously stirring
under 1 atm of H2 for 3 hr RT. The catalyst was removed by centrifugation, and
the solution concentrated to an orange solid under reduced pressure. The
products separated using a reversed phase C-18 semi-prep column using 38%
acetonitrile / water (0.1% TFA) to yield 14.6 mg (18%) of 3-pyrrole ethidium ·
TFA (25) (Rt = 13.8 min). 1H NMR (400 MHz, D2O, 20 °C): δ 8.43 (d, J = 9.2 Hz,
1H), δ 8.31 (d, J = 9.2 Hz, 1H), δ 7.87 (d, J = 1.6 Hz, 1H), δ 7.70 (d,d J1 = 9.2 Hz,
J2 = 1.6 Hz, 1H), δ 7.60-7.67 (m, 3H), δ 7.42 (d,d J1 = 9.2 Hz, J2 = 2.4 Hz, 1H), δ
7.30-7.32 (m, 2H), δ 7.19 (ab quart, Japp = 2.0 Hz, 2H), δ 6.52 (d, J = 2.4 Hz, 1H),
δ 6.29 (ab quart, Japp = 2.0 Hz, 2H), δ 4.61 (q, J = 7.2 Hz, 2H), δ 1.30 (t, J = 7.0
Hz, 3H). FAB MS calculated for C25H22N3: 364.1814, found 364.1823 [M]+. UV-vis
(50 mM sodium phosphate pH 7.5): λmax (nm) and ε (cm-1M-1): 223 (2.8x10⁴),
287 (4.7x10⁴), 453 (4.0x10³). 8-pyrrole ethidium · TFA (26) (3.3 mg (4%)), (RT
= 18.1 min). 1H NMR (400 MHz, D2O, 20 °C): δ 8.42 (d, J = 9.2 Hz, 1H), δ 8.40
(d, J = 8.8 Hz, 1H), δ 7.86 (d,d J1 = 9.2 Hz, J2 = 2.0 Hz, 1H), δ 7.61-7.71 (m, 3H),
δ 7.36-7.37 (m, 2H), δ 7.29 (d, J = 1.2 Hz, 1H), δ 7.24 (d,d J1 = 8.8 Hz, J2 = 1.2
Hz, 1H), δ 6.99 (d, J = 2.4 Hz, 1H), δ 6.84 (ab quart, Japp = 2.0 Hz, 2H), δ 6.13 (ab
quart, Japp = 2.0 Hz, 2H), δ 4.49 (q, J = 7.6 Hz, 2H), δ 1.30 (t, J = 7.6 Hz, 3H).
FAB MS calculated for C25H22N3: 364.1814, found 364.1822 [M]+. UV-vis (50 mM
sodium phosphate pH 7.5): λmax (nm) and ε (cm-1M-1): 223 (2.1x10⁴), 239
(1.4x10⁴), 289 (4.8x10⁴), 466 (4.1x10³).

238
E 5.2.9 Synthesis of 3,8-bis Pyrrole Ethidium Acetate (27):
3,8-bis pyrrole ethidium · Ac (27). Ethidium bromide / 4% water (264 mg, 670
µmoles) and glacial acetic acid (10 mL) were brought to 130 °C and 2 additions
(15 minutes apart) of dimethoxy tetrahydrofuran (2x110 µL, 1.65 mmoles total,
2.5 equiv) were added and the reaction was kept under reflux (at 130 °C) for an
additional 1h and cooled to RT. All volatiles were then removed under reduced
pressure, and the solid was dissolved in methanol (~40 mL) and filtered over a
plug of silica gel (~30 mL), the gel was washed with methanol (~60 mL), and the
methanolic fractions combined and concentrated to 280 mg (90%) of a yellow
solid under reduced pressure. The product can be purified further using a
reversed phase C-18 semi-prep column with a 50 – 80% acetonitrile / water
(0.1% TFA) gradient over 20 min. 1H NMR (400 MHz, d6-acetone, 20 °C): δ 9.38
(d, J = 9.0 Hz, 1H), δ 9.32 (d, J = 9.0 Hz, 1H), δ 8.73 (d, J = 2.1 Hz, 1H), δ 8.64
(d,d J1 = 9.0 Hz, J2 = 2.4 Hz, 1H), δ 8.49 (d,d J1 = 9.0 Hz, J2 = 2.1 Hz, 1H), δ
7.91-8.01 (m, 5H), δ 7.72 (ab quart, Japp = 2.1 Hz, 2H), δ 7.54 (d, J = 2.4 Hz, 1H),
δ 7.24 (ab quart, Japp = 2.1 Hz, 2H), δ 6.46 (ab quart, Japp = 2.1 Hz, 2H), δ 6.34
(ab quart, Japp = 2.1 Hz, 2H), δ 5.24 (q, J = 7.2 Hz, 2H), δ 1.58 (t, J = 7.2 Hz, 3H).
FAB MS calculated for C29H24N3: 414.1970, found 414.1951 [M]+. UV-vis (50 mM
N
NH2H2N
BrN
N N
O OOCH3
H3C
ethidium bromide (12) 3,8-bis pyrrole ethidium acetate (27)
acetic acid, 130oC(90%)
OAc ++-
-

239
sodium phosphate pH 7.5): λmax (nm) and ε (cm-1M-1): 302 (4.6x10⁴), 428
(5.2x10³).
E 5.2.10 Synthesis of Tetramethyl Ethidium Chloride (28):
Tetramethyl ethidium chloride (28). Ethidium bromide / 4 % water (50 mg, 122
µmoles) was combined with trimethyl phosphate (9 mL) and heated, under argon,
to 165 °C for 20 hrs. The trimethyl phosphate was removed under reduced
pressure (80 °C). The purple solid was then dissolved in 10% methanol / CHCl2,
loaded onto a plug of silica gel (15 mL), washed with 10% methanol / CHCl2 (70
mL), eluted using 20% methanol / CHCl2 (50 mL), and concentrated to a solid
under reduced pressure. The product was dissolved into 3 mL of 5% acetonitrile /
water, treated with AG1-X4 (Cl-) exchange resin (0.6 g, 2.1 mmoles, 17 mequiv)
for 5 min at RT, filtered, and lyophilized to yield 48 mg (97%) of a purple solid. 1H
NMR (400 MHz, d6-DMSO, 20 °C): δ 8.85 (d, J = 9.2 Hz, 1H), δ 8.79 (d, J = 9.6
Hz, 1H), δ 7.82 (d,d J1 = 9.6 Hz, J2 = 2.4 Hz, 1H), δ 7.77 (br s, 5H), δ 7.59 (d, J =
8.4 Hz, 1H), δ 6.09 (d, J = 2.4 Hz, 1H), δ 4.70 (q, J = 7.2 Hz, 2H), δ 3.20 (s, 6H),
δ 2.82 (s, 6H), 1.44 (t, J = 7.2 Hz, 3H). FAB MS calculated for C25H28N3:
N
NH2H2N
Br
ethidium bromide (13)
N
NN
tetramethyl ethidium chloride (28)
P
O
OCH3H3CO
H3COCl+ +
- -

240
370.2283, found 370.2279 [M]+. UV-vis (50 mM sodium phosphate pH 7.5): λmax
(nm) and ε (cm-1M-1): 224 (2.1x10⁴), 302 (3.7x10³), 538 (3.8x10⁴).
E 5.2.11 Synthesis of 3,8-bisurea Pyrrolidine Ethidium Trifluoroacetate (30):
3, 8-bisurea Pyrrolidine ethidium · TFAc (30). 3,8-bis Phenoxycarbamate
ethidium · H2PO4 (12 mg, 19 µmoles) (Section E 5.2.7), DMSO (1 mL) and
pyrrolidine (40 µL, 460 µmoles, 27 equiv) were combined and heated for 5 min
(90 °C). The reaction was then diluted into water (9 mL, 0.01% TFA) and loaded
onto an activated Water’s “Sep-pack” C-18 reversed phase column (activated
with 10 mL acetonitrile, 10 mL water), the column was washed with water (10
mL, 0.01% TFA), then 10% acetonitrile (10 mL, in water with 0.01% TFA). The
product was then eluted with 35% acetonitrile (10 mL, in water with 0.01% TFA)
and lyophilized to yield a yellow solid (12 mg, 100%). 1H NMR (400 MHz, d6-
DMSO, 21 °C): δ 9.01 (d, J = 9.6 Hz, 1H), δ 8.98 (s, 1H), δ 8.94 (d, J = 9.6 Hz,
1H), δ 8.89 (d, J = 2.0 Hz, 1H), δ 8.72 (s, 1H), δ 8.40 (d,d J1 = 9.2 Hz, J2 = 2.4 Hz,
1H), δ 8.26 (d,d J1 = 9.2 Hz, J2 = 1.6 Hz, 1H), δ 7.34-7.80 (m, 6H), δ 4.56 (q, J =
6.4 Hz, 2H), δ 3.46 (t, J = 6.4 Hz, 2H), δ 3.15 (t, J = 6.6 Hz, 2H), δ 1.91 (t, J = 6.4
N
HN
HN
H2PO4
O
O
O
O3,8-bis phenoxycarbamateethidium phosphate
N
HN
HN N
OO
3,8-bisurea pyrrolidine ethidiumtrifluoroacetate (30)
HN
+ +
-
NDMSO, 90 oC
(100%)
TFAc-

241
Hz, 2H), δ 2.81 (t, J = 6.6 Hz, 2H), δ 1.48 (t, J = 7.2 Hz, 3H). ESI MS calculated
for C31H34N5O2: 508, found 508 [M]+. UV-vis (50 mM sodium phosphate pH 7.5):
λmax (nm) and ε (cm-1M-1): 288 (4.7x10⁴), 438 (4.5x10⁴).
E 5.2.12 Synthesis of 3,8-bisurea Ethylene Diamine Trifluoroacetate (31):
3,8-bisurea Ethylene diamine ethidium · TFA3 (31). 3,8-bis phenoxycarbamate
ethidium · H2PO4 (9 mg, 13.8 µmoles) (Section E 5.2.7), DMSO (300 µL), and
ethylene diamine (100 µL) were heated at 85 °C for 30 min then cooled to RT.
500 mM sodium phosphate pH 6.5 (0.6 mL) was added and the reaction was
diluted into water (5 mL, 0.1% TFA) and loaded onto an activated Water’s “Sep-
pack” C-18 reversed phase column (activated with 10 mL acetonitrile, 10 mL
water). The column was washed with water / 0.1% TFA (5 mL), the product
eluted with 25% acetonitrile/water (0.1% TFA) and lyophilized to yield 10.5 mg
(91%) of a yellow solid. 1H NMR (300 MHz, D2O, 20 °C): δ 8.58 (d, J = 8.4 Hz,
1H), δ 8.50 (d, J = 8.4 Hz, 1H), δ 8.43 (s, 1H), δ 7.76 (d, J = 9.0 Hz, 1H), δ 7.60-
7.69 (m, 4H), δ 7.50 (s, 1H), δ 7.40-7.43 (m, 2H), δ 4.60 (q, J = 7.5 Hz, 2H),
δ 3.40 (t, J = 6.0 Hz, 2H), δ 3.26 (t, J = 5.7 Hz, 2H), δ 3.03 (t, J = 5.7 Hz, 2H),
N
HN
HN
H2PO4
O
O
O
O3,8-bis phenoxycarbamateethidium phosphate
N
HN
HN
HN
OO
3,8-bisurea ethylene diamineethidium chloride (31)
++
-
HN
DMSO, 85 oC(91%) NH2H2N
3 TFAH2N
NH2

242
δ 2.92 (t, J = 5.7 Hz, 2H), δ 1.37 (t, J = 7.2 Hz, 3H). ESI MS calculated for
C27H32N7O2: 486, found 486 [M]+. UV-vis (50 mM sodium phosphate pH 7.5):
λmax (nm) and ε (cm-1M-1): 216 (3.8x10⁴), 286 (6.6x10³), 444 (6.5x10⁴).
E 5.2.13 Synthesis of 3,8-bisurea Arginine Ethidium Trifluoroacetate (32):
3,8-bisurea arginine ethidium · TFA3 (32). 3,8-bis phenoxycarbamate ethidium
· H2PO4 (10 mg, 13.8 µmoles), DMSO (400 µL), water (100 µL), L-Arg · HCl (50
mg, 237 µmoles, 8.6 mequiv) and 2,4,6 collidine (84 µL, 711 µmoles, 26 mequiv)
were heated for at 90 °C for 1hr then cooled to RT and quenched 500 mM
sodium phosphate pH 6.5 (0.6 mL). The reaction was then diluted into 5 mL
water (0.1 % TFA) and loaded onto an activated Water’s “Sep-pack” C-18
reversed phase column (activated with 10 mL acetonitrile, 10 mL water). The
column was washed with water / 0.1% TFA (5 mL), the product eluted with 25%
acetonitrile/water (0.1% TFA) and lyophilized. The product was further purified
using a reversed phase C-18 semi-prep HPLC column using 15% acetonitrile /
water (0.1% TFA) (RT = 6.3 min) to yield 4.5 mg (31%) of a yellow solid. 1H NMR
(400 MHz, D2O, 20 °C): δ 8.37 (d, J = 8.8 Hz, 1H), δ 8.31 (d, J = 8.8 Hz, 1H), δ
8.30 (d, J = 8.8 Hz, 1H), δ 7.67-7.76 (m, 4H), δ 7.53 (d, J = 9.2 Hz, 1H), δ 7.39-
NHN
HN
H2PO4
O
O
O
O
NHN
HN
HN
O
HN
O CO2HHO2CNH
3- 8- bis phenoxycarbamateethidium phosphate
NH
NH
H2N
NH
NH2
3,8-bisurea arginine ethidiumthrifluoroacetate (32)
3 TFA-+ +
H2N
O2CNH
NH2
NH2-
DMSO, collidine,90 oC (31%)

243
7.45 (m, 3H), δ 4.59 (q, J = 6.8 Hz, 2H), δ 4.20 (t, J = 5.6 Hz, 1H), δ 4.08 (t, J =
5.2 Hz, 1H), δ 3.15 (t, J = 6.6 Hz, 2H), δ 3.10 (t, J = 6.8 Hz, 2H), δ 1.52-1.83 (m,
8H), δ 1.33 (t, J = 7.0 Hz, 3H). ESI MS calculated for C35H44N11O6: 714, found
715 [M+H]+, UV-vis (50 mM sodium phosphate pH 7.5): λmax (nm) and ε (cm-1
M-1): 216 (3.8x10⁴), 288 (6.8x10⁴), 444 (5.7x10³).
E 5.2.14 Synthesis of 3,8-bisurea 2-DOS Ethidium Trifluoroacetate (33):
3,8-bisurea 2-DOS ethidium · TFA3 (33). 3,8-bis phenoxycarbamate ethidium ·
H2PO4 (20 mg, 31 µmoles), DMSO (1.5 mL), phenol (1.5 g), Na2CO3 (50 mg, 472
µmoles, 15 equiv), 2-deoxy streptamine · 2HCl (110 mg, 277 µmoles, 8.9 equiv)
pre-dissolved in water (0.7 mL), were heated at 85 °C for 45 min. The reaction
was diluted into water (80 mL) and washed with CH2Cl2 (2x40 mL), CHCl3 (2x40
mL), and ethyl acetate (40 mL). The aqueous phase was then concentrated to a
solid and purified by reversed-phase chromatography (C-18 silica gel 60). The
column was conditioned with pure acetonitirile, pure water, and the crude product
was loaded in water (0.01 % TFA) and an acetonitrile gradient (0-8% acetonitrile
/ water (0.01% TFA) was used to elute the product. Fractions were collected and
lyophilized to yield 8 mg of a yellow solid (25%). 1H NMR (400 MHz, D2O, 20
N
HN
HN
H2PO4
O
O
O
O
N
HN
HN
HN
O
HN
O
H2N NH2
3,8-bis phenoxycarbamateethidium phosphate
OH OHOH
HOHOHO
3,8-bisurea 2-DOS ethidiumtrifluoroacetate (33)
3TFA-
+H2N NH2
OHOH
HO
DMSO, phenol,Na2CO3, 85 oC(25%)
+

244
°C): δ 8.55 (d, J = 8.4 Hz, 1H), δ 8.47 (d, J = 8.4 Hz, 1H), δ 8.44 (s, 1H), δ 7.62-
7.74 (m, 6H), δ 7.50 (s, 1H), δ 7.39 (s, 1H), δ 7.38 (d, J = 8.4 Hz, 1H), δ 4.59 (q, J
= 6.4 Hz, 2H), δ 3.70 (m, 1H), δ 3.52 (m, 1H), δ 3.08-3.38 (m, 8H), δ 2.21 (t,d J1 =
12.4 Hz, J2 = 4.0 Hz, 1H), δ 2.08 (t,d J1 = 12.4 Hz, J2 = 4.0 Hz, 1H), δ 1.56 (q, J =
12.4 Hz, 1H), δ 1.44 (q, J = 12.4 Hz, 1H), δ 1.37 (t, J = 6.4 Hz, 3H). ESI MS
calculated for C35H44N7O8: 690, found 690 [M]+, UV-vis (50 mM sodium
phosphate pH 7.5): λmax (nm) and ε (cm-1M-1): 216 (3.8x10⁴), 288 (6.8x10⁴), 444
(5.7x10³).
E 5.2.15 Synthesis of 8-Urea-Ethidium-6'-3'Deoxyneamine Trifluoroacetate(36):
Tobramycin has 5 amines that could, potentially react with the activated ethidium
derivative, resulting in multiple isomers. Indeed, at least other 2 isomers are
observed from the above reaction. The major product, however, is the only
isomer to have in its 1H NMR spectrum (d6-DMSO) a triplet for the splitting of the
highlighted N-H (above). The other isomers have a doublet for this hydrogen.
The non-hydrolyzed tobramycin-containing conjugates have also been prepared
using this method. To avoid hydrolysis, cbz is removed by using H2 / Pd black for
N
NH
HNO
O
O
O
3-cbz 8-phenoxycarbamateethidium phosphate
H2PO4 +- Tobramycin-TFA5 (3)
DMSO, Na2CO3
6M HCl/MeOH
20% (2steps)
N
NH
H2N
O+
H2NNH2
OHOH
O
O
NH2HO
NH
4 TFA
8-urea-ethidium 6'-3'deoxyneaminetrifluoroacetate (36)

245
a short (2.5 h) deprotection that results in some partial deprotection and some
degradation the ethidium, but can yield significant quantities of desired product(s)
(not shown).
8-urea-ethidium-6'-3'Deoxyneamine Trifluoroacetate (36). 3-cbz 8-phenoxy-
carbamate ethidium · H2PO4 (20 mg, 30 µmoles), tobramycin·TFA5 (160 mg, 154
µmoles), DMSO (2mL), and Na2CO3 (80 mg, 750 µmoles) were combined and
heated at 90 °C for 15 min. The reaction was then filtered, diluted into water (9
mL, 0.01% TFA), and loaded onto an activated Water’s “Sep-pack” C-18
reversed phase column (activated with 10 mL acetonitrile, 10 mL water), the
column was washed with water (10 mL), and the product was then eluted with
25% acetonitrile (10 mL, in water with 0.01% TFA) and lyophilized to yield a
yellow solid (40 mg) that was carried over directly to the next step. Deprotection
of cbz and the partial hydrolysis of the tobramycin-ethidium conjugate was
accomplished by refluxing the product in 6M HCl / MeOH for 1 hr (110 °C). The
reaction was then concentrated to a solid and purified using a reversed phase C-
18 semi-prep HPLC column with 13% acetonitrile/water (0.1% TFA) at 3.5 mL /
min (Rt = 18.6 min, the third and last major peak) to yield 7.4 mg (20%, 2 steps)
of an orange solid. 1H NMR (400 MHz, d6-DMSO, 20 °C): δ 9.35 (s, 1H), δ 8.74-
8.78 (m, 2H), δ 7.50 (br s, 6H), δ 8.07 (d,d J1 = 12.4 Hz, J2 = 2.8 Hz, 1H), δ 7.85
(br s, 3H), δ 7.71-7.77 (m, 5H), δ 7.52 (d, J = 2.8 Hz, 1H), δ 7.40 (s, 1H), δ 7.38
(d, J = 12.8 Hz, 1H), δ 6.56 (br s, 2H), δ 6.46 (br t, J = 7.0 Hz, 1H), δ 6.05 (br s,
1H), δ 5.76 (br s, 1H), δ 5.45 (d, J = 2.8 Hz, 1H), δ 5.32 (br s, 1H), δ 4.49 (q, J =

246
8.8 Hz, 2H), δ 3.07-3.66 (m, 10H), δ 2.27 (t,d J1 = 12.4 Hz, J2 = 4.0 Hz, 1H), δ
2.01 (t,d J1 = 12.4 Hz, J2 = 4.0 Hz, 1H), δ 1.81 (q, J = 12.4 Hz, 1H), δ 1.62 (q, J =
12.4 Hz, 1H), δ 1.41 (t, J = 9.2 Hz, 3H). ESI MS calculated for C34H44N7O6: 646,
found 646 [M]+. λmax (nm) and ε (cm-1M-1): 216 (3.2x10⁴), 288 (5.0x10⁴), 464
(4.5x10³).
E 5.2.16 Synthesis of 3-urea-Ethidium-6'-3'Deoxyneamine Trifluoroacetate(37):
Tobramycin has 5 amines that could, potentially react with the activated ethidium,
resulting in multiple isomers. Indeed, at least 3 isomers are observed for this
reaction. The major product, however, is the only isomer to have in its 1H NMR
spectrum (d6-DMSO) a triplet for the splitting of the highlighted N-H (above). The
other isomers are found to have a doublet for this hydrogen.
3-urea-ethidium-6'-3'Deoxyneamine trifluoroacetate (37). 8-cbz 3-phenoxy-
carbamate ethidium · H2PO4 (20 mg, 30 µmoles), tobramycin·TFA5 (160 mg, 154
µmoles), DMSO (2mL), and Na2CO3 (80 mg, 750 µmoles) were combined and
heated at 80 °C for 15 min. The reaction was then filtered, diluted into water (9
mL, 0.01% TFA), and loaded onto an activated Water’s “Sep-pack” C-18
N
HN
HN
8-cbz 3-phenoxycarbamateethidium phosphate
H2PO4 +
- Tobramycin-TFA5 (3)
DMSO, Na2CO3
6M HCl/MeOH
20% (2 steps)
3-urea-ethidium-6'-3'deoxyneaminetrifluoroacetate (37)
O
NH2H2NHO
HOO
O
H2N OH
NH
N
NH2HN
+4 TFA
O
O
O
O

247
reversed phase column (activated with 10 mL acetonitrile, 10 mL water), the
column was washed with water (10 mL), and the product was eluted using 25%
acetonitrile (10 mL, in water with 0.01% TFA) and lyophilized to yield a yellow
solid (35 mg) that was carried over directly to the next step. Deprotection of cbz
and the partial hydrolysis of the tobramycin-ethidium conjugate was
accomplished by refluxing the product in 6M HCl / MeOH for 1 hr (105 °C). The
reaction was then concentrated to a solid and purified using a reversed phase C-
18 semi-prep HPLC column with 13% acetonitrile / water (0.1% TFA) at 3.5 mL /
min (RT = 17.5 min, the fourth and last major peak) to yield 6.7 mg (18%, 2 steps)
of an orange solid. 1H NMR (300 MHz, d6-DMSO, 20 °C): δ 9.90 (s, 1H), δ 8.85
(d, J = 9.3 Hz, 1H), δ 8.81 (s, 1H), δ 8.73 (d, J = 9.3 Hz, 1H), δ 8.25 (br s, 3H), δ
8.15 (br s, 3H), δ 7.91 (br s, 3H), δ 7.73-7.78 (m, 6H), δ 7.57 (d,d J1 = 9.0 Hz, J2 =
2.4 Hz, 1H), δ 6.87 (br t, J = 4.5 Hz, 1H), δ 6.36 (d, J = 2.4 Hz, 1H), δ 6.06 (br s,
1H), δ 5.80 (br s, 1H), δ 5.52 (d, J = 3.0 Hz, 1H), δ 5.40 (br s, 1H), δ 4.53 (q, J =
6.6 Hz, 2H), δ 3.28-3.78 (m, 10H), δ 2.28 (t,d J1 = 12.4 Hz, J2 = 4.0 Hz, 1H), δ
2.03 (t,d J1 = 12.4 Hz, J2 = 4.0 Hz, 1H), δ 1.86 (q, J = 12.4 Hz, 1H), δ 1.63 (q, J =
12.4 Hz, 1H), δ 1.43 (t, J = 6.9 Hz, 3H). ESI MS calculated for C34H44N7O6: 646,
found 646 [M]+. UV-vis (50 mM sodium phosphate pH 7.5): λmax (nm) and ε (cm-
1M-1): 216 (3.0x10⁴), 288 (6.0x10⁴), 458 (5.2x10³).

248
E 6.1.1 Synthesis of Neo-N-acridine (38):
5''-amino-5''-deoxy-Boc6-Neomycin B. Synthesized as described (Hai Wang
Ph. D. Thesis, University of California, San Diego, 1998).
9-phenoxyacridine. Prepared according to Dupre and Robinson (J. Chem. Soc.
1945, 549-551).
5''-aminoacridine-5''-deoxy-Boc6-Neomycin B. 5''-amino-5''-deoxy-Boc6-
Neomycin B (12.7 mg, 10.4 µmoles) was combined with phenol (200 mg), DMSO
(350 µL), and 9-phenoxy acridine (8.2 mg, 30 µmoles, 2.9 equiv.) and heated,
under argon, at 70 °C for 2 h. The reaction was loaded directly onto a silica
column and purified using flash chromatography (5-10% MeOH / CH2Cl2) to
afford 6.7 mg of a yellow product (46%). Rf = .28 (10% MeOH / CH2Cl2). This
product was carried over, without further characterization to the next step.
Neo-N-acridine · TFA6 (38). 5''-amino-5''-deoxy-Boc6-Neomycin B (6.7 mg, 4.8
µmoles) was dissolved in a “deprotection cocktail” (4.5 mL trifluoroacetic acid,
HN
N
NH2
H2NO
OO
H2N
OH
HOO
HOO
HO
NH2
OHO
HO
NH2
H2NH2N
O
NHBoc
BocHNO
HOHO
OOBocHN
OH
NHBoc
HOO
HOO
HO
NHBoc
BocNH
N
O NH
O
NHBoc
BocHNO
HOHO
OOBocHN
OH
NHBoc
HOO
HOO
HO
NHBoc
BocNH
N
Neo-N-acridine (38)5''-amino-5''-deoxy-Boc6 Neomycin B
Phenol, 65 oC
(46%)
TFA, phenol,TIPS, H2O (99%)
5''-aminoacridine-5''-deoxyBoc6 Neomycin B

249
0.215 mL phenol, 0.215 mL water, and 87 µL of triisopropyl silane) and mixed for
30 min at RT. The reaction was then diluted into 2% acetic acid/water (30 mL)
and washed with diethyl ether (4x15 mL). The aqueous phase was then
concentrated to a solid under reduced pressure. The crude product was HPLC
purified on C-18 semiprep column using isocratic conditions 11% acetonitrile in
water and 0.1% TFA (Rt = 7.6 min) and lyophilized to yield 7.1 mg of a yellow
solid (99% assuming 6 TFA counter ions). 1H NMR (300 MHz, D2O, 25 °C): δ
8.36 (d, J = 8.7 Hz, 2H), δ 7.86 (t, J = 7.8 Hz, 2H), δ 7.73 (d, J = 8.4 Hz, 2H), δ
7.46 (t, J = 7.8 Hz, 2H), δ 5.76 (d, J = 3.9 Hz, 1H), δ 5.29 (d, J = 0.9 Hz, 1H), δ
5.14 (d, J = 1.2 Hz, 1H), δ 4.48-4.55 (m, 2H), δ 4.37 (d,d J1 = 4.2 Hz, J2 = 1.5 Hz,
1H), δ 4.25 (d,d J1 = 13.8 Hz, J2 = 8.1 Hz, 1H), δ 4.1 (t, J = 4.2 Hz, 1H), δ 4.03 (t,
J = 3.0 Hz, 1H), δ 3.74-3.85 (m, 2H), δ 3.65 (d, J = 3.0 Hz, 1H), δ 3.51-3.59 (m,
1H), δ 3.40-3.47 (m, 3H), δ 3.27-3.35 (m, 1H), δ 3.10-3.20 (m, 3H), δ 2.94 (d,d J1
= 13.5 Hz, J2 = 3.6 Hz, 1H), δ 2.18-2.33 (m, 3H), δ 1.95 (d,d J1 = 10.2 Hz, J2 =
3.9 Hz, 1H), δ 1.66 (q, J = 12.6 Hz, 1H). MALDI TOF MS calculated for
C36H54N8O12: 790.4, found 813.3 [M+Na]+, found 829.3 [M+K]+. UV-vis (50 mM
sodium phosphate pH 7.5): λmax (nm) and ε (cm-1M-1): 222 (2.0x10⁴), 266
(5.6x10⁴), 412 (10.3x10³), 434 (8.3x10³).

250
E 6.1.2 Synthesis of Neo-C-acridine (40):
5'' TIPS Boc6 Neomycin B. Synthesized as described (Hai Wang Ph. D. Thesis,
University of California, San Diego, 1998).
5'' Ethanedithiol Boc6 Neomycin. 5'' TIPS Boc6 Neomycin B (38 mg, 25.6
µmoles), cesium carbonate (176 mg, 540 µmoles, 20 equiv), DMF (2 mL) and 1,
2 ethane dithiol (230 µL, 2.7 mmoles, 107 equiv), were stirred under argon for 4 h
at RT, and diluted into ethyl acetate (180 mL) and washed with 1M NaH2PO4
(4x80 mL), brine (80 mL) and dried for 24 h. under reduced pressure. The crude
product was purified using standard flash chromatography (4-5% MeOH /
CH2Cl2) to yield 22 mg of a white solid (67%). Rf = 0.5 (10% MeOH / CH2Cl2) (the
same Rf as the starting material). 1H-NMR (400 MHz, MeOD) δ 5.41 (s, 1H), δ
S NH2
H2NO
OO
H2N
OH
HOO
HOO
HO
NH2
OHO
HO
NH2
H2N
NH
N
Neo-C-acridine (40)
S
O
O
NHBoc
BocHNO
HOHO
OO
BocHN
OH
NHBoc
HOO
HOO
HO
NHBoc
BocNH
S
O
O
HS SH
DMF, Cs2CO3 (67%)
S
O
NHBoc
BocHNO
HOHO
OO
BocHN
OH
NHBoc
HOO
HOO
HO
NHBoc
BocNH
HS
H2NBr
EtOH, NaOEtN
Cl
Phenol, NaH
O
NHBoc
BocHNO
HOHO
OO
BocHN
OH
NHBoc
HOO
HOO
HO
NHBoc
BocNH
SNH
NS
TFA cocktail
(22%, 3 steps)
5'' TIPS Boc6 Neomycin B 5'' Ethanedithiol Boc6 Neomycin B
Neo-C-acridine Boc6

251
5.13 (s, 1H), δ 4.92 (s, 1H), δ 4.21-4.24 (m, 2H), δ 4.08 (q, J = 5.2 Hz, 1H), δ
3.85-3.89 (m, 2H), δ 3.70-3.76 (m, 2H), δ 3.17-3.57 (m, 12H), δ 2.86-2.95 (m,
5H), δ 2.72 (t, J = 7.2 Hz, 2H), δ 1.92-1.98 (m, 1H), δ 1.28-1.46 (m, 56H).
Neo-C-acridine · TFA6 (40). Under argon, sodium ethoxide (14 mg, 206 µmoles)
argon-sparged ethanol (2 mL), and 1-bromo 2-ammonium ethane chloride (14
mg, 68 µmoles) were stirred for 5 min at RT. To this solution, 5'' ethanedithiol
Boc6 neomycin B (5 mg, 3.8 mmoles) (pre-dissolved in 1 mL of argon-sparged
ethanol) was added and allowed to react for 2.5 hr at RT. The reaction was then
diluted into ethyl acetate (150 mL) and washed with 0.1M citric acid (4x40 mL),
0.1M Na2HPO4 (50 mL), and brine (50 mL), dried over sodium sulfate and
concentrated to a solid under reduced pressure. All of this crude product (Rf =
0.1 (10 %MeOH / CH2Cl2)) was taken, directly, into the next step. 9-phenoxy
acridine was generated in situ by melting phenol (1 g), under argon, at 70 °C and
adding sodium hydride (10 mg, 60% dispersion in wax, 250 µmoles), followed by
9-chloroacridine (20 mg, 47 µmoles) and mixing, under argon for 5 min. The
neomycin-containing starting material (pre-dissolved in 1 mL of DMSO) was then
added and the reaction was kept at 70 °C under argon for 14 hr, diluted into ethyl
acetate (150 mL) and washed with 1M Na2CO3 (4x40 mL), and brine (50 mL),
then dried over sodium sulfate and concentrated to an oil under reduced
pressure. The crude product was then purified on silica gel, using standard flash
chromatography (0-9% MeOH / CH2Cl2) to afford a yellow solid Rf = 0.2 (10%
MeOH / CH2Cl2). All of this product was then taken into the next step without

252
further characterization. Deprotection was conducted by dissolving the product in
a deprotection cocktail (5 mL of trifluoroacetic acid, containing 1% ea (v/v) of
triisopropyl silane, and 1,2-ethanedithiol) and stirring, RT, for 20 min. The
reaction was then diluted into water (100 mL) and washed with CHCl3 (2x50 mL),
diethyl ether (2x50 mL), and concentrated to a yellow solid under reduced
pressure. The crude product was HPLC purified on C-18 semiprep column using
isocratic conditions (15% acetonitrile in water and 0.1% TFA) (Rt = 7.4 min) and
lyophilized to yield 1.3 mg of a yellow solid (22% three steps). 1H NMR (400
MHz, D2O, 25 °C): δ 8.22 (d, J = 8.8 Hz, 2H), δ 7.78 (t, J = 7.6 Hz, 2H), δ 7.63
(d, J = 8.8 Hz, 2H), δ 7.39 (t, J = 7.2 Hz, 2H), δ 5.86 (d, J = 4.0 Hz, 1H), δ 5.22 (s,
1H), δ 5.08 (s, 1H), δ 4.23 (t, J = 6.0 Hz, 1H), δ 4.18 (s, 1H), δ 4.12-4.16 (m, 1H),
δ 4.07 (t, J = 4.8 Hz, 1H), δ 4.03 (t, J = 2.4 Hz, 1H), δ 3.91 (t, J = 10 Hz, 1H), δ
3.82 (t, J = 9.6 Hz, 1H), δ 3.73 (t, J = 8.6 Hz, 2H), δ 3.62 (s, 1H), δ 3.52 (t, J = 10
Hz, 1H), δ 3.16-3.40 (m, 8H), δ 3.04 (d,d J1 = 14 Hz, J2 = 6.8 Hz, 1H), δ 2.98 (t, J
= 6.4 Hz, 2H), δ 2.90 (d,d J1 = 14 Hz, J2 = 4.4 Hz, 1H), δ 2.61-2.67 (m, 6H), δ
2.31 (d t, J1 = 12.4 Hz, J2 = 4.4 Hz, 1H), δ 1.73 (q, J = 12 Hz, 1H). MALDI TOF
MS calculated for C40H62N8O12S2: 910.4, found 911.3 [M+H]+, found 933.3
[M+Na]+, found 949.3 [M+K]+. UV-vis (50 mM sodium phoshate pH 7.5): λmax
(nm) and ε (cm-1M-1): 222 (1.95x10⁴), 266 (5.0x10⁴), 412 (9.85x10³), 434
(8.3x10³).

253
E 6.2.1 Synthesis and Characterization of Tobra-N-acridine (41):
6"-amino 6"-deoxy Boc5 Tobramycin. Synthesized as described (Hai Wang
Ph. D. Thesis, University of California, San Diego, 1998).
Boc5 Tobra-N-acridine. 6"-amino 6"-deoxy Boc5 Tobramycin (38 mg, 40
µmoles), 9-phenoxyacridine (50 mg, 190 µmoles), phenol (0.5 g), and DMSO (1
mL), were heated under Ar for 2 hr at 70 °C. Volatiles were then removed, under
vacuum, for 14 hr. The crude product was then purified on ~100 mL of silca gel
using standard flash chromatography and a 8 – 13% methanol/CH2Cl2 gradient,
yielding a yellow solid (41 mg, 91%). Rf = .23 (10% MeOH / CH2Cl2).1H NMR
(300 MHz, d6-MeOD, 25 °C): δ 8.55 (d, J = 8.7 Hz, 2H), δ 7.98 (t, J = 7.5 Hz,
2H), δ 7.81 (d, J = 7.8 Hz, 2H), δ 7.63 (t, J = 7.5 Hz, 2H), δ 5.13 (d, J = 3.3 Hz,
1H), δ 4.94 (d, J = 3.3 Hz, 1H), δ 4.60-4.67 (m, 3H), δ 4.09-4.17 (m, 1H), δ 3.30-
3.78 (m, 18H), δ 1.85-1.98 (m, 2H), δ 1.15-1.62 (m, 47H). MALDI FTMS
calculated for C56H85N7O8: 1143.60, found 1144.60 [M+H]+.
O
NH2
HO
H2N
H2NO
HOHOO
O
H2N OH
NH2
NH
Tobra-N-acridine (41)
N
O
NH-Boc
HO
Boc-HN
Boc-HNO
HOHOO
O
Boc-HN OH
NH-Boc
NH
Boc5 Tobra-N-acridine
N
O
NH-Boc
HO
Boc-HN
Boc-HNO
HOHOO
O
Boc-HN OH
NH-Boc
NH2
6''-amino 6''-deoxy Boc5 Tobramycin
9-phenoxyacridine,phenol, DMSO, 70 oC
(91%)
TFA, TIPS,water, phenol
(86%)

254
Tobra-N-acridine · TFA5 (41). Boc5 Tobra-N-acridine (11 mg, 9.6 µmoles) was
dissolved in a “deprotection cocktail” (9 mL trifluoroacetic acid, 0.4 mL phenol,
0.4 mL water, and 300 µL of triisopropyl silane) and mixed for 30 min at RT. The
reaction was then diluted into 2% acetic acid/water (30 mL) and washed with
diethyl ether (4x15 mL). The aqueous phase was concentrated to a solid under
reduced pressure and HPLC purified on C-18 semiprep column under isocratic
conditions (11% acetonitrile in water and 0.1% TFA) (Rt = 13.3 min) and
lyophilized to yield 10 mg of a yellow solid (86% assuming 5 TFA counter ions).
1H NMR (400 MHz, D2O, 25 °C): δ 8.29 (d, J = 8.8 Hz, 2H), δ 7.85 (t, J = 7.8 Hz,
2H), δ 7.70 (d, J = 8.8 Hz, 2H), δ 7.43 (t, J = 7.8 Hz, 2H), δ 5.47 (d, J = 3.6 Hz,
1H), δ 5.09 (d, J = 3.6 Hz, 1H), δ 4.46-4.50 (m, 1H), δ 4.24-4.28 (m, 2H), δ 3.94
(d,d J1 = 10.4 Hz, J2 = 3.2 Hz, 1H), δ 3.87 (t, J = 9.4 Hz, 1H), δ 3.56-3.75 (m,
4H), δ 3.36-3.94 (m, 3H), δ 3.30 (d,d J1 = 13.6 Hz, J2 = 4.0 Hz, 1H), δ 3.22 (d,t J1
= 12.0 Hz, J2 = 2.0 Hz, 1H), δ 3.09 (d,d J1 = 13.6 Hz, J2 = 7.6 Hz, 1H), ), δ 2.41
(d,t J1 = 12.8 Hz, J2 = 4.4 Hz, 1H), δ 2.08 (d,t J1 = 13.2 Hz, J2 = 4.8 Hz, 1H), δ
1.83 (q, J = 12.8 Hz, 1H), δ 1.81 (q, J = 12.8 Hz, 1H). MALDI FTMS calculated
for C31H45N7O8: 643.34, found 644.34 [M+H]+. (50 mM Tris·HCl pH 7.5): λmax
(nm) and ε (cm-1M-1): 222 (1.7x10⁴), 266 (5.0x10⁴), 412 (8.9x10³), 434 (7.4x10³).

255
E 6.3.1 Synthesis and Characterization of Neo-Neo (43):
Neo-neo was first synthesized by Hai Wang.180 It has more recently been
synthesized using a simplified method:
5'' ββββ-Mercaptoethyl Ether Neomycin · TFA6: 5'' TIPS Boc6 Neomycin B (40 mg,
27 µmoles) was dissolved in DMF (1.5 mL) and treated with Cs2CO3 (100 mg,
307 µmoles), and 2-mercaptoethyl ether (125 µL, 1 mmoles, 37 equiv). The
reaction was kept under argon for 7h at 30 °C, diluted into ethyl acetate (150 mL),
washed with 0.1 M citric acid (50 mL), water (3x50 mL), brine (50 mL) and dried
over sodium sulfate. The organic layer was then concentrated under reduced
pressure, and kept under a high vacuum over night. The crude product was
SO
H2N
NH2O
OO
NH2
HO
OH O
HO O
OH
H2N
OOH
HO
H2N
H2N
SO
NH2
H2NO
OO
H2N
OH
HOO
HOO
HO
NH2
OHO
HO
NH2
H2N
S S
Neo-Neo (43)
SO
NH2
H2NO
OO
H2N
OH
HOO
HOO
HO
NH2
OHO
HO
NH2
H2N
HS
O
O
NHBoc
BocHNO
HOHO
OO
BocHN
OH
NHBoc
HOO
HOO
HO
NHBoc
BocNH
S
O
O
5'' TIPS Boc6 Neomycin B5'' β-Mercaptoethyl EtherNeomycin B
1) β-mercaptoethyl ether,DMF, Cs2CO3
2) TFA cocktail (79%, 2 steps)
I2 / MeOH
(77%)

256
dissolved in CH2Cl2 (4 mL), and treated with 1,2 ethanedithiol (20 µL), and
triisopropy silane (20 µL). and trifluoroacetic acid (5 mL) for 15 min. at RT. The
reaction was diluted into toluene (50 mL) and concentrated under vacuum at
50 °C (2x) and kept under high-vacuum for 6 h, the solid was then dissolved in
0.1% TFA in water (3 mL), filtered through glass wool and lyophilized to afford 30
mg of a white solid (79% yield, two steps). 1H-NMR (400 MHz, D2O) δ 5.88 (d, J
= 4.0 Hz, 1H), δ 5.23 (d, J = 3.2 Hz, 1H), δ 5.12 (s, 1H), δ 4.21-4.24 (m, 2H), δ
4.13-4.18 (m, 2H), δ 4.04 (s, 1H), δ 3.91 (t, J = 10 Hz, 1H), δ 3.82 (t, J = 9.6 Hz,
1H), δ 3.71-3.75 (m, 2H), δ 3.64 (s, 1H), δ 3.48-3.57 (m, 4H), δ 3.17-3.41 (m, 8H),
δ 3.11 (d,d J1 = 13.6 Hz, J2 = 9.6 Hz, 1H), δ 2.97 (d,d J1 = 13.2 Hz, J2 = 3.6 Hz,
1H), δ 2.65-2.74 (m, 4H), δ 2.55 (t, J = 6.0 Hz, 2H), δ 2.30 (d, t J1 = 12.4 Hz, J2 =
4.4 Hz, 1H), δ 1.71 (q, J = 12.4 Hz, 1H). ESI MS calculated for C27H54N6O13S2:
734.3, found 735.3 [M+H]+.
Neo-Neo · TFA12 (43). 5'' β-Mercaptoethyl Ether Neomycin · TFA6 (9 mg, 6.4
µmoles) was dissolved in methanol (3 mL) and, while stirring, a dilute solution of
I2 (in methanol) was added drop-wise until two drops past the end-point (where
the reaction no longer decolorized the I2 solution) and stirred and additional 15
min at RT. The methanol was then removed under reduced pressure and the
solid was washed with acetonitrile (0.1 % TFA) (3x2 mL) to remove the remaining
traces of I2. The white solid was then lyophilized from water (0.1% TFA) to afford
6.9 mg of a white solid (77%). 1H-NMR (300 MHz, D2O) δ 5.90 (d, J = 4.0 Hz,
2H), δ 5.25 (d, J = 3.2 Hz, 2H), δ 5.15 (s, 2H), δ 4.25-4.29 (m, 4H), δ 4.16-4.17

257
(m, 4H), δ 4.06 (t, J = 2.8 Hz, 2H), δ 3.95 (t, J = 9.8 Hz, 2H), δ 3.85 (t, J = 9.9 Hz,
2H), δ 3.73-3.79 (m, 4H), δ 3.52-3.68 (m, 10H), δ 3.20-3.43 (m, 16H), δ 3.14 (d,d
J1 = 13.5 Hz, J2 = 6.9 Hz, 2H), δ 2.97 (d,d J1 = 13.5 Hz, J2 = 3.6 Hz, 2H), δ 2.68-
2.79 (m, 12H), δ 2.32 (d,t J1 = 12.9 Hz, J2 = 4.2 Hz, 2H), δ 1.73 (q, J = 12.6 Hz,
2H). MALDI TOF MS calculated for C54H106N12O26S4: 1466.6, observed: 1489.7
[M+Na]+.
E 6.3.2 Synthesis and Characterization of Neo-N-Neo (44):
Boc6 Neo-N-Neo. 5'' Ethanedithiol Boc6 Neomycin (Section E 6.1.2) (9 mg, 7
µmoles) was dissolved in 1:1 CHCl3/methanol (4 mL) and triethylamine (10 µL,
70 µmoles, 10 equiv). A dilute I2 solution (~3mg/mL in CHCl3) was titrated until
two drops past the end-point (where the reaction no longer decolorized the I2
SS
NH2
H2NO
OO
H2N
OH
HOO
HOO
HO
NH2
OHO
HO
NH2
H2N
SS
H2N
NH2O
OO
NH2
HO
OH O
HO O
OH
H2N
OOH
HO
H2N
H2N
Neo-N-Neo (44)
S
O
NHBoc
BocHNO
HOHO
OOBocHN
OH
NHBoc
HOO
HOO
HO
NHBoc
BocNH
HS
5'' Ethanedithiol Boc6 Neomycin B
S
O
NHBoc
BocHNO
HOHO
OO
OH
NHBoc
HOO
HOO
HO
NHBoc
BocNH
SS
O
BocHN
NHBocO
OHHO
OO
NHBoc
HO
BocHN
OH O
HO O
OH
BocHN
S
Boc6 Neo-N-Neo
NHBoc
NHBoc
I2 / MeOH
(99%)
TFA cocktail
(99%)

258
solution) and stirred an additional 45 min at RT. The reaction was then diluted
into CHCl3 (40 mL) and washed with 1M NaH2PO4 (2x15 mL), 1M Na2CO3, (2x15
mL), brine (20 mL) dried over sodium sulfate, and concentrated to a white solid
under reduced pressure (9 mg, 99%). Rf = 0.45 (10 % MeOH / CH2Cl2).1H-NMR
(300 MHz, MeOD) δ 5.38 (s, 1H), δ 5.15 (s, 1H), δ 4.95 (s, 1H), δ 4.24-4.28 (m,
2H), δ 4.07-4.12 (m, 1H), δ 3.89-3.41 (m, 2H), δ 3.72-3.78 (m, 2H), δ 3.17-3.57
(m, 12H), δ 2.89-2.95 (m, 7H), δ 1.93-1.99 (m, 1H), δ 1.27-1.48 (m, 56H).
Neo-N-Neo · TFA12 (44). Boc6 Neo-N-Neo (9 mg, 7 µmoles) was dissolved in
CHCl3 (1.5 mL), tiisopropyl silane (100 µL), TFA (1.5 mL), and stirred RT for 10
min. The reaction was then partitioned into water (40 mL) and diethyl ether (20
mL), the ether was discarded and the aqueous phase was washed with 1:30
methanol / diethyl ether (3x20 mL). The aqueous phase was then concentrated
to a solid under vacuum. The solid was dissolved in 4 mL 0.1% TFA / water and
lyophilized to yield a white solid (9 mg, 99%). 1H-NMR (400 MHz, D2O) δ 5.92 (d,
J = 4.0 Hz, 2H), δ 5.27 (d, J = 2.0 Hz, 2H), δ 5.17 (s, 2H), δ 4.27-4.31 (m, 4H), δ
4.21 (q, J = 4.0 Hz, 2H), δ 4.17 (t, J = 4.8 Hz, 2H), δ 4.08 (t, J = 2.4 Hz, 2H), δ
3.96 (t, J = 9.6 Hz, 2H), δ 3.88 (t, J = 10 Hz, 2H), δ 3.75-3.80 (m, 4H), δ 3.68 (d, J
= 2.4 Hz, 2H), δ 3.56 (t, J = 9.8 Hz, 2H), δ 3.18-3.46 (m, 14H), δ 3.11 (d,d J1 =
9.2 Hz, J2 = 7.6 Hz, 2H), δ 2.98 (d,d J1 = 13.6 Hz, J2 = 4.0 Hz, 2H), δ 2.84-3.02
(m, 10H), δ 2.73 (d,d J1 = 13.2 Hz, J2 = 6.0 Hz, 2H), δ 2.35 (d,t J1 = 12.8 Hz, J2 =
4.0 Hz, 2H), δ 1.76 (q, J = 12.4 Hz, 2H). MALDI TOF MS calculated for
C50H98N12O24S4:1378.6, observed: 1401.7 [M+Na]+.

259
Figure E 6.1: 1H NMR of Neo-Neo (43) before and after dimerization (A and B,respectively) in D20. Notice that the only significant changes are in the “linkerregion” at 2.6 and 3.6 ppm. 1H NMR of Neo-N-Neo (44) (C); again the onlysignificant differences between Neo-Neo and Neo-N-Neo are in the “linkerregion” at 2.8 and 3.6 ppm. The 1H NMR spectrum of neomycin B · TFA6 is alsoshown (D).
2.02.53.03.54.04.55.05.56.0
2.02.53.03.54.04.55.05.56.0
2.02.53.03.54.04.55.05.56.0
2.02.53.03.54.04.55.05.56.0
A) 5” β-Mercaptoethyl etherNeomycin B • TFA6
B) Neo-Neo • TFA12
C) Neo-N-Neo • TFA12
D) Neomycin B • TFA6
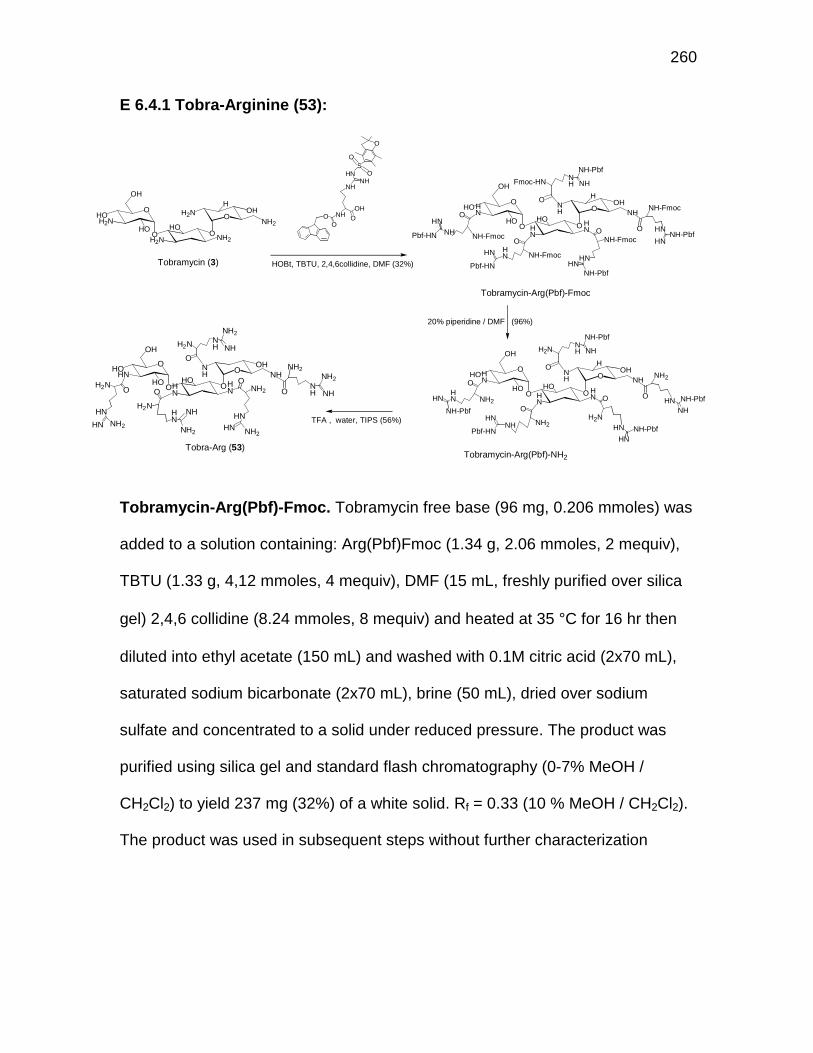
260
E 6.4.1 Tobra-Arginine (53):
Tobramycin-Arg(Pbf)-Fmoc. Tobramycin free base (96 mg, 0.206 mmoles) was
added to a solution containing: Arg(Pbf)Fmoc (1.34 g, 2.06 mmoles, 2 mequiv),
TBTU (1.33 g, 4,12 mmoles, 4 mequiv), DMF (15 mL, freshly purified over silica
gel) 2,4,6 collidine (8.24 mmoles, 8 mequiv) and heated at 35 °C for 16 hr then
diluted into ethyl acetate (150 mL) and washed with 0.1M citric acid (2x70 mL),
saturated sodium bicarbonate (2x70 mL), brine (50 mL), dried over sodium
sulfate and concentrated to a solid under reduced pressure. The product was
purified using silica gel and standard flash chromatography (0-7% MeOH /
CH2Cl2) to yield 237 mg (32%) of a white solid. Rf = 0.33 (10 % MeOH / CH2Cl2).
The product was used in subsequent steps without further characterization
O
NH2
HOH2N
H2NO
HOHO
O
O
H2N OH
NH2
HOH
NHOH
OO
O
O
HN
HOHN
HN
OHOHO
O
O
NH
OHNH
HOH
NH-Fmoc
O
NHHN
Pbf-HN NH-FmocO
HNHN
NH-Pbf
Fmoc-HN
O
NH NH
NH-Pbf
NH-Fmoc
OHNHN
Pbf-HN
NH-Fmoc
O HN
HNNH-Pbf
O
HN
HOHN
HN
OHOHO
O
O
NH
OHNH
OH
H2NO
HN
HN NH2
H2N
O
NH NH
NH2
NH2
ONH NH
NH2
NH2
O
HNHN NH2
H2N
O
HN
NH
NH2
TFA , water, TIPS (56%)
Tobra-Arg (53)
Tobramycin (3)
Tobramycin-Arg(Pbf)-Fmoc
Tobramycin-Arg(Pbf)-NH2
20% piperidine / DMF (96%)
HOBt, TBTU, 2,4,6collidine, DMF (32%)
NHNH
HNS
O
O
O
O
HN
HOHN
HN
OHOHO
O
O
NH
OHNH
HOH
NH2
OHNHN
NH-PbfH2N
O
HN
HNNH-Pbf
H2N
O
NH NH
NH-Pbf
NH2
O
NHHN
Pbf-HN
NH2
OHN
NH
NH-Pbf

261
Tobramycin-Arg(Pbf)-NH2. Tobramycin-Arg(Pbf)-Fmoc (100 mg, 27 µmoles)
was dissolved in DMF (4 mL) and piperidine (1 mL) was added, mixed RT for 14
hr, then concentrated and dried under reduced pressure (40 °C) to yield 67 mg
(98%) of a white solid. MALDI TOF MS calculated for C113H177O29S5: 2528, found
2531 [M+Na]+.
Tobramycin-Arg (53). Tobramycin-Arg(Pbf)-NH2 (25 mg, 9.8 µmoles) was
dissolved in CH2Cl2 (7 mL), added to a TFA solution (7 mL, containing 5% water
and 1.5% triisopropyl silane) and mixed RT for 2hr, water (40 mL) was then
added and the reaction washed with diethyl ether (3x20 mL), the aqueous phase
was then concentrated to a solid under reduced pressure. The product was
HPLC purified on C-18 semiprep column using isocratic conditions (7%
acetonitrile in water and 0.1% TFA) (Rt = 9.9 min) and lyophilized to yield 14 mg
of a white solid (56% assuming 10 TFA counter ions). 1H NMR (400 MHz, D2O,
22 °C): δ 5.33 (d, J = 3.2 Hz, 1H), δ 4.93 (d, J = 4.0 Hz, 1H), δ 3.82-3.97 (m,
9H), δ 3.77 (t, J = 6.6 Hz, 1H), δ 3.63-3.70 (m, 2H), δ 3.29-3.58 (m, 7H), δ 3.03-
3.11 (m, 10H), δ 1.74-1.84 (m, 12H), δ 1.45-1.59 (m, 12H). MALDI TOF MS
calculated for C48H97N25O14: 1247.7, observed: 1248.7 [M+H]+.

262
E 6.4.2 ace-Tobra-Arginine (54):
ace-Tobra-Arginine (54). Tobramycin-Arg(Pbf)-NH2 (section E 6.4.1, 35 mg,
13.9 µmoles) was treated with DMF (4 mL), acetic anhydride (0.2 mL), and dry
pyridine (0.4 mL) for 1.5 hr at 44 °C, then concentrated under reduced pressure,
re-dissolved in DMF (7 mL), concentrated under reduced pressure (50 °C), the oil
was re-dissolved in 1:1 DMF / water and concentrated to a solid under reduced
pressure (50 °C). All of the resulting product was carried into the next step upon
addition of CH2Cl2 (13 mL) and a TFA solution (13 mL, containing 5% water and
1.5% triisopropyl silane) the reaction was mixed at RT for 2hr, then diluted into
water (40 mL) and washed with diethyl ether (3x20 mL), the aqueous phase was
then concentrated to a solid, under reduced pressure. The product was HPLC
purified on a C-18 semiprep column using isocratic conditions (7% acetonitrile in
O
HN
HOHN
HN
OHOHO
O
O
NH
OH
NH
OH
HN
O
HNHN NH2
HN
O
NH NH
NH2
NH
ONH NH
NH2HN
O
HNHN NH2
HN
O
HN NH
NH2
O
O
O
O
O
TFA , water, TIPS
ace-Tobra-Arg (54)
(Ac)2O, pyridine
(42%, 2 steps)
O
HN
HOHN
HN
OHOHO
O
O
NH
OHNH
HOH
NH2
OHNHN
NH-PbfH2N
O
HN
HNNH-Pbf
H2N
O
NH NH
NH-Pbf
NH2
O
HNHN
Pbf-HN
NH2
OHN
NH
NH-Pbf
Tobramycin-Arg(Pbf)-NH2

263
water with 0.1% TFA) (Rt = 9.4 min), fractions were pooled and lyophilized to
yield 8.6 mg of a white solid (42% assuming 10 TFA counter ions). 1H NMR (400
MHz, D2O, 21 °C): δ 5.11 (d, J = 2.8 Hz, 1H), δ 5.08 (d, J = 4.0 Hz, 1H), δ 4.11-
4.16 (m, 3H), δ 3.79-4.08 (m, 6H), δ 3.56-3.63 (m, 5H), δ 3.31-3.41 (m, 6H), δ
3.03-3.08 (m, 10H), δ 1.81-1.90 (m, 14H), δ 1.45-1.71 (m, 25H). MALDI TOF MS
calculated for C58H107N25O19: 1457.8, observed: 1458.5 [M+H]+.
E 6.4.3 Kana-A-Dab (55):
Kana-A-Dab(Cbz)-Boc. Kanamycin A free base (100 mg, 206 µmoles), water (2
mL), 1,4 dioxane (6 mL), Boc-Dab(Z)-Osu (0.5 g, 1.1 mmoles, 1.35 mequiv),
triethyl amine (150 µL, 1.1 mmoles) were stirred for 14 hr at RT, then ethylene
diamine (0.2 mL) was added and allowed to react for 10 min. The reaction was
partitioned into ethyl acetate (150 mL) and 1 M NaH2PO4 (100 mL), the aqueous
layer was removed and the organic phase washed with 1 M NaH2PO4 (50 mL),
O
NH2
HOH2N
H2NO
HOHO
O
O
HO OH
NH2
OH
OH
NH
O
O
N
O
O
HN
O
O
O
O
NH
OHN
O
O OO
O
NH
HO HN
HN
OHOHO
O
O
HO OH
NH
OH
OH
NH
O
HN O
O O OHN
O
NHO
O
O
O
HN
O
NHO
O
O
O
NH2
O
H2N
O
NH
HO HN
HN
OHOHO
O
O
HO OHNH
OH
OH
NH2
O
NH2
H2N
O
H2N
H2N
O
H2N
Kanamycin A (1)
Kanamycin A -Dab(Cbz)-Boc
water, dioxane, TEA (27%)
Kanamycin A -Dab (55)
1) TFA2) H2 / Pd (99%, 2 steps)

264
saturated sodium bicarbonate (2x50 mL), brine (50 mL), then dried over sodium
sulfate and concentrated to a solid under reduced pressure. The crude product
was purified on silica gel (100 mL) using a 3 – 9% methanol/CH2Cl2 gradient (the
product elutes from 8 – 9% methanol). To yield a white solid (100 mg, 27%). Rf =
.25 (10% MeOH / CH2Cl2). The product was used further without additional
characterization.
Kana-A-Dab · TFA8 (55). Kana-A-Dab(Cbz)-Boc (30 mg, 16.5 µmoles), CH2Cl2
(2 mL), and TFA (2 mL) were stirred at RT for 15 min then concentrated to an oil
under reduced pressure. Anhydrous toluene (15 mL) was used to dissolve the oil
and was then removed under reduced pressure (50 °C) to yield white solid. All of
this product was taken to the next step without characterization. The white solid
was combined with methanol (3 mL), glacial acetic acid (2 mL) 10% Pd on
carbon (20 mg) and reacted with H2 (1.2 atm) for 14 hr at RT. The catalyst was
then removed, washed with water (2 mL), and the solvent removed under
reduced pressure. The resulting oil was then dissolved in water (2 mL, 0.1%
TFA), filtered through a 0.45 µm nylon filter, and lyophilized. The solid was then
re-dissolved in water (5 mL 0.1% TFA) and lyophilized to yield a white solid (31
mg, 99%, assuming 8 TFA counter ions). The product was analyzed using an
HPLC reverse phase C-18 column (3. 5mL/min 1 % acetonitrile in water and
0.1% TFA) and found to be >95% pure (detection at 215 nm, Rt = 6.9 min). 1H
NMR (400 MHz, D2O, 22 °C): δ 5.41 (d, J = 3.6 Hz, 1H), δ 4.99 (d, J = 3.6 Hz,
1H), δ 3.88-4.03 (m, 7H), δ 3.44-3.76 (m, 9H), δ 3.28-3.35 (m, 3H), δ 3.17 (t, J =

265
9.6 Hz, 1H), δ 2.93-3.03 (m, 8H), δ 2.10-2.17 (m, 8H), δ 1.89 (d,t J1 = 12.0 Hz, J2
= 3.8 Hz, 1H), δ 1.48 (q, J = 12.0 Hz, 1H). MALDI TOF MS calculated for
C34H68N12O15: 884.49, observed: 907.47 [M+Na]+.
E 6.4.4 Kana-A-Lys (56):
Kana-A-Lys(ClCbz)-Boc. Kanamycin A free base (40 mg, 82 µmoles), methanol
(8 mL), Boc-Lys(ClCbz)-Osu (0.5 g, 0.98 mmoles, 3 mequiv), triethyl amine (200
µL, 1.5 mmoles) were stirred for 24 hr at RT, then diluted into ethyl acetate (120
mL) and washed with 1 M Na2CO3 (2x50 mL), 1 M NaH2PO4 (2x50 mL), and
brine (50 mL). The organic phase was then dried over sodium sulfate and
reduced, under vacuum, to an oily solid that was purified on 80 mL of silica gel
using standard flash chromatography and a 3 – 10% methanol CH2Cl2 gradient to
yield a white solid (30 mg, 18%). Rf = .28 (10% MeOH / CH2Cl2). The product
was used further without additional characterization.
O
NH2
HOH2N
H2NO
HOHO
O
O
HO OH
NH2
OH
OH
NH
O
O
N
O
O
O
O
NH2
O
O
HN
HO HN
HN
OHOHO
O
O
HO OHNH
OH
OH
NH2
O
H2N
OH2N
O
Kanamycin A (1)
Kanamycin A -Lys(ClCbz)-Boc
methanol TEA (18%)
Kanamycin A -Lys (56)
1) TFA2) H2 / Pd (90%, 2 steps)
HN
O
OCl
NH2 H2N
H2NNH2
NH-Boc
O
O
HN
HO HN
HN
OHOHO
O
O
HO OH
NH
OH
OH
NH-Boc
O
Boc-HN
O
Boc-HN
O
NH-ClCbz
ClCbz-HN
NH-ClCbzNH-ClCbz

266
Kana-A-Lys · TFA8. Kana-A-Dab(ClCbz)-Boc (29 mg, 14 µmoles), methanol (5
mL), glacial acetic acid (1mL), 10% Pd on carbon (20 mg), were mixed under 1.2
atm of H2 for 14 hr at RT. The catalyst was then removed by centrifugation, and
the supernatant concentrated to a solid under reduced pressure. 20% of this
crude product was then carried over, directly, to the next step by adding CH2CL2
(2 mL), TFA (2 mL) and mixing at RT for 15 min. The reaction was then
concentrated to an oil under reduced pressure. Anhydrous toluene (15 mL) was
used to dissolve the oil and was then removed under reduced pressure (50 °C) to
yield white solid. A C-18 reversed phase column and HPLC was used for
purification (3. 5mL/min 2.5% acetonitrile in water and 0.1% TFA, detection at
215 nm, Rt = 6.5 min). To yield a white solid (4.8 mg, 90%). 1H NMR (400 MHz,
D2O, 21 °C): δ 5.37 (d, J = 3.6 Hz, 1H), δ 4.93 (d, J = 3.6 Hz, 1H), δ 3.59-3.99
(m, 13H), δ 3.26-3.49 (m, 6H), δ 3.08 (t, J = 9.8 Hz, 1H), δ 2.81-2.87 (m, 8H), δ
1.72-1.78 (m, 9H), δ 1.50-1.60 (m, 9H), δ 1.26-1.31 (m, 8H). MALDI TOF MS
calculated for C42H84N12O15: 996.62, observed: 977.71 [M+H]+, 1019.69 [M+Na]+.

267
E 6.4.5 γγγγ–guanidino Kana-A-Dab (57):
γγγγ–guanidino Kana-A-Dab · TFA8 (57). Kana-A-Dab(Cbz)-Boc (section 6.4.3) (27
mg, 14.8 µmoles), methanol (5 mL), 10% Pd on carbon (17 mg), glacial acetic
acids (0.2 mL) were stirred under 1.2 atm of H2 at RT for 16 h. The catalyst was
then removed by centrifugation, and the supernatant concentrated to an oil under
reduced pressure. Anhydrous toluene was then added and removed under
reduced pressure at 50 °C (repeated 2x total) to afford 18 mg of a white solid.
MALDI TOF MS calculated for C54H100N12O23: 1284.70, observed: 1285.63
[M+H]+, 1307.61 [M+Na]+. ½ of this product was carried over, without further
characterization, to the guanidinylation steps. Kana-A-Dab-Boc (9 mg, 7.0
µmoles), methanol (1 mL), CH2Cl2 (3 mL), N,N'-diBoc-N''-triflylguanidine (40 mg,
102 µmoles), triethyl amine (60 µL, 450 µmoles) were stirred at RT for 21 hr then
reduced to an oil under vacuum and purified using 20 mL of silica gel and flash
NH
OHN
O
O OO
O
NH
HO HN
HN
OHOHO
O
O
HO OH
NH
OH
OH
NH
O
HN O
O O OHN
O
NHO
O
O
O
HN
O
NHO
O
O
O
H2N
O
HN
O
HN
HOHN
HN
OHOHO
O
O
HO OH
NH
OH
OH
H2N
O
NH
H2N
O
HN
H2N O
HN
Kanamycin A -Dab(Cbz)-Boc
γ-guanidino Kanamycin A -Dab (57)
NH
OH2N
OO
O
NH
HO HN
HN
OHOHO
O
O
HO OH
NH
OH
OH
NH
O
H2N
O OHN
O
NH2O
O
HN
O
NH2O
O
Kanamycin A -Dab-Boc
H2 / Pd
HN
NH2
HN
NH2
NH
NH2NH
H2N
N-Tf
NH-BocBoc-HN
TFA50% (3 steps)

268
chromatography (4 – 6% methanol/CH2Cl2 gradient) to yield 8 mg of a white
solid. Rf = 0.33 (7% methanol/CH2Cl2). All of this product was deprotected by
adding CH2Cl2 (2 mL), triisopropyl silane (40 µL), and TFA (3 mL). The reaction
was carried out at RT for 4 hr then partitioned into 1% acetic acid in water (70
mL), and diethyl ether (70 mL). The ether was back-extracted one time with 30
mL of water. The combined aqueous fractions were then washed with diethyl
ether (2x40 mL) and concentrated to a solid under reduced pressure. The solid
was then dissolved in water (3 mL, 0.1% TFA), filtered trough a 0.45 mm nylon
filter, and lyophilized to a white solid (7.2 mg, 50%, 3 steps). The product was
analyzed using an HPLC reverse phase C-18 column (3. 5mL/min 0.5 – 4%
acetonitrile gradient in water and 0.1% TFA over 20 min) and found to be >90%
pure (detection at 215 nm, Rt = 16.5 min). For the RNA binding assays, a small
amount of this compound (3 mg) was purified to >99% using the same HPLC
conditions. 1H NMR (400 MHz, D2O, 21 °C): δ 5.39 (d, J = 3.2 Hz, 1H), δ 4.98 (d,
J = 3.2 Hz, 1H), δ 3.87-4.02 (m, 7H), δ 3.72 (t, J = 8.8 Hz, 1H), δ 3.16-3.63 (m,
20H), δ 2.02-2.07 (m, 8H), δ 1.87 (d,t J1 = 12.0 Hz, J2 = 3.8 Hz, 1H), δ 1.48 (q, J
= 12.0 Hz, 1H). MALDI TOF MS calculated for C38H76N20O15: 1052.58, observed:
1053.45 [M+H]+, 1075.43 [M+Na]+.

269
E 6.2.1 Synthesis and Characterization of guanidino5 Tobra-N-acridine (58)and guanidino4 Tobra-N-acridine (59):
Guanidino5 Tobra-N-acridine · TFA5 (58), and guanidino4 Tobra-N-acridine ·
TFA5 (59). Tobra-N-acridine · TFA5 (Section E 6.2.1) (13 mg, 11 µmoles), water
(0.45 mL), 1,4 dioxane (1.8 mL), N,N'-diBoc-N''-triflylguanidine (52 mg, 133
µmoles), triethyl amine (45 µL, 190 µmoles) were stirred at RT for 72 hr, then the
volatiles were removed under reduced pressure. The yellow oil was dissolved in
1,4 dioxane (1 mL) and triethyl amine (22 µL, 93 µmoles) and stirred at RT for 24
hr, then diluted into ethyl acetate (100 mL) and washed with water (3x50 mL),
brine (50 mL), dried over sodium sulfate, and concentrated to a solid under
reduced pressure. The Boc-protected products (Rf = .31, 10% methanol/CH2Cl2)
were purified on silica gel using a 5 – 12% methanol/CH2Cl2 gradient. The
mixture of the two Boc protected products were then deprotected in a
deprotection cocktail (10 mL of 88% TFA, 5% water, 5% phenol, and 2%
O
HN
HO HN
H2NO
HOHO
O
O
NH
OHNH
NH
H2N
NH
NH2
NH
NH2
NH
H2N
NH
N
Guanidino4 Tobra-N-acridine (59)
O
HN
HOHN
HN
OHOHO
O
O
NH
OHNH
NH
H2N
NH
H2NNH
NH2
NH
NH2
NH
H2N
NH
N
Guanidino5 Tobra-N-acridine (58)
O
NH2
HOH2N
H2NO
HOHO
O
O
H2N OHNH2
NH
N
N-Tf
NH-BocBoc-HN
TFA
Tobra-N-acridine (41)
(21%)
(12%)

270
triisopropylsilane (v/v)) at RT for 2 hr. The reaction was then was then diluted into
2% acetic acid (100 mL) and washed with diethyl ether (3x30 mL). The aqueous
phase was then reduced to a solid under reduced pressure and purified on a C-
18 reversed phase HPLC column with an isocratic mixture of 10% acetonitrile
(0.1% TFA) in water (0.1% TFA) (3 mL/min). The first peak to elute from the
column yielded 1.8 mg (12%) of guanidino4 tobra-N-acridine · TFA5 (59) (Rt =
18.6 min). 1H NMR (400 MHz, D2O, 22 °C): δ 8.26 (d, J = 8.0 Hz, 2H), δ 7.78 (t,
J = 7.8 Hz, 2H), δ 7.63 (d, J = 8.4 Hz, 2H), δ 7.38 (t, J = 7.6 Hz, 2H), δ 5.08 (d, J
= 3.6 Hz, 1H), δ 4.53-4.62 (m, 2H), δ 4.11 (d, J = 3.6 Hz, 1H), δ 3.76-3.83 (m,
1H), δ 3.65 (d,d J1 = 10.0 Hz, J2 = 4.0 Hz, 1H), δ 3.46-3.61 (m, 4H), δ 3.27-3.39
(m, 4H), δ 3.14-3.20 (m, 1H), δ 2.61 (d,t J1 = 12.4 Hz, J2 = 4.0 Hz, 1H), δ 2.20
(d,t J1 = 12.8 Hz, J2 = 4.0 Hz, 1H), δ 1.78 (d,t J1 = 11.6 Hz, J2 = 4.0 Hz, 1H), δ
1.58 (q, J = 12.0 Hz, 1H), δ 1.35 (q, J = 12.0 Hz, 1H). MALDI FTMS calculated
for C35H53N15O8: 811.420, found 812.418 [M+H]+.
The second peak from the column yielded 3.2 mg (21%) of guanidino5 tobra-N-
acridine · TFA5 (58) (Rt = 19.9 min). 1H NMR (400 MHz, D2O, 22 °C): δ 8.27 (d, J
= 7.6 Hz, 2H), δ 7.79 (t, J = 7.8 Hz, 2H), δ 7.63 (d, J = 8.8 Hz, 2H), δ 7.40 (t, J =
7.6 Hz, 2H), δ 5.09 (d, J = 3.6 Hz, 1H), δ 4.70 (d, J = 1.2 Hz, 1H), δ 4.53-4.62 (m,
2H), δ 3.02-3.79 (m, 11H), δ 2.59 (d,t J1 = 12.4 Hz, J2 = 4.0 Hz, 1H), δ 2.07 (d,t J1
= 12.8 Hz, J2 = 4.0 Hz, 1H), δ 1.79 (d,t J1 = 11.6 Hz, J2 = 4.0 Hz, 1H), δ 1.45 (q, J
= 12.0 Hz, 1H), δ 1.21 (q, J = 12.0 Hz, 1H). MALDI FTMS calculated for
C36H55N17O8: 853.442, found 854.451 [M+H]+.

271
E 6.2.2 Synthesis and Characterization of guanidino6 Neo-N-acridine (60)and guanidino5 Neo-N-acridine (61):
Guanidino6 Neo-N-acridine · TFA6 (60), and guanidino5 Neo-N-acridine ·
TFA6 (61). Neo-N-acridine · TFA6 (Section E 6.1.1) (1 mg, 670 nmoles), water
(0.1 mL), 1,4 dioxane (0.4 mL), N,N'-diBoc-N''-triflylguanidine (15 mg, 38
µmoles), triethyl amine (45 µL, 190 µmoles) were incubated at RT for 72 hr, then
the volatiles were removed under reduced pressure. The yellow oil was dissolved
in 1,4 dioxane (0.3 mL) and kept at RT for 72 hr, then concentrated to an oil
under reduced pressure. The Boc-protected products were purified on silica gel
using 8% methanol/CH2Cl2. The mixture of the two Boc protected products were
then deprotected in a deprotection cocktail (4 mL of 88% TFA, 5% water, 5%
phenol, and 2% triisopropylsilane (v/v)) at RT for 2 hr. The reaction was then was
then diluted into 2% acetic acid (30 mL) and washed with diethyl ether (3x10
HN
N
HN
HNO
OO
HN
OH
HOO
HOO
HO
HN
OHO
HO
NH
NH
H2NNH
HNNH2
NH
NH2
NH
NH2NH
H2N
HNNH2
Guanidino6 Neo-N-acridine (60)
HN
N
HN
HNO
OO
H2N
OH
HOO
HOO
HO
HN
OHO
HO
NH
NH
H2NNH
NH
NH2
NH
NH2NH
H2N
HNNH2
Guanidino5 Neo-N-acridine (61)
HN
N
NH2
H2NO
OO
H2N
OH
HOO
HOO
HO
NH2
OHO
HO
NH2
NH2
Neo-N-acridine (38)
N-Tf
NH-BocBoc-HN
TFA

272
mL). The aqueous phase was then reduced to a solid under reduced pressure
and purified on a C-18 reversed phase HPLC column with an isocratic mixture of
11.5% acetonitrile (0.1% TFA) in water (0.1% TFA) (3 mL/min). The UV-vis
extinction coefficients for Neo-N-acridine (Section 6.1.1) were used to quantify
the products and yielded 9 nmoles (1.3%) of guanidino6 neo-N-acridine · TFA6
(60) (Rt = 12.2 min) MALDI FTMS calculated for C42H66N20O12: 1042.517, found
1043.524 [M+H]+. And, 5 nmoles (0.9%) of guanidino5 neo-N-acridine · TFA6 (61)
(Rt = 10.8 min) MALDI FTMS calculated for C41H64N18O12: 1000.495, found
1001.498 [M+H]+.
E 6.7.1 Synthesis and Characterization of Amino-Tobra-BODIPY (65):
6''-TIPS Boc5 Tobramycin. Synthesized as described (Hai Wang Ph. D. Thesis,
University of California, San Diego, 1998).
OHONH2
ONH2
NH2O
ONH2NH2
OH
HO HO
S
NNB
FFO
S
HN
O
Amino Tobra-BODIPY (65)
OHONH2
ONH2
NH2O
ONH2NH2
OH
HO HO
S
O
HS
OHOBoc-HN
OBoc-HN NH-Boc
O
O NH-BocOH
HO HO
O
S OO
β-mercapto-ethylether
TFA
(61%, 2 steps)
6''-TIPS Boc5 Tobramycin
6''-β-mercaptoethylether-Tobramycin
BODIPY C1-IA(47%)
Boc-HN

273
6"-ββββ-Mercaptoethyl Ether Tobramycin · TFA5: 6" TIPS Boc5 Tobramycin (40
mg, 32 µmoles) Cs2CO3 (21 mg, 64 µmoles), dry DMF (3 mL) and 2-mercapto-
ethyl ether (34 µl, 274 µmoles, 8.6 equiv) were stirred under argon for 2h at
30 οC, diluted into ethyl acetate (100 mL), washed with water (4x50 mL), brine
(50 mL) then dried over sodium sulfate. The organic layer was then concentrated
under to an oil reduced pressure, and kept under a high vacuum for 40 min. The
crude product was dissolved in CH2Cl2 (2 mL), 1,2 ethanedithiol (15 µL),
triisopropy silane (15 µL), trifluoroacetic acid (3 mL), and stirred at RT for 15
minn. The reaction was then diluted into toluene (50 mL) and concentrated to a
solid at 50 οC under reduced pressure (2x). The white solid was then dissolved
into water and (100 mL) and washed with CHCl3 (4x50 mL). The aqueous layer
was concentrated under reduced pressure and lyophilized (2x) from 0.1% TFA (3
mL in water) to yield 25 mg of a white powder (61% yield, two steps). 1H-NMR
(400 MHz, D2O) δ 5.59 (d, J = 3.6 Hz, 1H), δ 4.85 (d, J = 4.0 Hz, 1H), δ 3.3-3.8
(m, 17H), δ 3.05 (d,d J1 = 13.6 Hz, J2 = 7.2 Hz, 1H), δ 2.94 (d,d J1 = 11.6 Hz, J2 =
2.4 Hz, 1H), δ 2.65-2.71 (m, 3H), δ 2.57 (t, J = 6.4 Hz, 2H), δ 2.40 (d,t J1 = 12.8
Hz, J2 = 4.0 Hz, 1H), δ 2.14(d,t J1 = 12.4 Hz, J2 = 4.4 Hz, 1H), δ 1.87 (q, J = 11.2
Hz, 1H), δ 1.78 (q, J = 12.8 Hz, 1H). ESI MS calculated for C22H45N5O9S2: 587.3,
found 588.2 [M+H]+.

274
Amino Tobra-BODIPY · HCl (65): 6"-β-Mercaptoethyl ether tobramycin · TFA5 (5
mg, 4.3 µmoles) was dissolved in a degassed aqueous buffer (1 mL of 150 mM
NaCl, 10 mM sodium phosphate pH 7.5, Ar sparged). Separately, BODIPY C1-IA
(2.5 mg, 6 µmoles, 1.4 equiv., Molecular Probes) was dissolved in DMSO (0.75
mL), and added, dropwise, to the tobramycin solution. The reaction was kept in
the dark for 2h at RT then diluted into water (8 mL) and loaded onto an activated
C-18 reversed-phase cartridge (Waters, Sep-pack), the column was washed with
1M NaCl (5 mL), pure water (5 mL), then a 0 – 30% acetonitrile/water gradient
was applied, the fractions between 5 – 15% acetonitrile/water were lyophilized to
yield 2.2 mg (47%) of a red powder. All BODIPY-glycoside conjugates are slightly
to moderately hygroscopic, therefore the absorption at 502nm of each compound
(in methanol) is used to confirm the yield of the conjugation reaction (taking ε502
nm = 76,000 cm-1 M-1). 1H-NMR (400 MHz, D2O) δ 7.39 (s, 1H), δ 6.91 (d, J = 4.0
Hz, 1H), δ 6.30 (d, J = 4.0 Hz, 1H), δ 6.22 (s, 1H), δ 5.55 (d, J = 3.6 Hz, 1H), δ
4.94 (d, J = 4.0 Hz, 1H), δ 4.49 (s, 2H), δ 3.25-3.90 (m, 19H), δ 3.05 (d,d J1 =
13.6 Hz, J2 = 7.2 Hz, 1H), δ 2.93 (d,d J1 = 11.6 Hz, J2 = 2.4 Hz, 1H), δ 2.60-2.67
(m, 5H), δ 2.40 (s, 3H), δ 2.29 (d,t J1 = 12.4 Hz, J2 = 3.6 Hz, 1H), δ 2.10-2.14 (m,
4H), δ 1.84 (q, J = 11.6 Hz, 1H), δ 1.66 (q, J = 12.8 Hz, 1H). MALDI TOF MS
calculated for C36H59BF2N8O10S2: 876.3 found 877.4 [M+H]+, found 899.3
[M+Na]+ found 915.4 [M+K]+.

275
E 6.7.2 Synthesis and Characterization of Guanidino-Tobra-BODIPY (66):
Boc10 Guanidino5 6"-ββββ-Mercaptoethyl Ether Tobramycin: 6"-β-mercaptoethyl
ether tobramycin · TFA5 (Section 6.7.1) (70 mg, 60 µmoles), was dissolved in
methanol (4mL) and treated with N,N′-di-Boc-N′′ -trifylguanidine (420 mg, 1.08
mmoles, 17.9 equiv.), dithiothreitol (42 mg, 272 µmoles), and triethyl amine (210
µL, 1.5 mmoles, 25 eqiv.) for 26 h at RT under argon. The reaction was then
diluted into 150 mL of CHCl3 and washed with 0.1M citric acid (3x50 mL), brine
(50 mL) and dried over sodium sulfate. The organic layer was then concentrated
to a solid and purified on silica gel using flash chromatography and 0 – 2%
methanol in CH2Cl2 to afford 90 mg of an off-white solid (83% yield). 1H-NMR
(400 MHz, CDCl3) δ 11.50 (s, 1H), δ 11.47 (s, overlapping, 2H), δ 11.45 (s, 1H), δ
11.38 (s, 1H), δ 8.86 (d, J = 3.6 Hz, 1H), δ 8.55 (d, J = 9.0 Hz, 1H), δ 8.46 (t, J =
NNB
FF
HN
O
Guanidino Tobra-BODIPY (66)
OHONH2
ONH2
NH2O
ONH2NH2
OH
HO HO
S
O
HS
6''-β-mercaptoethylether-Tobramycin
BODIPY C1-IA (17%)
OHOHN
OHN
HN
O
ONHNH
OH
HO HO
S
O
HS
Boc10Guanidino5-6"-β-Mercaptoethyl-ether Tobramycin
NH-Boc
N-Boc
N-Boc
Boc-HN
NH-Boc
NH-Boc
Boc-N
NH-Boc
N-BocBoc-HN
OHOHN
OHN
HN
O
ONHNH
OH
HO HO
S
O
HS
NH2
NH
NH
H2N
NH2
NH
HN
NH2
NHH2N
Guanidino5-6"-β-MercaptoethyletherTobramycin
(73%)
(83%)
TFA
N-Tf
NH-BocBoc-HN
OHOHN
OHN
HN
O
ONHNH
OH
HO HO
SOS
NH2
NH
NH
H2N
NH2
NHHN
NH2
NHH2N

276
6.3 Hz, 1H), δ 8.17 (d, J = 8.7 Hz, 1H), δ 5.30-5.40 (m, 2H), δ 4.97 (d, J = 3.9 Hz,
1H), δ 4.02 (br d,d J1 = 12 Hz, J2 = 8.4 Hz, 1H), δ 3.78-3.94 (m, 2H), δ 3.31-3.72
(m, 10H), δ 3.18 (br d, J1 = 11.4 Hz, 2H), δ 2.95-3.03 (m, 2H), δ 2.61-2.73 (m,
8H), δ 2.36 (s, 1H), δ 2.02 (s, 1H), δ 1.93 (s, 1H), δ 1.62-1.69 (m, 18H), δ 1.42-
1.51 (m, 18H), δ 1.28 (s, 1H). ESI MS calculated for C77H135N15O29S2: 1797.8,
found 1798.3 [M+H]+, found 899.7 [M+2H]2+.
Guanidino5 6" ββββ-Mercaptoethyl Ether Tobramycin · TFA5: Boc10 guanidino5
6"-β-mercaptoethyelther tobramycin (41 mg, 23 µmoles) was dissolved in CHCl3
(1mL) and treated with triisopropy silane (30 µL, 146 µmoles), 1,2-ethanedithiol
(30 µL, 358 µmoles), and trifluoroacetic acid (1.5mL) for 3 h at RT. The reaction
was then diluted into water (100 mL) and washed with CHCl3 (2x30 mL) and
diethyl ether (2x30 mL). The aqueous layer was concentrated to a solid under
vacuum, then dissolved in 0.1% trifluoroacetic acid in water (2 mL) and
lyophilized to afford 22 mg of a white solid (73% yield). 1H-NMR (400 MHz, d6-
MeOD) δ 5.65 (d, J = 3.6 Hz, 1H), δ 5.06 (d, J = 3.6 Hz, 1H), δ 4.10(t, J = 6.4 Hz,
1H), δ 3.45-3.88 (m, 17H), δ 3.04 (d,d J1 = 13.6 Hz, J2 = 2.8 Hz, 1H), δ 2.62-2.78
(m, 5H), δ 2.11-2.19 (m, 2H), δ 1.68-1.78 (m, 2H). MALDI TOF MS calculated for
C27H55N15O9S2: 797.37, found 820.32 [M+Na]+.

277
Guanidino Tobramycin-BODIPY · HCl (66): Guanidino5 6" β-mercaptoethyl-
ether tobramycin · TFA5 (10 mg, 4.3 µmoles) was added to an aqueous
degassed buffer (2 mL of 50 mM sodium phosphate pH 7.5, Ar sparged),
separately BODIPY C1-IA (2.5 mg, 6 µmoles, 1.4 equiv., Molecular Probes) was
dissolved in DMSO (0.75 mL), and added, dropwise, to the tobramycin solution.
The resulting precipitation of guanidino-tobramycin was partially reversed upon
addition of NaCl (150 mM final concentration) the reaction was then allowed to
react in the dark for 2h at RT and diluted into 5% acetonitrile in water (15 mL,
containing 100 mM NaCl) and loaded onto an activated C-18 reversed-phase
cartridge (Waters, Sep-pack). The column was then washed with 5 mL of water
and the product was eluted with 25% acetonitrile/water and lyophilized to yield
1.3 mg (17% yield) of a red powder. All BODIPY-glycoside conjugates are slightly
to moderately hygroscopic, the absorption at 502nm (in methanol) was used to
calculate the yield of the conjugation reaction (taking ε502 nm = 76,000 cm-1 M-1).
The low yield of this particular reaction was attributed to the solubility problems of
the guanidino-tobramycin starting material in 50 mM phosphate/25% DMSO in
water (its solubility in 10 mM sodium phosphate pH 7.5, 250 mM NaCl, 25%
DMSO is, however, significantly better). 1H-NMR (400 MHz, D2O) δ 7.41 (s, 1H),
δ 6.92 (d, J = 3.6 Hz, 1H), δ 6.31 (d, J = 3.6 Hz, 1H), δ 6.24 (s, 1H), δ 5.40 (d, J =
3.6 Hz, 1H), δ 4.98 (s, 1H), δ 4.51 (s, 2H), δ 4.03 (t, J = 6.8 Hz, 1H), δ 3.79 (t, J =
8.4 Hz, 1H), δ 3.27-3.64 (m, 18H), δ 2.90 (d, J = 13.2 Hz, 1H), δ 2.55-2.67 (m,
5H), δ 2.41 (s, 3H), δ 2.02-2.15 (m, 5H), δ 1.54-1.62 (m, 2H). MALDI TOF

278
calculated for C41H69BF2N18O10S2:1086.49, found 1087.36 [M+H]+, found
1109.30 [M+Na]+.
E 6.7.3 Synthesis and Characterization of Amino-Neo-BODIPY (67):
Amino Neo-BODIPY · HCl (67) : 5" β-mercaptoethylether neomycin B · TFA6
(Section 6.3.1) (10 mg, 7 µmoles), was dissolved in an aqueous buffer (1.5 mL of
10 mM sodium phosphate, 150 mM NaCl, pH 7.5, Ar sparged), separately,
BODIPY C1-IA (1.8 mg, 4.3 µmoles, 0.61 equiv., Molecular Probes) was
dissolved in DMSO (1.5 mL), and added, dropwise, to the neomycin solution and
allowed to react in the dark for 2h at RT. The reaction was then diluted into water
(8 mL) and loaded onto an activated C-18 reversed-phase cartridge (Waters,
Sep-pack), the column was then washed with 5% acetonitrile (5 mL, containing
100 mM NaCl in water), then pure water (1 mL), and the product eluted between
0 – 15% acetonitrile (in water) and lyophilized to yield 2.9 mg (55% yield) of a red
powder. All BODIPY-glycoside conjugates are slightly to moderately hygroscopic,
therefore the absorption at 502nm of each compound (in methanol) is used to
confirm the yield of the conjugation reaction (taking ε502 nm = 76,000 cm-1 M-1).
O
NH2
NH2O
HOHO
OO
NH2
OH
NH2
OHO
HOO
S
HO
NH2
NH2
NNB
FF
OS
NH
O
Amino Neo-BODIPY (67)
O
NH2
NH2O
HOHO
OO
NH2
OH
NH2
OHO
HOO
S
HO
NH2
NH2
OHS
5''-β-mercaptoethylether-neomycin B
NNB
FF NH
OI
DMSO, water (pH 7.5)(55%)

279
1H-NMR (400 MHz, D2O) δ 7.41 (s, 1H), δ 6.92 (d, J = 4.0 Hz, 1H), δ 6.30 (d, J =
4.0 Hz, 1H), δ 6.24 (s, 1H), δ 5.89 (d, J = 4.0 Hz, 1H), δ 5.27 (d, J = 3.6 Hz, 1H),
δ 5.15 (s, 1H), δ 4.50 (s, 2H), δ 4.26-4.32 (m, 2H), δ 4.21 (p, J = 4.0 Hz, 1H), δ
4.15 (t, J = 4.4 Hz, 1H), δ 4.07 (t, J = 3.2 Hz, 1H), δ 3.83-3.88 (m, 3H), δ 3.77 (t, J
= 9.2 Hz, 1H), δ 3.67 (s, 1H), δ 3.53-3.59 (m, 4H), δ 3.45 (s, 1H), δ 3.40 (d,d J1 =
11.2 Hz, J2 = 4.0 Hz, 1H), δ 3.67 (s, 1H), δ 3.20-3.35 (m, 5H), δ 3.09 (d d, J1 =
13.2 Hz, J2 = 7.6 Hz, 1H), δ 2.98 (d d, J1 = 13.6 Hz, J2 = 4.4 Hz, 1H), δ 2.67-2.77
(m, 5H), δ 2.41 (s, 3H), δ 2.25 (d t, J1 = 12.4 Hz, J2 = 4.4 Hz, 1H), δ 2.15 (s, 3H),
δ 1.65 (q, J = 12.8 Hz, 1H). MALDI TOF MS calculated for C41H68BF2N9O14S2:
1023.44, observed 1024.42 [M+H]+, observed 1046.43 [M+Na]+, observed
1062.54 [M+K]+.

280
E 6.7.4 Synthesis and Characterization of Guanidino Neo-BODIPY (68):
Boc12 Guanidino6-5"-ββββ-Mercaptoethylether Neomycin: 5" β-Mercaptoethyl
ether Neomycin B · TFA6 (Section E 6.3.1) (90 mg, 63 µmoles), was dissolved in
methanol (5 mL), CHCl3 (3 mL), and treated with N,N′-di-Boc-N′′ -trifylguanidine
(530 mg, 1.35 mmoles, 21 equiv.), dithiothreitol (50 mg, 324 µmoles), and triethyl
amine (530 µL, 3.8 mmoles, 60 eqiv.) for 96 h at RT under argon. The reaction
was then diluted into CHCl3 (200 mL) and washed with 0.1M citric acid (2x100
mL), brine (50 mL) and dried over sodium sulfate. The organic layer was then
concentrated to a solid under reduced pressure and purified on silica gel using
flash chromatography (0-1% methanol in CHCl3 to afford 71 mg of an off-white
NNB
FF NH
O
Guanidino Neo-BODIPY (68)
O
NH2
NH2O
HOHO
OO
NH2
OH
NH2
OHO
HOO
S
HO
NH2
NH2
OHS
5''-β-mercaptoethylether-neomycin B
BODIPY C1-IA (56%)
Boc12Guanidino6-5"-β-Mercaptoethyl-ether Neomycin B
Guanidino6-6"-β-Mercaptoethylether Nwomycin B
(52%)
N-Tf
NH-BocBoc-HN
O
HN
HNO
HOHO
OO
NH
OH
NH
OHO
HOO
S
HO
HN
NH
OHS
NH2
NH
NH2
NH
NHH2N
NHH2N
NHH2N
H2NNH
O
HN
HNO
HOHO
OO
NH
OH
NH
OHO
HOO
S
HO
HN
NH
OHS
NH-Boc
N-Boc
NH-Boc
N-Boc
N-BocBoc-HN
N-BocBoc-HN
N-Boc
Boc-HN
Boc-HN
N-Boc
(60%)
TFA
O
HN
HNO
HOHO
OO
NH
OH
NH
OHO
HOO
S
HO
HN
NH
OS
NH2
NH
NH2
NH
NHH2N
NHH2N
NHH2N
H2NNH

281
solid (52% yield). 1H-NMR (300 MHz, CDCl3) δ 11.41 (s, 2H, overlapping), δ
11.40 (s, 1H), δ 11.38 (s, 1H), δ 11.33 (s, 1H), δ 11.30 (s, 1H), δ 9.34 (d, J = 8.1
Hz, 1H), δ 8.92 (d, J = 7.2 Hz, 1H), δ 8.47 (t, J = 5.4 Hz, 1H), δ 8.41 (t, J = 5.4
Hz, 1H), δ 8.34 (d, J = 6.6 Hz, 1H), δ 8.18 (d, J = 9.0 Hz, 1H), δ 5.94 (d, J = 4.4
Hz, 1H), δ 5.62 (d, J = 4.2 Hz, 1H), δ 5.01 (d, J = 4.8 Hz, 1H), δ 4.91-4.94 (m,
2H), δ 4.38-4.95 (m, 3H), 4.05-4.22 (m, 4H), δ 3.79-3.92 (m, 3H), δ 3.66-3.74 (m,
2H), δ 3.55-3.59 (m, 4H), δ 3.25-3.42 (m, 4H), δ 2.54-2.74 (m, 5H), δ 2.44 (d t, J1
= 12.4 Hz, J2 = 4.4 Hz, 1H), δ 1.22-1.60 (m, 109H). ESI MS calculated for
C94H163N17O37S2: 2186.1, found 1094.2 [M+2H]2+.
Guanidino6 5"-ββββ-Mercaptoethylether Neomycin B · TFA6. Boc12 Guanidino6-
5"-β-mercaptoethyl ether neomycin (65 mg, 30µmoles) was dissolved in CHCl3
(1.5 mL) and treated with triisopropy silane (80 µL, 390 µmoles), 1,2-
ethanedithiol (30 µL, 955 µmoles), and trifluoroacetic acid (3 mL) for 3 h at RT.
The reaction was then diluted into water (200 mL) and washed with CHCl3
(2x100 mL) and diethyl ether (2x50 mL). The aqueous layer was then
concentrated to a solid under reduced pressure, dissolved in 0.1% trifluoroacetic
acid in water (2 mL) and lyophilized to afford 30 mg of a white solid (60% yield).
1H-NMR (400 MHz, D2O) δ 5.83 (d, J = 3.2 Hz, 1H), δ 5.05 (s, 1H), δ 4.94 (s, 1H),
δ 4.23-4.26 (m, 2H), δ 3.93-4.03 (m, 3H), δ 3.25-3.69 (m, 20H), δ 2.87 (d,d J1 =
14.4 Hz, J2 = 4.4 Hz, 1H), δ 2.55-2.67 (m, 5H), δ 2.08 (d t, J1 = 12.0 Hz, J2 = 4.4

282
Hz, 1H), δ 1.71 (q, J = 12.0 Hz, 1H). MALDI TOF MS calculated for
C33H66N18O13S2: 986.45, found 987.49 [M+H]+.
Guanidino Neo-BODIPY · HCl (68). Guanidino6 5"-β-Mercaptoethylether
Neomycin B · TFA6 (9 mg, 5.4 µmoles) was dissolved in an aqueous buffer (3.0
mL of 10 mM sodium phosphate pH 7.5, 150 mM NaCl, Ar sparged), separately
BODIPY C1-IA (1.7 mg, 4.1 µmoles, 0.76 equiv., Molecular Probes) was
dissolved in DMSO (1.5 mL), and added, dropwise, to the neomycin solution and
allowed to react in the dark for 2h at RT. The reaction was then diluted into water
(8 mL) and loaded onto an activated C-18 reversed-phase cartridge (Waters,
Sep-pack), the column was washed with 5% acetonitrile (5 mL, containing 100
mM NaCl in water), then pure water (1 mL), the product eluted between 0 – 20%
acetonitrile (in water) and was lyophilized to yield 4.5 mg (56% yield) of a red
powder. All BODIPY-glycoside conjugates are slightly to moderately hygroscopic,
therefore the absorption at 502nm of each compound (in methanol) is used to
confirm the yield of the conjugation reaction (taking ε502 nm = 76,000 cm-1 M-1). 1H-
NMR (400 MHz, D2O) δ 7.40 (s, 1H), δ 6.92 (d, J = 4.0 Hz, 1H), δ 6.31 (d, J = 4.0
Hz, 1H), δ 6.24 (s, 1H), δ 5.84 (d, J = 3.6 Hz, 1H), δ 5.07 (s, 1H), δ 4.91 (s, 1H), δ
4.51 (s, 2H), δ 4.21-4.24 (m, 2H), δ 3.93-4.00 (m, 3H), δ 3.80 (t, J = 8.4 Hz, 1H),
δ 3.66-3.71 (m, 2H), δ 3.25-3.55 (m, 15H), δ 2.80 (d,d J1 = 14.4 Hz, J2 = 4.4 Hz,
1H), δ 2.50-2.67 (m, 6H), δ 2.41 (s, 3H), δ 2.15 (s, 3H), δ 2.08 (d t, J1 = 12.0 Hz,
J2 = 4.4 Hz, 1H), δ 1.57 (q, J = 12.0 Hz, 1H). MALDI TOF MS calculated for
C47H80BF2N21O14S2: 1275.57, found 1276.57 [M+H]+.

283
E 6.7.5 Synthesis and Characterization of Amino-Tobra-Fluorescein (69):
Amino Tobra-Fluorescein · TFA5 (69): 6"-β-mercaptoethyl ether tobramycin ·
TFA5 (Section 6.7.1) (3 mg, 2.6 µmoles) was dissolved in an aqueous degassed
buffer (2 mL of 400 mM NaCl, 25 mM sodium phosphate pH 7.5, Ar sparged),
separately 5-iodo-acetamido-fluorescein (5-IAF) (3.0 mg, 5.8 µmoles, 2.0 equiv.,
Molecular Probes) was dissolved in DMSO (1 mL), and added, dropwise, to the
tobramycin solution and allowed to react in the dark for 2h at RT then 0.1M HCl
was added until the solution turned from orange to yellow. The reaction was then
diluted into water (8 mL) and loaded onto an activated C-18 reversed-phase
cartridge (Waters, Sep-pack), the column was then washed with pure water (10
mL), and the product was eluted with 20% acetonitrile/water, lyophilized, and
found to be >95% pure by HLPC. The product was purified further using a C-18
reversed phase HPLC column with an isocratic mixture of 20% acetonitrile (0.1%
TFA) in water (0.1% TFA) (3 mL/min) (Rt = 8.5 min) to yield 3.3 mg (77%) of an
orange solid. All fluorescein-glycoside conjugates are slightly to moderately
hygroscopic, therefore the absorption at 496nm (in aqueous buffer pH 9.0) of
Amino Tobra-Fluorescein (69)
OHONH2
ONH2
NH2O
ONH2NH2
OH
HO HO
S
O
HS
6''-β-mercaptoethylether-Tobramycin
(77%)
OHONH2
ONH2
NH2O
ONH2NH2
OH
HO HO
S
OS
O CO2H
HO
O
NH
O
5-IAF

284
each compound is used to confirm the yield of the conjugation reaction (taking
ε502 nm = 77,000 cm-1 M-1). 1H-NMR (400 MHz, D2O) δ 8.13 (d, J = 2.0 Hz, 1H), δ
7.67 (d,d J1 = 8.4 Hz, J2 = 1.6 Hz, 1H), δ 7.15-7.22 (m, 3H), δ 6.93 (d, J = 2.4 Hz,
2H), 6.77-6.80 (m, 2H), δ 5.53 (d, J = 2.8 Hz, 1H), δ 4.85 (d, J = 3.6 Hz, 1H), δ
3.22-3.83 (m, 21H), δ 3.05 (d,d J1 = 13.2 Hz, J2 = 7.2 Hz, 1H), δ 2.87 (d,d J1 =
11.6 Hz, J2 = 2.0 Hz, 1H), δ 2.77 (t, J = 5.8 Hz, 2H), δ 2.57-2.65 (m, 3H), δ 2.36
(d,t J1 = 12.0 Hz, J2 = 3.6 Hz, 1H), δ 2.09 (d,t J1 = 12.4 Hz, J2 = 3.6 Hz, 1H), δ
1.83 (q, J = 11.6 Hz, 1H), δ 1.74 (q, J = 12.4 Hz, 1H). MALDI TOF MS calculated
for C44H58N6O15S2: 974.34 found 975.42 [M+H]+, found 997.43 [M+Na]+ found
1013.41 [M+K]+.
E 6.7.6 Synthesis and Characterization of GuanidinoTobra-Fluorescein (70):
Guanidino Tobra-Fluorescein · TFA5 (70): Boc10 guanidino5 6" β-mercaptoethyl
ether tobramycin (Section 6.7.2) (10 mg, 5.6 µmoles), DMF (3 mL), Cs2CO3 (30
mg), and 5-iodo-acetamido-fluorescein (5-IAF) (5 mg, 9.7 µmoles, 1.7 equiv.,
Molecular Probes) were stirred at RT in the dark for 2h then diluted into ethyl
Guanidino Tobra-Fluorescein (70)
OHOHN
OHN
HN
O
ONHNH
OH
HO HO
NH2
NH
NH
H2N
NH2
NHHN
NH2
NHH2N
S
OS
O CO2H
HO
O
NH
O
(29%, 2 steps)
5-IAFOHOHN
OHN
HN
O
ONHNH
OH
HO HO
S
O
HS
Boc10Guanidino5-6"-β-Mercaptoethyl-ether Tobramycin
NH-Boc
N-Boc
N-BocBoc-HN
NH-Boc
NH-Boc
Boc-N
NH-Boc
N-BocBoc-HN
TFA
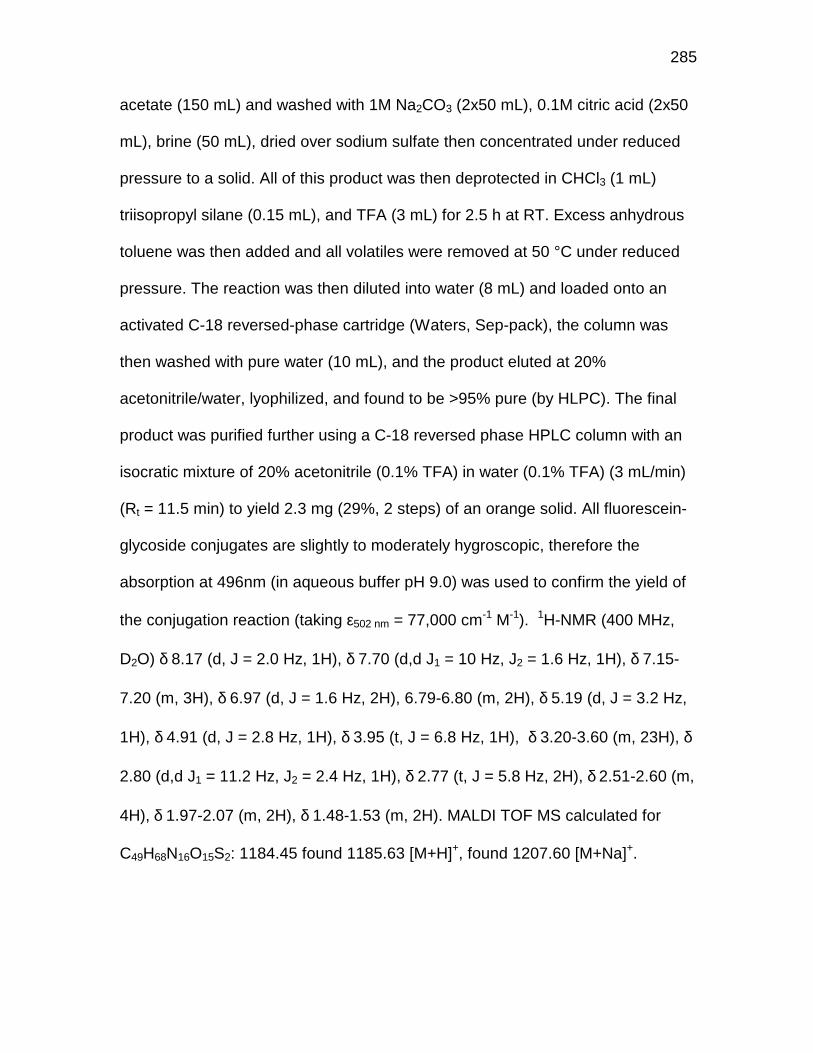
285
acetate (150 mL) and washed with 1M Na2CO3 (2x50 mL), 0.1M citric acid (2x50
mL), brine (50 mL), dried over sodium sulfate then concentrated under reduced
pressure to a solid. All of this product was then deprotected in CHCl3 (1 mL)
triisopropyl silane (0.15 mL), and TFA (3 mL) for 2.5 h at RT. Excess anhydrous
toluene was then added and all volatiles were removed at 50 °C under reduced
pressure. The reaction was then diluted into water (8 mL) and loaded onto an
activated C-18 reversed-phase cartridge (Waters, Sep-pack), the column was
then washed with pure water (10 mL), and the product eluted at 20%
acetonitrile/water, lyophilized, and found to be >95% pure (by HLPC). The final
product was purified further using a C-18 reversed phase HPLC column with an
isocratic mixture of 20% acetonitrile (0.1% TFA) in water (0.1% TFA) (3 mL/min)
(Rt = 11.5 min) to yield 2.3 mg (29%, 2 steps) of an orange solid. All fluorescein-
glycoside conjugates are slightly to moderately hygroscopic, therefore the
absorption at 496nm (in aqueous buffer pH 9.0) was used to confirm the yield of
the conjugation reaction (taking ε502 nm = 77,000 cm-1 M-1). 1H-NMR (400 MHz,
D2O) δ 8.17 (d, J = 2.0 Hz, 1H), δ 7.70 (d,d J1 = 10 Hz, J2 = 1.6 Hz, 1H), δ 7.15-
7.20 (m, 3H), δ 6.97 (d, J = 1.6 Hz, 2H), 6.79-6.80 (m, 2H), δ 5.19 (d, J = 3.2 Hz,
1H), δ 4.91 (d, J = 2.8 Hz, 1H), δ 3.95 (t, J = 6.8 Hz, 1H), δ 3.20-3.60 (m, 23H), δ
2.80 (d,d J1 = 11.2 Hz, J2 = 2.4 Hz, 1H), δ 2.77 (t, J = 5.8 Hz, 2H), δ 2.51-2.60 (m,
4H), δ 1.97-2.07 (m, 2H), δ 1.48-1.53 (m, 2H). MALDI TOF MS calculated for
C49H68N16O15S2: 1184.45 found 1185.63 [M+H]+, found 1207.60 [M+Na]+.

286
E 6.7.7 Synthesis and Characterization of Guanidino-Neo-Fluorescein (71):
Guanidino-Neo-Fluorescein · TFA6 (71): Boc12 guanidino6-5"-β-mercapto-
ethylether neomycin (Section 6.7.4) (3 mg, 1.4 µmoles), DMF (0.5 mL), 5-iodo-
acetamido-fluorescein (5-IAF) (5 mg, 9.7 µmoles, 1.7 equiv., Molecular Probes),
and triethyl amine (20 µL) were stirred at RT in the dark for 2h then diluted into
ethyl acetate (150 mL) and washed with 1M Na2CO3 (4x50 mL), 0.1M citric acid
(2x50 mL), brine (50 mL), dried over sodium sulfate then concentrated under
reduced pressure to a solid. All of this product was then deprotected in CHCl3 (3
mL) triisopropyl silane (0.05 mL), and TFA (5 mL) for 3.5 h at RT. Excess
anhydrous toluene was then added and all volatiles were removed at 50 °C
under reduced pressure. The reaction was then diluted into water (8 mL, 300 mM
NaCl) and loaded onto an activated C-18 reversed-phase cartridge (Waters, Sep-
pack), the column was then washed with pure water (10 mL), and the product
eluted between 5-20% acetonitrile/water (0.001 M HCl), lyophilized, and found to
be >85% pure (by HLPC). The product was purified further using a C-18 reversed
phase HPLC column with an isocratic mixture of 20% acetonitrile (0.1% TFA) in
Guanidino Neo-Fluorescein (71)Boc12Guanidino6-5"-β-Mercaptoethyl-ether Neomycin B
O
HN
HNO
HOHO
OO
NH
OH
NH
OHO
HOO
S
HO
HN
NH
OHS
NH-Boc
N-Boc
NH-Boc
N-Boc
N-BocBoc-HN
N-BocBoc-HN
N-Boc
Boc-HN
Boc-HN
N-Boc
(45%, 2 steps)
TFA
O
HN
HNO
HOHO
OO
NH
OH
NH
OHO
HOO
S
HO
HN
NH
OS
NH2
NH
NH2
NH
NHH2N
NHH2N
NHH2N
H2NNH
5-IAF
O CO2H
HO
O
NH
O

287
water (0.1% TFA) (3 mL/min) (Rt = 9.3 min) to yield 1.3 mg (45%, 2 steps) of an
orange solid. All fluorescein-glycoside conjugates are slightly to moderately
hygroscopic, therefore the absorption at 496nm (in aqueous buffer pH 9.0) was
used to confirm the yield of the conjugation reaction (taking ε502 nm = 77,000 cm-1
M-1). 1H-NMR (400 MHz, D2O): δ 8.12 (d, J = 2.0 Hz, 1H), δ 7.72 (d,d J1 = 8.8 Hz,
J2 = 1.6 Hz, 1H), δ 7.22 (d, J = 8.8 Hz, 1H), δ 7.11 (d, J = 9.2 Hz, 2H), δ 6.92 (d, J
= 2.4 Hz, 2H), δ 6.76 (d,d J1 = 8.8 Hz, J2 = 2.4 Hz, 1H), δ 5.69 (d, J = 4.0 Hz, 1H),
δ 4.98 (s, 1H), δ 4.87 (s, 1H), δ 4.18-4.24 (m, 2H), δ 3.85-3.88 (m, 3H), δ 3.16-
3.62 (m, 18H), δ 2.71-2.78 (m, 4H), δ 2.42-2.52 (m, 4H), δ 2.01 (d t, J1 = 12.0 Hz,
J2 = 4.4 Hz, 1H), δ 1.48 (q, J = 12.0 Hz, 1H). MALDI TOF MS calculated for
C55H79N19O19S2:1373.53, found 1374.72 [M+H]+.
E 6.8.1 Synthesis and Characterization of BODIPY-CR9 (72):
ace-CRRRRRRRRR-am · TFA9. Standard Fmoc solid-phase synthesis was
manually employed. Fmoc PAL PEG PS resin (1 g, 0.15 mmole, PerSeptive
Biosystems), was deprotected using 20% piperidine in DMF for 20 min at RT,
washed with DMF (3x7 mL), diethyl ether (2x7 mL), and DMF (3x7 mL), then
treated with TBTU (97 mg, 0.3 mmoles), Fmoc Arg (Pbf)-OH (195 mg, 0.3
mmoles), HOBt (46 mg, 0.3 mmoles), 2,4,6 collidine (0.4 mL, 3.0 mmoles), in
PEG NH
O
O
OCH3
OCH3
NH-Fmoc
piperidine/DMF
Fmoc-Arg(Pbf)-OH
HOBt/TBTU9
Fmoc PAL PEG PS Resin
HOBt/TBTU
Fmoc-Arg(Pbf)-OH
piperidine/DMF (Ac)2O
TFA aceCRRRRRRRRRam

288
DMF (7 mL), for at least 1 hr at RT on shaker. The resin is then washed, and the
deprotection and coupling processes were repeated nine times total, the final
coupling reaction utilized Fmoc Cys (Trt)-OH (264 mg, 0.45 mmoles), TBTU (145
mg, 0.45 mmoles), HOBt (46 mg, 0.45 mmoles), 2,4,6 collidine (0.6 mL, 4.5
mmoles), in DMF (7 mL) and lasted for 2 h at RT on a shaker. Following
deprotection and washes (as above), the N-terminus was acylated using HOBt
(80 mg, 0.78 mmoles), diisopropyl ethyl amine (0.9 mL), acetic anhydride (1.9
mL) in DMF (5mL) for 1 h at RT on a shaker. The resin was then washed with
DMF (3x7 mL), diethyl ether (2x7 mL), CHCl3 (4x7 mL) and deprotected with TFA
(9 mL) in the presence of triisopropy silane (400 µL, 2 moles) and 1,2-
ethanedithiol (0.2 mL, 6.4 mmoles) for 2.5 h at RT on a shaker. The solution was
then drained into 1% acetic acid/water (180 mL) and washed with CHCl3 (3x80
mL) and diethyl ether (3x80 mL). The aqueous layer was then concentrated to a
solid and lyophilized from 0.1% TFA in water. The crude peptide was purified
using a 9% acetonitrile/water (0.1% TFA) isocratic mixture on a C-18 reversed
phase HPLC column (3 mL/min retention time 10-12 min). and lyophilized to
afford a white solid (40 mg, 10%). MALDI TOF MS calculated for C59H118N38O115:
1566.96, found 1567.82 [M+H]+.

289
BODIPY-CR9 · HCl (72). The purified peptide ace-CRRRRRRRRR-am · TFA9 (10
mg, 3.86 umoles) was dissolved in an aqueous degassed buffer (1 mL of 100
mM NaCl, 10 mM phosphate pH 7.5, Ar sparged) and treated (dropwise) with a
solution of BODIPY C1-IA (1.3 mg, 3.1 µmoles, 0.81 equiv., Molecular Probes)
dissolved in DMSO (1.25 mL) and allowed to react in the dark for 1h at RT, then
diluted with 8 mL of water and loaded onto an activated C-18 reversed-phase
cartridge (Waters, Sep-pack), the column was then washed with 5% acetonitrile
(5 mL containing 100 mM NaCl in water), 1mL pure water, the product eluted
between 0 – 20% acetonitrile (in water) and lyophilized to yield 3.8 mg (56%
yield) of a red powder. All BODIPY-glycoside conjugates are slightly to
moderately hygroscopic, therefore the absorption at 502nm (in methanol) of each
compound was used to calculate the yield of the conjugation reaction (taking ε502
nm = 76,000 cm-1 M-1). 1H-NMR (400 MHz, D2O) δ 7.43 (s, 1H), δ 6.91 (d, J = 3.6
Hz, 1H), δ 6.29 (d, J = 3.6 Hz, 1H), δ 6.25 (s, 1H), δ 4.53 (s, 2H), δ 4.32 (t, J = 7.2
Hz, 1H), δ 4.13-4.23 (m, 10H), δ 3.34 (s, 2H), δ 2.96-3.08 (m, 18H), δ 2.86 (d, J =
6.8 Hz, 2H), δ 2.42 (s, 3H), δ 2.17 (s, 3H), δ 1.89 (s, 3H), δ 1.50-1.71 (m, 36H).
The 1H NMR suggests better than 95 % purity. MALDI TOF MS calculated for
C73H132BF2N41O12S: 1856, found 1857 [M+H]+.
NNB
FFI
NH
OaceCRRRRRRRRRam aceCRRRRRRRRRam
NNB
FF NH
OS
DMSO, water (pH 7.5)(56%)
BODIPY-CR9 (72)

290
E 6.8.2 Synthesis and Characterization of Fluorescein-CR9 (73):
Fluorescein-CR9 · TFA9 (73). The purified peptide ace-CRRRRRRRRR-am ·
TFA9 (10 mg, 3.86 µmoles) was dissolved in a an aqueous degassed buffer (1
mL of 100 mM NaCl, 10 mM phosphate pH 7.5, Ar sparged) and treated
(dropwise) with a solution of BODIPY C1-IA (1.3 mg, 3.1 µmoles, 0.81 equiv.,
Molecular Probes) pre-dissolved in DMSO (1.25 mL) and allowed to react in the
dark for 1h at RT. 0.1M HCl was then added drop-wise until the solution turned
from orange to yellow. The reaction was diluted into water (8 mL) and loaded
onto an activated C-18 reversed-phase cartridge (Waters, Sep-pack), the column
was washed with pure water (10 mL), and the product eluted with 30%
acetonitrile/water, lyophilized, and found to be >85% pure by HLPC. The final
product was purified to >98% purity using a C-18 reversed phase HPLC column
with an isocratic mixture of 20% acetonitrile (0.1% TFA) in water (0.1% TFA) (3
mL/min) (Rt = 6.5 min) to yield 4.2 mg (37%) of an orange solid. All fluorescein-
glycoside conjugates are slightly to moderately hygroscopic, therefore the
absorption at 496nm (in aqueous buffer pH 9.0) of each compound is used to
confirm the yield of the conjugation reaction (taking ε502 nm = 77,000 cm-1 M-1).
I
O CO2H
HO
O
NH
OaceCRRRRRRRRRam aceCRRRRRRRRRam
DMSO, water (pH 7.5)(37%) Fluorescein-CR9 (73)
S
O CO2H
HO
O
NH
O

291
1H-NMR (400 MHz, D2O) is consistent with the desired structure, but the
expected number of aromatic peaks are multiplied, suggesting partial protonation
of fluorescein. MALDI TOF MS calculated for C81H131N39O17S: 1954.03,
observed 1955.18 [M+H]+.
E 6.8.3 Synthesis and Characterization of Amino Neo-pyridyl disulfide (74):
Boc6 5'' ββββ-mercaptoethyl ether pyridyl disulfide neomycin B. Synthesized as
described (Hai Wang Ph. D. Thesis, University of California, San Diego, 1998).
Amino Neo-pyridyl disulfide · TFA6 (74). Boc6 5'' β-mercaptoethyl ether pyridyl
disulfide neomycin B (80 mg, 55 µmoles), CH2Cl2 (5 mL), triisopropyl silane (120
µL), TFA (6 mL) were reacted at RT for 15 min then partitioned into 0.1% acetic
acid (80 mL in water) and diethyl ether (50 mL). The aqueous layer was then
washed with diethyl ether (40 mL), CH2Cl2 (40 mL), CHCl3 (40 mL), ethyl acetate
(20 mL), and diethyl ether (40 mL). The aqueous layer was then concentrated to
a solid, under reduced pressure. The product was lyophilized from 0.01% TFA in
O
NHBoc
BocHNO
HOHO
OO
BocHN
OH
NHBoc
HOO
HOO
HO
NHBoc
BocNH
Boc6 5'' β-Mercaptoethyl-ether pyridyl disulfideNeomycin B
SO
S
S
NO
NH2
H2NO
HOHO
OO
H2N
OH
NH2
HOO
HOO
HO
NH2
NH2
SO
S
S
N
Amino Neo-pyridyl disulfide (74)
TFA
(76%)
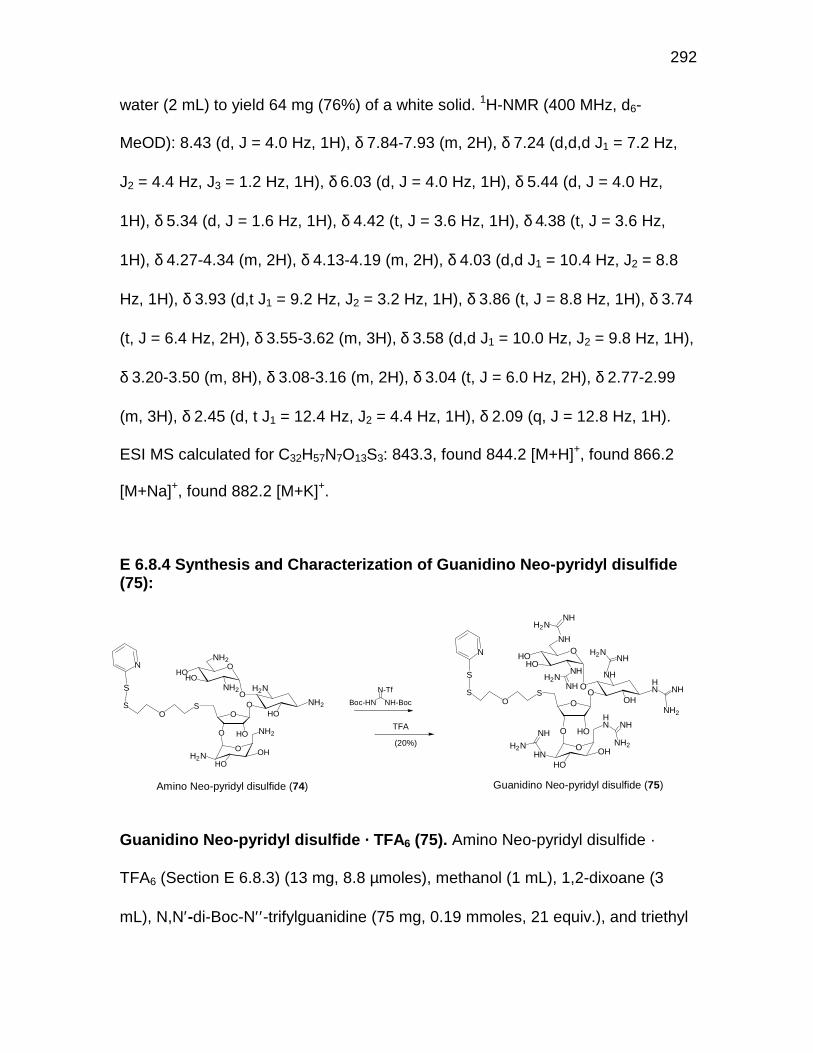
292
water (2 mL) to yield 64 mg (76%) of a white solid. 1H-NMR (400 MHz, d6-
MeOD): 8.43 (d, J = 4.0 Hz, 1H), δ 7.84-7.93 (m, 2H), δ 7.24 (d,d,d J1 = 7.2 Hz,
J2 = 4.4 Hz, J3 = 1.2 Hz, 1H), δ 6.03 (d, J = 4.0 Hz, 1H), δ 5.44 (d, J = 4.0 Hz,
1H), δ 5.34 (d, J = 1.6 Hz, 1H), δ 4.42 (t, J = 3.6 Hz, 1H), δ 4.38 (t, J = 3.6 Hz,
1H), δ 4.27-4.34 (m, 2H), δ 4.13-4.19 (m, 2H), δ 4.03 (d,d J1 = 10.4 Hz, J2 = 8.8
Hz, 1H), δ 3.93 (d,t J1 = 9.2 Hz, J2 = 3.2 Hz, 1H), δ 3.86 (t, J = 8.8 Hz, 1H), δ 3.74
(t, J = 6.4 Hz, 2H), δ 3.55-3.62 (m, 3H), δ 3.58 (d,d J1 = 10.0 Hz, J2 = 9.8 Hz, 1H),
δ 3.20-3.50 (m, 8H), δ 3.08-3.16 (m, 2H), δ 3.04 (t, J = 6.0 Hz, 2H), δ 2.77-2.99
(m, 3H), δ 2.45 (d, t J1 = 12.4 Hz, J2 = 4.4 Hz, 1H), δ 2.09 (q, J = 12.8 Hz, 1H).
ESI MS calculated for C32H57N7O13S3: 843.3, found 844.2 [M+H]+, found 866.2
[M+Na]+, found 882.2 [M+K]+.
E 6.8.4 Synthesis and Characterization of Guanidino Neo-pyridyl disulfide(75):
Guanidino Neo-pyridyl disulfide · TFA6 (75). Amino Neo-pyridyl disulfide ·
TFA6 (Section E 6.8.3) (13 mg, 8.8 µmoles), methanol (1 mL), 1,2-dixoane (3
mL), N,N′-di-Boc-N′′ -trifylguanidine (75 mg, 0.19 mmoles, 21 equiv.), and triethyl
O
NH2
H2NO
HOHO
OO
H2N
OH
NH2
HOO
HOO
HO
NH2
NH2
SO
S
S
N
Amino Neo-pyridyl disulfide (74)
N-Tf
NH-BocBoc-HN
(20%)
TFA
O
HN
HNO
HOHO
OO
NH
OH
NH
OHO
HOO
HO
HN
NH
NH2
NH
NH2
NH
NHH2N
NHH2N
NH
H2N
H2NNH
SO
S
S
N
Guanidino Neo-pyridyl disulfide (75)

293
amine (100 µl, 0.72 mmoles, 80 eqiv.) were stirred together for 96 h at RT under
Ar. All volatiles were then removed and the oil was treated with CHCl3 (1 mL),
N,N′-di-Boc-N′′ -trifylguanidine (15 mg, 0.038 mmoles, 4 equiv.), and triethyl
amine (60 µL, 0.43 mmoles, 49 eqiv.) for 24 h at RT under Ar. All volatiles were
then removed under reduced pressure and the resulting oil was dissolved CHCl3
(100 mL) and washed with 1 M NaH2PO4 (40 mL), water (40 mL), and brine (40
mL). The organic phase was then dried over sodium sulfate, concentrated to a
solid, and purified using silica gel (40 mL) and flash chromatography with a 0 –
3% methanol/CH2Cl2 gradient to yield ~5 mg of a white solid. Rf = 0.2 (2.5%
methanol/CH2Cl2). All of this product was deprotected by adding CHCl3 (1 mL),
TFA (2 mL) and stirring at RT for 2 hr. The reaction was then diluted into
anhydrous toluene and concentrated to a solid under reduced pressure (at 45
°C). HLPC was used to purify the final product using a C18 reversed phase semi-
prep column at 3.5 mL/min and an isocratic mixture of 12% acetonitrile in water
(0.1% TFA), fractions were collected (Rt = 10.2 min) and lyophilized to yield 3 mg
of a white solid (20%). 1H-NMR (400 MHz, d6-MeOD): δ 8.41 (d, J = 4.4 Hz), δ
7.81-7.89 (m, 2H), δ 7.24 (d,d,d J1 = 7.2 Hz, J2 = 4.8 Hz, J3 = 1.2 Hz, 1H), δ 6.06
(d, J = 3.2 Hz, 1H), δ 5.15 (d, J = 2.8 Hz, 1H), δ 5.07 (d, J = 1.2 Hz, 1H), δ 4.30-
4.32 (m, 2H), δ 4.05-4.11 (m, 2H), δ 3.99 (t, J = 3.4 Hz, 1H), δ 3.71-3.80 (m,
5H), δ 3.41-3.63 (m, 12H), δ 3.03 (t, J = 6.2 Hz, 2H), δ 2.95 (d,d J1 = 13.2 Hz, J2
= 4.4 Hz, 1H), δ 2.67-2.76 (m, 3H), δ 2.12 (d, t J1 = 12.4 Hz, J2 = 4.4 Hz, 1H), δ
1.72 (q, J = 12.4 Hz, 1H). ESI MS calculated for C38H69N19O13S3: 1095.45, found
1096.41 [M+H]+.

294
References and Footnotes
1. For historical accounts regarding the evolution of modern molecularbiology, see (a) F. H. C . Crick, What Mad Pursuit, Nasic Books, 1988. (b)H. F. Judson, The Eigth Day of Creation, Simon & Schuster Pubs., 1980.
2. A. Kornberg, T. Baker, DNA Replication, W.H. Freeman and Co, 1992.
3. E. H. Blackburn, Telomerase RNA structure and function. In: RNAStructure and Function, Cold Spring Harbor Laboratory Press, 1998, 669-693.
4. T. W. Nilsen, RNA-RNA Interactions in nuclear pre-mRNA splicing. In:RNA Structure and Function, Cold Spring Harbor Laboratory Press, 1998,279-307.
5. J. B. Hartford and T. A. Rouault, RNA structure and function in cellular ironhomeostasis. In: RNA Structure and Function, Cold Spring HarborLaboratory Press, 1998, 575-602.
6. B. N. Fields, D. M. Knipe, P. M. Howley (Eds.), Fundamental Virology,Lippincott-Raven Pubs., 1996.
7. R. Green, H. F. Noller, Ribosomes and translation. Annu. Rev. Biochem.1997, 66, 679-716.
8. H. F. Noller, V. Hoffarth, L. Zimniak, Unusual resistance of peptidyltransferase to protein extraction procedures. Science, 1992, 256, 1416-1419.
9. T. R. Cech, The ribosome is a ribozyme. Science, 2000, 289, 878-879.
10. (a) P. Nissen, J. Hansen, N. Ban, P. B. Moore, T. A. Steitz, The structuralbasis of ribosome activity in peptide bond synthesis. Science, 2000, 289,920-930. (b) G. W. Muth, L. Ortoleva-Donnelly, S. A. Strobel, A singleadenosine with a neutral pKa in the ribosomal peptidyl transferase center.Science, 2000, 289, 947-950.
11. C. G. Kurland, Translational accuracy and the fitness of bacteria. Annu.Rev. Genet. 1992, 26, 29-50.
12. (a) H. Siomi, G. Dreyfuss, RNA-binding proteins as regulators of geneexpression. Curr. Opin. Gen. Dev. 1997, 7, 345-353. (b) G. Varani, K.Nagai, RNA recognition by RNP proteins during RNA processing. Annu.Rev. Biophys. Biomol. Struct. 1998, 27, 407-445. (c) N. K. Gray, M.

295
Wickens, Control of translation initiation in animals. Annu. Rev. Cell. Dev.Biol. 1998, 14, 399-458.
13. T. R. Cech and B. L. Golden, Building a catalytic active site using onlyRNA. In: The RNA World, Cold Spring Harbor Laboratory Press, 1999,321-349.
14. M. W. Hentze, L. C. Kuhn, Molecular control of vertebrate iron metabolism- mRNA-based regulatory circuits operated by iron, nitric oxide, andoxidative stress. Proc. Natl. Acad. Sci. USA, 1996, 93, 8175-8182.
15. N. C. Lau, L. P. Lim, E. G. Weinstein, D. P. Bartel, An abundant class oftiny RNAs with probable regulatory roles in Caenorhabditis elegans.Science, 2001, 294, 858-862.
16. (a) G. Werstuck, M. R. Green, Controlling gene expression in living cellsthrough small molecule-RNA interactions. Science, 1998, 282, 296-298.(b) W. Winkler, A. Nahvi. R. R. Breaker RR. Thiamine derivatives bindmessenger RNAs directly to regulate bacterial gene expression. Nature,2002, 419, 952-956. (c) A. Nahvi, N. Sudarsan, M. S. Ebert, X. Zou, K. L.Brown, R. R. Breaker, Genetic control by a metabolite binding mRNA.Chem. Biol. 2002, 9, 1043-1049.
17. International Human Genome Sequencing Consortium, Initial sequencingand analysis of the human genome. Nature, 2001, 409, 860-921.
18. R. F. Gesteland, T. R. Cech, J. F. Atkins (Eds.), The RNA World, ColdSpring Harbor Laboratory Press, 1999.
19. J. Davies, U. Ahsen, R. Schroeder, Antibiotics and the RNA world: A rolefor low-molecular-weight effectors in biochemical evolution? The RNAWorld, Cold Spring Harbor Laboratory Press, 1993, 185-204.
20. Aptamers are RNA sequences that are selected from large libraries usinga pre-determined small molecule. Through multiple rounds of mutation,selection, and amplification, the evolution of an RNA sequence for apredetermined small molecule can be effected. Selected sequences canexhibit extremely high affinity and specificity for their cognate smallmolecule.
21. R. T. Batey, J. A. Doudna, The parallel universe of RNA folding. Nat.Struct. Biol. 1998, 5, 337-40.
22. (a) R. Russell, D. Herschlag, Probing the folding landscape of theTetrahymena ribozyme: Commitment to form the native conformation islate in the folding pathway. J. Mol. Biol. 2001, 308, 839-851. (b) S. K.

296
Silverman, M. L. Deras, S. A. Woodson, S. A. Scaringe, T. R. Cech,Multiple folding pathways for the P4-P6 RNA domain. Biochemistry, 2000,39, 12465-75. (c) M. S. Rook, D. K. Treiber, J. R. Williamson, An optimalMg2+ concentration for kinetic folding of the Tetrahymena ribozyme. Proc.Natl. Acad. Sci. U S A, 1999, 96, 12471-6.
23. (a) M. Zuker, On finding all suboptimal foldings of an RNA molecule.Science, 1989, 244 48-52. (b) C. Gaspin, E. Westhof, An interactiveframework for RNA secondary structure prediction with a dynamicaltreatment of constraints. J. Mol. Biol. 1995 229, 1049-1064. (c) A. R.Banerjee, J. A. Jaeger, D. H. Turner, Thermal unfolding of a Group-Iribozyme – the low-temperature transition is primarily disruption of tertiarystructure. Biochemistry, 1993, 32, 153-163.
24. M. Wu, I. Tinoco, Jr., RNA folding causes secondary structurerearrangement. Proc. Natl. Acad. Sci. USA, 1998, 95, 11555-60.
25. (a) A. L. Feig, O. C. Uhlenbeck, The role of metal ions in RNAbiochemistry. In: The RNA World, Cold Spring Harbor Laboratory Press,1999, 287-319. (b) V. K. Misra, D. E. Draper, On the role of magnesiumions in RNA stability. Biopolymers, 1998, 48,113-135.
26. (a) T. Hermann, E. Westhof, Exploration of metal ion binding sites in RNAfolds by Brownian-dynamics simulations. Structure, 1998, 6, 1303-14. (b)V. K. Misra, D. E. Draper, A thermodynamic framework for Mg2+ bindingto RNA. Proc. Natl. Acad. Sci. USA, 2001, 98, 12456-12461.
27. M. M. Teeter, G. J. Quigley, A. Rich. In Nucleic Acid – Metal IonInteractions; T. G. Spiro Ed. Wiley-Interscience: New York, 1980, 146-177.
28. (a) D. J. Earnshaw, M. J. Gait, Aminoglycosides and cleavage of thehairpin ribozyme. In: RNA-Binding Antibiotics, Molecular BiologyIntelligence Unit 13, Eurekah.com, 2001, 35-55. (b) B. M. Chowrira, A.Berzal-Herranz, J. M. Burke, Ionic requirements for RNA binding,cleavage and ligation by the hairpin ribozyme. Biochemistry, 1993,32,1088-95. (c) F. Walter, Q. Vicens, E. Westhof, Aminoglycoside-RNAinteractions. Curr. Opin. Chem. Biol. 1999, 3, 694-704.
29. A. D. Dahlberg, F. Horodyski, P. Keller, Interaction of neomycin withribosomes and ribosomal ribonucleic acid. Antimicrob. Agents Chemother.1978, 13, 331-39.
30. D. Moazed, H. F. Noller, Interaction of antibiotics with functional sites in 16S ribosomal RNA. Nature, 1987, 327, 389-394.

297
31. (a) T. Pape, W. Wintermeyer, M. V. Rodnina, Conformational switch in thedecoding region of 16S rRNA during aminoacyl-tRNA selection on theribosome. Nature Struct. Biol., 2000, 7, 104-107. (b) R. Karimi, M.Ehrenberg, Dissociation rate of cognate peptidyl tRNA from the A-site ofhyper-accurate and error-prone ribosomes. Eur. J. Biochem. 1994, 226,355-360.
32. (a) J. Davies, B. D. Davis, Misreading of ribonucleic acid code wordsinduced by aminoglycoside antibiotics. J. Biol. Chem. 1968, 243, 3312-3316. (b) S. R. Lynch, J. D. Puglisi. Structural origins of aminoglycosidespecificity for prokaryotic ribosomes. J. Mol. Biol. 2001, 306, 1037-1058.
33. A. P. Carter, W. M. Clemons, D. E. Brodersen, R. J. Morgan-Warren, B. T.Wimberly, V. Ramakrishnan, Functional insights from the structure of the30S ribosomal subunit and its interactions with antibiotics. Nature, 2000,407, 340 – 348.
34. R. E. Botto, B. Coxon, Nitrogen-15 nuclear magnetic resonancespectroscopy of neomycin B and related aminoglycosides. J. Am. Chem.Soc. 1983, 105, 1021-1028.
35. M. Hendrix, P. B. Alper, E. S. Priestley, C-H. Wong, Hydroxyamines as anew motif for the molecular recognition of phosphodiesters: implicationsfor aminoglycoside-RNA interactions. Angew. Chem. Intl. Ed. 1997, 36,95-98.
36. H. Wang and Y. Tor, Electrostatic interactions in RNA aminoglycosidesbinding. J. Am. Chem. Soc. 1997, 119, 8734-8735.
37. (a) A. Whelton, H. C. Neu (Eds.), The Aminoglycosides: Microbiology,Clinical Use, and Toxicology, Marcel Dekker, Inc., 1982. (b) T. Koeda, K.Umemura, M. Yokota, Toxicology and pharmacology of aminoglycosideantibiotics. In: Aminoglycoside Antibiotics, Springer-Verlag, 1982, 293-356.
38. For membrane-related toxicology issues, see: N. Tanaka, Mechanism ofaction of aminoglycoside antibiotics. In: Aminoglycoside Antibiotics.Handbook of Experimental Pharmacology. Vol 62, Springer-Verlag, 1982,221-266.
39. K. Michael, Y. Tor, Designing novel RNA binders. Chem. Eur. J. 1998, 4,2091-98.
40. J. R. Williamson, Induced fit in RNA-protein recognition. Nat. Struct. Biol.2000, 7, 834-837.

298
41. For reviews on RNA-small molecule recognition, see: (a) W. D. Wilson, K.Li, Targeting RNA with small molecules. Curr. Med. Chem., 2000, 7, 73-98. (b) S. J. Sucheck, C-H. Wong, RNA as a target for small molecules.Curr. Opin. Chem. Biol. 2000, 4, 678-686. (c) A. C. Cheng, V. Calabro, A.D. Frankel, Design of RNA-binding proteins and ligands. Curr. Opin.Struct. Biol. 2001, 11, 478-484.
42. (a) A. D. Frankel, J. A. T. Young, HIV-1: Fifteen proteins and an RNA.Annu. Rev. Biochem. 1998, 67, 1-25. (b) M. J. Gait, J. Karn, RNArecognition by the human immunodeficiency virus Tat and Rev proteins.Trends Biochem. Sci. 1993, 18, 255-259.
43. For a review on the Rev-RRE interaction see: (a) V. W. Pollard, M. H.Malim, The HIV-1 Rev protein. Annu. Rev. Microbiol. 1998, 52, 491-532.
44. (a) M. H. Malim, L. S. Tiley, D. F. McCarn, J. R. Rusche, J. Hauber, B. R.Cullen, HIV-1 structural gene expression requires binding of the Revtrans-activator to its RNA-target sequence. Cell, 1990, 60, 675-683. (b) T.J. Daly, K. S. Cook, G. S. Gray, T. E. Maione, J. R. Rusche, Specificbinding of HIV-1 recombinant Rev protein to the Rev-response element invitro. Nature, 1989, 342, 816-819. (c) C. A. Rosen, E. Terwilliger, A.Dayton, J. G. Sodroski, W. A. Haseltine, Intragenic cis-acting art gene-responsive sequences of the human immunodeficiency virus sequences ifthe human immunodeficiency virus. Proc. Natl. Acad. Sci. USA, 1988, 85,2071-2075. (d) T. J. Hope, D. McDonald, X. Huang, J. Low, T. G. Parslow,Minimal Rev-response element for type 1 human immunodeficiency virus.J. Virol. 1991, 65, 2131-2134. (e) M. L. Zapp, T. J. Hope, T. G. Parslow,M. R. Green, Oligomerization and RNA binding domains of the type 1human immunodeficiency virus Rev protein: a dual function for anarginine-rich binding motif. Proc. Natl. Acad. Sci. USA, 1991, 88, 7734-7738.
45. T. J. Hope, The ins and outs of HIV Rev. Arch. Biochem. Biophys. 1999,365, 186-191.
46. R. Tan, L. Chen, J. A. Buettner, D. Hudson, A. D. Frankel, RNArecognition by an isolated alpha-helix. Cell, 1993, 73, 1031-1040.
47. D. A. Mann, I. Mikaelian, R. W. Zemmel, S. M. Green, A. D. Lowe, T.Kimura, M. Singh, P. J. Butler, M. J. Gait, J. Karn, A molecular rheostat –cooperative binding to stem-1 of the Rev-response element modulateshuman immunodeficiency virus type-1 late gene expression. J. Mol. Biol.1994, 241, 193-207.

299
48. H. Schaal, M. Klein, P. Gehrmann, O. Adams, A. Scheid, Requirement ofN-terminal amino acid residues of gp41 for human immunodeficiency virustype 1-mediates cell fusion. J. Virol. 1995, 69, 3308-3314.
49. R. C. Gallo, HIV- The cause of AIDS – An overview of its biology,mechanisms of disease induction, and our attempts to control it. J. Acquir.Immune Defic. Syndr. 1988, 1, 521-535.
50. J-H. Chen, S-Y Le, J. V. Maizel, Prediction of common secondarystructures of RNAs: a genetic algorithm approach. Nucleic Acids Res.2000, 28, 991-999.
51. B. Charpentier, F. Stutz, M. Rosbash, A Dynamic in Vivo View of theHIV-1 Rev-RRE Interaction. J. Mol. Biol. 1997, 266, 950-962.
52. J. Kjems, B. J. Calnan, A. D. Frankel, P. A. Sharp, Specific Binding of aBasic Peptide from HIV-1 Rev. EMBO J. 1992, 11, 1119-1129.
53. J. L. Battiste, H. Mao, N. S. Rao, R. Tan, D. R. Muhandiram, L. E. Kay, A.D. Frankel, J. R. Williamson, Alpha helix-RNA major groove recognition inan HIV-1 rev peptide-RRE RNA complex. Science, 1996, 273, 1547-1551.
54. K. Li, M. Fernandez-Saiz, C. T. Rigl, A. Kumar, K. G. Ragunathan, A. W.McConnaughie, D. W. Boykin, H. J. Schneider, W. D. Wilson. Design andanalysis of molecular motifs for specific recognition of RNA. Bioorg. Med.Chem. 1997, 5, 1157-72.
55. K. M. Weeks, C. Ampe, S. C. Schultz, T. A. Steitz, D. M. Crothers,Fragments of the HIV-1 Tat Protein Specifically Bind TAR RNA. Science,1990, 249, 1281-1285.
56. (a) E. Kikuta, S. Aoki, E. Kimura, J. Am. Chem. Soc. 2001, 123, 7911-7912. (b) A. Litovchick, A. G. Evdokimov, A. Lapidot, Biochemistry, 2000,39, 2838-2852; (c) N. Tamilarasu, I. Huq, T. M. Rana, Bioorg. Med. Chem.Lett. 2000, 10, 971-974; (d) N. Gelus, C. Bailly, F. Hamy, T. Klimkait, W.D. Wilson, D. W. Boykin, Bioorg. Med. Chem. 1999, 7, 1089-1096; (e) H-Y. Mei, M. Cui, A. Heldsinger, S. M. Lemrow, J. A. Loo, K. A. Sannes-Lowery, L. Sharmeen, A. W. Czarnik, Biochemistry, 1998, 37, 14204-14212. (f) F. Hamy, V. Brondani, A. Floersheimer, W. Stark, M. Blommers,T. Klimkait, Biochemistry 1998, 37, 5086-5095. (g) S. Hwang, N.Tamilarasu, K. Ryan, I. Huq, S. Richter, W. C. Still, T. M. Rana, Proc. Natl.Acad. Sci. USA, 1999, 23, 12997-13002.
57. J. A. Ippolito, T. A. Steitz, A 1.3 Å resolution crystal structure of the HIV-1trans-activation response region RNA stem reveals a metal ion-dependentbulge conformation. Proc. Natl. Acad. Sci. USA, 1998, 95, 9819-9824.

300
58. J. D. Puglisi, R. Tan, B. J. Calnan, A. D. Frankel, J. R. Williamson,Conformation of the TAR RNA-Arginine Complex by NMR Spectroscopy.Science, 1992, 257,76-80.
59. J. A. Ippolito, T. A. Steitz, The structure of the HIV-1 RRE high affinity revbinding site at 1.6 Å resolution. J. Mol. Biol. 2000, 295, 711-717.
60. L. W. Hung, E. L. Holbrook, S. R. Holbrook SR. The crystal structure ofthe Rev binding element of HIV-1 reveals novel base pairing andconformational variability. Proc. Natl. Acad. Sci. USA, 2000, 97, 5107-5112.
61. N. K. Tanner, Ribozymes: the characteristics and properties of catalyticRNAs. FEMS Microbiology Rev. 1999, 23, 257-275.
62. M. Chastain, I. Tinoco Jr. Structural elements in RNA. Prog. Nucl. AcidRes. 1991, 41, 131-177.
63. O. C. Uhlenbeck, A small catalytic oligoribonucleotide. Nature, 1987, 328,596-600.
64. N. K. Vaish, A. R. Kore, F. Eckstein, Recent developments in thehammerhead ribozyme field. Nucl. Acids Res. 1998, 26, 5237-5242.
65. T. K. Stage, K. J. Hertel and O. C. Uhlenbeck, Inhibition of thehammerhead ribozyme by neomycin. RNA, 1995, 1, 95-101.
66. S. R. Kirk, N. W. Luedtke, Y. Tor, 2-Aminopurine as a real-time probe ofenzymatic cleavage and inhibition of hammerhead ribozymes. Bioorg. &Med. Chem. 2001, 9, 2295-2301.
67. Y. Tor, T. Hermann, E. Westhof, Deciphering RNA Recognition:Aminoglycoside Binding to the Hammerhead Ribozyme. Chem. Biol. 1998,5, R277-R283.
68. D. Fourmy, M. I. Recht, S. C. Blanchard, J. D. Puglisi. Structure of the Asite of Escherichia coli 16S ribosomal RNA complexed with anaminoglycoside antibiotic. Science, 1996, 274, 1367-1371.
69. (a) W. A. Greenberg, E. S. Priestley, P. S. Sears, P. B. Alper, C.Rosenbohm, M. Hendrix, S.-C. Hung, and C.-H. Wong. Design andSynthesis of New Amino Glycoside Antibiotics Containing Neamine as anOptimal Core Structure: Correlation of Antibiotic Activity with in VitroInhibition of Translation. J. Am. Chem. Soc. 1999, 121, 6527-6541. Seealso the supporting information of: (b) S. J. Sucheck, A. L. Wong, K. M.

301
Koeller, D. D. Boehr, K.-a. Draker, P. Sears, G. D. Wright, C.-H. Wong.Design of Bifunctional Antibiotics that Target Bacterial rRNA and InhibitResistance-Causing Enzymes. J. Am Chem. Soc. 2000, 122, 5230-5231.
70. S. R. Kirk, Y. Tor. tRNAPhe Binds Aminoglycoside Antibiotics. Bioor. Med.Chem. 1999, 7, 1979-1991.
72. (a) K. Hamasaki, R. R. Rando, A high-throughput fluorescence screen tomonitor the specific binding of antagonists to RNA targets. AnalyticalBiochemistry, 1998, 261, 183-190. (b) D. L. Boger, B. E. Fink, S. R.Brunette, W. C. Tse, M. P. Hedrick, A simple, high-resolution method forestablishing DNA binding affinity and sequence selectivity. J. Am. Chem.Soc. 2001, 123, 5878-91. (c) M. Auer, J-M. Seifert, S. Wallace, R. Sleigh,RNA in a miniaturized lead discovery process. In: RNA-BindingAntiobiotics, Molecular Biology Intelligence Unit 13, Eurekah.com, 2001,164-176.
73. Topics in Fluorescence Spectroscopy, Vol. 2: Principals. J. R. LakowiczEd., Plenum, New York, 1991.
74. K. L. Bentley, L. K. Thompson, R. J. Klebe, P. M. Horowitz, Fluorescencepolarization: A general method for measuring ligand binding andmembrane microviscosity. BioTechniques, 1985, 3, 356-365.
75. A. J. Pope, U. M. Haupts, K. J. Moore, Homogeneous fluorescencereadouts for miniaturized high-throughput screening: theory and practice.Drug Discovery Today, 1999, 4, 350-362.
76. (a) Y. Wang, K. Hamasaki, R. R. Rando, Specificity of aminoglycosidebinding to RNA constructs derived from the 16S rRNA decoding regionand the HIV-RRE activator region. Biochemistry, 1997, 36, 768-779.
77. D. I. Van Ryk, S. Venkatesan, Real-time kinetics of HIV-1 Rev-RevResponse Element Interactions. J. Biol. Chem. 1999, 274, 17452-17463.
78. C. Ma, N. A. Baker, S. Joseph, J. A. McCammon, Binding ofaminoglycoside antibiotics to the small ribosomal subunit: a continuumelectrostatics investigation. J. Am. Chem. Soc. 2002, 124, 1438-1442.
79. B. J. Calnan, S. Biancalana, D. Hudson, A. D. Frankel, Analysis ofarginine-rich peptides from the HIV Tat protein reveals unusual features ofRNA protein recognition. Genes Dev. 1991, 5, 201-210.
80. M. L. Zapp, T. J. Hope, T. G. Parslow, M. R. Green, Oligomerization andRNA binding of the type-1 Human Immunodeficiency Virus Rev protein - a

302
dual function for an arginine-rich binding motif. Proc. Natl. Acad. Sci. USA,1991, 88, 7734-7738.
81. N. W. Luedtke, Y. Tor, A novel solid-phase assembly for identifying potentand selective RNA ligands. Angew. Chem. Intl. Ed. 2000, 39, 1788-1790.
82. M. L. Zapp, S. Stern, M. R. Green, Small molecules that selectively blockRNA binding of HIV-1 Rev protein inhibit Rev function and viral production.Cell, 1993, 74, 969-978.
83. (a) K. Li, G. Xiao, T. Rigl, A. Kumar, D. W. Boykin, W. D. Wilson, InStructure, Motion, Interaction and Expression of BiologicalMacromolecules (Eds.; R.H. Sarma, M.H. Sarma), Adenine Press, 1998,137-145. (b) G. Xiao, A. Kumar, K. Li, C. T. Rigl, M. Bajic, T. M. Davis, D.W. Boykin, W. D. Wilson, Inhibition of the HIV-1 Rev-RRE complexformation by unfused aromatic cations. Bioorg. Med. Chem. 2001, 9,1097-1113.
84. K. Li, T. M. Davis, C. Bailly, A. Kumar, D. W. Boykin, W. D. Wilson, Aheterocyclic inhibitor of the Rev-RRE complex binds to RRE as a dimer.Biochemistry, 2001, 40, 1150-1158.
85. N.W. Luedtke, T. J. Baker, M. Goodman, Y. Tor, Guanidinoglycosides: Anovel family of RNA ligands. J. Am. Chem. Soc. 2000, 122, 12035-12036.
86. J-B. LePecq, C. J. Paoletti, A fluorescent complex between ethidiumbromide and nucleic acids. Physical-chemical characterization. J. Mol.Biol. 1967, 27, 87-106.
87. J. L. Bresloff, D. M. Crothers, Equilibrium studies of ethidium-polynucleotide interactions. Biochemistry, 1981, 20, 3547-3553.
88. D. D. Perrin, Dissociation Constants of Organic Bases in AqueousSolution, Butterworths: London, 1965.
89. K. A. Lacourciere, J. T. Strivers, J, P. Marino, Mechanism of neomycinand Rev binding to the Rev responsive element of HIV-1 as determined byfluorescence and NMR spectroscopy. Biochemistry, 2000, 39, 5630-5641.
90. W. D. Wilson, L. Ratmeyer, M. Zhao, L. Strekowski, D. Boykin, The searchfor structure-specific nucleic acid interactive drugs - effects of compoundstructure on RNA versus DNA interaction strength. Biochemistry, 1993,32, 4098-4104.
91. For reviews see: (a) D. P. Millar, Fluorescence studies of DNA and RNAstructure and dynamics. Curr. Opin. Struct. Biol. 1996, 6, 322-326. (b) D.
303
M. Jameson, J. F. Eccleston, Fluorescent Nucleotide Analogs: Synthesisand Applications. Methods Enzymology, 1997, 278, 363-390.
92. D. C. Ward, E. Reich, L. Stryer. Fluorescence studies of nucleotides andpolynucleotides. I. Formycin, 2-aminopurine riboside, 2,6-diaminopurineriboside, and their derivatives. J. Biol. Chem. 1969, 10, 1228-1237.
93. T. M. Nordlund, S. Andersson, L. Nilsson, R. Rigler, Strucutre andDynamics of a fluorescent DNA oligomer containing the EcoRI recognitionsequence: fluorescence, molecular dynamics and NMR studies.Biochemistry, 1989, 28, 9095-9103.
94. M. Rist, J. Marino. Association of an RNA kissing complex analyzed using2-aminopurine fluorescence. Nucleic Acids Res. 2001, 29, 2401-2408.
95. D. A. Harris, D. Rueda, N. G. Walter, Local conformational changes in thecatalytic core of the trans-acting hepatitis delta virus ribozyme accompanycatalysis. Biochemistry, 2002, 41, 12051-12061.
96. M. Menger, T. Tuschl, F. Eckstein, D. Porschke, Mg2+-dependentconformational changes in the hammerhead ribozyme. Biochemistry,1996, 35, 14710-14716.
97. S.R. Kirk, N.W. Luedtke, Y. Tor, 2-aminopurine as a real-time probe ofenzymatic cleavage and inhibition of hammerhead ribozymes. Bioorg.Med. Chem., 2001, 9, 2295-2301.
98. I. R. Klotz, Ligand-Receptor Energetics, John Wiley & Sons, Inc. NewYork, 1997.
99. T. Heyduk T, J. C. Lee, Application of fluorescence energy transfer andpolarization to monitor Escherichia coli cAMP receptor protein and lacpromoter interaction. Proc. Natl. Acad. Sci. U S A, 1990, 87, 1744-1748.
100. F. W. Sevenich, J. Langowski, V. Weiss, K. Rippe, DNA binding andoligomerization of NtrC studied by fluorescence anisotropy andfluorescence correlation spectroscopy. Nucleic Acids Res. 1998, 26, 1373-1381.
101. A. Rudi, Y. Benayahu, I. Goldberg, Y. Kashman, Tetrahedron Lett. 1988,29, 6655-6656.
102. N. R. Shochet, A. Rudi, Y. Kashman, H. Yaacov, M. R. El-Maghrabi, I.Spector, Novel marine alkaloids from the tunicate Eudistoma sp. arepotent regulators of cellular growth and differentiation and affect cAMP-mediated processes. J. Cell Physiol. 1993, 157, 481-492.

304
103. M. Einat, M. Lishner, A. Amiel, A. Nagler, S. Yarkorli, A. Rudi, Y.Kashman, D. Markel, I. Fabian, Eilatin: a novel marine alkaloid inhibits invitro proliferation of progenitor cells in chronic myeloid leukemia patients.Exp. Hematol. 1995, 23, 1439-1444.
104. L. A. McDonald, G. S. Eldredge, L. R. Barrows, C. M. Ireland, Inhibition oftopoisomerase II catalytic activity by pyridoacridine alkaloids from aCystodytes sp. ascidian: a mechanism for the apparent intercalator-induced inhibition of topoisomerase II. J. Med. Chem. 1994, 37, 3819-3827.
105. A. Rudi, Y. Kashman, D. Gut, F. Lellouche, M. Kol, . Rutheniumcomplexes of eilatin: Face selectivity in octahedral geometry; Synthesis of[Ru(bpy)2(eilatin)]2+ and [Ru(phen)2(eilatin)]2+. Chem. Commun. 1997,1,17-18.
106. D. Gut, A. Rudi, J. Kopilov, I. Goldberg, M. Kol, Pairing of propellers:dimerization of octahedral ruthenium(II) and osmium(II) complexes ofeilatin via pi-pi stacking featuring heterochiral recognition. J. Am. Chem.Soc. 2002, 124, 5449-5456.
107. E. C. Glazer, Y. Tor, Ru(II) complexes of “Large Surface” Ligands, Angew.Chem. Intl. Ed. 2002, 41, 4022-4026.
108. B. Bosnich, The application of exiton theory to the determination of theabsolute configurations of inorganic complexes. Acc. Chem. Res. 1969, 2,266-273.
109. A. Sylwester, S. Murphy, D. Shutt, D. R. Soll HIV-induced T cell syncytiaare self-perpetuation and the primary cause of T cell death in culture. J.Immunol. 1997, 158, 3996-4007.
110. D. D. Richman, V. A. Johnson, D. L. Mayers, T. Shirasaka, M. C. O'Brien,H. Mitsuya, In Current Protocols in Immunology; J. E. Coligan, A. M.Kruisbeek, D. H. Margulies, E. M. Shevach, W. Strober, Eds.; John Wiley& Sons: Brooklyn, NY, 1993; Suppl 8, Unit 12.9, pp 1-21.
111. (a) O. Novakova, J. Kasparkova, O. Vrana, P. M. van Vliet, J. Reedijk, V.Brabec, Correlation between cytotoxicity and DNA binding of polypyridylruthenium complexes. Biochemistry, 1995, 34, 12369-12378. (b) L.Mishra, R. Sinha, H. Itokawa, K. F. Bastow, Y. Tachibana, Y .Nakanishi,N. Kilgore, K. H. Lee, Anti-HIV and cytotoxic activities of Ru(II)/Ru(III)polypyridyl complexes containing 2,6-(2'-benzimidazolyl)-pyridine/chalcone as co-ligand. Bioorg. Med. Chem. 2001, 9, 1667-1671.

305
112. C. V. Kumar, J. K. Barton, N. J. Turro, Photophysical Properties ofRuthenium Complexes Bound to Double Helical DNA. J. Am. Chem. Soc.1985, 107, 5518-5523.
113. Estimated twist angle is based upon the crystal structure an analogous un-fused system [Ru(bpy)2bisisoquinoline]2+, see M. T. Ashby, G. N.Govindan, A. K. Grafton, Metal-assisted racemization of the atropisomersof a 1,1'- binaphthyl skeleton via a syn transition state. J. Am. Chem. Soc.1994, 116, 4801-4809.
114. Some metal complexes containing non-planar ligands have been shown tobind to DNA. For examples, see (a) R. J. Morgan, S. Chatterjee, A. D.Baker, T. C. Strekas, Effects of ligand planarity and peripheral charge onintercalative binding of Ru(2,2' –bipyridine)2L
2+ to calf thymus DNA. Inorg.Chem. 1991, 30, 2687-2692. (b) Y. Xiong, X-F. He, X-H. Zou, J-Z. Wu, X-M. Chen, L-N. Ji, R-H. Li, J-Y. Zhou, K-B. Yu, Interaction of polypyridylruthenium(II) complexes containing non-planar ligands with DNA. J.Chem. Soc. Dalton Trans., 1999, 19-24.
115. [7] (a) K. E. Erkkila, D. T. Odom, J. K. Barton, Recognition and reaction ofmetallointercalators with DNA. Chem. Rev. 1999, 99, 2777-2796. (b) J. K.Barton, A. T. Danishefsky, J. M. Goldberg, Tris(phenanthroline) Ru(II):Stereoselectivity in Binding to DNA. J. Am. Chem. Soc. 1984, 106, 2172-2176. (c) I. Haq, P. Lincoln, D. Suh, B. Norden, B. Z. Chowdhry, J. B.Chaires, Interaction of delta- and lambda- [Ru(phen)2 DPPZ] with DNA – Acalorimetric and equilibrium binding study. J. Am. Chem. Soc. 1995, 117,4788-4796; (d) J. G. Collins, J. R. Aldrich-Wright, I. D. Greguric, P. A.Pellegrini, Binding of the delta- and lambda- enantiomers of[Ru(dmphen)2+ to the hexanucleotide d(GTCGAC)2. Inorg. Chem. 1999,38, 5502-5509. (e) C. V. Kumar, J. K. Barton, N. J. Turro, Photophysics ofruthenium complexes bound to double helical DNA. J. Am. Chem. Soc.1985, 107, 5518-5523. (f) L-N. Ji, X-H. Zou, J-G Liu, Shape- andenantioselective interaction of Ru(II)/Co(III) polypyridyl complexes withDNA Coord. Chem. Rev. 2001, 216, 513-536. (g) C. Chow, J. K. Barton,Shaper-selective cleavage of tRNAPhe by transition-metal complexes. J.Am. Chem. Soc. 1990, 112, 2839-2841. (h) A. C. Lim, J. K. Barton,Targeting the Tat-binding site of bovine immunodeficiency virus TAR RNAwith a shape-selective rhodium complex. Bioorg. Med. Chem. 1997, 6,1131-1136. (i) S. Satyanarayana, J. C. Dabrowiak, J. B. Chaires, Neitherdelta- nor lambda tris(phenanthroline) ruthenium(II) binds to DNA byclassical intercalation. Biochemistry, 1992, 31, 9319-9324. (j) D. Z.Coggan, I. S. Haworth, P. J. Bates, A. Robinson, A. Rodger, DNA Bindingof Ruthenium Tris(1,10-phenanthroline): Evidence for the Dependence ofBinding Mode on Metal Complex Concentration. Inorg. Chem. 1999, 38,4486-4497. (k) J. G. Liu, Q. L. Zhang, X. F. Shi, L. N. Ji, Interaction of[Ru(dmp)2(dppz)]2+ and [Ru(dmb)2(dppz)]2+ with DNA: effects of the
306
ancillary ligands on the DNA-binding behaviors. Inorg Chem. 2001, 40,5045-5050.
116. L. S. Lerman, Structural considerations in the interaction of DNA andacridines. J. Mol. Biol. 1961, 3, 18-30.
117. G. Cohen, H. Eisenberg, Viscosity and sedimentation study of sonicatedDNA-proflavin complexes. Biopolymers, 1969, 8, 45-55.
118. E. Jin, V. Katritch, W. K. Olson, M. Kharatisvili, R. Abagyan, D. S. Pilch,Aminoglycoside binding in the major groove of duplex RNA: thethermodynamic and electrostatic forces that govern recognition. J. Mol.Biol. 2000, 298, 95-110.
119. J. K. Barton, S. J. Lippard, Cooperative binding of a platinummetallointercalation reagent to poly(A).poly(U). Biochemistry, 1979, 18,2661-2668.
120. D. H. Turner, In Nucleic Acids Structures Properties and Functions, V. A.Bloomfield, D. M. Crothers, I. Tinoco Jr. (Eds.), University Science Books,2000, 259-334.
121. I. Piantanida, B. S. Palm, M. Zinic, H-J, Schneider, A new 4,9-diazapyrenium intercalator for single- and double-stranded nucleic acids;distinct differences from related diazapyrenium compounds and ethidiumbromide. J. Chem. Soc., Perkin Trans. 2, 2001, 1808-1816.
122. G. R. Jones, M. E. Oliveira, R. B. Cundall, The interactions ofpyrenylmethyl tributylphosphonium bromide with single strandpolynucleotides. Photochem. Photobiol. 1990, 52, 451-460.
123. J. L. Battiste, R. Tan, A. D. Frankel, J. R. Williamson, Binding of an HIVRev peptide to Rev responsive element RNA induces formation of purine-purine base pairs. Biochemistry, 1994, 33, 2741-2747.
124. T. I. Watkins, G. Woolfe, Nature, 1952, 169, 506.
125. T. I. Watkins, Trypanocides of the phenanthridine series. Part I. The effectof changing the quaternary grouping in dimidium bromide. J. Chem. Soc.1952, 3059-3064.
126. J. Sambrook, E. F. Fritsch, T. Maniatis, In: Molecular Cloning A LaboratoryManual Second Edition, Cold Spring Harbor Press, 1989.
127. (a) H. Nishiwaki, M. Miura, K. Imai, R. Ohno, K. Kawashima,

307
Experimental studies on the antitumor effect of ethidium bromide andrelated substances. Cancer Res. 1974, 34, 2699-2703 (b) B. -R. Balda, G.D. Birkmayer, Drug effects in melanoma: tumor specific interactions ofproflavine and ethidium bromide. Yale J. Biol. Med. 1973, 46, 464-470.
128. C. L. Courchesne, J. A. Bantle, Analysis of the activity of DNA, RNA, andprotein synthesis inhibitors on Xenopus embryo development. Teratog.Carcinog. Mutagen. 1985, 5, 177-193.
129. (a) J. R. MacGregor, I. J. Johnson, In vitro metabolic activation of ethidiumbromide and other phenanthridinium compounds: mutagenic activity inSalmonella typhimurium. Mutation Res. 1977, 48, 103-108. (b) I. E.Mattern, Mutagenicity of ethidium bromide after metabolic activation invitro, Mutation Res. 1976, 38, 120.
130. http://www.laprovet.fr/Trypanosomoses.html
131. M. M. K. Nass, Differential effects of ethidium bromide on mitochondrialand nuclear DNA synthesis in vivo in cultured mammalian cells.Experimental Cell Research, 1972, 72, 211-222.
132. A. Peña, E. Chávez, A. Cárabez, M. T. De Gómez-Puyou, M.T. Themetabolic effects and uptake of ethidium bromide by rat liver mitochondria.Arch. Biochem. Biophys. 1977, 180, 522-529.
133. Anon. Material Safety Data Sheet (MSDS): Ethidium bromide. MDLInformation Systems Inc., San Leandro, CA (on-line retrieval through STNdatabase: MSDS-OHS) 1994.
134. J. Warring, Complex formation between ethidium bromide and nucleicacids. J. Mol. Biol. 1965, 13, 269-282.
135. J. B. LePecq, C. Paoletti, A fluorescent complex between ethidiumbromide and nucleic acids. Physical-chemical characterization. J. Mol.Biol. 1967, 27, 87-106.
136. M. Liebman, J. Rubin, M. Sundaralingam, Nonintercalative binding ofethidium bromide to nucleic acids: Crystal structure of an ethidium-tRNAmolecular complex. Proc. Natl. Acad. Sci. USA, 1977, 74, 4821-4825.
137. W. C. Chu, J. C. Liu, J. Horowitz J. Localization of the major ethidiumbromide binding site on tRNA. Nucleic Acids Res. 1997, 25, 3944-3949.
138. (a) C. C. Tsai, S. C. Jain, H. M. Sobell, Visualization of drug-nucleic acidinteractions at atomic resolution. I. Structure of an ethidium/dinucleosidemonophosphate crystalline complex, ethidium:5-iodouridylyl (3'-5')

308
adenosine. J. Mol. Biol. 1977, 114, 301-315. (b) S. C. Jain, C. C. Tsai, H.M. Sobell HM. Related Articles, Visualization of drug-nucleic acidinteractions at atomic resolution. II. Structure of an ethidium/dinucleosidemonophosphate crystalline complex, ethidium:5-iodocytidylyl (3'-5')guanosine. J. Mol. Biol. 1977, 114, 317-331.
139. W. D. Wilson, L. Ratmeyer, M. T. Cegla, J. Spychala, D. Boykin, M.Demeunynck, J. Lhomme, G. Krishnan, D. Kennedy, R. Vinayak, G. Zon,Bulged-base nucleic acids as potential targets for antiviral drug action.New. J. Chem. 1994, 18, 419-423.
140. H. Jacquemin-Sablon, M. Le Bret, A. Jacquemin-Sablon, C. Paoletti,Yeast mitochondrial deoxyribonuclease stimulated by ethidium bromide. 2.Mechanism of enzyme activation. Biochemistry, 1979, 18, 128-134.
141. W. J. Firth, C. L. Watkins, D. E. Graves, David E.; L. W. Yielding,Synthesis and characterization of ethidium analogs: emphasis on aminoand azido substituents. J. Heterocycl. Chem. 1983, 20, 759-765.
142. L. P. Wakelin, M. J. Waring, The unwinding of circular deoxyribonucleicacid by phenanthridinium drugs: structure-activity relations for theintercalation reaction. Mol. Pharmacol. 1974, 10, 544-561.
143. D. E. Graves, C. L. Watkins, L. W. Yielding, Ethidium bromide and itsphotoreactive analogues: spectroscopic analysis of deoxyribonucleic acidbinding properties. Biochemistry, 1981, 20, 1887-1892.
144. L. W. Yielding, K. L. Yielding, J. E. Donoghue, Ethidium Binding toDeoxyribonucleic Acid: Spectrophotometric Analysis of Analogs withAmino, Azido, and Hydrogen Substituents. Biopolymers, 1984, 23, 83-110.
145. J. Loccufier, E. Schacht, Regioselective acetylation of 3,8-diamino 5-ethyl6-phenyl-phenanthridinium bromide, preparation of potential newtrypanocides. Tetrahedron, 1989, 45, 3385-3396.
146. V. Peytou, R. Condom, N. Patino, R. Guedj, A. M. Aubertin, N. Gelus, C.Bailly, R. Terreux, D. Cabrol-Bass, Synthesis and antiviral activity ofethidium-arginine conjugates directed against the TAR RNA of HIV-1. J.Med. Chem. 1999, 42, 4042-4053.
147. M. Le Bret, O. Chalvet, Optical Spectrum of ethidium intercalated intoDNA a CNDO/S study. J. Mol. Struct. 1977, 37, 299-319.
148. C. Medhi, J. B. Mitchell, S. L. Price, A. B. Tabor. Electrostatic factors inDNA intercalation. Biopolymers, 1999, 52, 84-93.
309
149. D. Reha, M. Kabelac, F. Ryjacek, J. Sponer, J. E. Sponer, M. Elstner, S.Suhai, P. Hobza P. Intercalators. 1. Nature of stacking interactionsbetween intercalators (ethidium, daunomycin, ellipticine, and 4',6-diaminide-2-phenylindole) and DNA base pairs. Ab initio quantumchemical, density functional theory, and empirical potential study. J. Am.Chem. Soc. 2002, 124, 3366-3376.
150. S. E. Patterson, J. M. Coxon, L. Strekowski L. Intercalation of ethidiumand analogues with nucleic acids: a molecular orbital study. Bioorg. Med.Chem. 1997, 5, 277-281.
151. C. A. Hunter, K. R. Lawson, J. Perkins, C. J. Urch, Aromatic interactions.J. Chem. Soc. Perkin Trans. 2, 2001, 651-669.
152. D. A. Bondarev, W. J. Skawinski, C. A. Venanzi, Nature of intercalatoramiloride-nucelobase stacking. An empirical potential and ab initioelectron correlation study. J. Phys. Chem. 2000, 104, 815-822.
153. J. Sponer, J. Leszczynski, P. Hobza, Electronic properties, hydrogenbonding, stacking, and cation binding of DNA and RNA bases.Biopolymers, 2001, 61, 3-31.
154. F. Cozzi, M. Cinquini, R. Annuziata, J. S. Siegel, Dominance of polar/πover charge-transfer effects in stacked phenyl interactions. J. Am. Chem.Soc. 1993, 115, 5330-5331.
155. F. Cozzi, M. Cinquini, R. Annuziata, T. Dwyer, J. S. Siegel, Polar/πinteractions between stacked aryls in 1,8-diarylnaphthalenes. J. Am.Chem. Soc. 1992, 114, 5729-5733.
156. P. U. Giacomoni, M. Le Bret, Electronic structure of ethidium bromide.FEBS Lett. 1973, 29, 227-230.
157. G. P. Kreishman, S. I. Chan, W. Bauer, Proton magnetic resonance studyof the interaction of ethidium bromide with several uracil residues, uridylyl(3' leads to 5') uridine and polyuridylic acid. J. Mol. Biol. 1971, 61, 45-58.
158. G. Dougherty, A comparison of the base-pair specificities of threephenanthridine drugs using solution spectroscopy. Int. J. Biochem.1982,14, 493-504.
159. I. Tinoco Jr., K. Sauer, J. C. Wang, In Physical Chemistry, Principals andApplications in Biological Sciences (third edition), Prentice Hall, NewJersey, 1995.

310
160, All attempts to obtain NMR data for an ethidium analog that lacks the 6-phenyl ring have so far proven fruitless.
161. B. G. Griggs, M. W. Davidson, W. D. Wilson, D. W. Boykin, Assignment ofthe 13C chemical shifts of ethidium bromide and analogs in D2O solution.Org. Mag. Reson. 1980, 14, 371-373.
162. (a) H. Spiesecke, W. G. Schneider, the determination of π-electrondensities in azulene from C13 and H1 nuclear resonance shifts.Tetrahedron Lett. 1961, 14, 468-472. (b) G. A. Olah, G. P. Mateescu,Stable carbonium ions. The Tetraphenylcyclobutadiene dication. J. Am.Chem. Soc. 1970, 92, 1430-1432.
163. W. A. Brett, P. Rademacher, R. Boese, Redetermination of the structure ofphenanthridine. Acta. Cryst. 1993, C49, 1564-1566.
164. R. Kiralk, B. Kojic-Prodic, M. Zinic, S. Alihodzic, N. Trinajstic, Bond length-bond order relations and calculated geometries for some bezenoidaromatics, including phenanthridine. Structures of 5,6-dimethylphenanathridinium triflate, [N-(6-phenanthridinylmethyl)-aza-18-crown-6-κ5 O,O’,O’’, O’’’, O’’’’](picrate-κ2O,O’)potassium, and [N,N’-bis96-phenanthridinyl-κN-methyl)-7,16-diaza-18-crown-6-κ4 O,O’,O’’, O’’’]sodiumiodine dichloromethane solvate. Acta. Cryst. 1996, B52, 823-837.
165. N. W. Luedtke, Q. Liu, Y. Tor, The ground state electronic structure ofethidium reveals charge separation in an organic cation. In preparation
166. (a) M. Hospital, B. Busetta, C. R. Acad. Sci. Paris, 1969, 268, 1232-1235.(b) P. C. Courseille, B. Busetta, M. Hospital, Acta Cryst. 1974, B30, 2631-2639.
167. E. Subramanian, J. Trotter, C. E. Bugg, Crystal structure of ethidiumbromide. J. Cryst. Mol. Struct. 1971, 1, 3-15.
168. I. Zimmerman, H. W. Zimmerman, pKa values of ethidium bromide and 7-amino-9-phenyl-10-ethyl-phenanthridinium bromide. Z. Naturforsch. 1976,31, 656.
169. S. R. Kirk, N. W. Luedtke, Y. Tor, Neomycin-acridine conjugate: A potentinhibitor of Rev-RRE binding. J. Am. Chem. Soc., 2000, 122, 980-981.
170. W. D. Wilson, L. Ratmeyer, M. Zhao, L. Strekowski, D. W. Boykin, Thesearch for structure-specific nucleic acid-interactive drugs: effects ofcompound structure on RNA versus DNA interaction strength.Biochemistry, 1993, 32, 4098-4104.

311
171. R. H. Griffey, S. A. Hofstadler, K. A. Sannes-Lowery, D. J. Ecker, S. T.Crooke, Determinants of aminoglycoside-binding specificity for rRNA byusing mass spectrometry. Proc. Natl. Acad. Sci. USA, 1999, 96, 10129-10133.
172. S. J. Sucheck, W. A. Greenberg, T. J. Tolbert, C. -H. Wong. Design ofsmall molecules that recognize RNA: Development of aminoglycosides aspotential antitumor agents that target oncogenic RNA sequences. Angew.Chem. Int. Ed. 2000, 39, 1080-1084.
173. F. Walter, Q. Vicens, E. Westhof, Aminoglycoside-RNA interactions.Curr. Opin. Chem. Biol. 1999, 3, 694-704.
174. Y. Tor, T. Hermann, E. Westhof, Deciphering RNA recognition:aminoglycoside binding to the hammerhead ribozyme. Chem Biol. 1998,5, R277-R283.
175. M. Hendrix, E. S. Priestley, G. F. Joyce, C. -H Wong, Direct observation ofaminoglycoside-RNA interactions by surface plasmon resonance. J. Am.Chem. Soc. 1997, 119, 3641-3648.
176. Q. Chen, R. H. Shafer, I. D. Kuntz, Structure-based discovery of ligandstargeted to the RNA double helix. Biochemistry 1997, 36, 11402-11407.
177. S. R. Kirk, N. W. Luedtke, Y. Tor, Neomycin-acridine conjugate: A potentinhibitor of Rev-RRE binding. J. Am. Chem. Soc. 2000, 122, 980-981.
178. J. B. H. Tok, J. H. Cho, R. R. Rando, Aminoglycoside hybrids as potentRNA antagonists. Tetrahedron, 1999, 55, 5741-5758.
179. K. Hamasaki, A. Ueno, Aminoglycoside antibiotics, neamine and itsderivatives as potent inhibitors for the RNA-protein interactions derivedfrom HIV-1 activators. Bioorg. Med. Chem. Lett. 2001, 26, 591-594.
180. H. Wang, Y. Tor, Dimeric aminoglycosides: Design, synthesis and RNAbinding. Bioorg. Med. Chem. Lett. 1997, 7, 1951-1956.
181. J. B. Tok, G. R. Huffman, Enhanced binding of aminoglycoside dimers to a"dimerized" A-site 16S rRNA construct. Bioorg. Med. Chem. Lett. 2000,10, 1593-1595.
182. K. Michael, H. Wang, Y. Tor, Enhanced RNA binding of dimerizedaminoglycosides. Bioorg. Med. Chem. 1999, 7, 1361-1371.

312
183. J. B. Tok, L. J. Dunn, R. C. Des Jean, Binding of dimeric aminoglycosidesto the HIV-1 rev responsive element (RRE) RNA construct. Bioorg. Med.Chem. Lett. 2001, 11, 1127-1131.
184. (a) M. A. Weiss, N. Narayana, RNA recognition by arginine-rich peptidemotifs. Biopolymers, 1998, 48, 167-180. (b) R. N. De Guzman, R. B.Turner RB, M. F. Summers, Protein-RNA recognition. Biopolymers, 1998,48, 181-195.
185. R. Tan, A. D. Frankel, Costabilization of peptide and RNA structure in anHIV Rev peptide-RRE complex. Biochemistry, 1994, 33, 14579-14585.
186. N.W. Luedtke, T. J. Baker, M. Goodman, Y. Tor, Guanidinoglycosides: Anovel family of RNA ligands. J. Am. Chem. Soc. 2000, 122, 12035-12036.
187. T. J. Baker, N.W. Luedtke, Y. Tor, M. Goodman, Synthesis and anti-HIVactivity of guanidinoglycosides. J. Org. Chem. 2000, 65, 9054-9058.
188. Q. Liu, N.W. Luedtke, Y. Tor, A simple conversion of amines intomonosubstituted ureas in organic and aqueous solvents. Tetrahedron Lett.2001, 42, 1445-1447.
189. A. Litovchick, A. G. Evdokimov, A. Lapidot, Aminoglycoside-arginineconjugates that bind TAR RNA: Synthesis, characterization, and antiviralactivity. Biochemistry, 2000, 39, 2838-2852.
190. E. R. Jamieson, S. J. Lippard, Structure, recognition, and processing ofCisplatin-DNA adducts. Chem. Rev. 1999, 99, 2467–2498.
191. (a) A. M. J. Fichtinger-Schepman, J. L. van der Veer, J. H. J. den Hartog,P. H. M. Lohman, J. Reedijk, Adducts of the antitumor drug cis-diamminedichloroplatinum(II) with DNA: formation, identification, andquantitation. Biochemistry, 1985, 24, 707–713. (b) A. Eastman,Reevaluation of interaction of cis-dichloro(ethylenediamine)platinum(II)with DNA. Biochemistry, 1986, 25, 3912–3915.
192, (a) H. Huang, J. Woo, S. C. Alley, P. B. Hopkins, DNA-DNA interstrandcross-linking by cis-diamminedichloroplatinum(II): N7(dG)-to-N7(dG)cross-linking at 5'-d(GC) in synthetic oligonucleotides. Bioorg. Med. Chem.1995, 3, 659–669. (b) H Huang, L. Zhu, B. R. Reid, G. P. Drobny, P. B.Hopkins, Solution structure of a cisplatin-induced DNA interstrand cross-link. Science, 1995, 270 (5243), 842-845.
193. R. N. Bose, Biomolecular targets for platinum antitumor drugs. Mini. Rev.Med. Chem. 2002, 2, 103-111.

313
194. G. Speelmans, R. W. Staffhorst, K. Versluis, J. Reedijk, B. de Kruijff,Cisplatin complexes with phosphatidylserine in membranes. Biochemistry,1997, 36, 10545-10550.
195. T. Ishikawa, F. Ali-Osman, Glutathione-associated cis-diamminedichloro-platinum(II) metabolism and ATP-dependent efflux from leukemia cells.Molecular characterization of glutathione-platinum complex and itsbiological significance. J. Biol. Chem. 1993, 268, 20116-20125.
196. Selected examples: (a) B. E. Bowler, S. J. Lippard, Modulation of platinumantitumor drug binding to DNA by linked and free intercalators.Biochemistry, 1986, 25, 3031-3038. (b) B. D. Palmer, H. H. Lee, P.Johnson, B. C. Baguley, G. Wickham, L. P.G. Wakelin, W. D. McFadyen,W. A. Denny, DNA-directed alkylating agents. 2. Synthesis and biologicalactivity of platinum complexes linked to 9-anilinoacridine. J. Med. Chem.1990, 33, 3008–3014. (c) D. Gibson, K. F. Gean, J. Katzhendle, R. Ben-Shoshan, A. Ramu, I. Ringel, Preparation, characterization, andanticancer activity of a series of cis-PtCl2 complexes linked toanthraquinone intercalators. J. Med. Chem. 1991, 34, 414–420. (d) J.Whittaker, W. D. McFadyen, G. Wickham, L. P. Wakelin, V. Murray, Theinteraction of DNA-targeted platinum phenanthridinium complexes withDNA. Nucl. Acids. Res. 1998, 26, 3933–3939. (e) S. K. Sharma, L. W.McLaughlin, Cross-linking of a DNA conjugate tethering a cis-bifunctionalplatinated complex to a target DNA duplex. J. Am. Chem. Soc. 2002, 124,9658-9659.
197. J. Boer, N. W. Luedtke, Y. Tor, RNA-selective covalent modification byNeo-platin (A neomycin-cisplatin conjugate). J. Am. Chem. Soc.submitted.
198. For a recent review, see: S. Futaki, Arginine-rich peptides: potential forintracellular delivery of macromolecules and the mystery of thetranslocation mechanisms. Int. J. Pharm. 2002, 245, 1-7.
199. A. Ho, S. R. Schwarze, S. J. Mermelstein, G. Waksman, S. F. Dowdy.Synthetic protein transduction domains: enhanced transduction potentialin vitro and in vivo. Cancer Res. 2001, 61, 474-477.
200. D. J. Mitchell, D. T. Kim, L. Steinman, C. G. Fathman, J. B. Rothbard,Polyarginine enters cells more efficiently than other polycationichomopolymers. J. Pept. Res. 2000, 56, 318-325.
201. P. Belmont A. Aissaoui, M. Hauchecorne, N. Oudrhiri, L. Petit, J. P.Vigneron, J. M. Lehn, P. Lehn, Aminoglycoside-derived cationic lipids asefficient vectors for gene transfection in vitro and in vivo. J. Gene. Med.2002, 4, 517-526.

314
202. For a recent review describing the potential applications see: L. Bonetta,Getting proteins into cells, The Scientist, 2002, 16, 38-40.
203. O. C. Uhlenbeck, J. F. Milligan, Synthesis of small RNAs using T7 RNApolymerase. Methods Enzymol. 1989, 180, 51-62.
Copyright © 2022 FDOKUMEN