The reliability and validity of a lift simulator and its functional equivalence with free weight...
11
IEEE TRANSACTIONS ON REHABILITATION ENGINEERING, VOL. 3, NO. 2, JUNE 1995 I55 The Reliability and Validity of a Lift Simulator and Its Functional Equivalence with Free Weight Lifting Tasks Patrick J. Sparto, Mohamad Parnianpour, Kinda A. Khalaf, and Sheldon R. Simon Abstruct- The combination of Workers’ Compensation legal claims and the enactment of the Americans with Disabilities Act (1990) has created a need for more objective and real- istic trunk muscle testing. The LIDOLift (Loredan, Inc.) is a computerized dynamometer which has the capabilities to test multijoint coordinated lifting tasks in isometric, isokinetic, and isoinertial modes of operation. The calibration of the electro- mechanical sensors produced R2 values greater than 0.999. In the validation of the isokinetic mode, the normalized rms error from the set velocity was less than 1% at higher set velocities, after the accelerative portion of the lit. In the technical validation of the isoinertial mode, the measured force was significantly different than the predicted force based on an isoinertial model. Consequently, the simulated mass was found to be larger than the intended mass. However, the relative difference decreased as the intended mass increased. Next, an experimental protocol was utilized to determine the validity of the isoinertial mode in the work and joint spaces. A sagittal planar dynamic biomechanical model was used to provide the basis of comparison between lifts performed with the LIDOLift and with free weights. Analyses of covariance showed statistical differences for most work and joint space variables. However, the relative differencebetween the two for some variables may be functionally negligible. Important guidelines for clinical protocols using the isokinetic and isoinertial modes of this simulator are delineated. Areas of technological improvement have been identified to close the gap between the simulated isoinertial condition and the free weight lifting task. I. INTRODUCTION EDUCTION of the spiraling health care costs in the R industrialized societies has been one of the major chal- lenges of this decade. Health care providers, industry, and government all have incentives to decrease these costs by an array of reforms in service deliveries, in addition to the implementation of preventive measures. Musculoskeletal injuries, of which low back pain comprises the largest portion, have been the second most frequent cause of worker disability after cardiovascular diseases [ 11, [2]. Low back injuries have Manuscript received November 19, 1993; revised October 31, 1994. This work was partially supported by NIDRR, Rehabilitation Engineering Center Grant, and the Ohio Bureau of Workers’ Compensation, Division of Safety and Hygiene. P. J. Sparto is with the Biomedical Engineering Center, Ohio State University, Columbus, OH 43210 USA. M. Parnianpour is with the Department of Industrial, Welding and Systems Engineering, Ohio State University, Columbus, OH 43210 USA. K. A. Khalaf is with the Department of Mechanical Engineering, Ohio State University, Columbus, OH 43210 USA. S. R. Simon is with the Division of Orthopedic Surgery, Department of Surgery, Ohio State University Hospitals, Columbus, OH 43210 USA. IEEE Log Number 9408494. been estimated to cost the United States over $16 billion per year, after accounting for the rehabilitation, legal claims, and lost work time [l], [3]. Worker selection, training, and ergonomic workplace design have been suggested as effective means to reduce musculoskeletal injuries [4], [5]. Because a small portion of patients who become chronic are responsible for 65% (by the most recent estimates) of the total cost of low back claims, a major cost-saving effort is directed towards management of acute low back pain to avoid the prospect of chronic disability [6]. Although there has been low correlation between measurement of low back impairment and disability [7]-[ 1 11, functional restoration programs have used quantitative assessment of trunk performance as an essential part of rehabilitation of chronic patients [12], [13]. The quantitative measurement of trunk function is not intended for prediction of chronicity or disability, but is used to guide the treatment and evaluation of rehabilitation processes, return to work, and settlement of legal disputes [4], [7]. The importance of an objective means of quantifying mus- cular performance is further magnified by the enactment of the Americans with Disabilities Act (1990), which requires that muscle testing reflect the “essential function of the task.” In addition, companies are obligated to provide “reasonable accommodation” for the worker. The testing of the functional capabilities of the worker should play an important role in the interpretation of “reasonable accommodation.”In addition, once functional deficits are quantified, assistive devices can be implemented more appropriately so that impairments may be prevented from leading to disability or handicap [4]. There are two major categories of strength evaluations: isolated single joint exertions and coordinated multijoint exer- tions. The selection of the most appropriate testing paradigm has remained controversial [7], [ 141, [15]. Some researchers have advocated single joint testing due to the advantage of complete pelvic stabilization and isolation of trunk muscles [13], [16], [17], while others have pointed to single joint exertions as a primary source of error in simulating the lifting capability [15], 1181. Lack of high correlation amongst different indicators of strength and the requirements that strength tests reflect the “essential function of the task,” as mandated by the Americans with Disability Act (1990), has motivated more functional testing protocols. Hence, the unconstrained coordinated multijoint exertion has emerged as a good candidate for inclusion in clinical protocols dealing with functional lifting assessment. 1063-6528/95$04.00 0 1995 IEEE
Transcript of The reliability and validity of a lift simulator and its functional equivalence with free weight...
IEEE TRANSACTIONS ON REHABILITATION ENGINEERING, VOL. 3, NO. 2, JUNE 1995 I55
The Reliability and Validity of a Lift Simulator and Its Functional Equivalence with
Free Weight Lifting Tasks Patrick J. Sparto, Mohamad Parnianpour, Kinda A. Khalaf, and Sheldon R. Simon
Abstruct- The combination of Workers’ Compensation legal claims and the enactment of the Americans with Disabilities Act (1990) has created a need for more objective and real- istic trunk muscle testing. The LIDOLift (Loredan, Inc.) is a computerized dynamometer which has the capabilities to test multijoint coordinated lifting tasks in isometric, isokinetic, and isoinertial modes of operation. The calibration of the electro- mechanical sensors produced R2 values greater than 0.999. In the validation of the isokinetic mode, the normalized rms error from the set velocity was less than 1% at higher set velocities, after the accelerative portion of the lit. In the technical validation of the isoinertial mode, the measured force was significantly different than the predicted force based on an isoinertial model. Consequently, the simulated mass was found to be larger than the intended mass. However, the relative difference decreased as the intended mass increased. Next, an experimental protocol was utilized to determine the validity of the isoinertial mode in the work and joint spaces. A sagittal planar dynamic biomechanical model was used to provide the basis of comparison between lifts performed with the LIDOLift and with free weights. Analyses of covariance showed statistical differences for most work and joint space variables. However, the relative difference between the two for some variables may be functionally negligible. Important guidelines for clinical protocols using the isokinetic and isoinertial modes of this simulator are delineated. Areas of technological improvement have been identified to close the gap between the simulated isoinertial condition and the free weight lifting task.
I. INTRODUCTION EDUCTION of the spiraling health care costs in the R industrialized societies has been one of the major chal-
lenges of this decade. Health care providers, industry, and government all have incentives to decrease these costs by an array of reforms in service deliveries, in addition to the implementation of preventive measures. Musculoskeletal injuries, of which low back pain comprises the largest portion, have been the second most frequent cause of worker disability after cardiovascular diseases [ 11, [2]. Low back injuries have
Manuscript received November 19, 1993; revised October 31, 1994. This work was partially supported by NIDRR, Rehabilitation Engineering Center Grant, and the Ohio Bureau of Workers’ Compensation, Division of Safety and Hygiene.
P. J. Sparto is with the Biomedical Engineering Center, Ohio State University, Columbus, OH 43210 USA.
M. Parnianpour is with the Department of Industrial, Welding and Systems Engineering, Ohio State University, Columbus, OH 43210 USA.
K. A. Khalaf is with the Department of Mechanical Engineering, Ohio State University, Columbus, OH 43210 USA.
S. R. Simon is with the Division of Orthopedic Surgery, Department of Surgery, Ohio State University Hospitals, Columbus, OH 43210 USA.
IEEE Log Number 9408494.
been estimated to cost the United States over $16 billion per year, after accounting for the rehabilitation, legal claims, and lost work time [l], [3]. Worker selection, training, and ergonomic workplace design have been suggested as effective means to reduce musculoskeletal injuries [4], [5].
Because a small portion of patients who become chronic are responsible for 65% (by the most recent estimates) of the total cost of low back claims, a major cost-saving effort is directed towards management of acute low back pain to avoid the prospect of chronic disability [6]. Although there has been low correlation between measurement of low back impairment and disability [7]-[ 1 11, functional restoration programs have used quantitative assessment of trunk performance as an essential part of rehabilitation of chronic patients [12], [13]. The quantitative measurement of trunk function is not intended for prediction of chronicity or disability, but is used to guide the treatment and evaluation of rehabilitation processes, return to work, and settlement of legal disputes [4], [7].
The importance of an objective means of quantifying mus- cular performance is further magnified by the enactment of the Americans with Disabilities Act (1990), which requires that muscle testing reflect the “essential function of the task.” In addition, companies are obligated to provide “reasonable accommodation” for the worker. The testing of the functional capabilities of the worker should play an important role in the interpretation of “reasonable accommodation.” In addition, once functional deficits are quantified, assistive devices can be implemented more appropriately so that impairments may be prevented from leading to disability or handicap [4].
There are two major categories of strength evaluations: isolated single joint exertions and coordinated multijoint exer- tions. The selection of the most appropriate testing paradigm has remained controversial [7], [ 141, [15]. Some researchers have advocated single joint testing due to the advantage of complete pelvic stabilization and isolation of trunk muscles [13], [16], [17], while others have pointed to single joint exertions as a primary source of error in simulating the lifting capability [15], 1181. Lack of high correlation amongst different indicators of strength and the requirements that strength tests reflect the “essential function of the task,” as mandated by the Americans with Disability Act (1990), has motivated more functional testing protocols. Hence, the unconstrained coordinated multijoint exertion has emerged as a good candidate for inclusion in clinical protocols dealing with functional lifting assessment.
1063-6528/95$04.00 0 1995 IEEE
I56 IEEE TRANSACTIONS ON REHABILITATION ENGINEERING, VOL. 3, NO. 2, JUNE 1995
In the original studies for strength assessment, the kinematic and kinetic analyses were lacking. The relative contributions of various joints to the net force generated at the end effector was not considered [19]. It is only recently that these issues have been investigated [20]. To this end, more comprehensive systems of data collection and analysis have evolved. Motion analysis systems, forceplates, and exoskeleton goniometers have been used to objectively quantify both the task demands and functional capability [21].
If dynamometers are to be used in the areas of testing, rehabilitation, and task demand quantification, they must be shown to have equivalence in their simulation of actual job tasks. The concept of similarity or equivalence is complex for multijoint exertions. Given both the kinematic and kinetic redundancies in the multilink neuromuscular system, the same task can be performed by infinitely many postures and load distributions. Hence, in order to achieve the equivalency between the demands of the task and the requirements of testing protocols, two separate spaces need to be investigated: work space and joint space.
Work space parameters are defined here as the kinematic and kinetic parameters which are external to the multilink neuromuscular system. In other words, the work space is the domain of the object that is being moved by the multilink system and is described in the Cartesian coordinate system. In this study, work space parameters include: the kinematic (position, velocity, acceleration) profiles of the object, the forces exerted on the object, and the power absorbed by the object. Conversely, the joint space parameters are those internal to the neuromuscular system and are described in terms of joint coordinate systems. In this case, the individual joint kinematics (angular position, velocity, and acceleration), kinetics (forces and torques), and energetics (muscular power generation and transfer) are the joint space parameters. It can be stated that there is not a one-to-one mapping from the work space to the joint space, which implies that: given redundancies in the neuromuscular system, a kinematic and kinetic history of the movement of an object in the work space can be realized by an infinite number of histories which could have occurred in the joint space.
Traditionally, the task demands have been described in terms of load characteristics in the work space (i.e., the magnitude of the load, the speed of lift, the frequency of lift). Much of the clinical database, however, has dealt with strength, endurance, and the range of motion of isolated joints. Hence, the dynamometric lift simulation requires the exami- nation of the potential matcwmismatch in the kinematic and kinetic parameters within the work and joint space. This is the first time such concepts are formulated in the aforementioned paradigm and are being tested in the rehabilitation literature, although the areas of control of multibody systems and robotic systems have dealt with this issue in depth [22], [23].
The fundamental modes of strength testing are isometric, isokinetic, isotonic, and isoinertial. It is important to reit- erate that these terms describe the operating state of the dynamometer, not the state of the muscle or muscle groups being tested [ 141. Until recently, the two modes of testing that have dominated literature have been isometric and isokinetic.
An isometric mode is one in which the subject exerts against a fixed dynamometer. In the isokinetic mode, the dynamometer provides resistance to the subject so that the arm of the dynamometer moves at a constant velocity. The other less evaluated modes are isotonic and isoinertial. The isotonic mode provides a constant tension in the muscle by varying the resistance throughout the range of motion. This term has been also been used, rather unconventionally, for modes in which the external resistance is kept constant [24]. Finally, the isoinertial mode attempts to simulate a constant mass (i.e., free weight lifting).
Since the introduction of the concept of isokinetic exercise in 1967 [25], physical therapists, orthopedists, and researchers have used commercial isokinetic dynamometers to test mus- cular function, to provide training regimen during the course of rehabilitation, and to objectively document the functional deficits. Testing with these devices is advantageous because resistance is provided such that the subject is able to exert maximally throughout the entire range of motion [7], and safety is guaranteed with redundant controls. However, the inference of functional capacity by the use of any of these dynamometers has remained controversial [7]-[9].
The accuracy and reliability of measurement with isoki- netic dynamometers have been traditionally broken into two parts: the calibration of the measurement sensors and the validity of the machine in measuring indicators of muscle performance (torque, work). The calibration of the sensors has been thoroughly verified for isokinetic dynamometers [9], [26]-[30], while test-retest measurements of subjects’ maximum performance using the dynamometers have shown to be reliable [7], [lo], [26], [27].
Isoinertial testing was developed as another alternative to isometric testing [19]. In the early testing procedures, which used modified gymnasium equipment, each subject was directed to lift a constant mass selected by the researchers. The mass was increased after each lift until the subject reached hisher maximum. Since then, dynamometers which have tried to simulate this isoinertial mode of testing have been used both in research and in clinical settings.
The LIDOLift (Loredan Biomedical, Inc., Davis, CA) is a computer-controlled lift device which is supposed to simulate isometric, isokinetic, and isoinertial lifting conditions. The device is centered about an arm that has a workspace from 60 to 97.5 cm in the radial direction, 90 degrees angular range in the circumferential direction, and 180 cm in the vertical direction. Strain gages in the arm measure the vertical force applied at the end effector. In addition, the device has shelves that can be placed 90 degrees apart from one another at different heights to simulate different working environments. Although a calibration of the physical sensors of the LIDOLift has been performed [29], there has been no reported study, to date, of the complete validation of the LIDOLift.
This study can be divided into three parts. In the first part, the calibration of the electro-mechanical sensors was performed. In the second part, the validation of the isokinetic mode of the LIDOLift was undertaken. In the last part, the technical validation of the isoinertial mode was performed. Most importantly, work space and joint space parameters were
SPARTO et al.: RELIABILITY AND VALIDITY OF A LIFT SIMULATOR 157
analyzed to determine if there were any differences between lifting free weights and lifting the simulated loads of the LIDOLift, regardless of the ability or inability of the LIDOLift to properly simulate isoinertial lifting.
11. METHODS
A. Procedure
I ) Calibration of Sensors: The voltage signals for the arm angle, arm length, arm height, and end effector force were digitized using a 12-b A/D converter (Scientific Solutions, Solon, OH) and collected with user written software [31]. For the calibration of the arm angle, an arc was traced by attaching a pen to the end of the arm and marking on a sheet of paper the positions where the voltage was recorded. The actual angle (+ 0.1 degrees) was determined afterwards by graphical methods, using a protractor. For the arm length, an anthropometer was used to measure the distance (+ 0.5 mm) at which the voltage was recorded. The arm height was calibrated in a similar manner. For the strain gage calibration, known weights were applied at the end of the arm. To get the downward force, they were attached to a cable and simply hung from the arm and to get the upward force, they were attached to a cable and passed through an overhead pulley. The calibration procedure was repeated the next day for the arm length and box height. In addition, a LIDOLift software- driven calibration procedure of the measurement sensors [32] was performed 11 times over a 16 month period to insure month-to-month reliability.
2) Validation of Isokinetic Mode: To determine the validity of the isokinetic mode [31], a subject performed maximum lifts at five set velocities, incorporating the minimum and maximum capabilities of the LIDOLift: 5 , 25, 51, 76, and 89 c d s . The voltage signal from the arm height was smoothed and differentiated with respect to time to determine the time history of the vertical velocity of the box. The smoothing was accomplished using a zero phase-lag fourth-order Butterworth filter with cut-off frequency determined by residual analysis [33]. From the time history, a relationship between the lifting speed and time to reach that lifting speed was developed.
3) Validation of the Isoinertial Mode: The validation of the simulated isoinertial mode occurred in two parts: 1) technical validation and 2) experimental validation. In part 1) , the forces exerted by the hands in lifting (estimated from the measured forces from the load cell of the LIDOLift) were compared to predicted forces that were calculated from the acceleration of the LIDOLift arm and the simulated mass. In part 2), work space and joint space variables were analyzed to determine if there were any differences between lifting free weights and lifting the simulated loads of the LIDOLift.
For both parts of the validation, 10 healthy male nor- mal subjects participated in a study after signing a consent form approved by the human subjects committee. The mean (standard deviation) age, mass, and stature of the subjects were 26.2 (3.8) years, 85.1 (14.0) kg, and 178.6 (10.7) cm, respectively. Briefly, each subject lifted and lowered a two- handled box attached to the arm of the LIDOLift. The lift
cycle occurred in the sagittal plane of the subject. Each subject was instructed to lift and lower the box from as low as s h e could comfortably reach to waist height, for four continuous repetitions. Before the actual testing, the subject practiced at different loads, techniques, and movement times to gain familiarity with the equipment and testing protocol. Then, the tests were repeated for three simulated loads, three techniques of lift, and three movement times of lift in a random order. The simulated masses for the study were 6.82, 13.64, and 20.46 kg (15, 30, and 45 lb, respectively). The techniques were a self-selected, stoop (straight-knee), and squat (bent- knee) techniques of lifting. The movement times were 2, 4, and 6 s per cycle. The subject was paced to complete the lifts in these times by a metronome. Further analysis verified that the movement times were approximately 2, 4, and 6 s per lift.
The free weight box was similar in size to the LIDOLift box and contained the same loads as simulated in the LIDOLift trials. The same 27 conditions were performed by each subject with the LIDOLift and with the box of free weights. This allowed a direct comparison between the LIDOLift and free weights. The conditions were blocked by subject and lift device (LIDOLift or free weight). The 27 conditions within lift device were randomized for each subject.
B. Data Analysis
1 ) Calibration of Sensors: Linear regressions were per- formed on the collected voltages to determine the linearity of the sensors. Calibration equations, which allowed collection of data for the subsequent isokinetic and isoinertial validations, were developed from these regressions.
2) Validation of the lsokinetic Mode: Once the actual ve- locity approached the set velocity, the normalized root-mean- squared (rms) error was calculated to compare the measured versus intended velocities. In addition, the amount of time required by the dynamometer to attain the set velocity was recorded.
3) The Isoinertial Mode: a ) Technical validation: The data from all 270 trials (10
subjects x 27 lift combinations) were used to compare the estimated hand force with the predicted simulated force. The hand force, Fh, was estimated from the force measured at the load cell, Fm, by the following:
where mb is the mass of the box attached to the arm of the LIDOLift, g is the gravitational constant, and a the linear acceleration of the box computed by double-differentiating the arm height. The predicted simulated force is calculated based on the premise that an isoinertial lifting condition was simulated-that is, a constant mass was simulated. This condition was govemed by
where Fp is the predicted force, ms is the simulated mass, and a and g are as before. If the response was truly isoinertial, then the predicted force should match the hand force. An
158 IEEE TRANSACTIONS ON REHABILITATION ENGINEERING, VOL. 3, NO 2 , JUNE 1995
analysis of variance (ANOVA) was performed to determine if the measured force was different than the predicted force.
Since the measured force was found to be different than the predicted force, it was necessary to determine if any of the independent variables or their interactions were affecting the response. To this end, the rms error, peak error, and normalized rms error between the measured and predicted forces were calculated from the time history of each trial. Because there was a significant (p< 0.OOOl) correlation between the rms acceleration and the rms error (R2 = 0.76), peak error (R2 = 0.70) and normalized error (R2 = 0.82), analyses of covariance (ANCOVA) tested the effects of load, technique, and movement time an the computed errors. Since the behavior of the LIDOLift was found to be nonisoinertial, a series of linear regression analyses were performed in order to attempt to model the behavior of the LIDOLift, based on
F h = C 1 . m s + c z . m s . a (3)
where Fh is the hand force, ms the simulated mass, a the acceleration of the device arm, and the coefficients c1 and cz to be determined by the regression. No intercepts were included in the model, which allowed a direct comparison with (2), hence facilitating the physical interpretation of the model.
b) Comparison of work and joint space parameters: The data from the middle two cycles of each lifting condition were fit to 128 point curves and then averaged, instead of using the complete time history. This was performed so that a trial of any length time could be compared with any other trial. A sagittal planar six-link biomechanical model was used for analysis and comparison of the LIDOLift with free weight lifting. In both cases, the forces and torques were input at the end effector (hands), and calculated recursively at each joint in the order of elbow, shoulder, L5/Sl, hip, knee, and ankle.
For the LIDOLift, the vertical lifting force was estimated at the hands from the calibrated load cell data. This quantity was assumed to be more reliable than the force calculated from the simulation of the isoinertial lift by the LIDOLift. For the free weight lifts, the vertical force was determined from the equation of motion. The correlation and error between the vertical ground reaction forces (VGRF) measured at the forceplate and the vertical joint reactive forces calculated at the ankle provided a measure of the robustness of the biomechanical model. To determine the amount of error in using this method, one analogous condition was tested for both a LIDOLift and free weight lifting exercise. The cor- relation between the forces was high (R2 = 0.98) for the LIDOLift exercise while the rms error between the measured and predicted vertical ground reaction force was 1.8% of the measured force. Meanwhile, the correlation was slightly lower (R2 = 0.90) for the free weight exercise while the rms error between the measured and predicted vertical ground reaction force was 3.4% of the measured force. Averaged across all subjects and all conditions, the predicted peak ground reaction force differed from the measured peak ground reaction force by 3.6% for the LIDOLift tests and 5.5% for the free weight tests. These differences between the measured and predicted values for the ground reaction force were well within reported data in the literature [34].
The work space dependent variables included in the analysis were the movement time, box excursion, average lifting speed, maximum lifting power, average vertical lifting force, and maximum vertical lifting force. The joint space dependent variables included the maximum values aver the lifting cycle of the joint velocities and accelerations, joint reactive forces and moments, and compression and shear forces at the lum- bosacral (L5/S 1) joint, assuming a single equivalent extensor muscle model [8]. A more detailed description of the model is provided elsewhere [21]. Given the simplicity of this single equivalent extensor muscle model, it was expected that the computed shear forces were less accurate than the compression forces [35]. In this study, the relative correspondence between free weight lifting and the LIDOLift was investigated rather than the tissue tolerance or risk analysis, which may require more advanced models [36].
Because it was determined that the excursion of the box was significantly greater for the free weight conditions O,< O.OOOl), analyses of covariance (ANCOVA) with repeated measures were performed for the main effect of lifting “de- vice,” adjusted for the box excursion. Hereafter, lifting device will be called mode of lift. Furthermore, the interactions be- tween the mode of lift and the load, technique, and movement time were also tested. Descriptive statistics were examined to determine if the statistical differences provided any clinical significance.
111. RESULTS 1 ) Calibration of Sensors: The voltage recordings of arm
angle, arm length, arm height, and end-effector force were correlated with the physical measurements by linear regression [31]. All R-squared values were greater than 0.999. For the repeatability of the arm length and arm height calibrations, voltages were recorded a day after the first session and input into the regression equations. The predicted values of arm length and arm height correlated with the physical measurements, with R-squared values greater than 0.999. In addition, there was no drift in the signal within a one-hour test. Results from the month-to-month calibration found the signals to deviate from the factory setting at most 2.5% for the displacement signals and 4.2% for the force signal.
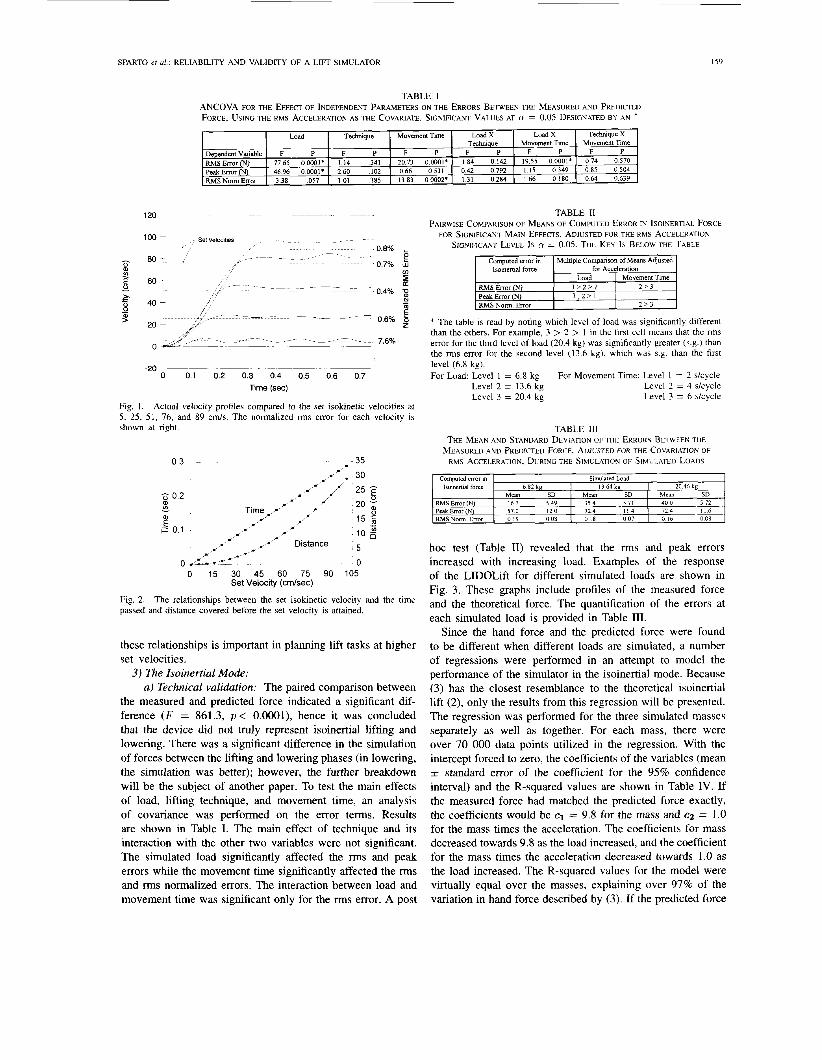
2 ) Validation of the Isokinetic Mode: The comparison of the velocity attained versus the set velocity is shown in Fig. 1. After the initial nonisokinetic portion, each velocity curve settled at a value that was approximately the set velocity. The rms error is shown as a percentage of the set velocity. Except at 5 cm/s, the percent rms error was small. The highest error of 7.6% was due to the small set velocity at the 5 cm/s condition. At the higher velocities, the attained velocity was slightly higher than the set velocity.
The quantification of the initial period of time that the velocity was not constant is shown as a function of the set isokinetic velocity in Fig. 2. There was a linear relationship between the desired velocity and the time to reach that velocity. Accompanying the time-velocity relationship is a curve relating the displacement of the arm to the time that the constant velocity attained the set velocity. Knowledge of
SPARTO et ul.: RELIABILITY AND VALIDITY OF A LIFI SIMULATOR 159
Load Techmque Movement Time Load X Load X Techmque Movement Time
Dependentvariable F P F P F P F P F P R M S Error (N) 7765 00001' 114 341 2073 O O O O l * 184 0142 1955 00001' Peak Error (N) 4696 00001* 2 6 0 102 066 0531 0 4 2 0792 1 15 0349 RMSNomError 3 38 057 101 385 13 83 00002' 131 0284 166 0 180
Techmque X Movement Time
F P 074 0570 085 0504 064 0639
120
Computed error in lsolnertlal force
RMS Error (N) Peak Error (N) RMSNorm Error
0
-*OL---- ~ ~
0 0 1 02 03 0 4 05 06 07 Time (sec)
Fig 1 Actual velocity profiles compared to the set Isokmetrc velocities at 5, 25, 51, 76, and 89 cm/s The normalized rms error for each velocity 1s
shown at nght
Simulated Load 6 82 kg 13 64 kp 20 46 kg
Mean SD Mean SD Mean SD 4 0 0 5 72 167 5 4 9 3 5 4 571
57 0 120 7 2 4 1 1 4 7 2 4 I I 6 0 19 0 0 8 0 18 0 0 7 0 16 0 0 8
0.3
5 0.2
E i- 0.1
a lo a v
- 35 ,,/: -30
/-,- 0 uL&-c-: -- _ _ -~ 0
0 15 30 45 60 75 90 105 Set Velocity (cmlsec)
Fig. 2. passed and distance covered before the set velocity is attained.
The relationships between the set isokinetic velocity and the time
these relationships is important in planning lift tasks at higher set velocities.
3) The Isoinertial Mode: a ) Technical validation: The paired comparison between
the measured and predicted force indicated a significant dif- ference ( F = 861.3, p < O.OOOl), hence it was concluded that the device did not truly represent isoinertial lifting and lowering. There was a significant difference in the simulation of forces between the lifting and lowering phases (in lowering, the simulation was better); however, the further breakdown will be the subject of another paper. To test the main effects of load, lifting technique, and movement time, an analysis of covariance was performed on the error terms. Results are shown in Table I. The main effect of technique and its interaction with the other two variables were not significant. The simulated load significantly affected the rms and peak errors while the movement time significantly affected the rms and rms normalized errors. The interaction between load and movement time was significant only for the rms error. A post
TABLE I1 PAIRWISE COMPARISON OF MEANS OF COMPUTED ERROR IN ISOINERTIAL FORCE
FOR SIGNIFICANT MAIN EFFECTS, ADJUSTED FOR THE RMS ACCELER4TION. SIGNJFICANT LEVEL IS N = 0.05. THE K E Y IS BELOW THE TABLE
I Computed error in I Multiple Comparison of Means Adjusted 1 Isoinenid force for Acceleration
Movement Time R M S Error Peak Error R M S Norm Error
+ The table is read by noting which level of load was significantly different than the others. For example, 3 > 2 > 1 in the first cell means that the rms error for the third level of load (20.4 kg) was significantly greater (s.g.) than the rms error for the second level (13.6 kg), which was s.g. than the first level (6.8 kg). For Load: Level 1 = 6.8 kg For Movement Time: Level I = 2 s/cycle
Level 2 = 4 skycle Level 3 = 6 skycle
Level 2 = 13.6 kg Level 3 = 20.4 kg
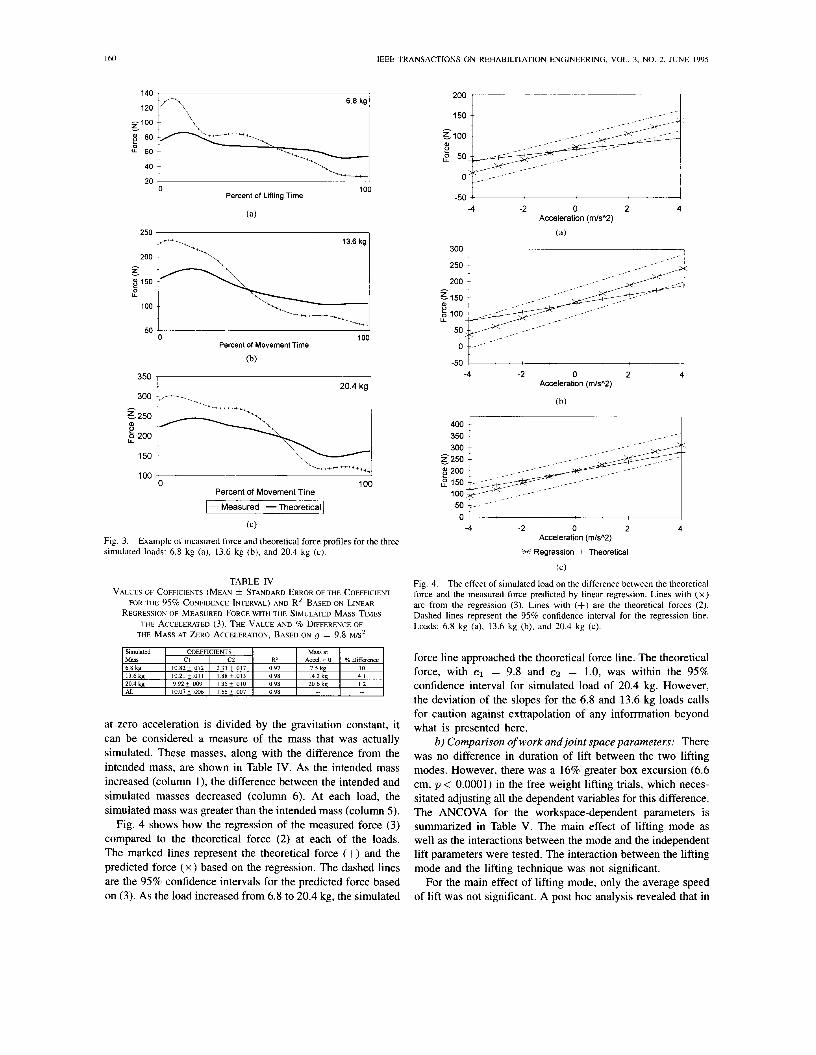
hoc test (Table 11) revealed that the rms and peak errors increased with increasing load. Examples of the response of the LIDOLift for different simulated loads are shown in Fig. 3. These graphs include profiles of the measured force and the theoretical force. The quantification of the errors at each simulated load is provided in Table 111.
Since the hand force and the predicted force were found to be different when different loads are simulated, a number of regressions were performed in an attempt to model the performance of the simulator in the isoinertial mode. Because (3) has the closest resemblance to the theoretical isoinertial lift (2), only the results from this regression will be presented. The regression was performed for the three simulated masses separately as well as together. For each mass, there were over 70 000 data points utilized in the regression. With the intercept forced to zero, the coefficients of the variables (mean f standard error of the coefficient for the 95% confidence interval) and the R-squared values are shown in Table IV. If the measured force had matched the predicted force exactly, the coefficients would be c1 = 9.8 for the mass and c2 = 1.0 for the mass times the acceleration. The coefficients for mass decreased towards 9.8 as the load increased, and the coefficient for the mass times the acceleration decreased towards 1.0 as the load increased. The R-squared values for the model were virtually equal over the masses, explaining over 97% of the variation in hand force described by (3). If the predicted force
IEEE TRANSACTIONS ON REHABILITATION ENGINEERING, VOL. 3. NO. 2, JUNE 1995
68kg ;1;!\-\\-1
40
20 0 100
Percent of Lifting Time
(a)
13.6 kg
200 I\ - t
150 0 U
100
50 0
300 350 1 Percent of Movement Time
(b)
100
20.4 kg 1
100 "-------i 0 100
Percent of Movement Tine
1 - Measured -Theoretical
(C)
Fig. 3. simulated loads: 6.8 kg (a), 13.6 kg (b), and 20.4 kg (c).
Example of measured force and theoretical force profiles for the three
TABLE IV VALUES OF COFFICENTS (MEAN & STANDARD ERROR OF THE COEFFICIENT
FOR THE 95% CONFIDENCE INTERVAL) AND R2 BASED ON LINEAR RECREWON OF MEASURED FORCE WITH THE SIMULATED MASS TIMES
THF MASS AT ZERO ACCELERATION, BASED ON iJ = 9.8 M/S2 THE ACCELERATED (3) THE VALUE AND % DIFFERENCE OF
at zero acceleration is divided by the gravitation constant, it can be considered a measure of the mass that was actually simulated. These masses, along with the difference from the intended mass, are shown in Table IV. As the intended mass increased (column l), the difference between the intended and simulated masses decreased (column 6). At each load, the simulated mass was greater than the intended mass (column 5).
Fig. 4 shows how the regression of the measured force (3) compared to the theoretical force (2) at each of the loads. The marked lines represent the theoretical force (+) and the predicted force ( x ) based on the regression. The dashed lines are the 95% confidence intervals for the predicted force based on (3). As the load increased from 6.8 to 20.4 kg, the simulated
2oo T
-50 I -4 -2 0 2 4
Acceleration (m/sA2)
(a)
300 I
-- 0 ,e-
-50 -4 -2 0 2 4
Acceleration (m/sA2)
(b)
01 -4 -2 0 2 4
Acceleration (m/sA2)
X Regression + Theoretical
(C)
Fig. 4. The effect of simulated load on the difference between the theoretical force and the measured force predicted by linear regression. Lines with ( x ) are from the regression (3). Lines with (+) are the theoretical forces (2). Dashed lines represent the 95% confidence interval for the regression line. Loads: 6.8 kg (a), 13.6 kg (b), and 20.4 kg (c).
force line approached the theoretical force line. The theoretical force, with c1 = 9.8 and c2 = 1.0, was within the 95% confidence interval for simulated load of 20.4 kg. However, the deviation of the slopes for the 6.8 and 13.6 kg loads calls for caution against extrapolation of any infomation beyond what is presented here.
b) Comparison of work and joint space parameters: There was no difference in duration of lift between the two lifting modes. However, there was a 16% greater box excursion (6.6 cm, p < 0.0001) in the free weight lifting trials, which neces- sitated adjusting all the dependent variables for this difference. The ANCOVA for the workspace-dependent parameters is summarized in Table V. The main effect of lifting mode as well as the interactions between the mode and the independent lift parameters were tested. The interaction between the lifting mode and the lifting technique was not significant.
For the main effect of lifting mode, only the average speed of lift was not significant. A post hoc analysis revealed that in
SPARTO er al.: RELIABILITY AND VALIDITY OF A LIFT SIMULATOR 161
Mode Load
O 6 7 Mode * Movement Time
06 7
E p 0 5 po5 g o 4 E
SO 3 0 5 0 4 LIDO
6 0 3 W
W W
$ 0 2 20 2 4 W
e o 1 3 0 1
0 0
Load 2 sec 4 sec 6 sec
Movement Time
Mode Load 250 1
Mode Movement Time 220 ,
- p 200 0
0 U
150
P 100 5
50 6 8 kg 1 3 6 k g 2 0 5 k g
Load
Mode * Load 350
160
140 U
4 120
p 100
80
60 2 sec 4 sec 6 sec
Movement Time
Mode Movement Time 350
=300 I T 5.
300 - e 250 e 250 0 0 U U F 200 @200
e I I = 100 = 100
' 150 A 150
50 50 6 8 kg 1 3 6 k g 2 0 5 k g
Load 2 sec 4 sec 6 sec
Movement Time
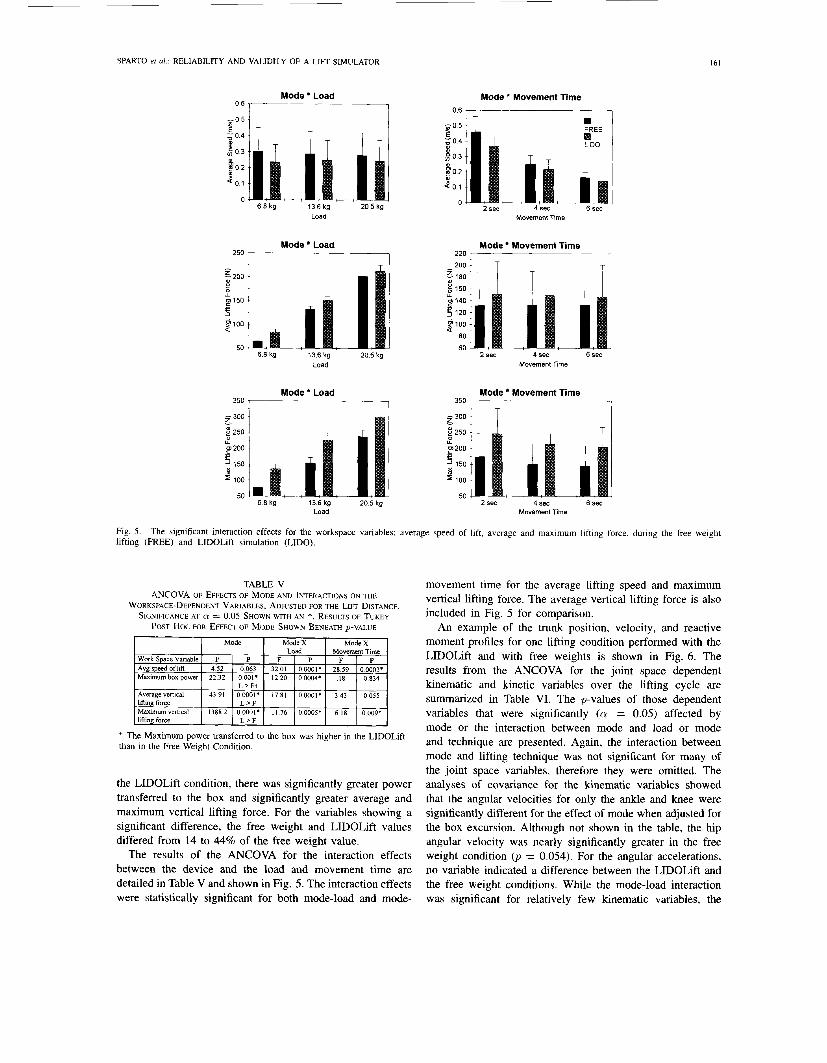
Fig. 5 . lifting (FREE) and LIDOLift simulation (LIDO).
The significant interaction effects for the workspace variables: average speed of lift, average and maximum lifting force, during the free weight
TABLE V ANCOVA OF EFFECTS OF MODE AND INTERACTIONS ON THE
WORKSPACE-DEPENDENT VARIABLES, ADJUSTED FOR THE LIFT DISTANCE. SIGNIFICANCE AT Cy = 0.05 SHOWN WITH AN *. RESULTS OF TUKEY
POST Hoc FOR EFFECT OF MODE SHOWN BENEATH p-VALUE
I ModeX I ModeX 1
+ The Maximum power transferred to the box was higher in the LIDOLift than in the Free Weight Condition.
the LIDOLift condition, there was significantly greater power transferred to the box and significantly greater average and maximum vertical lifting force. For the variables showing a significant difference, the free weight and LIDOLift values differed from 14 to 44% of the free weight value.
The results of the ANCOVA for the interaction effects between the device and the load and movement time are detailed in Table V and shown in Fig. 5. The interaction effects were statistically significant for both mode-load and mode-
movement time for the average lifting speed and maximum vertical lifting force. The average vertical lifting force is also included in Fig. 5 for comparison.
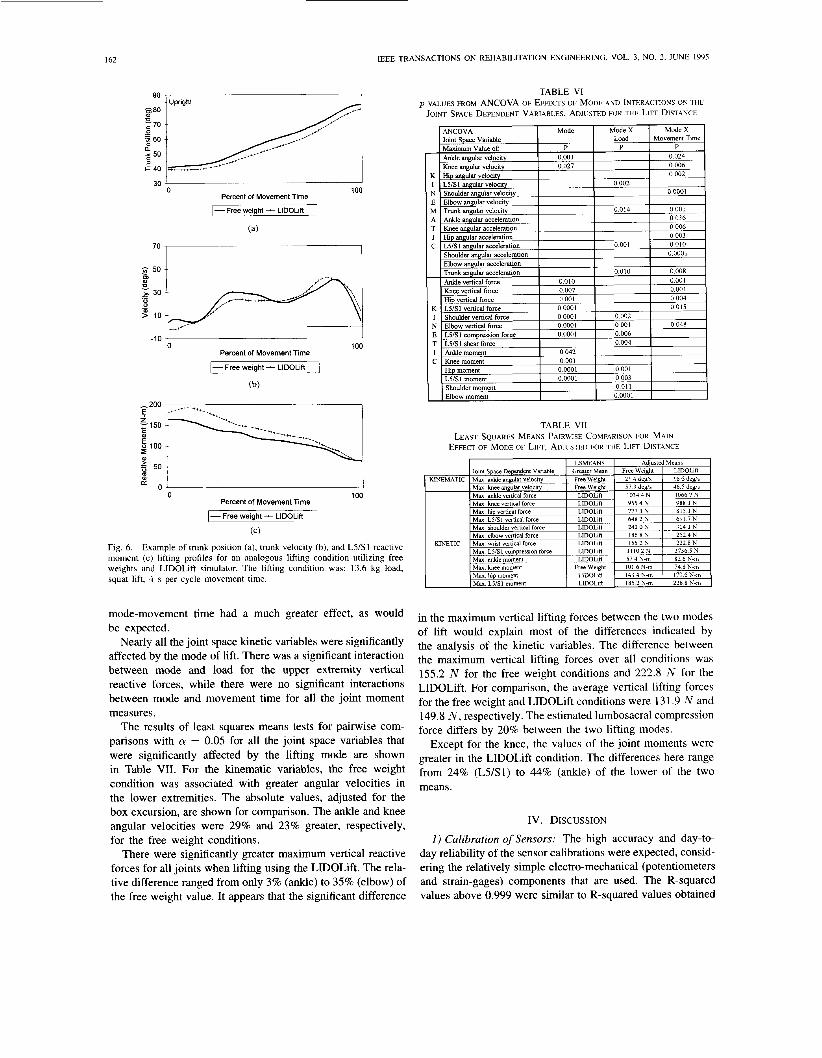
An example of the trunk position, velocity, and reactive moment profiles for one lifting condition performed with the LIDOLift and with free weights is shown in Fig. 6. The results from the ANCOVA for the joint space dependent kinematic and kinetic variables over the lifting cycle are summarized in Table VI. The p-values of those dependent variables that were significantly (cy = 0.05) affected by mode or the interaction between mode and load or mode and technique are presented. Again, the interaction between mode and lifting technique was not significant for many of the joint space variables, therefore they were omitted. The analyses of covariance for the kinematic variables showed that the angular velocities for only the ankle and knee were significantly different for the effect of mode when adjusted for the box excursion. Although not shown in the table, the hip angular velocity was nearly significantly greater in the free weight condition 0, = 0.054). For the angular accelerations, no variable indicated a difference between the LIDOLift and the free weight conditions. While the mode-load interaction was significant for relatively few kinematic variables, the
162 IEEE TRANSACTIONS ON REHABILITATION ENGINEERING, VOL. 3, NO. 2, JUNE 1995
m , I _." 0 100
Percent of Movement Time
1- Free weight - LlDOLift 1 (a)
70
-10 ' 1
100 Percent of Movement Time
-Free weight - LlDOLift
(b)
0 100 Percent of Movement Time
I- Free weight - LlDOLift
(C)
Fig. 6. Example of trunk position (a), trunk velocity (b), and LYS1 reactive moment (c) lifting profiles for an analogous lifting condition utilizing free weights and LIDOLift simulator. The lifting condition was: 13.6 kg load, squat lift, 4 s per cycle movement time.
mode-movement time had a much greater effect, as would be expected.
Nearly all the joint space kinetic variables were significantly affected by the mode of lift. There was a significant interaction between mode and load for the upper extremity vertical reactive forces, while there were no significant interactions between mode and movement time for all the joint moment measures.
The results of least squares means tests for pairwise com- parisons with cy = 0.05 for all the joint space variables that were significantly affected by the lifting mode are shown in Table VII. For the kinematic variables, the free weight condition was associated with greater angular velocities in the lower extremities. The absolute values, adjusted for the box excursion, are shown for comparison. The ankle and knee angular velocities were 29% and 23% greater, respectively, for the free weight conditions.
There were significantly greater maximum vertical reactive forces for all joints when lifting using the LIDOLift. The rela- tive difference ranged from only 3% (ankle) to 35% (elbow) of the free weight value. It appears that the significant difference
TABLE VI p-VALUES FROM ANCOVA OF EFFECTS OF MODE AND INTERACTIONS ON THE
JOINT SPACE DEPENDENT VARIABLES, ADJUSTED FOR THE LIFT DISTANCE
TABLE VI1 LEAST SQUARES MEANS PAIRWISE COMPARISON FOR MAIN
EFFECT OF MODE OF LIFT, ADJUSTED FOR THE LIFT DISTANCE
in the maximum vertical lifting forces between the two modes of lift would explain most of the differences indicated by the analysis of the kinetic variables. The difference between the maximum vertical lifting forces over all conditions was 155.2 N for the free weight conditions and 222.8 N for the LIDOLift. For comparison, the average vertical lifting forces for the free weight and LIDOLift conditions were 13 1.9 N and 149.8 N , respectively. The estimated lumbosacral compression force differs by 20% between the two lifting modes.
Except for the knee, the values of the joint moments were greater in the LlDOLift condition. The differences here range from 24% (L5/S1) to 44% (ankle) of the lower of the two means.
IV. DISCUSSION
1 ) Calibration of Sensors: The high accuracy and day-to- day reliability of the sensor calibrations were expected, consid- ering the relatively simple electro-mechanical (potentiometers and strain-gages) components that are used. The R-squared values above 0.999 were similar to R-squared values obtained
SPARTO et ai.: RELIABILITY AND VALIDITY OF A LIFT SIMULATOR I63
in the calibration of other instrumented dynamometers [37], [38]. The external calibration of the sensors was necessary in order that the information could be collected independently and synchronized with other equipment. For instance, in an earlier study, data were collected simultaneously from the LIDOLift, a forceplate, and electrogoniometers [2 11. In the current study, output voltage from the LIDOLift's force sensor, that was synchronized with the start and finish of the video data collection, was used as the external force input to the biomechanical model. The small deviations in measurement in the month-to-month calibration protocol verified that the sensors were accurate and stable, which ensured reliability in the data provided by the LIDOLift system.
2 ) Validation of the Isokinetic Mode: In the validation of the isokinetic mode of the LIDOLift, the attained velocities agreed well with the set velocity. Neglecting the error at 5 c d s , the greatest rms error was 0.8%. The error in linear velocity was comparable to the maximum 2% error found in the validation of the KINCOM [37], the maximum 5.1% error in the Cybex I1 [28], the average 3.5% error in the Biodex [38], and the maximum 0.4% error in the LIDO Active [30] dynamometer angular velocities, realizing that two different physical measurements were being compared. The higher attained velocity was consistent with the findings of a velocity overshoot at higher velocities in the KINCOM [37] and Biodex [38].
Because the arm could not accelerate to a constant velocity instantaneously, it was important to quantify the relationship between the set velocity and the time and distance required to reach that velocity. As expected, at higher set velocities, the time and distance needed for the arm to attain the set velocity was substantial. For example, in a 75 c d s lift, the time and distance required before the arm was moving at the set velocity was approximately 0.21 s and 16 cm, respectively. Farrell and Richards [37] also reported this effect. They found that at a set velocity of 210"/s, 33.6" of arc had passed before the dynamometer arm had attained that velocity. Therefore, isokinetic lifts at high set velocities may be rendered meaningless by the initial nonisokinetic phase. The results should warn against training protocols with short lifting distances at high velocities since the theoretical benefits of isokinetic exercise may not be realized because the nonisokinetic phase of the lift may dominate. This will reduce the efficiency of strengthening since the muscles are not stressed at their maximum capability in the nonisokinetic portion of the lift.
3) The Isoinertial Mode: a ) Technical validation: In the isoinertial mode, the rms
normalized error between the hand force and simulated force ranged from 16 to 19% of the hand force (Table 111). At times, the peak error was nearly as great as the simulated weight. The size of the error was substantial, considering that these loads were comparable to those that would be used in the testing of a large proportion of the patient population.
While there is greater confidence in testing at higher loads, the testing at low loads may not be physically meaningful. Although the accelerations were relatively small in this study, they still represented a significant portion of the accelerations
that will be encountered in testing. In continuing research, it is intended to further quantify the error at higher loads and accelerations.
The regression analysis reflected the results of the analysis of covariance. At the largest load simulated in this study, the theoretical force line lay well within the 95% confidence interval of the measured force line. This was not true with the smaller loads. Using the coefficients of (3) provided in Table IV, one can determine the simulated mass, given the measured force and acceleration of the box. By performing tests at a wide variety of simulated loads, a calibration curve can be determined which will provide the magnitude of the load to be set based on the actual load that is desired. This will be considered in a future study.
b) Comparison of work and joint space parameters: From the results of the workspace dependent parameters, it was expected that there would be no difference in the speeds of lift since the subjects were paced by a metronome and no significant effect was detected in the movement time per cycle. However, it was surprising to find that the excursion of the box was greater for the free weight condition compared to the LIDOLift. Because of this finding, all subsequent analyses were adjusted for the box excursion.
Although some of the interaction effects for the work space variables were statistically significant, the trends were not dramatic in the plots of Fig. 5. Due to the sensitive nature of the repeated measures analysis, within subject differences were analyzed rather than between subjects differences. The descriptive statistics shown in Fig. 5 were averaged over all 10 subjects and thus incorporated between subject differences. Hence, the interaction appears to be less significant than it would be if the data from each individual subject had been plotted.
The maximum angular velocity for the joints of the lower extremities was significantly greater for the free weight con- dition. It was possible that the increased angular velocity of the lower extremities was raising the body faster and was partly responsible for the decreased difference in joint reactive forces in the lower extremities, relative to the upper extremities. There was at least a 20% difference between the free weight and LIDOLift trials. For all of the joints, the angular acceleration was not significantly different. This was expected, considering the probable large variance.
The maximum vertical reaction forces of the LIDOLift trials were greater for all joints, most likely due to the large difference in lifting forces. Although the relative differences can be quite substantial, the functional importance of these differences must be evaluated based on the purposes of each individual study. The maximum joint moments, except for the knee, were higher for the LIDOLift condition compared to free weight.
The equivalency of the LIDOLift and free weight lifting was at best questionable, based on statistical criteria. They were significantly different both in terms of the work space and joint space parameters. Most probably, these differences resulted from the higher load simulation by the LIDOLift (Table IV). However, the utility of the device should be evaluated based on the added safety and efficiency in testing
164 IEEE TRANSACTIONS ON REHABILITATION ENGINEERING, VOL. 3, NO. 2, JUNE 1995
with the same equipment three different modes of muscle strength (isometric, isokinetic, and isoinertial). The results of Table VI1 indicated that, despite statistical significance, the magnitude of the differences may be functionally negligible for some variables. The intent has been to provide proper feedback to both clinicians and the engineering community as to the validity and reliability of this device. At higher loads, the LIDOLift approached an isoinertial lifting environment. Clinicians who are testing patients should realize that, at low loads, the isoinertial lifting tasks simulated by the LIDOLift were significantly different than free weight lifting conditions.
The preceding data identify two areas of improvement of the existing technology. First, the control algorithm should be modified to yield a faster isokinetic response, especially at higher lifting speeds. Second, the hardware or software modifications should enhance the fidelity of the isoinertial lifting mode. This study provided a methodology by which any improvement in performance can be evaluated. There has been a very cooperative relationship between the authors and Loredan, Inc. and this group believes that the proper way to interact with new technology is to critically evaluate the technology and then demand technical improvement using the criteria of validity and reliability. Others who have rejected the advanced dynamometric evaluations run the risk of returning to the days of unreliable, subjective, manual testing, which is undesirable. The future of rehabilitation engineering is tied with enhancement in the quantification of function and the ob- jective evaluation of the improvement in human performance; that can only be realized by responsible interaction amongst those developing technology, those delivering the service using the technology, and researchers trying to evaluate the tools assessing the efficacy of rehabilitation processes.
V. CONCLUSION The LIDOLift was found to be accurate and reliable in the
measurements which it was reporting. The isokinetic mode of testing was shown to have little error at clinically useful velocities and the quantified accelerative portion of the lift warns against using high speeds during short lifting distances. The isoinertial mode produced larger loads than the target load for loads that are used in the testing for a large percentage of the patient population. Nonetheless, the error was reduced at higher loads.
In terms of workspace parameters, using the LIDOLift for a wide range of lifting tasks was significantly different than using free weights. The relative difference was at least 10% for the maximum box power, average lifting force, and maximum lifting force. A comparison of the output of a biomechanical model from the two modes of lifting showed significant differences in some joint angular velocities, reactive forces, and reactive moments. However, the effect of these differences on the functional equivalency of LIDOLift isoinertial lifting and free weight lifting must be evaluated by each user on an individual basis.
This study is the first of its kind to examine the validity of a lift simulator in terms of work space and joint space variables. This type of evaluation is needed in order to raise the level of
the state of the science of functional muscle testing. There has been much improvement in the last two decades in the objec- tive assessment of muscular performance. To further improve, the medical and engineering communities must continue to work together to advance the current technology.
ACKNOWLEDGMENT
P. L. Wright and Dr. W. Marras are recognized for their invaluable assistance. In addition, the reviewers are gratefully thanked for their insightful comments and suggestions. Dr. T. Waters and Dr. T. Leskinen contributed significantly to the technical validation of the isoinertial mode. The aid of R. McCall in preparation of this manuscript is also appreciated.
REFERENCES
[ l ] J. W. Frymoyer and V. Mooney, “Occupational orthopaedics,” J . Bone Joint Surg., vol. 68-A, no. 3, pp. 469474, 1986.
[2] Arthritis Foundation, Press Releuse. Washington, D.C.: National Arthritis Foundation, May 2, 1979.
[3] K. L. Grazier, T. L. Holbrook. J. L. Kelsey, and R. N. Strauffer, The Frequency of Occurence, Impuct, und Cost .f Musculoskeletcil Conditions in the United Stales. Chicago: The American Academy of Orthopaedic Surgeons, 1984.
[4] V. Mooney, “Impairment, disability, and handicap,” Clin. Orthopuedics Related Res., vol. 221, pp. 14-25, 1991.
[SI D. B. Chaffin and G. B. J. Andersson, Occuputionul Biornechunics, 2nd ed.
[6] B. S. Wehster and S. H. Snook, “The cost of 1989 Workers’ Compen- sation low hack pain claims,” Spine, vol. 19, no. 10, pp. 11 11-1 116, 1994.
[7] A. A. Sapega, “Muscle performance evaluation in orthopaedic practice,” J . Bone Joint Surg., vol. 72a, no. 10, pp. 1562-1574, 1990.
[ X I J. M. Rothstein, R. L. Lamb. and T. P. Mayhew. “Clinical uses of isokinetic measurements-Critical issues,” Phys. Ther., vol. 67, no. 12, pp. 184CL1844, 1987.
[9] M. Newton and G. Waddell. “Trunk strength testing with iso- machines-Part 1: Review of a decade of scientific evidence.” Spine, vol. 18, no. 7, pp. 801-811. 1993.
[IO] M. Newton, M. Thow, D. Somerville, I . Henderson, and G. Waddell, “Trunk strength testing with iso-machines-Part 2: Experimental evalu- ation of the Cyhex I1 back testing system in normal subjects and patients with chronic low hack pain,” Spine, vol. 18, no. 7, pp. 8 12-824, 1993.
I l l R. G. Hazard, L. D. Haugh, P. A. Green, and P. L. Jones, “Chronic low back pain: The relationship between patient satisfaction and pain, impairment and disability outcomes,” Spine, vol. 19, no. 8, pp. 88 1-887, 1994.
121 L. Curtis, T. G. Mayer, and R. J. Gatchel, “Physical progress and residual impairment quantification after functional restoration. Part 111. Isokinetic and isoinertial lifting capacity,” Spine, vol. 19, no. 4, pp. 401405, 1994.
131 V. Mooney, “On the dose of therapeutic exercise,” Orthopedicx. vol. 15, no. 5, pp. 653-656, 1992.
[14] M. Pamianpour and J. C. Tan, “Objective quantification of trunk performance,” in Back Puin Rehabilitution, D’Orazio. Ed. Boston: Andover Medical, 1993, pp. 205-237.
[I51 M. Pamianpour, L. Hasselquist, L. Fagan. and A. Aaron, “Correla- tion among isometric, isokinetic and isoinertial muscle performance during multi-joint coordinated exertions and isolated single joint trunk exertion,” Eur. J . Phys. Med. Rehub., vol. 3, no. 3, pp. 114-122. 1993.
[I61 J. E. Graves et al., “Qualitative assessment of full range of motion isometric lumbar extension strength,” Spine, vol. 16, pp. 289-294, 1991.
[17] S . Gracovetsky el al., ‘The importance of pelvic tilt in reducing compressive stress in the spine during flexion and extension exercises,” Spine, vol. 14, pp. 412420, 1989.
[I81 D. L. Wheeler, J. E. Graves. G. J. Miller, P. O‘Connor. and M. MacMillan, “Functional assesment for prediction of lifting capacity,” Spine, vol. 19, no. 9, pp. 1021-1026, 1994.
[19] K. H. E. Kroemer, “An isoinertial technique to assess individual lifting capability,” Human Fuctors, vol. 25, no. 5 , pp. 493-506, 1983.
[20] M. Gagnon and G. Smyth, “Muscular mechanical energy expenditure as a process for detecting potential risks in manual materials handling.” J . Biomechan., vol. 24, no. 3/4, pp. 191-203, 1991.
New York: Wiley Interscience, 1991.
SPARTO er al.: RELIABILITY AND VALIDITY OF A LIFT SIMULATOR I65
[21] P. J . Sparto, K. A. Khalaf, and M. Pamianpour, “The effect of load, speed and mode of lift on the joint energetics during unconstrained lifting and lowering activities,” presented at the 1993 ASME Winter Annu. Mtg., New Orleans, LA, 1993.
[22] A. A. Maciejewski and C. A. Klein, “Obstacle avoidance for kinemat- ically redundant manipulators in dynamically varying environments,” Int. J . Robotics Res., vol. 4, no. 3, pp. 109-117, 1985.
[23] J. J. Craig, Introduction to Robotics: Mechanics and Control, 2nd ed. Reading, MA: Addison-Wesley, 1989.
[24] Chattecx Corp., “KIN-COM 125E plus clinical desk reference,” rev. C, 1992.
[25] H. J. Hislop and J . J. Pemne, “The isokinetic concept of exercise,” Phys. Ther., vol. 49, pp. 114-1 17, 1967.
[26] D. C. Feiring, T. S. Ellenbecker, and G. L. Derscheid, “Test-retest reliability of the Biodex isokinetic dynamometer,” J. Orthopaedic Sports Phys. Ther., vol. 11, no, 7, pp. 298-300, 1990.
[27] M. A. McCrory, S. G. Aitkens, C. M. Avery, and E. M. Bemauer, “Reliability of concentric and eccentric measurements on the Lido active isokinetic rehabilitation system,” Med. Sci. Sports Exercise, vol. 1, no. 2, s52, 1989.
[28] M. Moffroid, R. Whipple, J. Hofkosh, E. Lowman, and H. Thistle, “A study of isokinetic exercise,” Phys. Ther., vol. 49, no. 7, pp. 735-746,
1301
1351
1969. M. G. Bemben, K. J. Grump, and B. H. Massey, “Assessment of technical accuracy of the Cybex I1 isokinetic dynamometer and analog recording system,”J. OrthopaedicSports Phys. Ther., vol. IO, pp. 12-17, 1988. L. A. Patterson and W. Spivey, “Validity and reliability of the Lido active isokinetic system,” J. Orthopaedic Sports Phys. Ther., vol. 15, no. 1, pp. 32-36, 1992. P. Wright, M. Pamianpour, and W. Marras, “Reliability and validity of the kinematic and kinetic measures of a lift simulator,” in Proc. 2nd No. Amer. Congr. Biomechan., pp. 529-530, 1992. Loredan Biomedical, Inc., “LIDOLift operations manual,” very 2.4, 1989. D. A. Winter, Biomechanics and Motor Control of Human Movement, 2nd ed. S . Kromodihardjo and A. Mital, “Kinetic analysis of manual lifting ac- tivities: Part I-Development of a three-dimensional computer model,” Int. J . Ind. Ergonomics, vol. 1, pp. 77-90, 1986. S . M. McGill and R. W. Norman, “Effects of an anatomically de- tailed erector spinae model on L4L5 disc compression and shear,” J. Biomechan., vol. 20, no. 6, pp. 591-600, 1987. -, “Partitioning of the L4-L5 dynamic moment into disc, ligamen- tous, and muscular components durine liftine.” Saine. vol. 11. no. 7,
New York: Wiley Interscience, 1990.
- I .
pp. 66&678, 1986. M. Farrell and J. G. Richards, “Analysis of the reliability and validity of the kinetic communicator exercise device,” Med. Sci. Sports Exercise, vol. 18, no. 1, pp. 4 4 4 9 , 1986. N. A. S. Taylor, R. H. Sanders, E. I. Howick, and S . N. Stanley, “Static and dynamic assessment of the Biodex dynamometer,” Eur. J . Applied Physiol. Occupational Physiol., vol. 62, pp. 18C188, 1991. SAS Institute Inc., SAS/STAT User’s Guide, release 6.03 ed. Cary, NC: SAS Institute Inc., 1988.
Patrick J. Sparto received the B.S. degree in me- chanical engineering from the University of Dayton, OH, in 1992. He is presently a doctoral candidate in the Biomedical Engineering Center of the Ohio State University, and is specializing in biomechanics.
His research interests include the measurement of human performance and the measurement of fatigue-related changes that occur during lifting.
Mohamad Parnianpour received the B.A. degree in physics from Queens College, City University of New York, the M.S degree in applied science, and the Ph.D. degree in occupational biomechanics from New York University, in 1982, 1983, and 1988, respectively.
He was Associate Director of the Occupational and Industnal Orthopedic Center of the Hospital for Joint Diseases Orthopedic Institute, New York, NY and Research Assistant Professor in the Department of Environmental Medicine at New York University
until 1991. He IS presently an Assistant Professor in the Department of Industnal and Systems Engineenng and Biomedical Engineenng Program at the Ohio State University, Columbus. He is also Associate Director of the Biodynamics Laboratory conducting research in the areas of quantification of human performance, development of functional evaluation protocols (implica- tions of the Amencans with Disability Act), neuromuscular control, low back pain, and biomechanical modeling.
Kinda A. Khalaf received the B.S. and M.S. de- grees in mechanical engineering from the Ohio State University, Columbus, in 1990 and 1991, respectively. She is currently a doctoral candidate in biomechanics at the Ohio State University.
Her current research interests include develop- ing quantitative models to assess functional perfor- mance of both normal and disabled subjects.
Sheldon R. Simon holds degrees in both engi- neering and medicine and has continually applied engineering concepts and principles to the field of medicine.
He is a Judson Wilson Professor of Orthopedic Surgery at the Ohio State University, Chief of the Division of Orthopedic Surgery in University Hospital, and Adjunct Professor in the Department of Mechanical Engineering. He currently maintains a clinical practice and manages a laboratory and the Orthopedic Department. He is a founding member,
past president, treasurer, and member of the Board of Directors of RESNA, and a previous member of the NIH study section on musculoskeletal disorders and a present member of the NIH SBIR study. He has published in the field of biomechanics and rehabilitation engineering with a specialty in human movement and performance.