Reliability, validity and follow-up of the EEG in senile dementia: sequelae of sequential...
13
400 Electroencephalography and clinical N europt~vsiologv. 1990, 76:400-412 Elsevier Scientific Publishers Ireland. Ltd. EEG 89535 Reliability, validity and follow-up of the EEG in senile dementia: sequelae of sequential measurement Chris Hooijer a, Cees Jonker b, Johan Posthuma c and Simon L. Visser a Departments of, Psychiatry and d Clinical Neurophysiology, Free Universi(v of Amsterdam, Amsterdam I The Netherlands), t, PCA Valeriuskliniek, Amsterdam (The Netherlands), and ' Hospital Dennenoord, Zuidlaren (The Netherlands) (Accepted for publication: 11 January 1990) Summary In a longitudinal study, slowing of the EEG in SDAT patients and elderly controls is investigated using both visual and power spectral analyses. For this a reliability study in 20 SDAT patients is performed and results for intra-rater, inter-rater and test-retest reliability (in 24 h) are used in the selection of parameters. Next, the diagnostic efficacy of the chosen parameters for SDAT is confirmed in a validity study in 43 SDAT patients, 41 elderly non-organic psychiatric patients and 51 elderly normals. In the longitudinal study 78 of these subjects could be retested after 20 months. The parameter for visual analysis appeared to be superior in actually showing a progress of slowing of the EEG in 20/2l SDAT patients over time. The parameter for power spectral analysis was superior in measuring the more subtle processes in the normal elderly. Results of these studies are used to discuss some problems in the measurement of EEG in SDAT over time. Key words: Senile dementia: EEG; Sequential measurement Senile dementia of the Alzheimer type, SDAT, is a frequently occurring disease, characterised by an insidious onset, progressive invalidity, a de- creased longevity and a final diagnosis post portem. Additional to direct clinical observations, EEG is one of the most important diagnostic procedures. Longitudinal cohort studies of the EEG in SDAT are clearly of interest, although they are scarce and results are somewhat unclear. In studies concerning patients with a severe or advanced dementia, EEGs of these patients seem to be more frequently and more seriously dis- turbed than are the EEGs found in studies con- cerning patients with a mild or less advanced dementia: moreover, in cross-sectional studies (concerning both stages or types of dementia Correspondence to." Chris Hooijer, M.D., Dept. of Psychi- atry, Valeriuskliniek. Valeriusplein 9, 1075 BG Amsterdam (The Netherlands). within one study at one point in time), these differences tend to be confirmed over decades (Greenblatt et al. 1945; Mundy-Castle et al. 1954; McAdam and Robinson 1956; Thaler 1956: Obrist et al. 1962; Thompson 1976; Roberts et al 1978; Kaszniak et al. 1979; Soininen et al. 1982; Brenner et al. 1988). In longitudinal cohort studies a pro- gression of EEG deterioration with time is to be expected in SDAT patients. In these studies this expectation is confirmed only for results referring to the groups of de- mentia patients as a whole: group means, propor- tion of deviations per group or proportion of disturbed EEGs per group (Gordon 1968; Johannesson et al. 1977; Coben et al. 1985; Rae Grant et al. 1987). However, expectations were not at all confirmed in results for individual pa- tients. In two studies on presenile dementia 20- 40% of patients did not show worsening of EEG features over years, improvement even occurred (Gordon 1968; Johannesson 1977). In the recent 0013-4649/90/$03.50 © 1990 Elsevier Scientific Publishers Ireland, Ltd.
-
Upload
independent -
Category
Documents
-
view
1 -
download
0
Transcript of Reliability, validity and follow-up of the EEG in senile dementia: sequelae of sequential...
400 Electroencephalography and clinical N europt~vsiologv. 1990, 76:400-412 Elsevier Scientific Publishers Ireland. Ltd.
EEG 89535
Reliability, validity and fol low-up of the E E G in seni le dementia: sequelae of sequential measurement
Chris Hooijer a, Cees Jonker b, Johan Posthuma c and Simon L. Visser a Departments o f , Psychiatry and d Clinical Neurophysiology, Free Universi(v of Amsterdam, Amsterdam I The Netherlands),
t, PCA Valeriuskliniek, Amsterdam (The Netherlands), and ' Hospital Dennenoord, Zuidlaren (The Netherlands)
(Accepted for publication: 11 January 1990)
Summary In a longitudinal study, slowing of the EEG in SDAT patients and elderly controls is investigated using both visual and power spectral analyses. For this a reliability study in 20 SDAT patients is performed and results for intra-rater, inter-rater and test-retest reliability (in 24 h) are used in the selection of parameters. Next, the diagnostic efficacy of the chosen parameters for SDAT is confirmed in a validity study in 43 SDAT patients, 41 elderly non-organic psychiatric patients and 51 elderly normals. In the longitudinal study 78 of these subjects could be retested after 20 months. The parameter for visual analysis appeared to be superior in actually showing a progress of slowing of the EEG in 20 /2 l SDAT patients over time. The parameter for power spectral analysis was superior in measuring the more subtle processes in the normal elderly. Results of these studies are used to discuss some problems in the measurement of EEG in SDAT over time.
Key words: Senile dementia: EEG; Sequential measurement
Senile dementia of the Alzheimer type, SDAT, is a frequently occurring disease, characterised by an insidious onset, progressive invalidity, a de- creased longevity and a final diagnosis post portem. Additional to direct clinical observations, EEG is one of the most important diagnostic procedures. Longitudinal cohort studies of the EEG in SDAT are clearly of interest, although they are scarce and results are somewhat unclear.
In studies concerning patients with a severe or advanced dementia, EEGs of these patients seem to be more frequently and more seriously dis- turbed than are the EEGs found in studies con- cerning patients with a mild or less advanced dementia: moreover, in cross-sectional studies (concerning both stages or types of dementia
Correspondence to." Chris Hooijer, M.D., Dept. of Psychi- atry, Valeriuskliniek. Valeriusplein 9, 1075 BG Amsterdam (The Netherlands).
within one study at one point in time), these differences tend to be confirmed over decades (Greenblatt et al. 1945; Mundy-Castle et al. 1954; McAdam and Robinson 1956; Thaler 1956: Obrist et al. 1962; Thompson 1976; Roberts et al 1978; Kaszniak et al. 1979; Soininen et al. 1982; Brenner et al. 1988). In longitudinal cohort studies a pro- gression of EEG deterioration with time is to be expected in SDAT patients.
In these studies this expectation is confirmed only for results referring to the groups of de- mentia patients as a whole: group means, propor- tion of deviations per group or proportion of disturbed EEGs per group (Gordon 1968; Johannesson et al. 1977; Coben et al. 1985; Rae Grant et al. 1987). However, expectations were not at all confirmed in results for individual pa- tients. In two studies on presenile dementia 20- 40% of patients did not show worsening of EEG features over years, improvement even occurred (Gordon 1968; Johannesson 1977). In the recent
0013-4649/90/$03.50 © 1990 Elsevier Scientific Publishers Ireland, Ltd.
E E G I N S E N I L E D E M E N T I A 401
study by Rae Grant et al. (1987), also using visual analysis of the EEG in senile and presenile de- mentia, in one-half of the dementia patients the EEG was judged to be no worse and 12% of EEGs even improved. In the other recent longitudinal study of Coben et al. (1985) using computerized spectral analysis, these results of visual analysis were confirmed by showing progressive slowing of the power spectrum for a group of patients but no results on individual patients are presented for comparison with the puzzling results mentioned above for visual analysis.
Longitudinal studies have to meet two sets of conditions:
Firstly, all aspects of diagnosis, like the use of internationally accepted inclusion and exclusion criteria in the sample of subjects or the relation- ship between EEG results and other diagnostic procedures, have to meet the highest standards. These aspects were recently outlined by Rae Grant et al. (1987) and are basically identical to the conditions to be met by any study of validity of the EEG in SDAT.
The second set of conditions is often neglected but can be considered as a specific one for longi- tudinal studies: the measurement should be suit- able for demonstrating the changes that are ex- pected. These conditions not only mean simple arithmetical considerations but also point at some other qualities of measurement itself.
As far as human judgement is concerned, mea- surement can exhibit variance where there is no actual variance within the subjects under study. This feature concerns intra-rater and inter-rater reliability and studies dedicated to this subject did not reject this problem as irrelevant (Travis 1937; Blum 1954: Houfek 1959; Jenkins 1962; Volavka et al. 1973). Now, computer analysis has solved this problem but the design of the longitudinal study poses the next problem for both visual and computer analysis, test-retest reliability. This means that any variance shown by the measure- ment or the subject under study over short periods of time sets the limits to the amount of change that can be perceived over longer periods of time.
Besides, the state of the art requires an equi- librium: on the one hand the EEG procedure in follow-up has to be standardized as rigorously as
possible, on the other the same procedure should be applicable in most clinical laboratories and those EEG phenomena should be chosen that are well known for their diagnostic validity.
In the results of longitudinal studies of the EEG in SDAT means do confirm the thesis of worsening in the course of time but figures from many individual patients do not. This kind of contradictory result might lead to a qualitative suggestion, like subtypes of dementia: they might, however, also lead to a quantitative suggestion, such as a random error within the procedure of measurement. We studied the second set of condi- tions by considering the entire results from a small reliability study, a validity study and a small longitudinal study on SDAT patients and con- trols.
EEG methods
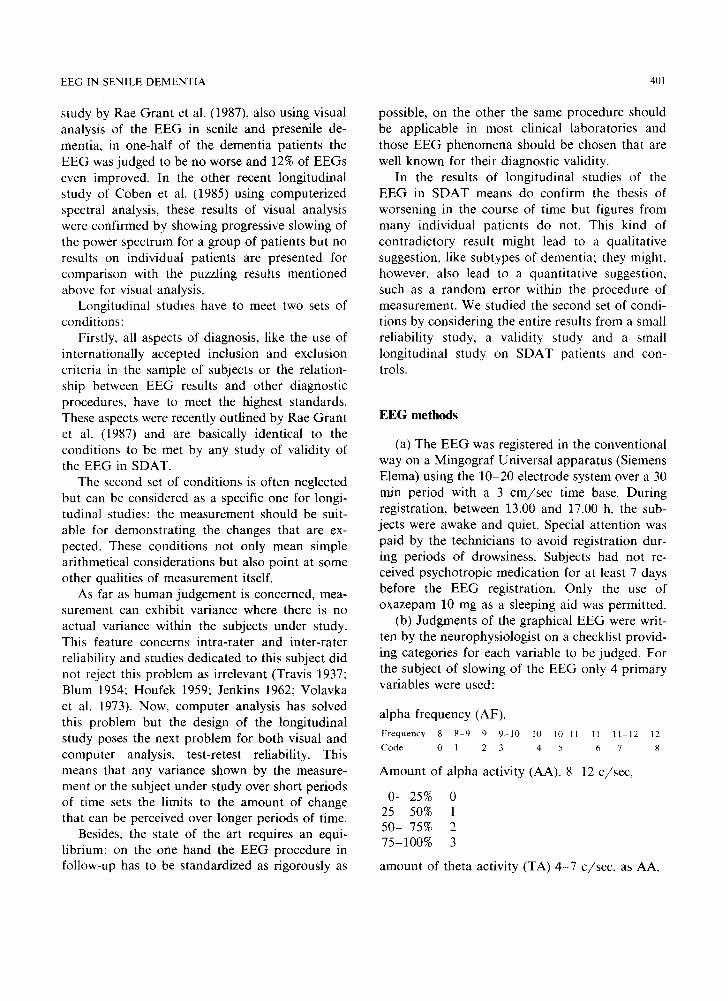
(a) The EEG was registered in the conventional way on a Mingograf Universal apparatus (Siemens Elema) using the 10-20 electrode system over a 30 min period with a 3 cm/sec time base, During registration, between 13.00 and 17.00 h, the sub- jects were awake and quiet. Special attention was paid by the technicians to avoid registration dur- ing periods of drowsiness. Subjects had not re- ceived psychotropic medication for at least 7 days before the EEG registration. Only the use of oxazepam 10 mg as a sleeping aid was permitted.
(b) Judgments of the graphical EEG were writ- ten by the neurophysiologist on a checklist provid- ing categories for each variable to be judged. For the subject of slowing of the EEG only 4 primary variables were used:
alpha frequency (AF).
F r e q u e n c y 8 8 9 9 9 - 1 0 10 111 11 11 11 -12 12
C o d e 0 1 2 3 4 5 6 7 8
Amount of alpha activity (AA), 8-12 c/sec,
0- 25% 0 25- 50% 1 50- 75% 2 75-100% 3
amount of theta activity (TA) 4-7 c/sec, as AA,

402 C. HOOIJER ET AL.
amount of delta activity (DA) 1-3 c/sec, as AA and TA
To improve reliability and to achieve better statistical quality in the measurement of EEG slowing, these 4 primary variables were combined in 3 simple constructions for secondary variables, guided by their supposed meaning for the concept of slowing:
AL = alpha all = 1AF + 2AA (alpha frequency
+ 2 alpha amount)
(alpha amount is doubled to equate the scoring ranges of both)
TD = theta delta = TA + 2 DA (theta amount
+ 2 delta amount)
(delta amount is doubled for its clinical signifi- cance for slowing)
SLOW = slowing = TD - AL ( + 11).
(decrease of fast activity a n d / o r increase of slow activity) (+ 11 to avoid negative values).
(c) In the same session a sample of the EEG having as few artifacts as possible was selected by visual inspection and stored on tape (SE 7000). Two derivations were used for spectral analysis: P3-O1 and P4-O2. Analysis used 10 epochs of 10.24 sec, computer sampling rate was 100 Hz, frequency resolution 1/10.24 Hz providing 512 frequency classes, ranging from 0 to 50 Hz. Filters were set at 0.25 Hz and at 70 Hz ( - 3 dB, 18 dB/octave). The first 3 frequency classes were set at zero, the lower border of the spectrum being 0.35 Hz. Fast Fourier transformation was applied, using a PDP 11/34 computer, to each epoch and results were averaged to produce the final analy- sis. Power in the usual frequency bands was ex- pressed in percentages of total power.
(d) For slowing of the EEG 4 primary variables were chosen:
percentage power of delta activity (PD)
0.35-4 Hz. percentage power of theta activity (PT)
4-8 Hz. percentage power of alpha activity (PA)
8-13 Hz. percentage power of beta activity (PB)
13-30 Hz.
A fifth variable, called Rest, concerned the percentage of power in the 30-50 Hz band and was used as an indicator for possible artifacts (Gotman et al. 1975). The denominator for all percentual values was the 0.35-50 Hz band. The concept of slowing was also measured by a sec- ondary variable: the ratio of fast and slow activi- ties, similar to studies concerning focal lesions of the brain (Steadman and Morgan 1974; Roubi6ek 1977; Huffelen et al. 1985). We used the basal form of this ratio without the attachment of weights:
PSAQ = (PA + P B ) / ( P T + PD)
= (% power alpha + % power beta) /
(% power theta + % power delta)
Comparison of data from the two derivations did not show any significant differences (Mann- Whitney U test, P > 0.05). Only results from one derivation, P3-O1, are presented here.
Study I: reliability
Subjects From patients, admitted to a psychogeriatric
ward of a psychiatric hospital, 20 subjects were selected according to 4 criteria (JP): Inclusion: (1) age over 65 years; (2) admission: suspected de- mentia; (3) clinical diagnosis: senile dementia (P.D.D., DSM III (A.P.A. 1980)). Exclusion: (4) any disease or medication known to influence the EEG.
Method EEG visual judgement and power spectral anal-
ysis (PSA) procedures were performed on each subject between 13.00 and 14.00 h and repeated the next day. Hour of the day, room, machinery, procedure and technician were the same for all 40 registrations.
For visual judgement EEG curves were made anonymous and offered to rater A, then to rather B, and after about 6 weeks again to rater A; all judging was done without knowledge of previous judgements, filling in all 100 items of the total
E E G IN S E N I L E D E M E N T I A
T A B L E 1
E E G reliability study: results of different var iables in senile demen t i a pat ients (n = 20).
403
Results
In t ra - ra te r In te r - ra te r Test-retest
Visual analys is *
A F alpha f requency 0.62 0.52 0.62
A A alpha a m o u n t 0.72 0.69 0.50
T A theta a m o u n t 0.81 0.77 0.68
D A delta a m o u n t - - -
A T = A F + 2A A 0.77 0.64 0.61
T D = T A + 2 D A 0.83 0.77 0.67
S L O W = T D - A T + 11 0.81 0.80 0.73
S p e c t r a l analys is * *
PD delta 0 .35 - 4 Hz
P T t h e t a 4 - 8 H z
P A a l p h a 8 - 1 3 H z
PB beta 13 - 3 0 H z
PSAQ = (PA + P B ) / ( P T + PD)
Test-re tes t
Before Af te r * * *
0.40 ns
ns 0.58
ns 0.50
ns 0.70
0.60 0.78
* Spearman , P < 0.05, - = insuff, var iance.
* * Pearson, P < 0.05, ns = not-significant.
* * * Exclusion of cases with more than 10% power in 3 0 - 5 0 Hz band.
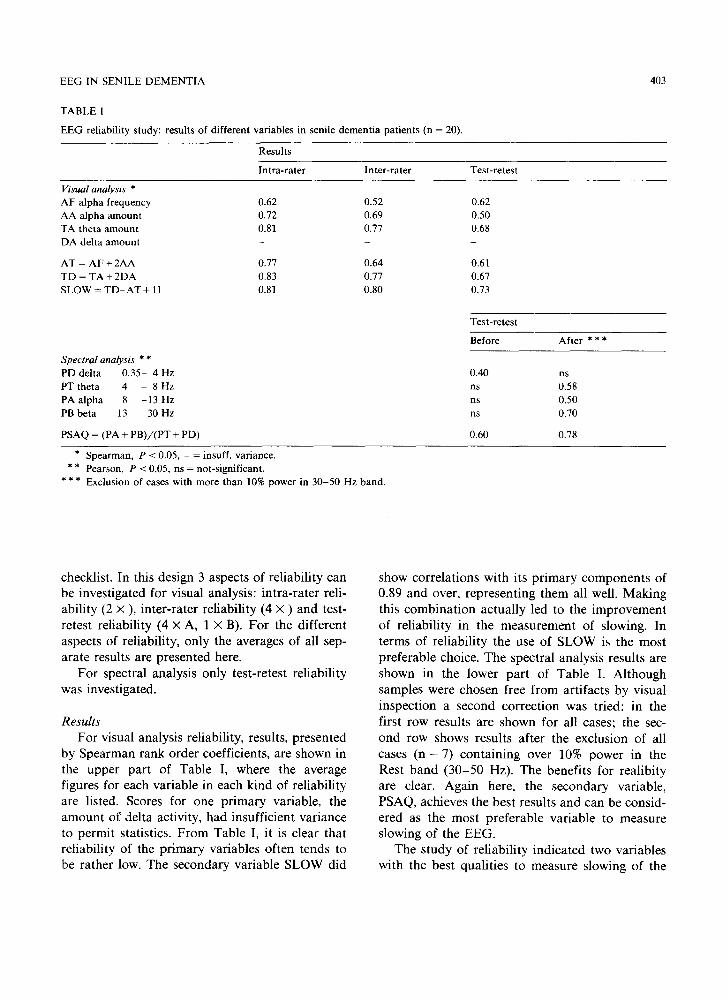
checklist. In this design 3 aspects of reliability can be investigated for visual analysis: intra-rater reli- ability (2 × ), inter-rater reliability (4 x ) and test- retest reliability (4 x A, 1 x B). For the different aspects of reliability, only the averages of all sep- arate results are presented here.
For spectral analysis only test-retest reliability was investigated.
Results For visual analysis reliability, results, presented
by Spearman rank order coefficients, are shown in the upper part of Table I, where the average figures for each variable in each kind of reliability are listed. Scores for one primary variable, the amount of delta activity, had insufficient variance to permit statistics. From Table I, it is clear that reliability of the primary variables often tends to be rather low. The secondary variable SLOW did
show correlations with its primary components of 0.89 and over, representing them all well. Making this combination actually led to the improvement of reliability in the measurement of slowing. In terms of reliability the use of SLOW is the most preferable choice. The spectral analysis results are shown in the lower part of Table I. Although samples were chosen free from artifacts by visual inspection a second correction was tried: in the first row results are shown for all cases; the sec- ond row shows results after the exclusion of all cases (n = 7) containing over 10% power in the Rest band (30-50 Hz). The benefits for realibity are clear. Again here, the secondary variable, PSAQ, achieves the best results and can be consid- ered as the most preferable variable to measure slowing of the EEG.
The study of reliability indicated two variables with the best qualities to measure slowing of the
404
E E G in the next 2 studies: visual analysis: S L O W (intra- and in ter - ra ter 0.80, retest 0.73); spectral analysis: PSAQ (test-retest 0.78).
Study 2: validity
Subjects Out of a series of psychia t r ic hospi ta ls admis-
sions of pat ients who were 65 years of age or more, the ward teams concerned app l ied the inclu- sion cri teria chosen by the authors and selected two groups of pat ients :
Group D. A group of 43 pa t ien ts d iagnosed according to the D S M - I I I cr i ter ia for P.D.D. , complemen ted by the cri ter ia of Roth and Myers (1969) for senile dement ia . Select ion was com- p le ted by: a his tory of at least 2 years dura t ion , in which memory d is turbances for recent events and or ienta t ion d is turbances p redomina ted ; cl inical observa t ion dur ing 2 weeks conf i rming the ex- istence of funct ional A D L dis turbances as de- scribed by Blessed et al. (1968).
Group P. A group of 41 elderly psychia t r ic inpat ients , admi t ted to the same hospi ta l at the same time. A 2 week observat ion d id not give rise to any suspicion of any k ind of dement i a (o ther diagnoses happened less than 10 times). Pat ients with any somatic disease that could account for their behavioura l d i s tu rbance were excluded by extensive physical , l abo ra to ry and radiologica l ex- aminat ions .
Group N. A group of 51 normal elderly volunteers, selected for research purposes . They were sent by GPs or volunteered fol lowing a rad io broadcas t . F rom 80 volunteers, 51 were selected with a his tory free from any impor t an t somat ic or psychia t r ic disease and aged 65 and over (CH). Each subject was seen at ent ry and at fol low-up after 20 months by an exper ienced and indepen- dent psychiatr is t , who in all cases could conf i rm the al locat ion to 1 of the 3 groups.
Methods" EEG and PSA were pe r fo rmed between 13 and
17 h on each subject. In 23 of the 51 normal volunteers for technical reasons only PSA was per formed. Wi th in the same project all subjects
C. HOOIJER ET AL.
TABLE I1
EEG validity study: diagnostic groups, statistics and EEG variables.
Variables Groups
Dementia Psychiatric Normal
N 43 41 51 Sex F/M 30/13 23/18 27/54
Age Mean 75.9 73.7 73.3 * S.D. 5.2 6.6 5.1 N 42 40 28
SLOW Mean 9.6 5.7 * 5.2 * S.D. 4.8 2.6 2.2 Range 2 18 1-14 1 9 N * * 37 36 42
PSAQ Mean 0.61 2.39 * 2.65 * S.D. 0.76 1.85 1.69 Range 0.08-4.03 0.09-7.07 0.07-8.32
GMS-incomp 4.7 (3.5) 1.0 (2.1) * 0.0 (0.2) * NPT-fluency 5.5 (5.0) 24.9 (8.6) * 36.3 (9.3) *
* Student t test (2t, P < 0.05) for differences from group D. * * After exclusion for possible artefacts (rest 10% + ).
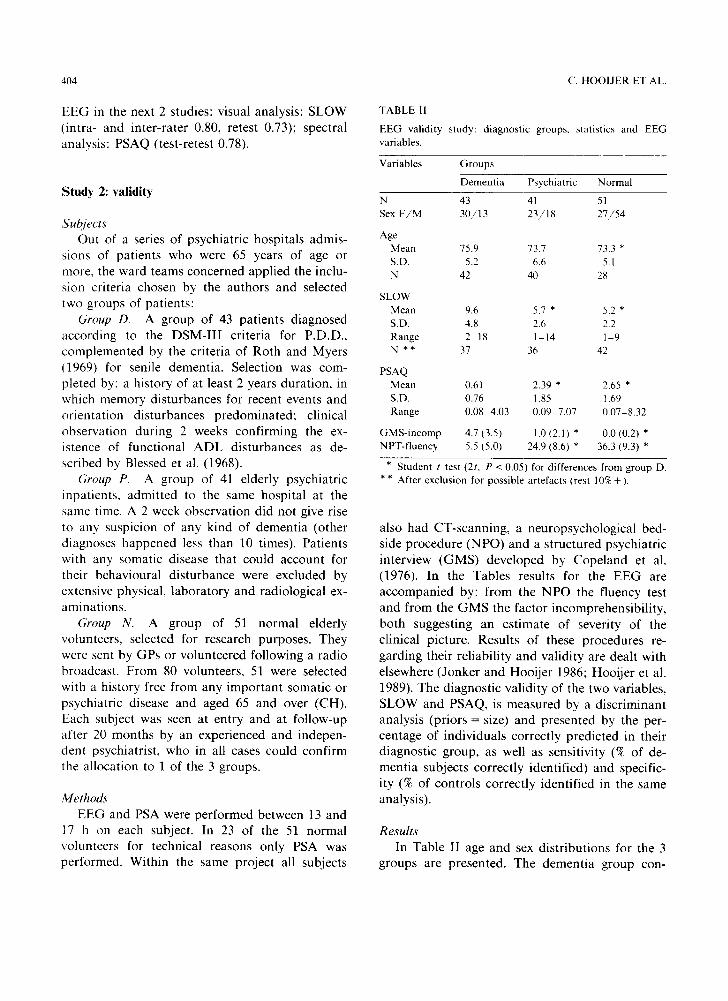
also had CT-scanning , a neuropsychologica l bed- side p rocedure (NPO) and a s t ruc tured psychia t r ic interview ( G M S ) deve loped by Cope land et al. (1976). In the Tables results for the E E G are accompan ied by: f rom the N P O the fluency test and from the G M S the factor incomprehens ib i l i ty , bo th suggesting an es t imate of severity of the cl inical picture. Resul ts of these procedures re- gard ing their re l iabi l i ty and val id i ty are deal t with elsewhere (Jonker and Hooi je r 1986; Hooi je r et al. 1989). The d iagnos t ic va l id i ty of the two variables, S L O W and PSAQ, is measured by a d i sc r iminant analysis (pr iors = size) and presented by the per- centage of ind iv idua ls correct ly p red ic ted in their d iagnos t ic group, as well as sensi t ivi ty (% of de- ment ia subjects correc t ly ident i f ied) and specific- i ty (% of cont ro ls correc t ly ident i f ied in the same analysis) .
Results In Table II age and sex d is t r ibu t ions for the 3
groups are presented . The dement i a group con-
EEG IN SENILE DEMENTIA 405
TABLE III
EEG validity study: discriminant analyses, individual classification in diagnostic groups. Sensitivity and specificity (viz., Methods),
Analyses Percentages of correct individual predication
SLOW SENS SPEC PSAQ SENS SPEC (%) (%) (%) (%) (%) (%)
Dementia vs. normal 74 Dementia vs. psychiatric 75 Dementia vs. P + N 76
71 79 83 86 76 71 80 76 86 68 71 79 83 86 72
tained more women than the control groups and was slightly older. The age difference was only statistically significant between group D and N (t test. P < 0.05, 2t).
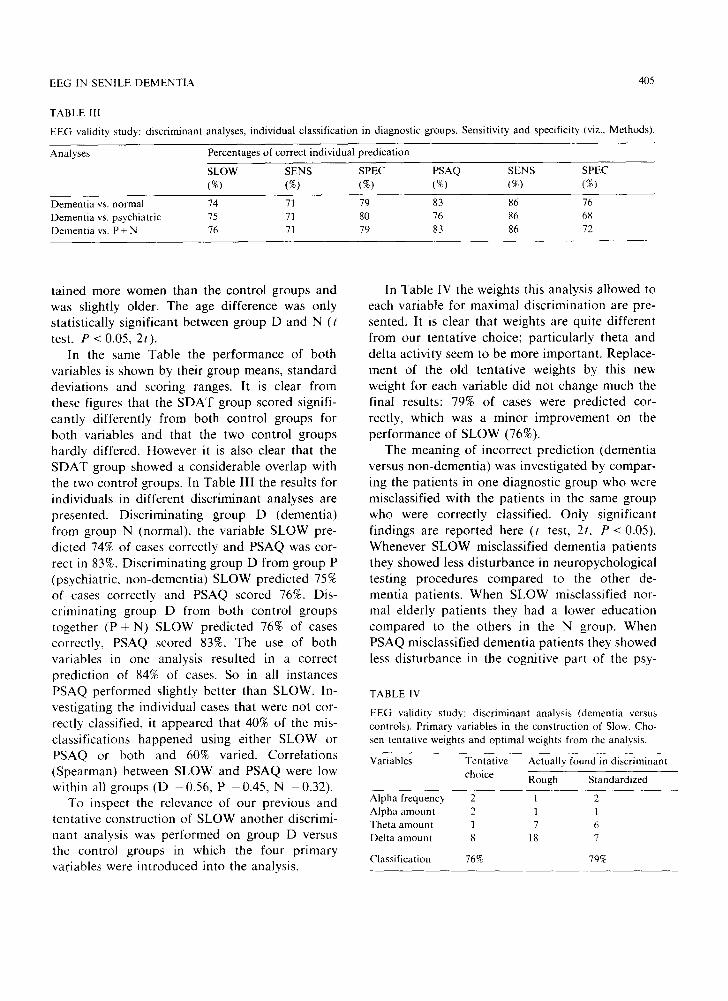
In the same Table the performance of both variables is shown by their group means, standard deviations and scoring ranges. It is clear from these figures that the SDAT group scored signifi- cantly differently from both control groups for both variables and that the two control groups hardly differed. However it is also clear that the SDAT group showed a considerable overlap with the two control groups. In Table III the results for individuals in different discriminant analyses are presented. Discriminating group D (dementia) from group N (normal), the variable SLOW pre- dicted 74% of cases correctly and PSAQ was cor- rect in 83%. Discriminating group D from group P (psychiatric, non-dementia) SLOW predicted 75% of cases correctly and PSAQ scored 76%. Dis- criminating group D from both control groups together (P + N) SLOW predicted 76% of cases correctly, PSAQ scored 83%. The use of both variables in one analysis resulted in a correct prediction of 84% of cases. So in all instances PSAQ performed slightly better than SLOW. In- vestigating the individual cases that were not cor- rectly classified, it appeared that 40% of the mis- classifications happened using either SLOW or PSAQ or both and 60% varied. Correlations (Spearman) between SLOW and PSAQ were low within all groups (D -0 .56, P -0 .45 , N -0.32) .
To inspect the relevance of our previous and tentative construction of SLOW another discrimi- nant analysis was performed on group D versus the control groups in which the four primary variables were introduced into the analysis.
In Table IV the weights this analysis allowed to each variable for maximal discrimination are pre- sented. It is clear that weights are quite different from our tentative choice; particularly theta and delta activity seem to be more important, Replace- ment of the old tentative weights by this new weight for each variable did not change much the final results: 79% of cases were predicted cor- rectly, which was a minor improvement on the performance of SLOW (76%).
The meaning of incorrect prediction (dementia versus non-dementia) was investigated by compar- ing the patients in one diagnostic group who were misclassified with the patients in the same group who were correctly classified. Only significant findings are reported here (t test, 2t, P < 0.05). Whenever SLOW misclassified dementia patients they showed less disturbance in neuropychological testing procedures compared to the other de- mentia patients. When SLOW misclassified nor- mal elderly patients they had a lower education compared to the others in the N group. When PSAQ misclassified dementia patients they showed less disturbance in the cognitive part of the psy-
TABLE IV
EEG validity study: discriminant analysis (dementia versus controls). Primary variables in the construction of Slow. Cho- sen tentative weights and optimal weights from the analysis.
Variables Tentative choice
Actually found in discriminant
Rough Standardized
Alpha frequency 2 1 2 Alpha amount 2 1 1 Theta amount 1 7 6 Delta amount 8 18 7
Classification 76% 79%
406 C. HOOIJER ET AL.
chiatric interview (GMS) and misclassified psychi- atric patients were older, compared to the psychi- atric patients correctly classified by PSAQ. These results are elaborated elsewhere (Jonker and Hooijer 1986).
The study of validity pointed out the two vari- ables chosen for reasons of reliability, performed at a satisfactory level in validity as could be ex- pected in this diagnostic group.
Study 3: follow-up
Subjects Within the framework of the larger study, 1.5
years after entry, all patients from the validity study (or those caring for them) were contacted again. Of the 43 dementia patients, 13 had died, 8 decided not to participate, 1 could not be found and 21 were investigated again. Of the 41 psychi- atric patients, 6 had died, 23 would not par- ticipate, 1 could not be found and 11 were in- vestigated again. Of the 51 normal volunteers, 1 had died, 4 did not participate and 46 were in- vestigated again. The 78 subjects were seen again by the independent psychiatrist. In cases of re- fusal, the psychiatrist in charge was contacted to judge whether a change in the original subdivision (dementia/functional) might be suggested by the course of the illness. Changes in the original group
membership did not occur. EEG and spectral analysis were performed under the same condi- tions as at base line. Judgements were made by rater B, without knowledge of previous judge- ments on the subject.
Student's t test (2t) was performed on the different subgroups emerging; dependent vari- ables were age, length of history, SLOW, PSAQ, log PSAQ and sex (X2). Correlations between scores at baseline and at follow-up were measured by Pearson's R. All levels of significance were set at 5% and only significant findings are reported.
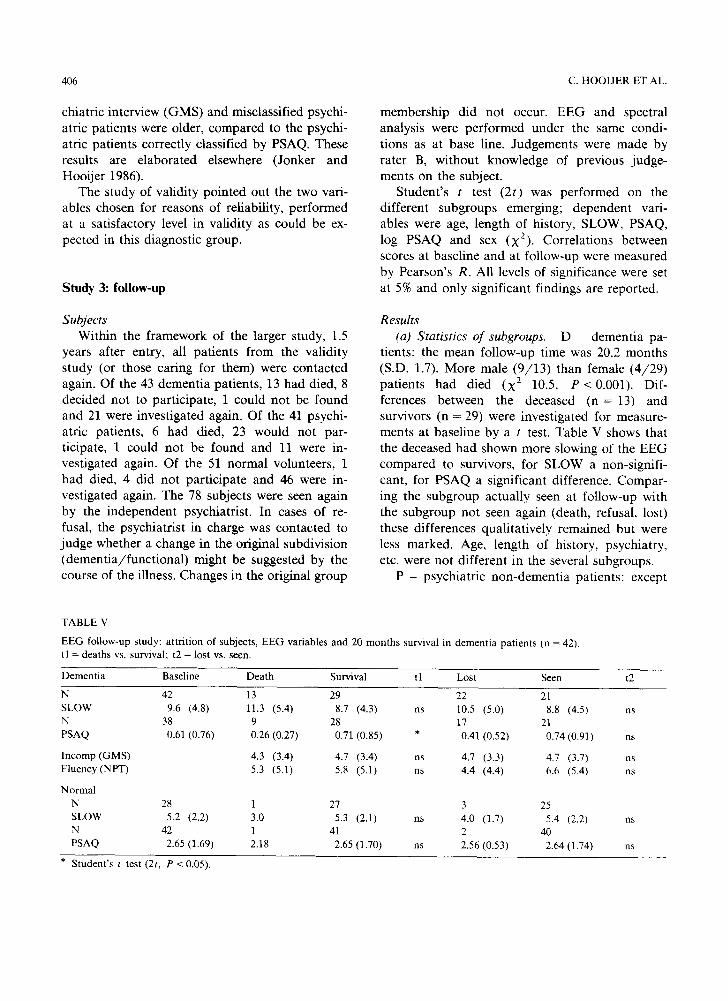
Results (a) Statistics of subgroups. D - dementia pa-
tients: the mean follow-up time was 20.2 months (S.D. 1.7). More male (9/13) than female (4/29) patients had died (X 2 10.5, P<0 .001) . Dif- ferences between the deceased ( n = 13) and survivors (n = 29) were investigated for measure- ments at baseline by a t test. Table V shows that the deceased had shown more slowing of the EEG compared to survivors, for SLOW a non-signifi- cant, for PSAQ a significant difference. Compar- ing the subgroup actually seen at follow-up with the subgroup not seen again (death, refusal, lost) these differences qualitatively remained but were less marked. Age, length of history, psychiatry, etc. were not different in the several subgroups.
P - psychiatric non-dementia patients: except
TABLE V
EEG follow-up study: attrition of subjects, EEG variables and 20 months survival in tl = deaths vs. survival; t2 = lost vs. seen.
dementia patients (n = 42).
Dementia Baseline Death Survival tl Lost Seen t2
N 42 13 29 22 21 SLOW 9.6 (4.8) 11.3 (5.4) 8.7 (4.3) ns 10.5 (5.0) 8.8 (4.5) ns N 38 9 28 17 21 PSAQ 0.61 (0.76) 0.26 (0.27) 0.71 (0.85) * 0.41 (0.52) 0.74 (0.91) ns
Incomp(GMS) 4.3 (3.4) 4.7 (3.4) ns 4.7 (3.3) 4.7 (3.7) ns Fluency(NPT) 5.3 (5.1) 5.8 (5.1) ns 4.4 (4.4) 6.6 (5.4) ns
Normal
N 28 1 27 3 25 SLOW 5.2 (2.2) 3.0 5.3 (2.1) ns 4.0 (1.7) 5.4 (2.2) ns N 42 1 41 2 40 PSAQ 2.65 (1.69) 2.18 2.65 (1.70) ns 2.56 (0.53) 2.64 (1.74) ns
* Student's t test (2t, P < 0.05).
EEG IN SENILE D E M E N T I A
30-
25- ~
I
i0 FU A
~ Ju
BASE
B FU
407
-20
~15
5 - ~ 5
/ 1 - " I
ASE FU BASE
C D
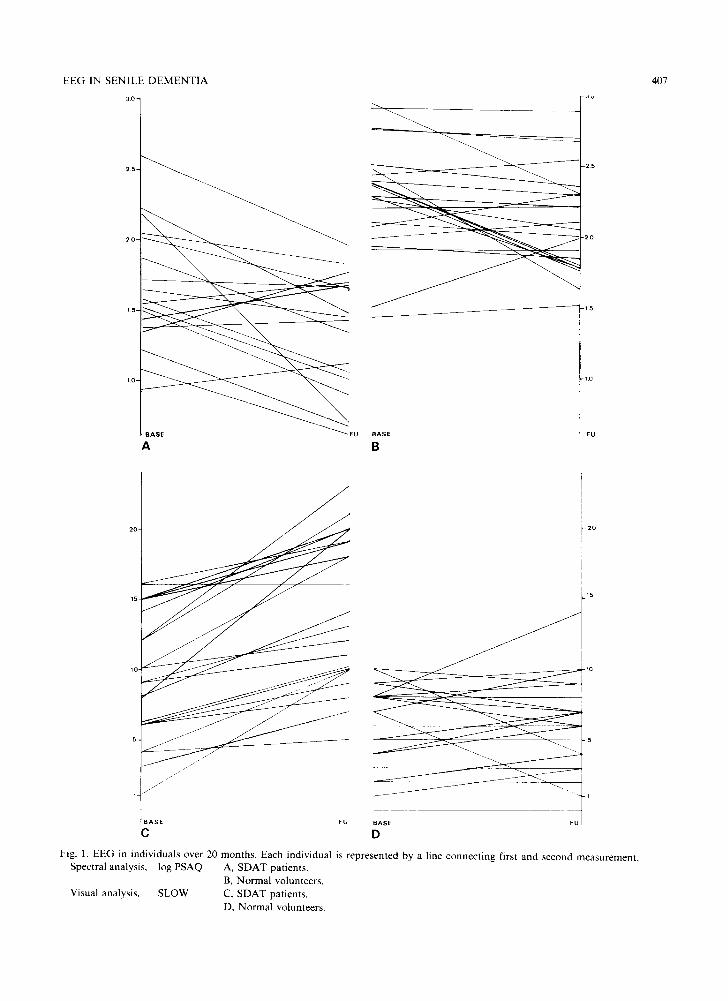
Fig. 1. EEG in individuals over 20 months. Each individual is represented by a line connecting first and second measurement. Spectral analysis, log PSAQ A, SDAT patients.
B, Normal volunteers. Visual analysis, SLOW C, SDAT patients.
D, Normal volunteers.
408
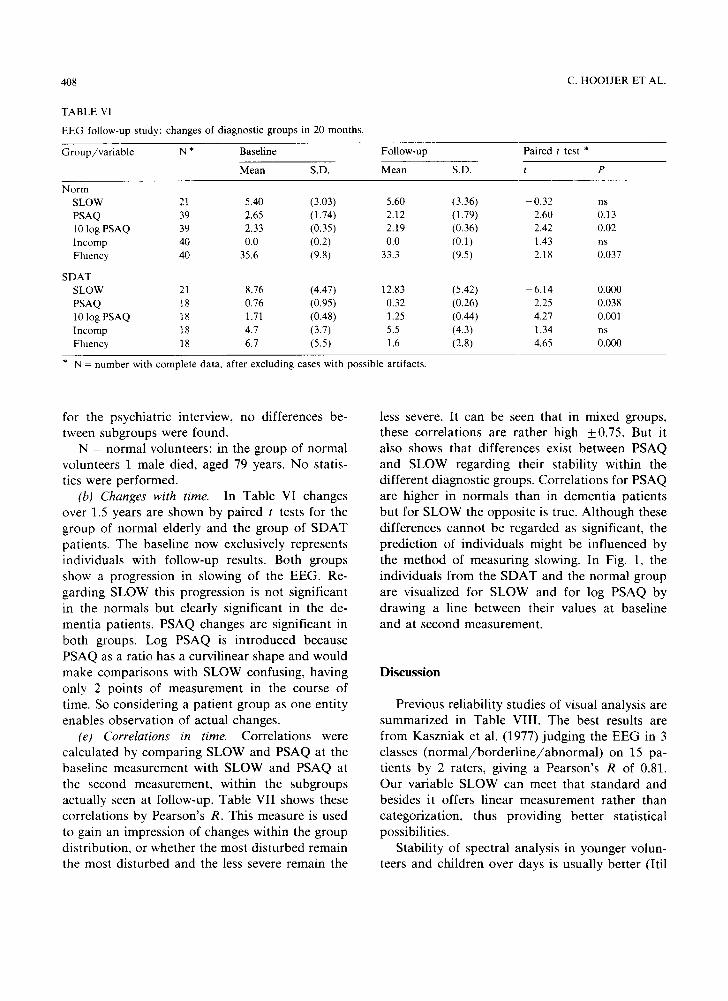
TABLE VI
EEG follow-up study: changes of diagnostic groups in 20 months.
C. HOOIJER ET AL.
Group/variable N * Baseline Follow-up
Mean S.D. Mean S.D.
Paired t test *
t P
N o r m
SLOW 21 5.40 (3.03) 5.60 (3.36) - 0.32 PSAQ 39 2.65 (1.74) 2.12 (1.79) 2.60 10 log PSAQ 39 2.33 (0.35) 2.19 (0.36) 2.42 Incomp 40 0.0 (0.2) 0.0 (0.1) 1.43 Fluency 40 35.6 (9.8) 33.3 (9.5) 2.18
SDAT SLOW 21 8.76 (4.47) 12.83 (5.42) - 6.14 PSAQ 18 0.76 (0.95) 0.32 (0.26) 2.25 10 log PSAQ 18 1.71 (0.48) 1.25 (0.44) 4.27 Incomp 18 4.7 (3.7) 5.5 (4.3) 1.34 Fluency 18 6.7 (5.5) 1.6 (2.8) 4.65
n s
0.13 0.02 n s
0.037
0.000 0.038 0.001 n s
0.000
* N = number with complete data, after excluding cases with possible artifacts.
for the psychia t r ic interview, no differences be- tween subgroups were found.
N - normal volunteers: in the group of no rma l volunteers 1 male died, aged 79 years. N o statis- tics were per formed.
(b) Changes with time. In Table VI changes over 1.5 years are shown by pa i red t tests for the group of normal elderly and the group of S D A T pat ients . The basel ine now exclusively represents individuals with fol low-up results. Both groups show a progress ion in slowing of the EEG. Re- gard ing S L O W this progress ion is not s ignif icant in the normals bu t clear ly signif icant in the de- ment ia pat ients , PSAQ changes are s ignif icant in bo th groups. Log PSAQ is in t roduced because PSAQ as a rat io has a curvi l inear shape and would make compar i sons with S L O W confusing, having only 2 poin ts of measurement in the course of time. So consider ing a pa t ien t group as one ent i ty enables observat ion of actual changes.
(e) Correlations in time. Corre la t ions were calcula ted by compar ing S L O W and PSAQ at the basel ine measurement with S L O W and PSAQ at the second measurement , within the subgroups actual ly seen at fol low-up. Table VII shows these corre la t ions by Pearson 's R. This measure is used to gain an impress ion of changes within the group dis t r ibut ion , or whether the most d i s tu rbed remain the most d i s tu rbed and the less severe remain the
less severe. It can be seen that in mixed groups, these corre la t ions are ra ther high _+0.75. But it also shows that differences exist be tween PSAQ and S L O W regard ing their s tabi l i ty within the different d iagnos t ic groups. Corre la t ions for PSAQ are higher in normal s than in dement i a pa t ien ts bu t for S L O W the oppos i t e is true. Al though these differences canno t be regarded as significant, the p red ic t ion of ind iv idua ls might be inf luenced by the me thod of measur ing slowing. In Fig. 1, the indiv iduals f rom the S D A T and the normal group are visual ized for S L O W and for log PSAQ by drawing a line be tween their values at basel ine and at second measurement .
D i s c u s s i o n
Previous re l iabi l i ty studies of visual analysis are summar ized in Table VIII . The best results are f rom Kaszn iak et al. ( 1977 ) judg ing the E E G in 3 classes ( n o r m a l / b o r d e r l i n e / a b n o r m a l ) on 15 pa- t ients by 2 raters , giving a Pearson ' s R of 0.81. Our var iable S L O W can meet that s t anda rd and besides it offers l inear measurement ra ther than categor iza t ion, thus p rov id ing bet ter s tat is t ical possibi l i t ies .
S tabi l i ty of spectra l analysis in younger volun- teers and chi ldren over days is usual ly be t te r (Iti l

EEG IN SENILE DEMENTIA 40q
TABLE VII
EEG follow-up study: correlations in different diagnostic groups between basefine and follow-up over 20 months for the EEG variables Slow and PSAQ.
Groups
Dementia Psychi- Normal All All iatric patients subjects
No. of cases 21 11 46 32 78 SLOW 0.83 ns 0.63 0.75 0.73 PSAQ 0.58 ns 0.75 0.73 0.77
Pearsons's r < 0.05.
et al. 1974; Dis et al. 1979; Matougek et al. 1979; Gasser et al. 1985); studies of stability of spectral analysis in senile dementia patients over days are lacking. In studies concerning validity, spectral analysis was as powerful as visual analysis in the diagnostic efficacy for dementia. In our findings stability over 24 h of spectral analysis (PSAQ) was about the same as for visual analysis (SLOW) (Table I).
The suggestion remains that spectral analysis in dementia patients is less stable than in younger subjects. One thorough study by Prinz et al. (1982) performed 24-h registrations and found more fluctuations of E E G in senile dementia patients over hours when compared to normal elderly con- trols. Here, another point has to be stressed about our findings in reliability. F rom the ideal point of a reliability of 1.0 the two variables, SLOW and PSAQ, decrease in reliability for different reasons (Table I). SLOW decreases (from 1.0 to 0.80)
because of intra- and inter-rater differences. In retesting after 24 h only a minor decrease happens (from 0.80 to 0.73). PSAQ can be expected to have an intra- and inter-machine reliability of over 0.99. In retesting after 24 h a major decrease (from 0.99 to 0.78) takes place. If fluctation in slowing, sug- gested for dementia patients, is the cause of insta- bility of a repeated measurement over 24 h, then it hardly affects the 30 min visual analysis but has a greater influence on the 100 sec spectral analysis.
In our validity study results were as expected for both S L O W and PSAQ. A diagnostic efficacy for senile dementia in compar ison to other elderly psychiatric patients and normal elderly controls of about 80% is comparable to the results of former and recent studies (Soininen et al. 1982; Brenner et al. 1986). Even the slight advantages in diagnos- tic efficacy in dementia for spectral analysis com- pared to visual analysis recently found by Brenner et al. (1988) are confirmed. In our study visual analysis has been compressed into one variable for slowing, but apparent ly this heavy reduction did not prevent sufficient validity. As has been shown, this variable can be improved by allowing ap- propriate weights to its components (Table IV). In our view this variable can now be used as a basic parameter to explore the complementary signifi- cance of variables other than slowing, like alpha blocking, paroxysms and focal abnormalit ies in dementia; they are still controversial, but not re- jected (Soininen et al. 1982). The overall judge- ment of the E E G as normal or abnormal is based on all these components together and therefore is
TABLE VIII
EEG, visual judgement: previous studies of reliability.
Ref. Authors Year Patients Raters Judgment Agreement Reliab no. first pub1. (n) (n) classes (%) coeff.
lntra-rater 16 Jenkins 1962 12 1 8 83 -
Inter-rater 18 Blum 1954 10 5 12 40 19 Houfeck 1959 140 2 2 85 0.73 20 Volavka 1973 98 7 10 - 0.56
8 Kaszniak 1977 15 2 3 - 0.81
28 Present 20 2 _> 12 - 0.80
410 C. HOOIJER ET AL.
left out of this paper, restricted to the phenome- non of slowing.
Our longitudinal study partly foundered be- cause of the problem of informed consent. This was partly due to the ambition of using so many instruments together (viz. Methods). The number of patients actually seen is rather small and this means that all conclusions have to be modest. Previous findings of follow-up in dementia were confirmed: the group of SDAT patients shows a considerable progression of EEG slowing in both analyses. In the normal elderly there is only slight progression, nevertheless changes reach signifi- cance for PSAQ. This confirms the findings of Coben et al. (1985) in the normal elderly over 1 and 2.5 years and underlines the fact that spectral analysis is very sensitive to the changes happening in a group of healthy elderly volunteers. However, in the case of individual SDAT patients, previous results are contradicted: except in 1 patient who stayed almost the same, all SDAT patients showed an increase of SLOW: a worsening of the condi- tion. In contrast to the recent study by Rae Grant et al. (1987) the thesis of worsening of the EGG during the disease is confirmed. Comparing that study with the present there are 2 differences: in patient sampling and in measurement. Both stud- ies used the PDD criteria of the DSM III (A.P.A. 1980). The other study used only these criteria but found several opportunities for neuropathological confirmation of diagnosis. No details are given about neuropathology related to worsening/non- worsening of the EEG. In the text of the DSM III the P.D.D. is regarded as selecting patients more widely than just those with SDAT. The recent DSM-III-R is different and more strict (A.P.A. 1988). In our study we added further criteria. These criteria stem from the study group that used neuropathological investigation to validate the clinical picture. As our patients were admitted to hospital and the criteria demanded at least 2 years of history as well as observed ADL disturbances, the proportion of mild dementia can be assumed to be very small. No specific indices for severity were included in the design. Maybe our narrowing of patient selection caused the differences between the 2 studies.
A second possible explanation is the measure-
ment itself. In the Rae Grant et al. study EEG judgements are restricted to 4 classes. Changes in the course of time are restricted to changes from one class into another, thus obscuring small changes. Some of the dementia patients were placed at baseline in the worst class IV and could not worsen, as was stated by the authors. Reliabil- ity studies (Table VIII) concerning several kinds of categorical classifications of EEG interpreta- tion have shown a maximum reliability of 0.80. This leaves enough room for changes like categori- cal improvement in 10% of cases by chance. Our way of measuring SLOW provided much more possibility for change to show up and did not suffer from ceiling limits and apparently the wor- sening of SDAT patients exceeded the variance caused by the lack of 1.0 reliability. In power spectral analysis, however, individual progression in SDAT patients was much less predictable. Not surprisingly the problems noted concerning relia- bility appear again at this repeated measurement after 1.5 years. Presumably, the changes within hours in dementia patients are as strong as the worsening that is to be expected over the years. When using group means, PSAQ decreases as expected (Table VI); for individual patients the follow-up results are much less predictable (Table VI, Fig. 1), thus suggesting a random error. On one side it must be remembered that computer analysis in our design is disadvantaged by the curvilinear variable, the limited derivations, a crude method to avoid drowsiness and the possi- ble influence of slow artifacts. On the other hand, this did not prevent its excellent performance in the normal elderly. A close look at the attrition of dementia subjects in the follow-up (Table V) shows that subjects actually followed up were probably less severe at baseline (compared to the deceased) but arriving at the same level after 1.5 years. The methods (paired t test), however~ prevented attri- tion to influence this change.
Conclusion As far as groups of subjects are concerned, the
significant progression in slowing of the EEG in SDAT patients and the subtle progression in nor- mal elderly, seen in previous studies, are con- firmed, both for visual and for spectral analysis.
EEG IN SENILE DEMENTIA 411
In ind iv idua l S D A T pat ien ts , in con t r a s t to prev i -
ous f indings , a cons i s t en t s lowing of the E E G
(visual analysis) is found . I n v isual analys is a n e w
va r i ab le for the q u a n t i f i c a t i o n of s lowing of the
E E G is i n t r o d u c e d . Th is var iab le , ca l led S L O W
was chosen for r easons of rel iabi l i ty . I t p r o v e d to
have suf f ic ien t va l id i ty a n d ac tua l ly dec reased in
20 ou t of 21 S D A T pa t i en t s o v e r 1.5 years. A p a r t
f r o m d i f fe rences in pa t i en t s a m p l i n g it is be l i eved
that the use of a m e a s u r e m e n t wi th suf f ic ien t
p a r a m e t r i c a l qua l i t i es was a m a i n cause for this
f inding. Th i s va r i ab le is sugges ted to serve as a
base l ine in the s tudy of the o t h e r c o m p o n e n t s
l ead ing to the overa l l j u d g e m e n t of the E E G .
In spec t ra l ana lys is a p r o b l e m arose wi th the
level of re l iabi l i ty , no t p r e v e n t i n g suf f ic ien t and
supe r io r va l id i ty for S D A T bu t i nva l i da t i ng c lear
fo l low-up resul ts for i nd iv idua l pa t ien ts . T h e
sugges t ion r ema ins to inves t iga te the ac tua l s tabi l -
i ty o f shor t s amples (10 x 10 sec) wi th in 30 m i n o f
E E G of S D A T pa t ien ts , as has b e e n d o n e for
ch i ld ren by Gasse r et al. (1985) and y o u n g e r
vo lun t ee r s by K a w a b a t a (1975). M o r e or l onge r
samples migh t p r e v e n t ins tab i l i ty and p r o v i d e bet-
ter results in o the r issues. T h e supe r io r sens i t iv i ty
of spec t ra l analys is for changes in the n o r m a l
e lder ly unde r l i ne s b o t h its sens i t iv i ty a n d its
vu lnerab i l i ty .
References
A.P.A. American Psychiatric Association. Diagnostic and Sta- tistic Manual of Mental Disorders, 3rd edition. American Psychiatric Association, Washington, DC, 1980. and A.P.A. D.S.M., 3rd edition, revised, 1988.
Blessed, G., Tomlinson, B.E. and Roth, M. The association between quantitative measures of dementia and of senile change in the cerebral grey matter of elderly subjects. Br. J. Psychiat., 1968, 114: 797-811.
Blum, R.H. A note on the reliability of electroencephalo- graphic judgments. Neurology, 1954, 4: 143-147.
Brenner, R.P., Ulrich, R.F., Spiker, D.G., Sclabassi, R.J., Rey- nolds, C.F., Matin, R.S. and Boiler, F. Computerized EEG spectral analysis in elderly normal, demented and de- pressed subjects. Electroenceph. clin. Neurophysiol., 1986, 64: 484-492.
Brenner, R.P., Reynolds, C.F. and Ulrich, R.F. Diagnostic efficacy of computerised spectra versus visual EEG analysis in elderly normal demented and depressed subjects. Elec- troenceph, clin. Neurophysiol., 1988, 69: 110-117.
Coben, L.A., Danziger, W.L. and Berg, L. Frequency analysis of the resting awake EEG in mild senile dementia of Alzheimer type. Electroenceph. clin. Neurophysiol., 1983, 55: 372-380.
Coben, L.A., Danziger, W.L. and Sorandt, M. A longitudinal EEG study of mild senile dementia of Alzheimer type: changes at 1 year and at 2.5 years. Electroenceph. clin. Neurophysiol., 1985, 61: 101-112.
Copeland, J.R.M., Kelleher, M.J., Kellett, J.M., Gourlay, A.J., Gurland, B.J., Fleiss, J.L. and Sharpe, L. A semistructured clinical interview for the assessment of diagnosis and men- tal state in the elderly: the Geriatric Mental State Schedule. 1. Development and reliability. Psychol. Med., 1976, 6: 439-449.
Dis, H. van, Corner, M., Dapper, R., Hanewald, G. and Kok, H. Individual differences in the human electroencephalo- gram during quiet wakefulness. Electroenceph. clin. Neuro- physiol., 1979, 47: 87-94.
Gasser, T., B~icher, P. and Steinberg, H. Test-retest reliability of aspectral parameters of the EEG. Electroenceph. clin. Neurophysiol., 1985, 60: 312-319.
Gordon, E.B. Serial EEG studies in presenile dementia. Br. J. Psychiat., 1968, 114: 779-780.
Gotman, J., Gloor, P. and Ray, W.F. A quantitative compari- son of traditional reading of the EEG and interpretation of computer-extracted features in patients with supratentorial brain lesions. Electroenceph. clin. Neurophysiol., 1975, 38: 623-639.
Greenblatt, M., Levin, S. and Atwell. C. Comparative value of electroencephalogram and abstraction tests in diagnosis of brain damage. J. Nerv. Ment. Dis., 1945, 102: 383-391.
Hooijer, C., Jonker, C., Dewey, M.E., Tilburg, W. van and Copeland, J.R.M. A standardized interview for the elderly (GMS). Reliability studies. Int. J. Geriat. Psychiat., 1989, in press.
Houfek, E.E. and Ellingson, R.J. On the reliability of clinical EEG interpretation. J. Nerv. Ment. Dis., 1959, 128: 425- 437.
Huffelen, A.C. van, Poortvliet, D.C.J. and Wulp, C.J.M. van der. Quantitative electrocephalography in cerebral ischemia. Detection of abnormalities in "normal" EEGs. In: G. Pfurtscheller, E.J. Jonkman and F.H. Lopes da Silva (Eds.), Quantitative EEG and Imaging Techniques. Elsevier Sci- ence Publishers, Amsterdam, 1985: 3-28.
Itil, T.M., Saletu, B., Davis, S. and Allen, M. Stability studies in schizophrenics and normals using computer-analyzed EEG. Biol. Psychiat., 1974, 8:321 335.
Jenkins, C.D. The relation of EEG slowing to selected indices of intellective impairment. J. Nerv. Ment. Dis., 1962, 135: 162-170.
Johannesson, G., Brun, A., Gustafson, 1. and Ingvar, D.H. EEG in presenile dementia related to cerebral blood flow and autopsy findings. Acta Neurol. Scand., 1977, 56: 89- 103.
Jonker, C. and Hooijer, C. Seniele dementie van het Alzheimer type (SDAT). De betekenis van een aantal gangbare di- agnostische methoden in de klinische psychiatrie, Diss., Free University, Amsterdam, 1986.

412 C. HOOIJER ET AL.
Kaszniak, A.W., Garron, D.C., Fox, J.H., Bergen, D. and Huckman, M. Cerebral atrophy, EEG slowing, age, educa- tion and cognitive functioning in suspected dementia. Neu- rology, 1979, 29: 1273-1279.
Kawabata, N. Test of statistical stability of the electroen- cephalogram. Biol. Cybernet., 1975, 17: 235-238.
Matou~ek, M., Arvidsson, A. and Friberg, S. Serial quantita- tive electroencephalography. Electroenceph. clin. Neuro- physiol., 1979, 47: 614-622.
McAdam, W. and Robinson, R.A. Senile intellectual deteriora- tion and the electroencephalogram: a quantitative correla- tion. J. Ment. Sci., 1956, 102: 819-825.
Mundy-Castle, A.C., Hurst, L.A., Beerstecher, D.M. and Prinsloo, T. The electroencephalogram in the senile psycho- ses. Electroenceph. clin. Neurophysiol., 1954, 6: 245-252.
Obrist, W.D., Busse, E.W., Eisdorfer, C. and Kleemeier, R.W. Relation of the EEG to intellectual function in senescence. J. Gerontol., 1962, 17: 197-206.
Prinz, P.N., Peskind, R., Vitaliano, P.P., Raskind, M.A., Eisdorfer, C., Zemcuznikov, N. and Gerber, C.J. Changes in the sleep and waking EEGs of nondemented and de- mented elderly subjects. J. Am. Geriat. Soc., 1982, 30: 86 93.
Rae Grant, A., Blume, W., Lau, C., Hachinsky, V.C., Fisman, M. and Merskey, H. A sequential study correlating the electroencephalogram with psychometric and quantitative pathologic data. Arch. Neurol., 1987, 44: 50-54.
Roberts, M.A., McGeorge, A.P. and Caird, F.I. Electroen- cephalography and computerised tomography in vascular and non-vascular dementia in old age. J. Neurol. Neuro- surg. Psychiat., 1978, 41: 903-906.
Roth, M. and Myers, D.H. The diagnosis of dementia. Br. J. Psychiat., 1969, 9: 87-99.
Roubi~ek, J. The electroencephalogram in the middle aged and the elderly. J. Am. Geriat. Soc., 1977, 25: 145-152.
Soininen, H., Partanen, V.J., Helkala, E.L. and Riekkinen, P.G. EEG findings in senile dementia and normal aging. Acta Neurol. Scan&, 1982, 65: 59-70.
Steadman, J.W. and Morgan, R.J. Use of a spectral ratio in lateralization of CNS lesions. Electroenceph. clin. Neuro- physiol., 1974, 37: 399-402.
Thaler, M. Relationships among Wechsler, Weigl, Rorschach, EEG findings, and abstract-concrete behaviour in a group of normal aged subjects. J. Gerontol., 1956, 11: 404-409.
Thompson, L.W. Cerebral blood flow, EEG, and behaviour in aging. In: R.D. Terry and S. Gershon (Eds.), Neurobiology of Aging. Raven Press, New York, 1976: 103-119.
Travis, L.E. and Gottlober, A. How consistent are an individ- ual's brain potentials from day to day. Science, 1937, 85: 223-224.
Volavka, J., Matou~ek, M., Feldstein, S., Roubi~ek, J., Prior, D., Scott, D.F., Brezinova, V. and Synek, V. Die Zuverl~issigkeit der EEG-Beurteilung. Z. EEG-EMG, 1973, 4: 123-130.