The Construct and Concurrent Validity of the EQ-5D in a Renal Transplant Population
11
Volume 7 • Number 4 • 2004 VALUE IN HEALTH © ISPOR 1098-3015/04/$15.00/499 499–509 499 Blackwell Science, LtdOxford, UKVHEValue in Health1098-30152004 ISPORJuly/August 200474499509Original ArticleValidity of EQ-5D in Renal TransplantationCleemput et al. Address correspondence to: Irina Cleemput, Belgian Health Care Knowledge Centre, Wetstraat 155, B-1040 Brussels, Belgium. E-mail: [email protected] The Construct and Concurrent Validity of the EQ-5D in a Renal Transplant Population Irina Cleemput, PhD, 1 Katrien Kesteloot, PhD, 1,2 Philip Moons, MSc, 1,2 Yves Vanrenterghem, MD, PhD, 2 Johannes P. Van Hooff, MD, PhD, 3 Jean-Paul Squifflet, MD, PhD, 4 Sabina De Geest, PhD 1 1 Centre for Health Services and Nursing Research, Katholieke Universiteit Leuven, Leuven, Belgium; 2 Department of Nephrology, University Hospitals Leuven, Leuven, Belgium; 3 Department of Nephrology, Academic Hospital Maastricht, Maastricht, the Netherlands; 4 Department of Kidney and Pancreas Transplantation, Cliniques Universitaires Saint-Luc, Brussels, Belgium ABSTRACT Objectives: Cost–utility analysis in renal transplant pop- ulations requires the use of a generic instrument for health status measurement that generates a single value for health. Such instruments should be widely applicable in diverse patient populations and their validity should be established. The aim of this study was to explore the validity of the EQ-5D in renal transplant patients. Methods: The EQ-5D was compared with the Short- Form 36 Health Survey (SF-36), the modified transplant symptom occurrence and symptom distress (MTSOSD) scale, the short-form Beck Depression Inventory (BDI), and the State Trait Anxiety Inventory (STAI). Construct and concurrent validity were tested on cross-sectional data of 350 patients. Results: Construct validity is good for some but not all EQ-5D dimensions, and the EQ-5D discriminates well among groups of patients with different health states according to the SF-36, MTSOSD scale, BDI, and STAI and between patients and the general public. Concurrent validity is good, as shown by the correspondence of EQ- 5D and SF-36 results. Conclusion: It is concluded that the EQ-5D is a valid instrument for the measurement of health status in renal transplant patients. Keywords: concurrent validity, construct validity, EQ- 5D, renal transplantation. Introduction The increasing need to set priorities in health care has urged health professionals to develop instru- ments that reflect patients’ subjective health status and use these in economic evaluations. Subjective health status is the personal perception of a patient’s own health. This concept is closely related to the concept health-related quality of life—and in the lit- erature both concepts are used interchangeably— although health-related quality of life can be inter- preted more broadly, including all aspects of life that have a possible relationship with health. Because there is a large variability in the aspects of life that are considered important for an individual’s health-related quality of life, health-related quality of life is more difficult to measure and it cannot be claimed that a generic instrument, with a limited number of non-disease-specific dimensions, meas- ures actual health-related quality of life. One of the concerns in using generic question- naires, as required for economic evaluations, is that they may fail to capture small but relevant changes in the health status of specific patient groups. Devel- opers of health status measurement instruments necessarily make trade-offs between simplicity and comprehensiveness. Simplicity of the instrument is crucial for the feasibility of using the instrument in routine practice or in large clinical or economic studies. Moreover, the instrument should allow the translation of the health state description into one single index value to allow the calculation of the number of quality-adjusted life-years gained by an intervention compared to other interventions. The EQ-5D is a generic five-dimensional instru- ment that is used worldwide for health status meas- urement [1,2]. Each health state description corresponds with an index value, derived from the general public [3]. The validity and reliability of the EQ-5D have been tested in the general public of dif- ferent countries [4–7] as well as in several patient
Transcript of The Construct and Concurrent Validity of the EQ-5D in a Renal Transplant Population

Volume 7 • Number 4 • 2004V A L U E I N H E A L T H
© ISPOR 1098-3015/04/$15.00/499 499–509
499
Blackwell Science, LtdOxford, UK
VHEValue in Health1098-30152004 ISPOR
July/August 200474499509
Original Article
Validity of EQ-5D in Renal TransplantationCleemput et al.
Address correspondence to:
Irina Cleemput, Belgian HealthCare Knowledge Centre, Wetstraat 155, B-1040 Brussels,Belgium. E-mail: [email protected]
The Construct and Concurrent Validity of the EQ-5D in a Renal Transplant Population
Irina Cleemput, PhD,
1
Katrien Kesteloot, PhD,
1,2
Philip Moons, MSc,
1,2
Yves Vanrenterghem, MD, PhD,
2
Johannes P. Van Hooff, MD, PhD,
3
Jean-Paul Squifflet, MD, PhD,
4
Sabina De Geest, PhD
1
1
Centre for Health Services and Nursing Research, Katholieke Universiteit Leuven, Leuven, Belgium;
2
Department of Nephrology, University Hospitals Leuven, Leuven, Belgium;
3
Department of Nephrology, Academic Hospital Maastricht, Maastricht, the Netherlands;
4
Department of Kidney and Pancreas Transplantation, Cliniques Universitaires Saint-Luc, Brussels, Belgium
ABSTRACT
Objectives:
Cost–utility analysis in renal transplant pop-ulations requires the use of a generic instrument for healthstatus measurement that generates a single value forhealth. Such instruments should be widely applicable indiverse patient populations and their validity should beestablished. The aim of this study was to explore thevalidity of the EQ-5D in renal transplant patients.
Methods:
The EQ-5D was compared with the Short-Form 36 Health Survey (SF-36), the modified transplantsymptom occurrence and symptom distress (MTSOSD)scale, the short-form Beck Depression Inventory (BDI),and the State Trait Anxiety Inventory (STAI). Constructand concurrent validity were tested on cross-sectionaldata of 350 patients.
Results:
Construct validity is good for some but not allEQ-5D dimensions, and the EQ-5D discriminates wellamong groups of patients with different health statesaccording to the SF-36, MTSOSD scale, BDI, and STAIand between patients and the general public. Concurrentvalidity is good, as shown by the correspondence of EQ-5D and SF-36 results.
Conclusion:
It is concluded that the EQ-5D is a validinstrument for the measurement of health status in renaltransplant patients.
Keywords:
concurrent validity, construct validity, EQ-5D, renal transplantation.
Introduction
The increasing need to set priorities in health carehas urged health professionals to develop instru-ments that reflect patients’ subjective health statusand use these in economic evaluations. Subjectivehealth status is the personal perception of a patient’sown health. This concept is closely related to theconcept health-related quality of life—and in the lit-erature both concepts are used interchangeably—although health-related quality of life can be inter-preted more broadly, including all aspects of lifethat have a possible relationship with health.Because there is a large variability in the aspects oflife that are considered important for an individual’shealth-related quality of life, health-related qualityof life is more difficult to measure and it cannot beclaimed that a generic instrument, with a limited
number of non-disease-specific dimensions, meas-ures actual health-related quality of life.
One of the concerns in using generic question-naires, as required for economic evaluations, is thatthey may fail to capture small but relevant changesin the health status of specific patient groups. Devel-opers of health status measurement instrumentsnecessarily make trade-offs between simplicity andcomprehensiveness. Simplicity of the instrument iscrucial for the feasibility of using the instrument inroutine practice or in large clinical or economicstudies. Moreover, the instrument should allow thetranslation of the health state description into onesingle index value to allow the calculation of thenumber of quality-adjusted life-years gained by anintervention compared to other interventions.
The EQ-5D is a generic five-dimensional instru-ment that is used worldwide for health status meas-urement [1,2]. Each health state descriptioncorresponds with an index value, derived from thegeneral public [3]. The validity and reliability of theEQ-5D have been tested in the general public of dif-ferent countries [4–7] as well as in several patient

Cleemput et al.
500
populations, such as rheumatoid arthritis patients[8] and patients with osteoarthritis of the knee [9],lower limb ischemia [10], sleep apnea [11], chronicobstructive pulmonary disease [12], and intestinalfailure [13].
To be useful for comparisons across patientgroups, the EQ-5D should be valid in all patientpopulations. The validity of an instrument is “thedegree to which evidence and theory support theinterpretation of the test scores entailed by the pro-posed uses of tests” [14]
.
The proposed use of theEQ-5D is as an outcome measure in economic eval-uations. Hence, to be valid the EQ-5D must allowsensible comparisons among patient groups and/orpatients with different characteristics. The problemwith evaluating the validity of an instrument thatmeasures subjective health status, such as the EQ-5D, is that there is no gold standard against whichthe instrument can be tested. A number of conceptsthat focus on different aspects of validity have beendescribed in the literature. A recent classification ofvalidity concepts explains which evidence is neededto perform a validity test: evidence on test content,response process, internal structure, relations toother variables, and consequences of testing (seeGoodwin [15] for a full discussion).
As yet, there is no evidence on the validity of theEQ-5D in the renal transplant population. Such evi-dence is important, however, to allow decision mak-ers to assess the usefulness of the EQ-5D foreconomic evaluations that are used to set prioritiesbetween different disease areas. Evidence on thevalidity of the EQ-5D in other disease areas doesnot guarantee validity in the renal transplant pop-ulation. The aim of this study was therefore toassess the construct and concurrent validity of theEQ-5D in renal transplant patients.
Methods
Patient Sample
The analyses in this article are based on the data ofa cross-sectional descriptive study that aimed toexamine the subjective health status of patients fol-lowing a tacrolimus-based immunosuppressive reg-imen after renal transplantation (RTX) [16]. Thesample consisted of 361 renal transplant patientsfrom 3 RTX centers in Belgium and the Nether-lands. Patients were considered eligible for partici-pation in the study if they were 18 years of age orolder, literate, and Dutch or French speaking; had apost-transplant status of at least 6 months; and hadnot received a combined transplantation (e.g., kid-ney-pancreas) or a second renal transplantation. All
patients were asked for a written informed consentbefore the questionnaires were distributed. Elevenpatients refused to participate in the study, resultingin a complete data set for 350 patients. At themoment of inclusion, patients had a median post-RTX status of 16.7 months (
Q
1
=
7.9;
Q
3
=
38.6).
Variables and Measurement
The validity of the EQ-5D was tested by means ofcomparisons with already validated instruments forthe measurement of different aspects of health sta-tus in the renal transplant population. Instrumentsinclude the Short-Form 36 Health Survey (SF-36)[17] as a generic profile measure for health status,the short-form Beck Depression Inventory (BDI)[18] for the measurement of depressive symptoma-tology, and the modified transplant symptom occur-rence and symptom distress (MTSOSD) scale [19]for the measurement of symptom experience andsymptom distress associated with side effects ofimmunosuppressive drugs. All 350 patients whoagreed to participate in the study were given an SF-36, an EQ-5D, an MTSOSD scale, and a BDI atinclusion in the study.
EQ-5D.
The EQ-5D is a simple two-page question-naire consisting of a self-classifier and a visual ana-log scale (VAS) on which patients can value theircurrent health state. The developers of the EQ-5Drelied on existing instruments for the measurementof health status, such as the quality of well-beingscale, the Nottingham Health Profile, the SicknessImpact Profile, and the Rosser Index [20].
The self-classifier includes five dimensions(mobility, self-care, usual activities, pain/discom-fort, and anxiety/depression) with three levels ofseverity in each dimension (no problems, someproblems, and severe problems). This classificationallows for the description of 243 (3
5
) differenthealth states. Each of these 243 health states corre-sponds with a single index measure between 0(
=
dead) and 1 (
=
perfect health), derived from andreflecting the preferences of the general public [3].The index values used for the analyses in this studywere derived from a large Flemish EuroQol valida-tion survey [21].
The reliability of the EQ-5D with VAS is accept-able, as shown by studies in different patient pop-ulations and the general public [8,9,12,22–26]. Thereported intraclass correlation coefficients rangefrom 0.7 to 0.93.
Short-form 36 health survey.
The SF-36 is a gen-eric instrument for the measurement of patients’current health status. The SF-36 is often referred as

Validity of EQ-5D in Renal Transplantation
501
an instrument that measures quality of life. Giventhe far more limited nature of health status com-pared to quality of life, however, preference is givento the term health status. The SF-36 contains 36items that cover eight dimensions of health: physicalfunctioning, role limitation due to physical prob-lems, bodily pain, general health perception, vital-ity, social functioning, role limitation due toemotional problems, and mental health [17]. Itresults in a profile for health, with a value between0 (worst health) and 100 (best health) for eachdimension. Because the SF-36 does not yield onesingle index score for general health status, it has, sofar, been inappropriate for economic evaluations.Recent attempts have been made, however, to derivea preference-based single index value from a revisedsix-dimensional classification of the SF-36 [27]
.
This approach is still under development.The validity of the subscales of the SF-36 has
been established against clinically defined groups ingeneral [28] and renal transplant populations inparticular [29,30]. The SF-36 has been used fre-quently in studies on RTX for the measurement ofhealth status [29–38] as well as for the validation ofa new disease-specific instrument [39]. Piehlmeierand colleagues [40] examined the validity, reliabil-ity, and responsiveness of the SF-36 in a renal trans-plant population and concluded that the SF-36 is areliable (internal consistency), valid (high correla-tion with overall evaluations of the health-relatedquality of life), discriminant (detects differences inclinical status), and responsive (detects differencesin patients before and after transplantation) instru-ment for evaluating subjective health status.
Short-form Beck Depression Inventory.
The short-form BDI is an instrument containing 13 items thatmeasures depressive symptomatology in patients[18,41]. In contrast to the original version of theBDI with 22 items [42], the short-form BDI doesnot include any physical symptoms of depression,thus preventing false-positive results in chronicallyill patients such as renal transplant recipients. The13 items are scored with three response categories[1–3]. The total score is obtained by summing thescores on the individual items. On the basis of theirindividual total score on the BDI, patients are clas-sified into four categories: no depression (0–4), milddepression (5–7), moderate depression (8–15), orsevere depression (16–39).
The BDI has been used frequently for the meas-urement of depression in renal transplant popula-tions [43–46]. One study examined the validity ofusing the 22-item BDI in a renal transplant popula-
tion [47]. It was found that the symptoms that mostdiscriminate between depressed and nondepressedrenal transplant patients were the symptomsincluded in the short-form BDI (e.g., death wish,suicidal intention, guilt, dysphoric mood, and prob-lems in concentration) [47]. Both the long- and theshort-form BDI have good internal consistency reli-ability [48,49].
Modified transplant symptom occurrence andsymptom distress scale.
The MTSOSD scale is a45-item questionnaire about a patient’s perceivedoccurrence of symptoms related to the side effects ofthe immunosuppressive regimen after transplanta-tion and the distress associated with these symp-toms [19]. It includes symptoms such as increasedhair growth, itching, impotence, fatigue, and trem-bling hands. The MTSOSD scale is a disease-specificinstrument, developed especially for the transplantpopulation. For each potential symptom, occur-rence (cognitive component of symptom experi-ence) is rated on a scale from 0 (never) to 4(always), and distress (emotional component ofsymptom experience) is rated on a scale from 0 (notdistressing) to 4 (extremely distressing). The psy-chometric properties of the MTSOSD scale aredescribed elsewhere [19]. The authors conclude thatthe MTSOSD scale is a valid instrument for themeasurement of symptom occurrence and symptomdistress related to side effects of immunosuppressivetherapy. Test–retest reliability was not assessed andinternal consistency could not be tested because theconditions for this test were not satisfied.
Hypotheses
Based on prior research in the renal transplant pop-ulation, five hypotheses were developed for thisstudy that address anticipated relationshipsbetween the EQ-5D and other relevant variables.The tested hypotheses and the instruments used areschematically presented in Table 1.
Given that the SF-36 and the EQ-5D both claimto measure (subjective) health status, the resultsobtained with both instruments should be compa-rable (H
4
). Results of the BDI and MTSOSD scaleshould be comparable with the responses on theEQ-5D dimensions anxiety/depression and pain/discomfort, respectively, because both claim tomeasure the same aspect of health (H
5
). Therefore,patients were grouped by their response on the rel-evant dimension of the EQ-5D, and scores on theBDI, MTSOSD scale, and SF-36 were comparedamong the patient groups. In case of comparisonswith the SF-36, it is expected that there are larger
Cleemput et al.
502
differences between the mean SF-36 scores ofpatients grouped according to their response oncomparable domains of the EQ-5D (e.g., mobil-ity
EQ-5D
and physical functioning
SF-36
or pain/discomfort
EQ-5D
and bodily pain
SF-36
) than betweenthe mean SF-36 scores of patients grouped accord-ing to their response on noncomparable domainsof the EQ-5D (e.g., mobility
EQ-5D
and role limita-tions due to emotional problems
SF-36
). This shouldreveal whether the EQ-5D dimension response dis-tinguishes between groups of patients with higheror lower mean SF-36 scores. For the BDI, it isexpected that the classification of the EQ-5D into“no depression,” “some depression,” and “severedepression” reflects the classification into no, mild,moderate, and severe depressive symptomatologyof the BDI [41]. For the MTSOSD scale, it isexpected that mean total scores differ significantlybetween groups of patients with different levels ofpain/discomfort on the EQ-5D.
Statistical Analysis
Differences in percentages of patients reportingproblems on the respective dimensions of the EQ-5D between men and women and among the differ-ent age groups were tested by means of a chi-squaretest statistic. Differences in EQ-5D index scoresamong age groups were tested by means of aKruskal–Wallis test. For differences in EQ-5D indexscores between men and women an independentsample Student’s
t
test could be used because of thelarge number of patients in both groups. Age groupswere defined as 10-year intervals between the agesof 20 and 80.
Differences between percentage of patientsreporting problems on the five EQ-5D dimensionsand the percentage of respondents from the generalpublic were tested by means of a Fisher exact test,
because no single patient reported extreme prob-lems with mobility.
Comparisons of BDI and MTSOSD scale scoresacross patient groups were made by means of ananalysis of variance (ANOVA). For comparisons ofSF-36 scores across patient groups an independentsample Student’s
t
test was used; response categorieswere dichotomized because a very small proportionof the respondents reported severe problems on theEQ-5D dimensions. The nonparametric Spearmanrank correlation coefficients were calculatedbetween EQ-5D index scores and SF-36 domainscores because the EQ-5D index scores were notnormally distributed.
Symptom occurrence and symptom distress wereanalyzed using ridit analysis [51,52]. Ridit analysis,as used in this study, calculates the probability thata respondent reports a level of symptom occurrence,or distress, that is higher than the symptom occur-rence, or distress, reported by a randomly selectedpatient from the entire patient sample, given his orher profile of responses on all the symptoms. Riditsare hence probabilities that are calculated for eachindividual across all symptoms, both for symptomoccurrence and for symptom distress. Individualridit scores were compared with the ridits of allpatients in the sample; i.e., the entire patient samplewas used as the reference group with which individ-ual scores were compared. For example, if a patienthas higher symptom occurrence than the “average”patient from the entire sample, his or her ridit scorewill be higher than 0.5. The “average” patient has aridit of 0.5: the probability that his or her level ofsymptom occurrence is higher than a randomlyselected patient from the entire patient sample is50%; the probability that it is lower is also 50%.Ridits give an indication of the profile of a patient.A patient who reports high levels of symptom
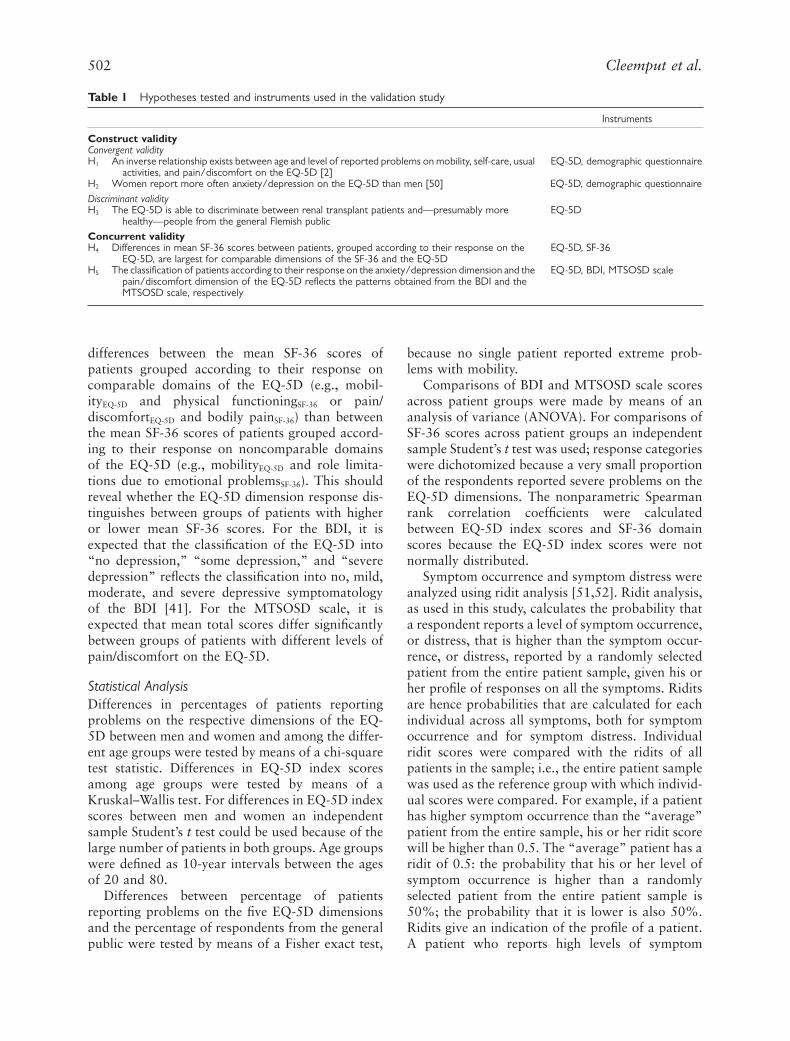
Table 1
Hypotheses tested and instruments used in the validation study
Instruments
Construct validity
Convergent validity
H
1
An inverse relationship exists between age and level of reported problems on mobility, self-care, usual activities, and pain/discomfort on the EQ-5D [2]
EQ-5D, demographic questionnaire
H
2
Women report more often anxiety/depression on the EQ-5D than men [50] EQ-5D, demographic questionnaire
Discriminant validity
H
3
The EQ-5D is able to discriminate between renal transplant patients and—presumably more healthy—people from the general Flemish public
EQ-5D
Concurrent validity
H
4
Differences in mean SF-36 scores between patients, grouped according to their response on the EQ-5D, are largest for comparable dimensions of the SF-36 and the EQ-5D
EQ-5D, SF-36
H
5
The classification of patients according to their response on the anxiety/depression dimension and the pain/discomfort dimension of the EQ-5D reflects the patterns obtained from the BDI and the MTSOSD scale, respectively
EQ-5D, BDI, MTSOSD scale

Validity of EQ-5D in Renal Transplantation
503
occurrence or symptom distress will have a highridit score. The reason for using ridits is that theysummarize the ordinal answers on a large numberof questions into a single parameter for everypatient. Instead of analyzing the data on the level ofthe separate symptoms, a more generalized analysisis possible through ridits. Moreover, ridits allowparametric statistical analyses on profiles of ordinaldata.
All statistical analyses were performed with SPSSstatistical software version 9.0 (SPSS Inc., Chicago,IL, 1999). The level of significance was set at 5%.
Results
Demographic Characteristics
Of the 350 patients included in the study, 59.7%were men. The mean age of the men and women inthe sample was 51.7 years (SD 13.1 and 12.9 years,respectively) and hence the mean age of all patientswas also 51.7 years (SD 13 years). Thirty-seven per-cent of the respondents attained a primary schoollevel, 42.7% a secondary school level, and 18.6% ahigher educational degree. The remainder did nothave any educational degree.
Construct Validity
Convergent validity (H
1
and H
2
).
The results withrespect to convergent validity show that olderpatients have significantly more problems on mobil-ity than younger patients and have significantlylower EQ-5D index scores. No significant differ-ences are found for the other dimensions (Table 2).
Significantly more women are anxious ordepressed than men. Men and women do not showsignificant differences on any other dimension of theEQ-5D (Table 2).
Discriminant validity (H
3
).
A significant differencebetween the frequency of reported problems bypatients and the general public is found for all thedimensions of the EQ-5D except for self-care(Table 3). The difference in EQ-5D index scores isalso highly significant.
Demographic characteristics of the patient groupare significantly different from those of the generalpublic; patients are significantly older (
P
=
0.024)and have higher educational levels (
P
=
0.001), andthere are more men in the patient sample than in thegeneral public sample (
P
<
0.0005). A multivariateanalysis, in which the EQ-5D index values are cor-rected for age, educational level, and sex, revealsstable results, with patients having a lower EQ-5Dindex score than people from the general public.
Tabl
e 2
Perc
enta
ge o
f re
spon
dent
s re
port
ing
prob
lem
s (m
oder
ate
or s
ever
e) o
n th
e fiv
e di
men
sion
s of
the
EQ
-5D
by
age
cate
gory
and
sex
Age
in y
ears
Sex
20–2
9(n
=
19)
30–3
9(n
=
41)
40–4
9(n
=
78)
50–5
9(n
=
94)
60–6
9(n
=
79)
70–7
9(n
=
25)
P
val
ueM
ale
(n
=
209
)Fe
mal
e (n
=
141
)
P
val
ue
Mob
ility
10.5
26.8
28.2
34.0
55.7
68.0
<
0.01
*40
.734
.00.
22*
Self-
care
012
.25.
14.
38.
920
.00.
05*
6.2
8.5
0.53
*U
sual
act
ivity
10.5
24.4
32.1
34.0
32.9
36.0
0.36
*27
.736
.20.
10*
Pain
/dis
com
fort
42.1
48.7
61.6
57.4
54.4
40.0
0.33
*52
.658
.10.
33*
Anx
iety
/dep
ress
ion
15.8
29.3
34.6
35.1
26.6
24.0
0.46
*23
.940
.50.
01*
Mea
n EQ
-5D
inde
x sc
ore
(SD
)0.
86 (
0.15
)0.
76 (
0.25
)0.
71 (
0.22
)0.
72 (
0.21
)0.
69 (
0.20
)0.
73 (
0.17
)0.
01
†
0.75
(0.
21)
0.70
(0.
21)
0.21
‡
*Chi
-squ
are
test
.
†
Kru
skal
–Wal
lis t
est.
‡
Inde
pend
ent
sam
ple
Stud
ent’s
t
tes
t.

Cleemput et al.
504
Concurrent Validity (H
4
and H
5
)
For the concurrent validity testing, patients weregrouped according to their responses on the EQ-5Dto see whether this classification reflected the pat-terns obtained with the SF-36, BDI, STAI, andMTSOSD scale. Results for the SF-36 are presentedin Table 4.
Patients reporting some or severe problems onthe EQ-5D dimensions have significantly lower SF-36 scores for almost all SF-36 domains. A fewexceptions are observed. The difference in SF-36
scores for mental health among patients reportingno, moderate, or severe problems on mobility is notsignificant (
P
=
0.162). The same applies for the dif-ference in scores on role limitation due to emotionalproblems and mental health between groups report-ing no, moderate, or extreme problems on self-care(
P
=
0.160 and
P
=
0.062). Differences are largestbetween dimensions of the SF-36 and the EQ-5Dcovering comparable domains of health (e.g.,mobility
EQ-5D
and physical functioning
SF-36
, mentalhealth
SF-36
and anxiety/depression
EQ-5D
, bodilypain
SF-36
and pain/discomfort
EQ-5D
, physical role lim-itation
SF-36
and usual activities
EQ-5D
).The range of possible scores on the different
health domains is larger in the SF-36 than in theEQ-5D. In the EQ-5D the range of responses on thelevel of the dimensions is, by design, limited tothree, whereas the domain scores in the SF-36 canbe any discrete number between 0 and 100. Thisimplies that the SF-36 has a higher potential to cap-ture small changes in health status if these changesmanifest themselves in one health domain than theEQ-5D.
Spearman rank correlation coefficients betweenthe EQ-5D index scores and the SF-36 domainrange from 0.41 (with role limitation due to emo-tional problems) to 0.68 (with bodily pain) (all
P
<
0.01). The correlations with all other domainsof the SF-36 are also significant on the 1% signifi-cance level. This means that more problems on anydomain of the SF-36 are associated with lower EQ-5D index scores and vice versa.
For the BDI, it is found that the classification into“not,” “moderately,” or “severely” depressedresulting from the responses on the anxiety/depres-
Table 3
Percentage of respondents reporting no, some, andsevere problems on each of the EQ-5D dimensions
Study sample(n = 350)
General public(n
=
967)
P
value
MobilityNo problems 62.0 83.1
<
0.01*Some problems 38.0 16.7Severe problems 0 0.2
Self-careNo problems 92.9 95.0 0.17*Some problems 6.6 4.1Severe problems 0.6 0.9
Usual activitiesNo problems 68.9 82.5
<
0.01*Some problems 27.1 15.9Severe problems 4.0 1.6
Pain/discomfortNo problems 45.1 53.0 0.04*Some problems 52.0 44.5Severe problems 2.9 2.6
Anxiety/depressionNo problems 69.4 77.3 0.01*Some problems 26.9 21.7Severe problems 3.7 1.0
EQ-5D index, mean(SD)
0.73 (0.21) 0.81 (0.21)
<
0.01
†
*Fisher exact test.
†
Mann–Whitney
U
test.
Table 4 SF-36 scores by EQ-5D response
EQ-5D
SF-36 domain
GHPN PF SF RP RE BP MH V
MobilityNo problems 217 84.0 83.2 71.5 78.5 80.1 72.8 68.7 65.3Any problems 133 55.3* 71.6* 45.9* 66.2* 63.3* 69.8 54.6* 53.7*
Self-careNo problems 325 75.8 80.3 64.3 74.9 75.3 72.3 64.7 61.9Any problems 23 38.0* 58.5* 29.0* 60.0 53.4* 63.7 45.2* 47.9*
Usual activitiesNo problems 241 81.9 85.0 74.8 81.3 80.6 75.3 69.1 65.7Any problems 95 53.6* 65.1* 33.0* 57.2* 58.4* 63.6* 50.5* 50.1*
Pain/discomfortNo problems 158 79.6 87.1 76.6 86.7 90.4 78.2 72.3 68.2Any problems 182 67.7* 71.9* 49.6* 63.2* 60.0* 66.3* 56.0* 54.9*
Anxiety/depressionNo problems 243 74.6 84.5 67.4 85.3 77.9 79.7 69.1 64.6Any problems 94 69.6* 65.9* 49.0* 47.7* 64.3* 53.4* 50.3* 52.4*
*P < .01 according to an independent sample t test.Abbreviations: PF, physical functioning; SF, social functioning; RP, role limitations due to physical problems; RE, role limitations due to emotional problems; BP, bodilypain; MH, mental health; V, vitality; GHP, general health perception.

Validity of EQ-5D in Renal Transplantation 505
sion dimension on the EQ-5D reflects the classifica-tion of the BDI into “no,” “mild,” “moderate,” and“severe” depression [41] (Table 5). The majority ofthe patients without depression according to theBDI report no anxiety or depression on the EQ-5D(80.6%). The balance is changed the more depres-sive symptoms patients have according to the BDI.Still a majority of patients with mild depressionreport no anxiety or depression on the EQ-5D(58.5%), but patients with moderate depression aremore likely to report some anxiety or depression onthe EQ-5D. Seventy-five percent of the patients withsevere depression according to the BDI also reportextreme anxiety or depression on the EQ-5D(Table 5).
The concurrent validity of the EQ-5D withrespect to depression is also illustrated by the sig-nificant difference between the mean BDI scoresof the different groups of patients, defined bytheir response on the anxiety/depression dimen-sion of the EQ-5D (Table 5). Patients withextreme anxiety/depression according to the EQ-5D have significantly higher BDI scores than
patients with moderate or no anxiety/depressionaccording to the EQ-5D (P < 0.0005). The sameapplies for patients with moderate anxiety/depres-sion in comparison with patients with no anxiety/depression.
Mean ridits for symptom occurrence and symp-tom distress are significantly different amongpatients grouped by their level of pain/discomfort(P < 0.01). Respondents reporting more pain/dis-comfort have significantly higher ridits (Fig. 1). Thismeans that the probability that a respondent reportshigher symptom experience and distress than a ran-domly selected patient from the entire sampleincreases as the level of problems reported on theEQ-5D pain/discomfort dimension increases.
The negative correlations between the EQ-5Qindex scores and the MTSOSD scale scores(r = -0.386 for symptom experience and r=-0.498 for symptom distress) are highly significant(P < 0.0005), meaning that the more symptomspatients experience and the more distressed theyare about these symptoms, the lower their score foroverall health.
Table 5 Percentage of patients reporting no, some, or extreme anxiety/depression, given their BDI classification and mean BDIscore for respondents with different answers on the EQ-5D anxiety/depression dimension
EQ-5D: anxiety/depression
Classification according to the short-form BDI
TotalBDI scoremean (SD)
Nodepression
Milddepression
Moderatedepression
Severedepression
No problems 80.6 58.5 20.0 0 69.4 2.31 (2.59)Some problems 18.2 39.6 65.0 25 26.9 5.59 (3.97)Severe problems 1.2 1.9 15.0 75 3.7 12.54 (8.54)Total 72.3 15.1 11.4 1.1 100 3.57 (4.06)
Figure 1 Box plots of ridit scores for the symptom occurrence and symptom distress subscales of the MTSOSD scale, according to response onEQ-5D pain/discomfort.
EQ-5D pain/discomfort
Severe problemsSome problemsNo problems
Sym
ptom
occ
urre
nce—
ridit
1.0
0.8
0.6
0.4
0.2
0.0
EQ-5D pain/discomfort
Severe problems Some problems No problems
Sym
ptom
dis
tres
s—rid
it
0.9
0.8
0.7
0.6
0.5
0.4
0.3
0.2

Cleemput et al.506
Discussion
The purpose of this study was to investigate theconstruct and concurrent validity of the EQ-5D inrenal transplant recipients. The construct validity ofthe instrument was tested by looking at the conver-gent and discriminant validity of the instrument.
The hypothesis of an inverse relationshipbetween age and level of problems on mobility, self-care, usual activities, and pain/discomfort (H1)could not entirely be accepted. The expected rela-tionship was seen only between age and mobility.An unexpected pattern in frequency of reportedproblems with self-care was observed. The percent-age of patients reporting problems on the EQ-5Dself-care dimension was high in the category 30 to39 years of age, declines up to 50 to 59 years of age,and then increases again up to 70 to 79 years of age.Unexpected patterns were also observed in the usualactivities and pain/discomfort dimensions. Theresults are in contrast to most existing research ingeneral populations [2,53–56], in which an almostsystematic increase in frequency of reported prob-lems is observed on all dimensions, except for anx-iety/depression.
There are three possible explanations for thesefindings. In chronic patient populations diseaseseverity is a covariate that might count for the unex-pected correlation between age and self-care limita-tions. Because there was no disease severity indexavailable in this study, this is a hypothesis thatshould be tested in future research. The unusualpattern in usual activities may be due to the fact thatyounger patients may suffer from their disease lesslong than the older patients. Therefore, they maynot have adapted certain coping strategies, such aschanging lifestyle, habits, and ways to performusual activities to the same extent as the olderpatients. Because older patients have adopted theirusual activities to their current physical capacity,they might no longer feel equally impaired in per-forming usual activities. The same applies for theself-care dimension. The longer people suffer from achronic disease, the more they find ways to getaround this problem. The unusual pattern observedon the pain/discomfort dimension may be explainedby the fact that older patients generally have lesscomorbidities at transplantation than youngerpatients and thus a better self-reported health statusafterward. There is evidence that older patients withmany comorbidities are less likely to be trans-planted than younger patients [57]. Patients withmuch comorbidity, e.g., those with cardiovasculardiseases who were not transplanted at a younger
age, tend to grow old on dialysis and were hence notincluded in our study of transplant patients.
The second hypothesis (H2) could not be rejectedbecause women did show higher levels of anxiety/depression than men, analogous to findings fromthe general public in different countries [2,53–56,58–61].
For the discriminant validity test, percentages ofpatients reporting problems on the respective EQ-5D dimensions were compared to percentages ofpeople in the general public reporting problems onthe same dimensions. Renal transplant patientsscored worse on all EQ-5D dimensions than thegeneral Flemish public (H3), though not signifi-cantly on the self-care dimension. The latter obser-vation may be due to the relatively restrictedformulation of the self-care question in the EQ-5D(“I have no/some/severe problems with washing ordressing myself”), whereas the other dimensions areformulated in more general terms. The differencepersisted after correction for difference in age, sex,and educational level, three aspects that differed sig-nificantly between both samples.
For almost all dimensions of the EQ-5D, the SF-36 scores for all SF-36 domains differ significantlyamong patients grouped by their response on therespective EQ-5D dimensions (H4). Differences inSF-36 scores between comparable dimensions of theEQ-5D and the SF-36 were larger than betweennoncomparable dimensions, pointing at good con-current validity of the EQ-5D. The response cate-gories of the EQ-5D are very limited in comparisonto the response categories of the SF-36. This is anacknowledged problem, however, for which theproposed solution is to use a separate disease-spe-cific instrument alongside the generic EQ-5D [3] ifmore information about subdomains of health isrequired. For use in economic evaluations, however,the observed concurrent validity of the EQ-5D issatisfactory, especially in view of the highly signifi-cant positive correlation between the EQ-5D indexscore and the SF-36 score for general healthperception.
The classification into depressed and notdepressed patients according to the EQ-5D washighly comparable with the classification of the BDI(H5). If no information about potential reasonsfor depressive symptomatology in renal transplantpatients is required, as in economic evaluations, theuse of the descriptive EQ-5D system may besufficient.
A similar pattern was found for the MTSOSDscale scores. Patients with more problems on self-care, usual activities, pain/discomfort, and anxiety/

Validity of EQ-5D in Renal Transplantation 507
depression have higher scores for symptom occur-rence and symptom distress.
Conclusions
In conclusion, the results of this study show that theEQ-5D has acceptable convergent and discriminantvalidity and concurrent validity for the measure-ment of health status in a renal transplant popula-tion. The results of the EQ-5D in renal transplantpatients are in line with existing evidence. Conse-quently, the use of the EQ-5D in the outcome meas-urement of interventions for economic evaluationswill reveal results that are consistent with evidence,which is an important indication for its validity inrenal transplant patients.
One of the merits of the EQ-5D is that it is a sim-ple instrument that can easily be administered dur-ing routine clinical practice. This feature makes theinstrument especially attractive from a research per-spective. Given the relatively good indications ofvalidity of the instrument in a renal transplant pop-ulation, we recommend further use of this instru-ment in this patient group.
This study was supported by an unrestricted scientificgrant from Fujisawa GmbH, Germany, and by a grantfrom the Research Council of the K.U. Leuven, Belgium.The research was carried out at Center for Health Servicesand Nursing Research.
References
1 Johnson JA, Coons SJ, Ergo A, et al. Valuation ofEuroQol (EQ-5D) health states in an adult US sam-ple. Pharmacoeconomics 1998;13:421–33.
2 Kind P, Dolan P, Gudex C, et al. Variations in pop-ulation health status: results from a United King-dom national questionnaire survey. BMJ1998;316:736–41.
3 Brooks R. EuroQol: the current state of play.Health Policy 1996;37:53–72.
4 Brazier J, Jones N, Kind P. Testing the validity ofthe EuroQol and comparing it with the SF-36health survey questionnaire. Qual Life Res1993;2:169–80.
5 van Agt HME, Essink-Bot ML, Krabbe PFM, et al.Test–retest reliability of health state valuations col-lected with the EuroQol questionnaire. Soc SciMed 1994;11:1537–44.
6 Essink-Bot ML, Krabbe PFM, Bonsel GJ, et al. Anempirical comparison of four generic health statusmeasures: the Nothingham Health Profile, theMedical Outcomes Study 36-item Short-FormHealth Survey, the COOP/WONCA charts, and theEuroQol instrument. Med Care 1997;35:522–37.
7 Johnson JA, Coons SJ. Comparison of the EQ-5Dand SF-12 in an adult US sample. Qual Life Res1998;7:155–66.
8 Hurst NP, Jobanputra P, Hunter M, et al. Validityof EuroQol—a generic health status instrument—in patients with rheumatoid arthritis. Br J Rheu-matol 1994;33:655–62.
9 Fransen M, Edmonds J. Reliability and validity ofthe EuroQol in patients with osteoarthritis of theknee. Rheumatology 1999;38:807–13.
10 Chetter IC, Spark JI, Dolan P, et al. Quality of lifein patients with lower limb ischaemia: suggestionsfor European Standardisation. Eur J EndovascSurg 1997;13:597–604.
11 Jenkinson C, Stradling J, Petersen S. Comparisonof three measures of quality of life outcome in theevaluation of continuous positive airways pressuretherapy for sleep apnoea. J Sleep Res 1997;6:199–204.
12 Harper R, Brazier J, Waterhouse JC, et al. Com-parison of outcome measures for patients withchronic obstructive pulmonary disease (COPD) inan outpatient setting. Thorax 1997;52:879–87.
13 Richards DM, Irving MH. Assessing the quality oflife of patients with intestinal failure on homeparenteral nutrition. Gut 1997;40:218–22.
14 American Educational Research AssociationAmerican Psychological Association, NationalCouncil on Measurement in Education. Standardsfor Educational and Psychological Testing. Wash-ington (DC): American Educational ResearchAssociation, 1999.
15 Goodwin LD. Changing conceptions of measure-ment validity: an update on the new standards. JNurs Educ 2002;41:100–6.
16 Moons P, Vanrenterghem Y, Van Hooff JP, et al.Health-related quality of life and symptom experi-ence in tacrolimus-based regimens after renaltransplantation: a multicentre study. TransplantInt 2002;16:653–64.
17 Ware JE, Sherbourne CD. The MOS 36-item short-form health survey (SF-36). Med Care 1992;30:473–83.
18 Beck AT, Beck RW. Screening depressed patients infamily practice: a rapid technique. Postgrad Med1972;52:81–5.
19 Moons P, De Geest S, Versteven K, et al. Psycho-metric properties of the “Modified TransplantSymptom Occurrence and Symptom DistressScale”. J Nurs Meas 2001;9:115–34.
20 The EuroQol Group. EuroQol—a new facility forthe measurement of health-related quality of life.Health Policy 1990;16:199–208.
21 Cleemput I, Kind P, Kesteloot K. Re-scaling socialpreference data: implications for modeling. In: KindP, Macaran S, eds., 19th Plenary Meeting of theEuroQol Group. York: University of York, 2002.
22 Dorman P, Slattery J, Farrell B, et al. Qualitativecomparison of the reliability of health status

Cleemput et al.508
assessments with the EuroQol and SF-6 question-naires after stroke. Stroke 2000;29:63–8.
23 Badia X, Monserrat S, Roset M, et al. Feasibility,validity and test–retest reliability of scaling meth-ods for health states: the visual analogue scale andthe time trade-off. Qual Life Res 1999;8:303–10.
24 Gudex C, Dolan P, Kind P, et al. Health state val-uations from the general public using the visualanalogue scale. Qual Life Res 1996;5:521–31.
25 Ünal G, de Boer JB, Borsboom GJJM, et al. A psy-chometric comparison of health-related quality oflife measures in chronic liver disease. J Clin Epide-miol 2001;54:587–96.
26 Stavem K, Bjornaes H, Lossius MI. Properties ofthe 15D and EQ-5D utility measures in a commu-nity sample of people with epilepsy. Epilepsy Res2001;44:179–89.
27 Brazier J, Roberts J, Deverill H. The estimation ofa preference-based measure of health from the SF-36. J Health Econ 2002;21:271–92.
28 Anderson RT, Aaronson NK, Wilkin D. Criticalreview of the international assessments of health-related quality of life. Qual Life Res 1993;2:369–95.
29 Fujisawa M, Ichikawa Y, Yoshiya K, et al. Assess-ment of health-related quality of life in renal trans-plant and hemodialysis patients using the SF-36health survey. Urology 2000;56:201–6.
30 Bremer BA, Wert KM, Durica AL, et al. Neuropsy-chological, physical, and psychosocial functioningof individuals with end-stage renal disease. AnnBehav Med 1998;19:348–52.
31 Manu MA, Radulescu S, Harza M, et al. Qualityof life assessed by SF-36 health survey in renaltransplant patients. Transplant Proc 2001;33:1927–8.
32 Gross CR, Limwattananon C, Matthees B, et al.Impact of transplantation on quality of life inpatients with diabetes and renal dysfunction.Transplantation 2000;70:1736–46.
33 Singer MA, Hopman MW, MacKenzie TA. Physi-cal functioning and mental health in patients withchronic medical conditions. Qual Life Res1999;8:687–91.
34 Rebollo P, Ortega F, Baltar JM, et al. Healthrelated quality of life (HRQOL) of kidney trans-planted patients: variables that influence it. ClinTransplant 2000;14:199–207.
35 Forsberg A, Lorenzon U, Nilsson F, et al. Pain andhealth related quality of life after heart, kidney andliver transplantation. Clin Transplant 1999;13:453–560.
36 Matas AJ, McHugh L, Payne WD, et al. Long-termquality of life after kidney and simultaneous pan-creas-kidney transplantation. Clin Transplant1998;12:233–42.
37 Shield CF, McGrath MM, Goss TF. Assessment ofhealth-related quality of life in kidney transplantpatients receiving tacrolimus (FK506)-based versus
cyclosporine-based immunosuppression. Trans-plantation 1997;64:1738–43.
38 Benedetti E, Matas AJ, Hakim N, et al. Renaltransplantation for patients 60 years or older. Asingle-institution experience. Ann Surg 1994;220:445–58.
39 Franke GH, Riemer J, Kohnle M, et al. Quality oflife in end-stage renal disease patients after success-ful kidney transplantation: development of theESRD symptom checklist—transplantation mod-ule. Nephron 1999;83:31–9.
40 Piehlmeier W, Bullinger M, Kirchberger I, et al.Evaluation of the quality of life of patients withinsulin-dependent diabetes mellitus before andafter organ transplantation with the SF-36 healthsurvey. Eur J Surg 1996;162:933–40.
41 Beck AT, Steer RA, Garbin MG. Psychometricproperties of the Beck Depression Inventory:twenty-five years of evaluation. Clin Psych Rev1988;8:77–100.
42 Beck AT, Ward CH, Mendelson M, et al. An inven-tory for measuring depression. Arch General Psych1961;4:561–7.
43 Christensen AJ, Ehlers SL, Raichle KA, et al. Pre-dicting change in depression following renal trans-plantation: effect of patient coping preferences.Health Psychol 2000;19:348–53.
44 Frazier PA, Davis-Ali SH, Dahl KE. Correlates ofnoncompliance among renal transplant recipients.Clin Transplant 1994;8:550–7.
45 Shulman R, Price JD, Spinelli J. Biopsychosocialaspects of long-term survival on end-stage renalfailure therapy. Psychol Med 1989;19:945–54.
46 Schlebusch L, Pillay BJ, Louw J. Depression andself-report disclosure after live related donor andcadaver renal transplants. S Afr Med J1989;75:490–3.
47 Smith MD, Hong BA, Robson AM. Diagnosis ofdepression in patients with end-stage renal disease:comparative analysis. Am J Med 1985;79:160–6.
48 Richter P, Werner J, Heerlien A, et al. On the valid-ity of the Beck Depression Inventory: a review. Psy-chopathology 1998;31:160–8.
49 Leahy JM. Validity and reliability of the BeckDepression Inventory-Short Form in a group ofadult bereaved females. J Clin Psychol 1992;48:64–8.
50 Kawachi I, Berkman LF. Social ties and mentalhealth. J Urban Health 2001;78:458–67.
51 Sermeus W, Delesie L. Ridit analysis on ordinaldata. West J Nurs Res 1996;18:351–9.
52 Bross I. How to use ridit analysis. Biometrics1958;14:18–38.
53 Burstrom K, Johannesson M, Diderichsen F.Health-related quality of life by disease and socio-economic group in the general population in Swe-den. Health Policy 2001;55:51–69.
54 Burstrom K, Johannesson M, Diderichsen F.Swedish population health-related quality of life

Validity of EQ-5D in Renal Transplantation 509
results using the EQ-5D. Qual Life Res2001;10:621–35.
55 Anderson C, Wittenburg R. Health status of Brit-ish adult population by the EuroQol instrumentand other measures. EuroQol Plenary MeetingBarcelona 1995 1995;173–95.
56 Badia X, Schiaffino A, Alonso J, et al. Using theEuroQol EQ-5D in the Catalan general popula-tion: feasibility and construct validity. Qual LifeRes 1998;7:311–22.
57 Krishnan M, Lok CE, Jassal SV. Epidemiologyand demographic aspects of treated end-stagerenal disease in the elderly. Semin Dial 2002;15:79–83.
58 Devlin N, Hansen P, Herbison P. Variations in self-reported health status: results from a New Zealandsurvey. N Z Med J 2000;113:517–20.
59 Ikegami N, Ikeda S. Health status in the Japanesepopulation: results from the Japanese EuroQolstudy. 16th Plenary Meeting of the EuroQol Group1999;271–83.
60 Mayo NE, Goldberg M, Kind P. Performance ofthe EuroQol EQ-5D in a Canadian population.EuroQol Plenary Meeting Rotterdam 19971997;25–41.
61 Ohinmaa A, Sintonen H. Quality of life of Finnishpopulation measured by EuroQol. EuroQol Ple-nary Meeting Barcelona 1995 1995;161–73.