Paediatric Track and Trigger Systems: Validity, Reliability and ...
Increasing the Reliability and Validity of Quantitative Laddering Data with LadderUX
Abstract Laddering is an interview technique that provides rich qualitative data, and subsequent content analysis allows crossing over from qualitative to a quantitative measurement. However, the method is not tailored to data coming from user experience studies, and result-ing data analysis of UX Laddering studies risks to lack scientific rigor with respect to the reliability and validity of the data. Therefore, we present LadderUX and point out the design rationale for its special features that help UX researchers measure what they actually set out to measure, ensuring that the resulting dominant means-end chains form an accurate representation of the population under study.
Keywords Laddering, Means-End Chain theory, User Experiences, Reliability, Validity
ACM Classification Keywords H.5.2 [User Interfaces]: Theory and Methods.
General Terms Design, Human Factors, Performance.
Copyright is held by the author/owner(s).
CHI’12, May 5–10, 2012, Austin, Texas, USA.
ACM 978-1-4503-1016-1/12/05.
Vero Vanden Abeele e-Media Lab, Groep T Vesaliustraat 16 B-3000, Leuven, Belgium [email protected] Erik Hauters LadderUX.org Mezenstraat 42 B-3061 Leefdaal, Belgium [email protected] Bieke Zaman IBBT/CUO, KULeuven Parkstraat 45 bus 3605 3000, Leuven, Belgium [email protected]
Work-in-Progress CHI 2012, May 5–10, 2012, Austin, Texas, USA
2057
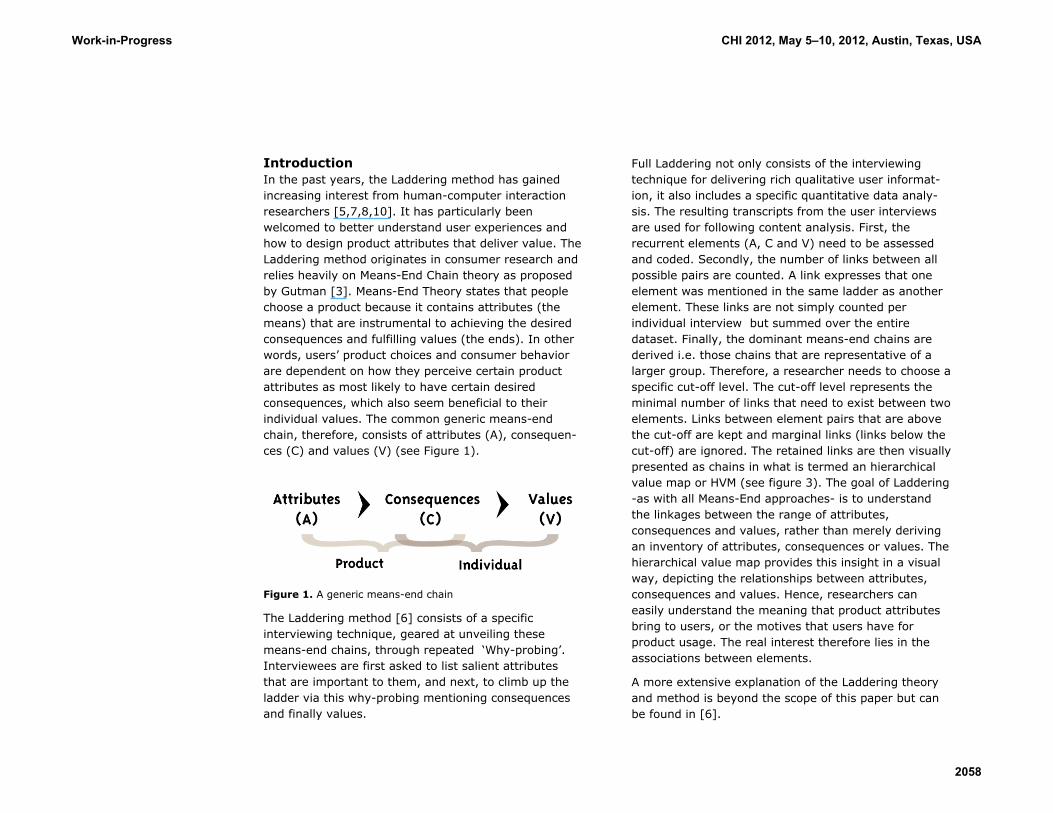
Introduction In the past years, the Laddering method has gained increasing interest from human-computer interaction researchers [5,7,8,10]. It has particularly been welcomed to better understand user experiences and how to design product attributes that deliver value. The Laddering method originates in consumer research and relies heavily on Means-End Chain theory as proposed by Gutman [3]. Means-End Theory states that people choose a product because it contains attributes (the means) that are instrumental to achieving the desired consequences and fulfilling values (the ends). In other words, users’ product choices and consumer behavior are dependent on how they perceive certain product attributes as most likely to have certain desired consequences, which also seem beneficial to their individual values. The common generic means-end chain, therefore, consists of attributes (A), consequen-ces (C) and values (V) (see Figure 1).
Figure 1. A generic means-end chain
The Laddering method [6] consists of a specific interviewing technique, geared at unveiling these means-end chains, through repeated ‘Why-probing’. Interviewees are first asked to list salient attributes that are important to them, and next, to climb up the ladder via this why-probing mentioning consequences and finally values.
Full Laddering not only consists of the interviewing technique for delivering rich qualitative user informat-ion, it also includes a specific quantitative data analy-sis. The resulting transcripts from the user interviews are used for following content analysis. First, the recurrent elements (A, C and V) need to be assessed and coded. Secondly, the number of links between all possible pairs are counted. A link expresses that one element was mentioned in the same ladder as another element. These links are not simply counted per individual interview but summed over the entire dataset. Finally, the dominant means-end chains are derived i.e. those chains that are representative of a larger group. Therefore, a researcher needs to choose a specific cut-off level. The cut-off level represents the minimal number of links that need to exist between two elements. Links between element pairs that are above the cut-off are kept and marginal links (links below the cut-off) are ignored. The retained links are then visually presented as chains in what is termed an hierarchical value map or HVM (see figure 3). The goal of Laddering -as with all Means-End approaches- is to understand the linkages between the range of attributes, consequences and values, rather than merely deriving an inventory of attributes, consequences or values. The hierarchical value map provides this insight in a visual way, depicting the relationships between attributes, consequences and values. Hence, researchers can easily understand the meaning that product attributes bring to users, or the motives that users have for product usage. The real interest therefore lies in the associations between elements.
A more extensive explanation of the Laddering theory and method is beyond the scope of this paper but can be found in [6].
Work-in-Progress CHI 2012, May 5–10, 2012, Austin, Texas, USA
2058
Although links can be counted manually, this is a tedious, error-prone process. In addition, extracting the hierarchical value map is a complex matter. All element links above the cut-off level must be inspected and ‘folding’ [2] (i.e. arranging the layout of associations between elements) must be done with care. Finally, researchers must be able to try out different cut-off levels and understand the impact of the chosen cut-off level on the Laddering data. This shows the need for a tool for the quantitative analysis of Laddering data.
Laddering for user experiences Moreover, Laddering in a context of user experience evaluations differs from traditional Laddering as it has typically been promoted in consumer research [9]. Hence, user experience Laddering requires an adapted approach in the data analysis. In the following paragraphs, we highlight the important ‘design guidelines’ (DG) that informed the conceptual design.
Less elaborated ladders In a UX context, Laddering is often used to gather feedback on a product that has not yet been adopted on a wide scale in society, e.g. prototypes. Typically, the ladders for products that users have only been interacting with for short periods of times are less elaborated. This becomes especially problematic when being enforced to use one general cutoff level for all elements (be it attributes, consequences or values). In HCI studies, it is likely that the data set has a pyramidal structure, i.e., many more attributes than consequences and values are mentioned [1]. It should therefore be possible to define different cut-off levels for the Attributes, Consequences and Values level.
DG 1) Allow to set different cut-off level for attributes, consequences and values.
A focus on concrete attributes For designers of HCI products, it is valuable to distin-guish between concrete attributes and abstract attribu-tes. Concrete attributes are physical or tangible attribu-tes, such as colour, product material, size, speed or memory capacity. Abstract attributes are more general or intangible, e.g. glass can be a concrete attribute, whereas transparency is an abstract attribute [4]. While this distinction is recognized in consumer re-search at a theoretical level, few of these studies actually retain this level of distinction in the data analysis and mostly analyze at the ‘abstract attribute level’. For HCI, concrete attributes might be pertinent.
DG 2) Distinguish between concrete and abstract attributes
As Laddering interviews in HCI often start with a specific interaction with a prototype, retaining the link between the mentioned elements and the prototype facilitates the meaningfulness of the Laddering data; it provides information on the specific implementation of an attribute. To exemplify, if an interviewee mentions that he likes the button style of a specific prototype, this style can be further assessed from the prototype).
DG 3) Allow to add a specific prototype to the dataset
Multidisciplinary effort Research is rarely an individual endeavor; and this is especially true within the multi-disciplinary field of HCI. Hence, a tool that allows for collaborative work is highly desirable. Collaborations can also prevent researcher bias. One specific way to prevent researcher bias and judge the reliability of the data is via the assessment of intercoder reliability (IR), a critical component of content analysis. IR does not guarantee validity, nevertheless, when it is not established properly, the
Work-in-Progress CHI 2012, May 5–10, 2012, Austin, Texas, USA
2059
data and interpretations of the data cannot be considered valid. Therefore any tool for content analysis should foresee the measurement of IR.
DG 4) Facilitate computing intercoder reliability
Flexible, yet unambiguous criteria for cut-off levels For a typical ‘consumer’ Laddering study, cut-off levels fall somewhere between three and five [6], or a cut-off level that results in only showing the most informative associations, yet still providing a stable set of relations
that represents the diversity of the data. However, no exact statistical or theoretical criteria exist that guide the choice for a specific cut-off level, only rules of thumb. Consequently, in order to investigate the stability of the data, researchers need to be able to quickly tweak cut-off levels and notice the effect.
DG 5) Adjust cut-off levels easily and inspect the hierarchical value map for its stability
In previous Laddering studies, it has also been advised to choose a cut-off level that keeps approximately two thirds of all links [6:20]. In essence, this refers to a ‘goodness of fit’ indicator. Obviously, if one wants to take into account the goodness of fit indicator, this data should be available to the researcher.
DG 6) Provide researchers with a summary of project data, especially the goodness of fit.
We argue that these design recommendations significantly enhance the reliability and the validity of Laddering studies conducted in the domain of HCI. A tool that incorporates the features mentioned above, increases the consistency of the results over time and ensures that the resulting dominant means-end chains are accurate representations of the user experience.
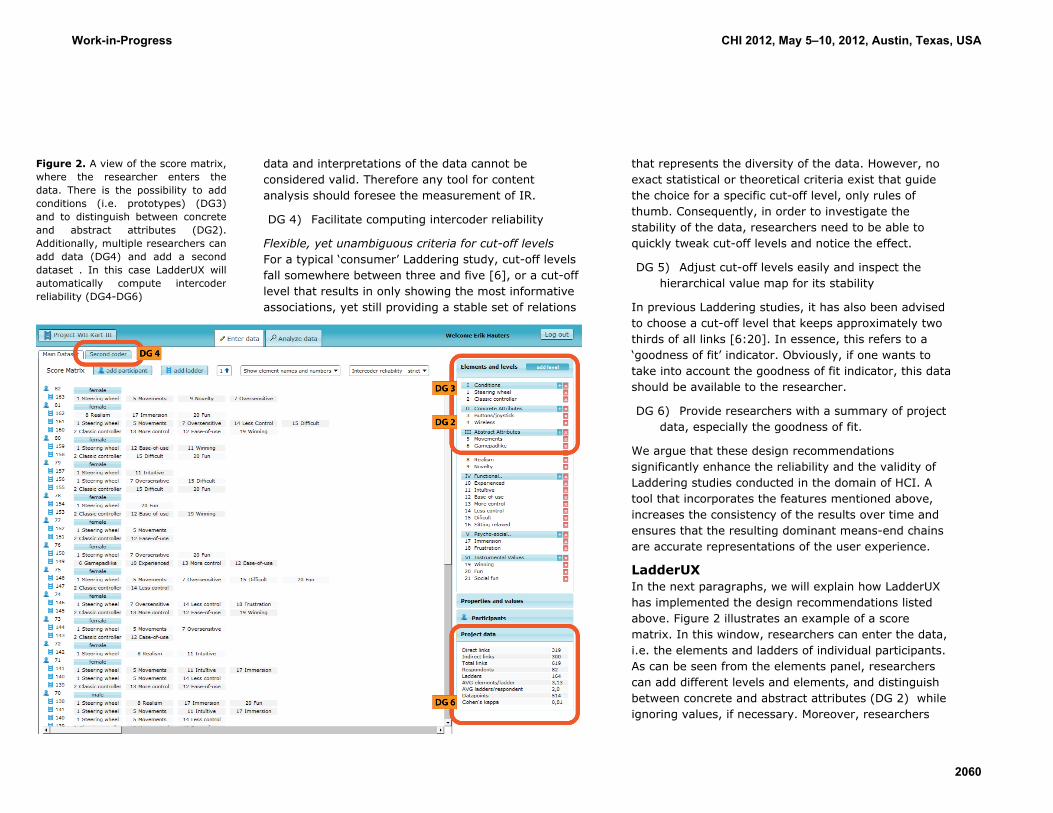
LadderUX In the next paragraphs, we will explain how LadderUX has implemented the design recommendations listed above. Figure 2 illustrates an example of a score matrix. In this window, researchers can enter the data, i.e. the elements and ladders of individual participants. As can be seen from the elements panel, researchers can add different levels and elements, and distinguish between concrete and abstract attributes (DG 2) while ignoring values, if necessary. Moreover, researchers
Figure 2. A view of the score matrix, where the researcher enters the data. There is the possibility to add conditions (i.e. prototypes) (DG3) and to distinguish between concrete and abstract attributes (DG2). Additionally, multiple researchers can add data (DG4) and add a second dataset . In this case LadderUX will automatically compute intercoder reliability (DG4-DG6)
Work-in-Progress CHI 2012, May 5–10, 2012, Austin, Texas, USA
2060

can add specific prototypes, here termed conditions (DG 3). LadderUX allows for different researchers to work on one data set. If the additional data analysis of a second coder is entered, intercoder reliability is assessed automatically. Intercoder agreement is computed per participant and per ladder. LadderUX computes the Cohen’s Kappa and lists the result as part of the project data (DG 6). Researchers can opt for a more loose assessment where intercoder reliability will be computed per ladder but ignores the order of
elements, or a more strict assessment where the order of elements is also taken into account. Figure 3 shows the hierarchical value map and the additional panels. The cut-off level panels can be easily adjusted and the changes are immediately reflected in the hierarchical value map. This allows researchers to investigate and perceive the effect of different cut-off levels and aim for those values that result in stable MECs (DG 4). As can be seen, cut-off levels can be tweaked for the entire data set or per element level
Figure 3. An overview of the hierar-chical value map. Researchers can adjust the cut-off values easily, and per level if wanted, (DG1)and assess the impact on the means-end chains (DG6). In the project data researchers get an overview of parameters such as the goodness of fit indicator (DG6).
Work-in-Progress CHI 2012, May 5–10, 2012, Austin, Texas, USA
2061

separately (DG 1). The project data panel displays several important measures of the data set, among others the goodness of fit indictator (DG 6) and Cohen’s kappa.
Conclusion LadderUX is a designed for the quantitative analysis of user experience Laddering data. We demonstrated its value by motivating the importance of the specific features built into the tool. These features ensure that the resulting dominant means-end chains are an accurate representation of the total population under study. Because LadderUX has been implemented based on design guidelines that are adapted to the peculiarities of user experience Laddering, reliance on this tool will increase the reliability and validity of the quantitative Laddering data analysis.
LadderUX has, to date, been applied only to few research projects by few researchers; further refine-ments and adaptations, in different research projects, by researchers of different disciplines, is necessary. We invite interested researchers to make use of the software, available at www.ladderux.org, and to contribute to a greater body of knowledge surrounding laddering as a means to investigate user experiences.
References 1. Claeys, C. and Vanden Abeele, P. Means-End Chain
Theory and Involvement: Potential Research Directions. In Understanding Consumer Decision-Making,. Lawrence Elbaum Associates, New Jersey, 2001, 359–387.
2. Grunert, K.G., Beckmann, S.C., and Sorensen, E. Means-end chains and laddering: an inventory of problems and an agenda for research. In Understanding Consumer Decision-Making: The
Means-end Approach to Marketing and Advertising Strategy,. Lawrence Earlbaum, Mahwah, NJ, 1996, pp.63-90.
3. Gutman, J. A means-end chain model based on consumer categorization processes. Journal of Marketing 46, 2 (1982), 60–72.
4. Kardes, F., Cronley, M., and Cline, T. Consumer Behavior. South-Western College Pub, 2010.
5. Leitner, M., Wolkerstorfer, P., Sefelin, R., and Tscheligi, M. Mobile multimedia: identifying user values using the means-end theory. Proceedings of the 10th international conference on Human computer interaction with mobile devices and services, ACM (2008), 167–175.
6. Reynolds, T.J. and Gutman, J. Laddering theory, method, analysis, and interpretation. In T.J. Reynolds and J.C. Olsen, eds., Understanding consumer decision making . Lawrence Erlbaum, Mahwah N.J. ;;London, 2001, 25–52.
7. Subramony, D.P. Introducing a “Means-End” Approach to Human-Computer Interaction: Why Users Choose Particular Web Sites Over Others. (AACE), P.O. Box 3728, Norfolk, VA (2002).
8. Tang, H., Lang, J., Lou, J., and Farmer, K. Measuring the emotional drivers of visual preference in china. Proc. 2nd intern.conf. on Usability and intern., Springer-Verlag (2007), 506–509.
9. Vanden Abeele, V. and Zaman, B. Laddering the user experience! User Experience Methods, Interact 2009, Uppsala, Sweden, (2009).
10. Zaman, B. and Vanden Abeele, V. Laddering with Young Children in User eXperience Evaluations: Theoretical Groundings and a Practical Case. Interaction Design and Children, (2010).
Work-in-Progress CHI 2012, May 5–10, 2012, Austin, Texas, USA
2062
Copyright © 2022 FDOKUMEN


![[Validity and reliability of the nursing organizational health questionnaire]](https://static.fdokumen.com/doc/165x107/633a0d90a730b4837d007338/validity-and-reliability-of-the-nursing-organizational-health-questionnaire.jpg)