Paediatric Track and Trigger Systems: Validity, Reliability and ...
351
1 Paediatric Track and Trigger Systems: Validity, Reliability and Utility Susan Margaret Chapman UCL Doctor of Philosophy
-
Upload
khangminh22 -
Category
Documents
-
view
0 -
download
0
Transcript of Paediatric Track and Trigger Systems: Validity, Reliability and ...

1
Paediatric Track and Trigger
Systems:
Validity, Reliability and Utility
Susan Margaret Chapman
UCL
Doctor of Philosophy


3
Declaration
I, Susan Margaret Chapman confirm that the work presented in this thesis is my
own. Where information has been derived from other sources, I confirm that this has
been indicated in the thesis.
Signed:
Date: 20th February 2017

4
Abstract
Paediatric Track and Trigger Systems (PTTS) should alert staff to deteriorating
children and accelerate access to resuscitation. The thesis presents a series of
linked studies exploring selected aspects of PTTS use.
Study 1: Systematic review
Fifty-five papers describing 33 PTTS were identified. Implemented without a rapid
response team (RRT), PTTS did not demonstrate statistically significant relative
reduction in cardiac or respiratory arrest, or mortality. Implemented as part of a RRT
PTTS demonstrated a statistically significant reduction in the relative and absolute
risk of death in hospital, death on the ward and death following PICU transfer.
Study 2: Validity
This case-controlled study compared the predictive validity of 18 PTTS using case-
controlled methodology. The area under the receiver operator characteristic curve
(AUROC) varied (0.62 to 0.89). Three systems demonstrated statistically better
performance. Incorporation of evidence-based thresholds for heart and respiratory
rate did not improve the AUROC of high-performing systems.
Study 3: Reliability
This study examined the accuracy and completeness of PTTS documentation and
compliance to a monitoring and escalation protocol. Of the 13,816 observation sets,
10,518 (76.1%) had an accurately calculated PTTS. Just 4957 (35.9%) contained all
the required parameters. Only 3.3% of patients (20/608) met the required standard
for monitoring and escalation.
Study 4: Utility
This mixed-methods study examined the understanding and experiences of
children, young people, parents and nurses surrounding the use of a PTTS. Three
main themes emerged: benefits and burdens, watchfulness and wisdom, and
collaboration and conflict. Findings indicate that use of a PTTS is complex and
greater collaboration between children/young people, families and healthcare
professionals is likely to improve their use in clinical practice.

5
Conclusion:
There may be a relationship between validity, reliability and utility which, at present,
is poorly understood. Better understanding of this relationship may improve
outcomes for children and young people.

6
Acknowledgement
Firstly, I would like to thank my husband Steve for tolerating (with a smile) all the
lost weekends, disrupted holidays and sustained periods of absence when I have
been locked in my ‘office’ working on my PhD. His constant understanding and
support has been invaluable and I know I would not have completed my research
without him. I am only sorry that my Mum is not here to share in his delight at its
completion.
I would also like to thank my supervisory team. Dr. Jo Wray for taking responsibility
for my supervision and endeavoring to keep me on the straight and narrow,
particularly in the final few months before submission. Dr. Kate Oulton for providing
encouragement, support and expertise on my qualitative research. Professor Mark
Peters for his critical challenge and endless knowledge of all things quantitative. My
thanks also go to Professor Linda Franck and Professor Mike Grocott who
supervised and supported me through the initial part of my research and provided a
solid foundation that my current supervisors have built upon.
I would like to acknowledge the assistance of Dr Samiran Ray, who calculated the z-
scores and p values reported in chapter three and produced Figure 3.1, Mr. Andrew
Gilroy who collected data on 20 of the patients reported in chapters three and four
and Mrs Sue Pike who conducted two of the six focus groups reported in chapter
five.
My family and work colleagues have vicariously ‘experienced‘ my PhD. I thank them
for the encouragement and support they have provided along the way.
Finally I would like to thank the children, young people, families and nurses whose
contribution made this research possible.

7
Table of Contents
Declaration ................................................................................................... 3
Abstract ........................................................................................................ 4
Acknowledgement ....................................................................................... 6
Tables ......................................................................................................... 12
Figures ........................................................................................................ 14
Appendices................................................................................................. 16
Abbreviations ............................................................................................. 18
Chapter 1 Introduction ............................................................................ 20
1.1 Overview .................................................................................................. 20
1.2 Background ............................................................................................. 22
1.2.1 Childhood mortality in the UK .............................................................. 22
1.2.2 In-hospital childhood mortality ............................................................. 25
1.2.3 Aetiology of cardiac arrest in hospitalised children .............................. 26
1.2.4 The role of intensive care .................................................................... 27
1.2.5 Sub-optimal care of hospitalised children ............................................ 31
1.2.6 A safe system to improve in-hospital mortality..................................... 33
1.2.7 Evolution of track and trigger systems ................................................. 35
1.2.8 Paediatric track and trigger systems ................................................... 37
1.2.9 Types of paediatric track and trigger systems ..................................... 43
1.2.10 Mechanisms by which track and trigger systems may work ............... 47
1.2.11 Sub-optimal use of track and trigger systems .................................... 48
1.3 Motivation for the thesis ......................................................................... 50
1.3.1 Gaps in the research on paediatric track and trigger systems ............. 50
1.3.2 Questions and problems ..................................................................... 52
1.3.3 The value of this research ................................................................... 52
1.3.4 Motivation for this research ................................................................. 53
1.4 My research ............................................................................................. 53
1.4.1 Overall aim of the thesis ...................................................................... 53
1.4.2 Component studies ............................................................................. 54
1.4.3 Boundaries of the thesis ...................................................................... 54

8
1.4.4 Structure of the thesis ......................................................................... 55
Chapter 2 A systematic review of paediatric track and trigger
systems…….. ............................................................................................. 57
2.1 Introduction ............................................................................................. 57
2.1.1 Validity ................................................................................................ 57
2.1.2 Calibration ........................................................................................... 58
2.1.3 Reliability ............................................................................................ 59
2.1.4 Utility ................................................................................................... 59
2.1.5 Initial systematic review ...................................................................... 59
2.1.6 Developments since the initial systematic review. ............................... 61
2.2 Systematic review methodology ............................................................ 62
2.2.1 Aim of the systematic review ............................................................... 62
2.2.2 Research questions ............................................................................ 63
2.2.3 Review method ................................................................................... 63
2.3 Results ..................................................................................................... 70
2.3.1 Search results ..................................................................................... 70
2.3.2 Included studies .................................................................................. 72
2.3.3 Published paediatric track and trigger systems ................................... 73
2.3.4 Key characteristics .............................................................................. 76
2.3.5 Vital signs ........................................................................................... 85
2.3.6 Comparison of PTTS heart and respiratory rate thresholds to evidence
based values .................................................................................................. 92
2.3.7 Effect as a single intervention on patient important outcomes ........... 102
2.3.8 Effect as part of a package of interventions on patient important
outcomes ...................................................................................................... 110
2.3.9 Validity – Predictive performance ...................................................... 121
2.3.10 Reliability ........................................................................................ 126
2.3.11 Calibration ....................................................................................... 128
2.3.12 Utility ............................................................................................... 128
2.4 Discussion ............................................................................................. 132
2.4.1 Limitation of the systematic review .................................................... 134
2.4.2 Implications for practice .................................................................... 134
2.5 Conclusion ............................................................................................. 135

9
Chapter 3 Validity: an observational study of 18 paediatric track and
trigger systems in a paediatric hospital ................................................ 136
3.1 Introduction ........................................................................................... 136
3.2 Aim ......................................................................................................... 136
3.2.1 Hypothesis ........................................................................................ 137
3.2.2 Setting .............................................................................................. 137
3.3 Methods ................................................................................................. 138
3.3.1 Selection of Paediatric Track and Trigger Systems ........................... 138
3.3.2 The Children’s Early Warning Score ................................................. 138
3.3.3 CEWS escalation plan ...................................................................... 139
3.3.4 Participants ....................................................................................... 140
3.3.5 Ethical issues .................................................................................... 142
3.3.6 Data extraction: ................................................................................. 142
3.4 Data analysis ......................................................................................... 147
3.5 Results ................................................................................................... 149
3.5.1 Eligible systems ................................................................................ 149
3.5.2 Patient characteristics ....................................................................... 156
3.5.3 Performance of systems ................................................................... 158
3.6 Discussion ............................................................................................. 173
3.6.1 Limitations ......................................................................................... 175
3.7 Conclusion ............................................................................................. 176
Chapter 4 Reliability: an observational study of the accuracy and
completeness of paediatric track and trigger system documentation
and compliance to a monitoring and escalation protocol .................... 177
4.1 Introduction ........................................................................................... 177
4.1.1 Background ....................................................................................... 177
4.2 Methods ................................................................................................. 179
4.2.1 Ethical issues .................................................................................... 179
4.2.2 Participants ....................................................................................... 180
4.2.3 Criteria for compliance ...................................................................... 180
4.2.4 Data extraction .................................................................................. 182
4.2.5 Data analysis .................................................................................... 182
4.3 Results ................................................................................................... 185
4.3.1 Patient characteristics ....................................................................... 185

10
4.3.2 Overall frequency of vital sign recording............................................ 185
4.3.3 Accuracy and completeness of PTTS scoring ................................... 188
4.3.4 PTTS monitoring for individual patients ............................................. 197
4.3.5 Frequency of vital sign parameter recording in the hours before the
critical deterioration event ............................................................................. 201
4.3.6 Compliance to PTTS monitoring protocol .......................................... 204
4.3.7 Compliance to the PTTS escalation protocol ..................................... 208
4.3.8 Overall compliance to the protocol. ................................................... 216
4.4 Discussion ............................................................................................. 217
4.4.1 Limitations of the study ..................................................................... 223
4.5 Conclusion ............................................................................................. 223
Chapter 5 Utility: the experiences of children and young people, their
families and nursing staff of vital sign observation recording and use of
a paediatric track and trigger system .................................................... 225
5.1 Introduction ........................................................................................... 225
5.1.1 Background ....................................................................................... 225
5.2 Aim ......................................................................................................... 226
5.2.1 Principle research questions to be addressed ................................... 226
5.3 Methods ................................................................................................. 227
5.3.1 Study design and rationale ................................................................ 227
5.3.2 Sampling strategy ............................................................................. 229
5.3.3 Inclusion and exclusion criteria ......................................................... 230
5.3.4 Ethical issues .................................................................................... 230
5.3.5 Data collection procedures ................................................................ 232
5.3.6 Data analysis .................................................................................... 235
5.4 Results ................................................................................................... 238
5.5 Findings ................................................................................................. 239
5.5.1 Benefits and burdens ........................................................................ 241
5.5.2 Watchfulness and wisdom ................................................................ 252
5.5.3 Collaboration and conflict .................................................................. 259
5.6 Discussion ............................................................................................. 268
5.6.1 Limitations ......................................................................................... 272
5.6.2 Strengths .......................................................................................... 273
5.7 Conclusion ............................................................................................. 274

11
Chapter 6 Discussion ............................................................................ 275
6.1 Introduction ........................................................................................... 275
6.1.1 Research objectives .......................................................................... 275
6.1.2 Summary of the main findings ........................................................... 275
6.1.3 Original contribution of this thesis...................................................... 277
6.2 Supporting and conflicting findings across the four studies ............. 278
6.2.1 Recording of vital sign observations and paediatric track and trigger
system scores ............................................................................................... 278
6.2.2 Escalation of elevated paediatric track and trigger system scores ..... 279
6.2.3 Errors in paediatric track and trigger system scores .......................... 280
6.3 Strengths of the thesis .......................................................................... 281
6.4 Limitations of the thesis ....................................................................... 282
6.5 Dissemination of findings ..................................................................... 283
6.6 Implementation of findings into clinical practice ................................ 283
6.7 Implications for clinical practice .......................................................... 284
6.7.1 Core element: Recognising deterioration .......................................... 284
6.7.2 Core element: Responding to deterioration ....................................... 285
6.7.3 Core element: Partnership with patients and family ........................... 285
6.7.4 Core element: Open and consistent learning .................................... 286
6.7.5 Core element: Education and training ............................................... 286
6.7.6 Core element: Patient safety culture ................................................. 287
6.8 Implications for research ...................................................................... 287
6.9 Conclusion ............................................................................................. 288
References................................................................................................ 289

12
Tables
Table 1.1 UK childhood deaths in 2014 ................................................................. 22
Table 1.2 Comparison of characteristics of ward and intensive care non-survivors in
a single centre tertiary children’s hospital ....................................................... 25
Table 1.3 Source of admissions to PICU 2012-2014 .............................................. 28
Table 1.4 Diagnostic group at admission to PICU 2012-2014 ................................ 30
Table 1.5 Core elements of the safe system framework......................................... 35
Table 1.6 Frequency of the component parameters reported by the 31 hospitals
using an early identification system in 2005 ................................................... 41
Table 1.7 Origin of systems ................................................................................... 42
Table 1.8 Comparison of trigger and scoring systems reported by NICE ............... 46
Table 2.1 Multi-dimensional model of clinical utility ................................................ 59
Table 2.2 Major findings of the initial systematic review ......................................... 60
Table 2.3 GRADE quality definitions ...................................................................... 64
Table 2.4 PICOS criteria for the systematic review ................................................ 66
Table 2.5 Patient important outcomes .................................................................... 67
Table 2.6 Overview of included studies, key characteristics and parameters ......... 77
Table 2.7 Vital sign thresholds within PTTS ........................................................... 86
Table 2.8 Additional guidance for vital sign thresholds ........................................... 91
Table 2.9 Evidence profile of PTTS as a single intervention ................................ 103
Table 2.10 Evidence profile for PTTS as part of a package of interventions......... 111
Table 2.11 Studies reporting predictive performance ........................................... 122
Table 2.12 Studies reporting inter-rater reliability ................................................. 127
Table 2.13 Studies reporting acceptability to staff ................................................ 129
Table 3.1 Conditions constituting critical deterioration ......................................... 141
Table 3.2 Data extraction criteria ......................................................................... 143
Table 3.3 Framework to identify the appropriate percentile value (healthy children)
to be applied to the respiratory and heart rate parameter score dependent on
the PTTS weighting framework .................................................................... 146
Table 3.4 Framework to identify the appropriate percentile value (hospitalised
children) to be applied to the respiratory and heart rate parameter score
dependent on the PTTS weighting framework .............................................. 147
Table 3.5 Key characteristics and parameters of the PTTS ................................. 151
Table 3.6 Patient characteristics (each patient episode) ...................................... 156
Table 3.7 Comparative performance against the CEWS for scoring systems ....... 159

13
Table 3.8 Comparative performance against the CEWS for trigger systems ........ 160
Table 3.9 Comparative performance of PTTS scoring systems against the highest
AUROC-ranked PTTS .................................................................................. 162
Table 3.10 Comparative performance of PTTS trigger systems against the highest
AUROC-ranked PTTS .................................................................................. 163
Table 3.11 Modification of trigger system to score-based system ........................ 164
Table 3.12 Performance at optimal score ............................................................ 166
Table 3.13 Performance of modified PTTS .......................................................... 170
Table 4.1 The proportion of observation sets with an under and over-scoring error
expressed as a percentage of the total observation sets of cases and controls
.................................................................................................................... 193
Table 4.2 The prevalence of errors and missing PTTS scores for low, medium and
high scores .................................................................................................. 194
Table 4.3 Cases and controls achieving compliance to vital sign parameter
monitoring protocol over 48-hour study period and within the last 12 hours
before the critical deterioration event ........................................................... 204
Table 4.4 Cases and controls achieving compliance to individual elements of the
PTTS score protocol for the 48-hour study period and the final 12-hours of data
collection ...................................................................................................... 206
Table 4.5 Compliance to documenting the monitoring plan over the 48-hour study
period and in the final 12-hours of data collection ........................................ 207
Table 4.6 Overall compliance to PTTS monitoring standards ............................... 208
Table 4.7 Compliance to escalation protocol for the first recorded PTTS value of two
in the 48-hour study period and final 12 hours of data collection .................. 209
Table 4.8 Compliance to escalation protocol for the first recorded PTTS value of
three in the 48-hour study period and final 12 hours of data collection ......... 211
Table 4.9 Compliance to escalation protocol for the first recorded PTTS value of four
in the 48-hour study period and final 12 hours of data collection .................. 212
Table 4.10 Compliance to escalation protocol for the first recorded PTTS value of
five or more in the 48-hour study period and final 12 hours of data collection213
Table 4.11 Overall compliance to escalation protocol over the 48-hour study period
and final 12 hours of data collection ............................................................. 216
Table 4.12 Overall compliance to monitoring and escalation protocol over the 48-
hour study period and final 12 hours of data collection ................................. 217

14
Figures
Figure 1.1 Smoothed child mortality rates by year and age group, UK 1980-2010 . 23
Figure 1.2 Causes of death by age of children and young people in the UK in 2012
...................................................................................................................... 24
Figure 1.3 Pathways to cardiac arrest in children ................................................... 27
Figure 1.4 Source of admissions to PICU 2012-2014 ............................................ 29
Figure 1.5 Safe system framework for hospitalised children .................................. 34
Figure 1.6: The Royal Alexandra Children's Hospital Paediatric Early Warning Score
...................................................................................................................... 38
Figure 1.7 Criteria for activation of the medical emergency team ........................... 40
Figure 1.8 Example of a simple escalation algorithm to accompany a scoring system
...................................................................................................................... 44
Figure 1.9 Example of a complex algorithm for a scoring system ........................... 45
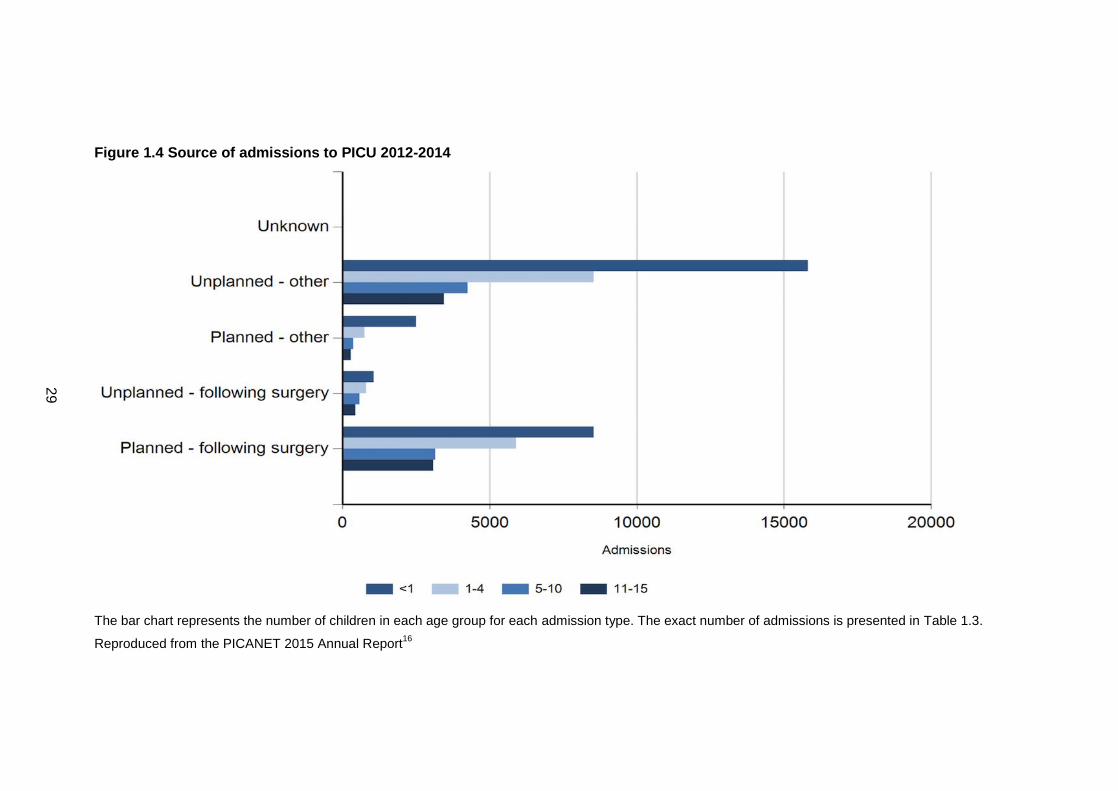
Figure 2.1 Summary of the GRADE approach to quality assessment .................... 65
Figure 2.2 Data extracted ...................................................................................... 69
Figure 2.3 Search results ....................................................................................... 71
Figure 2.4 Number of publications per year (cumulative) ....................................... 72
Figure 2.5 Country in which the study was conducted ........................................... 73
Figure 2.6 Year of first publication of identified PTTS ............................................ 74
Figure 2.7 Frequency of score and trigger based systems with one, four and five
differing age-categories .................................................................................. 76
Figure 2.8 Percentile values for heart rate ............................................................. 93
Figure 2.9 Example of heart rate thresholds for a score-based PTTS .................... 93
Figure 2.10 Comparison of heart rate thresholds within PTTS scoring systems to
validated reference ranges ............................................................................. 95
Figure 2.11 Comparison of heart rate thresholds within PTTS trigger systems to
validated reference ranges ............................................................................. 96
Figure 2.12 Comparison of recommendations for normal heart rate thresholds within
PTTS scoring systems to validated reference ranges..................................... 97
Figure 2.13 Comparison of respiratory rate thresholds within PTTS scoring systems
to validated reference ranges ......................................................................... 99
Figure 2.14 Comparison of respiratory rate thresholds within PTTS trigger systems
to validated reference ranges ....................................................................... 100

15
Figure 2.15 Comparison of recommendations for normal respiratory rate thresholds
within PTTS scoring systems to validated reference ranges......................... 101
Figure 3.1 Comparison of the receiver operator characteristic curve of the highest
performing PTTS and the local PTTS ........................................................... 161
Figure 4.1 Proportion of observation sets with a value recorded for AVPU, heart
rate, oxygen saturation, respiratory rate, systolic blood pressure and
temperature for cases and controls .............................................................. 186
Figure 4.2 Frequency of component vital signs parameters documentation during
the day and night-time .................................................................................. 187
Figure 4.3 Correct, incorrect and missing PTTS scores (all patients) ................... 190
Figure 4.4 Correct, incorrect and missing PTTS scores (case patients) ............... 191
Figure 4.5 Correct, incorrect and missing PTTS scores (control patients) ............ 192
Figure 4.6 Reason for PTTS inaccurate scores ................................................... 195
Figure 4.7 Direction and potential impact of inaccurate scores ............................ 197
Figure 4.8 Proportion of patients with a vital sign parameter recorded for each hour
of the day ..................................................................................................... 198
Figure 4.9 Proportion of case patients with a vital sign parameter recording by hour
of the day ..................................................................................................... 199
Figure 4.10 Proportion of control patients with a vital sign parameter recording by
hour of the day ............................................................................................. 199
Figure 4.11 All observation sets of cases and controls: weekends versus weekdays
.................................................................................................................... 200
Figure 4.12 Complete observation sets of cases and controls: weekends versus
weekdays ..................................................................................................... 201
Figure 4.13 Recording of component vital signs in case patients in the hours before
the critical deterioration event ...................................................................... 202
Figure 4.14 Recording of component vital sign in control patients in the
corresponding hours to time zero (critical deterioration event in cases) ....... 202
Figure 4.15 Complete and incomplete observation sets of cases and controls in the
hours before the event ................................................................................. 203
Figure 5.1 An example of the vital sign monitoring equipment provided during
interviews ..................................................................................................... 234
Figure 5.2 Initial sub-themes identified from the data ........................................... 238
Figure 5.3 Diagrammatic representation of main themes and sub-themes ........... 240

16
Appendices
Appendix 1 Modification of PTTS published age-ranges to facilitate
comparative analysis ............................................................................... 312
Appendix 2 Children's Early Warning Score (CEWS)......................... 316
Appendix 2.1 Thresholds for CEWS ........................................................... 316
Appendix 2.2 Example of CEWS chart for infant under one year ............... 317
Appendix 3 The Children's Early Warning Score escalation
algorithm……. .......................................................................................... 318
Appendix 4 Search strategy ................................................................. 319
Appendix 4.1 AMED: 27th May 2016 .......................................................... 319
Appendix 4.2 CINAHL Plus: 27th May 2016 ............................................... 320
Appendix 4.3 Cochrane: 27th May 2016 .................................................... 320
Appendix 4.4 Embase search: 27th May 2016 ........................................... 321
Appendix 4.5 OVID medline: 27th May 2016 ............................................. 322
Appendix 5 Quality assessment .......................................................... 323
Appendix 5.1 Diagnostic testing studies ..................................................... 323
Appendix 5.2 Observational studies ........................................................... 324
Appendix 5.3 Qualitative studies ................................................................ 326
Appendix 6 Research Ethics Committee permission ......................... 327
Appendix 7 Information leaflets ........................................................... 331
Appendix 7.1 Leaflet for children aged four to eight years .......................... 331
Appendix 7.2 Leaflet for children/young people over the age of eight years 332
Appendix 7.3 Leaflet for families ................................................................ 333
Appendix 8 Consent forms ................................................................... 334
Appendix 8.1 Parent/guardian of chid/young person participants ............... 334
Appendix 8.2 Assent form for children and young people .......................... 335
Appendix 8.3 Parent/guardian participants ................................................. 336
Appendix 8.4 Focus group participants ...................................................... 337
Appendix 9 Interview and focus group question schedules ............. 338
Appendix 9.1 Interview schedule: younger children ................................... 338
Appendix 9.2 Interview schedule: older children ........................................ 339

17
Appendix 9.3 Interview schedule: parents .................................................. 341
Appendix 9.4 Focus group questions: ........................................................ 343
Appendix 10 Framework for qualitative analysis ............................... 344
Appendix 11 Participants ..................................................................... 345
Appendix 11.1 Child participants ................................................................ 345
Appendix 11.2 Characteristics of parent/guardian participants ................... 347
Appendix 11.3 Focus group participants .................................................... 350
Appendix 12 Publications, presentations and abstracts ................... 351
Appendix 12.1 Publications ........................................................................ 351
Appendix 12.2 Presentations ..................................................................... 351

18
Abbreviations
Abbreviation In full
AUROC Area under the Receiver Operator Characteristic Curve
AVPU Alert-Voice-Pain-Unresponsive
BP Blood pressure
CEWS Children’s Early Warning Score
CI Confidence interval
CPAP Continuous positive airways pressure
GRADE Grading of Recommendations Assessment, Development, and Evaluation
HDU High Dependency Unit
ICU Intensive Care Unit
IQR Interquartile range
LTV Long-term ventilation
MET Medical Emergency Team
NEWS National Early Warning System
NICE National Institute for Health and Care Excellence
NPV Negative Predictive Value
PEW Paediatric Early Warning
PEWS Paediatric Early Warning System
PICU Paediatric Intensive Care Unit
PPV Positive Predictive Value
PTTS Paediatric Track and Trigger System
ROC Receiver Operator Characteristic Curve
RR Relative Risk
RRT Rapid Response Team

19
Abbreviation In full
SBP Systolic blood pressure
SPSS Statistical Package for the Social Sciences
WHO World Health Organisation

20
Chapter 1 Introduction
1.1 Overview
More than 3000 children and young people between the ages of one month and 18
years die each year in the United Kingdom (UK).1 Although the death of a child
remains a relatively rare event in the UK, each represents an individual tragedy for
those involved. That tragedy is exacerbated if the death was preventable. Most
childhood deaths occur in hospital.2 A confidential enquiry into childhood deaths
found that 21% of hospital deaths had avoidable factors with 49% assessed as
having potentially avoidable factors.3 The most significant recurrent avoidable factor
was the failure to recognise serious illness.1
Recognising and responding to serious illness in childhood is one of the most
important clinical skills for nurses and other health professionals, however
identification of critical illness in children is complex. It requires the clinician to take a
clear and full history, appropriately assess and examine the child and effectively
communicate with children/young people, their families and other members of the
multidisciplinary team. This requires training, experience and good judgment.3
To assist clinicians in the early identification of childhood critical illness,
standardised monitoring systems have been developed. These paediatric track and
trigger systems (PTTS) aim to alert staff to patients at risk of critical illness through
uniform monitoring of vital signs and other clinical indicators linked to a risk
assessment.4 Their use has been recommended by a number of national bodies3,5,6
despite only weak evidence that they improve outcomes.
Although PTTS would intuitively seem to be a good thing, relatively little is known
about their ‘real world’ performance, reliability and utility. Purported as a ‘panacea’
they have not, as yet, delivered the expected benefits. The reasons for this are
complex. We do not know which PTTS might be best for which children in which
setting. We are unsure whether PTTS are used effectively and the effect this may
have on their accuracy. We are also uncertain whether they are valued and trusted
by the staff they were designed to assist. Despite a drive towards involving
children/young people and their families in their care there is little evidence of their
views on PTTS having been sought. This thesis aims to explore some of these
factors.

21
This thesis makes a number of original contributions to the evidence base:
1. A systematic review of published PTTS which highlighted 33 differing PTTS
with variable validity and reliability
2. A pooled analysis of published PTTS which identified very low level evidence
for PTTS implementation and moderate to low evidence for PTTS
implementation as part of a package of interventions such as a rapid
response system
3. A comparative analysis of validity (as assessed by the area under the
receiver operator characteristic curve) which identified significant differences
in the performance of published PTTS
4. A comparative analysis of validity which identified that modifying published
PTTS with percentile-derived vital sign thresholds does not significantly
improve the performance of the best performing systems
5. An evaluation of nursing practice which identified that only 35.9% of
observation sets had simultaneous recording of the six components required
to calculate the local PTTS score
6. An evaluation of nursing practice which identified that 7.3% of observation
sets had no recorded local PTTS value and 19.6% had a local PTTS value
which was incorrect
7. An assessment of adherence to the local PTTS monitoring and escalation
protocol using an ‘all or nothing’ approach which identified that no case
patients and only 6.4% of controls fully adhered to the protocol
8. A qualitative study with junior and senior nurses, parents and children and
young people to elicit their perceptions and experiences of in-patient vital
sign monitoring and the use of PTTS

22
1.2 Background
1.2.1 Childhood mortality in the UK
In 2014 3868 children between the ages of one month and 15 years died in the UK.7
The majority (2,842) died within the first year of life (Table 1.1).
Table 1.1 UK childhood deaths in 2014
*Data for infants (28 days -1 year of age) are presented as deaths per 1000 live births
Reproduced from Office for National Statistics7
Overall childhood mortality is declining (Figure 1.1). From 1980-2010 all cause
mortality fell by 50-70% across the UK.8 A similar reduction in the rate of death was
seen in both younger (1-9 year olds) and older (10-18 year olds) children and young
people.
The cause of death varies by age (Figure 1.2). Preterm birth has been
demonstrated to contribute to mortality outside of the neonatal period.8 For 1-4 year
olds injuries and poisoning (‘external causes’ – 15%), cancer (15%) and congenital
conditions (14%) were the most common cause of death. From five to nine years,
injuries and poisoning (15%), cancer (15%) and congenital causes were most
prevalent. Disorders of the nervous system (11%), respiratory conditions (11%) and
infections (9%) were also common. Injuries and poisonings (24%), and cancer
(24%) were the most frequent cause of death in older children/young people aged
10-14 years, and accounted for almost half of deaths overall. Deaths due to
disorders of the nervous system and developmental conditions were also common
(14%). Although childhood mortality has fallen and continues to fall, the UK lags
behind other developed countries both in Europe and wider afield. The reasons for
this are uncertain.
Age in years
Infant 1-4 years 5-9 years 10-14
Deaths 2,842 442 294 290
Deaths per 100,000
population of the same age
3.7 * 14 8 8

23
Figure 1.1 Smoothed child mortality rates by year and age group, UK 1980-2010
Mortality is presented as deaths per 100,000 population of the same age.
Reproduced from Office for National Statistics7

24
Figure 1.2 Causes of death by age of children and young people in the UK in 2012
Adapted from Royal College of Paediatrics and Child Health9

25
1.2.2 In-hospital childhood mortality
A significant proportion of children who die do so in the hospital environment. Some
deaths are expected with children/young people and families working in partnership
with palliative care professionals. However many children/young people are still
receiving active treatment or being cared for within the intensive care environment
at the time of their death.
In the UK the majority of paediatric in-hospital deaths appear to occur within
intensive care. A study of the characteristics of death in a tertiary paediatric hospital
identified that 85.7% occurred in the intensive care setting, with only 14.3% on
wards outside of PICU.2 Infants account for 57.7%, reflective of the national picture
of childhood death.
The picture differed for deaths inside and outside of intensive care (Table 1.2). Most
children who died in intensive care were less than one year of age, whilst the
majority on the ward were aged 1-14 years. Congenital malformations (21.9%),
perinatal disease (20.8%) and cardiovascular causes (16.4%) were the most
prevalent cause of death within intensive care, whilst neoplasms (37.3%) and
congenital malformations (23.6%) accounted for over half of the deaths of children
in the ward. Whilst most deaths on the ward are anticipated, some follow acute
events leading to cardiac arrest.
Table 1.2 Comparison of characteristics of ward and intensive care non-survivors in a single centre tertiary children’s hospital
Characteristic Intensive Care
n (%)
Ward
n (%)
Age group
Newborn (<28 days) 282 (29.2) 0 (0)
Infant (1 – 12 months) 304 (31.45) 64 (39.7)
Child (1-14 years) 322 (33.3) 85 (52.8)
Young adults (>14 years) 58 (6.0) 12 (7.5)

26
Characteristic Intensive Care
n (%)
Ward
n (%)
Diagnostic category
Congenital malformation 212 (21.9) 38 (23.6)
Cardiovascular 158 (16.4) 11 (6.8)
Gastroenterology 18 (1.9) 10 (6.2)
Infections 43 (4.5) 3 (1.9)
Injury/poisonings 82 (8.5) 4 (2.5)
Metabolic disorders 25 (2.6) 12 (7.5)
Neoplasms 81 (8.4) 60 (37.3)
Neurological 68 (7.0) 15 (9.3)
Perinatal diseases 201 (20.8) 0 (0)
Respiratory 72 (7.5) 6 (3.7)
Other 6 (0.6) 2 (1.2)
Total 966 (100) 161 (100)
Deaths in each age-group and diagnostic category are presented as a proportion of the total
number of deaths in intensive care and the ward.
Reproduced from Ramnarayan et al 20072
1.2.3 Aetiology of cardiac arrest in hospitalised children
Cardiac arrest in children in hospital wards is relatively rare at 0.1-20/1000
children.10 Survival to hospital discharge varies from 27-50% and is often associated
with significant morbidity.10 Emphasis has traditionally been on education and
training in cardiopulmonary resuscitation, but evidence indicates that even with
optimal resuscitation and post-resuscitation care, there remains significant mortality
and morbidity associated with cardiopulmonary arrest.11,12 Prevention is now seen
as the best strategy.10,13

27
The causes of cardiorespiratory arrest in children differ from those in adults. In
adults events are more likely to arise from cardiac arrhythmias, where the
cardiorespiratory arrest is the primary event. By contrast most paediatric events are
secondary events arising from decompensated respiratory or circulatory failure
(Figure 1.3). They are often preceded by significant periods of physiological
instability which is either not recognised or inadequately treated. As such,
occurrence of cardiorespiratory arrest in a non-monitored unit has been proposed as
a potentially avoidable event.14
Figure 1.3 Pathways to cardiac arrest in children
Figure represents the differing aetiologies leading to respiratory and circulatory failure in children.
Reproduced from Advanced Paediatric Life Support Manual15
1.2.4 The role of intensive care
The Paediatric Intensive Care Unit (PICU) facilitates a higher level of monitoring and
intervention than is available on a normal ward. Many children and young people
require life-sustaining support by way of mechanical ventilation, drugs to support the
cardiovascular system and other complex therapies. The overall aim is to prevent
death and adverse events such as cardiopulmonary arrest. However for PICU to

28
provide the most benefit, children at risk of cardiopulmonary arrest need to be
identified and transferred sufficiently early to facilitate treatment.
Between 2012 and 2014 59,637 children were admitted to PICU in the UK and
Ireland (Table 1.3 and Figure 1.4). Almost half (27,949, 47%) were under one year
of age and a third of those children were less than one month old at admission
(9382, 34%). Around a third of children were admitted electively following surgery
(20662, 34.6%) with a smaller proportion admitted as a planned event (3912, 6.6%).
However the majority of children were admitted as an emergency, either following
deterioration in their condition (32054, 53.7%) or following a surgical procedure
(2895, 4.9%).
Table 1.3 Source of admissions to PICU 2012-2014
Admission
type
Age in years
<1 1-4 5-10 11-15 Total
n % n % n % n % n %
Unplanned (other)
15817 (49.3) 8530 (26.6) 4260 (13.3) 3447 (10.8) 32054 (53.7)
Planned (following surgery)
8529 (41.3) 5899 (28.5) 3155 (15.3) 3079 (14.9) 20662 (34.6)
Planned (other) 2503 (63.9) 745 (19.0) 375 (9.6) 289 (7.4) 3912 (6.6)
Unplanned (following surgery)
1065 (36.8) 808 (27.9) 580 (20.0) 442 (15.3) 2895 (4.9)
Unknown 35 (30.7) 40 (35.1) 18 (15.8) 21 (18.4) 114 (0.2)
Total 27949 (46.9) 16022 (26.9) 8388 (14.1) 7278 (12.2) 59637 (100.0)
Table is reproduced from data submitted to the UK Paediatric Intensive Care Audit Network
(PICANet)16
The unshaded area presents the number of children in each age group for each admission
type and percentages are presented for each age band separately.
Percentages in the total column represent the proportion of total admissions of each
admission type
29
Figure 1.4 Source of admissions to PICU 2012-2014
The bar chart represents the number of children in each age group for each admission type. The exact number of admissions is presented in Table 1.3.
Reproduced from the PICANET 2015 Annual Report16

30
Reason for admission to PICU varies across age group (Table 1.4). For infants
cardiovascular problems, primarily from congenital heart disease are the most
common reason followed by gastro-intestinal diseases. Respiratory disease is the
most prevalent diagnostic group for children aged 1-10 years. Musculo-skeletal
disorders associated with trauma are most common in older children.
Table 1.4 Diagnostic group at admission to PICU 2012-2014
Diagnostic group
Age group (years)
<1 1-4 5-10 11-15 Total
n % n % n % n % n %
Blood / lymphatic 102 (18.8) 169 (31.1) 154 (28.4) 118 (21.7) 543 (0.9)
Body wall and cavities
880 (85.0) 106 (10.2) 29 (2.8) 20 (1.9) 1035 (1.7)
Cardio-vascular 10817 (61.6) 3839 (21.8) 1810 (10.3) 1105 (6.3) 17571 (29.5)
Endocrine / metabolic
501 (34.5) 394 (27.1) 248 (17.1) 309 (21.3) 1452 (2.4)
Gastro-intestinal 2109 (59.6) 672 (19.0) 385 (10.9) 371 (10.5) 3537 (5.9)
Infection 1450 (49.2) 851 (28.9) 358 (12.2) 287 (9.7) 2946 (4.9)
Multisystem 119 (57.2) 50 (24.0) 22 (10.6) 17 (8.2) 208 (0.3)
Musculo-skeletal 178 (6.9) 455 (17.5) 487 (18.8) 1475 (56.8) 2595 (4.4)
Neurological 1640 (26.4) 2294 (36.9) 1390 (22.3) 898 (14.4) 6222 (10.4)
Oncology 308 (15.2) 721 (35.7) 597 (29.5) 394 (19.5) 2020 (3.4)
Respiratory 8582 (51.2) 4959 (29.6) 1979 (11.8) 1228 (7.3) 16748 (28.1)
Trauma 120 (8.9) 452 (33.4) 375 (27.7) 408 (30.1) 1355 (2.3)
Other 1101 (33.8) 1005 (30.8) 522 (16.0) 630 (19.3) 3258 (5.5)
Unknown 42 (28.2) 55 (36.9) 32 (21.5) 18 (12.1) 147 (0.2)
Total 27949 (46.9) 16022 (26.9) 8388 (14.1) 7278 (12.2) 59637 (100)
Table is reproduced from data submitted to the UK Paediatric Intensive Care Audit Network
(PICANet).16
The unshaded area presents the number of children in each age group for each diagnostic
group and percentages are presented for each age band separately.
Percentages in the total column represent the proportion of total admissions of each
diagnostic group.

31
Recent research has highlighted that children and young people admitted to PICU
from the ward have a worse outcome than patients admitted from the accident and
emergency unit.17 They also stay longer in PICU. It has therefore been suggested
that strategies to reduce PICU mortality need to be targeted at admissions from
hospital wards. Compelling evidence from retrospective reviews of adults indicates
that sub-optimal care before transfer to intensive care is frequent.18-28
1.2.4.1 Sub-optimal care of hospitalised adults
The use of track and trigger systems for adults was driven by several retrospective
reviews of the quality of care before cardiac arrest and unplanned transfer to
intensive care. All identified significant and often prolonged periods of physiological
instability which were either not recognised or poorly managed.18-25 A confidential
enquiry into the quality of care before unplanned admission to intensive care
considered that just 20% of adults were well managed. Significant deficiencies were
identified in 54% of cases with the failure to appreciate the severity of the patient’s
condition and failure to escalate to a senior clinician identified as major contributing
factors. Suboptimal care was considered to have contributed to morbidity or
mortality in most cases.26
A UK study of 317 adults dying unexpectedly on hospital wards or after unplanned
admission to intensive care also identified failures in care. Of the patients dying
following failed resuscitation, 65% were considered avoidable. Eighty-six patients
were admitted as an emergency to intensive care. In 31 cases (36%) the
management before intensive care was considered sub-optimal due to non-
recognition of deterioration (12 cases) or inappropriate treatment (19 cases).
Mortality in intensive care (52% vs 35%) and hospital (65 vs 42%) was significantly
higher in the poorly managed group (p<.0001).27
A subsequent national confidential enquiry into the management of adult acute
medical patients yielded similar findings.28 Of patients transferred to intensive care
65% exhibited physiological instability for more than 12 hours. The report
recommended the use of track and trigger systems for all in-patients.
1.2.5 Sub-optimal care of hospitalised children
The research on sub-optimal care in paediatrics is much less developed. A six-year
review of 1612 records of children who died, had an unplanned admission to PICU
and were referred for specific review identified 325 adverse events (20.2%).

32
Although the nature of the adverse events was not reported in detail, training in
acute paediatric life support and the recognition of septic shock, together with the
introduction of a medical emergency team, were key interventions resulting from the
review.29
Research in paediatrics has largely focused on the management of sepsis. A case
note review of 47 children who died following PICU admission assessed the
occurrence of critical incidents (undesirable events which could/did to lead to patient
harm but did not contribute to death) and adverse events (undesirable events which
contributed to death).30 There were 37 critical incidents in 28 cases and 22 adverse
events in 17 children. Adverse events included the failure to recognise and manage
acute illness. Most deficiencies in care occurred in hospital wards, prior to PICU
transfer.
A study in 2005 of children with meningococcal disease compared the management
of 143 children who died with that of 355 who survived.31 Failure to recognise
complications, failure to appreciate disease severity, failure in supervision, lack of
involvement of a paediatric team in care and inadequacies of fluid and inotrope
administration were all significantly associated with death. Vital signs were often
inadequately documented and signs of shock were not recognised. In particular, the
review highlighted that age-appropriate values for vital signs were not appreciated,
with extreme values for pulse and respiratory rate recorded but not acted upon. A
later study in 2010 of children who died from severe bacterial infection also
identified sub-optimal care in 76% of cases.32 The failure to appreciate the severity
of the disease and failure to recognise the signs of shock were again cited.
A landmark confidential enquiry in 2008 identified significant avoidable factors
associated with the death of children.3 A detailed review was undertaken in 89
cases where the death occurred in hospital. Whilst most deaths occurred in the
PICU (25%) or other critical care setting (10%) a significant proportion were found in
the general ward or adolescent unit (25%). Avoidable factors, such as the failure to
recognise clear indicators of meningitis, were found in 19 (21%) cases. Potentially
avoidable factors were found in 44 (49%). Avoidable factors were found more
frequently in children who did not have a life-limiting illness. In only 26 (29%) of the
cases was the death considered to be unavoidable. The recognition of the severity
of illness, including the failure to examine or interpret clinical signs (including vital
signs) correctly was highlighted as an area of particular concern. This led the

33
authors to recommend a standardised and rational monitoring system with an
embedded early identification system to assist with the detection of developing
critical illness for paediatric care in hospital. The authors identified this identification
system as an early warning score.
A subsequent confidential enquiry into the care of children who died following
surgery in 20116 also made recommendations regarding PTTS. Although they
identified that 56.4% of hospitals (155/275) were using a PTTS, they highlighted
concern about the number of hospitals that did not have a policy for identifying sick
children or a resuscitation policy for children. Again the use of a PTTS was
recommended as standard practice, however the report also recommended that the
National Institute for Health and Clinical Excellence (NICE) should develop guidance
on the recognition and response to the seriously ill child in hospital. To date this has
not been addressed.
1.2.6 A safe system to improve in-hospital mortality
There is increasing recognition that identifying and managing clinical deterioration is
complex. It relies on multiple component factors which are inter-linked and inter-
dependent. Recently a framework has been proposed by the Royal College of
Paediatrics and Child Health (RCPCH) and NHS Improvement.33 This ‘safe system’
is has six core elements but also acknowledges the groups of individuals who
influence or contribute to safe management of the deteriorating child. Whilst the
infant, child or young person is at the centre they are surrounded by their family and
carers, clinicians, the wider clinical team, the service or organisation where they are
currently based and regional and national networks of individuals and organisations
that influence care delivery. The safe system framework can be seen at Figure 1.5.

34
Figure 1.5 Safe system framework for hospitalised children
Reproduced from NHS Improvement and RCPCH33
The safe system framework has six core elements, each focusing on a particular
aspect of the system. These core elements describe the essential components of a
safe system and are described in Table 1.5.

35
Table 1.5 Core elements of the safe system framework
Core Element Safe System Framework Description
Patient safety culture A large and challenging element covering many of the aspects including a commitment to overall improvement in patient safety, prioritising safety, leadership and executive accountability, and monitoring and measuring patient safety
Partnership with patients and their family
While all the core elements focus on the patient and family, this partnership is an area of increased growth and central to supporting all the others
Recognising deterioration
The ability to spot physiological deviations before significant changes in care are required or harm occurs is a fundamental working element that is central to the system
Responding to deterioration
Ensuring a timely and accurate response encompassing all necessary support and treatment from all those involved in the care of the patient is the vital element that is often the key change required
Open and consistent learning
Consideration of the system errors and individual responsibility, recording, investigating and evaluating incidents as well as best practice in order to learn and effect change will drive forward continual improvements in all elements
Education and training Consistently building clinical knowledge and capability as well as patient safety and improvement methods will provide the foundation for all elements to be enhanced
Adapted from the RCPCH and NHS Improvement Safe System Framework33
Of particular relevance to this thesis are recognising deterioration, responding to
deterioration and partnership with patients and families, however education and
training, open and consistent learning and patient safety culture are also key factors
in successful management of the deteriorating child.
1.2.7 Evolution of track and trigger systems
In the late 1990’s a small but significant body of research challenged the widely held
belief that critical deterioration events in adults were unpredictable and therefore
unpreventable. Periods of physiological instability were demonstrated to occur for
many hours before critical deterioration events, such as unplanned admission to

36
intensive care, cardiac arrest and unexpected death.21,22,25-27 This physiological
instability was often identified through the routine monitoring of vital signs but was
either overlooked or inadequately treated by healthcare staff.
Track and trigger systems evolved to assist staff in detecting developing critical
illness. The first system was developed in Australia as part of a wider system to
facilitate rapid access to critical care within the ward environment.34 Selected vital
signs and other clinical indicators were periodically monitored and when thresholds
for abnormal values were breeched, this ‘triggered’ the member of staff to activate a
specialist team of critical care clinicians known as the ‘rapid response team’.
More sophisticated systems were subsequently developed incorporating a scoring
matrix. Scores were assigned based on the degree of abnormality of the clinical
sign, with higher scores indicating greater physiological abnormality. These scores
were then aggregated to produce a single numerical value, generally referred to as
the early warning score. Positive scores indicate patients at risk of deterioration,
with higher scores associated with increasing risk.35
A variety of systems then developed, with differing names such as early warning
scores, early warning systems, alert criteria, activation criteria and trigger criteria.
However they shared two common characteristics: the ability to ‘track’ the patient’s
progress through monitoring of selected vital signs and the ability to ‘trigger’ a
response when predetermined criteria were met. The term track and trigger system
was subsequently adopted to include these related but differing systems.36,37 Track
and trigger systems were often associated with specialist teams who were also
known by a variety of names: critical care outreach, patient at risk, rapid response
team, rapid response system and medical emergency team.
Track and trigger systems are now routinely used to monitor all hospitalised adults
in the UK following recommendations by NICE.37 Despite their widespread use,
studies of track and trigger systems have failed to demonstrate a significant impact
on patient outcomes in the adult population.36,38

37
1.2.8 Paediatric track and trigger systems
1.2.8.1 The first paediatric track and trigger system
The first reported PTTS for hospitalised children, the Paediatric Early Warning
Score,39 was published in 2005. The system was developed at the Royal Alexandra
Hospital for Sick Children in Brighton, UK.
In February 2001 a working group was established at the Royal Alexandra Hospital
to investigate the feasibility of extending the existing adult critical care outreach to
children. By October 2001, a pilot was underway. Initially ward staff referred children
about whom they had concerns, and the team, including staff from PICU, attended.
However ward staff reported feeling deskilled, undermined and undervalued.
Focus shifted to implementing mechanisms to assist staff in the early identification
of the deteriorating child. No paediatric-specific system could be identified from the
literature so the working group adapted the existing adult system. Because a system
based solely on vital signs would require different versions to address age-
appropriate values, three main indicators were adopted: behavior, cardiovascular
and respiratory status. Specific thresholds for vital signs were not provided. The
system is shown in Figure 1.6.

38
Figure 1.6: The Royal Alexandra Children's Hospital Paediatric Early Warning Score
0 1 2 3
Behaviour Playing/
appropriate
Sleeping Irritable Lethargic/ confused
Reduce response to
pain
Cardiovascular Pink or
capillary refill 1-
2 seconds
Pale or capillary
refill 3 seconds
Grey or capillary
refill 4 seconds.
Tachycardia of 20
above normal rate
Grey or mottled or
capillary refill 5
seconds or above.
Tachycardia of 30
above normal rate
or bradycardia
Respiratory Within normal
parameters, no
recession or
tracheal tug
>10 above normal
parameters, using
accessory
muscles, 30+%
FiO2 or
4+litres/min
>20 above normal
parameters
recessing,
tracheal tug.
40+% FiO2 or 6+
litres/min
5 below normal
parameters with
sternal recession,
tracheal tug or
grunting. 50% FiO2
or 8+ litres/min
Total score is derived from assessment of behaviour, cardiovascular and respiratory status.
Reproduced from Monaghan 200539
Staff assessed the child against the guidance, assigning a score of zero to three for
each of the three indicators. The total score was then assessed against guidance
which prompted one of five actions:
Continue current care
Inform the nurse in charge
Increase the frequency of the observations
Call for a medical review and inform the outreach team for a score of four
Call the full medical team and outreach team for any score greater than four
Any child who scored in the ‘red’ zone (a score of three in any one indicator) would
also be escalated to the medical and outreach team.

39
Initial feedback on the score was variable, with reports that:
“Some staff could not see why we needed a score as they felt they were quite capable of recognising patients at risk”
(Monaghan, p3539)
Concerns were also raised about the assessment being time-consuming, although
when investigated, completing the early warning score only took 30 seconds over
and above the time taken to record the vital signs.
During the three-month pilot 30 patients scored four, prompting the nurse to request
a review by the medical team. The majority (96%) were seen within 15 minutes. All
required medical intervention, after which 83% improved whilst the remaining 17%
were transferred to the PICU. Children who staff felt should have scored higher
prompted revision of the score to include additional weighting for prolonged post-
operative vomiting.
Subsequent feedback from thirty-three staff on the acute medical and surgical wards
revealed that 80% felt that the score had improved their confidence in recognising a
child at risk of deterioration. Although the author reported that assessment of the
sensitivity of the score was underway, with assessment of inter-rater reliability
planned in the future, no subsequent publications could be identified.
Despite its limited evaluation, the study remains an important milestone, marking the
first publication of PTTS.
1.2.8.2 An alternative approach
On the other side of the world another paediatric hospital was also working to
improve the management of the deteriorating child. The Royal Children’s Hospital in
Melbourne, Australia developed a specialist team to respond to the deteriorating
child known as the Medical Emergency Team or MET.40 The MET could be
activated by clinical staff if any one of nine criteria was present (Figure 1.7). Eight of
the criteria represented clinical indicators and vital signs values associated with
serious illness, but the MET could also be activated if the nurse or doctor was
‘worried’ about the child’s condition. Explicit age-related criteria for vital signs were
specified but unlike the Paediatric Early Warning System no scoring matrix was
used. This ‘trigger’ based approach was simpler and required no mathematical
calculation, but unlike the Paediatric Early Warning Score, the outcome was
dichotomous, with an ‘all or nothing’ response.

40
Figure 1.7 Criteria for activation of the medical emergency team
Fulfillment of any single category would trigger a referral to the medical emergency team.
Reproduced from Tibballs et al 200540

41
1.2.8.3 Subsequent development of paediatric track and trigger systems
Although the first publications on PTTS were in 2005, many hospitals had been
developing and implementing their own local systems. A 2005 survey of 186 UK
hospital trusts identified 144 who were delivering paediatric services.41 Thirty-one of
these (21.5%) reported using a PTTS. Many appeared to be the same or local
adaptions of the Monaghan39 Paediatric Early Warning Score or the subsequently
published Bristol Paediatric Early Warning Score.42
The 31 centres were asked to report the component parameters of their PTTS. Of
the 36 identified parameters (Table 1.6), respiratory and heart rate, nurse and
doctor concern and respiratory effort were most prevalent.41
Table 1.6 Frequency of the component parameters reported by the 31 hospitals using an early identification system in 2005
Frequency of the component parameters in the 31 early identification systems reported by
the 2005 survey respondents.
Reproduced from Duncan41
The survey was repeated in 201343 with a response rate of 94.9% (149/157). The
majority were district general hospitals (119/126) with 30 (out of 31) respondents
from tertiary hospitals. Of the 149 centres who responded 99 of the 119 (83%)

42
district general hospitals and 27 of the 30 (90%) tertiary care hospitals reported they
had a PTTS in place. Eleven district general hospitals and 15 tertiary hospitals had
also introduced a rapid response team.
Respondents were asked to identify the origin of their PTTS (Table 1.7). Only a third
reported that their system was based on a previously published tool, with the
remainder using a mix of systems adapted from other hospitals and those purposely
designed for the individual unit. The number of differing parameters had increased
to 47, however respiratory and heart rate remained the most commonly cited
parameters.
Table 1.7 Origin of systems
PTTS based on: Number of responses (%)
Previously published system 26 (33.8%)
Unpublished system in use at another hospital 19 (24.7%)
Purposely designed for own unit 15 (19.5%)
Unsure 8 (10.4%)
No response 9 (11.7%)
Total 77 (100%)
Respondents to a survey were asked to identify the origin of their current PTTS system.
Reproduced from Roland43
The authors of the 2013 survey recommended a collaborative approach to PTTS
similar to that led by the Royal College of Physicians for adult patients.43,44 They
advocated that all PTTS must be simple to use and be acceptable to the end user if
they are to be widely accepted and adopted into clinical practice. They proposed
that respiratory rate, heart rate and oxygen saturation levels should be considered
core parameters as they were the top three items in the survey results. The authors
also suggested that conscious level, respiratory effort, nursing concern, blood
pressure and oxygen therapy should be considered for inclusion on the basis that at
least 50% of units currently included these items in their PTTS and they had also
been highlighted in a systematic review of clinical features of serious illness in
children.45 Finally they identified that the ideal PTTS would utilise routinely collected
data. To allow expert help to be mobilised and interventions to be implemented, it

43
would also accurately identify patients who are deteriorating at a sufficiently early
stage.
This rapid uptake in PTTS usage has been characterised as an ‘explosion’.46
Although many systems are in existence, all have adopted either the score-based
approach pioneered by the Royal Alexandra Hospital or the trigger-based approach
promoted by the Royal Children’s Hospital. Whilst both approaches aim to identify
children at risk of clinical deterioration, there are important differences between
score-based and trigger-based systems.
1.2.9 Types of paediatric track and trigger systems
1.2.9.1 Scoring systems
Score-based systems such as the Paediatric Early Warning Score39 shown at Figure
1.6 assign values to vital signs, and other clinical indicators, representing the extent
of deviation from ‘normal’. Children are assessed at periodic intervals against the
scoring matrix and assigned a score for each parameter. Component values are
combined to generate an overall score. Scores of zero generally indicate ‘normal’ or
‘stable’ status with increasing scores indicating greater physiological abnormality.
Higher scores should represent an increased risk of deterioration, prompting more
rapid review by senior clinicians.35
Scoring systems are designed to link with an escalation algorithm to indicate the
response to each score. Algorithms can vary in their complexity. At their simplest,
this may be a set of instructions which indicate the response required for the
assigned score, as shown in Figure 1.8.

44
Figure 1.8 Example of a simple escalation algorithm to accompany a scoring system
The score identified on the left was generated from the Cardiac Children’s Hospital Early
Warning Score. Boxes with a solid line indicate actions to be taken for the relevant score.
Boxes in hatched lines indicate additional actions to be considered by the nurse.
Adapted from McLellan47
The majority of escalation algorithms represent a set of instructions to prompt
review by a doctor or specialist personnel, such as a rapid response team. However
some PTTS have been associated with more detailed and complex algorithms such
as that shown in Figure 1.9.

45
Figure 1.9 Example of a complex algorithm for a scoring system
The flow chart starts from the top white box. The relevant PTTS score would be identified in
the colour coded circles and the appropriate part of the flow chart followed.
Reproduced from Skaletzky et al 200948

46
1.2.9.2 Trigger systems
Trigger-based systems, such as the MET activation criteria40 (Figure 1.7), contain a
number of pre-defined thresholds. When one or more thresholds are breeched, this
‘triggers’ a pre-determined response. Unlike score-based systems, there is no
associated algorithm. Trigger-based systems result in a dichotomous ‘all or nothing’
response. This typically means activation of a rapid response system (RRS) (also
known as ‘critical care outreach’, ‘rapid response’ or ‘medical emergency’ teams).
1.2.9.3 Scoring versus trigger-systems
Although no national guidance exists to recommend the type of PTTS for
hospitalised children, NICE has previously assessed the advantages and
disadvantages of different types of track and trigger systems for identifying the
acutely ill hospitalised adult.37 The main findings are summarised in Table 1.8.
Table 1.8 Comparison of trigger and scoring systems reported by NICE
Type of system
Advantages Disadvantages
Scoring system Allow monitoring of clinical progress
Allow for a graded response strategy
Widely used in UK hospitals
May lack reproducibility and reliability because systems are prone to human calculation errors
A range of sensitivities and specificities depending on the cut-off score used, but it is possible to achieve high sensitivity and specificity at defined cut-off point
Trigger system Simple to use
Simple system with better reproducibility
Does not allow a patient’s progress to be tracked
Does not allow a graded response strategy
Evidence36
suggested that trigger systems have low sensitivity, low positive predictive value but high specificity. This could potentially cause increased triggers that are not related to an adverse event
Not widely adopted in the UK adult setting.
Advantages and disadvantages were identified relevant to the track and trigger systems
used for acutely ill hospitalised adults.
Reproduced from NICE 200737

47
Use of a scoring system facilitates a graded response. This may be more
advantageous as escalation algorithms can be developed that are tailored to local
needs and available resources. However scoring systems are recognised as being
more complex, requiring correct allocation of individual parameter scores and
correct summation of the overall score.49,50 This may be particularly important for
paediatric scoring systems, which may be more complex due to the need to
acknowledge age-appropriate vital sign thresholds.
Not all settings that care for children have access to a rapid response team, and this
may limit the utility of a trigger-based system. However trigger systems are
generally easier to use and eliminate the additional mathematical calculation
required by score-based systems.
1.2.10 Mechanisms by which track and trigger systems may work
Track and trigger systems have been used to identify patients on wards outside of
critical care who are at risk of clinically deteriorating, in order that timely attendance
by appropriately skilled staff can be ensured.36,51 Despite their widespread use,
there is still limited understanding of the mechanisms by which they improve clinical
management and patient outcomes.
Critical illness is often preceded by physiological deterioration.18,20-22,24,52,53 Heart
and respiratory rate, temperature, blood pressure, oxygenation and consciousness
are commonly monitored in hospitalised patients with the aim of detecting the early
signs of deterioration.54 However studies have demonstrated that nursing and
healthcare support workers often fail to interpret these signs correctly, and
opportunities to intervene and possibly avert adverse events such as cardiac arrest
are consequently lost.26,30,52,55-60
Track and trigger systems are intended to facilitate objective decision-making and,
thus, aid the timely recognition of developing critical illness in patients outside of the
critical care setting.53 As described in section 1.2.8, they ‘track’ the patient’s
progress and when thresholds for abnormal values are breeched ‘trigger’ or prompt
the staff member to intervene. Although this has been perceived as the primary
mechanism by which these systems improve the management of patients, other
benefits are emerging.

48
Vital signs are a core component of track and trigger systems36,41,43,61 Introduction of
a track and trigger system often prompts the development of associated policies and
guidelines which specify the expected standard for vital sign monitoring.37,62 This
has been associated with improved frequency and completeness of vital sign
monitoring63-69 Introduction of a track and trigger systems may also prompt a review
of the observation chart design, which has been linked with improvements to the
recognition of abnormal vital signs and the speed of response.70-75
Improve communication between healthcare professionals may be another benefit
of track and trigger systems. Score-based systems have been described as
valuable by staff as they provide quantifiable evidence of the patients
deterioration.76-81 This can be particularly useful for junior staff who find it difficult or
stressful to escalate a deteriorating patients condition to senior colleagues. Rather
than reporting changes in individual vital signs, the track and trigger score effectively
‘packages’ them together.77 This results in a ‘shared language’ between different
professional groups.82 and has been reported to offer a more precise, concise and
unambiguous means of communicating deterioration, with a subsequent increase in
nursing confidence.77-79,81
More recently, researchers have reported that track and trigger systems may have a
positive impact on situational awareness. Situational awareness is (i) the perception
of data elements, (ii) the comprehension of their meaning in context and (iii) the
projection of their status in the near future.83,84 More simply, it is described as
“knowing what’s going on”.85 A study of situational awareness in the paediatric
setting reported that PTTS can improve situational awareness by providing an
objective assessment framework and shared training and language regarding
patient risk.83 Other researchers have also reported benefits in terms of stronger
team-working and empowerment of junior staff.63,79,81
1.2.11 Sub-optimal use of track and trigger systems
1.2.11.1 Deficiencies in the use of adult track and trigger systems
The use of track and trigger systems is now considered standard practice for adults
in the UK. Despite widespread use they have failed to demonstrate significant
improvements in mortality and morbidity. The reasons are unclear but deficiencies in
their use by clinical staff have been identified as a contributing factor.

49
Errors in the recording of track and trigger systems of between 64% to 86% have
been reported.49,86-91 These errors have been particularly prevalent in score-based
systems, where accurate scoring requires correct allocation of parameter scores,
correct summation of sub-score values and documentation of total scores.90 Absent
track and trigger scores have also been noted, with only 50% to 69.5% of
observation sets having a corresponding track and trigger score.49,54,86,92 Errors have
resulted in both under and over scoring,49,88,90 but the clinical impact on patients
remains uncertain. However, under-scoring errors have been noted to result in a
lack of clinical escalation.89 Patients with more deranged vital signs appear to be at
greater risk of mis-scoring.49
Infrequent and incomplete recording of component observations have also been
identified as problematic. The pattern of vital sign recording has been identified as
variable, with infrequent recordings at night.93 More recent evidence has suggested
that alerts for patients who were becoming physiologically unstable were commonly
missed when observation sets were incomplete.94 A review of deaths reported to the
UK national safety database identified that 14 of the 64 patients had no
observations for a prolonged period prior to death. In 30 patients vital signs were
recorded but not acted upon.60 Deficiencies in observation recording following
surgery have also been noted, with only 17% of patients having the minimum level
of vitals signs documented in the first three post-operative days.95 Just 33.1% had a
full set of vital signs recorded each nursing shift for the first six post-operative
days.96 Recording of respiratory rate in particular was highlighted as poor.69,97-100
Even when track and trigger systems are recorded as intended, the system is not
always acted upon. A cluster randomised controlled trial of MET versus traditional
cardiac arrest teams in Australia demonstrated no significant difference in rates of
cardiac arrests, unplanned admissions to intensive care and deaths.101 There was
no difference in the rate of calls to the MET versus the cardiac arrest team for
patients breeching the MET criteria for cardiac arrest (30% vs 44%, p = .031),
unplanned intensive care admissions (51% vs 55%, p = .596) and unexpected
deaths (50% vs 55%, p = .660). The overall call rate was sub-optimal in both
groups. Communication between nurses and doctors has been highlighted as
inadequate102 and this may contribute to insufficient activation of the MET. Delayed
or missed MET activation has been identified by other non-randomised studies, and
this has been noted even with systems considered to be well-developed and
established.92,103-110

50
Several studies have examined the reasons for these deficiencies. Interprofessional
relationships,81,111 teamworking,81,111 and institutional hierarchy81,112,113 have been
identified as contributory factors by nursing and medical staff. Deficiencies have
also been attributed to the inexperience of nurses111,114 and doctors,102,111 nursing
workload,111 and shortages of both medical and nursing staff.113
1.2.11.2 Deficiencies in the use of paediatric track and trigger systems
There are indications that, similar to the care delivered to adults, PTTS may not
always be used effectively. Studies evaluating the predictive validity of PTTS have
reported wide variation in the completeness of observation recording, with 5- 89% of
observation sets having all the necessary components simultaneously
recorded.115,116 The recording of blood pressure has been reported as particularly
poor.59,117
Missing PTTS values in 15% of observation sets have been reported.115 In a study
of PTTS implementation only 71% of patients had their PTTS value recorded every
four hours, notwithstanding this being the required standard. Inaccuracies in the
PTTS value were noted in 9% of cases. This was despite a hospital wide education
and assessment process.118 For age-dependent PTTS, documentation on an
incorrect age-appropriate chart has been noted in 3% of vital sign recordings.119
1.3 Motivation for the thesis
1.3.1 Gaps in the research on paediatric track and trigger systems
The use of PTTS has been advocated for all children in hospital. There is evidence
that they are gaining momentum and that the majority of centres caring for children
currently use them.43 However evidence to support their use is largely based on
outcomes of confidential reviews and evidence extrapolated from adult studies.
Track and trigger systems are an accepted part of care for hospitalised adults
following numerous studies highlighting sub-optimal care prior to intensive care
admission, cardiac arrest and death on the wards.20,21,26,27,58,120 They are
recommended by NICE despite the associated systematic review identifying little
evidence of their reliability, validity and utility.36 The significant body of evidence of
sub-optimal care of hospitalised adults made a compelling case for the use of track
and trigger systems. However they have not, as yet, delivered the large
improvements in morbidity and mortality that were hoped for.

51
Research on PTTS is far more limited and has not, as yet, been subject to
systematic review. The number and nature of published PTTS is unclear. The
evidence to support their use in terms of validity, reliability and utility has not been
summarised and no meta-analysis has been performed.
We know that many differing PTTS exist.43 We do not, as yet, know if there are
significant differences in their performance. The characteristics of the best
performing PTTS have not been identified and it is currently unclear whether scoring
or triggering systems may be best and under what circumstances. Only one study
has compared the performance of three PTTS in predicting actual or impending
cardiac arrest.121 No studies have compared the ability of different PTTS to predict
unplanned admission to PICU or unexpected death on the ward.
Studies of adult track and trigger systems have indicated that they may not be
reliably used in clinical practice. Documentation may be less frequent at night and at
the weekend.93 There is a lack of paediatric studies on the frequency and
completeness of vital sign and PTTS recording. Of the limited paediatric studies
available most have evaluated practices at or close to the time of implementation of
a PTTS. Although inaccuracies in PTTS calculation have been observed, no studies
have described the prevalence of, or reasons for, these errors. In particular, the
clinical significance and nature of scoring errors have not been quantified. Errors of
over-scoring will waste resources and may increase anxiety in children/young
people, their families and healthcare staff. Underscoring may lead to missed
detection of developing critical illness and impact on morbidity and mortality.
Understanding the nature of these errors may identify aspects which are amenable
to change.
Understanding the experiences of patients is an essential component of high quality
care. In hospital, the relationship between child patient’s, parents and nurse is
characterised as a partnership and differs from the relationship experienced by adult
patients. A small number of adult and paediatric studies have explored family
activation of a rapid response team (RRT).122-127 However, the majority of current
PTTS are activated exclusively by healthcare professionals, despite the
acknowledgment that parents contribute a unique understanding of their own
child.128 It is unclear, in these circumstances, whether PTTS provide children, young
people and families with reassurance or raise their level of anxiety. Paediatric
nursing is built on a partnership between children, young people and families but it

52
is unclear how much partnership is involved in monitoring and acting on PTTS. The
first step is to explore their views on the use of PTTS. Finally nurses are the
professional group who record and act on PTTS. It is unclear whether they find
PTTS helpful.
1.3.2 Questions and problems
Four main research questions have been identified:
1. What are the number, nature and characteristics of published PTTS and
what is the evidence of their validity, reliability and utility?
2. Does predictive validity, as assessed by the area under the receiver operator
characteristic curve (AUROC), vary between differing PTTS and can the
substitution of percentile-derived thresholds for heart and respiratory rate
improve performance?
3. When PTTS are used in clinical practice are they reliably recorded,
accurately calculated and appropriately escalated?
4. What are the views of children/young people, their families and ward nursing
staff on PTTS?
1.3.3 The value of this research
Over 3000 children die each year in the UK. Although many die from life-limiting
conditions which are not ameliorable to treatment, there is evidence that some
deaths are unnecessary.3 The death of a child is a life-changing event for families
and carers and can have a profound effect on healthcare providers.129 Prevention of
unnecessary childhood death is therefore a priority to healthcare providers, families
and carers alike.
The use of PTTS to facilitate early identification of children who are deteriorating
has been advocated. Use is now widespread despite limited evidence of their
validity, reliability and utility.43 Greater understanding of these factors will allow
clinicians and managers to make informed choices about whether to implement a
PTTS or not. If a decision is made to implement a PTTS, this research may identify
which one might be best and under what circumstances. For scoring systems,
performance at differing scoring thresholds will allow escalation algorithms to be
developed which match the needs and resources of the hospital.

53
Understanding the prevalence and nature of scoring errors will assist with identifying
the limitations of PTTS and provide a framework for the training and education of
staff.
Finally understanding the views of children, young people and their families about
PTTS will allow nurses to structure their communication about PTTS in a more
meaningful way. Engaging with children, young people and families in this way
strengthens the philosophy of partnership working. Children, young people and
families may also identify improvements that can be made to PTTS. Understanding
the views of the staff who monitor and act on PTTS may provide greater insights
into why implementation and utilisation are not always successful.
Detecting and acting on the signs of deterioration is complex and influenced by
many factors.111 This series of linked studies will support the development,
implementation and use of PTTS in clinical practice.
1.3.4 Motivation for this research
The motivation for this research grew from a need to address real-world problems
identified in the course of my work as a paediatric nurse.
In 2003 a decision was made in my hospital to implement a PTTS in light of national
recommendations and NHS governance requirements. I was asked to lead the
process. The lack of high quality evidence meant decisions were made on a
pragmatic basis. We chose to implement a locally developed PTTS, the Children’s
Early Warning Score or CEWS. Whilst there was some improvement and
standardisation in practice, the impact on outcomes such as unplanned PICU
transfer, cardiac and respiratory arrest and mortality was uncertain. This research
sets out to address some of the gaps in the literature that I identified during that
process.
1.4 My research
1.4.1 Overall aim of the thesis
In this thesis I will present a series of linked studies on PTTS which summarise the
current evidence on PTTS and explore aspects of their validity, reliability and utility.
The thesis will be structured around the safe system framework described in section
1.2.6, Figure 1.5 and Table 1.5. This will provide an underpinning framework to link

54
the studies, placing them within the national context for managing deterioration in
hospitalised children.
1.4.2 Component studies
The aim of this thesis is to explore some aspects of PTTS usage. It is a multi-
method series of linked studies on important aspects of PTTS. Exploration of these
factors may identify aspects which are ameliorable to change to optimise the impact
of PTTS.
The first study is a systematic review of the number, nature and characteristics of
published PTTS and an appraisal of the evidence on their validity, utility and
reliability.
The second study compares the predictive validity of 17 published PTTS identified
through the systematic review, together with the local PTTS in use at the time of the
study. A retrospective case-controlled methodology was selected as this allowed
comparison of the differing PTTS without exposing the patients to unnecessary risk.
Patients who suffered a critical deterioration event were matched 1:1 with ‘stable’
children. Sensitivity, specificity, positive/negative predictive values, likelihood ratios
and the area under the receiver operator characteristic curve were calculated.
Systems were then modified by the addition of percentile-derived heart and
respiratory rate thresholds and re-evaluated to see if performance improved.
Reliability of PTTS monitoring and escalation was then examined through a case-
controlled study. Vital sign observation sets were examined for frequency,
completeness and errors in PTTS scoring. Nursing care was assessed through
adherence to the local PTTS protocol and compliance to the escalation of elevated
PTTS scores.
Finally, utility of PTTS was explored through semi-structured interviews with 15
parents and 10 children, and six focus groups with junior and senior nurses to elicit
their experiences of vital sign and PTTS monitoring. Results were analysed using
the framework approach.
1.4.3 Boundaries of the thesis
In this thesis I have not sought to evaluate all aspects of PTTS validity, reliability or
utility. I have chosen to look at selected ‘real world’ problems encountered when
implementing and using a PTTS. The findings may be of most relevance to other

55
specialist children’s hospitals, particularly those without an emergency department.
However given the increasing acuity of hospitalised children, findings may have
relevance for patients in the secondary care setting.
Validity will look at predictive validity assessed by the AUROC, sensitivity and
specificity for the composite outcome of critical deterioration. It will not look at
validity across the individual outcomes of death, cardiac or respiratory arrest and
unexpected death on the ward, nor will it explore validity of alternative outcomes
such as length of PICU stay.
Reliability will examine the completeness of the recording of component parameters
of the PTTS and accuracy of the calculation of the PTTS score. It will not look at
inter-rater reliability or intra-rater reliability.
Utility will be examined through qualitative evaluation of the experiences of front line
nurses, patients and their families. It will not seek to examine the views of other
important PTTS users, such as doctors or nurse managers, not will it look at
economic aspects through a cost-benefit analysis.
1.4.4 Structure of the thesis
Chapter two is a systematic review and pooled analysis of PTTS. This provides a
foundation to the thesis by identifying the strengths and limitations of the research
promoting ‘open and consistent learning’ and increasing knowledge on the
‘recognition of deterioration’ identified by the safe system framework33 for children at
risk of deterioration.
Chapter three compares the validity of 18 PTTS and the national early warning
score (NEWS) in their ability to detect critical deterioration. This supports the
recognition of deterioration within the safe system framework.33
Chapter four explores the reliability of PTTS used in practice in terms of their
accuracy and completeness. It also explores compliance to the monitoring and
escalation protocol in the clinical setting. This chapter supports the recognition and
response to deterioration and open and consistent learning within the safe system
framework.33
Chapter five examines the utility of PTTS by exploring the views of children/young
people, families and nurse of PTTS. Partnership with patients and families is cited

56
as an area of priority and growth with the safe system framework33 and is
considered central to the support of other core elements.
Finally in chapter six the findings are synthesised. The studies are related to the
safe system framework33 and recommendations are made for clinical practice and
future research.

57
Chapter 2 A systematic review of paediatric track and trigger systems
2.1 Introduction
The purpose of this chapter is to systematically review the literature on paediatric
track and trigger systems (PTTS). Systematic reviews provide a summary of
evidence relating to a specific question. They differ from narrative reviews by
applying rigorous methodology to the search, appraisal and synthesis process130 to
make the available research more accessible to clinicians.131
A systematic review attempts to identify, appraise and synthesise all the empirical evidence that meets pre-specified eligibility criteria to answer a given research question. Researchers conducting systematic reviews use explicit methods aimed at minimising bias, in order to produce more reliable findings that can be used to inform decision-making.
(University of York p v132)
The systematic review contributes to the safe system framework by promoting open
and consistent learning. Identifying, summarising and synthesising evidence in this
way facilitates research to be adopted into practice and informs clinical decision-
making.
The methodology adopted for the review is firstly described and justified. The
number and nature of PTTS are summarised and the evidence for their validity,
calibration, reliability and clinical utility are rigorously evaluated. Where possible,
results are pooled to improve the power of small or inconclusive studies. The
evidence is synthesised and recommendations for clinical practice advanced. This
will underpin the subsequent thesis by identifying strengths and weaknesses in the
evidence.
2.1.1 Validity
Validity is the degree to which an instrument measures what it is supposed to be
measuring. In the context of PTTS, this is the ability to discriminate between ‘well’
children and those ‘at risk’ of developing critical deterioration at a sufficiently early
stage in their illness for intervention to be effective. A variety of statistical tests have
been employed to assess diagnostic accuracy, most commonly in terms of

58
sensitivity, specificity, positive and negative predictive value and receiver operating
characteristic (ROC) curve analysis.
2.1.1.1 Sensitivity and specificity
Sensitivity (the true positive rate) is the proportion of patients with critical
deterioration who triggered the PTTS at a given scoring threshold.133 Assessment of
sensitivity is ‘retrospective’, in that it shows the probability that a child suffering
critical deterioration will have a ‘significant’ PTTS score. Specificity (the true
negative rate) is the proportion of ‘well’ patients without critical deterioration who did
not trigger the system at a given scoring threshold.133 Specificity demonstrates that
a ‘well’ child will have a non-significant, low score.
High sensitivity will ensure that children who are at risk of critical deterioration are
accurately identified, whilst high specificity will prevent unnecessary reviews and
interventions in children who are not at risk of deterioration, protecting scarce
resources. The ideal PTTS will have high levels of both sensitivity and specificity
and appraisal of these values at differing scores can identify the most appropriate
thresholds for clinical intervention.
2.1.1.2 Receiver operator characteristic curve
In scoring-based PTTS, values for sensitivity and specificity depend on the scoring-
threshold selected. Higher levels of sensitivity can be achieved but at the expense
of lower specificity. The ROC curve plots sensitivity against 1-specificity for each of
the score thresholds. Overall predictive validity is assessed by calculating the area
under the curve. Larger values represent better predictive ability.134
2.1.2 Calibration
Calibration is the degree to which differing PTTS scores agree with the observed
outcome. It is appraised by plotting the observed against the predicted outcome.134
A perfectly calibrated PTTS would display a 45O straight line. Poor calibration has
been noted as easier to resolve than poor discrimination.134

59
2.1.3 Reliability
Reliability is the extent to which a test will yield the same results over time or with
different observers. Incomplete recording of component vital sign parameters and
incorrect calculation of PTTS values will impact the reliability of the score. Effective
use of score-based PTTS also require adherence to the escalation protocol.
2.1.4 Utility
Clinical utility has traditionally been associated with evidence on the effectiveness of
an intervention. However it has been suggested that this narrow view of clinical
utility excludes practitioners’ views on the usefulness, benefits and potential
drawbacks of an intervention.135 A model to describe clinical utility has been
proposed which encompasses four dimensions (Table 2.1).135
Table 2.1 Multi-dimensional model of clinical utility
Component Aspect Issues that might be considered
Appropriate Effective
Relevant
Formal evidence of effectiveness
Impact on existing treatment process and importance for clinical decision-making
Accessible Resources
Procurement
Cost and cost-effectiveness
Availability, supply and quality
Practicable Functional
Suitable
Training and knowledge
Is the tool fit for purpose and ready to use
Is the tool suitable for use in the clinical setting?
Levels and costs of training required
Acceptable To clinician
To patients/ families
To society
Ethical, legal, societal, or psychological concerns and preferences to clinicians, children and families and society at large
Adapted from a multi-dimensional model of clinical utility derived from a review of the
literature described by Smart135
2.1.5 Initial systematic review
An initial systematic review was undertaken in 2009 at the start of the PhD process.
The aim was to identify the key characteristics and evidence for the clinical utility,

60
reliability and validity of PTTS together with the strengths and weaknesses of the
evidence base.
The review followed the 2009 NHS Centre for Reviews and Dissemination (CRD)
guidance on conducting systematic reviews of interventions and clinical tests in
healthcare,131 the methodology recommended at the time by leading healthcare
journals and bodies such as the National Institute for Health and Care Excellence
(NICE) and the Cochrane collaborative. Methodological quality was assessed using
the Scottish Intercollegiate Guidelines Network (SIGN) grading system.136
In February 2009, eleven papers39,40,42,137-144 describing 10 PTTS were identified
from the literature. Six studies described the introduction and use of the
PTTS,39,40,139-141,143 Four examined the development and testing of the
system,42,137,138,144 and one described both.142 There was marked variability across
all aspects of the PTTS, including the method of development, and the number and
type of component parameters. As a result, the evidence supporting the validity,
reliability and utility of PTTS was characterised as weak and further research was
recommended before their widespread adoption into clinical practice could be
advocated. The findings were published in a leading critical care journal in 20104
and are summarised in Table 2.2.
Table 2.2 Major findings of the initial systematic review
Main findings
Methodology NHS Centre for Reviews and Dissemination guidance on systematic
reviews of interventions and clinical tests in healthcare.131
Search
strategy
Database search: CINAHL, Cochrane Library, Database of Reviews of
Effectiveness, EMBASE and Medline from January 1990 to February
2009.
Hand searching of reference lists and citation search of papers identified
by database searching. Correspondence with experts and lead authors.
Search results Eleven papers39,40,42,137-144
describing 10 systems.
General
characteristics
Marked variability across all aspects including the method of
development, type of system, and the number and type of parameters.

61
Main findings
Validity Five studies42,137,138,142,144
explored the predictive validity, but only
three137,138,144
used appropriate methodology and analysis.
Clinical
effectiveness
Only one study evaluated the effectiveness of implementing a PTTS144
.
However five papers reported the effect of a rapid response team
activated by a PTTS40,139,141-143
of which two141,143
reported statistically
significant improvements in hospital wide mortality, code rates and
‘preventable’ cardiopulmonary arrest.
Reliability One study evaluated reliability,144
which was found to be high.
Utility No studies evaluated utility, other than effectiveness.
Implications
for practice
The lack of evidence on PTTS raises concerns about widespread
adoption without more research. Hospitals with a track and trigger system
should monitor and modify their system. Hospitals considering introducing
a PTTS should consider systems that meet their local needs and patient
population.
Implications
for research
Further studies on validity, reliability and clinical utility and the impact of
PTTS on patient outcomes are needed. Age-related thresholds for vital
signs and their role in identifying physiological instability warrants further
investigation.
Conclusion The role of PTTS in aiding early detection of critical deterioration in
hospitalised children has not, as yet, been demonstrated.
The table summarises the findings of the initial systematic review. The full publication can be
seen at Appendix 12.1.
2.1.6 Developments since the initial systematic review.
In chapter one a considerable increase in the use of PTTS over recent years was
reported. A cross sectional survey of UK hospitals with paediatric services in 2013
identified that 83% of district general hospitals and 90% of tertiary care hospitals
had a PTTS in place. This was in contrast to the findings of an earlier survey in
2005, which identified only 21.5% of centres with a PTTS in place.41

62
Respondents to the 2013 survey were asked to identify the origin of their PTTS
(Table 1.7). Only a third of respondents reported that their system was based on a
previously published tool, with the remainder using a mix of systems adapted from
those in other hospitals and those purposely designed for the individual unit. A total
of 47 different parameters were identified within the reported PTTS, an increase
from 36 in 2005. Respiratory and heart rate remained the most commonly cited
parameters in both surveys.
The authors of the 2013 survey recommended a collaborative approach to PTTS
similar to that led by the Royal College of Physicians in respect of identifying the
deteriorating adult patient.43,44 The authors proposed that respiratory rate, heart rate
and oxygen saturation levels be considered core parameters as they were the top
three items in the survey results. They also suggested that conscious level,
respiratory effort, nursing concern, blood pressure and oxygen therapy should be
considered for inclusion on the basis that at least 50% of units currently included
these items in their PTTS and they had also been highlighted in a systematic review
of clinical features of serious illness in children.45 They suggested that the ideal
PTTS would accurately identify patients who are deteriorating sufficiently early in the
course of their illness to mobilise expert help. They advocated that, if PTTS are to
be widely accepted and adopted into clinical practice, they must be simple to use
and acceptable to the end user.
In light of the findings of the 2013 survey an updated review was conducted in 2015
towards the end of the PhD process to see if the initial findings are still valid. The
findings of this updated review will be reported in detail.
2.2 Systematic review methodology
2.2.1 Aim of the systematic review
The systematic review is intended to assess the evidence on the use of PTTS to
detect critical deterioration in hospitalised children. For the purposes of this review,
PTTS were defined to be any system which attempts to identify – through ongoing
monitoring of clinical signs (either alone or as part of a package of interventions) –
hospitalised children who are at risk of, or suffering from, critical deterioration.
Children in critical care units, theatres and the emergency room were excluded

63
because differing strategies to detect deterioration are employed and these
environments have differing levels of monitoring and staffing.
2.2.2 Research questions
1. What are the characteristics, key features and parameters of PTTS?
2. What is the evidence for the predictive validity of PTTS?
3. What is the evidence for the calibration of PTTS?
4. What is the evidence for the reliability of PTTS?
5. What is the evidence for the clinical utility of PTTS?
2.2.3 Review method
The review followed the Grading of Recommendations Assessment, Development,
and Evaluation (GRADE) approach.145 GRADE is recommended as it offers a
transparent and structured approach for developing and summarising evidence for
systematic reviews. GRADE is now widely endorsed by peer review journals and
organisations such as the Cochrane collaborative and NICE.
Within GRADE, the scope of the review is firstly framed using the PICOS
(Participants, Intervention, Comparison, Outcome, Study design) approach.
Outcomes are then identified and rated in terms of their importance to patients.146
Evidence is systematically searched and assessed against the PICOS criteria. The
quality of evidence for each patient-important outcome is then assessed across all
studies, rather than for each individual study. A body of evidence is rated as high,
moderate, low or very low quality (Table 2.3).

64
Table 2.3 GRADE quality definitions
Quality
level
Icon Definition
High ⨁⨁⨁⨁
HIGH
We are very confident that the true effect lies close to
that of the estimate of effect
Moderate ⨁⨁⨁◯
MODERATE
We are moderately confident in the effect estimate:
The true effect is likely to be close to the estimate of
effect, but there is a possibility that it is substantially
different
Low ⨁⨁◯◯
LOW
Our confidence in the effect estimate is limited: The
true effect may be substantially different from the
estimate of effect
Very low ⨁◯◯◯
VERY LOW
We have very little confidence in the effect estimate:
The true effect is likely to be substantially different from
the estimate of effect
Reproduced from GRADE147
Quality of evidence undergoes systematic ranking within GRADE. Figure 2.1
summarises the factors which can increase or decrease the quality assessment.
Randomised controlled trials start as high quality evidence, and observational
studies as low level. This is seen in the first and second columns on the left of
Figure 2.1. Five factors can lead to the evidence being downgraded. This is shown
in column three. Risk of bias across the studies, inconsistency between and across
the studies findings, indirectness (indicated by differences in outcome measures,
study populations, interventions or indirect comparisons) and imprecision of the
findings (indicated by wide confidence intervals or small sample size) and
publication bias can result in the initial quality assessment being decreased by one
or two levels dependent on the severity. Three factors may result in evidence being
upgraded. Where the studies demonstrate a large or very large magnitude effect,
the initial quality assessment can be upgraded by one or two levels. The presence
of a dose-response gradient may also result in evidence being upgraded, but by a
maximum of one level. On occasions, all plausible residual confounding from
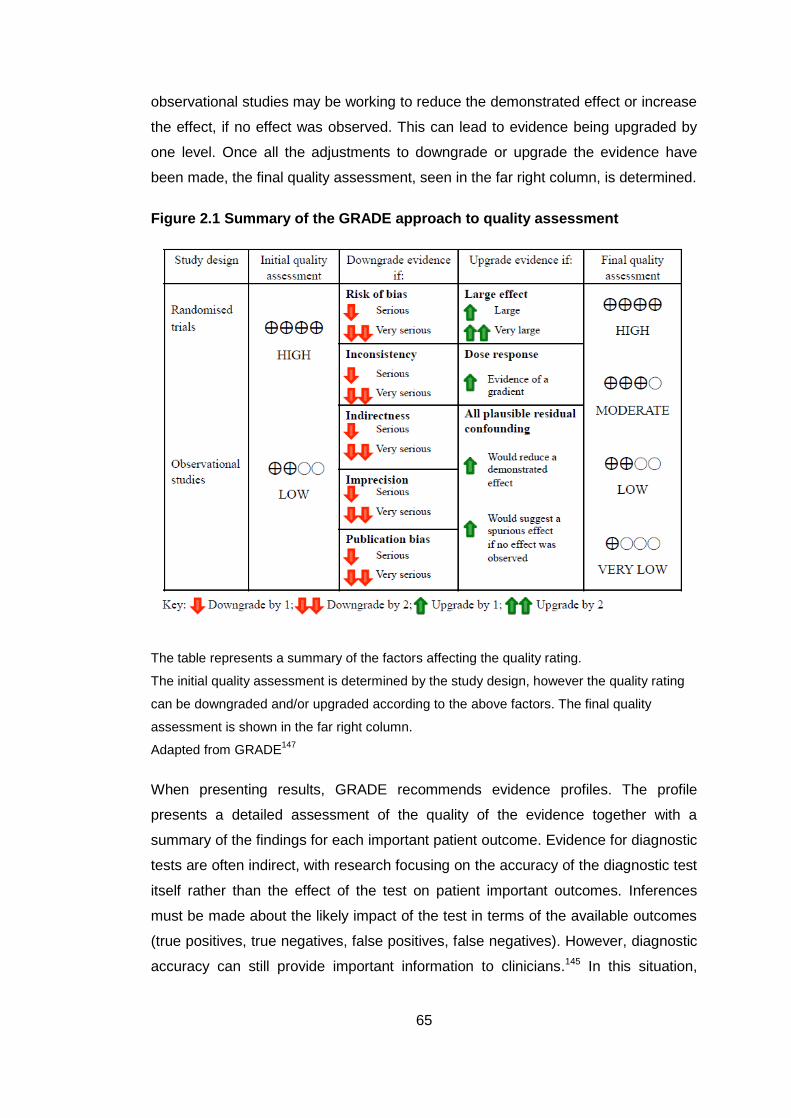
65
observational studies may be working to reduce the demonstrated effect or increase
the effect, if no effect was observed. This can lead to evidence being upgraded by
one level. Once all the adjustments to downgrade or upgrade the evidence have
been made, the final quality assessment, seen in the far right column, is determined.
Figure 2.1 Summary of the GRADE approach to quality assessment
The table represents a summary of the factors affecting the quality rating.
The initial quality assessment is determined by the study design, however the quality rating
can be downgraded and/or upgraded according to the above factors. The final quality
assessment is shown in the far right column.
Adapted from GRADE147
When presenting results, GRADE recommends evidence profiles. The profile
presents a detailed assessment of the quality of the evidence together with a
summary of the findings for each important patient outcome. Evidence for diagnostic
tests are often indirect, with research focusing on the accuracy of the diagnostic test
itself rather than the effect of the test on patient important outcomes. Inferences
must be made about the likely impact of the test in terms of the available outcomes
(true positives, true negatives, false positives, false negatives). However, diagnostic
accuracy can still provide important information to clinicians.145 In this situation,

66
cross-sectional and cohort studies start as high quality evidence but can move to
low or very low quality dependent on other factors.147
2.2.3.1 The scope of the review
The scope of the review was outlined by the PICOS criteria as seen in Table 2.4.
Table 2.4 PICOS criteria for the systematic review
Participants
Hospitalised children (0-18 years) on paediatric wards excluding
critical care, theatre, accident and emergency
Intervention Development, use or evaluation of a PTTS to detect clinical
deterioration
Comparison PTTS use (either alone or as part of a package of care) versus
normal care
Outcome Any patient related outcome including (but not restricted to)
death, admission to intensive care, cardiac and/or respiratory
arrest, patient/family satisfaction
Any user related outcomes including (but not restricted to) staff
satisfaction, inter-user reliability, utility
Study design All designs excluding reviews
2.2.3.2 Outcomes of interest
Primary outcomes were identified from the previous systematic review, the
candidate’s knowledge of the literature and clinical expertise. The identified
outcomes were then ranked in terms of their importance to patients using the
framework from adult studies and the researcher’s clinical expertise (Table 2.5). No
outcomes were ranked as being of low importance (rank 1-3).

67
Table 2.5 Patient important outcomes
Importance and rank Direct
outcomes
Surrogate outcomes
Critical for
decision making
9 Death
8 Cardiac arrest
Respiratory
arrest
CPR (chest compressions and/or bag-
valve-mask)
Call for immediate assistance
Code Blue
7 PICU
admission
Severity of illness scores (PiM2)
Severity of illness markers (pH, lactate)
Treatment markers (days of ventilation,
length of PICU stay)
Important, but
not critical for
decision making
6 HDU
admission
Severity of illness scores (PiM2)
Severity of illness markers (pH, lactate)
Treatment markers (days of non-invasive
ventilation, length of HDU stay)
5 Length of
hospital stay
Rapid response team activation
Urgent call to a healthcare professional
4
Low importance
for decision
making
3
2
1
Direct and surrogate outcomes were identified from the literature and candidates expertise.
No outcomes were identified that were considered to be of low importance (rank 1-3).
Abbreviations: CPR: Cardiopulmonary resuscitation; HDU: High Dependency Unit; PiM2:
Pediatric Index of Mortality 2; PICU: Paediatric Intensive Care Unit

68
2.2.3.3 Inclusion and exclusion criteria
Papers were included if they described the development, testing or use of a PTTS to
detect critical deterioration in children on hospital wards. Reports and reviews were
excluded. Studies set in the emergency department, operating theatre or critical
care unit were excluded as were those concerning both adult and paediatric patients
unless the data relating to children could be adequately separated.
2.2.3.4 Search strategy
The following databases were searched: AMED, CINAHL, Cochrane Library,
EMBASE, and OVID PubMed. A broad search strategy was adopted, informed by a
previous systematic review of paediatric alert criteria,4 with Medical Subject
Headings (MeSH) and free text searching using keywords in the title or abstract.
Results were limited to papers from 1990 relating to children. Google scholar was
searched using the terms paediatric early warning system/score, paediatric track
and trigger system/score and paediatric rapid response/medical emergency team.
Abstracts from the annual conferences of the Royal College of Paediatrics and Child
Health (RCPCH), European Society of Paediatric and Neonatal Intensive Care
(ESPNIC) and European Society of Intensive Care Medicine (ESCIM), together with
the bi-annual World Congress in Paediatric Intensive Care were hand-searched
from 2000 onwards.
After removal of duplicates, the title and abstract of records were screened by the
candidate and the primary supervisor. Full-text papers were reviewed and the
references and citations of eligible studies were manually searched on the Web of
Science database. Uncertainty regarding inclusion of a paper was resolved through
discussion within the supervisory team.
2.2.3.5 Data extraction:
Based on findings from the initial systematic review, three data extraction forms
were developed for randomised control trials, observational studies and studies of
diagnostic accuracy.4 The main categories of data are summarised in Figure 2.2.
Extracted data were entered into Microsoft Excel for Mac 2011 (version 14.4.7).

69
Figure 2.2 Data extracted
Figure summarises the main categories of data extracted from papers identified for inclusion
in the systematic review.
Abbreviations: AUROC: Area under the reciver operator characteristic curve; NPV:
Negative predictive value; PPV: Positive predictive value
2.2.3.6 Evidence appraisal and analysis.
PTTS were firstly categorised as ‘scoring’ or ‘trigger’ systems. Systems were then
classified as being either ‘age-dependent’ (multiple systems with differing age-
related thresholds) or ‘age-independent’ (a single system applied regardless of age).
Risk of bias for diagnostic accuracy studies were assessed using QUADAS 2148
(Appendix 5.1). Remaining quantitative studies were assessed against criteria in the
GRADE handbook147 (Appendix 5.1). The risk of bias in qualitative studies was
assessed using the Critical Appraisal Skills Programme (CASP) checklist (Appendix
5.3).149 Pooled risk ratio and 95% confidence intervals for each outcome were
Study
Aim
Location
Setting
Participants
Methodology
Method
Participants
Outcomes assessed
Method of analysis
Diagnostic accuracy
Sensitivity
Specificity
PPV
NPV
AUROC
Calibration
System characteristics
Trigger or score
Age-dependant/ independent
Age categories
System parameters
Number
Simple or complex
Classifi- cation
Vital signs thresholds

70
calculated using GRADE Pro GDT150 and Vasser Stats.151 The overall quality of
evidence for each patient-important outcome was ranked following the GRADE
approach. Evidence profiles were formulated in GRADE Pro GDT.150
Where sufficient detail was provided, the risk ratio and 95% confidence intervals for
each outcome were calculated. Results were separated into studies examining the
introduction of a PTTS alone and those introducing a PTTS as part of a package of
interventions, such as a rapid response team. Predictive validity was also
summarised.
2.3 Results
2.3.1 Search results
The search was conducted on 20th May 2016. An overview of the search results are
shown in Figure 2.3. Database searching yielded 564 papers with another 30
identified from other sources (28 from grey literature, two from citation searching).
After removal of duplicates 487 papers remained.
The abstracts of 208 papers were reviewed. Forty were excluded because the
subject was inappropriate, 10 because the study was not set in the hospital ward
and four because the participants were not children. This left 154 abstracts which
required further review.
The full text of these 154 papers was obtained. Review papers (22) and papers with
insufficient detail (42), such as conference abstracts and short reports were
excluded. A further 19 papers were excluded as the subject (12) or setting (7) were
inappropriate. Ten papers did not contain the outcomes of interest and six were
excluded for other reasons, including research protocols (2), tools which only
assessed clinical status on admission (2), cost benefit analysis (1) and electronic
screening tools (1). This resulted in 55 papers for inclusion.
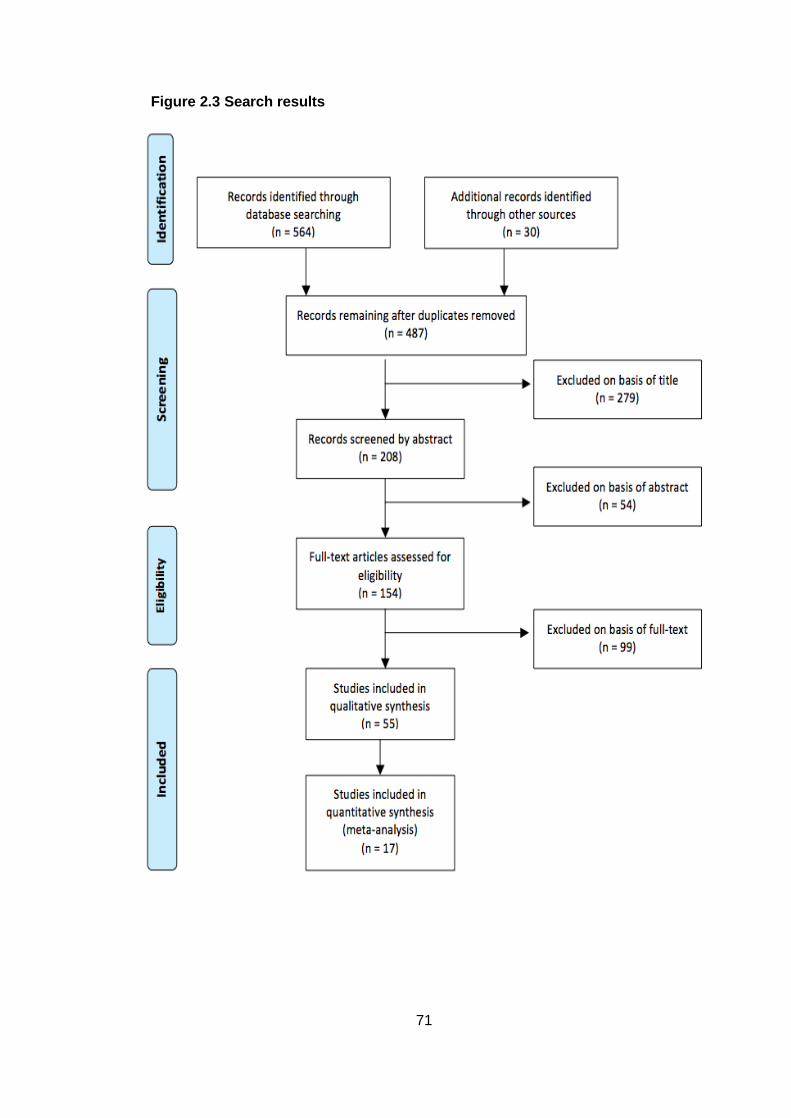
71
Figure 2.3 Search results

72
2.3.2 Included studies
All 55 studies were included in the qualitative synthesis with 17 suitable for
quantitative pooled analysis. The first study was published in 2005 and there has
been a steady increase in the number of yearly publications (Figure 2.4).
Figure 2.4 Number of publications per year (cumulative)
Note: Figure is cumulative, representing the total number of publications available in the
literature for each year
The majority of studies were conducted in North America, with a number of studies
in the UK and Australia. Single studies were carried out in Ireland, Malawi,
Netherlands, Italy and Pakistan (Figure 2.5).

73
Figure 2.5 Country in which the study was conducted
Pie chart shows the country where the study was conducted for the 55 papers included in
the review
2.3.3 Published paediatric track and trigger systems
Thirty-three PTTS were identified. Different PTTS with the same name were
numbered in order of publication to distinguish between them. Figure 2.6 represents
an overview of the year each PTTS was first published. Many were minor
modifications of previously published PTTS. Those PTTS reported to be based on a
previously published tool are presented in the same colour. Single PTTS which were
not identified as an adaption of a previously reported system are present in white.
The first published PTTS, the Paediatric Early Warning Score I39 has been adapted
10 times. The Paediatric Early Warning System Score I underpinned five further
systems, with the Medical Emergency Team Activation Criteria I spawning three
variants. The Bristol Paediatric Early Warning Score was modified once. The
remaining 11 PTTS were considered unique, although there were many shared
characteristics with previous PTTS.

74
Figure 2.6 Year of first publication of identified PTTS
Footnotes can be seen on the next page

75
Footnotes to Figure 2.5.
The 33 identified PTTS are presented by the year of first publication. Those PTTS which are
adaptions of previously published tools are identified by the same colour. PTTS in white are
consider unique.
Abbreviations: AC: Activation criteria; C-CHEWS: Cardiac Children's Hospital Early
Warning Score; CHEWS: Cardiac Children's Hospital Early Warning Score; CEWT:
Children’s early warning tool; ITAT: Inpatient triage, assessment and treatment score; LA:
Los Angeles; MET: Medical Emergency Team; MPEWS: Modified Pediatric Early Warning
Score; NHSI: NHS Institute; PAWS: Pediatric Advanced Warning Score; PERT: Pediatric
Early Response Team; PEW: Paediatric/Pediatric Early Warning; PEWS:
Paediatric/Pediatric Early Warning System; PMET: Pediatric Medical Emergency Team;
TCH: Texas Children’s Hospital; THSC: Toronto Hospital for Sick Children

76
2.3.3.1 Types of system
Twenty-one systems were classified as ‘scoring systems’, and 12 as ‘trigger
systems’. Fourteen were ‘age-dependent’ and 19 ‘age-independent’ (Figure 2.7).
Figure 2.7 Frequency of score and trigger based systems with one, four and five differing age-categories
Age-independent systems have a single category. Age-dependent systems had either four
or five differing age categories
2.3.4 Key characteristics
Table 2.6 summarises the included studies, PTTS key characteristics and
parameters, together with the quality rating for each study.
Two papers152,153 reported a system for activation of a rapid response team but did
not describe its characteristics. There was a wide variety in the number and type of
parameters within the PTTS. The median number of parameters per system was
six, with a range of three to 19. Some broader parameters shared the same name
(such as ‘respiratory’ or ‘cardiovascular’) but were constituted from differing
component parts or had differing thresholds for scoring/triggering.

77
Table 2.6 Overview of included studies, key characteristics and parameters
System Paper
(First author, year)
Country
Sett
ing
*
Vital signs Concern Clinical indicators Therapies Other parameters
Sco
re o
r tr
igg
er
Ag
e c
ate
go
ries (
n)
Pa
ram
ete
rs (
n)
Oxyg
en
satu
ratio
n
Hea
rt r
ate
Resp
ira
tory
ra
te
Systo
lic B
P
CR
T
Te
mpe
ratu
re
Sta
ff c
on
ce
rn
Pa
ren
t co
nce
rn
Resp
ira
tory
Be
ha
vio
ur
Card
iova
scu
lar
Con
scio
usn
ess
Se
izu
re
Resp
ira
tory
dis
tress
Vo
mitin
g p
ost-
su
rge
ry
Air
way th
rea
t
15
-mim
ute
neb
ulis
ers
Oxyg
en
th
era
py
Ris
k o
f bia
s
Bedside PEWS
Parshuram 2009154
Parsharam 2011a119
Parsharam 2011b116
Robson 2013121
Bonafide 2014155
Kaul 2014156
Gawronski 2016157
Canada
Canada
Canada (3) & UK
USA
USA
USA
Italy
CH
CCH
CH
CH
CH
CH
CH
S 5 7 ✓ ✓ ✓ ✓ ✓ ✓ ✓ H
H
L
H
L
S
H
Bristol PEW tool
Haines 200642
Tume 200759
Robson 2013121
McLellan 2014158
UK
UK
USA
USA
CH
CH
CH
CH
T 5 14 ✓1 ✓3 ✓ ✓ ✓ Apnoea ±bradycardia; DKA; clinically tiring or complete airway obstruction; GCS ≥ 11 or unresponsive or responding only to pain; hyperkalaemia; nebulised adrenaline; signs of shock (e.g. prolonged CRT (3s), poor perfusion, ± low BP); suspected meningococcus
H
H
H
H

78
System Paper
(First author, year)
Country
Sett
ing
*
Vital signs Concern Clinical indicators Therapies Other parameters
Sco
re o
r tr
igg
er
Ag
e c
ate
go
ries (
n)
Pa
ram
ete
rs (
n)
Oxyg
en
satu
ratio
n
Hea
rt r
ate
Resp
ira
tory
ra
te
Systo
lic B
P
CR
T
Te
mpe
ratu
re
Sta
ff c
on
ce
rn
Pa
ren
t co
nce
rn
Resp
ira
tory
Be
ha
vio
ur
Card
iova
scu
lar
Con
scio
usn
ess
Se
izu
re
Resp
ira
tory
dis
tress
Vo
mitin
g p
ost-
su
rge
ry
Air
way th
rea
t
15
-mim
ute
neb
ulis
ers
Oxyg
en
th
era
py
Ris
k o
f bia
s
Burns Centre PEWS
Rahman 2016159
USA CH S 1 7 ✓ ✓ ✓ ✓ Intake; Output; Skin H
Cardiff and Vale PEWS
Edwards 2009137
UK UH S 5 8 ✓ ✓ ✓ ✓ ✓ ✓ ✓ ✓ ✓ L
C-CHEWS
McLellan 201347
McLellan 2014158
Agulnik 2016160
USA
USA
USA
CH
CH
CH
S 1 5 ✓ ✓ ✓ ✓ ✓ Family absent H
H
H
CHEW McLellan 201347
USA CH S 1 5 ✓ ✓ ✓ ✓ ✓ Family absent H
Children’s Early Warning Tool
McKay 201367
Australia
UH
S 4 9 ✓ ✓ ✓ ✓ ✓ ✓ ✓ ✓ ✓ H
CH LA PEWS
Mandell 2015161
USA CH S 1 4 ✓ ✓ ✓ Medical history H
ITAT Olson 2013162
Malawi RH S 5 4 ✓ ✓ ✓ ✓ H

79
System Paper
(First author, year)
Country
Sett
ing
*
Vital signs Concern Clinical indicators Therapies Other parameters
Sco
re o
r tr
igg
er
Ag
e c
ate
go
ries (
n)
Pa
ram
ete
rs (
n)
Oxyg
en
satu
ratio
n
Hea
rt r
ate
Resp
ira
tory
ra
te
Systo
lic B
P
CR
T
Te
mpe
ratu
re
Sta
ff c
on
ce
rn
Pa
ren
t co
nce
rn
Resp
ira
tory
Be
ha
vio
ur
Card
iova
scu
lar
Con
scio
usn
ess
Se
izu
re
Resp
ira
tory
dis
tress
Vo
mitin
g p
ost-
su
rge
ry
Air
way th
rea
t
15
-mim
ute
neb
ulis
ers
Oxyg
en
th
era
py
Ris
k o
f bia
s
MET AC I Tibballs 200540
Tume 200759
Kinney 2008163
Edwards 2011164
Krmpotic 2013165
Australia
UK
Australia
UK
Canada
CH
CH
CH
UH
CH
T 5 9 ✓1 ✓ ✓ ✓ ✓ ✓ ✓ ✓ ✓ ✓ Cardiac or respiratory arrest; apnoea or cyanosis
H
H
H
L
H
MET AC II
Brilli 2007142
USA CH T 1 4 ✓ ✓ ✓ ✓ ✓ ✓ Worsening retractions; Cyanosis L
MET AC III
Tibballs 2009141
Azzopardi 2011166
Lobos 2014167
Australia
Australia
Canada
CH
CH
CH
T 5 9 ✓1 ✓ ✓ ✓ ✓ ✓ ✓ ✓ ✓ ✓ ✓ Cardiac or respiratory arrest; apnoea or cyanosis
H
S
H
MET AC IV
Bonafide 2012168
USA CH T 1 6 ✓ ✓ ✓ ✓ ✓ Early Warning Score in red zone L

80
System Paper
(First author, year)
Country
Sett
ing
*
Vital signs Concern Clinical indicators Therapies Other parameters
Sco
re o
r tr
igg
er
Ag
e c
ate
go
ries (
n)
Pa
ram
ete
rs (
n)
Oxyg
en
satu
ratio
n
Hea
rt r
ate
Resp
ira
tory
ra
te
Systo
lic B
P
CR
T
Te
mpe
ratu
re
Sta
ff c
on
ce
rn
Pa
ren
t co
nce
rn
Resp
ira
tory
Be
ha
vio
ur
Card
iova
scu
lar
Con
scio
usn
ess
Se
izu
re
Resp
ira
tory
dis
tress
Vo
mitin
g p
ost-
su
rge
ry
Air
way th
rea
t
15
-mim
ute
neb
ulis
ers
Oxyg
en
th
era
py
Ris
k o
f bia
s
Modified Bristol PEWS
Sefton 2014169
UK
CH
T 5 16 ✓1 ✓3 ✓ ✓ ✓ Apnoea ±bradycardia; Clinically tiring or complete airway obstruction; GCS ≤ 11 or falling, children responding only to pain
or
unresponsive on AVPU; Hyperkalaemia; Marked increased work of breathing; Nebulised adrenaline (or no improvement); pH <7.2, Poor perfusion, prolonged CRT (≥3s), ± low BP, large central/peripheral temp gradient; Unresolved pain on current analgesia therapy
H
MPEWS I Skaletzky 2012170
USA CH S 1 3 ✓ ✓ ✓ H

81
System Paper
(First author, year)
Country
Sett
ing
*
Vital signs Concern Clinical indicators Therapies Other parameters
Sco
re o
r tr
igg
er
Ag
e c
ate
go
ries (
n)
Pa
ram
ete
rs (
n)
Oxyg
en
satu
ratio
n
Hea
rt r
ate
Resp
ira
tory
ra
te
Systo
lic B
P
CR
T
Te
mpe
ratu
re
Sta
ff c
on
ce
rn
Pa
ren
t co
nce
rn
Resp
ira
tory
Be
ha
vio
ur
Card
iova
scu
lar
Con
scio
usn
ess
Se
izu
re
Resp
ira
tory
dis
tress
Vo
mitin
g p
ost-
su
rge
ry
Air
way th
rea
t
15
-mim
ute
neb
ulis
ers
Oxyg
en
th
era
py
Ris
k o
f bia
s
MPEWS II
Bonafide 201379
Roberts 2014171
USA
USA
CH
CH
S 5 18 ✓ ✓ ✓ ✓ ✓ ✓ ✓ ✓ ✓ Abnormal airway or positive pressure ventilation; Active acquired or congenital heart disease or history of heart surgery; Baseline supplemental oxygen requirement; CVL; IV bolus fluid or blood product within past 4 hours; Pre/post any transplant; Presence of gastrostomy or jejunostomy tube; Previous ICU admission; Severe developmental, neurological or neuromuscular disease
L
L
MPEWS III
Fuijkschot 2014172
NL CH S 5 8 ✓ ✓ ✓ ✓ ✓ ✓ ✓ ✓ H
NHSI PEWS
Ennis 2014173
Mason 2016174
Ireland
UK
UH
UH
S 4 7 ✓ ✓ ✓ ✓ ✓ ✓ ✓ H
L
PERT AC Van Voorhis 2009126
USA CH T 1 5 ✓ ✓ ✓ ✓ ✓ ✓ ✓ Pain or agitation that is difficult to control
H

82
System Paper
(First author, year)
Country
Sett
ing
*
Vital signs Concern Clinical indicators Therapies Other parameters
Sco
re o
r tr
igg
er
Ag
e c
ate
go
ries (
n)
Pa
ram
ete
rs (
n)
Oxyg
en
satu
ratio
n
Hea
rt r
ate
Resp
ira
tory
ra
te
Systo
lic B
P
CR
T
Te
mpe
ratu
re
Sta
ff c
on
ce
rn
Pa
ren
t co
nce
rn
Resp
ira
tory
Be
ha
vio
ur
Card
iova
scu
lar
Con
scio
usn
ess
Se
izu
re
Resp
ira
tory
dis
tress
Vo
mitin
g p
ost-
su
rge
ry
Air
way th
rea
t
15
-mim
ute
neb
ulis
ers
Oxyg
en
th
era
py
Ris
k o
f bia
s
PEW score I
Monaghan 200539
Randhawa 2011118
Watson 2014152
UK
USA
USA
CH
CH
CH
S 1 4 ✓ ✓ ✓ ✓ ✓ H
H
H
PEW score II
Tucker 2009144
Brady 201384
Brady 201483
McLellan 2014158
Fenix 2015175
USA
USA
USA
USA
USA
CH
CH
CH
CH
CH
S 1 4 ✓ ✓ ✓ ✓ ✓ H
L
L
H
H
PEW score III
Demmel 2010176
USA CH S 1 4 ✓ ✓ ✓ ✓ H
PEW score IV
Akre 2010177
USA CH S 1 4 ✓ ✓ ✓ ✓ ✓ H
PEW score V
Henderson 2012178
UK RR S 4 6 ✓ ✓ ✓ ✓ ✓ ✓ H
PEW signs
Anwar-ul-Haque 2010
179
Pakistan UH T 1 8 ✓ ✓ ✓ ✓ ✓ ✓ ✓ ✓ H
PEWS Skaletzky 200948
USA CH S 1 3 ✓ ✓ ✓ H

83
System Paper
(First author, year)
Country
Sett
ing
*
Vital signs Concern Clinical indicators Therapies Other parameters
Sco
re o
r tr
igg
er
Ag
e c
ate
go
ries (
n)
Pa
ram
ete
rs (
n)
Oxyg
en
satu
ratio
n
Hea
rt r
ate
Resp
ira
tory
ra
te
Systo
lic B
P
CR
T
Te
mpe
ratu
re
Sta
ff c
on
ce
rn
Pa
ren
t co
nce
rn
Resp
ira
tory
Be
ha
vio
ur
Card
iova
scu
lar
Con
scio
usn
ess
Se
izu
re
Resp
ira
tory
dis
tress
Vo
mitin
g p
ost-
su
rge
ry
Air
way th
rea
t
15
-mim
ute
neb
ulis
ers
Oxyg
en
th
era
py
Ris
k o
f bia
s
PEWS score I
Duncan 2006138
Robson 2011121
Canada
UK
CH
CH
S 5 19 ✓ ✓ ✓ ✓ ✓ ✓ ✓ >3 medical specialities involved in care; abnormal airway (not tracheostomy); bolus fluid; CVL in situ; gastrostomy; GCS; home oxygen; medication score; previous admission to ICU; pulses; severe cerebral palsy; transplant recipient
H
H
PEWS score II
Panesar 2014180
USA CH S 1 3 ✓ ✓ ✓ H
PMET triggers I
Shilksofski140
Hunt 2008180
USA CH T 1 12 ✓ ✓ ✓ ✓ ✓ ✓ Abnormal/worsening respiratory symptoms; progressive lethargy; circulatory compromise/acute shock syndrome; SVT/ other dysrhythmia; respiratory arrest; cardiac arrest
H
H
PMET triggers II
Kotsakis 2011139
Canada (4)
CH (4)
T 5 7 ✓ ✓ ✓ ✓ ✓ ✓ ✓ GCS L
RRT AC Sharek 2007181
USA CH T 1 6 ✓ ✓ ✓ ✓ ✓ ✓ L
TCH PAWS
Bell 2013143
USA CH S 1 5 ✓ ✓ ✓ ✓ Every hour respiratory treatments H

84
System Paper
(First author, year)
Country
Sett
ing
*
Vital signs Concern Clinical indicators Therapies Other parameters
Sco
re o
r tr
igg
er
Ag
e c
ate
go
ries (
n)
Pa
ram
ete
rs (
n)
Oxyg
en
satu
ratio
n
Hea
rt r
ate
Resp
ira
tory
ra
te
Systo
lic B
P
CR
T
Te
mpe
ratu
re
Sta
ff c
on
ce
rn
Pa
ren
t co
nce
rn
Resp
ira
tory
Be
ha
vio
ur
Card
iova
scu
lar
Con
scio
usn
ess
Se
izu
re
Resp
ira
tory
dis
tress
Vo
mitin
g p
ost-
su
rge
ry
Air
way th
rea
t
15
-mim
ute
neb
ulis
ers
Oxyg
en
th
era
py
Ris
k o
f bia
s
THCS MET criteria
Kukreti 2014182
Canada CH T 1 7 ✓1 ✓ ✓ ✓ ✓ ✓ ✓ ✓ ✓ ✓ ✓ Poor peripheral pulses, mottled extremities, GCS
S
Not specified
Hanson 2010183
Zenker 2007115
USA
USA
CH
CH
NS NS NS L
H
Key: Coloured text links indicators that are combined within a single parameter;
1 separate parameters for children with and without cyanotic heart disease;
2
in preceding 72 hours; 3 following one bolus of 10mls/kg fluid; *All studies are single centre unless otherwise stated.
Overall risk of bias: L: Low; H: High; S: Survey (not assessed)
Abbreviations: AC: Activation criteria; BP: blood pressure; C-CHEWS: Cardiac Children's Hospital Early Warning Score; CCH: Children’s community
hospital; CH: Children’s hospital; CRT: Capillary refill time; CVL: Central venous line; DKA: Diabetic ketoacidosis; GCS: Glasgow Coma Score; ICU:
Intensive Care Unit; ITAT: Inpatient triage, assessment and treatment score; IV: Intravenous; LA: Los Angeles; MET: Medical Emergency Team; MPEWS:
Modified Pediatric Early Warning Score; NHSI: NHS Institute; NL: Netherlands; NS: Not specified; PAWS: Pediatric Advanced Warning Score; PERT:
Pediatric Early Response Team; PEW: Paediatric/Pediatric Early Warning; PEWS: Paediatric/Pediatric Early Warning System; PMET: Pediatric Medical
Emergency Team; RH: Referral hospital; RR: Remote rural; RRT: Rapid Response Team; SVT: Super ventricular tachycardia; TCH: Texas Children’s
Hospital; THSC: Toronto Hospital for Sick Children; UH: University Hospital

85
2.3.5 Vital signs
All PTTS included one or more vital signs. Method of utilisation varied, but largely
took one of three forms. At the simplest level, a single vital sign was assessed
against a scoring matrix with clear thresholds for normal and abnormal values.
Other PTTS assessed vital signs against subjective criteria where some
interpretation or evaluation was required by the clinician. Examples include ‘acute
change’ in vital sign or a recording ‘above the baseline’. At its most complex level,
the vital sign was one part of a parameter requiring assessment of two or more
component parts simultaneously. These complex parameters most commonly
include subjective measures of vital signs combined with other related clinical
features. For example, the ‘respiratory’ parameter within the ‘Paediatric Early
Warning System Score I’39 combines assessment of respiratory rate, oxygen
therapy and respiratory effort. Abnormal vital signs could also be combined with
specific interventions, such as low oxygen saturation levels despite additional
oxygen therapy or high heart rate despite the administration of a fluid bolus.
Additional guidance was present in some systems to assist with identification of
‘normal’ and ‘abnormal’ values. Thresholds prompting a positive score or trigger
within the PTTS are seen in Table 2.7. Four PTTS170,176,177,179 presented additional
guidance on age-appropriate vital signs to assist clinicians in determining normal
and abnormal values and these can be seen in Table 2.8.
Most PTTS appeared to be developed from expert opinion and did not reference the
source of their vital sign thresholds. Differences in thresholds were often minor. Age
categories varied as did the thresholds for systolic blood pressure, heart and
respiratory rate, which resulted in marked differences in scoring for some PTTS.
Some PTTS provided different values dependent on whether the child was awake or
sleeping, male or female. Trigger values for oxygen saturation were largely
consistent, but the method of measurement varied, with some requiring
measurement in oxygen, others in air or detecting a decrease despite non-specified
first line interventions. Thresholds for capillary refill time and temperature were
broadly similar; however, they were less frequently incorporated into the PTTS
compared to other vital signs.

86
Table 2.7 Vital sign thresholds within PTTS
System Age range
Heart Rate Respiratory Rate
Systolic BP CRT Oxygen saturation
Temperature
Bedside PEW system116,119,121,154,156
0 - <3 m ≤110 ≥150 ≤29 ≥61 ≤60 ≥80 ≥3 s ≤94%
3 - <12m ≤100 ≥150 ≤24 ≥51 ≤80 ≥100
1-4y ≤90 ≥120 ≤19 ≥41 ≤90 ≥110
< 4-12y ≤70 ≥110 ≤19 ≥31 ≤90 ≥120
>12y ≤60 ≥100 ≤11 ≥17 ≤100 ≥130
Bristol PEW tool42,59,121,158
>6 m ≤95$ ≥150 ≥70 3s ≥92% in oxygen
≥75% in oxygen (CHD)
6-12 m ≤95$ ≥150 ≥60
1-5 y ≤95$ ≥150 ≥40
5-12 y ≥120 ≥25
>12 y ≥100 ≥25
Burns Centre PEWS159 All 10 above normal
parameter
≥2 s >95% with supplemental
oxygen
<36.5 >38.4
Cardiff and Vale PEW system137
<1 y <90 >160 <20 >50 <70 >90 Requiring oxygen to keep
above 90%
1-2 y <80 >150 <15 >45 <80 >95
2-5 y <75 >140 <15 >40 <80 >100
5-12 y <60 >120 <10 >35 <90 >110
>12 y <55 >100 <10 >30 <100 >120

87
System Age range
Heart Rate Respiratory Rate
Systolic BP CRT Oxygen saturation
Temperature
C-CHEWS47,158 All Mild tachycardia (≥10% for age)
Mild tachypnoea (≥10% for age)
≥3 s Mild desaturation below baseline
Children’s Early Warning Tool67
<1y ≤100 >160 ≤20 >45 ≤75 >150 >2s ≤93% <35.5 >38.0
1-4y ≤90 >140 ≤15 >35 ≤80 >150
5-11y ≤80 >130 ≤15 >30 ≤85 >150
>12y ≤60 >120 ≤15 >25 ≤95 >150
Children’s Hospital LA PEWS160
All 20 above normal rate
> 10 above normal
parameter
≥3 s Requiring oxygen to
maintain normal saturations
ITAT162 <3 m <110 >150 <30 >60 ≤95% <36 >37.4
3-12m <100 >150 <25 >50
1-4y <90 >120 <20 >40
4-12y <70 >110 <20 >30
>12y <60 >100 <12 >15
MET activation criteria I42,59,121,158
MET activation criteria III141,166
Term-3 m <100 >180 >60 <50 <90% in oxygen
<60% in oxygen (CHD)
4-12 m <100 >180 >50 <60
1-4 y <90 >160 >40 <70
5-12 y <80 >140 >30 <80
>12 y <60 >130 >30 <90

88
System Age range
Heart Rate Respiratory Rate
Systolic BP CRT Oxygen saturation
Temperature
MET activation criteria II142
All <90% in oxygen
MPEWS I170
PEW score I39,118
PEW score II83,84,144,158
PEW score III176
PEW score IV177
PEW system score II180
All 20 above normal rate
> 10 above normal
parameter
≥3 s
MPEWS II79,171 <3 m <110 >160 <30 >60 <60 >90 ≥ 2s <95 <36 >38.4
3-<12 m <100 >150 <25 >50 <80 >110
1-<4 y <90 >130 <20 >40 <90 >120
4-<12 y <70 >120 <20 >30 <90 >120
>/=12 y <60 >110 <12 >16 <100 >130
MPEWS III172 0 - <3 m ≤110 ≥150 ≤29 ≥61 ≤60 ≥80 ≥3 s ≤94% <36.5 >37.5
3 - <12m ≤100 ≥150 ≤24 ≥51 ≤80 ≥100
1-4y ≤90 ≥120 ≤19 ≥41 ≤90 ≥110
< 4-12y ≤70 ≥110 ≤19 ≥31 ≤90 ≥120
>12y ≤60 ≥100 ≤11 ≥17 ≤100 ≥130

89
System Age range
Heart Rate Respiratory Rate
Systolic BP CRT Oxygen saturation
Temperature
Modified Bristol PEW system169
<3 m ≤95$ ≥150 <20 ≥70 ≥3s ≤92% in oxygen
≤75% in oxygen (CHD)
3-6 m ≤95$ ≥150 Half lower value
for resps
for age
≥70
6-12 m ≤95$ ≥150 ≥60
1-5 y ≤95$ ≥150 ≥40
5-12 y ≥120 ≥25
>12 y ≥100 ≥25
PERT activation criteria126
RRT activation criteria143
All Acute change Acute change Acute change Acute change
PEW signs179 All Acute change Acute change Acute change Acute change <90%
PMET triggers I139,140 All Decrease despite 1st-line interventions
PMET triggers II181
THCS MET calling criteria183
Term-3m <100 >180 >60 <50 <90% in oxygen
<60% in oxygen (CHD)
4-12m <100 >180 >50 <60
1-4y <90 >160 >40 <70
5-12y <80 >140 >40 <80
>12y <60 >130 >30 <90

90
System Age range
Heart Rate Respiratory Rate
Systolic BP CRT Oxygen saturation
Temperature
NHSI PEWS173,174 0-11m <90 >160 <30 >60
1-4y <90 >140 <20 >40
5-12y <70 >120 <20 >30
13-18y <60 >100 <10 >20
PEW system score I121,138 <3 m <110 >150 <30 >60 <60 >80 ≥2s ≤95 <36.0 >38.5
3-12 m <100 >150 <25 >50 <80 >100
1-4 y <90 >120 <20 >40 <90 >110
4-12 y <70 >110 <20 >30 <90 >120
>12 y <60 >100 <12 >16 <100 >130
TCH PAWS182 All ≥20 above baseline
≥10 above baseline
≥3 s 5 points below baseline
Thresholds for vital signs represent a score of one or more within a PTTS scoring system or a trigger threshold.
Key: ♯Persistent tachycardia following one bolus of 10mls/kg fluid; $:Apnoea ± bradycardia
Abbreviation: BP: Blood pressure; C-CHEWS: Cardiac Children's Hospital Early Warning Score; CHD: cyanotic heart disease; CRT: Capillary Refill Time;
GCS: Glasgow Coma Score; ITAT: Inpatient Triage, Assessment and Treatment score; PAWS: Pediatric Advanced Warning Score; PERT: Pediatric Early
Response Team; PEW: Paediatric/Pediatric Early Warning; MET: Medical Emergency Team; MPEWS: Modified Pediatric Early Warning Score; PMET:
Pediatric Medical Emergency Team; RRT: Rapid Response Team; TCH: Texas Children’s Hospital; THSC: Toronto Hospital for Sick Children

91
Table 2.8 Additional guidance for vital sign thresholds
System Age range Heart Rate Respiratory Rate
MPEWS I170 Awake Sleeping
0-3 months 85 - 205 80 - 160
3 months-2 years 100 - 190 75 - 160
2-10 years 60 - 140 60 - 90
>10 years 60 - 100 50 - 90
<1 years 30 - 60
1-3 years 24 - 40
4-5 years 22 - 24
6-12 years 18 - 30
13-18 years 12 - 16
PEW score III176 Neonate 70 - 190 30 - 50
1-11 months 80 - 160 30 - 45
1-2 years 80 - 130 20 - 30
3-4 years 80 - 120 20 - 30
5-7 years 70 - 115 20 - 25
8-11 years 80 - 110 12 - 20
12-15 years (male) 80 - 100 12 - 20
12-15 years (female) 80 - 110 12 - 20
>15 years (male) 75 - 95 12 - 20
>15 years (female) 70 - 100 12 - 20
PEW score IV177 0-1 month 100 - 180 40 - 60
1-12 month 100 - 180 35 - 40
13 months – 3 years 70 - 110 25 - 30
4-6 years 70 - 110 21 - 23
7-12 years 70 - 110 19 - 21
13-19 years 55 - 90 16 - 18
PEW signs179 0-12 months 80 - 200 20 - 60
1-14 years 80 - 180 10 - 40
Additional guidance on normal vital sign ranges to be used in conjunction with the relevant
PTTS.
Key: PEW: Paediatric/Pediatric Early Warning; MPEWS: Modified Pediatric Early Warning
System

92
2.3.6 Comparison of PTTS heart and respiratory rate thresholds to evidence based values
Heart rate thresholds within PTTS were compared to evidence-based references
ranges for hospitalised children derived from percentile curves.184 The
recommended values for each percentile were plotted graphically against the
relevant age threshold. As an example, the percentile values for heart rate can be
seen at Figure 2.8. Thresholds for the 1st, 5th, 10th, 90th, 95th and 99th are presented
in grey, with the relevant value noted on the right of the figure. The 50th percentile or
median value is presented in black.
Thresholds for the scoring thresholds of each PTTS were then superimposed over
the percentile based thresholds. Each different score was represented by a different
colour. Where a PTTS provided an upper and lower threshold for a given score
these were presented using the same line colour. An example of a PTTS with three
upper and three lower scoring thresholds for scores of one, two and four can be
seen at Figure 2.9.
Each PTTS was plotted in this way and the process was repeated for the
appropriate respiratory rate thresholds.
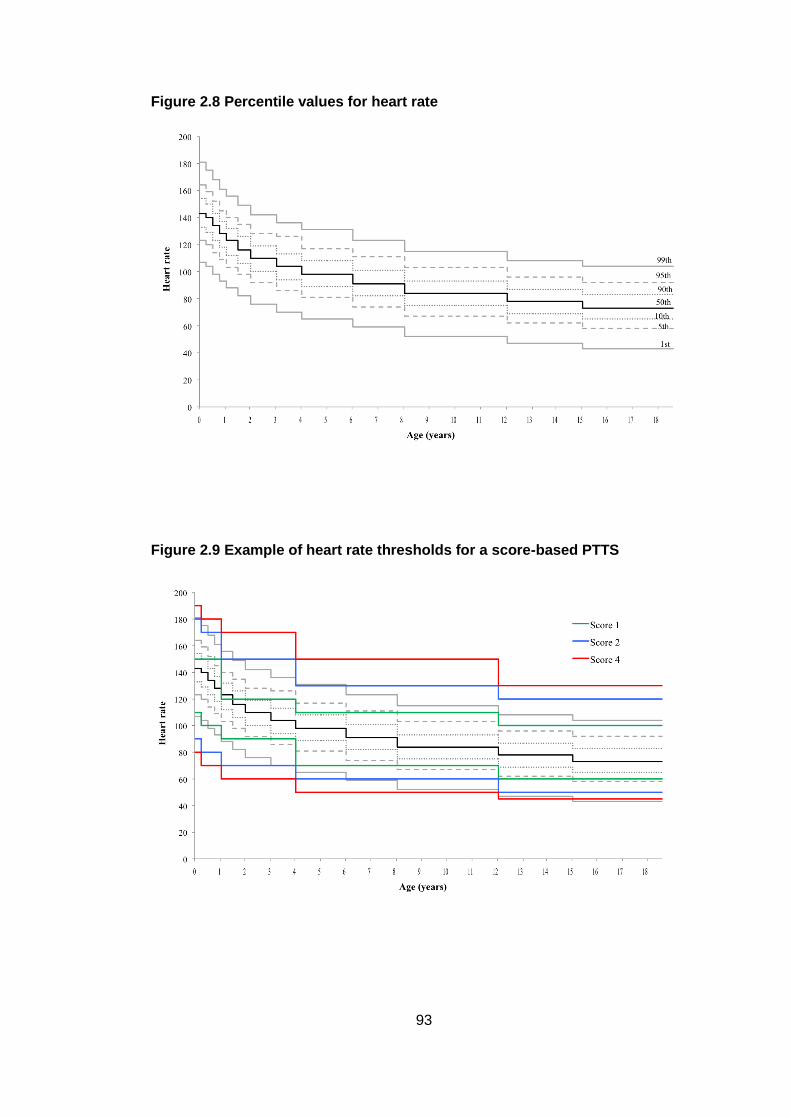
93
Figure 2.8 Percentile values for heart rate
Figure 2.9 Example of heart rate thresholds for a score-based PTTS

94
2.3.6.1 Comparison of heart rate thresholds
Thresholds for the heart rate of PTTS scoring systems are seen at Figure 2.10, with
those for trigger systems at Figure 2.11. Four systems provided guidance on
expected ‘normal values’ for heart rate. These can be seen at Table 2.8.
The eight PTTS scoring systems had six differing thresholds and scoring weightings
(Figure 2.10). Differences were sometimes minor, such as that between the
Paediatric Early Warning (PEW) system score I, Inpatient triage, assessment and
treatment score (ITAT) and the Modified Paediatric Early Warning Score (MPEWS)
II. There was inconsistency between the scoring thresholds and percentile values.
For example, the PEWS scoring system I and ITAT ‘upper score’ of one sits around
the 95th centile for younger children but dips below the 50th centile for children aged
12-18 months of age.
Four scoring systems (Bedside PEWS, Modified PEWS III, PEW system score I and
ITAT) had a score threshold that breeched the 50th percentile for younger children
and infants. This represents the median and as such is considered to be the
‘normal‘ value. Thresholds for the maximum score for the Bedside PEWS, Modified
PEWS III and the Children’s Early Warning Tool (CEWT) also exceeded the 99th
percentile for infants. These represent extreme values falling far outside of the
expected range. There appeared to be particularly poor association between
percentile-based reference ranges and the PTTS scoring thresholds in younger
children.
There was greater consensus on heart rate limits for trigger systems, with four
systems sharing the same thresholds (Figure 2.11). The thresholds for infants for
the Bristol/Modified Bristol tool sat well below the 90th percentile. Given that PTTS
trigger systems are often used to activate specialist teams of intensive care staff,
this was surprising.
Four systems provided values for the expected or ‘normal’ heart rate to assist staff
using the PTTS (Figure 2.12). There was wide variation in these thresholds and
poor agreement with the percentile thresholds. The upper limit for the PEW signs
PTTS sat far outside the 99th percentile for all age-ranges, whilst the PEW score IV
had upper thresholds which were in excess of the 99th percentile for children of one
year of age which fell to below the median for those aged one to three years.

95
Figure 2.10 Comparison of heart rate thresholds within PTTS scoring systems to validated reference ranges
Heart rate thresholds from PTTS systems are plotted against validated reference ranges derived from percentile curves for hospitalised children185
Legend (percentile values): 99th and 1
st ; 95
th and 5
th: - - - -; 90
th and 10
th:
……; 50
th:

96
Figure 2.11 Comparison of heart rate thresholds within PTTS trigger systems to validated reference ranges
Heart rate thresholds from PTTS systems are plotted against validated reference ranges derived from percentile curves for hospitalised children185
Legend (percentile values): 99th; - - - - 95
th;
…….. 90
th; 50
th;
……..10
th; - - - - 5
th; 1st

97
Figure 2.12 Comparison of recommendations for normal heart rate thresholds within PTTS scoring systems to validated reference ranges
Heart rate thresholds from PTTS systems are plotted against validated reference ranges derived from percentile curves for hospitalised children185
Legend (percentile values): 99th; - - - - 95
th;
…….. 90
th; 50
th;
……..10
th; - - - - 5
th; 1st

98
2.3.6.2 Respiratory rate
Respiratory rate thresholds also demonstrated variability when compared to
evidence-based reference ranges. The eight score-based PTTS had seven separate
thresholds (Figure 2.13). Again, differences were often minor. The Bedside PEWS
‘lower’ score of one sat at or around the 50th centile (median) for children aged eight
to 12 years, but fell to below the 1st centile for children/young people over 12 years.
However, for the same age-ranges the ‘upper’ score of one sat well above the 99th
centile for those aged eight to 12 years, but at or around the 50th centile for older
children/young people. Both upper and lower thresholds for respiratory rate
demonstrated marked differences between the systems and poor correlation to the
percentile-derived reference ranges.184
The six trigger systems had three differing thresholds (Figure 2.14). None presented
thresholds for low respiratory rate. The thresholds for tachypnea varied when
compared to the evidence-based thresholds and there appeared to be little
agreement on values.
Four PTTS provided additional guidance on ‘normal thresholds’ for respiratory rate
in infants and children (Figure 2.15). There was little consensus between the four
differing PTTS on what they would classify as ‘normal’. When compared to the
evidence-based thresholds, differences were marked, with no association between
percentile threshold and ‘normal’ ranges.
Overall respiratory rate thresholds within PTTS appear detached from the reference
ranges derived from percentile-based values in hospitalised children.

99
Figure 2.13 Comparison of respiratory rate thresholds within PTTS scoring systems to validated reference ranges
Respiratory rate thresholds from PTTS systems are plotted against validated reference ranges derived from percentile curves for hospitalised children185
Legend (percentile values): 99th; - - - - 95
th;
…….. 90
th; 50
th;
……..10
th; - - - - 5
th; 1st

100
Figure 2.14 Comparison of respiratory rate thresholds within PTTS trigger systems to validated reference ranges
Respiratory rate thresholds from PTTS systems are plotted against validated reference ranges derived from percentile curves for hospitalised children185
Legend (percentile values): 99th; - - - - 95
th;
…….. 90
th; 50
th;
……..10
th; - - - - 5
th; 1
st

101
Figure 2.15 Comparison of recommendations for normal respiratory rate thresholds within PTTS scoring systems to validated reference ranges
Respiratory rate thresholds from PTTS systems are plotted against validated reference ranges derived from percentile curves for hospitalised children185
Legend (percentile values): 99th; - - - - 95
th;
…….. 90
th; 50
th;
……..10
th; - - - - 5
th; 1st

102
2.3.7 Effect as a single intervention on patient important outcomes
Six studies evaluated PTTS as a single intervention (four studies examined PTTS
introduction into hospitals with an established rapid response team67,118,176,182 and
two without119,169). Results are shown in Table 2.9. A further 11 studies examined
the impact of PTTS as part of a package of interventions, mainly rapid response
team implementation (Table 2.10) and are summarised below. Thirteen studies
reported diagnostic accuracy (Table 2.11). No randomised controlled trials were
identified. Accordingly the level of evidence overall is very low.
2.3.7.1 Death – Very low evidence
The two observational studies67,169 had small sample sizes and low event rates.
Death following unplanned admission to intensive care from the ward demonstrated
a relative risk (RR) of 1.28 (95% confidence interval [CI] 0.66-2.52); however,
results were not significant. The RR of unexpected death on the ward could not be
calculated, as there was only one death in the study population.
2.3.7.2 Cardiac arrest – Very low evidence
Two studies examined cardiac arrest.118,176 Both studies were severely limited by
methodological concerns and RR could not be estimated from the limited data. The
RR of cardiac arrest on the ward demonstrated an increase after PTTS
implementation (RR 1.32, 95% CI 0.33-5.26), although this was not statistically
significant.
2.3.7.3 Respiratory arrest – No evidence
No studies examined the effect of PTTS implementation on respiratory arrest in
hospitalised children.

Table 2.9 Evidence profile of PTTS as a single intervention
Metric Quality assessment № of patients Effect
Quality № of studies
Study design
Risk of bias
Inconsistency Indirectness Imprecision Other factors
PTTS No PTTS Relative (95% CI)
Absolute (95% CI)
Outcome: Death Importance: Critical
Death after PICU admission from ward
1 OS not serious
not serious
not serious not serious
1
publication bias strongly suspected2
17/157 (10.8%)
14/166 (8.4%)
RR 1.28 (0.66 to 2.52)
24 more per 1000
(from 29 fewer to 128 more)
⨁◯◯◯ VERY LOW
Unexpected death on ward
1 OS not serious
not serious
not serious very serious
1
publication bias strongly suspected
0/899 (0.0%)
1/1059 (0.1%)
not estimable not estimable ⨁◯◯◯VERY LOW
Outcome: Cardiac Arrest Importance: Critical
Ward arrests/1000 patient days
1 OS serious3 not
serious not serious serious
4 none 6/12344
(0.5) 3/8115 (0.4)
RR 1.32 (0.33 to 5.26)
1 more per 1000
(from 2 fewer to 16 more)
⨁◯◯◯
VERY LOW
Ward arrests/1000 patient days
1 OS serious3 not
serious not serious serious
4 publication
bias strongly
suspected2
0.12 0.61 not estimable not estimable ⨁◯◯◯
VERY LOW

Metric Quality assessment № of patients Effect
Quality № of studies
Study design
Risk of bias
Inconsistency Indirectness Imprecision Other factors
PTTS No PTTS Relative (95% CI)
Absolute (95% CI)
Days between ward cardiac arrests
1 OS very serious
5
not serious
not serious serious4 publication
bias strongly
suspected2
1053 299 not estimable not estimable ⨁◯◯◯
VERY LOW
Outcome: Request for emergency assistance Importance: Critical
Code blue events/1000 patient days
1 OS very serious
3
not serious
serious8 not
serious publication
bias strongly
suspected2
0.256 0.293 not estimable not estimable ⨁◯◯◯VERY LOW
Outcome: Unplanned transfer to PICU Importance: Critical
Invasive ventilation after unplanned PICU transfer
1 OS not serious
not serious
not serious very serious
1
publication bias
strongly suspected
2
104/166 (62.7%)
118/157 (75.2%)
RR 0.83 (0.72 to 0.97)
128 fewer per 1000
(from 23 to 210 fewer)
⨁◯◯◯
VERY LOW

Metric Quality assessment № of patients Effect
Quality № of studies
Study design
Risk of bias
Inconsistency Indirectness Imprecision Other factors
PTTS No PTTS Relative (95% CI)
Absolute (95% CI)
Unplanned transfer from ward to PICU/1000 patient days
1 OS not serious
not serious
serious 6 serious
4
publication bias
strongly suspected
2
102/12344 (8.3)
66/8115 (8.1)
RR 1.02 (0.75 to 1.38)
1 more per 10,000
(from 3 fewer to 16 more)
⨁◯◯◯
VERY LOW
Median days of invasive ventilation
1 OS not serious
not serious
not serious not serious
publication bias
strongly suspected
2
2 4 not estimable not estimable ⨁◯◯◯
VERY LOW
Inotropes after unplanned PICU transfer
1 OS not serious
not serious
not serious very serious
4
publication bias
strongly suspected
2
40/166 (24.1%)
50/157 (31.8%)
RR 0.76 (0.53 to 1.08)
76 fewer per 1000
(from 25 more to 150 fewer)
⨁◯◯◯
VERY LOW
Median days of inotropes
1 OS not serious
not serious
not serious very serious
4
publication bias
strongly suspected
2
0 0 not estimable not estimable ⨁◯◯◯
VERY LOW

Metric Quality assessment № of patients Effect
Quality № of studies
Study design
Risk of bias
Inconsistency Indirectness Imprecision Other factors
PTTS No PTTS Relative (95% CI)
Absolute (95% CI)
Median days of PICU stay
1 OS not serious
not serious
not serious very serious
4
publication bias
strongly suspected
2
3 5 not estimable not estimable ⨁◯◯◯
VERY LOW
*Unsafe transfer to centre with PICU /1000 patient days
1 OS not serious
not serious
serious6 serious
4 none 1/2350
(0.4) 2/842 (2.4)
RR 0.18 (0.02 to 1.98)
2 fewer per 1000
(from 2 fewer to 2 more)
⨁◯◯◯
VERY LOW
Transfer to centre with PICU facilities/1000 patient days
1 OS not serious
not serious
serious6 serious
1 none 19/2350
(8.1) 5/842 (5.9)
RR 1.36 (0.51 to 3.64)
2 more per 1000
(from 3 fewer to 16 more)
⨁◯◯◯
VERY LOW
Median PIM2 score
1 OS not serious
not serious
serious7 not
serious publication
bias strongly
suspected2
0.04 0.06 not estimable not estimable ⨁◯◯◯
VERY LOW

Metric Quality assessment № of patients Effect
Quality № of studies
Study design
Risk of bias
Inconsistency Indirectness Imprecision Other factors
PTTS No PTTS Relative (95% CI)
Absolute (95% CI)
Outcome: Need for PICU and/or HDU Importance: Critical
Unplanned transfer from ward to PICU or HDU
1 OS not serious
not serious
serious6 not
serious publication bias strongly suspected2
24/899 (2.7%)
40/1059 (3.8%)
RR 0.71 (0.43 to 1.16)
11 fewer per 1000
(from 3 fewer to 16 more)
⨁◯◯◯
VERY LOW
Outcome: Call for urgent assistance Importance: Important
Urgent call to paediatrician/ 1000 patient days
1 OS not serious
not serious
serious 8 serious
1 none 12/2350
(5.1) 19/842 (22.6)
RR 0.23 (0.11 to 0.47)
17 fewer per 1000
(from 12 to 20 fewer)
⨁◯◯◯
VERY LOW
Urgent call to respiratory therapist/1000 patient days
1 OS not serious
not serious
serious 8 serious
1 none 8/2350
(3.4) 8/842 (9.5)
RR 0.36 (0.14 to 0.96)
6 fewer per 1000
(from 0 to 8 fewer)
⨁◯◯◯
VERY LOW
RRT call /1000 patient days
1 OS very serious
3
serious 9 serious
8 not
serious publication bias strongly suspected2
5.85 4.88 not estimable not estimable ⨁◯◯◯
VERY LOW

Metric Quality assessment № of patients Effect
Quality № of studies
Study design
Risk of bias
Inconsistency Indirectness Imprecision Other factors
PTTS No PTTS Relative (95% CI)
Absolute (95% CI)
Call to RRT 1 OS not serious
serious 9 serious
8 not
serious publication bias strongly suspected2
5/899 (0.6%) ⨁◯
◯◯
VERY LOW
RR 1.47 (0.40 to 5.47)
2 more per 1000
(from 2 fewer to 17 more)
⨁◯◯◯
VERY LOW
Call to RRT 1 OS serious 3 serious
9 serious
8 very
serious10
publication
bias strongly
suspected2
19.4% reduction in RRT activation after PTTS implementation ⨁◯◯◯
VERY LOW

Metric Quality assessment № of patients Effect
Quality № of studies
Study design
Risk of bias
Inconsistency Indirectness Imprecision Other factors
PTTS No PTTS Relative (95% CI)
Absolute (95% CI)
Outcome: Length of hospital stay Importance: Important
Mean days in hospital
1 OS not serious
not serious
serious11
not serious
publication bias
strongly suspected
2
1.5 not estimable not estimable ⨁◯◯◯
VERY LOW
Data presented relates to the number of patients unless the metric states otherwise. Outcomes highlighted in blue are statistically significant.
*Unsafe transfer: Patient requiring intubation, vasoactive drugs or >3 fluid bolus prior to or within first hour in PICU
Abbreviations: CI: Confidence interval; HDU: High Dependency Unit; OS: Observational study; PICU: Paediatric Intensive Care Unit; RR: Relative risk;
RRT: Rapid Response Team
Key
1. Very low number of events and small sample size therefore results uncertain. Downgrade by 2 2. Single study of small sample size. Considering that PTTS are widely used, the possibility of publication bias is strongly suspected. 3. Implementation study with retrospective data collection, poor definitions of outcome, and inadequate control and reporting of confounding. 4. Low number of events and limited sample size, therefore results uncertain. Downgrade by 2 5. Implementation study with poor definition of outcomes, inadequate control of confounding measures and poor description of outcome measurement. 6. Threshold to transfer to higher level of care can be influenced by numerous factors including capacity, physician preference, parental concern, nurse staffing on
both ward and PICU. Therefore indirect measure of patient outcome but only warrants downgrading by 1. 7. Well validated surrogate outcome which is widely used to assess risk of death in PICU, therefore only downgraded by 1. 8. Urgent call to individual or emergency team can be influenced by many factors including nurse staffing levels, nurse skill mix and experience, ward culture,
previous experience of emergency situations and training and education. Downgraded by 1. 9. Studies describing rapid response team calls demonstrated differing results with some demonstrating increasing calls and others decreasing calls.
10. No statistical analysis or CI presented so high degree of uncertainty about the results. Downgrade by 2. 11. Length of stay can be influenced by non-patient factors such as nurse staffing, capacity, parental ability, and clinician subjective assessment. Downgrade by 1.

110
2.3.7.4 Unplanned transfer to intensive care – Very low evidence
Of the three studies67,119,169 examining unplanned admission to intensive care, one
also included admissions to high dependency care67 and a further study reported
transfers to a specialist hospital with intensive care facilities, although it is not known
if these children ultimately received intensive care.119 Results were mixed, with
PTTS introduction reported as either increasing or decreasing the risk of transfer.
Surrogate measures of illness severity included the requirement for inotropes and
ventilation, PiM2 score and length of intensive care stay. Only the change in the rate
of invasive ventilation after unplanned transfer was statistically significant, with a RR
of 0.83 (95% CI 0.72-0.97). This was predicted to result in 128 fewer patients
requiring invasive ventilation per 1000 PICU transfers.
2.3.7.5 Call for emergency assistance – Very low evidence
Emergency assistance was defined as activation of the code blue or cardiac arrest
team. A single study reported a reduction in calls after a PTTS was introduced, but
RR could not be calculated as neither the number of calls nor the denominator were
reported.182
2.3.7.6 Call for urgent assistance – very low evidence
Four studies examined urgent calls for assistance.67,118,119,182 A single study119
reported a statistically significant reduction in calls to paediatricians (RR 0.23, 95%
CI 0.11-0.47) and respiratory therapists (RR 0.36, 95% CI 0.14-0.96).
2.3.7.7 Length of hospital stay – very low evidence
A single study reported a decreased length of hospital stay (1.5 days pre- versus 1.6
days post-PTTS implementation) but the RR could not be calculated.182
2.3.8 Effect as part of a package of interventions on patient important outcomes
Ten observational studies described the introduction of PTTS as part of instigating a
rapid response team.40,139,141-143,152,153,155,179,181 A further study84 with an established
team examined a package of interventions designed to increase situational
awareness. Results are summarised in Table 2.10.

111
Table 2.10 Evidence profile for PTTS as part of a package of interventions
Metric Quality assessment № of patients Effect
Quality № of studies
Study design
Risk of bias
Inconsistency Indirectness Imprecision Other factors
PTTS as part of RRT
No RRT Relative (95% CI)
Absolute (95% CI)
Outcome: Death Importance: Critical
Death following PICU transfer/all PICU patients
1 OS not serious
not serious
not serious
not serious
very strong association
2
228/5753 (4.0%)
266/4666 (5.7%)
RR 0.70 (0.59 to 0.83)
171 fewer per 10,000
(from 97 fewer to 234 fewer)
⨁⨁⨁⨁
HIGH
Death in hospital/ 1000 admissions
4 OS not serious
not serious
not serious
not serious
strong association
1 1136/
207115 (5.5)
1661/ 192862
(8.6)
RR 0.64 (0.59 to 0.69)
27 fewer per 10,000
(from 23 fewer to 30 fewer)
⨁⨁⨁◯
MODERATE
Unexpected death on ward/1000 admissions
3 OS not serious
not serious
not serious
not serious
none 11/151327 (0.1)
37/129679 (0.3)
RR 0.26 (0.13 to 0.50)
2 fewer per 10,000
(from 1 fewer to 2 fewer)
⨁⨁◯◯
LOW
Death following PICU transfer/ PICU transfers
4 OS not serious
not serious
not serious
not serious
none
137/1946 (7.0)
210/2479 (8.5)
RR 0.83 (0.68 to 1.02)
144 fewer per 10,000
(from 17 more to 271 fewer)
⨁⨁◯◯
LOW

112
Metric Quality assessment № of patients Effect
Quality № of studies
Study design
Risk of bias
Inconsistency Indirectness Imprecision Other factors
PTTS as part of RRT
No RRT Relative (95% CI)
Absolute (95% CI)
Death after PICU readmission/ 1000 hospitals admissions
1 OS not serious
not serious
not serious
not serious
none 7/55963 (0.1)
16/55469 (0.3%)
RR 0.43 (0.18 to 1.05)
2 fewer per 10,000
(from 0 fewer to 2 fewer)
⨁⨁◯◯
LOW
Death during ward emergency/ 1000 patient days
1 OS not serious
not serious
not serious
not serious
none 0/178151 (0.0)
2/192353 (0.0)
not estimable
not estimable ⨁⨁◯◯
LOW
Death of arrested patients/ arrested patients
1 OS not serious
not serious
not serious
very serious
3
none 2/8 (25.0%)
8/16 (50.0%)
RR 0.50 (0.33 to 1.00)
250 fewer per 1000
(from 0 fewer to 335 fewer)
⨁◯◯◯
VERY LOW

113
Metric Quality assessment № of patients Effect
Quality № of studies
Study design
Risk of bias
Inconsistency Indirectness Imprecision Other factors
PTTS as part of RRT
No RRT Relative (95% CI)
Absolute (95% CI)
Outcome: Cardiac Arrest Importance: Critical
Arrest on ward/1000 non-PICU admissions
3 OS not serious
not serious
not serious
not serious
none 28/145574 (0.2)
40/125013 (0.3)
RR 0.60 (0.37 to 0.97)
1 fewer per 10,000
(from 0 fewer to 2 fewer)
⨁⨁◯◯
LOW
Arrest on ward/1000 non-PICU patient days
3 OS not serious
not serious
not serious
not serious
none 28/363316 (0.1)
35/384655 (0.1)
RR 0.85 (0.52 to 1.39)
1 fewer per 10,000
(from 4 fewer to 4 more)
⨁⨁◯◯
LOW
Arrests/1000 hospital admissions
1 OS not serious
not serious
not serious
not serious
none 15/5471 (2.7)
43/10576 (4.1)
RR 0.67 (0.38 to 1.21)
13 fewer per 10,000
(from 9 more to 25 fewer)
⨁⨁◯◯
LOW

114
Metric Quality assessment № of patients Effect
Quality № of studies
Study design
Risk of bias
Inconsistency Indirectness Imprecision Other factors
PTTS as part of RRT
No RRT Relative (95% CI)
Absolute (95% CI)
Outcome: Respiratory arrest Importance: Critical
Ward intubation/ 1000 patient days
1 OS not serious
not serious
not serious
not serious
none 3/49588 (0.1)
11/48393 (0.2)
RR 0.27 (0.08 to 0.98)
2 fewer per 10,000
(from 0 fewer to 2 fewer)
⨁⨁◯◯
LOW
Ward intubation/ 1000 patient discharges
1 OS not serious
not serious
not serious
not serious
none 3/7503 (0.4)
11/7504 (1.5)
RR 0.27 (0.71 to 0.98)
11 fewer per 10,000
(from 0 fewer to 13 fewer)
⨁◯◯◯
VERY LOW
Arrests/1000 patient days
1 OS not serious
not serious
not serious
not serious
none 4/52494 (0.1)
16/92188 (0.2)
RR 0.44 (0.15 to 1.31)
1 fewer per 10,000
(from 1 fewer to 1 more)
⨁⨁◯◯
LOW
Ward intubation/ 1000 non-PICU patient days
1 OS not serious
not serious
not serious
not serious
none 0.12 0.09 not estimable
not estimable ⨁⨁◯◯
LOW

115
Metric Quality assessment № of patients Effect
Quality № of studies
Study design
Risk of bias
Inconsistency Indirectness Imprecision Other factors
PTTS as part of RRT
No RRT Relative (95% CI)
Absolute (95% CI)
Outcome: Cardiac and/or respiratory arrest Importance: Critical
Arrests/1000 non-PICU admissions
4 OS not serious
not serious
not serious
not serious
strong association
1
89/68701 (1.3)
173/91644 (1.9)
RR 0.69 (0.53 to 0.89)
6 fewer per 10,000
(from 2 fewer to 9 fewer)
⨁⨁⨁◯
MODERATE
Arrests/1000 discharges
2 OS serious 4 not
serious not
serious not
serious strong
association1
68/19185 (3.5)
176/30065 (5.9)
RR 0.61 (0.46 to 0.80)
23 fewer per 10,000
(from 12 fewer to 32 fewer)
⨁⨁⨁◯
MODERATE
Arrests/1000 patient days
3 OS not serious
not serious
not serious
not serious
none 19/136502 (0.1)
94/243118 (0.4)
RR 0.36 (0.22 to 0.59)
2 fewer per 10,000
(from 2 fewer to 3 fewer)
⨁⨁◯◯
LOW
Outcome: Request for emergency assistance Importance: Critical
Code blue call/1000 non-PICU patient days
1 OS not serious
not serious
not serious
not serious
none 115/ 178151
(0.6)
102/ 192353
(0.5)
RR 1.22 (0.93 to 1.59)
1 more per 10,000
(from 0 fewer to 3 more)
⨁⨁◯◯
LOW

116
Metric Quality assessment № of patients Effect
Quality № of studies
Study design
Risk of bias
Inconsistency Indirectness Imprecision Other factors
PTTS as part of RRT
No RRT Relative (95% CI)
Absolute (95% CI)
Code blue call/1000 hospital admissions
1 OS not serious
not serious
not serious
not serious
none 210/55469 (3.8)
150/55963 (2.7)
RR 1.41 (1.15 to 1.74)
11 more per 10,000
(from 4 fewer to 20 more)
⨁⨁◯◯
LOW
Code blue call/1000 patient days
1 OS very serious
5
not serious
not serious
not serious
none 88/49588 (1.8)
51/48393 (1.1)
RR 1.68 (1.19 to 2.38)
7 more per 10,000
(from 2 more to 15 more)
⨁◯◯◯
VERY LOW
Outcome: Unplanned transfer to PICU Importance: Critical
Unplanned transfers requiring vasopressors in first 1 hour/ unplanned transfers
1 OS not serious
not serious
not serious
serious6 none 16/936
(1.7%) 41/874 (4.7%)
RR 0.36 (0.21 to 0.65)
30 fewer per 1000
(from 16 fewer to 37 fewer)
⨁◯◯◯
VERY LOW
Unplanned ward transfers/ 1000 admissions
2 OS not serious
not serious
not serious
not serious
none 1178/ 91855 (12.8)
1560/ 160249
(9.7)
RR 1.32 (1.22 to 1.42)
31 more per 10,000
(from 21 more to 41 more)
⨁⨁◯◯
LOW

117
Metric Quality assessment № of patients Effect
Quality № of studies
Study design
Risk of bias
Inconsistency Indirectness Imprecision Other factors
PTTS as part of RRT
No RRT Relative (95% CI)
Absolute (95% CI)
Unplanned ward transfers/1000 non-PICU patient days
1 OS not serious
not serious
not serious
not serious
none 936/ 178151
(5.3)
874/ 192353
(4.5)
RR 1.16 (1.05 to 1.27)
7 more per 10,000
(from 2 more to 12 more)
⨁⨁◯◯
LOW
Unplanned readmissions from ward/ 1000 admissions
1 OS not serious
not serious
not serious
not serious
none 200/55469 (3.6)
163/55963 (2.9)
RR 1.24 (1.01 to 1.52)
7 more per 10,000
(from 0 fewer to 15 more)
⨁⨁◯◯
LOW
Critical deterioration event/1000 non-PICU patient days
1 OS not serious
not serious
not serious
not serious
none 281/ 178151
(1.6)
260/ 192353
(1.4)
RR 1.17 (0.99 to 1.38)
2 fewer per 10,000
(from 0 fewer to 5 more)
⨁⨁◯◯
LOW
Median PRISM III-12 score on admission
1 OS not serious
not serious
not serious
not serious
none 0 2 not estimable
not estimable ⨁⨁◯◯
LOW

118
Metric Quality assessment № of patients Effect
Quality № of studies
Study design
Risk of bias
Inconsistency Indirectness Imprecision Other factors
PTTS as part of RRT
No RRT Relative (95% CI)
Absolute (95% CI)
Unsafe transfer*/ 10000 non-ICU inpatient days
1 OS not serious
not serious
not serious
not serious
none 2.4 4.4 not estimable
not estimable ⨁⨁◯◯
LOW
Unplanned transfer requiring vasopressors in first 12 hours/ unplanned PICU transfers
1 OS not serious
not serious
not serious
serious6 none 57/936
(6.1%) 71/874 (8.1%)
RR 0.75 (0.54 to 1.05)
20 fewer per 1000
(from 4 more to 37 fewer)
⨁◯◯◯
VERY LOW
Unplanned transfer requiring mechanical ventilation in first 1 hour/ unplanned PICU transfers
1 OS not serious
not serious
not serious
serious6 none 42/936
(4.5%) 45/874 (5.1%)
RR 0.87 (0.58 to 1.31)
9 fewer per 1000
(from 13 more to 23 fewer)
⨁◯◯◯
VERY LOW

119
Metric Quality assessment № of patients Effect
Quality № of studies
Study design
Risk of bias
Inconsistency Indirectness Imprecision Other factors
PTTS as part of RRT
No RRT Relative (95% CI)
Absolute (95% CI)
Unplanned transfer requiring mechanical ventilation in first 12 hours/ unplanned PICU transfers
1 OS not serious
not serious
not serious
serious6 none 103/936
(11.0%) 112/874 (12.8%)
RR 0.86 (0.67 to 1.10)
18 fewer per 1000
(from 13 more to 42 fewer)
⨁◯◯◯
VERY LOW
Data presented relates to the number of patients unless the metric states otherwise. Outcomes highlighted in blue are statistically significant.
*Unsafe transfer: Patient requiring intubation, vasoactive drugs or >3 fluid bolus prior to or within first hour in PICU
Abbreviations: CI: Confidence interval; OS: Observational study; PICU: Paediatric Intensive Care Unit, RR: Relative Risk
Key
1. Large effect of relatively rate outcome. Upgraded by 1. 2. Very large effect of relatively rate outcome. Upgraded by 2. 3. Extremely small sample size. Downgraded by 1. 4. One study poorly reported the definition of arrest and both studies inadequately described the risk of confounding. Downgrade by 1. 5. Inadequate definition of code blue call, retrospective data collection, inadequate description of risk of confounding. Downgraded by 2 6. Small sample size. Downgraded by 1.

120
2.3.8.1 Death – Moderate evidence
Eight studies reported impact on mortality.139,141-143,152,155,179,181 The pooled results
indicate a statistically significant reduction in the risk for death in hospital of 0.64
(95% CI 0.59-0.69), with 31 fewer deaths predicted per 10,000 admissions. Relative
risk of death following PICU transfer was reduced at 0.7 (95% CI 0.59-0.83), which
equates to 171 (95% CI 97 – 234) fewer predicted deaths per 10,000 PICU patients.
There was also a significant reduction in unexpected deaths on the ward (RR 0.26,
95% CI 0.13-0.50), with two fewer predicted deaths per 10,000 admissions after
rapid response team and PTTS implementation. These are rare events and hence
the absolute effect size is small.
2.3.8.2 Cardiac arrest – Low evidence
Three studies reported the impact of a rapid response team with an embedded
PTTS on the rate of cardiac arrest.142,152,155 Ward cardiac arrests per 10,000 non-
PICU admissions were significantly reduced (RR 0.60, 95% CI 0.37-0.97).
Unsurprisingly given the low event rates, the predicted absolute reductions are very
small, with one fewer predicted death per 10,000 non-PICU ward admissions.
Notably, when the RR of arrest was calculated per 10,000 non-PICU patient days,
the result was not statistically significant (RR 0.85, 95% CI 0.52-1.39).
2.3.8.3 Respiratory arrest – Low evidence
Requirement for bag-valve-mask ventilation and intubation on the ward were
considered under the outcome of respiratory arrest. The three studies139,142,155 all
utilised different metrics. There was a statistically significant reduction in the risk of
need for intubation on the ward of 0.27 for events, both per 1000 patient days (95%
CI 0.08-0.98) and per 1000 discharges (95% CI 0.71-0.98). Again the absolute
effect was small, with two fewer predicted ward intubations per 10,000 patient days
(zero fewer to two fewer) and 11 fewer per 10,000 discharges (zero fewer to 13
fewer).
2.3.8.4 Cardiac and/or respiratory arrest – Moderate evidence
Six studies combined the reporting of cardiac and respiratory arrests for three
metrics.139,142,143,153,179,181 All results were statistically significant. The RR of arrest per
10,000 non-ICU admissions was 0.69 (95% CI 0.53-0.89) or six fewer predicted
arrests. When reported against patient discharges, an absolute reduction of 23

121
arrests per 10,000 discharges was estimated (RR 0.61, 95% CI 0.46-0.80). The RR
of arrest per 10,000 patient days was also reduced (RR 0.36, 95% CI 0.22-0.59)
with an estimated reduction of 23 arrests per 10,000 patient days.
2.3.8.5 Request for emergency assistance – Low evidence
Calls for emergency assistance were reported by three studies139,155,181 using three
metrics. No metric achieved statistical significance.
2.3.8.6 Unplanned transfer to Intensive Care –Very low level evidence
Five studies40,84,139,155,181 described 10 different metrics relating to the risk of
unplanned transfer to PICU. The RR of unplanned transfer requiring vasopressors in
the first hour was 0.36 (95% CI 0.21-0.65), with an absolute rate of 30 fewer
patients per 1000 unplanned PICU admission. The remaining results did not achieve
statistical significance.
2.3.9 Validity – Predictive performance
Seventeen studies42,59,116,121,137,138,144,154,157,158,162,164,170,172,177,186 examined the
predictive performance of PTTS to predict patient important outcomes (Table 2.11).
One study42 reported inaccurate values for sensitivity and specificity and the
methodology did not permit accurate calculation.187 The results were therefore
removed from the table. The majority of the remaining 13 studies were
retrospective, which increased the risk of bias. PTTS systems were examined
across a variety of outcomes and combinations of outcomes.

122
Table 2.11 Studies reporting predictive performance
Paper Design Patients Outcome measures System Score Sensitivity % (95% CI)
Specificity % (95% CI)
AUROC
(95% CI)
Olson162 Prospective nested
case-control
54 cases
161 controls
Death within 2 days ITAT ≥ 4 44.0
(31.3-58.5)
86.0
(79.1-90.5)
0.76
Robson121
Retrospective case-
controlled
evaluation of 3
systems
96 cases
96 controls
Code blue Bedside PEWS ≥8 43.8
(33.8-54.2)
85.4
(76.4-91.5)
0.73
Bristol PEW tool ≥1 76.3
(66.0-83.9)
61.5
(50.9-71.1)
0.75
PEWS score I ≥5 86.6
(77.6-92.3)
72.9
(62.7-81.2)
0.85
Duncan138 Retrospective case
control
87 cases
128 controls
Code blue PEWS
score I
≥5 78.0
(67.8-86.0)
95.0
(88.6-97.6)
0.90
Akre177 Retrospective,
descriptive
186 cases Code blue and/or RRS
activation
PEW score IV ≥ 4 85.5
(79.4-90.1)
Fenix175 Retrospective
cohort study
97 patients Deterioration event*
after non-elective PICU
transfer
PEW Score II ≥ 3 80.0 43.0

123
Paper Design Patients Outcome measures System Score Sensitivity % (95% CI)
Specificity % (95% CI)
AUROC
(95% CI)
Mandell186 Retrospective case-
controlled
38 cases
151 controls
Unplanned PICU
readmission within 48
hours
CH LA PEWS ≥2 76.0 56.0 0.71
Parsharum
2011116
Prospective multi-
centre case-
controlled
686 cases
1388 controls
Urgent PICU admission
and/or call to
resuscitation team
Bedside PEWS ≥8 57.4
(53.6-61.2)
94.7
(93.3-95.8)
0.87
(0.85-0.89)
McLellan158 Retrospective
cohort
64 cases (10
arrests, 54 PICU
transfers)
248 controls
Unplanned PICU
transfer or
cardiopulmonary arrest
C-CHEWS ≥ 3 95.3 76.2 0.92
PEW I ≥ 3 54.7
(41.7-67.2)
86.3
(81.4-90.3)
0.79
Fuijschot172 Retrospective
cohort
24 cases
Unplanned PICU
admission
Bedside PEWS ≥7 64.0 91.0
MPEWS III ≥8 67.0 88.0
Skaletzky170 Retrospective case-
controlled
100 cases
250 controls
PICU admission MPEWS I 2.5 62.0
(51.7-71.4)
89.2
(84.5-92.6)
0.81
(0.75-0.86)
Tucker144 Prospective, cohort 2979 PICU admission PEW score II ≥3 90.2
(77.8-96.3)
74.4
(72.8-75.9)
0.89
(0.84-0.94)

124
Paper Design Patients Outcome measures System Score Sensitivity % (95% CI)
Specificity % (95% CI)
AUROC
(95% CI)
Parshuram
2009154
Prospective case-
controlled validation
60 cases
120 control
Urgent PICU admission
without code blue
Bedside PEWS ≥8 82
(69.1-90.1)
93
(86.9-96.9)
0.91
(0.86-0.96)
Agulnik160 Retrospective case-
controlled
110 cases
220 controls
Unplanned admission
to PICU
C-CHEWS ≥ 3 93.6
(86.9-97.2)
88.2
(83.0-92.0)
0.96
(0.93-0.98)
Gawronski157 Retrospective case-
controlled
19 cases
80 controls
Unplanned PICU
transfer, urgent RRS
consult, unexpected
ward death
Bedside PEW
system
≥8 73.7
(48.6-89.9)
98.8
(92.3-99.9)
0.87
Tume59
Retrospective
cohort
33 cases (PICU)
32 cases (HDU)
Unplanned admission
to PICU or HDU
Bristol PEW tool ≥ 1
(HDU)
84.4
(66.5-94.1)
≥ 1
(PICU)
87.9
(70.9-96.0)
MET activation
criteria I
≥ 1
(HDU)
87.5
(70.1-96.0)
≥ 1
(PICU)
87.9
(70.9-96.0)

125
Paper Design Patients Outcome measures System Score Sensitivity % (95% CI)
Specificity % (95% CI)
AUROC
(95% CI)
Edwards
2009137
Prospective cohort 10001 PICU/PHDU admission;
respiratory/ cardiac
arrest**; death**
Cardiff and Vale
PEW system
≥2 68.7
(41.5-87.9)
89.9
(87.9-91.7)
0.86
(0.82-0.91)
Edwards
2011164
Retrospective
cohort study
10001 PICU/PHDU admission;
death**
MET activation
criteria I
≥1 68.3
(57.7-77.3)
83.2
(83.1-83.2)
0.79
(0.30 -0.84)
Mason174 Retrospective
cohort study
10001 Adverse outcome
(PICU/ PHDU
admission, death*)
NHSI PEW
system
≥2 62.5
(35.9-83.7)
42.0
(38.9-45.1)
.83
(0.77-0.88)
One study42
reported incorrect values for sensitivity and specificity and these have been eliminated from analysis
Key: *Deterioration event: Intubation, inotropes, high flow nasal cannula oxygen, non-invasive ventilation and/or aggressive (>60mL/kg) fluid resuscitation
within 12 hours of transfer to the PICU
**No respiratory/cardiac arrests or deaths occurred; Values in red were not reported in the paper and have been calculated using available data; 1Published
values were calculated based on the number of observations taken, rather than the number of patients and have re-calculated
Abbreviations: AUROC: Area Under Receiver Operating Characteristic Curve; C-CHEWS: Cardiac Children's Hospital Pediatric Early Warning Score; CI:
Confidence interval; ITAT: Inpatient triage, assessment and treatment score; MET: Medical Emergency Team; MPTTS: Modified Pediatric Track and Trigger
Score; PEW: Paediatric/Pediatric Early Warning; PEWS: Paediatric/Pediatric Early Warning System; PHDU: Paediatric High Dependency Unit; PICU:
Paediatric Intensive Care Unit; PMET: Pediatric Medical Emergency Team PPV: positive predictive value; RRT: Rapid Response Team; TCH: Texas
Children’s Hospital

126
2.3.9.1 Death in hospital – very low evidence
A single study of the ITAT system,162 set in a resource-limited environment, was
examined for the ability to predict death in hospital. A significant proportion of
children were excluded due to missing data, raising concerns about the risk of bias.
AUROC of 0.76 demonstrated reasonable ability to identify children at risk of death
within two days.
2.3.9.2 Cardiac arrest – very low evidence
Two case controlled studies were identified,121,138 of which one compared the validity
of three differing systems.121 Similar levels of sensitivity were seen across the
differing systems, but specificity varied. AUROC values ranged from 0.73 to 0.91.
Trigger-based system121 appeared to perform less well than the scoring
systems.121,138
2.3.9.3 Respiratory arrest – no evidence
No studies evaluated respiratory arrest as a stand-alone outcome.
2.3.9.4 Unplanned transfer to intensive care – very low evidence
Unplanned transfer to PICU was evaluated in four studies144,154,170,172 of which one
specifically excluded patients who had received a code blue call prior to transfer.154
AUROC ranged from 0.80 (95% CI 0.85-0.89) to 0.90 (95% CI not reported).
2.3.9.5 Unplanned transfer to PICU or HDU – very low evidence
Three studies59,137,164 examined the composite outcome of transfer to PICU or HDU.
Two studies137,164 used the same data set to validate prospectively and to evaluate
retrospectively the ability to predict unplanned transfer, cardiac/respiratory arrest
and/or death. However no arrests or deaths occurred so the outcome was limited to
unplanned transfer. AUROC ranged from 0.79 (95% CI 0.73-0.84) to 0.86 (95% CI
0.82 - 0.91).
2.3.10 Reliability
Six studies evaluated the inter-rater reliability of six different PTTS (Table 2.12) in a
variety of settings. Good to high levels of inter-rater reliability were reported for four
studies,118,119,144,182 with a further study demonstrating excellent inter-rater reliability

127
at scores of three and above, the first cut-point on the algorithm that required
escalation.158 The remaining study presented the outcomes graphically and reported
a consistent improvement over an unspecified period of time.176 All studies were
conducted during the implementation of score-based PTTS but no studies evaluated
whether reliability was sustained after implementation. No studies evaluated intra-
rater reliability.
Table 2.12 Studies reporting inter-rater reliability
System Setting Assessors Cases assessed
Inter-rater reliability
(95% CI)
Bedside PEW system119
22 bed ward, community
hospital
Frontline nurse and research
nurse
793 vital sign documentations
0.90 (0.87- 0.93)
C-CHEWS158
41 bed cardiovascular
unit
25 frontline nurses and expert nurse
37 patients (87 documented vital signs)
0.5 all scores
1.0 when score ≥ 3
PEW score I118
Cardiology/ nephology unit
3 assessors (nurse manager, staff nurse, medical
director)
44 cases across 4 assessments
0.9 –0 .95
PEW score II144
24-bed medical unit
2 nurses 55 cases 0.92, p <.0001
PEW score III176
Haematology/ oncology unit
2 nurses NS Increased over time
TCH-PAWS182
3 acute care units 58 nurses NS 0.85 (0.75 –0 .91)
Key: C-CHEWS: Cardiac Children's Hospital Early Warning Score CI: Confidence interval;
NS: Not stated; PEW: Paediatric Early Warning; TCH-PAWS: Texas Children’s Hospital
Pediatric Advance Warning System

128
2.3.11 Calibration
No studies assessed calibration.
2.3.12 Utility
Eight quantitative and two qualitative studies examined the acceptability and
usefulness of PTTS to staff (Table 2.13). Nurses were represented in all 10 studies,
physicians in eight and respiratory therapists in two. Overall responses were
positive, with improved recognition, escalation and communication featuring in a
number of studies.
Staff appeared to value the systems and reported improvements in both the
detection and escalation of concerns. However one study reported an
‘unwillingness’ to escalate elevated PTTS by 47% of doctors and 32% of nurses. No
study identified PTTS as negatively impacting on patients or staff.
Although a number of PTTS contain criterion to report ‘family concern’ no studies
evaluated the acceptability of PTTS to the children who were undergoing PTTS
monitoring and their families.
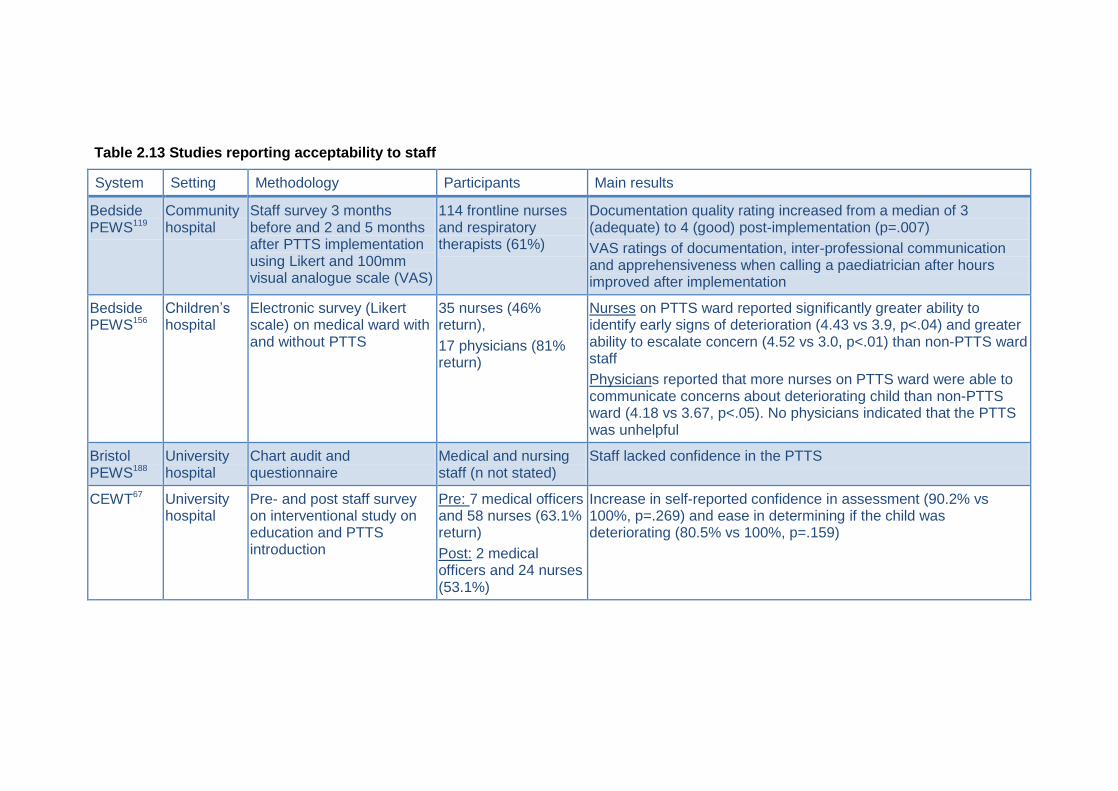
Table 2.13 Studies reporting acceptability to staff
System Setting Methodology Participants Main results
Bedside PEWS119
Community hospital
Staff survey 3 months before and 2 and 5 months after PTTS implementation using Likert and 100mm visual analogue scale (VAS)
114 frontline nurses and respiratory therapists (61%)
Documentation quality rating increased from a median of 3 (adequate) to 4 (good) post-implementation (p=.007)
VAS ratings of documentation, inter-professional communication and apprehensiveness when calling a paediatrician after hours improved after implementation
Bedside PEWS156
Children’s hospital
Electronic survey (Likert scale) on medical ward with and without PTTS
35 nurses (46% return),
17 physicians (81% return)
Nurses on PTTS ward reported significantly greater ability to identify early signs of deterioration (4.43 vs 3.9, p<.04) and greater ability to escalate concern (4.52 vs 3.0, p<.01) than non-PTTS ward staff
Physicians reported that more nurses on PTTS ward were able to communicate concerns about deteriorating child than non-PTTS ward (4.18 vs 3.67, p<.05). No physicians indicated that the PTTS was unhelpful
Bristol PEWS188
University hospital
Chart audit and questionnaire
Medical and nursing staff (n not stated)
Staff lacked confidence in the PTTS
CEWT67 University hospital
Pre- and post staff survey on interventional study on education and PTTS introduction
Pre: 7 medical officers and 58 nurses (63.1% return)
Post: 2 medical officers and 24 nurses (53.1%)
Increase in self-reported confidence in assessment (90.2% vs 100%, p=.269) and ease in determining if the child was deteriorating (80.5% vs 100%, p=.159)

System Setting Methodology Participants Main results
MET activation criteria I166
Children’s hospital
Likert based electronic survey on attitudes and barriers to established paediatric RRS
280 nurses, 127 doctors
RRS was highly valued by 85% nurses and 83% doctors.
However 47% doctors and 32% nurses reported unwillingness to activate RRS when the PTTS criterion were breeched.
30% doctors and 15% nurses reported that delay in activating the RRS was because they did not appreciate how sick the patient was
Modified Bristol PEWS69
Children’s hospital
Survey of ward nurses 122 nurses (64% Registered nurses, 20% charge nurse, 8% student nurse, 7% care assistant)
62% felt PTTS helped them pick up seriously ill children earlier.
43% had triggered the PTTS in the last month and 80% felt it helped them get appropriate management for the child.
51% of nurses felt medical staff did not take PTTS seriously enough.
Modified PEWS II79
Children’s hospital
Semi-structured interviews with staff who had recently cared for patients with false-positive and false-negative PTTS
27 nurses and 30 physicians
Four major themes:
1: PTTS facilitate patient safety by alerting staff to concerning changes, prompting them to think critically about the possibility of deterioration
2: PTTS provide less experienced nurses with helpful age-based reference ranges for vital signs
3: PTTS serve as concrete evidence to empower nurses to escalate care
4: PTTS may not be helpful for children with altered baseline physiology and neurological deterioration
PEW score I39
Children’s hospital
Staff survey 33 staff (medical and surgical ward)
80% reported that PTTS improved their confidence in recognising the child at risk of deterioration

System Setting Methodology Participants Main results
PEW Score II83
Children’s hospital
Seven role-specific focus groups on situational awareness. Constant comparison analysis
10 charge nurses, 8 bedside nurses, 3 respiratory nurses, 10 resident physicians
PTTS was identified by all 6 nurse focus groups as contributing to situational awareness of the deteriorating child
PTTS was not identified by resident physicians as contributing to situational awareness of the deteriorating child
PEW Score III176
Children’s hospital
Staff survey Nurses (29%) and house officers (36%)
Percentage of nurses who agreed or strongly agreed with the following:
PTTS made it easier to know what to do when a child was deteriorating (60%)
PTTS made it easier to get help when taking care of patients (80%)
PTTS had positively impacted the care given to children (60%)
Percentage of physicians who agreed or strongly agreed with the following:
Calls regarding changes to patient clinical status were appropriate in frequency (62%)
PTTS kept them better informed (62%)
PTTS resulted in consistent and prompt care (75%)
PTTS had positively impacted the care given to children on the unit (38%) and children who were deteriorating (74%)
PTTS had prevented codes (57%)
Key: C-CHEWS: Cardiac Children's Hospital Paediatric Early Warning Score; CEWT: Children’s Early Warning Tool; MET: Medical Emergency team; NS:
Not stated; PEW: Paediatric/Pediatric Early Warning; PEWS: Paediatric/Pediatric Early Warning System; RRS: Rapid Response System; VAS: Visual
analoge scale

132
2.4 Discussion
Paediatric track and trigger systems are now an established part of care for children
in hospital. Most paediatric centres report using them.43 There is striking diversity in
the components, thresholds and efficacy of the systems. The Paediatric Early
Warning System Score I138 remains the most complex, with nineteen parameters. By
contrast, the Paediatric Early Warning Score I39,118 and its
derivatives48,144,170,177,180,182 have far fewer parameters (three to five). However, these
‘simpler’ systems are constituted from parameters which have three to four sub-
parts requiring assessment. For example, the ‘cardiovascular’ parameter in the
Paediatric Early Warning Score I requires assessment of skin colour, capillary refill
time and heart rate, whilst the ‘respiratory’ parameter combines respiratory rate,
oxygen therapy, tracheal tug and other signs of respiratory effort. Within these
‘simpler’ systems clinicians often had to make independent judgments of the
‘normal’ values for heart rate and respiratory rate. It is also unclear what score they
should assign if the clinical features identified were spread across two or more ‘sub-
scores’. Therefore it may be that the superficially more complex systems containing
objective and unambiguous scoring frameworks may be simpler for clinicians to use.
Although vital signs appeared frequently, comparison to evidence-based thresholds
for heart rate and respiratory rate184 revealed marked variation between different
PTTS systems. No system had consistent thresholds when mapped against the
centile-derived reference ranges and some had thresholds that crossed the 50th
centile, indicating that activation/escalation would occur with a ‘normal’ vital sign
value. Others had thresholds that sat well outside the 1st or 99th centile, representing
extreme levels of derangement. Most age-dependent PTTS grouped children into
five age-categories, which may account for the ‘bluntness’ of the thresholds when
compared to those derived from percentile curves.
The evidence to support the clinical utility of PTTS is variable. Implemented without
a rapid response team, PTTS did not demonstrate statistically significant relative
reduction in cardiac or respiratory arrest, or mortality. A single study in a specialist
children’s hospital demonstrated a reduction in the rate of invasive ventilation after
unplanned admission to PICU (RR 0.83, 95% CI 0.72 – 0.97). The study predicted
that PTTS implementation would result in 128 fewer patients requiring ventilation
per 1000 unplanned ward to PICU transfers. A separate study set in a community

133
hospital reported a relative reduction in risk of urgent calls to both physician and
respiratory therapists, with a predicted absolute reduction of 17 and six fewer calls
per 1000 patient days respectively. However it is unclear whether low rates of
urgent calls is a desirable outcome that ultimately benefits patients.
When implemented as part of a rapid response team, PTTS demonstrated more
positive results and the evidence overall was of moderate quality. This would
support the ethos of the safe system framework,33 where improvements in the
management of the deteriorating child are likely to emerge through attention to the
system of care rather than implementation of any one single intervention. There was
a statistically significant reduction in the relative and absolute risk of death in
hospital, death on the ward and death following PICU transfer. Childhood mortality
remains a rare but devastating event. The contributing factors are complex, but the
failure to recognise serious illness and correctly interpret physical signs correctly
has been cited as a significant factor.1 This review demonstrates the potential of
PTTS and associated interventions to reduce the number of in-hospital deaths by an
estimated 31 cases per 10,000 hospital admissions. Given the rarity of childhood
death, this is a significant improvement.
PTTS as part of a package of interventions also had a positive impact on cardiac
and respiratory arrests on the ward. When examined separately the evidence was
low level, however studies that combined the outcome were of moderate quality.
Again, the events are relatively rare and although a significant reduction was seen in
the RR, the predicted absolute effect was low, with only one fewer predicted cardiac
arrests on the ward per 10,000 non-ICU admissions, and 11 fewer ward intubations
per 10,000 discharges. In 2009 the short-term financial cost per event was
estimated at £3884 for cardiac arrest and £3569 for respiratory arrest.189 The
emotional cost, particularly for children and their families, cannot be overestimated.
Unplanned transfer to the PICU generally increased post-rapid response team
implementation, but studies did not achieve statistical significance. Only the metric
of unplanned PICU transfers requiring vasopressors within the first hour was
statistically significant, however the effect was not sustained and at 12 hours post-
transfer there was no difference between the groups.
Many of the metrics used to assess the outcomes did not achieve statistical
significance. The relatively low incidence of these events means that many years of

134
data are required to achieve studies with sufficient statistical power, prompting calls
for valid, yet pragmatic measures to be adopted.168
There is low level evidence of the predictive validity of PTTS in detecting children at
risk of cardiopulmonary arrest or admission to a higher level of care. There remains
very low evidence about the ability to predict mortality. The evidence arises from the
single centre study in a resource limited setting. This may simply reflect the study
power issue with relatively low rates of unexpected deaths in hospital in developed
countries.
Scoring systems are generally used with a decision-algorithm, which indicates the
appropriate action to be taken for the PTTS score. This facilitates a graded
response, where low scores prompt review by the nurse in charge of the ward and
high scores require referral to a senior clinician. However, effective use requires
appropriate assessment of the degree of risk indicated for each score. To date, no
studies have analysed the calibration of score-based PTTS, therefore it is unclear
whether the decision-algorithms advocated by differing PTTS scores are appropriate
for the degree of risk. Despite this, the evidence on validity suggests that score-
based PTTS may be more effective than trigger-based systems.
2.4.1 Limitation of the systematic review
This updated systematic review was restricted to published PTTS and it is highly
likely that there are many more unpublished systems in clinical practice that may
have undergone local evaluation and examination. There is a potential risk of bias
through non-publication of studies with equivocal or negative results (publication
bias).190
Most studies have been conducted in specialist children’s hospitals and the results
may have limited applicability to secondary care settings due to the different mix of
patients and staffing.
2.4.2 Implications for practice
The initial systematic review highlighted the lack of evidence to support PTTS.
Validity, utility and reliability were largely unknown. More robust research was called
for before more widespread adoption.4 Over the course of the PhD process the

135
situation has improved. The evidence is stronger for PTTS as part of a package of
interventions. This may reflect the complexities of healthcare delivery and support
the approach advocated by the safe system framework.33 Management of complex
conditions is rarely resolved by a single intervention, and this may explain the
popularity of packages of interventions or ‘care bundles’.191,192
There remains no consensus on what type of PTTS should be implemented, or on
the constituent parameters. Score-based systems may have benefits over trigger
systems. They offer the opportunity to implement a graded response, which may be
a better use of resources and expertise. This may be most relevant in centres
without access to a rapid response team. Score-based systems have also had more
extensive evaluation and demonstrated better sensitivity. Currently the Bedside
PEWS has been the most intensively evaluated. This score was developed and
tested in a single tertiary centre, but has undergone several further evaluations in
other settings and is currently being tested in a multi-centre, international cluster-
randomised trial in 22 hospitals.10 As such, it appears to be the most appropriate
choice for centres looking to implement a PTTS.
2.5 Conclusion
This chapter has contributed to the body of knowledge of PTTS through a rigorous
and systematic examination the literature. The low overall level of evidence on
PTTS has been highlighted. Most studies have failed to demonstrate that PTTS
have a positive impact on clinical outcomes. The reasons for this are complex but
validity, reliability and utility require further research. Validity and particularly
predictive performance remain largely unknown. Only 14 of the 33 identified
systems have undergone evaluation of predictive performance and performance
between differing PTTS was only compared in a single study. Pooled analysis was
largely not possible because of the different outcome and metrics that were
evaluated.
The next chapter will compare the predictive validity of 18 PTTS and explore
whether performance can be improved by the addition of evidence based heart and
respiratory rate thresholds.

136
Chapter 3 Validity: an observational study of 18 paediatric track and trigger systems in a paediatric hospital
3.1 Introduction
In the previous chapter the literature on paediatric track and trigger systems (PTTS)
was systematically reviewed. Gaps were identified in the evidence for validity,
particularly predictive performance. In this chapter performance of 18 PTTS will be
compared to determine if performance varies. Recently published evidenced-based
thresholds for heart and respiratory rate have been proposed as offering potential to
improve existing PTTS. They may also offer the opportunity to adapt the adult
National Early Warning Score146 (NEWS) to a paediatric population, with possible
benefits in terms of staff training, improved communication and greater synergy
between paediatric and adult services. Therefore the performance of the NEWS in a
paediatric population will also be evaluated. Examining the performance of PTTS
has the potential to inform decision-making regarding the choice of PTTS. Selection
of a high performing PTTS may improve the ‘recognition of deterioration’ component
of the safe system framework.33
A retrospective case-control methodology was selected as this allowed comparison
between and across multiple PTTS without interfering with patient care. As validity is
largely unknown this was appropriate to protect patients whilst conducting the
research. It also allowed comparison to be made on the basis of clinical signs and
observations that had been documented without knowledge of the resulting PTTS
score.
3.2 Aim
The aim of this study was to compare the performance of PTTS in predicting critical
deterioration in a UK tertiary referral children’s hospital.
A secondary aim was to examine if any limitations in the performance of these
PTTS could be improved by substitution of evidence-based thresholds derived from
percentile curves for heart and respiratory rate.185

137
3.2.1 Hypothesis
H1: Predictive validity, as assessed by the area under the receiver operator
characteristic curve (AUROC), varies between differing PTTS
H2: The current PTTS in clinical use, the Children’s Early Warning Score (CEWS),
has significantly worse performance that other published PTTS
H3: Predictive validity of PTTS, as assessed by the AUROC, can be improved by
substitution of percentile-derived thresholds for heart and respiratory rate
3.2.2 Setting
The studies reported in Chapters three to five took place in a tertiary specialist
children’s hospital in central London. There are in excess of 50 different paediatric
clinical specialties. The hospital receives in excess of 240,000 visits per year (in-
patient admissions and out-patient visits). Most children have complex and/or rare
health problems which are life-threatening or life limiting.
There were 25 wards at the time of data collection for the studies. Two wards were
exclusively for international and private patients and had a range of specialities. The
remaining wards admitted children from a small number of related sub-specialities.
There were no ‘general paediatric wards’. Where multiple specialities co-existed on
a single ward, these were closely related, for example neurology and neurosurgery
and gastroenterology, endocrinology and metabolic medicine. Although children
were often seen by multiple teams and differing professionals they were cared for
on the ward associated with their ‘primary specialist’. As such, wards were
considered a proxy match for diagnostic specialty.
At the time of the study standard protocols were in place for recording and
documenting of vital signs, which nurses were informed of at induction and yearly
intervals thereafter. Medical staff were received information on the PTTS on
induction and were also updated at yearly intervals. The PTTS protocol mandated
recording of a full set of vital signs within two hours of the start of the 12-hour shift.
Elevated PTTS scores required repeat vital sign recording after 30 minutes. On-
going frequency of recording was at the discretion of the bedside nurse.

138
3.3 Methods
A retrospective case-control study design was chosen as this was the most
appropriate methodology to compare multiple differing PTTS without exposing
patients to unnecessary risk. A cohort methodology was considered, however given
the relatively small number of critical deterioration events per year this would
exceed the resources available both in terms of researcher time and PhD duration if
results were to be statistically significant. A two-year retrospective study would yield
approximately 300 cases, which was considered sufficient by a statistician to
demonstrate significant results at a p value of <.05.
3.3.1 Selection of Paediatric Track and Trigger Systems
As different PTTS were going to be compared based on existing data, not all of the
PTTS identified in the systematic review (Chapter 2) were suitable for inclusion in
this study.
A number of PTTS required knowledge of the patient’s baseline vital signs or
included subjective assessments; these were excluded. Components of the
remaining systems were reviewed to confirm that they could be extracted from the
healthcare records. Criteria for data extraction were developed for included
parameters (Table 3.2) together with the weighting framework for scoring systems.
Minor inconsistencies such as overlapping age bandings were modified in a
consistent manner to facilitate score calculation. These modifications can be seen at
Appendix 1. The NEWS has been recommended by the Royal College of Physicians
for use across adult services in the National Health Service (NHS).193 This was
included to evaluate whether there was potential to adapt this tool for use with
children. As this system was designed to identify deterioration in adults, evaluation
of the unmodified NEWS was restricted to children aged 12 years and over. The
local hospital’s unvalidated PTTS (CEWS) was also included.
3.3.2 The Children’s Early Warning Score
The PTTS in use at the time of the study was the Children’s Early Warning Score or
CEWS. This was an age-dependent scoring system which was developed locally
based on the Advanced Paediatric Life Support Guidance.15 It had six component
parameters: temperature, heart rate, blood pressure, respiratory rate,

139
consciousness measured using the AVPU scale (Alert - Responding to Voice -
Responding to Pain - Unresponsive), and oxygen saturation.
Vital signs were assessed by the bedside nurse and the values documented on the
CEWS chart. Each vital sign parameter had an allocated section on the CEWS
chart, with the exception of heart rate and blood pressure, which were charted in the
same section. Temperature, respiratory rate, heart rate and blood pressure were
charted on a graphical scale, whilst AVPU and oxygen saturation were entered into
a table.
Each component parameter was then allocated a score from zero up to four
(Appendix 2.1). The score was dependent on the degree of abnormality, with higher
scores indicating a greater degree of variance from the ‘normal’ thresholds
described in the APLS guidance.15 The parameters of temperature, oxygen
saturation and AVPU were assessed against a standardised scoring matrix
regardless of the child’s age. Heart rate, respiratory rate and blood pressure were
assessed against one of four age-dependent scoring matrixes. Age ranges were in
line with APLS recommendations: up to one year, one year to four years, five years
to 11 years and 12 years and over.173,194 As the vital sign CEWS scores were
embedded in the observation chart, there were four versions of the observation
charts, one for each age-range. In addition, the chart had sections for recording the
vital sign monitoring plan and presence of supplemental oxygen therapy. An
example of the CEWS observation charts can be seen at Appendix 2.1.
Each vital sign parameter was entered onto the chart and the individual parameter
sub-score determined. Parameter sub-scores were then combined to produce the
overall CEWS score.
3.3.3 CEWS escalation plan
The overall CEWS score was linked to an escalation plan identifying the action to be
taken (Appendix 3). Higher scores indicated greater physiological derangement.
This is purported to be associated with increasing risk of critical deterioration and
prompted increasingly swift and more senior action.
Scores of zero or one were considered to indicate a child at low risk of deterioration,
with vital sign parameters at or close to normal values. No action was required as
part of the response. Scores of 2-4 were considered to indicate medium risk. This

140
prompted the vital sign parameters and PTTS score to be repeated and the child
reviewed by a senior clinician. Scores at or above five were considered to indicate
high risk. Vital sign parameters should be repeated and the child promptly reviewed
by a senior clinician and specialist personnel from the intensive care outreach team.
The intensive care outreach team comprised a senior doctor and senior nurse
experienced in paediatric critical care. Both members of the team were required to
attend children with a CEWS score of five and above. However staff were aware
that they could call the intensive care outreach nurse at any time if they had
concerns or questions about the child’s condition. Both the nurse and doctor were
members of the hospital’s clinical emergency team, which would be activated for an
actual or imminent respiratory or cardiac arrest.
3.3.4 Participants
Patient’s who suffered a critical deterioration event were designated ‘cases’ (Table
3.1). Case patients were identified from the Paediatric Intensive Care Audit Network
database (PICANet),195 the hospital resuscitation database and cross-referenced
against intensive care admission records. Patients present on the ward for less than
two hours before the event were excluded as this was considered the minimum time
for the child to be assessed, clinical signs recorded and action to be taken. Each
case patient was matched with a single control, present on the same ward at the
same time. Wards were considered a proxy match for diagnostic speciality.

141
Table 3.1 Conditions constituting critical deterioration
Condition Definition
Cardiac arrest Chest compressions administered for absent or poor pulse
Respiratory arrest Rescue breaths administered via mouth-to-mouth, bag-valve-mask or emergency intubation on ward
Unplanned admission to critical care
An admission that was not expected and is therefore classed as an emergency.
Includes children who are admitted from the operating room where surgery is not the main reason for admission (e.g. child who is taken to the anaesthetic room for emergency intubation due to difficult airway)
Unexpected death Death on the ward without the presence of a ‘do not attempt resuscitation' (DNAR) order or end of life care pathway
3.3.4.1 Inclusion criteria
Participants were admitted to the hospital between the 1st January 2011 and 31st
December 2012.
3.3.4.2 Exclusion criteria
To ensure at least one set of observations could be extracted, control patients
present on the ward for less than 24 hours were excluded, with the exception of
wards classified as providing short stay/day case care where the threshold was four
hours. Patients who suffered a critical deterioration event within the following 48
hours and/or having a ‘do not attempt resuscitation order’ were excluded.
3.3.4.3 Matching procedure
The ward at the time of each case patient’s critical deterioration event was
identified. If the event took place outside of the ward, such as in x-ray, the ‘home
ward’ where the child was currently nursed was used.
Eligible participants present on the ward at that time were identified from the
hospitals registration system and sorted into order of age. The child closest in age to
the case patient was identified. The healthcare record was then examined and the
CEWS chart for the previous 48-hours was identified. If healthcare records were
unavailable or the relevant vital sign record was missing, the patient was excluded

142
and a new control was sought using the same procedure. Patients previously
entered into the study were eligible to act as a control.
3.3.5 Ethical issues
This study was assessed by the hospital’s clinical audit department and was
designated a service evaluation project. As such the study was considered exempt
from approval from a Research Ethics Committee and the local clinical research
committee. The project was registered with the clinical audit department (registration
number 1489).
3.3.6 Data extraction:
Clinical data were extracted from the healthcare record of case patients for a period
of 48 hours before the critical deterioration event. Data from controls were extracted
for the same 48-hour period. Data were extracted using a standardised pro-forma.
Vital signs were extracted as continuous variables. Respiratory effort was assessed
retrospectively as mild, moderate or severe using standardised criteria.196
Dichotomous variables were assessed using criteria in Table 3.2.
Data were collected by the candidate (588 participants) and a prospective medical
student working under the candidate’s supervision (20 participants).

143
Table 3.2 Data extraction criteria
Variable Descriptor Value
Abnormal airway (not tracheostomy)
Documented structural abnormality or admission for investigation of persistent stridor
0 (No), 1 (Yes)
Acquired or congenital heart disease
Documented diagnosis 0 (No), 1 (Yes)
Apnoea Documentation of the terms 'apnoea', 'breath holding', 'respiratory arrest'
0 (No), 1 (Yes)
AVPU Documented value Continuous value
Blood gas values Documented value Continuous value
Capillary refill time Documented value Continuous value
Cardiac arrest Requirement for cardiac compressions and/or defibrillation.
0 (No), 1 (Yes)
Central venous line Presence of any central venous line 0 (No), 1 (Yes)
Clinically tiring/ impending or complete airway obstruction
Documentation of exhaustion, tiring, or outreach review for severe respiratory distress
0 (No), 1 (Yes)
Convulsion Documented convulsion +/- administration of rescue anticonvulsants
0 (No), 1 (Yes)
Cyanotic heart disease Diagnosis of cyanotic heart lesion which had not been corrected
0 (No), 1 (Yes)
Diabetic ketoacidosis Documented actual or differential diagnosis 0 (No), 1 (Yes)
Gastrostomy Excludes oro- or naso-gastric tube 0 (No), 1 (Yes)
Heart rate Documented value Continuous value
Home oxygen Evidence of home oxygen therapy immediately before admission
0 (No), 1 (Yes)
Hyperkalaemia>6.0 Documented potassium value of greater than 6 0 (No), 1 (Yes)
Long term ventilation Diagnosis of long term ventilation/CPAP or admission to LTV ward
0 (No), 1 (Yes)
Medication sub-score Number of prescribed medications, not individual doses
Continuous value
Meningococcus Documented actual or differential diagnosis of meningococcus or presence of purpuric rash
0 (No), 1 (Yes)
Nebulised adrenaline Administration of adrenaline nebuliser 0 (No), 1 (Yes)

144
Variable Descriptor Value
Nebulisers Documentary evidence of continuous nebulisers or greater than 3 nebulisers in one hour
0 (No), 1 (Yes)
Number of specialities Documentary evidence of review by differing speciality during data extraction period
0 (No), 1 (Yes)
Oxygen therapy Documented value as fraction of inspired oxygen or percentage
Continuous value
Oxygen saturation Documented value Continuous value
Parental concern Documentary evidence of parental concern/anxiety/worry
0 (No), 1 (Yes)
Persistent vomiting post-surgery
3 or more vomits in the 4 hours post-surgery 0 (No), 1 (Yes)
Pre-transplant Evidence of presence on transplant list or pre-transplant work-up
0 (No), 1 (Yes)
Pulses Documentary evidence of poor peripheral pulses
0 (No), 1 (Yes)
Respiratory arrest Requirement for bag-value-mask or intubation on the ward
0 (No), 1 (Yes)
Respiratory effort Documentary evidence of increased respiratory effort classified according to adapted WHO criteria
196
Mild=1, Moderate =2, Severe/ apnoea=3
Respiratory rate Documented value Continuous value
Severe cerebral palsy Documented diagnosis 0 (No), 1 (Yes)
Severe developmental delay, neuro /neuromuscular
Documented diagnosis. Excludes mild developmental delay
0 (No), 1 (Yes)
Signs of shock Documentation of the terms 'shocked', 'mottled', 'poor perfusion'
0 (No), 1 (Yes)
Staff concern Documentary evidence of healthcare professional concern/anxiety/worry, or request for review by nurse in charge or medical staff
0 (No), 1 (Yes)
Stridor/airway threat Any documentation of stridor or threatened airway
0 (No), 1 (Yes)
Systolic blood pressure Documented value Continuous value
Temperature Documented value Continuous value
Tracheostomy Presence of tracheostomy 0 (No), 1 (Yes)

145
Variable Descriptor Value
Transplant Any organ transplant, bone marrow or stem cell transplant
0 (No), 1 (Yes)
Unresolved pain Persistent pain requiring referral to acute pain service
0 (No), 1 (Yes)
If unclear, parameter scored as 0
3.3.6.1 Data entry
Data were electronically checked for internal consistency and manually checked for
accuracy. Inconsistencies were resolved by reviewing the data extraction proforma
and the healthcare records.
3.3.6.2 Paediatric Track and Trigger System score calculation
A recording of one or more vital signs was considered as an observation data set.
Using the formulas function in Excel, the scores for each parameter within each
PTTS were calculated for each observation data set. If the system contained
overlapping thresholds these were modified so the calculated score would be at the
lesser rather than the greater value. The most common modification was the
addition of ‘greater than’ or ‘less than’ before a threshold. A summary of
modifications made to the age-ranges for each PTTS can be seen at Appendix 1. If
any of the observations required to complete the score were missing these were
presumed to be normal (score zero), consistent with clinical practice at the time.
For score-based systems the individual parameter scores were calculated and then
summed and this value represented the total PTTS score. For trigger systems, each
parameter was considered as scoring one if breeched or zero if not. Trigger systems
were considered to have been activated if one or more parameters were breeched
(i.e. if the score was one or above). In order to assess if trigger systems might
function significantly better as a score-based system the individual parameter
scores were also summed. This value was considered to be the total PTTS score
when the system was assessed as a scoring system.
3.3.6.3 Modifying PTTS with percentile values
Each PTTS system was modified to incorporate percentile derived thresholds for
heart and respiratory rate. Percentile values were available for the 1st, 10th, 50th, 90th

146
and 99th percentile for healthy children and the 1st, 5th, 10th, 50th, 90th, 95th and 99th
percentile for hospitalised children.
Modification followed a standardised procedure. Five weighting frameworks for the
PTTS were identified. These were matched with the available centile thresholds.
Values between the 10th and 90th percentile were considered to be ‘normal’ and
therefore assigned a weighting of ‘0’. The 99th percentile was considered grossly
abnormal and assigned the highest weighting. Remaining weightings were then
distributed across the available percentile thresholds. If the number of weighting
thresholds exceeded the number of available percentile values the higher weighting
was excluded, on the basis that it was preferable to under rather than over score.
The total PTTS score and trigger activation for these modified PTTS were then
calculated according to the process described in Section 3.3.6.2.
The percentile values assigned to the weighting framework can be seen in Table 3.4
and Table 3.4.
Table 3.3 Framework to identify the appropriate percentile value (healthy children) to be applied to the respiratory and heart rate parameter score dependent on the PTTS weighting framework
Percentile value
Weighting framework within PTTS
0,1,2,3 0,1 0,1,2 0,1,2,4 0,1,2,3,4
99th 3 1 2 4 4
90th 1 0 1 1 1
Values in between
0 0 0 0 0
10th 1 0 1 1 1
1st 3 1 2 4 4
The range of weighting scores for heart and respiratory rate are matched with the weighting
framework. The heart and respiratory rate thresholds for each given score are then modified
using the identified percentile value184

147
Table 3.4 Framework to identify the appropriate percentile value (hospitalised children) to be applied to the respiratory and heart rate parameter score dependent on the PTTS weighting framework
Percentile value
Weighting framework within PTTS
0,1,2,3 0,1 0,1,2 0,1,2,4 0,1,2,3,4
99th 3 1 2 4 4
95th 2 1 1 2 2
90th 1 0 1 1 1
Values in between
0 0 0 0 0
10th 1 0 1 1 1
5th 2 1 1 2 2
1st 3 1 2 4 4
The range of weighting scores for heart and respiratory rate are matched with the weighting
framework. The heart and respiratory rate thresholds for each given score are then modified
using the identified percentile value184
3.4 Data analysis
Analysis was performed using SPSS and r (www.cran.r-project.org). Characteristics
of cases and controls were compared with the Mann Whitney U-test for continuous
variables and Chi-squared for categorical variables.
The maximum observed value for each PTTS for each patient in the 48 hours before
the event was used in the comparison. The final hour of data before the
deterioration event in the case patient was censured to establish if the PTTS could
identify critical deterioration with at least one hour’s notice. The AUROC were
calculated for each PTTS and the PTTS were ranked from highest to lowest
AUROC value.
To assess if published systems demonstrated better performance the AUROC of
each PTTS was then compared to the local PTTS (the CEWS). The AUROC values
were transformed into a z-score. Z-scores indicate the number of standard
deviations above or below the area under the curve of the CEWS.197 Standardising
the AUROC values in this way facilitates meaningful comparison between the

148
differing systems. A z-score of zero would indicate no difference. A z-score of one
would indicate a value that is one standard deviation greater, whilst a z-score of -1
indicates one standard deviation less than the AUROC value of the CEWS. The
AUROC values were compared using the Delong's test for correlated curves.198 As
this would result in multiple comparisons of the AUROC, significance testing was
adjusted with Bonferroni’s correction to avoid type I errors.199 Type I errors result in
the rejection of the null hypothesis when there is no significant difference in the
performance of the PTTS.200 p-values <.0025 were therefore considered significant.
The process was repeated to compare the highest ranked PTTS to the remaining
systems.
3.4.1.1 Trigger systems
The performance of trigger systems was primarily assessed at a score of one.
However to assess if trigger systems had significantly better performance when they
functioned as a scoring system, AUROC were compared using the method
described above.
3.4.1.2 Modification of PTTS with percentile values
The AUROC of PTTS after modification of thresholds with percentile values for heart
and respiratory rate were calculated and the significance of the difference assessed
pairwise between each PTTS and its modified version using the analysis described
above.
3.4.1.3 Performance measures
Measures of performance, such as sensitivity, specificity, positive predictive value,
negative predictive value, likelihood ratio positive test and likelihood ratio negative
test were calculated for each PTTS.
Trigger-based PTTS systems are amenable to comparison as values are calculated
on the same threshold, namely the breeching of a single ‘trigger’ which is equivalent
to a score of one. However score-based systems result in a range of scores, each
with differing values for the performance indicators. As the range of scores within
differing PTTS systems varies, this can make comparison of the performance
indicators between differing PTTS challenging.

149
In order to compare the performance of differing score-based PTTS, it was
necessary to select the scoring threshold for comparison in a uniform manner.
Previous studies have described the calculation of an ‘optimal score’.133 This is the
scoring threshold which results in the maximum value for the sum of the sensitivity
and specificity. Although the optimal score facilitates comparison between differing
PTTS systems and demonstrates the maximum combined value for sensitivity and
specificity, it may not be a clinically appropriate threshold which would be used in
practice. However it does offer a way to compare differing PTTS systems in a
uniform manner.
The optimal score for each scoring system was identified,137 and the sensitivity,
specificity, positive predictive value, negative predictive value, likelihood ratio
positive test and likelihood ratio negative test were calculated. The numbers of case
and control patients who would be correctly and incorrectly identified at this
threshold were calculated.
3.4.1.4 Time from optimal score to event
For case subjects who triggered the optimal score the time from the first recorded
optimal score to the event was calculated. The median time was calculated with the
inter quartile range.
3.5 Results
3.5.1 Eligible systems
The systematic review in chapter two identified 33 PTTS. Nine contained
parameters requiring subjective assessment, six required knowledge of the baseline
vital signs and one inadequately described the component parameters: these were
excluded from further analysis. Seventeen PTTS remained. Systems with the same
name were numbered in order of publication to distinguish between them (Table 2).
In order to evaluate whether the national system for adults could be adapted to
predict deterioration in children, the NEWS was also included. To evaluate
performance against the current system in use the local unpublished system
(CEWS) was also evaluated. This resulted in 18 paediatric and one adult system for
comparative evaluation.

150
3.5.1.1 Characteristics and component parameters
Thirteen PTTS were categorised as ‘scoring’ and six as ‘trigger’ systems. The
number of component parameters varied from three to 19. Some systems combined
two or more variables within a single parameter, for example oxygen therapy and
saturation values. Forty variables either alone or in combination were identified, as
shown in Table 3.2.
3.5.1.2 Vital signs
Vital signs featured prominently in all systems. All 19 include heart and respiratory
rate, 15 included oxygen saturation (78.9%) and 12 blood pressure (63.2%).
Temperature was a component of only seven systems (36.8%). Thirteen had age-
specific criteria for one or more vital signs embedded in the PTTS. Five provided
supplemental guidance on age-specific ‘normal values’. Five weighting frameworks
were identified across the 13 scoring systems with four PTTS also incorporating
additional points for risk factors. Differences between systems were often minor.
The maximum scores varied from seven to 32.

151
Table 3.5 Key characteristics and parameters of the PTTS
System
PT
TS
ch
ara
cte
ri
stics
Parameters (scored using weighting framework) Additional risk factors
We
ightin
g fra
mew
ork
Vital signs Concern Other parameters
Name, first citation
Sco
re o
r tr
igg
er
Ma
xim
um
sco
re
Ag
e r
ang
es
Pa
ram
ete
rs (
n)
Hea
rt r
ate
Resp
ira
tory
ra
te
Oxyg
en
satu
ratio
n
Systo
lic B
P
Cap
illa
ry r
efill
tim
e
Te
mpe
ratu
re
Sta
ff c
on
ce
rn
Pa
ren
t c
once
rn
Resp
ira
tory
Be
ha
vio
ur
Card
iova
scu
lar
Con
scio
usn
ess
Se
izu
re
Resp
ira
tory
dis
tress
Air
way th
rea
t
Oxyg
en
th
era
py
Bedside PEWS154
S 26 5 7 ✓ ✓ ✓ ✓ ✓ ✓ ✓ 0,1,2,4
Bristol PEW tool42
T 13 1 14 ✓ ✓ ✓
1 ✓ ✓ ✓ ✓ ✓ Apnoea ±bradycardia; DKA; clinically
tiring or complete airway obstruction; hyperkalaemia; nebulised adrenaline; signs of shock (e.g. poor perfusion, ± low BP); suspected meningococcus
Trigger
Cardiff and Vale PEWS
137
S 8 5 8 ✓ ✓ ✓ ✓ ✓ ✓ ✓ ✓ ✓ 0, 1
Children’s Early Warning Tool
67
S 24 4 9 ✓ ✓ ✓ ✓ ✓ ✓ ✓ ✓ ✓ 0,1,2,3
ITAT162
S 8 5 4 ✓ ✓ ✓ ✓ 0,1,2
MET AC I40
T 9 5 9 ✓1 ✓ ✓ ✓ ✓ ✓ ✓ ✓ ✓ Cardiac/respiratory arrest; apnoea or
cyanosis Trigger

152
System
PT
TS
ch
ara
cte
ri
stics
Parameters (scored using weighting framework) Additional risk factors
We
ightin
g fra
mew
ork
Vital signs Concern Other parameters
Name, first citation
Sco
re o
r tr
igg
er
Ma
xim
um
sco
re
Ag
e r
ang
es
Pa
ram
ete
rs (
n)
Hea
rt r
ate
Resp
ira
tory
ra
te
Oxyg
en
satu
ratio
n
Systo
lic B
P
Cap
illa
ry r
efill
tim
e
Te
mpe
ratu
re
Sta
ff c
on
ce
rn
Pa
ren
t c
once
rn
Resp
ira
tory
Be
ha
vio
ur
Card
iova
scu
lar
Con
scio
usn
ess
Se
izu
re
Resp
ira
tory
dis
tress
Air
way th
rea
t
Oxyg
en
th
era
py
MET AC III141
T 9 5 9 ✓1 ✓ ✓ ✓ ✓ ✓ ✓ ✓ ✓ ✓ Cardiac/respiratory arrest; apnoea or
cyanosis Trigger
Modified Bristol PEWS
169
T 15 5 16 ✓1 ✓2 ✓ ✓ ✓ ✓ ✓ Apnoea ±bradycardia; Clinically tiring
or complete airway obstruction; Hyperkalaemia; Marked increased work of breathing; Nebulised adrenaline (or no improvement); pH <7.2, Poor perfusion, ± low BP, large central/peripheral temp gradient; Unresolved pain on current anagesia therapy
Trigger
MPEWS I170
S 9 1 3 ✓ ✓ ✓ ✓ ✓ ✓ ✓ 0,1,2,3

153
System
PT
TS
ch
ara
cte
ri
stics
Parameters (scored using weighting framework) Additional risk factors
We
ightin
g fra
mew
ork
Vital signs Concern Other parameters
Name, first citation
Sco
re o
r tr
igg
er
Ma
xim
um
sco
re
Ag
e r
ang
es
Pa
ram
ete
rs (
n)
Hea
rt r
ate
Resp
ira
tory
ra
te
Oxyg
en
satu
ratio
n
Systo
lic B
P
Cap
illa
ry r
efill
tim
e
Te
mpe
ratu
re
Sta
ff c
on
ce
rn
Pa
ren
t c
once
rn
Resp
ira
tory
Be
ha
vio
ur
Card
iova
scu
lar
Con
scio
usn
ess
Se
izu
re
Resp
ira
tory
dis
tress
Air
way th
rea
t
Oxyg
en
th
era
py
MPEWS II79
S 26 5 18 ✓ ✓ ✓ ✓ ✓ ✓ ✓ ✓ ✓ CVL; IV bolus fluid or blood product within past 4 hours
Abnormal airway or positive pressure ventilation; Active acquired/congenital heart disease or history of heart surgery; Home oxygen; Pre/post any transplant; Gastrostomy or jejunostomy tube; Previous ICU admission; Severe developmental, neurological or neuromuscular disease
0,1,2
MPEWS III172
S 28 5 8 ✓ ✓ ✓ ✓ ✓ ✓ ✓ ✓
NHSI PEWS173
S 7 4 7 ✓ ✓ ✓ ✓ ✓ ✓ ✓ Stridor or apnoea 0,1
PEW score III176
S 10 1 4 ✓ ✓ ✓ ✓ ✓ ✓ ✓ ✓ 0,1,2,3

154
System
PT
TS
ch
ara
cte
ri
stics
Parameters (scored using weighting framework) Additional risk factors
We
ightin
g fra
mew
ork
Vital signs Concern Other parameters
Name, first citation
Sco
re o
r tr
igg
er
Ma
xim
um
sco
re
Ag
e r
ang
es
Pa
ram
ete
rs (
n)
Hea
rt r
ate
Resp
ira
tory
ra
te
Oxyg
en
satu
ratio
n
Systo
lic B
P
Cap
illa
ry r
efill
tim
e
Te
mpe
ratu
re
Sta
ff c
on
ce
rn
Pa
ren
t c
once
rn
Resp
ira
tory
Be
ha
vio
ur
Card
iova
scu
lar
Con
scio
usn
ess
Se
izu
re
Resp
ira
tory
dis
tress
Air
way th
rea
t
Oxyg
en
th
era
py
PEW score IV177
S 13 1 4 ✓ ✓ ✓ ✓ ✓ ✓ ✓ 15 minute nebulisers or vomiting post-op
0,1,2,3
PEW system score I
138
S 32 5 19 ✓ ✓ ✓ ✓ ✓ ✓ ✓ ✓
>3 medical specialities involved in care; abnormal airway (not tracheostomy); CVL; gastrostomy; home oxygen; medication score; previous admission to ICU; severe cerebal palsy; transplant recipient
0,1,2,3
PMET triggers II
181
T 7 5 7 ✓ ✓ ✓1 ✓ ✓ ✓ ✓ ✓ ✓ Trigger
THCS MET criteria
183
T 7 1 7 ✓ ✓ ✓1 ✓ ✓ ✓ ✓ ✓ ✓ ✓ ✓ Poor peripheral pulses, mottled
extremities Trigger

155
System
PT
TS
ch
ara
cte
ri
stics
Parameters (scored using weighting framework) Additional risk factors
We
ightin
g fra
mew
ork
Vital signs Concern Other parameters
Name, first citation
Sco
re o
r tr
igg
er
Ma
xim
um
sco
re
Ag
e r
ang
es
Pa
ram
ete
rs (
n)
Hea
rt r
ate
Resp
ira
tory
ra
te
Oxyg
en
satu
ratio
n
Systo
lic B
P
Cap
illa
ry r
efill
tim
e
Te
mpe
ratu
re
Sta
ff c
on
ce
rn
Pa
ren
t c
once
rn
Resp
ira
tory
Be
ha
vio
ur
Card
iova
scu
lar
Con
scio
usn
ess
Se
izu
re
Resp
ira
tory
dis
tress
Air
way th
rea
t
Oxyg
en
th
era
py
CEWS (local PTTS)
S 21 4 6 ✓ ✓ ✓ ✓ ✓ ✓ 0,1,2,3,4
NEWS (adult) S 20 1 7 ✓ ✓ ✓ ✓ ✓ ✓ ✓ 0,1,2,3
Key: Indicators combined within a single parameter are presented in coloured text / ✓. All studies are single centre unless otherwise stated.
1 Separate
parameters for children with and without cyanotic heart disease; 2 following one bolus of 10mls/kg fluid
Abbreviations: AC: Activation criteria; BP: Blood pressure; CEWS: Children’s Early Warning Score CVL: Central venous line; DKA: Diabetic ketoacidosis;
ICU: Intensive Care Unit; ITAT: Inpatient triage, assessment and treatment score; IV: Intravenous; MET: Medical Emergency Team; MPEWS: Modified
Pediatric Early Warning Score; NEWS: National Early Warning Score; NHSI: NHS Institute; PEW: Paediatric/Pediatric Early Warning; PEWS:
Paediatric/Pediatric Early Warning System; PMET: Pediatric Medical Emergency Team; SVT: Super ventricular tachycardia; THSC: Toronto Hospital for Sick
Children

156
3.5.2 Patient characteristics
Three hundred and nineteen critical deterioration events were identified. In eight
episodes the patient was present on the ward for less than two hours, leaving 311
eligible critical deterioration events in 237 patients. Fourteen case patient records
were missing, leaving a case sample of 297 events in 224 patients. Two hundred
and forty-four control patients were identified for the 311 events.
In total, 13551 observations sets were performed, 8360 on cases and 5191 on
controls. The median number of observation sets per patient per day was 13 for
cases and six for controls. Only 36.4% of observation sets contained the five vital
sign parameters and assessment of consciousness required for complete recording
of the local PTTS.
Case patients were more likely to be female (56.3% vs 46.3%, p=.009), have been
admitted as an emergency (64.6% vs 39.2%, p=<.01) and have a longer hospital
stay (median 57.1 vs 35.9 days, p=<.01). Mortality was also higher for case patients
at 24 hours, 30 days and hospital discharge. A summary of patient characteristics is
shown in Table 3.6.
Table 3.6 Patient characteristics (each patient episode)
Characteristic Cases (n=297)
n (%)
Controls (n=311)
n (%)
P value
Male
Female
130 (43.8%)
167 (56.3)
167 (53.7)
144 (46.3)
.018a
Age
0-<6 months
6 months-<1 year
1-4 years
5-11 years
12-<19y
70 (23.6)
41 (13.8)
101 (34.0)
54 (18.2)
31(10.4)
66 (21.2)
47 (15.1)
108 (34.7)
62 (19.9)
28 (9.0)
.888b
Gestation below 37 weeks 60 (20.1) 48 (15.4) .152a
Weight, median, (interquartile range)
10.4kg (1.71-87.00) 11.1kg (2.10-94.20) .668b

157
Characteristic Cases (n=297)
n (%)
Controls (n=311)
n (%)
P value
Number of previous same hospital admissions
0
1-5
6-10
11 – 20
21 – 50
>50
150 (50.5)
66 (22.2)
29 (9.8)
20 (6.7)
25 (8.4)
7 (2.4)
145 (46.6)
92 (29.6)
27 (8.7)
26 (8.4)
16 (5.2)
5 (1.6)
.946b
Number of previous PICU admissions (excluding this admission)
0
1
2
3 - 5
>5
247 (83.1)
32 (10.8)
15 (5.1)
1 (0.3)
2 (0.7)
276 (88.7)
20 (6.4)
4 (1.3)
5 (1.6)
6 (1.9)
.061b
Number of previous PICU admissions (this admission)
0
1
2
3 - 5
>5
185 (62.3)
75 (25.2)
17 (5.7)
14 (4.7)
6 (2.0)
238 (76.5)
55 (17.7)
14 (4.5)
4 (1.3)
0 (0.0)
<.001b
Admitting specialty
Medical
Surgical
Intensive Care
186 (62.6)
57 (19.2)
54 (18.2)
205 (65.9)
66 (21.2)
40 (12.9)
.19a
Type of admission
Elective
Emergency
105 (35.4)
192 (64.6)
189 (60.8)
122 (39.2)
<.001a
Specialty at event
Medical
Surgical
228 (76.8)
69 (23.2)
237 (76.2)
74 (23.8)
1.0a

158
Characteristic Cases (n=297)
n (%)
Controls (n=311)
n (%)
P value
Critical deterioration event classification
PICU transfer
Respiratory Arrest
Cardiac Arrests
Death on ward
186 (62.6)
84 (28.3)
27 (9.1)
0 (0)
0
0
0
0
N/A
Reason for event
Respiratory
Cardiovascular
Neurological
Other
176 (59.3)
67 (22.6)
38 (12.8)
16 (5.4)
0
0
0
0
N/A
Length of stay in days median, (interquartile range)
57.1 (21.0 – 122.0)
35.9 (12.8 – 89.4)
0.001b
Outcome
Alive at 24 hours
Alive at 30 days
Alive at discharge
279 (93.9)
246 (82.8)
220 (74.1)
311 (100%)
308 (99.0)
301 (96.8)
<.001a
<.001a
<.001a
Key: aChi-squared;
bMann-Whitney U test
Abbreviations: PICU: Paediatric intensive care unit
One hundred and eighty six (62.6%) critical deterioration events were categorised
as unplanned transfers to the PICU, 84 (28.3%) as respiratory arrests and 27 (9.1%)
as cardiac arrests. 31 patients remained on the ward after a cardiac or respiratory
arrest. Six patients died before transfer to intensive care.
3.5.3 Performance of systems
3.5.3.1 Overall predictive performance
The predictive performance across the differing PTTS varied (Table 3.7 and Table
3.8). When placed in rank order the Cardiff and Vale Paediatric Early Warning
System (PEWS) had the highest AUROC at 0.89 (95% confidence interval [CI] 0.86-
0.91). The Bristol PEWS had the lowest at 0.62 (95% CI 0.58-0.67). When
evaluated across children of all ages the adult NEWS had an AUROC of 0.72 (95%
CI 0.67-0.76), which was less than all the paediatric scoring systems. When

159
comparison was restricted to children of 12 years and over, performance improved
to give an AUROC of 0.78 (0.67-0.91). The local PTTS (CEWS) was ranked 9th with
an AUROC of 0.79 (95% CI 0.75-0.82).
Table 3.7 Comparative performance against the CEWS for scoring systems
Scoring systems AUCROC (95% CI) z-score p-value
Cardiff and Vale PEWS 0.89 (0.86-0.91) -7.12 <.001
Bedside PEWS 0.88 (0.85-0.91) -6.49 <.001
Modified PEWS III 0.87 (0.85-0.90) -5.88 <.001
CEWT 0.85 (0.82-0.88) -6.49 <.001
Modified PEWS II 0.85 (0.82-0.88) -3.30 <.001
PEWS III 0.83 (0.80-0.86) -2.63 .009
NHSI PEWS 0.82 (0.79 - 0.86) -2.10 .036
PEWS system score I 0.82 (0.78-0.85) -1.58 .114
PEWS IV 0.79 (0.75-0.82) -0.11 .909
CEWS 0.79 (0.75-0.82) N/A N/A
NEWS (12 years and above) 0.78 (0.67-0.91) 0.04 .968
ITAT score 0.77 (0.74-0.81) 0.75 .453
Modified PEWS I 0.74 (0.70-0.78) 2.10 .036
NEWS (all ages) 0.72 (0.67-0.76) 3.46 .001
z-score values calculated by Dr Samiran Ray
Performance was assessed by calculation of the AUROC. Systems were then ranked and
performance was compared to the local PTTS (CEWS) using the Delong's test for correlated
curves. z-scores represent comparison of mean values. Significance testing was adjusted for
the multiple comparisons of AUROC with Bonferroni’s correction, meaning p-values <.0025
were considered significant.
Abbreviations: AUROC: Area under the receiver operator characteristic curve; CEWS:
Children’s Early Warning Score; CEWT: Children’s Early Warning Tool; CI: Confidence
interval; ITAT: Inpatient triage, assessment and treatment score; NEWS: National Early
Warning Score; NHSI: NHS Institute; PEW: Paediatric/Pediatric Early Warning; PEWS:
Paediatric/Pediatric Early Warning System

160
Trigger systems had lower AUROC values, which would be expected from a
dichotomous system (Table 3.8). Four trigger systems demonstrated similar
performance with an AUROC value of 0.71 to 0.73. The remaining two systems had
considerably worse performance, with an area under the curve value of 0.62. The
majority of trigger systems would be outperformed by the adult NEWS without any
modifications
Table 3.8 Comparative performance against the CEWS for trigger systems
Trigger systems AUCROC (95% CI) z-score p-value
THSC MET calling criteria 0.73 (0.69-0.77) 3.02 .003
MET activation criteria I 0.71 (0.70-0.75) 4.18 <.001
MET activation criteria III 0.71 (0.70-0.75) 4.18 <.001
PMET triggers II 0.71 (0.67 – 0.75) 4.40 <.001
Modified Bristol PEWS 0.62 (0.58-0.67) 8.16 <.001
Bristol PEWS 0.62 (0.58-0.67) 8.27 <.001
z-score values calculated by Dr Samiran Ray
Performance was assessed by calculation of the AUROC. Systems were then ranked and
performance was compared to the local PTTS (CEWS) using the Delong's test for correlated
curves. z-scores represent comparison of mean values. Significance testing was adjusted for
the multiple comparisons of AUROC with Bonferroni’s correction, meaning p-values <.0025
were considered significant.
Abbreviations: AUROC: Area under the receiver operator characteristic curve; CI:
Confidence interval; MET: Medical Emergency Team; PEWS: Paediatric/Pediatric Early
Warning System; PMET: Pediatric Medical Emergency Team; THSC: Toronto Hospital for
Sick Children
3.5.3.1 Comparative performance against the local PTTS (CEWS)
The AUROC curve for each PTTS was compared to local CEWS (AUROC 0.79)
(Table 3.7). The z-scores varied from -7.12 to 8.27. Nine systems demonstrated
better performance and nine had worse performance. When results were adjusted
with Bonferroni’s correction five performed significantly better than the CEWS.
The receiver operator characteristic (ROC) curve of the highest ranked PTTS was
plotted against the ROC curve of the CEWS (Figure 3.1). The 95% confidence

161
interval for the Cardiff and Vale PEWS is in blue, the CEWS in pink. There was no
overlapping of the confidence intervals.
Figure 3.1 Comparison of the receiver operator characteristic curve of the highest performing PTTS and the local PTTS
Figure created by Dr. Samiran Ray.
The receiver operator characteristic curve of the local system (CEWS, AUROC 0.79) was
compared to the highest performing system (Cardiff and Vale PEWS, AUROC 0.89). Shaded
areas represent the 95% confidence intervals.
Key: AUROC: Area under the receiver operator characteristic curve; CEWS: Children’s
Early Warning Score; PEWS: Paediatric Early Warning System
3.5.3.2 Comparative performance against the highest performing PTTS
(Cardiff and Vale PEWS)
The AUROC for each PTTS was compared to the PTTS with the largest value, the
Cardiff and Vale PEWS (AUROC 0.89). The comparative performance of scoring
systems is seen in Table 3.9 and trigger systems in Table 3.10. The z-scores for

162
scoring systems varied from 0.72 to 9.10 and for trigger systems from 9.31 to 16.01.
The difference in area under the curve of the Bedside PEWS and the Modified
PEWS III was not statistically significant. As such, the performance of these three
systems could be considered equivalent.
Table 3.9 Comparative performance of PTTS scoring systems against the highest AUROC-ranked PTTS
Scoring systems AUCROC (95% CI) z-score p-value
Cardiff and Vale PEWS 0.89 (0.86-0.91) N/A N/A
Bedside PEWS 0.88 (0.85-0.91) 0.72 .47
Modified PEWS III 0.87 (0.85-0.90) 1.58 .11
Modified PEWS II 0.85 (0.82-0.88) 2.87 .004
CEWT 0.85 (0.82-0.88) 3.21 .001
PEWS III 0.83 (0.80-0.86) 4.06 <.001
PEWS system score I 0.82 (0.78-0.85) 4.42 <.001
NHSI PEWS 0.82 (0.79 - 0.86) 4.52 <.001
PEWS IV 0.79 (0.75-0.82) 6.00 <.001
CEWS 0.79 (0.75-0.82) 7.12 <.001
NEWS (12 years and above) 0.78 (0.67-0.91) 1.58 0.12
ITAT score 0.77 (0.74-0.81) 7.12 <.001
Modified PEWS I 0.74 (0.70-0.78) 8.06 <.001
NEWS (all ages) 0.72 (0.67-0.76) 9.10 <.001
z-score values calculated by Dr Samiran Ray
Performance was assessed by calculation of the AUROC. Systems were then ranked and
performance was compared to the highest ranked PTTS (Cardiff and Vale PEWS) using the
Delong's test for correlated curves. z-scores represent comparison of mean values.
Significance testing was adjusted for the multiple comparisons of AUROC with Bonferroni’s
correction, meaning p-values <.0025 were considered significant.
Abbreviations: AUROC: Area under the receiver operator characteristic curve; CEWS:
Children’s Early Warning Score; CEWT: Children’s Early Warning Tool; CI: Confidence
interval; ITAT: Inpatient triage, assessment and treatment score; NEWS: National Early
Warning Score; NHSI: NHS Institute; PEW: Paediatric/Pediatric Early Warning; PEWS:
Paediatric/Pediatric Early Warning System

163
For 14 of the remaining 15 systems there was a statistically significant difference in
performance compared to the Cardiff and Vale PEWS when results were adjusted
with Bonferroni’s correction for multiple comparisons.
Table 3.10 Comparative performance of PTTS trigger systems against the highest AUROC-ranked PTTS
Trigger systems AUCROC (95% CI) z-score p-value
THSC MET calling criteria 0.73 (0.69-0.77) 9.31 <.001
MET activation criteria I 0.71 (0.70-0.75) 10.70 <.001
MET activation criteria III 0.71 (0.70-0.75) 10.70 <.001
PMET triggers II 0.71 (0.67 – 0.75) 10.82 <.001
Modified Bristol PEWS 0.62 (0.58-0.67) 16.02 <.001
Bristol PEWS 0.62 (0.58-0.67) 16.11 <.001
z-score values calculated by Dr Samiran Ray
Performance was assessed by calculation of the AUROC. Systems were then ranked and
performance was compared to the highest ranked PTTS (Cardiff and Vale PEWS) using the
Delong's test for correlated curves. z-scores represent comparison of mean values.
Significance testing was adjusted for the multiple comparisons of AUROC with Bonferroni’s
correction, meaning p-values <.0025 were considered significant.
Abbreviations: AUROC: Area under the receiver operator characteristic curve; CI:
Confidence interval; ITAT: Inpatient triage, assessment and treatment score; MET: Medical
Emergency Team; NHSI: NHS Institute; PEW: Paediatric/Pediatric Early Warning; PEWS:
Paediatric/Pediatric Early Warning System; PMET: Pediatric Medical Emergency Team;
THSC: Toronto Hospital for Sick Children
3.5.3.3 Modification of trigger systems into scoring system
Trigger systems were modified to perform as a scoring system by summation of all
the scores from each parameter. The AUROC curve was then calculated at all
possible scores. Performance of this modified system was then compared to assess
whether performance improved significantly.
All six trigger systems performed significantly better when functioning as a scoring
system. Performance of the Medical Emergency Team (MET) activation criteria I
and MET activation criteria III both matched the third ranked PTTS. Performance of
the two lowest ranked trigger systems was significantly improved.

164
Table 3.11 Modification of trigger system to score-based system
PTTS Trigger –based AUROC (95%
CI)
Score -based AUROC (95%
CI)
z-score
p value
THSC MET calling criteria
0.73 (0.69-0.77) 0.84 (0.81-0.87) 10.69 <.001
MET activation criteria I
0.71 (0.70-0.75) 0.87 (0.84-0.89) 12.90 <.001
MET activation criteria III
0.71 (0.70-0.75) 0.87 (0.84-0.89) 12.90 <.001
PMET triggers II 0.71 (0.67 – 0.75) 0.85 (0.82-0.88) 11.89 <.001
Bristol PEWS 0.62 (0.58-0.67) 0.85 (0.82-0.88) 16.44 <.001
Modified Bristol PEWS 0.62 (0.58-0.67) 0.86 (0.84-0.89) 17.12 <.001
z-score values calculated by Dr Samiran Ray
Performance of each trigger-based PTTS was assessed by calculation of the AUROC.
Systems were then modified to a score-based system by aggregating the score of the
component parameters. The performance of each modified score-based PTTS was
compared to its unmodified trigger-based partner using the Delong's test for correlated
curves. z-scores represent comparison of mean values. Significance testing was adjusted for
the multiple comparisons of AUROC with Bonferroni’s correction, meaning p-values <.0025
were considered significant.
Abbreviations: AUROC: Area under the receiver operator characteristic curve; CI:
Confidence interval; MET: Medical Emergency Team; PEW: Paediatric/Pediatric Early
Warning; PEWS: Paediatric/Pediatric Early Warning System; PMET: Pediatric Medical
Emergency Team; THSC: Toronto Hospital for Sick Children
3.5.3.4 Comparative performance at the optimal score
The optimal score for score-based PTTS varied from two for the NHS Institute
PEWS (maximum score of seven) to nine for the PEWS system score I (maximum
score of 32). The adult NEWS had an optimal core of 10 (maximum score). Trigger-
based systems were all assessed at a score of one or greater. Sensitivity,
specificity, positive predictive value (PPV), negative predictive vale (NPV) and
positive and negative likelihood ratio for the optimal score are reported in Table
3.12.

165
Trigger systems demonstrated better sensitivity (range 0.90 (95% CI 0.86-0.93) to
0.96 (95% CI 0.93-0.98)) than scoring systems (range 0.46 (95% CI 0.40-0.51) to
0.83 (95% CI 0.78-0.87)), but worse specificity (range 0.28 (95% CI 0.23-0.34) to
0.56 (95% CI 0.50-0.61)) versus 0.65 (95% CI 0.60-0.71) to 0.91 (95% CI 0.87-
0.94)).
3.5.3.5 Time from detection to critical deterioration event
Paediatric track and trigger systems demonstrated the ability to detect children at
risk of critical deterioration a significant time before the event. Median time from
optimal score to the critical deterioration event ranged from 17 hours (interquartile
range [IQR] 6.8-35.7) to 39.5 hours (IQR 17.4-46.6) for patients correctly identified
by scoring systems (Table 3.12). Longer times were demonstrated by trigger
systems: 27.9 hours (IQR 13.7-42.4) to 39.8 (IQR 23.8-46.2), possibly reflecting the
increased sensitivity.
The system with the highest AUROC had a median time from optimal score to the
event of 26.60 hours. The local CEWS performed slightly worse at 21.05 hours.
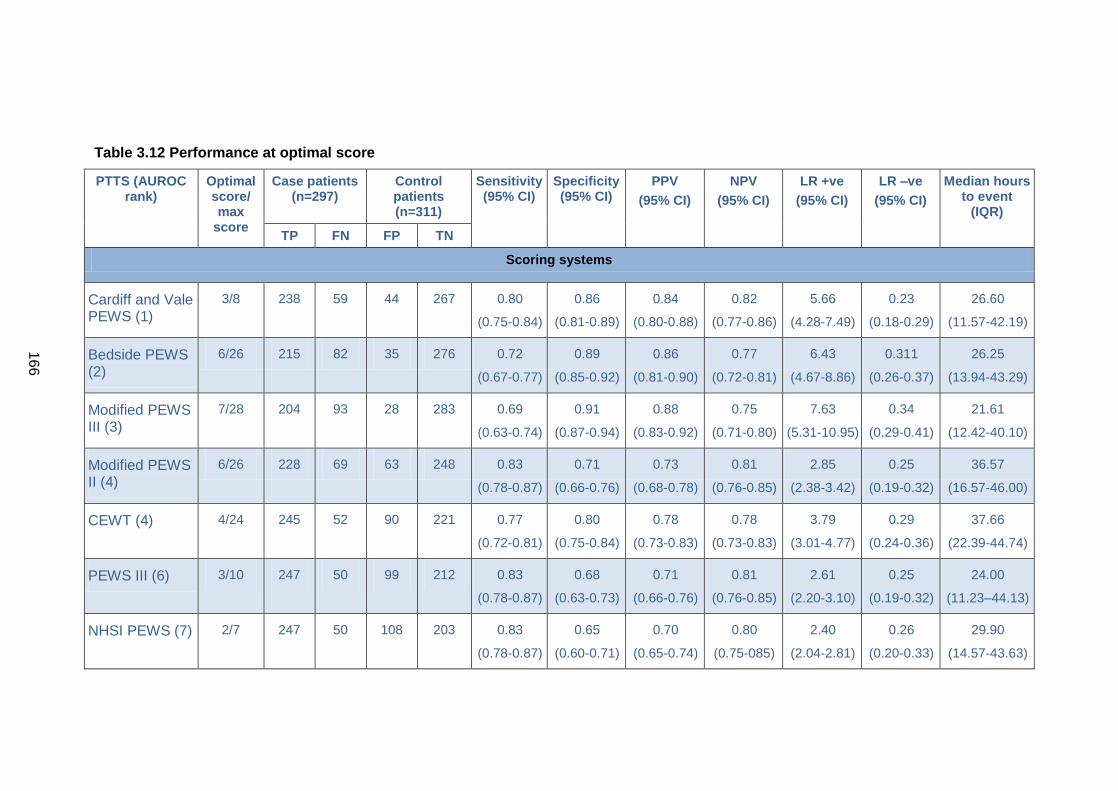
166
Table 3.12 Performance at optimal score
PTTS (AUROC rank)
Optimal score/ max
score
Case patients (n=297)
Control patients (n=311)
Sensitivity (95% CI)
Specificity (95% CI)
PPV
(95% CI)
NPV
(95% CI)
LR +ve
(95% CI)
LR –ve
(95% CI)
Median hours to event
(IQR)
TP FN FP TN
Scoring systems
Cardiff and Vale PEWS (1)
3/8 238 59 44 267 0.80
(0.75-0.84)
0.86
(0.81-0.89)
0.84
(0.80-0.88)
0.82
(0.77-0.86)
5.66
(4.28-7.49)
0.23
(0.18-0.29)
26.60
(11.57-42.19)
Bedside PEWS (2)
6/26 215 82 35 276 0.72
(0.67-0.77)
0.89
(0.85-0.92)
0.86
(0.81-0.90)
0.77
(0.72-0.81)
6.43
(4.67-8.86)
0.311
(0.26-0.37)
26.25
(13.94-43.29)
Modified PEWS III (3)
7/28 204 93 28 283 0.69
(0.63-0.74)
0.91
(0.87-0.94)
0.88
(0.83-0.92)
0.75
(0.71-0.80)
7.63
(5.31-10.95)
0.34
(0.29-0.41)
21.61
(12.42-40.10)
Modified PEWS II (4)
6/26 228 69 63 248 0.83
(0.78-0.87)
0.71
(0.66-0.76)
0.73
(0.68-0.78)
0.81
(0.76-0.85)
2.85
(2.38-3.42)
0.25
(0.19-0.32)
36.57
(16.57-46.00)
CEWT (4) 4/24 245 52 90 221 0.77
(0.72-0.81)
0.80
(0.75-0.84)
0.78
(0.73-0.83)
0.78
(0.73-0.83)
3.79
(3.01-4.77)
0.29
(0.24-0.36)
37.66
(22.39-44.74)
PEWS III (6) 3/10 247 50 99 212 0.83
(0.78-0.87)
0.68
(0.63-0.73)
0.71
(0.66-0.76)
0.81
(0.76-0.85)
2.61
(2.20-3.10)
0.25
(0.19-0.32)
24.00
(11.23–44.13)
NHSI PEWS (7) 2/7 247 50 108 203 0.83
(0.78-0.87)
0.65
(0.60-0.71)
0.70
(0.65-0.74)
0.80
(0.75-085)
2.40
(2.04-2.81)
0.26
(0.20-0.33)
29.90
(14.57-43.63)

167
PTTS (AUROC rank)
Optimal score/ max
score
Case patients (n=297)
Control patients (n=311)
Sensitivity (95% CI)
Specificity (95% CI)
PPV
(95% CI)
NPV
(95% CI)
LR +ve
(95% CI)
LR –ve
(95% CI)
Median hours to event
(IQR)
TP FN FP TN
PEWS system score I (7)
9/32 207 90 78 233 0.70
(0.64-0.75)
0.75
(0.70-0.80)
0.73
(0.67-0.78)
0.72
(0.70-0.77)
2.78
(2.26-3.42)
0.40
(0.34-0.48)
39.50
(17.43-46.57)
PEWS IV (9) 4/13 181 116 50 261 0.61
(0.55-0.67)
0.84
(0.79-0.88)
0.78
(0.72-0.83)
0.69
(0.64-0.74)
3.79
(2.89-4.96)
0.47
(0.40-0.54)
26.00
(11.75-41.58)
CEWS (9) 4/21 179 118 48 263 0.60
(0.54-0.66)
0.85
(0.80-0.88)
0.80
(0.73-0.84)
0.69
(0.64-0.74)
3.91
(2.96-5.15)
0.47
(0.41-0.54)
21.05
(10.38-40.12)
NEWS [12 years and above] (11)
10/20 21 10 4 24 0.68
(0.49-0.83)
0.86
(0.66-0.95)
0.84
(0.63-0.95)
0.71
(0.52-0.84)
4.74
(1.85-12.13)
0.38
(0.22-0.63)
37.63
(27.50-44.08)
ITAT score (12) 3/8 202 95 82 229 0.68
(0.62-0.73)
0.74
(0.68-0.78)
0.71
(0.65-0.76)
0.71
(0.65-0.76)
2.58
(2.11-3.16)
0.43
(0.37-0.51)
28.95
(14.70-43.96)
Modified PEWS I (13)
4/9 135 162 31 280 0.46
(0.40-0.51)
0.90
(0.86-0.93)
0.81
(0.74-0.87)
0.63
(0.59-0.68)
4.56
(3.19-6.51)
0.61
(0.55-0.67)
17.00
(6.75-35.68)

168
PTTS (AUROC rank)
Optimal score/ max
score
Case patients (n=297)
Control patients (n=311)
Sensitivity (95% CI)
Specificity (95% CI)
PPV
(95% CI)
NPV
(95% CI)
LR +ve
(95% CI)
LR –ve
(95% CI)
Median hours to event
(IQR)
TP FN FP TN
Trigger systems
THSC MET calling criteria (14)
≥1 triggers 267 30 138 173 0.90
(0.86-0.93)
0.56
0.50-0.61)
0.66
(0.61-0.71)
0.85
(0.79-0.90)
2.03
(1.78-2.31)
0.18
(0.13-0.26)
27.90
(13.74-42.37)
MET activation criteria I (15)
≥1 triggers 276 21 158 153 0.93
(0.89-0.96)
0.49
(0.44-0.55)
0.64
(0.59-0.68)
0.88
(0.82-0.92)
1.83
(1.63-2.05)
0.14
(0.10-0.22)
33.87
(18.76-45.52)
MET activation criteria III (15)
≥1 triggers 276 21 158 153 0.923
(0.89-0.96)
0.49
(0.44-0.55)
0.64
(0.59-0.68)
0.88
(0.82-0.92)
1.83
(1.63-2.05)
0.14
(0.10-0.22)
33.92
(18.76-45.52)
PMET triggers II (15)
≥1 triggers 273 24 157 154 0.92
(0.88-0.95)
0.50
(0.44-0.55)
0.64
(0.59-0.68)
0.87
(0.80-0.68)
1.82
(1.62-2.04)
0.16
(0.11-0.24)
33.25
(16.90-45.42)
Modified Bristol PEWS (18)
≥1 triggers 286 11 223 88 0.96
(0.93-0.98)
0.28
(0.23-0.34)
0.56
(0.52-0.61)
0.90
(0.81-0.94)
1.34
(1.25-1.45)
0.13
(0.07-0.24)
39.83
(23.82-46.25)
Bristol PEWS (18)
≥1 triggers 285 12 223 88 0.96
(0.93-0.98)
0.28
(0.23-0.34)
0.56
(0.52-0.61)
0.88
(0.80-0.93)
1.34
(1.24-1.44)
0.14
(0.08-0.25)
39.73
(23.45-46.25)
The PTTS are ordered by rank performance based on the AUROC. Values for sensitivity, specificity, PPV, NPV and likelihood ratio are presented for the
optimal score.
[Footnotes continue on next page].

169
[Footnotes continued from previous page].
Optimal score is the maximum value for sensitivity plus specificity. Median time calculated from case patient’s achieving optimal score/trigger
Results for the NEWS are only presented for children of 12 years and above (31 cases, 29 controls).
Abbreviations: AUROC: Area under the receiver operator characteristic curve; CI: Confidence interval; FP: False positive; FN: False negative; IQR:
Interquartile range; ITAT: Inpatient triage, assessment and treatment score; LR +ve; Positive likelihood ratio; LR –ve: Negative likelihood ratio; MET: Medical
Emergency Team; NEWS: National Early Warning System; NHSI: NHS Institute; NPV: Negative predictive value; PEW: Paediatric/Pediatric Early Warning;
PEWS: Paediatric/Pediatric Early Warning System; PMET: Pediatric Medical Emergency Team; PPV: Positive predictive value; THSC: Toronto Hospital for
Sick Children; : TP: True positive; TN: True negative

170
3.5.3.6 Modification with percentile based thresholds
The AUROC was calculated for each PTTS after the heart and respiratory rate
thresholds had been modified with percentile based values for both hospitalised
(Table 3.4) and healthy children (Table 3.3). The AUROC values, together with the
z-score and values are presented in Table 3.13. All values are adjusted for
Bonferroni’s correction.
The substitution of percentile-based heart and respiratory rate values for healthy
children improved the AUROC value for three systems and decreased the AUROC
for two. Performance of the two lowest ranked PTTS was significantly improved.
None of the AUROC values of the modified systems were greater than the three
highest ranked unadjusted PTTS. Although the AUROC increased for the adult
NEWS, the difference was not statistically significant. Performance of the remaining
13 systems did not reach statistical significance.
The substitution of percentile-based values for hospitalised children improved the
performance of five PTTS and only decreased performance in one system. The two
lowest performing PTTS again demonstrated significant improvement in AUROC.
The NHS Institute PEWS performance improved significantly, matching the AUROC
of the Modified PEWS III (ranked third). Performance of the adult NEWS did not
significantly improve.
Table 3.13 Performance of modified PTTS
PTTS Unadjusted Modified
(healthy children)
Modified
(hospitalised children)
AUROC
(95%CI)
AUROC
(95%CI)
z-score p-value AUROC
(95%CI)
z-score p-value
Cardiff and Vale PEWS
0.89 (0.86-0.91)
0.73 8.37 <.001 0.88 0.48 .633
Bedside PEWS 0.88 0.85-0.91)
0.86 2.72 .007 0.88 0.01 .990
Modified PEWS III
0.87 (0.85-0.90)
0.85 2.77 .006 0.86 1.01 .313

171
PTTS Unadjusted Modified
(healthy children)
Modified
(hospitalised children)
AUROC
(95%CI)
AUROC
(95%CI)
z-score p-value AUROC
(95%CI)
z-score p-value
CEWT 0.85 (0.82-0.88)
0.83 2.22 .026 0.85 0.00 .997
Modified PEWS II
0.85 (0.82-0.88)
0.75 5.06 <.001 0.76 4.76 <.001
PEWS III 0.83 (0.80-0.86)
0.81 1.11 .266 0.81 0.86 .391
NHSI PEWS 0.82 (0.79 - 0.86)
0.85 -2.63 .008 0.86 -3.22 .001
PEWS system score I
0.82 (0.78-0.85)
0.80 1.12 .264 0.85 -1.99 .047
PEWS IV 0.79 (0.75-0.82)
0.80 -0.48 .634 0.85 -4.67 <.001
CEWS 0.79 (0.75-0.82)
0.76 1.30 .194 0.80 -1.49 .137
ITAT score 0.77 (0.74-0.81)
0.76 1.36 .173 0.79 -1.13 .258
Modified PEWS I
0.74 (0.70-0.78)
0.84 -4.99 <.001 0.85 -5.55 <.001
THSC MET calling criteria
0.73 (0.69-0.77)
0.68 2.86 .004 0.68 3.03 .003
NEWS (all ages)
0.72 (0.67-0.76)
0.75 -1.83 .070 0.76 -2.39 .017
MET activation criteria I
0.71 (0.70-0.75)
0.68 1.81 .070 0.68 2.07 .039
MET activation criteria III
0.71 (0.70-0.75)
0.68 1.81 .070 0.68 2.07 .039
PMET triggers II
0.71 (0.67–0.75)
0.68 1.68 .093 0.68 2.01 .045

172
PTTS Unadjusted Modified
(healthy children)
Modified
(hospitalised children)
AUROC
(95%CI)
AUROC
(95%CI)
z-score p-value AUROC
(95%CI)
z-score p-value
Modified Bristol PEWS
0.62 (0.58-0.67)
0.70 -5.44 <.001 0.71 -5.19 <.001
Bristol PEWS 0.62 (0.58-0.67)
0.70 -5.37 <.001 0.71 -5.05 <.001
z-score values calculated by Dr Samiran Ray
Performance of each PTTS was assessed by calculation of the AUROC. Systems were then
modified by substitution of the heart and respiratory rate threshold derived from percentile
based for healthy children (seen at Table 3.3) and hospitalised children (seen at Table 3.4)
and the AUROC calculated. The performance of each modified PTTS for healthy and
hospitalised children was compared to its unmodified partner using the Delong's test for
correlated curves. z-scores represent comparison of mean values. Significance testing was
adjusted for the multiple comparisons of AUROC with Bonferroni’s correction, meaning p-
values <.0025 were considered significant.
Values in red indicate a significant decrease in performance. Values in green represent a
significant improvement in performance.
Abbreviations: AUROC: Area under the receiver operator characteristic curve; CI:
Confidence interval; MET: Medical Emergency Team; PEW: Paediatric/Pediatric Early
Warning; PEWS: Paediatric/Pediatric Early Warning System; PMET: Pediatric Medical
Emergency Team; THSC: Toronto Hospital for Sick Children

173
3.6 Discussion
This study compared the predictive ability of 18 PTTS and one adult track and
trigger system. Track and trigger systems are an important component supporting
the detection of deterioration within the safe system framework.33 Although no
system demonstrated excellent performance, eight might be considered as good
predictors, nine as useful and two poor.201 Score-based systems consistently
outperformed trigger systems. Larger number of parameters did not appear to
improve performance: for instance the two lowest ranked systems had 16 and 14
parameters respectively compared to eight parameters for the highest ranked
system. As part of a system, the choice of PTTS may be important in identification
of the deteriorating hospitalised child.
The Cardiff and Vale PEWS, Bedside PEWS and Modified PEWS III performed
better than the other PTTS. There were no clear defining features that identified why
these systems significantly outperformed their competitors. Score weighting differed,
with the Cardiff and Vale PEWS using a weighting of zero or one, and the Bedside
and Modified III PEWS using the more complex zero, one, two, four weighting. All
three systems included heart and respiratory rate, oxygen saturation and blood
pressure. The Cardiff and Vale PEWS did not include capillary refill time but did
incorporate staff concern, conscious level and airway threat. The Modified PEWS II
only differed from the Bedside PEWS by the additional scoring of temperature, but
this did not significantly alter its performance.
At the optimal score, scoring systems demonstrated poorer sensitivity, but superior
specificity than trigger systems, which may reduce false alerts and build clinician
confidence. Using the two-year data from this study, the highest AUROC-ranked
trigger system (THSC MET calling criteria) would correctly identify 29 more patients
than the highest AUROC-ranked scoring system (the Cardiff and Vale PEWS) at the
optimal score. However 94 additional false alerts would result. This would
significantly increase clinician workload, potentially incur greater financial costs and
may create ‘alarm fatigue’ and increase response times.202
Lowering the scoring thresholds improves sensitivity, creating additional
opportunities to intervene and potentially improve outcome.203 The ability to select
the threshold which balances sensitivity and specificity most appropriate to the local
environment gives scoring systems some advantages. However they are more

174
complex to use, carrying the risk of inaccurate calculation 49,94 and inappropriate
response.54,204
When trigger systems were modified to function as a scoring system, their
performance improved significantly. All six modified trigger systems had an AUROC
of above or equal to 0.85. Although modification in this way introduces additional
complexity into the calculation of the PTTS, the significant improvement in the
overall performance, particularly the reduction in false alerts, would appear to justify
this modification.
The current local system (CEWS) performed moderately, ranked ninth overall
despite being developed by local clinicians, using local data and local expertise. It
was considerably out-performed by systems externally validated in similar and
differing populations. The receiver operator characteristic curve shows no
overlapping of the 95% confidence intervals, illustrating the significance of the
differences between the curves. Using the two-year data from this study, the highest
AUROC-ranked PTTS would correctly identify 59 more patients who subsequently
suffered a critical deterioration event than the CEWS at the optimal score. This
represents a significant number of opportunities to intervene and potentially improve
the outcome. Only four additional false alerts would result, with minimal impact on
clinician workload.
Incorporation of evidence based thresholds for heart and respiratory rate did not
deliver the expected benefits. Although the inclusion of percentile thresholds from
hospitalised children out-performed those derived from healthy children, neither
improved the performance of the top-ranked systems. Given the additional
complexity that these thresholds would introduce, their inclusion into current
published PTTS cannot, at this time, be recommended.
All PTTS demonstrated the ability to identify deteriorating children at an early stage.
Median hours from optimal score to critical deterioration event varied from 17.0 to
39.5 hours and from 27.9 to 39.8 hours for trigger systems. This is longer than
previous study findings for comparable scoring thresholds177 and demonstrates that
both scoring and trigger systems can act as an important ‘early warning’ to front line
staff of children at risk of critical deterioration.

175
3.6.1 Limitations
Values for PTTS were retrospectively calculated from existing documentation. There
was no way to verify the accuracy of the documented vital sign values and other
observations. Administration of a fluid bolus could not be reliably extracted affecting
three PTTS.42,79,138 Missing values were considered to be ‘normal’ (score 0) and this
may underestimate PTTS performance. Data sets were frequently incomplete
however inadequate vital sign monitoring has been frequently reported even when
staff are actively prompted by researchers.67,117
Significance testing for comparison between the different systems was adjusted with
Bonferrioni’s correction for multiple comparisons. This may be considered a
conservative approach, resulting in equivocal findings where differences may
exist.199 However only two systems, the Children’s Early Warning Tool and the
Modified PEWS II, demonstrated equivocal results.
The framework for percentile-based modification of PTTS was developed using a
pragmatic approach. As such the choice of weightings may not have been optimal,
which could have affected the results.
The optimal score was used to facilitate comparison of performance measures
between differing PTTS systems. However scoring thresholds for use in clinical
practice are selected by clinicians to balance the benefits, risks, workload and
available resources. As such this may not be the most appropriate threshold for this
evaluation.
At the time of the study the CEWS was in clinical use and as such was used by staff
to inform their decision-making. All other PTTS were retrospectively evaluated
based on available data and could not inform the clinical decision-making of staff.
As such, if the CEWS was performing effectively, its use may have prompted staff to
intervene and the resulting actions may have prevented or modified a critical
deterioration event. This would have decreased the sensitivity of the CEWS and as
such, the performance of the CEWS may have been underestimated.
The study was conducted in a tertiary specialist children’s hospital. The critical
deterioration event rate was high when compared to reports from other specialist
children’s hospitals. Other settings may require alternative response strategies at
differing scoring thresholds. Different results may also be seen for different

176
outcomes and combinations of outcomes. Greater standardisation of reporting and
consensus on pragmatic measures to evaluate PTTS and other similar interventions
would facilitate meaningful comparison and collaborative research.168
3.7 Conclusion
Recognition of the deteriorating child is an important component of the safe system
framework.33 However there is considerable variation in the performance of
published PTTS and as such the choice of PTTS may be an important factor in the
performance of the overall system and in the child’s outcome. The three top-ranked
systems demonstrated similar performance and could be recommended for
hospitals seeking to introduce or revise their PTTS. Trigger based systems
performed poorly overall and although proponents cite simplicity as a justification for
their selection, their low AUROC values would appear to out-weigh this. However it
remains unclear what factors determine optimum performance across the PTTS.
More complex systems did not necessarily demonstrate improved performance.
We have no reason to believe our situation is unique and it is likely that many other
locally developed un-validated PTTS would demonstrate similar sub-optimal
performance if rigorously evaluated.36 The high and increasing number of published
and unpublished PTTS raises concerns that paediatrics may be following a similar
path to that of adult track and trigger systems, with multiple poorly validated systems
with unknown predictive power.
The choice of PTTS may be an important factor in determining outcome. On the
basis of this study, three systems could be recommended: the Cardiff and Vale
PEWS, the Bedside PEWS and the Modified PEWS III. Trigger systems cannot, at
this time, be advocated due to their poor predictive performance. Modification of
existing systems with percentile based heart and respiratory rate thresholds did not
deliver the expected benefits and therefore further research is required to determine
if they have a place within PTTS.
The next chapter will explore if the accuracy and completeness of PTTS scoring
affects the utility of PTTS in the clinical setting.

177
Chapter 4 Reliability: an observational study of the accuracy and completeness of paediatric track and trigger system documentation and compliance to a monitoring and escalation protocol
4.1 Introduction
Research on paediatric track and trigger systems (PTTS) has largely concentrated
on diagnostic accuracy, using retrospective data to assess whether the system can
accurately discriminate between children who are clinically deteriorating from those
who are not. Relatively few studies have examined how healthcare practitioners use
PTTS in clinical practice. Evidence from patient safety incidents suggests that they
are not always used optimally.33 This may have implications for the recognition of
deterioration and response to deterioration components of the safe system
framework.33
This chapter reports the real-world use of PTTS by clinical staff. Firstly how
compliance to a protocol may be assessed will be discussed, and why the ‘all-or-
nothing’ approach was selected will be examined. The study methodology will then
be described, specifying and justifying the standards used to assess monitoring and
escalation compliance. The results of PTTS completeness, accuracy and frequency
will be presented before a discussion of the findings.
4.1.1 Background
For PTTS to function effectively they need to be used as designed. This means that
observation sets should be complete so all parameters can be scored effectively.
Scores should be calculated correctly. This requires selection of the correct chart for
the child’s age, allocation of the correct sub-scores for each parameter and correct
summation of these sub-scores to produce a total PTTS score. Finally PTTS need
to be acted upon through adherence to the escalation protocol for elevated scores.
Although performing each of these steps appears, on the surface at least, to be
simple, there is evidence that recording and calculating track and trigger scores
involves a complex relationship between clinical decision-making, human error and
external factors such as chart design.49,72,205,206 Steps can be omitted or incorrectly
performed, and this can affect the accuracy of the score.

178
Numerous studies have highlighted deficiencies in the use of track and trigger
systems in adult clinical practice as highlighted in section 1.2.10. Major areas of
concern include missing, incomplete and inaccurate scoring and failure to follow the
recommended plan for escalation. Although the research on PTTS tools is less
developed, it is reasonable to assume that they may suffer from similar flaws in use,
given the similarities in their form and function.
Effective track and trigger systems require adherence to a protocol. A number of
studies of adult patients have assessed the performance of both novel and
established track and trigger systems.49,111 These previous studies have
predominantly assessed performance in two ways: ‘item-by item measurement’,
where each item is reported separately as a percentage, (e.g. 80% of patients had a
PTTS value recorded twice per day), or as a ‘composite measure’ where
performance is reported as a ratio of the elements achieved, (e.g. all patients
achieved three out of the four required care elements).207 In the current study
compliance has been assessed using an ‘all or nothing’ approach.207 This approach
is particularly relevant when care is composed of differing and often interlinked
steps. Using PTTS as an example, a full observation set (step 1) is accurately taken
(step 2) at the required frequency (step 3). A corresponding PTTS score is
calculated (step 4), but the value is incorrect. The nurse correctly follows the
escalation plan (but for the incorrect value) (step 5), and the patient receives the
required response (step 6). However despite five of the six steps being correctly
executed, the process is flawed. The steps are inter-linked and the process requires
reliable execution of each step to achieve the desired outcome. As such, when
assessing the monitoring and escalation of PTTS, all or nothing measures are
considered more appropriate than item-by-item or composite measures.
Within the ‘all-or-nothing’ approach, compliance to all the specified elements of the
protocol is required to achieve the standard. There is no ‘credit’ for partial
compliance. Whilst this inevitably produces far lower levels of compliance, it more
closely reflects wishes and desires of patients and families and reportedly drives
clinicians to achieve improvements in care.207
4.1.1.1 The local PTTS protocol for monitoring and escalation
The local PTTS protocol set out the minimum standards derived from
recommendations of national reports and professional consensus.3,5,6,33,51 All nurses
and medical staff were informed of these standards on induction and thereafter at

179
yearly updates. The protocol was available on each ward and could be accessed via
the hospital intranet. The protocol was designated as a policy rather than a
guideline. As such staff were mandated to adhere to the protocol unless there were
clear contra-indications to its use, which would need to be documented and
reported.
At the time of the study the PTTS protocol required blood pressure to be
documented once per day. All other vital sign parameters had to be recorded at
least once per nursing shift. This equated to once every 12-hours as a standard shift
pattern was in operation at the time.
The protocol directed that a PTTS score should be completed with each vital sign
parameter recording. Where a vital sign parameter value fell on the border between
two differing sub-scores, the protocol stated that the lower sub-score value should
be used.
A hospital-wide escalation protocol was in place which identified the action to be
taken for each PTTS score (Appendix 3).
4.2 Methods
This was an observational study examining the real-world use of PTTS by clinicians.
The aim was to explore whether PTTS are used as intended and to examine the
compliance to a monitoring and escalation protocol. As outlined in chapter three, a
case-controlled methodology was selected. A cohort methodology was considered
but discarded due to the large number of participants required to capture sufficient
data on the management of elevated PTTS values. This would have exceeded the
resources available to the PhD candidate. A 2-year retrospective study was
considered adequate to demonstrate statistically significant findings at a p value of
<0.05 as it would yield approximately 600 participants (300 cases and 300 controls).
This would facilitate sufficient number of patients with ‘normal’ and ‘elevated’ PTTS
scores to allow meaningful analysis.
4.2.1 Ethical issues
This study was assessed by the hospital’s clinical audit department and was
designated a service evaluation project. As such the study was considered exempt
from approval from a Research Ethics Committee and the local clinical research

180
committee. The project was registered with the clinical audit department (registration
number 1489).
4.2.2 Participants
Patients entered into the validity study described in Chapter three also participated
in this study. Patients who suffered a critical deterioration event were designated
‘cases’ using the criteria previously described in section 3.3.4. Cases were matched
with a single control present on the same ward at the same time. Wards were
considered a proxy match for diagnostic speciality.
Inclusion and exclusion criteria were identical for both studies and have previously
been described in section 0 and 3.3.4.2. Case patients were matched with the
control patient closest in age to them, as outlined in 3.3.4.3.
4.2.3 Criteria for compliance
Standards for compliance were developed based on the recommendations within
the PTTS protocol and the PTTS escalation protocol (Appendix 3). The protocol
dictated that elevated PTTS values must be repeated within 30 minutes. Although
no time-limit for attendance by a clinician or intensive care outreach team was
explicitly set within the escalation protocol, a period of one hour from documented
score to attendance was considered reasonable, given that PTTS alert staff to
clinical deterioration.
It was recognised that there may also be a delay between the recording of vital
signs and PTTS documentation. Repeat PTTS recording and escalation may need
to be balanced against other important patient-related tasks such as toileting and
administering analgesia. Documentation of findings will always be secondary to
patient assessment and intervention. To acknowledge this, the standard for
compliance required repeat recording within one hour and escalation within two
hours.
4.2.3.1 Compliance to the monitoring protocol
Ten standards were developed to assess adherence to the monitoring protocol.
Compliance required all ten standards to be met for each 12-hour period. If a patient
was ‘not available’ for any single 12-hour period, they were regarded as achieving
compliance for that period.

181
The ten standards for monitoring were:
1. Use of the correct PTTS chart for the child’s age
2. Presence of a monitoring plan on the PTTS chart
3. At least one temperature value recorded every 12 hours
4. At least one heart rate value recorded every 12 hours
5. At least one respiratory rate value recorded every 12 hours
6. At least one assessment of consciousness* recorded every 12 hours
7. At least one systolic blood pressure value recorded every 24 hours
8. At least one oxygen saturation value recorded every 12 hours
9. At least one PTTS value recorded every 12 hours
10. At least one accurate PTTS value calculated from a full set of observations
recorded every 12 hours
*Consciousness was measured by assessment on the AVPU scale (alert – responds to
voice -responds to pain – unresponsive).
4.2.3.2 Compliance to the escalation protocol
Eight standards were developed to assess adherence to the escalation protocol,
one for a score of two (standard 1), two standards for a score of three (standards 2
and 3), two standards for a score of four (standards 4 and 5) and three for a score of
or above five (standard 6-8). Scores below two did not require escalation.
Within each 12-hour period, the first PTTS value of two, three, four and five or more
was identified. The time to the relevant escalation standard (repeat PTTS score,
escalation to a senior clinician, escalation to the intensive care outreach team) was
calculated. If the relevant action was achieved within one hour for repeat PTTS
recording and two hours for clinician or outreach review the standard was
considered to have been met for that 12-hour period. Patients who did not achieve a
PTTS score of two or more within a given 12-hour period were considered compliant
for that period with regards to escalation.
The eight standards for escalation were:
1. For the first recorded PTTS score of two, repeat recording of a full set of
observations and a correctly calculated PTTS value within 60 minutes

182
2. For the first recorded PTTS score of three, repeat recording of a full set of
observations and a correctly calculated PTTS value within 60 minutes
3. For the first recorded PTTS score of three, escalation to a senior clinician
within 120 minutes
4. For the first recorded PTTS score of four, repeat recording of a full set of
observations and a correctly calculated PTTS value within 60 minutes
5. For the first recorded PTTS score of four, escalation to a senior clinician
within 120 minutes
6. For the first recorded PTTS scores ≥5, repeat recording of a full set of
observations and a correctly calculated PTTS value within 60 minutes
7. For the first recorded PTTS scores ≥5, escalation to a senior clinician within
120 minutes
8. For the first recorded PTTS scores ≥5, escalation to the intensive care
outreach team within 120 minutes
4.2.4 Data extraction
Vital sign and PTTS data were extracted from healthcare documents for the 48-
hours prior to the critical deterioration event for case patients and the corresponding
48-hour period for the matched controls. The documented values for the component
vital sign parameters, PTTS vital sign parameter sub-score, total PTTS scores and
the age-range of the PTTS chart used were extracted using a standardised pro-
forma. Evidence of a request for or an actual senior clinician and/or intensive care
outreach review was also extracted.
Data were assigned to the date and time noted on the healthcare record. Where a
value for date and/or time was not recorded, this was estimated using other
indicators (such as the activation of a cardiac arrest team) or through calculation of
the median of the documented values at either side. For example, if the entry before
the missing value was timed at 12:00 and after at 14:00, the missing value would be
assigned to 13:00.
4.2.5 Data analysis
Data were entered into a Microsoft Excel database developed by the candidate.
To facilitate analysis, data were allocated to an hour of the day, with the time of
each value apportioned to the hour of the time value recorded. For example, if a
time value of 08:59 was recorded, the hour of the day would be calculated as 8.

183
Data were also allocated to the hour before the critical deterioration event. For
example if the critical deterioration event occurred at 10:30, values recorded from
09:30 to 10:29 were considered to have occurred in hour zero and those recorded
from 08:30 to 09:29 were allocated to the period one hour before the event and so
on. For controls, the time of the critical deterioration event was considered to be the
event time of their matched case patient. All values for the hour of the day and the
hour to event were calculated using formulas in Excel.
Completeness of observation sets was calculated using the ‘COUNTIF’ function in
Excel. An observation set was considered to be complete if there was simultaneous
recording of all component PTTS parameters together with a total PTTS score.
To assess PTTS score accuracy, values were recalculated in Excel using the
available vital sign parameter values. Formulas were developed by the candidate to
accurately determine the correct chart for the child’s age based on date of birth and
date of vital sign parameter documentation. Individual component parameter sub-
scores were calculated using the ‘IF’ functions within Excel. Component sub-scores
were combined using the ‘SUM’ function to generate an accurate Excel-derived total
PTTS score. Missing component vital sign parameters were presumed to be normal
(score 0), consistent with clinical practice at the time and the methodology of
previous studies.116,121
A PTTS score was considered to be accurate when the documented total PTTS
score matched the Excel-generated PTTS score. Comparison was undertaken using
the pivot table function in Excel. Where the documented and Excel-generated score,
although different, would have led to the same escalation, the incorrectly
documented score was classed as not clinically significant. Where the incorrectly
documented score resulted in a different escalation pathway from that indicated by
the Excel-generated score, the score was classed as clinically significant.
Inaccurate PTTS scores were classified according to the reason:
incorrect chart for child’s age
incorrect sub-score for one or more component vital sign parameters
incorrect summation of the excel-derived sub-scores or
a combination of two or more inaccuracies.

184
Completeness and accuracy were compared across different nursing shifts, days of
the week and low (0-1) medium (2-4) and high (≥5) scores for cases and controls.
Analysis was facilitated using the pivot table function in Excel.
Compliance was assessed for each 12-hour period before the critical deterioration
event (0-11 hours, 12-23 hours, 24-35 hours, 36-47 hours). The 12-hour
assessment period corresponded with the length of a ward nurse’s shift, facilitating
assessment against the standards in the PTTS protocol. A patient was considered
to be ‘available for PTTS assessment’ if they were present on the ward for any part
of the relevant 12-hour period. A patient was considered ‘unavailable for PTTS
assessment’ if they were missing from the ward for the entire 12-hour period
because, for example, they were in the operating theatre, on home leave, or had
not, as yet, been admitted to hospital.
Compliance to the 10 monitoring and eight escalation standards was assessed for
each 12-hour period using the pivot table function. Achievement of the required
standard or absence of the patient for the entire 12-hour data period were
considered to indicate compliance.
Overall compliance was assessed using an ‘all or nothing’ assessment. This
required each patient to have achieved compliance for each of the eight escalation
standards at the first presentation of the elevated PTTS score. This ‘all or nothing’
approach was then applied to the composite standards for monitoring (10 elements)
and escalation (8 elements). Failure to achieve the required standard for any one
element would be considered as an overall failure to meet the required care
standard.
Compliance to each monitoring and escalation standard was analysed across the
entire 48-hour study period and the final 12-hour period before the critical
deterioration event. Comparisons were drawn between cases and controls across
these two periods to evaluate if compliance improved closer to the critical
deterioration event, as the signs of deterioration may be more marked.
4.2.5.1 Statistical analysis
Data were analysed using Microsoft Excel, SPSS and Vasser Stats. Descriptive
statistics were calculated, including counts, means, medians and percentages.
Statistical significance was assessed by chi squared or fishers exact test for

185
categorical data and Mann-Whitney U test for continuous data. A value of p<.05 was
considered to be significant for all comparisons.
4.3 Results
4.3.1 Patient characteristics
Three hundred and nineteen critical deterioration events were identified. In eight
episodes the patient was present on the ward for less than two hours, leaving 311
eligible critical deterioration events in 237 patients. Fourteen case patient records
were missing, leaving a case sample of 297 events in 224 patients. A total of 244
control patients were identified for the 311 events.
Case patients were more likely to be female (56.3% vs 46.3%, p=.018), have been
admitted as an emergency (64.6% vs 39.2%, p<.001) and have a longer hospital
stay (median 57.1 vs 35.9 days, p<.01). In-hospital mortality was also higher for
case patients at 24 hours and 30 days, and at hospital discharge (p=<.001). A
summary of patient characteristics is shown in Table 3.6.
Of the 297 critical deterioration events 186 (62.6%) were classified as PICU
transfers, 84 (28.3%) as respiratory arrests and 27 (9.1%) cardiac arrests. Thirty-
one patients remained on the ward after a cardiac or respiratory arrest. Six patients
could not be resuscitated after a cardiac arrest and died before transfer to intensive
care.
4.3.2 Overall frequency of vital sign recording
In total 13,816 observations sets were performed. A greater numbers of observation
sets were performed on cases (8543, 61.8%) compared to controls (5273, 38.2%).
The median number of observation sets per patient per day was 12 (interquartile
range [IQR] 6-19) for cases and six (IQR 6-8) for controls.
The frequency of recording of the component vital sign parameters varied (Figure
4.1). Heart rate, oxygen saturation and respiratory rate were recorded more
frequently than other parameters. They were present in the observation sets of more
than 95% of case patients and 85% of controls. A comparison of cases and controls
revealed a significantly higher presence in the observation sets of case patients
compared to controls. The difference was highly significant for heart rate and
oxygen saturation (p <.001) and significant for respiratory rate (p= .012).
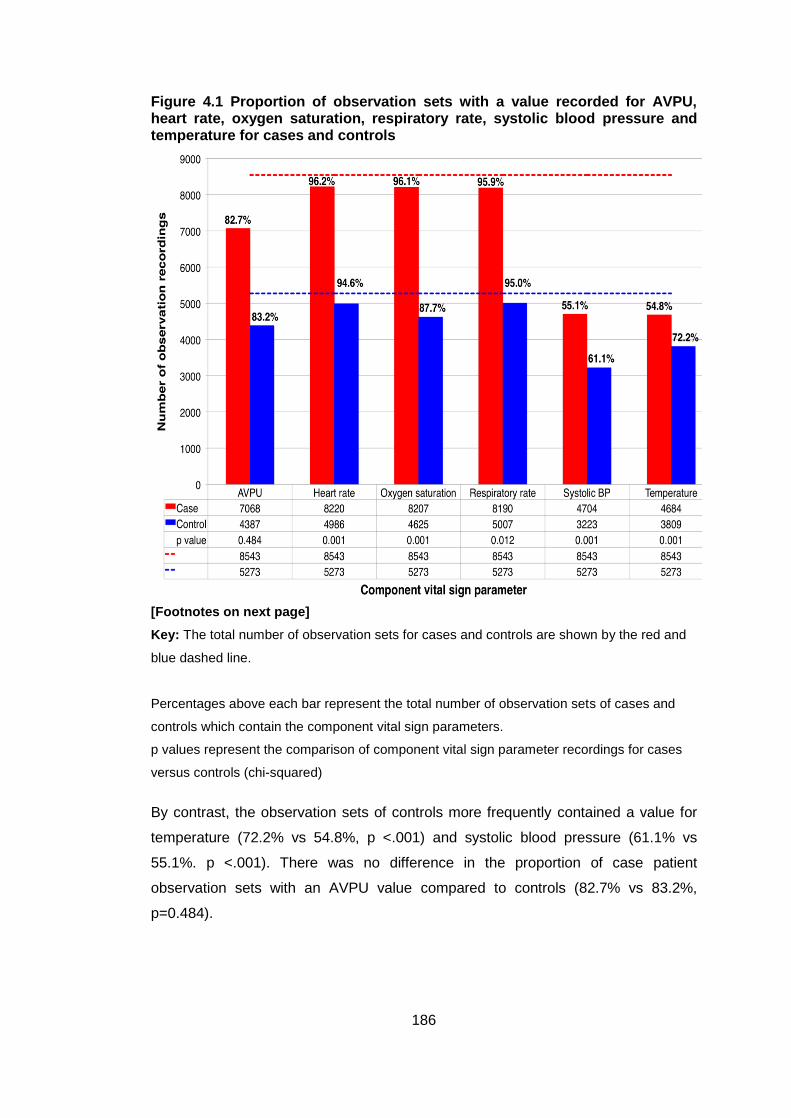
186
Figure 4.1 Proportion of observation sets with a value recorded for AVPU, heart rate, oxygen saturation, respiratory rate, systolic blood pressure and temperature for cases and controls
[Footnotes on next page]
Key: The total number of observation sets for cases and controls are shown by the red and
blue dashed line.
Percentages above each bar represent the total number of observation sets of cases and
controls which contain the component vital sign parameters.
p values represent the comparison of component vital sign parameter recordings for cases
versus controls (chi-squared)
By contrast, the observation sets of controls more frequently contained a value for
temperature (72.2% vs 54.8%, p <.001) and systolic blood pressure (61.1% vs
55.1%. p <.001). There was no difference in the proportion of case patient
observation sets with an AVPU value compared to controls (82.7% vs 83.2%,
p=0.484).

187
4.3.2.1 Frequency of component vital signs for day and night shift
More observation sets were recorded during the day shift (08:00- 19:59) compared
to the night shift (20:00 – 07:59). Case patients had more day-time recordings of all
parameters. Controls had slightly more recordings of heart rate, oxygen saturation
and respiratory rate at night, but a greater number of AVPU, oxygen saturation and
temperature recordings in the day. For each vital sign parameter, comparison of the
number of day and night-time recording across cases and controls revealed no
significant differences (Figure 4.2).
Figure 4.2 Frequency of component vital signs parameters documentation during the day and night-time
Values represent the total number of vital sign values recording during the day (08:00-19:59)
and night shift (20:00-07:59).
Key: p values denote significance of recoding of component vital sign values of cases and
controls on the day and night shift (chi-squared)

188
4.3.2.2 Completeness of observation sets
Only 4957 (35.9%) observation sets contained a complete set of component vital
sign parameters with a concurrent PTTS score. The remainder did not, and as such
were considered to be incomplete. Case patient’s had a significantly lower
proportion of observation sets that were complete when compared to controls
(32.9% vs 40.7%, p <.0001).
4.3.3 Accuracy and completeness of PTTS scoring
4.3.3.1 Correct, incorrect and missing PTTS scores
The distribution of documented PTTS values for each given Excel-derived PTTS
value can be seen in Figure 4.3. The number of observation sets for each
documented PTTS value are seen in the ‘Total’ column on the right, whilst the
number of observation sets for each correctly calculated score are seen in the row
at the bottom of Figure 4.3
Observation sets with no documented PTTS value are highlighted in yellow.
Observation sets where the documented PTTS score matches the Excel-derived
score were considered to be accurate and are highlighted in green. Observation
sets where the two values did not match were considered to be inaccurate. Values
in the top right-hand side of the figure - where the documented PTTS is less than
the Excel-derived score - were classified as under-scored. Values in the bottom left
of the figure - where the documented PTTS score exceeds the Excel-derived score -
were classified as over-scored. Scoring errors which would have led to activation of
a different escalation pathway were considered clinically significant and are shaded
blue for over-scoring and red for under-scoring errors.
Overall 10,518 (76.1%) observation sets had a PTTS score that was accurately
calculated, 2416 (17.5%) were considered inaccurate and 882 (6.4%) were missing
(Figure 4.3).
The distribution of correct, incorrect and missing PTTS score for case patients is
seen in Figure 4.4. There were 6250 (73.2%) observation sets with a correctly
calculated PTTS score. Errors were present in 1673 sets (19.6%) and 620 (7.3%)
had no concurrent PTTS value.

189
Control patients had a higher proportion of accurate PTTS scores (4268, 80.9%) as
seen in Figure 4.5. Errors in PTTS scoring were less frequent (743, 14.1%) and
fewer observation sets were missing a documented PTTS value (262, 5.0%). When
cases and controls were compared, the differences in the proportion of accurate
scores (p <.0001), scoring errors (p <.0001) and missing PTTS values (p <.0001)
were highly significant.

190
Figure 4.3 Correct, incorrect and missing PTTS scores (all patients)
PTTS values of 0-1 required no escalation. PTTS values of 2-4 and 5 or greater had differing escalation pathways. The Excel-derived PTTS score was plotted against the documented PTTS score. The framework represents the number of observation sets for each documented PTTS score at the relevant excel-derived PTTS. Green represents observation sets where the excel-derived and documented PTTS matched and was therefore considered to be accurate Yellow indicates observation sets where no PTTS value was documented and the PTTS was considered to be missing Blue indicates observation sets where the Excel-derived score was greater than the documented PTTS score and would have resulted in different escalation pathways (clinically significant under-score) Red indicates observation sets where the Excel-derived score was less than the documented PTTS score and would have resulted in different escalation pathways (clinically significant under-score) White indicates observation sets where the Excel-derived and documented PTTS score differed but the resultant escalation pathways matched (non-clinically significant error)

191
Figure 4.4 Correct, incorrect and missing PTTS scores (case patients)
PTTS values of 0-1 required no escalation. PTTS values of 2-4 and 5 or greater had differing escalation pathways. The Excel-derived PTTS score was plotted against the documented PTTS score. The framework represents the number of observation sets for each documented PTTS score at the relevant excel-derived PTTS. Green represents observation sets where the excel-derived and documented PTTS matched and was therefore considered to be accurate Yellow indicates observation sets where no PTTS value was documented and the PTTS was considered to be missing Blue indicates observation sets where the Excel-derived score was greater than the documented PTTS score and would have resulted in different escalation pathways (clinically significant under-score) Red indicates observation sets where the Excel-derived score was less than the documented PTTS score and would have resulted in different escalation pathways (clinically significant under-score) White indicates observation sets where the Excel-derived and documented PTTS score differed but the resultant escalation pathways matched (non-clinically significant error)

192
Figure 4.5 Correct, incorrect and missing PTTS scores (control patients)
PTTS values of 0-1 required no escalation. PTTS values of 2-4 and 5 or greater had differing escalation pathways. The Excel-derived PTTS score was plotted against the documented PTTS score. The framework represents the number of observation sets for each documented PTTS score at the relevant excel-derived PTTS. Green represents observation sets where the excel-derived and documented PTTS matched and was therefore considered to be accurate Yellow indicates observation sets where no PTTS value was documented and the PTTS was considered to be missing Blue indicates observation sets where the Excel-derived score was greater than the documented PTTS score and would have resulted in different escalation pathways (clinically significant under-score) Red indicates observation sets where the Excel-derived score was less than the documented PTTS score and would have resulted in different escalation pathways (clinically significant under-score) White indicates observation sets where the Excel-derived and documented PTTS score differed but the resultant escalation pathways matched (non-clinically significant error)
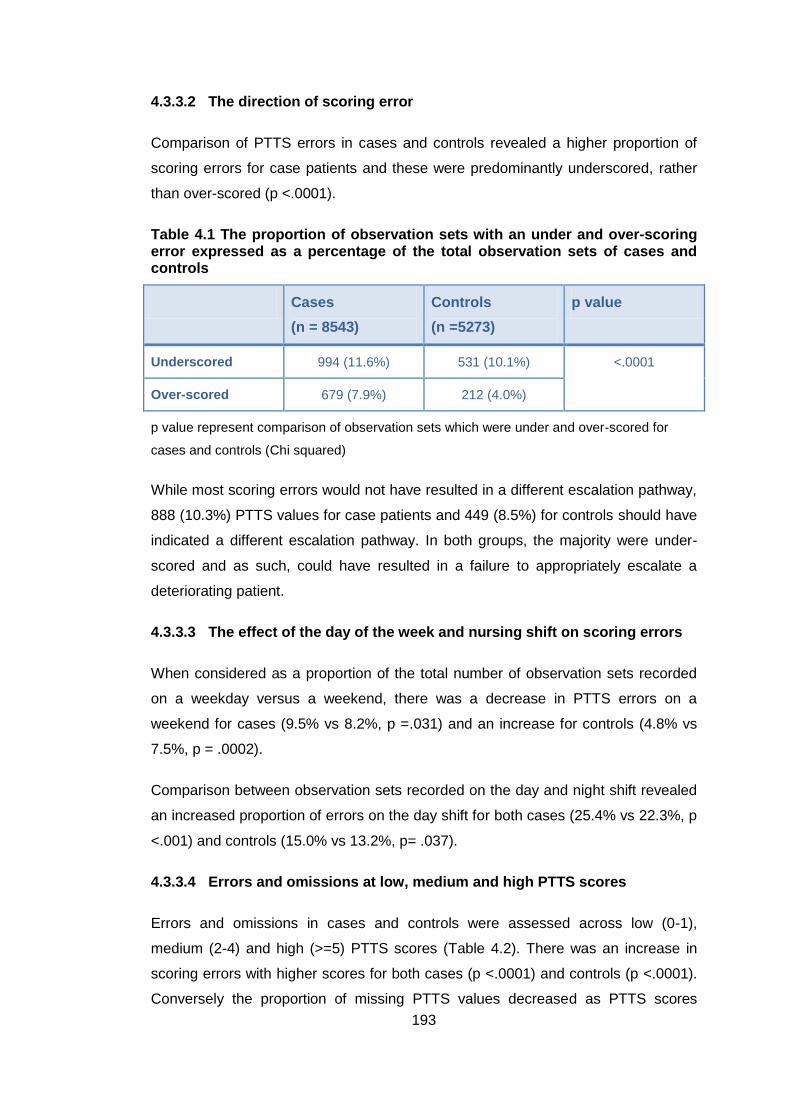
193
4.3.3.2 The direction of scoring error
Comparison of PTTS errors in cases and controls revealed a higher proportion of
scoring errors for case patients and these were predominantly underscored, rather
than over-scored (p <.0001).
Table 4.1 The proportion of observation sets with an under and over-scoring error expressed as a percentage of the total observation sets of cases and controls
Cases
(n = 8543)
Controls
(n =5273)
p value
Underscored 994 (11.6%) 531 (10.1%) <.0001
Over-scored 679 (7.9%) 212 (4.0%)
p value represent comparison of observation sets which were under and over-scored for
cases and controls (Chi squared)
While most scoring errors would not have resulted in a different escalation pathway,
888 (10.3%) PTTS values for case patients and 449 (8.5%) for controls should have
indicated a different escalation pathway. In both groups, the majority were under-
scored and as such, could have resulted in a failure to appropriately escalate a
deteriorating patient.
4.3.3.3 The effect of the day of the week and nursing shift on scoring errors
When considered as a proportion of the total number of observation sets recorded
on a weekday versus a weekend, there was a decrease in PTTS errors on a
weekend for cases (9.5% vs 8.2%, p =.031) and an increase for controls (4.8% vs
7.5%, p = .0002).
Comparison between observation sets recorded on the day and night shift revealed
an increased proportion of errors on the day shift for both cases (25.4% vs 22.3%, p
<.001) and controls (15.0% vs 13.2%, p= .037).
4.3.3.4 Errors and omissions at low, medium and high PTTS scores
Errors and omissions in cases and controls were assessed across low (0-1),
medium (2-4) and high (>=5) PTTS scores (Table 4.2). There was an increase in
scoring errors with higher scores for both cases (p <.0001) and controls (p <.0001).
Conversely the proportion of missing PTTS values decreased as PTTS scores

194
increased (p <.0001) in controls. There was no statistical difference in the proportion
of missing scores at differing scoring thresholds for controls (p= .737).
When the error rates between the two groups were compared for differing scores,
case patients had a higher error rate for low scores (p<.0001) but a lower error rate
for medium (p <.0001) and high risk scores (p =.0026).
Table 4.2 The prevalence of errors and missing PTTS scores for low, medium and high scores
PTTS score Cases p value Controls p value
PTTS score errors
Low
Medium
High
476/3899 (12.2%)
887/3665 (24.2%)
311/1046 (29.7%)
<.0001a 400/4376 (9.1%)
309/824 (37.5%)
34/73 (46.6%)
<.0001a
Missing PTTS scores
Low
Medium
High
377/3899 (9.7%)
259/3665 (7.1%)
49/1046 (4.7%)
<.0001a 222/4376 (5.1%)
37/824 (4.5%)
3/73 (4.1%)
.737
Errors and missing scores are considered as a proportion of the total number of recorded
observation sets at low (0-1), medium (2-4) and high scores (≥5)
4.3.3.5 Reason for PTTS score inaccuracy
Analysis of the 2416 errors to identify the cause revealed that 124 (5.1%)
observation sets were documented on a chart that was the wrong age for the patient
(Figure 4.6). This error largely resulted in the incorrect sub-score for one or more of
the vital sign parameters in 199 observation sets (4.9%).
Errors were frequently associated with inconsistencies in the sub-scoring of one or
more vital sign parameters (74.3%). Overall 1796 (62.8%) erroneous observation
sets had a missing or incorrectly scored parameter sub-score. Errors appeared to
be particularly prevalent around boundaries between scores.
Errors were also common in the summation of the parameter sub-scores to produce
the total PTTS score. A total of 802 (33.3%) erroneous observation sets had errors
in summation.
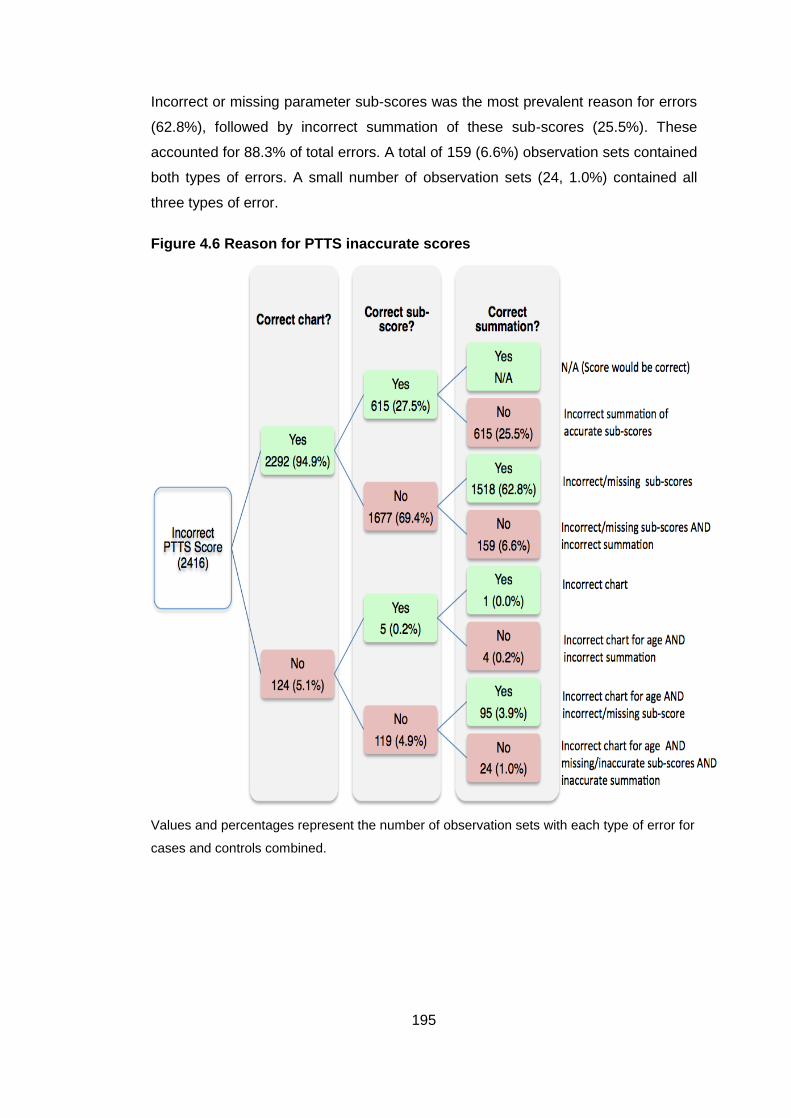
195
Incorrect or missing parameter sub-scores was the most prevalent reason for errors
(62.8%), followed by incorrect summation of these sub-scores (25.5%). These
accounted for 88.3% of total errors. A total of 159 (6.6%) observation sets contained
both types of errors. A small number of observation sets (24, 1.0%) contained all
three types of error.
Figure 4.6 Reason for PTTS inaccurate scores
Values and percentages represent the number of observation sets with each type of error for
cases and controls combined.

196
4.3.3.6 Direction of inaccurate scores
A summary of the direction of the scoring errors can be seen in Figure 4.7. Of the
2416 errors overall, 1673 occurred in case patients and 743 in controls. When errors
were considered as a proportion of the total number of observation sets of cases
(n=8543) and controls (n=5273), case patients also had a significantly higher
proportion of erroneous scores (19.4% versus 14.1%, p <.0001).
4.3.3.7 Clinical implication of PTTS score inaccuracy
Overall 1080 (7.8%) PTTS errors would have indicated a different escalation
pathway and, as such, were considered clinically significant. More observation sets
were underscored (748, 5.4%), with just 332 (2.4%) classed as over-scored. A
higher absolute number of clinical significant errors occurred in the observation sets
of case patients (786) compared to controls (294) and this was significant when
considered as a proportion of their total observation sets (9.2% vs 5.6%, p <.0001).
Erroneous PTTS scores (n=2416) were predominantly under- rather than over-
scored (1526, 11.0% versus 890, 6.4%). The tendency to under rather than over-
score was seen in PTTS values that were both clinically significant and clinically
insignificant. There were statistically significant differences between cases and
controls for errors that were clinically significant (p= .027) and clinically insignificant
(p <.01) (Figure 4.7).

197
Figure 4.7 Direction and potential impact of inaccurate scores
Key: Values represent the number of observation sets within each category for cases (red)
and controls (blue).
Percentages are presented separately to allow comparison between the two groups
4.3.4 PTTS monitoring for individual patients
To evaluate the efficiency of PTTS monitoring for individual patients, the frequency,
completeness and accuracy of PTTS for both cases and controls were assessed.
Values were calculated as a percentage of the total number of patients who were
available for PTTS assessment.

198
4.3.4.1 Observation recording by hour of day
Although the pattern of vital sign parameter recording varied throughout the day,
there were peaks in the frequency of recording at 4-hourly periods (Figure 4.8). A
regular pattern appeared, which corresponded with the traditional pattern of vital
sign recording at 2, six and 10 o’clock.
Figure 4.8 Proportion of patients with a vital sign parameter recorded for each hour of the day
Values are a percentage of the total number of patients who were available for vital sign
recording within that hour of the day
However comparison of the pattern of recording in case and control patients reveals
differences in their frequency. Case patients had more frequent recordings of vital
sign parameters overall. There were more frequent recording of values in-between
the 4-hourly observation sets (Figure 4.9), with around half of patients having a
value recorded in any one hour of the day.
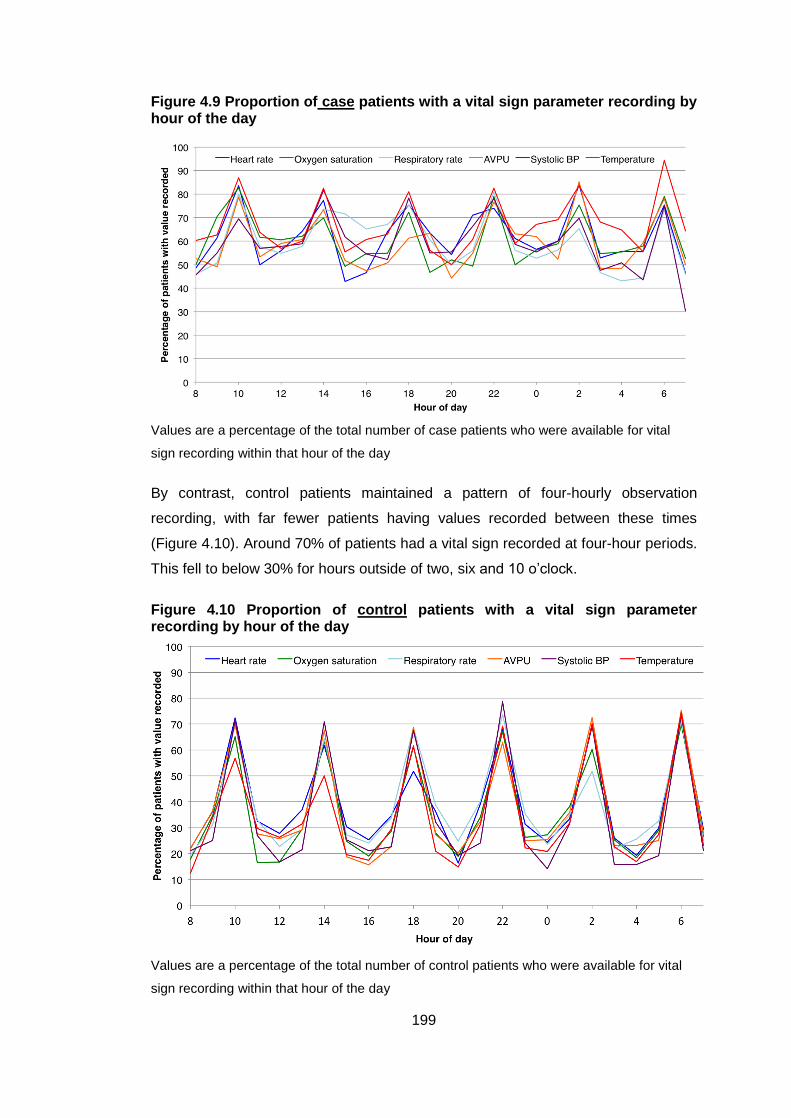
199
Figure 4.9 Proportion of case patients with a vital sign parameter recording by hour of the day
Values are a percentage of the total number of case patients who were available for vital
sign recording within that hour of the day
By contrast, control patients maintained a pattern of four-hourly observation
recording, with far fewer patients having values recorded between these times
(Figure 4.10). Around 70% of patients had a vital sign recorded at four-hour periods.
This fell to below 30% for hours outside of two, six and 10 o’clock.
Figure 4.10 Proportion of control patients with a vital sign parameter recording by hour of the day
Values are a percentage of the total number of control patients who were available for vital
sign recording within that hour of the day

200
The pattern of vital sign parameter recording on weekdays and at the weekend was
examined for all observation sets (Figure 4.11) and only those observation sets that
were complete (Figure 4.11). Whilst patterns were similar for complete observation
sets of case and control patients, there was a marked difference in the pattern of
when observation sets were assessed.
Figure 4.11 All observation sets of cases and controls: weekends versus weekdays
Values are a percentage of the total number of case and control patients who were available
for vital sign recording within that hour of the day

201
Figure 4.12 Complete observation sets of cases and controls: weekends versus weekdays
Values are a percentage of the total number of patients who were available for vital sign
recording within that hour of the day
4.3.5 Frequency of vital sign parameter recording in the hours before the critical deterioration event
Presence of each of the six vital sign parameters in the 48-hours before the critical
deterioration event was plotted against the time to the event for cases (Figure 4.13)
and the matching 48-hours for controls (Figure 4.14).

202
Figure 4.13 Recording of component vital signs in case patients in the hours before the critical deterioration event
Values are a percentage of the total number of case patients who were available for vital
sign recording within that hour
Figure 4.14 Recording of component vital sign in control patients in the corresponding hours to time zero (critical deterioration event in cases)
Values are a percentage of the total number of patients who were available for vital sign
recording within that hour

203
Frequency of recording of heart rate, oxygen saturation and respiratory rate were
similar in both cases and controls, whilst AVPU, temperature and systolic blood
pressure were recorded less frequently. As expected, the frequency of monitoring in
control patients stayed fairly constant, with vital sign frequency of between 15-42%
for individual parameters. Case patients showed increased levels of monitoring from
48 hours up until three hours before the event. At three hours before the event
levels of monitoring dramatically fell, returning to levels close to those at the 48-hour
mark. This pattern was seen across all parameters.
The frequency of complete and incomplete observations in the hours before the
event demonstrated similar patterns (Figure 4.15), with an escalation in the number
of complete and incomplete observation sets in case patients, with controls
maintaining a ‘steady state’ of recording.
Figure 4.15 Complete and incomplete observation sets of cases and controls in the hours before the event
Values are a percentage of the total number of cases and controls who were available for
vital sign recording within that hour

204
4.3.6 Compliance to PTTS monitoring protocol
4.3.6.1 Recording of component vital sign parameters
The protocol required one recording per 12-hour shift of heart and respiratory rate,
oxygen saturation, consciousness and temperature, with a single recording of blood
pressure once in every 24 hours.
Compliance to the monitoring schedule for each of the component PTTS
parameters is shown in Table 4.3. In case patients, compliance was greater than
95% for all vital sign parameters for both the whole study period and the final 12-
hours. For controls, aside from systolic blood pressure, compliance for all
parameters across the whole study period fell just below 95%, but rose above this
threshold in the final 12-hours. All patients achieved greater than 95% compliance
for recording of systolic blood pressure throughout the 48-hour study period. There
was no statistical difference in compliance between cases and controls in either time
period.
Table 4.3 Cases and controls achieving compliance to vital sign parameter monitoring protocol over 48-hour study period and within the last 12 hours before the critical deterioration event
Vital sign
parameter
48-hour study period Final 12-hours
Cases
(n=297)
Controls
(n=311)
p value Cases
(n=297)
Controls
(n=311)
p value
Heart rate 288
(97.0%)
295
(94.9%)
.190a 291
(98.0%)
306
(98.4%)
.699a
Oxygen saturation
288
(97.0%)
295
(94.9%)
.190a 291
(98.0%)
306
(98.4%)
.699a
Respiratory rate 288
(97.0%)
295
(94.9%)
.190a 291
(98.0%)
306
(98.4%)
.699a
Consciousness (AVPU)
288
(97.0%)
295
(94.9%)
.190a 291
(98.0%)
306
(98.4%)
.699a
Systolic Blood pressure*
288
(97.0%)
306
(98.4%)
.242a 291
(98.0%)
308
(99.0%)
.330a

205
Vital sign
parameter
48-hour study period Final 12-hours
Cases
(n=297)
Controls
(n=311)
p value Cases
(n=297)
Controls
(n=311)
p value
Temperature 288
(97.0%)
295
(94.9%)
.190a 291
(98.0%)
306
(98.4%)
.699a
Compliance was regarded as documentation on the PTTS chart of at least one vital sign
parameter value in every 12-hour period, with the exception of systolic blood pressure, which
was required to be recorded once in every 24-hours.
Patients who were unavailable for PTTS assessment for the entire 12-hour period were
considered compliant for that period.
p values represent the difference between compliance for cases and controls for that time
frame.
Key: aPearson’s Chi squared values
4.3.6.2 Recording of PTTS value
The standards achieved for monitoring of the PTTS score can be seen in Table 4.4.
The majority of patients had at least one PTTS score recorded in each 12-hour
period, although neither cases nor controls achieved greater than 95% compliance
when assessed across the 48-hours. Compliance for the final 12-hour study period
achieved high-level compliance. There were no differences between cases and
controls in either time period.
Accuracy of PTTS recording was significantly higher in control patients when
assessed over the 48-hour study period. No differences were seen in the final 12-
hours, although compliance was greater than 90% for both groups.
A greater proportion of case patients had at least one PTTS calculated from a full
set of vital sign parameters for each 12-hour period within the study (64.0% vs
52.4%, p =.004). This difference was maintained in the final 12-hours before the
critical deterioration event (81.5% vs 72.7%, p =.010).

206
Table 4.4 Cases and controls achieving compliance to individual elements of the PTTS score protocol for the 48-hour study period and the final 12-hours of data collection
PTTS recording 48-hour study period Final 12-hours
Cases
(n=297)
Controls
(n=311)
p values Cases
(n=297)
Controls
(n=311)
p values
PTTS score recorded 288
(97.0)
295
(94.9%)
.417a 291
(98.0%)
306
(98.4%)
.699a
PTTS score accurately
calculated from the
available component
parameters
215
(72.4%)
262
(84.2%)
<.001 281
(94.6%)
287
(92.3%)
.247
PTTS calculated from a
complete observation
set
190
(64.0%)
163
(52.4%)
.004 242
(81.5%)
226
(72.7%)
.010
PTTS accurately
calculated from a
complete observation
set
139
(46.8%)
141
(45.3%)
.718 221
(74.4%)
202
(65.0%)
.011
Compliance was regarded as documentation of at least one PTTS value meeting the
specified standard in every 12-hour period.
Patients who were unavailable for PTTS assessment for the entire 12-hour period were
considered compliant for that period.
p values represent the difference between compliance for cases and controls for that time
frame (Pearson’s Chi squared values)
The standard considered to be fully adherent to the escalation protocol is highlighted in
green
The requirement to have an accurate PTTS score calculated from a full set of vital
sign parameters at least once in every 12-hours was met in less than half of patients
for the 48-hour study period. Case patients had increased compliance in the 12-
hours before the critical deterioration event and this was significantly better than
controls (74.4% vs 65.0%, p =.011).

207
4.3.6.3 Presence of a monitoring plan
Compliance to documenting a plan for monitoring the vital sign parameters on the
PTTS chart was significantly better in control patients for both time periods (p
<.001). However overall compliance was poor for all patients, as shown in Table 4.5.
Table 4.5 Compliance to documenting the monitoring plan over the 48-hour study period and in the final 12-hours of data collection
Protocol 48-hour study period Final 12-hours
Cases
(n=297)
Controls
(n=311)
p values Cases
(n=297)
Controls
(n=311)
p values
Monitoring plan
documented
38
(12.8%)
75
(24.1%)
<.001 54
(18.2%)
90
(28.9%)
<.001
Compliance was regarded as documentation on the PTTS chart of a monitoring plan at least
once in every 12-hour period.
Patients who were unavailable for PTTS assessment for the entire 12-hour period were
considered compliant for that period.
p values represent the difference between compliance for cases and controls for that time
frame (Pearson’s Chi squared)
4.3.6.4 Overall compliance to PTTS monitoring standards
Overall compliance to the PTTS monitoring standard was poor for both cases and
controls (Table 4.6). Less than 5% of case patients achieved the required standard
for the 48-hour study period, although compliance increased to 12.5% in the 12-
hours before the critical deterioration event. Although better levels of compliance
were seen in control patients, the standard was still only met for 10.0% of this group
for the 48-hour study period. There was no significant difference in compliance
between cases and controls in the final 12-hours.

208
Table 4.6 Overall compliance to PTTS monitoring standards
48-hour study period Final 12-hours
Cases
(n=297)
Controls
(n=311)
p value Cases
(n=297)
Controls
(n=311)
p value
Compliant 11
(3.7%)
31
(10.0%)
.002 37
(12.5%)
54
(17.4%)
.090
Non-compliant 286
(96.3%)
280
(90.0%)
260
(87.5%)
257
(82.6%)
To be considered compliant, a PTTS value - accurately calculated from all 6 vital sign
parameters - and a monitoring plan had to be recorded at least once in every 12-hour period.
Patients who were unavailable for PTTS assessment for the entire 12-hour period were
considered compliant for that period.
p values represent the difference between compliance for cases and controls for that time
frame (Pearson’s Chi squared)
4.3.7 Compliance to the PTTS escalation protocol
Compliance to the escalation protocol was assessed for all patients with a low
(PTTS score of two), medium (PTTS score of three and four) and high PTTS (PTTS
score of five and above).
4.3.7.1 Compliance for patients considered to be at low risk
A CEWS score of two was considered to represent a low risk of deterioration and
the escalation protocol indicated that a full observation set with a PTTS value should
be taken within 30 minutes. Compliance to the escalation protocol within one, two
and 12 hours is shown in Table 4.7.
There was no statistical difference in compliance between cases and control for
repeat recording of the PTTS within one hour when examined across the 48 hour
study period or during the final 12-hours of data collection. However significantly
more case patients had a PTTS value recorded within two hours when assessed
across the complete 48-hour data collection period and during the final 12-hours
before the critical deterioration event. Not all patients with a PTTS score of two had

209
a repeat recording within 12-hours. There was no difference seen between
compliance in case patients versus controls.
Table 4.7 Compliance to escalation protocol for the first recorded PTTS value of two in the 48-hour study period and final 12 hours of data collection
Time
achieved
within
Escalation
action
48-hour study period Final 12-hours
Cases
(n=221)
Controls
(n=134)
p value Cases
(n=154)
Controls
(n=45)
p value
1 hour Repeat
PTTS
41
(18.6%)
15
(11.2%)
.065a 26
(16.9%)
4
(8.9%)
0.239b
2 hours Repeat
PTTS
71
(32.1%)
22
(16.4%)
.001a 47
(30.5%)
5
(11.1%)
0.009a
12 hours Repeat
PTTS
168
(76.0%)
94
(70.1%)
0.222a 104
(67.5%)
22
(48.9%)
0.023a
Compliance was assessed for the first documented PTTS value of two within the 48-hour
study period and the final 12-hours of data collection.
Repeat PTTS recording had to contain all 6 vital sign parameters and be accurately
calculated.
p values represent the difference between cases and controls for compliance to either PTTS
recording or clinician review within the target time frame.
The standard considered to be fully adherent to the escalation protocol is highlighted in
green.
Key: aPearson’s Chi squared values;
bFishers exact probability test

210
4.3.7.2 Compliance for patients considered to be at moderate risk
Scores of three or four were considered to represent a moderate risk of
deterioration. Compliance to the escalation protocol was considered to have been
achieved if there was a repeat PTTS recording within one hour and documentary
evidence of clinical review by a doctor of at least registrar status within two hours.
Compliance to the escalation requirements for a PTTS score three can be seen at
Table 4.8 and for a score of four at Table 4.9.
When the 48 hour data collection period was examined, repeat recording of PTTS
within the required target of one hour was statistically better in case patients than
controls (21.6% vs 3.0%, p<.001). A significant difference was also seen during the
final 12-hours of data collection. However overall compliance was poor for both
groups and considerable numbers of cases and controls failed to have a repeat
PTTS value recorded within 12 hours.
Compliance was even poorer for repeat recording of the PTTS after an elevated
score of four had been documented. There was no difference between cases and
controls for repeat PTTS recording within one, two and 12 hours. Levels of
compliance were low for both groups. Again, considerable numbers of patients did
not have a documented PTTS value recorded within 12-hours of their first
documented PTTS score of four.
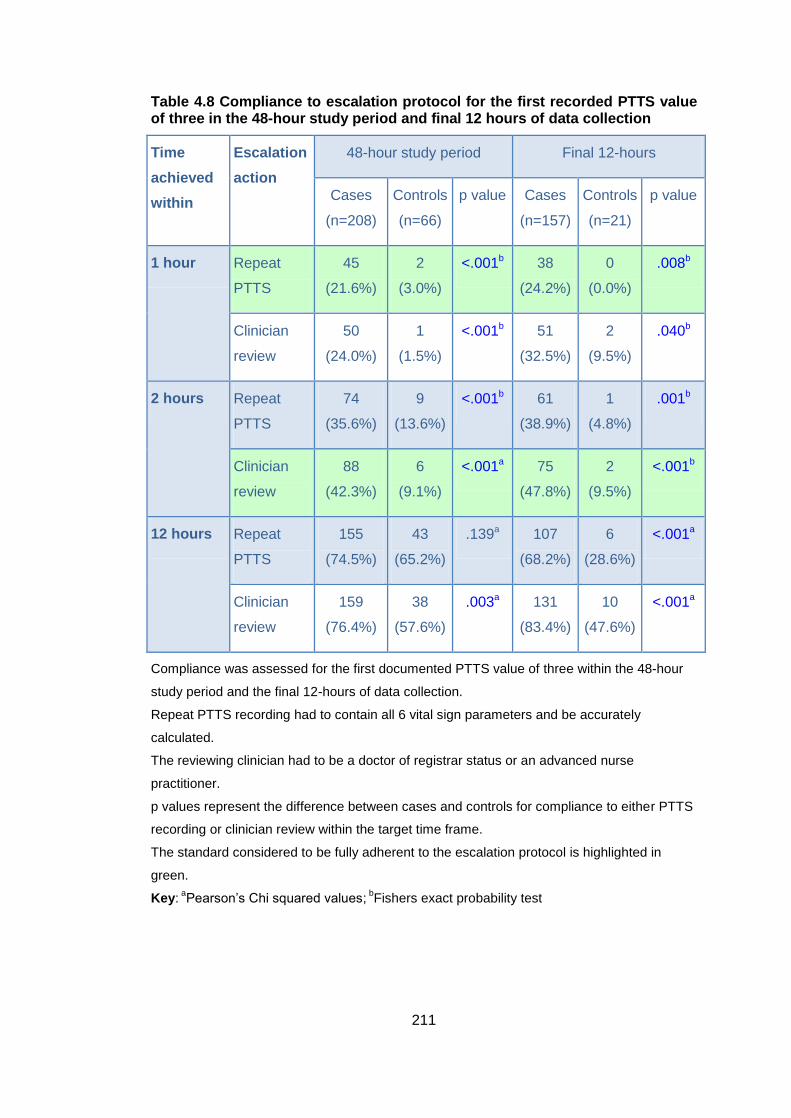
211
Table 4.8 Compliance to escalation protocol for the first recorded PTTS value of three in the 48-hour study period and final 12 hours of data collection
Time
achieved
within
Escalation
action
48-hour study period Final 12-hours
Cases
(n=208)
Controls
(n=66)
p value Cases
(n=157)
Controls
(n=21)
p value
1 hour Repeat
PTTS
45
(21.6%)
2
(3.0%)
<.001b 38
(24.2%)
0
(0.0%)
.008b
Clinician
review
50
(24.0%)
1
(1.5%)
<.001b 51
(32.5%)
2
(9.5%)
.040b
2 hours Repeat
PTTS
74
(35.6%)
9
(13.6%)
<.001b 61
(38.9%)
1
(4.8%)
.001b
Clinician
review
88
(42.3%)
6
(9.1%)
<.001a 75
(47.8%)
2
(9.5%)
<.001b
12 hours Repeat
PTTS
155
(74.5%)
43
(65.2%)
.139a 107
(68.2%)
6
(28.6%)
<.001a
Clinician
review
159
(76.4%)
38
(57.6%)
.003a 131
(83.4%)
10
(47.6%)
<.001a
Compliance was assessed for the first documented PTTS value of three within the 48-hour
study period and the final 12-hours of data collection.
Repeat PTTS recording had to contain all 6 vital sign parameters and be accurately
calculated.
The reviewing clinician had to be a doctor of registrar status or an advanced nurse
practitioner.
p values represent the difference between cases and controls for compliance to either PTTS
recording or clinician review within the target time frame.
The standard considered to be fully adherent to the escalation protocol is highlighted in
green.
Key: aPearson’s Chi squared values;
bFishers exact probability test

212
Table 4.9 Compliance to escalation protocol for the first recorded PTTS value of four in the 48-hour study period and final 12 hours of data collection
Time
achieved
within
Escalation
action
48-hour study period Final 12-hours
Cases
(n=166)
Controls
(n=32)
p value Cases
(n=127)
Controls
(n=10)
p value
1 hour Repeat
PTTS
22
(13.3%)
2
(6.3%)
.380b 23
(18.1%)
2
(20.0%)
1.000b
Clinician
review
44
(26.5%)
1 (3.1%) .002b 43
(3.9%)
0
(0.0%)
.030b
2 hours Repeat
PTTS
46
(27.7%)
9
(28.1%)
1.000a 51
(40.2%)
3
(30.0%)
.740b
Clinician
review
66
(39.8%)
6
(18.8%)
.024a 67
(52.8%)
1
(10.0%)
.017b
12 hours Repeat
PTTS
119
(71.7%)
21
(65.6%)
.488a 83
(65.4%)
5
(50.0%)
.330b
Clinician
review
133
(80.1%)
22
(68.8%)
.153a 108
(85.0%)
3
(30.0%)
<.001b
Compliance was assessed for the first documented PTTS value of four within the 48-hour
study period and the final 12-hours of data collection.
Repeat PTTS recording had to contain all 6 vital sign parameters and be accurately
calculated.
The reviewing clinician had to be a doctor of registrar status or an advanced nurse
practitioner.
p values represent the difference between cases and controls for compliance to either PTTS
recording or clinician review within the target time frame.
The standard considered to be fully adherent to the escalation protocol is highlighted in
green.
Key: aPearson’s Chi squared values;
bFishers exact probability test

213
Escalation to a senior clinician within two hours demonstrated slightly better
compliance for case patients. A significantly greater proportion of case patients had
documentary evidence of a review across all time periods when compared to
controls, but the overall compliance for both groups was poor. Only 37.7% of case
patients and less than 15% of controls achieved the required standard of two hours.
4.3.7.3 Compliance for patients considered to be at high risk
Scores of five and above were considered to indicate a patient at high risk of
deterioration. The protocol indicated that the nurse should repeat the PTTS
recording within one hour. A score of five and above also required escalation to a
senior doctor together with activation of the intensive care outreach team. These
should be completed within two hours. Compliance to a PTTS score of five and
above is summarised in Table 4.10.
Table 4.10 Compliance to escalation protocol for the first recorded PTTS value of five or more in the 48-hour study period and final 12 hours of data collection
Time
achieved
within
Escalation
action
48-hour study period Final 12-hours
Cases
(n=154)
Controls
(n=19)
p value Cases
(n=123)
Controls
(n=7)
p value
1 hour Repeat
PTTS
38
(24.7%)
2
(10.5%)
.250b 32
(26.0%)
0
(0.0%)
.193b
Clinician
review
64
(41.6%)
3
(15.8%)
.044b 50
(40.7%)
2
(28.6%)
.702b
Outreach
review
29
(18.8%)
1 (5.3%) .203b 28
(22.8%)
1
(14.3%)
1.0b

214
Time
achieved
within
Escalation
action
48-hour study period Final 12-hours
Cases
(n=154)
Controls
(n=19)
p value Cases
(n=123)
Controls
(n=7)
p value
2 hours
Repeat
PTTS
62
(40.3%)
5
(26.3%)
.238b 51
(41.5%)
0
(0.0%)
.042b
Clinician
review
74
(48.1%)
3
(15.8%)
.007b 72
(58.5%)
2
(28.6%)
.140b
Outreach
review
39
(25.3%)
1 (5.3%) .079b 50
(40.7%)
1
(14.3%)
.245b
12 hours Repeat
PTTS
110
(71.4%)
15
(78.9%)
.488a 79
(64.2%)
2
(28.6%)
.103b
Clinician
review
125
(81.2%)
13
(68.4%)
.192a 105
(85.4%)
2
(28.6%)
.002b
Outreach
review
80
(51.9%)
2
(10.5%)
<.001b 89
(72.4%)
2
(28.6%)
.002b
Compliance was assessed following the first documented PTTS value of five or more within
the 48-hour study period and the final 12-hours of data collection.
Repeat PTTS recording had to contain all 6 vital sign parameters and be accurately
calculated.
The reviewing clinician had to be a doctor of registrar status or an advanced nurse
practitioner.
p values represent the difference between cases and controls for compliance to either PTTS
recording or clinician review within the specified time frame.
The standard considered to be fully adherent to the escalation protocol is highlighted in
green.
Key: aPearson’s Chi squared values;
bFishers exact probability test
Repeat recording within the required standard of one hour of a PTTS score at or
above five had low levels of compliance. There was no significant change in the rate
of compliance for case patients in the final 12-hours before the critical deterioration
event (p =.07) and less than half had the PTTS score repeated within two hours.

215
Although the number of control patients with a PTTS score of five or more was low,
there was also poor adherence to the requirement for repeat PTTS recording.
Across the 48-hour study period less than half of case patients had documentary
evidence of a review by a senior clinician with 2-hours of the first recorded PTTS of
five or more. A significantly lower proportion of control patients achieved this
standard (control 15.8% vs case 48.1%, p =.007). Activation of the intensive care
outreach team demonstrated similar differences in compliance. Whilst 25.3% of
case patients had evidence of an outreach review within two hours, only one of the
nineteen controls patients (5.3%) achieved this target. However this difference was
not statistically significant.
During the final 12-hours of data collection there was no significant improvement in
compliance for case patients for repeat PTTS recording within one hour (24.7% to
26.0%, p =.07) and senior clinician review (48.1% to 58.5%, p =.08) within two
hours. However outreach reviews within two hours did show a significant increase in
compliance, from 25.3% to 40.7% (p =.007). There was low compliance to the
escalation protocol for control patients during the final 12-hour data period. No
patients had their PTTS score repeated within the hour. Only two of the seven
patients received a senior clinician review and only one had evidence of a critical
care outreach review.
4.3.7.4 Overall compliance to the escalation protocol
Overall compliance to the escalation protocol was poor. Compliance was assessed
from the first recorded PTTS value of two, three and five or greater. Although 168
control patients were compliant with the required standard, only 164 (of 311)
achieved a score which would require escalation. By contrast only 41 (of 297) case
patients had a score below two, which would not require escalation.

216
Table 4.11 Overall compliance to escalation protocol over the 48-hour study period and final 12 hours of data collection
48-hour study period Final 12-hours
Cases
(n=297)
Controls
(n=311)
p value Cases
(n=297)
Controls
(n=311)
p value
Compliant to
escalation protocol
44
(14.8%)
168
(54.0%)
<.001a 75
(25.3%)
252
(81.0%)
<.001a
Non-compliant to
escalation protocol
253
(85.2%)
143
(46.0%)
222
(74.7%)
59
(19.0%)
p values represent comparison of compliance and non-compliance for cases and controls
Key: aPearson’s Chi squared values;
bFishers exact probability test
4.3.8 Overall compliance to the protocol.
Overall, compliance to the escalation protocol was very poor. When assessed
across the 48-hour study period no case patient was compliant with the required
standard for monitoring and escalation and only 6.4% of controls patients achieved
the standard required. The final 12-hours before the critical deterioration event saw
a small improvement in compliance for both cases and controls but levels still fell far
below the standard required.

217
Table 4.12 Overall compliance to monitoring and escalation protocol over the 48-hour study period and final 12 hours of data collection
48-hour study period Final 12-hours
Cases
(n=297)
Controls
(n=311)
p value Cases
(n=297)
Controls
(n=311)
p value
Compliant to
monitoring and
escalation protocol
0
(0.0%)
20
(6.4%)
<.001b 6
(2.0%)
45
(14.5%)
<.001a
Non-compliant to
monitoring and
escalation protocol
297
(100.0%)
291
(93.6%)
291
(98.0%)
266
(85.5%)
Overall compliance required adherence to both the monitoring (Table 4.6) and escalation
protocol (Table 4.11).
p values represent comparison of compliance ad non-compliance for cases and controls
Key: aPearson’s Chi squared values;
bFishers exact probability test
.
4.4 Discussion
In this chapter the frequency and completeness of the component vital sign
parameter recording of an established PTTS have been examined. The accuracy of
PTTS scoring and adherence to an established protocol for escalation have also
been assessed. These links to the ‘recognising deterioration’ component of the safe
system framework (Figure 1.5 and Table 1.5).33 Results clearly indicate that PTTS
are not used optimally, with frequent errors and omissions in both the monitoring
and escalation process.
Heart rate, oxygen saturation and respiratory rate were found to be recorded more
frequently than other component vital sign parameters. Systolic blood pressure,
temperature and AVPU had fewer recordings. This is similar to findings from other
paediatric studies.59,67,117
It is unclear what influences the decision to include or omit a vital sign parameter
from an observation set. The consistency between this study and other paediatric
studies would suggest that inclusion or omission is an active choice rather than a
random act of chance. Paediatric nurses may place greater emphasis on recording
heart rate, oxygen saturation and respiratory rate as they are aware that the majority

218
of paediatric cardiorespiratory arrests follow decompensated respiratory or
circulatory failure. This is supported by the findings from a small survey of paediatric
nursing and medical staff in which respiratory rate was identified as the most
important indicator of deterioration, followed by heart rate, conscious level, oxygen
saturation and blood pressure.67
To function effectively PTTS scores need to be recorded accurately and from
complete observation sets. The evidence from this study indicates that PTTS scores
are often sub-optimal. A large proportion are based on incomplete observation sets
where one or more parameters are missing. Failing to record a full observation set
could result in a total PTTS score which is lower than one derived from a complete
observation set. This is significant as it will result in a ‘missed opportunity’ to identify
deterioration.208
Inaccuracy in total PTTS scoring was also common, with 23.9% of observation sets
incorrectly calculated from the available vital sign parameters. Analysis of the
reason for scoring errors indicated that an incorrectly allocated sub-score for one or
more vital sign parameters was the most frequent cause. This was despite clear
guidance that the lower score should always be used if the vital sign reading sat on
the border between two differing scores. This should have resulted in a greater risk
of over-scoring errors, were the higher and not the lower sub-score erroneously
selected. However under-scoring errors dominated, potentially exposing the patient
to a missed opportunity to identify and address clinical deterioration. Few studies
have systematically examined scoring errors in children, but the preponderance of
under-scoring is in keeping with studies of hospitalised adults.49,54,90 The reasons for
this are unclear but researchers have suggested that bedside staff may ‘manipulate’
the score to support their clinical impression of the patient.49
A significant proportion of total PTTS values were not documented. If the PTTS
value was not calculated it would be unknown to the nurse and therefore could not
be acted upon. This would represent a missed opportunity to act on deterioration.
However the nurse may have calculated the value but failed to document it. This
would represent a missed opportunity to communicate deterioration to the multi-
disciplinary team. These omissions undermine the effectiveness of the system and
do not facilitate ongoing monitoring and effective communication of the patient’s
condition.

219
Analysis of the time of day that vital sign parameters are recorded suggests that
nurses working with children and young people take observations at regular times,
namely 10, two and six o’clock. Patients who went on to suffer a critical deterioration
event had a greater number of observation sets recorded outside of these times,
although the predominance of the four-hourly recording pattern could still be seen
(Figure 4.9). This contrasts with the findings of an adult study which identified two
large peaks in vital sign recording at 6am and 10pm.93
Analysis of the number of vital sign parameter recordings in the hours before the
critical deterioration event revealed a steady increase in the number of recordings
for case patients (Figure 4.13) whilst controls (who did not suffer a critical
deterioration event) maintained a steady rate of recording (Figure 4.14). This
indicates that nurses increased the frequency of vital sign recording, possibly
because they were prompted to do so by the escalation protocol or because they
detected other clinical signs which they interpreted as indicating a deterioration in
the patient’s condition. The highest recording rate was noted to be three hours
before the event. However after this time there was a marked drop in the rate of
recording across all vital sign parameters, with levels returning to those seen at
baseline (48-hours before the event). The reasons for this are unclear. It may be
that nurses have identified that the patient is ‘at-risk’ and are taking steps to
intervene and these interventions prevent the recording of further PTTS values. Or,
having identified that the patient was deteriorating, the nurse perceived that further
recording of PTTS would not influence the management of the patient, and made an
active decision to reduce or discontinue PTTS recording. An alternative view is that
the decrease in the rate of PTTS recording fails to identify the patient’s critical
condition and the lack of appropriate intervention accelerates the physiological
pathway towards the critical deterioration event.
Effective track and trigger systems promote adherence to a protocol. Significant and
wide-ranging issues with compliance in both the monitoring and escalation of PTTS
have been identified in this study. Compliance was assessed using an ‘all or
nothing’ approach207 which leads to lower reported levels than traditional measures,
but provides a more sensitive indicator of the overall stability of the process.
Closer examination of the individual elements reveals the required standard of vital
sign parameter recording was not achieved in just 3.0% of cases and 5.1% of
controls. Compliance was consistent across all vital sign parameters apart from

220
systolic blood pressure, where levels were increased for controls. A study of
compliance in adults recovering from major surgery identified 3.7% of patients who
did not have at least one recording of blood pressure documented during the shift.95
However compliance varied across differing vital sign parameters. Respiratory rate
was the most poorly recorded, with documentation failure identified on 15.4% of
occasions. Of greater concern are the findings from a paediatric study reporting
adherence to a 12-hourly PTTS monitoring protocol, where only half of the required
parameters were recorded, despite the research nurses’ consistent requests for
adherence to the protocol.117 Temperature was the most frequently recorded and
was present in 88.4% of observation sets whilst blood pressure was the least, at
only 25.1%. Whilst oxygen saturation (76.7%), respiratory (79.7%) and heart rate
(86.8%) recording were present in the majority of observation sets, levels of
compliance fell below that seen in this study (Figure 4.1).
The vast majority of patients achieved the required standard of one documented
PTTS value per 12-hour period. However a number of PTTS values were calculated
from incomplete observation sets and had inaccuracies in the score calculation
(Table 4.3). As a result less than half of patients had at least one recorded PTTS
value that met the required standard for each 12-hour period.
Overall compliance to the PTTS monitoring standards was low. Only 6.9% of
patients achieved the required standard across all elements for each 12-hour
period. The greatest influence on compliance came from the lack of a documented
monitoring plan on the PTTS chart: only 18.5% achieved the required standard.
Within the ’all or nothing’ assessment framework, failure to achieve the standard for
any one component in any one 12-hour period results in a failure to achieve
compliance overall. In effect, the component with the lowest reported value acts as
a ‘ceiling’ to the overall compliance level. This explains why overall levels of
compliance within this study appear at first to be far lower than other studies.
Compliance to the escalation protocol suffered from similar deficiencies. The
protocol required elevated PTTS scores to be repeated in 30 minutes. For the
purposes of this study compliance was considered to have been achieved if a
documented PTTS value was noted within 60 minutes. This was to allow for
prioritisation of competing patient-related demands such as toileting or administering
analgesia.

221
Repeat recording of PTTS values rarely achieved the required standard (Table 4.7,
Table 4.8 and Table 4.9), although compliance was marginally improved at higher
PTTS scores (Table 4.10). Compliance was significantly better in case compared
with control patients for scores at or above two and 3. The low number of control
patients with a PTTS score of five and above resulted in differences which were not
statistically significant.
A number of patients did not have a repeat PTTS value recorded within 12-hours of
the initial elevated score. This represents a significant period of time where
deterioration (or indeed improvement) in the patient’s condition may go undetected.
Compliance was only considered to have been achieved if the repeat PTTS value
was scored accurately and calculated from a complete observation set. Many
patients had repeat PTTS values which did not achieve this standard. The decision
to record an incomplete observation set may have been influenced by the nurse’s
decision to ‘check’ only those vital sign parameters which were previously assessed
as ‘abnormal’. This fails to acknowledge that physiological abnormalities are rarely
solitary in nature and that PTTS values derived from incomplete observation sets
may under-represent the ‘true’ PTTS score. False reassurance of clinical stability
and potentially delayed escalation may result.
Higher PTTS scores of three or more required escalation and review by a senior
clinician, with scores of five also requiring input from the critical care outreach team.
These elevated score indicate significant physiological derangement. Compliance
was achieved if there was documentary evidence of escalation or review within two
hours. Overall levels were low. Non-compliance could simply be a failure to
document escalation calls or clinical reviews. However this raises concern, as
important clinical information may have been lost, particularly around the
interventions administered and the patient’s subsequent response which might
inform future treatment. More seriously, non-compliance may indicate a failure of the
nurse to call for assistance or a failure of the relevant clinician to respond. These
failures leave the patient vulnerable as delayed intervention in significant
physiological derangement increases morbidity and mortality.31,60,209
There were significant failures in the escalation of patients who achieved a PTTS of
five and above. Less than one third (32.0%) were reviewed by a clinician within the
required two hours and a quarter (25.2%) had no evidence of any review within 12-
hours. This raises concerns that significantly high PTTS scores were poorly

222
responded to or worse still ignored. When a PTTS value of five or above occurred in
the final 12 hours before the critical deterioration event, no evidence could be found
of a senior clinical review in 14.6% of cases and 73.4% of controls.
Overall compliance to the escalation protocol was poor. Only 15.8% of cases were
compliant to the protocol for the 48-hour study period. Results appeared better for
controls, where over half (54.0%) achieved compliance. However closer
examination reveals that only 147 controls achieved a score which would require
escalation. Of these, only four met the necessary standard. Of the 297 cases
patients, 256 had PTTS scores of two or more. Just six met the required standard.
When compliance to both the monitoring and escalation protocol were combined,
the results were disappointing. Across the 48-hour study period only 20 control
patients met the required standard and no case patients were considered compliant.
These standards were considered the minimum requirement for monitoring and
escalation based on clear guidance that was shared with all nursing and medical
staff on induction and through yearly updates.
The reasons for non-compliance are unclear. The failure to escalate has previously
been perceived as an inadequacy in education around the signs of clinical
deterioration and insufficient knowledge of the role of the intensive care outreach
team.210 However it is becoming apparent that the situation is far more complex,
with multiple factors influencing whether a PTTS protocol is followed or not. Studies
conducted with nurses caring for acutely ill adult patients have identified issues
around the inexperience of both nurses83,111,114 and doctors,83,102,111 nursing
workload,111 issues of staff shortage (both medical and nursing),113 interprofessional
relationships and teamworking,81,83,111 institutional hierarchy,81,83,112,113 and staff
inexperience.111
A qualitative paediatric study of the perceived benefits of a PTTS highlighted that
staff perceive the PTTS as unhelpful in patients who were stable, those with
abnormal baselines physiology and children with neurological deterioration.79 This
may offer an explanation of non-compliance in some, but not all, patients.
Clinicians may also regard protocol-based care as too rigid and unresponsive to the
individual needs and desires of children and young people and their families. Others
have reported that staff may ‘re-prioritise’ the escalation of an elevated track and
trigger score dependent on multiple factors, such as the environment, the perceived

223
competence of the attending medical staff and the status of pending
investigations.210 The evidence to quantify and explain failures in the monitoring and
escalation of PTTS compliance is currently very limited.
4.4.1 Limitations of the study
This was a case-controlled study conducted in a tertiary specialist children’s
hospital. As such, the population may not be representative of patients within
specialist children’s hospitals or paediatric services in other centres.
The findings are based on retrospective data collected through healthcare record
review. There was no way to verify if failures in compliance were due to failures in
care or failures in documentation. There was no attempt to explore whether the
errors or admissions caused patient harm, nor to explain or justify why these events
had occurred. This initial exploratory study merely sought to quantify and describe
their occurrence in a population of ‘sick’ and ‘stable’ patients within a specialist
children’s hospital.
Compliance was based on ‘all or nothing’ measurement of the standard of care. The
methodology is such that the selected standards should be clearly linked to an
improvement in clinical outcomes, however current evidence is limited. The
measures used in this study were chosen on the basis of national recommendations
and professional consensus,3,5,6,51 but there is a possibility that other measures may
have been more appropriate. Greater standardisation of pragmatic measures to
evaluate PTTS and other similar interventions would facilitate meaningful
comparison and collaborative research.168
To facilitate analysis, escalation compliance was only assessed on the first recorded
PTTS value at or above a score of two, three and five for each 12-hour time period.
Analysis of repeated high PTTS values may have yielded different results.
4.5 Conclusion
This chapter has assessed the compliance to a monitoring and escalation protocol
for an established PTTS in a specialist children’s hospital. The findings have
highlighted deficiencies in the documented recording and escalation of PTTS scores
when assessed against an ‘all or nothing’ standard. As such, the use of PTTS is
sub-optimal. This jeopardises the ‘recognising deterioration’ component of the ‘safe

224
system’ approach to managing deteriorating children in hospital33 with a potentially
negative effect on clinical outcomes.
The next chapter will explore how children and young people, their families and
nursing staff perceive and use vital sign parameter and PTTS monitoring.

225
Chapter 5 Utility: the experiences of children and young people, their families and nursing staff of vital sign observation recording and use of a paediatric track and trigger system
5.1 Introduction
Vital sign observations and paediatric track and trigger system (PTTS) values are
traditionally recorded and acted upon by the bedside nurse. As such, the interaction
between nurses, children/young people and their families is pivotal to the early
identification and prompt response to critical deterioration.211-213 The safe system
framework33 has highlighted that greater involvement of children/young people and
families is needed if these systems are to be effective.
The previous chapter presented the variability in recording of vital sign parameters
and PTTS values. This chapter focuses on understanding the experiences of
children, families and nurses of vital sign recording and use of a PTTS (Utility). This
may offer insight into the reasons for variability in vital sign and PTTS recording,
potentially highlighting factors that may be amenable to change. This could improve
the reliability of PTTS and have a potentially positive impact on childhood morbidity
and mortality.
5.1.1 Background
Paediatric nurses are expected to work in partnership with children and parents214
but little is known about children’s and families’ perceptions and understanding of
vital sign monitoring and PTTS. Effective use of PTTS systems requires regular and
complete recording of component parameters and prompt escalation of elevated
scores. It is unclear what role, if any, parents and children play in this process.
The systematic review reported in chapter two identified nine PTTS systems
incorporating parental concern as a parameter. Despite this, no studies were
identified which specifically explored the views of parents on PTTS that are used
and activated exclusively by healthcare professionals. The recently published safe
system framework seen at Figure 1.5 for children at risk of deterioration33 places
children and young people at the centre, surrounded by their parents and carers and
then clinicians. The framework makes specific reference to the partnership between
patients, families and clinicians, emphasising that this is an area which requires
growth.

226
Some institutions have facilitated parents and family members to be able to activate
specialist teams such as a rapid response team if they perceive their child is
deteriorating. Condition H123 (for help), for example, evolved following the death of a
child in hospital whose deterioration was missed despite her mother expressing
concerns to healthcare professionals.215 Despite staff concerns that this service
would be overburdened with calls from parents, the evidence indicates that numbers
are small.216,217 Breakdown in relationships between parents and professionals were
cited as a frequent underlying reason for the call.217 Further evidence of the role that
parents can play comes from a recent paper on detection of deterioration in infants
discharged home after congenital heart surgery. The behavioural changes noted by
parents were reported as a potential indicator of deterioration.218
There is a small but growing body of research exploring the views of staff on vital
sign monitoring and use of PTTS. A systematic review of vital signs in hospitalised
adult patients noted a lack of evidence on optimal practice and suggested that vital
sign measurement is based more on tradition and expert opinion than research.219
Evidence on track and trigger system use is largely adult based, although studies on
paediatric specific tools are now emerging.79,83 Findings from qualitative studies
suggest that clinicians identify benefits of a PTTS, such as providing junior staff with
guidance on the expected vital sign values for children and facilitating an objective
assessment of the child’s condition, using criteria unrelated to their validity and
reliability.79,83,217 However no studies have been identified that specifically canvas
the views of children and young people on vital sign monitoring or PTTS use.
5.2 Aim
The overarching aim of this study was to describe the experiences of hospitalised
children/young people, their families and nurses of vital sign monitoring and use of a
PTTS in a medical, surgical and short stay paediatric ward.
5.2.1 Principle research questions to be addressed
Three principle research questions were identified:
1. What are the experiences of hospitalised children/young people undergoing
vital sign monitoring and their perceptions and understanding of PTTS in
detecting critical deterioration?
2. What are the experiences of families of hospitalised children/young people
undergoing vital sign monitoring and their perceptions and understanding of

227
PTTS in detecting critical deterioration?
3. What are the experiences of nurses undertaking vital sign monitoring of
hospitalised children and young people and their perceptions and
understanding of PTTS in detecting critical deterioration in these patients?
5.3 Methods
5.3.1 Study design and rationale
This was an exploratory study examining the experiences, perceptions and
understandings of children/young people, families and nurses on PTTS. A
qualitative approach was selected as being most appropriate for facilitating the
production of rich data and allowing issues of importance to participants to
emerge.220
It was recognised that differing data collection techniques would be needed for
children, young people, parents and nursing staff. Research with younger children
presents specific challenges, particularly with those who are hospitalised or have
learning disabilities.221,222 It is well documented that eliciting their thoughts and views
may not be amenable to traditional qualitative techniques such as
interviews.221,223,224 The draw and write technique was selected because it has been
used successfully in research with hospitalised children under 12-years of age.225,226
It is an approach which allows children to contribute their perspective in a way that
is most suited to their needs and preferences.227 The technique facilitates children,
particularly younger children, to become active participants in research by revealing
their unique perspective on illness and healthcare as they see it.228,229 Drawing is a
familiar activity and is seen as pleasurable and non-threatening by children. It is
often used by younger children to communicate their perception about the world.221
Because children may know more than they are able to say, the drawings are used
by the researcher as a springboard to facilitate discussion and engage children in
verbal descriptions or writings describing the area in question.221,228 As such, it has
been seen as a useful research tool for eliciting the views of children of differing
developmental ages who are suffering from acute and chronic diseases.
221,225,226,228,230
Older children have more developed cognitive and verbal functioning and there are
many examples of them having successfully participated in interviews in a hospital
228
setting.221,223,231,232 An informal, conversational approach using semi-structured
questions has been recognised as encouraging the young person to talk freely
about their views, allowing them to raise issues which they feel are important.221,233-
235 In this study, it was important that young people felt their views were heard and
respected, so they were encouraged to discuss both positive and negative aspects
of vital sign monitoring. Facilitating this was key as they were being interviewed by a
nurse whilst they were on the ward receiving treatment and could have felt unable to
be honest.
Semi-structured interviews were also used to elicit the views of parents. This
method was selected as the most appropriate way of collecting data in a single
session, allowing the conversation to be structured around PTTS and vital signs but
with the flexibility to explore factors that participants felt were important.
Furthermore, individual interviews could be more easily scheduled to accommodate
the needs of the child and family than other qualitative approaches such as focus
groups.
Focus groups were selected to capture the views of nurses. Focus groups are
particularly useful when participants have a shared goal or characteristic, in this
case their role as a paediatric nurse.236 This methodology was selected as it was
considered that the interaction between participants was likely to enhance the
richness of the data. Focus groups may also highlight similarities and differences
between the participants in a way that individual interviews cannot. Participants may
not only question each other, but offer explanations to the group,237 which may be
relevant when seeking to explore the inconsistencies in practice highlighted in
chapter four. The methodology has been highlighted as particularly useful when little
is known about the topic under investigation,236 such as nurses perceptions of PTTS
and vital sign monitoring and how they make decisions in clinical practice.54,111,219
Focus groups also offered a pragmatic way of collecting data from groups of
participants in a relatively short time frame. To minimise the burden on participants,
data collection took place during working hours. Releasing staff from their clinical
duties can sometimes be problematic and participants’ attention may not be focused
on the research if clinical workload is high. Focus groups were therefore conducted
on existing training days when staff were rostered for non-clinical duties. This
allowed data to be collected from a larger number of participants than could have
been achieved with individual interviews.

229
Framework was chosen for analysis of the qualitative data.238 Although framework
analysis has been used to generate theories, it is more suitable for describing and
interpreting what is happening in a particular setting.239,240 Framework analysis
allows for case-based and theme-based analysis, or a combination of the two.240
This was felt to be useful as data was collected from 3 separate groups of
individuals (children, parents and nurses) in three different environments (medical,
surgical and short-stay ward). As such, theme and case-based analysis may yield
differing benefits and enrich the interpretation of the data. Framework analysis has
also been used to combine mixed methods data.240 Framework analysis is reported
as being more explicit in its approach, providing transparent results and conclusions
that can be clearly linked back to the original data.240 All of these factors makes it
particularly suitable for use within this study.
5.3.2 Sampling strategy
Small sample sizes are acceptable in qualitative research. The richness of the data
is considered to be more important than the absolute number of participants.220,241
Small sample sizes also allow the data to be effectively managed.220,241 In qualitative
research large sample sizes can be considered to waste resources and subject
participants to unnecessary involvement when they are unlikely to add any new
data. 242
A purposeful sampling approach was used for children and families with the aim of
recruiting three to five parents and three to five children from each of three types of
wards: medical, surgical and short stay. These wards were felt to have a mixed
caseload with patients of differing ages, with acute and long-term conditions and
differing levels of acuity. The sample was anticipated to be reasonably
homogenous, so a large sample was not considered to be necessary.242,243 However
variation with regards to factors such as age of the child, gender, previous
admission to intensive care and number of previous hospitalisation was desirable.
To address this, a sampling matrix242,243 was constructed, comprising these
variables. Participants were purposely selected to fulfill those criteria across all three
wards.
Nurse participants were also purposefully selected from a convenience sample of
nurses attending staff training days. Focus groups were scheduled to take place on
those days. Using a sampling matrix, the ward manager identified nurses of differing

230
gender, banding, age and years of nursing experience to maximise the diversity of
the sample.
5.3.3 Inclusion and exclusion criteria
5.3.3.1 Children
Children/young people from four years up to 18 years of age were eligible to
participate. Children younger than four years were excluded as they may have
lacked the developmental capacity to participate fully in the study. Young people of
18 years and over were considered adults and therefore fell outside the scope of
this study. Children/young people with an active ‘Do Not Attempt Resuscitation’
(DNAR) or End of Life care pathway were excluded, as PTTS or vital signs may not
be actively monitored or escalated as a result.
5.3.3.2 Parents
Parents who were resident for at least one night during their child’s stay were
eligible to participate. Overnight stay was considered important so families could
discuss the impact of vital sign monitoring and PTTS at night. Parents were
excluded if their child had an active DNAR or End of Life care pathway for the
reasons outlined above.
5.3.3.3 Nurses
Nurses of band 6 or below who worked on the three identified wards were included
in the study. Nurses of band seven and above were excluded as these staff may not
record vital sign observations and use the PTTS on a daily basis. No other exclusion
criteria were applied.
5.3.4 Ethical issues
Approval was granted by the NHS research ethics committee and can be seen at
Appendix 6
5.3.4.1 Recruitment
Child/young people and parent participants were identified and screened by a
member of the direct care team. The direct care team were aware of the aims and
demands of the research and provided information leaflets to those who expressed
an interest in participating. These leaflets can be seen at Appendix 7. The team

231
were asked to make it clear to potential participants that their care would not be
affected if they declined either to speak to the candidate or participate in the study.
Staff were allocated to the focus group by the ward manager. A brief overview of the
study was provided at the beginning of the training day together with a request to
participate. Staff were advised to speak to the ward manager if they did not wish to
be approached by the candidate and given reassurance that they would be removed
from the focus group with no further clarification required.
5.3.4.2 Informed consent
Children/young people and parents who expressed an interest in the research to the
direct care team were approached by the candidate. The aims and requirements of
the study were explained and they were provided with further copies of the
information leaflet if required. If the child/young person and parent required time to
consider the study, a further meeting was scheduled at a mutually convenient time.
If the child/young person wished to participate, written informed consent was
obtained from their parent (Appendix 8.1). Children and young people were also
asked to give their assent and could sign a form if they chose to (Appendix 8.2).
Written consent was also obtained from parents for their own participation. Parents
and children/young people were provided with a copy of the assent/consent form to
keep. Consent was seen as a continual process rather than a ‘one-off’ event and
hence it was reviewed prior to and during the interviews and draw and write
sessions.
At the beginning of the focus group, staff were asked if they wished to participate in
the study. The candidate answered any questions that the participants raised.
Those who agreed to participate were asked to sign a consent form (Appendix 8.4).
5.3.4.3 Anonymity and confidentiality
Each parent, child and young person and nurse was assigned a unique identification
code. The names of the participants and all personal identifiable details were kept
separately from the research data. All electronic data were maintained on a
password protected Trust computer or Trust-supplied encrypted USB device in line
with local hospital policy. Consent forms and drawings were stored in a locked
cabinet. Files transferred via e-mail for transcription were encrypted.

232
Direct quotations from participants were pseudo-anonymised to protect participants
from identification. Particular care was taken to ensure that children with rare
conditions and/or their parents were not identifiable.
Participants were made aware that information disclosed during the interview or
focus group would not be shared with members of the patient’s direct care team or
their managers. Participants were told that anonymised data would, however, be
shared with the candidate’s supervisory team as part of the research supervision
process.
5.3.4.4 Maintaining privacy
Respect for the participants’ privacy was maintained at all times. Children/young
people and families were offered flexibility as to the location and scheduling of the
interview and draw and write sessions. Two child participants and one parent chose
for the interview to take place away from their bedside in the communal playroom
area. All other participants chose their child’s bedside.
Focus groups were held in a seminar room identified by the ward manager. A
member of the candidate’s supervisory team attended one session. All other
sessions were restricted to the candidate and the participants.
5.3.5 Data collection procedures
An interview schedule for each group of participants was built around the research
questions. For older children, parents and nurses the interview questions were
designed to elicit participants’ views of their understanding and experiences of
PTTS use and vital sign monitoring. Questions for younger children focused only on
vital sign monitoring as it was felt that the PTTS would be a complex concept for
them to understand. Where appropriate, prompts were used to guide the interview.
The interview schedules can be seen at Appendix 9
All interviews, focus groups and draw and write sessions were tape-recorded after
the participants had provided consent/assent. Field noted were made after each
interview and focus group. Tape recordings were transcribed verbatim by a
professional transcription service used by the candidate’s supervisory team.

233
5.3.5.1 Children and young people
The following equipment was taken to interviews with children and young people:
paper, a selection of pens, pencils and crayons, tempadots, a small and large sized
blood pressure cuff, an oxygen saturation probe and a PTTS chart. An example of
the monitoring equipment taken to each interview can be seen at Figure 5.1.
Children up to eight years of age were given the choice of talking about their
experiences or drawing a picture. Children who opted to draw a picture were
provided with paper and a selection of pens, pencils and other colouring tools. They
were asked to draw a picture and/or write their thoughts on what it felt like when
they had their vital sign observations taken (Appendix 9.1). The vital sign monitoring
equipment was placed on the table and the child was encouraged to ‘play’ with the
equipment if they wished. Whilst the child was drawing, the candidate asked the
child questions about the content for the picture or why they had chosen a certain
type of pen or colour. The dialogue was conversational in nature and the candidate
allowed the child to discuss anything that they brought up during the session. The
vital sign monitoring equipment was used as a prompt if the child no longer wanted
to draw or was not sure what the candidate was asking. At the end of the session,
pictures were scanned and then returned to the child.

234
Figure 5.1 An example of the vital sign monitoring equipment provided during interviews
Interviews with younger children who chose not to draw pictures were adapted to
meet the child’s preferences. Children were shown monitoring equipment, generally
one piece at a time. They were asked questions about what each piece of
equipment did and how it felt when it was used. If they wanted to ‘act out’ taking the
candidate’s vital sign observations, this was encouraged. Questions and prompts
were used to clarify the child’s meaning.
Older children and young people were asked questions in a more structured
manner. Interviews were conducted in an informal, conversational style using the
interview schedule as a guide (Appendix 9.2). Children/young people were
encouraged to discuss any aspect of vital sign and PTTS monitoring they felt to be
important. Conversations often ‘strayed’ into other areas such as school, what they

235
liked to do outside of hospital, where they lived, pets and siblings. This was
considered important as it helped develop a rapport223 with the participant and
demonstrated that the candidate was interested in them as a person not just as a
research participant.
5.3.5.2 Parents
Semi-structured interviews with parents followed an interview schedule (Appendix
9.3). If a parent wished to discuss a relevant topic ‘out of sequence’, the ordering of
the questions was adjusted. Parents were encouraged to discuss both positive and
negative aspect of vital sign and PTTS monitoring. If parents wished to introduce a
new topic area that they felt was relevant to PTTS and vital sign recording, this was
encouraged. For example, some parents wished to discuss other measurements
such as height, which they associated with the recording of vital sign observations.
Interviews were informal and conversational in style. Participants chose the location
of the interview and whether this was conducted in the presence of their child and
other family members.
Demographic data were collected on the following: age of child, relationship of
participant to the child, gender of child, number of times the child had been
hospitalised previously, whether the child had been admitted to intensive care in the
past and length of stay before the interview.
5.3.5.3 Nursing staff
Focus groups were separated into junior (nursing staff of band 5 and below) and
senior (band six) staff. Four to eight participants were allocated to each group and
sessions were scheduled to last up to an hour. The first 15 minutes were planned to
respond to participants’ questions about the study and to gain their written consent.
The remaining 45-minutes were allocated to data collection. An interview schedule
was followed to ensure consistency between the groups (Appendix 9.4).
5.3.6 Data analysis
The five-stage approach for framework analysis described by Ward240 was followed.
This has five distinct but inter-linked stages which, rather than being a linear
process, overlap backwards and forwards in an iterative fashion.244,245 This

236
interpretive process allowed data to be systematically searched for patterns in order
to provide insight and description of the phenomenon in question.240
The five stages are:
1. familiarisation through immersion in the data
2. development of a theoretical framework through identification of important
and recurrent themes
3. indexing and charting
4. summarising data in an analytical framework
5. mapping and interpretation.
5.3.6.1 Stage one: familiarisation
The interview tape recordings were listened to in order to get a sense of the data as
a whole. Transcripts were read several times, and field notes and comments were
examined. Recordings were then listened to with the transcripts.
5.3.6.2 Stage two: identification of the framework
The purpose of the framework is to facilitate the management of the complete data
set in an organised ‘matrix’ fashion. This allows data to be viewed across categories
or participants and helps with subsequent retrieval, exploration and examination of
the data.246
The approach recommended by Parkinson and colleagues was adopted.246 An initial
framework based around the areas explored in the interviews and focus groups was
developed. Charting was piloted with one focus group and two interviews. Areas of
overlap that could be condensed, and areas that were missing from the framework
were identified through discussion within the supervisory team. The framework was
modified. Categories were added, developing and building the framework through a
number of iterative revisions. The final framework can be seen at Appendix 10.
5.3.6.3 Stage three: Indexing
During this stage the data were prepared for entry into the framework (Appendix
10). Data in the transcripts were coded using the number identified for each sub-
category. Where relevant, data were coded to a single category. However when
data could fit across two or more categories, multiple coding was used. For

237
example, data about vital sign monitoring at night was coded to pain and discomfort,
keeping watch, needing to conform and anxiety and fear.
5.3.6.4 Stage four: Charting
Charting aims to organise the data in a manageable format to prepare for the final
stage of mapping and interpretation.246 Microsoft Excel was used to display and
manage the data. Each of the four categories was assigned a separate spreadsheet
with columns allocated for each sub-category.247 Participants or focus groups were
each allocated a row.
Data were summarised and inserted into the spreadsheet under the corresponding
column and row in a matrix fashion. Words or phrases used by the participant were
indicated by quotation marks. Summarised data contained the transcript line to
facilitate easy referral back to the original data.
5.3.6.5 Stage five: Mapping and interpreting the data
Data were synthesised by mapping and interpreting the data. To facilitate the initial
identification of themes and sub-themes the matrix was printed, so each
spreadsheet could be displayed side by side.
Initially the data were examined for themes that were present across multiple cells in
the framework. Sub-themes sometimes emerged from a phrase or word used by a
participant which captured a sub-set of the data. A total of 55 sub-themes were
initially identified. Each was written on a post-it note as shown at Figure 5.2.

238
Figure 5.2 Initial sub-themes identified from the data
These sub-themes were then examined for connections and associations. The post-
it notes with the sub-theme headings were ‘moved around’ and clustered together
until the list was reduced to 10 sub-themes. These revised sub-themes were
captured on a single post-it note and the process repeated to identify and organise
the main themes. Themes and sub-themes were critically appraised for overlap and
duplication. Sub-headings were merged where there was felt to be significant
overlap. For example, the boundaries between the sub-themes of ‘providing
reassurance’, ‘tracking progress’ and ‘alerting to deterioration’ were examined and
were felt to be closely related. These were captured under the sub-theme ‘providing
reassurance and alerting’.
5.4 Results
The final sample comprised 13 parents, 10 children and young people and 36
nurses. Fourteen interviews were conducted in total. Five interviews had a single
participant: one child, four parents. Nine interviews had two participants: eight
parent and child/young person dyads, one mother and father dyad.

239
All but one of the parents was interviewed in the presence of their child. Most
interviews took place at the child’s bedside with just one interview taking place in the
playroom of the ward. Eight interviews took place in single rooms and seven were in
open bay areas. Parents were present for all child/young person interviews,
although one parent left part-way through the interview at her own request and with
the child’s consent. Interviews lasted between six and 85 minutes (median 20.5
minutes). Only one child chose to participate in a draw and write session. All other
child/young person participants chose to describe their experiences in a semi-
structured interview.
Six focus groups were conducted: three on a surgical ward, two on a medical ward
and one on a short stay ward. Three focus groups were conducted with junior
nurses and three with senior nurses. Four focus groups were facilitated by the PhD
candidate. Two were facilitated by an experienced senior nurse who was instructed
by the candidate and followed the interview schedule seen at Appendix 9.4. Focus
group sessions lasted between 24 and 56 minutes (median 40 minutes). Groups
had four to eight participants (total 36 participants).
5.5 Findings
The aim of this section is to present an overview of the key findings to emerge from
the data. Three major themes and 10 sub-themes were identified that reflect
participants’ understanding and experiences of vital sign monitoring and use of a
PTTS in the paediatric ward. A diagrammatic representation of the themes and sub-
themes is shown at Figure 5.3

Figure 5.3 Diagrammatic representation of main themes and sub-themes
The three main themes are represented in dark blue. Sub-themes are in light blue

241
5.5.1 Benefits and burdens
Participants identified the benefits that using a PTTS score and monitoring vital sign
observations could bring. Providing reassurance about the child’s condition, tracking
their progress over time and alerting them to problems were highlighted as
beneficial. However there were also associated burdens. Pain and discomfort,
particularly around the taking and recording of vital sign observations, and anxiety
and fear were identified by participants.
Benefits and burdens were interlinked. For example, parents described in positive
terms the reassurance gained by continuously monitoring their child’s oxygen
saturation levels but simultaneously reported the burden of constant negotiation and
vigilance to prevent their child from removing the monitoring probe. Because of the
close relationship between benefits and burdens, these are reported together. Four
sub-themes were identified and will be discussed in turn: reassuring and alerting,
pain and discomfort, anxiety and fear and needing to conform.
5.5.1.1 Reassuring and alerting
None of the participating parents or children/young people were familiar with the
local PTTS system, the Children’s Early Warning Score (CEWS). This was despite
the fact that all but one young person and one mother and father dyad reported that
this was not their first stay in the hospital. Many participants had experienced three
or more admissions to the hospital and their lack of familiarity with the CEWS was
somewhat surprising, especially as it had been in place for around eight years.
Despite their unfamiliarity with the CEWS parents and young people appeared to
understand its function and purpose after they had received a brief explanation.
Young people were generally positive about its use and made comments about the
potential benefits of using such a system:
That makes me feel good, because they’re keeping track of how you’re doing, and if you’re well overall, I think that’s good, that’s very good system, because that sounds also quite-, a good way of keeping track. I think that’s good, I’m happy about that, because I didn’t know that before.
Female young person, 14-years, surgical ward

242
Parents and young people felt reassured by the PTTS and cited the benefits of
being able to track progress, particularly if the young person was unwilling or unable
to self-report. One parent likened the PTTS to a traffic light system, drawing
parallels to a red-amber-green system of alerting. This was particularly interesting
as the CEWS escalation protocol also used this methodology to indicate patients at
low, medium and high risk of deterioration (Appendix 3).
Helps you know what's going on, doesn't it? Whether everything's alright or whether there's a problem
Mother, daughter 11-years, surgical ward
I think that’s reassuring. It’s like a traffic light [system] … and you know that, in the night, your child’s just as safe as they are in the day. Because, in the day, they can express that they’re not feeling very well. At night is normally when these things spike…or if you’re asleep, you don’t know that, that your temperature has risen to the extent that … you’ve got to be observed, observed a bit more than you perhaps were earlier on in the night. No, I think that’s a brilliant idea.
Mother, daughter 9-years, medical ward
Children and families saw vital signs as an objective measure of their progress.
Children and young people talked about vital signs being able to ‘track your
progress’ to see whether you are ‘getting better’. One young person said this made
her feel ‘good’ because staff could then see ‘how she was doing’ and if they were
‘well overall’. Another young person talked about ‘checking’ for signs such as a
fever, which would then allow staff to ‘do something about it’.
You'd rather have your mind be put at rest and know that if the nurses think that there's something not right, that they're going to get somebody who's knows what they're doing more, like a higher-up, the doctor, to come and double check, you know?
Mother, daughter 11-years, surgical ward
Nurses also identified benefits associated with the PTTS. They highlighted that it
may be most beneficial to junior staff who were less able to draw on previous
experience and apply clinical judgment. The PTTS could help them ‘make sense’ of
the observations by providing guidance on the expected vital sign values and
indicating when they may need to alert someone with more experience. Detecting

243
and alerting staff to children who were deteriorating was reported as a key benefit of
the CEWS by participants in all focus groups:
It's about alerting us when a patient is deteriorating … so we can seek help appropriately.
Senior nurse, medical ward
I think [for] the less experienced nurses it gives them some, not so much taking it from observation. If you've got this score, contact this person and they have to come. That's very useful
Senior nurse, medical ward
It is helpful, especially if we’re working with a student. It helps alert them to if the child’s deteriorating.
Junior nurse, medical ward
The PTTS was reported as particularly useful when staff were working in unfamiliar
areas or with children from specialities they were less familiar with:
Because every ward is so specialised, they all have different criteria for each of their patients, and people don’t always realise that. You can go and work on another ward and it’s like going to France! You’ve got no idea what they’re talking about!
So you might not know anything else about their conditions at all, and you might not know how to look after that patient but you can look at their [PTTS] scores and go ‘this patient is okay’.
Junior nurse, surgical ward
The benefits of a universal risk assessment were clearly highlighted by this junior
surgical nurse. The PTTS was felt to offer a means of recognising whether a patient
was ‘sick’ or ‘stable’. Low scores provided reassurance that a patient was ‘okay’ and
this reduced anxiety. Whilst this universal language was particularly helpful when
nurses were faced with unfamiliar diseases or challenging situations, it could also be
seen as unnecessary in some settings:
For the patients coming back from theatre … it's fine because you can assess them and you'd be able to tell if they are deteriorating or if they're the same level as they were before. For patients that come in for infusions and things like that, it's not really helpful. It doesn't really do anything for us.
Junior nurse, short stay ward

244
Most children on the short stay ward were admitted electively for tests and
treatments. As such, the nurses felt that they were considered to be stable and
‘well’. The PTTS was seen as adding an unnecessary addition to their workload and
was reported by nurses to raise parental anxiety.
5.5.1.2 Pain and discomfort
When discussing vital sign observation recording with children/young people, they
frequently recalled the pain and discomfort that the procedure brings.
Children/young people repeatedly cited blood pressure as inducing pain and they
and their parents often used the word ‘hate’ when this vital sign was discussed. No
child discussed blood pressure recording in a positive manner. During one interview
a five year old boy became visibly distressed when he saw the blood pressure cuff,
despite reassurances that no recordings were going to be taken. He tried to hide
away under the bed covers. When asked why he was upset he pointed at the blood
pressure cuff and said it was “Very hurty … and it goes, and it squeezes really tight”
For others, the repetitive nature of the procedure, especially during prolonged
hospital stays, was identified as a burden. As one child explained:
… especially for the three months [in] hospital. There I had this for about three months. Days and days and days and days…and then pain and pain and pain
Female child, 7-years, medical ward
When this young girl was recounting her experience, it appeared that she wanted to
emphasise that three months was a long time. Each time she said the word ‘days’
the delivery of the word became longer and more drawn out. She gave similar
emphasis to the word ‘pain’. Her words and the way that she said them appeared to
underline how difficult this was for her.
Temperature recording was also a source of discomfort for some children/young
people. Although it was not universally disliked to the same degree as blood
pressure, many still reported it as restrictive or uncomfortable. The taking of oral
temperature recording was reported to restrict speech, create difficultly when
children/young people need to cough and made one child feel ‘sick’. Keeping it
under the tongue was ‘a big problem’. One child reported that ‘it digs into the top

245
and the bottom’ of your mouth although another younger child described the
temperature probe as ‘soft’. One child perceived that the nurses took his
temperature ‘every hour’, although his mother indicated that this was not the case.
The route of temperature recording appeared to be important to children and young
people:
The only thing I don’t like is when they put it under the tongue
Male young person, 10 years, short stay ward
The taking of oxygen saturation levels evoked mixed responses, with some
children/young people reporting it as ‘okay’ and others saying they disliked the
‘sticky’ feel of the recording probe. One child highlighted that whilst she ‘didn’t really
notice it’, she couldn’t ‘wave her arm around’ when monitoring was in progress. As a
consequence, she felt she had to sit still whilst the probe was on her finger.
No child or parent discussed the monitoring of the remaining component vital sign
parameters for the local PTTS: heart rate, respiratory rate or consciousness.
It was apparent that the impact of monitoring could be exacerbated if the child was
more vulnerable either because they had special needs or if they had just
undergone surgery. One mother explained that postoperative oxygen saturation
monitoring could be irritating for her son and this could be more distressing than the
surgery itself. Tiredness was identified by a number of participants as affecting the
child’s tolerance to vital sign observation recording. This was particularly true if
monitoring was required overnight and sleep was disturbed as a result. It emerged
that the reaction to vital sign recording could be influenced by factors such as
medication, as this parent reported:
[he does] put more of a fight, when he's had his Melatonin … he's more harder to wake up, and he does wake up very moody … he doesn't wanna, sort of like, turn over, or he doesn't want 'em touching his fingers, and he gets really sort of rude, and starts shouting at them. Whereas before when he wasn't on his medication, he was still a bit miserable, but it makes him a bit grouchy
Mother, son 7-years, surgical ward
Although nursing staff recognised the discomfort that children/young people
experienced when having vital signs recorded, none characterised this as painful.

246
They mainly discussed the response to recording vital sign observations using
words like ‘distress’ and ‘anxiety’. Discussion tended to centre around the
challenges of obtaining ‘reliable’ recording of vital sign observations when a child
was distressed and the impact this had on PTTS values.
Nurses on the short stay ward emphasised that taking observations could invoke
abnormal vital sign readings, such as a high heart rate or elevated blood pressure.
This was seen as potentially interfering with tests results and causing the child and
family more distress.
5.5.1.3 Anxiety and fear
Although nurses reported PTTS as providing reassurance about the child’s
condition, they also cited episodes where use of a PTTS could raise anxiety. Junior
staff in particular recalled past experiences where they had calculated a high PTTS
and how they felt ‘panic’ and ‘nervous’ and ‘frightened’ in the moments afterwards.
One nurse described how she felt when faced with an elevated PTTS score:
It is still nerve-wracking though, especially when you’re newer and obviously it comes with experience and stuff. It is quite daunting.
Junior nurse, surgical ward
Junior staff also reported ‘fear’ when they calculated a PTTS score and realised it
was high. This fear was evoked by past experiences of finding elevated PTTS and
the potential consequences for the child and family.
Recording the PTTS was a task that was often delegated to junior staff, health care
assistants and student nurses. Senior nurses reported that this required supervision
and support, which could place an additional burden on their workload. When
workload was high, this caused anxiety about whether tasks were completed
properly as senior nurses felt they could not be ‘in all places at once’.
Making decisions on recording or omitting vital sign observations could also lead to
anxiety. Assessment of consciousness using the ‘alert-responds to pain-responds to
voice-unresponsive’ (AVPU) scale was discussed in a number of focus groups as
participants were unsure what they should do at night when a child was sleeping.
Views differed but people were anxious about balancing the need for the child to
sleep with the need to record the observation. In one focus group a nurse recalled a

247
child admitted with a relatively minor problem who deteriorated overnight and ‘didn’t
wake up’ the following morning. An AVPU value had not been recorded but
continuous oxygen saturation monitoring was in place and had been ‘stable’. The
child deteriorated and required admission to PICU and ‘almost died’. The nurse
described being ‘scared’ because she didn’t know ‘how long that child had been
unconscious for’. The incident had clearly left its mark as the nurse continued to
return to the event throughout the remainder of the focus group. Others spoke of
their fear of litigation if anything was to ‘go wrong’, particularly where there was a
dispute between the parent and nurse about taking recordings at night.
The constant nature of vital sign observation recording led it to be described as the
‘last straw’ by children, young people and families. Parents reported how vital sign
recording assumed a greater importance to the child after repeated admissions.
Nurses also reported that some children became distressed when ‘anybody in a
uniform’ came near them. During the interviews, two younger children became
visibly distressed when they saw a blood pressure cuff. This was despite the
candidate and the parent reassuring them that no measurements would be taken.
One child tried to hide under the bed covers. Another child repeatedly said ‘take it
off’ and ‘all finished’ when he saw the blood pressure cuff. This was despite the cuff
not being applied to his arm. His parent explained that this was a sign that he was
distressed, feelings that were felt to be exacerbated by his autism. She reported that
blood pressure recordings made him ‘sad’ and ‘cry’.
Another mother, whose daughter was currently an in-patient, relayed how, during a
previous admission to the same ward with her son, he became ‘stressed’ whenever
a nurse entered the room. She described how he became ‘annoyed’ when the
nurses placed their equipment amongst his toys and this was increased when they
did not remove them after the procedure was finished. Vital sign monitoring became
a focus for his frustration and he began to refuse to have these taken. The situation
continued to escalate as he struggled to exert some control over his situation. She
described how this created additional pressure for her:
It’s embarrassing for the parents because you’re trying to persuade [him] to do some of the most basic things when actually you haven’t got the energy to, and you think ‘Do you know what? Does it really matter today?’

248
Mother, daughter 14-years, medical ward
Many parents described feelings of ‘embarrassment’ when their children refused to
have their vital sign observations taken. They characterised their child’s behaviour
as ‘playing up’. Parents themselves came to ‘dread’ the procedures and became
stressed when they knew observations were due to be taken. Other parents
described how their child’s responses varied, but appeared to be related to repeated
episodes of hospitalisation. Two mothers described their experiences:
Last year, that was his way of, sort of, gaining a bit of control. Sort of saying no to sats or running away from them and, you know, all the ops and things. The nurse would come in and say, ‘Can we put the probe on your finger?’’ “No, you can’t”’ and we’d say, ‘come on [child’s name], I need to know.’ So I was dreading this admission, thinking he’s going to be so awkward and he’s been brilliant this time around.
Mother, son 5-years, medical ward
‘cause he knows as soon as that goes up he knows it’s obs time and he, I think he knows what time the obs are! He just knows. But if he don’t want it done, you can’t force him. Yeah, head-butts the cot and everything if he don’t want it done.
I’ve been lucky for the last ten days he has wanted it done.
Mother, son 5-years, medical ward
The effect of non-compliance on the parents was palpable. There was a sense of
relief expressed by both these mothers when their child consented to have their vital
sign observations taken.
Staff discussion included the impact of repeated vital sign recording on parents and
children/young people, which was perceived by nurses as increasing parental stress
and anxiety. This was felt to be particularly true when the child was assessed as
well and stable:
The more anxious the parents get, the last thing you want is for parents to get really anxious.
What's the normal range? Why are you doing it again? Things like that. So we want to keep the children as normal as we can in order for our tests to be normal.

249
Yes, you don't want to be stressing a child out and then their cortisol response going through the roof and that's actually what they're in there to look at that and stressing a child out by doing blood pressure is less helpful for their test.
Junior nurses, short stay ward
Parents reported anxiety and fear when they perceived their child to be at risk of
deterioration. Feelings were particularly acute if they felt that staff may not recognise
or be able to respond adequately to the signs of deterioration. This led them to ‘keep
watch’ over their child, a theme that is explored in later section below.
5.5.1.4 Needing to conform
Children/young people, families and nurses all described how vital sign recording
and PTTS imposed restrictions on their behaviour and decision-making. Although
restrictions differed for differing groups of participants, all explained a need to
conform to the demands imposed by the PTTS and the associated protocol.
For children and young people restrictions revolved around vital sign recording and
continuous monitoring. This often require the child to ‘sit still’ or ‘not to talk’ during
procedures such as oral temperature recording. One child described how he disliked
being still for observations as they ‘weren’t very good at it’. Continuous monitoring
imposed more sustained restrictions, as children/young people described feeling like
they were ‘all tied up’ particularly when they became ‘tangled up’ in the leads
overnight.
Nurses spoke of having to conform to monitoring protocols even when this conflicted
with their own judgment. On some wards there were also informal protocols to
regulate the frequency of vital sign monitoring. Nurses were advised ‘to stick to four-
hourly’ recording of observations, with the caveat that nurses who stepped outside
of this guidance would need to ‘justify’ their actions. The fear of litigation was also
cited as a driver to conform.
Nurses also reported the impact of conforming to the PTTS escalation protocol. For
many children, a high PTTS value accorded with the nurses’ clinical impression of
the patients. However others had an elevated PTTS, which conflicted with their
judgment. In these cases, they described the conflict they felt when escalating an
elevated PTTS value in a child they assessed to be well. This was seen as being

250
particularly frustrating when a senior clinician subsequently appeared to belittle their
decision. Nurses in one focus group described their experience of escalating a
patient to the intensive care outreach team whose PTTS score was repeatedly high:
You say to somebody, this patient has a score of eight and frequently has a score of eight and they're like “oh, it's just him”.
Like that we can't use our own judgment! We are trying to bring it to the attention of somebody more senior and they just don't seem to take any notice. It's just rude!
Senior nurse, surgical ward
The perceived reluctance to attend to this patient appeared to have a detrimental
effect on inter-professional relationships and led staff to remark that the intensive
care outreach team, ‘don’t really care’. This was despite the protocol indicating that
a score of eight signified a child at high risk of deterioration where attendance by the
intensive care outreach team was required within 15 minutes (Appendix 3).
When faced with an elevated PTTS score, junior staff would often ‘seek out’ more
experienced nurses. These senior nurses would make an assessment and
sometimes judge that escalation was not needed. However junior staff sometimes
ignored this advice and escalated the child to a doctor or the intensive care outreach
team despite the senior nurse’s recommendation, as they feared the criticism and
consequences of failing to conform to the escalation protocol.
Nurses appeared to recognise that complying to the protocol and obtaining a full set
of vital sign observations on which to calculate the PTTS was required, however
achieving this in practice was more challenging. They also appeared to want the
PTTS chart to appear regular, structured and complete. Additional information,
which may be useful in tracking the child’s progress, was seen as disrupting the
quality of the chart:
You have a perfect chart and then just because you tried to do better and put these extra obs in it looks crap because you can’t see little bits, maybe the few you literally can’t do.

251
And it doesn’t always look straight. If you do the sats and resp rate four times every hour so every 15 minutes for a patient, and then on the next hour you do them but then you’re doing the BP and the full set of obs, your obs then have got four gaps in between
Junior nurse, surgical ward
Others described challenges in recording the PTTS score during transient episodes
of physiological instability. Frequent but fleeting changes in the child’s condition,
such as desaturation or bradycardic episodes, created difficulties as the problem
had sometimes resolved before a full set of vital sign observations could be
captured.
And it doesn’t look like a full set and they’ll say well what were the resps? And you’re like, well, you try getting the resps!
Junior nurse, surgical ward
Nurses appeared to put ‘pressure’ upon themselves to achieve the ‘perfect’ chart,
despite being unable to explain what this constituted. However partial vital sign
observation sets, with missing parameters, appeared to be regarded as ‘sub-
standard’ and failed to conform to the expected standard. Sometimes staff
developed additional charts to ‘work-around’ the problem. These ‘desaturation’ and
‘apnoea’ charts allowed documentation of selected vital sign observations, together
with relevant information such as interventions to resolve the apnoea. This resulted
in documentation that worked outside of existing protocols.
Conforming to the PTTS protocol was, in a few instances, also perceived to bring
benefits. Whilst a high PTTS score was seen as an indicator that the child might be
deteriorating, it was also perceived as a mechanism to secure help from senior
clinical staff, as they were also required to conform to the protocol. As such a high
PTTS value was seen as an indicator that was difficult to ignore.
It helps you as well because they have to listen, so if the CEWS are high enough they have to do something about it, so it helps nurses.
Junior nurse, surgical ward

252
5.5.2 Watchfulness and wisdom
The second theme of watchfulness and wisdom encompassed the need by families
and nurses to watch over the child/young person, make sense of their own visual
observations and recognise what this meant for that particular child. Watchfulness
and wisdom was grouped into three sub-themes: keeping watch, wisdom and
judgment and knowing the child
5.5.2.1 Keeping watch
Parental confidence in the skills and ability of the staff appeared to influence their
actions and behaviours in keeping watch over their child. This appeared to be
closely linked to the degree of trust and the strength of the partnership between the
parent, staff and child. Parents reported feeling uncomfortable about leaving the
ward if they were ‘not happy’ with their child’s condition and this was exacerbated if
they perceived that the ward was busy or short staffed:
I was about to leave [my child] for the night and I just wasn’t happy. [He] was on constant monitoring and they were really short staffed and I just stayed and watched because I knew what was going on.
Mother, daughter 14-years, medical ward
This mother’s quote highlights particularly clearly how parents’ response to vital sign
monitoring can be affected by their previous experiences of care, in this case a
previous admission to the same ward with her son. She went on to describe how
this increased her anxiety and how she feared the consequences if he were to
deteriorate and this was not detected. Another parent described how she felt ‘like
the responsibility’s again on your shoulders’ when her child’s nurse did not take
regular vital sign observations. Parents described how they assumed responsibility
for monitoring their child’s condition when they perceived that healthcare
professionals may not do so.
Continuous monitoring was also important to parents, as they could see how their
child was and make their own independent judgments. This was particularly
significant during prolonged admissions. When parents could see the monitor they
reported feeling reassured about their child’s progress. However prolonged use
could make the transition at discharge more challenging:

253
… when you’re in for a long admission you become a bit reliant on those monitors when they’re on all the time because they do put your mind at rest or they alert you if there’s any problems. Once you go home and you don’t have that equipment, sometimes you feel a little bit like your sleeping bag’s been taken off
Mother, 5-year son, medical ward
This mother’s feeling of having her sleeping bag removed could reflect the exposure
she felt at being responsible for monitoring her son’s health status at home in
contrast to the security of being in hospital. However nurses sometimes appeared
critical of parents who watched their child’s monitor:
Some of them get a bit obsessed about watching the monitors. Particularly post procedure, when they're on the monitor, they'll get very, very obsessed with watching it.
Junior nurse, short-stay ward
Characterising parents as becoming ‘hypnotised’ or ‘obsessed’ by the monitor
appeared to imply that parents paid more attention to the monitor than to the child
themselves.
A lack of suitable equipment appeared to hamper nurses’ efforts to record vital sign
observations. This was particularly problematic at times when nurses were trying to
record vital sign observations at scheduled (four-hourly) times and was noted by
parents who observed that the shortfall led to nurses “fighting’ over monitors. This
could, in part, account for parents feeling the need to keep watch over their child.
Parents kept watch not only to detect signs of deterioration, but also to protect their
child from other dangers. One child would chew the wires of the monitoring
equipment and required constant vigilance to prevent this from happening.
Keeping watch at night was cited as particularly problematic. Parent participants
frequently discussed the disruptive effect that overnight vital sign monitoring had on
both their own and their child’s sleep. Monitor alarms were a particular source of
frustration. Parents recognised that alarms were activated by a change in the child’s
condition. However these were sometimes not responded to promptly and parents
reported having to get out of bed, check their child and seek out a nurse to address
the alarm. Initially this created fear and anxiety in parents, a theme already
described. However parents of children hospitalised for extended periods reported

254
‘irritation’, driven by their ‘exhaustion’ after continued nights of broken sleep. The
situation was aggravated if the alarms were frequent or the nurse appeared
dismissive or unresponsive to the underlying cause.
Children also appeared to become involved in keeping watch over their condition,
with some reporting using their own judgment to alert staff to a potential change in
their condition. This five-year old boy described what he did when he felt he had a
temperature:
I can tell by it because I’m hot because you get all sweaty. And my hair gets all wet…when Mum’s not here I just have to press a buzzer.
Male child, 5-years, medical ward
5.5.2.2 Wisdom and judgment
Making decisions on how and when to record vital sign observations and PTTS
scores was seen as important by nurses. They described how the taking of vital sign
recording and PTTS scores could require considerable skill and dexterity,
particularly around those observations that were seen as more technically
challenging, such as blood pressure. Whilst the expertise needed to record vital sign
observations was also recognised by parents, they valued the ability of the nurse to
successfully engage with their child, negotiate and offer choice and ‘persuade’
children and young people to have their observations taken.
More experienced nurses and some parents considered junior staff sometimes to be
lacking in basic skills of organisation or ‘common-sense’. They cited issues around
coordinating the recording of vital sign observations with other aspects of nursing
care such as medication or hygiene needs. Parents also spoke of more
inexperienced staff being ‘inflexible’ over the recording of vital signs.
Children and young people also developed practical knowledge and skills around
vital sign monitoring. When presented with vital sign observation equipment even
young children under the age of eight years could demonstrate how to apply a blood
pressure cuff, or take a temperature or use an oxygen saturation probe. They would
often accompany their actions with words and phrases such as ‘you’re okay’ and
‘take it out now’, which appeared to mimic words they had heard their nurse say. As

255
with parents, children and young people also indicated that they valued nurses who
offered them choice and flexibility when recording vital sign observations. It is
possible that this could reduce their anxiety, increase compliance and strengthen
partnership working.
Making decisions on how frequently to record the PTTS was seen by nurses as
complex. When faced with an unwell or deteriorating child, some vital sign
observations were seen as more important than others:
Pulse, resps, sats are your kind of key, more hourly ones…temperature and blood pressure are still four-hourly unless there's something that requires you to check it more
Senior nurse, surgical ward
Families, particularly those with children who required long-term or frequent
admissions, displayed considerable knowledge and skills around vital sign
observations. Some relayed quite sophisticated knowledge of the purpose and
function of the vital signs, such as monitoring oxygen saturation levels to detect
respiratory issues and guide oxygen therapy. They also adopted language
frequently used by healthcare professions such as their child having ‘spiking
temperatures’. The need to monitor their child’s progress and ability to make their
own judgments appeared to be both a protective mechanism and a source of
reassurance. Skills and knowledge appeared largely self-taught, with parents
reporting that they ‘pieced this together’ whilst looking at bedside monitors or vital
sign observation charts. Knowledge increased either through repeated hospital
admissions or exposure to periods of intensive monitoring such as critical care. The
father of a 2-month old girl who had spent considerable time in intensive care
characterised his wife’s knowledge as ‘like a trainee nurse now’.
Some reflected back on the time before they developed these skills and ‘regretted’
that they didn't know then what they knew now. Whilst some parents said they felt
they had sufficient information on the meaning and significance of vital sign
observations, others felt very strongly that additional knowledge and skills would
enable them to be better partners in their child’s care. One mother spoke of a time
after two of her children had been admitted to hospital, both acutely unwell:

256
But I was watching them and I thought, I wished I understood better what was going on … I wished I had understood better when to call for help
Mother, daughter 14-years, medical ward
In all six focus groups it was reported by staff that PTTS should be used with clinical
judgment, never in isolation. Although it was seen to be of particular value to junior
staff and student nurses, there were concerns that they may not have the
experience to recognise its limitations:
Because a junior staff member might not see that a child is fine … They could normally have a respiratory rate of 60, but actually you go and look at that child, they've dropped their respiratory rate and a junior member of staff might say 'That's fine, great, they're back in their normal CEWs,' but actually you could go and look at them and say, 'But that child doesn't look right for whatever reason.'
Senior nurse, surgical ward
They explained that this was due, in part, to the inherent limitations of PTTS. In
particular they reported the tendency to over-trigger in certain patient groups -
particularly neonates and adolescents - and their concern that PTTS would fail to
detect deterioration in some children. Inappropriate thresholds for vital sign
parameter sub-scores were felt to be a frequent cause of over-triggering:
I think it is useful in a normal child that’s had an appendectomy but outside of that, especially not for neonates … that generally have a lot of other problems, I don’t find it [useful], because I don’t look at the CEW scores. I always think of everything else and then look at the child and then kind of ignore the CEWS. I probably shouldn’t say that, but I do.
Senior nurse, surgical ward
This senior nurse described how the PTTS was used to confirm, rather than detect
the signs of deterioration. She used her judgment to assess the individual clinical
indicators and make her own assessment regardless of the PTTS. She emphasised
how looking at the child was seen as more important than the score.
When vital sign values fell on the border between two differing PTTS sub-scores,
staff in one focus group told how they selected the score which supported their
clinical impression of the patient’s condition: a higher score if they felt the vital sign
value was ‘wrong’ for the patient and the lower score if it was felt to be ‘normal’.
257
Some children and young people had long-term health problems that led to
persistently high PTTS scores. Nurses recognised that the PTTS score was a poor
indicator in these patients and used their judgment to determine whether to escalate
the situation or not. These limitations resulted in staff, particularly those who were
more senior, making active decisions to over-ride the PTTS escalation protocol. As
such they used the PTTS as a mechanism to support rather than direct their
decision-making.
5.5.2.3 Knowing the child
In relation to the sub-theme of watchfulness and wisdom, nurses discussed the
value of ‘knowing the child’, and the benefits this brought when assessing their
condition and interpreting PTTS scores. Caring for a child and family on consecutive
shifts helped to build this knowledge. Staff became familiar with the child’s
preferences and this helped with the recording of vital sign observations. Families
also appreciated seeing a ‘familiar face’ and this helped to reduce their anxiety. As
previously mentioned, they appreciated when nurses knew and understood the
child’s preferences, as this improved the child’s compliance to vital sign monitoring,
easing their own workload and burden.
Familiarity with the child was also reported to improve decision-making, as nurses
were better able to judge the significance of changes in vital signs and PTTS values.
Acute changes in the child’s condition were more readily interpreted as the nurse
was familiar with the risk factors and changes to therapy that may have precipitated
the event.
Non-specific concerns were often raised by families, who reported their child was
‘just not right’. Nurses placed a high value on these reports, recognising that parents
know their own child best. This was particularly valuable when the child had a long-
term health condition, limited vocabulary or special needs.
Nurses, parents and children/young people placed value on care that was
individualised and tailored to their own particular circumstances. Nurses recognised
that PTTS could detract from this, as a ‘one size fits all’ methodology was not
necessarily appropriate for all children. This was particularly true of children they
perceived as physiologically ‘different’ to other children of the same age. The local

258
PTTS had four charts with different age-dependent vital sign scoring (Appendix 2.1).
Some nurses questioned whether this approach was appropriate, as some children
were physically or developmentally different from their age-related peers.
Participants in two focus groups felt that the local PTTS should have individual
scoring frameworks and thresholds that personalised the PTTS to each child.
Children with long-standing illnesses were also identified as a particularly
challenging group. Many nurses identified children whose vital sign observation
values always sat outside the ‘normal’ range, even when they were experiencing a
period of well-being. This led to persistent false triggers despite staff recognising
that this was ‘normal for them’. Although mechanisms were in place to deal with this,
through the adjustment of the vital sign scoring thresholds, nurses reported these
were poorly used in practice. Nurses perceived that responsibility for adjusting these
parameters lay with the doctor or intensive care outreach team. However they
reported a reluctance from doctors to formally document these adjustments, which
led to ongoing recording of falsely high PTTS scores. Initially this resulted in
repeated escalations, but as time went on, nurses began to ‘ignore’ these high
PTTS score. They expressed concern that they were effectively going against the
protocol and how this might be perceived, particularly by junior staff:
I think that’s the bad thing about the CEWS. If a patient does consistently score, you just become complacent, like ‘Oh, it’s normal for them’. So it’s not…like you say, if someone was to come in that’s never had the child before you can’t notice that they’re deteriorating, because it’s still the same respiratory [rate]. Especially if the doctors aren’t saying ‘this is what we’d accept for this child’.
Junior nurse, medical ward
Nurses also talked about falsely low PTTS scores. In two focus groups staff talked
of having a ‘gut instinct’ that some children were deteriorating, despite the PTTS
score being low. However attempts to escalate these children to a senior clinician
could be problematic:
I've had experience where, like you said, the child is really poorly and they don't score a CEWS And it seems like all the person on the phone wants to know is the CEWS score and actually that's when I don't find it very useful. Because when you are worried about a child, you need somebody to come. It's great in other

259
senses and I think it is good for less experienced nurses as a helpful guide, but I don't think it's a fool-proof tool.
Senior nurse, medical ward
In these scenarios the PTTS was perceived as not only unhelpful, but also
potentially obstructive to their escalation attempts. Inappropriately low PTTS scores
appeared to undermine confidence in the validity of local PTTS. The reluctance of
senior staff to attend these patients had a consequential effect on intra-professional
relationships.
The theme of watchfulness and wisdom highlights the vigilance displayed by nurses,
families and, to a lesser degree, children and young people. Keeping watch was a
way of managing the child’s condition and protecting them from harm. This required
considerable skills and knowledge. Although the PTTS was reported as assisting
nurses to monitor the child’s progress, it also needed to be used with judgment.
Knowing the child was seen as important to nurses and families as it helped to
make sense of the vital sign observations and PTTS score. This could strengthen
the partnership between parents and nurses, as highlighted in the next theme,
collaboration and conflict.
5.5.3 Collaboration and conflict
The care of children in hospital is underpinned by the partnership between
children/young people, their families and healthcare professionals.214 Collaboration
is seen as important but views and opinions may differ and this can lead to conflict.
Effective communication and sharing of information may mitigate against this
conflict whilst poor communication may or may not exacerbate it.
Three sub-themes were identified: partners in care, conflicts in care and sharing
information.
5.5.3.1 Partners in care
Children and young people recognised that it was important for nurses to be able to
take their observations. Although younger children could find the procedure
distressing, older children and young people understood that the nurse ‘needed to
know’ what their vital sign values were so they could ‘track their progress’. Some

260
would hold out their arm in readiness for observations to be taken. As previously
described, they and their families appreciated nurses offering them choice and
flexibility when recording vital sign observations. Negotiating the timing of recordings
and allowing the child to choose how these were taken - such as offering a choice
between oral or axillary recording of temperature or blood pressure measurement
on the arm or the leg – was seen as particularly valuable. Parents felt this allowed
the child/young person to regain a sense of control, which minimised subsequent
issues with compliance.
Some children and families reported that nurses allowed them to enter their own
vital sign observation values into the iPad system that had recently come into
operation. This was seen as enjoyable by children and was reported by to facilitate
discussion between the nurse, child and family about the vital sign values and their
significance.
At night, using small torches and talking quietly were highlighted as making a
difference and reportedly improved the quality of sleep experienced by
children/young people and their families. Small things, like leaving a blood pressure
cuff in place overnight rather than removing and reapplying it for each reading, were
appreciated by parents as they reduced the child’s distress and improved their
compliance. This was particularly important if they experienced a long period of
hospitalisation. Actions like these were perceived by families as indicating a high
level of nursing skill and expertise, illustrating the link between the theme of
watchfulness and wisdom and collaboration and conflict.
Parents also reported working with nurses to take their child’s observation
recordings. This collaboration was seen as particularly important if their child had
special needs. One mother, whose son has autism, explained how she assisted with
the recording of her son’s observations at night:
I wake up because he's awake and he gets quite aggressive, you know, refuses it, and turns over, and he'll turn the other way and won't let 'em, sort of, get hold of him, so I have to get up in the night and sort of help them to do what they've gotta do. [Its] helping him, helping them persuade him to let 'em do what they've got to do.
Mother, son 11-years, surgical ward

261
This mother described how she had to ‘persuade’ her son to allow his vital sign
observations to be taken, resulting in her experiencing broken and disturbed sleep.
This was echoed by other parents, who spoke of the need to ‘persuade and cajole’
their child into having their observations taken. Whilst most accepted the need for
such collaboration, some observed that they themselves could not see the value of
the observations.
One nurse described how parents would alert them to potential changes in their
child’s condition and how this might instigate the recording of a PTTS value:
So they'll come out and go, 'Ooh, I think they're quite warm,' or, 'Ooh, I think he's very sleepy,' and then you'll go and, 'Mmm, he looks okay, but I'll do a set of obs,' and then that will give you your CEWS. So…they're either your instigation for doing the obs or, you know, they're your calm me down factor when you think, 'Oh dear, their CEWS are high,' and they’ll say, 'That's normal.’' So they do have an impact on where you would go from either starting your CEWS or answering your CEWS, kind of thing.
Senior nurse, surgical ward
This nurse valued parents’ input for alerting them to problems, but also sought their
advice on interpreting the findings. This sharing of expertise combined parents’
unique knowledge of the child, as previously described, with the nurses’ clinical and
professional expertise. This collaborative effort relied on the nurse actively listening
and valuing their input.
5.5.3.2 Conflicts in care
Whilst the benefits and burdens of vital sign monitoring have already been
described, a separate but related theme was the resulting conflict that can arise
particularly when vital sign monitoring occurs at night. Both parents and staff
reported this as an area of challenge.
Parents shared their frustration when nurses came to record observations at night
when they had just settled their child to sleep. Although they recognised the
importance, they sometimes felt their views as parents were not always listened to:
… on other occasions [my child] looks hot … but sometimes they’re, sort of, rigidly to their times ... so I shove a Temper-DOT [in] … and then I’ll go tell them!

262
Mother, daughter 14-years, medical ward
Parents also described feeling a loss of control, particularly over monitoring at night.
there are some times when you might be coming towards the end …of an eight month admission and actually he’s alright in himself, and the nurses are coming to him in the morning and depending what nurse you get there are a couple that put all the lights on, [and] come in. It’s a broken night’s sleep and you wonder why
Mother, son 5-years, medical ward
This mother questioned the need to perform her son’s vital sign observations
overnight after such a prolonged admission, particularly when staff were making
plans to discharge him soon. Overnight vital sign observations was perceived by the
parent as adding little to his clinical management, but resulted in broken sleep for
both the child and herself.
The following example highlights particularly clearly how the requirements of
nighttime monitoring appeared to undermine partnership working between nurses
and parents and disturbed the parent’s sleep. In a senior nurse focus group two
participants highlight the challenges of taking vital sign observations at night:
You’re walking in…and you’ve got your stethoscope and they’re like “no, I’ve just put them to sleep, can you come back?”...Yeah, it’s frustrating, and you do kind of think you’re here and you’re trying to do a certain thing for a certain reason, and how long is it acceptable to leave it?
… if there was a, God forbid a court case or anything, there’s nothing you could say to justify “oh no I didn’t do it, oh no the Mum didn’t want me to do it”. I mean, you haven’t got a leg to stand on…
If they’re here, resident, they play such a big role in what we do and when we do it, and sometimes how we do it, then they do dictate to a certain degree. Whether or not they do actually understand what we’re doing what we do and why and how.
Senior nurses, surgical ward
The nurses characterised parents’ requests as ‘dictating’ their child’s care. They
reported frustration as tasks were delayed and took longer to complete. If parents
resisted this, staff labeled them as ‘awkward’. Persistent resistance caused nurses

263
to ‘dread’ taking the observations, as this discussion between two junior nurses
about taking observations at night illustrates:
I think they can hinder, because on a night-time sometimes they don’t want you coming in doing obs.
Yeah, its’ a nightmare. Especially if they’ve got the baby in the bed with them. You feel like you’re invading their space as well.
I think sometimes they have to be reminded that they are in hospital…
Yeah, ‘cause you accidently wake the parent up and they tut and they go ‘Oh, for God’s sake!’
But they choose to sleep there… we shouldn’t feel responsible for waking them up, should we? But it is awful.
Junior nurses, medical ward
On occasions when the partnership between children and families functioned less
well nurses sometimes perceived that parents had overstepped their boundaries.
Consequently they sensed there was a need to reassert their role and ‘authority’.
Some parents reported particular challenges related to their child’s individual needs.
One mother explained how her son’s autism meant he responded poorly to noise,
especially at night. To try to overcome some of these difficulties, they always had a
single room when he was admitted to hospital. She explained how she responded if
the nurses wanted to record her son’s vital sign observations at night:
No I’ll refuse that. ‘Cause he has melatonin at night, so that’s the only way to get him to sleep and if they ‘sturb him he’s awake. That’s why we’re in here [in this single room].
Mother, son 5-years, medical ward
However sometimes the PTTS could mitigate conflict between staff and parents by
providing a score that symbolised a change in the child’s condition and an objective
measure of the need for intervention:

264
I had a child who, I think she was scoring a six, which was quite unusual for her, and the doctors, at two in the morning, she had a low blood pressure, and he wanted us to wake her up and weigh her and do a blood sugar. But because I explained to mum that she was scoring a six and what it meant, she was all right-ish about us weighing her at two o’clock in the morning. So it did help.
Junior nurse, medical ward
Other nurses reported challenges around managing a child’s temperature. Nurses
described how they would attempt to reduce a child’s fever by removing excess
clothing and blankets only for the parent to ‘swaddle’ them again. The situation was
seen as particularly challenging as swaddling was perceived by parents as offering
the infant comfort and protection. Nurses recited the potential for conflict if parents
perceived that the nurse was straying into their role as a parent. Staff reported that
this may be due to their relative inexperience with a young baby and that education
on caring for a newborn baby, particularly with regards to temperature management,
may be required.
Nurses also reported disagreements with senior staff over the management of
children/young people who were deteriorating. The PTTS could be seen as a
hindrance, particularly if senior staff had previously been called to review the child
for an elevated PTTS. A low PTTS value in this scenario appeared to sometimes
over-ride the nurse’s judgment, despite the bedside nurses having clear concerns
about the child. This led nurses to vent their frustration by labeling other staff as
‘uncaring’.
5.5.3.3 Sharing information
Nurses saw the PTTS chart as central to communicating the child’s condition to
other healthcare professionals and it was apparent that it was a key source of
collaboration and conflict. Documenting the child’s vital signs and PTTS score
provided an ongoing record and was felt to create a shared language to summarise
the child’s progress, potentially reducing miscommunication. It gave ‘structure‘ to
junior staff’s communication with senior staff, eliminating the need to remember and
recite individual observation values. Junior staff in emergency situations particularly
valued this:

265
If you want a doctor to come and review them, instead of just … going through it all, you can just say ‘their CEWS is a six, so you need to come and see them now ‘cause I’m worried’. And it’s a way of saying you’re really concerned without … you know, going through it all.
Junior nurse, medical ward
It gives you a quick handover to a doctor or to a CSP, rather than having to go through every vital sign, you can give them a CEW score, which then alerts them to the need to be looked at and flagged
Senior nurse, medical ward
This shared language also allowed staff who were less familiar with the child to
make the escalation call to the doctor or intensive care outreach team, allowing the
nurse caring for the child to remain with them and their family.
Or you have to send someone else off to make the phone call because you’re looking after your patient who are deteriorating, you’d need something there and the CEW score helps.
Junior nurse, surgical ward
In emergency situations, documenting the vital sign observations and the PTTS
appeared to be more challenging. The need to intervene and respond to the
situation was, by necessity, prioritised above the documentation of vital signs.
I think when you do have an emergency situation you can go back and look at the chart … and for two hours probably nothing was recorded because you were doing so much other stuff. So … for people that do rely on looking at charts … you’re not actually recording anything. So CEWS would probably have been awful - there’s nothing to say what happened at the time. So, I think in like emergency situations they’re not there to be relied on because you’re just not interested in writing things down on what the CEWS are, because you’re just treating the patient as you see fit.
Senior nurse, surgical ward
Nurses appeared to recognise the importance of creating a record of the child,’s
progress especially during a clinical emergency. However they identified that
significant time could pass with no opportunity to document key vital sign
observations. This was recognised as creating difficulties for people who may view
the chart at a later time.

266
All parents expressed an interest in knowing about their child’s vital sign
observations. Views were mixed on whether they felt they received sufficient
information. Some relied on the nursing staff keeping them informed. Others felt
strongly that it would be valuable to view their child’s charts, as they would be better
informed and be able to assist with their child’s care from the nursing staff. Children
and young people expressed less interest in knowing about their own vital sign
observations. These young people expressed indifference regarding their vital sign
observations and PTTS scores.
Yeah, I understand about it all. I would’ve liked to know but I wouldn’t-, wouldn’t be that bothered about it …
Male young person, 12-years, short stay ward
I would like to know about the other ones [PTTS and vital sign observations] but the height is the most important one.
Male child, 10-years, short-stay ward
One parent felt that all parents and children should be informed about vital sign
observations on admission and suggested that a leaflet explaining what they were
might be helpful. Some also felt that the child should be involved more:
I know they’re [nurses] very busy, but to take your observations, have them all put down, and then show the child, ‘This is what you was yesterday, this is what you are today,’ and help them, probably, understand more of why they have that…
Mother, daughter 9-years, medical ward
Some parents particularly valued viewing their child’s observation charts
independently without the need to ask a nurse. Those parents who viewed their
child’s PTTS chart appreciated being able to see their progress for themselves.
Sometimes this resulted in questions about specific issues they noted on the chart.
This type of interaction appeared to make them feel more of a partner in their child’s
care. However a number of parents expressed reticence about asking about the
vital sign observations because they perceived this as placing an additional burden
on the nurses:

267
It’s just easy as a parent coming in and you don’t have to ask anyone, they just see. I walked in and … you just see straight away and if there are any questions you just ask the nurse and they explain.
Mother, daughter 2-months, surgical ward
I think they should be at the end of the children’s bed … because it’s your child, and you should be able to read the child’s notes … You can see what is the plan without bothering the nurses.
Mother, daughter 11-years, medical ward
I just don’t want to ask, ‘Oh, would you mind showing me…all the obs’, you know.
Father, daughter 2-months, surgical ward
Participants in one focus group discussed the impact of parents having ready
access to the PTTS charts at their child’s bedside.
…they’re like ‘Oh what’s this up here?’ and you’d be like ‘they were crying, they were unsettled before feeding’, but the parents are like ‘well he hasn’t been like that before’, and the parents because they start being quite “nursey”, it then makes them anxious, which make you more anxious, and then the baby gets more anxious and it’s a bit of a Catch 22 really.
…you like to think ‘Trust me, it’s cool, I’ve trained’. But I understand why they do it and that’s fine, I’d do the same, but that can be a problem sometimes.
Junior nurse, surgical ward
The use of the word ‘nursey’ appeared to indicate a perception by nurses that
parents were encroaching into their professional role. Although staff reported that
they ‘understood’ why parents asked questions about their child’s vital sign
observations, there was a sense that these questions indicated a lack of trust in
their skills and abilities.
Families also reported their frustration at the introduction of an electronic method of
recording vital sign observations and it can be seen how this could become a source
of conflict between parents and nurses. Some saw this as a deliberate attempt to
hide the observations away so they, as parents, could not see them. Others felt this
extended into nurses turning monitors towards them so that values could not be
seen. This lack of transparency prevented the parent from ‘keeping watch’ over their

268
child and stopped them making their own individual judgment and assessment of
their child’s condition:
The iPad, it feels like it’s more like a secret thing. I don’t want to ask, you know, ‘Would you mind showing me all the information?’
Mother, daughter 2-months, surgical ward
So, why is it so secret? I don’t understand that part…it’s my child. I’d like to know what is wrong, and what you’re doing, and what you’re giving, and why you’re giving it, and why you keep coming back in every two hours to take [my child’s] observations, and then why’s it changed to four-hourly? All of that, um, is never explained why. You know, and having the, the, the paperwork about your child, as much as it’s not discussed as the reasons why, you can pretty much work it out for yourself, seeing it in black and white.
Mother, daughter 9-years, medical ward
Both parents characterised the use of an iPad as making the vital sign observations
a ‘secret’. These parents valued looking at their child’s chart to reassure themselves
about their condition.
In this theme, the importance of children/young people, parents and nurses working
in partnership has been highlighted. The recording of vital sign observations can put
this this partnership under strain, particularly when monitoring is required overnight.
5.6 Discussion
This discussion section will include a review of the findings from the interview and
focus group data and discussion of these in relation to the existing body of
knowledge on vital sign monitoring and PTTS in children and young people. This will
be followed by a review of the strengths and limitations of this qualitative study.
None of the children, young people and parents who participated in the study were
aware of the local PTTS, the CEWS, although this system had been in place for a
number of years. Developing meaningful partnerships with children, young people
and families has been highlighted in the safe system framework33 as an area which
requires further development. Following an explanation of the PTTS function,
parents reported that they found the use of a PTTS to be reassuring and none
raised concerns about its use.

269
The findings of this study indicate that nurses and healthcare professionals may
under-estimate the effects and consequences of vital sign observations recording on
children, young people and parents. Whilst the results support previous research
that children and young people view vital sign observation recording as a
fundamental clinical skill which they considered to be important to them,248 they also
saw it as distressing and painful. Parents perceived that nurses were sometimes
inflexible regarding the scheduling of vital sign observation recording. This was
echoed by senior nurses, who highlighted that the inexperience of junior nurses
sometimes resulted in poor planning of care, placing an extra burden and disruption
on families. The recording of vital signs at night particularly appeared to add to
parental burden and disrupt sleep, which led to feelings of exhaustion and
frustration. Previous studies have reported that nurses may undertake vital sign
observation recording at regular times rather than responding to the needs and
preferences of children, young people and families.93,249 Parents reported particular
frustration with false alarms from continuous monitoring, which when ongoing
appeared to undermine their partnership with nurses, especially if they perceived
that nurses were dismissive of their concerns. Parents also spoke of the need for
their child to ‘behave’ whilst having observations taken. This appeared to have great
importance for them, not only because they recognised vital sign observations as an
important way of assessing their child’s progress, but also because they wanted to
be perceived by staff as being a good parent with a ‘well-behaved child’. Offering
choice and allowing children and young people and parents a degree of control over
the recording of vital signs may mitigate the adverse effects experienced by them.
This has the potential to improve relations, not only between nurses and families but
also between parents and their children. Moreover, with improved compliance
comes the likelihood of improved accuracy of recordings.
Child and family participation in the recognition and response to deterioration has
been identified in the safe system framework33 as an area which requires growth
(Table 1.5). A relatively small number of published PTTS explicitly encourage
parental participation in the PTTS by inclusion of a dedicated parameter for parental
concern.40,47,140-142,173,176,181,250 Although none have specifically reported its efficacy
as a predictor of deterioration, the parameter has been cited as offering potential
benefits by drawing on the skills and knowledge of the person who knows the child
best.128 Inclusion of a parental concern parameter may act a vehicle for healthcare

270
professionals to discuss with families the aim and function of the PTTS. As such,
inclusion may have benefits in terms of increased communication regarding the
PTTS with children, young people and parents.
The data support the view that vital sign observation recording requires technical
expertise, high-level communication and well-developed negotiation skills. Vital sign
observations underpin the calculation of a PTTS score and have traditionally been
perceived as a low impact activity that is a routine part of clinical care. As such, it is
often delegated to the most junior and least experienced staff111 and this may
underestimate its importance.111,115
Some nurses expressed frustration about the requirement to document regular vital
sign observations in patients perceived as being at low risk of deterioration. This
was particularly true of the short stay ward where children and young people were
admitted for elective investigation. Compliance to the requirement to document a
PTTS score once per shift was perceived as time consuming for nurses and anxiety
provoking for parents. Similar concern has been expressed by staff undergoing a
workflow evaluation on a paediatric ward in a different hospital, who identified the
majority of PTTS scores as normal or low.115
Whilst no nurses identified PTTS as causing harm, they did identify limitations in its
use. The PTTS was not felt to be helpful with certain groups of patients. Neonates
were highlighted as a particular group for whom the PTTS did not work well and was
largely felt to be related to ‘inappropriate’ vital sign parameter thresholds resulting in
over-triggering and false alerts. In a recent study, the distribution of heart and
respiratory rate values of 14,014 hospitalised children were compared to two
previously validated PTTS. The findings indicate that 12% to 54% of heart rate
values and 32% to 40% of respiratory rate values would have resulted in an
elevated PTTS score using the Bedside Paediatric Early Warning System154 and the
Paediatric Early Warning Score (PEWS) 177 Given that these children were on wards
outside of the paediatric intensive care unit, it is highly likely that a significant
number did not indicate a patient who went on to suffer a critical deterioration event.
Challenges in PTTS use were also identified for children who had long standing
conditions or altered physiology in whom baseline PTTS values remained elevated,
even when the child is experiencing a period of well-being. Although there was a

271
mechanism to deal with this, nurses reported that it was poorly used. Findings from
a previous study indicate similar problems for adult patients who falsely triggered
the National Early Warning System.78 Registrars and consultants were reported as
reluctant to adjust these thresholds despite the resultant additional workload for the
bedside nurse.
Nurses in this study also described feelings of conflict when they were required to
repeatedly escalate patients who falsely triggered the PTTS but they assessed to be
‘well’. Repeated escalations were felt to undermine their own judgment and
impacted on relationships with senior clinicians and the intensive care outreach
team. Continued false positives resulted in ward nurses ‘accepting’ high PTTS
values as ‘normal’ for the child. Responses from the intensive care outreach team
and senior clinicians were reported to re-enforce this impression. Ward nurses
expressed concern about the impression this might give to junior staff.
Repeated false positive PTTS scores might be considered to merely induce alarm
fatigue,251-253 where repeated exposure to non-actionable or false alarms reduces
subsequent response times.202 Whilst the relationship between isolated false alarms
and reduced response times has been demonstrated in the paediatric setting,202 the
impact of repeated falsely high PTTS values appears more complex. The inter-
professional communication between the alerted senior clinician or intensive care
outreach team and the bedside nurse would appear to play a significant role. Nurses
in this study reported reticence at escalating elevated PTTS values if they perceived
they had previously been criticised or belittled. Escalations of children/young people
with persistently high PTTS values were sometimes disregarded by the intensive
care outreach team. This was despite staff indicating they ‘knew the child’ and had
concerns about their condition. This appeared to affect intra-professional
relationships as staff characterised these responses as ‘rude’. Hierarchy, culture,
nursing confidence and fear of criticism have all been reported to play a role but the
relationship between these and other factors is poorly understood.83,171 It is not
known whether the experience and skills of the nurse is a mitigating or aggravating
factor.
The findings suggest that the PTTS may be used by different staff in differing ways.
Senior staff on the more acute medical and surgical wards staff described using the

272
PTTS to confirm, rather than detect, the signs of deterioration. This phenomenon
has been previously described in adult wards, where the documentation of vital sign
observations follows, rather than precedes, an escalation call.111 Staff may place
value on other indicators of deterioration which do not form part of the PTTS.
Nurses in the focus groups spoke of a ‘gut instinct’ that a patient is deteriorating.
The incorporation of a PTTS parameter for nurse concern may be a way of
addressing this issue.
Nurses highlighted a number of benefits associated with the use of a PTTS. They
reported that a PTTS could facilitate the early detection of children who are
deteriorating and prompt referral to senior clinicians to instigate appropriate
interventions. This accords with findings from a US study where nurses and
physicians identified the PTTS as alerting them to significant vital sign changes and
prompting them to think critically about the possibility of deterioration.79 Nurses also
identified the benefits for junior nurses, as the PTTS provided reassurance and
guidance to indicate when they should seek senior help and guidance. For senior
nurses, this eased the burden of supervision and helped them to manage their
workload. Similar findings have been reported by doctors and nurses in similar
children’s hospital in the USA.79
5.6.1 Limitations
This study explored the understanding and use of a PTTS in clinical practice. It was
conducted in a specialist children’s hospital in three selected wards. Children/young
people and parent participants were, to a certain extent, self-selecting. After being
approached by the direct care team, potential participants put themselves forward to
be approached by the candidate to discuss the research. Participants in the focus
group were selected by the ward manager using the sampling matrix developed by
the candidate. The manager may, consciously or unconsciously, have selected
candidates who had a particular perspective on vitals sign monitoring and PTTS
use. This may have introduced bias and resulted in findings which were not
representative of the wider population. As a result, findings may not be
generalisable to other settings, either within the same or different hospitals.
Moreover, participants in each focus group were drawn from the same ward. Group
dynamics are recognised to influence the discussion. There is a potential for
consensus within the group to be misinterpreted, as participants may choose to give

273
similar answers or withhold their views dependent on the relationship and dynamics
of the group.254 The views of one person may dominate the discussion and this can
exclude important and relevant findings from other participants. However these
limitations were recognised by the candidate, who made a conscious effort to
ensure equal participation by all participants. Focus groups appeared dynamic,
discussion was free flowing and both positive and negative reflections on vital sign
monitoring and PTTS emerged.
No data were collected on children and families who were approached by the direct
care team but chose not to put themselves forward for participation. This was felt to
have potential to be mis-interpreted as exerting additional pressure on candidates to
participate. The need to ensure participant choice and unbiased participation was
prioritised although it was recognised that this may limit the findings.
Participants were predominantly female. This may reflect the lower number of male
paediatric nurses and the higher proportion of mothers who are resident with their
child in hospital. However male participants may have a different perspective on
vital sign and PTTS recording which could affect the findings of this study.
Analysis was undertaken by the candidate, who was also a nurse. Whilst this may
offer greater insight into the findings, particularly from the focus groups, it may also
have introduced bias into the data collection and data analysis.254 The views of
nurses may have been afforded greater weight over those of the children/young
person and family. However this was recognised as a potential limitation by the
candidate and care was taken to reflect on the findings with a supervisor from a
different professional background.
Due to the small number of participants it was not possible to explore whether
differences exist between surgical, medical and short stay wards. Further research
is required to explore these factors.
5.6.2 Strengths
This study explored the views of nurses, families, children and young people on vital
sign monitoring and use of a PTTS that is used and activated exclusively by
healthcare staff. This is an area where there is limited research. Greater

274
participation by parents and children/young people has been highlighted as central
to the effective management of the deteriorating hospitalised child.33 Exploration of
their views and understanding of PTTS use may facilitate greater participation in
care and strengthen the partnership between children, families and healthcare
professionals. The candidate drew on her extensive nursing experience to try and
build a rapport with families and quickly put them at ease, which was felt to have
facilitated the production of rich data.
Data were collected from children/young people, parents and nurses from the same
three wards. This offered an opportunity to compare and contrast the findings and
examine the relationship between the differing participants. This may offer greater
insight into the dynamics and inter-personal relationships that contribute to the
delivery of care. Different data collection methods were selected to meet the needs
of participants. The data collection process was flexible to reduce the burden on
participants and facilitate the opportunity for participation. This resulted in a rich data
set.
5.7 Conclusion
In this chapter the understanding and experiences of children, young people,
parents and nurses surrounding the use of a PTTS have been explored. The
findings indicate that the use of PTTS is complex. Many factors influence the
success or failure in clinical practice. However greater partnership between children,
young people, families and healthcare professionals appears key.
The final chapter will discuss the findings presented in this thesis and make
recommendation for future research and clinical practice.

275
Chapter 6 Discussion
6.1 Introduction
Selected aspects around the use of paediatric track and trigger systems (PTTS) to
detect critical deterioration in hospitalised children have been reported in this thesis.
Aspects were selected based on the candidate’s experience of implementing a
PTTS in clinical practice. They represented real-world problems and challenges
faced by clinicians and explored areas where the existing research was identified as
limited or weak.
6.1.1 Research objectives
Four main research questions were identified:
1. What are the number, nature and characteristics of published PTTS and
what is the evidence on their validity, reliability and utility?
2. Does predictive validity, assessed by calculation of the area under the
receiver operator characteristic curve (AUROC), vary between differing
PTTS and can the substitution of percentile-derived thresholds for heart and
respiratory rate improve performance?
3. When PTTS are used in clinical practice are they reliably recorded,
accurately calculated and appropriately escalated?
4. What are the views of children/young people, their families and ward nursing
staff on PTTS?
6.1.2 Summary of the main findings
A systematic review of the literature using the GRADE methodology147 was
presented in chapter two. Thirty-three different PTTS were identified from 55
publications. Twenty-one were classified as scoring systems and 12 as trigger
systems. All included one or more vital signs however thresholds for prompting a
positive score or trigger differed. Implemented without a rapid response team, PTTS
did not demonstrate a statistically significant relative reduction in cardiac or
respiratory arrest, or mortality. When implemented as part of a rapid response team
there was a statistically significant reduction in the relative and absolute risk of
death in hospital, death on the ward and death following transfer to the paediatric

276
intensive care unit (PICU). There was also a significant reduction in the relative risk
of cardiac and respiratory arrest on the ward. Six studies examined inter-rater
reliability. Four found good to high levels with a further study demonstrating
excellent inter-rater reliability at scores of three and above. Eight quantitative and
two qualitative studies examined the acceptability and usefulness of PTTS to staff.
No studies evaluated the acceptability of PTTS to the children and their families.
An observational study of the predictive performance of 18 PTTS was presented in
chapter three. A retrospective case-control methodology was selected as this
allowed simultaneous comparison between multiple PTTS. Overall 297 case events
and 311 control events were identified. The predictive performance assessed by the
AUROC varied from 0.62 to 0.89. The Cardiff and Vale Paediatric Early Warning
System (PEWS),137 the Bedside PEWS154 and the Modified PEWS III172 performed
better than the other PTTS, but there were no clear defining features that explained
this. Incorporation of evidence based thresholds for heart and respiratory rate184,185
did not improve the performance of the highest ranked PTTS.
In chapter four the findings from an observation study of real-world use of PTTS by
clinicians were reported. The vital signs observation sets and PTTS scores recorded
for case and control patients identified in chapter three were examined for accuracy,
completeness and compliance to a monitoring and escalation protocol. Whilst case
patients had a greater number of observation sets recorded (8543 vs 5273), they
had a lower proportion of accurately calculated PTTS scores (73.2% vs 80.9%).
Only 35.9% of observations sets had all the component vital signs recorded
simultaneously. Compliance to the monitoring and escalation protocol was very
poor. Only 6.4% of controls and no case patients fully complied with the monitoring
and escalation protocol for the entire 48-hour study period.
An exploratory study into the experiences of children/young people, their families
and nurses of their perceptions and experiences of vital sign monitoring and the use
of PTTS was reported in chapter five. Three themes and 10 sub-themes emerged
from the data. Vital signs and PTTS monitoring were associated with benefits and
burdens by participants. In particular, children and young people reported that
recording of their vital sign observations was sometimes a painful and distressing
experience. Watchfulness and wisdom embodied the need by parents and nurses to

277
watch over the child/young person and offers explanations on how they made
assessments and judgments on the child’s progress. Both groups identified the
benefits of knowing the child/young person. Collaboration and conflict encompassed
the impact that PTTS use sometimes has on relationships between children/young
people, their families and healthcare staff. Children and young people and their
parents were unaware of the local PTTS although most could understand its
concept and function after it was explained to them. The importance of their
participation has been emphasised in the recent the safe system report.33
6.1.3 Original contribution of this thesis
Findings from the four studies provided original contributions to the evidence base
on PTTS:
1. A systematic review of published PTTS which highlighted 33 differing PTTS
with variable validity and reliability
2. A pooled analysis of published PTTS which identified very low level evidence
for PTTS implementation and moderate to low evidence for PTTS
implementation as part of a package of interventions such as a rapid
response system
3. A comparative analysis of validity (as assessed by the AUROC) which
identified significant differences in the performance of published PTTS
4. A comparative analysis of validity which identified that modifying published
PTTS with percentile-derived vital sign thresholds does not significantly
improve the performance of the best performing systems
5. An evaluation of nursing practice which identified that only 35.9% of
observation sets had simultaneous recording of the six components required
to calculate the PTTS score
6. An evaluation of nursing practice which identified that 7.3% of observation
sets had no recorded PTTS value and 19.6% had a PTTS value which was
incorrect
7. An assessment of adherence to a PTTS monitoring and escalation protocol
using an ‘all or nothing’ approach which identified that no case patients and
only 6.4% of controls fully adhered to the protocol.

278
8. A qualitative study with junior and senior nurses, parents and children and
young people which elicited their perceptions and experiences of in-patient
vital sign monitoring and the use of PTTS.
6.2 Supporting and conflicting findings across the four studies
Although the findings reported in this thesis relate to four separate studies, all
explore differing aspect of PTTS use in a tertiary specialist children’s hospital. As
such the findings from one study may help explain and enrich our understanding of
another. Findings may also conflict and this may highlight areas which require
further study. The following section will discuss selected findings linked by two or
more of the studies.
6.2.1 Recording of vital sign observations and paediatric track and trigger system scores
In chapter five parents spoke of how vital sign observations appeared to be
recorded at regular times rather than being tailored to their child’s individual needs.
Nurses also reported the tendency, particularly by junior staff, to record
observations at regular times. Night-time recording of vital sign observations and
PTTS was highlighted as an area of particular challenge for both staff and parents.
Parents described how staff would come to record their child’s vital sign
observations after they had just settled them to sleep. Staff spoke of occasions
when parents restricted the taking of observations and as such they were perceived
as ‘awkward’.
The data reported in chapter four would appear to support some of these
perceptions. Examination of Figure 4.8 reveals a four-hourly pattern of recording
around the hours of two, six and 10 o’clock. This pattern was seen for both case
(Figure 4.9) and control patients (Figure 4.10) and persisted across the individual
vital sign parameters. However comparison of vital sign recording frequency for the
day and night revealed no statistical difference (paragraph 4.3.2.1). These finding
differ those found in adult in-patients.93 A pattern of two large peaks in the morning
and evening were noted and the frequency of vital sign observation recording was
significantly lower at night. The findings of this study indicate that the challenges
and conflicts identified by both parents and nurses do not appear to affect the

279
underlying rate of recording. It may be that these episodes are infrequent and were
not present for the patients in this sample. Staff may have successfully negotiated
with parents and children times to take the observations at night. Alternatively, staff
may have continued to record vital sign observations despite the protestations of
families.
Assessment of the frequency of vital sign recording in the hours leading up to the
case patients’ critical deterioration event indicated a steady increase in the
frequency of recording (Figure 4.15). Nurse participants in chapter five reported
increasing the frequency of observations when they detected that a child’s condition
was deteriorating.83 Parents also reported requesting that vital sign observations be
performed when they sensed something was ‘not right’ with their child. However
closer examination of Figure 4.15 shows that this increase was not sustained. At
around three hours before the critical deterioration event the rate of recording for
vital sign parameters decreased. Nurses in the focus groups described how the
need to intervene in emergency situations out-weighed the documentation of vital
sign recordings, creating ‘gaps’ in the chart.111 Despite recognising the importance
of recording, they cautioned that PTTS charts should not be relied upon in
emergency situations.
6.2.2 Escalation of elevated paediatric track and trigger system scores
Findings from chapter three indicate that the local PTTS, the CEWS, performed
moderately well, with an AUROC of 0.79 (95% confidence interval [CI] 0.75-0.82).
This could be considered to indicate reasonable discrimination.201 The optimal score
was identified as four (Table 3.12) with sensitivity determined to be 0.60 (95% CI
0.54 - 0.66) and specificity of 0.85 (95% CI 0.80-0.88). The subsequent response to
this score for 166 case patients and 32 controls was reported in Chapter four (Table
4.9). These 32 control patients could retrospectively be labeled as ‘false positives’.
Nurse participants in chapter five identified ‘false positives’ as a concern and certain
patient groups, such as neonates, were highlighted as particularly vulnerable. The
challenges of using a PTTS in this population have previously been highlighted.255
Participants recalled occasions where patients had repeatedly attained a high score,
but had not gone on to suffer a critical deterioration event. They emphasised the
importance of discretion in these situations and appeared to feel that their decision

280
not to escalate the patient was vindicated when the patient did not go on to
deteriorate. However this still represented a failure to adhere to the protocol in a
significant number of patients considered to be at moderate risk of deterioration.
Full adherence to the escalation protocol for all patients would considerably
increase the workload for healthcare staff. In this case-controlled study over 10% of
control patients achieved a CEWS of four. If this were applied to the hospital in-
patient population as a whole, a considerable number of additional repeat PTTS
recordings and clinical reviews would be required. Emphasis has traditionally been
placed on achieving high levels of sensitivity for PTTS. The consequential lower
level of specificity has received less attention. On the surface, this appears to be the
‘safe’ option. However there may be unintended consequences of low specificity
which leads nurses to make decisions on whether or not to escalate a patient with
an elevated score. The accuracy of this decision can only be determined with
hindsight. As such elimination of false positives may be equally important because
of the effect this may have on compliance to the escalation protocol.
6.2.3 Errors in paediatric track and trigger system scores
In chapter four a high rate of errors in PTTS score calculation was identified.
Significantly more errors were under rather than over-scored. The majority of errors
were ascribed to an incorrect or missing sub-score for one or more parameters
(Table 4.9). Examination of the prevalence of scoring errors at differing scores
revealed significantly more errors for CEWS scores of two and above (Table 4.2).
Despite having a smaller number of elevated scores, control patients had a
significantly higher rate of errors for medium and high CEWS scores when
compared to cases. In control patients these scores would be considered to be a
false positive.
Findings from chapter five may offer some insight into the possible reasons for this.
Nurse participants in one focus group described their decision-making process
when faced with a vital sign parameter which sat on the border between two
parameter sub-scores. They explained how they selected the vital sign parameter
sub-score which most closely matched their clinical impression of the patient. If they
felt the patient was ‘sick’ they chose the higher score. If they assessed the patient

281
as ‘stable’ the lower score was selected. As such they used the PTTS as a
mechanism to support rather than direct their decision-making.
When examined together, these findings may indicate that the mis-calculation of a
PTTS score is not just ‘random error’. Rather, it may represent a deliberate choice
by nurses to select a score which matches their clinical impression of the patient. A
similar phenomenon, characterised as ‘manipulation of the score’, has been
reported in adult patients with Legionnaires disease.49 This may explain the higher
prevalence of under rather than over-scoring errors.54,90
6.3 Strengths of the thesis
This thesis explored selected aspects around the use of PTTS in clinical practice.
The research questions arose from problems encountered when implementing and
using a PTTS in the clinical arena. They were considered clinically important based
on these real-world experiences and challenges. As such, the findings may have a
high degree of utility for other clinicians.
A strength of this thesis is the inter-relationship between the findings of the four
component studies This offers an opportunity to compare and contrast findings and
may enrich our understanding of PTTS use in the clinical environment. The findings
may also add breadth to the research on PTTS. Collaboration with children/young
people and their parents on PTTS use is an area which has received very little
attention.
The research explored selected aspects of an established PTTS. A significant
proportion of existing research is set in the period during or shortly after PTTS
implementation. Relatively little attention has been paid to how these systems
develop and change over time. Findings from adult studies indicate that mature
rapid response systems behave differently to novel systems.256-258 It is therefore
possible that PTTS evolve and change over time. The findings from centres with a
newly established system may differ from those where the PTTS has been
established for a number of years. Given that the majority of hospitals in the UK
have already implemented a PTTS, the findings reported in this thesis may have
greater relevance.

282
6.4 Limitations of the thesis
The research in this thesis was performed in a specialist children’s hospital without
an emergency department. Many of the children suffer from rare and life-limiting
disorders and as a consequence had experienced multiple episodes of
hospitalisation. As such, findings from this study may not be generalisable to other
settings.
The main outcome reported in chapter three and four was critical deterioration. This
was a composite outcome of respiratory and cardiac arrest, unplanned admission to
the PICU (paediatric intensive care unit) and unexpected death on the ward. The
majority of case patients were classified as requiring an unplanned admission to
PICU. Respiratory and cardiac arrests were less frequent and no participant was
classified as suffering an unexpected death on the ward. Death on the ward and
arrests were recognised as a more robust outcome measure. Admission to PICU is
known to be influenced by many non-patient factors: bed capacity, staffing levels
and skill mix in both the PICU and the ward, clinician preference, inter-professional
relationships and local protocols to cite but a few.16,259-261 However arrests and ward
deaths are rare events, and it is likely that the numbers needed to achieve
statistically significant findings would have exceeded the duration of the PhD. As
such the outcome was selected for pragmatic purposes, whilst bearing in mind the
significant number of PTTS studies which have utilised this
outcome.59,119,137,138,154,157,161,170
The candidate was a senior nurse in the hospital where the research was conducted
and was responsible for implementing the local PTTS which was central to the
studies reported in chapters four and five. Her role in implementing the PTTS was
known by all senior staff and many of the research participants. All data, with the
exception of two focus groups in Chapter five and the data from 20 participants in
Chapter four, were collected and analysed by the candidate. Hindsight bias may
have influence the classification of compliance reported in chapter four.262
Participants in chapter five may have been aware of the candidate’s role in
implementing the PTTS and felt pressure to report positive, rather than negative
opinions on the PTTS. Whilst care was taken to remain objective, this may have
introduced bias into the studies at either the data collection or the analysis stage.

283
Data were collected and analysed at different times over the course of the PhD. No
attempt was made to standardise care across differing wards, but differences in
clinical practice may have evolved over time.
6.5 Dissemination of findings
Findings from chapter two have been published and can be seen at Appendix 12.1.
Findings from Chapter three have been peer-reviewed and accepted for publication.
Selected findings from chapter three have also been accepted for presentation at
the European Academy of Paediatric Societies (Appendix 12.2). The results from
Chapter four are currently being prepared for publication. The qualitative study in
chapter five will be prepared for publication later in the year.
The results from the studies have been shared with colleagues and managers at the
candidate’s host hospital. Some have already been incorporated into clinical
practice and this is discussed below. Findings have also been shared with
colleagues with similar research interests in other institutions.
6.6 Implementation of findings into clinical practice
Selected findings reported in this thesis have already been implemented in practice.
In chapter four, high levels of incomplete recording of vital sign observation sets and
PTTS calculation errors were reported. Findings were shared with senior clinicians
and managers at the hospital at an early stage. Software systems which
electronically capture vital sign observations, accurately calculate the PTTS and
automatically cascade an alert to a senior clinician were available, however funding
could not be secured as the benefits were not clear. Early findings from this study
supported the procurement of such a system as the high number of missing or
erroneous scores and the failure to escalate some elevated PTTS scores were
considered a patient safety risk. The system was implemented across the hospital in
2014.
In chapter three the comparative validity of 18 PTTS scores was reported.
Considerable variation in the predictive validity of PTTS was identified. The local
PTTS, the Children’s Early Warning System (CEWS), performed only moderately,
ranked ninth overall (Table 3.12). Findings were shared with the Medical Director

284
and the Deteriorating Children committee. The Bedside Paediatric Early Warning
System,154 ranked second in the Table, (PEWS) was felt to have advantages over
the Cardiff and Vale PEWS137 (ranked first) and the Modified PEWS III172 (ranked
third): it had previously been validated in a similar clinical setting, was being used in
other UK centres and was currently subject to an international multi-centre cluster-
randomised controlled trial.10 Using the optimal score threshold identified in Table
3.10, implementation of the Bedside PEWS, ranked second in the table, would have
led to correct identification of 36 more children who suffered a critical deterioration
event over the two-year study period. It would also have prevented 13 false alerts
for children who did not suffer a critical deterioration event. The deteriorating
children committee recommended moving to the Bedside PEWS as it would
facilitate more accurate discrimination between ‘sick’ and ‘stable’ patients. The
group also highlighted increased opportunities for future collaborative research and
potential reductions in staff training, particularly for staff that join the hospital from
centres already using the Bedside PEWS. Based largely on the data presented in
this thesis, the committee’s recommendations were accepted and are currently
being implemented into practice.
6.7 Implications for clinical practice
Managing the deteriorating child is complex. Although PTTS have been purported
as a means to address some of the deficiencies in managing the deteriorating child,
they have not delivered the anticipated benefits in terms of improved clinical
outcomes. The findings reported in this thesis may go some way towards offering an
explanation.
The recent report by NHS Improvement and the Royal College of Paediatrics and
Child Health emphasises the need to make improvements across a number of
domains.33 The six core elements which characterised a ‘safe system’ were
identified (Table 1.5). The findings reported in this thesis have implications, to a
greater or lesser extent, for all six elements.
6.7.1 Core element: Recognising deterioration
Chapter two identified the diversity of published PTTS. However it is highly likely
that many more unpublished systems are in use. The ability of these systems to

285
accurately support staff in recognising deterioration is variable. Whilst the findings
reported in chapter three may not be directly transferable to other settings, they do
highlight that locally derived PTTS may not necessarily perform better than those
which have been externally validated. A poorly validated PTTS may decrease staff
confidence in the PTTS and result in unintended consequences such as the failure
of staff to escalate elevated scores. Regular assessment of the predictive validity of
any local PTTS remains important so users can be reassured that the system is
delivering improvements in care and not harm.
6.7.2 Core element: Responding to deterioration
Responding effectively to deterioration is essential if the child is to receive the
appropriate help. However PTTS may not always be acted upon as intended.
Technology has been proposed as offering a means to bridge this gap. Software
systems with electronic calculation of PTTS values can eradicate the scoring errors
identified in chapter four.89 Inbuilt prompts can alert staff to the need for repeat vital
sign observation recordings. Escalations to senior clinicians can be automated,
without the nurse needing to generate a call. Early findings have been largely
positive.263-267 However these systems may be beyond the financial reach of many
centres, particularly those caring for children in a predominantly adult environment.
Audit of elevated PTTS scores may offer clinicians and managers an opportunity to
evaluate the robustness of their response.
6.7.3 Core element: Partnership with patients and family
Partnership with patients and families is seen as an essential component of the
system and is highlighted as ‘central’ to all other elements.33
None of the parents or children recruited to the qualitative study were aware of the
local PTTS despite the system being established for a number of years. Many had
been in hospital before but did not recall the system from previous admissions.
Some parent’s spoke of their wish to know more about when and how to escalate.
Nurses also spoke of parents alerting them to indicators of potential deterioration.
Nine of 33 PTTS systems identified in chapter two had a parameter for parental
concern.40,47,140-142,158,173,176,181,183 Incorporating parental concern into the PTTS may

286
act as a prompt to discuss its function with parents, allowing them to participate
more fully in their child’s care. Studies of parental activation of a rapid response
system have suggested that parents are judicious in its use and concerns regarding
over-activation have not, as yet, materialised.128,217,268
Some parents would appear to welcome more information on PTTS. Others were
more reticent. Control, choice and negotiation were highlighted by children and
families as important, particularly around the method and timing of vital sign
recordings. Greater attention to these may strengthen the partnership between
children, families and healthcare professionals and improve relationships and
compliance to the PTTS protocol.
6.7.4 Core element: Open and consistent learning
The report highlights the need to regularly measure, monitor and report on the
processes around detecting and escalating deterioration.33 The findings from
chapter four reinforce the need to continually monitor processes of care and
evaluate the robustness of monitoring and escalation procedures. The report also
emphasises the to need triangulate information and data. This series of linked
studies has demonstrated that evaluation of differing aspects of PTTS use can be
beneficial in promoting our understanding of these complex systems.
6.7.5 Core element: Education and training
The report highlights the importance of involving children and families in training and
education and draws attention to the challenges they may experience in raising
concerns about deterioration. For staff the benefits of training and learning as a
team, both immediate and cross-boundary and teams are emphasised.
Findings from chapter five would appear to support these aims. Some parents
recalled how they wished they had known more about how and when to escalate
their child’s condition. Others reported that their knowledge on vital signs was
largely self-taught. Some expressed an interest in understanding more so they could
better manage their child’s condition. Findings would appear to indicate that
education and training for parents and children are likely to be positively received.

287
Relationships between the ward staff and the intensive care outreach team
occasionally appeared to be under strain. Staff sometimes reported a reluctance to
escalate an elevated PTTS score, as there was a perceived reluctance by senior
staff to attend the patient. Others reported that they had been retrospectively
criticised for failing to escalate a PTTS score in a patient who later deteriorated.
Cross-boundary training may promote a greater understanding of the challenges of
each other’s roles and facilitate a better working relationship between differing
teams. This may also promote consistent escalation of elevated PTTS scores.
6.7.6 Core element: Patient safety culture
This element highlights the need for patient, parent and family engagement, open
and robust communication and broad leadership for patient safety, such as
monitoring progress and setting goals.
Whilst this was not explicitly addressed within the findings of this thesis, complex
interventions which involve adjustments to systems and processes, working with
differing teams and professional groups, and inter-departmental working inevitably
involve a shift in people’s ideas, beliefs and customs.83,253,269,270 As such, these
findings adjust the patient safety culture within an organisation.
6.8 Implications for research
The limitations of the outcomes reported in chapter three and four of this thesis have
been highlighted. Looking forward, there is a need to develop novel and more
pragmatic outcomes for research into PTTS. Greater consensus on these outcomes
may offer opportunities to increase collaborative research and increase research
outputs. This would also support multi-centre research and ensure that findings can
be pooled. This is especially important for areas where the numbers of children who
deteriorate significantly are small, such as district general hospitals. There is an
urgent need to address the lack of research in secondary care, particularly given the
high numbers of children admitted to these settings. Staff in these environments
may not be paediatric specialists and as such, may be less familiar with signs of
deterioration in children.
There are a number of areas which would benefit from future research:

288
Prospective research on the effect of PTTS on clinical outcomes particularly for
centres implementing a PTTS without access to a rapid response system
Qualitative research using ethnography to explore the clinical decision-making
by nurses in relation to the recording of vital sign observations and adherence to
PTTS monitoring and escalation protocols
Prospective research to identify the characteristics of high performing PTTS in a
variety of settings
Studies to examine less invasive and more reliable methods of capturing vital
sign observations and their acceptability to children, their families and clinicians
Examination of the clinical benefits of software facilitating electronic calculation
of PTTS values with automated escalation
Research examining the calibration of validated PTTS
Studies exploring the role that parents and children can play in detecting and
escalating critical illness
Mixed methods research exploring the relationship between validity, reliability
and utility
6.9 Conclusion
The aim of this thesis was to provide practice-based research that would have real-
world applicability for children, young people, families and clinicians. A systematic
review of PTTS was followed by three studies examining selected aspects of
validity, reliability and utility. The findings indicate that managing the deteriorating
child is complex. There appears to be a relationship between validity, reliability and
utility which is, at present, poorly understood. The outcome for children and young
people is unlikely to be significantly altered by improving validity, reliability or utility
in isolation. Benefits may be more likely to emerge if the relationship between these
factors and other core elements of the safe system framework33 are explored and
better understood.

289
References
1. Pearson GA, Ward-Platt M, Harnden A, Kelly D. Why children die: avoidable factors associated with child deaths. Arch Dis Child. 2011;96(10):927-931. doi:10.1136/adc.2009.177071.
2. Ramnarayan P, Craig F, Petros A, Pierce C. Characteristics of deaths occurring in hospitalised children: changing trends. J Med Ethics. 2007;33(5):255-260. doi:10.1136/jme.2005.015768.
3. Pearson GA. Why Children Die: a Pilot Study. London: CEMACH; 2008.
4. Chapman SM, Grocott MPW, Franck LS. Systematic review of paediatric alert criteria for identifying hospitalised children at risk of critical deterioration. Intensive Care Med. 2010;36(4):600-611. doi:10.1007/s00134-009-1715-x.
5. Royal College of Nursing. Standards for Assessing, Measuring and Monitoring Vital Signs in Infants, Children and Young People. 2nd ed. Royal College of Nursing; 2011.
6. National Confidential Enquiry into Patient Outcome and Death. Are we there yet? A review of organisational and clinical aspects of children’s surgery. doi:10.1016/j.ijsu.2013.06.644.
7. Office for National Statistics. Childhood mortality in England and Wales. http://www.ons.gov.uk. Accessed July 1, 2016.
8. Hardelid P, Dattani N, Davey J, Pribramska I, Gilbert R. Overview of Child Deaths in the Four UK Countries. London: Royal College of Paediatrics and Child Health; 2013.
9. Wolfe I, Macfarlane A, Donkin A, Marmot M, Viner R. Why Children Die: Death in Infants, Children and Young People in the UK Part A. Royal College of Paediatrics and Child Health; 2016:1-31.
10. Parshuram CS, Dryden-Palmer K, Farrell C, et al. Evaluating processes of care and outcomes of children in hospital (EPOCH): study protocol for a randomized controlled trial. Trials. 2015;16(1):245. doi:10.1186/s13063-015-0712-3.
11. Straney LD, Schlapbach LJ, Yong G, et al. Trends in PICU Admission and Survival Rates in Children in Australia and New Zealand Following Cardiac Arrest. Pediatr Crit Care Med. 2015;16(7):613-620. doi:10.1097/PCC.0000000000000425.
12. de Mos N, van Litsenburg RRL, McCrindle B, Bohn DJ, Parshuram CS. Pediatric in-intensive-care-unit cardiac arrest: incidence, survival, and predictive factors. Crit Care Med. 2006;34(4):1209-1215. doi:10.1097/01.CCM.0000208440.66756.C2.

290
13. Wolfe HA, Yuerek M, Berg RA. Pediatric Cardiac Arrests Are a Big Problem No Matter What the Denominator. Pediatr Crit Care Med. 2015;16(7):673-674. doi:10.1097/PCC.0000000000000466.
14. Topjian AA, Nadkarni VM, Berg RA. Cardiopulmonary resuscitation in children. Curr Opin Crit Care. 2009;15(3):203-208. doi:10.1097/MCC.0b013e32832931e1.
15. Advanced Life Support Group. Advanced Paediatric Life Support: the Practical Approach. 4 ed. (Samuels M, Wieteska S, eds.). Oxford: Wiley Blackwell; 2004. doi:10.1002/9781118369784.ch4.
16. PICANet. 2015 Annual Report. http://www.picanet.org.uk/Audit/Annual-Reporting/. Accessed July 1, 16AD.
17. Odetola FO, Rosenberg AL, Davis MM, Clark SJ, Dechert RE, Shanley TP. Do outcomes vary according to the source of admission to the pediatric intensive care unit? Pediatr Crit Care Med. 2008;9(1):20-25. doi:10.1097/01.PCC.0000298642.11872.29.
18. Goldhill DR, McNarry AF, Mandersloot G, McGinley A. A physiologically-based early warning score for ward patients: the association between score and outcome. Anaesthesia. 2005;60(6):547-553. doi:10.1111/j.1365-2044.2005.04186.x.
19. Lighthall GK, Markar S, Hsiung R. Abnormal vital signs are associated with an increased risk for critical events in US veteran inpatients. Resuscitation. 2009;80(11):1264-1269. doi:10.1016/j.resuscitation.2009.08.012.
20. Hillman KM, Bristow PJ, Chey T, et al. Antecedents to hospital deaths. Intern Med J. 2001;31(6):343-348. doi:10.1046/j.1445-5994.2001.00077.x.
21. Schein RMH, Hazday N, Pena M, Ruben BH, Sprung CL. Clinical antecedents to in-hospital cardiopulmonary arrest. Chest. 1990;98(6):1388-1392. doi:10.1378/chest.98.6.1388.
22. Franklin C, Mathew J. Developing strategies to prevent inhospital cardiac arrest: analyzing responses of physicians and nurses in the hours before the event. Crit Care Med. 1994;22(2):244-247. doi:10.1097/00003246-199402000-00014.
23. Buist MD, Jarmolowsi E, Burton PR, Bernard SA, Waxman BP, Anderson J. Recognising clinical instability in hospital patients before cardiac arrest or unplanned admission to intensive care. Med J Aust. 1999;171:22-25.
24. Kause J, Smith GB, Prytherch DR, Parr M, Flabouris A, Hillman K. A comparison of antecedents to cardiac arrests, deaths and emergency intensive care admissions in Australia and New Zealand, and the United Kingdom--the ACADEMIA study. Resuscitation. 2004;62(3):275-282. doi:10.1016/j.resuscitation.2004.05.016.

291
25. Goldhill DR, White SA, Sumner A. Physiological values and procedures in the 24 h before ICU admission from the ward. Anaesthesia. 1999;54(6):529-534. doi:10.1046/j.1365-2044.1999.00837.x.
26. McQuillan P, Pilkington S, Allan A, et al. Confidential inquiry into quality of care before admission to intensive care. BMJ. 1998;316(7148):1853-1858. doi:10.1136/bmj.316.7148.1853.
27. McGloin H, Adam SK, Singer M. Unexpected deaths and referrals to intensive care of patients on general wards. Are some cases potentially avoidable? J R Coll Physicians Lond. 1999;33(3):255-259.
28. National Confidential Enquiry into Patient Outcome and Death. An Acute Problem? Vol 11. NCEPOD; 2005. doi:10.1016/j.ijsu.2013.06.644.
29. Dunn KL, Reddy P, Moulden A, Bowes G. Medical record review of deaths, unexpected intensive care unit admissions, and clinician referrals: detection of adverse events and insight into the system. Arch Dis Child. 2006;91(2):169-172. doi:10.1136/adc.2005.074179.
30. Monroe K, Wang D, Vincent C, Woloshynowych M, Neale G, Inwald DP. Patient safety factors in children dying in a paediatric intensive care unit (PICU): a case notes review study. BMJ Qual Saf. 2011;20(10):863-868.
31. Ninis N, Phillips C, Bailey L, et al. The role of healthcare delivery in the outcome of meningococcal disease in children: case-control study of fatal and non-fatal cases. BMJ. 2005;330(7506):1475–0. doi:10.1136/bmj.330.7506.1475.
32. Launay E, Guen CG-L, Martinot A, et al. Suboptimal care in the initial management of children who died from severe bacterial infection: a population-based confidential inquiry. Pediatr Crit Care Med. 2010;11(4):469-474. doi:10.1097/PCC.0b013e3181ce752e.
33. Royal College of Paediatrics and Child Health, NHS Improvement. A safe system for recognising and responding to children at risk of deterioration. http://www.rcpch.ac.uk/safer-system-children-risk-deterioration. Published June 14, 2016. Accessed June 19, 2016.
34. Cuthbertson BH, Smith GB. A warning on early-warning scores! Br J Anaesth. 2007;98(6):704-706. doi:10.1093/bja/aem121.
35. Seiger N, Maconochie I, Oostenbrink R, Moll HA. Validity of Different Pediatric Early Warning Scores in the Emergency Department. Pediatrics. 2013;132(4):e841-e850. doi:10.1542/peds.2012-3594.
36. Gao H, McDonnell A, Harrison DA, et al. Systematic review and evaluation of physiological track and trigger warning systems for identifying at-risk patients on the ward. Intensive Care Med. 2007;33(4):667-679. doi:10.1007/s00134-007-0532-3.

292
37. National Institute for Health Care Excellence,. Acutely Ill Patients in Hospital: Recognition of and Response to Acute Illness in Adults in Hospital. http://www.nice.org.uk/guidance/cg50/evidence/cg50-acutely-ill-patients-in-hospital-full-guideline3. Published July 2007. Accessed July 1, 2016.
38. Alam N, Hobbelink EL, van Tienhoven AJ, van de Ven PM, Jansma EP, Nanayakkara PWB. The impact of the use of the Early Warning Score (EWS) on patient outcomes: A systematic review. Resuscitation. 2014;85(5):587-594. doi:10.1016/j.resuscitation.2014.01.013.
39. Monaghan A. Detecting and managing deterioration in children. Paediatr Nurs. 2005;17(1):32-35. doi:10.7748/paed2005.02.17.1.32.c964.
40. Tibballs J, Kinney S, Duke T, Oakley E, Hennessy M. Reduction of paediatric in-patient cardiac arrest and death with a medical emergency team: preliminary results. Arch Dis Child. 2005;90(11):1148-1152.
41. Duncan HP. Survey of early identification systems to identify inpatient children at risk of physiological deterioration. Arch Dis Child. 2007;92(9):828. doi:10.1136/adc.2006.112094.
42. Haines C, Perrott M, Weir P. Promoting care for acutely ill children-development and evaluation of a paediatric early warning tool. Intensive Crit Care Nurs. 2006;22(2):73-81. doi:10.1016/j.iccn.2005.09.003.
43. Roland D, Oliver A, Edwards ED, Mason BW, Powell CVE. Use of paediatric early warning systems in Great Britain: has there been a change of practice in the last 7 years? Arch Dis Child. 2014;99(1):26-29.
44. Royal College of Physicians. National Early Warning Score (NEWS): Standardising the Assessment of Acute-Illness Severity in the NHS. London: Royal College of Physicians; 2012.
45. Van den Bruel A, Haj-Hassan T, Thompson M, Buntinx F, Mant D, European Research Network on Recognising Serious Infection investigators. Diagnostic value of clinical features at presentation to identify serious infection in children in developed countries: a systematic review. Lancet. 2010;375(9717):834-845. doi:10.1016/S0140-6736(09)62000-6.
46. Roland D. Paediatric Early Warning Scores: Holy Grail and Achilles' heel. Arch Dis Child Educ Pract Ed. 2012;97(6):208-215. doi:10.1136/archdischild-2011-300976.
47. McLellan MC, Connor JA. The Cardiac Children's Hospital Early Warning Score (C-CHEWS). J Pediatr Nurs. 2013;28(2):171-178.
48. Skaletzky S, Pelligra A, Wood B, Raszynski A, Totapally BR. Pediatric Early Warning System. International Pediatrics. 2009;24(1):26-30.

293
49. Smith AF, Oakey RJ. Incidence and significance of errors in a patient 'track and trigger‘ system during an epidemic of Legionnaires’ disease: retrospective casenote analysis. Anaesthesia. 2006;61(3):222-228. doi:10.1111/j.1365-2044.2005.04513.x.
50. Prytherch DR, Smith GB, Schmidt P, et al. Calculating early warning scores--a classroom comparison of pen and paper and hand-held computer methods. Resuscitation. 2006;70(2):173-178. doi:10.1016/j.resuscitation.2005.12.002.
51. Centre for Clinical Practice at NICE (UK). Acutely Ill Patients in Hospital: Recognition of and Response to Acute Illness in Adults in Hospital. July 2007.
52. Smith AF, Wood J. Can some in-hospital cardio-respiratory arrests be prevented? A prospective survey. Resuscitation. 1998;37(3):133-137. doi:10.1016/s0300-9572(98)00056-2.
53. Jansen JO, Cuthbertson BH. Detecting critical illness outside the ICU: the role of track and trigger systems. Curr Opin Crit Care. 2010;16(3):184-190. doi:10.1097/MCC.0b013e328338844e.
54. Odell M. Detection and management of the deteriorating ward patient: an evaluation of nursing practice. J Clin Nurs. 2015;24(1-2):173-182. doi:10.1111/jocn.12655.
55. Harris S, Singer M, Rowan K, Sanderson C. Delay to admission to critical care and mortality among deteriorating ward patients in UK hospitals: a multicentre, prospective, observational cohort study. Lancet. 2015;385 Suppl 1:S40. doi:10.1016/S0140-6736(15)60355-5.
56. Rowan KM, Harrison DA. Recognising and responding to acute illness in patients in hospital. BMJ. 2007;335(7631):1165-1166. doi:10.1136/bmj.39395.497928.80.
57. O'Leary F, McGarvey K, Christoff A, et al. Identifying incidents of suboptimal care during paediatric emergencies-an observational study utilising in situ and simulation centre scenarios. Resuscitation. 2013;85(3):431-436. doi:10.1016/j.resuscitation.2013.12.001.
58. Massey D, Aitken LM, Chaboyer W. What factors influence suboptimal ward care in the acutely ill ward patient? Intensive Crit Care Nurs. 2009;25(4):169-180. doi:10.1016/j.iccn.2009.03.005.
59. Tume L. The deterioration of children in ward areas in a specialist children's hospital. Nurs Crit Care. 2007;12(1):12-19.
60. Nadel S, Britto J, Booy R, Maconochie I, Habibi P, Levin M. Avoidable deficiencies in the delivery of health care to children with meningococcal disease. J Accid Emerg Med. 1998;15(5):298-303. doi:10.1136/emj.15.5.298.

294
61. Winters BD, Pham JC, Hunt EA, Guallar E, Berenholtz S, Pronovost PJ. Rapid response systems: A systematic review*. Crit Care Med. 2007;35(5):1238-1243. doi:10.1097/01.CCM.0000262388.85669.68.
62. McCabe A, Duncan HP. National survey of observation and monitoring practices of children in hospital. Paediatr Nurs. 2008;20(6):24-27. doi:10.7748/paed2008.07.20.6.24.c6627.
63. Mackintosh NJ, Rainey H, Sandall J. Understanding how rapid response systems may improve safety for the acutely ill patient: learning from the frontline. BMJ Qual Saf. 2012;21(2):135-144. doi:10.1136/bmjqs-2011-000147.
64. McBride J, Knight D, Piper J, Smith GB. Long-term effect of introducing an early warning score on respiratory rate charting on general wards. Resuscitation. 2005;65(1):41-44. doi:10.1016/j.resuscitation.2004.10.015.
65. Hammond NE, Spooner AJ, Barnett AG, Corley A, Brown P, Fraser JF. The effect of implementing a modified early warning scoring (MEWS) system on the adequacy of vital sign documentation. Aust Crit Care. 2013;26(1):18-22. doi:10.1016/j.aucc.2012.05.001.
66. Mitchell IA, McKay H, Van Leuvan C, et al. A prospective controlled trial of the effect of a multi-faceted intervention on early recognition and intervention in deteriorating hospital patients. Resuscitation. 2010;81(6):658-666. doi:10.1016/j.resuscitation.2010.03.001.
67. McKay H, Mitchell IA, Sinn K, et al. Effect of a multifaceted intervention on documentation of vital signs and staff communication regarding deteriorating paediatric patients. J Paediatr Child Health. 2013;49(1):48-56. doi:10.1111/jpc.12019.
68. Odell M, Rechner IJ, Kapila A, et al. The effect of a critical care outreach service and an early warning scoring system on respiratory rate recording on the general wards. Resuscitation. 2007;74(3):470-475. doi:10.1016/j.resuscitation.2007.01.035.
69. Butler-Williams C, Cantrill N, Maton S. Increasing staff awareness of respiratory rate significance. Nursing Times. 2005;101(27):35-37.
70. Elliott D, Allen E, Perry L, et al. Clinical user experiences of observation and response charts: focus group findings of using a new format chart incorporating a track and trigger system. BMJ Qual Saf. 2015;24(1):65-75. doi:10.1136/bmjqs-2013-002777.
71. Elliott D, McKinley S, Perry L, et al. Clinical utility of an observation and response chart with human factors design characteristics and a track and trigger system: study protocol for a two-phase multisite multiple-methods design. JMIR Res Protoc. 2014;3(3):e40. doi:10.2196/resprot.3300.

295
72. Christofidis MJ, Hill A, Horswill MS, Watson MO. A human factors approach to observation chart design can trump health professionals' prior chart experience. Resuscitation. 2013;84(5):657-665. doi:10.1016/j.resuscitation.2012.09.023.
73. Christofidis MJ, Hill A, Horswill MS, Watson MO. Observation chart design features affect the detection of patient deterioration: a systematic experimental evaluation. J Adv Nurs. 2016;72(1):158-172. doi:10.1111/jan.12824.
74. Christofidis MJ, Hill A, Horswill MS, Watson MO. Observation charts with overlapping blood pressure and heart rate graphs do not yield the performance advantage that health professionals assume: an experimental study. J Adv Nurs. 2014;70(3):610-624. doi:10.1111/jan.12223.
75. Horswill MS, Preece MHW, Hill A, et al. Human factors research regarding observation charts: Research project overview. Australian Commission on Safety and Quality in Healthcare. 2010.
76. McDonnell A, Tod A, Bray K, Bainbridge D, Adsetts D, Walters S. A before and after study assessing the impact of a new model for recognizing and responding to early signs of deterioration in an acute hospital. J Adv Nurs. 2013;69(1):–52. doi:10.1111/j.1365-2648.2012.05986.x.
77. Andrews T, Waterman H. Packaging: a grounded theory of how to report physiological deterioration effectively. J Adv Nurs. 2005;52(5):473-481. doi:10.1111/j.1365-2648.2005.03615.x.
78. Lydon S, Byrne D, Offiah G, Gleeson L, O'Connor P. A mixed-methods investigation of health professionals' perceptions of a physiological track and trigger system. BMJ Qual Saf. October 2015. doi:10.1136/bmjqs-2015-004261.
79. Bonafide CP, Roberts KE, Weirich CM, et al. Beyond statistical prediction: qualitative evaluation of the mechanisms by which pediatric early warning scores impact patient safety. J Hosp Med. 2013;8(5):248-253. doi:10.1002/jhm.2026.
80. Stafseth SK, Grønbeck S, Lien T, Randen I, Lerdal A. The experiences of nurses implementing the Modified Early Warning Score and a 24-hour on-call Mobile Intensive Care Nurse: An exploratory study. Intensive Crit Care Nurs. November 2015. doi:10.1016/j.iccn.2015.07.008.
81. Donohue LA, Endacott R. Track, trigger and teamwork: communication of deterioration in acute medical and surgical wards. Intensive Crit Care Nurs. 2010;26(1):10-17. doi:10.1016/j.iccn.2009.10.006.
82. Goldenhar LM, Brady PW, Sutcliffe KM, Muething SE. Huddling for high reliability and situation awareness. BMJ Qual Saf. 2013;22(11):899-906. doi:10.1136/bmjqs-2012-001467.

296
83. Brady PW, Goldenhar LM. A qualitative study examining the influences on situation awareness and the identification, mitigation and escalation of recognised patient risk. BMJ Qual Saf. 2014;23(2):153-161.
84. Brady PW, Muething SE, Kotagal UR, et al. Improving situation awareness to reduce unrecognized clinical deterioration and serious safety events. Pediatrics. 2013;131(1):e298-e308. doi:10.1542/peds.2012-1364.
85. Brady PW, Wheeler DS, Muething SE, Kotagal UR. Situation Awareness: A New Model for Predicting and Preventing Patient Deterioration. Hospital pediatrics. 2014;4(3):143-146. doi:10.1542/hpeds.2013-0119.
86. Gordon CF, Beckett DJ. Significant deficiencies in the overnight use of a Standardised Early Warning Scoring system in a teaching hospital. Scott Med J. 2011;56(1):15-18. doi:10.1258/smj.2010.010009.
87. Beckett DJ, Inglis M, Oswald S, et al. Reducing cardiac arrests in the acute admissions unit: a quality improvement journey. BMJ Qual Saf. 2013;22(12):1025-1031. doi:10.1136/bmjqs-2012-001404.
88. Austen C, Patterson C, Poots A, Green S, Weldring T, Bell D. Using a local early warning scoring system as a model for the introduction of a national system. Acute Med. 2012;11(2):66-73.
89. Jones S, Mullally M, Ingleby S, Buist M, Bailey M, Eddleston JM. Bedside electronic capture of clinical observations and automated clinical alerts to improve compliance with an Early Warning Score protocol. Crit Care Resusc. 2011;13(2):83-88.
90. Edwards M, McKay H, Van Leuvan C, Mitchell I. Modified Early Warning Scores: inaccurate summation or inaccurate assignment of score? Crit Care. 2010;14(Suppl 1):P257. doi:10.1186/cc8233.
91. Robb G, Seddon M. A multi-faceted approach to the physiologically unstable patient. Qual Saf Health Care. 2010;19(5):e47-e47. doi:10.1136/qshc.2008.031807.
92. Niegsch M, Fabritius ML, Anhøj J. Imperfect implementation of an early warning scoring system in a Danish teaching hospital: a cross-sectional study. Salluh JIF, ed. PLoS ONE. 2013;8(7):e70068. doi:10.1371/journal.pone.0070068.
93. Hands C, Reid E, Meredith P, et al. Patterns in the recording of vital signs and early warning scores: compliance with a clinical escalation protocol. BMJ Qual Saf. 2013;22(9):719-726. doi:10.1136/bmjqs-2013-001954.
94. Clifton DA, Clifton L, Sandu D-M, et al. “Errors” and omissions in paper-based early warning scores: the association with changes in vital signs-a database analysis. BMJ Open. 2015;5(7):e007376. doi:10.1136/bmjopen-2014-007376.

297
95. McGain F, Cretikos MA, Jones D, et al. Documentation of clinical review and vital signs after major surgery. Med J Aust. 2008;189(7):380-383.
96. De Meester K, Haegdorens F, Monsieurs KG, Verpooten GA, Holvoet A, Van Bogaert P. Six-day postoperative impact of a standardized nurse observation and escalation protocol: A preintervention and postintervention study. J Crit Care. 2013;28(6):1068-1074. doi:10.1016/j.jcrc.2013.07.061.
97. Chellel A, Higgs D, Scholes J. An evaluation of the contribution of critical care outreach to the clinical management of the critically ill ward patient in two acute NHS trusts. Nurs Crit Care. 2005;11(1):42-51. doi:10.1111/j.1362-1017.2006.00140.x.
98. Cretikos MA, Bellomo R, Hillman K, Chen J, Finfer S, Flabouris A. Respiratory rate: the neglected vital sign. Med J Aust. 2008;188(11):657-659.
99. Ansell H, Meyer A, Thompson S. Why don't nurses consistently take patient respiratory rates? Br J Nurs. 2014;23(8):414-418. doi:10.12968/bjon.2014.23.8.414.
100. Edwards SM, Murdin L. Respiratory rate--an under-documented clinical assessment. Clin Med. 2001;1(1):85-85. doi:10.7861/clinmedicine.1-1-85.
101. Hillman K, Chen J, Cretikos M, et al. Introduction of the medical emergency team (MET) system: a cluster-randomised controlled trial. The Lancet. 2005;365(9477):2091-2097. doi:10.1016/S0140-6736(05)66733-5.
102. Endacott R, Kidd T, Chaboyer W, Edington J. Recognition and communication of patient deterioration in a regional hospital: a multi-methods study. Aust Crit Care. 2007;20(3):100-105. doi:10.1016/j.aucc.2007.05.002.
103. Guinane J, Bucknell T, Currey J, Jones D. Incidence of missed medical emergency team (MET) activation. Aust Crit Care. 2010;24(1):63-64. doi:10.1016/j.aucc.2010.12.028.
104. Bucknall TK, Jones D, Bellomo R, Staples M, RESCUE Investigators. Responding to medical emergencies: system characteristics under examination (RESCUE). A prospective multi-site point prevalence study. Resuscitation. 2013;84(2):179-183. doi:10.1016/j.resuscitation.2012.06.015.
105. Hravnak M, Edwards L, Clontz A, Valenta C, DeVita MA, Pinsky MR. Defining the incidence of cardiorespiratory instability in patients in step-down units using an electronic integrated monitoring system. Arch Intern Med. 2008;168(12):1300-1308. doi:10.1001/archinte.168.12.1300.
106. Boniatti MM, Azzolini N, Viana MV, et al. Delayed medical emergency team calls and associated outcomes*. Crit Care Med. 2014;42(1):26-30. doi:10.1097/CCM.0b013e31829e53b9.

298
107. Trinkle RM, Flabouris A. Documenting Rapid Response System afferent limb failure and associated patient outcomes. Resuscitation. 2011;82(7):810-814. doi:10.1016/j.resuscitation.2011.03.019.
108. Calzavacca P, Licari E, Tee A, et al. The impact of Rapid Response System on delayed emergency team activation patient characteristics and outcomes—A follow-up study. Resuscitation. 2010;81(1):31-35. doi:10.1016/j.resuscitation.2009.09.026.
109. Quach JL, Downey AW, Haase M, Haase-Fielitz A, Jones DA, Bellomo R. Characteristics and outcomes of patients receiving a medical emergency team review for respiratory distress or hypotension. J Crit Care. 2008;23(3):325-331. doi:10.1016/j.jcrc.2007.11.002.
110. Downey AW, Quach JL, Haase M, Haase-Fielitz A, Jones DA, Bellomo R. Characteristics and outcomes of patients receiving a medical emergency team review for acute change in conscious state or arrhythmias. Crit Care Med. 2008;36(2):477-481. doi:10.1097/01.CCM.0000300277.41113.46.
111. Odell M, Victor C, Oliver D. Nurses' role in detecting deterioration in ward patients: systematic literature review. J Adv Nurs. 2009;65(10):1992-2006. doi:10.1111/j.1365-2648.2009.05109.x.
112. Radeschi G, Urso F, Campagna S, et al. Factors affecting attitudes and barriers to a medical emergency team among nurses and medical doctors: A multi-centre survey. Resuscitation. 2015;88:92-98. doi:10.1016/j.resuscitation.2014.12.027.
113. Cioffi J. Nurses' experiences of making decisions to call emergency assistance to their patients. J Adv Nurs. 2000;32(1):108-114. doi:10.1046/j.1365-2648.2000.01414.x.
114. Endacott R, Westley M. Managing patients at risk of deterioration in rural hospitals: A qualitative study. Aust J Rural Health. 2006;14(6):275-279. doi:10.1111/j.1440-1584.2006.00829.x.
115. Watson A, Skipper C, Steury R, Walsh H, Levin A. Inpatient nursing care and early warning scores: a workflow mismatch. J Nurs Care Qual. 2014;29(3):215-222. doi:10.1097/NCQ.0000000000000058.
116. Parshuram CS, Duncan HP, Joffe AR, et al. Multicentre validation of the bedside paediatric early warning system score: a severity of illness score to detect evolving critical illness in hospitalised children. Crit Care. 2011;15(4):R184.
117. Oliver A, Powell C, Edwards D, Mason B. Observations and monitoring: routine practices on the ward. Paediatr Nurs. 2010;22(4):28-32. doi:10.7748/paed2010.05.22.4.28.c7738.

299
118. Randhawa S, Roberts-Turner R, Woronick K, DuVal J. Implementing and sustaining evidence-based nursing practice to reduce pediatric cardiopulmonary arrest. West J Nurs Res. 2011;33(3):443-456. doi:10.1177/0193945910379585.
119. Parshuram CS, Bayliss A, Reimer J, Middaugh KL, Blanchard N. Implementing the Bedside Paediatric Early Warning System in a community hospital: A prospective observational study. Paediatr Child Health. 2011;16(3):e18-e22.
120. Hillman KM, Bristow PJ, Chey T, et al. Duration of life-threatening antecedents prior to intensive care admission. Intensive Care Med. 2002;28(11):1629-1634. doi:10.1007/s00134-002-1496-y.
121. Robson M-AJ, Cooper CL, Medicus LA, Quintero MJ, Zuniga SA. Comparison of three acute care pediatric early warning scoring tools. J Pediatr Nurs. 2013;28(6):e33-e41. doi:10.1016/j.pedn.2012.12.002.
122. Odell M, Gerber K, Gager M. Call 4 Concern: patient and relative activated critical care outreach. Br J Nurs. 2010;19(22):1390-1395. doi:10.12968/bjon.2010.19.22.1390.
123. Bogert S, Ferrell C, Rutledge DN. Experience with family activation of rapid response teams. Medsurg Nurs. 2010;19(4):215–22–quiz223.
124. Baird SK, Turbin LB. Condition concern: an innovative response system for enhancing hospitalized patient care and safety. J Nurs Care Qual. 2011;26(3):199-207. doi:10.1097/NCQ.0b013e31820b1f91.
125. Dean BS, Decker MJ, Hupp D, Urbach AH, Lewis E, Benes-Stickle J. Condition HELP: a pediatric rapid response team triggered by patients and parents. J Healthc Qual. 2012;30(3):28-31. doi:10.1111/j.1945-1474.2008.tb01139.x.
126. Van Voorhis KT, Willis TS. Implementing a pediatric rapid response system to improve quality and patient safety. Pediatr Clin North Am. 2009;56(4):919-933.
127. Greenhouse PK, Kuzminsky B, Martin SC, Merryman T. Emergency. Calling a condition h(elp): one facility gives patients and families the ability to summon a rapid response team. Greenhouse PK, Kuzminsky B, Martin SC, Merryman T, eds. AJN, American Journal of Nursing. 2006;106(11):63-66.
128. Roland D. But I told you she was ill! The role of families in preventing avoidable harm in children. BMJ Qual Saf. 2015;24(3):186-187. doi:10.1136/bmjqs-2015-003950.
129. Forster E, Hafiz A. Paediatric death and dying: exploring coping strategies of health professionals and perceptions of support provision. Int J Palliat Nurs. 2015;21(6):294-301. doi:10.12968/ijpn.2015.21.6.294.

300
130. Akobeng AK. Understanding systematic reviews and meta-analysis. Arch Dis Child. 2005;90(8):845-848. doi:10.1136/adc.2004.058230.
131. University of York. Systematic reviews: CRD's guidance for undertaking reviews in health care. http://scholar.google.com/scholar?q=related:rQBxpIZ0krsJ:scholar.google.com/&hl=en&num=20&as_sdt=0,5. Published September 2009. Accessed June 19, 2015.
132. Higgins J, Green S, eds. Cochrane Handbook for Systematic Reviews of Interventions. 5 ed. The Cochrane Collaboration www.cochrane-handbook.org.
133. Søreide K. Receiver-operating characteristic curve analysis in diagnostic, prognostic and predictive biomarker research. J Clin Pathol. 2009;62(1):1-5. doi:10.1136/jcp.2008.061010.
134. Su T-L, Jaki T, Hickey GL, Buchan I, Sperrin M. A review of statistical updating methods for clinical prediction models. Stat Methods Med Res. July 2016. doi:10.1177/0962280215626466.
135. Smart A. A multi-dimensional model of clinical utility. Int J Qual Health Care. 2006;18(5):377-382. doi:10.1093/intqhc/mzl034.
136. Harbour R, Miller J. A new system for grading recommendations in evidence based guidelines. BMJ. 2001;323(7308):334-336.
137. Edwards ED, Powell CVE, Mason BW, Oliver A. Prospective cohort study to test the predictability of the Cardiff and Vale paediatric early warning system. Arch Dis Child. 2009;94(8):602-606. doi:10.1136/adc.2008.142026.
138. Duncan H, Hutchison J, Parshuram CS. The Pediatric Early Warning System score: a severity of illness score to predict urgent medical need in hospitalized children. J Crit Care. 2006;21(3):271-278. doi:10.1016/j.jcrc.2006.06.007.
139. Hunt EA, Zimmer KP, Rinke ML, et al. Transition From a Traditional Code Team to a Medical Emergency Team and Categorization of Cardiopulmonary Arrests in a Children's Center. Arch Pediatr Adolesc Med. 2008;162(2):117-122.
140. Shilkofski NA, Hunt EA. A pediatric medical emergency team manages a complex child with hypoxia and worried parent. Jt Comm J Qual Patient Saf. 2007;33(4):236–41–185.
141. Tibballs J, Kinney S. Reduction of hospital mortality and of preventable cardiac arrest and death on introduction of a pediatric medical emergency team. Pediatr Crit Care Med. 2009;10(3):306-312.

301
142. Brilli RJ, Gibson R, Luria JW, et al. Implementation of a medical emergency team in a large pediatric teaching hospital prevents respiratory and cardiopulmonary arrests outside the intensive care unit. Pediatr Crit Care Med. 2007;8(3):236-246. doi:10.1097/01.PCC.0000262947.72442.EA.
143. Sharek PJ, Parast LM, Leong K, et al. Effect of a rapid response team on hospital-wide mortality and code rates outside the ICU in a children’s hospital. JAMA. 2007;298(19):2267-2274.
144. Tucker KM, Brewer TL, Baker RB, Demeritt B, Vossmeyer MT. Prospective evaluation of a pediatric inpatient early warning scoring system. J Spec Pediatr Nurs. 2009;14(2):79-85. doi:10.1111/j.1744-6155.2008.00178.x.
145. Schünemann HJ, Schünemann AHJ, Oxman AD, et al. GRADE: Grading quality of evidence and strength of recommendations for diagnostic tests and strategies. BMJ. 2008;336(7653):1106-1110. doi:10.1136/bmj.39500.677199.AE.
146. Guyatt G, Oxman AD, Akl EA, et al. GRADE guidelines: 1. Introduction-GRADE evidence profiles and summary of findings tables. J Clin Epidemiol. 2011;64(4):383-394. doi:10.1016/j.jclinepi.2010.04.026.
147. Schunemann H, Brozek J, Oxman A. GRADE Handbook for Grading Quality of Evidence and Strength of Recommendation. Version 3.2. 2013. www.guidelinedevelopment.org/handbook.
148. Whiting PF, Rutjes AWS, Westwood ME, et al. QUADAS-2: a revised tool for the quality assessment of diagnostic accuracy studies. Ann Intern Med. 2011;155(8):529-536. doi:10.7326/0003-4819-155-8-201110180-00009.
149. Critical Appraisal Skills Programme CASP. 10 Questions to Help You Make Sense of Qualitative Research. Oxford: CASP; 1999:1-6.
150. GRADE ProGDT. http://gradepro.org. Accessed March 1, 2016.
151. Vasserstats. www.vassarstats.net. www.vassarstats.net. Accessed November 11, 2015.
152. Hanson CC, Randolph GD, Erickson JA, et al. A reduction in cardiac arrests and duration of clinical instability after implementation of a paediatric rapid response system. Postgrad Med J. 2010;86(1015):314-318.
153. Zenker P, Schlesinger A, Hauck M, et al. Implementation and impact of a rapid response team in a children's hospital. Jt Comm J Qual Patient Saf. 2007;33(7):418-425.
154. Parshuram CS, Hutchison J, Middaugh K. Development and initial validation of the Bedside Paediatric Early Warning System score. Crit Care. 2009;13(4):R135. doi:10.1186/cc7998.

302
155. Bonafide CP, Localio AR, Roberts KE, Nadkarni VM, Weirich CM, Keren R. Impact of rapid response system implementation on critical deterioration events in children. JAMA Pediatr. 2014;168(1):25-33. doi:10.1001/jamapediatrics.2013.3266.
156. Kaul M, Snethen J, Kelber ST, Zimmanck K, Maletta K, Meyer M. Implementation of the Bedside Paediatric Early Warning System (BedsidePEWS) for nurse identification of deteriorating patients. J Spec Pediatr Nurs. 2014;19(4):339-349. doi:10.1111/jspn.12092.
157. Gawronski O, Ciofi Degli Atti ML, Di Ciommo V, et al. Accuracy of Bedside Paediatric Early Warning System (BedsidePEWS) in a Pediatric Stem Cell Transplant Unit. J Pediatr Oncol Nurs. October 2015. doi:10.1177/1043454215600154.
158. McLellan MC, Gauvreau K, Connor JA. Validation of the Cardiac Children's Hospital Early Warning Score: an early warning scoring tool to prevent cardiopulmonary arrests in children with heart disease. Congenit Heart Dis. 2014;9(3):194-202.
159. Rahman ZH, Leahy NE, Sessler K, et al. A Pilot Study to Validate the Burn Center Pediatric Early Warning Score Tool in Clinical Practice. J Burn Care Res. 2016;37(3):160-165. doi:10.1097/BCR.0000000000000306.
160. Agulnik A, Forbes PW, Stenquist N, Rodriguez-Galindo C, Kleinman M. Validation of a Pediatric Early Warning Score in Hospitalized Pediatric Oncology and Hematopoietic Stem Cell Transplant Patients. Pediatr Crit Care Med. 2016;17(4):e146-e153. doi:10.1097/PCC.0000000000000662.
161. Mandell IM, Bynum F, Marshall L, Bart R, Gold JI, Rubin S. Pediatric Early Warning Score and unplanned readmission to the pediatric intensive care unit. J Crit Care. 2015;30(5):1090-1095. doi:10.1016/j.jcrc.2015.06.019.
162. Olson D, Davis NL, Milazi R, et al. Development of a severity of illness scoring system (inpatient triage, assessment and treatment) for resource-constrained hospitals in developing countries. Trop Med Int Health. 2013;18(7):871-878. doi:10.1111/tmi.12137.
163. Kinney S, Tibballs J, Johnston L, Duke T. Clinical Profile of Hospitalized Children Provided With Urgent Assistance From a Medical Emergency Team. Pediatrics. 2008;121(6):e1577-e1584.
164. Edwards ED, Mason BW, Oliver A, Powell CVE. Cohort study to test the predictability of the Melbourne criteria for activation of the medical emergency team. Arch Dis Child. 2011;96(2):174-179. doi:10.1136/adc.2010.187617.
165. Krmpotic K, Lobos A-T. Clinical profile of children requiring early unplanned admission to the PICU. Hospital pediatrics. 2013;3(3):212-218. doi:10.1542/hpeds.2012-0081.

303
166. Azzopardi P, Kinney S, Moulden A, Tibballs J. Attitudes and barriers to a Medical Emergency Team system at a tertiary paediatric hospital. Resuscitation. 2011;82(2):167-174.
167. Lobos A-T, Fernandes R, Ramsay T, McNally JD. Patient characteristics and disposition after pediatric medical emergency team (MET) activation: disposition depends on who activates the team. Hospital pediatrics. 2014;4(2):99-105. doi:10.1542/hpeds.2013-0032.
168. Bonafide CP, Roberts KE, Priestley MA, et al. Development of a pragmatic measure for evaluating and optimizing rapid response systems. Pediatrics. 2012;129(4):e874-e881.
169. Sefton G, McGrath C, Tume L, Lane S, Lisboa PJG, Carrol ED. What impact did a Paediatric Early Warning system have on emergency admissions to the paediatric intensive care unit? An observational cohort study. Intensive Crit Care Nurs. 2015;31(2):91-99.
170. Skaletzky SM, Raszynski A, Totapally BR. Validation of a modified pediatric early warning system score: a retrospective case-control study. Clin Pediatr (Phila). 2012;51(5):431-435. doi:10.1177/0009922811430342.
171. Roberts KE, Bonafide CP, Paine CW, et al. Barriers to calling for urgent assistance despite a comprehensive pediatric rapid response system. Am J Crit Care. 2014;23(3):223-229.
172. Fuijkschot J, Vernhout B, Lemson J, Draaisma JMT, Loeffen JLCM. Validation of a Paediatric Early Warning Score: first results and implications of usage. Eur J Pediatr. 2014;174(1):15-21. doi:10.1007/s00431-014-2357-8.
173. Ennis L. Paediatric early warning scores on a children's ward: a quality improvement initiative. Nursing children and young people. 2014;26(7):25-31.
174. Mason BW, Edwards ED, Oliver A, Powell CVE. Cohort study to test the predictability of the NHS Institute for Innovation and Improvement Paediatric Early Warning System. Arch Dis Child. February 2016. doi:10.1136/archdischild-2015-308465.
175. Fenix JB, Gillespie CW, Levin A, Dean N. Comparison of Pediatric Early Warning Score to Physician Opinion for Deteriorating Patients. Hospital pediatrics. 2015;5(9):474-479. doi:10.1542/hpeds.2014-0199.
176. Demmel KM, Williams L, Flesch L. Implementation of the pediatric early warning scoring system on a pediatric hematology/oncology unit. J Pediatr Oncol Nurs. 2010;27(4):229-240. doi:10.1177/1043454209358410.
177. Akre M, Finkelstein M, Erickson M, Liu M, Vanderbilt L, Billman G. Sensitivity of the pediatric early warning score to identify patient deterioration. Pediatrics. 2010;125(4):e763-e769. doi:10.1542/peds.2009-0338.

304
178. Henderson S. A paediatric early warning scoring system for a remote rural area. Nursing children and young people. 2012;24(6):23-26. doi:10.7748/ncyp2012.07.24.6.23.c9189.
179. Anwar-ul-Haque, Saleem AF, Zaidi S, Haider SR. Experience of pediatric rapid response team in a tertiary care hospital in Pakistan. Indian J Pediatr. 2010;77(3):273-276. doi:10.1007/s12098-010-0032-2.
180. Panesar R, Polikoff LA, Harris D, Mills B, Messina C, Parker MM. Characteristics and Outcomes of Pediatric Rapid Response Teams Before and After Mandatory Triggering by an Elevated Pediatric Early Warning System (PEWS) Score. Hospital pediatrics. 2014;4(3):135-140.
181. Kotsakis A, Lobos A-T, Parshuram CS, et al. Implementation of a Multicenter Rapid Response System in Pediatric Academic Hospitals Is Effective. Pediatrics. 2011;128(1):72-78.
182. Bell D, Mac A, Ochoa Y, Gordon M, Gregurich MA, Taylor T. The Texas Children’s Hospital Pediatric Advanced Warning Score as a Predictor of Clinical Deterioration in Hospitalized Infants and Children: A Modification of the PEWS Tool. J Pediatr Nurs. 2013;28(6):e2-e9.
183. Kukreti V, Gaiteiro R, Mohseni-Bod H. Implementation of a Pediatric Rapid Response Team: Experience of the Hospital for Sick Children in Toronto. Indian Pediatr. 2014;51(1):11-15.
184. Fleming S, Thompson M, Stevens R, et al. Normal ranges of heart rate and respiratory rate in children from birth to 18 years of age: a systematic review of observational studies. Lancet. 2011;377(9770):1011-1018.
185. Bonafide CP, Brady PW, Keren R, Conway PH, Marsolo K, Daymont C. Development of heart and respiratory rate percentile curves for hospitalized children. Pediatrics. 2013;131(4):–e1157.
186. Mandell IM, Bynum F, Marshall L, Bart R, Gold JI, Rubin S. Pediatric Early Warning Score and unplanned readmission to the pediatric intensive care unit. J Crit Care. 2015;30(5):1090-1095. doi:10.1016/j.jcrc.2015.06.019.
187. Tibballs J, Kinney S. Evaluation of a paediatric early warning tool--claims unsubstantiated. Intensive Crit Care Nurs. 2006;22(6):315–6–authorreply317.
188. Quinn N, Meade K. Audit of the Bristol Paediatric Early Warning Tool observation charts. Pediatr Crit Care Med. 2011;12(3 (Suppl)):A134.
189. Duncan HP, Frew E. Short-term health system costs of paediatric in-hospital acute life-threatening events including cardiac arrest. Resuscitation. 2009;80(5):529-534. doi:10.1016/j.resuscitation.2009.02.018.
190. Malmivaara A. Methodological considerations of the GRADE method. Ann Med. 2014;47(1):1-5.

305
191. Robb E, Jarman B, Suntharalingam G, Higgens C, Tennant R, Elcock K. Using care bundles to reduce in-hospital mortality: quantitative survey. BMJ. 2010;340:c1234.
192. Turner AM, Lim WS, Rodrigo C, Welham SA, Calvert JM. A care-bundles approach to improving standard of care in AECOPD admissions: results of a national project: Table 1. Thorax. 2015;70(10):992-994. doi:10.1136/thoraxjnl-2015-206833.
193. Jones M. NEWSDIG: The National Early Warning Score Development and Implementation Group. Clin Med. 2012;12(6):501-503. doi:10.7861/clinmedicine.12-6-501.
194. Advanced Life Support Group. Advanced Paediatric Life Support. (Advanced Life Support Group, Mackway-Jones K, Molyneux E, Phillips B, Wieteska S, eds.). Oxford, UK: Wiley-Blackthorn; 2011:21-35. doi:10.1002/9780470757369.ch4.
195. Draper E, Hobson R, Lamming C, et al. Annual Report of the Paediatric Intensive Care Audit Network. 2013:1-72.
196. Lakhanpaul M, MacFaul R, Werneke U, Armon K, Hemingway P, Stephenson T. An evidence-based guideline for children presenting with acute breathing difficulty. In: Vol 26. 2009:850-853. doi:10.1136/emj.2008.064279.
197. Sedgwick P. Standardising outcome measures using z scores. BMJ. 2014;349:g5878. doi:10.1136/bmj.g5878.
198. DeLong ER, DeLong DM, Clarke-Pearson DL. Comparing the areas under two or more correlated receiver operating characteristic curves: a nonparametric approach. Biometrics. 1988;44(3):837-845.
199. Sedgwick P. Multiple hypothesis testing and Bonferroni's correction. BMJ. 2014;349:g6284. doi:10.1136/bmj.g6284.
200. Sedgwick P. Pitfalls of statistical hypothesis testing: type I and type II errors. BMJ. 2014;349:g4287. doi:10.1136/bmj.g4287.
201. Smith GB, Prytherch DR, Schmidt PE, Featherstone PI. Review and performance evaluation of aggregate weighted “track and trigger” systems. Resuscitation. 2008;77(2):170-179.
202. Bonafide CP, Lin R, Zander M, et al. Association between exposure to nonactionable physiologic monitor alarms and response time in a children's hospital. J Hosp Med. 2015;10(6):345-351. doi:10.1002/jhm.2331.
203. Raymond TT, Bonafide CP, Praestgaard A, et al. Pediatric Medical Emergency Team Events and Outcomes: A Report of 3647 Events From the American Heart Association's Get With the Guidelines-Resuscitation Registry. Hospital pediatrics. 2016;6(2):57-64. doi:10.1542/hpeds.2015-0132.

306
204. Petersen JA, Mackel R, Antonsen K, Rasmussen LS. Serious adverse events in a hospital using early warning score - What went wrong? Resuscitation. 2014;85(12):1699-1703. doi:10.1016/j.resuscitation.2014.08.037.
205. Cahill H, Jones A, Herkes R, et al. Introduction of a new observation chart and education programme is associated with higher rates of vital-sign ascertainment in hospital wards. BMJ Qual Saf. 2011;20(9):791-796. doi:10.1136/bmjqs.2010.045096.
206. Preece MHW, Hill A, Horswill MS, Karamatic R, Hewett DG, Watson MO. Applying heuristic evaluation to observation chart design to improve the detection of patient deterioration. Appl Ergon. 2013;44(4):544-556. doi:10.1016/j.apergo.2012.11.003.
207. Nolan T, Berwick DM. All-or-none measurement raises the bar on performance. JAMA: The Journal of the American Medical Association. 2006;295(10):1168-1170. doi:10.1001/jama.295.10.1168.
208. Van Leuvan CH, Mitchell I. Missed opportunities? An observational study of vital sign measurements. Crit Care Resusc. 2008;10(2):111-115.
209. Cvetkovic M, Lutman D, Ramnarayan P, Pathan N, Inwald DP, Peters MJ. Timing of death in children referred for intensive care with severe sepsis: implications for interventional studies. Pediatr Crit Care Med. 2015;16(5):410-417. doi:10.1097/PCC.0000000000000385.
210. Shearer B, Marshall SD, Buist MD, et al. What stops hospital clinical staff from following protocols? An analysis of the incidence and factors behind the failure of bedside clinical staff to activate the rapid response system in a multi-campus Australian metropolitan healthcare service. BMJ Qual Saf. 2012;21(7):569-575. doi:10.1136/bmjqs-2011-000692.
211. Wheatley I. The nursing practice of taking level 1 patient observations. Intensive Crit Care Nurs. 2006;22(2):115-121. doi:10.1016/j.iccn.2005.08.003.
212. Tibballs J. Systems to prevent in-hospital cardiac arrest. Paediatr Child Health. 2011;21(7):322-328. doi:10.1016/j.paed.2011.03.007.
213. Elliott M, Coventry A. Critical care: the eight vital signs of patient monitoring. Br J Nurs. 2012;21(10):621-625. doi:10.12968/bjon.2012.21.10.621.
214. Fowler C, Rossiter C, Bigsby M, Hopwood N, Lee A, Dunston R. Working in partnership with parents: the experience and challenge of practice innovation in child and family health nursing. J Clin Nurs. 2012;21(21-22):3306-3314. doi:10.1111/j.1365-2702.2012.04270.x.
215. King S. Our story. Clin Ped Emerg Med. 2006;36(4):268-270. doi:10.1016/j.cpem.2006.10.001.

307
216. Hueckel RM, Mericle JM, Frush K, Martin PL, Champagne MT. Implementation of condition help: family teaching and evaluation of family understanding. J Nurs Care Qual. 2012;27(2):176-181. doi:10.1097/NCQ.0b013e318235bdec.
217. Brady PW, Zix J, Brilli R, et al. Developing and evaluating the success of a family activated medical emergency team: a quality improvement report. BMJ Qual Saf. 2015;24(3):203-211. doi:10.1136/bmjqs-2014-003001.
218. Tregay J, Brown KL, Crowe S, et al. Signs of deterioration in infants discharged home following congenital heart surgery in the first year of life: a qualitative study. Arch Dis Child. January 2016. doi:10.1136/archdischild-2014-308092.
219. Evans D, Hodgkinson B, Berry J. Vital signs in hospital patients: a systematic review. Int J Nurs Stud. 2001;38(6):643-650. doi:10.1016/s0020-7489(00)00119-x.
220. Bryman A, Burgess RE. Analysing Qualitative Research. London: Routledge; 1993.
221. Soanes L, Hargrave D, Smith L, Gibson F. What are the experiences of the child with a brain tumour and their parents? Eur J Oncol Nurs. 2009;13(4):255-261. doi:10.1016/j.ejon.2009.03.009.
222. Oulton K, Sell D, Kerry S, Gibson F. Individualizing hospital care for children and young people with learning disabilities: it's the little things that make the difference. J Pediatr Nurs. 2015;30(1):78-86. doi:10.1016/j.pedn.2014.10.006.
223. Livesley J, Long T. Children's experiences as hospital in-patients: Voice, competence and work. Messages for nursing from a critical ethnographic study. Int J Nurs Stud. 2013;50(10):1292-1303. doi:10.1016/j.ijnurstu.2012.12.005.
224. Carnevale FA, Macdonald ME, Bluebond-Langner M, McKeever P. Using participant observation in pediatric health care settings: ethical challenges and solutions. J Child Health Care. 2008;12(1):18-32. doi:10.1177/1367493507085616.
225. Franck LS, Sheikh A, Oulton K. What helps when it hurts: children's views on pain relief. Child Care Health Dev. 2008;34(4):430-438. doi:10.1111/j.1365-2214.2008.00812.x.
226. Horstman M, Bradding A. Helping children speak up in the health service. Eur J Oncol Nurs. 2002;6(2):75-84. doi:10.1054/ejon.2002.0185.
227. Horstman M, Aldiss S, Richardson A, Gibson F. Methodological issues when using the draw and write technique with children aged 6 to 12 years. Qualitative Health Research. 2008;18(7):1001-1011. doi:10.1177/1049732308318230.

308
228. Knighting K, Rowa-Dewar N, Malcolm C, Kearney N, Gibson F. Children's understanding of cancer and views on health-related behaviour: a ‘draw and write’ study. Child Care Health Dev. 2011;37(2):289-299. doi:10.1111/j.1365-2214.2010.01138.x.
229. Bradding A, Horstman M. Using the write and draw technique with children. Eur J Oncol Nurs. 1999;3(3):170-175. doi:10.1016/s1462-3889(99)80801-1.
230. Neill SJ, Cowley S, Williams C. The role of felt or enacted criticism in understanding parent's help seeking in acute childhood illness at home: a grounded theory study. Int J Nurs Stud. 2013;50(6):757-767. doi:10.1016/j.ijnurstu.2011.11.007.
231. Bray L, Callery P, Kirk S. A qualitative study of the pre-operative preparation of children, young people and their parents' for planned continence surgery: experiences and expectations. J Clin Nurs. 2012;21(13-14):1964-1973. doi:10.1111/j.1365-2702.2011.03996.x.
232. Khair K, Gibson F, Meerabeau L. 'Just an unfortunate coincidence‘: children’s understanding of haemophilia genetics and inheritance. Haemophilia. 2011;17(3):470-475. doi:10.1111/j.1365-2516.2010.02448.x.
233. Coyne I. Children's experiences of hospitalization. J Child Health Care. 2006;10(4):326-336. doi:10.1177/1367493506067884.
234. Coyne I, Kirwan L. Ascertaining children's wishes and feelings about hospital life. J Child Health Care. 2012;16(3):293-304. doi:10.1177/1367493512443905.
235. Sloper P, Lightfoot J. Involving disabled and chronically ill children and young people in health service development. Child Care Health Dev. 2003;29(1):15-20. doi:10.1046/j.1365-2214.2003.00315.x.
236. Doody O, Slevin E, Taggart L. Focus group interviews in nursing research: part 1. Br J Nurs. 2013;22(1):16-19. doi:10.12968/bjon.2013.22.1.16.
237. Plummer-D'Amato P. Focus Group methodology Part 1: considerations for Design. International Journal of Therapy and Rehabilitation. 2008;15(2):69-73. doi:10.12968/ijtr.2008.15.2.28189.
238. Dixon-Woods M, Agarwal S, Jones D, Young B, Sutton A. Synthesising qualitative and quantitative evidence: a review of possible methods. J Health Serv Res Policy. 2005;10(1):45-53. doi:10.1258/1355819052801804.
239. Srivastava A, Thomson SB. Framework analysis: a qualitative methodology for applied policy research. JOAAG. 2009;4(2):72-79.
240. Ward DJ, Furber C, Tierney S, Swallow V. Using Framework Analysis in nursing research: a worked example. J Adv Nurs. 2013;69(11):2423-2431. doi:10.1111/jan.12127.

309
241. Pope C, Ziebland S, Mays N. Qualitative research in health care. Analysing qualitative data. BMJ. 2000;320(7227):114-116. doi:10.1136/bmj.320.7227.114.
242. Ritchie J, Lewis J, Nicholls C, Ormston R. Qualitative Research Practice: a Guide for Social Science Students and Researchers. 2013.
243. Tuckett AG. Qualitative research sampling: the very real complexities. Nurse Res. 2004;12(1):47-61. doi:10.7748/nr2004.07.12.1.47.c5930.
244. Rabiee F. Focus-group interview and data analysis. Proc Nutr Soc. 2004;63(4):655-660. doi:10.1079/PNS2004399.
245. Swallow V, Lambert H, Santacroce S, Macfadyen A. Fathers and mothers developing skills in managing children's long-term medical conditions: how do their qualitative accounts compare? Child Care Health Dev. 2011;37(4):512-523. doi:10.1111/j.1365-2214.2011.01219.x.
246. Parkinson S. Framework analysis: a worked example of a study exploring young people’s experiences of depression. Qualitative Research in Psychology. 2016;13(2):109-129. doi:10.1080/14780887.2015.1119228.
247. Swallow V, Newton J, Van Lottum C. How to manage and display qualitative data using “Framework”and Microsoft® Excel. J Clin Nurs. 2003;12(4):610-612. doi:10.1046/j.1365-2702.2003.00728.x.
248. Fletcher T, Glasper AE, Prudhoe G, et al. Building the future: children's views on nurses and hospital care. Br J Nurs. 2011;20(1):39-45.
249. Macías M, Zornoza C, Rodriguez E, et al. Impact of Hospital Admission Care At a Pediatric Unit: A Qualitative Study. Pediatr Nurs. 2015;41(6):285-294.
250. Bonafide CP, Holmes JH, Nadkarni VM, Lin R, Landis JR, Keren R. Development of a score to predict clinical deterioration in hospitalized children. J Hosp Med. 2012;7(4):345-349. doi:10.1002/jhm.971.
251. Nix M. Combating alarm fatigue. Am J Nurs. 2015;115(2):16. doi:10.1097/01.NAJ.0000460671.80285.6b.
252. Karnik A, Bonafide CP. A framework for reducing alarm fatigue on pediatric inpatient units. Hospital pediatrics. 2015;5(3):160-163. doi:10.1542/hpeds.2014-0123.
253. Gazarian PK. Nurses' response to frequency and types of electrocardiography alarms in a non-critical care setting: a descriptive study. Int J Nurs Stud. 2014;51(2):190-197. doi:10.1016/j.ijnurstu.2013.05.014.
254. Doody O, Slevin E, Taggart L. Focus group interviews part 3: analysis. Br J Nurs. 2013;22(5):266-269. doi:10.12968/bjon.2013.22.5.266.

310
255. Holme H, Bhatt R, Koumettou M, Griffin MAS, Winckworth LC. Retrospective Evaluation of a New Neonatal Trigger Score. Pediatrics. 2013;131(3):e837-e842. doi:10.1542/peds.2012-0640.
256. Galhotra S, DeVita MA, Simmons RL, Dew MA, Members of the Medical Emergency Response Improvement Team (MERIT) Committee. Mature rapid response system and potentially avoidable cardiopulmonary arrests in hospital. Qual Saf Health Care. 2007;16(4):260-265. doi:10.1136/qshc.2007.022210.
257. Jones DA, Opdam H, Egi M, et al. Long-term effect of a Medical Emergency Team on mortality in a teaching hospital. Resuscitation. 2007;74(2):235-241. doi:10.1016/j.resuscitation.2006.12.007.
258. Jones D, Bellomo R, DeVita MA. Effectiveness of the Medical Emergency Team: the importance of dose. Crit Care. 2009;13(5):313. doi:10.1186/cc7996.
259. Parslow RC, Tasker RC, Draper ES, et al. Epidemiology of critically ill children in England and Wales: incidence, mortality, deprivation and ethnicity. Arch Dis Child. 2009;94(3):210-215. doi:10.1136/adc.2007.134403.
260. Goldstein B, Nadel S. The promise and potential of continuous improvement in the pediatric intensive care unit: the evolving story from the United Kingdom Paediatric Intensive Care Audit Network. J Pediatr. 2013;163(4):935-937. doi:10.1016/j.jpeds.2013.05.044.
261. Edwards ED, Fardy CH. Which children need to be transferred to the paediatric intensive care unit? Paediatr Child Health. 2007;17(7):295-299. doi:10.1016/j.paed.2007.04.002.
262. Coolin A, Erdfelder E, Bernstein DM, Thornton AE, Thornton WL. Explaining individual differences in cognitive processes underlying hindsight bias. Psychon Bull Rev. 2015;22(2):328-348. doi:10.3758/s13423-014-0691-5.
263. Pullinger R, Wilson S, Way R, et al. Implementing an electronic observation and early warning score chart in the emergency department: a feasibility study. Eur J Emerg Med. February 2016. doi:10.1097/MEJ.0000000000000371.
264. Umscheid CA, Betesh J, VanZandbergen C, et al. Development, implementation, and impact of an automated early warning and response system for sepsis. J Hosp Med. 2014;10(1):26-31. doi:10.1002/jhm.2259.
265. Evans RS, Kuttler KG, Simpson KJ, et al. Automated detection of physiologic deterioration in hospitalized patients. Journal of the American Medical Informatics Association. 2014;22(2):amiajnl–2014–002816–360. doi:10.1136/amiajnl-2014-002816.

311
266. Kollef MH, Chen Y, Heard K, et al. A randomized trial of real-time automated clinical deterioration alerts sent to a rapid response team. J Hosp Med. 2014;9(7):1-6. doi:10.1002/jhm.2193.
267. Bellomo R, Ackerman M, Bailey M, et al. A controlled trial of electronic automated advisory vital signs monitoring in general hospital wards. Crit Care Med. 2012;40(8):2349-2361. doi:10.1097/CCM.0b013e318255d9a0.
268. Sen AI, Morgan RW, Morris MC. Variability in the implementation of rapid response teams at academic American pediatric hospitals. J Pediatr. 2013;163(6):1772-1774. doi:10.1016/j.jpeds.2013.07.018.
269. Richards DA, Borglin G. Complex interventions and nursing: looking through a new lens at nursing research. Int J Nurs Stud. 2011;48(5):531-533. doi:10.1016/j.ijnurstu.2011.02.013.
270. Michie S, Fixsen D, Grimshaw JM, Eccles MP. Specifying and reporting complex behaviour change interventions: the need for a scientific method. Implement Sci. 2009;4(1):40. doi:10.1186/1748-5908-4-40.

312
Appendix 1 Modification of PTTS published age-ranges to facilitate comparative analysis
Paediatric Early Warning System
Name, first citation
Published age ranges
Age-ranges used in the comparative analysis
Bedside PEWS154 0 - 3 months
3 – 12 months
1-4 years
4-12 years
>12 years
0 - <3 months
3 - <12 months
1-4 years
> 4-12 years
>12 years
Bristol PEW tool42 <6 months
6-12 months
1-5 years
5-12 years
>12 years
<6 months
6-12 months
1-<5 years
5-12 years
>12 years
Cardiff and Vale PEWS137 <1 years
1-2 years
2-5 years
5-12 years
>12 years
<1 years
1-<2 years
2-<5 years
5-12 years
>12 years
Children’s Early Warning System
<1 year
1 – 4 years
5-11 years
≥ 12 years
<1 year
1 – 4 years
5-11 years
≥ 12 years
Children’s Early Warning Tool67
<1 years
1-4 years
5-11 years
>12 years
<1 years
1-4 years
5-11 years
≥12 years

313
Paediatric Early Warning System
Name, first citation
Published age ranges
Age-ranges used in the comparative analysis
ITAT162 <3 months
3-12months
1-4 years
4-12 years
>12 years
<3 months
3-12months
1-<4 years
4-12 years
>12 years
MET activation criteria I40 Term-3 months
4-12 months
1-4 years
5-12 y
>12 years
Term-3 months
4-<12 months
1-4 years
5-12 years
>12 years
MET activation criteria III141 Term-3 months
4-12 months
1-4 years
5-12 years
>12 years
Term-3 months
4-<12 months
1-4 years
5-12 years
>12 years
Modified Bristol PEWS169 <3 months
3-6 months
6-12 months
1-5 years
5-12 years
>12 years
<3 months
3-<6 months
6-12 months
1-<5 years
5-12 years
>12 years
Modified PEWS I170 Newborn – 3 months
3 months – 2 years
2 years- 10 years
> 10 years
0 – <3 months
3 months – <2 years
2 years- 10 years
> 10 years

314
Paediatric Early Warning System
Name, first citation
Published age ranges
Age-ranges used in the comparative analysis
Modified PEWS II79 <3 months
3-<12 months
1-<4 years
4-<12 years
>/=12 years
<3 months
3-12 months
1-<4 years
4-<12 years
≥12 years
Modified PEWS III172 0 - 3 months
3 – 12 months
1-4 years
4-12 years
>12 years
0 - <3 months
3 - <12 months
1-4 years
> 4-12 years
>12 years
NHSI PEWS173 0-11 months
1-4 years
5-12 years
13-18 years
0-11 months
1-4 years
5-12 years
13-18 years
PEW score III176 Neonate
1-11 months
1-2 years
3-4 years
5-7 years
8-11 years
12-15 years male
12-15 years female
>15 years male
>15 years female
Neonate
1-11 months
1-2 years
3-4 years
5-7 years
8-11 years
12-15 years male
12-15 years female
>15 years male
>15 years female

315
Paediatric Early Warning System
Name, first citation
Published age ranges
Age-ranges used in the comparative analysis
PEW score IV177 0 – 1 month
1-12 months
13 months – 3 years
4-6 years
7-12 years
13-19 years
0 – 1 month
<1-12 months
13 months – 3 years
4-6 years
7-12 years
13-19 years
PEW system score I138 <3 months
3-12 months
1-4 years
4-12 years
>12 years
<3 months
3-<12 months
1-<4 years
4-12 years
>12 years
PMET triggers181 Term-3 months
4-12 months
1-4 years
5-12 years
>12 years
Term-3 months
4-<12 months
1-4 years
5-12 years
>12 years
THCS MET calling criteria 183 Term-3 months
4-12 months
1-4 years
5-12 years
>12 years
Term-3 months
4-<12 months
1-4 years
5-12 years
>12 years
Key: Age-ranges that were modified are presented in italics

316
Appendix 2 Children's Early Warning Score (CEWS)
Appendix 2.1 Thresholds for CEWS
Age range Score
4 3 2 1 0 1 2 3 4
Heart rate <1 year
1 – 4 years
5-11 years
≥ 12 years
<60
<70
<60
<50
60-79
70-79
80-89
60-69
50-59
80-89
70-89
60-69
90-160
90-140
90-130
70-120
161-170
141-160
131-150
121-130
171-190
161-180
151-170
131-160
>190
>180
>170
161-190
>190
Respiratory
rate
<1 year
1 – 4 years
5-11 years
≥ 12 years
<10
<5
<5
<5
10-14
5-9
5-9
5-9
15-19
10-14
10-14
10-14
20-45
15-35
15-30
15-25
46-50
36-40
31-40
26-30
51-55
41-50
41-50
31-40
> 55
>50
>50
41-50
>50
Systolic
blood
pressure
<1 year
1 – 4 years
5-11 years
≥ 12 years
<40
<50
<50
<60
40-49
50-59
50-59
60-69
50-59
60-69
60-69
70-79
60-69
70-79
70-89
80-89
≥ 70
≥ 80
≥ 90
≥ 90
Temperature All <36.0 36.0-38.0 38.1-39.0 >39.0
Oxygen
saturation
All 94-100% 90-93% 85-89% <85%
AVPU All A V P U

317
Appendix 2.2 Example of CEWS chart for infant under one year

318
Appendix 3 The Children's Early Warning Score escalation algorithm
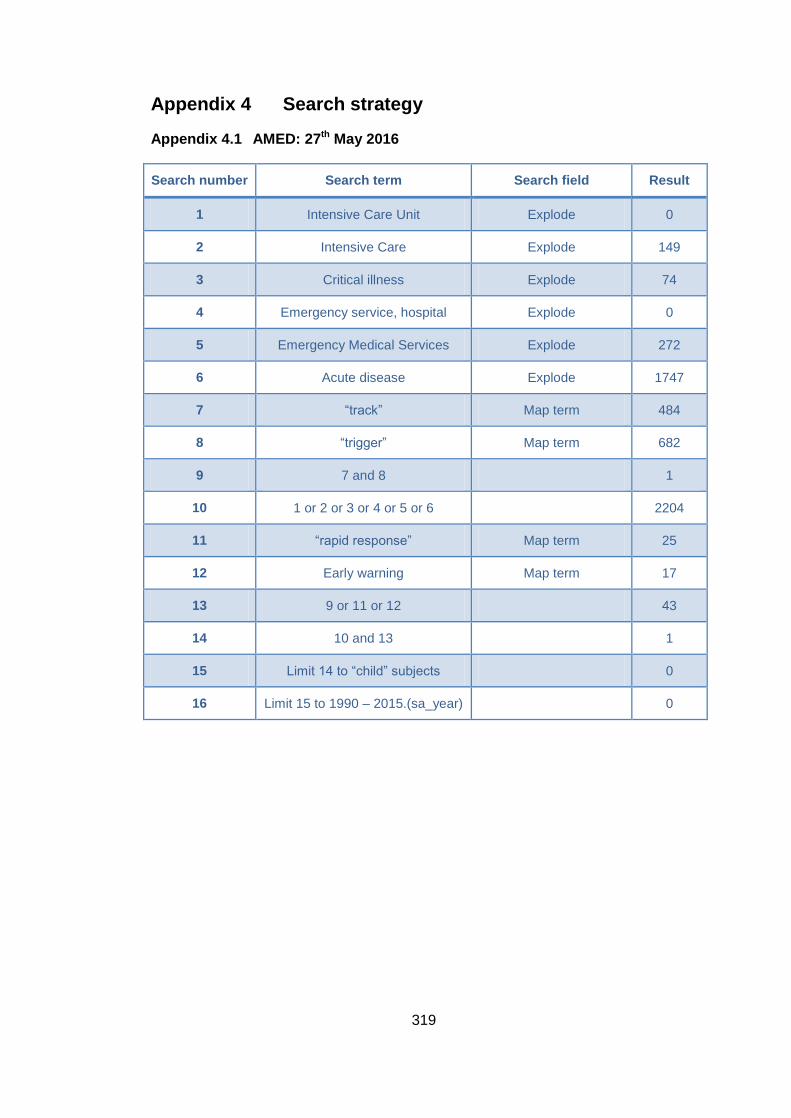
319
Appendix 4 Search strategy
Appendix 4.1 AMED: 27th May 2016
Search number Search term Search field Result
1 Intensive Care Unit Explode 0
2 Intensive Care Explode 149
3 Critical illness Explode 74
4 Emergency service, hospital Explode 0
5 Emergency Medical Services Explode 272
6 Acute disease Explode 1747
7 “track” Map term 484
8 “trigger” Map term 682
9 7 and 8 1
10 1 or 2 or 3 or 4 or 5 or 6 2204
11 “rapid response” Map term 25
12 Early warning Map term 17
13 9 or 11 or 12 43
14 10 and 13 1
15 Limit 14 to “child” subjects 0
16 Limit 15 to 1990 – 2015.(sa_year) 0

320
Appendix 4.2 CINAHL Plus: 27th May 2016
Search number
Search term Search field
Result
1 “early warning” Abstract 686
2 “rapid response’ Abstract 1206
3 medical emergency team” Abstract 224
4 “critical care outreach” Abstract 66
5 “track” Abstract 4873
6 “trigger” Abstract 6874
7 5 and 6 All 43
8 1 or 2 or 3 or 4 or 7, limit to all infant/child/adolescent and dates: 1990 - 2015
All 208
Appendix 4.3 Cochrane: 27th May 2016
Search number
Search term Search field Result
1 “early warning” Title, abstract, key words 146
2 “track and trigger” Title, abstract and key words 7
3 “rapid response” Title, abstract and key words 248
4 “critical care outreach” Title, abstract and key words 7
5 “medical emergency team” Title, abstract and key words 18
6 child Title, abstract and key words 87890
7 1 or 2 or 3 or 4 or 5 409
8 6 and 7, limit to 1990-present
61

321
Appendix 4.4 Embase search: 27th May 2016
Search number Search term Search field Result
1 Intensive Care Unit Explode 107477
2 Intensive Care Explode 544019
3 Critical illness Explode 23988
4 Emergency service, hospital Explode 77948
5 Emergency Medical Services Explode 77948
6 Acute disease Explode 94473
7 “track” Map term 45384
8 “trigger” Map term 86632
9 7 and 8 313
10 1 or 2 or 3 or 4 or 5 or 6 774492
11 “rapid response” Map term 6127
12 Early warning Map term 5166
13 9 or 11 or 12 11328
14 10 and 13 2407
15 Limit 14 to “child” subjects 210
16 Limit 15 to 1990 – 2015.(sa_year) 201

322
Appendix 4.5 OVID medline: 27th May 2016
Search number Search term Search field Result
1 Intensive Care Unit Explode 63429
2 Intensive Care Explode 47573
3 Critical illness Explode 20013
4 Emergency service, hospital Explode 56973
5 Emergency Medical Services Explode 107287
6 Acute disease Explode 195927
7 “track” Map term 33896
8 “trigger” Map term 65363
9 7 and 8 193
10 1 or 2 or 3 or 4 or 5 or 6 404346
11 “rapid response” Map term 4224
12 Early warning Map term 3683
13 9 or 11 or 12 7958
14 10 and 13 906
15 Limit 14 to “child” subjects 100
16 Limit 15 to 1990 – 2015.(sa_year) 94

323
Appendix 5 Quality assessment
Appendix 5.1 Diagnostic testing studies
STUDY RISK OF BIAS Overall
risk of
bias PATIENT
SELECTION INDEX TEST
REFERENCE STANDARD
FLOW/ TIMING
Agulnik160
Akre177
Duncan138
Edwards 2009137
Edwards 2011164
Fenix175
Fuijschot 2014172
Gawronski157
Haines158
Mandell186
Mason174
McLellan162
Olson154
Parsharum 2009116
Parsharum 2011121
Robson170
Skaletsky 2012144
Tucker59
Tume59
Key: Low Risk High Risk ? Unclear Risk

324
Appendix 5.2 Observational studies
Study RISK OF BIAS Overall Risk of
Bias Lack of allocation
concealment
Failure to develop and
apply eligibility criteria
Flawed measurement of exposure and outcome
Inadequate control of
confounding
Inadequate/ incomplete follow-up
Anwar-ul-Haque179
?_
Bell182
?_
Bonafide168
Bonafide155
Brady84
Brilli142
?_
Demmel176
?_ ?_ ?_
Ennis173
?_
Hanson152
?_
Henderson178
Hunt139
Kinney163
Kotsakis181
Krmpotic165 ?_
Lobos167
McKay67
McLellan 2014158

325
Study
RISK OF BIAS Overall Risk of
Bias Lack of allocation
concealment
Failure to develop and
apply eligibility criteria
Flawed measurement of exposure and outcome
Inadequate control of
confounding
Inadequate/ incomplete follow-up
Monaghan39
?_
Panesar180
Parsharam 2011119
Rahman159
Randhawa118
Sefton169
Sharek143
Skaletzky 200948
Tibballs 200540
Tibballs 2009141
Van Voorhis126
Watson115
?_
Zenker153
Key: Low Risk High Risk ? Unclear Risk

326
Appendix 5.3 Qualitative studies
Study Design
appropriate
Recruitment
strategy
appropriate?
Data
collection
appropriate?
Researcher-
participant
relationship
Ethical
issues
Rigorous
data
analysis?
Clear
findings
Value of
the
research
Overall
risk of
bias
Bonafide79
Brady 201483
Roberts 2014171 ?
Key: Low Risk ; High Risk ? Unclear Risk

327
Appendix 6 Research Ethics Committee permission

328

329

330

331
Appendix 7 Information leaflets
Appendix 7.1 Leaflet for children aged four to eight years
What is a study? A study is what you do when you want to learn more about something or find out something new.
What is this study about? Observations (obs) are when the nurse comes to take your temperature, blood pressure and other signs. We want to know what you think about having your obs done.
Why have you asked me to help? We are asking children on your ward who are more than 4 years old to help.
What will I have to do if I say yes? Sue will chat to you or you can draw a picture about having your obs done and tell her about it Sue will bring a tape recorder so she can remember what you said.
What happens then? After this, Sue will give the tapes to someone who will type out what you said. Sue will then write a report about what she’s found. We can send you a copy if you’d like one.
Are there any bad things about this study? We don’t think so. Talking about your obs might make you think about being ill and in hospital and that might make you sad or angry. You can tell your Mum and Dad or Sue if you want to stop.
Who will know what I draw or what I say? We would like to write about some of the things you say but we won’t use your name. Sue will keep your drawings, the tapes and writing locked away so no-one else can see or hear them.
Do I have to help? No, you don’t. It is up to you. If you say yes at first, but then want to stop, that’s fine. Sue won’t mind and neither will the doctors and nurses on the ward. It’s up to you.
Who should I ask if I have any questions? You can ask Sue or your Mum or Dad or the nurses of there is anything you don’t understand.
Hi,I’mSue
Starthere
Bob wants to tell you about the observations study. Follow his paws to go for a walk with him ………..
Let’s find out about the observations study
Hi,I’mBob
4-8yearoldinforma onsheet.Version1.0November2014.Vitalsignsstudy

332
Appendix 7.2 Leaflet for children/young people over the age of eight years

333
Appendix 7.3 Leaflet for families

334
Appendix 8 Consent forms
Appendix 8.1 Parent/guardian of chid/young person participants

335
Appendix 8.2 Assent form for children and young people

336
Appendix 8.3 Parent/guardian participants

337
Appendix 8.4 Focus group participants
Dear colleague
We are working on improving the care of the deteriorating child across GOSH and
your ward has agreed to participate as a pilot site. Vital sign monitoring is an
essential part of detecting deterioration in children but little is known about nurses
perceptions of vital sign monitoring and CEWS.
To increase our understanding and improvement our current system we would like
to invite you to participate in a focus group on vital sign monitoring and CEWS. The
focus group will be recorded and then transcribed and analysed. You will be
provided with a summary of the overall findings.
Your participation in this focus group is voluntary and you can withdraw from the
group at any time. By participating today, you are giving your consent for the
recording and analysis of this interview.
Your personal details will not be divulged and the findings will be anonomysed. The
details below will be used to assess any differences between registered/non-
registered staff and senior/junior staff.
Name__________________________ Band__________________
If Registered Nurse, years since qualifying________________________________
If Healthcare Assistant/Clinicians Assistant, years working as HCA/CA___________
Years working on Rainforest ward_____________________________________
I understand that this interview will be recorded and I give my consent.
Signature

338
Appendix 9 Interview and focus group question schedules
Appendix 9.1 Interview schedule: younger children

339
Appendix 9.2 Interview schedule: older children

340

341
Appendix 9.3 Interview schedule: parents

342

343
Appendix 9.4 Focus group questions:
1. Do you find CEWS helpful in detecting clinical deterioration? Why?
2. Tell me about a time when you found CEWS useful?
3. Tell me about a time when you found CEWS unhelpful? Are there any
situations where you think CEWs may have had a negative impact when a
child was deteriorating?
4. Do you always act on elevated CEWs scores? Why/why not?
5. Tell me about the role parents have in detecting deterioration
6. How you decide how frequently to take observations? What influences this?
7. How do you decide if vital sign observations are ‘acceptable’? What do you
do if obs are ‘not acceptable’?
8. What would improve our current CEWS?

344
Appendix 10 Framework for qualitative analysis
Heading Category Sub-category
1. The Value and Limitations of vital sign observations and PTTS
1.1 Overall Benefits and Limitations 1.1.1 The perceived purpose of VS and PTTS
1.1.2 The perceived benefits/positive aspects of VS and PTTS
1.2 Disadvantages and limitations 1.2.1 The perceived negative/disadvantages aspects of VS and PTTS
1.2.2 The perceived limitations of VS and PTTS
1.2.3 Do VS and PTTS have a negative/harmful impact?
1.3 Suggestions for improvement 1.3.1 Suggestions for improvement
2. Recording and using vital sign observations and PTTS in clinical practice
2.1 Taking and documenting PTTS 2.1.1 Taking VS and PTTS
2.1.2 Documentation of VS, PTTS and unexpected events
2.2 Acting on PTTS 2.2.1 Dealing with abnormal VS and high PTTS scores
2.2.2 Communicating about VS and PTTS
2.2.3 Modifying PTTS to individual children
2.3 Training, support and experience 2.3.1 Training, support and experience
3. Making decisions 3.1 Making decisions on recording 3.1.1 Making decisions on recording VS and PTTS
3.2 Making decisions on escalating 3.2.1 Making the decisions to act on VS and PTTS
3.2.2 Managing children with deranged physiology/persistently high PTTS
4. Experiences, impact and consequences of VS monitoring and PTTS
4.1 The experiences of VS monitoring and PTTS
4.1.1 The experiences of VS monitoring and PTTS for nurses
4.1.2 The experiences of VS monitoring and PTTS for other healthcare professionals
4.1.3 The experiences of VS monitoring and PTTS for children
4.1.4 The experiences of VS monitoring and PTTS for families/carers
4.2 Perceived impact and consequences of vital sign and PTTS monitoring
4.2.1 The perceived impact and consequences for nurses
4.2.2 The perceived impact and consequences for other healthcare professionals
4.2.3 The perceived impact and consequences of for children
4.2.4 The perceived impact and consequences for families/carers
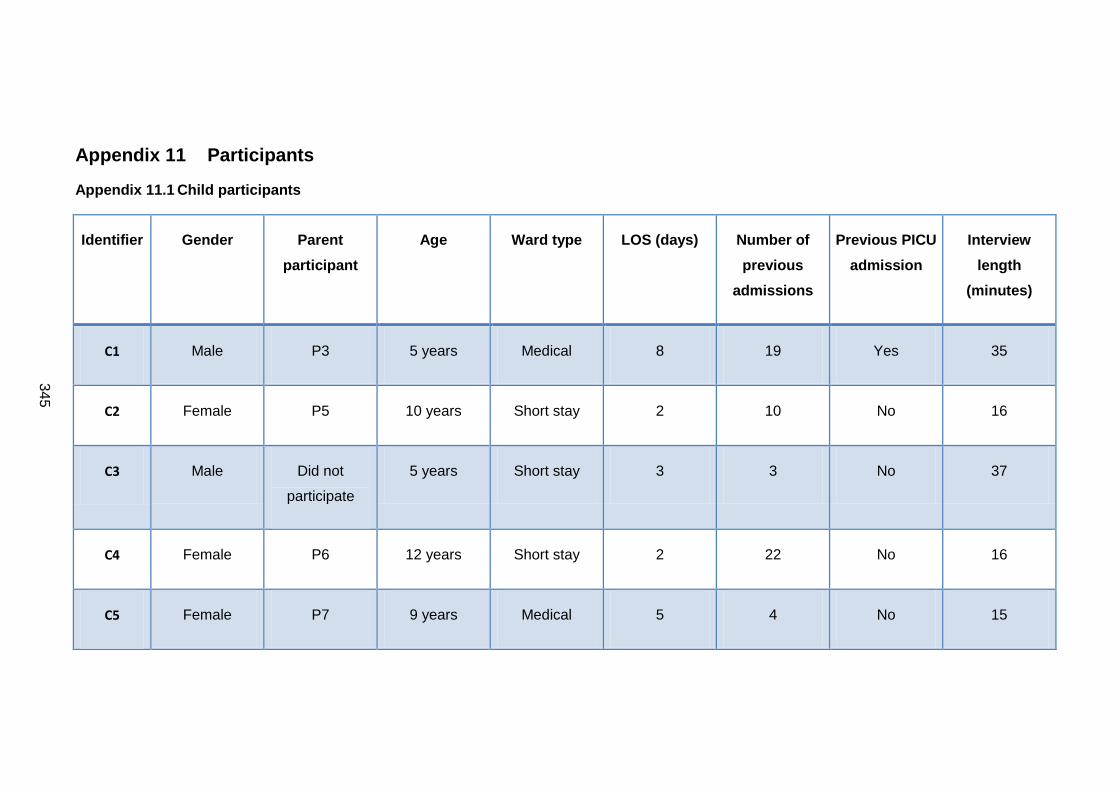
345
Appendix 11 Participants
Appendix 11.1 Child participants
Identifier Gender Parent
participant
Age Ward type LOS (days) Number of
previous
admissions
Previous PICU
admission
Interview
length
(minutes)
C1 Male P3 5 years Medical 8 19 Yes 35
C2 Female P5 10 years Short stay 2 10 No 16
C3 Male Did not
participate
5 years Short stay 3 3 No 37
C4 Female P6 12 years Short stay 2 22 No 16
C5 Female P7 9 years Medical 5 4 No 15

346
Identifier Gender Parent
participant
Age Ward type LOS (days) Number of
previous
admissions
Previous PICU
admission
Interview
length
(minutes)
C6 Male P9 11 years Medical 5 10 Yes 34
C7 Female P12 7 years Medical 24 7 No 85
C8 Male P13 7 years Surgical 4 0 No 16
C9 Male P14 5 years Surgical 8 2 No 18
C10 Female P15 14 years Surgical 6 6 Yes 20

347
Appendix 11.2 Characteristics of parent/guardian participants
Identifier Relationship to
child
Ward type Age of child Gender of child LOS (days) Number of
previous
admissions
Previous PICU
admission
Interview
length
(minutes)
P1 Mother Medical 14 years Female 127 5 No 33
P2 Mother Medical 5 years Male 12 28 Yes 17
P3 Mother Medical 5 years Male 8 19 Yes 35
P4 Mother Short stay 5 years Female 3 3 No 6
P5 Mother Short stay 10 years Male 2 10 No 16
P6 Father Short stay 12 years Male 2 22 No 16

348
Identifier Relationship to
child
Ward type Age of child Gender of child LOS (days) Number of
previous
admissions
Previous PICU
admission
Interview
length
(minutes)
P7 Female
guardian
Surgical 11 years Male 18 1 No 15
P8 Mother Medical 9 years Female 5 4 No 43
P9 Mother Medical 11 years Male 6 10 Yes 34
P10 Mother Surgical 2 months Female 24 0 Yes 21
P11 Father Surgical 2 months Female 24 0 Yes 21
P12 Mother Medical 7 years Female 24 7 No 85

349
Identifier Relationship to
child
Ward type Age of child Gender of child LOS (days) Number of
previous
admissions
Previous PICU
admission
Interview
length
(minutes)
P13 Mother Surgical 7 years Male 4 4 No 16
P14 Mother Surgical 5 years Male 8 8 No 18
P15 Mother Surgical 14 years Female 6 6 Yes 20
Length of stay is the number of days in hospital before the interview/draw and write session.

350
Appendix 11.3 Focus group participants
Ward type Grade of
staff
Number of
participants
Number of
male
participants
Interview
length
(minutes)
FG1 Surgical Junior 4 1 42
FG2 Surgical Senior 4 0 56
FG3 Surgical Senior 7 0 46
FG4 Medical Junior 8 1 38
FG5 Medical Senior 5 1 32
FG6 Short stay Junior 8 0 24

351
Appendix 12 Publications, presentations and abstracts
Appendix 12.1 Publications
Chapman SM, Grocott MPW, Franck LS. Systematic review of paediatric alert
criteria for identifying hospitalised children at risk of critical deterioration. Intensive
Care Med 2010;36:600–11. doi:10.1007/s00134-009-1715-x.
Chapman SM, Wray J, Oulton K, Peters MJ. Systematic review of paediatric track
and trigger systems for hospitalised children. Resuscitation. 109:87-109 December
2016. doi:10.1016/j.resuscitation.2016.07.230.
Chapman SM, Wray J, Oulton K, Pagel C, Ray, S, Peters MJ. “The Score Matters”:
Wide Variations in Predictive Performance of 18 Paediatric Track and Trigger
Systems. Archives of Disease in Childhood (accepted for publication 25th January
2017).
Appendix 12.2 Presentations
6th Congress of the European Academy of Paediatric Societies – EAPS 2016
Geneva, Switzerland | October 21-25, 2016
S Chapman, J Wray, K. Oulton, C. Pagel, S. Ray, M. Peters. Evidence-based vital
signs do not improve predictive performance of effective paediatric track and trigger
tools. Session 21: Before and after PICU: Oral presentation.