Industry Track - Educational Data Mining
31
Industry Track
-
Upload
khangminh22 -
Category
Documents
-
view
3 -
download
0
Transcript of Industry Track - Educational Data Mining

Industry Track

Dropout Prediction in Home Care Training
Wenjun Zeng∗
University of MinnesotaMinneapolis, [email protected]
Si-Chi ChinSEIU 775 Benefits Group
Seattle, [email protected]
Brenda ZeimetSEIU 775 Benefits Group
Seattle, Washingtonbrenda.zeimet
@myseiubenefits.orgRui Kuang
University of MinnesotaMinneapolis, [email protected]
Chih-Lin ChiUniversity of MinnesotaMinneapolis, Minnesota
ABSTRACTIn Washington state (WA), SEIU 775 Benefits Group pro-vides basic home care training to new students who willdeliver care and support to older adults and people withdisabilities, helping them with self-care and everyday tasks.Should a student fail to complete their required training, itleads to a break in service, which can result in costly negativehealth outcomes (e.g. emergency rooms and hospitalization)for their clients [1].
In this paper we describe the results of utilizing machinelearning predictive models to accurately identify studentswho exhibit a higher risk of drop out in two areas: (1)dropping out before attending first class[first class atten-dance]; and (2) dropping out before completing the train-ing[training completion]. Our experimental results showthat AdaBoost algorithm gives a useful result with ROCAUC
= 0.627±0.013 and Precision at 10 = 0.73±0.12 for first classattendance and ROCAUC = 0.680±0.024 and Precision at10 = 0.67±0.20 for training completion without relying onadditional assessment data about students. In addition, wedemonstrate the use case for constructing larger decisiontrees to help front-line training operations staff identify in-tervention strategies that create the most impact in prevent-ing dropout.
1. INTRODUCTIONBy 2050, the number of Americans needing long-term homecare services and supports will double[2], implying increaseddemand for workers providing home care services (called“personal care aides”nationally and“home care aides (HCA)”in WA). This will also increase the demand of training for
∗This work has been done during the author’s internship atSEIU 775 Benefits Group
HCAs to provide quality care to their clients. In WA, shouldan individual wish to work as a home care aide, they are re-quired to complete a 75 hour, 2 week, Basic Training (BT)course within 120 days of their hire date. In WA, an HCAcan begin providing care before completing their training aslong as their deadline has not passed. In the event that anHCA fails to complete BT, she or he will fall out of com-pliance, leading to the HCAs termination and a break inservice for the clients served by the HCA [1].
Educators have frequently used assessment tools that mea-sure cognitive skills, engagement, self-management and so-cial support to accurately predict student successes. How-ever, conducting assessments at scale is time consuming forboth students and instructors. In the absence of a validatedassessment specific to HCA profession, there is great interestin utilizing existing learning data to isolate the strongest pre-dictors of dropout through the predictive power of machinelearning algorithms. Our research questions are two-folds:1) Can machine learning algorithms successfully predict stu-dent dropouts? 2) What are the risk factors related to earlydropout from basic home care training?
Many studies[3] have been conducted to explain academicperformance and to predict the success or failure across a va-riety of students in a wide-range of educational settings. Ma-chine learning algorithms have been successful in predictinggraduation[4], course participation[5], and other academicoutcomes[6].
However current research has not fully investigated the areaof using machine learning algorithms for on-the-job training,healthcare training programs, or adult education in general.In this paper, we focus on the dropout problems in home caretraining using machine learning methods. We were grantedthe latitude to be creative with our feature engineering, uti-lizing readily available data to meet business requirements.
2. EXPERIMENTAL SETUPFigure 1 illustrates the four sequential time-based milestonesin home care training: 1) Complete Orientation & Safety(O&S); 2) Register for a 70-hours BT course; 3) Attend thefirst class in this course; 4) Complete the 70-hour training.At the moment that a prospective home care aide enters thesystem, a ‘Tracking Date’ is assigned to their O&S training
Proceedings of the 10th International Conference on Educational Data Mining 442

Figure 1: Predicting Targets and Features
requirement, signifying the start of their training journey.On average a student will register for his or her first classapproximately 19 days after completing O&S and will actu-ally attend his or her class about 64 days after entering oursystem.
Predicting dropouts at different stages has the potential toallow for timely interventions that may improve a students’learning experience. This paper focuses on two stages: First,Class Attendance: Will the newly hired students show upfor their first scheduled class? We attempt to predict thisat the point of registration. Second, Training Comple-tion: Will a student complete all 70 hours of their requiredtraining? We attempt to predict this at the point that astudent attends his or her first class. As shown in Figure 1,some basic but sometimes incomplete student demographicdata are captured at the time a student is assigned to takeO&S training. As a student progresses in his or her trainingjourney, we are able to extract more features about learningbehavior, such as the amount of time a student needed tocomplete O&S or the number of days it took a student toregister for class. In addition, we leveraged external gov-ernment census data to augment the existing feature set byadding income and population data of the student’s countyof residence.
We built four models – Logistic Regression, SVM, RandomForests, and AdaBoost – for the two predicting targets de-scribed above. Our final data set contained 5,303 recordsfor predicting first class attendance and 5,182 records forpredicting training completion. For both predicting targets,we reserved 2,000 records for testing data set and the re-maining were utilized as the training data set. We collected22 features to predict class completion and used the first19 features to predict first class attendance(the last three
features are not available at our prediction point of regis-tration). Table 1 summarizes the features we used for themodel.
3. EXPERIMENT RESULTS3.1 Prediction Performance: ROC-AUC and
Precision at kWe use area under curve of the receiver operating charac-teristic (ROCAUC) and precision at k (Prec@k) to evalu-ate prediction quality of each machine learning technique.ROCAUC was used as a standard evaluation metric to mea-sure the quality of overall ranking results. Prec@k was usedto determine the quality of predicting the top k outcomes, inour case, the top k students of highest drop out risk at eachstage. It is assuming that, with limited resources, front-linestaff could only outreach to k number of students per week toprovide support and assistance to HCAs struggling to meettheir individual learning needs. Therefore, it is essential toaccurately predict the first k students exhibiting the highestdropout risk.
Figures 2a and 2b depict the prediction results of our 4 mod-els articulated by precision at k. The AdaBoost model givesthe best prediction result for both targets. For predictingfirst class attendance, AdaBoost with tree number = 2000has the highest precision at 10 which equals to 0.73 and Ad-aBoost with tree number = 1000 gives the best precision at20, 50, 100 which equals to 0.67, 0.56 and 0.46 respectively.For predicting BT completion, AdaBoost with tree number= 100 gives the best precision at 10, 20, 50, 100, whichequals to 0.67, 0.62, 0.53, 0.44 respectively. As there aremore students who did not attend the first class (385/2000
Proceedings of the 10th International Conference on Educational Data Mining 443

Table 1: Features used for class attendance and training completion prediction
Feature Type Remarks
provider type Nominal Individual provider (paid by the Department of Social and Health Services) oragency provider (paid by private home care agencies). {IP, AP}
student ethnicity Nominal student ethnicity. {Asian Indian, White etc}student language Nominal student language. {English, Russian, etc}student age Numerical student age. {Mean = 39, Median = 37}os month Numerical Month of O&S tracking date. {1,2,· · · ,12}os day Numerical Day of O&S tracking date {1,2,· · · , 31}class language containEnglish Boolean Whether the student’s profile includes an English language selection. {Yes, No}class language containOther Boolean Whether the student’s profile includes a language other than English.{Yes, No}county Nominal student’s county of residence {King County, Pierce County,etc}county income mean Numerical The mean income(in USD) for the county.{mean = 67011, median = 65498}county income median Numerical The medium income(in USD) for the county. {mean = 55468, median = 54727}county population Numerical The population for the county. {mean = 28672, median = 29582}os transferredhours Numerical Transferred hours for O&S. {mean = 0.9965, median = 0}duration to oscomplete numerical Duration(in number of days) beween O&S completion date and O&S tracking
date.{mean = 0.842, median = 1.500}first module Nominal The module of first registered class {Module 1, Module 2,..., Module 20, etc}duration to class Numerical Duration(in number of days) between class date and O&S tracking
date.{mean=72.05, median = 67.42}first class interpreter Boolean Whether the student articulated a need for interpreter services.{Yes,No}duration to class registration Numerical duration(in number of days) between class registration date and O&S tracking
date.{mean = 32.647, median = 19.784}num terminations Numerical Number of terminating employment relationships before attending first
class.{0,· · · ,7}student noshow count Numerical Number of class absences before attending the first class. {0,· · · ,58}student withdraw count Numerical Number of class withdrawals before attending the first class. {0,· · · ,60}num class attendee Numerical Number of attendees in the first class. {3,· · · ,33}
(a) Precision at k for first class attendance (b) Precision at k for training completion
Figure 2: Precision at k results
Proceedings of the 10th International Conference on Educational Data Mining 444

ROCAUC
Model 1st Class Attendance Training CompletionSVM(radial) 0.578±0.012 0.600±0.011LR 0.612±0.020 0.634±0.018AD(1000) 0.627±0.013 0.673±0.025AD(2000) 0.626±0.015 0.680±0.024RF(2000) 0.608±0.012 0.672±0.023
Table 2: ROCAUC results
= 19.25%) than the number of students who did not com-plete the training (229/2000 = 11.45%), it was slightly easierto predict top k students who were likely to not show up fortheir first class and explains the higher Prec@k for predict-ing class attendance.
Table 2 shows ROCAUC results. For predicting first classattendance, AdaBoost with tree number = 1000 gives thebest ROCAUC at 0.627. For predicting BT completion, Ad-aBoost with tree number = 2000 gives the best ROCAUC at0.68. Low ROCAUC indicates the need for stronger inputsand feature attributes to the models. Although 19 out of22 attributes were shared in both predicting problems, at-tributes such as duration to class registration, duration toclass and first module were more useful in predicting BTcompletion than in predicting class attendance. This ex-plains the increased ROCAUC results for BT completion pre-dictions. It provides an opportunity to understand why stu-dents choose to not attend their registered training classesand to collect more data at this early stage of the trainingjourney.
3.2 Risk Profile AnalysisIn this section, we illustrate how we use insights derivedfrom decision tree modeling to profile students with differ-ent dropout rates, providing a tool to isolate target segmentsof high risk students so the business can take measures thatcan decrease dropout rate. Decision tree modeling enable usto acquire foundational knowledge necessary to develop ed-ucated hypotheses for customized interventions to supportstudents with different risk profiles. Variable importanceanalysis using Random Forest also enhances our understand-ing of what factors influence training dropout and assists inour predictions.
At the root note of Figure 3a, the average first class atten-dance rate is almost 81% among 5,303 students. That is,the overall dropout rate is 19%. For students who didn’tenroll in either module 1 or 2 as their first class1, theydemonstrated a significantly higher risk of not attending thetraining – 54% will not show up for their first registeredclass. Using the same decision tree, we are also able to inferthat both county and age are important factors. For exam-ple, students who do not reside in certain counties 2 aboveand are younger than 49 are less likely to attend the first
1Currently, students are allowed to attend classes out of se-quence in order to complete their training before the manda-tory deadline.2Counties include: Benton, Clark, Cowlitz, Douglas, GraysHoarbor, Lewis, Mason, Skagit, Stevens, Walla Walla andWhatcom
class compared to those who are older than 49. Youngerstudents, English speaking students and students who takelonger to complete O&S exhibit higher risk of not attend-ing their first class. The variable importance from randomforest shows that duration to class registration, duration toclass are other most important indicators. The larger thetime gaps, the higher the dropout rates are.
Figure 3b gives a decision tree for training completion. Fromthe display, we can see if students have two or more class ab-sence records before actually attending the first class, theircompletion rate decreases to 60%, which is much lower thanthe average completion rate of 89%. Among these students,if their first class is not Module 1, then the likelihood thatthe student will complete training drops to 27%. It showsduration to class registration and class location (i.e county)play important role for training completion. Duration toclass and student age are also shown as important indica-tors using random forest variable importance analysis. Inaddtion, knowing the count of class absence record and firstclass module gives a much better understanding about theBT completion. Figure 3b shows that even for students whohad one or zero class absences. If they register for the classtoo late (in our case this amounts to more than 52 days afterbeing hired), then the probability of completing the trainingis even lower.
4. RELATED WORKPrior studies([3],[7],[8]) have been conducted to explain aca-demic performance and to predict the success or failure acrossa variety of students in a wide-range of educational settings.These studies focused heavily on the explanatory factorsassociated with a student’s learning behavior and trainingjourney and which of those may cause separation betweenstudent types. Machine learning algorithms have been suc-cessful in high school and college education settings, mosthelpful in predicting graduation[4], course participation[5],and other academic outcomes[6]. These algorithms also pro-vide great value to the student success[9].
Lakkaraju et al.[6] used several classification models to iden-tity students at risk of adverse academic outcomes and usedprecision at top K and recall at top K to predict risk early.The authors compared ROC curves for two cohorts for algo-rithms Random Forest, AdaBoost, Linear Regression, SVMand Decision Tree. The authors demonstrated that Ran-dom Forests outperformed all other methods. Aguiar etal.[10] selected and prioritized students who are at risk ofnot graduating high school on time by prediction the riskfor each grade level and reported precision at top 10%, ac-curacy, and MAE for ordinal prediction of time to off-track.
Proceedings of the 10th International Conference on Educational Data Mining 445

Johnson et al.[11] used d-year-ahead predictive model to pre-dict on-time graduation for different grade level. Vihavainenet al.[5] found a higher likelihood of failing their mathemat-ics course could be detected in an early stage using Bayesiannetwork. Radcliffe et al.[4] used logit probability model andparametric survival models to found that demographic info,academic preparation and first-term academic performancehave a strong impact to graduation. Dekker et al.[12] gaveexperimental results which showed decision trees gave a highaccuracy for predicting student success and improved pre-diction accuracy using cost-sensitive learning.
Other prior studies have highlighted some important indi-cators that influence students’ performance like a student’sage and absence rates[6]. Based on these features, EarlyWarning Indicator (EWI) systems are rapidly being builtand deployed using machine learning algorithms[6]. Simi-lar to other research in Educational Data Mining (EDM),we use precision at k to measure the prediction result([6],[10], [13]) and, like in traditional education systems, our mo-tive is to most effectively and efficiently target our limitedresources to assist and suppor students. Typically, ensem-ble models outperformed individual models[7] and this heldtrue in our case as well. While random forest has proven tobe an extremely useful and powerful machine learning tech-nique in educational research[11], our results indicated thatAdaBoost outperformed random forest.
5. CONCLUSION AND FUTURE WORKIn this study, we demonstrated preliminary results for pre-dicting home care student training dropout from a large,heterogeneous dataset containing student demographics andengineered features extracted from training patterns. Pre-dicting dropout at varying stages of an adult learner’s train-ing journey yielded promising results from a skewed datasetof over 5,303 students with AdaBoost (2,000 trees) providingthe strongest predictions (prec@10 = 0.73 and ROCAUC =0.625. Prior history of class absence and time effects (du-ration to registration, duration to first class) were amongthe strongest individual predictors of dropout, as were classmodule sequence, county, and student age. The resultsdemonstrate that applying machine learning techniques todemographic data and learning behavior data (e.g. dura-tion to registration, duration to first class) can achieve ade-quate prediction quality in predicting the top k highest riskstudents out of a pool of newly hired HCAs. This enablesefficient use of limited capacity and resources to supportstudents of greatest need. Insights revealed in this studyinspired training operation staff to explore alternatives, in-cluding encouraging newly hired HCAs to register for train-ing early and strongly recommend proper class sequence tosupport students success in their training.
Future work will investigate collecting more information aboutstudents, such as their motivations, propensity for self-efficacy,and life circumstances to determine if there are other factorsat play on a personal level that my uncover additional fea-tures that can contribute to our target predictions aroundtraining dropout.
6. REFERENCES[1] Charissa Raynor. Innovations in training and
promoting the direct care workforce. Public Policy &
Aging Report, 24(2):70–72, 2014.
[2] Colombo Francesca, Llena-Nozal Ana, Mercier Jerome,and Tjadens Frits. OECD Health Policy Studies HelpWanted? Providing and Paying for Long-Term Care:Providing and Paying for Long-Term Care, volume2011. OECD Publishing, 2011.
[3] S Kotsiantis, Christos Pierrakeas, and P Pintelas.Predicting students’performance in distance learningusing machine learning techniques. Applied ArtificialIntelligence, 18(5):411–426, 2004.
[4] P Radcliffe, R Huesman, and John Kellogg. Modelingthe incidence and timing of student attrition: Asurvival analysis approach to retention analysis. Inannual meeting of the Association for InstitutionalResearch in the Upper Midwest (AIRUM), 2006.
[5] Arto Vihavainen, Matti Luukkainen, and JaakkoKurhila. Using students’ programming behavior topredict success in an introductory mathematicscourse. In Educational Data Mining 2013, 2013.
[6] Himabindu Lakkaraju, Everaldo Aguiar, Carl Shan,David Miller, Nasir Bhanpuri, Rayid Ghani, andKecia L Addison. A machine learning framework toidentify students at risk of adverse academicoutcomes. In Proceedings of the 21th ACM SIGKDDInternational Conference on Knowledge Discovery andData Mining, pages 1909–1918. ACM, 2015.
[7] Dursun Delen. A comparative analysis of machinelearning techniques for student retention management.Decision Support Systems, 49(4):498–506, 2010.
[8] S Kotsiantis, Kiriakos Patriarcheas, and M Xenos. Acombinational incremental ensemble of classifiers as atechnique for predicting students’ performance indistance education. Knowledge-Based Systems,23(6):529–535, 2010.
[9] Cristobal Romero and Sebastian Ventura. Educationaldata mining: a review of the state of the art. IEEETransactions on Systems, Man, and Cybernetics, PartC (Applications and Reviews), 40(6):601–618, 2010.
[10] Everaldo Aguiar, Himabindu Lakkaraju, NasirBhanpuri, David Miller, Ben Yuhas, and Kecia LAddison. Who, when, and why: A machine learningapproach to prioritizing students at risk of notgraduating high school on time. In Proceedings of theFifth International Conference on Learning AnalyticsAnd Knowledge, pages 93–102. ACM, 2015.
[11] Reid A Johnson, Ruobin Gong, SiobhanGreatorex-Voith, Anushka Anand, and Alan Fritzler.A data-driven framework for identifying high schoolstudents at risk of not graduating on time.
[12] Gerben Dekker, Mykola Pechenizkiy, and JanVleeshouwers. Predicting students drop out: A casestudy. In Educational Data Mining 2009, 2009.
[13] Everaldo Aguiar, G Alex Ambrose, Nitesh V Chawla,Victoria Goodrich, and Jay Brockman. Engagement vsperformance: Using electronic portfolios to predictfirst semester engineering student persistence. Journalof Learning Analytics, 1(3):7–33, 2014.
Proceedings of the 10th International Conference on Educational Data Mining 446

|first_module=cdefhijklmnoqrstu
first_module=cdfhijklmq
county=abcfgjkl
county=bcghiklmpqstv
student_age< 49.02
0.8075n=5303
0.4583n=192
0.254n=63
0.5581n=129
0.3404n=47
0.6829n=82
0.8206n=5111
0.7982n=3672
0.7778n=2565
0.8455n=1107
0.8777n=1439
(a) First Attend
(b) Training Completion
Figure 3: Decision Trees
Proceedings of the 10th International Conference on Educational Data Mining 447

Few hundred parameters outperform few hundredthousand?
Amar Lalwanifuntoot
2nd floor, Sancia House,14th Cross,1st Stage Domlur,
Bengaluru 560071, [email protected]
Sweety Agrawalfuntoot
2nd floor, Sancia House,14th Cross, 1st Stage Domlur,
Bengaluru 560071, [email protected]
ABSTRACTKnowledge Tracing plays a key role to personalize learning inan Intelligent Tutoring System including funtoot. BayesianKnowledge Tracing, apart from other models, is the sim-plest well-studied model which is known to work well. Re-cently, Deep Knowledge Tracing based on Deep Neural Net-works, was proposed with huge promises. But, soon after,it was discovered that the gains achieved by DKT were notof significant magnitude as compared to Performance Fac-tor Analysis [13] and BKT and its variants proposed in [6].In the quest of examining and studying these models, weexperiment with them on our dataset. We also introducea logical extension of DKT, Multi-Skill DKT, to incorpo-rate items requiring knowledge of multiple skills. We showthat PFA clearly outperforms all the above mentioned mod-els when the AUC results were averaged on skills while PFAand DKT, both were equally good, when they were averagedon all data points.
KeywordsDeep Knowledge Tracing, Adaptive Learning, funtoot,Bayesian Knowledge Tracing, Intelligent Tutoring System,Performance Factor Analysis
1. INTRODUCTIONAn Intelligent Tutoring System’s main aspect is to deliverthe instruction and provide feedback as and when required.To do that, the system requires to measure the knowledgestate of a student with respect to the content available. Thesystem continuously monitors the student’s performance,updates the knowledge state and based on that takes fur-ther decisions. The techniques capable of performing thesefunctions are called Knowledge Tracing models.
Bayesian Knowledge Tracing [2] has been one of the mostpredominantly researched models in the educational datamining domain. BKT is a 2-state skill specific model, wherethe student’s knowledge state can take either of the twovalues: learned or unlearned. Moreover, a skill once learnedcannot be unlearned. These assumptions make it a verysimple and constrained model and has led lots of researchersto extend the model by enhancing it with new features toimprove its performance; making it less constrained so tosay. For instance [10] extend BKT in the scenario where thestudents do not necessarily use the system in the same day.
Authors of [14] proposed an individualized BKT model
which fits not only the skill specific parameters, but also stu-dent specific parameters and have reported significant gainsover standard BKT.
Educational data mining techniques can now very accuratelypredict how much a student has learned a Knowledge Com-ponent (KC). But it doesn’t give information about the ex-act moment when the KC was learnt. [3] discusses a tech-nique about finding a moment of learning.
Another model Performance Factor Analysis (PFA) is a lo-gistic regression model proposed in [7] which showed betterperformance than standard BKT. Unlike BKT, PFA can in-corporate items with multiple skills. PFA makes predictionsbased on the item difficulty and historical performances of astudent. [4] has compared BKT and PFA by using variousmodel fitting parameter models like Expectation Maximiza-tion (EM) and Brute Force (BF). Knowledge tracing modelswith EM have shown performance comparable to PFA[4].
The most recently published model - DKT [9] is the newesttechnique in this area of research. DKT is an LSTM [5] net-work, a variant of recurrent neural network [11] which takesas input a series of exercises attempted by the student andcorrespondingly a binary digit suggesting if the exercise wasanswered correctly or not. DKT has shown significant gainsover BKT which is a very tempting gain for any researcherin this community to look into and study further. Paperslike [6], [13] and [12] did just that.
Authors in [13] have pointed out few irregularities in thedataset used by authors in [9] which, when accounted for,reduce the gain reported by using DKT. They also reportedthat DKT doesn’t quite hold an edge when the results arecompared with PFA.
Another standard framework for modelling student re-sponses, Temporal extension of Item Response Theory (IRT)is compared with DKT in [12]. Authors have reported thatthe variants of IRT consistently matched or outperformedDKT.
Recent paper [6] studies DKT even further and explains whyDKT might be better. It has been pointed out that DKTinherently exploits the characteristics of the data which stan-dard models like BKT cannot. So, in order to make a faircomparison between the two, authors have presented three
Proceedings of the 10th International Conference on Educational Data Mining 448

different variants of BKT with forgetting, skill discovery andlatent abilities which might help BKT make use of informa-tion from the data the way DKT does.
Having introduced these variants, the authors also make apoint that Knowledge Tracing might not require the “depth”that deep learning models offer.
Being an Intelligent Tutoring System, funtoot’s tutor mod-ule requires sophisticated knowledge tracing technique whichmodels the process of knowledge acquisition and helps stu-dents achieve mastery. One such model operates at the levelof LGs (discussed in section 2) which models the commit-tance and avoidance of them with time and practice. In thecontext of this paper, these LG models are of prime impor-tance to us and henceforth we will refer LGs as skills. Also,considering user experience, we need a model which can beused for predictions in real time without compromising onuser latency.
In this paper, we test standard BKT, the variants of BKT,DKT and PFA on the funtoot dataset and examine theresults. We also introduce a logical and trivial extensionof DKT to accommodate the items which involve multipleskills. Out of all the models considered in this article, PFAis one such model which allows items with multiple skills.But in our dataset, each of the skills in the item has its ownresponse and hence it is modelled separately in PFA.
The rest of the paper is organized as follows: section 2 givesa brief introduction to our product funtoot and its knowl-edge graph. Section 3 discusses the experiments on funtootdataset and results. Section 4 discusses the future work andconclusion.
2. FUNTOOTFuntoot1 is a personalized digital tutor which is currentlybeing used actively in around 125 schools all over India withthe total of 99,842 students registered. The curriculum ofmath and science for grades 2 to 9 is covered by funtoot.
Schools in India are typically affiliated with one of the boardsof education2. Curriculum for math and science from thefollowing boards of education are included in funtoot:
• CBSE3 board for grades 2 to 9,
• Karnataka State Board4 for grades 2 to 8,
• ICSE5 board for grades 2 to 8 and
• IGCSE6 board for grades 2 to 3.
1http://www.funtoot.com/2https://en.wikipedia.org/wiki/Boards_of_Education_in_India3https://en.wikipedia.org/wiki/Central_Board_of_Secondary_Education4https://en.wikipedia.org/wiki/Karnataka_Secondary_Education_Examination_Board5https://en.wikipedia.org/wiki/Indian_Certificate_of_Secondary_Education6https://en.wikipedia.org/wiki/International_General_Certificate_of_Secondary_Education
2.1 Funtoot Knowledge GraphPedagogy team at funtoot has created a funtoot ontologyaround the subjects Math and Science. This ontology rep-resents the various learning units of any subject and theirrelationships, which is created based on human expertise inthe subject matter. All the above mentioned curricula arelater derived from this funtoot ontology based on the agegroup and grade.
An ontology for a subject is created as follows:
1. a subject is broken down into the smallest teachablesub-sub-concepts
2. it is then mapped to determine inter-dependencies/connections between concepts, sub-concepts (sc) and sub-sub-concepts (ssc) as shown inthe figure 1,Consider the example shown in figure 1. SubjectMath contains a concept Triangle, and Trianglecontains a sub-concept Congruency. Sub-conceptcontains two sub-sub-concepts: Rules of Congruencyand Applications of Congruency. Sub-sub-conceptsare connected by “depends-on” relationship. Here,Applications of Congruency is dependent on Rulesof Congruency, which suggests that the latter is aprerequisite for the former.
3. learning gaps (definition 1) are determined in thesub-sub-concepts
Definition 1. Learning Gap (LG): “A learning gapis a relative performance of a student in a specific skill,i.e. difference of what a student was supposed to learn,and what he actually learned in a skill. 7”
“A misunderstanding of a concept or a lack of knowl-edge about a concept that is required for a student tosolve or answer a particular question is also a learninggap”
For instance, a question “Solve 12 + 18” is given tostudent Alice. If Alice makes a mistake while addingcarry and answers 20, we say that a LG (carry-overerror) has been committed. Had she answered 30, thisLG would have been said to be avoided. This questionmight also have other LGs which could have been com-mitted simultaneously with the LG mentioned above.If the response is correct, all the LGs of a question aresaid to have been avoided.
In figure 1, Applications of Congruency is an ssc con-taining LG1, LG2 and LG3. Learning gaps can have“induce” relationships. In our example, LG1 inducesLG2.
4. inter-dependencies get refined based on the data-pointsreceived by funtoot through the user’s interaction
5. an SSC is further divided into six Bloom’s Taxon-omy Learning Objectives (btlos) using Bloom’s Tax-anomy [1]. Each learning objective has five difficulty
7http://edglossary.org/learning-gap/
Proceedings of the 10th International Conference on Educational Data Mining 449

hhhhhhhhhhhhhDifficulty LevelBTLO
Remember Understand Apply Analyze Evaluate Create
12345
Table 1: Btlos, Difficulty levels ⇒ Complexities
levels as shown in table 1. Each cell (for instance,Remember1, Apply2 and so on) in table 1 is called acomplexity in funtoot.
Figure 1: Funtoot Knowledge Graph
2.2 DatasetDuring a student’s interaction with funtoot, informa-tion like: session, the scope of the question (which in-cludes grade − subject − topic − subtopic − subsubtopic −complexity − question), question identifier, start time, to-tal attempts allowed based on the student’s performance,time taken, attempts taken, information about hints, LGscommitted in each attempt, assistance provided and so onis logged.
In the study presented in this paper, we model LG as a skill.We aim to predict a student’s proficiency in a particular LG.When a student is presented with an item, several attemptsare provided to solve it. In an unsuccessful attempt a stu-dent might commit more than one LG as explained in sec-tion 2 and the same LG can also be committed in severalattempts. We know apriori the set of LGs that are exposedby a question. With this information at hand, we need animpression of each of these LGs for the student in the con-text of this item.
Consider a hypothetical example. Alice attempts an item qfrom a subtopic Rules of Congruency having skills s1, s2, s3.The series of attempts is shown in table 2.
Attempt no. s1 s2 s31 0 1 12 0 1 13 0 0 14 1 1 1
Overall Outcome 0 0 1
Table 2: Attempts made by Alice while solving q
In the above table, 1 represents avoidance and 0 representscommittance. As shown in the table, Alice committed s1 inattempts 1, 2 and 3. Alice committed s2 in attempt 3. Aliceavoided s3 in all attempts. The overall outcome of Alice inLGs s1, s2 and s3 is (0, 0, 1) which is a logical AND overall attempts. This means that s1 and s2 are committed ands3 is avoided. From now on, we will refer these outcomesas committances and avoidances and they will be used formodelling. So this problem attempt of Alice gives rise tothree data points.
For this experiment we have used data of 6th grade CBSEmath from date 2015 − 07 − 25 to 2017 − 01 − 30. Syl-labus descendant hierarchy for this dataset is as follows: 22topics, 69 subtopics, 119 sub-sub-topics, 541 complexitiesand 1, 524 problems. This dataset has 26, 06, 022 entries ofproblem attempts involving 442 skills. This data is about176 schools with 11, 820 students and 1, 524 problems. Fromthis dataset, the data of students having less than 100 prob-lem attempts were excluded. This gives us 24, 47, 027 prob-lem attempts involving 442 skills with 7780 students and1, 523 problems. Finally, we have 56, 04, 227 data pointswhere 42, 68, 503 are avoidances (class 1) and 13, 35, 724 arecommittance (class 0).
In the context of the example shown in table 2, the lengthof Alice′s attempt to solve a question q can be said as three,as there are three skills involved. Given this definition, oflength of the problem attempt, figure 2 shows the distribu-tion of the length of the problem attempts in the dataset.38.18% of the total problem attempts have 1 skill, i.e., lengthis 1 and 29.47% of the problem attempts have length 2.
3. EXPERIMENTSIn this section, we discuss the experiments done on ourdataset and report the results. Consider a hypotheticaldataset of student Alice attempting questions q1 and q2 inthe same order. Question q1 has three skills A,B and C,question q2 has two skills B and C. Alice gets only oneattempt for both the questions wherein she commits skillB and C and skill B in questions q1 and q2 respectively.This example is used in this section to explain the trainingdatasets for each of the techniques.
Proceedings of the 10th International Conference on Educational Data Mining 450

Figure 2: Data Distribution
3.1 Bayesian Knowledge TracingAfter DKT [9], authors in [6] have explored and hypothe-sized the properties of the data which DKT exploits whilethe standard BKT cannot. To equip BKT with those capa-bilities, the authors have proposed three variants of BKT:BKT with forgetting (BKT+F), BKT with skill discovery(BKT+S) and BKT with latent-abilities (BKT+A).
We have used the author’s implementation of BKTand its three variants published on https://github.com/
robert-lindsey/WCRP/tree/forgetting to train on ourdataset. The data format required by these BKT variantsis as shown in table 3. As discussed in the earlier section 1,
skill ID response seriesA 1B 0, 0C 0, 1
Table 3: BKT data format
BKT is a skill specific model and thus, three models need tobe built one each for skills A, B and C. Each model needsthe time series of responses as shown in the table 3.
All variants of BKT except the ones where skill discoveryis involved, namely BKT, BKT+F, BKT+A and BKT+FAoperate on the skills provided by the data. The remainingvariants: BKT+S and BKT+FSA completely ignore the ex-pert tagged skills available in the data. This is achievedby setting the non-parametric prior, β on the expert taggedskills as 0.
3.2 Performance Factor AnalysisLike BKT, PFA being a skill specific model requires a dif-ferent model to be built for each skill. Logistic Regressionmodel of [8] is used in the implementation of PFA. For eachskill, the response is a function of the skill difficulty, numberof prior student success (avoidances) responses and num-ber of prior student failure (committances) responses for theskill. From the implementation point of view, the decisionfunction has two variables - the number of prior success in-stances and the number of prior failure instances for the skill.Also, a bias is added in the decision function (achieved bythe intercept) which serves as the skill difficulty. The dataformat needed by PFA is as shown in figure 4.
skill ID no. of failures no. of successes responseA 0 0 1B 0 0 0C 0 0 0B 1 0 0C 1 0 1
Table 4: PFA data format
3.3 Deep Knowledge TracingThe implementation of LSTM based DKT published onhttps://github.com/mmkhajah/dkt is used to train ourdataset. The neural network of DKT requires the inputas one hot encoding of skills as well as responses for each ofthem, while output is the probability of correctness of eachof the skills. Hence the size of the input is twice the num-ber of skills and that of the output is the number of skills.The serial number in the table 5 shows the order in whichthe inputs are fed into the network. The input in the tablesignifies the previous output while the response shows theexpected output out of the network. The odd bits in theinput represent one hot encoding of the skills while the evenbits represent their responses. X in the output shows thatthe bit can take either 0 or 1.
serial no. input response1 0, 0, 0, 0, 0, 0 1, X, X2 1, 1, 0, 0, 0, 0 X, 0, X3 0, 0, 1, 0, 0, 0 X, X, 04 0, 0, 0, 0, 1, 0 X, 0, X5 0, 0, 1, 0, 0, 0 X, X, 1
Table 5: DKT data format
As discussed in subsection 2.2 that to figure out the finaloutcomes for the LGs in an item attempt, there is no clearor fixed ordering. But the time series to be fed into the net-work of DKT requires us to establish the ordering betweenthem. We sample the orderings randomly and average theresults on them. The sample dataset in the table 5 is onesuch ordering. Another random ordering can be seen in thetable 6. The skills of the item q1 are in the order A, B, Cin table 5 while their order is B, A, C in table 6. The otherway to get an ordering is to get rid of the ordering itselfby merging the data points of the skills in an item which isexplained in the following subsection.
serial no. input response1 0, 0, 0, 0, 0, 0 X, 0, X2 0, 0, 1, 0, 0, 0 1, X, X3 1, 1, 0, 0, 0, 0 X, X, 04 0, 0, 0, 0, 1, 0 X, X, 15 0, 0, 0, 0, 1, 1 X, 0, X
Table 6: Shuffled skills DKT data format
3.4 Multi-skill DKTAs explained in the context of DKT, the orderings among theskills in the item are sampled randomly. In order to get ridof such orderings, we introduce an extension of DKT: Multi-skill DKT which can incorporate the items having multipleskills efficiently. It can be seen from the table 7 that thethree data points of q1 and two data points of q2 are con-solidated and we are left with two data points in total. Thesize and structure of the inputs and outputs still remain the
Proceedings of the 10th International Conference on Educational Data Mining 451

serial no. input response1 0, 0, 0, 0, 0, 0 1, 0, 02 1, 1, 1, 0, 1, 0 X, 0, 1
Table 7: Multi-Skill DKT data
same. The only difference is that the input and output canhave the information about multiple skills simultaneously.
3.5 ResultsFor all the algorithms, we use three replications of 2-foldcross validation, which gives us 6 folds in total on whichthe results are averaged. We use Area under the curve ofReceiver Operating Characteristics (ROC), which we willrefer as the AUC. Paper [6] discusses the inconsistent pro-cedures used to compute and compare performance of BKTand DKT. We therefore compute AUC both by averagingon all data points and by averaging on skills. The results ofour experiments on funtoot dataset are shown in figure 3.
When AUC is averaged on all the data points, the relativedifference in performance between algorithms is very low,0.83 being the lowest and 0.88 being the highest. PFA andDKT share the highest performance of 0.88 AUC. Multi-skillDKT lags a bit behind DKT by 0.03 AUC units (0.85 AUC).All the variants of BKT also lag behind DKT and PFA bynot a very big margin, the highest being 0.05 AUC units.BKT has the lowest AUC of 0.83, BKT+FSA has the highestAUC of 0.85 and the rest of them have an AUC of 0.84, whichdepicts that they all show equivalent performance.
The relative difference in performance between algorithms ishigher when AUC is averaged on skills, the lowest being 0.64AUC of BKT+F and highest being 0.88 AUC of PFA whichis 37.5% gain. PFA with an AUC of 0.88 outperforms allthe methods by having a minimum gain of 17% (0.75 AUCof DKT and BKT+FSA) and maximum gain of 37.5% (0.64AUC of BKT+F). Here also, the magnitude of differencebetween DKT and Multi-skill DKT is very less, 0.04 AUCunits to be precise with Multi-skill DKT lagging behind.
With BKT, BTK+F, BKT+A and BKT+FA having AUCsof 0.65, 0.64, 0.68 and 0.67 respectively, it is clear that For-getting adds no value. The number of skills discovered byboth BKT+S and BKT+FSA are in the range of 145− 175compared to 442 original skills. The Skill Discovery ex-tension provides reasonable gains which are evident fromthe AUCs of BKT and BKT+S (9% gain) and BKT+FAand BKT+FSA (12% gain). The magnitude of the gainsachieved by Abilities extension is very less, 0.003 AUC unitsin the case of BKT, BKT+A and BKT+F, BKT+FA. Fi-nally, the different variants of BKT achieve a gain of maxi-mum 15% over standard BKT. Notably, the best version ofBKT, that is, BKT+FSA and DKT, perform equally.
4. DISCUSSION AND FUTURE WORKOur aim of this study was to explore the performance ofstandard BKT, all of its variants proposed in [6], PFA andDKT on funtoot dataset. The results we have got are insync with the results in [6]. When the AUC results werecomputed by averaging over skills, DKT and BKT+FSAperform equally well while DKT outperforms standard BKTwith the gain of 15%. Also, BKT+S gave a performance
Figure 3: A comparison of PFA, DKT, Multi-skill DKT, BKTand its variants
which was very close to DKT. Though DKT does performbetter when the AUC results are averaged over all datapoints, the magnitude of the gain is significantly low.
Similar kind of results hold true for PFA. PFA achieves ahigh gain compared to all the models when AUC resultsare averaged over skills. When AUC results are averagedover all data points, PFA equals DKT’s performance andoutperforms the rest of the models, though not with a veryhigh margin. This is not consistent with the results in [13]where DKT outperforms PFA though, not overwhelmingly.
The above results reinforce the hypothesis proposed in [6]that the domain of knowledge tracing seems to be shallowand may not require the depth that the deep neural net-works offer. The predictive or the explanatory power of amodel can also be characterized in terms of the number ofparameters the model fits. One of the reasons why DKT isexpected to be more successful than other models, at thecost of interpretability, is that it has weights in the orderof hundreds of thousands. Moreover, being made up of alayer of LSTM cells, DKT has the capability of looking backarbitrary number of timesteps. On the contrary, variantsof BKT and PFA are very simple and interpretable mod-els. Their simplicity can easily be attributed to the smallnumber of parameters they fit.
Standard BKT needs four parameters: pInit (the probabil-ity that the student is in learned state before the first prac-tice), pLearn (the probability that the student transitionsfrom not learned state to the learned state at each prac-tice), pGuess (the probability that the student guesses theanswer being in the unlearned state) and pSlip (the prob-ability that the student accidentally makes a mistake be-ing in the learned state). In PFA, it is even better, onlythree parameters are learned per skill - item difficulty andone coefficient each for prior failures and successes. Withthis, the total parameters for a few hundred skills (whichis true in our case) would be a few hundred parameters:three × number of skills. Hence, in our context, it seemsappropriate to say that few hundred parameters are betterthan few hundred thousand parameters.
Both BKT and DKT, in an abstract sense, are the models
Proceedings of the 10th International Conference on Educational Data Mining 452

which maintain the knowledge state of the student. Witheach response of the student, the knowledge states are up-dated and those states are used to generate future predic-tions. They both require the time series data of the student’sresponses. This is significantly different than the type ofdata required by PFA. PFA operates on abstract featuresof student’s interactions like total number of prior successesand failures. It occurs to us that the abstract features aresmoother than the time series data of responses. It seemsthe domain of knowledge tracing can be deciphered betterif the abstract features are used instead of detailed trail ofresponses which might be noisy. More studies and experi-ments are required to validate this point.
The skills used in our experiment are the LGs from the fun-toot Knowledge Graph which are tagged at the level of sub-subtopic which acts as a context of LG. Also, an LG canoccur in multiple subsubtopics. The discovered skills in ourexperiments of BKT+S and BKT+FSA were in the rangeof 145 − 175 which is close to the number of subsubtopics(119) in our dataset. We suspect that there is some relationbetween the subsubtopics in our dataset and the skills dis-covered. We would like to investigate this further in future.DKT also supports skill discovery as proposed in [9] whichwe would look into in future to compare the skills discoveredby several algorithms.
Funtoot dataset has items with multiple skills which forcedus to extend DKT and come up with Multi-skill DKT. Thisvariant of DKT underperformed marginally as compared toDKT. We do not have a clear understanding about whythis is so and hence this also requires further study. Sincewe have used a very crude dataset, that is, does not containfeatures about attempts, time durations, hints, item context,etc., it would be interesting to use them with DKT and seeif the depth of DKT can exploit them.
5. REFERENCES[1] L. W. Anderson, D. R. Krathwohl, and B. S. Bloom.
A taxonomy for learning, teaching, and assessing: Arevision of Bloom’s taxonomy of educationalobjectives. Allyn & Bacon, 2001.
[2] A. T. Corbett and J. R. Anderson. Knowledge tracing:Modeling the acquisition of procedural knowledge.User modeling and user-adapted interaction,4(4):253–278, 1994.
[3] R. S. d Baker, A. B. Goldstein, and N. T. Heffernan.Detecting the moment of learning. In InternationalConference on Intelligent Tutoring Systems, pages
25–34. Springer, 2010.
[4] Y. Gong, J. E. Beck, and N. T. Heffernan. Comparingknowledge tracing and performance factor analysis byusing multiple model fitting procedures. InInternational conference on intelligent tutoringsystems, pages 35–44. Springer, 2010.
[5] S. Hochreiter and J. Schmidhuber. Long short-termmemory. Neural computation, 9(8):1735–1780, 1997.
[6] M. Khajah, R. V. Lindsey, and M. C. Mozer. Howdeep is knowledge tracing? In Proceedings of the 9thInternational Conference on Educational Data Mining(EDM 2016), pages 94–101, 2016.
[7] P. I. Pavlik Jr, H. Cen, and K. R. Koedinger.Performance factors analysis–a new alternative toknowledge tracing. Online Submission, 2009.
[8] F. Pedregosa, G. Varoquaux, A. Gramfort, V. Michel,B. Thirion, O. Grisel, M. Blondel, P. Prettenhofer,R. Weiss, V. Dubourg, J. Vanderplas, A. Passos,D. Cournapeau, M. Brucher, M. Perrot, andE. Duchesnay. Scikit-learn: Machine learning inPython. Journal of Machine Learning Research,12:2825–2830, 2011.
[9] C. Piech, J. Bassen, J. Huang, S. Ganguli, M. Sahami,L. J. Guibas, and J. Sohl-Dickstein. Deep knowledgetracing. In Advances in Neural Information ProcessingSystems, pages 505–513, 2015.
[10] Y. Qiu, Y. Qi, H. Lu, Z. Pardos, and N. Heffernan.Does time matter? modeling the effect of time withbayesian knowledge tracing. In Educational DataMining 2011, 2010.
[11] R. J. Williams and D. Zipser. A learning algorithm forcontinually running fully recurrent neural networks.Neural computation, 1(2):270–280, 1989.
[12] K. H. Wilson, Y. Karklin, B. Han, andC. Ekanadham. Back to the basics: Bayesianextensions of irt outperform neural networks forproficiency estimation. In Proceedings of the 9thInternational Conference on Educational Data Mining(EDM 2016), pages 539–544, 2016.
[13] X. Xiong, S. Zhao, E. G. Van Inwegen, and J. E. Beck.Going deeper with deep knowledge tracing. InProceedings of the 9th International Conference onEducational Data Mining (EDM 2016), pages545–550, 2016.
[14] M. V. Yudelson, K. R. Koedinger, and G. J. Gordon.Individualized bayesian knowledge tracing models. InInternational Conference on Artificial Intelligence inEducation, pages 171–180. Springer, 2013.
Proceedings of the 10th International Conference on Educational Data Mining 453

Tell Me More: Digital Eyes to the Physical World for EarlyChildhood Learning
Vijay Ekambaram∗, Ruhi Sharma Mittal∗, Prasenjit Dey,Ravi Kokku, Aditya K Sinha, Satya V Nitta
IBM [email protected], [email protected], [email protected]
[email protected], [email protected], [email protected]
ABSTRACTChildren are inherently curious and rapidly learn a number of thingsfrom the physical environments they live in, including rich vocabu-lary. An effective way of building vocabulary is for the child to ac-tually interact with physical objects in their surroundings and learnin their context [17]. Enabling effective learning from the physicalworld with digital technologies is, however, challenging. Specifi-cally, a critical technology component for physical-digital interac-tion is visual recognition. The recognition accuracy provided bystate-of-the-art computer vision services is not sufficient for use inEarly Childhood Learning (ECL); without high (near 100%) recog-nition accuracy of objects in context, learners may be presentedwith wrongly contextualized content and concepts, thereby makingthe learning solutions ineffective and un-adoptable. In this paper,we present a holistic visual recognition system for ECL physical-digital interaction that improves recognition accuracy levels using(a) domain restriction, (b) multi-modal fusion of contextual infor-mation, and (c) semi-automated feedback with different gamingscenarios for right object-tag identification & classifier re-training.We evaluate the system with a group of 12 children in the age groupof 3-5 years and show how these new systems can combine existingAPIs and techniques in interesting ways to greatly improve accura-cies, and hence make such new learning experiences possible.
1. INTRODUCTIONChildren learn a lot from the physical environment they live in. Oneof the important aspects of early childhood learning is vocabularybuilding, which happens to a substantial extent in the physical en-vironment they grow up in [17]. Studies have shown that failureto develop sufficient vocabulary at an early age affects a child’sreading comprehension and hence their ability to understand otherimportant concepts that may define their academic success in thefuture. It is also evident from a study that failure to expose a childto sufficient number of words by the age of three years leads to a 30million word gap between kids who have been exposed to a lot ofquality conversations, versus the ones that have not been exposedas much [13].
Vocabulary building has been a theme for early childhood learn-ing and is closely associated with its context in the physical world.
∗these authors contributed equally to this work
The exploration of physical surroundings of the child triggers newvocabulary and vice-versa. Relating physical world objects andconcepts, to digital world content requires seamless flow of infor-mation. Increasingly, availability of cheap sensors such as camera,microphone etc. on connected devices enable capture of physicalworld information and context, and translate them to personalizeddigital learning.
An envisioned system uses mobile devices to take pictures of thechild’s physical surroundings and make the best sense out of thepicture. This is then translated to a learning session where the childis taught about the object in focus, its relation to other objects,its pronunciation, it’s multiple representations, etc. Recognitionof pictures for teaching a child requires high recognition accuracy.In-the-wild image recognition accuracies are in general low, espe-cially for images taken with mobile devices. Moreover, picturestaken by a child is even more challenging given the shake, blur,lighting issues, pose etc. that come with it.
To this end, in this paper, we take a holistic approach of recognition-in-context using a combination of (a) domain restriction, (b) multi-modal fusion of contextual information, and (c) gamified disam-biguation and classifier re-training using child-in-the-loop. Specifi-cally, we use object recognition results from a custom-trained (withimages from restricted domains) vision classifier, and combine themwith information from the domain knowledge that is available when-ever a new domain of words is taught to a child in the classroom orat home. We use a new voting based multimodal classifier fusionalgorithm to disambiguate the results of vision classifier, with re-sults from multiple NLP classifiers, for better accuracy. We showthat using such a framework, we can attain levels of accuracy thatcan make a large majority of the physical-digital interaction expe-riences fruitful to the child, and also get useful feedback from thechild at a low cognitive load to enable the system to retrain the clas-sifier and improve accuracy. We tested our system with a group of12 children in the age group of 3-5 years and show that children canplay an image disambiguation game (that allows the child to verifywhat class label has actually been identified by the system) veryeasily with graceful degradation of performance on difficult im-ages. In most cases, multi-modal context disambiguation improvesobject recognition accuracy significantly, and hence the human dis-ambiguation step remains limited to one or two rounds, which en-sures the child’s continuing interest in the games and learning ac-tivities. The system learns from the child feedback, and the childin turn feels engaged to enable the system to learn over time. Thenuggets of information made available about the object in focus atthe end of playing a game were also found to be very engaging bythe child.
In summary, this paper makes the following contributions:
• We take a holistic approach to address the challenges with
Proceedings of the 10th International Conference on Educational Data Mining 454

automatic visual recognition for physical digital interactionto enable early childhood learning in context. Our three-stage approach includes (a) domain restriction, (b) contex-tual disambiguation and (c) gamified human disambiguation,which enables a platform for building a variety of early child-hood learning applications with physical-digital interaction.
• We propose a novel re-ranking algorithm that uses the no-tion of strong vouching to re-order the output labels of a vi-sion classifier based on strong supporting evidence providedby the additional context from semantic representation mod-els in NLP, namely GloVe [6], Word2vec [11] and Concept-Net [5] (which can be textual cues in the form of classroomand curriculum context, domain focus, conversational inputand clues, etc.). Note that, we use the terms "re-order" and"re-rank" interchangeably throughout this paper.
• We evaluate a simple disambiguation game for children tochoose the right label from the Top-K labels given out bythe system. Through an usability study with 12 children, wemake the case that engaging user experiences can indeed bedeveloped to bridge the gap between automatic visual recog-nition accuracies and the requirement of high accuracy formeaningful learning activities.
2. MOTIVATION AND RELATED WORKEarly childhood learning applications with physical-digital interac-tion fall into two categories: (i) Application-initiated activities: Inthis category, the child is given a context by the application and isrequired to find relevant physical object and take a picture [2]. Forexample, the application may prompt the child to take a picture of"something that we sit on", "a fruit", “something that can be usedto cut paper”, etc. (ii) Child-initiated activities: In this category,the child takes a picture of an object and intends to know what it is,where it comes from, other examples of the same type of objects,etc. For example, the child may take a picture of a new gadget ormachine found in school, a plant or a leaf or a flower, etc. andwants to know more about them.
In each of these categories, the application is required to identifywhat the object is with Top-1 accuracy (i.e. a vision recognition so-lution should emit the right label at the top with high confidence).While a lot of advancement has been made in the improvement ofaccuracy of vision classifiers, Top-1 accuracy levels are still rela-tively low, although Top-5 accuracy levels (i.e. the right label isone of the top 5 labels emitted) are more reasonable. Nevertheless,the goal is to be able to work with the Top-5 list, and using thetechniques described earlier, push the Top-1 accuracy to acceptablelevels for a better interaction.
2.1 Vision Recognition AccuracyTo understand the efficacy of state-of-the-art solutions quantita-tively, we experimented with two deep convolution neural networks(Baseline Model 1: VGGNet [18] and Baseline Model 2: InceptionV3 [19]). Inception V3 has been found to have 21.2% top-1 errorrate for ILSVRC 2012 classification challenge validation set [8].Even in experiments where baseline models were custom trainedwith 300 training images per class and tested with images takenfrom iPad, we observed low Top-1 accuracy (of 72.6% in BaselineModel 1 and 79.1% in Baseline Model 2); i.e. one in about four im-ages will be wrongly labeled. Even the Top-5 accuracy is 88.05% inBaseline Model 1 and 89.3% in Baseline Model 2. We also trainedthe Baseline models with the complete Imagenet[8] images for theconsidered classes and we observed <1% improvement. Further,when multiple objects are present in the image frame, the Top-1accuracy degrades further (38.2% in Baseline Model 1 and 44.5%in Baseline Model 2 for 2 objects in a frame), and so does Top-5 accuracy (of 77.9% in Baseline Model 1 and 85.6% in BaselineModel 2). Note that this could be a common scenario with children
taking pictures, in which multiple objects get captured in a singleimage frame. Observe that recent Augment Reality (AR) Applica-tions such as Blippar [4], Layer [9], Aurasma [3] rely on similarvision recognition task, and hence run into similar inaccuracies inuncontrolled settings. While adult users of such applications maybe tolerant to inaccuracies of the application, children may get dis-engaged when the system detects something wrongly or is unableto detect at all.
2.2 Multi-modal Information FusionUsing additional information to identify the objects holds promisein imporving the accuracy of vision recognition. For instance, sev-eral past works ( [22], [14], [15]) improve the image classificationoutput based on the text features derived from the image. Specif-ically, authors in [20] propose techniques that train the modelspecifically with images that contain text, for efficient extraction oftext and image features from the image. They also propose fusiontechniques to merge these features for improving image recogni-tion accuracies. While this may be possible in some scenarios, theapplication’s accuracy will remain a challenge when such textualinformation embedded in the image is not present. Several worksin literature propose indexing of images based on text annotationsfor efficient image search. [12] surveys and consolidates variousapproaches related to efficient image retrieval system based on textannotations. Likewise, [21] proposes techniques to label imagesbased on image similarity concepts. These works are complemen-tary, and do not address the problem of correctly determining thelabels right when a picture is taken based on a context.
In summary, the early childhood learning scanarios require a holis-tic solution that leverages the state-of-the-art vision recognition so-lutions, but goes beyond in improving the detection accuracy of theimage captured to make engaging applications for children. Wedescribe one such holistic solution next.
3. PROPOSED APPROACHOur goal is to enable a holistic solution for applications to provideas input an image taken by a child, and emit as output the final labelthat should be used as an index into the relevant learning content. Ahigh level overview of our solution is depicted in Figure. 1. In oneof the envisioned applications built for physical-digital interaction,a child takes a picture that is sent as input to the proposed ECL Im-age Recognition (ECL-IR) Module that emits the correct label ofthe image by applying the following three stages: (i) Stage 1: Do-main Specific Customized Training (which improves Top-K accu-racy), (ii) Stage 2: Domain Knowledge (DK) based disambiguationand reordering (which improves Top-1 accuracy) and (iii) Stage 3:Human Disambiguation game (confirmation step). We now discusseach of these stages in detail.
3.1 Stage 1: Domain Specific Customized Train-ing of Baseline Models
The first stage of our solution strives to improve the Top-K accu-racy of the vision classifiers by constraining the domain of childlearning in which they are applied. In order to achieve this, we per-form custom training of the baseline models with domain-specificdata sets. This step is very commonly applied in most of the vi-sion recognition use-cases for improving the Top-K accuracy andseveral reported statistics indicate good Top-K accuracy improve-ments through custom training. For example current state-of-artvision classifier [19] reports 94.6% Top-5 accuracy on ILSVRC2012 classification challenge validation set. However, even thisstate-of-art vision classifier reports 21.2% Top-1 error rate on thesame validation set. In the next section, we discuss how ECL-IRmodule improves Top-1 accuracy through contextualized reorder-ing (Stage 2).
Proceedings of the 10th International Conference on Educational Data Mining 455

Figure 1: High Level Solution Overview
3.2 Stage 2: Domain Knowledge based Dis-ambiguation and Reordering
In this section, we propose to improve the Top-1 accuracy throughintelligent reordering of the Top-5 labels from the vision classifier.In-order to achieve this, we leverage the domain knowledge asso-ciated with the teaching activity as a second source of informationto re-order the Top-5 output labels. Domain Knowledge refers tothe classroom learning context (derived from teacher’s current syl-labus, teaching themes, object related clues, collaborative clues)based on which the learning activity is conducted. Note that theDomain Knowledge could be a word or a phrase too. We now dis-cuss various important aspects of this stage in detail.
Enabling Semantic Capability. Domain Knowledge is a textrepresentation of the intent or activity derived from the classroomcontext. However, same intent or information could be conveyedthrough different keywords, and hence traditional bag-of-word ap-proaches [23] will not solve the problem in our use-cases. We lever-age the support of semantic representations (i.e. distributed wordrepresentation [16]) of words for enabling keyword independentre-ranking algorithm. In distributed word representation, wordsare represented as N-dimensional vectors such that distance be-tween them capture semantic information. There are various pre-trained semantic representation models (also called word embed-ding models such as Word2Vec [11], GloVe [6]) available whichenable semantic comparison of words. Likewise, there is also Con-ceptNet [5] which is a multilingual knowledge base, representingwords and phrases that people use and the common-sense relation-ships between them. This paper leverages these existing works toachieve an effective re-ranking of the output label-set with semanticcapability.
Existing Approach Results. One naive way to approach theproblem of re-ranking is to find the DK Correlation Score (DK-CS)using Algorithm. 1 and re-rank the Top-5 labels in descending orderof their DK-CS. However, this approach has strong bias towards thesemantic representation output and completely ignores the rankingthat is produced by the vision classifier.
Other fusion approaches that have been tried are combining one ormore of the classifier outputs (i) Word2Vec (S1), (ii) GloVe (S2),(iii) ConceptNet (S3), (iv) Vision (S4) in different ways. The mostcommon are the product rule and the weighted average rule wherethe confidence scores are combined by computing either a productof them or a weighted sum of them. The improvement in Top-1 ac-curacy of such combinations varies from -11% to 6%. We observethat the Top-1 accuracy of the system did not increase significantly
Algorithm 1: Algorithm to calculate DK Correlation ScoreInput: Label, Domain Knowledge text (DK)Output: DK Correlation Score (i.e. Semantic correlation between
DK and Label)1 For every word in DK, fetch its corresponding N-dimensional
semantic vector from the semantic representation model.2 Representation(DK) <– Compose N-dimensional vector for the
complete DK by combining word level vectors to a phrase levelvector using linear average technique
3 Representation(Label) <– Fetch N-dimensional vector for the labelfrom the semantic representation model
4 DK Correlation Score = Cosine Distance betweenRepresentation(DK) and Representation(Label)
5 return DK Correlation Score
and in many cases Top-1 accuracy of the system dropped after re-ranking as compared to the original list. The reason being the needfor proper and more efficient resolution of conflicts between DK-CS wins vs. vision confidence score wins. In the next section, weexplain the proposed novel re-ranking algorithm which highly im-proves the Top-1 accuracy of the system by effectively resolvingthe conflicts between DK-CS and vision rankings.
Proposed Re-Ranking Approach. In our proposed approach,we fuse the inferences from various semantic models and visionmodel using Majority-Win Strong Vouching algorithm for re-orderingthe Top-5 output list. There are two important aspects of this ap-proach: (i) Strong Vouching of Semantic Models, (ii) Majority Vot-ing across Semantic Models.
Strong Vouching of Semantic Models: As discussed earlier, thereason for failure of the traditional fusion approaches is the need forefficient resolution of conflicts between the semantic model ranksand the vision model ranks. Let us understand this problem through2 example scenarios. (i) Scenario 1: Top-1 prediction is "orange",Top-2 prediction is "apple", domain Knowledge is "fruits"; (ii) Sce-nario 2: Top-1 prediction is "orange", Top-2 prediction is "apple",domain knowledge is "red fruits". In the first scenario, since thedomain knowledge is semantically correlated towards both Top-1and Top-2 predicted labels, system should maintain the same or-der as predicted by the vision model. However, in the second sce-nario, since the domain knowledge (i.e. "red fruits") is highly cor-related towards Top-2 (i.e. "apple")as compared to Top-1(i.e. "or-ange"), system should swap the order of Top-1 and Top-2 labels.It turns out that just having a higher DK-CS to swap the labels isnot enough. We show that DK-CS of one label (label-1) shouldoverride the other label (label-2) by a specific threshold value toindicate that label-1 is semantically more correlated with as com-pared to label-2 and hence effect a swap against the vision rank.Through empirical analysis in Section. 4.2, we show that, in thecontext of reordering Top-K labels, if normalized DK-CS of a labelis greater than the other label by a value equal to 1/k (thresholdvalue), then the former label is more semantically correlated withdomain knowledge as compared to the latter.
Majority Voting across Semantic Models: As mentioned before,many semantic models exist in the literature and each of them aretrained on various data-sets. Therefore, it is not necessary that thestrong vouching behavior of all these semantic models to be same.In order to resolve this, our approach considers multiple semanticmodels together (such as GloVe, Word2Vec and ConceptNet) andenables swapping of i-th label with j-th label (i<j) in the Top-K out-put list only when majority of semantic models are strongly vouch-ing that j-th label is more correlated with DK as compared to the i-th label. This makes the system more intelligent in resolving across
Proceedings of the 10th International Conference on Educational Data Mining 456
semantic models as well as resolving conflicts across DK correla-tion score wins vs. vision confidence score wins. Algorithm. 2explains the overall flow of the proposed re-ranking algorithm.
Algorithm 2: Fusion based on Majority Win Strong Vouching Con-ceptInput: Top-K output label from image recognition model,
Domain Knowledge(DK)Output: Reordered Top-K output label list
1 Sort Top-K labels based on vision confidence score2 Re-rank the Top-K label by sorting using the following compare
logic3 Compare logic (i-th label, j-th label, DK): begin4 [Note] i-th label precedes j-th label in the ranked Top-K list.5 X1 = Total number of semantic models strongly-vouching for
j-th label as compared to i-th label6 X2 = Total number of semantic models strongly-vouching for
i-th label as compared to j-th label7 if X1>X2 then8 swap i-th label and j-th label in the Ranked Top-K list9 else
10 Maintain the same order of i-th label and j-th label
11 return Re-Ranked Top-K List
3.3 Stage 3: Human Disambiguation GameIt is important to note that, due to limitation of existing state-of-art vision models, though we achieve effective improvements, wenever reach an accuracy of 100%. Even after effective custom train-ing and DK based Top-K re-ranking, accuracy of the system is not100% (though high improvements are observed). So, there has tobe a confirmation step involving human-in-loop to confirm whetherthe predicted label is the right label to prevent teaching wrong ob-jectives. Since we are dealing with Kids, this step has to be ex-tremely light, simple, and also engaging for the Kids so that, theydo not feel any extra cognitive load. In this section, we proposea simple disambiguation game which is designed in a way that,(i) Kids easily play with it correctly, (ii) Kids interaction with thegame highly reduces when Top-1 accuracy of the system is high.Through enhancements as explained in previous sections, we makevision model to reach high Top-1 accuracy which in-turn reducesthe Kids interactions in the disambiguation game, thereby reducingthe overall cognitive overload to the Kids.
Our system leverages image matching for the disambiguation game.Re-ranked Top-K list (which is the output from Stage 2) is fed asinput to the disambiguation game. This game is depicted in Fig-ure. 2 renders reference images of the label (with possible variantsof a same object) one by one in the order of the re-ranked list andasks the Kid to select the image, if it looks similar to the objectclicked (through camera). If not, system show the next referenceimage and continues till all K labels are rendered. Since the inputto the game is a re-ranked Top-K list (which has high Top-1 ac-curacy), Kid has high chances of encountering the right image inthe first or second step itself, thus reducing the cognitive load ofthe kid to traverse till the end. Usability Guidelines [10] [1] forChild based Apps suggest large on-screen elements which are wellspatially separated for Kids to easily interact with them. So, basedon the display size of the form-factor, system could configure theno of images to be rendered in one step/cycle. Through usabilitystudy with 15 Kids, we show that Kids are able to easily play im-age similarity based disambiguation games. In scenarios when theright label is not in the predicted Top-K labels, system executes theexit scenarios as configured. Few possible exit scenarios could be:(i) Continue the game with other labels in the learning vocabularyset in the sorted order of DK, (ii) Request for teacher intervention,etc.
Figure 2: Basic Disambiguation Game
4. EVALUATIONWe present here the experimental setup and results of improvementin the vision classifier results achieved by the re-ordering approach.We then explain and present the results of the empirical analysis todetermine the value of threshold for strong vouching of the seman-tic models. To show that our approach is independent of domainknowledge, test set, training class set, and baseline image classifi-cation models (generality of approach), we performed various ex-periments as explained in following subsections. Later in this sec-tion, we present the usability study and inferences from the studyconducted with a group of 12 children in the age group of 3-5 years.
Datasets: The training dataset includes images from Imagenet [8].We used 52 classes and approximately 400 images per class fortraining. These 52 selected classes are objects commonly used inearly childhood learning, for example, apple, car, book, and violin,etc. The test datasets include real images taken from mobile phonesand tablets. The test dataset I includes 1K images where singleobject (from training set) is present in an image frame. The testdataset II includes 2.6K images where two objects (from trainingset) are present in an image frame. All the experiments were per-formed using two baseline image classification models: (i) Base-line Model 1 (BM1): Model based on VGGNet architecture [18],(ii) Baseline Model 2 (BM2): Model based on Inception-V3 archi-tecture [19].
Domain Knowledge: During all the experiments, we used twodifferent domain knowledge (DK): Domain Knowledge 1 (DK1),which is the google dictionary definition [7] of each object class;Domain Knowledge 2 (DK2), which is the merged description ofeach object class collected from three different annotators (crowd-sourced approach). By this way, we make sure that the domainknowledge is not keyword dependent and re-ordering happens atsemantic level rather than at any specific keyword matching level.
Evaluation Metrics: In order to illustrate the performance of theproposed approach, evaluation parameters such as Top-1 accuracy,Top-5 accuracy, and improvements in Top-1 accuracy are used. TheTop-1 accuracy is computed as the proportion of images such thatthe ground-truth label is the Top-1 predicted label. Similarly, theTop-5 accuracy is computed as the proportion of images such thatthe ground truth label is one of the Top-5 predicted labels.
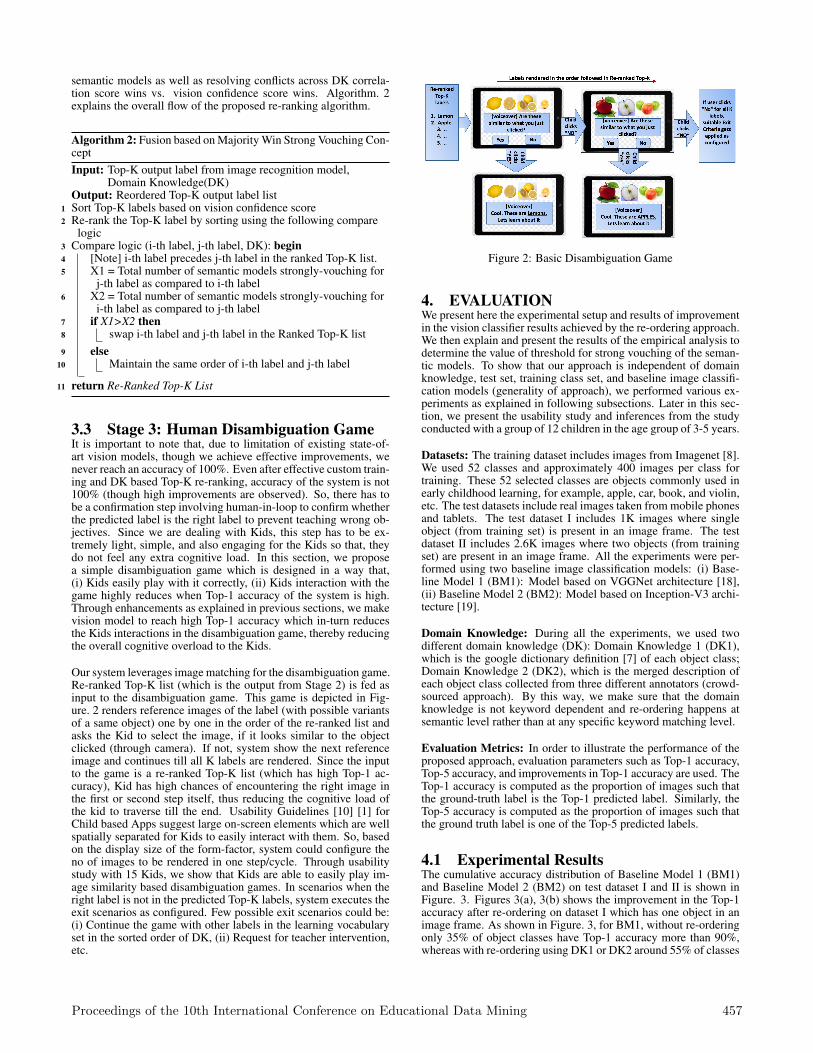
4.1 Experimental ResultsThe cumulative accuracy distribution of Baseline Model 1 (BM1)and Baseline Model 2 (BM2) on test dataset I and II is shown inFigure. 3. Figures 3(a), 3(b) shows the improvement in the Top-1accuracy after re-ordering on dataset I which has one object in animage frame. As shown in Figure. 3, for BM1, without re-orderingonly 35% of object classes have Top-1 accuracy more than 90%,whereas with re-ordering using DK1 or DK2 around 55% of classes
Proceedings of the 10th International Conference on Educational Data Mining 457
(a) (b)
(c) (d)
Figure 3: Cumulative accuracy distribution of Baseline Model 1 &Baseline Model 2 on the data set. I(a-b), II(c-d).
have more than 90% Top-1 accuracy. Similarly, for BM2 our ap-proach shows 20% improvement in number of classes for 90% orabove Top-1 accuracy on dataset I as shown in Figure 3(b).When a child takes an image, it is common that multiple objectsget captured in that image. If more than one object is presentin an image, then the confusion of the classifier highly increaseswhich leads to low Top-1 accuracy. Figure. 3(c), 3(d) show theimprovement in Top-1 accuracy on data set II, where two objects(from training set) are present in an image frame. As shown in Fig-ure. 3(c), for BM1, without re-ordering only 7% of object classeshave Top-1 accuracy more than 90% whereas with re-ordering us-ing DK1 or DK2 around 40% of classes have more than 90% Top-1accuracy. Similarly, for BM2, our approach shows improvementof 45% in number of classes for 90% or more Top-1 accuracy ondataset II as shown in Figure. 3(d).
4.2 Empirical analysis to determine thresholdfor strong vouching of semantic models
In this section, we explain the empirical analysis which determinesthe threshold value required by semantic models for strong vouch-ing as discussed in Section. 3.2. In comparing two elements withrespect to their semantic correlation with domain knowledge (i.e.DK-CS), the threshold stands for the minimum value by which DK-CS of one element should be higher than the other to confidentlysay that the element is semantically more correlated with the do-main knowledge as compared to the other element. Choice of cor-rect threshold value is very cruicial for the proposed approach. Thethreshold value should be as high so as to avoid wrong swappingof labels, and as low to allow correct swapping of labels for betterTop-1 accuracy improvements.For the empirical analysis of threshold value, we conducted exper-iments on dataset II with the following combinations (i) four dif-ferent domain knowledges collected through crowd sourcing, (ii)four different threshold values, and (iii) for both baseline models(BM1&BM2) to make it independent of any local data-behavior.The results are shown in Figure. 4. From the results, we noticedthat the correct threshold value is 0.2 for reordering Top-5 predictedlabels. As observed in Figure. 4, Top-1 accuracy reaches the peakvalue when the threshold value is 0.2. We now discuss the reasonbehind this magical number.
(a) (b)
Figure 4: Improvement in Top-1 accuracy while reordering pre-dicted Top-5 labels for different domain knowledge, threshold val-ues and baseline models
In our approach, we use normalized DK-CS, which means if weconsider equal distribution of labels while reordering Top-5 pre-dicted labels, then the DK-CS for each label is 0.2 (i.e. 1/5). Wepropose that, if DK-CS of one label overrides the semantic scoreof another label by a value near or equal to the 1/k (i.e. individualDK-CS of the labels considering equal distribution of each label),then it is considered as strong vouching by semantic model for theformer label.In order to confirm the above proposed claim, we performed ex-
(a) (b)
Figure 5: Improvement in Top-1 accuracy while reordering pre-dicted Top-4 labels for different Domain Knowledge, ThresholdValues and Baseline Models
periments to reorder Top-4 predicted labels (results are shown inFigure. 5). From the results, we can see that the performance isat peak for threshold between values 0.2 and 0.3, which is near to0.25 (1/k where k is number 4). There is very noticeable degra-dation in performance when threshold is below 0.2 or above 0.3.Similar trends were also observed when experimenting with Top-3re-ordering.Therefore, the correct choice of threshold while re-ordering Top-kpredicted labels is 1/k. When system is tuned to vouch stronglyusing this threshold value, we observe high improvements in Top-1accuracy.
4.3 Usability StudyThe main purpose of this usability study is to observe the followingkey points in children of ages between 3-5 years: (i) whether theycan take images using the camera of a phone or tablet, (ii) whetherthey can perform visual comparison between the physical objectfor which picture was taken, and its reference image provided bythe classifier in the disambiguation game, (iii) comparison of cog-nitive load on children when they see less vs. more number ofimages on a device screen during the game. To conduct this study,we asked the child to play with our app installed on iPads, whichlogged the complete click stream data of the app for tracking vari-ous quantitative parameters. We also noted down the feedback fromparents/observer during the activity play.
We conducted this usability study on 12 children with a total of 29trials. In each trail, a child was allowed to play with the app as long
Proceedings of the 10th International Conference on Educational Data Mining 458

(a) (b)
Figure 6: (a) Cumulative distribution of time taken by children toplay disambiguation game when two and five objects are shown onthe device screen (b) % of times children correctly played disam-biguation game when two and five objects are shown on the devicescreen
s(he) wanted. We observed that some children played only onetime in a trial and some played upto 8 times in a trail. There wereno limitations on the number of trails per child. We did not observeeven a single instance where a child was asked to capture an imageof a relevant object using the camera and s(he) failed to do it. Thisshows that children of that age group can easily take pictures. Theaverage time taken by a child to search for an object in the environ-ment and take picture was 20 seconds. From the collected data, weobserved that around 90% of times, children are able play the dis-ambiguation game correctly. The common feedback which we gotfrom parents/observers is that children liked this app and wanted toplay it again and again.
The comparison of cognitive load on a child when (s)he got 2 objectimages (from Top-2) vs. 5 object images (from Top-5) on a screenduring disambiguation game is shown in Figure.6 (a). Around 95%of children took upto 7 and 11 seconds for disambiguation gamewhen they got 2 and 5 options on a screen, respectively (as shownin figure 6a). Similarly, Figure. 6 (b) shows that on an average achild failed to make a visual comparison only 5% of time (whenthere were 2 images on a screen) and 15% of time (when therewere 5 images on a screen). These results indicate that, child isable to easily play the disambiguation game but the cognitive loadreduces when less number of images were rendered in each turn ofthe game. Since the proposed re-ranking algorithm increases theTop-1 accuracy of the system, the child could reach the right ob-ject in initial rounds of the disambiguation game with high chance,thereby providing a good user experience.
5. CONCLUSIONWe present a holistic visual recognition system for Early Child-hood Learning through physical-digital interaction that improvesrecognition accuracy levels using (a) domain restriction and cus-tom training of vision classifiers, (b) a novel re-ranking algorithmfor multi-modal fusion of contextual information, and (c) semi-automated feedback with different gaming scenarios for right object-tag identification & classifier re-training. Through a usability studywith 12 children, we make the case that engaging user experiencescan indeed be developed to bridge the gap between automatic vi-sual recognition accuracies and the requirement of high accuracyfor meaningful learning activities.
Extensive evaluations on large datasets brought forth the deficiencyof existing multimodal fusion techniques in combining the domainknowledge context with the vision classification results. Using adata driven approach we show the efficacy of our proposed re-ranking algorithm based on strong vouching, and also show thatthe swapping threshold (derived from data) is also anchored in aphysical meaning.
For future work we would like to conduct extensive pilot study withchildren to demonstrate evidence-of-learning for vocabulary acqui-sition using physical-digital interaction. We would also like to useother implicit contexts such as location, speech cues, wearable sen-sors etc. to derive domain knowledge for better multimodal disam-biguation.
6. REFERENCES[1] Usability guidelines for kids. http://rosenfeldmedia.com/wp-
content/uploads/2014/11/DesignforKids-excerpt.pdf.[2] Alien assignment app.
http://my.kindertown.com/apps/alien-assignment, 2017.[3] Aurasma. https://www.aurasma.com/, 2017.[4] Blippar. https://blippar.com/en/, 2017.[5] Conceptnet.
https://github.com/commonsense/conceptnet5/wiki, 2017.[6] Glove. http://nlp.stanford.edu/projects/glove/, 2017.[7] Google dictionary.
http://www.dictionary.com/browse/google, 2017.[8] Imagenet. http://www.image-net.org/, 2017.[9] Layar - augmented reality.
http://appcrawlr.com/ios/layar-reality-browser-augmented,2017.
[10] Usability guidelines for kids.http://hci.usask.ca/publications/2005/HCI_TR_2005_02_-Design.pdf,2017.
[11] Word2vec. https://github.com/dav/word2vec, 2017.[12] A. N. Bhute and B. Meshram. Text based approach for
indexing and retrieval of image and video: A review. arXivpreprint arXiv:1404.1514, 2014.
[13] B. Hart et al. The early catastrophe: The 30 million word gapby age 3. American educator, 27(1):4–9, 2003.
[14] Y. Lin et al. Text-aided image classification: Using labeledtext from web to help image classification. In WebConference (APWEB), 2010 12th International Asia-Pacific,pages 267–273. IEEE, 2010.
[15] H. Ma et al. Bridging the semantic gap between imagecontents and tags. IEEE Transactions on Multimedia,12(5):462–473, 2010.
[16] T. Mikolov et al. Distributed representations of words andphrases and their compositionality. In Advances in neuralinformation processing systems, pages 3111–3119, 2013.
[17] B. C. Roy et al. Predicting the birth of a spoken word.Proceedings of the National Academy of Sciences,112(41):12663–12668, 2015.
[18] K. Simonyan and A. Zisserman. Very deep convolutionalnetworks for large-scale image recognition. arXiv preprintarXiv:1409.1556, 2014.
[19] C. Szegedy et al. Rethinking the inception architecture forcomputer vision. In Proceedings of the IEEE Conference onComputer Vision and Pattern Recognition, pages 2818–2826,2016.
[20] L. Tian et al. Image classification based on the combinationof text features and visual features. International Journal ofIntelligent Systems, 28(3):242–256, 2013.
[21] G. Wang et al. Building text features for object imageclassification. In Computer Vision and Pattern Recognition,pages 1367–1374. IEEE, 2009.
[22] C. Xu et al. Fusion of text and image features: A newapproach to image spam filtering. In Practical Applicationsof Intelligent Systems, pages 129–140. Springer, 2011.
[23] Y. Zhang et al. Understanding bag-of-words model: astatistical framework. International Journal of MachineLearning and Cybernetics, 1(1-4):43–52, 2010.
Proceedings of the 10th International Conference on Educational Data Mining 459

Student Learning Strategies and Behaviors to Predict Success in an Online Adaptive Mathematics Tutoring
SystemJun Xie
University of Memphis 3720 Alumni Ave,
Memphis, TN 38152 (901)678-2000
Alfred Essa McGraw Hill Education
281 Summer Street, Boston, MA 02210
(800)338-3987 [email protected]
Shirin Mojarad McGraw Hill Education
281 Summer Street, Boston, MA 02210
(800)338-3987 [email protected]
om Ryan S. Baker
University of Pennsylvania 3451 Walnut Street,
Philadelphia, PA 19104-6291 (215)573-2990
Keith Shubeck University of Memphis
3720 Alumni Ave, Memphis, TN 38152
(901)678-2000 [email protected]
Xiangen Hu
University of Memphis 3720 Alumni Ave,
Memphis, TN 38152 (901)678-5736
ABSTRACT Student learning strategies play a critical role in their overall success. The central goal of this study is to investigate how learning strategies are related to student success in an online adaptive mathematics tutoring system. To accomplish this goal, we developed a model to predict student performance based on their strategies in ALEKS, an online learning environment. We have identified student learning strategies and behaviors in seven main categories: help-seeking, multiple consecutive errors, learning from errors, switching to a new topic, topic mastery, reviewing previous mastered topics, and changes in behavior over time. The model, developed by using stepwise logistic regression, indicated that requesting two consecutive explanations, making consecutive errors and requesting an explanation, and changes in learning behaviors over time, were associated with lower success rates in the semester-end assessment. By contrast, the reviewing previous mastered topics strategy was a positive predictor of success in the last assessment. The results showed that the predictive model was able to predict students’ success with reasonably high accuracy.
Keywords
Help-seeking, errors, learning strategy, math, student success, adaptive tutoring system
1. INTRODUCTION Computer-based learning environments, particularly intelligent tutoring systems (ITS), are becoming more commonly used to assist students in their acquisition of knowledge. Computer-based tutors provide tailored instruction and one-to-one tutoring, which can improve students’ learning experiences and their motivation. These learning systems also provide unique and critical insight to learning science researchers by creating exhaustive archives of student learning behaviors. A central goal of investigating student learning processes is to unveil the associations between learning behaviors and performance, ultimately allowing learning system
developers and researchers to predict and understand student performance. This knowledge allows for evidence-based and individually tailored feedback to be provided to students who are struggling to learn.
2. RELATED WORK Many studies have investigated the relationships between learning behaviors and success in learning [1, 2]. The most frequent learning behaviors used in the current literature involve help-seeking, making errors, persistence, and changes in learning behaviors over time [3, 4, 5]. For example, worked examples, an effective and commonly used type of help, can be overused by students, negatively affecting learning [6]. However, asking for help after making an error has been found to be an effective help-seeking strategy, particularly for high prior knowledge students [7]. Additionally, reading a worked example after solving a problem can foster better learning than practice alone and reading a worked example before solving a problem can improve learning when compared to reading a worked example after solving a problem [8, 9].
Clearly, there is a delicate interplay between help-seeking strategies students use, their prior knowledge, and learning success. Whether students benefit from making errors often depends on how errors are approached pedagogically. Errors, when treated as stemming from student inadequacies, can trigger math anxiety, which negatively affects students’ learning [10, 11]. An extreme example of making errors during learning is seen in wheel-spinning behaviors, in which students attempt ten problems or more without mastering the topic. While too many consecutive errors (i.e. wheel-spinning) undermine learning performance [12], repeated failure in the low-skill phase has been found to improve the likelihood of success in the next step [5] and to lead to more robust learning [13]. Furthermore, the errors that naturally occur from desirable difficulty are considered to be an essential element in learning [14] and facilitate long-term knowledge retention and transfer [15, 16, 17].
Proceedings of the 10th International Conference on Educational Data Mining 460

Many of the current computer-based tutoring systems are designed to provide students more autonomy by allowing them to learn at their own pace. In self-paced or self-regulated tutoring systems, students’ learning behaviors tend to change over time during learning. These changes in learning behaviors over time represent an important aspect of learning for researchers to understand. Relatively more well-structured behavior over time is positively related to reading performance, whereas more chaotic, less-structured learning behaviors are related to poor reading performance [4].
Persistence is another increasingly studied behavior in learning research. For example, persistence is measured as time spent on unsolved problems during solving anagrams and riddles [18]. Persistence on challenging tasks is associated with mastery goals, which benefit learning [19]. Given these definitions of persistence, a contrasting learning behavior could be considered frequently switching topics within a learning system to find easier topics, an example of gaming the system [20]. Based on students’ self-reports, persistence was also found to positively related to student satisfaction with the computer-based tutoring system [21]. However, unproductive persistence (i.e. wheel-spinning) impedes learning, but various formats of problems and spaced practice can reduce unproductive persistence and improve learning [22].
Reviewing previous learned materials is an efficient way to improve learning. Per Ebbinghuas’ forgetting curve [23], memory retention declines over time. Repeated exposure to previously learned materials can enhance memory retention and improve learning [24]. An example of reviewing previously learned materials is seen in the retrieval practice, which was found to improve students’ memory retention of reading materials [25] as well accuracy in solving “student-and-professor” algebra word problems [26].
This study aims to investigate which learning behaviors predict student success in ALEKS (Assessment and Learning Knowledge Spaces), a math tutoring system that adapts to students’ knowledge [27]. Given the above literature, help-seeking behaviors, multiple consecutive errors, learning from errors, temporal behavioral changes, persistence (i.e. switch to a new topic without mastering the current topic), and reviewing previous mastered topics were selected as potential predictors of success in ALEKS. In addition, the percentage of topics that have been mastered, an indicator of learning progress, is included in the model to predict success.
3. Description of ALEKS ALEKS is a web-based artificially intelligent learning and assessment system [27]. Its artificial intelligence is based on a theoretical framework called Knowledge Space Theory (KST) [28]. KST allows domains to be represented as a knowledge map consisting of many knowledge states, which represent the prerequisite relationships between different knowledge states (KS). Therefore, KST allows for a precise description of a student’s current knowledge state, and what a student is ready to learn next. ALEKS can estimate a student’s initial KS by conducting a diagnostic assessment (based on a test) when the student first begins to interact with the system. ALEKS conducts assessments during students’ progress through the course to update their knowledge states and to decide what the student is ready to learn next.
For each topic within ALEKS, a problem is randomly generated, with adjustments made to several parameters for each problem type. This results in an enormous set of unique problems. Students
are required to provide solutions in the form of free-response answers, rather than by selecting an answer from multiple choices. Explanations in the form of worked examples can be requested by students at any time. When an explanation is requested, a worked example for the current problem is provided and a new problem is provided to the student. The interface of ALEKS is displayed in Figure 1.
ALEKS is self-paced; students can choose topics to learn and can choose when they want to request help. All the topics that the student is most ready to learn (per the KST model) are displayed in his or her knowledge pie (Figure 2). The knowledge pie presents the student’s learning progress in each math subdomain as well.
Research has shown ALEKS produces learning outcomes comparable with other effective tutoring systems for teaching Algebra [29]. Using ALEKS as an after-school program has also been observed to be as effective as interacting with expert teachers [32]. Students need less assistance during learning when using ALEKS than in traditional curricula [31]. Additionally, ALEKS has been found to reduce the math performance discrepancies between ethnicities in an after-school program [32].
Figure 1. The ALEKS interface
Figure 2. The ALEKS knowledge pie
Proceedings of the 10th International Conference on Educational Data Mining 461

4. Data The data used in this study was collected from 179 students within 11 college classes that used ALEKS for developmental mathematics in Fall 2016. The data is comprised of information about students’ learning actions and assessment scores. These actions include “correct” (C), “wrong” (W), mastering a topic (S; three C’s in a row within a single topic), failing a topic (F; five W’s in a row within a single topic) and explanations (E; requesting an explanation). The data also contains students’ last assessment scores in ALEKS which account for students’ performance in ALEKS. 5. METHODS We employed stepwise logistic regression with backward elimination to predict students’ success in ALEKS, using a training-test split. More details of this process are described below.
5.1 Student success Success in ALEKS is defined as students knowing 60% or more of the topics in their last assessment. Therefore, we adopted 60% in the semester-end assessment as a cut-off value for success. Students whose last assessment score was 60% or greater were grouped as “successful students”, whereas those with last assessment scores under 60% was grouped as “unsuccessful students”. The dataset was randomly split into two parts: 60% of students’ data were used to train the model (N=107), and 40% were used to test the model’s generalizability (N= 72). Success was labeled as 1 and failure was labeled as 0 in the prediction model.
5.2 The features to predict success The following behavior patterns were used to predict student success: (1) help-seeking i.e., requesting an explanation after making an error (WE), and requesting two sequential explanations (EE); (2) multiple consecutive errors i.e., making two sequential errors (WW), making an error again after an error and requesting an explanation (WEW), making an error again after an error and requesting two explanations (WEEW), and the overall percentage of failure labeled by ALEKS (PF); (3) learning from errors i.e., providing a correct answer after making an error (WC), providing a correct answer after making an error and requesting an explanation (WEC), and providing a correct answer after making an error and requesting two explanations (WEEC); (4) switching to a new topic i.e., switching to a new topic after making an error or requesting an explanation (PNew), and switching to a new topic because of failure on a topic (FNew); (5) topic mastery (PS), i.e. providing three correct responses in a row; (6) reviewing previous mastered topics (PReview); and finally, (7) changes in learning behaviors over time (measured using the entropy metric).
The features of the first four aspects mentioned above were generated by using D’Mello’s likelihood metric [33] (Equation 1).
The likelihood metric is used to compute the transition probability of an event to another event. In the case of multiple events, we calculate a proportion of each sequence out of the number of sequences of that length. For example, the probability of WEEW means the transition probability of WEE to W. In this case, WEE is represented as Mt and W is represented as Mt+1 in the formula. When the value produced by the likelihood metric is higher than 0, it signifies that Mt+1 occurs after Mt more frequently than the base rate of Mt+1. Otherwise, Mt+1 occurs after Mt at a rate lower or equal than the base rate of Mt+1.
(1)
Shannon entropy is used to compute the degree of regularity in the changes in students’ learning behaviors over time (specifically focusing on the shifts between making an error, give a correct answer, and requesting an explanation) [34] (Equation 2). High entropy values represent disordered leaning behavior patterns. On the contrary, low entropy implies ordered pattern of learning behaviors:
(2)
The details on how the features were computed are listed below in table 1.
Table 1. Descriptions of features used to predict success
Features Description
WE The transition probability from making an error to requesting an explanation
EE The transition probability from requesting an explanation to requesting another explanation
WW The transition probability from making an error to making an error again
WEW The transition probability from making an error and requesting an explanation to making an error again
WEEW The transition probability from making an error and requesting two sequential explanations to making an error again
PF The proportion of times a student made five consecutive errors
WC The transition probability from making an error to giving a correct answer
WEC The transition probability from making an error and requesting an explanation to giving a correct answer
WEEC The transition probability from making an error and requesting two sequential explanations to giving a correct answer
PNew The probability of starting a new topic after making an error or requesting an explanation on the current topic
FNew The probability of starting a new topic after failing a topic
PS The proportion of the mastered topics out of the number of the attempted topics during learning
PReview The percentage of mastered topics that the student reviews after mastering them
Entropy The entropy value produced based on students’ learning behaviors
Proceedings of the 10th International Conference on Educational Data Mining 462

6. RESULTS 6.1 Description of features Before building the prediction model, we calculated basic descriptive statistics. The mean and standard deviations are listed in Table 2.
Table 2. Feature means and standard deviations
Features M S.D.
WE .40 .11
EE -.07 .07
WW -.02 .08
WEW .15 .09
WEEW .06 .25
PF .07 .07
WC -.69 .37
WEC -.07 .18
WEEC -.22 .46
PNew .001 .01
FNew .76 .33
PS .87 .10
PReview .14 .11
Entropy .51 .11
6.2 Model development Stepwise logistic regression with backward elimination was used to generate the predictive model of students’ success. The final model included requesting an explanation after making an error (WE), requesting two sequential explanations (EE), making an error again after making an error and requesting an explanation (WEW), changes in learning behaviors over time (entropy) and review on the topic (PReview). Each of these metrics were statistically significant predictors of students’ success (i.e. the score in the last assessment is greater or less than 60%) in ALEKS. The details on the prediction model are displayed in Table 3.
Table 3. The results of multi-feature logistic regression on students' success
B S.E. Z value p
Intercept 3.32 1.63 2.04 .04*
WE 4.25 2.31 1.84 .07
EE -8.31 4.05 -2.06 .04*
WEW -11.33 3.40 -3.33 .00***
Entropy -10.34 2.91 -3.55 .00***
PReview 9.44 2.57 3.67 .00***
Note. p<.000 ***, p<.05 *
The results of multicollinearity indicated that there were low correlations between features. The VIF value (i.e. variance inflation factor) for each feature is illustrated in Table 4.
Furthermore, logistic regressions that only include one single feature were conducted to examine suppression effect. The results were listed in Table 5. The results showed that compared to the results of multi-feature logistic regression, the direction of relationship between each feature and success did not change in the single-feature logistic regression. Therefore, the relationship between features and success was not impacted by suppression effect.
Then, based on the results of logistic regressions, students were less likely to be successful in the last assessment if they tend to read two consecutive explanations, or made an error after making an error and requesting an explanation, or demonstrated irregularity in their learning behaviors. By contrast, the more frequently students reviewed topics they have already mastered, the more likely they were to pass the last assessment in ALEKS.
Table 4. Multicollinearity between features in the prediction model
WE EE WEW entropy PReview
VIF 1.02 1.32 1.17 1.66 1.50
Table 5. The summary of single-feature logistic regressions on
students' success B Z value
WE 4.40 2.32
EE -0.61 -.23
WEW -9.12 -3.44
Entropy -5.01 -2.62
PReview 5.24 2.60
6.3 Model goodness The fitness index of the prediction model (i.e. AIC) of training data was 115.67. McFadden pseudo r2 of training data was .30, indicating that this model predicts a substantial amount of the variance in student success. The model’s accuracy of prediction on test data was 0.71. The AUC of test data (area under the ROC curve) was 0.77. The plot of the ROC curve is illustrated in Figure 3.
Figure 3. The ROC plot of the prediction model
Proceedings of the 10th International Conference on Educational Data Mining 463
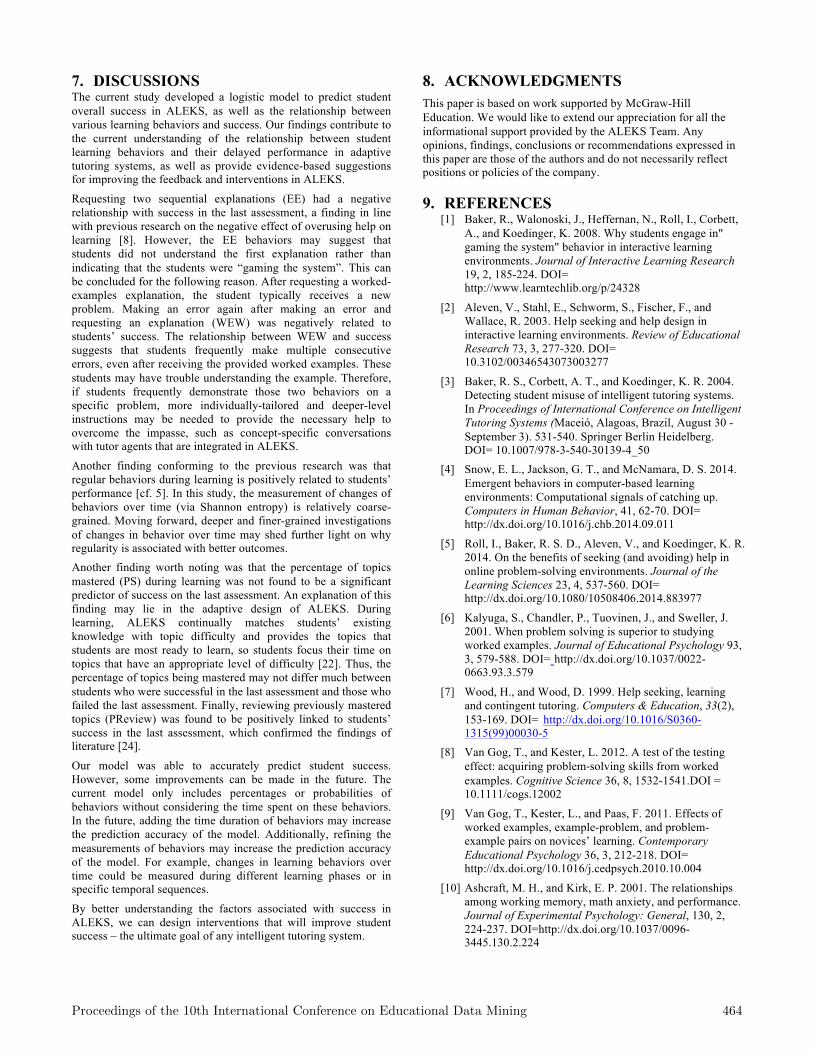
7. DISCUSSIONS The current study developed a logistic model to predict student overall success in ALEKS, as well as the relationship between various learning behaviors and success. Our findings contribute to the current understanding of the relationship between student learning behaviors and their delayed performance in adaptive tutoring systems, as well as provide evidence-based suggestions for improving the feedback and interventions in ALEKS.
Requesting two sequential explanations (EE) had a negative relationship with success in the last assessment, a finding in line with previous research on the negative effect of overusing help on learning [8]. However, the EE behaviors may suggest that students did not understand the first explanation rather than indicating that the students were “gaming the system”. This can be concluded for the following reason. After requesting a worked-examples explanation, the student typically receives a new problem. Making an error again after making an error and requesting an explanation (WEW) was negatively related to students’ success. The relationship between WEW and success suggests that students frequently make multiple consecutive errors, even after receiving the provided worked examples. These students may have trouble understanding the example. Therefore, if students frequently demonstrate those two behaviors on a specific problem, more individually-tailored and deeper-level instructions may be needed to provide the necessary help to overcome the impasse, such as concept-specific conversations with tutor agents that are integrated in ALEKS.
Another finding conforming to the previous research was that regular behaviors during learning is positively related to students’ performance [cf. 5]. In this study, the measurement of changes of behaviors over time (via Shannon entropy) is relatively coarse-grained. Moving forward, deeper and finer-grained investigations of changes in behavior over time may shed further light on why regularity is associated with better outcomes. Another finding worth noting was that the percentage of topics mastered (PS) during learning was not found to be a significant predictor of success on the last assessment. An explanation of this finding may lie in the adaptive design of ALEKS. During learning, ALEKS continually matches students’ existing knowledge with topic difficulty and provides the topics that students are most ready to learn, so students focus their time on topics that have an appropriate level of difficulty [22]. Thus, the percentage of topics being mastered may not differ much between students who were successful in the last assessment and those who failed the last assessment. Finally, reviewing previously mastered topics (PReview) was found to be positively linked to students’ success in the last assessment, which confirmed the findings of literature [24].
Our model was able to accurately predict student success. However, some improvements can be made in the future. The current model only includes percentages or probabilities of behaviors without considering the time spent on these behaviors. In the future, adding the time duration of behaviors may increase the prediction accuracy of the model. Additionally, refining the measurements of behaviors may increase the prediction accuracy of the model. For example, changes in learning behaviors over time could be measured during different learning phases or in specific temporal sequences.
By better understanding the factors associated with success in ALEKS, we can design interventions that will improve student success – the ultimate goal of any intelligent tutoring system.
8. ACKNOWLEDGMENTS This paper is based on work supported by McGraw-Hill Education. We would like to extend our appreciation for all the informational support provided by the ALEKS Team. Any opinions, findings, conclusions or recommendations expressed in this paper are those of the authors and do not necessarily reflect positions or policies of the company.
9. REFERENCES [1] Baker, R., Walonoski, J., Heffernan, N., Roll, I., Corbett,
A., and Koedinger, K. 2008. Why students engage in" gaming the system" behavior in interactive learning environments. Journal of Interactive Learning Research 19, 2, 185-224. DOI= http://www.learntechlib.org/p/24328
[2] Aleven, V., Stahl, E., Schworm, S., Fischer, F., and Wallace, R. 2003. Help seeking and help design in interactive learning environments. Review of Educational Research 73, 3, 277-320. DOI= 10.3102/00346543073003277
[3] Baker, R. S., Corbett, A. T., and Koedinger, K. R. 2004. Detecting student misuse of intelligent tutoring systems. In Proceedings of International Conference on Intelligent Tutoring Systems (Maceió, Alagoas, Brazil, August 30 - September 3). 531-540. Springer Berlin Heidelberg. DOI= 10.1007/978-3-540-30139-4_50
[4] Snow, E. L., Jackson, G. T., and McNamara, D. S. 2014. Emergent behaviors in computer-based learning environments: Computational signals of catching up. Computers in Human Behavior, 41, 62-70. DOI= http://dx.doi.org/10.1016/j.chb.2014.09.011
[5] Roll, I., Baker, R. S. D., Aleven, V., and Koedinger, K. R. 2014. On the benefits of seeking (and avoiding) help in online problem-solving environments. Journal of the Learning Sciences 23, 4, 537-560. DOI= http://dx.doi.org/10.1080/10508406.2014.883977
[6] Kalyuga, S., Chandler, P., Tuovinen, J., and Sweller, J. 2001. When problem solving is superior to studying worked examples. Journal of Educational Psychology 93, 3, 579-588. DOI= http://dx.doi.org/10.1037/0022-0663.93.3.579
[7] Wood, H., and Wood, D. 1999. Help seeking, learning and contingent tutoring. Computers & Education, 33(2), 153-169. DOI= http://dx.doi.org/10.1016/S0360-1315(99)00030-5
[8] Van Gog, T., and Kester, L. 2012. A test of the testing effect: acquiring problem-‐solving skills from worked examples. Cognitive Science 36, 8, 1532-1541.DOI = 10.1111/cogs.12002
[9] Van Gog, T., Kester, L., and Paas, F. 2011. Effects of worked examples, example-problem, and problem-example pairs on novices’ learning. Contemporary Educational Psychology 36, 3, 212-218. DOI= http://dx.doi.org/10.1016/j.cedpsych.2010.10.004
[10] Ashcraft, M. H., and Kirk, E. P. 2001. The relationships among working memory, math anxiety, and performance. Journal of Experimental Psychology: General, 130, 2, 224-237. DOI=http://dx.doi.org/10.1037/0096-3445.130.2.224
Proceedings of the 10th International Conference on Educational Data Mining 464

[11] Moser, J. S., Moran, T. P., Schroder, H. S., Donnellan, M. B., and Yeung, N. 2013. On the relationship between anxiety and error monitoring: a meta-analysis and conceptual framework. Frontiers in Human Neuroscience,7,1-19. DOI= 10.3389/fnhum.2013.00466
[12] Beck J., and Rodrigo M.M.T. 2014. Understanding Wheel Spinning in the Context of Affective Factors. In Proceedings of 12th Intelligent Tutoring System (Honolulu, Hawaii, USA, June 5- 9, 2014). Lecture Notes in Computer Science, 162-167. Springer, Cham. DOI= 10.1007/978-3-319-07221-0_20
[13] Baker, R.S.J.d., Gowda, S., and Corbett, A.T. 2011. Towards predicting future transfer of learning. In Proceedings of 15th International Conference on Artificial Intelligence in Education (Canterbury, New Zealand, June 27- July 1, 2011). 23-30. DOI= 10.1007/978-3-642-21869-9_6
[14] Bjork, R. A., Dunlosky, J., and Kornell, N. 2013. Self-regulated learning: Beliefs, techniques, and illusions. Annual Review of Psychology, 64, 417-444. DOI= 10.1146/annurev-psych-113011-143823
[15] Lee, T. D. 2012. Contextual Interference: Generalizability and limitations. In Skill Acquisition in Sport: Research, Theory, and Practice II. 79-93. Routledge, London.
[16] Simon, D. A., and Bjork, R. A. 2001. Metacognition in motor learning. Journal of Experimental Psychology: Learning, Memory, and Cognition 27, 4, 907-912. DOI= http://dx.doi.org/10.1037/0278-7393.27.4.907
[17] Taylor, K., and Rohrer, D. 2010. The effects of interleaved practice. Applied Cognitive Psychology 24, 6, 837-848. DOI= 10.1002/acp.1598
[18] Ventura, M., Shute, V., and Zhao, W. 2013. The relationship between video game use and a performance-based measure of persistence. Computers & Education 60, 1, 52-58. DOI= http://dx.doi.org.ezproxy.memphis.edu/10.1016/j.compedu.2012.07.003
[19] American Psychological Association, Coalition for Psychology in Schools and Education. 2015. Top 20 principles from psychology for preK–12 teaching and learning.
[20] Kai, S., Almeda, M. V., Baker, R. S., Shechtman, N., Heffernan, C., and Heffernan, N. 2017. Modeling wheel-spinning and productive persistence in skill builders. Journal of Educational Data Mining (in press).
[21] Levy, Y. 2007. Comparing dropouts and persistence in e-learning courses. Computers & education 48, 2, 185-204. DOI= http://dx.doi.org/10.1016/j.compedu.2004.12.004
[22] Baker, R.S.J.d., Mitrovic, A., and Mathews, M. 2010. Detecting Gaming the System in Constraint-Based Tutors. In Proceedings of the 18th Annual Conference on User Modeling, Adaptation, and Personalization (Big
Island, HI, USA, June 20-24, 2010), 267-278. DOI= 10.1007/978-3-642-13470-8_25
[23] Averell, L., and Heathcote, A. 2011. The form of the forgetting curve and the fate of memories. Journal of Mathematical Psychology 55, 1, 25-35. DOI=http://dx.doi.org/10.1016/j.jmp.2010.08.009
[24] Rohrer, D. 2015. Student instruction should be distributed over long time periods. Educational Psychology Review 27, 4, 635-643. DOI=10.1007/s10648-015-9332-4
[25] Roediger III, H. L., and Karpicke, J. D. 2006. Test-enhanced learning: Taking memory tests improves long-term retention. Psychological Science 17, 3, 249-255. DOI= 10.1111/j.1467-9280.2006.01693.x
[26] Christianson, K., Mestre, J. P., and Luke, S. G. 2012. Practice makes (nearly) perfect: Solving ‘students-‐and-‐professors’-‐type algebra word problems. Applied Cognitive Psychology 26, 5, 810-822. DOI= 10.1002/acp.2863
[27] https://www.aleks.com/about_aleks
[28] Falmagne JCJ-C, Thiéry N, and Cosyn E, et al 2006. The Assessment of Knowledge, in Theory and in Practice. Form Concept Anal 3874, 61–79. DOI= 10.1109/KIMAS.2003.1245109
[29] Sabo, K E., Atkinson, R. K., Barrus, A. L., Joseph, S. S., and Perez, R.S. 2013. Searching for the two sigma advantage: evaluating algebra intelligent tutors. Computers in Human Behavior 29, 4 ,1833-1840. DOI= http://dx.doi.org/10.1016/j.chb.2013.03.001
[30] Craig SD, Hu X, and Graesser AC, et al 2013. The impact of a technology-based mathematics after-school program using ALEKS on student’s knowledge and behaviors. Comput Educ 68, 495–504. DOI= 10.1016/j.compedu.2013.06.010
[31] Hu, X., et. 2012. The effects of a traditional and technology-based after-school program on 6th grade student's mathematics skills. Journal of Computers in Mathematics and Science Teaching 31, 1, 17-38. DOI= http://www.editlib.org/p/38628/
[32] Huang, X., Craig, S.D., Xie, J., Graesser, A., and Hu, X. 2016. Intelligent tutoring systems work as a math gap reducer in 6th grade after-school program. Learning and Individual Differences 47, 258-265. DOI= http://dx.doi.org/10.1016/j.lindif.2016.01.012
[33] D’Mello, S. and Graesser, A. 2012. Dynamics of affective states during complex learning. Learning and Instruction 22, 2, 145-157. DOI= http://dx.doi.org/10.1016/j.learninstruc.2011.10.001.
[34] Shannon, C. E. 1951. Prediction and entropy of printed English. Bell System Technical Journal 30, 1, 50–64. DOI=10.1002/j.1538-7305.1951.tb01366.x.
Proceedings of the 10th International Conference on Educational Data Mining 465

Adaptive Assessment Experiment in a HarvardX MOOC Ilia Rushkin
Harvard University Cambridge, USA
Colin Fredericks Harvard University Cambridge, USA
Yigal Rosen Harvard University Cambridge, USA
Dustin Tingley Harvard University Cambridge, USA
[email protected] Glenn Lopez
Harvard University Cambridge, USA
Andrew Ang Harvard University Cambridge, USA
Mary Jean Blink TutorGen, Inc
Fort Thomas, USA [email protected]
ABSTRACT We report an experimental implementation of adaptive learning functionality in a self-paced HarvardX MOOC (massive open online course). In MOOCs there is need for evidence-based instructional designs that create the optimal conditions for learners, who come to the course with widely differing prior knowledge, skills and motivations. But users in such a course are free to explore the course materials in any order they deem fit and may drop out any time, and this makes it hard to predict the practical challenges of implementing adaptivity, as well as its effect, without experimentation. This study explored the technological feasibility and implications of adaptive functionality to course (re)design in the edX platform. Additionally, it aimed to establish the foundation for future study of adaptive functionality in MOOCs on learning outcomes, engagement and drop-out rates. Our preliminary findings suggest that the adaptivity of the kind we used leads to a higher efficiency of learning (without an adverse effect on learning outcomes, learners go through the course faster and attempt fewer problems, since the problems are served to them in a targeted way). Further research is needed to confirm these findings and explore additional possible effects.
Keywords
MOOCs; assessment; adaptive assessment; adaptive learning.
1. INTRODUCTION Digital learning systems are considered adaptive when they can dynamically change the presentation of content to any user based on the user’s individual record of interactions, as opposed to simply sending users into different versions of the course based on preexisting information such as user’s demographic information, education level, or a test score. Conceptually, an adaptive learning system is a combination of two parts: an algorithm to dynamically assess each user’s current profile (the current state of knowledge, but potentially also affective factors, such as frustration level), and, based on this, a recommendation engine to decide what the user should see next. In this way, the system seeks to optimize individual user experience, based on each user’s prior actions, but also based on the actions of other users (e.g. to identify the course items that many others have found most useful in similar circumstances). Adaptive technologies build on decades of
research in intelligent tutoring systems, psychometrics, cognitive learning theory and data science [1, 3, 4].
Harvard University partnered with TutorGen to explore the feasibility of adaptive learning and assessment technology implications of adaptive functionality to course (re)design in HarvardX, and examine the effects on learning outcomes, engagement and course drop-out rates. As the collaboration evolved, the following two strategic decisions were made: (1) Adaptivity would be limited to assessments in four out of 16 graded sub-sections of the course. Extra problems would be developed to allow adaptive paths; (2) Development efforts would be focused on Harvard-developed Learning Tools Interoperability (LTI) tool to support assessment adaptivity on edX platform. Therefore, in the current prototype phase of this project, adaptive functionality is limited to altering the sequence of problems, based on continuously updated statistical inferences on knowledge components a user mastered. As a supplement to these assessment items, a number of additional learning materials are served adaptively as well, based on the rule that a user should see those before being served more advanced problems.
While the prototype enabled us to explore the feasibility of adaptive assessment technology and implications of adaptive functionality to course (re)design in HarvardX, it is still challenging to judge its effects on learning outcomes, engagement and course drop-out rates due to the prototype limitations. However, we believe that the study will help to establish a solid foundation for future research on the effects of adaptive learning and assessment on outcomes such as learning gains and engagement. [5]
2. SETUP AND USER EXPERIENCE The HarvardX course in this experiment was “Super-Earths and Life”. It deals with searching for planets orbiting around stars other than the Sun, in particular the planets capable of supporting life. The subject matter is physics, astronomy and biology. Roughly speaking, the course aims at users with college-level knowledge of physics and biology. Some of the assessment material in the course requires calculations, and some requires extensive factual knowledge (e.g. questions about DNA structure).
Proceedings of the 10th International Conference on Educational Data Mining 466

Two versions of the course have already run in the edX platform, our adaptivity was implemented as part of the course re-design for the third run.
A number of subsections in the course contained assessment modules (homeworks). The experiment consisted of making four of these homeworks adaptive for some of the users. At the moment of their registration, the course users were randomly split 50%-50% into an experimental group and into a control group. When arriving to a homework, users in the control group see a predetermined, non-adaptive set of problems on a page. The same is true for the experimental group in all homeworks except the four where we deployed the adaptive tool. In these homeworks, a user from the experimental group is served problems sequentially, one by one, in the order that is individually determined on-the-fly based on the user’s prior performance. In addition to problems, some instructional text pages were also included in the serving sequence.
To enable adaptivity, we manually compiled a list of knowledge components (KCs, for our purposes synonymous with “learning objectives”, “learning outcomes”, or “skills”) and tagged problems in the course with one or several knowledge components. This tagging was done for all assessment items in the course (as well as for some learning materials), enabling the adaptive engine to gather information from any user’s interaction with any problem in the course, not only with those problems that are served adaptively. Additionally, the problems in the 4 adaptive homeworks were tagged with one of three difficulty levels: advanced, regular and easy (other problems in the course were tagged by default as regular). No pre-requisite relationships or other connections among the knowledge components were used.
The adaptive engine (a variety of Bayesian Knowledge Tracing algorithm) decides which problem to serve next based on the list of KCs covered by the homework and course material. Additional rules could be incorporated into the serving strategy. Thus, we had a rule that before any problem of difficulty level “Advanced”, the user should see a special page with advanced learning material.
The parity between experimental and control groups was set up as follows. In the pool from which problems are adaptively served to the experimental group, all the regular-difficulty problems were the ones that the control group saw in these homework. The control group had access to the easy and advanced problems as well: students in this group saw a special “extra materials” page after each of the 4 experimental homeworks. This page contained the links to all the advanced instructional materials and advanced and easy problems for this homework, for no extra credit. Thus, all the materials that an experimental user can see, were also available to the control students. There were two main reasons for this: obvious usefulness for comparative studies, and enabling all students, experimental and control, to discuss all problems in the course forum.
When an experimental group user is going through an adaptive homework, the LTI tool loads edX problem pages in an iFrame.
Submitting (“checking”) an answer to the problem triggers an update of user’s mastery, but does not trigger serving the next problem. For that to happen, the user has to click the button “Next Question” outside the iFrame. The user always can revisit any of the previously served problems.
In edX, users usually get several attempts at a problem. Thus, it may be possible for a user to submit a problem after the next problem has already been served. Fig. 1, for instance, shows a situation, where so far 4 problems have been served (note the numbered tabs in the upper left), but the user is currently viewing problem 2 in this sequence, not the latest one. The user is free to re-submit this problem, which will update the user’s mastery (although in this case there is no need to do so, since it appears that problem 2 has been answered correctly). It will not alter the existing sequence (problems 3 and 4 will not be replaced by others), but it may have effect on what will be served as 5 and so on.
The user interface keeps track of the total number of points earned in a homework (upper right corner in Fig. 1). The user knows how many points in total are required and may choose to stop once this is achieved (earning more points will no longer affect the grade). Otherwise, the serving sequence ends when the pool of questions is exhausted. Potentially, it could also end when the user’s probability of mastery on all relevant KCs passes a certain mastery threshold (a high probability, at which we consider the mastery to be, in practical terms, certain; it was set to 0.9). However, in this particular implementation, due to having only a modest number of problems, this was not done.
In order to explore possible effects of adaptive experiences on learners’ mastery of content knowledge competence-based pre- and post-assessment were added to the course and administered to study participants in both experimental and control groups. Typical HarvardX course clickstream time-stamped data and pre-post course surveys data was collected.
2.1 Course Design Considerations Adaptive learning techniques require the development of additional course materials, so that different students can be provided with different content. For our prototype, tripling the existing content in the four adaptive subsections was considered a minimum to provide a genuine adaptive experience. This was achieved by work from the project lead and by hiring an outside content expert. This did not provide each knowledge component with a large number of problems, reducing the significance of knowledge tracing, but it was sufficient for the purpose of our experiment. The total time outlay was ~200 hours. Keeping the problems housed within the edX platform avoided substantial amounts of software development.
The tagging of content with knowledge components was done by means of a shared Google spreadsheet, which contained a list of content items in one sheet (both assessment and learning materials), a list of knowledge components in another, and a correspondence table (the tagging itself), including the difficulty levels, in the third.
Most of the time was spent on creating new problems based on the existing ones. For these the tagging process was “reversed”: rather than tag existing content with knowledge components, the experts created content targeting knowledge components and difficulty levels. Commonly, an existing problem was considered to be of “regular” difficulty, and the expert’s task was to create an “easy” and/or an “advanced” version of it.
Proceedings of the 10th International Conference on Educational Data Mining 467

103 distinct knowledge components were used in tagging. The experts used their judgement in defining them. 66 of these were used in tagging problems, and in particular the 39 adaptively served problems were tagged with 25 KCs. The granularity of KCs was such that a typical assessment problem was tagged with one learning objective (which is desirable for knowledge tracing). Namely, among the adaptively served problems, 31 were tagged with a single KC, 7 problems – with 2 KCs, and 1 problem – with 3.
2.2 LTI Tool Development To enable the use of an adaptive engine in an edX course, Harvard developed the Bridge for Adaptivity (BFA) tool (open-source, GitHub link available upon request). BFA is a web application that uses the LTI specification to integrate with learning management systems such as edX. BFA acts as the interface between the edX course platform and the TutorGen SCALE (Student Centered Adaptive Learning Engine) system, and handles the display of problems recommended by the adaptive engine. Problems are accessed by edX XBlock URLs.
This LTI functionality allows BFA to be embedded in one or more locations in the course (4 locations in our case). The user interface seen by a learner when they encounter an installed tool instance is that shown in Fig. 1.
Figure 1. Adaptive assessment user interface
Problems from the edX course are displayed one at a time in a center activity window, with a surrounding toolbar that provides features such as navigation, a score display, and a shareable link for the current problem (that the learner can use to post to a forum for help). The diagram in Fig. 2 describes the data passing in the system. The user-ids used by edX are considered sensitive information and are not shared with SCALE: we created a different user-id system for SCALE, and the mapping back and
forth between the two id-systems happens in the back end of the app.
Figure 2. Diagram of data passing in the system
Every problem-checking event by the user (both inside and outside the adaptive homeworks) sends the data to SCALE, to update the mastery information real-time. Every “Next Question” event in an adaptive homework sends to SCALE a request for the next content item to be served to the user (this could be instructional material or a problem). SCALE sends back the recommendation, which is accessed as an edX XBlock and loaded.
The edX support for LTI is highly stable. The challenge is that edX exports data on a weekly cycle, but we needed to receive the information about submits in real time. We achieved this by creating a reporting JavaScript and inserting it into every problem.
2.3 TutorGen Adaptive Engine TutorGen SCALE is focused on improving learning outcomes using data collected from existing and emerging educational technology systems combined with the core technology to automatically generate adaptive capabilities. Key features that SCALE provides include knowledge tracing, skill modeling, student modeling, adaptive problem selection, and automated hint generation for multi-step problems. SCALE engine improves over time with additional data and/or with the help of human input by providing machine learning using a human-centered approach. The algorithms have been tested on various data sets in a wide range of domains. For successful implementation and optimized adaptive operations, it is important that the knowledge components be tagged at the right level of granularity.
SCALE has been used in the intelligent tutoring system environment, providing adaptive capabilities during the formative learning stages. SCALE with HarvardX for this course is being used more as in the assessment stage of the student experience. In order to accomplish the goals of the prototype for this pilot study, we extended our algorithms to consider not only the knowledge components (KCs), but also problem difficulty. This will accommodate the needs for this course by providing an adaptive experience for students while still supporting the logical flow of the course. Further, the flexible nature of the course, having all content available and open to students for the duration of the course, presents some additional requirements to ensure that students are presented with problems based on their current state and not necessarily where the system believes they should navigate.
Proceedings of the 10th International Conference on Educational Data Mining 468

A variety of serving strategies are available in SCALE and can be swapped in and out. In this particular implementation, while the algorithm did trace the students’ knowledge, the results were used minimally in the serving strategy: it did not make sense to do otherwise given the small size of the adaptive problem pool. SCALE was configured to consider after each submit: the probability of the learner has mastered the KCs from the problem most recently worked, the difficulty of that problem, and the correctness of the submitted answer. A general and simplified explanation of the process is as follows. Each of the four adaptive modules was treated as a separate instance, with its own pool of problems. Each problem can be served to each learner no more than once. Given the last problem submitted by a learner in the module, the candidate to be served next is the (previously unseen) problem, whose KC tagging overlaps with the KCs of the last submitted problem and includes at least one KC, on which the user has not yet reached the mastery threshold. If multiple candidates are available, SCALE will serve the one with a KC closest to mastery. If no candidates are available, other problems of the same difficulty within the same module will be served (i.e. SCALE switches to another KCs). The difficulty level of the next served problem is determined by the last submit correctness. As long as problems of the same difficulty level as the last one are available, the learner will remain at that difficulty level. Once such problems are exhausted, SCALE will serve a more or less difficult problem, depending on whether the last submit in the module was correct or incorrect.
2.4 Quantitative Details and Findings The course was launched on Oct 19, 2016. The data for the analysis presented in this paper were accessed on Mar 08, 2017 (plus or minus a few days, since different parts of the data were extracted at different times), after the official end date of the course.
Table 1. Number of students attempting assessment items of different difficulty level
Experimental group
Control group
Regular level only 58 73 Easy level only 0 0 Advanced level only 1 0 (Regular È Easy) levels only 1 35 (Regular È Advanced) levels only 105 0 (Easy È Advanced) levels only 0 1 (Regular È Easy È Advanced) levels 99 145 Total students attempting new problems 264 254 We will refer to the list of problems from which problems were served adaptively to the experimental group as “new problems”. The control group may have interacted with these as well, although not adaptively (as additional problems that do not count towards the grade). There were 39 new problems, out of which 13 were regular difficulty (these formed the assessments for the control group of students), 14 were advanced and 12 were easy. For the control group, the advanced and easy problems were offered as extra material after assessment, with no credit toward the course grade. The numbers of students attempting assessment problems of different difficulty levels are given in Table 1.
To get a sense of how the two groups of students performed in the course, we compared the group averages of the differences in
scores in the pre-test and post-test. For reasons unrelated to this study, both tests were randomized: in each test each user received 9 questions, randomly selected from a bank of 17. All questions were graded on the 0-1 scale. The users knew that the pre- and post- tests do not contribute to the grade, and so only about ~40% of users took both. Moreover, not all of these questions were relevant for (i.e. tagged with) those 25 knowledge components, with which the adaptively served problems were tagged. So the number of offered relevant questions varied randomly from user to user. For these reasons the pre- and post-test are not the most reliable measure of knowledge gain, but it was still important for us to make sure that adaptivity did not have any adverse effect. Each question was graded on the scale 0-1, and in Fig. 3 we subset the student population to those individuals who attempted a “new problem” and a relevant pre-test question and a relevant post-test question, and used the average score from relevant questions as the student’s relevant score. For instance, if one user attempted two relevant questions in a pre-test, and another user attempted three, and the questions were answered correctly, both users have the relevant score 1: (1+1)/2=(1+1+1)/3.
Figure 3. Comparison of relevant post-test and pre-test scores. Here and everywhere below, the p-values are two-tailed from the Welch two-sample t-test, and the effect size is the Cohen’s
d (Cohen suggested to consider d=0.2 as “small”, d=0.5 as “medium” and d=0.8 as “large” effect size).
There is no significant between-group difference, neither in the pre-test scores (p-value 0.49, effect size 0.093) nor in the post-test scores (p-value 0.21, effect size 0.17). The two populations of pre-test takers remain comparable after subsetting to those who attempted new problems and the post-test and we see no statistically significant difference in the knowledge gaining between the experimental and control groups.
We did not see a difference in the final grade of the course: the mean grade was 83.7% in the experimental group vs. 82.9% in the control group, which is not a significant difference (p-value 0.76, effect size 0.06). Likewise, there is no significant between-group difference in the completion and certification rates (about 20%), or in demographics of students who did not drop out.
Students in the experimental group tended to make more attempts at a problem (Fig. 4), and they tried fewer problems (Fig. 5), most strikingly among the easy new problems: for these we have 1,162 recorded scores in the control group and only 423 in the experimental group.
Proceedings of the 10th International Conference on Educational Data Mining 469

Figure 4. Comparison of attempt numbers between the experimental and control groups in the chapters where adaptivity was implemented. The attempt numbers are
averaged both over the problems and over the users. Non-adaptive problems are problems not from the 4 experimental homeworks but from the same two chapters of the course as
the experimental homeworks.
Figure 5. Comparison of attempt numbers between the experimental and control groups in the chapters where
adaptivity was implemented. Non-adaptive problems are problems not from the 4 experimental homeworks but from
the same two chapters of the course as the experimental homeworks.
The interpretation emerges that the students who experienced adaptivity showed more persistence by giving more attempts per problem (presumably, because adaptively served problems are more likely to be on the appropriate current mastery level for a student), while taking a faster track through the course materials. We also observed that the experimental group students tended to have a lower net time on task in the course: an average of 5.47 hours vs. 5.85 in the control group (although in this comparison the p-value is high, 0.21, and the effect size is –0.11).
Thus, we conjecture that the adaptivity of this kind leads to a higher efficiency of learning. Students go through the course faster and attempt fewer problems, since the problems are served to them in a targeted way. And yet there is no evidence of an adverse effect on the students’ overall performance or knowledge gain. Given the limited implementation of adaptivity in this course, it is not surprising that we cannot find a statistically significant effect on student overall performance in the course. We expect to refine these conclusions in the future courses with a greater scope of adaptivity.
3. FUTURE WORK Our implementation of adaptivity provided some insights for future work. For instance, assessment questions in MOOCs can vary greatly in nature, difficulty and format (multiple choice, check-all-that-applies, numeric response, etc.), and may often be tagged with more than one knowledge component. To be suitable for a MOOC, an adaptive engine should be able to handle these features.
There appear to be extensive opportunities to expand adaptive learning and assessment in MOOCs. The low total number of problems was the most severe restriction on the variability of learner experience in this study. In the future applications, larger sets of tagged items could provide a more adaptive learning experience for students, while also providing a higher degree of certainty of assessment results. Interestingly, in some MOOCs (for example, those teaching programming languages) it may be possible to create very large numbers of questions algorithmically, essentially by filling question templates with different data.
In this study, adaptivity was implemented mostly on assessment problems. Given the structure of many MOOCs, more integration between learning content and assessment could provide an adaptive experience that would guide students to content that could improve their understanding based on how they perform on integrated assessments.
Affective factors could be included to provide a more personalized learning experience. We can conceive an adaptive engine which decides what item to serve next based not just on the mastery but also on the behavioral patterns interpreted as boredom or frustration.
Finally, this work could lead to improved MOOC platform features that would contribute to improved student experiences, such as optimized group selection [2]. In addition, we anticipate expanding this adaptive assessment system to work with other LTI-compliant course platforms. Enabling use in a platform such as Canvas, the learning management system used university-wide at Harvard (and many other schools), would enable adaptivity for residential courses on a large scale. An adjustment to the current system architecture would be the use of OpenEdX as the platform for creating and hosting problems.
4. ACKNOWLEDGMENTS We are grateful for the support from the Office of the Vice Provost for Advances in Learning at Harvard University for thoughtful leadership and support to HarvardX and the VPAL-Research group. Special thanks to Professor Dimitar Sasselov from the Harvard Department of Astronomy whose “Super-Earths and Life” MOOC made this project possible. TutorGen gratefully acknowledges support of SCALE® from the National Science Foundation award numbers 1346448 and 1534780 and from the Commonwealth of Kentucky Cabinet for Economic Development, Kentucky Science and Engineering Foundation, and The Kentucky Science and Technology Corporation, award numbers KSTC-184-512-14-182 and KSTC-184-512-16-241.
5. REFERENCES [1] Koedinger, K., and Stamper, J. 2010. A Data Driven
Approach to the Discovery of Better Cognitive Models. In Baker, R.S.J.d., Merceron, A., Pavlik, P.I. Jr. (Eds.) Proceedings of the 3rd International Conference on
Proceedings of the 10th International Conference on Educational Data Mining 470

Educational Data Mining. (EDM 2010), 325-326. Pittsburgh, PA.
[2] Rosen, Y. 2017. Assessing students in human-to-agent settings to inform collaborative problem-solving learning. Journal of Educational Measurement 54, 1: 36-53.
[3] Rosen, Y. 2015. Computer-based assessment of collaborative problem solving: Exploring the feasibility of human-to-agent approach. International Journal of Artificial Intelligence in Education 25, 3: 98-129.
[4] Stamper, J., Barnes, T., and Croy, M. 2011. Experimental Evaluation of Automatic Hint Generation for a Logic Tutor. In Kay, J., Bull, S. and Biswas, G. eds. Proceeding of the 15th International Conference on Artificial Intelligence in Education (AIED2011). 345-352. Berlin Germany: Springer.
[5] A preliminary report of our study (based on the data obtained prior to the course end) is to appear in the Proceedings of the Fourth Annual ACM Conference on Learning at Scale (L@S 2017) as: Rosen, Y., Rushkin, I., Ang A., Fredericks C., Tingley D., Blink M.J. 2017. Designing Adaptive Assessments in MOOCs.
Proceedings of the 10th International Conference on Educational Data Mining 471