educational extracts
140
-
Upload
khangminh22 -
Category
Documents
-
view
2 -
download
0
Transcript of educational extracts


A Bi-annual Peer Reviewed Educational Journal
St. Thomas College of Teacher Education, Pala, Kerala – 686 575Re-accredited (3rd cycle) with A Grade by NAACWebsite: www.stce-pala.info, www.stctepala.org
Email: [email protected], [email protected]
EDUCATIONAL EXTRACTSVol. 4 Issue 2 July 2016
ISSN 2320-7612

Statement showing ownership and other particulars aboutEDUCATIONAL EXTRACTS
Place of Publication : St. Thomas College of Teacher Education, Pala,Kottayam
Periodicity of Publication : Half Yearly
Managing Editor : Prof. Jose P. Mattam
Chief Editor : Dr. T. C. Thankachan
Printer & Publisher : Prof. Jose P. Mattam, Principal,St. Thomas College of Teacher Education, Pala,Kottayam
Nationality : Indian
Address & Ownership : Prof. Jose P. Mattam, Principal (Rtd.),St. Thomas College of Teacher Education, Pala,Kottayam
Printed at : St. Thomas Offset Printers, Pala, Kottayam, Kerala
I, Prof. Jose P. Mattam, Principal (Rtd.), St. Thomas College of Teacher Education,Pala, Kerala, do hereby declare that the particulars given above are true to the best of myknowledge and belief.
Sd/-
Prof. Jose P. MattamManaging Editor & Publisher,
Educational Extracts
2

EFFECTIVENESS OF COMPUTER BASEDCONCEPT MAPPING INSTRUCTIONAL STRATEGY ON
ACHIEVEMENT IN BIOLOGICAL SCIENCE OFSECONDARY SCHOOL STUDENTS
Rosy Fernandes*Dr. Flosy C.R. D’Souza**
AbstractThe study was aimed at evaluating the effectiveness of Computer Based ConceptMapping Instructional Strategy and Conventional Strategy of teaching BiologicalScience in improving the Achievement of Secondary School Students. TheExperimental Design used was pre-test post-test parallel group 2×2 factorial design.An Achievement test in Biological Science constructed by the Investigators andvalidated by experts was used to collect the data from the sample consisting of 72students studying in standard Nine. Findings of this research revealed that:i) Computer-Based Concept Mapping Instructional Strategy is more effective thanthe conventional strategy in improving the Achievement of Secondary SchoolStudents. ii) Intellectually above-average students of experimental group performedbetter than the above-average students of control group in Achievement.iii) Intellectually below-average students of experimental group performed betterthan the below-average students of control group in Achievement.Keywords: Computer Based Concept Mapping Instructional Strategy, Achievement.
* Research scholar, St. Ann’s College of Education (Autonomous), Mangalore.** Associate professor, St. Ann’s College of Education (Autonomous), Mangalore.
Educational Extracts ISSN 2320-7612
Vol. IV Issue 2 July 2016pp. 3-8
St. Thomas College of Teacher Education, Pala, Kerala, IndiaWebsite: www.stce-pala.info, www.stctepala.orgemail: [email protected]
INTRODUCTION
Science is a body of knowledge. TheScientific knowledge exists in the form offacts, concepts, principles, laws, hypothesesand theories. To acquire this scientificknowledge effective Instructional strategiesneed to be adopted. True learning is not
merely acquisition of certain traits or skills;it is a change in behaviour brought about bytraining or experiences. This study attemptsto provide unique learning experiences tostudents, to develop Concept Maps usingtechnology for enhancing students learningoutcomes in Science.
4
Educational Extracts Vol. IV, Issue 2, July 2016 St. Thomas College of Teacher Education, Pala, Kerala
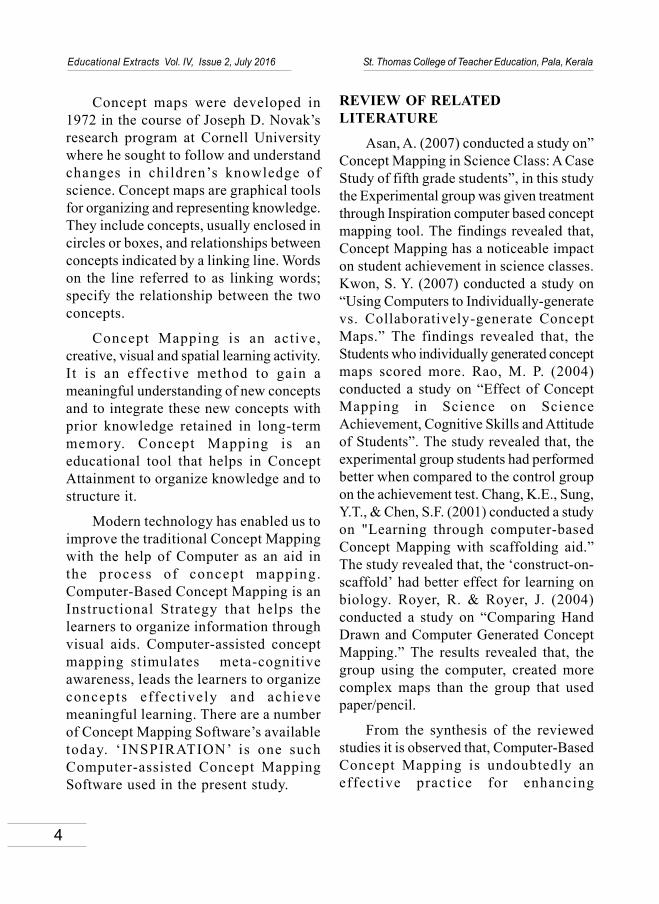
Concept maps were developed in1972 in the course of Joseph D. Novak’sresearch program at Cornell Universitywhere he sought to follow and understandchanges in children’s knowledge ofscience. Concept maps are graphical toolsfor organizing and representing knowledge.They include concepts, usually enclosed incircles or boxes, and relationships betweenconcepts indicated by a linking line. Wordson the line referred to as linking words;specify the relationship between the twoconcepts.
Concept Mapping is an active,creative, visual and spatial learning activity.It is an effective method to gain ameaningful understanding of new conceptsand to integrate these new concepts withprior knowledge retained in long-termmemory. Concept Mapping is aneducational tool that helps in ConceptAttainment to organize knowledge and tostructure it.
Modern technology has enabled us toimprove the traditional Concept Mappingwith the help of Computer as an aid inthe process of concept mapping.Computer-Based Concept Mapping is anInstructional Strategy that helps thelearners to organize information throughvisual aids. Computer-assisted conceptmapping stimulates meta-cognitiveawareness, leads the learners to organizeconcepts effect ively and achievemeaningful learning. There are a numberof Concept Mapping Software’s availabletoday. ‘INSPIRATION’ is one suchComputer-assisted Concept MappingSoftware used in the present study.
REVIEW OF RELATEDLITERATURE
Asan, A. (2007) conducted a study on”Concept Mapping in Science Class: A CaseStudy of fifth grade students”, in this studythe Experimental group was given treatmentthrough Inspiration computer based conceptmapping tool. The findings revealed that,Concept Mapping has a noticeable impacton student achievement in science classes.Kwon, S. Y. (2007) conducted a study on“Using Computers to Individually-generatevs. Collaboratively-generate ConceptMaps.” The findings revealed that, theStudents who individually generated conceptmaps scored more. Rao, M. P. (2004)conducted a study on “Effect of ConceptMapping in Science on ScienceAchievement, Cognitive Skills and Attitudeof Students”. The study revealed that, theexperimental group students had performedbetter when compared to the control groupon the achievement test. Chang, K.E., Sung,Y.T., & Chen, S.F. (2001) conducted a studyon "Learning through computer-basedConcept Mapping with scaffolding aid.”The study revealed that, the ‘construct-on-scaffold’ had better effect for learning onbiology. Royer, R. & Royer, J. (2004)conducted a study on “Comparing HandDrawn and Computer Generated ConceptMapping.” The results revealed that, thegroup using the computer, created morecomplex maps than the group that usedpaper/pencil.
From the synthesis of the reviewedstudies it is observed that, Computer-BasedConcept Mapping is undoubtedly aneffective practice for enhancing

5
Educational Extracts Vol. IV, Issue 2, July 2016 St. Thomas College of Teacher Education, Pala, Kerala
Achievement in Science and othersubjects. But very little effort has beendone to use Computer-Based Conceptmapping in teaching Science Content,although the teachers were aware of thepresent trends in the teaching of Science.
OBJECTIVES1. To study the effectiveness of Computer-
Based Concept Mapping InstructionalStrategy and Conventional Strategy inimproving Achievement of Students inScience.
2. To study the effectiveness ofComputer-Based Concept MappingInstructional Strategy andConventional Strategy in improvingAchievement of Above- Average andBelow- Average Intelligence levelstudents.
HYPOTHESESH1: Computer-Based Concept Mapping
Instructional Strategy is moreeffective than the ConventionalStrategy of teaching in improving theAchievement of standard nine studentsin Science.
H2: The Achievement in Science of above-average students of experimental groupis more than the above-averagestudents of control group.
H3: The Achievement in Science of below-average students of experimental groupis more than the below-averagestudents of control group.
RESEARCH DESIGN
A pre-test post-test parallel group 2×2factorial design was used in the study. This isdiagrammatically represented in the Table 1.
Table1Schematic Representation of Treatmentsand Levels Levels → Above Below
Treatments ↓Average Average
(L1) (L2)Computer-BasedConcept n(18) n(18)Mapping InstructionalStrategy. (T1) T1 L1 T1 L2ConventionalStrategy. (T2) n(18) n(18)
T2 L1 T2 L2
SAMPLE
The sample consisted of 72 studentswithin the age group 14 to15 studying inStandard Nine. Based on their Intelligence‘T’ Scores, matched pairs were identified anddistributed into two groups as Experimentaland Control group with 36 cases in eachgroup. On the basis of their intelligence eachgroup was further divided into 2 levels asAbove- Average and Below- Averageconsisting of 18 cases in each group.
TOOLS USED
Standardized Intelligence test developedby J C Raven, was used for the classificationof levels of students (Above-Average andBelow-Average). The data for the presentstudy was collected by using theAchievement test developed by theinvestigator. This test was constructed onthe basis of Cognitive domain of the Bloomstaxonomy of Educational objectives and itconsisted of 36 items selected through itemanalysis. The content validity was establishedby expert judgement. The coefficient ofconsistency by the split half method wasfound to be 0.89.
6
Educational Extracts Vol. IV, Issue 2, July 2016 St. Thomas College of Teacher Education, Pala, Kerala
PROCEDURE OF THE STUDY
In order to avoid the inter-personal andintra personal variation of two differentteachers for the student groups based onComputer-Based Concept Mappinginstructional strategy and Conventionalstrategy, it was decided to conduct both theclasses by a single teacher havingcompetence in both the strategies on the samedates. The two groups were pre-tested onAchievement. The experimental treatmentinvolved the teaching of a selected unit inBiological Science namely, “Classification ofliving organisms” for standard nine. Eachlesson was of one and half hour duration.The total fifteen lessons were taught by usingComputer-Based Concept mappinginstructional strategy to the experimentalgroup of students. Meanwhile, the studentsof Control group were taught the samelessons for the same duration of time by thesame teacher using Conventional Strategy.Immediately after the completion of thetreatment both the groups were Post- testedon Achievement.
DELIMITATIONS• Computer-Based Concept Mapping
Instructional Strategy can be applied toany subject, at any level. In the presentstudy, the background of the Researcherhas enabled its application to Science atSecondary School level.
• Computer-Based Concept MappingInstructional Strategy can be applied fordifferent types of instruction. In thepresent study, it is applied to Groupinstruction as it is suitable to the Indiancontext.
• The study was confined to the teachingof Science for students of Englishmedium of standard nine only.
• Computer Based Concept MappingInstructional Strategy involved the useof freely available software (trialversion) namely ‘INSPIRATION’.
RESULTS
The objectives and related hypotheseswere analysed by applying ‘t’ test. Theresults of the study are given below:
⇒⇒⇒⇒⇒ Instructional Strategy (Treatment)
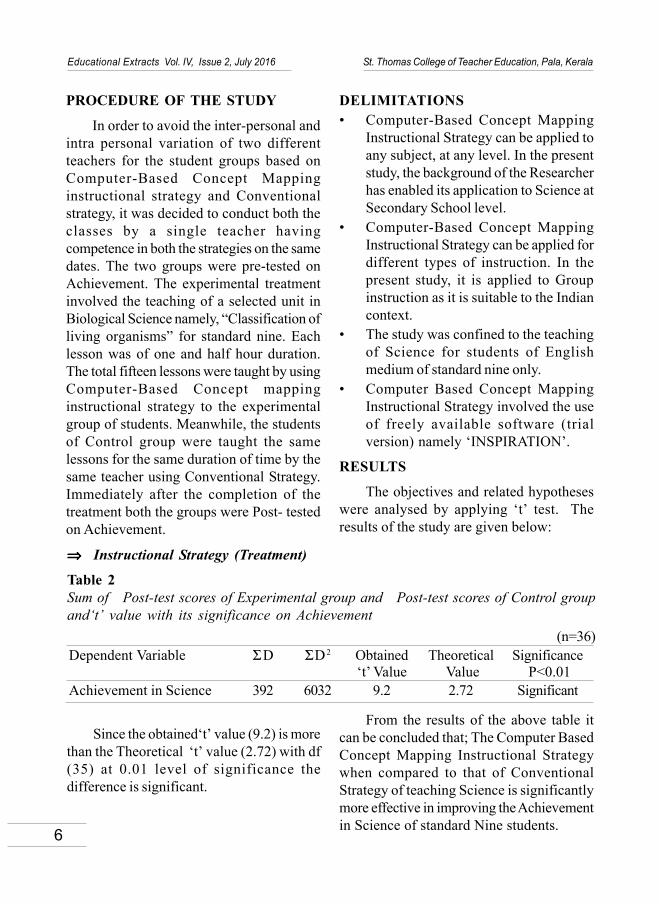
Table 2Sum of Post-test scores of Experimental group and Post-test scores of Control groupand‘t’ value with its significance on Achievement
(n=36)Dependent Variable ΣD ΣD2 Obtained Theoretical Significance
‘t’ Value Value P<0.01Achievement in Science 392 6032 9.2 2.72 Significant
Since the obtained‘t’ value (9.2) is morethan the Theoretical ‘t’ value (2.72) with df(35) at 0.01 level of significance thedifference is significant.
From the results of the above table itcan be concluded that; The Computer BasedConcept Mapping Instructional Strategywhen compared to that of ConventionalStrategy of teaching Science is significantlymore effective in improving the Achievementin Science of standard Nine students.
7
Educational Extracts Vol. IV, Issue 2, July 2016 St. Thomas College of Teacher Education, Pala, Kerala
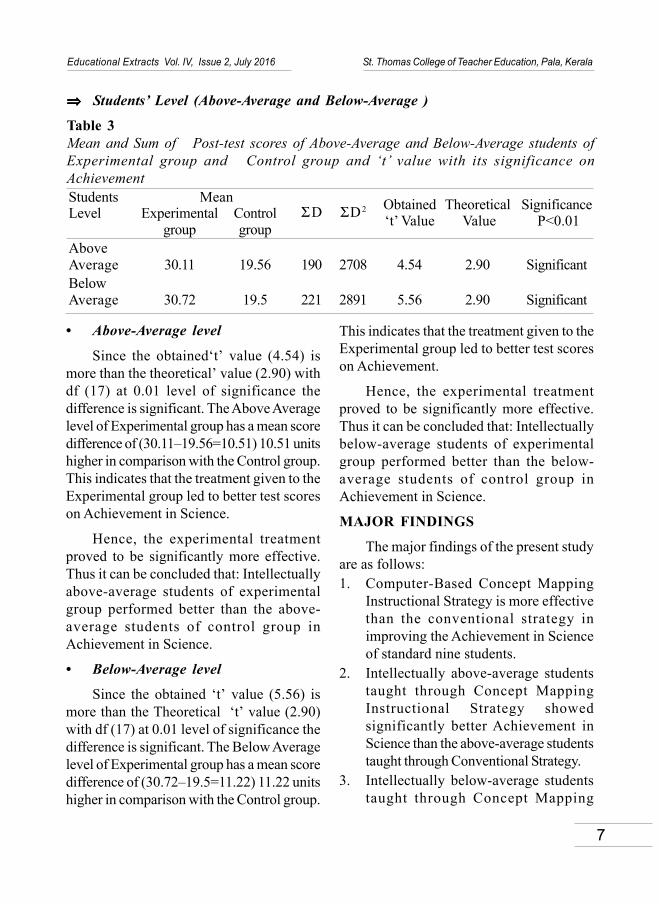
• Above-Average level
Since the obtained‘t’ value (4.54) ismore than the theoretical’ value (2.90) withdf (17) at 0.01 level of significance thedifference is significant. The Above Averagelevel of Experimental group has a mean scoredifference of (30.11–19.56=10.51) 10.51 unitshigher in comparison with the Control group.This indicates that the treatment given to theExperimental group led to better test scoreson Achievement in Science.
Hence, the experimental treatmentproved to be significantly more effective.Thus it can be concluded that: Intellectuallyabove-average students of experimentalgroup performed better than the above-average students of control group inAchievement in Science.
• Below-Average level
Since the obtained ‘t’ value (5.56) ismore than the Theoretical ‘t’ value (2.90)with df (17) at 0.01 level of significance thedifference is significant. The Below Averagelevel of Experimental group has a mean scoredifference of (30.72–19.5=11.22) 11.22 unitshigher in comparison with the Control group.
This indicates that the treatment given to theExperimental group led to better test scoreson Achievement.
Hence, the experimental treatmentproved to be significantly more effective.Thus it can be concluded that: Intellectuallybelow-average students of experimentalgroup performed better than the below-average students of control group inAchievement in Science.
MAJOR FINDINGS
The major findings of the present studyare as follows:1. Computer-Based Concept Mapping
Instructional Strategy is more effectivethan the conventional strategy inimproving the Achievement in Scienceof standard nine students.
2. Intellectually above-average studentstaught through Concept MappingInstructional Strategy showedsignificantly better Achievement inScience than the above-average studentstaught through Conventional Strategy.
3. Intellectually below-average studentstaught through Concept Mapping
⇒⇒⇒⇒⇒ Students’ Level (Above-Average and Below-Average )
Table 3Mean and Sum of Post-test scores of Above-Average and Below-Average students ofExperimental group and Control group and ‘t’ value with its significance onAchievementStudents Mean
ΣD ΣD2 Obtained Theoretical SignificanceLevel Experimental Control ‘t’ Value Value P<0.01group groupAboveAverage 30.11 19.56 190 2708 4.54 2.90 SignificantBelowAverage 30.72 19.5 221 2891 5.56 2.90 Significant

8
Educational Extracts Vol. IV, Issue 2, July 2016 St. Thomas College of Teacher Education, Pala, Kerala
Instructional Strategy showedsignificantly better Achievement inScience than the below-averagestudents taught through ConventionalStrategy.
CONCLUSION
Computer-Based Concept mappinginstructional strategy helps the learners toorganize information and stimulates learner’scognitive and meta-cognitive abilities. Thepresent study has proved that Computer-Based Concept Mapping InstructionalStrategy is more effective when comparedto that of Conventional Strategy in improvingAchievement in Science. This study hasimplications for student centric learning. Ithas been found to be a systematic strategyto improve classroom instruction acrossvarious disciplines and hence its inclusion inthe teacher education curriculum will be amajor step in making its application possibleat the grass root level. The teachers of alllevels need sufficient training to useComputer-Based Concept Mappingsoftware’s like ‘Inspiration’ to improveAchievement in their students. Efforts in thisdirection will surely bring in improvement instudents performance.
ReferencesAsan, A. (2007). Concept Mapping in Science
Class: A Case Study of fifth grade students.Educational Technology & Society, 10(1), 186-195.
Chang, K.E., Sung, Y.T., and Chen, S.F. (2001).Learning through Computer-Based ConceptMapping with scaffolding aid. Journal ofComputer Assisted Learning, 17, 21-33.
Best J. W. (1981), Research in Education , 4thEdition , New Delhi, Prentice Hall Of IndiaPvt. Ltd.
Kwon, S. Y., and Cifuentes, L. (2007).UsingComputers to Individually-generate vs.Collaboratively-generate Concept Maps.Educational Technology and Society, 10 (4),269-280.
Novak, J. D. (1990). Concept maps and veediagrams: Two Metacognitive tools forscience and mathematics education.Instructional Science, 19, 29-52.
Rao, M. P. (2004). Effect of Concept Mapping inScience on Science Achievement, CognitiveSkills and Attitude of Students. IndianEducational Abstracts 4(1).
Royer, R. and Royer, J. (2004). Comparing HandDrawn and Computer Generated ConceptMapping. Journal of Computer s inMathematics and Science Teaching, 23(1), 67-81. Norfolk, VA: AACE.

9
Educational Extracts Vol. IV, Issue 2, July 2016 St. Thomas College of Teacher Education, Pala, Kerala
* Research scholar, Dept. of Education, Dravidian University, Kuppam-517 426** Dean, School of Education and HRD, Dravidian University, Kuppam – 517 426
Educational Extracts ISSN 2320-7612
Vol. IV Issue 2 July 2016pp. 9-21
St. Thomas College of Teacher Education, Pala, Kerala, IndiaWebsite: www.stce-pala.info, www.stctepala.orgemail: [email protected]
ORGANIZATIONAL STRUCTURE AND CLIMATE OFB.ED COLLEGES OF EDUCATION AS SOURCE OF
OCCUPATIONAL STRESS FORTEACHERS IN A.P STATE
M.Shailaja*Prof. G.Lokanadha Reddy**
“A teacher affects eternity; she can never tell where her influence stops”.- Henry Adams
The present day teacher’s roles andresponsibilities are more dynamic anddemanding a variety of knowledge, skills,positive attitudes and competences to trainthe younger generations of the nation. Therole of teachers as agents of change inpromoting understanding and tolerance, andimproving the quality of education of learnerscannot be over-emphasized. It necessitatesdemand for teachers who are professionallycompetent, responsible, and responsive to theneeds of society; who are enthused withmotivation, appropriate knowledge and skills;and who display a positive attitude towardslife and other people; teachers who havepersonal characteristics of integrity and akind of spiritual orientation to the younggenerations.
In this process, the teacher has tounderstand the organizational aims and goalsin which he/ she is working, enhance his/
her personal and professional efficiency,develop intra and interpersonal relationshipswithin himself, colleagues, students andparents. Further, he/she has to adjust withthe environment in which he/ she is workingapart for balancing home and work place.Whatever may the potentialities of theindividual, the new emerging environmentsin education evoke lot of stress and strain inthe teachers. Teaching like many otherprofessions is progressively becoming astressful occupation (Hepburn & Brown,2001; Johnson et. al, 2005) as teachers haveto shoulder multiple roles and responsibilitieskeeping in mind the deadlines. These rolesmay include as an assessor, planner,curriculum developer, information provider,role model, facilitator, and resource generator.The responsibilities may include planninglessons, effective teaching, class supervision,maintenance of discipline, evaluation,
10
Educational Extracts Vol. IV, Issue 2, July 2016 St. Thomas College of Teacher Education, Pala, Kerala
assessment and accountability of studentperformance or achievement, conducting co– curricular activities, etc. It is a well knownfact that the organizational structure andclimate of the colleges of the education playsa vital role in promoting job involvement inthe teachers working in. The organizationstructural factors such as - role ambiguity,role conflict, role over-load and role under-load can be the potential causes of stress.Stressors that interfere with teacher effortscan be student apathy, student disruption orindiscipline, poor student attendance, lowachievement, large number of students in aclass, heavy paper or prep work, indifferentattitude of colleagues, obtrusive administrator,ineffective leadership of principals, denial ofopportunities for professional development,low salary, unsatisfactory relationships withstudents, non involvement in decision making,accountability of student progress, fatigue,frustration, helplessness, stagnation,boredom, and loss of motivation orenthusiasm and unsupportive parents, etc.(Blase,1986; Travers & Cooper, 1996;Pithers & Sodon, 1998; Butt et al., 2005).All these stressors are various job conditionsor compulsions that generally a teacherencounters while working in an institution andoften they are uncertain in dealing with them.As a result, it leads to disinterest, negligence,bitterness, and absenteeism among teachers,the learning environment of the teacher getsaffected and thus, prevents achievement ofeducational goals (Nagra, 2013).
Although some stress is a common andnecessary element of life, excessiveunmanaged stress has been linked to a longlist of physical and mental health problems(Colbert, 2008; Sapolsky, 2005; Weil, 2005;
Wheeler, 2007). Chronic stress is typicallymeasured through self-reporting methods,either in interviews or with survey instrumentsusing checklists, scales, or open-endedquestions in which participants documenttheir perceived stress levels and stressors(Cohen, 2000). World all over, chronic stressis of great concern because it has beenassociated with a variety of health problemsincluding muscle tension and pain, memoryloss, suppression of the immune system, andeven damage to the heart or other organs(Colbert, 2008; Larimore, 2003; Weil, 2005;Wheeler, 2007). In addition, Larimore (2003)explains that chronic stress can weaken thefunctioning of the adrenal system (the sourceof one of the energy producing hormones,adrenalin), resulting in decreased energyduring the day and disrupted sleep at night.Left untreated, chronic stress can eventuallylead to exhaustion, burnout, and seriousphysical or mental illnesses (Colbert, 2008;Wheeler, 2007).
There are different factors such as :organizational structure and climate,personal and professional efficiency of theteachers, intra and interpersonal relationswithin and among the teachers and students, environmental factors and home-workinterface are some of the sources ofoccupational stress in teachers working atdifferent levels of education ( Reddy, 2006,2011 and 2012), Reddy and Poornima (2009, 2012, 2012a and 2013), Reddy andVijaya Anuradha ( 2013, 2013a, 2013b,2013c and 2014). Studies on theorganizational structure and climate of B.Edcolleges causing stress in teachers are notattempted much and the present study is anattempt in this direction.

11
Educational Extracts Vol. IV, Issue 2, July 2016 St. Thomas College of Teacher Education, Pala, Kerala
Objectives of the Study1. To develop a tool to assess the level of
occupational stress of teachers due toorganizational structure and climate ofthe B.Ed. colleges of education in A.P.State.
2. To find out the number and percentageof teachers with low, moderate and highlevels of occupational stress, arising outof organizational structure and climateof the B.Ed. colleges of education.
3. To find out the significant differences,if any, in the occupational stress ofB.Ed. college teachers due to variationsin their gender, marital status, type ofcollege working, location of the college,nature of job, years of experience,average number of working hours perweek, designation, age group,community, educational qualification andsalary per month.
Hypothesis of the Study
There is significant difference in theoccupational stress arising out of theorganizational structure and climate of teachersworking in B.Ed. colleges of education due tovariation in their gender, marital status, type ofcollege working, location of the college, natureof job, years of experience ,average numberof working hours per week, designation, agegroup, community, educational qualification andsalary per month.
Methodology used in the Study
Survey method is used in the study.
i) Construction of Research Tools Usedin the Study
For the purpose of the study, theinvestigator developed a organizational
structure and climate rating scale to assessthe occupational stress of B.Ed collegeteachers arising out of their collegesorganizational structure and climate. Theinvestigator went through various toolsdeveloped previously to assess theoccupational stress and reviewed theliterature to construct the statements.
The investigator referred toOrganizational Climate Scale- OCS (Petheet al. 2001), Occupational Stress ofSpecial Education Teachers Rating Scale(Reddy, 2006), Occupational Stress RatingScale of Reddy (2006) adopted by Poornima(2010) and Anuradha (2012) to assess theoccupational stress of special educationteachers and higher secondary teachersrespectively, and Occupational Stress RatingScale developed by Reddy (2011) to assessthe occupational stress of university teachers.From the review of research tools, it isunderstood that, a good number of tools areavailable to assess the occupational stress inteachers. But there is no specific tool toassess the occupational stress of teachersworking in the B.Ed. colleges and thus theinvestigators developed their own RatingScale to assess the Occupational Stress ofteachers aroused out of the organizationalstructure and climate of the of B.Ed. collegesof education, in lines with the tool developedby Reddy (2011).
To develop the rating scale to assess theoccupational stress of the B.Ed. Collegeteachers arising out of organizational structureand climate (OSC) of the B.Ed colleges, theinvestigator constructed the statements tomeasure the sources of stress in B.Ed.college teachers due to OSC of the colleges.The available tools and the literature review

12
Educational Extracts Vol. IV, Issue 2, July 2016 St. Thomas College of Teacher Education, Pala, Kerala
helped the investigator to develop the ratingscale to assess the sources of stress amongB.Ed. college teachers due to organizationalstructure and climate of the college. At theinitial stage, a draft pool of 15 statements onthe sources of occupational stress amongB.Ed. college teachers was prepared. Carewas taken to present the statements in a clearand concise form for better understanding.This rough draft pool of items was given tothe panel of experts (psychologists,professionals and B.Ed. college teachers fora critical discussion on the sources of stressin teachers due to the organizational structureand climate of B.Ed colleges. Based on thediscussion, the statements were furtherrefined with the view to avoid ambiguity andrepetitions. At the final stage, theorganizational structure and climate ratingscale encompasses 12 statements. These 12statements represent the sources of stressexperienced by B.Ed. college teachersarising out of the organizational factors likerole overload, role ambiguity, role conflict,little or no participation in decision making,stringent rules and regulations, resourceconstraints and problematic instructionalassignments and arrangements. To measurethe occupational stress in B.Ed. collegeteachers arising out of organizational structureand climate of the college, against eachstatement five gradations are given namelyStrongly Disagree (SD), Disagree (D),Undecided (UD), Agree (A), Strongly Agree(SA) having the scores 1,2,3,4 and 5respectively.
ii) Pilot Study: A pilot study was carriedout by the investigator to find out the suitabilityof the test items for the investigation. Thepilot study aimed to find out the reliability and
the validity of the rating scale used anddeveloped in the study. The developed RatingScale was administered to 36 B.Ed. collegeteachers (10 % of the total sample) randomlyselected from the three regions (i.e. CostalAndhra, Rayalaseema and Telangana) of theUnited Andhra Pradesh State. The B.Ed.college teachers were oriented to rate thestatements of the Rating to indicate theirresponses using the gradations/points. Thecompleted Rating Scale were collected andstatistically analyzed to establish the reliabilityof the research tools. Split half method is usedto establish the reliability of the organizationalstructure and climate rating scale. Theobtained half test (0.554) and whole test(0.713) reliability of the organizationalstructure and climate scale is high and hence,the rating scale used in this study possesshigh reliability indicating its suitability for thepresent investigation.
Validity of the Research Tools
According to Best (1989), validity is thequality of a data gathering instrument orprocedure that enables it to measure what itis supposed to measure. The index ofreliability is sometimes taken as a measureof validity (Garrett & Wordsworth, 1981).The content validity, face validity, intrinsicvalidity and criterion validity has beenestablished through scientific procedures.
Locale and Sample of the Study
The locale of the study is the unitedAndhra Pradesh State of India. United A.P.State consists of three regions i.e. Telangana,Coastal Andhra Pradesh and Rayalaseemaregions comprising of 23 districts. InTelangana region, there are 10 districts,Coastal Andhra Pradesh region 9 districts
13
Educational Extracts Vol. IV, Issue 2, July 2016 St. Thomas College of Teacher Education, Pala, Kerala
and Rayalaseema region with 4 districts. Inall the three regions, a good number of B.Ed.colleges are functioning.
For the purpose of the study, theinvestigator at the first stage selected 5districts i.e. two from Telangana region(Hyderabad and Warangal Districts), two fromCoastal Andhra Pradesh region (Guntur andVishakhapatnam districts) and one fromRayalaseema region (Chitoor District) byusing simple random sampling technique. InHyderabad and Warangal districts 51 B.Ed.colleges, in Guntur and Vishakhapatnamdistricts 63 B.Ed. colleges and in Chittoordistrict 30 B.Ed. colleges are functioning. Inall these five districts, University departmentsare offering B.Ed. course. For the purpose ofthe study, the investigator consideredGovernment/ Aided and Private Colleges ofEducation and University departments ofeducation (offering B.Ed. course) functioningin the above said districts. In each college onan average, there are 6 to 7 teachers working.
In the second stage, the investigatorselected 11 B.Ed. colleges from each districtby using simple random sampling techniqueconsidering Government, Aided and Privatecolleges. Thus, the total number of collegesselected is 55 (Telangana region - 22, CoastalAndhra Pradesh region- 22 and 11 inRayalaseema region). In each college, thereare about 6 to 7 teachers working either inpermanent or temporary basis. All theteachers working in these colleges are thesample of the study. Accordingly, there are148 teachers working in 22 B.Ed. Collegesof Education including Universitydepartments in Telangana region in theselected two districts i.e. Hyderabad andWarangal; 138 teachers working in 22 B.Ed.
colleges of education including Universitydepartment in Coastal Andhra Pradesh regionin the selected two districts i.e. Guntur andVishakhapatnam; and 78 teachers workingin the 11 B.Ed. colleges including Universitydepartments in Rayalaseema region ofChittoor District. Thus, the total sample ofthe study is 364 teachers working in B.Ed.colleges of education and Universitydepartments offering B.Ed. course, at thetime of collection of data for the study.
Data Collection: The investigatorpersonally visited the B.Ed. Colleges ofEducation to collect the data from theteachers and Principals working in thosecolleges. Good rapport was established withthe Principals and teachers beforeadministering the tools. They were explainedabout the purpose of the study. It wasemphasized that the data will be keptconfidential and will be used only for researchpurpose, and participants were instructed notto leave any item unrated.
Statistical Techniques Used in the Study:The collected data were analyzed by usingappropriate statistical techniques such asnumber and percentage, mean, SD, mean ±1SD, t-test, F-test.
Results and Discussion
Number and Percentage of Teacherswith low, moderate and high levels ofoccupational stress due to OrganizationalStructure and Climate of the B.Ed collegesof education.
Table-1 shows the number andpercentage of teachers experiencing low,moderate and high levels of occupation stressaroused out of organizational structure andclimate of B.Ed. college.
14
Educational Extracts Vol. IV, Issue 2, July 2016 St. Thomas College of Teacher Education, Pala, Kerala
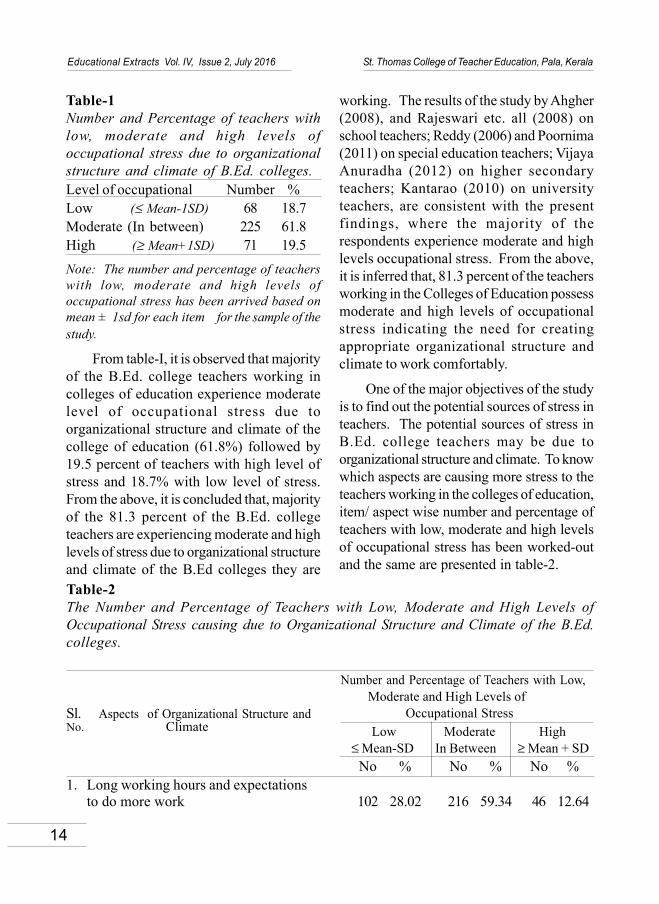
Table-1Number and Percentage of teachers withlow, moderate and high levels ofoccupational stress due to organizationalstructure and climate of B.Ed. colleges.Level of occupational Number %Low (≤ Mean-1SD) 68 18.7Moderate (In between) 225 61.8High (≥ Mean+1SD) 71 19.5Note: The number and percentage of teacherswith low, moderate and high levels ofoccupational stress has been arrived based onmean ± 1sd for each item for the sample of thestudy.
From table-I, it is observed that majorityof the B.Ed. college teachers working incolleges of education experience moderatelevel of occupational stress due toorganizational structure and climate of thecollege of education (61.8%) followed by19.5 percent of teachers with high level ofstress and 18.7% with low level of stress.From the above, it is concluded that, majorityof the 81.3 percent of the B.Ed. collegeteachers are experiencing moderate and highlevels of stress due to organizational structureand climate of the B.Ed colleges they are
working. The results of the study by Ahgher(2008), and Rajeswari etc. all (2008) onschool teachers; Reddy (2006) and Poornima(2011) on special education teachers; VijayaAnuradha (2012) on higher secondaryteachers; Kantarao (2010) on universityteachers, are consistent with the presentfindings, where the majority of therespondents experience moderate and highlevels occupational stress. From the above,it is inferred that, 81.3 percent of the teachersworking in the Colleges of Education possessmoderate and high levels of occupationalstress indicating the need for creatingappropriate organizational structure andclimate to work comfortably.
One of the major objectives of the studyis to find out the potential sources of stress inteachers. The potential sources of stress inB.Ed. college teachers may be due toorganizational structure and climate. To knowwhich aspects are causing more stress to theteachers working in the colleges of education,item/ aspect wise number and percentage ofteachers with low, moderate and high levelsof occupational stress has been worked-outand the same are presented in table-2.
Table-2The Number and Percentage of Teachers with Low, Moderate and High Levels ofOccupational Stress causing due to Organizational Structure and Climate of the B.Ed.colleges.
Sl. Aspects of Organizational Structure and
Number and Percentage of Teachers with Low,
No. Climate
Moderate and High Levels ofOccupational Stress
Low Moderate High ≤ Mean-SD In Between ≥ Mean + SD
No % No % No %1. Long working hours and expectations
to do more work 102 28.02 216 59.34 46 12.64

15
Educational Extracts Vol. IV, Issue 2, July 2016 St. Thomas College of Teacher Education, Pala, Kerala
From table-2, it is clear that, more than75 percent of the teachers are experiencingmoderate and high levels of occupationalstress due to: carrying multiple responsibilitiesin short span of time (81.3%), working onassignments that are not necessary toprofession (76.37%), lack of equipments forteaching learning process (84.07%), handlinglarge class size with diverse needs (76.9%),lack of involvement of teacher educators indecision making process of the activitiesrelated to profession (82.69%), lack ofopportunities for promotion and careerdevelopment (78.02%), inadequate salary forthe work done in the college (88.46%),stringent rules and regulation in B.Ed. collegethat hinders to act independently (85.17%)and taking responsibility for the activities ofothers (84.61%), under the dimension‘organizational structure and climate’ of the
college. In the remaining aspects (S.No.1, 3and 6) 66% to 72% of teachers areexperiencing occupational stress. Thisindicates the need to develop conduciveorganizational structure and climate of thecolleges of education.
Sources and Level of OccupationalStress of B.Ed. College Teachers
To identify the level of occupationalstress of teachers working in the colleges ofeducation, mean and standard deviation foreach item of the organizational structure andclimate has been calculated for the wholesample of the teachers working at thecolleges of the education. By using mean ±1SD; the low, moderate and high level ofstressor’s have been identified and the sameis presented in table-3.
2. Carrying multiple responsibilities ina short span of time 68 18.68 207 56.87 89 24.45
3. Lack of information in carrying out theprofessional responsibilities 115 31.59 230 63.19 19 5.22
4. Working on assignments that are notnecessary to the profession 86 23.63 242 66.48 36 9.89
5. Lack of equipments for teaching-learningprocess 58 15.93 241 66.21 65 17.86
6. Inadequate supportive staff in the college 124 34.07 178 48.90 62 17.037. Handling large class size with diverse needs 71 19.51 242 66.48 51 14.018. Lack of involvement of the teacher
educators in the decision making process ofthe activities related to profession 63 17.31 208 57.14 93 25.55
9. Lack of opportunities for promotion andcareer development 80 21.98 227 62.36 57 15.66
10. Inadequate salary for the work donein the college 42 11.54 255 70.05 67 18.41
11. Stringent rules and regulations in B.Ed.College that hinders to act independently 54 14.84 260 71.43 50 13.74
12. Taking responsibility for the activities ofothers 56 15.38 267 73.35 41 11.26
16
Educational Extracts Vol. IV, Issue 2, July 2016 St. Thomas College of Teacher Education, Pala, Kerala
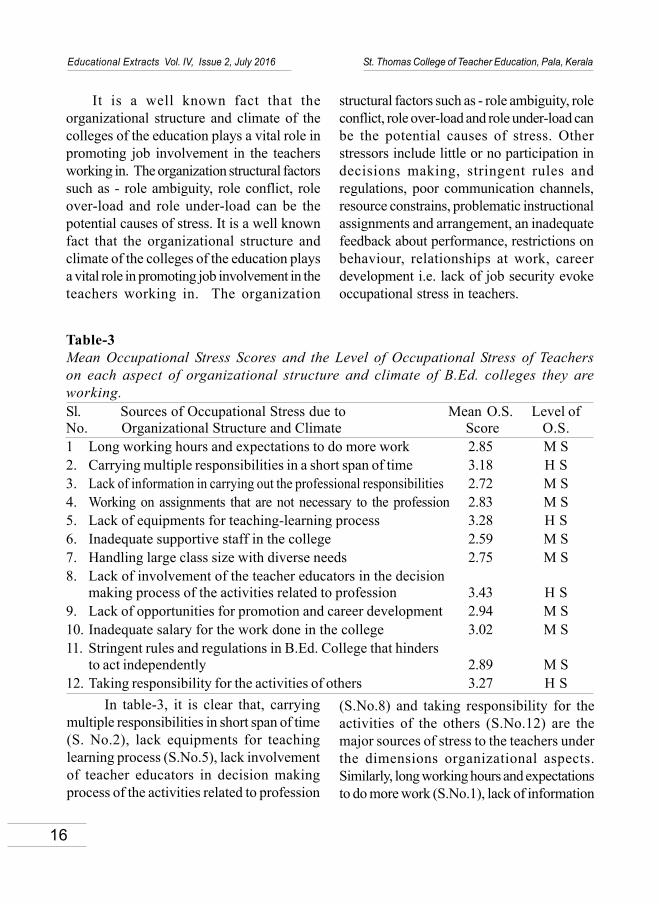
It is a well known fact that theorganizational structure and climate of thecolleges of the education plays a vital role inpromoting job involvement in the teachersworking in. The organization structural factorssuch as - role ambiguity, role conflict, roleover-load and role under-load can be thepotential causes of stress. It is a well knownfact that the organizational structure andclimate of the colleges of the education playsa vital role in promoting job involvement in theteachers working in. The organization
structural factors such as - role ambiguity, roleconflict, role over-load and role under-load canbe the potential causes of stress. Otherstressors include little or no participation indecisions making, stringent rules andregulations, poor communication channels,resource constrains, problematic instructionalassignments and arrangement, an inadequatefeedback about performance, restrictions onbehaviour, relationships at work, careerdevelopment i.e. lack of job security evokeoccupational stress in teachers.
Table-3Mean Occupational Stress Scores and the Level of Occupational Stress of Teacherson each aspect of organizational structure and climate of B.Ed. colleges they areworking.Sl. Sources of Occupational Stress due to Mean O.S. Level ofNo. Organizational Structure and Climate Score O.S.1 Long working hours and expectations to do more work 2.85 M S2. Carrying multiple responsibilities in a short span of time 3.18 H S3. Lack of information in carrying out the professional responsibilities 2.72 M S4. Working on assignments that are not necessary to the profession 2.83 M S5. Lack of equipments for teaching-learning process 3.28 H S6. Inadequate supportive staff in the college 2.59 M S7. Handling large class size with diverse needs 2.75 M S8. Lack of involvement of the teacher educators in the decision
making process of the activities related to profession 3.43 H S9. Lack of opportunities for promotion and career development 2.94 M S10. Inadequate salary for the work done in the college 3.02 M S11. Stringent rules and regulations in B.Ed. College that hinders
to act independently 2.89 M S12. Taking responsibility for the activities of others 3.27 H S
In table-3, it is clear that, carryingmultiple responsibilities in short span of time(S. No.2), lack equipments for teachinglearning process (S.No.5), lack involvementof teacher educators in decision makingprocess of the activities related to profession
(S.No.8) and taking responsibility for theactivities of the others (S.No.12) are themajor sources of stress to the teachers underthe dimensions organizational aspects.Similarly, long working hours and expectationsto do more work (S.No.1), lack of information

17
Educational Extracts Vol. IV, Issue 2, July 2016 St. Thomas College of Teacher Education, Pala, Kerala
in carrying out the professionalresponsibilities (S.No.3), working onassignments that are not necessary toprofession (S.No.4), inadequate supportivestaff on college (S.No.6), handling large classsize with diverse needs (S.No.7), lack ofopportunities for promotion and careerdevelopment (S.No.9), in adequate salary forthe work done in the college (S.No.10) andstringent rules and regulation in B.Ed. collegethat hinders to act independently are awakingmoderate level of stress in the teachers.Surprisingly, all the aspects mentioned arecausing high and moderate level of stress tothe teachers, reflecting the poor organizationalstructure and climate of the colleges ofeducation.
Effect of Independent variables(gender, marital status, type of collegeworking…..) on occupational stress ofteachers arising out of organizationalstructure and climate of B.Ed colleges.
In order to study the significancedifference between two or more than twogroup of samples, differential studies aremade. One of the major objectives of thestudy is to find out the significant differences,if any, in the B.Ed. college teachersoccupational stress due variations in theirindependent variables. To know thesignificant differences, if any, in theoccupational stress of B.Ed. college teachersdue to variation in their gender, marital status,type of college working, location of thecollege , nature of job, years of experience,average number of working hours per week,designation, age group, community,educational qualification and salary permonth; mean and SD has been calculatedfor each group in a variable. Based on themean and SD’s, t/ F-values have beenworked out to know the significantdifferences in the occupational stress of theteachers, arising out of organizationalstructure and climate of the B.Ed. colleges.
Table- 4Mean and Standard deviation of the occupational stress scores of teachers workingin the colleges of education due to variations in their independent variables.Variable Groups No. Mean SD Cal. t/F-valueGender Men 201 36.66 5.83
Women 163 34.64 7.94 2.80**Marital Status Married 268 35.27 6.67
Unmarried 96 37.09 7.46 2.22*Type of College Govt. & Private Aided Colleges 186 34.83 7.17Working Private Colleges 178 36.71 6.54 2.60**Location of the Urban 165 34.70 6.28College Rural 199 36.63 7.31 2.67 **Nature of Job Permanent 93 35.78 6.79
Temporary 271 35.74 6.985 0.052@Years ofExperience 1-10 years below 242 34.66 6.62
11-20 years and above 122 37.92 7.02 4.33**

18
Educational Extracts Vol. IV, Issue 2, July 2016 St. Thomas College of Teacher Education, Pala, Kerala
Average No. ofWorking Hours 14 hours and below 217 34.57 6.58
15 hours and above 147 37.50 7.07 4.00**Designation Assistant Professor 233 35.08 7.00
Associate Professor 131 36.95 6.65 2.48*Age Groups 28-37 years 198 34.01 6.56
38-47 years 102 37.87 5.9048-57 years 64 37.78 8.03 14.88**
Community OC 128 36.17 8.07BC 151 35.99 6.58SC & ST 85 34.69 5.45 1.32@
Educational PG with M.Ed. 220 35.27 7.11Qualifications NET/ SLET 46 36.59 6.46
PG with M.Ed. & M.Phil. 26 36.15 6.54PG with Ph.D. 72 36.54 6.75 0.91@
Regions of Telangana 138 36.92 6.63United Rayalaseema 79 35.50 6.85Andhra Pradesh Coastal Andhra Pradesh 148 34.64 7.12 3.97*Salary per Up to Rs. 10,000 106 34.41 5.91month Rs. 10,001 to 20,000 120 36.38 7.91
Rs. 20,001 to 30,000 39 37.26 7.21Rs. 30,001 to 40,000 63 36.49 5.37Rs. 40,001 and above 36 34.69 7.76 2.12@
Note : * Significant at 0.05 level; ** Significant at 0.01 level; @ Not significant at 0.01 level
In table-4, it is clear that, the t-valueswith respect to the variables gender (2.80),type of college working (2.60), location ofthe college (2.67), years of experience (4.33),average number of working hours (4.00) aresignificant at 0.01 level and; designation(2.48) and marital status (2.22) aresignificant at 0.05 level; the F-values for thevariables age group (14.88) and regions ofthe United Andhra Pradesh (3.97) aresignificant at 0.01 and 0.05 level, respectively.It means, the variations in each of thesevariables are significantly influencing theB.Ed. College teachers’ occupational stresscaused due to organizational structure and
climate of the B.Ed. colleges. Further, themean values indicate that the men teachers(36.66), unmarried teachers (37.09),teachers working in the private B.Ed.colleges (36.71), teachers working in thecolleges located in urban areas (36.63),teachers with 11-20 years and aboveexperience (37.92), teachers working morethan 15 hours and above (37.50) andAssociate professors (36.95) areexperiencing more stress than theircounterparts i.e. women (34.64), married(35.27), teachers working in government &private aided colleges (34.83), teachersworking in the colleges located in rural areas

19
Educational Extracts Vol. IV, Issue 2, July 2016 St. Thomas College of Teacher Education, Pala, Kerala
(34.70), teachers with 1-10 years ofexperience (34.66), teachers working 14hours and below (34.57) and Assistantprofessors (35.08), respectively. Similarly,teachers with higher age groups areexperiencing more stress than theircounterparts with younger age group.Teachers working in the B.Ed. colleges ofTelangana region showed higher rates ofoccupational stress (36.92), followed byRayalaseema region (35.50) and CoastalAndhra Pradesh region (34.64). On the otherhand, the t/F-values with respect to thevariables nature of job (0.052), community(1.32), educational qualification (0.91) andsalary per month (2.12) are not significantindicating non-influence of the variations ineach of these variables on the occupationalstress of B.Ed. college teachers.
The results of the study indicates theneed for providing conducive organizationalstructure and climate in the B.Ed. collegesin terms of assigning appropriate work,providing opportunities for professionalenhancement, giving scope for the teachersto participate in the decision making process,giving rational salary based on thequalifications and so on. Further, there is aneed to organize orientation programs to theteachers about the ways and means ofcompetency building in prevention, avoidanceand management of occupational stress,without sacrificing the quality of teachertraining programs. There is a need to trainthe teachers on the importance of meditation,yoga, scheduling of their time effectively bygiving adequate space for leisure activitieslike recreation, relaxation, sharing theirthoughts, feelings and ideas with thecolleagues in the college and outside the
colleges of education. It means, it is not justpassively absorbing the stress in the humanbody but expressing explicitly before thecolleagues and in the work environmentwhich make the other people to realize andreact to find appropriate workable solutionsto improve the work environment. In othersense, it is not the sympathetic outlook thatfinds solution to the problems but anempathetic bent of mind that promotes theother person to act more constructively inimproving the organizational structure andclimate of the B.Ed. colleges of education.
ReferencesAhghar, G. (2008) The role of school organizational
climate in occupational stress amongsecondary school teachers in Tehran,International Journal of OccupationalMedicine and Environmental Health, 21 (4),Pp.319-329.
Best, J.W. (1989) Research in education. PrenticeHall of India Pvt. Ltd: New Delhi.
Blase, J. (1986) A qualitative analysis of sourcesof teacher stress: Consequences forperformance. American Educational ResearchJournal, 23 (1), Pp. 13-40.
Brock, B. L and Grady, M. L. (2002) Avoidingburnout: A principal’s guide to keeping thefire alive. Thousand Oaks, CA: Corwin Press.
Butt, G., Lance, A., Fielding, A., Gunter, H., Rayner,S and Thomas, H. (2005) Teacher jobsatisfaction: lessons from the TSW pathfinderproject, School Leadership and Management,25 (5), Pp. 455-471
Colbert, D. (2008) Stress Less. Lake Mary, Florida:Siloam Publishers.
Combs, J., Edmonson, S. L., & Jackson, S. H.(2009) Burnout among elementary schoolprincipals, Journal of Scholarship andPractice, 5(4), 10-15.

20
Educational Extracts Vol. IV, Issue 2, July 2016 St. Thomas College of Teacher Education, Pala, Kerala
Garrett, E.H and Woodsworth, R.S.(1981) Statistics in psychology and education.Vakkils, Feffer and Simons Ltd: Bombay.
Hepburn, A and Brown, S. (2001)Teacher stress and Management ofAccountability, Human Relations, 54 (6),Pp.691-715.
Johnson, S., Cooper, C., Cartwright, S.,Donald, I., Taylor, P and Millet, C. (2005)The experience of work-related stress acrossoccupations, Journal of ManagerialPsychology, 20 (1/2), Pp.178-187.
Kanta Rao, P. (2010) Occupationalstress of teachers working in DravidianUniversity, M.Ed. Dissertation, DravidianUniversity, Kuppam
Larimore, W. (2003) Ten essentials ofhighly healthy people. Grand Rapids, MI:Zondervan Publishing.
Nagra, V. (2013, August) OccupationalStress among Teacher Educators, GlobalOnline Electronic InternationalInterdisciplinary Research Journal, 2:2.Retrieved from http://goeiirj.com/upload/aug2013/3.pdf
Pethe, S., Chaudhari, S and Dhar, U.(2001) Manual for Organizational ClimateScale. National Psychological Corporation:Agra.
Pithers, R. T and Soden, R. (1998)Scottish and Australian Teacher Stress andStrain: A Comparative Study, British Journalof Educational Psychology, 68, Pp 269-279.
Poornima, R. (2010) EmotionalIntelligence, occupational stress and jobsatisfaction of special education teachers,Ph.D. Thesis, Dept. of Education, DravidianUniversity, Kuppam.
Poornima, R. and Reddy, G.L. (2012)Occupational Stress and ProfessionalBurnout of University Teachers in SouthIndia, International Journal of EducationalPlanning andAdministration, 2(2), Dec.,Pp.109-124.
Rajeswari, S.M., Santhanam, T., Babu,B.P and Rao, D.B. (2008) Stress and attitudeof women teachers. Discovery PublishingHouse: New Delhi.
Reddy, G.L. (2006) Occupational stress,professional burnout and job satisfactionamong special education teachers in SouthIndia, Major Research Project MHRD, Govt.of India, Dept. of Education, DravidianUniversity, Kuppam.
Reddy, G.L. (2011) Occupational stress,professional burnout and job satisfaction ofuniversity teachers in South India, UGCMajor Research Project, Dept. of Education,Dravidian University, Kuppam.
Reddy, G.L and Poornima, R. (2009) Astudy on occupational stress of teachersworking in the special schools for visuallyimpaired children, Disabilities andImpairment, 23 (1), Pp.7-18.
Reddy, G.L and Poornima, R. (2012)Occupational stress and professional burnoutof university teachers in South India,International Journal of Educational Planningand Administration, 2 (2), July-December,Pp.109-124.
Reddy, G.L and Poornima, R. (2012a)Professional burnout of university teachersin South India, Edu Tracks: A MonthlyScanner of Trends in Education, 12 (2),October, Pp.14-20.

21
Educational Extracts Vol. IV, Issue 2, July 2016 St. Thomas College of Teacher Education, Pala, Kerala
Reddy, G.L and Poornima, R. (2013)Occupational stress of university teachers,Innovative Thoughts: an
International Research Journal, 1 (2),October, Pp.2-15.
Reddy, G.L and Vijaya Anuradha, R.(2013) Emotional Intelligence, OccupationalStress and Job Performance of HigherSecondary Teacher: A Correlation Study,Journal of Edu Tracks, 12 (06), February,Pp.15-24.
Reddy, G.L and Vijaya Anuradha, R.(2013a) Emotional Intelligence andOccupational stress of higher secondaryschool teachers: A correlation study. Journalof Pedagogics, 10 & 11 (1), Sept, Pp.6-11.
Reddy, G.L and Vijaya Anuradha, R.(2013b) Occupational Stress of HigherSecondary Teachers Working in VelloreDistrict. International Journal of EducationalPlanning and Administration, 3 (1), March,Pp. 9-24. Available online:http://www.ripublications.com//ijepa.htm.
Reddy, G.L and Vijaya Anuradha, R.(2013c) Organizational Structure & Climateas Source of Stress for Teachers.Educational Extracts, 1 (1), Jan, Pp.5-18
Reddy, G.L and Vijaya Anuradha, R.(2014) Occupational Stress and JobPerformance of Higher Secondary Teachers.Indian Journal of Psychometry and Education– An Interdisciplinary Peer ReviewedResearch Journal, 44 (1), Jan, Pp.37-43.
Slavin, R.E. (1987) Small groupmethods, in M.J. Dunkin (Eds.) Theinternational encyclopedia of teaching andteacher education, pp. 237-243. Pergamum:Oxford.
Sapolsky, R. M. (2004) Why zebrasdon’t get ulcers. New York: Holt Inc.
Traverse, C.J and Cooper, C.L. (1996)Teachers under pressure: Stress in theteaching profession. Routledge: London.
Vijaya Anuradha, R (2012) EmotionalIntelligence, Occupational Stress and JobPerformance of Teachers working at HigherSecondary Level, Ph.D. thesis, DravidianUniversity, Kuppam.
Weil, A. (2007) Healthy Aging. NewYork: Random House, Inc.
Wheeler, C. M. (2007) Ten simplesolutions to stress: How to tame tension andstart enjoying your life. Oakland, CA: NewHarbinger Publications.

22
Educational Extracts Vol. IV, Issue 2, July 2016 St. Thomas College of Teacher Education, Pala, Kerala
SELF CONCEPT AS A CORRELATE OFJOB INVOLVEMENT AMONG SECONDARY
SCHOOL TEACHERSDr. Seema Menon. K.P.*
AbstractThe study intends to find out the relationship between self concept and jobinvolvement among secondary school teachers in Palakkad district. The sample forthe present study consisted of 400 secondary school teachers working in schools ofgovernment, aided and unaided sectors. The investigator used two tools to collectdata-A self concept scale and job involvement scale for teachers. The study revealsthat secondary school teachers possess moderate level of self concept and jobinvolvement. The self concept among teachers with respect to gender and locale donot differ significantly. The job involvement among secondary school teachers do notdiffer significantly with respect to gender and locale. Findings of correlation revealeda positive correlation between self concept and job involvement for the total sampleand sub samples. The study points out to the need of improving the self concept andjob involvement of secondary school teachers.Keywords : Self concept, Job involvement, Secondary School Teachers, etc.
* Assistant Professor, N.S.S. Training College, Ottapalam, Palakkad, Pin 679 101
Educational Extracts ISSN 2320-7612
Vol. IV Issue 2 July 2016pp. 22-31
St. Thomas College of Teacher Education, Pala, Kerala, IndiaWebsite: www.stce-pala.info, www.stctepala.orgemail: [email protected]
INTRODUCTION
Education has got prime importance indetermining the future of our nation. It isconsidered as a man making process for theprogress of individual as well as for thenation. So it is necessary to ensure thateveryone should get quality educationirrespective of their socio economic status.
Teacher’s performance is the mostcrucial input in education since teachers playsan important role in moulding the personality
of a child. Teacher is the person who keepsthe lamp of civilization burning and shining.
The quality of education depends on thequality of teachers. The quality of a teacheris determined by his personality factors.Goldenson (1970) contends that anindividual’s self concept is considered as oneof the basic and crucial component of hispersonality. Teachers with proper selfconcept can only identify their abilities anddrawback. So that they can make
23
Educational Extracts Vol. IV, Issue 2, July 2016 St. Thomas College of Teacher Education, Pala, Kerala
appropriate measures to make their effortmaximum. Creemers (1994) argues thatstudents academic outcomes are moreheavily dependent on the procedure andactivities carried out in the classroom.Teachers require proper self-concept to maketheir class room suitable for teaching learning.Teachers have to perform various roles likea teacher, friend, counselor, etc. So teachersshould have a balanced, proper self conceptthen only they can guide their students. Oserand Partry (1992) found that learning andprogress cannot be achieved withouteffective teachers. When teaching is asharing of self with others it is vital to haveteachers with positive self concept to createproductive and supportive environment toenhance the achievement in students. Asteachers duty is to maximize the educationaloutcome teachers with good self concept aremost favoured. Burn (1984) asserted thatteachers with proper self concept has positiveattitude towards students.
Teachers with favaourable self concepthave a good degree of professionaladjustment. Khatry (1973) found out asignificant relationship between self conceptand professional adjustment among teachers.Ackley et al (1999) found that healthy selfconcept among teachers had profoundpositive impact on the attitude, beliefs andfinally on teaching success.
Positive self concept in teachers facilitatenot only themselves as effective teachers butalso pupil as effective learners with selfesteem and performance. Teachers selfconcept is considered as the majordeterminants in attitude towards their jobinvolvement. Teachers self concept hasprofound effects on students’ academic
achievement, attitude towards their teachingjob, interpersonal, relationships, adjustment.Teachers with positive self concept are foundto be successful in their life.
Job involvement of teachers refers tothe degree to which they are involved in theirteaching job. The job involved teachersdiffers from their colleagues in several ways.The teachers who are more involved in theirjobs are more likely to show betterperformance, ready to take up newresponsibility, and attain excellence ineverything they do. The main determinantsof job involvement among teachers are foundto be personal psychological variable, jobcircumstance variables and familycharacteristic variable. Among the threefactors personal psychological and jobcharacteristics are found to be more relevant.The study intends to find out the relationshipbetween self concept and job involvementamong secondary school teachers inPalakkad district.
OBJECTIVES OF THE STUDY
The main objectives of the study are:-1. To find out the self concept among
secondary school teachers.2. To find out the job involvement among
secondary school teachers.3. To find out whether there is any
significant difference in self conceptamong secondary school teachers forthe sub samples classified on the basisof (a) Gender, (b) Locale.
4. To find out whether there is anysignificant difference in job involvementamong secondary school teachers forthe sub samples classified on the basisof (a) Gender, (b) Locale.
24
Educational Extracts Vol. IV, Issue 2, July 2016 St. Thomas College of Teacher Education, Pala, Kerala
5. To find out whether there is anysignificant relationship between selfconcept and job involvement amongsecondary school teachers for the totalsample and sub sample classified on thebasis of (a) Gender, (b) Locale.
6. To find out whether there is anysignificant difference in relationshipbetween self concept and jobinvolvement among secondary schoolteachers for the sub sample classifiedon the basis of (a) Gender, (b) Locale.
HYPOTHESES OF THE STUDY
The main hypotheses of the study are:-1. The self concept among secondary
school teachers is comparatively high.2. The job involvement among secondary
school teacher is comparatively high.3. There exists a significant difference in
self concept among secondary schoolteachers for the sub sample classifiedon the basis of (a) Gender, (b) Locale.
4. There exists a significant difference injob involvement among secondary schoolteachers for the sub sample classifiedon the basis of (a) Gender, (b) Locale.
5. There exists a significant relationshipbetween self concept and jobinvolvement among secondary schoolteachers for the total sample and subsample classified on the basis of (a)Gender, (b) Locale.
6. There exists a significant difference inrelationship between self concept andjob involvement among secondary schoolteachers for the sub sample classifiedon the basis of (a) Gender, (b) Locale.
METHODOLOGY
The methodology of the present studyis described under the following headings.
Method
Survey method is used to collect data.
Sample
The present study was conducted on afinal sample of four hundred secondaryschool teachers, working in schools ofgovernment, aided and unaided sectors. Thesample for the present study was drawn bystratified random sampling techniques.
Tools
The investigator used the following toolsto measure the variables.• Self concept scale for teachers
developed by Dr. Kamala. S. Pillai(1989).
• Job involvement scale for teachers,which constituted of 59 statements, on14 dimensions of job involvement suchas; Locus of control, Work role salience,Need for achievement, anatomy, Workcommitment, Work challenge, Leaderbehaviour, Job satisfaction,Organisational support, Role ofambiguity, Skill variety, Infrastructurefacility, Spouse support, Parentaldemands.
Scoring
The score scheme adopted for the jobinvolvement is as follows. The scoring forthe positive statements was done as 5, 4, 3,2, 1 respectively for the responses stronglyagree, agree undecided, disagree, andstrongly disagree. For the negative

25
Educational Extracts Vol. IV, Issue 2, July 2016 St. Thomas College of Teacher Education, Pala, Kerala
statements it was done as 1, 2, 3, 4, 5respectively for marking strongly agree,agree, undecided, disagree and stronglydisagree. Subjects were asked to put ‘x’ inthe appropriate alternative with which theyagree.
Statistical Techniques Used1. Percentage analysis2. Two tailed test of significance of
difference between means for largeindependent sample.
3. Karl Pearson’s product moment co-efficient of correlation.
4. Test of significance of ‘r’ using ‘t’ test.5. Test of significance of difference
between two ‘r’ s.
Results and Discussion
Classification of secondary schoolteachers according to their level of selfconcept is given table 1. The table alsocontains the number and percentage ofteachers with different levels of self concept.
Table 1Percentage Analysis of the Variable Self Concept among Teachers for the Total SampleSl. No. Groups N Percent1. High Level of Self Concept 140 35.002. Average Level of Self Concept 148 37.003. Low Level of Self Concept 112 28.00Discussion of Results
Table 1 indicates that in the total sampleof 400 secondary school teachers 28 percentof teachers have high level of self concept,37 percent of teachers have average levelof self concept and 35 percent of teachershave low level of self concept. From thisdata it can be concluded that most of the
teachers fall in the category of average levelof self concept.
Classification of secondary schoolteachers according to their level of jobinvolvement is given table 2. The table alsocontains the number and percentage ofteachers with different levels of jobinvolvement.
Table 2Percentage analysis of the Variable Job Involvement among Teachers for the TotalSampleSl. No. Groups N Percent1. High Level of Job Involvement 141 35.252. Average Level of Job Involvement 142 35.503. Low Level of Job Involvement 117 29.25Discussion of Results
Data in the Table 2 suggests that in thetotal sample of 400 secondary schoolteachers 35.25 percent are with high levelof job involvement, 35.50 percent are with
average level of job involvement and 29.25percent are with low level of job involvement.From this data it can be concluded that mostof the teachers fall in the category of averagelevel of job involvement.
26
Educational Extracts Vol. IV, Issue 2, July 2016 St. Thomas College of Teacher Education, Pala, Kerala
To find out whether there is anysignificance in self concept amongsecondary school teachers for sub
samples classified on the basis of gender,‘t’ test was used and the result is shownin table 3.
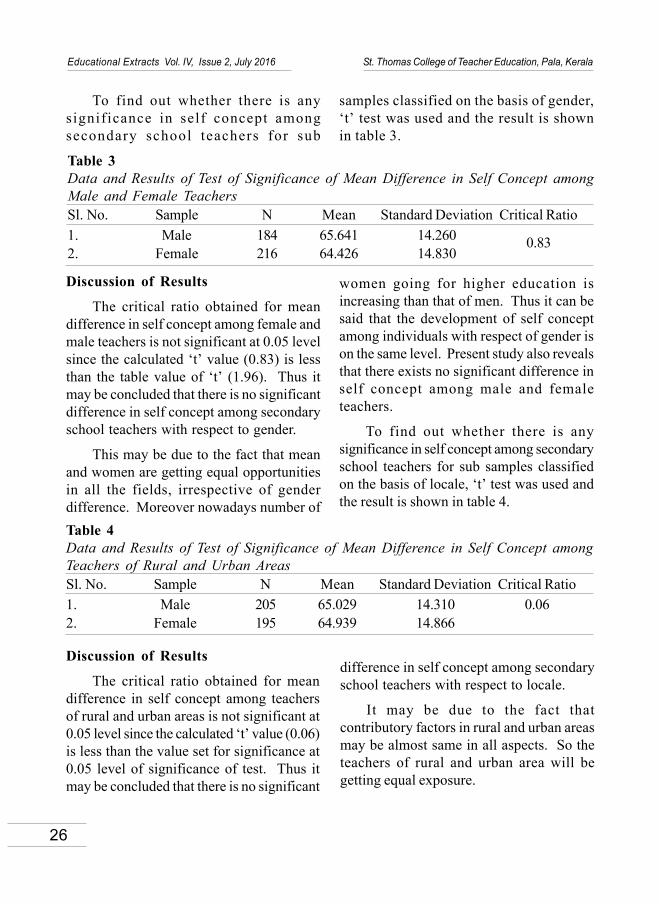
Table 3Data and Results of Test of Significance of Mean Difference in Self Concept amongMale and Female TeachersSl. No. Sample N Mean Standard Deviation Critical Ratio1. Male 184 65.641 14.260 0.832. Female 216 64.426 14.830
Discussion of Results
The critical ratio obtained for meandifference in self concept among female andmale teachers is not significant at 0.05 levelsince the calculated ‘t’ value (0.83) is lessthan the table value of ‘t’ (1.96). Thus itmay be concluded that there is no significantdifference in self concept among secondaryschool teachers with respect to gender.
This may be due to the fact that meanand women are getting equal opportunitiesin all the fields, irrespective of genderdifference. Moreover nowadays number of
women going for higher education isincreasing than that of men. Thus it can besaid that the development of self conceptamong individuals with respect of gender ison the same level. Present study also revealsthat there exists no significant difference inself concept among male and femaleteachers.
To find out whether there is anysignificance in self concept among secondaryschool teachers for sub samples classifiedon the basis of locale, ‘t’ test was used andthe result is shown in table 4.
Table 4Data and Results of Test of Significance of Mean Difference in Self Concept amongTeachers of Rural and Urban AreasSl. No. Sample N Mean Standard Deviation Critical Ratio1. Male 205 65.029 14.310 0.062. Female 195 64.939 14.866
Discussion of Results
The critical ratio obtained for meandifference in self concept among teachersof rural and urban areas is not significant at0.05 level since the calculated ‘t’ value (0.06)is less than the value set for significance at0.05 level of significance of test. Thus itmay be concluded that there is no significant
difference in self concept among secondaryschool teachers with respect to locale.
It may be due to the fact thatcontributory factors in rural and urban areasmay be almost same in all aspects. So theteachers of rural and urban area will begetting equal exposure.

27
Educational Extracts Vol. IV, Issue 2, July 2016 St. Thomas College of Teacher Education, Pala, Kerala
To find out whether there is anysignificance in job involvement amongsecondary school teachers for sub samples
classified on the basis of gender, ‘t’ test wasused and the result is shown in table 5.
Table 5Data and Results of Test of Significance of Mean Difference in Job Involvement amongMale and Female TeachersSl. No. Sample N Mean Standard Deviation Critical Ratio1. Male 184 221.408 17.522 1.902. Female 216 224.857 18.504
Discussion of Results
The critical ratio obtained for meandifference in job involvement scores obtainedamong male and female teacher is notsignificant at 0.05 level since the calculated‘t’ value is less than the table value of ‘t’(1.96). Thus it may be concluded that thereis no significant difference in job involvementamong male and female teachers.
The mean score obtained for jobinvolvement among male and femaleteachers reveals that females teachers are
found to be more involved than maleteachers. It may be due to the reason thatmale teachers may not be satisfied with theworking conditions and have less jobsatisfaction. They may have moreexpectations than that of female teachers.
To find out whether there is anysignificance in job involvement amongsecondary school teachers for sub samplesclassified on the basis of locale, ‘t’ test wasused and the result is shown in table 6.
Table 6Data and Results of Test of Significance of Mean Difference in Job Involvement amongTeachers of Rural and Urban AreasSl. No. Sample N Mean Standard Deviation Critical Ratio1. Rural 205 224.039 17.313 0.872. Urban 195 225.462 18.940
Discussion of Results
The critical ratio obtained for meandifference in job involvement among teachersof rural and urban area is not significant at 0.05level since the calculated ‘t’ value (0.87) is lessthan the table value of ‘t’ (1.96). Thus it maybe concluded that there is no significantdifference in job involvement among secondaryschool teachers with respect to locale.
Results reveal that teachers of rural andurban areas give equal importance to theirjobs. The working conditions that they aregetting in schools situated in both areas maybe more or less same.
To find out whether there exists asignificant relationship between self conceptand job involvement among secondary schoolteachers for the total sample and sub samples
28
Educational Extracts Vol. IV, Issue 2, July 2016 St. Thomas College of Teacher Education, Pala, Kerala
classified on the basis of gender co-efficientof correlation (r) was found that the result ispresented in table 7.
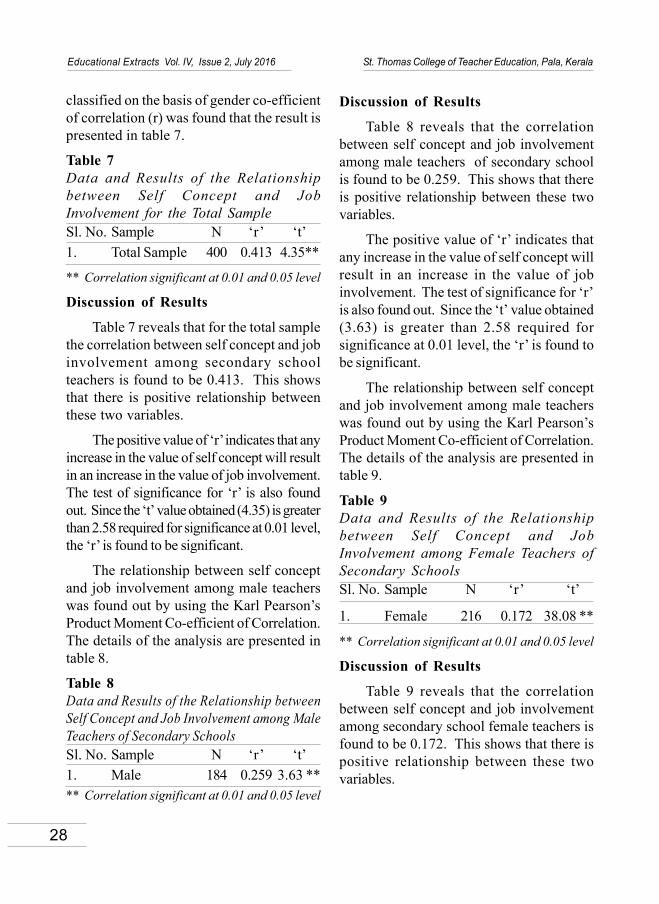
Table 7Data and Results of the Relationshipbetween Self Concept and JobInvolvement for the Total SampleSl. No. Sample N ‘r’ ‘t’1. Total Sample 400 0.413 4.35**
** Correlation significant at 0.01 and 0.05 level
Discussion of Results
Table 7 reveals that for the total samplethe correlation between self concept and jobinvolvement among secondary schoolteachers is found to be 0.413. This showsthat there is positive relationship betweenthese two variables.
The positive value of ‘r’ indicates that anyincrease in the value of self concept will resultin an increase in the value of job involvement.The test of significance for ‘r’ is also foundout. Since the ‘t’ value obtained (4.35) is greaterthan 2.58 required for significance at 0.01 level,the ‘r’ is found to be significant.
The relationship between self conceptand job involvement among male teacherswas found out by using the Karl Pearson’sProduct Moment Co-efficient of Correlation.The details of the analysis are presented intable 8.
Table 8Data and Results of the Relationship betweenSelf Concept and Job Involvement among MaleTeachers of Secondary SchoolsSl. No. Sample N ‘r’ ‘t’1. Male 184 0.259 3.63 **** Correlation significant at 0.01 and 0.05 level
Discussion of Results
Table 8 reveals that the correlationbetween self concept and job involvementamong male teachers of secondary schoolis found to be 0.259. This shows that thereis positive relationship between these twovariables.
The positive value of ‘r’ indicates thatany increase in the value of self concept willresult in an increase in the value of jobinvolvement. The test of significance for ‘r’is also found out. Since the ‘t’ value obtained(3.63) is greater than 2.58 required forsignificance at 0.01 level, the ‘r’ is found tobe significant.
The relationship between self conceptand job involvement among male teacherswas found out by using the Karl Pearson’sProduct Moment Co-efficient of Correlation.The details of the analysis are presented intable 9.
Table 9Data and Results of the Relationshipbetween Self Concept and JobInvolvement among Female Teachers ofSecondary SchoolsSl. No. Sample N ‘r’ ‘t’
1. Female 216 0.172 38.08 **
** Correlation significant at 0.01 and 0.05 level
Discussion of Results
Table 9 reveals that the correlationbetween self concept and job involvementamong secondary school female teachers isfound to be 0.172. This shows that there ispositive relationship between these twovariables.

29
Educational Extracts Vol. IV, Issue 2, July 2016 St. Thomas College of Teacher Education, Pala, Kerala
The positive value of ‘r’ indicates thatany increase in the value of self concept willresult in an increase in the value of jobinvolvement. The test of significance for ‘r’is also found out. Since the ‘t’ value obtained(38.08) is greater than 2.58 required forsignificance at 0.01 level, the ‘r’ is found tobe significant.
The relationship between self conceptand job involvement among secondary schoolteachers of rural area found out by using theKarl Pearson’s Product Moment Co-efficientof Correlation. The details of the analysisare presented in Table 10.
Table 10Data and Results of the Relationshipbetween Self Concept and JobInvolvement among Teachers of RuralAreaSl. No. Sample N ‘r’ ‘t’1. Rural 205 0.85122.82 **
** Correlation significant at 0.01 and 0.05 level
Discussion of Results
Table 10 reveals that the correlationbetween self concept and job involvementamong secondary school female teachers isfound to be 0.851. This shows that there ispositive relationship between these twovariables.
The positive value of ‘r’ indicates thatany increase in the value of self concept willresult in an increase in the value of jobinvolvement. The test of significance for ‘r’is also found out. Since the ‘t’ value obtained(22.82) is greater than 2.58 required forsignificance at 0.01 level, the ‘r’ is found tobe significant.
The relationship between self conceptand job involvement among secondary schoolteachers of urban area found out by usingthe Karl Pearson’s Product Moment Co-efficient of correlation. The details of theanalysis are presented in Table 11.
Table 11Data and Results of the Relationshipbetween Self Concept and JobInvolvement among Teachers of UrbanAreaSl. No. Sample N ‘r’ ‘t’
1. Urban 195 0.484 7.6**
** Correlation significant at 0.01 and 0.05 level
Discussion of Results
Table 11 reveals that the correlationbetween self concept and job involvementamong secondary school teachers of urbanarea is found to be 0.484. This shows thatthere is positive relationship between thesetwo variables.
The positive value of ‘r’ indicates thatany increase in the value of self concept willresult in a increase in the value of jobinvolvement. The test of significance for‘r’ is also found out. Since the ‘t’ valueobtained (7.6) is greater than 2.58 requiredfor significance at 0.01 level, the ‘r’ is foundto be significant.
To test whether there is exists asignificant difference in relationship betweenself concept and job involvement amongsecondary school teachers for the sub samplesclassified on the basis of gender, test ofsignificance of difference in ‘r’ is used testof significance of difference in ‘r’ of selfconcept and job involvement among teachers
30
Educational Extracts Vol. IV, Issue 2, July 2016 St. Thomas College of Teacher Education, Pala, Kerala
with respect to gender is found out and theresults are presented in the Table 12.
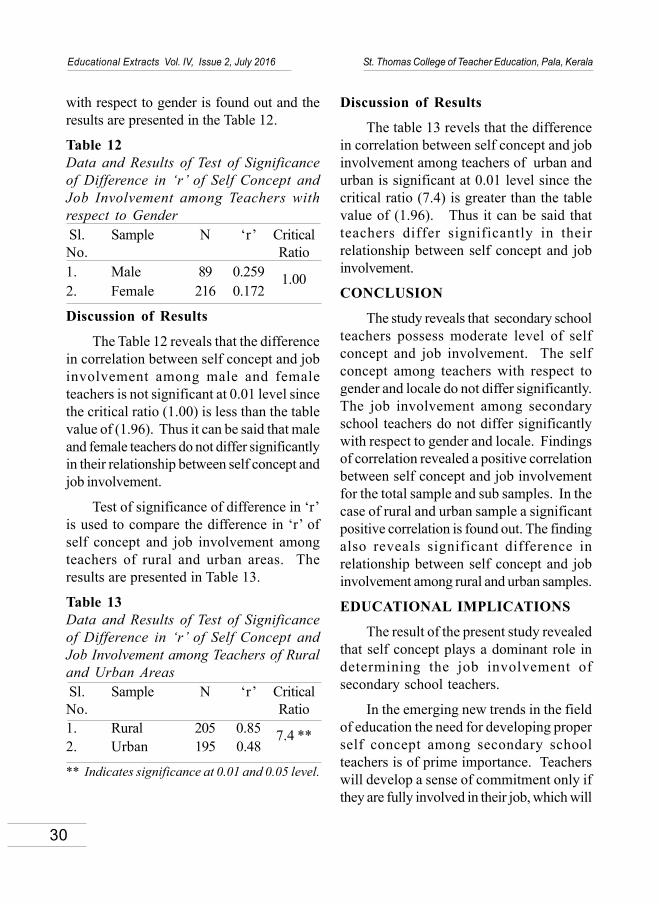
Table 12Data and Results of Test of Significanceof Difference in ‘r’ of Self Concept andJob Involvement among Teachers withrespect to Gender Sl. Sample N ‘r’ CriticalNo. Ratio1. Male 89 0.259 1.002. Female 216 0.172
Discussion of Results
The Table 12 reveals that the differencein correlation between self concept and jobinvolvement among male and femaleteachers is not significant at 0.01 level sincethe critical ratio (1.00) is less than the tablevalue of (1.96). Thus it can be said that maleand female teachers do not differ significantlyin their relationship between self concept andjob involvement.
Test of significance of difference in ‘r’is used to compare the difference in ‘r’ ofself concept and job involvement amongteachers of rural and urban areas. Theresults are presented in Table 13.
Table 13Data and Results of Test of Significanceof Difference in ‘r’ of Self Concept andJob Involvement among Teachers of Ruraland Urban Areas Sl. Sample N ‘r’ CriticalNo. Ratio1. Rural 205 0.85 7.4 **2. Urban 195 0.48
** Indicates significance at 0.01 and 0.05 level.
Discussion of Results
The table 13 revels that the differencein correlation between self concept and jobinvolvement among teachers of urban andurban is significant at 0.01 level since thecritical ratio (7.4) is greater than the tablevalue of (1.96). Thus it can be said thatteachers differ significantly in theirrelationship between self concept and jobinvolvement.
CONCLUSION
The study reveals that secondary schoolteachers possess moderate level of selfconcept and job involvement. The selfconcept among teachers with respect togender and locale do not differ significantly.The job involvement among secondaryschool teachers do not differ significantlywith respect to gender and locale. Findingsof correlation revealed a positive correlationbetween self concept and job involvementfor the total sample and sub samples. In thecase of rural and urban sample a significantpositive correlation is found out. The findingalso reveals significant difference inrelationship between self concept and jobinvolvement among rural and urban samples.
EDUCATIONAL IMPLICATIONS
The result of the present study revealedthat self concept plays a dominant role indetermining the job involvement ofsecondary school teachers.
In the emerging new trends in the fieldof education the need for developing properself concept among secondary schoolteachers is of prime importance. Teacherswill develop a sense of commitment only ifthey are fully involved in their job, which will
31
Educational Extracts Vol. IV, Issue 2, July 2016 St. Thomas College of Teacher Education, Pala, Kerala
improve the standard of education. Someof the educational implications of this studyare the following:• The study points out in the need for
developing proper self concept insecondary school teachers.
• The study will make a self awarenessamong teachers about the need forimproving their own self concept andjob involvement for enhancing theirteaching ability.
• The findings lead to the necessity ofconsidering the self concept level ofteachers while conducting theorientation and teachers developmentprogrammes.
• The findings of the study lead to thenecessity of encouraging teachers toinvolve more in their job by developinga sense of commitment.
• The study points out the need fordevising methods for enhancing teachercommitment.
• The study points out the need forintegrating strategies and techniques inpre-service and in-service education soas to develop proper self concept andcommitment among teachers towardsteaching job.
REFERENCESAllport, G. (1943). The ego in contemporary
psychology, Psychological Review, 50, 451-476.
Aminabhavi, V.A and Dhavanendriah, A.S(1997). A study of factors contributing tojob involvement, Indian Journal ofPsychometry and Education. 28(2), 109-112.
Burns, R.B. (1984). The self concept, theory,measurement and behaviour, (3rdimpression). London and New York :Longman.
Creemer (1994). Generating Criteria forMeasuring Teacher effectiveness throughself evaluation approach : A complementaryway of measuring teacher effectiveness. InKyriakides, R.J. Camp bell, and E.Christ Fidou(2002). School Effectiveness and SchoolImprovement. Vol. 13, No. 3, pp. 291-325.
Goldenson, R.M (1970). The Encyclopedia ofHuman Behaviour Psychology, Psychiatryand Mental Health. Vol. 2, 1100, New York :Doubleday.
Khatry, P.P (1973). A comparative study of theself concept of teachers of different categoriesand the relationship of their self concept withprofessionally adjustment. Doctoral thesis,Punjab University.
Oser, F.K, Dick, A. and Patry, J.L. (1992). Effectiveand responsible teaching. New York :Macmillan.

32
Educational Extracts Vol. IV, Issue 2, July 2016 St. Thomas College of Teacher Education, Pala, Kerala
SPATIAL THINKING SKILLS AND ACHIEVEMENT INMATHEMATICS AMONG SECONDARY
SCHOOL STUDENTS
Anju K. Paul*Dr. T. C Thankachan**
AbstractSpatial intelligence is the ability to visualize spatial patterns and mentallymanipulate them over a time-ordered sequence of spatial transformations.Mathematics is regarded as the mother of all sciences. The present study aims toassess the Spatial Thinking Skills and Academic Achievement of the Students ofStandard Nine. Survey method was used for the study. The study was conducted on arandom sample of 402 Students of Standard Nine. The major finding of the study wasthat Most of the students have Average Spatial Thinking Skills and Achievement inMathematics. The study further reveals that there is no significant difference in SpatialThinking Skills and Achievement in Mathematics among Boys and Girls. The studyalso reveals that there is significant difference in Spatial Thinking Skills andAchievement in Mathematics among Aided, Unaided and Government school studentsof standard Nine. And there is a high relationship between Spatial Thinking Skillsand Achievement in Mathematics among the students of Standard Nine.Key Words:- Spatial Thinking Skills, Achievement in Mathematics, Secondary SchoolStudents, etc.
* Assistant Professor, Department of PG Studies in Education, St. Thomas College of TeacherEducation, Pala, Kerala & Research Scholar, Bharathiar University, Coimbatore.
** Assistant Professor, St. Thomas College of Teacher Education, Pala, Kerala.
Educational Extracts ISSN 2320-7612
Vol. IV Issue 2 July 2016pp. 32-44
St. Thomas College of Teacher Education, Pala, Kerala, IndiaWebsite: www.stce-pala.info, www.stctepala.orgemail: [email protected]
Introduction
Education is a never ending process ofinner growth and development. It is holisticin character; it is just like an artist who mouldsthe raw materials of child into a better, pureand noble person. Mathematics has certainunique features which one can hardly find in
other disciplines. The importance ofscholastic or academic achievement hasraised important questions for educationalresearchers. What factors promoteachievement in schools and how far do thesedifferent factors contribute towardsachievement? When it comes toachievement in mathematics Education, it

33
Educational Extracts Vol. IV, Issue 2, July 2016 St. Thomas College of Teacher Education, Pala, Kerala
involves the interaction of three factorsnamely aptitude for learning, readiness forlearning and opportunity for learning.Achievement in Mathematics preciselyspeaking implies one’s knowledge,understanding and skills in the subject.
Mathematics is regarded as the motherof all sciences. If our students are to functioneffectively at this time of extraordinarily andaccelerating global changes, they mustunderstand Mathematics and be able to useMathematics both in their personal andprofessional lives. These has never been agreater need to be mathematically literatethan these days. Those who understand andproficient in Mathematics have significantlyenhanced opportunities and options that opendoors to productivity. Those who lackmathematical competence will find such doorsand options closed. The study of mathematicsprovides sufficient mathematical skills tomeet the demands of daily life. It provides aframework for solving problems. Therefore,mathematics is a powerful tool for the learner.
An achievement is something whichsomeone has successes in doing, especiallyafter a lot of effort. It was a greatachievement to reach this agreement quickly.Academic achievement is the knowledgeobtained or skill acquired in the schoolsubjects. According to Downie, “Any testthat measures the attainments oraccomplishment of an individual after aperiod of training or learning is calledachievement test”. “Achievement is theknowledge attained or skills developed inacademic subjects usually designed by testscores or by marks assigned by the teachersor both” (Good, 1945).
Spatial thinking skills in Mathematics
Thinking is one of the important aspectsof teaching and learning. Teaching childrento become effective thinkers is increasinglyrecognized as an immediate goal ofeducation. A child’s ability to learn and solvethe problems depends upon his ability to thinkcorrectly. It helps him in adjustment and isnecessary for successful living. A man whocan think distinctly, consecutively andcarefully can only contribute somethingworthwhile to the society. But one is not aborn thinker. One has to learn to think just asone has learnt to perceive. The child has tobe trained in keeping himself away from theincorrect and useless thinking besides havingknowledge and practice of the methods ofadequate thinking. Thinking is the highestmental activity present in a man. All humanachievement and progress is simply theproduct of thought.
Mathematical thinking is the mentalactivity involved in the abstraction andgeneralization of mathematical ideas. Thereare different types of thinking strategiesneeded for learning mathematics. Lateralthinking skills, convergent thinking skills,abstract thinking skills, spatial thinking skillsand so on. Among these, developing SpatialThinking Skill is very much importantbecause of the advancement in science andTechnology in this modern era. SpatialThinking is powerful. It solves problems bymanaging, transforming and analyzing datasets and by communicating the results ofthose processes to one’s self and to others.Spatial Thinking has been receiving increasedattention in the past several years. It has alarge number of applications in our day-to-

34
Educational Extracts Vol. IV, Issue 2, July 2016 St. Thomas College of Teacher Education, Pala, Kerala
day life. According to National ResearchCouncil Committee of USA (2006) “SpatialThinking is a constructive amalgam of threemutually reinforcing components: the conceptof space, tools of representation, andprocesses of reasoning”.
Spatial ability, often referred to asthinking pictures, is important for generatingand conceptualizing solutions to multi-stepproblems that arise in area such asarchitecture, engineering, science,mathematics, art, games and everyday life.Spatial functioning is a mental process, whichis associated with the brain’s attempts tointerpret certain types of incominginformation. This information is basicallyanything visual-pictures, maps, plans etc.while other types of intelligence (such asmathematical ability) are historicallyesteemed by society, spatial ability is probablyand silently the most vital aspect of thehuman’s mental capabilities.
Spatial Thinking is the capacity toperceive the visual world accurately, toperform transformations and modificationsupon one’s initial perceptions, and to be ableto re-create aspects of one’s visualexperience, even in the absence of relevantphysical stimuli (Gardner, 1987). Theoperational definition of Spatial Thinkingdenotes the ability to judge the relations ofobjects in space, to manipulate them mentally,to visualize the effect of putting them togetheror of turning them over or around.
Need for the study of Spatial thinkingskills in Mathematics
Mathematics has not only been usefulin its own right but it has also enriched theworld by helping to develop other fields of
helping to develop other fields of knowledge.It helps in our quest for knowledge, truth andbeauty, desire to interpret and control ourenvironment. Our culture is on the movethrough Mathematics. Mathematicalfoundation skills are crucial for success intoday’s high performance work place.
Nearly a century of research confirmsthe close connection between SpatialThinking and mathematics performance. Ingeneral, people with strong Spatial Skills alsotend to perform well in mathematics.Moreover the strength of this connectiondoes not appear to be limited to any onestrand of mathematics. Researchers havefound evidence to suggest that SpatialThinking plays an important role in arithmetic,word problems, measurement geometry,algebra and calculus. Spatial thinking was abetter predictor of mathematic as successthan either verbal or mathematical skills.Mathematics learning disability related tospatial cognition is called spatial acalculia,which is characterized by difficulties aligningnumerals and reading operational signs.
Spatial Thinking Skills help in developinga positive attitude and in making connectionsbetween Mathematics and everydaythinking. The development of Spatial ThinkingSkills in Mathematics has been a primaryproblem for the researchers, educators andteachers for many years. So children shoulddevelop Spatial Thinking Skills especially interms of learning of Mathematics. SpatialMathematical Thinking will help an individualto be strong in everyday mathematicalproblem solving skill. Spatial visualization,reasoning and representation can help todevelop the Mathematical skill.

35
Educational Extracts Vol. IV, Issue 2, July 2016 St. Thomas College of Teacher Education, Pala, Kerala
This study will be conduct to studentsof Standard Nine because students in thisage begin to perceive the structure ofMathematics as a discipline. At this stage,students integrate the many concepts andskills that may lead into a problem solvingability. Mathematical modeling, spatialvisualization, spatial reasoning, data analysisand interpretation taught at this stage canconsolidate a high level of mathematicalliteracy. . A majority of children have a senseof fear and failure regarding Mathematics.Hence, they give up early on, and drop outof serious mathematical learning. Thecurriculum is disappointing not only to thisnon-participating majority, but also to thetalented minority by offering them nochallenges. Problems, exercises and methodsof evaluation are mechanical and repetitive,with too much emphasis on computation.Areas of Mathematics such as SpatialThinking are not developed enough in thecurriculum. (National CurriculumFramework, 2005)
Spatial Thinking is malleable and can beimproved through education and experience.Spatial Thinking is made up of many skills,and for this reason, it is possible to excel incertain aspects of Spatial Thinking, such asnavigational skills, while demonstratingrelative weaknesses in other areas, such asvisualization skills. Spatial Thinking Skills canbe improved through an assortment ofactivities and across all age groups. Theteacher can suggest some techniques toimprove Spatial Thinking Skills such as • Puzzle play • Video games (eg. Tetris) • Block building
• Practicing spatial activities • Art and design tasks • In class lesson and activities designed
to support and develop student’s SpatialThinking Skills.
Spatial Thinking is not a magical processor a matter of genetic endowment, but alearned mental process. For solvingmathematical problems, we need the skillssuch as reasoning, hypothesizing, problemsolving, information processing andevaluation. Each of these thought requiresthe application of a rational, questioningapproach in order to be successful. Theimportance of the study of Spatial Thinkingis to help one learn to think properly and focusour mind so we can come up with a solution.
Need for the Study of Achievement inMathematics
Achievement in Mathematics isnecessary for higher studies. Fundamentalmathematical skills are needed as the basicsurvival tools for life. Appropriate experienceswith Mathematics enhance the ability to besystematic and spatial problem solvers.Achievement test will increase student’sconfidence level.
Mathematical literacy is a necessity intoday’s world. Fundamental mathematicalskills are needed as the basics survival toolsfor life. Furthermore the word is changing sorapidly, we don’t know what kinds ofproblems that today a child will be facestomorrow. So above all they need to be ableto be systematic, logical problem solvers.Appropriate experiences with Mathematicsenhance that ability.
36
Educational Extracts Vol. IV, Issue 2, July 2016 St. Thomas College of Teacher Education, Pala, Kerala
The importance of scholastic orAcademic Achievement has raised importantquestions for educational researchers that,factors promote Achievement in schools andhow far do the different factors contributetowards Achievement in Mathematicseducation, Spatial Thinking Skills have aconsiderable influence on haw a childperforms in mathematical accomplishment.
Significance of the Study of SpatialThinking Skills
There is a connection between SpatialThinking Skill and Mathematics performance.Students with strong Spatial Skill also tend toperform well in Mathematics. Geddes (1993)claimed that studying geometry will developspatial sense and provide opportunities fordeveloping divergent thinking and creativeproblem solving as well as logical thinkingabilities of students. Burns expressed that,appropriate geometry experiences wereuseful for developing reasoning processeswhich in turn support problem solving skills inchildren.
Mathematics is exact and true. So italways demands originality for its learning.There for the aim of the teacher is to developchild’s resources to think and reasonmathematically, to pursue assumptions tospatial conclusions and to handleabstractions. Visual spatial skills are of greatimportance for success in solving many tasksin everyday life. Having children develop apositive attitude towards, and a liking for,Mathematics at the primary stage is asimportant, if not more as the cognitive skillsand concepts that they acquire.Mathematical games, puzzles and storieshelp in developing a positive attitude and in
making connections between mathematicsand everyday thinking (NCF, 2005).Spatial thinking skills help the students todevelop the ability to think. Besidesnumbers and number operations, dueimportance must be given to shapes, spatialunderstanding, patterns, measurement anddata handling. The curriculum must explicitlyincorporate the progression that learnersmake from the concrete to the abstract whileacquiring concepts (NCF, 2005).
All these studies highlight theimportance of Spatial Thinking Skills inMathematics. Also Spatial Thinking isrecognized as a fundamental part of schoolcurriculum due to its importance as aproblem solving tool in many differentdisciplines especially in Mathematics.Therefore, the development of SpatialThinking Skills in Mathematics has been aprimary problem for the researchers,educators and teachers for many years. Sochildren should develop Spatial Thinking Skillsespecially in terms of Mathematics. Beforethat one has to know the extent of SpatialThinking Skills in Mathematics amongchildren to provide proper help to developthis skill and to nurture it.
Individuals with Spatial mathematicalthinking will fall into one or perhaps all of thefollowing sectors • Educational Mathematical Achievement • Studied Mathematics at school / college
and achieved good grades • Strong everyday Mathematical skills • Enjoys utilizing ones Mathematical skills
in everyday life • Everyday problem solving skills naturally
inquisitive, curios and investigative

37
Educational Extracts Vol. IV, Issue 2, July 2016 St. Thomas College of Teacher Education, Pala, Kerala
• Ability to apply spatial reasoning skillsto solve everyday problems
So Spatial Thinking has an important rolein Mathematics education.
Significance of the Study ofAchievement in Mathematics
Mathematical performance of thestudents can be improved by training themon spatial tasks, several studies have shownthat Spatial Thinking Skills are positivelyrelated to Achievement in Mathematics.Spatial Thinking Skills help the students likereasoning, orientation, representation, andvisualization. This helps them into a highestachievement.
Educators believe that awareness ofthe Spatial Thinking Skill of their studentswill lead to effective teaching and activelearning. They insisted that curriculumcontent and activities should match thestudent’s reasoning abilities. With the properlearning experience instruction can developthe higher order thinking skills of studentsand help to lift the intellectual developmentand academic achievement of students tohigher levels.
Statement of the problem
Investigator states the research problemof the study as “A study on Spatial ThinkingSkills and Achievement in Mathematicsamong the Students of Standard Nine ofKottayam District”.
Operational Definitions of the keyTerms
• Spatial Thinking Skills
“Spatial Thinking Skills are consideredto those mental skills concerned with
understanding, manipulating, reorganizing orinterpreting relationship visually” (Mc Gee,1979).
• Achievement in Mathematics
“Achievement in Mathematics refers tothe knowledge attained or skills developed inthe subject of mathematics, usually designedby the test scores or marks assigned by theteachers” (Good, 1945).
• Students of Standard Nine
Students of Standard Nine are definedas the students who are in the age of 14-15years both boys and girls belonging toGovernment, Aided and Unaided schools ofKottayam district.
• Kottayam District
The investigator defines KottayamDistrict as one of the fourteen RevenueDistricts in the state of Kerala.
Objectives of the Study
The investigator formulated theobjectives for the present study as follows, • To study the distribution of scores on
Spatial Thinking Skills among theStudents of Standard Nine.
• To study the distribution of the scoreson Achievement in Mathematics amongthe Students of Standard Nine.
• To study the significant difference if anyin the Means of scores on SpatialThinking Skills among the Students ofStandard Nine with regard to
a) Gender
b) Locale and
c) Type of Management

38
Educational Extracts Vol. IV, Issue 2, July 2016 St. Thomas College of Teacher Education, Pala, Kerala
• To study the significant difference if anyin the Means of scores onAchievement in Mathematics amongthe Students of Standard Nine withregard to
a) Gender
b) Locale and
c) Type of Management • To study the relationship between
Spatial Thinking Skills and Achievementin Mathematics among the Students ofStandard Nine.
Hypotheses of the Study
The investigator formulated thefollowing Research Hypotheses for thestudy.1. There exists a significant difference in
the Means of scores on Spatial ThinkingSkills among the Boys and Girls ofStandard Nine.
2. There exists a significant difference inthe Means of scores on Spatial ThinkingSkills among the Students of StandardNine of Urban and Rural area schools.
3. There exists a significant difference inthe Means of scores on Spatial ThinkingSkills among the Students of StandardNine of Aided, Government andUnaided schools.
4. There exists a significant difference inthe Means of scores on Achievementin Mathematics among the Boys andGirls of Standard Nine.
5. There exists a significant difference inthe Means of scores on Achievementin Mathematics among the Students ofStandard Nine of Urban and Rural areaschools.
6. There exists a significant difference inthe Means of scores on Achievementin Mathematics among the Students ofStandard Nine of Aided, Government
and Unaided schools.7. There exists a significant relationship
between Spatial Thinking Skills andAchievement in Mathematics amongthe Students of Standard Nine.
Methodology of the Study
The present study used the DescriptiveSurvey method for the collection of data onSpatial Thinking Skills in Mathematics amongthe Students of Standard Nine.
Population of the Study
The population of the present studyconsists of all the Government, Aided andUnaided school students of Standard Nineof Urban and Rural schools of KottayamDistrict.
Sample of the Study
Stratified Random Sampling techniqueused by the investigator to select the sample.The present study conduct on arepresentative sample of 402 Students ofStandard Nine of Kottayam District.
Tools used for the Study • A test on Spatial Thinking Skills: - • Achievement test scores in Mathematics
of terminal examination
Statistical Techniques used for theStudy
Descriptive Statistics:-
• Arithmetic Mean
• Standard Deviation
• Graphical Representation
• Karl Pearson’s Product MomentCorrelation
Inferential Statistics
• Two-tailed test (t-test)
• One way ANOVA

39
Educational Extracts Vol. IV, Issue 2, July 2016 St. Thomas College of Teacher Education, Pala, Kerala
Table 1Distribution of the scores of Spatial ThinkingSkillsClass Frequency % ofInterval Frequency10-20 4 .9920-30 22 5.4730-40 36 8.9640-50 50 12.4450-60 57 14.1860-70 62 15.4270-80 69 17.1680-90 79 19.6590-100 23 5.47Total 402 100
The first objective was to study theSpatial Thinking Skills among the Studentsof Standard Nine. From the table, it isinterpreted that highest number of studentsie, 79 students fall in the class interval of80-90. Ie, 19.65% of the students fall in thisscore. .99% belongs to the class interval10-20. Only 5.47% got scores in the classinterval 20-30. This shows that the scoresare not normally distributed around thecentral score.
Table 2Classification of total sample of students based on their scores on Spatial Thinking SkillsLevel of Spatial Range Number of PercentageThinking Skills studentsHigh Spacial Thinking Skills Above 81.83 87 21.64Average Spatial Thinking Skills Between 81.83 and 42.29 237 58.96Low Spatial Thinking Skills Below 42.29 78 19.40Total 402 100
We have to find out the level of SpatialThinking Skills. The investigator classified thewhole sample based on the scores obtainedin the tool titled Test on Spatial Thinking Skills.The classification is as follows. By using theMean and Standard deviation of the scoresit is easy to classify the students accordingto their Spatial Thinking Skills. Majority ofstudents have Average Spatial Thinking Skills.Only 21.64% of students have high SpatialThinking Skills. About 19.40% of studentshave low Spatial Thinking Skills.
Table 3Distribution of the scores of Achievementin MathematicsClass Frequency % ofInterval Frequency0-10 3 .7510-20 21 5.2220-30 30 7.4630-40 36 8.9640-50 44 10.9550-60 50 12.4460-70 54 13.4370-80 58 14.4380-90 72 17.9190-100 34 8.46Total 402 100

40
Educational Extracts Vol. IV, Issue 2, July 2016 St. Thomas College of Teacher Education, Pala, Kerala
The second objective was to study theAcademic Achievement among the Studentsof Standard Nine. From the table, it isinterpreted that highest number of studentsie, 58 students fall in the class interval of 70-
80. Ie, 14.43% of the students fall in thisscore. 75% belongs to the class interval 0-10. Only 5.22% got scores in the class interval10- 20. This shows that the scores are notnormally distributed around the central score.
Table 4Classification of total sample of students based on their scores Achievement inMathematicsLevel of Achievement in Mathematics Range No. of students PercentageHigh Achievement in Mathematics Above 83.22 82 20.39Average Achievement in Mathematics Between 83.22 & 33.82 226 56.23Low Achievement in Mathematics Below 33.82 94 23.88Total 402 100
We have to find out the level ofAchievement in Mathematics. Theinvestigator classified the whole samplebased on the scores obtained in the scoresof Achievement test in Mathematics. Theclassification is as follows. By using theMean and standard deviation of the scores it
is easy to classify the students according totheir Achievement in Mathematics. Majorityof students have Average Achievement inMathematics. Only 20.39% of students havehigh Achievement in Mathematics. About23.88% of students have low Achievementin Mathematics.
Table 5Significance of the difference between the means of scores of Spatial Thinking Skillsamong the Students of Standard Nine with regard to Gender and LocaleVariable Category N Mean S.D Df t value p value RemarkMale 201 61.68 19.97 400 .388 .699 Not SignificantFemale 201 62.44 19.60 at .05 levelUrban 200 60.06 20.05 400 2.027 .043 SignificantRural 202 64.04 19.33 at .05 level
The third objective was to find out thesignificance difference if any among thestudents of standard nine based on Genderand Locale. The investigator used inferentialstatistics to find out the significant differencebetween the mean scores of the variables.The above table reveals that the t valuesindicating the differences in the means ofscores of Spatial Thinking Skills among theStudents of Standard Nine grouped in terms
of Gender are less than the table value 1.96and the obtained p value is not less than .05at .05 level of significance with degrees offreedom 400. And t values indicating thedifferences in the means of scores of SpatialThinking Skills among the Students ofStandard Nine grouped in terms of Localeare greater than the table value 1.96 and theobtained p value is less than .05 at .05 levelof significance with degrees of freedom 400.

41
Educational Extracts Vol. IV, Issue 2, July 2016 St. Thomas College of Teacher Education, Pala, Kerala
The third objective was to find out thesignificance difference if any among thestudents of standard nine based on Type ofmanagement. The investigator usedinferential statistics to find out the significantdifference between the mean scores of thevariables. From the table the investigator
interprets that the obtained F- value 20.933is greater than the table value 3.02 at .05level of significance with degrees of freedom3/399. It shows that Means of Scores onSpatial Thinking Skills with regard to Typeof Management differ significantly.
It shows that the male and female, studentsof standard Nine do not differ significantlyin their Spatial Thinking Skills and Means of
the scores on Spatial Thinking Skills amongthe Students of Standard Nine with regardto Locale differ significantly.
Table 6Comparison of the Means of the Scores on Spatial Thinking Skills with regard to Type ofManagementVariable Category Sum of Square df Mean Square F- value RemarksSpatial Between 14877.02 2 7438.51 SignificantThinking Groups at .05 levelSkills Within
Groups 141784.83 399 355.35 20.933Total 156661.85
Table 7Multiple Comparison of different pairs of Spatial Thinking Skills Type of Type of Mean Std.Management (I) Management (J) Difference Error p- valueAided Government 9.25926* 2.29444 .000
Unaided 14.75535* 2.30744 .000Government Aided 9.25926* 2.29444 .000
Unaided 5.49609* 2.30744 .000Unaided Aided 14.75535* 2.30744 .000
Government 5.49609* 2.30744 .000
* The Mean Difference is significant at the .05 level
The investigator presents pairwisecomparison of Spatial Thinking Skills amongthe Students of Standard Nine with regardto Type of Management in the Table 5
From the Table 5 the investigatorinterprets that• There is significant difference between
the Means of scores on Spatial Thinking
Skills of Students of Standard Nine ofGovernment and Unaided schools.
• There is significant difference betweenthe Means of scores on Spatial ThinkingSkills of Students of Standard Nine ofAided and Government schools.
• There is significant difference betweenthe Means of scores on Spatial ThinkingSkills of Students of Standard Nine ofAided and Unaided schools.
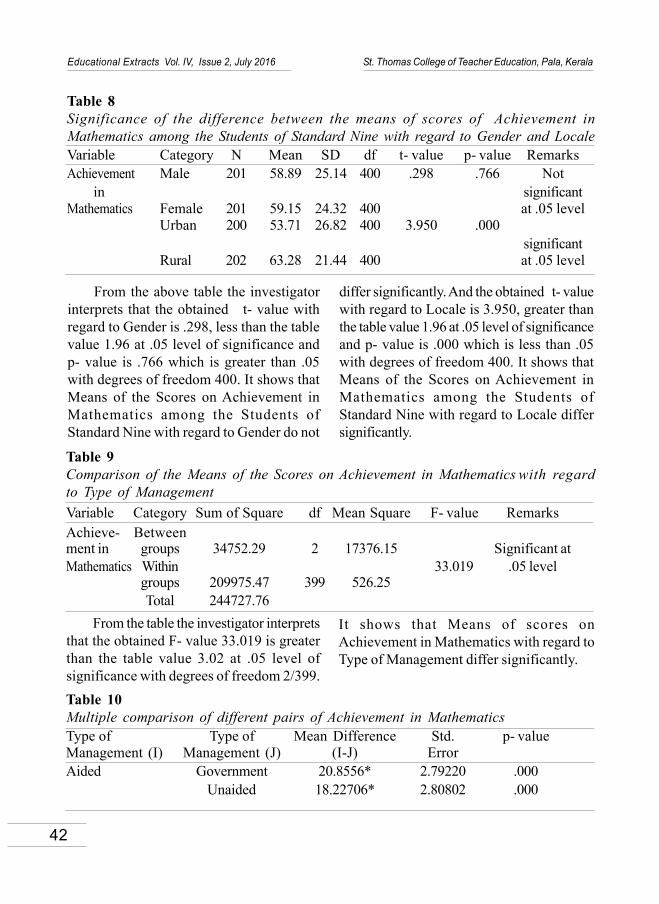
42
Educational Extracts Vol. IV, Issue 2, July 2016 St. Thomas College of Teacher Education, Pala, Kerala
differ significantly. And the obtained t- valuewith regard to Locale is 3.950, greater thanthe table value 1.96 at .05 level of significanceand p- value is .000 which is less than .05with degrees of freedom 400. It shows thatMeans of the Scores on Achievement inMathematics among the Students ofStandard Nine with regard to Locale differsignificantly.
Table 8Significance of the difference between the means of scores of Achievement inMathematics among the Students of Standard Nine with regard to Gender and LocaleVariable Category N Mean SD df t- value p- value RemarksAchievement Male 201 58.89 25.14 400 .298 .766 Not in significantMathematics Female 201 59.15 24.32 400 at .05 level
Urban 200 53.71 26.82 400 3.950 .000significant
Rural 202 63.28 21.44 400 at .05 level
From the above table the investigatorinterprets that the obtained t- value withregard to Gender is .298, less than the tablevalue 1.96 at .05 level of significance andp- value is .766 which is greater than .05with degrees of freedom 400. It shows thatMeans of the Scores on Achievement inMathematics among the Students ofStandard Nine with regard to Gender do not
Table 9Comparison of the Means of the Scores on Achievement in Mathematics with regardto Type of ManagementVariable Category Sum of Square df Mean Square F- value RemarksAchieve- Betweenment in groups 34752.29 2 17376.15 Significant atMathematics Within 33.019 .05 level
groups 209975.47 399 526.25Total 244727.76
From the table the investigator interpretsthat the obtained F- value 33.019 is greaterthan the table value 3.02 at .05 level ofsignificance with degrees of freedom 2/399.
It shows that Means of scores onAchievement in Mathematics with regard toType of Management differ significantly.
Table 10Multiple comparison of different pairs of Achievement in MathematicsType of Type of Mean Difference Std. p- valueManagement (I) Management (J) (I-J) ErrorAided Government 20.8556* 2.79220 .000
Unaided 18.22706* 2.80802 .000

43
Educational Extracts Vol. IV, Issue 2, July 2016 St. Thomas College of Teacher Education, Pala, Kerala
From the Table 8 the investigatorinterprets that• There is no significant difference
between the Means of scores onAchievement in Mathematics amongthe Students of Standard Nine ofGovernment and Unaided schools.
• There is a significant difference betweenthe Means of scores on Achievement
in Mathematics among the Students ofStandard Nine of Aided and Governmentschools.
• There is a significant difference betweenthe Means of scores on Achievementin Mathematics among the Students ofStandard Nine of Aided and Unaidedschools.
Government Aided 20.85556* 2.79220 .000Unaided 2.62849 2.80802 1.000
Unaided Aided 18.22706* 2.80802 .000Government 2.62849 2.80802 1.000
*The mean difference is significant at the .05 level.
Table 11Relationship between Spatial Thinking Skills and Achievement in MathematicsVariables Number Degrees Calculated Remarks
of freedom r- valueSpatial Thinking 402 400 .719 SignificantSkills at.05 levelAchievements inMathematics
From the Table the investigator interpretsthe calculated r-value .719 is greater than thetable r- value .098 at .05 level of significancewith degrees of freedom 400. Thus theinvestigator concludes that there is asignificant positive correlation between SpatialThinking Skills and Achievement inMathematics among the Students of StandardNine. This result indicates that improvementin the performance of Spatial Thinking Skillsof Students there should be a correspondingincrease in their Achievement in Mathematics.
Major Findings of the Study1. The distribution of scores of Spatial
Thinking Skills and Achievement inMathematics is not normally distributed.
2. Most of the students have AverageSpatial Thinking Skills andAchievement in Mathematics.
3. There is no significant difference inSpatial Thinking Skills andAchievement in Mathematics amongBoys and Girls.
4. There is significant difference in SpatialThinking Skills and Achievement inMathematics among Aided, Unaidedand Government school students ofstandard Nine.
5. There is a high relationship betweenSpatial Thinking Skills andAchievement in Mathematics amongthe students of Standard Nine.

44
Educational Extracts Vol. IV, Issue 2, July 2016 St. Thomas College of Teacher Education, Pala, Kerala
Discussion of the results
The study reveals that Spatial ThinkingSkills and Achievement in Mathematicsamong the students of standard Nine aremoderate. Only 21.64% and 20.39% of the402 students of standard Nine who formedhigh level of Spatial Thinking Skills andAchievement in Mathematics. Furtheranalysis reveals that male and femalestudents of standard Nine do not differsignificantly in their Spatial Thinking Skillsand Achievement in Mathematics. Thisindicates that Gender have no influence ontheir Spatial Thinking Skills andAchievement in Mathematics. The studyalso revealed that there is a significantdifference in the Means of Scores on SpatialThinking Skills and Achievement inMathematics among the Students ofStandard Nine with regard to Locale and Typeof Management. Also there is a positivecorrelation between Spatial Thinking Skillsand Achievement in Mathematics.
ReferencesFrancis. (2014). Multiple Intelligence and
Academic Achievement of Javahar NavodayaVidyalaya Students. Journal of the GroundBuilder: an attempt to recent qualityeducation, 3(1), 55-58.
Malini, P. M. (2014). Gender difference in relationof Mathematical Creativity w i t hAchievement in Mathematics. Journal ofEducational Extracts, 2(2), 119-123.
Mahmood, Alam, M. (2009). A study on AcademicAchievement in Mathematics in relation toCreativity and Achievement Motivation.Edutracks, 5(2), 11-15.
Minikutty, A., & Krishnan, Sunitha. (2014). SpatialThinking Skills in Mathematics. Journal ofEducational Research and Extension, 51(2),1-6.
Raj, Lidson, J. (2014). Spatial Ability andMathematics Achievement of SecondarySchool Students of Kerala with specialreference to Gender, Locality and Typeof Management. Journal of Research andPedagogic Interventions, 3(1), 112-118.
Rinsa, P.V., & Sumangala, V. (2012). InteractionEffect of Thinking styles and DeductiveReasoning on Problem Solving Ability inMathematics of Secondary SchoolStudents. Journal of Endeavours inEducation, 3(1), 44-48.

45
Educational Extracts Vol. IV, Issue 2, July 2016 St. Thomas College of Teacher Education, Pala, Kerala
EMOTIONAL INTELLIGENCE AND KNOWLEDGEMANAGEMENT OF TECHNICAL STUDENTS
Sini S. S*Dr. Sunila Thomas**
AbstractEmotional Intelligence is defined asthe subset of social intelligence that involvesthe ability to monitor one's own and others' feelings and emotions, to discriminateamong them and to use this information to guide one's thinking and actions. Itscomponents involveself-awareness, self-control, motivation, empathy and social skills.Emotional intelligence has proven a better predictor of future success than traditionalmethods like the GPA, IQ, and standardized test scores. Hence the great interest inemotional intelligence on the part of corporations and universities. KnowledgeManagement (KM) efforts typically focus on organizational objectives such asimproved performance, competitive advantage, innovation and the sharing of lessonslearned. KM efforts overlap with organizational learning and focus on encouragingthe sharing of knowledge. It is an enabler of organizational learning. Many studentsin the technical sector have a discomfort in the transition from school to professionalcourse. The problems are adapting a new learning environment with often increasedacademic expectations, the number of back papers, career anxiety etc. Due to thelack of emotional maturity, the technical students are unable to face the careerchallenges. In this backdrop, the present study aims to analyze the emotionalintelligence and to assess the relationship between knowledge management andemotional intelligence of technical students. Emotional intelligence was found to bepositively associated with knowledge management.Key Words: Emotional Intelligence, Knowledge Management, OrganizationalObjective, Improved Performance, Competitive Advantage, Innovation, etc.
* Assistant Professor, Rajadhani Institute of Engineering and Technology, Attingal,Trivandrum & Research Scholar in Education, Bharathiar University, Coimbatore.
** Associate Professor, Titus II Teacher Education College, Thiruvalla & Research Guide,Bharathiar University, Coimbatore
Educational Extracts ISSN 2320-7612
Vol. IV Issue 2 July 2016pp. 45-51
St. Thomas College of Teacher Education, Pala, Kerala, IndiaWebsite: www.stce-pala.info, www.stctepala.orgemail: [email protected]
INTRODUCTION
Emotional Intelligence (EI) is a type ofnon-intellective intelligence, sometimes
described as “social intelligence.” EI itselfwas first defined in the early 1990s bySalovey and Meyers as “a type of social
46
Educational Extracts Vol. IV, Issue 2, July 2016 St. Thomas College of Teacher Education, Pala, Kerala
intelligence that involves the ability to monitorone's own and others' emotions, todiscriminate among them, and to use thisinformation to guide one's thinking andactions.” Emotional Intelligenceencompasses the following fivecharacteristics and abilities:• Self-awareness -- knowing your emotions,
recognizing feelings as they occur, anddiscriminating between them
• Self-Regulation--handling feelings sothey're relevant to the current situationand you react appropriately
• Motivation--"gathering up" your feelingsand directing yourself towards a goal,despite self-doubt, inertia, andimpulsiveness
• Empathy--recognizing feelings in othersand tuning into their verbal and nonverbalcues.
• Social Skills--handling interpersonalinteraction, conflict resolution, andnegotiations
Knowledge management (KM) is theprocess of capturing, developing, sharing, andeffectively using organizational knowledge.It refers to a multi-disciplinary approach toachieving organizational objectives by makingthe best use of knowledge.
NEED FOR THE PRESENT STUDY
According to the new concept -brain-based learning-emotional health isfundamental to effective learning. The mostcritical element for a student's success is anunderstanding of how to learn and how canbe applied the learned knowledge to humanwelfare.i.e. Knowledge Management andEmotional Intelligence. The idea of EmotionalIntelligence has inspired research and
curriculum development throughout thesefacilities. Researchers have concluded thatpeople who manage their own feelings welland deal effectively with others are morelikely to live meaningful lives. In addition,happy people are more apt to retaininformation more effectively than dissatisfiedpeople. This statement reveals theconnection between Emotional Intelligenceand Knowledge management.
Students are able to reach theirmaximum potential in cognitive and personallevel provided their emotional functioning ishealthy. The Present study providesacademic and intellectual strength to thetechnical students by modifying their levelof emotional intelligence. It also helps to moldthe personality of students with highemotional competencies –i.e, with highemotional intelligence
Many students in the technical sectorhave a discomfort in the transition fromschool to professional course. The problemsare adapting a new learning environment withoften increased academic expectations, thenumber of back papers, career anxiety etc.Due to the lack of emotional maturity, thetechnical students are unable to face thecarrier challenges. In this backdrop, thepresent study aims to analyze the emotionalintelligence and to assess the relationshipbetween knowledge management andemotional intelligence of technical students.Emotional intelligence was found to bepositively associated with knowledgemanagement.
Considering all these elements, theinvestigators entitled the study and paper,“Emotional Intelligence and Knowledge
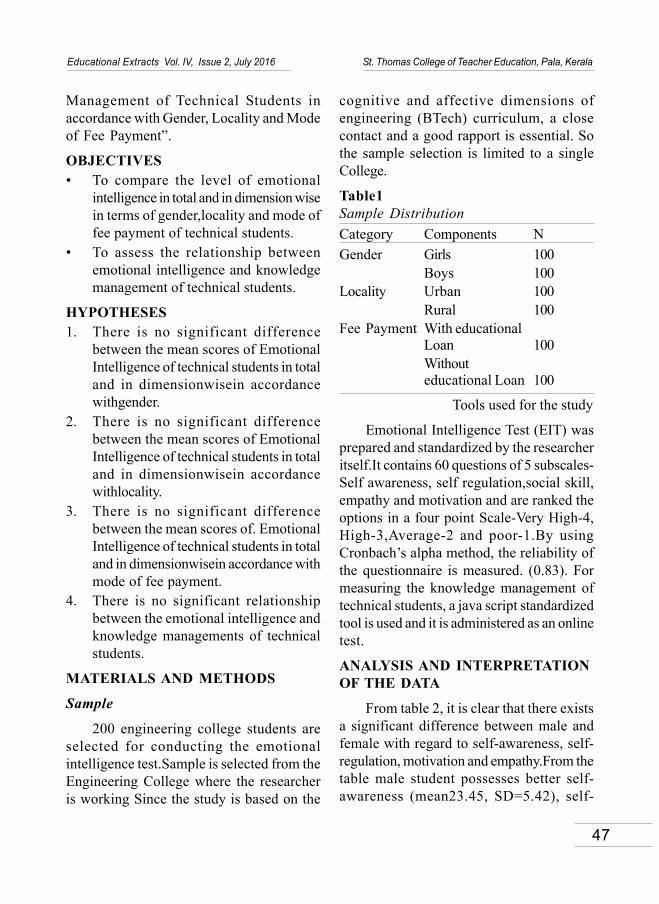
47
Educational Extracts Vol. IV, Issue 2, July 2016 St. Thomas College of Teacher Education, Pala, Kerala
Management of Technical Students inaccordance with Gender, Locality and Modeof Fee Payment”.
OBJECTIVES• To compare the level of emotional
intelligence in total and in dimension wisein terms of gender,locality and mode offee payment of technical students.
• To assess the relationship betweenemotional intelligence and knowledgemanagement of technical students.
HYPOTHESES1. There is no significant difference
between the mean scores of EmotionalIntelligence of technical students in totaland in dimensionwisein accordancewithgender.
2. There is no significant differencebetween the mean scores of EmotionalIntelligence of technical students in totaland in dimensionwisein accordancewithlocality.
3. There is no significant differencebetween the mean scores of. EmotionalIntelligence of technical students in totaland in dimensionwisein accordance withmode of fee payment.
4. There is no significant relationshipbetween the emotional intelligence andknowledge managements of technicalstudents.
MATERIALS AND METHODS
Sample
200 engineering college students areselected for conducting the emotionalintelligence test.Sample is selected from theEngineering College where the researcheris working Since the study is based on the
cognitive and affective dimensions ofengineering (BTech) curriculum, a closecontact and a good rapport is essential. Sothe sample selection is limited to a singleCollege.
Table1Sample DistributionCategory Components NGender Girls 100
Boys 100Locality Urban 100
Rural 100Fee Payment With educational
Loan 100Withouteducational Loan 100
Tools used for the study
Emotional Intelligence Test (EIT) wasprepared and standardized by the researcheritself.It contains 60 questions of 5 subscales-Self awareness, self regulation,social skill,empathy and motivation and are ranked theoptions in a four point Scale-Very High-4,High-3,Average-2 and poor-1.By usingCronbach’s alpha method, the reliability ofthe questionnaire is measured. (0.83). Formeasuring the knowledge management oftechnical students, a java script standardizedtool is used and it is administered as an onlinetest.
ANALYSIS AND INTERPRETATIONOF THE DATA
From table 2, it is clear that there existsa significant difference between male andfemale with regard to self-awareness, self-regulation, motivation and empathy.From thetable male student possesses better self-awareness (mean23.45, SD=5.42), self-
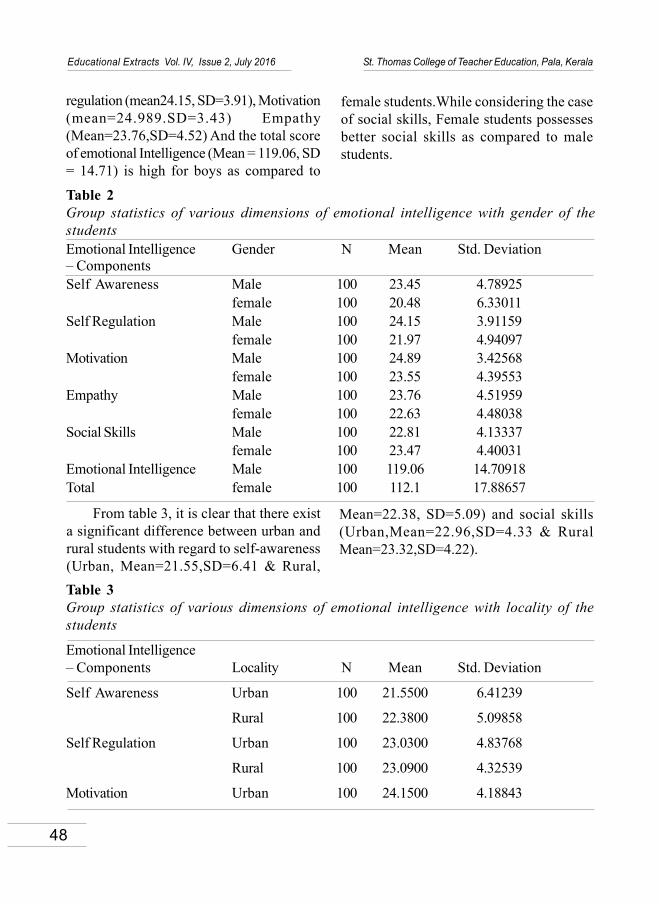
48
Educational Extracts Vol. IV, Issue 2, July 2016 St. Thomas College of Teacher Education, Pala, Kerala
regulation (mean24.15, SD=3.91), Motivation(mean=24.989.SD=3.43) Empathy(Mean=23.76,SD=4.52) And the total scoreof emotional Intelligence (Mean = 119.06, SD= 14.71) is high for boys as compared to
Table 3Group statistics of various dimensions of emotional intelligence with locality of thestudents
Emotional Intelligence– Components Locality N Mean Std. Deviation
Self Awareness Urban 100 21.5500 6.41239
Rural 100 22.3800 5.09858
Self Regulation Urban 100 23.0300 4.83768
Rural 100 23.0900 4.32539
Motivation Urban 100 24.1500 4.18843
female students.While considering the caseof social skills, Female students possessesbetter social skills as compared to malestudents.
Table 2Group statistics of various dimensions of emotional intelligence with gender of thestudentsEmotional Intelligence Gender N Mean Std. Deviation– ComponentsSelf Awareness Male 100 23.45 4.78925
female 100 20.48 6.33011Self Regulation Male 100 24.15 3.91159
female 100 21.97 4.94097Motivation Male 100 24.89 3.42568
female 100 23.55 4.39553Empathy Male 100 23.76 4.51959
female 100 22.63 4.48038Social Skills Male 100 22.81 4.13337
female 100 23.47 4.40031Emotional Intelligence Male 100 119.06 14.70918Total female 100 112.1 17.88657
From table 3, it is clear that there exista significant difference between urban andrural students with regard to self-awareness(Urban, Mean=21.55,SD=6.41 & Rural,
Mean=22.38, SD=5.09) and social skills(Urban,Mean=22.96,SD=4.33 & RuralMean=23.32,SD=4.22).

49
Educational Extracts Vol. IV, Issue 2, July 2016 St. Thomas College of Teacher Education, Pala, Kerala
While considering the self-regulation,motivation and empathy, there is nosignificant difference between the meanscores of urban and rural students. Ruralstudents possess a little hike(Mean=116.12,SD=15.44) in the totalemotional intelligence score when comparedto urban students (Mean=115.04,SD=17.92).
From table 4, it is clear that there asignificant difference between the meanscores of Emotional Intelligence of technical
students in total and in dimension wise inaccordance with mode of feepayment.Table3 depicts that students with educationalloan possess better self-awareness(mean=22.24,SD=5.25),self-regulation(mean=23.19,SD=4.04), Motivation (mean =24.54, SD=3.53), Empathy (Mean=23.72,SD=4.36) and the total score of emotionalIntelligence (Mean=117.96,SD=13.69) ascompared to students without educationalloan.
Rural 100 24.2900 3.79605
Empathy Urban 100 23.3500 4.75113
Rural 100 23.0400 4.30391
Social Skills Urban 100 22.9600 4.33431
Rural 100 23.3200 4.22087
Emotional Intelligence Urban 100 115.0400 17.92967
Total Rural 100 116.1200 15.44968
Table 4Group statistics of various dimensions of emotional intelligence with the mode of feepayment
Emotional Intelligence Fee Payment N Mean Std. DeviationSelf Awareness With educational loan 100 22.2400 5.25149
Without educational loan 100 21.6900 6.30327Self Regulation With educational loan 100 23.1900 4.04693
Without educational loan 100 22.9300 5.06973Motivation With educational loan 100 24.5400 3.53173
Without educational loan 100 23.9000 4.39122Empathy With educational loan 100 23.7200 4.36950
Without educational loan 100 22.6700 4.63638Social Skills With educational loan 100 24.2700 3.72774
Without educational loan 100 22.0100 4.49353Emotional Intelligence With educational loan 100 117.9600 13.69208Total Without educational loan 100 113.2000 19.02205

50
Educational Extracts Vol. IV, Issue 2, July 2016 St. Thomas College of Teacher Education, Pala, Kerala
Table 5Descriptive Statistics of Variables
Mean Std. Deviation NTotal EI 229.17 13.1520 200KM 47.962 4.46136 200
Table 6Correlations among Variables
Total EI KM Pearson Total EI 1.000 .166Correlation
KM .166 1.000Sig. (1-tailed) Total EI . .018
KM .018 .N Total EI 200 200
KM 200 200
Table 7ANOVA (Total Emotional Intelligence and Knowledge Management)
Model Sum of Squares Df Mean Square F Sig.1 Regression 447.302 1 447.302 1.608 .206
Residual 55067.418 199 278.118Total 55514.720 200
a Predictors: (Constant), KM
b Dependent Variable: Total EI
In order to assess the relationshipbetween emotional intelligence andknowledge management a simple linearregression, is performed. Descriptivestatistics and correlations are displayed inTable (5) and Table (6) respectively. Fromthe Table (7), for two tailed significance0.05(sig >0.05), Significance value (.206) isgreater than 0.05. Hence null hypothesis isnot accepted. The results show that there isa significant difference between the totalemotional intelligence scores and knowledgemanagement among technical students
CONCLUSION
Emotional intelligence of technicalstudents with five subcomponents are
analyzed in accordance with gender, localityand mode of fee payment.From table2, thereis a significant difference between male andfemale students with regard to self-awareness, self-regulation, motivation andempathy.And the total score of emotionalIntelligence is high for male as compared tofemale students. Rural students possess highemotional intelligence as a total and indimension wise as compared to urbanstudents. Students with educational loanpossess high emotional intelligence in totaland in dimension wise than those withouteducational loans.ANOVA score depicts thatthere is a significant relation betweenemotional intelligence and knowledgemanagement among technical students.
51
Educational Extracts Vol. IV, Issue 2, July 2016 St. Thomas College of Teacher Education, Pala, Kerala
REFERENCESAbiSamra, N. (2000), The Relationship between
Emotional Intelligence and AcademicAchievement in Eleventh Graders, Researchin Education, FED, pp 620-661.
Goleman, D. (2003) Apples and Applesauce,Issues and Recent Developments inEmotional Intelligence, 1(3), pp 425-448
Jaeger (2003), A conceptual framework foremotional intelligence in education: Factorsaffecting student achievement, (Vol. XIV, No.2, pp 41-44), Unpublished doctoraldissertation, Texas A&M University-Kingsville.
Lam (2001). Emotional intelligence: Emotionalintelligence: The role of transformativelearning in academic excellence. (Vol. XIII,No. 2, pp. 7-10), TEXAS STUDY ofSecondary Education.
Parker. J. D. A., Creque. Snr. R. E., Barnhart. D. L.,Harris. J. I., Majeski. S. A., Wood. L. M., etal., (2004), Academic Achievement in highSchool: Does Emotional Intelligence Matter?,Personality and Individual Differences, 37(7),pp 1321- 1330 Personality, 9, 195-211.
Petrides. K. V., Frederickson and Furnham. A,and. (2005), On the dimensional structure ofemotional intelligence, Personality andIndividual Differences, 42, pp 313-320.
Salovey, P. & Mayer, J .D. (1990).EmotionalIntelligence, imagination, cognition, andpersonality, Baywood Publishing Co., pp 185-211.
Six Seconds, Emotional Intelligence Network,http://www.6seconds.org/2013/04/24/fog-how-to-use-emotio nal-intelligence-free-poster/.
Zee, K., Thijs, M. and Schakel, L. (2002), Therelationship of emotional intelligence withacademic intelligence and the Big Five. Eur. J.Pers., 16: 103–125.

52
Educational Extracts Vol. IV, Issue 2, July 2016 St. Thomas College of Teacher Education, Pala, Kerala
ART AND SCIENCE OF REVIEW OF LITERATURE
Dr. K.M. Rajan*
AbstractReview of literature is an integral part of any research. The most common contexts inwhich review of literature is demanded are - - (1) A course assignment, (2) A shortreview for a research article, (3) A review for research proposal, (4) A stand alonereview article and (5) A chapter-length review for thesis/dissertation. A criticalanalysis of the existing research provides researchers an opportunity to minimizeerrors and think about practical difficulties of data collection and analysis. Thisleads to strengthening of the scientific approach of eliminating possible short-comings in research. The review of literature involves two processes - - (1) Selectionof the literature and (2) Scrutinizing the studies with respect to five dimensions - -Accuracy, Authority, Objectivity, Currency and Coverage. Moreover, there are sevenimportant steps in the task of review of literature such as - - (1) How to search forstudies? (2) How to select studies? (3) How to analyze studies? (4) Which scheme isappropriate for analysis? (5) How to compose/organize review of literature? (6)Scheme of presentation of review and (7) Conclusion. A review of the literature withproper identification, selection and evaluation will be the beacon light for theresearcher as well as for those who read the review.
* Principal & Associate Professor (Rtd.), Kannanayakal House, Arthat, Kunnamkulam,Kerala - 680521.
Educational Extracts ISSN 2320-7612
Vol. IV Issue 2 July 2016pp. 52-57
St. Thomas College of Teacher Education, Pala, Kerala, IndiaWebsite: www.stce-pala.info, www.stctepala.orgemail: [email protected]
Introduction
Review of literature is an integral partof any research. Every research can beconsidered as a link in the evolution ofknowledge. Evolution of knowledgeencompasses the accepted knowledge andproceeds through the evolving knowledge.What is known in the discipline needs to begauged before undertaking any research.The review of literature is a survey of themost relevant and significant academic
research on a particular topic in order toreflect the current state of knowledge inthe field. However, the scope and purposeof review of literature vary with the context.The most common contexts in which reviewof literature is demanded are - - (1) Acourse assignment, (2) A short review fora research article, (3) A review for researchproposal, (4) A stand alone review articleand (5) A chapter-length review for thesis/dissertation.

53
Educational Extracts Vol. IV, Issue 2, July 2016 St. Thomas College of Teacher Education, Pala, Kerala
Review of literature is an importantexercise in the process of identifying andformulating a research problem. Selecting atopic and carrying out research is a subjectiveenterprise, nevertheless it is a systematicprocess of enquiry. A critical analysis of theexisting research provides researchers anopportunity to minimize errors and think aboutpractical difficulties of data collection andanalysis. This leads to strengthening of thescientific approach of eliminating possibleshort comings in research.
The purpose of review of literature is toconvey your reader what knowledge andideas have been established on a topic, andwhat their strengths and weaknesses are. Asa piece of writing, the literature review mustbe defined by a guiding concept such as theresearch objective. It is not just a descriptivelist of the material available, or a set ofsummaries. The researcher is not trying tolist all the material published, but to synthesizeand evaluate it according to the guidingconcept of the thesis or research question.The review of literature involves twoprocesses - - (1) Selection of the literatureand (2) Scrutinizing the studies with respectto five dimensions. The five dimensions are- - Accuracy, Authority, Objectivity, Currencyand Coverage. Accuracy refers to thereliability of information available. Authorityentails academic credential of the author andthe institution to which s/he is affiliated.Objectivity implies the unbiased nature of theinformation. Currency deals with the timeframe of the information made available.Coverage delineates the breadth and depthof the information as will be required in thecontext.
The above processes will help synthesizeresults into a summary of what is known andwhat is not known. Also, the exercise willhelp identify areas of controversy in theliterature. At this point it will be appropriateto focus on the purpose of the literaturereview detailed above. The length of thereview or adequacy of the review ofliterature will be judged based on the purposefor which the review of literature is done. Itis likely that there may be contradictingliterature on a particular topic/area. Theresearcher will have to deal this carefully toalert the reader that such instances are alsofound in the literature. Often suchcontradictions result from authors orientationor the theoretical framework relied on.Researcher will have to include and deal withliterature with which s/he may not agree with.
There are seven important steps in thetask of review of literature. They are - - (1)How to search for studies? (2) How to selectstudies? (3) How to analyze studies? (4)Which scheme is appropriate for analysis?(5) How to compose/organize review ofliterature? (6) Scheme of presentation ofreview and (7) Conclusion. Each of thesesteps is detailed below.
(1) How to search for literature?
The first phase of review of literature isto identify and effectively locate neededliterature. To enable this researcher mustdevelop skills in digging information.Resources are available as hard copies andin digital format. Some of the resources areavailable in both soft and hard copy format.These documents include - - Standard Books,Academic Journals, Encyclopedia, Survey ofResearch, Dissertations Abstract

54
Educational Extracts Vol. IV, Issue 2, July 2016 St. Thomas College of Teacher Education, Pala, Kerala
International (DAI), Educational ResourcesIndex Catalogue (ERIC), Thesis/Dissertation,Proceedings of conferences/seminars,Reports of Governments, Reports of NGOs,News Letters, etc.
Digital resources are many and billionsof textual documents are indexed by eachagency. The outcome of website searchdepends on the search Engine used in tappingthe information. Some of the popular searchengines are - - Clusty.com, Ask.com,Altavista.com, Google.com, Askusnow.com,Meebo.com, AllTheWeb.com, Inktomi.com,Teoma.com, etc. These search engines willfetch different sets of information.
There are different websites to searchfor the relevant literature such aswww.Cambride.com/asia/collectionsarchive.org; inflibnet; doaj.org ; Scopus; Pro-Quest (OAJ); British Library – archive.org/web.web.php; Jstor; Ebsco; Sage.pub;Journals.cambridge.com; Wiley OnlineLibrary; IOSR (International Organization ofScientific Research) - JHSS (Journal ofHumanities and Social Sciences), Delnet,educational research complete (erc),PsycINFO, EconLit, ERIC (EducationalResources Information Center), FRANCIS,Teacher Reference Center, Web of Science,Assia, EMBASE, Cochraine data bases,Sinahl, Psychological Abstracts, DAI(Dissertation Abstracts International), etc.However, peer-reviewed journals should bepreferred as they will carry original researchstudies which are known as primary sources.Although the review contains mostly originalresearch studies, other resources such asbooks and encyclopedia are also helpful inlocating original research or in providingbackground information on the topic.
In any search for literature, it is desirableto use multiple search engines as well asmultiple databases. The reason is that thesearch engines and databases often providedifferent set of articles/information. Duringyour search for literature, especially whensearching for articles in databases,researchers rely very much on keywordsearching. To conduct a keyword search,researchers need to formulate a searchstatement. Then, identify the keywords orthe main concepts of the research topic.Think of similar terms (synonyms) or phrasesthat might also be used to describe theseconcepts, to ensure that you do not miss outany relevant information. You can use athesaurus to help find synonyms. Forexample, you can first arrange the mainconcepts in columns. Then under eachcolumn write down similar terms or phrasesthat may also be used to represent thatconcept. Subsequently, you can combineyour search terms in a way that a databasecan understand. To do this, you need to usethe words such as AND, OR, NOT, etc(Boolean operators).
In the process of searching literatureusing multiple search engines and databases,it is highly desirable to keep a record of whatyou have done to perform the search, suchas the search engines/databases you haveused, the keywords you have combined andsearched, and the search results retrievedusing various search statements. From whatyou have done, you will then know what youshould do next. At times certain websites(as a trial period) permit you to downloadarticles free of cost which may be for a monthor so. Therefore, keeping track of what youhave done is very important for an effectivereview of literature.
55
Educational Extracts Vol. IV, Issue 2, July 2016 St. Thomas College of Teacher Education, Pala, Kerala
Periodicals are another type of resourceswhich include Trade magazines such as Oiland Gas Investor, Popular magazine such asNewsweek and Newspapers such as theWall Street Journal. These are of immensevalue to locate the date of an event whichhappened in the near past. When you useresources in your literature review, whetherthe resources are books, journal articles,theses or websites, it is important that youalways cite the resources that you use. Byciting sources properly, you give credit tothose who created the original informationresources. By citing the sources and creatingproper references you are maintainingacademic integrity and academic honesty.Also you allow readers to consult the originalresources and prevent plagiarism. Moreover,the work in the field by one researcher isconnected with the wrok of others in thediscipline. Now, it is customary thatresearchers write out names of thedatabases that they have searched and theperiod for which the search was conducted.This will help the researcher to defend theoutcome of the review of literature.
(2) How to select studies?
The next phase of review of literatureis to evaluate each study with a focus on theresearch topic/area/variable(s). This willrequire multi-level scanning with respect tothe nature of the journal in which it waspublished (e.g., Impact Factor), the date ofpublication, the author of the article, thecomprehensiveness of the references given,etc. This evaluation may bring surprises suchas conflicting evidences especially in socialsciences. The reason may be - - missing orover represented sample, the period for whichthe literature is reviewed, the different
techniques used to locate studies, etc.Therefore, all resources should be exploredand as a general convention the review shouldbe conducted for a period of past twentyyears.
It is important that the review should notrely too heavily on secondary sources. Thereview should present materials that arepertinent to the area of research. Theliterature reviewed should be long enough todemonstrate to the reader that the researcherhas a sound understanding of the relationshipbetween what has been done and what willbe done.
The problem of selecting studies forreview is far more important than collectingstudies in a particular area of interest. Firstof all, details of the source of the article/material are to be documentedcomprehensively. All elements necessary toprovide reference as per the APA Manualwill have to be collected before including thestudy for review. Studies included in reputedjournals should be given preference inreviewing the literature. If theoreticalframework is an important aspect of thereview, then standard books of reputedauthors must be consulted.
Information overflow is the problem ofthese decades and articles of dubious qualitymust be eliminated. Some of the opendomain sites allow anybody to edit/add to theinformation which will result in poor qualityof material. After reading ten to fifteenarticles in the topic of interest, researcherwill be able to gauge two important things - -(1) which are the journals in which most ofthe studies in the area of interest are reportedand (2) who are the giants of reputation inthe field of interest. Since most of the

56
Educational Extracts Vol. IV, Issue 2, July 2016 St. Thomas College of Teacher Education, Pala, Kerala
journals provide e-mail address of authors, itis quite easy to contact these persons. Thereis no short cut to this exercise of reading andgetting acquainted with persons and theirwork whereby the current status of researchcan be assessed.
(3) How to analyze studies?
A general approach (Jackson, 1980) toanalysis has four dimensions - - (a) What isknown? (b) How well is it known? (c) Howlittle is known? And (d) What is not known?Indiscriminate acceptance and use of anyother research is undesirable. The purposeof analysis of studies is to infer generalizationabout an issue from a set of studies. Further,it is important to identify what earlierresearch has left unattended/unresolved(Cooper, 1982; 1989). Moreover, analysisof studies helps interpret other studies andappraise new methodological developmentsin the area of interest.
(4) Which scheme is appropriate foranalysis?
Jackson (1980) has referred to fourcategories of review. They are - - listing,excluding, averaging and vote taking. Inlisting, researcher simply goes on listing thestudies which is a simple count or narrationof studies. This is done either chronologicallyor as studies conducted in India and studiesconducted abroad. This listing or narrationis a futile exercise for it will not generate abetter understanding of the field in which thestudy can be situated. Moreover, this willnot require the ingenuity of a researcher.
Researchers often exclude certainstudies from their review for unknownreason. There can be several issues in
review of literature such as different namesof the same construct are used (e.g., ScienceAchievement), different constructs aresometimes studied under a single name (e.g.,Intelligence), any given construct can havedifferent measures and measures have notbeen validated (Glass, 1977). However, asound analysis of literature must providereasons for exclusion.
Researchers often take average of thesignificant and non-significant studies to inferthe trend in the existing literature.Congruence of findings does not assure theirvalidity, and the lack of congruence is not aproof of invalidity. Therefore, congruenceshould be considered as suggestive and notconclusive. To get a trend from the literature,it is not desirable to count the number ofstudies in favor or against by vote taking, forthe studies do differ in many dimensions.
(5) How to compose/organize reviewof literature?
There are healthy practices withrespect to organizing the review of literature(e.g., Light & Pillemer, 1984). The reviewof literature should be organized around thequestion of research. The variables ofinterest should guide the organization ofreview. Questions such as to whichpopulation can the main findings begeneralized? How different are thesamples? How different are the methods?How long was the treatment? (if the study isexperimental in nature). Answers to thesequestions will require the skill ofinterpretation (hermeneutics) on the part ofthe researcher. A review of literature withoutany structure to organization will be only arecounting of studies.

57
Educational Extracts Vol. IV, Issue 2, July 2016 St. Thomas College of Teacher Education, Pala, Kerala
On certain occasions, review ofliterature will generate conflicting evidence.The reason can be attributed to differenttechniques to locate studies, population of thestudy not accounted, missing and overrepresented samples, period for which theliterature is reviewed and so on. However,conflicting findings should never be ignored.Researcher will have to examine variationsfor insight (Light & Pillemer, 1984). It isimportant to ascertain where and with whomparticular findings are likely to hold good?
(6) Scheme of presentation of review
Scheme of presentation of review ofliterature is important because theacquaintance of researcher with the field ofinvestigation is summarized in the review.Depending on the nature of the study, theconstruct studied may have to be clarified ina tabular format. Some studies will requireeffect size calculations, if sample size is amatter of concern in summarizing the study.If the problem suggests a review withrespect to variables and their relationships,then the scheme can be in the context of thevariables involved in the study.
(7) Conclusion
Any review literature must concludewith a summary of the current understandingas evidenced from the literature.
Significance of the research question mustbe substantiated by the exercise of reviewof literature. Important aspects of thequestion under research will have to be putin perspective in the background of theavailable literature. A review of the literaturewith proper identification, selection andevaluation will be the beacon light for theresearcher as well as for those who readthe review.
ReferencesAmerican Psychological Association (2009).
Publication manual of the AmericanPsychological Association (6th ed.).American Psychological Association.
Cooper, H. M. (1982). Scientific guidelines forconducting integrative research reviews.Review of Educational Research, 52, 291-302.
Cooper, H. M. (1989). The integrative researchreview: A Systematic approach (2nd ed.).California: Sage.
Glass, G. V. (1977). Integrating findings: The meta-analysis of research. Review of Research inEducation, 5, 351-379.
Jackson, G. B. (1980). Methods of integrativereviews. Review Educational Research, 50,438-460.
Light, R. J., & Pillemer, D. B. (1984). Summing up:The science of reviewing research.Cambridge, MA: Harvard University Press.
58
Educational Extracts Vol. IV, Issue 2, July 2016 St. Thomas College of Teacher Education, Pala, Kerala
EFFECT OF ATTITUDE VARIABLES ONMATHEMATICAL CREATIVITY OF
SECONDARY STUDENTS IN KERALA
Dr Sholy Joseph, K*
Abstract Mathematically creative children should be encouraged and motivated properly. Ifgiven a chance they will do something extraordinary and remarkable. We must try todevelop mathematical creativity in all children so that they may excel in their fieldsof interest and can lead the nations in progress. Mathematics educators hold theview that mathematical creativity is something that all students can develop ifstimulated and assisted in the right kinds of learning environments. Attitude towardsmathematics is another factor which influences learning. This study dealt withsecondary school students of Kerala. Two districts namely Kannur and Thrissurwere selected for the study. The study revealed significant differences in attitudetowards mathematics in the fluency, flexibility and originality scores of mathematicalcreativity. This contributed to wide differences in mathematical creativity amongthe secondary students in Kerala.Key-words: mathematical creativity, fluency, flexibility and originality, attitudetowards mathematics, etc.
* Asst Professor PKM College of Education, Madampam, Kannur
Educational Extracts ISSN 2320-7612
Vol. IV Issue 2 July 2016pp. 58-65
St. Thomas College of Teacher Education, Pala, Kerala, IndiaWebsite: www.stce-pala.info, www.stctepala.orgemail: [email protected]
Introduction
Mathematics is a very useful subject formost vocations and higher specializedcourses of learning. In this fast advancingtechnological and computerized world,ignorance of mathematics will be a greathandicap in the progress of any nation. It isalso believed that mathematics is anexceptionally difficult subject both to teachand to learn (Cockcroft, 1982) and its studyrequires special ability and intelligence.
Affective, cognitive and motivational factorsare extrinsically linked in the learning,achievement and creativity in mathematics.Ma (1997) recommended that mathematics,especially difficult mathematics content,should be taught in an interesting andattractive manner so that students can enjoyit without feeling that learning mathematicsis difficult.
All pupils can become creative if placedin a conducive environment (Sternberg,
59
Educational Extracts Vol. IV, Issue 2, July 2016 St. Thomas College of Teacher Education, Pala, Kerala
2006). Current emphasis on convergentthinking and rapid response has failed to keepinterest in mathematics. Limiting the use ofcreativity in the classroom reducesmathematics to a set of skills to master andrules to memorize. Consequently, naturalcuriosity and enthusiasm of many childrenfor mathematics disappear as they get older,creating a tremendous problem formathematics educators who are trying toinstill these very qualities (Meissner, 2008).Keeping students interested and engaged inmathematics by recognizing and valuing theirmathematical creativity may increase interestin mathematics.
The creative children use their common-sense knowledge very intensively. They veryoften react unconsciously, spontaneouslydevelop new ideas, and often we can detecta ‘cognitive jump’ (Meissner, 2008).Mathematical creativity is the ability to inventnew or important ideas, discover newrelationships, imagination (visual / spatialabilities), flexibility, modify given techniquesand to connect the fields of experiences.Mathematically creative children exhibitsocial aspects like communication,cooperation, team work, the ability toconvince or argue, motivation and self-confidence (Meissner, 2008). Teacherswishing to improve student motivationtowards mathematics should include lessonsthat allow for more student involvement andtask orientation (Opolot-Okurut, 2010).
Research findings suggest that creativityoften emerges from divergent thinking(Guilford, 1967). This thinking that movesoutward from conventional knowledge orwisdom into unexplored paths andunconventional solutions. It is from this
thinking that creative breakthroughs seem toemerge. In contrast, convergent thinkingapplies existing knowledge and rules of logicto the task of narrowing the range of potentialsolutions on a single correct answer. Suchthinking is productive in many situations butit does not appear to foster true creativity.For Sternberg (2006), creativity is a factorof synthetic ability (divergent thinking)analytical ability (convergent critical thinking)and practical ability. Many researchersdescribe creativity as a product of fluencyflexibility, originality and sometimes aselaboration (Torrance, 1974; Haylock, 1997& Kim, Cho & Ahn, 2003). According toTorrance, (1974) fluency is the number ofrelevant, rational responses to specificsituations. Flexibility refers to the number ofrelevant categories in which the responsesto a situation falls. Originality is the statisticaluniqueness of the response. Since attitudeof students towards mathematics plays animportant role in the way studentscomprehend the subject and perform in it,can also play an important role in students’mathematical creativity.
The poor performance of mathematicsin schools results from a number of factorssuch as students’ poor attitudes, poorteaching methods, the learning environment,syllabus and curriculum, shortage of teachingresources, home and socio-economicbackground, inability to read and write,absenteeism, dropouts, overcrowdedclassrooms and assessment (Opolot-Okurut,2008). Motivation and confidence inmathematics, anxiety in mathematics, socio-economic background, gender etc are somefactors that need to be addressed to enhancethe mathematical creativity of pupils in the

60
Educational Extracts Vol. IV, Issue 2, July 2016 St. Thomas College of Teacher Education, Pala, Kerala
country. Furthermore, little attention is paidto the needs of students with poor attitudetowards mathematics. The teaching andlearning of mathematics and fosteringmathematical creativity is therefore in urgentneed for improvement in our country.
Purpose of the Study
The purpose of the study was toinvestigate mathematical creativity by studentattitude towards mathematics in thesecondary schools in Kerala. The studyinvestigated differences in mathematicalcreativity by attitude towards mathematicsin case of fluency, flexibility and originalityscales.
Objectives
This study was guided by the followingobjectives :1. To investigate the fluency component of
mathematical creativity by attitudetowards mathematics.
2. To investigate the flexibility componentof mathematical creativity by attitudetowards mathematics.
3. To investigate originality component ofmathematical creativity between thehigh attitude towards mathematicsstudents and the low attitude towardsmathematics students.
Hypotheses
This study tested the following nullhypotheses:1. There are no differences in the fluency
component of mathematical creativityby attitude towards mathematics.
2. There are no differences in the flexibilitycomponent of mathematical creativityby attitude towards mathematics.
3. There is no difference in the originalitycomponent of mathematical creativitybetween the high attitude towardsmathematics students and the lowattitude towards mathematics students.
Methodology
This study was focused on thesecondary school students of Kerala. Thisstudy was carried out in Kannur and Thrissurdistricts in Kerala. These districts being inthe middle and northern part of the state willgive good representation to Kerala.
The sample of this study was 479 ninthstandard secondary students of Kerala. Twodistricts namely Kannur and Thrissur werepurposively selected. As the populationconsists of different categories like boys, girls,urban and rural schools, the investigator gaverepresentations to these factors. Theinvestigator gave equal representation to boysand girls in the sample. There are schoolsrun by both government and private agencies.Hence both government and private schoolswere selected for the present study. Sincethe population was divided into strata asdescribed above, stratified random samplingtechnique was used for the selection ofsample.
In each school all students from twoninth standard classes (the whole class) wereselected to participate in the study. In everyclass there are high, average and lowmathematically creative students. The wholeclass was selected to include all categoriesof children. Test of mathematical creativityand student attitude towards mathematicsinventory was administered to measuremathematical creativity and attitude towardsmathematics of these students. Fennema &

61
Educational Extracts Vol. IV, Issue 2, July 2016 St. Thomas College of Teacher Education, Pala, Kerala
Sherman, (1976) studied attitude towardsmathematics and the scale they constructedhas nine factors. Out of the nine factors, thisstudy has selected three factors namelymotivation in mathematics, confidence inmathematics and anxiety in mathematics.
Data Analysis
The scores on the Students Attitudetowards Mathematics Inventory (SATMI)were used to categorize students into highattitude towards mathematics and lowattitude towards mathematics students. Theminimum and maximum possible scores onthe instrument were 36 and 180 respectively.The overall average in the sample was foundto be 98. Those students who scored above98 points were considered as high attitudetowards mathematics students.Consequently those students who scoredbelow 98 points were considered as lowattitude towards mathematics students.
The questions about differences inmathematical creativity and its componentswith attitude towards mathematics wereaddressed using quantitative analysis.Statistical analysis involved in using thestatistical package SPSS for the followingstatistical techniques: student two-tailed t-test for independent samples was used to findif there were group differences in Fluency,Flexibility, Originality and mathematicalcreativity with student attitude towardsmathematics. Descriptive statistics likemeans and standard deviations for Fluency,Flexibility, Originality mathematical creativityand student attitude towards mathematicswere computed for the complete scores andfor each stratum using SPSS.
Findings and Discussion
In order to test hypotheses set for thisstudy, the mean scores on mathematicalcreativity for high attitude towardsmathematics students were compared to themean scores of low attitude towardsmathematics students. Table 1 represents themean scores (M) and standard deviations(SD) for mathematical creativity variablesof high attitude towards mathematicsstudents with low attitude towardsmathematics students in the present study.
The mean scores on mathematicalcreativity for high attitude towardsmathematics students were compared to themean scores of students with low attitudetowards mathematics in case of threecomponents of mathematical creativity. Inorder to accomplish this comparison, anindependent two-tailed t-test of equality ofmeans was done for each mathematicalcreativity variable with a type I error rate of.05 for each variable. The results are givenin Table 1.
The results show that high attitudetowards mathematics students had a highermean score (M = 36.17, SD = 9.16) in fluencythan the low attitude towards mathematicsstudents (M = 27.43, SD = 14.51). Thestandard deviations indicate that the variancesof scores in high attitude towardsmathematics students are different from lowattitude towards mathematics students. Theflexibility results show that high attitudetowards mathematics students had a highermean score (M = 3.61, SD = 1.23) in fluencythan the low attitude towards mathematicsstudents (M = 1.34, SD = 1.73). The standard
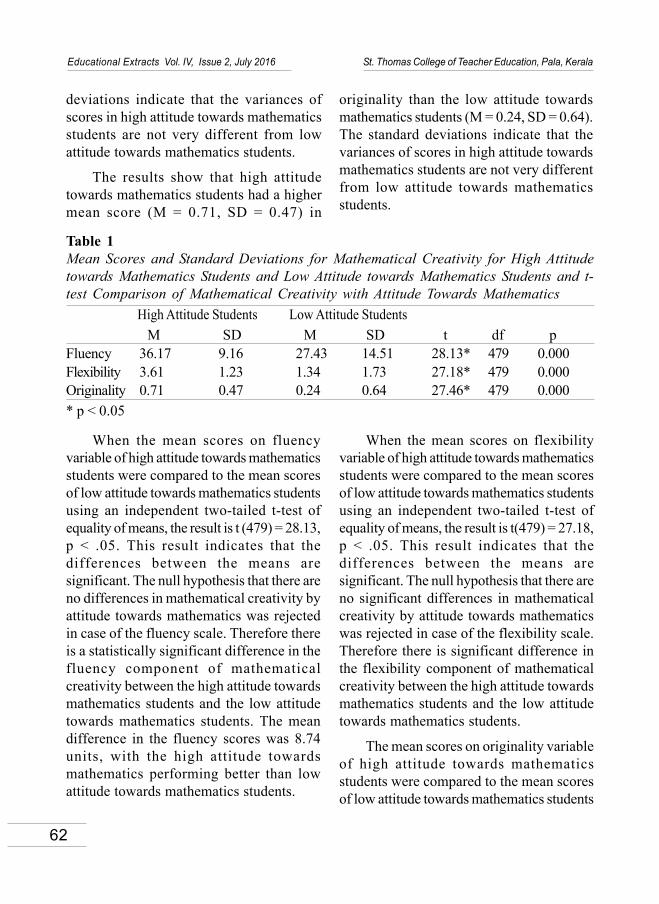
62
Educational Extracts Vol. IV, Issue 2, July 2016 St. Thomas College of Teacher Education, Pala, Kerala
When the mean scores on fluencyvariable of high attitude towards mathematicsstudents were compared to the mean scoresof low attitude towards mathematics studentsusing an independent two-tailed t-test ofequality of means, the result is t (479) = 28.13,p < .05. This result indicates that thedifferences between the means aresignificant. The null hypothesis that there areno differences in mathematical creativity byattitude towards mathematics was rejectedin case of the fluency scale. Therefore thereis a statistically significant difference in thefluency component of mathematicalcreativity between the high attitude towardsmathematics students and the low attitudetowards mathematics students. The meandifference in the fluency scores was 8.74units, with the high attitude towardsmathematics performing better than lowattitude towards mathematics students.
When the mean scores on flexibilityvariable of high attitude towards mathematicsstudents were compared to the mean scoresof low attitude towards mathematics studentsusing an independent two-tailed t-test ofequality of means, the result is t(479) = 27.18,p < .05. This result indicates that thedifferences between the means aresignificant. The null hypothesis that there areno significant differences in mathematicalcreativity by attitude towards mathematicswas rejected in case of the flexibility scale.Therefore there is significant difference inthe flexibility component of mathematicalcreativity between the high attitude towardsmathematics students and the low attitudetowards mathematics students.
The mean scores on originality variableof high attitude towards mathematicsstudents were compared to the mean scoresof low attitude towards mathematics students
deviations indicate that the variances ofscores in high attitude towards mathematicsstudents are not very different from lowattitude towards mathematics students.
The results show that high attitudetowards mathematics students had a highermean score (M = 0.71, SD = 0.47) in
originality than the low attitude towardsmathematics students (M = 0.24, SD = 0.64).The standard deviations indicate that thevariances of scores in high attitude towardsmathematics students are not very differentfrom low attitude towards mathematicsstudents.
Table 1Mean Scores and Standard Deviations for Mathematical Creativity for High Attitudetowards Mathematics Students and Low Attitude towards Mathematics Students and t-test Comparison of Mathematical Creativity with Attitude Towards Mathematics High Attitude Students Low Attitude Students
M SD M SD t df pFluency 36.17 9.16 27.43 14.51 28.13* 479 0.000Flexibility 3.61 1.23 1.34 1.73 27.18* 479 0.000Originality 0.71 0.47 0.24 0.64 27.46* 479 0.000* p < 0.05

63
Educational Extracts Vol. IV, Issue 2, July 2016 St. Thomas College of Teacher Education, Pala, Kerala
using an independent two-tailed t-test ofequality of means. The result is t (479) =27.46, p < .05. This result indicates that thedifferences between the means arestatistically significant. The null hypothesisthat there are no differences in mathematicalcreativity by attitude towards mathematicswas rejected in case of the originality scale.Therefore there is significant difference inthe originality component of mathematicalcreativity between the high attitude towardsmathematics students and the low attitudetowards mathematics students.
Thus, for the fluency, flexibility andoriginality variables of mathematicalcreativity, the null hypothesis that “there isno significant difference in mathematicalcreativity between high and low attitudetowards students” was rejected. This showsthat high attitude towards mathematicsstudents were different from the low attitudetowards mathematics students in all the levelsof those mathematical creativity components.
Conclusions and Implications
The finding of this study is that thereare significant differences in mathematicalcreativity by student attitude towardsmathematics. The data from themathematical creativity test analysed usingt-test. The scores of each component ofmathematical creativity like fluency, flexibilityand originality were analyzed using t-test withthe attitude towards mathematics. The resultsof this study indicated statistically significantdifferences in attitude towards mathematicsin the fluency, flexibility and originality scoresof mathematical creativity. The findings ofthe study agrees with the earlier researchstudies which reported significant relationship
between attitude towards mathematics andmathematical creativity (Choi & Do, 2008& Ma, 1997).
The implications of this study are thatteachers should try to increase attitudetowards mathematics in order to improvefluency, flexibility and originality factors ofmathematical creativity. Another implicationof this result is that students are not equallymotivated within themselves. In the classroom teachers need to translate thecurriculum in terms of skills that studentswould find relevant and interesting(Boekaerts, 2002). Teachers could assist thestudents to become intrinsically andextrinsically motivated through creativeteaching and relating the curriculum to reallife situations. Bad teaching kills motivationand that good teaching brings out the best instudents of all ages (Boekaerts, 2002).
Students will become motivated andmore involved if what they learned inmathematics classes are related to real lifesituations. Teachers wishing to improvestudents’ motivation towards mathematicsshould consider their classroom environment,because it is quite feasible that all teacherscan improve the quality of their ownclassrooms (Opolot-Okurut, 2010). Teachersneed to communicate to the students thatthey can learn mathematics; praise studenteffort and performance when deserved;employ cooperative grouping and encouragediscussion of mathematics among students;when students go wrong in a problem,encourage them try again and again ratherthan letting them to worry about their failure.To build motivation in mathematicsclassrooms Boekaerts (2002) pointed out that

64
Educational Extracts Vol. IV, Issue 2, July 2016 St. Thomas College of Teacher Education, Pala, Kerala
provide feed-back with respect to thesolution plan, encourage students to exchangeinformation about the strategies they usedand allow them to learn from mistakes.Parents also should give confidence andmotivation for students to learn. Teachers andparents through their exemplary behaviourshould be role-models to students.
Conclusion
In order to develop mathematicalcreativity, most important area to beconsidered is to create confidence and todevelop motivation to learn mathematics.Students should be encouraged to engage inchallenging problems and experiences. It isthe responsibility of the teachers to providesituations to have such inventions within theclassroom atmosphere. It should be notedthat all students are inventors and creatorsand the intensity of this creativity will bevaried from individual to individual. Insteadof neglecting or suppressing these divergentthinking, they should be converted to fruitfulcreations. Diversity is inevitably present inclassrooms and is recognised and capitalisedon by the use of cooperative teachingstrategies. Students should be encouraged tocommunicate their thinking, to work throughtheir ideas and those of other students, andwhere consideration of multiple solutionmethods are encouraged (flexible thinking)(Cropley, 1997). Teachers also try to avoidgiving negative comments and ridiculingstudents in the mathematics class rooms.Instead, try to make them learn from theirmistakes. This will ensure a positive attitudetowards mathematics and consequently it willdevelop mathematical creativity.
ReferencesBoekaerts, M. (2002). Motivation to learn.
Educational Practice Series,10. Paris:UNESCO.
Choi, Y., & Do, J. (2008). Research on thecharacteristics of mathematically giftedstudents in Korea. A Paper presented for the11th International Congress on MathematicsEducation, July 6-13, 2008, Mexico.
Cockcroft, W.H. (1982) Mathematics Counts.London: HMSO
Cropley, A. J. (1997). Fostering creativity in theclassroom: General principles. In M. A. Runco(Ed.), The creativity research handbook:Volume one (pp. 83-114). Cresskill, NJ:Hampton Press.
Fennema, E., & Sherman, J.A. (1976). Fennema-Sherman mathematics attitude scales:Instruments designed to measure attitudetoward mathematics by females and males,Journal of Research in MathematicsEducation, 7, 324-326.
Guilford, J. P. (1967). The nature of humanintelligence. New York: McGraw-Hill.
Haylock, D. W. (1997). A framework for assessingmathematical creativity in schoolchildren.Educational Studies in Mathematics,18, 59-74.
Kim,H., Cho,S., & Ahn, D. (2003). Developmentof mathematical creative problem solvingability test for identification of gifted in math.Gifted Education International, 18,184-174.
Ma, X. (1997). Reciprocal relationships betweenattitude toward mathematics andachievement. Journal of Education Research,90, 221-229.

65
Educational Extracts Vol. IV, Issue 2, July 2016 St. Thomas College of Teacher Education, Pala, Kerala
Meissner, H. (2008). Intutive-creative-gifted-logical. An analysis for the discussion groupDG 9 at ICME 11: A paper presented for the11th International Congress on MathematicsEducation, July 6-13, 2008, Mexico.
Opolot-Okurut, C. (2008). Factors that hinderopportunities to learn mathematics in primaryschools in Uganda. A paper presented for the11th International Congress on MathematicsEducation, July 6-13, 2008, Mexico.
Opolot-Okurut, C. (2010). Classroom learningenvironment and motivation towardsmathematics among secondary schoolstudents in Uganda.Learning EnvironmentsResearch: An International Journal, 13 (3),267-277.
Sternberg, R.J. (2006). The nature ofcreativity.Creativity Research Journal, 18(1),87-98.
Torrance, E. P. (1974). Torrance tests of creativethinking. Personnel Press, Xerox.Education Co.

66
Educational Extracts Vol. IV, Issue 2, July 2016 St. Thomas College of Teacher Education, Pala, Kerala
* Research Scholar, Bharathiar University, Coimbatore & Lecturer, UCTE Erattupetta, Kerala** Assistant Professor, St. Thomas College of Teacher Education, Pala, Kerala
Educational Extracts ISSN 2320-7612
Vol. IV Issue 2 July 2016pp. 66-73
St. Thomas College of Teacher Education, Pala, Kerala, IndiaWebsite: www.stce-pala.info, www.stctepala.orgemail: [email protected]
REGULATION OF COGNITION AMONGSECONDARY SCHOOL STUDENTS
Viswalakshmi T.V*Dr. T. C. Thankachan**
AbstractMetacognitive control/regulation is considered as the ability to use knowledge toregulate and control cognitive processes. Students with high metacognitive andself-regulatory abilities actively involved in their own learning process. It is importantfor students to be aware of their strengths and limitations as learners. In last twentyyears, metacognition has been receiving increased attention in cognitive psychology.The present study aims to find out the Regulation of Cognition among SecondarySchool Students. The main components of Regulation of Cognition are Planning,Monitoring and Evaluation. The main tool used for the survey is MetacognitiveAwareness Inventory prepared by Shraw and Dennison (1994). The result of thestudy indicate that the level of Regulation of Cognition among the Secondary SchoolStudents is average, there is significant difference in level of Regulation of Cognitionbetween Male and Female and there is no significant difference in the level ofRegulation of Cognition between English Medium and Malayalam Medium students.Keywords: Regulation of Cognition, Planning, Monitoring, Evaluation, etc.
Introduction
Regulation of cognition ormetacognitive regulation refers to a set ofactivities that help students control theirlearning (Gavelek & Raphael, 1982;Gourgey, 1998; Hartman, 1998). Althougha number of regulatory skills have beendefined, three basic skills are included in allaccounts: Planning, monitoring, andevaluation (Fraenkel & Wallen, 2000;
Jacobs & Paris, 1987). “Planning involvesthe selection of appropriate strategies andthe allocation of resources that affectperformance. Monitoring refers to one’sonline awareness of comprehension andtask performance. Evaluation refers toappraising the products and efficiency ofone’s learning (Schraw, 1998).

67
Educational Extracts Vol. IV, Issue 2, July 2016 St. Thomas College of Teacher Education, Pala, Kerala
Metacognitive control/regulation isconsidered as the ability to use knowledgeto regulate and control cognitive processes.Metacognitive control is related withmetacognitive activities that help to controlone’s thinking or learning (Ozsoy, 2008).Students having the prediction skill think aboutthe learning objectives, proper learningcharacteristics, and the available time.Prediction skill enables students to predictthe difficulty of a task, by this way they usethat prediction to regulate their engagementrelated to outcome. The selection ofappropriate strategies and allocation ofresources closely related with the predictionskill (Desoete, 2008). Monitoring refers toone’s on-line awareness of comprehensionand task performance. The ability to engagein periodic self-testing while learning is agood example (Winnie 1997). Studentshaving the evaluation skill appraise theproducts and regulatory processes of theirlearning. Students can re-evaluate their goalsand conclusions. Evaluation enables studentsto evaluate their performance on the task,students can compare their performanceswith each other and they can use the resultof comparison to locate the error in thesolution process (Lucangeli, Cornoldi, &Tellarini, 1998). Students with highmetacognitive and self-regulatory abilitiesactively involve in their own learning process,plan and monitor the task they are focusingon, their own study attitudes and the task andthe study attitudes fits together (Zimmerman&Martinez-Pons, 1986).
Metacognitive Regulation:Metacognitive experiences involve the useof metacognitive strategies or metacognitiveregulation (Brown, 2002) [16]. Metacognitive
strategies are sequential processes that oneuses to control cognitive activities, and toensure that a cognitive goal has been met.These processes help to regulate and overseelearning, and consist of planning andmonitoring cognitive activities, as well aschecking the outcomes of those activities
It is important for students to be awareof their strengths and limitations as learners.In last twenty years, metacognition has beenreceiving increased attention in cognitivepsychology. Specific attention has beenfocused on this construct as the interfacebetween cognition and affect and its essentialrole in self-regulation in achievement settings(Carrell, Gajdusek, & Wise, 1998; Lucangeli& Cornoldi, 1997). Metacognition itself doesnot predict achievement, but theorists believethat it may serve as a mediator to learning(Braten, 1991; Bruning, Schraw, & Ronning,1995). Highly metacognitive individuals dobetter than others in planning, managinginformation, monitoring, debugging, andevaluating (Anderson & Walker, 1991;Schraw & Dennison 1994).
Flavell (1979) stated that metacognitionis “knowing about knowing”. For Schrawand Dennison (1994), it is an ability to reflect,control and understand, in a self-aware mode,one’s own learning and cognition. Althoughthis term has been part of the vocabulary ofeducational psychologists for more thantwenty years, because of the lack of a cleardefinition and the lack of a unified theory ofmetacognition, defining metacognition is notthat simple. But if today metacognition is stilla fuzzy concept, there is general agreementamong researchers that it can be divided intotwo general constructs termed: metacognitiveknowledge and metacognitive control and
68
Educational Extracts Vol. IV, Issue 2, July 2016 St. Thomas College of Teacher Education, Pala, Kerala
regulation. Metacognitive knowledge refersto general knowledge about how humanbeings learn and process information, as wellas individual knowledge of one’s own learningprocesses. Metacognitive experiencesinvolve the use of metacognitive strategiesor metacognitive regulation (Brown, 1987).Metacognitve strategies are sequentialprocesses that one uses to control cognitiveactivities, and to ensure that a cognitve goalhas been met. These processes help toregulate and oversee learning, and consistof planning and monitoring cognitiveactivities, as well as checking the outcomesof those activities.
Metacognition is an important conceptin cognitive theory. It consists of two basicprocesses occurring simultaneously.Monitoring your process as you learn andmaking changes and adapting your strategiesif you perceive you are not doing so well. Itis about self – reflection, self – responsibilityand imitative as well as goal setting and timemanagement. Numerous studies learn thatMetacognition is important for Studentslearning because it affects how Studentsapply what they had learnt to solve problems.Metacognition has applications for manyareas of school success.
Significance of the Study
Metacognition broadly defined isknowledge that a person has his owncognitive process. Metacognition entails twocomponents: Metacognitive knowledge andMetacognitive regulation. Metacognition hasstudies gives an answer to the problems ofthe present educational practices.Metacognitive thinking is a key element inthe transfer of learning and the child’s
development of Metacognitive skills is termedas Meta-learning. Meta-learning andteaching strategies can help mediate theMetacognitive skills of children and stimulatechildren’s Metacognitive thinking. There isa significant relation between learningoutcomes and knowledge of specificstrategies.
In science, Metacognition looks likeplanning strategies to use on as word problemor to design an experiment to isolate a givenelement. Also, Metacognition means beingsable to evaluate several different strategiesused in order to determine which onesworked and which ones might be the best touse in a similar situation in the future. AlsoMetacognition help Students to plan essaysand modes of research before delivering intoa large paper or term paper. SinceMetacognition is thinking about thinking itsuse can be improve the Process Skills inScience.
Metacognition refers to our knowledgeof what we know or what we know aboutwhat we know and the use of this knowledgeto direst further learning activities. Whenengaging in critical thinking, Students needto monitor their thinking process checkwhether progress is being made toward anappropriate goal, ensure accuracy and makedecisions about the use of time and mentaleffort. Students can become better thinkersand learners by developing the habit ofmonitoring their learning. The skills andattitudes of Metacognitive activates can betaught and learned strategies and makejudgments about how efforts to allocate to acognitive task.(Nelson,1996).

69
Educational Extracts Vol. IV, Issue 2, July 2016 St. Thomas College of Teacher Education, Pala, Kerala
Accurate Metacognitive monitoring isnecessary for effective regulation of ScienceProcesses and these together contribute themore optimal learning. If a person does notaccurately monitor his current state of learning,he may fail to study effectively. Thereforeaccurate monitory learning is critical.
Sometimes students experiencedifficulties in acquiring these competenciesand behaviors due to their inability to makeuse of knowledge and skills and take controlof their learning. This inability to self-regulatetheir learning and behavior often results inpoor academic performance along withdifficulties in social interaction. Lindner andHarris suggested that the self-regulatedlearner is "organized, autonomous, self-motivated, self-monitoring, self-instructing, inshort, behaves in ways designed to maximizethe efficiency and productivity of the learningprocess". Thus a careful guidance inrecognizing and regulating one’s own thinkingprocesses may help learners to solveproblems of their lives. Instead of telling themthe solution of a particular problem it will bebetter to equip them with the knowledge tohave a practical assessment of their ownskills and cognitive processes which mayenable them not only to solve the presentproblem but the problems throughout theirlives. This concept of self-regulating ofbehavior is known as Metacognition.
Metacognitive strategies such as self-monitoring, knowledge of the existingproblem, self-evaluation and strategymechanism would definitely bring aboutrevolutionary changes in the teaching learningprocess. The need of the hour is the totalchanges in the existing learning – teaching
strategies and Students should be so orientedas to be discovers of knowledge. Self-discovery should be the desirable learningstrategy and accordingly, the teacher shouldpresent confusing or challenging situationsto the learner so that they must think a lotand find suitable solution to it. Thus thecurriculum should be so rearranged as to beincluded by the practice of Metacognitiveskills. This will facilitate better learning aswell as the problem solving and their byScience Process Skills in learner should beincreased. When Metacognitive strategiesare effectively applied the classes woulddefinitely and automatically become brain-storming sessions and the school a center ofexcellence in learning and teaching.
Objectives of the Study1. To study the distribution of the scores
on Regulation of Cognition among theSecondary school students.
2. To find out the level of Regulation ofCognition among Secondary schoolstudents.
3. To find out the significance differenceif any between the Means of the scoreson Regulation of Cognition among
A. Boys and Girls of Secondary schoolstudents
B. English medium and Malayalam Mediumof Secondary school students
Hypotheses of the Study
The hypotheses formulated for thepresent study were:i. The distribution of Regulation of
Cognition of Secondary school studentsis approximately equal.
ii. There exists a significant difference inthe Means of the Scores on Regulation

70
Educational Extracts Vol. IV, Issue 2, July 2016 St. Thomas College of Teacher Education, Pala, Kerala
of Cognition among Boys and Girls ofSecondary school students.
iii. There exists a significant difference inthe Means of the Scores on Regulationof Cognition among English medium andMalayalam medium students
Methodology
Normative survey method is adopted forthe conduct of present study. The presentstudy consists of sample of 60 Secondaryschool students randomly selected out of thetotal population in Kottayam District.Selection of sample is according to genderand medium of instruction.
The Metacognitive awareness inventoryPrepared by Schraw, G & Dennison, R.S(1994) was administered to selected samples.The inventory have 52 statements, out of this32 statements related to knowledge ofregulation and 17 belongs to knowledge ofcognition. Here the investigator takes onlythe statements relates to Regulation ofCognition. They are
(a) Planning
Planning, goal setting, and allocatingresources prior to learning
(b) Information management strategies
-Skills and strategy sequences used toprocess information more efficiently(e.g,elaborating, summarizing, selective focusing
(c) Comprehension Monitoring
-Strategies used to correctcomprehension and performance errors
(d) Debugging strategies
-Strategies used to correctcomprehension and performance errors
(f) Evaluation
-Analysis of performance and strategyeffectiveness after a learning episode.
Sample of the Study
The study conducted on a representativesample of 60 Secondary school students ofKottayam district by using a StratifiedRandom Sampling technique giving duerepresentation to Gender and Medium ofInstruction
Tools
Metacognitive Awareness Inventorydeveloped and Standardized by Shrew andDennison (1994).
Statistical Techniques Used
The following statistical techniques wereemployed for the analysis of data collection.
1. Mean
2. Standard deviation
3. ‘t’ –test
Analysis and Interpretation
Table 1The Distribution of scores of Regulationof Cognition among Secondary Schoolstudent
Class interval Frequency Percentage10-15 1 1.215-20 2 3.3320-25 25 41.6625-30 22 36.6730-35 10 16.66TOTAL 60 100
The first objective was to find out thedistribution of Regulation of Cognition among

71
Educational Extracts Vol. IV, Issue 2, July 2016 St. Thomas College of Teacher Education, Pala, Kerala
Table -2 Shows that the mean scores ofMale and female are 23.69 and 26.32 withstandard deviation of 2.523and 5.075respectively. The obtained t- value is 2.517is higher than the theoretical t-value 1.96 at0.05 level of significance. Hence thehypothesis -3 that there is significantdifference between Regulation of Cognitionamong Boys and Girls is accepted. The meanscores of female students are higher thanthat of male students. So the Female studentshaving good Regulation of Cognition than theMale students.
It is clear from the table-3 that the t-value is less than the 1.96 at 0.05 level ofsignificance. It shows that there is no
significant difference in Regulation ofCognition among the English Medium andMalayalam medium Students. The Meanscores of English medium and MalayalamMedium students are almost same.
Major findings of the study1. The distribution of Regulation of
Cognition among students is normallydistributed.
2. Most of the students have moderateRegulation of Cognition.
3. There is significant difference inRegulation of Cognition among Boys andGirls. Girls having good Regulation ofCognition than Boys.
the Secondary School Students. From thetable values it is interpreted that highestnumber of student fall in the class interval of20-25. The tables show that the scores areaccumulated towards the central scores 25.This shows that the Regulation of Cognitionis normally distributed among the samples.By using the Mean and standard deviationof the scores it is easy to classify the students
according to their Regulation of Cognition.Majority of students (41.66%) have moderateMetacognitive Regulation. Only 16.66% ofstudents have high Metacognitive Regulation.Since the majority of students belong toaverage level. It is concluded thatKnowledge of Regulation among SecondarySchool Students is not high but average.
Table 2 Regulation of cognition among Secondary School Students with respect to Gender.Variables Category N Mean S.D t-value RemarksRegulation of Male 29 23.69 2.573 2.517 significant atCognition Female 31 26.32 5.075 .05 level
Table 3Regulation of Cognition among Secondary School Students with respect to medium ofinstructionVariables Category N Mean S.D t-value RemarksRegulation of EnglishCognition medium 31 24.59 4.355 0.819 Not Significant
Malayalam at .05 levelmedium 29 25.45 4.130
72
Educational Extracts Vol. IV, Issue 2, July 2016 St. Thomas College of Teacher Education, Pala, Kerala
4. There is no significant difference inRegulation of Cognition among Englishmedium and Malayalam mediumstudents. The medium of instructionhave no effect on Regulation ofCognition.
Conclusion
The present study reveals that theRegulation of Cognition or MetacognitiveRegulation is average in secondary schoolstudents. Students must assume increasingresponsibility for planning regulating theirlearning. It is difficult for learners to becomeself-directed when learning is planned andmonitored by someone else. Students can betaught to make plans for learning activitiesincluding estimating time requirements,organizing materials and schedulingprocedures necessary to complete an activity.The resource center’s flexibility and accessto a variety of materials allows the Studentsto do just this. Criteria for evaluation mustbe developed with Students so that they learnto think and ask questions of themselves asthey proceed through a learning activity.Closure activities focus Students’ discussionon thinking processes to develop awarenessof strategies that can be applied to otherlearning situations. Guided self-evaluatingexperiences can be introduced throughindividual conferences and checklist focusingon thinking process. Gradually self-evaluationwill be applied more independently. AsStudents recognize that learning activities indifferent, disciplines are similar, they willbegin to transfer learning strategies to newsituations.
ReferencesBayer Barry, K. (1987). Practical Strategies for the
Teaching of Thinking. U.S.A: Allyn & Bacon.
Bell, T. (1963). Metacognition and its Dimensionin School and Outside. San Francisco: JosseyBass.
Govil Punitha.,& Rani Rekha.(2013).Metacognitive and its Correlates: AStudy.International Journal of Advancementin Education and Social sciences 1:1.IROSSS., pp 20-25.
Harriet Salatas Waters. & Wolfgung Schncider.(2010). Metacognition, Strategy use andInstruction. Newyork: The Guiford press.
Lokanadha Reddy, G., & Shanthakumari, P. (2004)English language Learning Difficulties:Metacognitive Awareness of students.Edutraks 3(12) pp31-35.
Mathew, T.K. (2013). Teacher Education toContemporary Learning. Thiruvalla: LillyPubishing house.
Mskini Hbiben. &Safar Yahya. (2016). The effectof Metacognitive Instruction on ProblemSolving skills in Iranian Students of healthSciences. Global Journal of Health Science8:1.Canadian Center of Science Education. Pp43-51
Pina, Tarricone. (2011).Taxonomy ofMetacognition.Newyork: PsychologyPress.Taylor and Francis Group.
Remadevi, K. (2010). Relation betweenMetacognitive Awareness and Achievementin Physics at Higher secondary level.International Educator 22:1.Thiruvananthapuram, Kalanikethan.pp 37-41
Shareeja Ali, M.C. (2010). Metacognition:Concepts and its development Edutraks 9(9).Hyderabad, Neelkamal publicationsPvt.Ltd.pp.10-13.
73
Educational Extracts Vol. IV, Issue 2, July 2016 St. Thomas College of Teacher Education, Pala, Kerala
Simon Philip., & Babu,R.(2008). MetacognitiveAwareness of Teacher Trainees In Kerala.International Educator 20:2Thiruvananthapuram, Kalanikethan. pp 19-21.
Thomas, Shimitha. (2011). A study onMetacognition and Problem solving Skillsamong the Students of Higher secondaryschools of Kottayam Disrict. UnpublishedM.Ed. Dissertation, Mahatma GandhiUniversity, Kottayam.
74
Educational Extracts Vol. IV, Issue 2, July 2016 St. Thomas College of Teacher Education, Pala, Kerala
EFFECTIVENESS OF GRAPHIC ORGANIZER ASA META COGNITIVE CLASSROOM PRACTICE ONTHE ACADEMIC ACHIEVEMENT AND THE META
COGNITIVE AWARENESS OF MALAYALAMLANGUAGE STUDENTS AT SECONDARY LEVEL
THROUGH THE IMPLEMENTATION OF CALLA MODELDr.Sreevrinda Nair N*
Abstract A graphic organizer is a visual and graphic display that depicts the relationshipbetween facts, terms or ideas within a learning task. These organizers activate andengage learners in the instructional process and enable them to capture and focustheir attention in an exciting way. Constructivist approaches to learning and teachinghave become increasingly influential concepts over the past few decades and attentionhas increasingly focused on how we learn, as well as what we learn. The intellectualdimension namely Meta cognitive dimension of student learning enters to theircognitive readiness through the mode of self-regulated learning which is capable formaking them responsible for managing their own learning.This study tries to findout the effectiveness of Graphic Organizer on the academic achievement and metacognitive awareness of Malayalam language students.This study reveals that‘Planning,’ the major component of Meta cognition enabled the learners to internalizethe learning goals and emphasized a clear-cut way for reaching the desired target.‘Monitoring’ kept them in the track and acted as an exemplar of sustaining motivationamong the students. From this study, we can conclude that Graphic organizers arepowerful and excellent instructional tools, which help to instill Meta cognitionamong the learners. These pictorial representations allow students to brainstormideas and organize them into manageable and comprehensible chunks.Key words: Meta cognition, Graphic Organizer, CALLA Model, Meta cognitiveawareness, etc.
* Assistant Professor, N S S Training College, Pandalam.
Educational Extracts ISSN 2320-7612
Vol. IV Issue 2 July 2016pp. 74-80
St. Thomas College of Teacher Education, Pala, Kerala, IndiaWebsite: www.stce-pala.info, www.stctepala.orgemail: [email protected]

75
Educational Extracts Vol. IV, Issue 2, July 2016 St. Thomas College of Teacher Education, Pala, Kerala
Introduction
According to the dual coding theory ofinformation storage, knowledge is stored intwo forms – linguistic and imagery. Theimagery mode of information storage isreferred to as graphic organizers or non-linguistic representations. A graphicorganizer is a visual and graphic display thatdepicts the relationship between facts, termsor ideas within a learning task. Theseorganizers activate and engage learners inthe instructional process and enable them tocapture and focus their attention in an excitingway. Constructivist approaches to learningand teaching have become increasinglyinfluential concepts over the past fewdecades and attention has increasinglyfocused on how we learn, as well as whatwe learn (Downing 2010). The intellectualdimension namely Meta cognitive dimensionof student learning enters to their cognitivereadiness through the mode of self-regulatedlearning which is capable for making themresponsible for managing their own learning.
Review of Related Studies
Snyder and Solomon (2012) conducteda study, which aims to investigate the effectsof graphic organizers, level of text structurecomplexity and content familiarity on secondgrade students’ comprehension, recall andsensitivity to cause/effect text structure.Suarez (2011) conducted a study that soughtto identify which graphic organizers andhigher order thinking skills would aid instudents test scores in a district impacted bypoverty and a high level of second languagelearners. The foundation of this study waspredicated on cognitive theory, constructivismand the use of graphic organizers. In thepreset context, the investigator adopted
Graphic Organizer as a classroom practicewith a view to enhance student’s cognitiveand Meta cognitive abilities throughfamiliarizing the advantages of pictorialformats for processing varied modes oflearning in classrooms.
Statement of the Problem
Effectiveness of Graphic Organizer asa Meta cognitive classroom practice on theacademic achievement and the Metacognitive awareness of Malayalam languagestudents at secondary level through theimplementation of CALLA model
Hypotheses of the study
The select Meta cognitive classroompractice, namely Graphic Organizer, is betterthan the prevailing activity oriented modesof curriculum transaction in enhancingacademic achievement of Malayalamlanguage students at secondary level.
The select classroom practice namely,Graphic Organizer is better than theprevailing activity oriented modes ofcurriculum transaction in enhancing the Metacognitive awareness of Malayalam languagestudents at secondary level.
Objectives of the study
To find out the effectiveness of selectMeta cognitive classroom practice, namelyGraphic Organizer in enhancing academicachievement of Malayalam languagestudents at secondary level.
To find out the effectiveness of selectMeta cognitive classroom practice, namelyGraphic Organizer in enhancing Metacognitive awareness of Malayalam languagestudents at secondary level.

76
Educational Extracts Vol. IV, Issue 2, July 2016 St. Thomas College of Teacher Education, Pala, Kerala
Sample selected for the study
165 Secondary school students fromfour schools belong to three districts ofKerala namely, Pathanamthitta, Alappuzhaand Kottayam were selected as experimentaland control groups.
Methodology adopted for the study
In the present study, a mixed method ofresearch design, incorporating bothquantitative and qualitative data collectionand analysis was used. Integrating these twomethods simultaneously provided the studywith new insights, consistency in findings anddetailed results that helped to cancel out theweaknesses of both quantitative andqualitative research techniques
Research design
A pre test posttest non-equivalent non-group design was selected for the study.
Tools employed for the study
Lesson transcript based on the selectMeta cognitive classroom practice, GraphicOrganizer
Meta cognitive awareness rubric
Achievement test on language learning
Procedure adopted for the study
In order to familiarize the students withthe processes embedded in the selectclassroom practice - Graphic organizer -theywere led through the instructional sequencesuggested by Chamot and O’ Malley (1990)which is portrayed in the Figure 1.
PURPOSE OF CALLA* Focus the learner* Improve academic language proficiency
* Motivate with content topics* Teach learning strategies.
Figure 1CALLA Instructional sequence.
The five phases recursive instructionalcycle of CALLA (Cognitive AcademicLanguage Learning Approach) are illustratedin the Figure 2.
Figure 2Schematic Representation of CALLA
The stages are explained below in detail.
Stage 1. Preparation stage: The purposeof this phase was to help students to elicittheir prior knowledge about the use oflearning strategies and identify the strategiesthey are already using in order to develop

77
Educational Extracts Vol. IV, Issue 2, July 2016 St. Thomas College of Teacher Education, Pala, Kerala
their Meta cognitive awareness. The highlightof this stage is depicted in Figure 3.
Figure. 3Highlights of the ‘Preparation’ stage.
Stage 2. Presentation: The second stage,namely ‘presentation’ comprises ofdemonstrations of the particular classroompractice before the learners. Modeling anddiscussion, application of the practiceexplicitly through examples are the corefeatures of this stage. The highlight of thestage is portrayed in Figure 4.
Figure 4Highlights of the ‘Presentation’ stage.
Stage 3. Practice: During the third phase‘Practice’, learners are divided into groups andare immersed in the experience with sequencedinstruction. There were opportunities to practicenew information and skills in a variety of waysby involving the spontaneous contribution ofideas from all members of the group. Thehighlights of this stage are given in Figure 5.
Figure 5Highlights of ‘Practice’ stage.
Stage 4. Self Evaluation: This phase standsout as one of the most comprehensive partsof the learning cycle and it captures therelevance of the instructional practice to befollowed and its effectiveness in a contextualsetting. The main set target of this phase wasto provide students with opportunities toevaluate their own success and strengthentheir insights through developing their Metacognitive awareness. The major componentsincluded in this stage are shown in Figurebelow.
Figure 6Highlights of ‘Self Evaluation’ stage.
Stage 5 Expansion: This final phase reallymeant for the transfer of skills learned in aparticular learning context to another newsituation. Learners are in a position to extendthe usefulness of classroom practices byapplying it to new contexts and devise theirown individual combinations with regard tothe pictorial representations of ideas andinterpretations of the select Meta cognitiveclassroom practice. The points inculcated inthis stage are given in Figure 7.
Figure 7Highlights of the ‘Expansion’ stage.
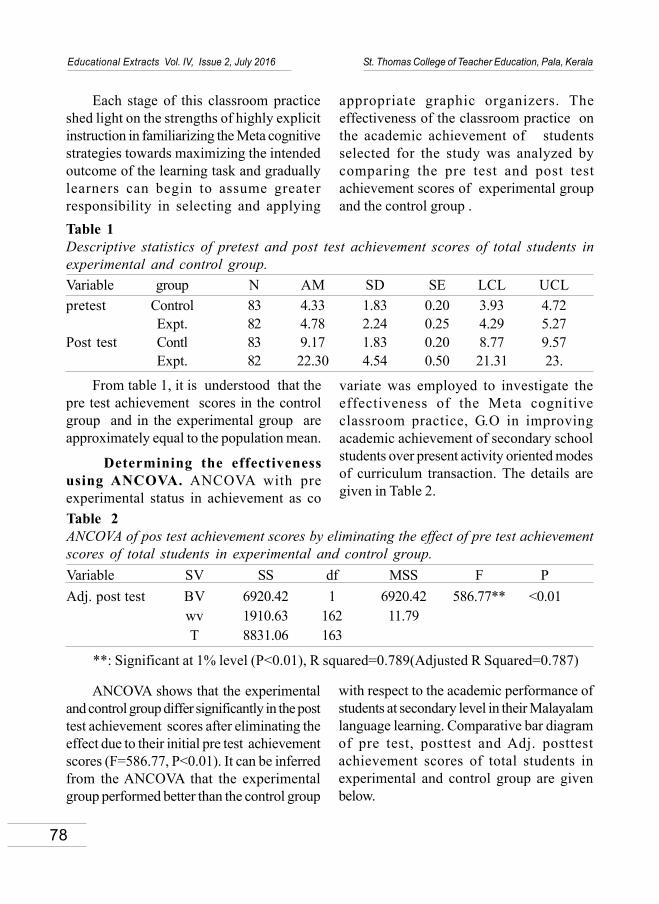
78
Educational Extracts Vol. IV, Issue 2, July 2016 St. Thomas College of Teacher Education, Pala, Kerala
Each stage of this classroom practiceshed light on the strengths of highly explicitinstruction in familiarizing the Meta cognitivestrategies towards maximizing the intendedoutcome of the learning task and graduallylearners can begin to assume greaterresponsibility in selecting and applying
appropriate graphic organizers. Theeffectiveness of the classroom practice onthe academic achievement of studentsselected for the study was analyzed bycomparing the pre test and post testachievement scores of experimental groupand the control group .
Table 1Descriptive statistics of pretest and post test achievement scores of total students inexperimental and control group.Variable group N AM SD SE LCL UCLpretest Control 83 4.33 1.83 0.20 3.93 4.72
Expt. 82 4.78 2.24 0.25 4.29 5.27Post test Contl 83 9.17 1.83 0.20 8.77 9.57
Expt. 82 22.30 4.54 0.50 21.31 23.
From table 1, it is understood that thepre test achievement scores in the controlgroup and in the experimental group areapproximately equal to the population mean.
Determining the effectivenessusing ANCOVA. ANCOVA with preexperimental status in achievement as co
variate was employed to investigate theeffectiveness of the Meta cognitiveclassroom practice, G.O in improvingacademic achievement of secondary schoolstudents over present activity oriented modesof curriculum transaction. The details aregiven in Table 2.
Table 2ANCOVA of pos test achievement scores by eliminating the effect of pre test achievementscores of total students in experimental and control group.Variable SV SS df MSS F PAdj. post test BV 6920.42 1 6920.42 586.77** <0.01
wv 1910.63 162 11.79T 8831.06 163
**: Significant at 1% level (P<0.01), R squared=0.789(Adjusted R Squared=0.787)
ANCOVA shows that the experimentaland control group differ significantly in the posttest achievement scores after eliminating theeffect due to their initial pre test achievementscores (F=586.77, P<0.01). It can be inferredfrom the ANCOVA that the experimentalgroup performed better than the control group
with respect to the academic performance ofstudents at secondary level in their Malayalamlanguage learning. Comparative bar diagramof pre test, posttest and Adj. posttestachievement scores of total students inexperimental and control group are givenbelow.

79
Educational Extracts Vol. IV, Issue 2, July 2016 St. Thomas College of Teacher Education, Pala, Kerala
The graph indicates that the studentswho were exposed to the select Metacognitive classroom practice namely; GraphicOrganizer showed significant improvementin their academic achievement in Malayalamover their counterparts in the control groupwho were exposed to the prevailing activityoriented modes of curriculum transaction.
Analysis of the effectiveness of GraphicOrganizer on strengthening the Metacognitive awareness of students
A Self assessment Rubric wasemployed for this purpose which comprisedof various criterion levels of awareness like,‘Exceeds Expectations’,(E.E) ‘MeetsExpectations,’ (M.E) ‘Partially MeetsExpectations’ (P.M.E) and ‘Doesn’t MeetExpectations.’ (D.M.E). The results showsthat none of the students deserves thecategorization, ‘Exceeding Expectation’ with
regard to the selected components of Metacognition of both control and experimentalgroups. A negligible proportion of studentsfrom both control and experimental groupscould be categorized as the strata, ‘MeetExpectations’. The following section dealswith the analysis of the post scores of totalstudents with respect to their Meta cognitiveawareness.
Analysis of self-assessment of secondaryschool students on their Meta cognitiveawareness-Re administration of theRubric
After the intervention, the variations inthe attainment level of Meta cognitiveawareness of secondary school students werefound out by re administering the Metacognitive awareness rubric to both control andexperimental groups. The change in perceptionsof students is detailed in the Table 3.
Figure 8Comparative bar diagram of pre test, posttest and Adj. post test achievement scores oftotal students in experimental and control group.

80
Educational Extracts Vol. IV, Issue 2, July 2016 St. Thomas College of Teacher Education, Pala, Kerala
By referring the Table, it can be notedthat there is no significant changes in thelevels of learners in the control group.However, in the case of experimental grouplevels of learners under M.E, E.E P.M.Ecategories have increased considerably andthe levels of learners under D.M.E categoryhave decreased.
Summary and conclusions: ‘Planning,’the major component of Meta cognitionenabled the learners to internalize the learninggoals and emphasized a clear-cut way forreaching the desired target. ‘Monitoring’ keptthem in the track and acted as an exemplarof sustaining motivation among the students.Considerable discussions about the processof learning and the participatory mode ofevaluation energized the learners to becomeauthentic about the most importantcomponent of self-directed learning,‘Evaluation’. Conceptual and strategicessence of lesson become more evidentthrough these excellent tools which assist thelearners in sorting, organizing, and arrangingideas in a clear pattern. From this study, wecan conclude that Graphic organizers arepowerful and excellent instructional tools,which help to instill Meta cognition amongthe learners. These pictorial representationsallow students to brainstorm ideas and
organize them into manageable andcomprehensible chunks. These visual toolsare relatively easy to implement and arewarding element in the instructionalpractitioners’ repertoire of skills with regardto curriculum transaction.
ReferencesSmith,K.A;Sheppard,S.D (2005).Pedagogies of
engagement: classroom based practices.Journal pf Engineering Education. 94,87-101.
Suarez, K.(2011). Graphic organizers and higherorder thinking skills with nonfiction text.(Doctoral Dissertation, Waldon University,Minnesotta, USA.UMI number.3482475.
O’Malley, M.J.&Chamot, A.U.(1990) Learningstrategies in second language acquisition.Cambridge: Cambridge University Press
Solomon,P;Synder A.E(2012).The effect ofgraphic organizers and content familiarity onsecond graders ‘ comprehension of cause /effect text.(Doctoral dissertation, Columbiauniversity, USA).
Table 3Comparison of post scores of students in experimental and control groups with regardto their Meta cognitive awareness. Levels of E.E M.E P.M.E D.M.Eperformance Contl. Exptal Contl. Exptal Contl. Exptal Contl. ExptalPlanning Nil 2 4 23 16 45 80 30Monitoring Nil 2 3 21 10 50 87 27Evaluation Nil 1 4 20 3 51 93 28Average Nil 1.66 3.66 .21.33 9.66 48.66 86.66 28.33

81
Educational Extracts Vol. IV, Issue 2, July 2016 St. Thomas College of Teacher Education, Pala, Kerala
AWARENESS OF THE ROLES OF THESOCIAL WORKERS IN THE REHABILITATION OF
PEOPLE WITH DISABILITIES AMONG AFIJIOLOCAL GOVERNMENT SERVANT, OYO STATE
Kasali Oketunde Alabede*Mujidat Lolade Alabede**
AbstractThis study examined the awareness of the roles of the social workers in therehabilitation of people with disabilities. The descriptive survey was used and thepopulation used comprised of fifty (50) people with disabilities from Afijio LocalGovernment of Oyo State, were randomly selected for the study. The instrument usedwas self-structured questionnaire to elicit the opinions from the respondents throughsampling technique. It was analyzed using chi-square to deduce final findings fromthe analysis. The recommendations were made to all tiers of governments to fortifymore efforts and inject more funds to rehabilitate the life of the people with disabilities.Keywords: Social Workers, Disabilities, Impairment and Rehabilitation, etc.
* Computer Science Department, Federal College Of Education (Special), Oyo P.M.B. 1089,Oyo State, Nigeria
** Education Department, Oyo West Local Government Secretariat, Ojongbodu, Oyo, Oyo State,Nigeria
Educational Extracts ISSN 2320-7612
Vol. IV Issue 2 July 2016pp. 81-93
St. Thomas College of Teacher Education, Pala, Kerala, IndiaWebsite: www.stce-pala.info, www.stctepala.orgemail: [email protected]
INTRODUCTION
Social work is a professional andacademic discipline that seeks to improve thequality of life and subjective well-being ofindividuals, groups, and communities throughresearch, policy, community organizing,direct practice, crisis intervention, andteaching for the benefit of those affected bysocial disadvantages such as poverty, mental
and physical illness or disability, and socialinjustice, including violations of their civilliberties and human rights.
Social Worker is protected by law andonly those who have undergone approvedtraining at university either through aBachelor or Masters degree in Social Workand are registered with the appropriateregulatory body may practice social work and
82
Educational Extracts Vol. IV, Issue 2, July 2016 St. Thomas College of Teacher Education, Pala, Kerala
be called a social worker. Social workerstypically undergo a systematic set of trainingand qualifications that are distinct from thoseof social care workers, care assistants orsocial care workers, who may undertake asocial work role but not necessarily have thequalifications or professional skills of aqualified social worker.
Social workers can work in differentfields both government and non-governmental organizations where theyprovide various services to people includingpeople with disabilities. In the Departmentof Social Welfare, which is housed in theMinistry of Health and Social Welfare, overand above provision of generic social welfareservices, social workers’ roles includepreventive, curative and rehabilitativeservices for both normal and with people withdisabilities. Disability care includes improvingcapacity for caregivers and parents to carefor their disabled children and facilitatingintegration of disabled children intomainstream schools and other social settings.Ithuseng Vocational Rehabilitation Centrewhich falls under the Rehabilitation Unit ofthe Ministry was established in 1991 as aresponse to the realization that disabilityperpetuates poverty. The Centre providessupport to adults and youth with any form ofdisability by providing vocational guidance andtraining, literacy and numeracy training skills,technical skills in metal work, leather work,carpentry, sewing, knitting, agriculture,general repair skills and basic training inbusiness management. With the devastatingeffects of HIV/AIDS in the country, socialworkers have also provided informationabout the pandemic to people with disabilities.They have encouraged them to know their
status and seek relevant treatment fromhospitals. The Department of social welfarehas also provided public assistance to the poorand vulnerable people with disabilities.
Social workers usually help the patientsand their families prepare for returning to theirhomes after discharge. As Zastrow (2000)rightly notes, discharge planning is especiallyvital in some rehabilitation settings, such ashospitals. In a case that a person withdisability cannot return home, placement insome other setting must be arranged, suchas in a nursing home or a group home. Socialworkers also make sure that the dischargedpatient adheres to the medication regimeafter discharge to avoid relapsing.
Social workers also provide counsellingto people with various forms of disabilities tohelp them adjust to their disability. In thiscontext, counselling usually involves a widerange of problems such as personal,interpersonal, family, financial, vocationaladjustment and educational adjustment. Insome situations, social workers do not alwaysprovide counselling to people with disabilitiesdirectly, especially if the disabled is a youngchild. Instead, social workers providecounselling to the family of the person withdisability, and other close parties such assiblings, peers and relatives. Working withthe family is initiated to help them understandthe nature of a disability and the prognosis,to make the essential adjustments to help thePWD and to deal with personal andinterpersonal concerns associated with thedisability (Zastrow, 2000).
Rehabilitation process is a process torestore one to his/her former state,reputation, possession, status and others.

83
Educational Extracts Vol. IV, Issue 2, July 2016 St. Thomas College of Teacher Education, Pala, Kerala
Another role for social workers is to raiseawareness of issues of disability in thecountry. As noted earlier on, there are stillnegative connotations about disabilities in thecountry hence social workers must be in theforefront of highlighting the plight of peoplewith disabilities. This can also be linked tothe advocacy role whereby social workerscan lobby government to pass legislationspecifically targeting people with disabilities.
People with disabilities often need avariety of services from other communityagencies, such as provision for financialassistance, wheelchairs, and prostheticservices as well as transportation. Socialworkers link people with disabilities withcommunity resources. Social workers in theDepartment of Social Welfare are responsiblefor collaborating with NGOs like WorldVision, Red Cross Society and otherorganizations that provide assistance topeople with disabilities. These organizationshave poverty alleviation programmes forpeople with disabilities. However, in apersonal interview on 24 April, 2010 with Ms.T. Tsuinyane, the Principal Social Worker,the Department of Social Welfare’s mainchallenges include severe shortages of staffgiven the increasing demand for services,particularly for orphans, other psychosocialsupport services and people with disabilities.
Disability refers to the limited activitiescaused by the impairment which may bephysical, cognitive, mental, sensory, emotional,developmental, or some combination of these.A disability may be present from birth, oroccur during a person's lifetime. It is anumbrella term, covering impairments, activitylimitations, and participation restrictions.
Impairment is a problem in body function orstructure; an activity limitation is a difficultyencountered by an individual in executing atask or action; while a participation restrictionis a problem experienced by an individual ininvolvement in life situations. Thus, disabilityis a complex phenomenon, reflecting aninteraction between features of a person’sbody and features of the society in which heor she lives.
Impairment refers to loss or abnormalityof development or growth of a particular partof the body. For example, a boy who is bornwith one partially developed arm or leg is saidto have a physical impairment. He can bedescribed as physically impaired. Likewise, aman who lost his sight as a result of a headinjury sustained in a motor accident can bedescribed as a visually impaired. People withdisability are a set of people encounteringlimitation in executing a task or action by anindividual in involvement in life situations.
Research and the practice of socialworker focused on areas such as: humandisability development, civil servants circle,psychosocial, psychotherapy, counselling,social policy, public administration, socialprogram evaluation, and communitydevelopment. Social workers are organizedinto local, national, continental, andinternational professional bodies. It is aninterdisciplinary field that incorporatestheoretical bases from economics, education,sociology, law, medicine, philosophy, politics,anthropology, and psychology
STATEMENT OF THE PROBLEM
This situation therefore makes itnecessary to investigate further theawareness of the roles of Social Workers in
84
Educational Extracts Vol. IV, Issue 2, July 2016 St. Thomas College of Teacher Education, Pala, Kerala
the Rehabilitation of people with disabilitiesto better their lives. With the involvement ofsocial worker makes the lives of people withdisabilities are improved through therehabilitation methods adopted by thesepeople.
PURPOSE OF THE STUDY
This refers to the objectives which theresearcher intends to accomplish through thestudy.i. To identity that the rehabilitated people
live independent life through the effortsof social workers
ii. To identify that the people withdisabilities gain full employment after therehabilitation by social workers
iii. To identity that the people withdisabilities contribute their quotas to theeconomy after the rehabilitation bysocial workers
iv. To identity that the people withdisabilities serve as employers of labourin the society
SCOPE OF THE STUDY
This study would have merited a moreroyal success than this if not for certainparasitic variables which rolled in as in thewheel of the researcher’s progress. Thereare some of the problems made it difficult toachieve the results as expected:i. Ethnical issues are some of the
limitations that may arise in this work,the correct honesty and ingenuity of datacan be ascertained
ii. Non-response factor is one of theproblems that this methodology will haveto contend with. The attitudes of therespondents to the questionnaire were
that they felt that it would disturb theirlegal duties as well as expose them.Some respondents snubbed theresearcher; some lost their copies of thequestionnaire while other submitted late.
iii. Limited time for the completion of thework that is time constraint
iv. The work is self sponsored and it isconstrained by budget that will enable itachieve the true outcome which requiresintensive capital.
v. Inaccessibility to the information cancontribute to the problem of limitations
SIGNIFICANCE OF THE STUDY
When talk of significance, it is importantin the sense that social workers contributepositively to the trends of events in thesociety. It is an inevitable as the driving forcefor the changes of development. This projectwork is significant in the sense that with thecontributions of social workers in the life ofpeople with disabilities make the lives ofpeople with disabilities easily, self-reliance,have independent lives useful to them and tothe society at large
THEORETICAL FRAMEWORK
The concept of charity goes back toancient times, and the practice of providingfor the poor had roots in many ancientcivilizations and world religions. Even beforethe rise of modern European states, thechurch was providing social services. Theearliest organized social welfare activity ofthe Christian church was the formation ofburial societies, followed closely by provisionof alms to the poor, shelter for the homeless,and care and comfort for the sick.Monasteries often served as comprehensive
85
Educational Extracts Vol. IV, Issue 2, July 2016 St. Thomas College of Teacher Education, Pala, Kerala
social service agencies, acting as hospitals,homes for the aged, orphanages, andtravelers’ aid stations. It was not until theemergence of industrialization andurbanization that the informal helping systemsof the church and family began to break downand organized social welfare servicesemerged to supplant it.
The profession of social work isgenerally considered to have developed fromthree movements: the Charity OrganizationSociety (COS) movement, the settlementhouse movement, and a third, less clearlydefined movement, the development ofinstitutions to deal with the entire range ofsocial problems. All had their most rapidgrowth during the nineteenth century, and allgrew out of the church (Donovan, 2012).
Social work has its roots in the socialand economic upheaval wrought by theIndustrial Revolution, in particular the societalstruggle to deal with poverty and its resultantproblems. Because poverty was the mainfocus of early social work, it was intricatelylinked with the idea of charity work(Schwingel, Niti, Tang, and Ng, 2009). Forinstance, it is common for modern socialworkers to find themselves dealing withconsequences arising from other "socialproblems" such as racism, sexism,homophobia, and discrimination based on ageor on physical or mental disability (Schwingel,Niti, Tang, and Ng, 2009).
Whereas social casework started on amore scientific footing aimed at directing andreforming individuals, other models of socialwork arising out of the Settlement Housemovement, led by activists such as JaneAddams, emphasized political activism and
community solutions. Currently, social workis known for its critical and holistic approachto understanding and intervening in socialproblems. This has led, for example, to therecognition of poverty as having a social andeconomic basis rooted in social policies ratherthan representing a personal moral defect.This trend also points to another historicaldevelopment in the evolution of social work:once a profession engages in social control,it is directed at social and personalempowerment. This is not to say that modernsocial workers do not engage in social control(consider, for example, child protectionworkers), and many, if not most, socialworkers likely would agree that there is anongoing tension between these forces withinthe profession. For example, see the debatebetween structural social work andhumanistic social work ((Schwingel, Niti,Tang, and Ng, 2009).
PRACTICE AND ROLE OF THEPROFESSIONAL
Social work is an interdisciplinaryprofession, meaning it draws from a numberof areas, such as (but not limited to)psychology, sociology, criminology,economics, ecology, education, health, law,philosophy, anthropology and counselling orcolloquially known as psychotherapy. It is nota 'single model', such as that of health;followed by medical professional such asnurses and doctors, thus, social work requiresstudy and continued professionaldevelopment to retain knowledge and skillsin practice.
The main tasks of professional socialworkers may include a number of servicessuch as case management (linking clients

86
Educational Extracts Vol. IV, Issue 2, July 2016 St. Thomas College of Teacher Education, Pala, Kerala
with agencies and programs that will meettheir psychosocial needs - common in the USand the UK), counseling and psychotherapy,assessment and diagnosis of mentaldisorders, child protection/welfare, humanservices management, social welfare policyanalysis, policy and practice development,community organizing, international, socialand community development, advocacy,teaching (in schools of social work), andsocial and political research.
A historic and defining feature of socialwork is the profession's focus on individualwell-being in a social context and the well-being of society. Social workers promotesocial justice and social change with and onbehalf of clients. The term client is used torefer to individuals, families, groups,organizations, or communities (Olkin, 2012).In the broadening scope of the modern socialworker's role, some practitioners have inrecent years traveled to war-torn countriesto provide psychosocial assistance to familiesand survivors (Olkin, 2012).
Types of disability
Sensory disability
Vision impairment
Hearing impairment
Olfactory and gustatory impairment
Somatosensory impairment
Intellectual disability
Discrimination in employment
The US Rehabilitation Act of 1973requires all organizations that receivegovernment funding to provide accessibilityprograms and services. A more recent law,
the Americans with Disabilities Act of 1990(ADA), which came into effect in 1992,prohibits private employers, state and localgovernments, employment agencies andlabor unions from discriminating againstqualified individuals with disabilities in jobapplication procedures, hiring, firing,advancement, compensation, job training, orin the terms, conditions and privileges ofemployment. This includes organizations likeretail businesses, movie theaters, andrestaurants. They must make reasonableaccommodation to people with differentneeds. Protection is extended to anyone with(a) a physical or mental impairment thatsubstantially limits one or more of the majorlife activities of an individual, (b) a record ofsuch an impairment or (c) being regarded ashaving such an impairment. The second andthird criteria are seen as ensuring protectionfrom unjust discrimination based on aperception of risk, just because someone hasa record of impairment or appears to have adisability or illness (e.g. features which maybe erroneously taken as signs of an illness).Employment protection laws makediscrimination against qualified individualswith a disability, illegal and may also requireprovision of reasonable accommodation(NASW, 2005). Reasonable accommodationsincludes changes in the physical environmentlike making facilities more accessible but alsoinclude increasing job flexibility like jobrestructuring, part-time or modified workschedules or reassignment to vacant position.Though many hold attitudes that are moreenlightened and informed than past years, theword “disability” carries few positiveconnotations for most employers. Negativeattitudes by employers toward potentialemployees with disabilities can lead to

87
Educational Extracts Vol. IV, Issue 2, July 2016 St. Thomas College of Teacher Education, Pala, Kerala
misunderstanding and discrimination (Arditi& Rosenthal, 1998).
African Americans and disability
According to the 2000 U.S. Census, theAfrican American community has the highestrate of disability in the United States at 20.8percent, slightly higher than the overalldisability rate of 19.4% (United Nations,2012). In comparison to the percentage ofWhite Americans with disabilities, AfricanAmericans nearly doubles and is more likelyto have one or more disabilities. Given thesestatistics, it can be suggested that AfricanAmericans with disabilities experience themost severe underemployment,unemployment, and under educationcompared to other disability groups (UnitedNations, 2012).
Social Security Administration
The US Social Security Administrationdefines disability in terms of inability toperform substantial gainful activity (SGA),by which it means work paying minimumwage or better. The agency pairs SGA witha listing of medical conditions that qualifyindividuals for disability benefits.
Disability and poverty
There is a global correlation betweendisability and poverty, produced by a varietyof factors. Disability and poverty may forma vicious circle, in which physical barriersmake it more difficult to get income, whichin turn diminishes access to health care andother necessities for a healthy life (Donovan2012). The World report on disabilityindicates that half of all disabled peoplecannot afford health care, compared to a thirdof non-disabled people.
Disability and disasters
There is limited research knowledge, butmany anecdotal reports, on what happenswhen disasters impact people with disabilities(Bites, 2011). Individuals with disabilities aregreatly affected by disasters (Bites, 2011).Those with physical disabilities can be at riskwhen evacuating if assistance is notavailable. Individuals with cognitiveimpairments may struggle with understandinginstructions that must be followed in theevent a disaster occurs. Those who are blind,hearing impaired and others may havedifficulty communicating during theemergency. All of these factors can increasethe degree of variation of risk in disastersituations with disabled individuals (Myers,Sweeny and Witmer, 2000).
Research studies have consistentlyfound discrimination against individuals withdisabilities during all phases of the disastercycle (WAI, 2013). The most commonlimitation is that people cannot physicallyaccess buildings or transportation, as well asaccess disaster-related services. Theexclusion of these individuals is caused in partby the lack of disability-related trainingprovided to emergency planners and disasterrelief personnel (WAI, 2013).
HYPOTHESES OF THE STUDY
The hypotheses define the state of mindof the researcher regarding possible reasonsfor a problem or a solution. There are usuallytwo hypotheses referred to as H0 and H1.
H0 is the null hypothesis and H1 is thealternate hypothesis. For this case, weformulate a hypothesis H0 which will berejected and H1 which will be accepted basedon the Chi-square analysis.

88
Educational Extracts Vol. IV, Issue 2, July 2016 St. Thomas College of Teacher Education, Pala, Kerala
H0: the people with disabilities do notlive independent life through the efforts ofsocial workers.
H1: the people with disabilities liveindependent life through the efforts of socialworkers
H0: the people with disabilities do notgain full employment after the rehabilitationby social workers.
H1: the people with disabilities gain fullemployment after the rehabilitation by socialworkers.
H0: the people with disabilities do notcontribute their quotas to the economy afterthe rehabilitation by social workers.
H1: the people with disabilities contributetheir quotas to the economy after therehabilitation by social workers.
H0: the people with disabilities do notserve as employers of labour in the society.
H1: the people with disabilities serve asemployers of labour in the society.
MEHODOLOGY
In this chapter, the various stepsemployed in collecting the data for the studywill be explained in details. This chapter willbe examined under the following headings.i. Research Designii. Population of the Studyiii. Sample and Sampling Techniquesiv. Research Instrumentv. Validity of the Research Instrumentvi. Reliability of the Instrumentvii. Research Procedureviii. Procedure for data Analysis
RESARCH DESIGN
Research is the plan, structure andstrategy of investigation conceived as toobtain answers to research questions and tocontrol variance. If the process of conductinga research about a phenomenon is likened tothe process of building a house, the researchdesign can therefore be regarded as thefoundation laying process. The design issystematically followed, objectivelyexamined, sequentially organized andproperly displayed.
The study is therefore the descriptivesurvey. Its aims are to look into the impactsof awareness of the roles of the socialworkers in the disabilities among Afijio LocalGovernment Civil Servants, Oyo State.
POPULATION OF THE STUDY
Research population can be defined asthe complete set of objects, subjects ormembers that can be observed in a givensituation and which have a commonobservable characteristics. The populationfor this study was made up of the peoplewith disabilities among Afijio LocalGovernment Civil Servants, Oyo State forthe purpose of the research. Fifty (50)members of the people with disabilities weresampled for the study.
SAMPLE AND SAMPLINGTECHNIQUES
A sample is a part of a populationbecause of the finance and time constraintsrestricted my sampling into people withdisabilities among Afijio Local GovernmentCivil Servants, Oyo State as a sample wason the basis of convenient rather than onrandom criterion. The research therefore
89
Educational Extracts Vol. IV, Issue 2, July 2016 St. Thomas College of Teacher Education, Pala, Kerala
believes that the Afijio Local GovernmentCivil Servants considered would provide apicture that will reflect the situation in otherLocal Government Areas with people withdisabilities. Random sampling technique wasemployed to give equi-probabilty tendencyto all people with disabilities so that they allhad the opportunity of being selected in thesample.
RESEARCH INSTRUMENT
The questionnaire method was used asthe instrument for the collection of data. Itconsists of two sections A and B. Section Acontains personal information about therespondents, which includes age, sex, religionand educational status.
Section B, the intending questions aimat eliciting responses from the respondentswas stated there. There were twenty (20)questions, which were related using theattitudinal scale. This scale allows for adegree of yes/No.
VALIDITY OF THE RESEARCHINSTRUMENT
The questionnaire was a 20 itemquestions constructed by the researcherbased on experience, managerial skillsacquired and the study of other researchworks. Most of the questions were easilyhandled by first hand experienced socialworkers. Furthermore, the validity of thisinstrument could not be undermined since thestandard has a world-wide acceptability andutility.
RELIABILITY OF THEINSTRUMENT
Reliability refers to the consistency withwhich a test measures what it is to be
measured at different time. It is the degreeof accuracy with which an instrumentmeasures what is supposed to measure. Thereliability of the instrument was ascertainedby analyzing in percentage method.Administering a questionnaire to a group offifty Afijio Local Government Civil Servantswith people with people with disabilityrandomly picked this in the Council. Thenthe results show that the instrument used wasreliable as it elicited the necessaryinformation to achieve the objective of theproject.
RESEARCH PROCEDURE
This is the process by which theresearch was carried out. A well structured20-scale question will be administered andfifty (50) copies of questionnaire will bedesigned, containing questions to elicitresponses related to the purpose of the study.People with disability (respondents) willadminister the copies of the questionnaire.Those who can read and fill the questionnairedo so by themselves while those who needthe assistance in one way or the other inreading and filling the questionnaire also doso. After all, the researcher retrieves all thequestionnaire forms given out after therespondent had filled them.
PROCEDURE FOR DATA ANALYSIS
The likert scale is used to determine theanalysis of the data sample draws by meansof using stratified sampling methods toclassify the people with disability in the strataor in gender (i.e. male or female). The datathat will be collected from the questionnairewill be analyzed descriptively, using chi-square.
90
Educational Extracts Vol. IV, Issue 2, July 2016 St. Thomas College of Teacher Education, Pala, Kerala
Chi-square will be used to bring clarityto enable the readers who are not in the fieldto understand the study very well, and todetermine the analysis of the opinions of therespondents. The responses collected from theresidents are analyzed in chi-square usingfrequency tables. The researcher was first ofall presented the information on the dataobtained on timetable and discusses the result.
From the table, it is easy to analyzedifferent opinions expresses by eachrespondent on each question. Hence Agreedand Disagreed are the alternatives use todetermine the effects of awareness of theroles of the social workers in the rehabilitationof people with disabilities.
METHOD OF ANALYSIS
RESEARCH QUESTION 1: Is thereany effect of social work intervention on thediscovery of the talents of the people withdisabilities?Item Agreed Disagreed Total1 90 25 1152 80 35 1153 100 15 1154 110 05 1155 90 25 115Total 470 105 575
Group Size α- level Df χtab2 χcal2 RemarkAgreed 470 0.05 4 9.488 30.2938 Significant.Disagreed 105
From the table above, χcal2 > χtab2 at0.05 level of significant we hereby rejectthe null hypothesis that there is no significantrelationship between social workers and thediscovery of talents of people with disabilities.
RESEARCH QUESTION 2 : Is thereany relationship between social workers’performance and the availability ofequipment use for the people with disabilities?
Item Agreed Disagreed Total
1 90 25 115
2 80 35 115
3 100 15 115
Total 270 75 345
Group Size α- level Df χtab2 χcal2 Remark
Agreed 270 0.05 2 5.991 10.222 Significant.
Disagreed 75
Since χcal2 > χtab2, we reject H0 andretain the alternative hypothesis that there issignificant relationship between socialworkers and the availability of equipment forthe use of people with disabilities.
RESEARCH QUESTION 3: Is thereany relationship between social workers’skills imparted on the learners (people withdisability) and fully gain employment of thepeople with disabilities after Rehabilitation.

91
Educational Extracts Vol. IV, Issue 2, July 2016 St. Thomas College of Teacher Education, Pala, Kerala
Item Agreed Disagreed Total1 95 20 1152 80 35 1153 110 05 115Total 285 60 345
workers’ roles and the educational needs ofthe people with disabilities provided by theparents of people with disability?
Item Agreed Disagreed Total1 80 35 1152 100 15 1153 95 20 115Total 275 70 345
Group Size α- level Df χtab2 χcal2 RemarkAgreed 285 0.05 2 5.991 13.921 Significant.Disagreed 60
Since χcal2 > χtab2, we reject H0 andretain the alternative hypothesis that there issignificant relationship between socialworkers’ skills imparted on the learners andfully gain employment of people withdisabilities after rehabilitation.
RESEARCH QUESTION 4: Arethere any relationships between social
Group Size α- level Df χtab2 χcal2 RemarkAgreed 275 0.05 2 5.991 11.6493 Significant.Disagreed 70
Since 11.6493>5.991 under 0.05 levelof significant, we hereby reject the nullhypothesis H0 and retain the alternativehypothesis that there is significant relationshipbetween the social workers and the parentsthat provide educational needs for the peoplewith disabilities.
DISCUSSION OF FINDINGS
H01: The study revealed that there is asignificant between social workers and thediscovery of the talents of the people duringthe course of rehabilitation.
This is line with National Association ofSocial Workers (NASW, 2005) which insupport of discovery of talents among thepeople with disability during the course of
training whose role is to assist people withdisabilities, their family members, friends andcarers to adjust to changes in their healthstatus or capabilities in deal with grief andloss as well as managing the emotional andsocioeconomic impact arising as a result ofinjury or illness.
This result in line with WHO (2011)which in support of rehabilitation process inrestoring his/her former state to manageableand controllable state to have independentlife.
H02 : The study revealed that there is asignificant between social workers’performance and the availability ofequipment use by the people with disability.

92
Educational Extracts Vol. IV, Issue 2, July 2016 St. Thomas College of Teacher Education, Pala, Kerala
The LOMAK keyboard as one of theequipment was designed in New Zealandspecifically for persons with disabilities(Sobh, 2007), which revealed in line that thereis significant relationship between socialworkers’ performance and the availability ofequipment to the people with disability.
The World Wide Web consortiumrevealed in line with the need for InternationalStandards for Web Accessibility asequipment for persons with disabilities toperform like normal counterpart and createdthe Web Accessibility Initiative (WAI, 2013).
The Business Disability Forum (BDF),formerly the Employers' Forum on Disability,is a membership organisation of UKbusinesses introduced the membership ofBDF in line with the need for a tool withwhich they could measure the performanceof people with disability on disability year
H03 : There is significant relationshipbetween social workers’ skills imparted onthe learners and fully gain employment ofpeople with disability after rehabilitation.
This is in line with more recent law, theAmericans with Disabilities Act of 1990(ADA), which came into effect in 1992,prohibits private employers, state and localgovernments, employment agencies and laborunions from discriminating against qualifiedindividuals with disabilities in job applicationprocedures, hiring, firing, advancement,compensation, job training, or in the terms,conditions and privileges of employment.
H04 : There is significant relationshipbetween the social workers’ and the parentsthat provide educational needs for the peoplewith disability.
The study confirmed that the people withdisabilities often need a variety of services from
parents, relations, and other communityagencies, such as financial assistance,wheelchairs, and prosthetic services as well astransportation. Also social workers link peoplewith disabilities with community resources forthe provision of educational needs to performexpected job without much dependency.
This is in line with Lesotho, socialworkers in the Department of Social Welfareare revealed that the collaboration withNGOs like World Vision, Care Lesotho andLesotho Red Cross Society that provideassistance to people with disabilities resultto independent life.
RECOMMENDATIONS
Ended by the finding of this study, theresearcher has the followingrecommendations:
The three tiers of governments that isFederal, State and Local governments shouldforestall any unforeseen circumstancescaused by science, disasters, flood, motoraccidents, plane disaster among others so thatnumber of people with disability can bereduced.
There should be adequate modernequipment and room for expansion withrequired materials and personnel who havespecial skills and abilities to train the peoplewith disabilities.
The centres/schools should be reallyfunded by the governments and non-governmental organizations within andoutside the country.
The centres/schools’ curricula shouldinclude the teaching of the totalcommunications that will involve manual andoral aspects.

93
Educational Extracts Vol. IV, Issue 2, July 2016 St. Thomas College of Teacher Education, Pala, Kerala
CONCLUSION
The project gives the importance ofSocial workers in rehabilitating people withdisability as the results of analyzed datacollected during the study. It was becauseof this the following conclusions were drawn:
It is very important to establish socialworker department in our tertiary institutionsin Nigeria in order to improve the life ofpeople with disability.
The study shows that the skills / traininggiven to the people with disability by Socialworkers develop various skills which can improveindependent life of people with disability.
More so, there is need for the government,social workers, policy makers, parents andguidance counselor to work hard in hand toconvince the whole world that these peoplescan perform better despite their disabilities.
REFERENCESArditi & Rosenthal. 1998. "Medicare Vision
Rehabilitation Services Act of 2003 HR 1902IH". Library of Congress.
National Association of Social Workers (2005)U.K. health and Safety Executive.
Bites August 2011 - International organisationsreport on disability. Disabled PersonsAssembly New Zealand. Downloaded fromhttp://www.disabilityreport.com. Retrieved11/12/ 2014.
Donovan 2012. "Economic Model of Disability".Michigan Disability Rights Coalition.Downloaded from www/com.economic/modeldisability. Retrieved 11/10/ 2014.
Myers, J. E.; Sweeny, T. J.; Witmer, J. M. 2000."The wheel of wellness counseling forwellness: A holistic model for treatmentplanning. Journal of Counseling andDevelopment". Journal of Counseling andDevelopment 78: 251–266.
Olkin. 2012. What Psychotherapists ShouldKnow About Disability. Guilford Press..26.
Schwingel, A.; Niti, M. M.; Tang, C.; Ng, T. P.2009. "Continued work employment andvolunteerism and mental well-being of olderadults: Singapore longitudinal ageingstudies". Age and Ageing 38 (5): 531–7.
Smith, T. B. 2012. A New and Emerging Model ofdisability. The Customer Model. White paper.The Pennsylvania State University.
Sobh. 2007. Innovations and AdvancedTechniques in Computer and InformationSciences and Engineering. Springer. 176.
The National Association of Workers. 2005. fromdownloaded from
http://www.socialworkers.org. Retrievev on:8/9/2014.
Tsuinyane, M. 2010: Services offered by theDepartment of Social Welfare (Personalcommunication at the Department of SocialWelfare Offices). Disability from Wikipedia, thefree encyclopedia. Retrieved on: 4/11/2014.
United Nations. 2012. "UN Enable – Promotingthe Rights of Persons with Disabilities"
Visual Impairment, Visual Disability and LegalBlindness". SSDisabilityApplication.com.Web Accessibility Initiative (WAI) - homepage". W3.org."Web Content AccessibilityGuidelines (WCAG) 2.0". W3.org.
Web Accessibility Initiative (2013). Diseaseincidence, prevalence and disability". GlobalBurden of Disease.
Witmer, J. M.; Sweeny, T. J. 1992. "A holistic modelfor wellness and prevention over thelifespan". Journal of Counseling andDevelopment 71: 140–148.
World Health Organization. 2011. Downloadedfrom World report on disability. Retrieved on:6/11/2014.
World Health Organization. 2011.Downloadedfrom Life expectancy at birth. Retrieved on:3/11/2014.
Zastrow, C. 2000. Introduction to Social Workand Social Welfare. Pacific Grove.
94
Educational Extracts Vol. IV, Issue 2, July 2016 St. Thomas College of Teacher Education, Pala, Kerala
EFFECT OF EPISODIC CONCEPTUALIZATIONSTRATERGY ON ACHIEVEMENTIN PHYSICS IN
RELATION TO INTELLIGENCEDr. V P Joshith*
Renjith J S**
AbstractScience results from a process of conceptualization of a subject matter. The task ofthe science teacher is to help student to understand some of the content knowledgeof science. The aim of this study is to find out the impact of episodic conceptualizationstrategy for the enhancement of achievement of secondary school students. The sampleconsists of 80 secondary school students of IX standard. The pre-test and post testequivalent group design was followed for this study. The data was analyzed using ttest. In this episodic conceptualization based Instructional Strategy couldsignificantly enhances the achievement of IX standard students. Traditional methodof teaching could not attribute anything in enhancing the achievement of IX standardstudents. Intelligence does not influence the achievement of IX standard students.There is no interaction between the treatment and intelligence in influencing theachievement of IX standard students.Keywords: Episodic conceptualization strategy, achievement, intelligence, etc.
* Research Guide & Assistant Professor, Department of Education, Central University Of Kerala,Kasargode
** (Ph.D OER Research Scholar) Department of Education, Bharathiar University, Coimbatore
Educational Extracts ISSN 2320-7612
Vol. IV Issue 2 July 2016pp. 94-101
St. Thomas College of Teacher Education, Pala, Kerala, IndiaWebsite: www.stce-pala.info, www.stctepala.orgemail: [email protected]
INTRODUCTION
Science is the system of knowing theuniverse though data collected by observationand controlled experimentation. Science looksfor different kinds of path and relationshipsuch as relationship between different thingsrelationship between the parts of thingsrelationship between the propertiespossessed by several things etc. After
discovering relationships, the scienceformulates statement that describes them.Man is able to conquer time and distancewith the help of science. Science helped totravel in a space beyond the sky. Scienceimproved his life conditions remarkably.Science gave eyes to blind, hearing for deaf,legs to lame. Science improved the qualityand quantity of plants and animals. Thus

95
Educational Extracts Vol. IV, Issue 2, July 2016 St. Thomas College of Teacher Education, Pala, Kerala
science and scientific invention changedman’s whole life by making it costly,comfortable and luxurious. It is changingentire existence of man in important aspectssuch as health, power, communication andtransportation. It helps us to develop scientificattitude in the mind of the learner.
Science results from a process ofconceptualization of a subject matter. Thetask of the science teacher is to help studentto understand some of the content knowledgeof science. Science learning requirespresentation of learning material leading toformation of concepts. So concepts are tobe presented by using a definite strategy likeepisodic conceptualization for increasing thecontent knowledge of the students.
Shulman defined pedagogical contentknowledge as teacher interpretations andtransformations of subject matter knowledgein the context of facilitating student learningproposal several key terms of PCK. (1)Knowledge of representation of subjectmatter, (2) understanding student conceptionsof the subject and the learning and teachingimplications that were associated with thespecific subject matter, (3) generalpedagogical knowledge (4) curriculumknowledge, (5) knowledge educationalcontext, (6) Knowledge of purpose ofeducation. To this conception of PCK, othershave contributed valuable insights on theimportance and relevance of linguistic &cultural characteristic of a diverse studentpopulation.
NEED OF THE STUDY
The call for transforming schools fromteaching basic skills towards schools forthought (Bruer, 1993) seems to a growing
consensus among educators. Researchersand educators worldwide have responded tothat call, investing costly resources in projectswhose primary goal is to enhance studentsthinking. However, a serious impediment towide and successful implementation of manysuch projects is the lack of adequate methods;episodic conceptualization strategy is a newdirection on this area.
If science is poorly taught by teacher orbadly learnt by pupil, then it is just like theburdening mind with dead information. Itgenerates new superstitions. Science is asubject where a teacher must select anappropriate strategy for teaching byinternalizing the knowledge acquired indifferent concepts because this is the onlysubject where the students feel as a remedyto their problems, a leisure that they want tokeep forever and many other things. So theteacher must equip himself with a skill ofanalyzing the concept and with aninstructional strategy as well. Concept helpsto understand the language of science. Thusconcepts have wide applicability in scienceteaching.
“Pedagogical content knowledge is anaccumulation of common element ie,knowledge of subject matter, knowledge ofcurricula, knowledge of Pedagogy. In PCKis knowing what, when and how to teachusing a reservoir of knowledge of goodteaching practice and experience”. Fromresearch, it has become clear that multiplestrategies are necessary to promote teacherlearning. Several review studies revealedthat for strategies aimed at the developmentof teacher knowledge, such as PCK, to besuccessful, the following elements areimportant:
96
Educational Extracts Vol. IV, Issue 2, July 2016 St. Thomas College of Teacher Education, Pala, Kerala
(a) An explicit focus on teachers’knowledge, beliefs and concerns; (b)opportunities for teachers to experiment intheir own practice; (c) collegial co-operationor exchange among teachers; and, (d)sufficient time for changes to occur.
The present study suggests one way foranalyzing the concepts in physics. Theteacher can equip himself with the skill offinding main characteristics, arranging themin a meaningful order. The modules preparedby researcher will help the teacher to establishrapport with the students. The present studywill give innovative ideas and thoughts tocurriculum setter’s and text book writers.
OBJECTIVES1. To prepare Episodic conceptualization
strategy for teaching physics atsecondary level
2. To find out the effectiveness of episodicconceptualization strategy in teachingphysics st secondary level.
3. To compare the effectiveness ofepisodic conceptualization strategy inteaching physics with traditional methodof teaching physics.
4. To study the effect of InstructionalStrategy, Intelligence and theirinteraction on Pedagogical ContentKnowledge by taking Pre-Achievementas covariate.
HYPOTHESIS1. There is no significant difference
between the experimental group andcontrol group in the achievement ofphysics at pretest level
2. There is no significant differencebetween the experimental group and
control group in the achievement ofphysics at posttest level.
3. There is no significant differencebetween the pretest and post test in theachievement in physics for theexperimental group.
4. There is no significant differencebetween the pretest and post test in theachievement in physics for the controlgroup.
5. There is a significant effect ofInstructional Strategy, Intelligence andtheir interaction on Pedagogical ContentKnowledge by taking Pre-Achievementas covariate
SAMPLE
The sample of the study consists of 100students studying under CBSE syllabus atMalappuram. The sample consists of bothboys and girls.
TOOLS USED
The tools used for the study are• Episodic conceptualization strategy• An achievement test
ANALYSIS AND INTERPRETATION
Hypothesis 1
There is no significant differencebetween the experimental group and controlgroup in the achievement of physics at pretestlevel
‘t’ test is applied to test the significanceof difference between the mean achievementtest scores of the experimental group andcontrol group at pretest level

97
Educational Extracts Vol. IV, Issue 2, July 2016 St. Thomas College of Teacher Education, Pala, Kerala
Table 1Mean Achievement score on the experimental group compared with that of the controlgroup at pretest levelGroups N Mean S.D ‘t’ value Level of significance at 0.05 levelExperimental 50 20.23 2.17 0.49 Not significantControl 50 19.90 1.97
Table 2 reveals that the‘t’ value issignificant at 0.01 level. Hence it could beinferred that there is a significant differencebetween the two groups as indicated by themean value, it can be concluded that thestudents of the experimental group faredbetter in achievement test than the studentsof the control group. This again clearly showsthat learning with the help of episodic
Table 1 indicate that the‘t’ value is notsignificant at 0.05 level. The students of theexperimental group do not differ significantlyfrom the students of the control group in themean achievement test scores at pre testlevel.
Hypothesis 2
There is no significant differencebetween the experimental group and controlgroup in the achievement of physics atposttest level.
Table 2Mean Achievement score on the experimental group compared with that of the controlgroup at post test levelGroups N Mean S.D ‘t’ value Level of significance at 0.01 levelExperimental 50 37.50 3.69 15.06 significantControl 50 20.00 5.17
conceptualization strategy will increase theachievement of the students better thanlearning through the conventional method.
Hypothesis 3
There is no significant differencebetween the pretest and post test in theachievement in physics for the experimentalgroup.
Table 3Mean Achievement test scores of pretest compared with that of the post test for theexperimental groupGroups N Mean S.D ‘t’ value Level of significance at 0.01 levelpretest 50 20.23 32.17 20.72 significantPost test 50 37.50 3.69
‘t’ value is applied to test the significanceof the difference between the meanachievement test scores of the pretest withthat of the posttest for the experimental group.
Table 3 indicate that the‘t’ value issignificant at 0.01 level. Hence it could beinferred that there is a significant differencebetween the pretest and post test in the

98
Educational Extracts Vol. IV, Issue 2, July 2016 St. Thomas College of Teacher Education, Pala, Kerala
achievement in physics for the experimentalgroup. The higher mean value in the posttestshows that the students fared better in theposttest than in the pretest. This furthershows that episodic conceptualizationstrategy has helped the students to scoremore in the post test.
Hypothesis 4
There is no significant differencebetween the pretest and post test in theachievement in physics for the controlgroup.
Table 4Mean Achievement test scores of pretest compared with that of the post test for thecontrol groupGroups N Mean S.D ‘t’ value Level of significance at 0.05 levelpretest 50 19.96 1.97 0.032 Not significantPost test 50 20.26 5.17
‘t’ value is applied to test the significanceof the difference between the meanachievement test scores of the pretest withthat of the posttest for the control group
Table 4 indicates that the‘t’ value is notsignificant at 0.05 level. Hence, it could beinferred that there is no significant differencebetween the pretest and post test in theachievement in physics for the control group.
Comparison of adjusted mean scores ofpck of experimental group and controlgroup by takng pre- pck as covariate
The objective was to compare adjustedmean scores of PCK of experimental groupand control group by considering pre-PCKas covariate. The data were analyzed withthe help of One Way ANCOVA byconsidering pre-PCK as covariate. Theresults are given in Table 4.4
Table 5Summary of One Way ANCOVA of PCK by taking pre-PCK as covariateSource of df Sum of Mean Square Fy.x RemarkVariance Squares of Variance
(SSy.x) (MSSy.x)Treatment 1 211.042 211.042 11..913 P<0.01Error 47 832.593 17.715Total 49 1766.880
** Significant at 0.01 level
Table 5 (a)Summary of Adjusted Mean Scores of PCK by taking Pre PCK as CovariateGroup Adjusted Mean Scores of PCK Standard ErrorExperimental Group 27.748 0.845Control Group 23.612 0.845
Note: Pre Test=22.46
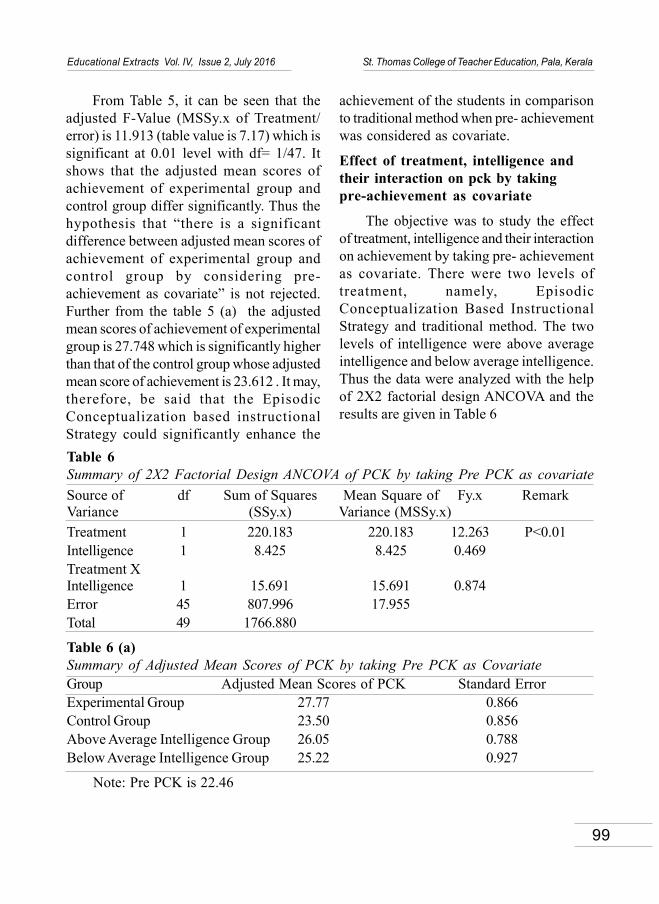
99
Educational Extracts Vol. IV, Issue 2, July 2016 St. Thomas College of Teacher Education, Pala, Kerala
From Table 5, it can be seen that theadjusted F-Value (MSSy.x of Treatment/error) is 11.913 (table value is 7.17) which issignificant at 0.01 level with df= 1/47. Itshows that the adjusted mean scores ofachievement of experimental group andcontrol group differ significantly. Thus thehypothesis that “there is a significantdifference between adjusted mean scores ofachievement of experimental group andcontrol group by considering pre-achievement as covariate” is not rejected.Further from the table 5 (a) the adjustedmean scores of achievement of experimentalgroup is 27.748 which is significantly higherthan that of the control group whose adjustedmean score of achievement is 23.612 . It may,therefore, be said that the EpisodicConceptualization based instructionalStrategy could significantly enhance the
achievement of the students in comparisonto traditional method when pre- achievementwas considered as covariate.
Effect of treatment, intelligence andtheir interaction on pck by takingpre-achievement as covariate
The objective was to study the effectof treatment, intelligence and their interactionon achievement by taking pre- achievementas covariate. There were two levels oftreatment, namely, EpisodicConceptualization Based InstructionalStrategy and traditional method. The twolevels of intelligence were above averageintelligence and below average intelligence.Thus the data were analyzed with the helpof 2X2 factorial design ANCOVA and theresults are given in Table 6
Table 6Summary of 2X2 Factorial Design ANCOVA of PCK by taking Pre PCK as covariateSource of df Sum of Squares Mean Square of Fy.x RemarkVariance (SSy.x) Variance (MSSy.x)Treatment 1 220.183 220.183 12.263 P<0.01Intelligence 1 8.425 8.425 0.469Treatment XIntelligence 1 15.691 15.691 0.874Error 45 807.996 17.955Total 49 1766.880
Table 6 (a)Summary of Adjusted Mean Scores of PCK by taking Pre PCK as CovariateGroup Adjusted Mean Scores of PCK Standard ErrorExperimental Group 27.77 0.866Control Group 23.50 0.856Above Average Intelligence Group 26.05 0.788Below Average Intelligence Group 25.22 0.927
Note: Pre PCK is 22.46

100
Educational Extracts Vol. IV, Issue 2, July 2016 St. Thomas College of Teacher Education, Pala, Kerala
Effect of Treatment on PCK by takingPre- achievement as covariate
From the table 6(a), it can be seen thatthe adjusted F- value is 12.263 (table valueis 7.23) which is significant at 0.01 level withdf=1/45. It shows that the adjusted meanscores of achievement of Episodicconceptualization based instructionalStrategy and traditional method differsignificantly. So there was a significant effectof episodic conceptualization basedinstructional Strategy on achievement.Further the from the table 6 (a), adjustedmean score of achievement of experimentalgroup is 27.77 which is significantly higherthan that of control group whose adjustedmean score of achievement is 23.50 . It may,therefore, be said that the episodicconceptualization based instructional strategycould significantly enhance achievement ofthe students in comparison to traditionalmethod when pre-achievement wasconsidered as covariate.
Effect of Intelligence on PCK bytaking Pre-achievement as covariate
From Table 6(a), it can also be seen thatthe adjusted F-Value for intelligence is 0.469(table value is 4.06 at 0.05 level) which isnot significant at 0.05 level with df=1/45. Itmeans that the adjusted mean scores ofachievement of students belonging to aboveaverage intelligence and below averageintelligence groups do not differ significantly.So there was no significant effect ofintelligence on achievement of students whenpre-achievement was taken as covariate.Further from the table 6(a) the adjustedmean score of achievement of studentsbelonging to above average intelligence groupis 26.05 which is not significantly higher thanthat of below average intelligence groupwhere adjusted mean score of achievement
is 25.22. It may, therefore, be said that withthe increase in intelligence, do not affect theachievement of Prospective teachers whenpre-achievement was taken as covariate.Thus Episodic Conceptualization BasedInstructional Strategy can be applied to anygroup of prospective teachers irrespectiveof their difference in intelligence.
Effect of interaction betweenTreatment and Intelligence on PCK bytaking Pre- achievement as covariate
From the table 6(a), it can be seen thatthe adjusted F-Value for interaction betweentreatment and intelligence is 0.874 which isnot significant. It means that adjusted meanscore of achievement of students belongingto above average and below averageintelligence when taught through treatmentand traditional Method did not differsignificantly when groups were matched inrespect of pre-achievement. So there wasno significant effect of interaction betweentreatment and intelligence on achievementof students when pre-achievement wasconsidered as covariate. Thus, the hypothesisthat “there is a significant effect of interactionbetween treatment and intelligence onachievement by considering pre-achievementas covariate” is rejected. It may, therefore,be said that the achievement was found tobe independent of interaction betweentreatment and intelligence when pre-achievement was taken as covariate
Main Effect and Interaction EffectFrom the above analysis it seen that
only one of the main effect is significant at0.01level. That is the F- ratio for the effectof treatment, which is the influence of theEpisodic Conceptualization BasedInstructional Strategy is 12.263 is significantat 0.01 levels and the other main effectintelligence which is not significant at 0.05

101
Educational Extracts Vol. IV, Issue 2, July 2016 St. Thomas College of Teacher Education, Pala, Kerala
level (F-ratio= 0.469). The interaction effectF-ratio=0.874, of treatment and intelligenceis not significant. The increase in F-ratio ofachievement from 11.913 to 12.263 is due tothe interaction of intelligence. This indicatesthat in the above experiment the main effectlike Episodic Conceptualization BasedInstructional Strategy contribute positively forenhancing achievement. Whereas the othermain effect intelligence and interactionbetween treatment and intelligence have nosignificant effect on achievement ofprospective teachers. So the developedpackage can be applied to any group ofprospective teachers without consideringtheir difference in the level of intelligencefor enhancing their Pedagogical ContentKnowledge
CONCLUSION• There is no significant difference
between the experimental group andcontrol group in the achievement ofphysics at pretest level
• There is significant difference betweenthe experimental group and controlgroup in the achievement of physics atposttest level. The students learning withthe help of episodic conceptualizationstrategy fared better in science than thestudents learning through theconventional method.
• There is significant difference betweenthe pretest and post test in theachievement in physics for theexperimental group. This shows thatepisodic conceptualization strategy hashelped the students to score more marksin the posttest.
• There is no significant differencebetween the pretest and post test in theachievement in physics for the controlgroup. This shows that conventionalteaching method of teaching will not help
the students to score more marks in thepost test.
• Intelligence does not influence theachievement of IX standard students.
• There is no interaction between thetreatment and intelligence in influencingthe achievement of IX standard students
EDUCATIONAL SIGNIFICANCE• Episodic conceptualization strategy is
effective in developing contentknowledge and achievement amongstudents.
• Topics are to be presented by using aepisodic conceptualization strategy sothat knowledge of students can beenhanced.
• Previous knowledge is given moreimportance while teaching topic inphysics.
REFERENCESAusubel, D. P. (1968). Educational Psychology A
Cognitive View. New York: Holt, RinehartWintson.
Best, J.W., &Khan, J.V. (2005). Research ineducation (9th ed.).New Delhi: Prentice –hallof India.
Bhattacharyya, & Dipak, Kumar. (2006). ResearchMethodology. New Delhi: Excel Books.
Charles, C.M. (1998).Introduction to EducationalResearch.NewYork: Longman.
Ebel, R.L. (1972). Essentials of EducationalMeasurement. Engel Wood Cliffs: N, J.Crencice Hall.
Garret, H .E. (2008). Statistics in Psychology andEducation. New Delhi: Surjeet Publication.
Garret, H.E. (1961). Statistics in Psychology andEducation. Bombay: Vakils, Feffer and Simons,Ltd.
Kothari, C.R. (2004).Research Methodology;Methods and Techniques.NewDelhi: NewageInternational Publications.

102
Educational Extracts Vol. IV, Issue 2, July 2016 St. Thomas College of Teacher Education, Pala, Kerala
A STUDY ON HEALTH TOURISM AND AYURVEDA INKERALA WITH SPECIAL REFERENCE TO
WAYANAD DISTRICTSoorya Thankachan*
AbstractTourism industry acts as a powerful agent of both economic and social change.Healthtourism in Kerala is more specifically known for the provision of health care withtraditional Ayurvedic medicine.This paper is attempted for a vivid and detailedstudy of health tourism and Ayurveda in the district of Wayanad and its attractions.Through this study find out majority of local tourists (86.6 percent) and foreigntourists (60 percent) had opinion that the treatment packages in the health carecenters were excellent. On the other hand, employee’s services of the health carecenters should be improved. And also find it, majority of local tourists (80 percent)and foreign tourists (86.6 percent) will prefer to visit the same health care centre forthe next time also.Key Words: Health Tourism, Ayurveda, Wayanad District, etc.
* Assistant Professor, Department of Commerce, Don Bosco Arts & Science College,Angadikadavu, Kannur – 670706
Educational Extracts ISSN 2320-7612
Vol. IV Issue 2 July 2016pp. 102-107
St. Thomas College of Teacher Education, Pala, Kerala, IndiaWebsite: www.stce-pala.info, www.stctepala.orgemail: [email protected]
INTRODUCTION
Tourism has emerged as a key sectorof the world economy and has become amajor workforce in global trade. Tourismindustry acts as a powerful agent of botheconomic and social change. It stimulatesemployment and investment, modifieseconomic structure and makes positivecontributions towards balance of payments.Tourism creates direct, indirect and inducedemployment. It produces a vast spectrum ofemployment from highly qualified and trainedmanagers of five-star hotels to room boys,
sales girls, and artisans. India as a touristdestination exercises immense attractionfrom various angles. Tourism has emergedas a major industry of the Indian economy,contributing substantially to foreignexchange earnings and serving as a potentialgenerator of employment opportunities.
The concept of health tourism is not anew one. The first recorded instance ofhealth tourism dates back to thousands ofyears when Greek pilgrims travelled fromall over the Mediterranean to the smallterritory in the Saronic Gulf, called Epidauria.

103
Educational Extracts Vol. IV, Issue 2, July 2016 St. Thomas College of Teacher Education, Pala, Kerala
The popularity of Ayurveda increases thenumber of health tourists. Now healthtourism is a high-tech healing of the privatehealth care sector as a tourist attraction.Ayurvedic care in hospitality sector got widepublicity thereafter. Health tourism in Keralais more specifically known for the provisionof health care with traditional Ayurvedicmedicine. For foreign tourists, it is a travel toa recuperative climate with naturaltherapeutic resources. The important Indiansystems of medicine practiced in Kerala areAyurveda, Modern medicine, Homoeopathy,Siddha, Naturopathy and Unani. Yoga andother meditation therapies have gainedreputation in Western countries as aneffective method of curing mental as well asphysical ailments. Apart from all these, thetraveller who visits the State is also lookingfor a holistic and wellness-healing, musictherapy and herbal therapy which are gainingpopularity among tourists. Of these,Ayurveda has the dominant role in attractinghealth tourists to the State.
SCOPE OF THE STUDY
Kerala pioneered in the field of healthtourism through Ayurveda. The governmention taps the State’s potential for health tourismthrough several steps. The State tourismdepartment and the private tourism sectorput up a strenuous effort to promote healthin a big way which has resulted in a profuseincrease of visitors in to the State.
The present study attempts to highlighton the type of services rendered by theAyurvedic centres, infrastructure facilities,different tourists’ packages and its tariff andalso the perception of tourists towards theseservices rendered by Ayurvedic centres. This
study would be much beneficial to thepotential tourist to know about variousservices and infrastructure facilities for theirtreatment. The study is restricted to Wayanaddistrict and so results cannot be generalisedthroughout the State.
OBJECTIVES• To study the services rendered by the
Ayurvedic Health Care Centres inWayanad District.
• To study the satisfaction level of thecustomers in the Ayurvedic Health CareCentres in the District.
METHODOLOGY
The research design adopted for thestudy is exploratory in nature. For conductingthe study, both primary and secondary datawere used. The secondary data for the studywere collected from journals such as Sajobs,Tourism India, and News Papers andpublished materials of Tourism Departmentof Government of Kerala.
• Sampling
For collecting primary data, samples of45 tourists were selected on the basis ofconvenience from Health Care Centres inWayanad district during 2015- 2016.
• Sources of data
The primary data and secondary datawere used for the study. Primary data wascollected from the customers in the selectedHealth Care Centres. Secondary data wascollected from journals, newspapers, books,internet, brochures of the sample unit etc.
• Tools of data collection
A structured questionnaire was used forcollecting data from tourist and unstructured

104
Educational Extracts Vol. IV, Issue 2, July 2016 St. Thomas College of Teacher Education, Pala, Kerala
interview schedule was used for collectingdata from officials in the health care centres.Data was collected on various accepts suchas the countries represented by the patients,speciality treatment, pricing, marketingtechniques, competition factors, touristdestination etc.
• Data analysis
The data collected was analysed throughusing tables and simple mathematical andstatistical like percentages.
Analysis and Interpretations
• Opinion of respondents about theServices of Health Care Centre
In order to promote the health tourismthe Health Care Centers and its services havevital role. To appear the flood of visitorsAyurvedic resorts has been mushroomingacross the landscape of Kerala. Yet thereare problems, the numerous massage centrescoming up both inside and outside the State,on the perfect of Ayurveda could tarnish theimage of his glorious system. Many of thesecentres are not supported by good serviceslike professional physicians or qualifiedtherapists, having better dealings ofemployees, best hospitality, effectivetreatment packages, good restaurant facilitiesand accommodation. The uncontrolledcommercialization of Ayurveda Centerswould spoil the name of Ayurveda. In thispoint of view, an analysis about services ofselected health care centres help to revealthe present reality of the centres. An analysisregarding opinion of respondents aboutservices is shown in table.
As per the table ,it reveals that amongthe respondents received on treatment
packages, it is interesting to note that (86.6percent of local tourists and 60 percent offoreign tourists) conveyed that they hadexcellent opinion on treatment packages.Only 6.7 percent of local tourists felt justsatisfactory only.
The response of respondents regardingqualified doctor’s services is found that (73.3percent of local tourists and 66.6 percent offoreign tourists) had excellent opinion. (13.3percent of local tourists and 20 percent offoreign tourists) were opinion that thedoctor’s service of the center was good. Verynominal percent of both 13.3 percent of localand foreign tourists thought that the doctor’sservice was only satisfactory.
From the table found that (80 percentof local tourists and 73.3 percent of foreigntourists) opined that the service of therapistswas excellent. (20 percent of local touristsand 6.66 percent of foreign tourists) opinedthat the service of therapists was good. Andremaining (20 percent of foreign tourists)opinion that the service of therapists issatisfactory only.
The table shows (33.3 percent of localtourists and 53.3 percent of foreign tourists)opined that the employee’s service wasexcellent. (13.3 percent of local tourists and40 percent of foreign tourists) opined thatthe service of employees was good.Remaining (53.3 percent of local tourists and6.66 percent of foreign tourists) reveals thatthe employee’s service was only satisfactory.
The response of respondents regardinghospitality it is found that (63.3 percent oflocal tourists and 80 percent of foreigntourists) had excellent opinion. Majority ofthe local tourists (23.4 percent as well as only
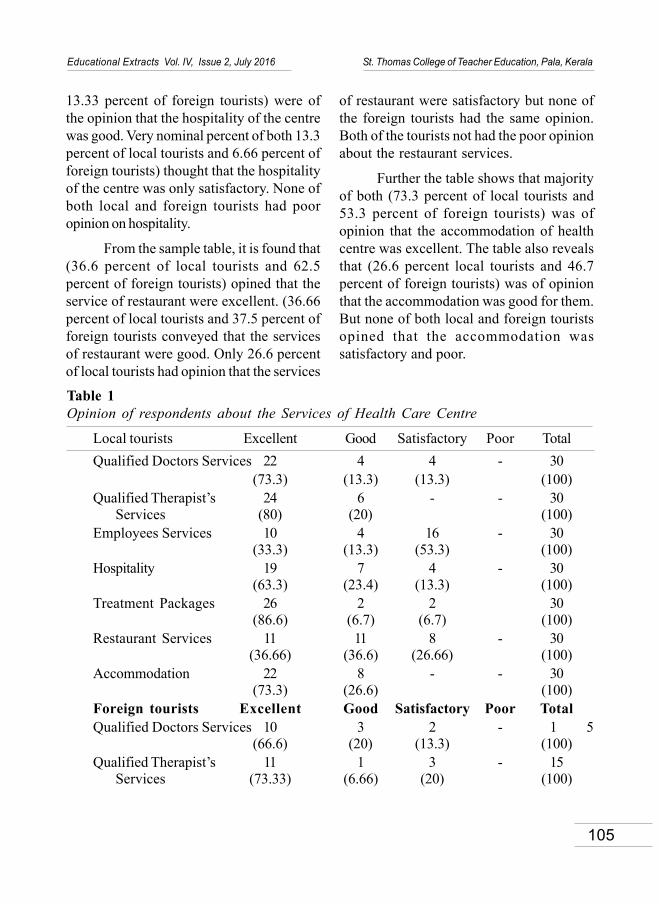
105
Educational Extracts Vol. IV, Issue 2, July 2016 St. Thomas College of Teacher Education, Pala, Kerala
13.33 percent of foreign tourists) were ofthe opinion that the hospitality of the centrewas good. Very nominal percent of both 13.3percent of local tourists and 6.66 percent offoreign tourists) thought that the hospitalityof the centre was only satisfactory. None ofboth local and foreign tourists had pooropinion on hospitality.
From the sample table, it is found that(36.6 percent of local tourists and 62.5percent of foreign tourists) opined that theservice of restaurant were excellent. (36.66percent of local tourists and 37.5 percent offoreign tourists conveyed that the servicesof restaurant were good. Only 26.6 percentof local tourists had opinion that the services
of restaurant were satisfactory but none ofthe foreign tourists had the same opinion.Both of the tourists not had the poor opinionabout the restaurant services.
Further the table shows that majorityof both (73.3 percent of local tourists and53.3 percent of foreign tourists) was ofopinion that the accommodation of healthcentre was excellent. The table also revealsthat (26.6 percent local tourists and 46.7percent of foreign tourists) was of opinionthat the accommodation was good for them.But none of both local and foreign touristsopined that the accommodation wassatisfactory and poor.
Table 1Opinion of respondents about the Services of Health Care Centre
Local tourists Excellent Good Satisfactory Poor TotalQualified Doctors Services 22 4 4 - 30
(73.3) (13.3) (13.3) (100)Qualified Therapist’s 24 6 - - 30
Services (80) (20) (100)Employees Services 10 4 16 - 30
(33.3) (13.3) (53.3) (100)Hospitality 19 7 4 - 30
(63.3) (23.4) (13.3) (100)Treatment Packages 26 2 2 30
(86.6) (6.7) (6.7) (100)Restaurant Services 11 11 8 - 30
(36.66) (36.6) (26.66) (100)Accommodation 22 8 - - 30
(73.3) (26.6) (100)Foreign tourists Excellent Good Satisfactory Poor TotalQualified Doctors Services 10 3 2 - 1 5
(66.6) (20) (13.3) (100)Qualified Therapist’s 11 1 3 - 15
Services (73.33) (6.66) (20) (100)
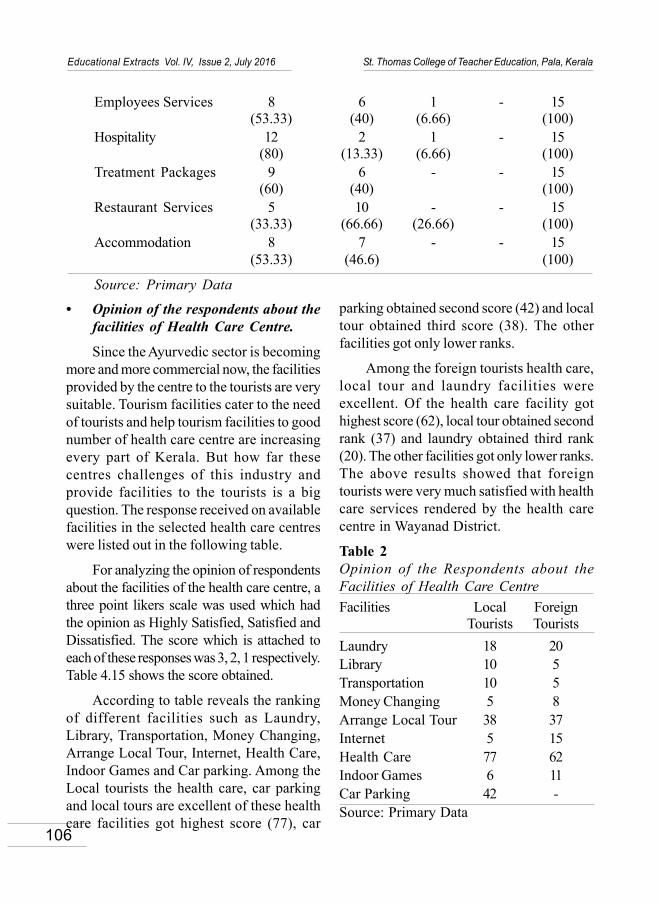
106
Educational Extracts Vol. IV, Issue 2, July 2016 St. Thomas College of Teacher Education, Pala, Kerala
Employees Services 8 6 1 - 15(53.33) (40) (6.66) (100)
Hospitality 12 2 1 - 15(80) (13.33) (6.66) (100)
Treatment Packages 9 6 - - 15(60) (40) (100)
Restaurant Services 5 10 - - 15(33.33) (66.66) (26.66) (100)
Accommodation 8 7 - - 15(53.33) (46.6) (100)
Source: Primary Data
• Opinion of the respondents about thefacilities of Health Care Centre.
Since the Ayurvedic sector is becomingmore and more commercial now, the facilitiesprovided by the centre to the tourists are verysuitable. Tourism facilities cater to the needof tourists and help tourism facilities to goodnumber of health care centre are increasingevery part of Kerala. But how far thesecentres challenges of this industry andprovide facilities to the tourists is a bigquestion. The response received on availablefacilities in the selected health care centreswere listed out in the following table.
For analyzing the opinion of respondentsabout the facilities of the health care centre, athree point likers scale was used which hadthe opinion as Highly Satisfied, Satisfied andDissatisfied. The score which is attached toeach of these responses was 3, 2, 1 respectively.Table 4.15 shows the score obtained.
According to table reveals the rankingof different facilities such as Laundry,Library, Transportation, Money Changing,Arrange Local Tour, Internet, Health Care,Indoor Games and Car parking. Among theLocal tourists the health care, car parkingand local tours are excellent of these healthcare facilities got highest score (77), car
parking obtained second score (42) and localtour obtained third score (38). The otherfacilities got only lower ranks.
Among the foreign tourists health care,local tour and laundry facilities wereexcellent. Of the health care facility gothighest score (62), local tour obtained secondrank (37) and laundry obtained third rank(20). The other facilities got only lower ranks.The above results showed that foreigntourists were very much satisfied with healthcare services rendered by the health carecentre in Wayanad District.
Table 2Opinion of the Respondents about theFacilities of Health Care CentreFacilities Local Foreign
Tourists TouristsLaundry 18 20Library 10 5Transportation 10 5Money Changing 5 8Arrange Local Tour 38 37Internet 5 15Health Care 77 62Indoor Games 6 11Car Parking 42 -Source: Primary Data
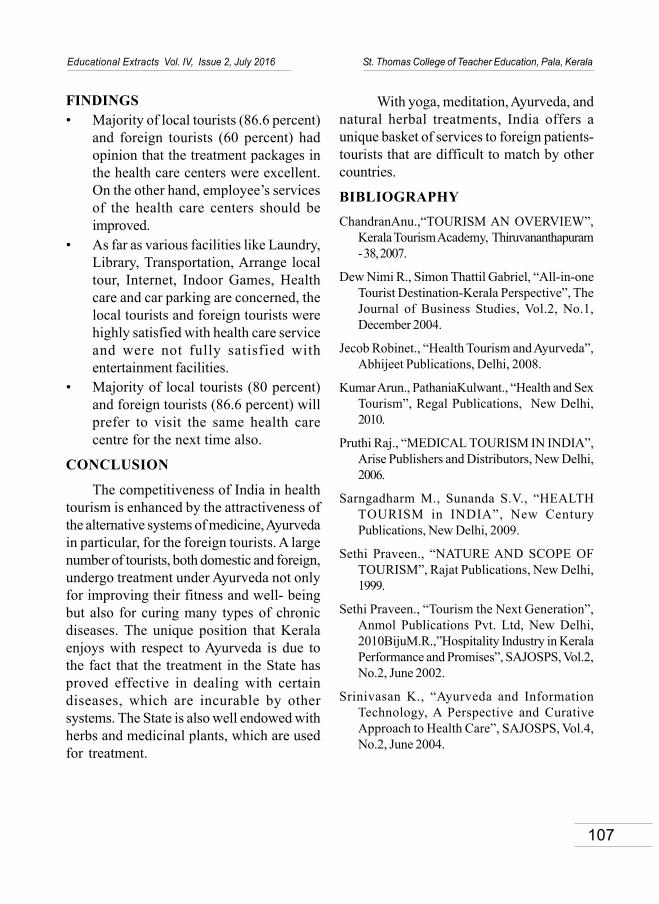
107
Educational Extracts Vol. IV, Issue 2, July 2016 St. Thomas College of Teacher Education, Pala, Kerala
FINDINGS• Majority of local tourists (86.6 percent)
and foreign tourists (60 percent) hadopinion that the treatment packages inthe health care centers were excellent.On the other hand, employee’s servicesof the health care centers should beimproved.
• As far as various facilities like Laundry,Library, Transportation, Arrange localtour, Internet, Indoor Games, Healthcare and car parking are concerned, thelocal tourists and foreign tourists werehighly satisfied with health care serviceand were not fully satisfied withentertainment facilities.
• Majority of local tourists (80 percent)and foreign tourists (86.6 percent) willprefer to visit the same health carecentre for the next time also.
CONCLUSION
The competitiveness of India in healthtourism is enhanced by the attractiveness ofthe alternative systems of medicine, Ayurvedain particular, for the foreign tourists. A largenumber of tourists, both domestic and foreign,undergo treatment under Ayurveda not onlyfor improving their fitness and well- beingbut also for curing many types of chronicdiseases. The unique position that Keralaenjoys with respect to Ayurveda is due tothe fact that the treatment in the State hasproved effective in dealing with certaindiseases, which are incurable by othersystems. The State is also well endowed withherbs and medicinal plants, which are usedfor treatment.
With yoga, meditation, Ayurveda, andnatural herbal treatments, India offers aunique basket of services to foreign patients-tourists that are difficult to match by othercountries.
BIBLIOGRAPHYChandranAnu.,“TOURISM AN OVERVIEW”,
Kerala Tourism Academy, Thiruvananthapuram- 38, 2007.
Dew Nimi R., Simon Thattil Gabriel, “All-in-oneTourist Destination-Kerala Perspective”, TheJournal of Business Studies, Vol.2, No.1,December 2004.
Jecob Robinet., “Health Tourism and Ayurveda”,Abhijeet Publications, Delhi, 2008.
Kumar Arun., PathaniaKulwant., “Health and SexTourism”, Regal Publications, New Delhi,2010.
Pruthi Raj., “MEDICAL TOURISM IN INDIA”,Arise Publishers and Distributors, New Delhi,2006.
Sarngadharm M., Sunanda S.V., “HEALTHTOURISM in INDIA”, New CenturyPublications, New Delhi, 2009.
Sethi Praveen., “NATURE AND SCOPE OFTOURISM”, Rajat Publications, New Delhi,1999.
Sethi Praveen., “Tourism the Next Generation”,Anmol Publications Pvt. Ltd, New Delhi,2010BijuM.R.,”Hospitality Industry in KeralaPerformance and Promises”, SAJOSPS, Vol.2,No.2, June 2002.
Srinivasan K., “Ayurveda and InformationTechnology, A Perspective and CurativeApproach to Health Care”, SAJOSPS, Vol.4,No.2, June 2004.

108
Educational Extracts Vol. IV, Issue 2, July 2016 St. Thomas College of Teacher Education, Pala, Kerala
ACQUIRING VOCATIONAL AND TECHNICAL SKILLSUSING ICT WITH MATHEMATICS AS TOOLS
Asifat Shuaib Akintunde*
AbstractThe rapid technological changes in the 21st century pose challenges to educationand employment sectors. The new labour market demands have caused manygraduates with various certificates to be unemployed. The massive rate ofunemployment and the changing face of the economic, social, political, labour marketworldwide have led to new education reforms/policies with emphasis on vocationaltechnical education (VTE) geared towards helping the youths and adults to be self-dependent. This research work therefore, examined how information andcommunication technology with mathematics can be use to acquire vocational skill.The instrument used for the research was a Likert’s scale structured questionnaire.The data gathered from the study was analysed using bar-chart and Chi-squarestatistical analyses.Keywords: VTE, ICT, NRCCTE, Mathematics, Acquisition, Computer Software, etc.
* Department of Computer Science, School of Science, Federal College of Education (Special),Oyo, Oyo State, Nigeria
Educational Extracts ISSN 2320-7612
Vol. IV Issue 2 July 2016pp. 108-118
St. Thomas College of Teacher Education, Pala, Kerala, IndiaWebsite: www.stce-pala.info, www.stctepala.orgemail: [email protected]
Introduction
The education reforms/policies of 1970sand 1980s which focused more on theacquisition of certificates instead of theneeded vocational skills have caused manyNigerian youths and adults to move into theeducation industry in pursuit of certificates.As a result of this, the education industriesgrew rapidly in size in late 1970s and 80s.The growth, according to Teboho (2000) citedby Okolocha (2012), stated that the educationsystem of Nigeria and some other developing
counties are still far from being ready forthe challenges of preparing students for thecontemporary global world.
The rapid technological changes in the21st century pose challenges to educationand employment sectors. The new labourmarket demands have caused manygraduates with various certificates to beunemployed. The massive rate ofunemployment and the changing face of theeconomic, social, political, labour marketworldwide have led to new education

109
Educational Extracts Vol. IV, Issue 2, July 2016 St. Thomas College of Teacher Education, Pala, Kerala
reforms/policies with emphasis on vocationaltechnical education (VTE) geared towardshelping the youths and adults to be self-dependent. Cinterfor and Ilo (2006) cited byOkolocha (2012) stated that VTE can be atool to counteract at least in part, the harmfuleffect of unemployment by promoting greaterjob turnover and guarding against the risksof obsolescence.
The use of Information andCommunication Technology is so prevalentin contemporary Nigeria that any educationalprogramme or course of study that is relatedto skill acquisition must embrace it alongsidewith the knowledge of Mathematics to remainviable. ICT is a recent technology in Nigeriaaimed at improving the learning process inskill acquisition. It deals with the use ofelectronic computers and computer softwareto convert, store, and protect; process,transmit, and securely retrieve information.ICT devices are applicable to all aspect ofhuman endeavour such as Education, Health,Politics, Library, skill acquisition and manymore to mention but a few. It has changedthe environment in which students aredeveloped, impacted, acquire skills and learnin schools. ICT married with mathematicspresents an entirely new learning environmentfor students, thus providing advance skills tobe successful in skill acquisition and otherfield of studies. One of the major purposesof ICT is just in the development of human-mental resources to produce new knowledge.The importance of information andcommunication technology (ICT) withMathematics in skill acquisition isacknowledged in the policy documents ofmany countries.
Statement of the Problem
The condition of present day living inNigeria characterized by unemployment, badleadership, depressed, economy, poormanagement of resource, complexity andinterdependence, hunger, low income earningand increased in health problems as well asdwellings resource call attention to the needfor enhanced levels of life-long skills toachieve personal fulfilment and quality of life.
In this age of massive discontinuities andaccelerating changes ,vocational andtechnical education as an integral body ofvarious discipline that incorporate variousarea of skills acquisition ways of enhancingskill acquisition. This study therefore intendsto examine the place of information andcommunication Technology married withmathematics in promoting skill acquisition isvocational and Technical Education.
Purpose of the Study
The essence of this study is to examinethe extent at which Information andCommunication Technology withMathematics as a course of study in higherinstitution of learning promote skill acquisitionin Vocational and Technical Education inNigeria.
Significance of the Study
Several related research has beenconducted in this area as it affect the skillacquisition by the student in higher institutionof learning. The result of this work willtherefore be significant in the following ways:
It will help facilitators to adopt theintervention of ICT with knowledge ofMathematics in skill acquisition in VTE

110
Educational Extracts Vol. IV, Issue 2, July 2016 St. Thomas College of Teacher Education, Pala, Kerala
As a result of the above point, theeducational achievement of the student in thearea of skill acquisition will be improved.
It will also empower the young graduateto stand on their own rather than looking forjob that is not ready.
On the part of the Government, havingunrest mind on how to coop with theunemployed young graduate will be reduce
Research Questions
The following research questions wereraised for the study:
Would the integration of ICT inVocational and Technical Educationalpromote or foster skill acquisition?
Would the teaching of Mathematics inVocational Education promote or foster skillacquisition?
Are there problems with VTE withmathematics when it comes to skillacquisition?
Do Government have positive attitudetoward VTE in Nigeria?
Research Hypotheses:
The following hypotheses were testedin this research at a significant level of 0.05:
Ho1: The use and knowledge of ICTmakes no significant impact in promoting skillacquisition in VTE.
Ho2: The knowledge of Mathematicsdoes not enhance and promote skill acquisitionin VTE.
H03: There are no significant problemsencountered while using Mathematics as atool to promote skill acquisition in VTE.
H04: Government has no positive attitudetowards VTE in Nigeria.
Literature Review
ICT according to Ogunlaja (2013), canbe explained to be the application of thebranch of knowledge concerned with appliedsciences for the practical purpose ofprocessing data or raw facts accurately andtimely into a particular sequence of symbols,letters, codes and signals to influencebehaviours, decisions, and outcomes ofevents, and the sending and receiving of thisthrough the use several media or computerrelated facilities and gadgets in a timely,efficient and effective manner. This couldinvolve the use of media or computer relateddevices such as computer systems in itstotality, networking devices, audio-visualdevices and gadgets, and detective &signalling gadgets. It is important to note thatsome of this devices and gadget may not bepurely computer based and as a result maybe relations with other field of knowledge.
Mathematics according toWikipedia.Org is a mental activity whichconsists carrying out, one after the other,those mental constructions which areinductive and effective: meaning that bycombining fundamental ideas, one reaches adefinite result. It is also seen as themanipulation of the meaningless symbols ofa first-order language according to explicit,syntactical rules to emphasize patterns,orders, or structures. It is perceived that theknowledge of some aspects of Mathematicssuch as Trigonometry, Angles & Bearing,Construction and many more but to mentiona few would play a significant role inpromoting skill acquisition in VTE alongsidewith the knowledge and use of ICT.
111
Educational Extracts Vol. IV, Issue 2, July 2016 St. Thomas College of Teacher Education, Pala, Kerala
VTE as an aspect of Education isrevolved around helping learners to acquireskills – both creative and technical. Suchskills acquired are exhibited by theperceptuomotor sense of the body. It is acommon experience that in learning a newskill one goes through phases in whichperceptual and motor aspect of the activityseem to be discordant (Ricardo, Molly andBohdan; 2013).Ricardo et al (2013) furthertouted that the transition from discordancebetween perceptual and motor aspects totheir integration is common to all learning;that is, perceptuomotor is a milestone forfluency in any field. This position of theirsdoes not exclude the area of skill acquisitionin VTE.
Available research has found few clearexamples of ICT contributing to improvedstudent outcomes, with the most significantresults indicating that outcomes were nodifferent from those achieved in traditionalsettings (Brennan et al, 2001: 36). However,there are many documented examples ofpositive learning outcomes and benefits thathave resulted from the use of ICT thatillustrating the potential of online learning anddelivery.
Labour market trends indicate that therewill be significant growth in work based onadvanced skills that include ICT-relatedcompetency (DEWR, 2005).Flexible deliveryof VTE is regarded as a significant means ofaccelerating a country’s transition to theinformation economy (Kilpatrick & Bound,2003: 10 and Education Network AustraliaVTE Advisory Group, 2000). The importanceof lifelong learning for all age groups has beenseen as increasingly critical in making thistransition effective (Kearns, 2004).
The research carried out by RambollManagement for the European Commission,DG Education and Culture in 2004,theanalysis of telephone interviews, case studiesand desk research shows that ICT createsroom for flexibility, new learning methods,opportunities for furnishing students withreal-life work skills, savings in time andmoney, the integration of theory and practiceand attracting students. Studies also indicatethat technology can accelerate, enrich, anddeepen basic skills; motivate and engagestudent learning; helps relate academics tothe practices of today’s’ workforce;strengthens teaching; increase the economicviability of tomorrows’ workers; contributesto school change; and connects schools tothe real world (Schacter, 1999).
An effective use of ICT in VTE schoolscan have an immediate positive impact onthe schools’ learning environments such as,by creating more dynamic interactionbetween students and teachers, increasingcollaboration and team working problem-solving activities, stimulating creativity in bothstudents and teachers, and helping studentsto control and monitor their own learning.Furthermore, successful use of ICT inschools can help students to acquire anddevelop skills; both specific to ICT and moregenerally, that will be useful for them in theirfuture academic and professional lives(OECD, 2005).
The National Research Centre forCareer and Technical Education (NRCCTE,2005) cited by Achieve (2012)in theirresearch tested several models for integratingmath in VTE, and several of theseapproaches have shown a positive impact onstudent learning of new skills in VTE. The

112
Educational Extracts Vol. IV, Issue 2, July 2016 St. Thomas College of Teacher Education, Pala, Kerala
Math-in-VTE research study tested a modelof curriculum integration to improve VTEstudents’ mathematical understanding. In thismodel, VTE teachers from agriculture, auto-technology, business/marketing, health andinformation technology programs were eachpaired with a math teacher from his/herregion. During the school year, the VTE-mathteacher teams met for a total of 10 days tolearn the process of the Math-in-VTEintegration. Teachers identified the mathcontent that was embedded in the VTEcurriculum through a curriculum mappingprocess. Then the VTE and math teachersdeveloped math-enhanced lessons thatbrought out the embedded content and helpedclarify how this math matched up withconcepts that were taught in the traditionalVTE classroom.
Betz (1978) found that mathematicsanxiety might be a critical factor in thevocational choice of students, implying thatinsufficient knowledge of Mathematics maydirectly or indirectly affect the acquisition ofsome skills in VTE. Mathematics is arequirement for a wide range of collegemajors and occupations. Therefore,according to research, the amount ofmathematics taken in high school and collegedetermines a student's range of careeroptions (Lent et al., 1993).
Methodology
The research was carried out using aqualitative (post-modern perspective)approach as it seeks to prove the impact ICTmarried with Mathematics would make inpromoting and fostering skill acquisition inVTE. It was quantitative since the researchwas based on collecting and analysingnumerical data; it concentrated on measuring
the response to a graduated scale in termsof frequency; and of course, was intendedto be detailed and structured, so results canbe easily collated and presented statistically.The research followed a descriptive surveydesign. The method allows the researcherto have a vivid examination on how ICT withMathematics can be used to promote skillacquisition in VTE in Nigeria. The populationof the study comprised of 100 respondentsincluding almost all the fields in the area ofVTE, as they would be able to provideaccurate information needed by theresearcher.
The instrument used was a Likert’s scalestructured questionnaire designed by theresearcher, and was given to professionalsin the field of Mathematics, ICT, and VTErespectively for validation of the constructand content. The instrument administrationwas carried out by the researcher during theworking hour and was collected the sameday. The data gathered from the study wasanalysed using bar-chart and Chi-squarestatistical analyses.
Data Analysis and Presentation ofResults
This aspect in research report willdepend on what has been stated on the studymethodology. Analysis is the breaking downand ordering of data into meaningful groups.The results of this research are presented inrelation to the hypothesis tested:
The bar-charts below shows theresponse of the respondents to aspects ofMathematics and ICT that was consideredby them to be of significance if ICT marriedMathematics would be used to promote andfoster skill acquisition in VTE.

113
Educational Extracts Vol. IV, Issue 2, July 2016 St. Thomas College of Teacher Education, Pala, Kerala
Research Question One: Would theintegration of ICT in Vocational andTechnical Educational promotes or foster skillacquisition.
Table 1 Levels of Integration of ICT in VTE forpromotion of skill acquisitionS/N A D TOTAL1. 80 20 1002. 75 25 1003. 60 40 1004. 90 10 1005. 85 15 1006. 62 38 1007. 50 50 1008. 70 30 1009. 60 40 10010. 98 02 100TOTAL 730 270 1000
From the table above, the percentage iscalculated and arrived at percentage ofcorrespondents that agreed and agreed onthe item as shown on the table.
Hypothesis Testing
Ho1: The use and knowledge of ICTmakes no significant impact in promoting skillacquisition in VTE.
H1: The use and knowledge of ICTmakes significant impact in promoting skillacquisition in VTE.
Table 2Decision TableGROUP NO α-level Degree of freedom χ2tab χ2cal DecisionAGREED 730 0.05 09 16.919 80.9618 Reject the null
hypothesis andaccept thealternative
DISAGREED 270 hypothesisCritical value 0.05
Table I indicate that, the computed X0tabratio at the degree of freedom - 09 is 16.919and less than the X2cal which is 80.916 whichis significant. It means that, the nullhypothesis which says that the use andknowledge of ICT makes no significantimpact in promoting skill acquisition in VTE.
Research Question Two: Would theteaching of Mathematics in VocationalEducation promote or foster skill acquisition.
Table 3Teaching of Mathematics in VTE topromote or fosters skill acquisition.S/N A D TOTAL1. 70 30 1002. 81 19 1003. 75 25 1004. 80 20 1005. 60 40 1006. 72 28 100TOTAL 438 162 600

114
Educational Extracts Vol. IV, Issue 2, July 2016 St. Thomas College of Teacher Education, Pala, Kerala
From the table above, the percentagewas calculated to determine the degree ofthose that agree on the item and those thatdisagree, the result of the percentage hasshowed on the table three above.
Hypothesis Testing
Ho2: The knowledge of Mathematicsdoes not enhance and promote skill acquisitionin VTE.
H2: The knowledge of Mathematicsenhances and promotes skill acquisition inVTE.
Table 4Decision TableGROUP NO α-level Degree of freedom χ2tab χ2cal DecisionAGREED 438 0.05
05 11.070 15.0178 Reject the nullhypothesis
and accept thealternative
DISAGREED 162 hypothesis
Discussion
Table 4 above indicate that, the computedX2tab ratio at the degree of freedom - 05 is11.070 and less than the X2cal which is15.0178 which is significant. It means that,the null hypothesis which says that theknowledge of Mathematics does not enhanceand promote skill acquisition in VTE.
Research Question Three: There areproblems with VTE with mathematics whencoming to skill acquisition
Table 5Problems encountered when usingMathematics as a tool to promote skillacquisition in VTE.S/N A D TOTAL1. 72 28 1OO2. 81 19 1003. 70 30 1004. 82 18 1005. 60 40 100TOTAL 365 135 500
The table above shows the calculatedpercentage of opinion of the respondents theresearch question.
Hypothesis Testing
H03: There are no significant problemsencountered while using Mathematics as atool to promote skill acquisition in VTE.
H3:There are significant problemsencountered while using Mathematics as atool to promote skill acquisition in VTE.

115
Educational Extracts Vol. IV, Issue 2, July 2016 St. Thomas College of Teacher Education, Pala, Kerala
Discussion
Table 4 above indicate that, thecomputed X2tab ratio at degree of freedom– 04 is 9.488 and less than the X2cal whichis 16.4384 which is significant. It means that,the null hypothesis which says that there areno significant problems encountered whileusing Mathematics as a tool to promote skillacquisition in VTE.
Research Question Four: Governmenthave positive attitude toward VTE in Nigeria
Table 7Government attitude toward VTE inNigeriaS/N A D TOTAL1. 50 50 1002. 52 48 1003. 45 55 100TOTAL 147 153 300
The above table shows the percentageof respondents’ opinion on Governmentattitude toward VTE in Nigeria. ThePercentage of the respondents attitude wascalculated and showed on the table.
Hypothesis Testing
H04:Government has no positive attitudetowards VTE in Nigeria.
H4: There is significant differencebetween government positive altitude andnegligence to VTE in Nigeria.
Table 6Chi-square of respondents Problem encountered in VTE with Mathematics promotesor fosters skill acquisitionGROUP NO α-level Degree of freedom χ2tab χ2cal DecisionAGREED 365 0.05
04 9.488 16.4384 Reject the nullhypothesis and accept
the alternativeDISAGREED 135 hypothesis
Table 8Decision TableGROUP NO α-level Degree of freedom χ2tab χ2cal DecisionAGREED 147 0.05
02 5.991 1.0404 Accept the nullDISAGREED 153 hypothesis.
Discussion
Table 4 above indicate that, thecomputed X2tab ratio at the degree of
freedom - 02 is 5.991 and higher than theX2cal which is 1.040 which is significant. Itmeans that, the null hypothesis which says
116
Educational Extracts Vol. IV, Issue 2, July 2016 St. Thomas College of Teacher Education, Pala, Kerala
that Government has no positive attitudetowards VTE in Nigeria was accepted.
Discussion of Findings
Flexible delivery of VTE is regarded asa significant means of accelerating acountry’s transition to the informationeconomy (Kilpatrick & Bound, 2003: 10;Education Network Australia VTE AdvisoryGroup: 2000). The importance of lifelonglearning for all age groups has been seen asincreasingly critical in making this transitioneffective (Kearns: 2004). Findings form thisstudy as shown that flexible delivery of VTEcan be achieved if ICT is effectively put touse by facilitators in the field, as ICT hasbeen proven the study to effectively supportdistance learning, regulating the flow ofknowledge and skills impartation in order toconform with learners’ pace and interests.
Available research has found few clearexamples of ICT contributing to improvedstudent outcomes, with the most significantresults indicating that outcomes were nodifferent from those achieved in traditionalsettings (Brennan et al, 2001: 36); howbeit,the findings from this study revealed that ICTcould offer more significant results whenused than when not used. There are manydocumented examples of positive learningoutcomes and benefits that have resultedfrom the use of ICT that illustrate thepotential of online learning and delivery.
The findings of the research carried outby Ramboll Management for the EuropeanCommission, DG Education and Culture in2004, shows that ICT creates room forflexibility, new learning methods,opportunities for furnishing students withreal-life work skills, saving time and money,
integrating theory and practice, and posingattraction to students .Studies also indicatethat technology can accelerate, enrich, anddeepen basic skills; motivate and engagestudent learning; helps relate academics tothe practices of today’s’ workforce;strengthens teaching; increase the economicviability of tomorrows’ workers; contributesto school change; and connects schools tothe real world (Schacter, 1999). It is worthyof note that the findings of these studycorroborates these previous findings.
The research findings of Ricardo et al(2013), revealed that if provided with suitableMathematics instruments and practices;learners from an early age can exist withthem in rich and nuanced ways that wouldresult in their perceptuomotor integration.This in turn then promotes their overall abilityto acquire skills. This finding of theirsindirectly agrees with the findings of theexisting research.
The National Research Centre forCareer and Technical Education (NRCCTE,2005) cited by Achieve (2012)in theirresearch tested several models for integratingmath in VTE, and several of theseapproaches have shown a positive impact onstudent learning of new skills in VTE whichfurther supports the findings of this researchregarding the impact Mathematics wouldmake in VTE in the area of skill acquisition.Betz (1978) also found that mathematicsanxiety might be a critical factor in thevocational choice of students, implying thatinsufficient knowledge of Mathematics maydirectly or indirectly affect the acquisition ofsome skills in VTE. Mathematics is arequirement for a wide range of collegemajors and occupations. Therefore,

117
Educational Extracts Vol. IV, Issue 2, July 2016 St. Thomas College of Teacher Education, Pala, Kerala
according to research, the amount ofmathematics taken in high school and collegedetermines a student's range of careeroptions (Lent et al., 1993). These additionalfindings of previous researches prove thefindings of the existing research to be true.
Findings as also shown from theforegoing of this research that there arechallenges and problems encountered intrying to integrate ICT and the teaching ofmathematics in VTE for the enhancementof skill acquisition. Also, is the unconcernedattitude shown by the government towardsprovision of necessary infrastructures,facilities and gadgets (ICT-based andmathematical) for effective skill acquisitionin VTE in Nigeria.
Conclusion
Proponents of ICT have alwayshighlighted the benefits of technology whenapplied in the different sectors of societyespecially in education and skill acquisition.There is a belief that using ICT will makepeople to acquire more skill and make theirlives better. Education has benefitedimmensely from ICT for it “offered an entirenew range of possibilities to enhanceteaching-learning situation. It is believed thatan ICT with mathematics education willprepare the youth to be able to meet thechallenges and demands of the economicmarket once they graduate
Recommendations
From the foregoing of this research, thefollowing are hereby highly recommended:
Institutions, schools and institutedelivering courses in VTE are encouragedto integrate ICT and Mathematics both in
terms of their knowledge and related devicesto their teaching learning process, in order toenhance learners’ ability to acquire relevantskills that would bring about self-reliance anda sustainable economy for the country.
Government at all levels should saddletheir efforts to show more concern towardsskill acquisition in VTE by making availableICT facilities and gadgets alongside withmathematical tools to respective institutions,schools and institute delivering courses inVTE. This also does not exclude individualsand private bodies concerned.
ReferencesAchieve (2012): Common Core State Standards
& Career and Technical Education: Bridgingthe Divide between College and CareerReadiness.
Betz, N. E. (1978). Prevalence, distribution, andcorrelates of math anxiety in college students.Journal of Counselling Psychology, 25, 441–448.
Brennan, R.; McFadden, M..; and Law, E. (2001):All that Glitters is not Gold: Online Deliveryof Education and Training, Review ofResearch. Australian National TrainingAuthority, National Centre for VocationalEducation Research, Adelaide. Australia.Retrieved May 5, 2002 from the World WideWeb: http://www.ncver.edu.au/research/proj/nr9008.pdf
Department of Employment and WorkplaceRelations (2005):Workforce Tomorrow:Adapting to a more diverse Australian labourmarket, Australian Government, Canberra.
Education Network Australia VET AdvisoryGroup (2000):Flexible learning for theinformation economy: a framework fornational collaboration in vocationaleducation and training. Strategy 2000, ANTA,Brisbane.

118
Educational Extracts Vol. IV, Issue 2, July 2016 St. Thomas College of Teacher Education, Pala, Kerala
EU Commission ,DG Education & Culture (2005):The use of ICT for learning and teaching ininitial Vocational Education and Training.
Kearns, P (2004):Towards a learning revolutionin Australia: a consultation paper on futuredirections for lifelong learning, AdultLearning Australia, Canberra.
Kilpatrick, S & Bound, S (2003):Learning online:benefits and barriers in regional Australia,Volume I, NCVER and ANTA, an initiative ofthe Australian Flexible Learning Frameworkfor the National VET System 2000-2004.
Lent, R. W., Lopez, F. G., & Bieschke, K. J.(1993):Predicting mathematics-related choiceand success behaviours: test of an expandedsocial cognitive model.Journal of VocationalBehavior, 47, 223-236. Retrieved December 3,2001,from the World Wide Web: fromWilsonSelect database.
OECD (2005):Are Students Ready for aTechnology-Rich World? What PISA StudiesTell Us,OECD, Paris.
Ogunlaja - Smith, O. A. (2013): Controlling and
Checking Crimes: The Role and Use of ICTFacilities and Gadgets, In the Proceedings ofthe 4th National Conference of the School ofScience, Federal College of Education(Special), Oyo – National Security andScience Education.
Okolocha, C. C.(2012): Vocational TechnicalEducation in Nigeria: Challenges and the WayForward. Business Management Dynamics,Vol.2 (6), pp.01-08.
Ricardo Neminrosky, Molly L. Kelton and BohdanRhodehamen (2013): Playing MathematicalInstruments: Emerging PerceptuomotorIntegration with an Interactive MathematicsExhibit. In Natasha, M. L.et al (Eds.), Journalfor Research in mathematics Education,JRME Publication. 44 (2), pp. 372 – 415.
Schacter, J. (1999):The Impact ofTechnology on Student Achievement: Whatthe Most Current Research has to Say,Milken Exchange on Educational Technology,Milken Family Foundation, New York.
119
Educational Extracts Vol. IV, Issue 2, July 2016 St. Thomas College of Teacher Education, Pala, Kerala
* Research Scholar, GBCTE Thalasserry** Research Guide in Education, Principal, IASE, Thrissur
Educational Extracts ISSN 2320-7612
Vol. IV Issue 2 July 2016pp. 119-126
St. Thomas College of Teacher Education, Pala, Kerala, IndiaWebsite: www.stce-pala.info, www.stctepala.orgemail: [email protected]
DESIGNING A TEST FOR ASSESSINGHIGHER ORDER WRITING SKILLS IN MALAYALAM AT
SECONDARY LEVELJessy N. C.*
Dr. B. H. Helen Joy**
AbstractTesting and evaluation are fields of study in education which have not gainedsignificant attention. Testing language competence is a difficult task. Languagetesting may be said to be consisting of three main factors, viz., language, learningand evaluation. In the context of language teaching writing is one of the four primaryskills viz., Listening, Speaking, Reading and Writing. All the writing activities insecondary level demand that the students are equipped with a good and soundknowledge of language structure, and vocabulary in addition to being aware ofdifferent verities of language use (Register), styles. They are also expected to possessfairly reasonable knowledge of phrases and clause structure, significant sayingsand proverbs in daily use and those involving moral, social and cultural aspects.But the assessment of higher order writing skills in mother tongue is not beingcarried out to the expected standard at the secondary level. Here an attempt is madeto design a test for assessing higher order writing skills in Malayalam at secondarylevel with special focus on IXth standard content of present Kerala syllabus.Key Words: Higher order, Writing skill, Assessment, etc.
Introduction
Acquisition of mother tongue commencesfrom the very infancy of every individual. Itbegins at home before the entry to formaleducation and gets developed through schooleducation. While the preschool acquisitionhappens to be informal, the school education
becomes more formal, and at the same timethe informal acquisition continues. Formaleducation in mother tongue involves thedevelopment of language skills whichfacilitates the learners the apt and appropriateuse of mother tongue in different situationsand contexts. According to National
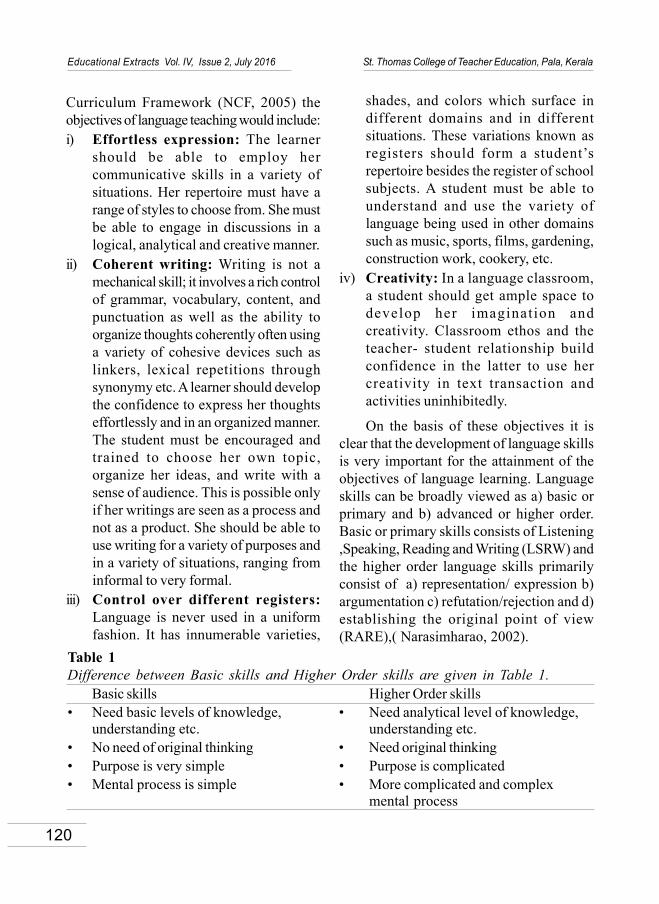
120
Educational Extracts Vol. IV, Issue 2, July 2016 St. Thomas College of Teacher Education, Pala, Kerala
Curriculum Framework (NCF, 2005) theobjectives of language teaching would include:i) Effortless expression: The learner
should be able to employ hercommunicative skills in a variety ofsituations. Her repertoire must have arange of styles to choose from. She mustbe able to engage in discussions in alogical, analytical and creative manner.
ii) Coherent writing: Writing is not amechanical skill; it involves a rich controlof grammar, vocabulary, content, andpunctuation as well as the ability toorganize thoughts coherently often usinga variety of cohesive devices such aslinkers, lexical repetitions throughsynonymy etc. A learner should developthe confidence to express her thoughtseffortlessly and in an organized manner.The student must be encouraged andtrained to choose her own topic,organize her ideas, and write with asense of audience. This is possible onlyif her writings are seen as a process andnot as a product. She should be able touse writing for a variety of purposes andin a variety of situations, ranging frominformal to very formal.
iii) Control over different registers:Language is never used in a uniformfashion. It has innumerable varieties,
shades, and colors which surface indifferent domains and in differentsituations. These variations known asregisters should form a student’srepertoire besides the register of schoolsubjects. A student must be able tounderstand and use the variety oflanguage being used in other domainssuch as music, sports, films, gardening,construction work, cookery, etc.
iv) Creativity: In a language classroom,a student should get ample space todevelop her imagination andcreativity. Classroom ethos and theteacher- student relationship buildconfidence in the latter to use hercreativity in text transaction andactivities uninhibitedly.
On the basis of these objectives it isclear that the development of language skillsis very important for the attainment of theobjectives of language learning. Languageskills can be broadly viewed as a) basic orprimary and b) advanced or higher order.Basic or primary skills consists of Listening,Speaking, Reading and Writing (LSRW) andthe higher order language skills primarilyconsist of a) representation/ expression b)argumentation c) refutation/rejection and d)establishing the original point of view(RARE),( Narasimharao, 2002).
Table 1Difference between Basic skills and Higher Order skills are given in Table 1.
Basic skills Higher Order skills• Need basic levels of knowledge, • Need analytical level of knowledge,
understanding etc. understanding etc.• No need of original thinking • Need original thinking• Purpose is very simple • Purpose is complicated• Mental process is simple • More complicated and complex
mental process

121
Educational Extracts Vol. IV, Issue 2, July 2016 St. Thomas College of Teacher Education, Pala, Kerala
Development of language skillsfacilitates the learners in the use of apt andappropriate language in different situationsand contexts. These skills combined with thecontent make the expression more effective.It is assumed that, by the time the learnersreach the secondary level of instruction, theywould have been equipped with the basicabilities of language use. So the developmentof higher order language skills has to befocused at secondary level. In this paper theresearcher focuses only on the writing skills(basic and advanced) in Malayalam atsecondary level with special reference to IXthStandard.
Writing
Writing is an expressive/productive skillwhile reading is a receptive skill. Writing atSecondary School involves production ofsmall paragraphs, descriptions, andnarratives, small controlled dialogues/conversations, guided composition,comprehension-cum-compositions, freecompositions of simple themes/topics etc.Apart from these, it could also be expectedfrom the secondary school students to writesimple criticisms, presenting various viewpoints and arriving at feasible and plausibleconclusions. All these activities demand thatthe students are equipped with a good andsound knowledge of language structure andvocabulary in addition to being aware ofdifferent varieties of language use (Register)and styles. They are also expected to possessfairly reasonable knowledge of phrases andclause structure, significant sayings andproverbs in daily use and those involvingmoral, social and cultural aspects. In thecontext of writing, vocabulary plays a veryimportant role. This demands the students to
be aware of synonyms, antonyms anddifferent shades of meaning (semantic)depending upon the situation and context.
Significance of Writing
The significance of writing in educationmay be given by highlighting that writing is aproductive skill and this skill cannot bedeveloped unless one gets familiarized andsystematically develops his / her skills ofextensive reading and listening which arebasically the primary receptive skills. Thebasic rules to follow while writing are:1. The aim of writing should be to make
the text as clear as possible2. Present the ideas clearly and concisely3. Avoid ambiguity or redundancy4. Write by following the grammatical rules
and spelling5. Always use appropriate punctuation
marks in appropriate places as per thesemantics of the context.
According to famous linguist NoamChomsky, (2000) three significant aspectsneed to be related to expression (speakingand writing).They are:1. Grammatical Adequacy2. Descriptive Adequacy3. Explanatory Adequacy
Grammatical Adequacy refers to the useof accuracy and aptness of expression.
Descriptive Adequacy refers toproviding sufficient and necessary detailsabout the concept concerned to ensure clearand unambiguous explanation.
Explanatory Adequacy refers to the kindof discourse pattern to ensure effectivecommunication/expression of the concept /
122
Educational Extracts Vol. IV, Issue 2, July 2016 St. Thomas College of Teacher Education, Pala, Kerala
theme concerned with due explanatorydetails.
Once the students are equipped with theabove competencies, required of their level,their expression (oral or written) becomemore meaningful, impressive and effective.
Need for Assessing Higher orderwriting skills
In the education system of Kerala thecurriculum, syllabus and text books ofMalayalam are revised on the bases of NCFfor achieving the objectives mentioned inTable1.The aim of learning mother tongueat secondary level focuses that the learnershould have acquired the competency inhigher order writing skills. One can expect apositive and favorable change in thedevelopment of writing skill after theimplementation of the new curriculum, whichhas its base on Social Constructivist Theoryof Vygotsky. However, critical examinationof the teaching learning process ofMalayalam language for the last ten yearsshows that the language competencies ofsecondary level students are far below theexpected levels. Though there are possibilitiesin the curriculum and the text books for thedevelopment of higher order writing andreading skills, the results have not beenpositive. Some reasons behind the issue werefound out through the Critical analyses of thepresent evaluation system and theassessment process of written testsconducted for students and the assessmentof the answer scripts. The existing evaluationsystem has little scope for proper assessmentof the Higher Order writing skills in mothertongue at the secondary level. It is found thatthe parameters of higher order writing skills
are not considered during the assessment ofanswer scripts. Taking this into regard, theresearcher would be very conscious,particular and specific in the assessment ofthe answer scripts written by the studentswith the parameters of each skill consideredseparately. The assessment would be doneon the bases of appropriate and specificparameters of each skill. The researcher hadalso intended to measure how far the existingmethod of teaching has been able to makethe learner attain the objectives of mothertongue learning at secondary level. Hence,the researcher designed a test for measuringthe attainment of the objectives of mothertongue learning (Malayalam) at secondarylevel with special focus on higher orderwriting skills. The design and the descriptionof the achievement test in Malayalam forSecondary level on the basis of IX th standardcontent are given as follows.
Description of the test constructed
The researcher prepared a test formeasuring the higher order writing skills onthe bases of the content of IXth standard ofpresent Kerala syllabus. The test contains18 test items and each of the items hasspecific scores /marks and parameters forassessment. Weightage has been given to thehigher order writing skills. All the test itemscome under four main aspects/areas ofobjectives of language learning, that isa) Aasayaparam, (meaning/theme aspect
of the particular discourse)b) Bashahaparam (linguistic aspect),c) Sahithyaparam (literary aspect) andd) Sargatimakam(creative aspect).
Table T1 shows the Design of the test.

123
Educational Extracts Vol. IV, Issue 2, July 2016 St. Thomas College of Teacher Education, Pala, Kerala
**Item numbers 14, 17, 15 and 18 arespecifically for higher order writing skills.Among this, items 14 and 17 are specificallyfor Argumentative writing and items 15 and18 for Critical writing respectively. But theyalso come under the aspects/areas of bothAasayaparam and Sahithyaparam. So thescores of these items are divided equally andincluded in Aasayaparam andSahithyaparam.
Objectives cannot be measured directly.It would be measured through the learningoutcomes of the learner during the teachinglearning process. Each objective has its ownparticular expected outcomes for the
evidence of the achievement of thatparticular objective. If a learner achieved aparticular objective through the teachinglearning process he/she should be able toexpress or produce the expected outcomesof that particular objective. For theexpression/reflection of the expectedoutcomes at Secondary level in mothertongue learning, the development of higherorder writing skills are essential. Thereforehigher order writing skills should beconsidered seriously for the assessment inthis test. Table T2 shows the Skill wise detailsof the test.
Table T1Design of the Test.Sl. Aspects/areas Test items Score given Type of itemsno considered for each
in the test aspect/area1 Aasayaparam 2,4,7,8,9, 21 Objective, very short
(meaning/theme (**15,18,14,17) answer, short answer,aspect of the and essayparticulardiscourse)
2 Bashahaparam 1,3,5,6 6 Objective.(linguistic aspect) very short answer
3 Sahithyaparam 10,11, 19 Objective,(literary aspect) (**15,18,14,17) very short answer,
short answer,and essay4 Sargatimakam. 12,13,16 14 Essay
(creative aspect)Total No. of Total score
items-18 -60

124
Educational Extracts Vol. IV, Issue 2, July 2016 St. Thomas College of Teacher Education, Pala, Kerala
Table T2Skill wise details of the test Skills to Category Item Parameters/expected outcomesbe acquired of skill numbers for assessing particular skill1) Following language Basic or 1,2,3,4, • Correct usage of grammatical specific norms Primary 5,6,7,8,9 rules and spelling2) Basic punctuation skills of • Correct usage of basic marks writing punctuation marks3) Paragraph • Clarity and consistency in the formation presentation of ideas
• Keeping coherence and cohesiveness in writing• One and only one idea in one paragraph
1) Select a title for 10, 11 • Should predict the content the passage • Catches the reader’s interest
• Reflects the tone of the piece of writing• Contains key words• Informative
2) Theme based Advanced • Accuracy in setting the theme focused writing or Higher • Important point in the theme
order skills • Relevant events strengthen theof writing main goal
3) Argumentative writing 14, 17 • Introduction of the focal point• Statement or opinion of the writer about the theme• Efficiency to substantiate the writer’s opinion with supporting evidence• Imperative use of Rhetorics• Technique for linking that writer’s opinion with supporting evidence• Conclusion—giving emphasize to the writer’s opinion• Cohesiveness and coherence in writing

125
Educational Extracts Vol. IV, Issue 2, July 2016 St. Thomas College of Teacher Education, Pala, Kerala
Preparation of the Items
In order to develop test items formeasuring objectives of Malayalam on thebasis of writing skills with special referenceon higher order writing skills in Malayalamat IXth standard, the researcher made athorough review of the related literatureavailable and analyzed the existing evaluationmethods and assessment process. Apartfrom this, the researcher had discussions withmany experts in this field. Based on thesediscussions and reviews, the researcherprepared a list of different items to be includedin the achievement test. Based on thesuggestions put forward by these experts andthe objectives of mother tongue learning inIXth standard according to the present KeralaSyllabus, the researcher designed the firstdraft of the test, which contained pool ofitems. Items, which overlapped, were
critically examined and the items whichconveyed the idea very clearly wereretained.
Validation of Items by Experts
Items so prepared were given to fiveexperts along with the operational definitionto see whether the given items really belongto the particular component of higher orderwriting skills in Mother tongue learning atsecondary level, with special focus on IXthstandard. The selected experts wereexperienced and practicing Secondary SchoolTeachers, State resource persons etc fromthe field of Language education andLinguistics. They were requested (a) toindicate to which dimension each itembelongs (b) to point out ambiguous items, (c)suggest necessary modifications, if any, inthe items. The researcher made necessary
4) Critical writing Advanced 15, 18 • Attractive/impressive openingor Higher statementorder skills • Description of the themeof writing • Opinion by others regarding the
same theme• Appropriate use of Rhetorics of the language• Formation of strong and clear opinion of writer in the pre- concluding statement about theme• Conclusion
5) Creative writing 12, 13, 16 • Expression in a unique and innovative manner (Uniqueness in the Rhetoric usages)• Techniques to twists• Social and moral relevance• Indirect expression revealing very high or strong concepts• Special style for conclusion

126
Educational Extracts Vol. IV, Issue 2, July 2016 St. Thomas College of Teacher Education, Pala, Kerala
corrections and modifications in the itemsbased on the suggestions from these expertsand thus developed the final draft of HigherOrder Writing Skill Test for IX th standardstudents.
Conclusion
Writing is one of the two media forhuman communication viz., Writing andSpeaking through which meaning isconveyed. The spectrum of writing is verywide and ranges from the formulation of analphabet to the development of writtendiscourse and longer texts. The importanceand effectiveness of writing is based uponthe observation of characteristics likecoherence, cogency and precision. Thus, inthe development of writing skill in anylanguage teaching/learning situation, largenumber of aspects are required to be coveredstarting from the hand movements, formationof the correct shapes of letters, paragraphs,essays and discourses, text books and criticaland creative writings. Development of higherorder language skills renders the learner’sexpressions apt and appropriate at secondarylevel. Then only the objectives of mothertongue learning will be achieved which wouldbe effectively expressed through expectedoutcomes at the expected level. The present
paper gives the details of a test designed forassessing the attainment of the objectives ofmother tongue learning, specifically the higherorder writing skills in Malayalam of studentsat secondary level in our schools. Properevaluation of the answer scripts andappropriate remedial measures based on theevaluation would enable the students atsecondary level to attain higher order writingskills in Malayalam.
ReferencesAcharya , K.P. (Edited), (1997) On Writing, Central
Institute of Indian Languages. Mysore.
Chomsky, N. (2000) New Horizons in the studyof Language and Mind, Cambridge UniversityPress.
Narasimharao, K.V.V.L. (1990) Evaluation inlanguage Education, Central Institute ofIndian Languages. Mysore.
National Curriculum Framework 2005, Positionpaper, National Focus Group on Teaching ofIndian languages, NCERT, Government ofIndia
Narasimharao, K.V.V.L. (2002) Mother tongueEducation , Central Institute of IndianLanguages. Mysore
Sam Mohal Lal.(2015) Format for module lessons(writing),RIE Mysore
127
Educational Extracts Vol. IV, Issue 2, July 2016 St. Thomas College of Teacher Education, Pala, Kerala
AWARENESS AND USE OF E-RESOURCES BYENGINEERING COLLEGE FACULTY AND STUDENTS
Saritha M.S.*
AbstractThis study reveals the awareness and use of e-resources by college of engineeringstudents and faculty members in Adoor, Kerala .Questionnaire method was mainlyused for collecting the data for the study.150 questionnaire were distributed amongstudents and 50 questionnaire distributed among faculty. Total 180 questionnairesreplied with responses. The study found that teachers and students were aware aboutthis e-resources and it is very useful to them.Key words: E-resources, College of Engineering, Questionnaire method, etc.
* Librarian, College of Engineering, Mankala, Adoor -691 551
Educational Extracts ISSN 2320-7612
Vol. IV Issue 2 July 2016pp. 127-131
St. Thomas College of Teacher Education, Pala, Kerala, IndiaWebsite: www.stce-pala.info, www.stctepala.orgemail: [email protected]
INTRODUCTION
In the present day context the traditionalfunctions of libraries and librarians haveundergone radical changes and digitalinformation resources have great importancein libraries and library users. Library is thecentre for both printed documents and digitalinformation resources in their collection. Inthe modern libraries digital informationresources are becoming more and moreimportant. The printed resources are nowbeing digitized which has given rise inincrease of the availability of books andjournals in the electronic format
Digital information resources are thoseresources which include e-books, e-databases, e-journals, e-magazines, e-audio,e-images, electronic exhibitions, e-
newsletters, e-conference proceedings etc.E-books and e-journals are widely used e-resources by the users. E-journals have thefacility for full text searching anddownloading articles.
College of Engineering - Adoor
College of Engineering Adoor wasestablished during the year 1995andmanaged by the Institute of HumanResource Development, Kerala, recognizedby AICTE New Delhi affiliated to AbdulKalam Technological university. This collegeis situated in Manakala, Adoor, Kerala. Fourbranches of engineering courses are here.They are electrical engineering, mechanicalengineering, computer science, electronicsand communication engineering and two yearM.tech course. Central library has about
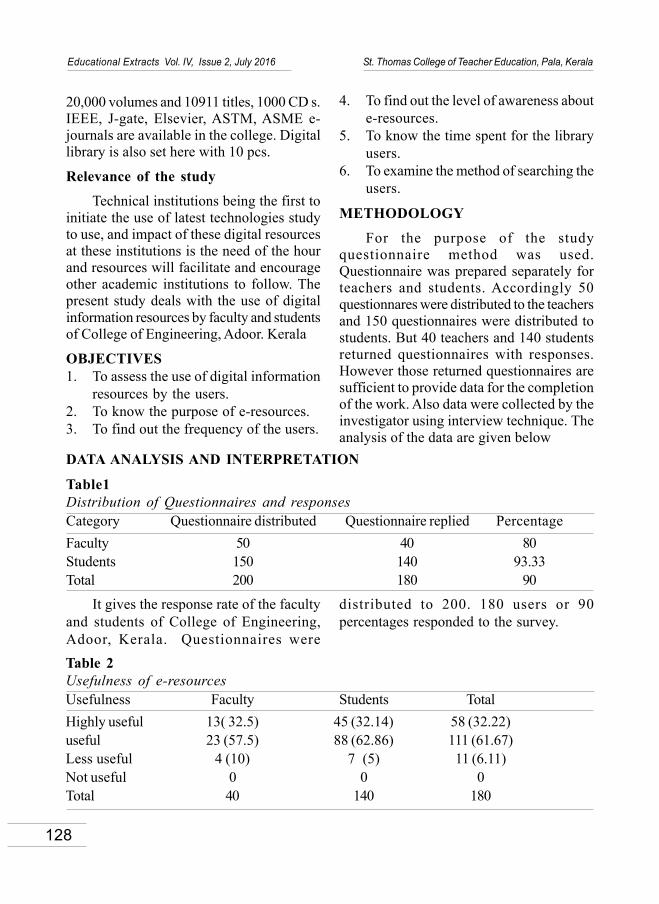
128
Educational Extracts Vol. IV, Issue 2, July 2016 St. Thomas College of Teacher Education, Pala, Kerala
20,000 volumes and 10911 titles, 1000 CD s.IEEE, J-gate, Elsevier, ASTM, ASME e-journals are available in the college. Digitallibrary is also set here with 10 pcs.
Relevance of the study
Technical institutions being the first toinitiate the use of latest technologies studyto use, and impact of these digital resourcesat these institutions is the need of the hourand resources will facilitate and encourageother academic institutions to follow. Thepresent study deals with the use of digitalinformation resources by faculty and studentsof College of Engineering, Adoor. Kerala
OBJECTIVES1. To assess the use of digital information
resources by the users.2. To know the purpose of e-resources.3. To find out the frequency of the users.
4. To find out the level of awareness aboute-resources.
5. To know the time spent for the libraryusers.
6. To examine the method of searching theusers.
METHODOLOGY
For the purpose of the studyquestionnaire method was used.Questionnaire was prepared separately forteachers and students. Accordingly 50questionnares were distributed to the teachersand 150 questionnaires were distributed tostudents. But 40 teachers and 140 studentsreturned questionnaires with responses.However those returned questionnaires aresufficient to provide data for the completionof the work. Also data were collected by theinvestigator using interview technique. Theanalysis of the data are given below
DATA ANALYSIS AND INTERPRETATION
Table1Distribution of Questionnaires and responsesCategory Questionnaire distributed Questionnaire replied PercentageFaculty 50 40 80Students 150 140 93.33Total 200 180 90
It gives the response rate of the facultyand students of College of Engineering,Adoor, Kerala. Questionnaires were
distributed to 200. 180 users or 90percentages responded to the survey.
Table 2Usefulness of e-resourcesUsefulness Faculty Students TotalHighly useful 13( 32.5) 45 (32.14) 58 (32.22)useful 23 (57.5) 88 (62.86) 111 (61.67)Less useful 4 (10) 7 (5) 11 (6.11)Not useful 0 0 0Total 40 140 180
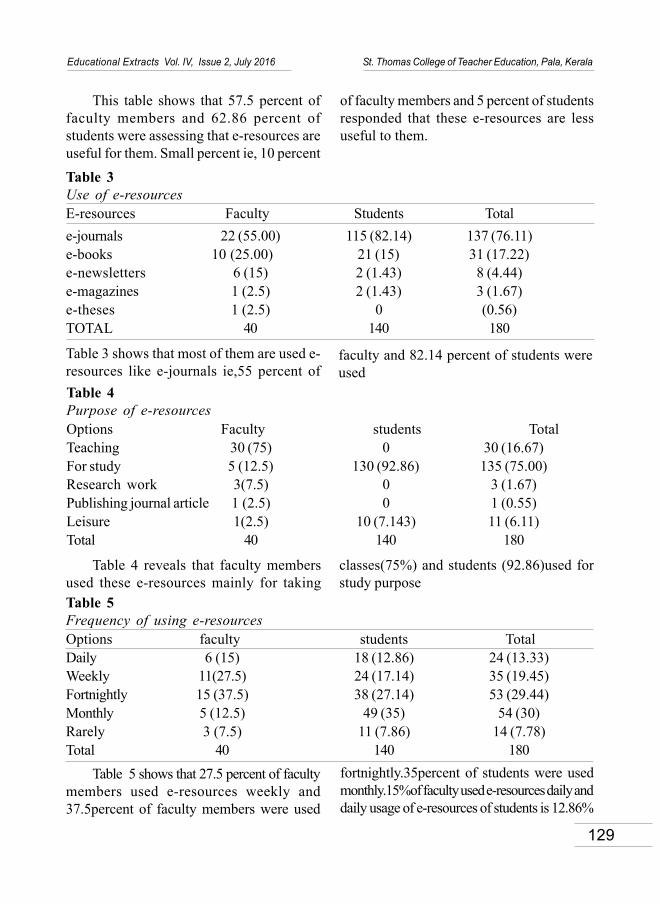
129
Educational Extracts Vol. IV, Issue 2, July 2016 St. Thomas College of Teacher Education, Pala, Kerala
This table shows that 57.5 percent offaculty members and 62.86 percent ofstudents were assessing that e-resources areuseful for them. Small percent ie, 10 percent
of faculty members and 5 percent of studentsresponded that these e-resources are lessuseful to them.
Table 3Use of e-resourcesE-resources Faculty Students Totale-journals 22 (55.00) 115 (82.14) 137 (76.11)e-books 10 (25.00) 21 (15) 31 (17.22)e-newsletters 6 (15) 2 (1.43) 8 (4.44)e-magazines 1 (2.5) 2 (1.43) 3 (1.67)e-theses 1 (2.5) 0 (0.56)TOTAL 40 140 180
Table 3 shows that most of them are used e-resources like e-journals ie,55 percent of
faculty and 82.14 percent of students wereused
Table 4Purpose of e-resourcesOptions Faculty students TotalTeaching 30 (75) 0 30 (16.67)For study 5 (12.5) 130 (92.86) 135 (75.00)Research work 3(7.5) 0 3 (1.67)Publishing journal article 1 (2.5) 0 1 (0.55)Leisure 1(2.5) 10 (7.143) 11 (6.11)Total 40 140 180
Table 4 reveals that faculty membersused these e-resources mainly for taking
classes(75%) and students (92.86)used forstudy purpose
Table 5Frequency of using e-resourcesOptions faculty students TotalDaily 6 (15) 18 (12.86) 24 (13.33)Weekly 11(27.5) 24 (17.14) 35 (19.45)Fortnightly 15 (37.5) 38 (27.14) 53 (29.44)Monthly 5 (12.5) 49 (35) 54 (30)Rarely 3 (7.5) 11 (7.86) 14 (7.78)Total 40 140 180
Table 5 shows that 27.5 percent of facultymembers used e-resources weekly and37.5percent of faculty members were used
fortnightly.35percent of students were usedmonthly.15%of faculty used e-resources daily anddaily usage of e-resources of students is 12.86%

130
Educational Extracts Vol. IV, Issue 2, July 2016 St. Thomas College of Teacher Education, Pala, Kerala
Table 7 reveals that 45 percent of facultymembers time spent for e resources less than1 hour and 27.5 percent faculty are time
spent depends on free time. 62.86 percentof students used these e-resources more than1 hour.
Table 6Level of awareness about e-resourcesOpinion faculty students TotalAware 27 (67.5) 95( 67.86) 122 (67.78)Somewhat aware 13 (32.5) 45 (32.14) 58 (32.22)Unaware 0 0 0Total 40 140 180
Table 6 shows that 67.5percent facultymembers were aware about this resourceand 67.86 percent of students were aware
about these resources. Both faculty andstudents were aware about these resources.
Table 7Time spent for e-resources
Less than one One hour More than Depend on Totalhour 1 hour free time
Faculty 18 (45) 8 (20) 3 (7.5) 11 (27.5) 40 (22.22)Students 6(4.28) 26 (18.57) 88(62.86) 20 (14.28) 140 (77.78)Total 24 34 91 31 180 (100)
Table 8Method of searching e-resources
Search engine Websites Through library Through lab TotalFaculty 9 (22.5) 11 (27.5) 8 (20) 12 (30) 40 (22.22)Students 61 (43.57) 24 (17.14) 13 (9.29) 42 (30) 140(77.78)Total 70 35 21 54 180 (100)
Table 8 shows that most of the students30 percent were used the e-resourcesthrough search engine and lab. Facultymembers access to this through lab andwebsites.
FINDINGS AND CONCLUSION
This study reveals that most of theteachers and students used the e -resourcesfor various purposes. No students areunaware about the e-resources because at
the time of membership taken in the library,library staff advice the students about thee-resources facilities especially e-journals.Most of the faculties were explain the useof e-resources to the students especially thecomputer science faculties. Through lab,majority of students access the e-resourcesfor getting relevant information .It is learnedthat e-resources is an invaluable asset ineducation and information gathering whichis great benefit to teachers and students.

131
Educational Extracts Vol. IV, Issue 2, July 2016 St. Thomas College of Teacher Education, Pala, Kerala
REFERENCESMurugan, K.(2015). Utilization of e-resources by
faculty and students of Universal college ofEngineering and Technology, Vallioor,Tamilnadu: A study. Journal of Advances inlibrary and information science, 4 (1) ,-73-76.www.cea.ac.in
Vijayakumar,K. & Shuaib (2014). Utilization ofelectronic resources among the facultymembers of Engineering colleges inNagapatinam District..Journal of Advances inlibrary and information science, 3(1), 240-243.
Jose, J.(2014). Usage of electronic resourcesby the students of Mahatma Gandhiuniversity Kottayam, Kerala. Journal ofAdvances in library and informationscience, 3(2), 89-93.
Selvaganapathi, N. & Surianarayanan,S.(2013).Use and impact of electronic resourcesamong the faculty members of St.Xavier’scatholic college of Engineering,Chunkankadai. Journal of Advances in libraryand information science, 2 (2), 50-54.

132
Educational Extracts Vol. IV, Issue 2, July 2016 St. Thomas College of Teacher Education, Pala, Kerala
* Assistant Professor in Perspectives in Education, Kerala University College of TeacherEducation, Kayamkulam
Educational Extracts ISSN 2320-7612
Vol. IV Issue 2 July 2016pp. 132-139
St. Thomas College of Teacher Education, Pala, Kerala, IndiaWebsite: www.stce-pala.info, www.stctepala.orgemail: [email protected]
INFLUENCE OF CERTAIN FAMILY, OCCUPATIONAL,INDIVIDUAL RELATED FACTORS ONJOB SATISFACTION OF TEACHERS
Dr. Smitha J.M.*
AbstractThe capacity of one’s job to satisfy needs of an individual positively correlates withthe job satisfaction of the employee. The job satisfaction of employees have positiveco-relation with the opportunities for need fulfillment of the employees. In the presentstudy an attempt has been made to understand the influence of various factors likegender, age, monthly income, work pressure ,teaching experience and teachingsubject, working environment, occupation of spouse, workload and work exhaustionon the variable Job Satisfaction of teachers .The findings revealed that there is nosignificant influence of these factors on the variable Job satisfaction of teachers.Key Words: Job Satisfaction, Individual Factors, Occupational Factors, Workload,Work exhaustion, etc.
INTRODUCTION
Job satisfaction or employeesatisfaction has been defined in manydifferent ways. Job satisfaction is the levelof contentment a person feels regarding hisor her job. This feeling is mainly based on anindividual's perception of satisfaction. Jobsatisfaction can be influenced by a person'sability to complete required tasks, the levelof communication in an organization, and theway management treats employees.
Teachers’ job satisfaction is importantfor school organization and improvement. Theteachers having good qualification may or
may not have a positive attitude towards theteaching profession. An ideal teacher isexpected to have favorable attitude towardshis or her profession. The phrase satisfactionof teachers refers to how contended orpleased they feel about their work and thecircumstances surrounding their work. Nowa days parents and public feel that theteachers don’t have satisfaction in the jobas a result of which standards of educationare deteriorating. The relevance of jobsatisfaction and motivation are very crucialto the long-term growth of any educationalsystem around the world. In addition, needssatisfaction and motivation to work are very
133
Educational Extracts Vol. IV, Issue 2, July 2016 St. Thomas College of Teacher Education, Pala, Kerala
essential in the lives of teachers becausethey form the fundamental reason forworking in life.
Many teachers chose teaching as aprofession because they valued the intrinsicrewards that they received and because theyenjoyed the emotional and personal benefitsof the job itself, such as personal growth anda sense of accomplishment. In fact, manyteachers selected this profession becausethey desired helping others and wereafforded the opportunity for personaldevelopment and public service .Teachersare important in their role in shaping students’intellectual, emotional, and socialdevelopment. Many teachers entered thefield of education and the teaching professionbecause they had a passion for helping othersand enjoyed the personal growth and senseof accomplishment (Latham, 1998).
STATEMENT OF THE PROBLEM
The problem of the present study hasbeen stated as influence of certain family,occupational, individual related factorson job satisfaction of school teachers intrivandrum.
STATEMENT OF HYPOTHESES1. There will not be significant difference
in the level of Job Satisfaction amongschool teachers(i) Based on their gender, age and
monthly income,(ii) Based on work pressure, teaching experience and teaching subject(iii) Based on working environment,
occupation of spouse, workload and on work exhaustion
1.5 METHODOLOGY IN BRIEF
SAMPLE
Survey method was used for the study.The sample selected for the present studywas drawn from teachers of various schoolsin Trivandrum. A sample of 150 teacherswere taken with due importance to gender,experience, gender, age and monthly income,work pressure ,teaching experience andteaching subject, working environment,occupation of spouse, workload and on workexhaustion. For the present study purposivesampling is used.
TOOLS EMPLOYED
To collect data the following tools wereused
1. Job Satisfaction Scale((Kavitha&Sam Sananda Raj, 1998)
Job Satisfaction Scale (Kavitha &Sunanda Raj, 1998) includes sixteen items.Both positive and negative items wereequally distributed. Out of the sixteen items8 are positive and 8 are negative. It is a 5point scale that is each item has five response.The subject are asked to respond to itemsusing five alternatives-A – Strongly Agree,B – Agree, C – Undecided, D – Disagreeand E – Strongly Disagree.
Reliability
The reliability of the test was found fromthe sample of 40 employees including malesand females. The split half reliability of thejob satisfaction scale using odd even methodwas found out to be 0.93. There is a highpositive correlation between the test scores
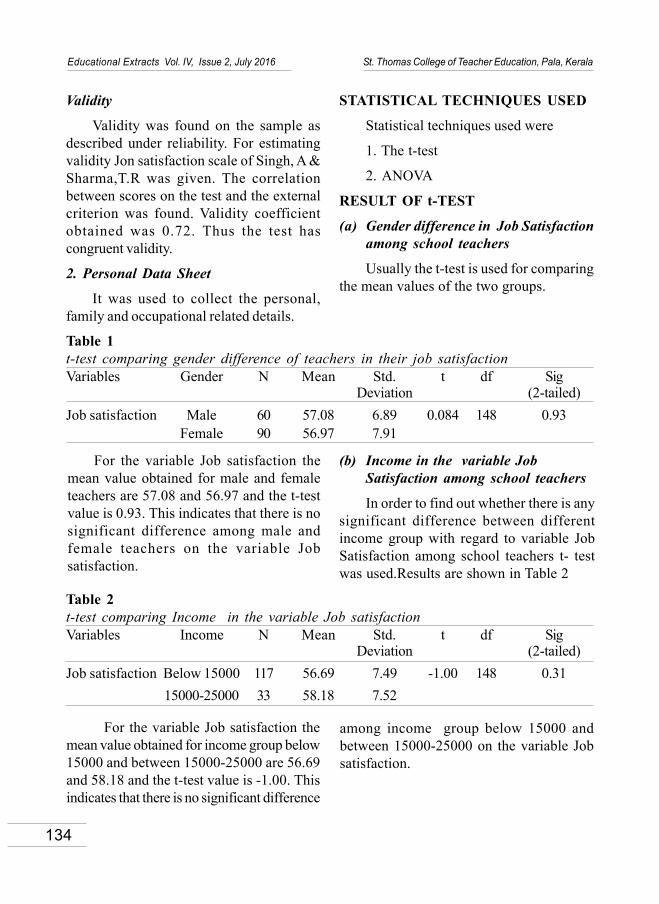
134
Educational Extracts Vol. IV, Issue 2, July 2016 St. Thomas College of Teacher Education, Pala, Kerala
Validity
Validity was found on the sample asdescribed under reliability. For estimatingvalidity Jon satisfaction scale of Singh, A &Sharma,T.R was given. The correlationbetween scores on the test and the externalcriterion was found. Validity coefficientobtained was 0.72. Thus the test hascongruent validity.
2. Personal Data Sheet
It was used to collect the personal,family and occupational related details.
STATISTICAL TECHNIQUES USED
Statistical techniques used were
1. The t-test
2. ANOVA
RESULT OF t-TEST
(a) Gender difference in Job Satisfactionamong school teachers
Usually the t-test is used for comparingthe mean values of the two groups.
Table 1t-test comparing gender difference of teachers in their job satisfactionVariables Gender N Mean Std. t df Sig
Deviation (2-tailed)Job satisfaction Male 60 57.08 6.89 0.084 148 0.93
Female 90 56.97 7.91
For the variable Job satisfaction themean value obtained for male and femaleteachers are 57.08 and 56.97 and the t-testvalue is 0.93. This indicates that there is nosignificant difference among male andfemale teachers on the variable Jobsatisfaction.
(b) Income in the variable JobSatisfaction among school teachers
In order to find out whether there is anysignificant difference between differentincome group with regard to variable JobSatisfaction among school teachers t- testwas used.Results are shown in Table 2
Table 2t-test comparing Income in the variable Job satisfactionVariables Income N Mean Std. t df Sig
Deviation (2-tailed)Job satisfaction Below 15000 117 56.69 7.49 -1.00 148 0.31
15000-25000 33 58.18 7.52
For the variable Job satisfaction themean value obtained for income group below15000 and between 15000-25000 are 56.69and 58.18 and the t-test value is -1.00. Thisindicates that there is no significant difference
among income group below 15000 andbetween 15000-25000 on the variable Jobsatisfaction.
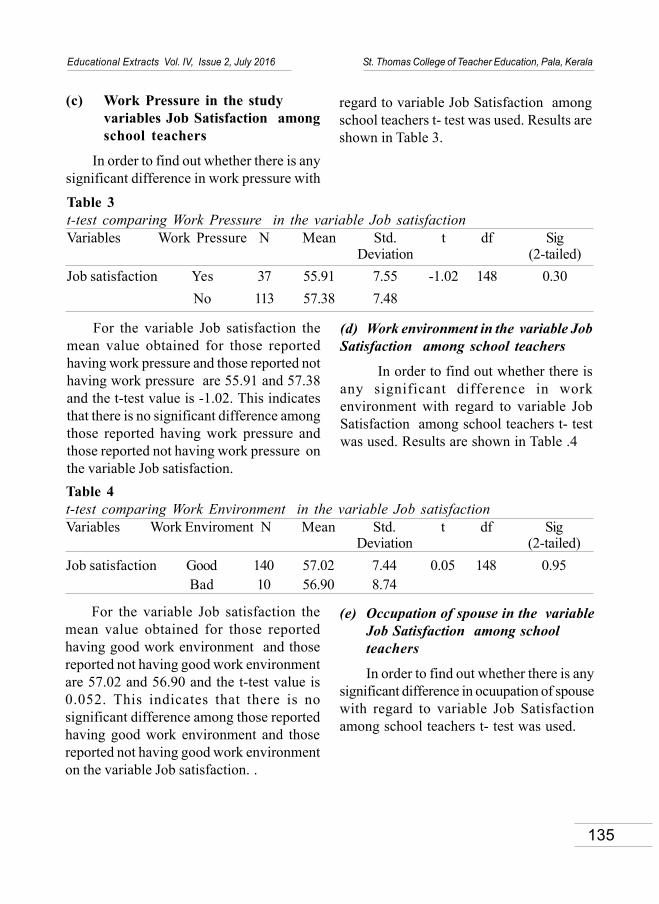
135
Educational Extracts Vol. IV, Issue 2, July 2016 St. Thomas College of Teacher Education, Pala, Kerala
(c) Work Pressure in the studyvariables Job Satisfaction amongschool teachers
In order to find out whether there is anysignificant difference in work pressure with
regard to variable Job Satisfaction amongschool teachers t- test was used. Results areshown in Table 3.
Table 3t-test comparing Work Pressure in the variable Job satisfactionVariables Work Pressure N Mean Std. t df Sig
Deviation (2-tailed)Job satisfaction Yes 37 55.91 7.55 -1.02 148 0.30
No 113 57.38 7.48
For the variable Job satisfaction themean value obtained for those reportedhaving work pressure and those reported nothaving work pressure are 55.91 and 57.38and the t-test value is -1.02. This indicatesthat there is no significant difference amongthose reported having work pressure andthose reported not having work pressure onthe variable Job satisfaction.
(d) Work environment in the variable JobSatisfaction among school teachers
In order to find out whether there isany significant difference in workenvironment with regard to variable JobSatisfaction among school teachers t- testwas used. Results are shown in Table .4
Table 4t-test comparing Work Environment in the variable Job satisfactionVariables Work Enviroment N Mean Std. t df Sig
Deviation (2-tailed)Job satisfaction Good 140 57.02 7.44 0.05 148 0.95
Bad 10 56.90 8.74
For the variable Job satisfaction themean value obtained for those reportedhaving good work environment and thosereported not having good work environmentare 57.02 and 56.90 and the t-test value is0.052. This indicates that there is nosignificant difference among those reportedhaving good work environment and thosereported not having good work environmenton the variable Job satisfaction. .
(e) Occupation of spouse in the variableJob Satisfaction among schoolteachers
In order to find out whether there is anysignificant difference in ocuupation of spousewith regard to variable Job Satisfactionamong school teachers t- test was used.
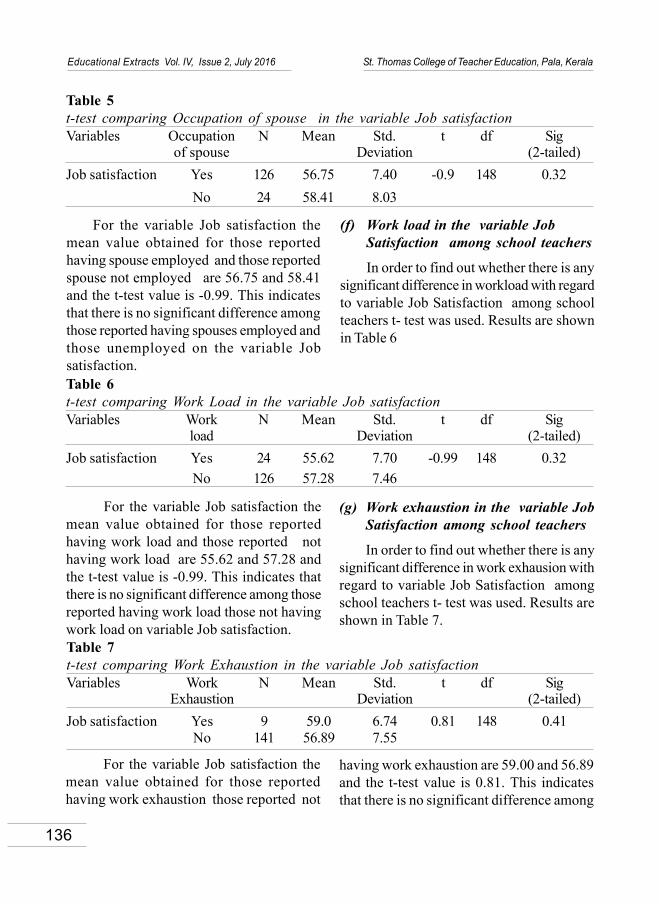
136
Educational Extracts Vol. IV, Issue 2, July 2016 St. Thomas College of Teacher Education, Pala, Kerala
(f) Work load in the variable JobSatisfaction among school teachers
In order to find out whether there is anysignificant difference in workload with regardto variable Job Satisfaction among schoolteachers t- test was used. Results are shownin Table 6
Table 5t-test comparing Occupation of spouse in the variable Job satisfactionVariables Occupation N Mean Std. t df Sig
of spouse Deviation (2-tailed)Job satisfaction Yes 126 56.75 7.40 -0.9 148 0.32
No 24 58.41 8.03
For the variable Job satisfaction themean value obtained for those reportedhaving spouse employed and those reportedspouse not employed are 56.75 and 58.41and the t-test value is -0.99. This indicatesthat there is no significant difference amongthose reported having spouses employed andthose unemployed on the variable Jobsatisfaction.Table 6t-test comparing Work Load in the variable Job satisfactionVariables Work N Mean Std. t df Sig
load Deviation (2-tailed)Job satisfaction Yes 24 55.62 7.70 -0.99 148 0.32
No 126 57.28 7.46
For the variable Job satisfaction themean value obtained for those reportedhaving work load and those reported nothaving work load are 55.62 and 57.28 andthe t-test value is -0.99. This indicates thatthere is no significant difference among thosereported having work load those not havingwork load on variable Job satisfaction.
(g) Work exhaustion in the variable JobSatisfaction among school teachers
In order to find out whether there is anysignificant difference in work exhausion withregard to variable Job Satisfaction amongschool teachers t- test was used. Results areshown in Table 7.
Table 7t-test comparing Work Exhaustion in the variable Job satisfactionVariables Work N Mean Std. t df Sig
Exhaustion Deviation (2-tailed)Job satisfaction Yes 9 59.0 6.74 0.81 148 0.41
No 141 56.89 7.55
For the variable Job satisfaction themean value obtained for those reportedhaving work exhaustion those reported not
having work exhaustion are 59.00 and 56.89and the t-test value is 0.81. This indicatesthat there is no significant difference among

137
Educational Extracts Vol. IV, Issue 2, July 2016 St. Thomas College of Teacher Education, Pala, Kerala
those reported having work exhaustion andthose not having work exhaustion on thevariable Job satisfaction.
RESULTS OF ANOVA
Anova is used to find out whether thereis any significant difference in job Satisfactionand Depression among school teachers
based on their age, experience and teachingsubject.
a) In order to find out whether there isany significant difference among schoolteachers on Job satisfaction based on ageANOVA was done and the result is givenbelow-
Table 8ANOVA for Job satisfaction among school teachers based on Age
Variables Group Sum of Squares df Mean Square F Sig.Job Satisfaction Between Groups 123.08 2 61.54 1.09 0.33
Within Groups 8265.85 147 56.23Total 8388.94 149
The results indicate that there is nosignificant difference among school teacherson Job satisfaction based on their age. TheF-ratio obtained for Job satisfaction is 1.09These values are not significant. This showsthat age is not a factor which influence jobsatisfaction of school teachers.
b) In order to find out whether there isany significant difference among schoolteachers on Job satisfaction based onteaching experience ANOVA was done andthe result is given in Table .9
Table 9ANOVA for Job satisfaction among school teachers based on Teaching experience.
Variables Group Sum of Squares df Mean Square F Sig.Job Satisfaction Between Groups 197.780 2 98.890 1.775 .173
Within Groups 8191.160 147 55.722Total 8388.940 149
The results indicate that there is nosignificant difference among school teacherson Job satisfaction based on their teachingexperience. The F-ratio obtained for Jobsatisfaction is 1.77 .These values are notsignificant. This shows that teachingexperience is not a factor which influence
job satisfaction of school teachers.
In order to find out whether there is anysignificant difference among school teacherson Job satisfaction based on teaching subjectANOVA was done and the result is given inTable10

138
Educational Extracts Vol. IV, Issue 2, July 2016 St. Thomas College of Teacher Education, Pala, Kerala
The results indicate that there is nosignificant difference among school teacherson Job satisfaction based on their teachingsubject. The F-ratio obtained for Jobsatisfaction is 1.65 .These values are notsignificant. This shows that teaching subjectis not a factor which influence on jobsatisfaction of school teachers.
TENABILITY OF HYPOTHESES
(1) The hypothesis is that there willnot be significant difference among variableJob Satisfaction of school teachers basedon their gender, age , monthly income, workpressure, their teaching experience, teachingsubject, working environment, spouse’s jobstatus, workload & on exhaustion
The results indicate that there is nosignificant difference between schoolteachers on the basis of gender, age, income,work pressure, teaching experience, teachingsubject, work environment ,work load andwork exhaustion with regard to variable jobsatisfaction .So the hypothesis is accepted.
MAJOR FINDINGS
School teachers are the social engineerswho shape the future of the society. But onlya few studies were conducted to understandthe job satisfaction level and of teachers. Theresults indicate that there is no significantdifference between school teachers on the
basis of gender, age, income, work pressure,teaching experience, teaching subject, workenvironment, work load & work exhausionwith regard to variable job satisfaction . Soit throws light on the fact that job satisfactionis not at all influenced by individual, familyor occupational related factors.
REFERENCESLatham, A. (1998, February). Teacher satisfaction.
Educational Leadership, 68, 123 - 126.
Nagarathnamma,B.&B, Viswanatha(1991).Effectof Occupational Stress on Job Satisfaction.Journal of Indian Academy of AppliedPsychology,17(1&2),81-85.
Ostroff,C.(1992).The relationship betweensatisfaction,attitudes and performance: Anorganizational level analysis. Journal ofApplied Psychology.77(6),963-967.
Paschali, A., & Tsitsas, G. (2010). Stress and lifesatisfaction among university students: Apilot study. Annual General Psychiatry,9(Supplement 1), S96.
Table 10ANOVA for Job satisfaction and Depression among school teachers based on TeachingSubject.
Variables Group Sum of Squares df Mean Square F Sig.Job Satisfaction Between Groups 185.164 2 92.582 1.659 0.194
Within Groups 8203.776 147 55.808Total 8388.940 149