An assessment of the construct validity of environmental strategy measures
30
AN ASSESSMENT OF THE CONSTRUCT VALIDITY OF ENVIRONMENTAL STRATEGY MEASURES Judith L. Walls Phillip H. Phan Pascual Berrone IESE Business School – University of Navarra Av. Pearson, 21 – 08034 Barcelona, Spain. Phone: (+34) 93 253 42 00 Fax: (+34) 93 253 43 43 Camino del Cerro del Águila, 3 (Ctra. de Castilla, km 5,180) – 28023 Madrid, Spain. Phone: (+34) 91 357 08 09 Fax: (+34) 91 357 29 13 Copyright © 2008 IESE Business School. Working Paper WP-754 May 2008
Transcript of An assessment of the construct validity of environmental strategy measures
IESE Business School-University of Navarra - 1
AN ASSESSMENT OF THE CONSTRUCT VALIDITY OF ENVIRONMENTAL
STRATEGY MEASURES
Judith L. Walls
Phillip H. Phan
Pascual Berrone
IESE Business School – University of Navarra Av. Pearson, 21 – 08034 Barcelona, Spain. Phone: (+34) 93 253 42 00 Fax: (+34) 93 253 43 43 Camino del Cerro del Águila, 3 (Ctra. de Castilla, km 5,180) – 28023 Madrid, Spain. Phone: (+34) 91 357 08 09 Fax: (+34) 91 357 29 13 Copyright © 2008 IESE Business School.
Working PaperWP-754 May 2008
IESE Business School-University of Navarra
AN ASSESSMENT OF THE CONSTRUCT
VALIDITY OF ENVIRONMENTAL STRATEGY MEASURES
Judith L. Walls1
Phillip H. Phan2
Pascual Berrone3
Abstract
The natural resource-based view of the company is emerging as a dominant paradigm for understanding the intersection of strategic management and the natural environment. Companies that proactively incorporate a natural environment perspective into their enterprise strategies are said to have sustainable competitive advantages. However, defining and measuring environmental strategy has been challenging, with different approaches yielding inconsistent results. Many studies ignore the empirical difficulties of marrying the theoretical connection between the company’s resource base and environmental strategy, and its impact on environmental company performance. In this paper, we apply an inductive approach to derive a measure of environmental strategy theoretically congruent with the natural resource-based-view of the firm. We assess its reliability and, using a multi-trait multi-method matrix, we confirm the convergent and discriminant validities of this measure against other measures often used by researchers. We also establish predictive validity of our environmental strategy measure for environmental performance. We discuss the implications of the measure for future research and practice.
1 Ross School of Business & School of Natural Resources and Environment, University of Michigan 2 Carey School of Business, Johns Hopkins University 3 Professor, Strategic Management, IESE
Keywords: Environmental performance, environmental strategies, inductive study, measures.
IESE Business School-University of Navarra
AN ASSESSMENT OF THE CONSTRUCT VALIDITY OF ENVIRONMENTAL
STRATEGY MEASURES
Introduction Environmental strategy has become an increasingly important component of strategic management. Many companies have shifted from taking a reactive view of environmental issues to a more proactive approach as the institutional environment has developed (Hoffman, 1999). As such, companies are building unique skills that form a source of competitive advantage put forth by the natural resource-based view, or “NRBV” (Hart, 1995). Research in this area has proliferated and, with it, a diverse range of environmental strategy measures have emerged. The heterogeneity in measures used has made it difficult to compare, replicate and refine studies. Perhaps more troubling is the fact that because ‘operationalization’ of the environmental strategy construct has been inconsistent, empirical consensus has not been reached on, for example, whether or not a proactive environmental strategy benefits companies financially (Claver-Cortés et al, 2005).
Defining environmental strategy is important to establish content validity because there is considerable overlap between environmental management variables (such as certification, practices, initiatives and technologies) and environmental performance variables (the impact of company activities on the natural environment) (Claver-Cortés et al, 2005). By and large, researchers have relied on the NRBV to connect environmental strategy to company performance, using environmental performance measures as a proxy for environmental strategy (e.g. Hart and Ahuja, 1996; King and Lenox, 2002; Russo and Fouts, 1997). But the association between environmental strategy and company financial performance still remains under debate, and may in fact be mediated by environmental performance (for a review, see Claver-Cortés et al, 2005). The ability to measure environmental strategy and determine whether it differs from environmental performance is therefore crucial.
The reliability of environmental strategy measures is a second important concern. Use of external data such as Kinder, Lydenberg and Domini (KLD) and the Toxic Release Inventory (TRI), common in environmental strategy research, has been subject to criticism (Entine, 2003; Toffel and Marshall, 2004). Verifying that such proxies accurately measure environmental strategy, and thus align theoretical and empirical conceptualizations of environmental strategy, has implications for future research in this area.
2 - IESE Business School-University of Navarra
In this paper we apply an inductive approach to develop a set of measures for environmental strategy, validate them, and establish their congruency with the theoretical underpinnings of the NRBV (Hoskisson et al, 1993; Schwab, 1980; Venkatraman and Grant, 1986). The main purpose of this article is to address empirical gaps in environmental strategy research by assessing the reliability and content, convergent, discriminant and predictive validities of various measures of corporate environmental activity. To do this, we first conducted a content analysis of corporate reports. This analysis allowed us to identify main environmental capabilities. We later contrasted these capabilities against NRBV formulations to secure theoretical consistency. Finally, we use a multi-trait multi-method approach (Campbell and Fiske, 1959), exploratory as well as confirmatory factor analyses (e.g., Hoskisson et al, 1993), and regression analysis to determine predictive validity (Kerlinger and Lee, 2000).
This study makes several contributions to the literature. First, we discover the dimensions of what may be considered the NRBV of the company by conducting a content analysis of corporate annual reports. Second, we operationalize the dimensions with a set of measures of environmental capabilities and show that the concept of “environmental strategy” is a multi-dimensional construct. This provides scholars with a clear guide about “what to look for” when conducting future research in the area. Third, we compare our environmental strategy measure with other proxies often used by researchers in the field to establish the convergent and discriminant construct validity of the measure. Finally, we demonstrate the construct and predictive validities of the environmental strategy measure and a KLD measure that captures environmental proactive behavior of firms.
Literature Review A corporate environmental strategy can be described as set of initiatives that mitigate the impact of a company’s activities on the natural environment through “products, processes and policies such as reducing energy consumption and waste generation, using ecologically sustainable resources, and implementing an environmental management system” (Bansal and Roth, 2000: 717). The natural resource-based view has become a dominant theoretical paradigm in the environmental strategy literature (Hart, 1995; Sharma and Aragón-Correa, 2005). It is an extension of the resource-based view of the company, which emphasizes that internal resources or capabilities, if valuable, rare, inimitable and without equivalent substitutes, creates sustainable competitive advantage because they are path dependent, causally ambiguous and socially complex (Barney, 1991).
In the case of environmental strategy, such skills are exhibited in continuous improvement to lower costs (tacit), integrating stakeholders to preempt competition (socially complex), and a shared vision of sustainable development that secures a company’s future position (rare) (Hart, 1995). Capabilities can be developed sequentially (Wernerfelt, 1984), or, when pertaining to environmental strategy, may also be built in parallel because of the path dependence and social embeddedness of environmental issues (Hart, 1995). In the literature, an environmental strategy that bestows competitive advantage is described as: future-oriented and going beyond compliance regulation (Aragón-Correa, 1998); implementing pollution prevention technologies through product and process (re)design or adaptation (Marcus and Geffen, 1998; Christmann, 2000); and, is reflected in managerial and corporate values and integrated into management systems and business strategy (Hart, 1995; Russo and Fouts, 1997). As a first step towards integration and reinvention of a business interface with the natural environment, developing “environmental capabilities” may allow companies to lower production costs, create a first-
IESE Business School-University of Navarra - 3
mover advantage, integrate across functions, learn and innovate (Christmann, 2000; Hart, 1995; Russo and Fouts, 1997; Sharma, 2000; Sharma and Vredenburg, 1998; Shrivastava, 1995).
Researchers argue that companies invest in capability development because intercompany differences create differential rents (Peteraf, 1993). Yet, capabilities consist of specific processes that are common across companies (otherwise the RBV is not generalizable), as integrated business functions and expertise, or reconfigured existing resources (Eisenhardt and Martin, 2000). Hence, it should be possible to identify common capabilities in companies that adopt proactive environmental strategy approaches.
Based on the literature review, we induced the dimensions of a company’s environmental strategy using a grounded theory approach (Glaser and Strauss, 1967). This approach helped us understand which capabilities companies were developing with respect to developing an environmental strategy. We focused on large U.S. S&P 500 companies in the manufacturing and primary industries (SIC code < 5000) for whom environmental issues are particularly salient (Hart and Ahuja, 1996).
To study the capabilities that companies were building for environmental strategy, we conducted a content analysis of environmental, annual and other reports published by companies that contained details on their environmental activities. Annual reports are often useful to study organizational behavior and strategy because they provide comparable sets of data and represent an account of an organization’s activities (Arndt and Bigelow, 2000; Bettman and Weitz, 1983; Bowman, 1984; Salancik and Meindl, 1984; Staw, McKechnie and Puffer, 1983). Similarly, environmental reports provide comparable data on the organizations’ environmental activities in terms of topics that are covered and comprehensiveness of data presented (Morhardt, 2001). The emergence of standardized environmental reporting systems such as the Global Reporting Initiative (GRI), introduced in 2000, has continued to ensure environmental reports are the overarching outlet for organizations to account for their environmental activities.
Thus, to collect data on environmental activities, we first searched for environmental reports, which 83 of the companies in our sample produced. Not all companies publish environmental reports annually, so if the report for 2003 was unavailable, we chose the environmental report produced in the closest year to 2003. If companies did not produce any environmental reports at all, we searched for this information in other company reports such as annual reports/10-K filings (106 firms) or the environmental pages, products or policy statements (60 firms) on the company’s website. Out of the 213 companies in our sample, 184 provided some kind of information about their environmental activities.
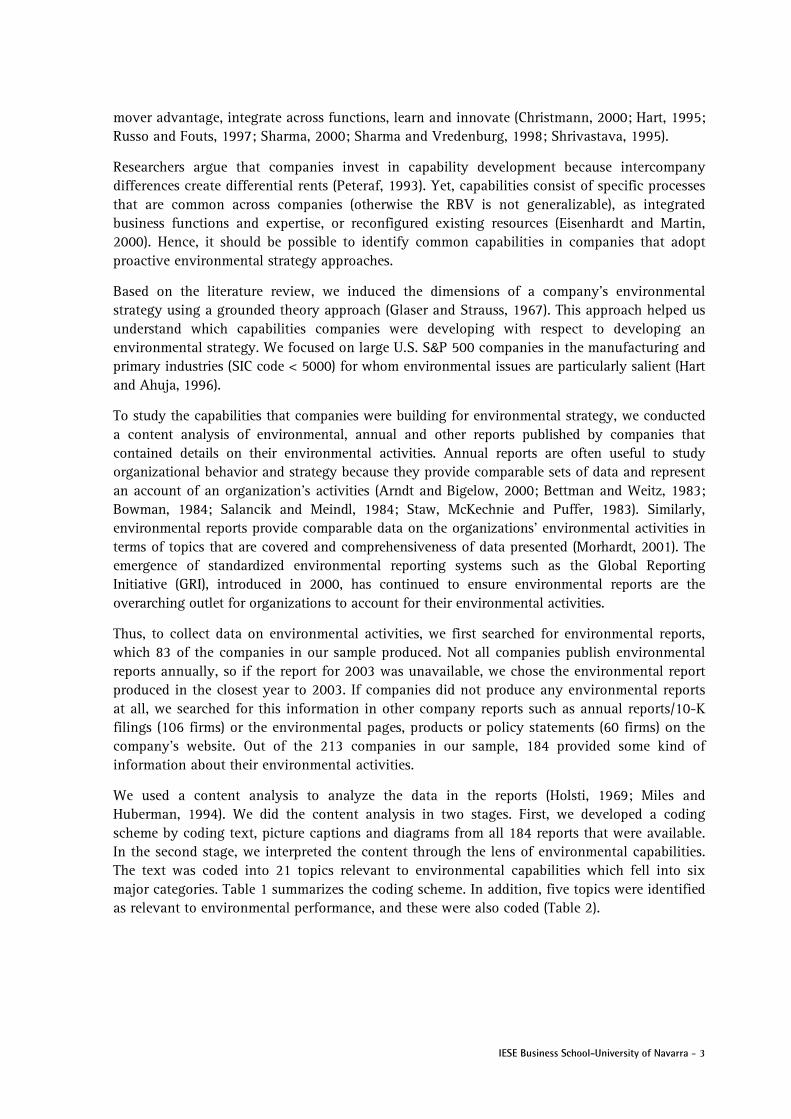
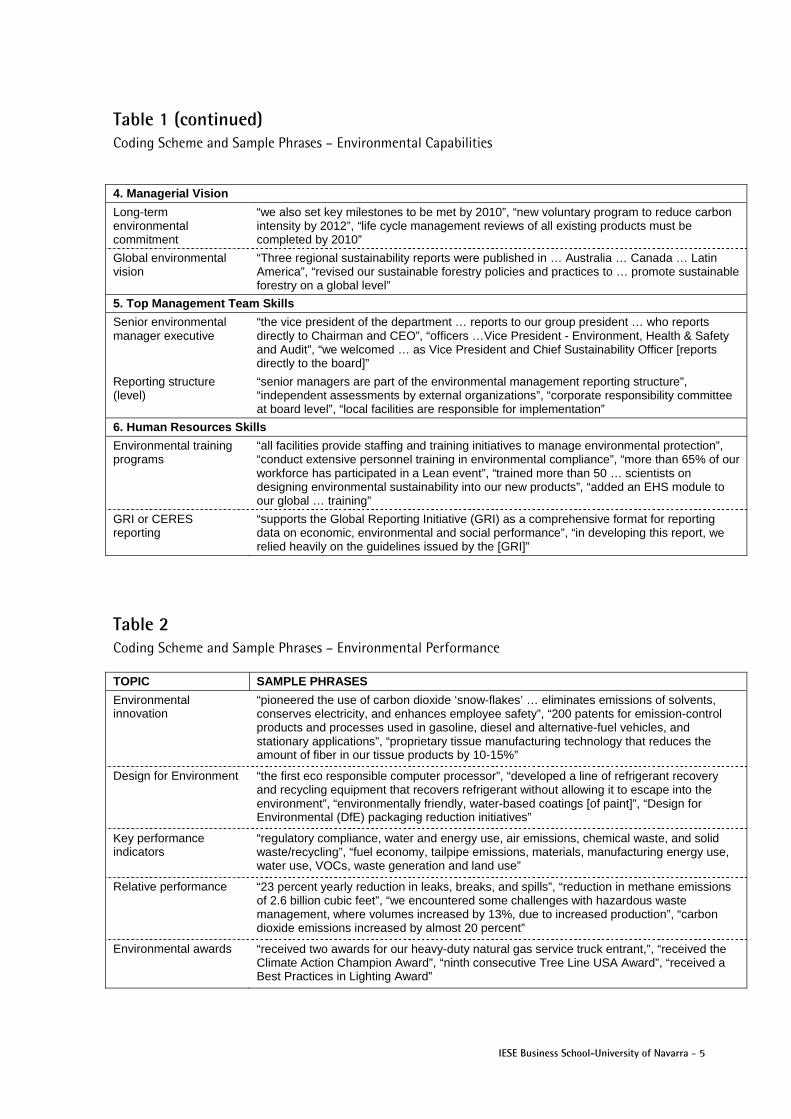
We used a content analysis to analyze the data in the reports (Holsti, 1969; Miles and Huberman, 1994). We did the content analysis in two stages. First, we developed a coding scheme by coding text, picture captions and diagrams from all 184 reports that were available. In the second stage, we interpreted the content through the lens of environmental capabilities. The text was coded into 21 topics relevant to environmental capabilities which fell into six major categories. Table 1 summarizes the coding scheme. In addition, five topics were identified as relevant to environmental performance, and these were also coded (Table 2).
4 - IESE Business School-University of Navarra
Table 1 Coding Scheme and Sample Phrases – Environmental Capabilities
TOPIC SAMPLE PHRASES
1. Historical Orientation
History of implementing an env’tal program
“Our commitment to sustainability has a long history”, “as early as 1928, our electric subsidiary … installed electrostatic precipitators to reduce particulate emissions”, “adopted its Environmental Policy in February 1975”
2a. Network Embeddedness: Supply Chain
Supplier policies “suppliers must be committed to reducing the environmental impact of their designs, manufacturing processes, and waste emissions … legal compliance to laws on chemicals, waste … endeavor to reduce or eliminate waste of all types”, “suppliers have committed to … sustainable forest management standard … certification process requires independent … audit”
Buyer policies “products must be designed, engineered, installed and supported to achieve customers’ production needs and their EHS objectives”, “recycled more than 8 million tires through dealership collection programs”, “ISO certification to meet customer requirements”
Life cycle analysis or product stewardship
“implemented a comprehensive product stewardship program to manage EHS issues concerning the chemical content of products, direct materials and packing materials”, “product life cycle principles are being applied to acquired products and during the development of new products …and during the design phase”
Industrial symbiosis activities
“facility recovers starch released during cutting operations, which is then sold to outside companies for further processing and use in products”, “unavoidable potato residuals generated during processing are sold as animal feed”
2a. Network Embeddedness: Other Stakeholders
Government relationships
“cooperate with federal, state and local government agencies in … developing a cost effective, performance-based environment, safety and health policy”, “working with members of Congress … to urge the U.S. …not to abandon the rule prohibiting roads from being built in currently protected forests”
NGO relationships “pipe was donated to three different wildlife refuges in California for use in watershed habitat maintenance”, “spent nearly $300,000 to fund the installation of hack boxes and hack tower material to reintroduce peregrine falcons to the Big River habitats”
Business/industry associations
“participate in the Global Roundtable on Climate Change”, “member of the Business for Social Responsibility (BSR)”, “participate in conferences, industry-working groups on specific projects such as cleaner transportation”
Community programs “a statewide initiative to teach young people about renewable energy technologies”, “community and environmental commitment through employee volunteerism programs, corporate donation campaigns, and environmental education and curriculum development programs”
Employee programs “instituted programs to reduce air emissions from employees’ vehicles traveling to and from work”, “more than 600 … environmental activities are being undertaken … by our employees”, “actively support employee volunteerism … donate $10 for every qualifying hour of volunteer work”
Socially responsible shareholders
“proudly listed in the Dow Jones Sustainability Index, Calvert Social Index and the Domini 400 Social Index”, “met with 15 SRI firms”, “increased shareholder value through EHS commitment”, “CSR analyst meetings”
Voluntary programs “entered into voluntary cleanup agreements … with the Department of Environmental Conservation”, “joined U.S. EPA Climate Leaders Partnership to work towards a voluntary commitment to reduce greenhouse gases”
3. Endowments
ISO certification “half of our locations are ISO14001 certified”, “all our facilities worldwide are expected to comply with our corporate Environmental Protection Program, which is aligned with ISO 14001”
Environmental management system
“we are using Six Sigma to reduce the amount of wood waste from ‘cut direct’ saws by 50 percent”, “environmental management system being developed at facility by facility basis”
Investment into environmental R&D
“investing $1.5 billion over the next several years in environmental systems that will significantly reduce emissions of SO2 and NOx at our power plants”, “$82 million in environmental spending”, “invested more than $4 million on research in the pursuit of a ‘zero-discharge’ water-recycling technology”
IESE Business School-University of Navarra - 5
Table 1 (continued) Coding Scheme and Sample Phrases – Environmental Capabilities
4. Managerial Vision
Long-term environmental commitment
“we also set key milestones to be met by 2010”, “new voluntary program to reduce carbon intensity by 2012”, “life cycle management reviews of all existing products must be completed by 2010”
Global environmental vision
“Three regional sustainability reports were published in … Australia … Canada … Latin America”, “revised our sustainable forestry policies and practices to … promote sustainable forestry on a global level”
5. Top Management Team Skills
Senior environmental manager executive
“the vice president of the department … reports to our group president … who reports directly to Chairman and CEO”, “officers …Vice President - Environment, Health & Safety and Audit”, “we welcomed … as Vice President and Chief Sustainability Officer [reports directly to the board]”
Reporting structure (level)
“senior managers are part of the environmental management reporting structure”, “independent assessments by external organizations”, “corporate responsibility committee at board level”, “local facilities are responsible for implementation”
6. Human Resources Skills
Environmental training programs
“all facilities provide staffing and training initiatives to manage environmental protection”, “conduct extensive personnel training in environmental compliance”, “more than 65% of our workforce has participated in a Lean event”, “trained more than 50 … scientists on designing environmental sustainability into our new products”, “added an EHS module to our global … training”
GRI or CERES reporting
“supports the Global Reporting Initiative (GRI) as a comprehensive format for reporting data on economic, environmental and social performance”, “in developing this report, we relied heavily on the guidelines issued by the [GRI]”
Table 2 Coding Scheme and Sample Phrases – Environmental Performance
TOPIC SAMPLE PHRASES
Environmental innovation
“pioneered the use of carbon dioxide ‘snow-flakes’ … eliminates emissions of solvents, conserves electricity, and enhances employee safety”, “200 patents for emission-control products and processes used in gasoline, diesel and alternative-fuel vehicles, and stationary applications”, “proprietary tissue manufacturing technology that reduces the amount of fiber in our tissue products by 10-15%”
Design for Environment “the first eco responsible computer processor”, “developed a line of refrigerant recovery and recycling equipment that recovers refrigerant without allowing it to escape into the environment”, “environmentally friendly, water-based coatings [of paint]”, “Design for Environmental (DfE) packaging reduction initiatives”
Key performance indicators
“regulatory compliance, water and energy use, air emissions, chemical waste, and solid waste/recycling”, “fuel economy, tailpipe emissions, materials, manufacturing energy use, water use, VOCs, waste generation and land use”
Relative performance “23 percent yearly reduction in leaks, breaks, and spills”, “reduction in methane emissions of 2.6 billion cubic feet”, “we encountered some challenges with hazardous waste management, where volumes increased by 13%, due to increased production”, “carbon dioxide emissions increased by almost 20 percent”
Environmental awards “received two awards for our heavy-duty natural gas service truck entrant,”, “received the Climate Action Champion Award”, “ninth consecutive Tree Line USA Award”, “received a Best Practices in Lighting Award”

6 - IESE Business School-University of Navarra
Nearly 5,000 items were coded, and reliability was tested via a content analysis of a sub-sample of reports. We randomly selected 300 items for coding by an independent researcher which yielded a Chronbach’s alpha of 91.25%. Coding of most of the items was converted to a binary format of whether or not the company performed the activity. The value of the items was then aggregated per category. For example, in the case of the “supply chain network,” if a company had a supplier policy and a product stewardship program, but did not have a buyer policy or industrial symbiosis activities, the total score was 2 (out of a possible 4). Some items were coded on a sliding scale to convert a number of years, dollar amount or level of reporting into a scale. These included: history of implementing an environmental program, ISO certification, investment into environmental R&D, long-term environmental commitment and reporting structure. In addition, three items related to environmental performance were coded on scales: key performance indicators, relative performance and environmental awards. Table 3 provides an overview of items that were scales rather than binary.
Table 3 Overview of Items Converted to Scales
Measurement Item Scale
History of implementing an environmental program 0: no history 1: 1-10 years 2: 11-20 years 3: 21-30 years 4: > 30 years
ISO certification 0: none 1: some sites 2: all sites
Investment in environmental R&D 0: $0-$399mil 1: $400mil - $1.6bn 2: > $1.6bn
Long-term environmental commitment 0: none 1: statement made 2: vision is 5 years or longer
Reporting structure (level) 0: none 1: local/facility level 2: senior mgmt team 3: board or external auditors
Key performance indicators (identified four main indicator categories: air, waste, water and energy)
0: none 1: one indicator 2: two indicators 3: three indicators 4: four indicators
Relative performance 1: generally worse 2: about the same 3: generally better
Environmental awards 0: none 1: 1-5 awards 2: 6-10 awards 3: > 10 awards
IESE Business School-University of Navarra - 7
Our content analysis, supported by our review of the literature, revealed six common “environmental capabilities” across firms: historical orientation, network embeddedness, endowments, managerial vision, top management team skills and human resources. As discussed next, each of these is analogous to those proposed by the NRBV because they are path –dependent and socially complex. We also outline how each variable can be operationalized based on the results of our inductive research.
Historical Orientation. A company’s path through time and space and the unique historical conditions of its establishment dictate how it acquires and exploits resources, and therefore how well it performs (Arthur, 1989; Barney, 1991). History can bestow companies with competitive advantage: preferential locations, founding conditions, scientific breakthroughs and values and beliefs that dominate the period, all contribute to the development of company-specific capabilities. Environmental capabilities are no different. For example, the development of environmental capabilities often begins as a reflection of the institutional environment at a point in history with a reactive approach of pollution control that later builds up towards a proactive goal of sustainable development (Hart, 1995; Hoffman, 1999).
By forming a reactive approach, companies build a foundation of addressing environmental issues. Having a “foot-in-the-door” approach of dealing with the natural environment makes it easier to gain support for future environmental projects, especially if past experiences were successful (Cordano and Frieze, 2000). In addition, actively seeking opportunities to improve environmental performance becomes a part of the corporate culture and identity (Sharma, 2000). Companies with a strong history in environmental strategy are more likely to consider the environmental impact of new strategies, products and processes. They are also more likely to spread environmental values throughout their supply chain in their relationships with buyers, suppliers, consumers and peers. Therefore, the longer a company’s history of having an environmental strategy, the more likely it is to have built environmental capabilities. In our inductive analysis, “historical orientation” emerged as a scale of the years since a company had implemented an environmental program.
Network Embeddedness. A network is a set of linkages among organizations characterized by specified relationships based on a) resource transfers such as money, information, power, commitment or personnel, or b) interpenetration of organizational boundaries through shared interest groups (Laumann, Galaskiewicz and Marsden, 1978). Networks are strategically important because they allow companies to respond to their interdependence with the general external environment (Pfeffer and Salancik, 1978; Uzzi, 1999) by having access to the right resources, identifying opportunities, matching expectations and gaining control over information (Burt, 1997; Lenz, 1980). The ability of organizations to generate resources is partly determined by their networks (Lenz, 1980). Because networks evolve over time, they are path-dependent and become a capability of the company (Freeman and Barley, 1990; Lenz, 1980). Networks are, furthermore, socially complex and difficult to imitate.
Access to networks is particularly critical for corporate environmental strategy because environmental issues are extremely complex and thus require companies to possess interdisciplinary skills and coordinate their environmental response with others (Roome, 1992). In terms of environmental strategy, networks fall into two groups: companies along the product supply chain acting as suppliers and buyers; and other stakeholders such as governments, employees, NGOs, or “any group or individual who can affect or is affected by the attainment of the organization’s objectives” (Freeman, 1984: 46). The “supply chain network” has a direct impact on a company’s production process and therefore also on its environmental performance
8 - IESE Business School-University of Navarra
by engaging with outsiders and sharing information along the product supply chain (Cerin and Karlson, 2002; Marcus and Geffen, 1998). The “other stakeholder network,” on the other hand, influences environmental strategy through social pressure and can determine the type of environmental strategy a company pursues (Delmas and Toffel, 2007). In response to stakeholder influence, companies can develop specific environmental strategies such as eco-design and ecosystem stewardship (Sharma and Henriques, 2005). By addressing stakeholder concerns, companies develop trust and credibility and build a good corporate reputation, an intangible resource (Sharma and Vredenburg, 1998; Russo and Fouts, 1997). Networking, thus, represents a socially complex environmental skill that forms a competitive advantage for environmental strategy (Delmas and Toffel, 2004; Hart, 1995; Henriques and Sadorksy, 1999). Our content analysis suggests that “supply chain network” can be measured as a reflection of companies’ engagement with suppliers and buyers, their product stewardship efforts, or engagement in material exchange (industrial symbiosis) with other companies. In turn, the “other stakeholder network” is a reflection of a company’s association with governments, NGOs, industry associations, communities, employees, socially responsible investors and voluntary programs.
Endowments. Companies can build competitive advantage through the accumulation of assets over time. Such endowments become an asset stock for the company as a result of a consistent pattern of resource flows through appropriate choices of expenditure and building resources and skills (Dierickx and Cool, 1989). This is a path-dependent process and a causally-ambiguous resource because it allows companies to achieve goals more quickly than competitors. Asset stocks are also interconnected with other stocks and subject to continual reinvestment to forestall erosion (Dierickx and Cool, 1989). Endowments can appear in the form of physical assets or structures in the form of organizational slack. Organizational slack is the cushion of currently-accessible or potentially-accessible resources that allow organizations to respond to pressure, initiate strategic change, champion causes and facilitate innovative or creative behavior (Bourgeois, 1981; Singh, 1986). Slack allows companies to retain earnings for reinvestment, particularly useful if the company wants to invest in long-term projects such as environmental strategy.
An effective environmental strategy requires continual and considerable reinvestment (Darnall and Edwards, 2006). Companies that possess long-term endowments can more easily build environmental capabilities because it allows them to invest in technological leadership and exploit opportunities (Aragón-Correa, 1998). In particular, the greater the degree of discretionary slack –that which is within the latitude of managerial action– the more likely it is that managers can address environmental issues (Sharma, 2000). Slack permits flexibility, and companies with slack respond in a timelier manner to changes in environmental technologies (Aragón-Correa, Matías-Reche and Senise-Barrio, 2004). Thus, endowments and related slack allow companies to build proactive environmental strategies. “Endowments,” in our analysis, is a combination of the amount of money a company invests in environmental research and development (scale) and supporting structures, such as an environmental management system or an ISO-14001 certified environmental process that would create the necessary slack to maximize the endowment.
Managerial Vision. “Visioning” is the process of projecting a desired future organizational state that, when effectively communicated, empowers followers to enact the vision (c.f. Westley and Mintzberg, 1989). Visionary leadership may result from an individual’s capacity for imagination, inspiration, insight, foresight or sagacity, and can be directed to focus on products, processes, the market, the organization or ideals (Westley and Mintzberg, 1989). Visionary leadership benefits company performance, attitudes of followers, creates cohesion among the top management team, and has a positive influence on corporate citizenship (c.f. Groves, 2006). Visionary leadership furthermore positively influences values of corporate social
IESE Business School-University of Navarra - 9
responsibility towards shareholders, stakeholders and the community at large (Waldman et al, 2006). Managerial vision is also important for building internal interdependencies and interrelationship within organizations (Dierickx and Cool, 1989). Vision is particularly important when uncertainty is high and actions are difficult to contract, and managers with strong visions will tend to attract employees with similar beliefs (Van den Steen, 2005).
Visionary leadership is a unique capability because such leaders are difficult to “make.” In addition, a complex or internally interdependent organization is difficult for competitors to copy because it cannot be systematically managed or influenced (Barney, 1991; Child, 1972). Environmental strategies require visionary leadership because the success of environmental strategies depends on long-term commitment and investment (Hart, 1995). Vision prioritizes the environment on the corporate agenda: managers can champion and gear functional, departmental and production processes towards environmental goals (Andersson and Bateman, 2000). Our analysis indicates that managerial vision of environmental strategy can be measured in terms of the time dimension of the environmental vision (short- or long-term goals have been set) and the depth of the vision across the organization (global or not).
Top Management Skills. Managerial skills may be generic (transferable), business- or industry-related, or company-specific (such as knowhow), and used to make operational and strategic decisions that build competitive advantage (Castanias and Helfat, 1991). Superior management skills are a source of economic rent (Penrose, 1959) and difficult for competitors to imitate as they are company-specific (Barney, 1991). The competitive advantage of top managers comes not just from within the company, but also through the managers’ connections within the business environment. Evidence suggests that, for example, the ability to network along the supply chain and stakeholders through reciprocal relationships based on trust (increasingly known as “guānxi”1) confers competitive advantage (Tsang, 1998).
A successful environmental strategy is likely to require managerial competencies in combination with other company-specific capabilities (Russo and Fouts, 1997). Implementing environmental strategic initiatives requires tight internal integration and coordination, as well as stable external partnerships (Dechant and Altman, 1994) which require a talented top-management team. The role of managers in environmental strategy is one of central coordination, integration and connections with others to source for talent, ideas and technologies (Marcus and Geffen, 1998). To do so, environmental managers must have some tenure with the company and relevant functional experience in environmental issues (Aragón-Correa et al, 2004). In our content analysis “top management team” environmental skills are assessed by whether the environmental manager is on the executive team, and by the reporting level of the environmental manager (a scale of local or facility level, to senior management team or the board).
Human Resources. Human resources are firm-specific capabilities that can bestow competitive advantage (Barney, 1991). Particularly, human resources can be a unique capability if a company’s HR practices differ from most of its peers, were developed through trial-and-error (path-dependent), consist of continual investment, and are highly-integrated with other company resources (socially complex), and cannot be substituted by planning systems (non-substitutable) (Lee, Phan and Chan, 2005).
1 The basic dynamic in personalized networks of influence; a central concept in Chinese society.
10 - IESE Business School-University of Navarra
Human resources are an important capability for the development of environmental strategies because dealing with environmental issues requires expert knowledge and specific incentives (Wehrmeyer, 1996). Such experience may not necessarily rest within the firm, but can be brought in by hiring professionals or experts. Indeed, the more companies search for talent and ideas externally, the more likely they will be able to build environmental capabilities if they can harmonize the external learning within the company (Marcus and Geffen, 1998). It is also thought that companies that evaluate managers on environmental performance criteria are more likely to develop environmental capabilities (Sharma, 2000). In our analysis, two processes that companies may have in place appear to be relevant to “human resources” skills for environmental strategy. These include a formal environmental training program and environmental reporting, both of which indicate the presence of HR skills related to the environment.
Methods
Sample and Measures
Our sample included 184 companies from the U.S. S&P 500 companies in 22 manufacturing and primary industries by 2-digit SIC code. We excluded companies who did not report any type of environmental information, in order to avoid artificial inflation of reliability and validity measures and factor analyses.
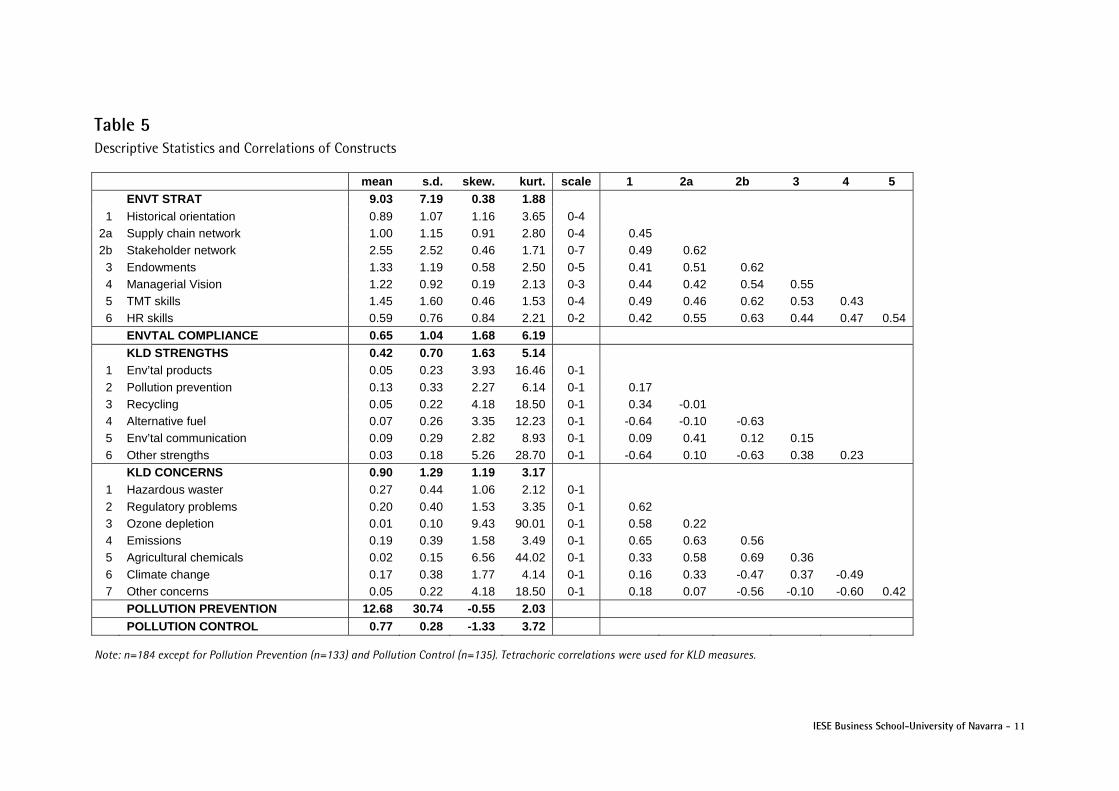
Our measure of environmental strategy was inductively derived from the content analysis described earlier, consisting of six environmental capabilities. Most companies (83.2%) had at least one environmental capability. After testing for construct validity and reliability, we aggregated the capabilities into a single environmental strategy construct. Table 5 provides descriptive statistics and an overview of the scale of each measure.
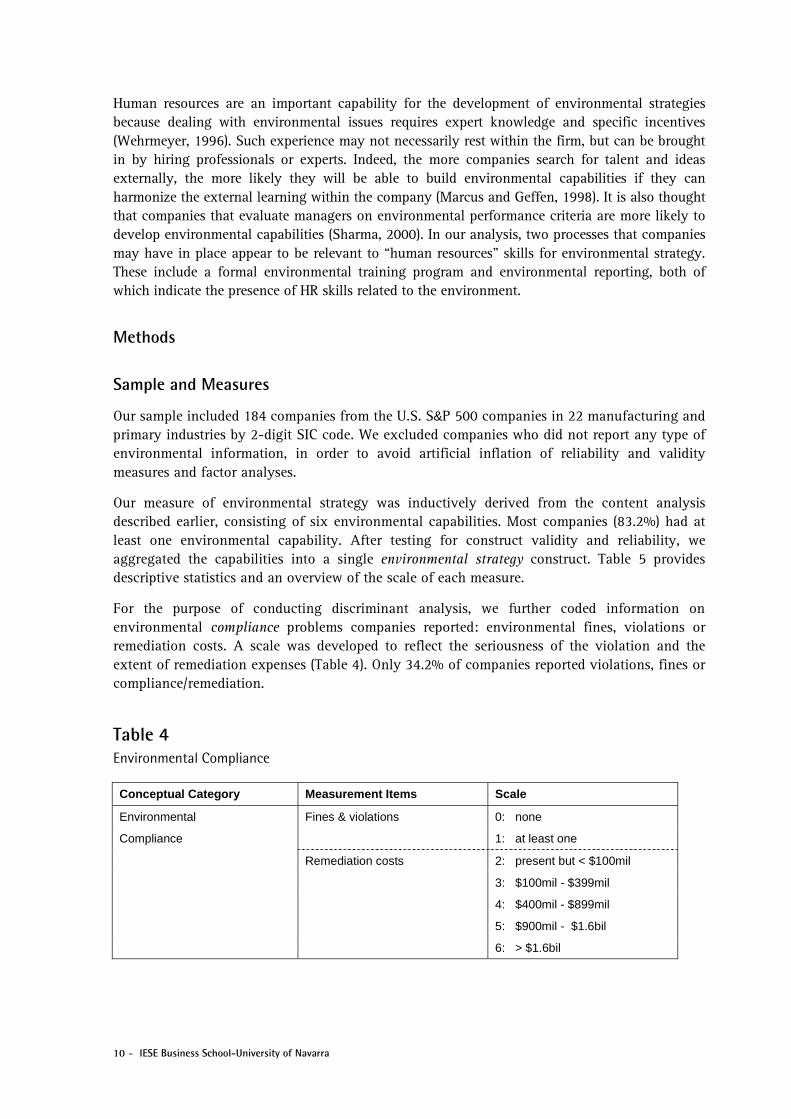
For the purpose of conducting discriminant analysis, we further coded information on environmental compliance problems companies reported: environmental fines, violations or remediation costs. A scale was developed to reflect the seriousness of the violation and the extent of remediation expenses (Table 4). Only 34.2% of companies reported violations, fines or compliance/remediation.
Table 4 Environmental Compliance
Conceptual Category Measurement Items Scale
Environmental Fines & violations 0: none
Compliance 1: at least one
Remediation costs 2: present but < $100mil
3: $100mil - $399mil
4: $400mil - $899mil
5: $900mil - $1.6bil
6: > $1.6bil
IESE Business School-University of Navarra - 11
Table 5 Descriptive Statistics and Correlations of Constructs
mean s.d. skew. kurt. scale 1 2a 2b 3 4 5 ENVT STRAT 9.03 7.19 0.38 1.88
1 Historical orientation 0.89 1.07 1.16 3.65 0-4 2a Supply chain network 1.00 1.15 0.91 2.80 0-4 0.45 2b Stakeholder network 2.55 2.52 0.46 1.71 0-7 0.49 0.62
3 Endowments 1.33 1.19 0.58 2.50 0-5 0.41 0.51 0.62 4 Managerial Vision 1.22 0.92 0.19 2.13 0-3 0.44 0.42 0.54 0.55 5 TMT skills 1.45 1.60 0.46 1.53 0-4 0.49 0.46 0.62 0.53 0.43 6 HR skills 0.59 0.76 0.84 2.21 0-2 0.42 0.55 0.63 0.44 0.47 0.54
ENVTAL COMPLIANCE 0.65 1.04 1.68 6.19 KLD STRENGTHS 0.42 0.70 1.63 5.14
1 Env’tal products 0.05 0.23 3.93 16.46 0-1 2 Pollution prevention 0.13 0.33 2.27 6.14 0-1 0.17 3 Recycling 0.05 0.22 4.18 18.50 0-1 0.34 -0.01 4 Alternative fuel 0.07 0.26 3.35 12.23 0-1 -0.64 -0.10 -0.63 5 Env’tal communication 0.09 0.29 2.82 8.93 0-1 0.09 0.41 0.12 0.15 6 Other strengths 0.03 0.18 5.26 28.70 0-1 -0.64 0.10 -0.63 0.38 0.23
KLD CONCERNS 0.90 1.29 1.19 3.17 1 Hazardous waster 0.27 0.44 1.06 2.12 0-1 2 Regulatory problems 0.20 0.40 1.53 3.35 0-1 0.62 3 Ozone depletion 0.01 0.10 9.43 90.01 0-1 0.58 0.22 4 Emissions 0.19 0.39 1.58 3.49 0-1 0.65 0.63 0.56 5 Agricultural chemicals 0.02 0.15 6.56 44.02 0-1 0.33 0.58 0.69 0.36 6 Climate change 0.17 0.38 1.77 4.14 0-1 0.16 0.33 -0.47 0.37 -0.49 7 Other concerns 0.05 0.22 4.18 18.50 0-1 0.18 0.07 -0.56 -0.10 -0.60 0.42
POLLUTION PREVENTION 12.68 30.74 -0.55 2.03 POLLUTION CONTROL 0.77 0.28 -1.33 3.72
Note: n=184 except for Pollution Prevention (n=133) and Pollution Control (n=135). Tetrachoric correlations were used for KLD measures.
12 - IESE Business School-University of Navarra
Other data came from external providers. We chose to use information from a ratings agency, Kinder, Lydenberg and Domini (KLD), and variables calculated from the Toxic Release Inventory (TRI) often used by researchers in this field as proxies for environmental strategy. KLD’s data has been used extensively in academia (Graves and Waddock, 1994; Johnson and Greening, 1999; McWiliams and Siegel, 2000; Neubaum and Zahra, 2006; Waddock and Graves, 1997). KLD compiles data on several categories within both environmental strengths and environmental concerns (Appendix A).2 Each category was binary to indicate whether the company performed the activity. We aggregated the category scores for a total respective score of KLD strengths and KLD concerns, attributing equal weights to the categories. The maximum possible KLD strengths score was 6, and the maximum possible KLD concerns score was 7.
TRI data is another well established and often used measure of corporate environmental impact (King and Lenox, 2002; Klassen and Whybark, 1999; Russo and Harrison, 2005). TRI data consists of toxic emissions via air, water, land or underground injection that must be reported to the Environmental Protection Agency (EPA). Since emissions are not the same as harmful exposure (EPA, 2002), some studies have tried to mitigate this shortcoming by weighting emissions, using “reportable quantities” to account for the toxicity levels of chemical agents (e.g., King and Lenox, 2000; King and Lenox, 2002; Russo and Harrison, 2005). However, Toffel and Marshall (2004) argued that this is also problematic. To account for risks associated to human health and obtain a more precise measure, we weighted chemicals using the Human Toxicity Potential Factor (HTP) developed by Hertwich and colleagues (2001), which measures toxicity in terms of benzene equivalence (for carcinogens) or toluene equivalence (for non-carcinogens). Each of the two measures, one for carcinogenic and one for non-carcinogenic emissions, were aggregated across chemicals at facility level and then to parent company. The next step was to calculate the predicted value of pollution, by estimating total waste generation levels using production ratios in the prior year reported by TRI, and compare these against actual levels (King and Lenox, 2000; King and Lenox, 2002). If actual waste was lower than predicted, the pollution prevention measure would yield positive results. This measure has been recently validated by Berrone and Gómez-Mejía (in press). Because these two measures were highly skewed, we log-transformed them. The carcinogenic and non-carcinogenic measures were aggregated for a final measure of pollution prevention. In addition, an end-of-pipe pollution control measure was calculated as a ratio of the sum of chemicals recycled, treated on-site, and transferred to other locations for further treatment divided by the total waste generated by the company (King and Lenox, 2001; King and Lenox, 2002; King and Lenox, 2004; Sarkis and Cordeiro, 2001).
Estimation Techniques
Analysis was conducted in several stages using multiple techniques. First, the theoretical underpinnings of the environmental strategy measure based on the six capabilities were tested. Content validity is established since the scale was constructed according to theoretical development (Nunnally and Bernstein, 1994). To test the validity of the environmental strategy construct, we split our same sample to conduct exploratory factor analysis on part of the data set, and a confirmatory factor analysis on the rest of the data (Bollen, 1989). We used a factor extraction method (principal factors) with quartimin oblique rotation for the factor analyses to identify whether environmental strategy was a latent construct of the six environmental capability measurement items (Bartholomew et al, 2002; Fabrigar et al, 1999).
2 KLD also provides data on a number of other social responsibility measures. We used only the measures related to environmental initiatives of firms: “environmental strengths” and “environmental concerns.”
IESE Business School-University of Navarra - 13
We used a multi-trait multi-method matrix to test for convergent and discriminant validity (Campbell and Fiske, 1959). This approach uses more than one method and more than one trait to check that correlations converge between different methods measuring the same trait, but are not too high with other traits from which they were intended to differ (Campbell and Fiske, 1959). In this methodology a matrix is established in which the diagonal entries are reliability scores (Cronbach’s alphas) for mono-trait mono-method measures as an indicator of internal reliability. These scores should be significantly different from zero as evidence of convergent validity. In addition, validity diagonals are correlations between mono-trait hetero-method values as measures of convergent validity, and these should be higher than the values in adjacent columns and rows in the hetero-trait hetero-method triangles to establish discriminant validity (Campbell and Fiske, 1959).
Finally, we used regression analysis to establish predictive validity of the measures (Kerlinger and Lee, 2000.) We used environmental performance as an outcome measure. Since this measure was a non-negative count variable, with variance greater than the mean, we applied a negative binomial technique to perform the regression (Cameron and Trivedi, 1998).
Results
Reliability and Validity of Scales, Measures and Constructs
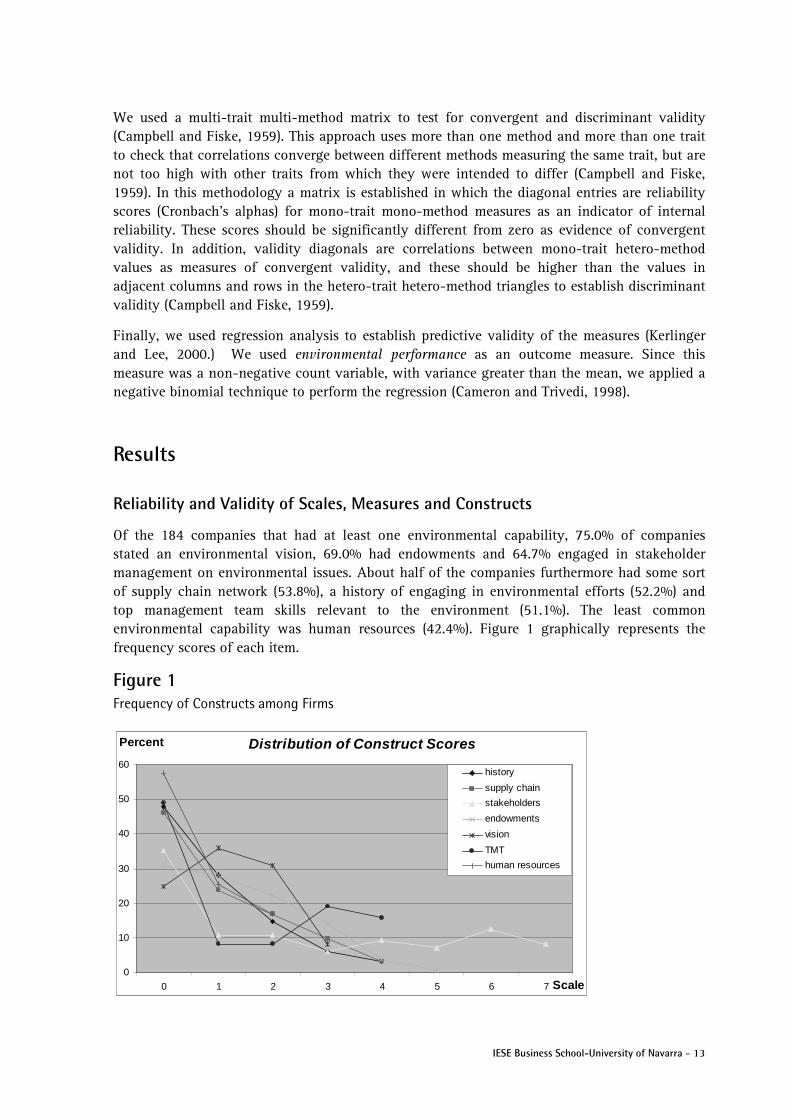
Of the 184 companies that had at least one environmental capability, 75.0% of companies stated an environmental vision, 69.0% had endowments and 64.7% engaged in stakeholder management on environmental issues. About half of the companies furthermore had some sort of supply chain network (53.8%), a history of engaging in environmental efforts (52.2%) and top management team skills relevant to the environment (51.1%). The least common environmental capability was human resources (42.4%). Figure 1 graphically represents the frequency scores of each item.
Figure 1 Frequency of Constructs among Firms
Distribution of Construct Scores
0
10
20
30
40
50
60
0 1 2 3 4 5 6 7 Scale
Percent
history
supply chain
stakeholders
endowments
vision
TMT
human resources
14 - IESE Business School-University of Navarra
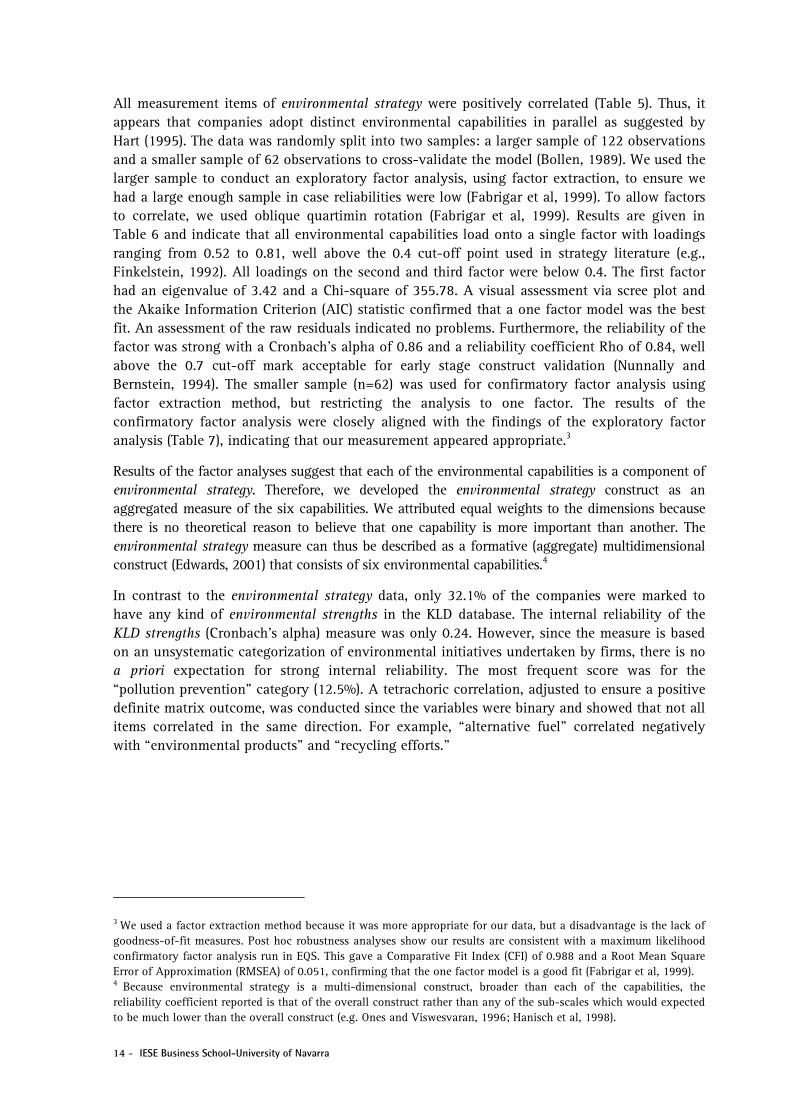
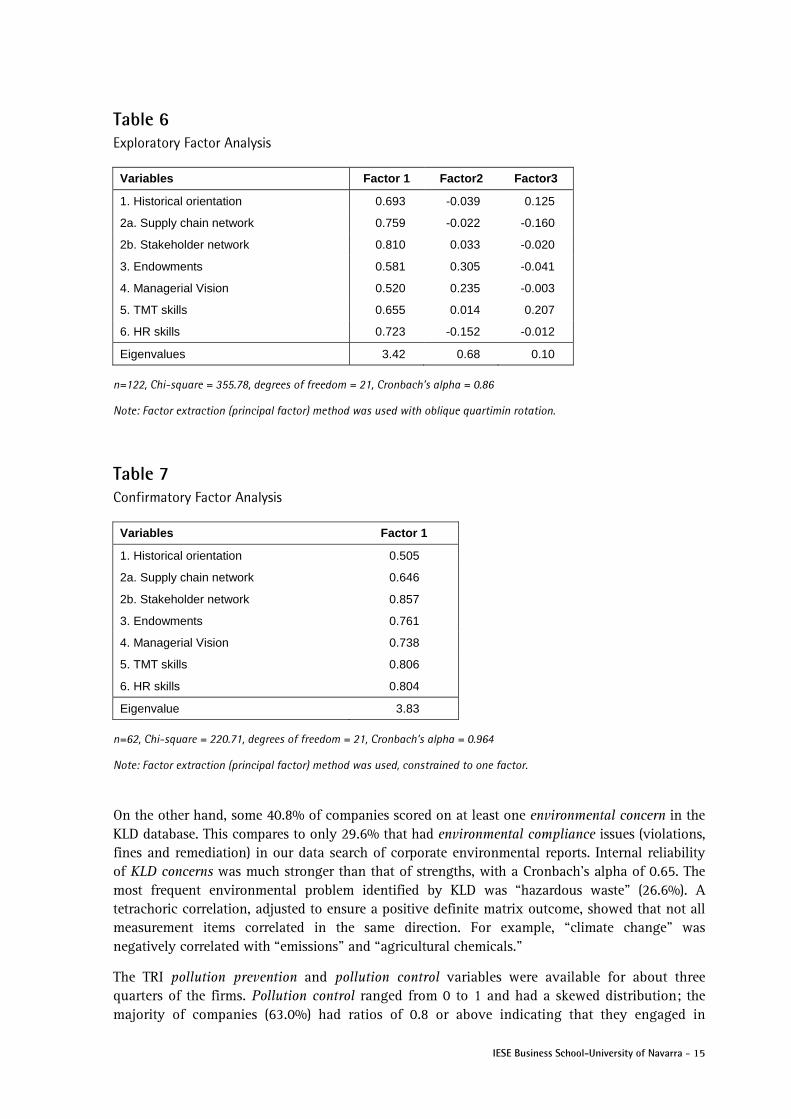
All measurement items of environmental strategy were positively correlated (Table 5). Thus, it appears that companies adopt distinct environmental capabilities in parallel as suggested by Hart (1995). The data was randomly split into two samples: a larger sample of 122 observations and a smaller sample of 62 observations to cross-validate the model (Bollen, 1989). We used the larger sample to conduct an exploratory factor analysis, using factor extraction, to ensure we had a large enough sample in case reliabilities were low (Fabrigar et al, 1999). To allow factors to correlate, we used oblique quartimin rotation (Fabrigar et al, 1999). Results are given in Table 6 and indicate that all environmental capabilities load onto a single factor with loadings ranging from 0.52 to 0.81, well above the 0.4 cut-off point used in strategy literature (e.g., Finkelstein, 1992). All loadings on the second and third factor were below 0.4. The first factor had an eigenvalue of 3.42 and a Chi-square of 355.78. A visual assessment via scree plot and the Akaike Information Criterion (AIC) statistic confirmed that a one factor model was the best fit. An assessment of the raw residuals indicated no problems. Furthermore, the reliability of the factor was strong with a Cronbach’s alpha of 0.86 and a reliability coefficient Rho of 0.84, well above the 0.7 cut-off mark acceptable for early stage construct validation (Nunnally and Bernstein, 1994). The smaller sample (n=62) was used for confirmatory factor analysis using factor extraction method, but restricting the analysis to one factor. The results of the confirmatory factor analysis were closely aligned with the findings of the exploratory factor analysis (Table 7), indicating that our measurement appeared appropriate.3
Results of the factor analyses suggest that each of the environmental capabilities is a component of environmental strategy. Therefore, we developed the environmental strategy construct as an aggregated measure of the six capabilities. We attributed equal weights to the dimensions because there is no theoretical reason to believe that one capability is more important than another. The environmental strategy measure can thus be described as a formative (aggregate) multidimensional construct (Edwards, 2001) that consists of six environmental capabilities.4
In contrast to the environmental strategy data, only 32.1% of the companies were marked to have any kind of environmental strengths in the KLD database. The internal reliability of the KLD strengths (Cronbach’s alpha) measure was only 0.24. However, since the measure is based on an unsystematic categorization of environmental initiatives undertaken by firms, there is no a priori expectation for strong internal reliability. The most frequent score was for the “pollution prevention” category (12.5%). A tetrachoric correlation, adjusted to ensure a positive definite matrix outcome, was conducted since the variables were binary and showed that not all items correlated in the same direction. For example, “alternative fuel” correlated negatively with “environmental products” and “recycling efforts.”
3 We used a factor extraction method because it was more appropriate for our data, but a disadvantage is the lack of goodness-of-fit measures. Post hoc robustness analyses show our results are consistent with a maximum likelihood confirmatory factor analysis run in EQS. This gave a Comparative Fit Index (CFI) of 0.988 and a Root Mean Square Error of Approximation (RMSEA) of 0.051, confirming that the one factor model is a good fit (Fabrigar et al, 1999). 4 Because environmental strategy is a multi-dimensional construct, broader than each of the capabilities, the reliability coefficient reported is that of the overall construct rather than any of the sub-scales which would expected to be much lower than the overall construct (e.g. Ones and Viswesvaran, 1996; Hanisch et al, 1998).
IESE Business School-University of Navarra - 15
Table 6 Exploratory Factor Analysis
Variables Factor 1 Factor2 Factor3
1. Historical orientation 0.693 -0.039 0.125
2a. Supply chain network 0.759 -0.022 -0.160
2b. Stakeholder network 0.810 0.033 -0.020
3. Endowments 0.581 0.305 -0.041
4. Managerial Vision 0.520 0.235 -0.003
5. TMT skills 0.655 0.014 0.207
6. HR skills 0.723 -0.152 -0.012
Eigenvalues 3.42 0.68 0.10
n=122, Chi-square = 355.78, degrees of freedom = 21, Cronbach’s alpha = 0.86
Note: Factor extraction (principal factor) method was used with oblique quartimin rotation.
Table 7 Confirmatory Factor Analysis
Variables Factor 1
1. Historical orientation 0.505
2a. Supply chain network 0.646
2b. Stakeholder network 0.857
3. Endowments 0.761
4. Managerial Vision 0.738
5. TMT skills 0.806
6. HR skills 0.804
Eigenvalue 3.83
n=62, Chi-square = 220.71, degrees of freedom = 21, Cronbach’s alpha = 0.964
Note: Factor extraction (principal factor) method was used, constrained to one factor.
On the other hand, some 40.8% of companies scored on at least one environmental concern in the KLD database. This compares to only 29.6% that had environmental compliance issues (violations, fines and remediation) in our data search of corporate environmental reports. Internal reliability of KLD concerns was much stronger than that of strengths, with a Cronbach’s alpha of 0.65. The most frequent environmental problem identified by KLD was “hazardous waste” (26.6%). A tetrachoric correlation, adjusted to ensure a positive definite matrix outcome, showed that not all measurement items correlated in the same direction. For example, “climate change” was negatively correlated with “emissions” and “agricultural chemicals.”
The TRI pollution prevention and pollution control variables were available for about three quarters of the firms. Pollution control ranged from 0 to 1 and had a skewed distribution; the majority of companies (63.0%) had ratios of 0.8 or above indicating that they engaged in
16 - IESE Business School-University of Navarra
treating waste as an end-of-pipe process. The pollution prevention variable, after a log transformation, exhibited a fairly normal distribution but skewed towards positive scores: 69.2% of companies had scores above zero.
Convergent and Discriminant Validity
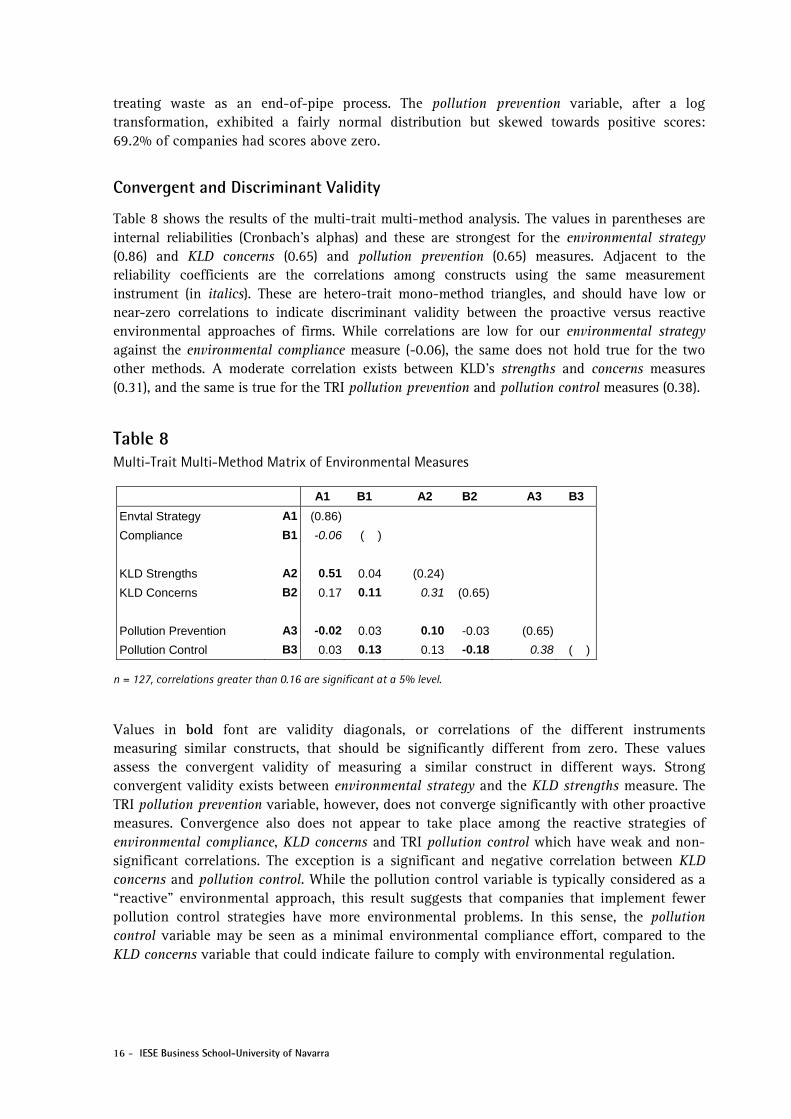
Table 8 shows the results of the multi-trait multi-method analysis. The values in parentheses are internal reliabilities (Cronbach’s alphas) and these are strongest for the environmental strategy (0.86) and KLD concerns (0.65) and pollution prevention (0.65) measures. Adjacent to the reliability coefficients are the correlations among constructs using the same measurement instrument (in italics). These are hetero-trait mono-method triangles, and should have low or near-zero correlations to indicate discriminant validity between the proactive versus reactive environmental approaches of firms. While correlations are low for our environmental strategy against the environmental compliance measure (-0.06), the same does not hold true for the two other methods. A moderate correlation exists between KLD’s strengths and concerns measures (0.31), and the same is true for the TRI pollution prevention and pollution control measures (0.38).
Table 8 Multi-Trait Multi-Method Matrix of Environmental Measures
A1 B1 A2 B2 A3 B3
Envtal Strategy A1 (0.86)
Compliance B1 -0.06 ( )
KLD Strengths A2 0.51 0.04 (0.24)
KLD Concerns B2 0.17 0.11 0.31 (0.65)
Pollution Prevention A3 -0.02 0.03 0.10 -0.03 (0.65)
Pollution Control B3 0.03 0.13 0.13 -0.18 0.38 ( )
n = 127, correlations greater than 0.16 are significant at a 5% level.
Values in bold font are validity diagonals, or correlations of the different instruments measuring similar constructs, that should be significantly different from zero. These values assess the convergent validity of measuring a similar construct in different ways. Strong convergent validity exists between environmental strategy and the KLD strengths measure. The TRI pollution prevention variable, however, does not converge significantly with other proactive measures. Convergence also does not appear to take place among the reactive strategies of environmental compliance, KLD concerns and TRI pollution control which have weak and non-significant correlations. The exception is a significant and negative correlation between KLD concerns and pollution control. While the pollution control variable is typically considered as a “reactive” environmental approach, this result suggests that companies that implement fewer pollution control strategies have more environmental problems. In this sense, the pollution control variable may be seen as a minimal environmental compliance effort, compared to the KLD concerns variable that could indicate failure to comply with environmental regulation.
IESE Business School-University of Navarra - 17
An assessment of discriminant validity was conducted by checking that the bold diagonal values are higher than hetero-trait hetero-method triangles (values in normal font). This is the case for environmental strategy and the KLD strengths measures. The pollution control measure also has mostly larger values than those in the hetero-trait hetero-method triangles. An exception is the pollution prevention measure, which in all cases has smaller values in the diagonal suggesting a lack of discriminant validity of the pollution prevention measure.
Predictive Validity
Predictive validity is a form of criterion-related validity that checks a measurement instrument against an outcome measure (Kerlinger and Lee, 2000). Because the association between environmental strategy with company financial performance is still under debate, and may be mediated by environmental performance (Claver-Cortés et al, 2005), we opted to use environmental performance, rather than financial performance, as an outcome variable to check criterion-related validity.
The environmental performance measure was constructed by coding items in corporate environmental reports that reflect outcomes of environmental initiatives. These items included: environmental initiatives such as environmental innovation, product or process (re)design for the environment, use of key performance indicators to track environmental performance and how a company fared in these measures, as well as environmental awards received. These items were scaled and aggregated (Table 2). Some 75.5% of companies in our sample reported environmental performance measures. The aggregated scale ranged from 0 to 12, with a mean of 4.83, standard deviation of 3.81, a Cronbach’s alpha of 0.62 and an average inter-item covariance of 0.82.
Since the environmental performance measure was a non-negative count variable, with variance greater than the mean, we used a negative binomial regression (Cameron and Trivedi, 1998) to assess predictive validity of each of the environmental measures onto the environmental performance outcome. We included standard controls in our model, following (King and Lenox, 2002): company size as a log of assets, sales growth as change of sales over the last three years, R&D intensity as R&D expenditure over sales, capital intensity as capital expense over sales, and leverage as total debt over total assets. We added an industry control in the form of pollution intensity that ranks 2-digit SIC industries by total amount of toxic emissions, from most (highest score) to least (lowest score) polluting sector (Berrone and Gómez-Mejía, in press).
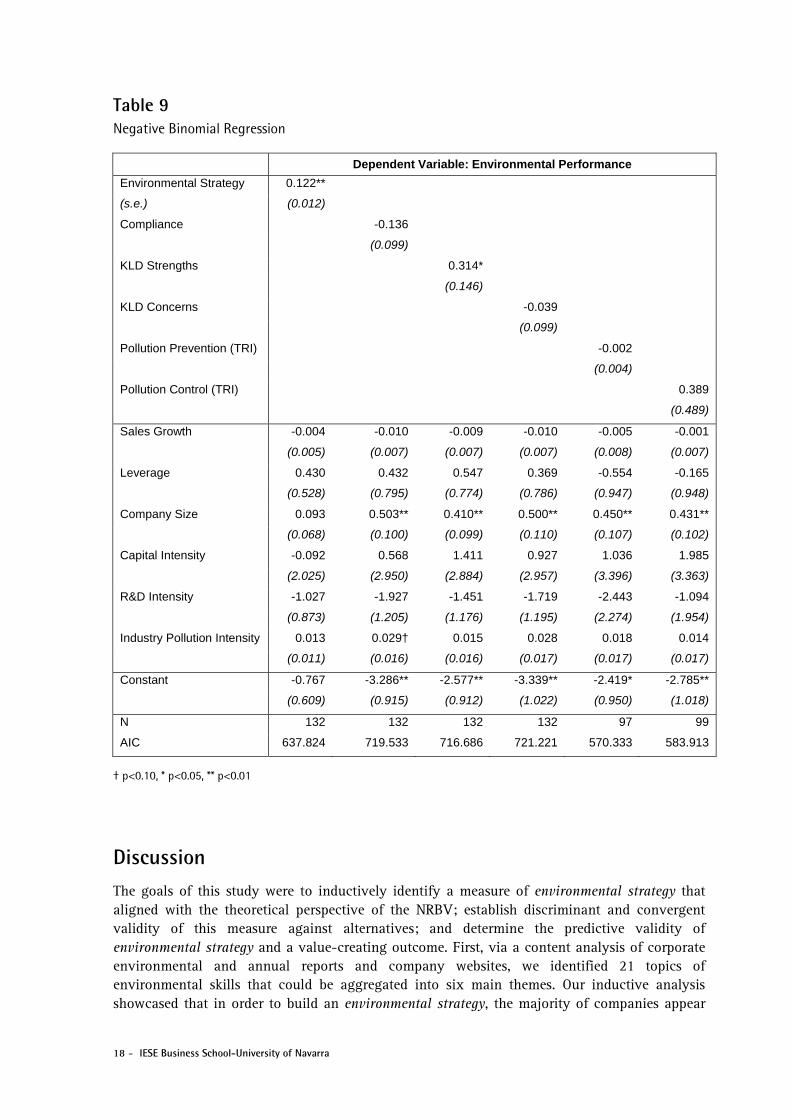
Results are given in Table 9. The environmental strategy and KLD strengths are positively and significantly associated with environmental performance. Significant associations were not found for any of the other environmental measures. In the environmental strategy model, none of the controls were significantly associated with environmental performance. Company size was a relevant factor in all other models and the only significant control variable. These results suggest that proactive environmental initiatives, measured as an aggregated environmental strategy construct based on six environmental capabilities, positively predicts environmental performance. Furthermore, evidence suggests that the KLD strengths measure also positively predicts environmental performance.
18 - IESE Business School-University of Navarra
Table 9 Negative Binomial Regression
Dependent Variable: Environmental Performance
Environmental Strategy 0.122**
(s.e.) (0.012)
Compliance -0.136
(0.099)
KLD Strengths 0.314*
(0.146)
KLD Concerns -0.039
(0.099)
Pollution Prevention (TRI) -0.002
(0.004)
Pollution Control (TRI) 0.389
(0.489)
Sales Growth -0.004 -0.010 -0.009 -0.010 -0.005 -0.001
(0.005) (0.007) (0.007) (0.007) (0.008) (0.007)
Leverage 0.430 0.432 0.547 0.369 -0.554 -0.165
(0.528) (0.795) (0.774) (0.786) (0.947) (0.948)
Company Size 0.093 0.503** 0.410** 0.500** 0.450** 0.431**
(0.068) (0.100) (0.099) (0.110) (0.107) (0.102)
Capital Intensity -0.092 0.568 1.411 0.927 1.036 1.985
(2.025) (2.950) (2.884) (2.957) (3.396) (3.363)
R&D Intensity -1.027 -1.927 -1.451 -1.719 -2.443 -1.094
(0.873) (1.205) (1.176) (1.195) (2.274) (1.954)
Industry Pollution Intensity 0.013 0.029† 0.015 0.028 0.018 0.014
(0.011) (0.016) (0.016) (0.017) (0.017) (0.017)
Constant -0.767 -3.286** -2.577** -3.339** -2.419* -2.785**
(0.609) (0.915) (0.912) (1.022) (0.950) (1.018)
N 132 132 132 132 97 99
AIC 637.824 719.533 716.686 721.221 570.333 583.913
† p<0.10, * p<0.05, ** p<0.01
Discussion The goals of this study were to inductively identify a measure of environmental strategy that aligned with the theoretical perspective of the NRBV; establish discriminant and convergent validity of this measure against alternatives; and determine the predictive validity of environmental strategy and a value-creating outcome. First, via a content analysis of corporate environmental and annual reports and company websites, we identified 21 topics of environmental skills that could be aggregated into six main themes. Our inductive analysis showcased that in order to build an environmental strategy, the majority of companies appear
IESE Business School-University of Navarra - 19
to develop one or several of six capabilities. A historical orientation is important to establish a “foot-in-the-door” towards environmental responsibility on which companies can later build other capabilities. Network embeddedness allows companies to engage in environmental supply chain relationships with suppliers and buyers, and engage in product stewardship and by-product synergy programs. Stakeholder networks also allow companies to develop relations with government organizations, NGOs, businesses and industry, communities, employees and socially-responsible shareholders, and join voluntary programs with respect to environmental issues. Furthermore, companies gain environmental endowments through ISO certification schemes, establishing environmental management programs and setting up environmental research and development initiatives. Companies emphasize visionary environmental leadership through long-term, global commitment. Skills among the top management team are also important with many companies assigning a senior environmental manager to oversee environmental issues and setting up a reporting level that at times reaches as high as the board of directors or even external auditing agencies. Finally, human resources are developed to address environmental issue via specific training programs and reporting systems to track environmental activities along the lines of GRI’s standards. Our literature review discussion matches these six environmental capabilities to the NRBV and our exploratory and confirmatory factor analysis validated this environmental strategy measure as a formative multi-dimensional construct in which all six capabilities load onto a single factor.
The second step of our research was to establish convergent and discriminant validity of our environmental strategy measure with other measures used in the environmental management literature via a multi-trait multi-method analysis. Findings indicated that the environmental strategy measure correlates reasonably well with the KLD strengths variable, suggesting that at least to some extent the KLD measure captures the underlying capabilities that companies are building to develop an environmental strategy. Both these measures also have discriminant validity. In contrast, the TRI pollution prevention measure does not converge well with our environmental strategy measure, nor could discriminant validity be established. Limited conclusions can be drawn from this result. Our interpretation is that, while the TRI pollution prevention variable captures actual company behavior, it cannot identify if environmental capabilities are being built. Thus, the pollution prevention variable does not appear to be consistent with the theoretical notions of the NRBV. This might be because a time lag may exist between the building of environmental capabilities and actual pollution prevention techniques. Alternatively, and more perturbing, environmental strategies may not account for the actual impact of pollutants on human health, an aspect that our TRI pollution prevention variable captured. Another explanation could be that environmental reporting is subject to selective disclosure or “greenwashing” by promoting successful activities but failing to discuss failures, something companies are more likely to do under certain conditions (Lyon, 2007). The selective disclosure argument would partly explain why our content analysis captured many more capabilities than compliance issues (compared to the KLD concerns variable, for instance). Certainly, the lack of correlation between environmental strategy and pollution prevention bears deeper investigation.
The selective disclosure argument may also partly explain the lack of convergence between the “reactive” measures for which the results were generally weak. For instance, no correlation was found between environmental compliance with either KLD concerns or TRI pollution controls. It is quite possible that KLD is conducting a more rigorous search of company’s weaknesses when it comes to environmental issues than companies are willing to report. It may also be true that a single environmental problem is captured in several KLD concerns categories thus artificially

20 - IESE Business School-University of Navarra
inflating these scores. For example, a company that has high emissions may also be breaking environmental regulations for which it would score two hits on the KLD concerns category. We found a negative association between KLD concerns and TRI pollution control. Our interpretation of this result is that the notion of “reactive” environmental strategies may need to be refined further and be coded along a continuum (e.g., Newman and Hanna, 1996) or a combination of approaches (e.g., Aragón-Correa, 1998). After all, there is a difference between failing to comply with environmental regulation (thus scoring on the KLD concerns category) and implementing end-of-pipe pollution control equipment with the purpose of ensure regulatory compliance is met (thereby scoring on the KLD strengths variable). While an end-of-pipe control is not a “proactive” strategy that builds a capability, it can be very effective in controlling the noxious impact of emissions and the release of hazardous waste, and preventing companies from breaking environmental laws.
A third objective of this paper was to determine the predictive validity of our measure and per the arguments of the NRBV we assessed whether environmental strategy was capable of creating value in terms of improved environmental performance. We measured environmental performance in terms of environmental innovations, design of environment initiatives, relative performance of air, water, waste and energy indicators, and environmental awards. Our results indicate that both our environmental strategy measure and the KLD strengths variable predicted environmental performance outcomes. In contrast, none of the other measures predicted environmental performance indicating that predictive validity can vary depending on the measure of environmental strategy used. Our interpretation is that the lack of a common measure of environmental strategy that aligns with the theoretical underpinnings of the NRBV in the past has led to inconsistent results. We used environmental performance as an outcome because it is thought to mediate the relationship between environmental strategy and financial performance. However, the same argument may hold true for financial performance outcomes. Although it was beyond the scope of our study to tease out the association between environmental strategy and company financial performance, we conducted some post-hoc assessments which show that financial performance outcomes differ depending on the measure of environmental strategy. For instance, in an ordinary least square regression that included controls, our environmental strategy measure was weakly and positively associated with Tobin’s Q, but the KLD strengths measure was not significant nor was the TRI pollution prevention measure. Both the environmental compliance and KLD concerns measures were negatively associated with Tobin’s Q but the TRI pollution control variable was not a significant predictor. These preliminary findings clearly show that the choice of measures makes a difference in outcomes and demonstrates the value of our construct validity study as a contribution to this field.
Some limitations of this study should be mentioned. First, common method bias could be present in the regression analysis of environmental performance and environmental strategy because both variables were constructed from the same source (environmental/annual reports). Nevertheless, this issue is partly addressed by the fact that the KLD strengths variable was also positively associated with environmental performance in a separate regression. The KLD measure brings its own limitations, as the environmental categories are largely zero dominant,5 thus lacking in variability and highly-skewed. Because we limited our sample to large companies in the primary and manufacturing industry for whom environmental issues are salient, 32.1% of companies in our sample had KLD strengths and 40.8% had KLD concerns. While using KLD data is clearly simpler than collecting and coding information from environmental reports, the KLD variables may nevertheless prove challenging for larger data samples.
5 The full population of companies covered by KLD in 2003 (n=2,963) showed that only 11.8% of companies had non-zero entries for environmental strengths and/or concerns.
IESE Business School-University of Navarra - 21
Several important implications emerge from this work. From a research perspective, our measure of environmental strategy captures capabilities that companies develop to deal with the natural environment. As our measure is consistent with the theoretical perspective of the NRBV, it is an indicative lead indicator of forward-looking strategies that companies pursue in order to gain competitive advantage. Thus, this measure has some advantages over lag indicators of past company behavior captured by external data providers such as KLD and TRI which are not reflective of environmental capabilities per se. Our environmental strategy measure may therefore be better able to depict companies at the frontier of environmental strategy and the value this creates. Our results show that this measure is predictive of improved environmental performance and possibly also of financial performance. Future research should investigate these associations and delve deeper into possible moderating and mediating effects as well as stability of the measure over time.
A useful outcome to practitioners is that our measure of environmental strategy gives guidance on investment in and development of specific environmental capabilities. Companies can effectively enter the environmental strategy space by establishing a history, reaching out to the supply chain network and other stakeholders, invest in environmental endowments, create a managerial vision for the environment, hire top managers with environmental skills or develop these internally, and set up a human resources system that includes environmental training and reporting. Our evidence suggests that these capabilities create value for the company and they are therefore critical to establishing a competent, competitive and proactive environmental strategy.
22 - IESE Business School-University of Navarra
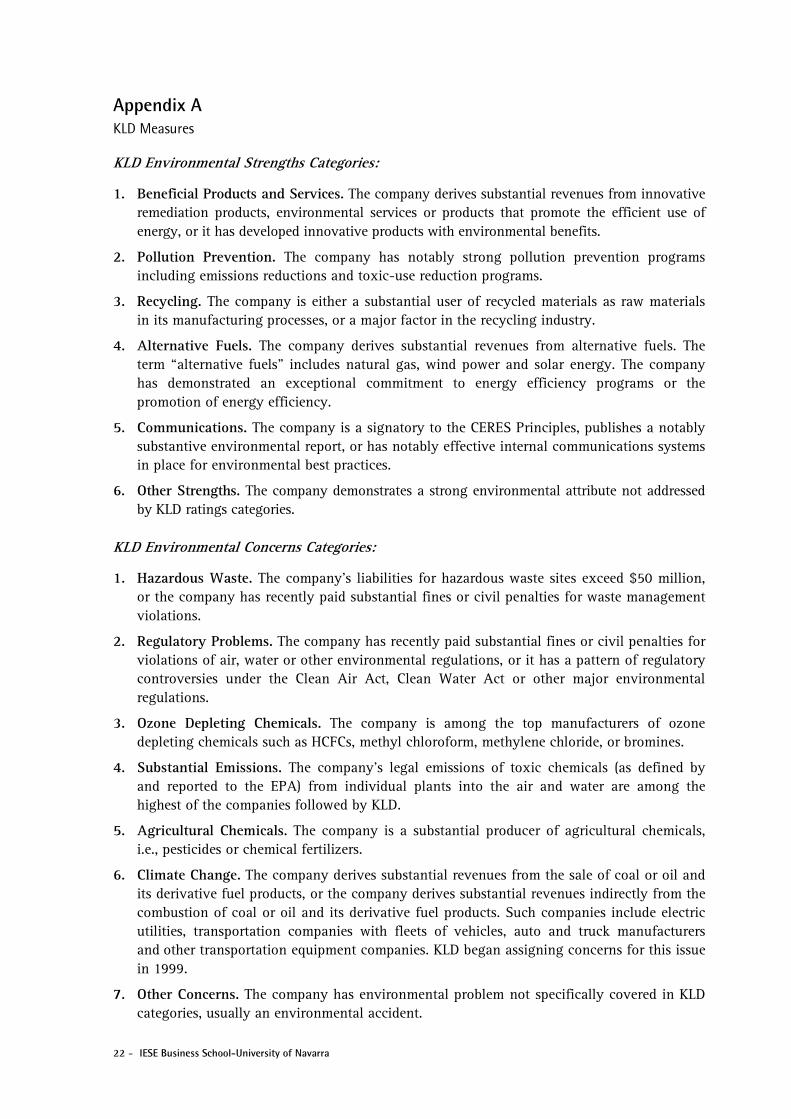
Appendix A KLD Measures
KLD Environmental Strengths Categories:
1. Beneficial Products and Services. The company derives substantial revenues from innovative remediation products, environmental services or products that promote the efficient use of energy, or it has developed innovative products with environmental benefits.
2. Pollution Prevention. The company has notably strong pollution prevention programs including emissions reductions and toxic-use reduction programs.
3. Recycling. The company is either a substantial user of recycled materials as raw materials in its manufacturing processes, or a major factor in the recycling industry.
4. Alternative Fuels. The company derives substantial revenues from alternative fuels. The term “alternative fuels” includes natural gas, wind power and solar energy. The company has demonstrated an exceptional commitment to energy efficiency programs or the promotion of energy efficiency.
5. Communications. The company is a signatory to the CERES Principles, publishes a notably substantive environmental report, or has notably effective internal communications systems in place for environmental best practices.
6. Other Strengths. The company demonstrates a strong environmental attribute not addressed by KLD ratings categories.
KLD Environmental Concerns Categories:
1. Hazardous Waste. The company's liabilities for hazardous waste sites exceed $50 million, or the company has recently paid substantial fines or civil penalties for waste management violations.
2. Regulatory Problems. The company has recently paid substantial fines or civil penalties for violations of air, water or other environmental regulations, or it has a pattern of regulatory controversies under the Clean Air Act, Clean Water Act or other major environmental regulations.
3. Ozone Depleting Chemicals. The company is among the top manufacturers of ozone depleting chemicals such as HCFCs, methyl chloroform, methylene chloride, or bromines.
4. Substantial Emissions. The company's legal emissions of toxic chemicals (as defined by and reported to the EPA) from individual plants into the air and water are among the highest of the companies followed by KLD.
5. Agricultural Chemicals. The company is a substantial producer of agricultural chemicals, i.e., pesticides or chemical fertilizers.
6. Climate Change. The company derives substantial revenues from the sale of coal or oil and its derivative fuel products, or the company derives substantial revenues indirectly from the combustion of coal or oil and its derivative fuel products. Such companies include electric utilities, transportation companies with fleets of vehicles, auto and truck manufacturers and other transportation equipment companies. KLD began assigning concerns for this issue in 1999.
7. Other Concerns. The company has environmental problem not specifically covered in KLD categories, usually an environmental accident.
IESE Business School-University of Navarra - 23
References Andersson, L.M. and Bateman, T.S. (2000), “Individual environmental initiative: championing
natural environmental issues in U.S. business organizations,” Academy of Management Journal, 43 (4), pp. 548-570.
Aragón-Correa, J.A. (1998), “Strategic proactivity and company approach to the natural environment,” Academy of Management Journal, 41 (5), pp. 556-567.
Aragón-Correa, J.A., Matías-Reche, F., and Senise-Barrio, M.E. (2004), “Managerial discretion and corporate commitment to the natural environment,” Journal of Business Research, 57, pp. 964-975.
Arndt, M. and Bigelow, B. (2000), “Presenting structural innovation in an institutional environment: hospitals’ use of impression management,” Administrative Science Quarterly, 45 (3), pp. 494-522.
Arthur, W.B. (1989), “Competing technologies, increasing returns and lock-in by historical events,” The Economic Journal, March, pp. 116-131.
Bansal, P. and Roth, K. (2000), “Why companies go green: A model of ecological responsiveness,” Academy of Management Journal, 43 (4), pp. 717-736.
Barney, J.B. (1991), “Company resources and sustained competitive advantage,” Journal of Management, 11 (2), pp. 408-427.
Bartholomew, D.J, Steele, F., Moustaki, I. and Galbraith, J.I. (2002), “The analysis and interpretation of multivariate data for social scientists,” Texts in Statistical Science. New York: Chapman & Hall/CRC.
Berrone, P. and Gómez-Mejía, L.R., In press. “Do companies compensate their CEO’s for environmental performance? An empirical analysis of U.S. polluting industries,” Academy of Management Journal.
Bettman, J.R. and Weitz, B.A. (1983), “Attributions in the board room: causal reasoning in corporate annual reports,” Administrative Science Quarterly, 28, pp. 165-183.
Bollen, K.A. (1989), “Structural Equations with Latent Variables,” New York: John Wiley & Sons.
Bourgeois, III, L.J. (1981), “On the measurement of organizational slack,” Academy of Management Review, 6, pp. 29-39.
Bowman, E.H. (1984), “Content analysis of annual reports for corporate strategy and risk,” Interfaces, 14 (1), pp. 61-71.
Burt, R.S. (1997), “The contingent value of social capital,” Administrative Science Quarterly, 42 (2), pp. 339-365.
Cameron A. C. and Trivedi, P.K. (1998), “Regression analysis of count data,” New York: Cambridge University Press.
Campbell, D.T. and Fiske, D.W. (1959), “Convergent and discriminant validation by the multitrait-multimethod matrix,” Psychological Bulletin, 56 (2), pp. 81-105.
24 - IESE Business School-University of Navarra
Castanias, R.P. and Helfat, C.E. (1991), “Managerial resources and rents,” Journal of Management, 17 (1), pp. 155-171.
Cerin, P. and Karlson, L. (2002), “Business incentives for sustainability: a property rights approach,” Ecological Economics, 40 (1), pp. 13-22.
Child, J. (1972), “Organization structure, environment and performance: the role of strategic choice,” Sociology, 6, pp. 1-22.
Christmann, P. (2000), “Effects of ‘best practices’ of environmental management on cost advantage: the role of complementary assets,” Academy of Management Journal, 43 (4), pp. 663-681.
Claver-Cortés, E., Molina-Azorín, J.F., Tarí-Guilló, J.J. and López-Gamero, M.D. (2005), “Environmental management, quality management and company performance: a review of empirical studies,” en S. Sharma and J.A. Aragón-Correa (Eds.), “Corporate environmental strategy and competitive advantage,” pp. 157-182. Northampton: Edward Elgar.
Cordano, M. and Frieze, I.H. (2000), “Pollution reduction preferences of U.S. environmental managers: applying Azjens theory of planned behavior,” Academy of Management Journal, 43 (4), pp. 627-641.
Darnall, N. and Edwards, D. (2006), “Predicting the cost of environmental management system adoption: the role of capabilities, resources and ownership structure,” Strategic Management Journal, 27, pp. 301-320.
Dechant, K. and Altman, B. (1994), “Environmental leadership: from compliance to competitive advantage,” Academy of Management Executive, 8 (3), pp. 7-27.
Delmas, M. and Toffel, M.W. (2004), “Stakeholders and environmental management practices: an institutional framework,” Business Strategy and the Environment, 13 (4), pp. 209-222.
Delmas, M. and Toffel, M.W. (2007), “Organizational responses to environmental demands: opening the black box,” Strategic Management Journal, forthcoming.
Dierickx, I. & Cool, K. (1989), “Asset stock accumulation and sustainability of competitive advantage,” Management Science, 35 (12), pp. 1504-1511.
Edwards, J.R. (2001), “Multidimensional constructs in organizational behavior research,” Organizational Research Methods, 4 (2), pp. 144-192.
Eisenhardt, K.M. and Martin, J.A. (2000), “Dynamic capabilities: what are they?,” Strategic Management Journal, 21, pp. 1105-1121.
Entine, J. (2003), “The myth of social investing: a critique of its practice and consequences for corporate social performance research,” Organization and Environment, 16 (3), pp. 352-368.
EPA. (2002), “The toxics release inventory (TRI) and factors to consider when using TRI data,” Report no. 60-F-02-017: 1-29. Washington DC: Environmental Protection Agency (EPA).
Fabrigar, L.R., Wegener, D.T., MacCallum, R.C. and Strahan, E.J. (1999), “Evaluating the use of exploratory factor analysis in psychological research,” Psychological Methods, 4 (3), pp. 272-299.
IESE Business School-University of Navarra - 25
Finkelstein, S. (1992), “Power in top management teams: dimensions, measurement and validation,” Academy of Management Journal, 35 (3), pp. 505-538.
Freeman, J. and Barley, S.R. (1990), “The strategic analysis of inter-organizational relations in biotechnology,” en Loveridge, R. and Pitts, M. (Eds.), “The strategic management of technological innovations,” pp. 127-156. Chichester: Wiley.
Freeman, R. (1984), “Strategic management: a stakeholder perspective,” Englewood Cliffs: Prentice Hall.
Glaser, B.G. and Strauss, A.L. (1967), “The Discovery of Grounded Theory,” New York: de Gruyter.
Graves, S.B. and Waddock, S.A. (1994). “Institutional owners and corporate social performance,” Academy of Management Journal, 37 (4), pp. 1034-1046.
Groves, K.S. (2006), “Leader emotional expressivity, visionary leadership, and organizational change,” Leadership and Organization Development Journal, 27 (7), pp. 566-583.
Hanisch, K.A., Hulin, C.L. and Roznowski, M. (1998), “The importance of individuals’ repertoires of behaviors: the scientific appropriation of studying multiple behaviors and general attitudes,” Journal of Organizational Behavior, 19, pp. 463-480.
Hart, S. L. and Ahuja, G. (1996), “Does it pay to be green?: An empirical examination of the relationship between pollution prevention and company performance,” Business Strategy and the Environment, 5 (1), pp. 30-37.
Hart, S.L. (1995), “A natural resource-based view of the firm,” Academy of Management Review, 20 (4), pp. 986-1014.
Henriques, I. and Sadorsky, P. (1999), “The relationship between environmental commitment and managerial perceptions of stakeholder importance,” Academy of Management Journal, 42 (1), pp. 87-99.
Hertwich, E. G., Mateles, S. F., Pease, W. S., and McKone, T. E. (2001), “Human toxicity potentials for life-cycle assessment and toxics release inventory risk screening,” Environmental Toxicology and Chemistry, 20, pp. 928-939.
Hoffman, A. (1999), “Institutional evolution and change: environmentalism and the U.S. chemical industry,” Academy of Management Journal, 42 (4), pp. 351-371.
Holsti, O.R. (1969), “Content Analysis for the Social Sciences and Humanities,” Reading, MA: Addison-Wesley.
Hoskissen, R.E., Hitt, M.A., Johnson, R.A. and Moesel, D.D. (1993), “Construct validity of an objective (entropy) categorical measure of diversification strategy,” Strategic Management Journal, 14, pp. 215-235.
Johnson, R. A. and Greening, D. W. (1999), “The effects of corporate governance and institutional ownership types on corporate social performance,” Academy of Management Journal, 42 (5), pp. 564-576.
Kerlinger, F.N. and Lee, H.B. (2000), “Foundations of Behavioral Research,” 4th edition. United States: Wadsworth, Thomson Learning.
26 - IESE Business School-University of Navarra
King, A. A. and Lenox, M. J. (2000), “Industry self-regulation without sanctions: the chemical industry's responsible care program,” Academy of Management Journal, 43, pp. 698-716.
King, A. A. and Lenox, M. J. (2004), “Prospects for developing absortive capacity through internal information provision,” Strategic Management Journal, 25, pp. 331-345.
King, A.A. and Lenox, M. (2002), “Exploring the locus of profitable pollution reduction,” Management Science, 48, pp. 289-299.
King, A.A. and Lenox, M.J. (2001), “Lean and green? An empirical examination of the relationship between lean production and environmental performance,” Production and Operations Management, 10 (3), pp. 244-256.
Klassen, R.D. and Whybark, D.C. (1999), “The impact of environmental technologies on manufacturing performance,” Academy of Management Journal, 42, pp. 599-615.
Laumann, E.O., Galaskiewicz, J. and Marsden, P.V. (1978), “Community structure as interorganizational linkages,” Annual Review of Sociology, 4, pp. 455-484.
Lee, S.H., Phan, P.H. and Chan, E. (2005), “The impact of HR configuration on company performance in Singapore: a resource-based explanation,” International Journal of Human Resource Management, 16 (9), pp. 1740-1758.
Lenz, R.T. (1980), “Strategic capability: a concept and framework for analysis,” Academy of Management Review, 5 (2), pp. 225-234.
Lyon, T.P. (2007), “Greenwash: corporate environmental disclosure under threat of audit,” Working Paper, Erb Institute for Global Sustainable Enterprise, University of Michigan.
Marcus, A. and Geffen, D. (1998), “The dialectics of competency acquisition: pollution prevention in electric generation,” Strategic Management Journal, 19, pp. 1145-1168.
McWilliams, A. and Siegel, D. (2000), “Corporate social responsibility and financial performance: correlation or misspecification,” Strategic Management Journal, 21 (5), pp. 603-609.
Miles, M.B. and Huberman, A.M. (1994), “Qualitative Data Analysis”, 2nd ed., Thousand Oaks, CA: Sage.
Morhardt, J.E. (2001), “Scoring corporate environmental reports for comprehensiveness: a comparison of three systems,” “Environmental Management”, 27 (6), pp. 881-892.
Neubaum, D. O. and Zahra, S. A. (2006), “Institutional ownership and corporate social performance: The moderating effects of investment horizon, activism, and coordination,” Journal of Management, 32 (1), pp. 108-131.
Newman, W.R. and Hanna, M.D. (1996), “An empirical exploration of the relationship between manufacturing strategy and environmental management,” International Journal of Operations and Production Management, 16 (4), pp. 69-87.
Nunnally, J.C. and Bernstein, I.H. (1994), “Psychometric Theory,” McGraw-Hill Series in Psychology, 3rd edition, New York: McGraw-Hill Inc.
Ones, D.S. and Viswesvaran, C. (1996), “Bandwidth-fidelity dilemma in personality measurement for personnel selection,” Journal of Organizational Behavior, 17, pp. 609-626.
IESE Business School-University of Navarra - 27
Penrose, E.T. (1959), “The theory of the growth of the firm,” Oxford: Basil Blackwood.
Peteraf, M.A. (1993), “The cornerstones of competitive advantage: A resource-based view,” Strategic Management Journal, 14 (3), pp. 179-192.
Pfeffer, J. and Salancik, G.R. (1978), “The external control of organizations,” New York: Harper & Row.
Roome, N. (1992), “Developing environmental management strategies,” Business Strategy and the Environment, 1 (1), pp. 11-24.
Russo, M. V. and Harrison, N. S. (2005), “Organizational design and environmental performance: clues from the electronics industry,” Academy of Management Journal, 48, pp. 582-593.
Russo, M.V. and Fouts, P.A. (1997), “A resource-based perspective on corporate environmental performance and profitability,” Academy of Management Journal, 40 (3), pp. 534-559.
Salancik, G.R. and Meindl, J.R. (1984), “Corporate attributions as strategic illusions of management control,” Administrative Science Quarterly, 29, pp. 238-254.
Sarkis, J. and Cordeiro, J. J. (2001), “An empirical evaluation of environmental efficiencies and company performance: Pollution prevention versus end-of-pipe practice,” European Journal of Operational Research, 135, pp. 102-113.
Schwab, D. (1980), “Construct validity in organizational behavior,” en Staw, B.M. and Cummings, L.L. (eds.), “Research in Organizational Behavior,” Vol 2, Greenwhich: JAI.
Sharma, S. and Aragón-Correa, J.A. (2005), “Corporate environmental strategy and competitive advantage,” Northampton: Edward Elgar Publishing.
Sharma, S. and Henriques, I. (2005), “Stakeholder influences on sustainability practices in the Canadian forest products industry,” Strategic Management Journal, 26, pp. 159-180.
Sharma, S. and Vredenburg, H. (1998), “Proactive corporate environmental strategy and the development of competitively valuable organizational capabilities,” Strategic Management Journal, 19, pp. 729-753.
Sharma, S. (2000), “Managerial interpretations and organizational context as predictors of corporate choice of environmental strategy,” Academy of Management Journal, 43 (4), pp. 681-697.
Shrivastava, P. (1995), “Environmental technologies and competitive advantage,” Strategic Management Journal, 16 (Special Issue), pp. 183-201.
Singh, J.V. (1986), “Performance, slack, and risk taking in organizational decision making,” Academy of Management Journal, 29 (3), pp. 562-585.
Staw, B.M., McKechnie, P.I. and Puffer, S.M. (1983), “The justification of organizational performance,” Administrative Science Quarterly, 28, pp. 582-600.
Toffel, M. W. and Marshall, J. D. (2004), “Improving environmental performance assessment: Comparative analysis of weighting methods used to evaluate chemical release inventories,” Journal of Industrial Ecology, 8 (1-2), pp. 143-172.
28 - IESE Business School-University of Navarra
Tsang, E.W.K. (1998), “Can guanxi be a source of sustained competitive advantage for doing business in China?,” Academy of Management Executive, 12 (3), pp. 64-73.
Uzzi, B. (1999), “Embeddedness in the making of financial capital: how social relations and networks benefit companies seeking financing,” American Sociological Review, 64 (4), pp. 481-505.
Van den Steen, E. (2005), “Organizational beliefs and managerial vision,” Journal of Law Economics and Organization, 21 (1), pp. 256-283.
Venkatraman, N. and Grant, J.H. (1986), “Construct measurement in organizational strategy research: a critique and proposal,” Academy of Management Review, 11, pp. 71-87.
Waddock, S.A. and Graves, S.B. (1997), “The corporate social performance – financial performance link,” Strategic Management Journal, 18 (4), pp. 303-319.
Waldman, D.A., Sully de Luque, M., Washburn, N. and House, R.J and others (2006), “Cultural leadership predictors of corporate social responsibility values of top management: a GLOBE study of 15 countries,” Journal of International Business, 37, pp. 823-837.
Wehrmeyer, W. (1996), “Greening people,” Sheffield, England: Greenleaf.
Wernerfelt, B. (1984), “A resource-based view of the firm,” Strategic Management Journal, 5, pp. 171-180.
Westley, F. and Mintzberg, H. (1989), “Visionary leadership and strategic management,” Strategic Management Journal, 10, pp. 17-32.