construct validation of the revised listening component of the ...
Upload
khangminh22Category
view
2download
0
A CONSTRUCT COMPARABILITY A N A L Y S I S OF COGNITIVE ABILITY TESTS IN DIFFERENT L A N G U A G E S
by
T A N Y A MICHELLE McCREITH
B.A. , The University of Waterloo, 1995 M . A . S c , The University of Waterloo, 1997
A THESIS SUBMITTED IN PARTIAL FULFILMENT OF THE REQUIREMENTS FOR THE DEGREE OF
DOCTOR OF PHILOSOPHY
in
THE F A C U L T Y OF G R A D U A T E STUDIES
(Department of Educational and Counselling Psychology, and Special Education)
We accept this thesis as conforming to the required standard
THE UNIVERSITY OF BRITISH C O L U M B I A
July 2004
© Tanya Michelle McCreith, 2004

ABSTRACT
This research studies the construct comparability of the Woodcock-Johnson Battery -
Third Edition Tests of Cognitive Ability (WJ III COG; Woodcock, McGrew, & Mather, 2001)
and the Bateria III Woodcock-Munoz: Pruebas de Habilidad Cognitiva - Third Edition (Bateria
III COG; Woodcock, Munoz-Sandoval, McGrew, Mather, & Schrank, in press-b), which are the
English and Spanish versions of the same battery, respectively. These are measures of cognitive
functioning that purport to be direct counterparts of one another. This study examined the degree
of comparability and sources of incomparability of seven tests of cognitive ability that were
translated from English to Spanish. The purpose of this study was to determine: (1) whether the
dimensionality and structure of each of the selected tests of the WJ III COG and Bateria III COG
were the same; (2) whether there were specific items from the selected tests of the WJ III COG
and Bateria III COG that function differentially for English- and Spanish-speaking examinees;
and (3) whether the sources of differences in constructs being assessed for the two language
groups could be identified. Answers to the research questions stated above contributed to
evidence relevant for determining the comparability of the inferences based on these test scores
for two different language versions. Between the two language versions of the tests, at the scale
as well as the item level, the results indicated that there were different levels of psychometric
similarities and differences for some of the seven tests that may jeopardize the comparability of
scores from these versions.
n
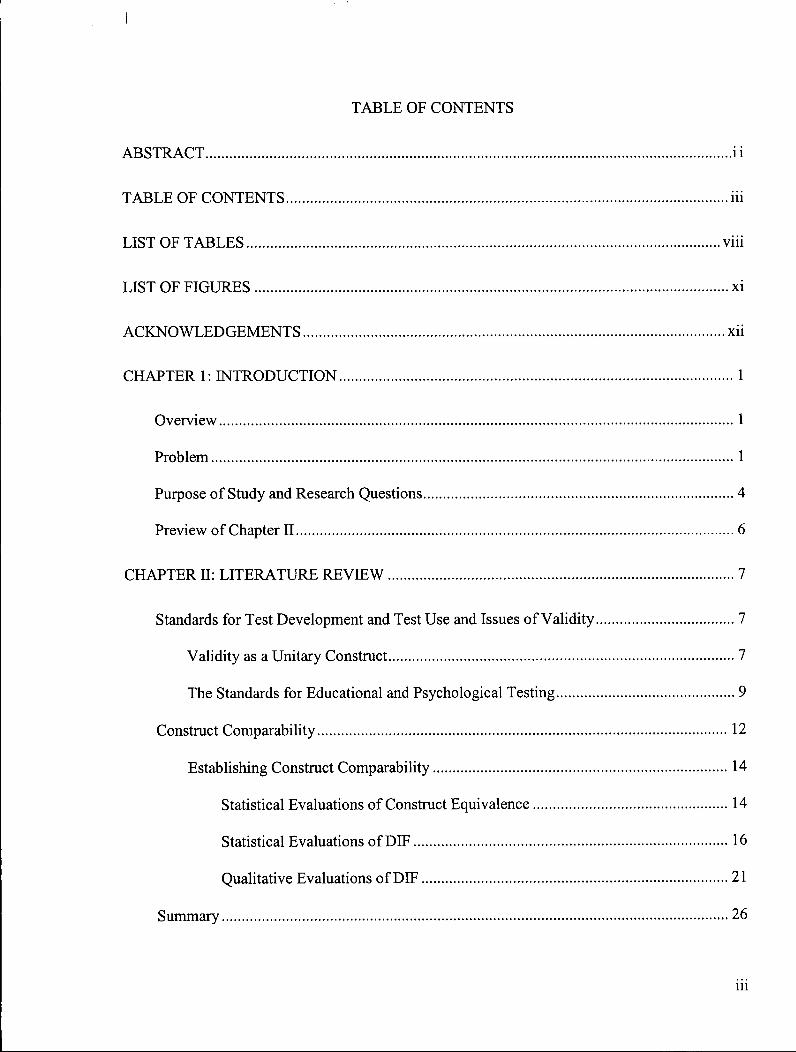
T A B L E OF CONTENTS
ABSTRACT i i
T A B L E OF CONTENTS iii
LIST OF T A B L E S viii
LIST OF FIGURES xi
A C K N O W L E D G E M E N T S xii
CHAPTER 1: INTRODUCTION 1
Overview 1
Problem 1
Purpose of Study and Research Questions 4
Preview of Chapter II 6
CHAPTER II: L ITERATURE REVIEW 7
Standards for Test Development and Test Use and Issues of Validity 7
Validity as a Unitary Construct 7
The Standards for Educational and Psychological Testing 9
Construct Comparability 12
Establishing Construct Comparability 14
Statistical Evaluations of Construct Equivalence 14
Statistical Evaluations of DIF 16
Qualitative Evaluations of DEF 21
Summary 26
iii

CHAPTER III: M E T H O D 27
Measures 27
Selection of Tests 29
Woodcock-Johnson III Tests of Cognitive Ability 32
Bateria III Woodcock-Munoz: Pruebas de Habilidades Cognitiva 33
Translation Process 34
Equated US Norms 35
Scoring 36
Procedure 37
Stage 1 - Examination of Factor Structure 37
Factor Analysis Models 40
Determination of Factor Solution 41
Stage 2 - Internal Consistency 43
Stage 3 - IRT Based Analyses 46
Identification of Differential Item Functioning 46
Item Response Theory Models 50
Three-parameter logistic model 52
Two-parameter partial credit model 52
Evaluation of the LRT Model Assumptions 53
Unidimensionality 54
Item fit 54
Local item dependence (LID) 54
Investigation of Item and Test Characteristics 55
iv

Stage 4 - Judgmental Review 56
Selection and Training of Judgmental Reviewers 57
Training Session 58
Review Session of Test Instructions and Items 59
CHAPTER TV: RESULTS 61
Data 61
Group Characteristics 62
Descriptive Statistics on the Tests of Cognitive Ability 63
Stage 1 - Examination of Factor Structures 65
Spatial Relations 66
Visual Matching 71
Decision Speed 75
Rapid Picture Naming 79
Picture Recognition 85
Concept Formation 89
Analysis-Synthesis 94
Summary 99
Stage 2 - Internal Consistency 100
Stage 3 - Item Response Theory Based Analyses 102
Evaluation of the IRT Model Assumptions 104
Unidimensionality 105
Item fit 105
Local item dependence (LID) 108
v

Identification of Differential Item Functioning 109
Investigation of Item Characteristics 110
Standard Error of Measurement 115
Correlation of Item Parameters 119
Stage 4 - Judgmental Review 124
Differences in Items 124
Differences in Instructions to Examiner 125
Differences in Instructions to Examinees 126
CHAPTER V : DISCUSSION 131
Summary 131
Research Question One 132
Research Question Two 134
Research Question Three 136
Degree of Comparability 137
Integration of Findings 140
Implications 141
Implications for Practitioners 144
Limitations 145
Contributions of Findings to Literature 147
Future Directions 148
REFERENCES 153
Appendix A 163
vi
Codes for the Sources of Translation Differences 163
Appendix B 169
Judgmental Review Sample Worksheet 169
vii
LIST OF TABLES
Table 1: Stimulus and Response Required for the Translated Tests of the WJ III COG and
Bateria III C O G 30
Table 2: Task Description of the Translated Tests for the WJ III C O G and
Bateria III COG. 31
Table 3: Reported Reliabilities for the Selected Tests of the WJ III COG 33
Table 4: Item Characteristics of the Translated Tests of the WJ III COG
and Bateria III COG 46
Table 5: Statistical Rules for Identify Three Levels of DIF 50
Table 6: Judgmental Review Rating Scale 59
Table 7: Sample Sizes for Each of the Selected Tests (age 9 to 29) 64
Table 8: Descriptive Statistics for Each of the Selected Tests (age 9 to 29) 65
Table 9: PC A Eigenvalues and Variance Explained for Each Factor for
Spatial Relations 67
Table 10: P R O M A X Rotated Factor Loadings for Spatial Relations 69
Table 11: Inter-factor Correlation Matrix for Spatial Relations 70
Table 12: PC A Eigenvalues and Variance Explained for Each Factor for
Visual Matching 72
Table 13: P R O M A X Rotated Factor Loadings for Visual Matching 74
Table 14: Inter-factor Correlation Matrix for Visual Matching_ 75
Table 15: PC A Eigenvalues and Variance Explained for Each Factor for
Decision Speed 76
Table 16: P R O M A X Rotated Factor Loadings for Decision Speed 78

Table 17: Inter-factor Correlation Matrix for Decision Speed' 79
Table 18: PC A Eigenvalues and Variance Explained for Each Factor for
Rapid Picture Naming 81
Table 19: P R O M A X Rotated Factor Loadings for Rapid Picture Naming 84
Table 20: Inter-factor Correlation Matrix for Rapid Picture Naming 85
Table 21: PCA Eigenvalues and Variance Explained for Each Factor for
Picture Recognition 86
Table 22: P R O M A X Rotated Factor Loadings for Picture Recognition 88
Table 23: P C A Inter-factor Correlation Matrix for Picture Recognition 89
Table 24: FIFA Eigenvalues and Variance Explained for Each Factor for
Concept Formation 90
Table 25: P R O M A X Rotated Factor Loadings for Concept Formation 93
Table 26: Inter-factor Correlation Matrix for Concept Formation 94
Table 27: FIFA Eigenvalues and Variance Explained for Each Factor for
Analysis-Synthesis 95
Table 28: P R O M A X Rotated Factor Loadings for Analysis-Synthesis 98
Table 29: Inter-factor Correlation Matrix for Analysis-Synthesis 99
Table 30: Summary of Number of Factors for the WJ III COG and Bateria III COG 100
Table 31: Reliabilities for the Selected Tests of the WJ III C O G and Bateria III COG 101
Table 32: Summary of Eliminated Items and Reasons for Elimination for TRT
Related Analyses 104
Table 33: Evaluation of IRT Assumptions 105
Table 34: Q\ Goodness of Fit Results for Spatial Relations 106
ix

Table 35: Q\ Goodness of Fit Results for Concept Formation 107
Table 36: Q\ Goodness of Fit Results fox Analysis-Synthesis 108
Table 37: Item Pairs with Local Item Dependency (LID) 109
Table 38: Number of DIF Items for Each Test of Cognitive Ability 110
Table 39: Item Information for Concept Formation 113
Table 40: Item Information for Analysis-Synthesis 115
Table 41: Correlation between IRT Item Parameters 119
Table 42: Summary of Judgmental Review Ratings and Noted Differences in the
Instructions to Examiners 129
Table 43: Summary of Judgmental Review Ratings and Noted Differences in the
Instructions to Examinees 130
Table 44: Summary of Completed Analyses by Test 138
x

LIST OF FIGURES
Figure 1: Scree Plots for Spatial Relations 68
Figure 2: Scree Plots for Visual Matching. 73
Figure 3: Scree Plots for Decision Speed 77
Figure 4: Scree Plots for Rapid Picture Naming. 84
Figure 5: Scree Plots for Picture Recognition 87
Figure 6: Scree Plots for Concept Formation 91
Figure 7: Scree Plots for Analysis-Synthesis 96
Figure 8: Standard Error of Measurement for Concept Formation 117
Figure 9: Standard Error of Measurement for Analysis-Synthesis 118
Figure 10: Scatter Plots for the Discrimination and Difficulty Parameters for
Spatial Relations 121
Figure 11: Scatter Plots for the Discrimination and Difficulty Parameters for Concept
Formation 122
Figure 12: Scatter Plots for the Discrimination and Difficulty Parameters for
Analysis-Synthesis 123
xi
A C K N O W L E D G E M E N T S
First and foremost I would like to thank my research supervisor Kadriye Ercikan. In the
years that we have known one another our relationship has taken many forms, instructor-student,
employer-employee, collaborators, supervisor-student, big sister-little sister, but most
importantly friends. Her encouragement and support has never wavered, and neither has my
respect and admiration for her as person and a professional.
Another instrumental figure in my development as a doctoral student and person has been
William McKee. For those that do not know Bi l l , I describe him as my academic dad. He is the
person I could always count on for guidance, support, and especially a laugh.
While it has been said it takes a community to raise a child, it takes a committee to
complete a dissertation. Beth Haverkamp has offered me wonderful insights about my research
project, the dissertation process, and how to mentally manage. I appreciated every comment, the
time she made for my project, and her spirit. Laurie Ford played a prominent role getting my
project off the ground. Her assistance with obtaining the data used in this project, as well as
funding, and introducing me to the wonderful people associated with the Woodcock-Johnson and
Bateria test batteries wil l always be appreciated.
I would also like to thank Richard Woodcock, Ana Munoz-Sandoval, Kevin McGrew,
Fredrick Schrank for their generosity in sharing the data used in this study, as well as Mary Ruef
and Stephanie Glickman for their assistance and answers related to setting up and understanding
the data sets. Further, I would like to extend my gratitude to the Woodcock-Munoz Foundation
for funding my dissertation research.
My appreciation to Angela Jaramillo and Adriana Espinoza for giving their time and
expertise by serving as judgmental reviewers for my project.

Bonita Davidson (nee Steele). Well here we are, at the end of our dissertation journey.
And what a trip! Everyone should be so lucky to travel the path to completion of a dissertation
with someone like you. From the dissertation "boot camps", numerous emails, to the endless
hours on the phone troubleshooting, asking and answering questions, and providing support in
order to maintain sanity and keep going. Where would we be without each other? Not done, is
the answer to that question. But instead here we are, finishing within hours of one another. I
look forward to the other journeys we will take together, as sisters(in-law) and doctors!
One cannot survive by academics alone, and I have been very fortunate to have met and
developed wonderful friendships over the years at U B C . From the very beginning, when I met
Kelly Lemon, Faye Karvat (nee Cuddy), and Maria Lappas (nee Arvanitakis). I treasure all the
moments and adventures we have shared together. And when, for whatever reason it wasn't the
four of us, it was Kelly and I. Vancouver could not have been a home without a friend and
companion like Kelly. And now, wherever she is, it will always be a home away from home.
U B C became a very lonely place once Kelly, Faye, and Maria graduated. How lucky for
me that I met Kirstin Funke, Vanessa Lapointe, Natalie Rocke Henderson, and Nicole Ricci.
While going to school became fun again, my friendship with these individuals extends beyond
the walls of Scarfe, the Thunderbird exercise room, The PRTC, The Barn, and the pool.
The last and most important person I met while completing my degree at U B C , was Rick
Steele. He started off as a blind date, set up by his sister Bonita, and ended up as my husband.
While he may have been the source of many a distraction from my dissertation, ultimately his
love and support has helped me through, and he brings me more happiness and satisfaction than
any of my academic accomplishments.

Lastly, I would like to acknowledge my parents, Lindsay and Sandra McCreith. They
provided me an environment where anything was possible, and supported every choice I have
made along the way.
xiv

CHAPTER 1: INTRODUCTION
Overview
With the increase in language and cultural diversity in North America, having
comparable measures of skills and abilities in different languages offers a number of benefits,
including assessing students in their first language. The Woodcock-Johnson Battery - Third
Edition Tests of Cognitive Ability (WJ III COG; Woodcock, McGrew, & Mather, 2001) and the
Bateria III Woodcock-Munoz: Pruebas de Habilidad Cognitiva - Third Edition (Bateria III COG;
Woodcock, Munoz-Sandoval, McGrew, Mather, & Schrank, in press-b) are the English and
Spanish versions of the same test battery. According to the authors, these tests are direct
counterparts and they measure the same constructs in each of the populations (Woodcock,
Munoz-Sandoval, McGrew, Mather, & Schrank, in press-a). Further these tests have been
designed to be used in combination with one another in order to allow practitioners to compare
individuals' scores when the tests have been administered in the two different languages. The
present study is designed to examine the comparability of scores and the validity of inferences
drawn from the two versions of these cognitive test batteries.
Problem
The assessment of cognitive ability and achievement by means of standardized, norm-
referenced measures is a fact of modern society (Reschly & Grimes, 2002; Samuda, 1998).
Norm-referenced assessment procedures are used to draw inferences about an individual's
performance relative to a defined population of individuals or groups (e.g., their age or grade
peers). Such assessment tools are helpful in determining and describing an individual's strengths
and weaknesses in a particular domain, as well as assisting in classification, whether for
educational classification, placement or diagnosis. The validity of interpretations based on such
1

assessments depends on the conceptual (i.e., the theoretical bases for the measure, how the
construct is defined and operationalized), as well as the technical aspects of the test, including
the appropriateness of the reference group as a basis for comparison for a particular individual.
Therefore, the appropriateness of inferences based on such assessments for language minority
groups, such as Spanish-speakers, is a crucial aspect of the validity of a particular measure.
Assessing any minority group or subpopulation comes with the challenge of finding an
appropriate measure and drawing valid inferences from the scores obtained. Beyond the normal
psychometric requirements of an assessment measure, the challenge of ensuring that the test is
appropriate for the particular population must be met. For language-minority individuals, finding
appropriate measurement tools requires one to consider the language of administration or
language demands of test items and instructions. Historically, the choice of non-English
measures has been limited, and statistical procedures to examine test properties as they pertain to
minority groups were also limited, compared to today's standards. That is, test selection did not
hinge on whether a measure was appropriate in terms of language; instead, test use was based on
what was available. As a result, there has been a misuse of tests with non-English speaking test
takers, and even inappropriate inferences or placements based on such test use, including the
overrepresentation of minorities in special education (e.g., Scheuneman & Oakland, 1998).
Concerns about fair testing procedures have triggered a number of events. For example,
there have been a number of court challenges to the use of cognitive functioning tests with
children from sub- or minority populations, which has led to new legislation [e.g., Individuals
with Disabilities Act (IDEA: 1990)], which specifically addresses issues pertaining to the
selection and use of tests when investigating whether special education programming is
necessary for a specific student (Scheuneman & Oakland, 1998). This law states that every child
2
has a right to a comprehensive assessment of the nature and degree of his or her specific
disability (Flanagan, Andrews, & Genshaft, 1997), and that tests be "validated for the specific
purpose for which they are used" (Scheuneman & Oakland, p. 92). Further, the development of
Standards in Educational and Psychological Testing (American Educational Research
Association [AERA], American Psychological Association [APA], National Council on
Measurement in Education [NCME], & Joint Committee on Standards for Educational and
Psychological Testing (U.S.), 1999) and the Guidelines for Educational and Psychological
Testing (Canadian Psychological Association [CPA], 1987) require test developers to construct
technically adequate measures, and test users to be responsible and conscientious in the way they
choose and administer tests, and subsequently interpret test scores. Lastly, The Code of Fair
Testing Practices in Education (Joint Committee on Testing Practices, 1988) addresses the roles
of test developers and users, and states the major obligations of each of these bodies. The Code
presents standards for educational test developers and users in four areas: developing and
selecting tests, interpreting scores, striving for fairness, and informing test takers. Moreover, the
A P A Ethical Principles of Psychologists and Code of Conduct (APA, 2002) lists ethical
standards (enforceable rules for conduct as psychologists) for test construction (Standard 9.05)
and interpretation of assessment results (Standard 9.06) requiring psychologists to "use
appropriate psychometric procedures and current scientific or professional knowledge for test
design, standardization, validation, reduction or elimination of bias, and recommendations for
use" (p. 1072), as well as consider characteristics of the person being assessed that affect the
accuracy of test interpretations, including linguistic differences. Each of these resource
guidelines emphasizes the importance of a number of critical issues associated with appropriate
test development and use.
3

The research presented here is a construct comparability study designed to examine the
equivalence of results from cognitive ability tests administered in two languages. Specifically,
this study focused on the Woodcock-Johnson Battery - Third Edition Tests of Cognitive Ability
(WJ III COG; Woodcock, McGrew, & Mather, 2001) and the parallel Spanish version, the
Bateria III Woodcock-Munoz: Pruebas de Habilidad Cognitiva - Third Edition (Bateria III COG;
Woodcock, Munoz-Sandoval, McGrew, Mather, & Schrank, in press-b). It is important to
investigate the construct comparability for these measures for at least three reasons. First,
because the language of administration is different, there are reasons to expect that there might
be differences in the psychometric properties of the test. Are the ideas and content translatable?
Was the translation process done well? Second, and more importantly, while such measures are
administered in two different languages and the target populations for use are also different, the
types of inferences that are drawn are the same and are intended to be used in the same context.
For example, in an educational setting one or the other test will be chosen for assessment
purposes to match the language spoken by the student. The consequences based on the respective
scores will be the same; this assumes that a score of x on the WJ III COG is equivalent to a score
of x on the Bateria III COG. But what are the implications i f these scores are not equivalent?
Lastly, demonstrating that a measure provides useful and meaningful inferences based on test
scores for individuals and groups and across settings or contexts is an ongoing empirical question
(Messick, 1995).
Purpose of Study and Research Questions
This study begins the investigation of the construct comparability of the WJ III COG and
the Bateria III COG, which are English and Spanish versions of the same battery, respectively.
The research presented here represents a first step toward determining the degree of
4

comparability of these measures, because no other studies investigating this question have been
conducted. Using statistical as well as qualitative evaluations this study examined the degree of
comparability and sources of incomparability of seven tests of cognitive ability that were
translated from English to Spanish. The three research questions for this project were:
1. Are the dimensionality and structure of each of the selected tests of the WJ III COG
and Bateria III COG the same? Are the test items in each test related to each other
and the overall construct being assessed in the same way for both language versions?
2. Are there specific items from the selected tests of the WJ III C O G and Bateria III
COG that may be functioning differentially between English- and Spanish-speaking
examinees? Are there items that are easier or more difficult for examinees from a
particular language group (when matched on ability)? If so, which items are they?
3. What are the sources of differences in constructs being assessed for the two language
groups? Are there item characteristics that might be associated with the differential
functioning of the items? Are there problems associated with translation of the items?
By examining the comparability of the WJ III COG and the Bateria III COG, this study
identified unique issues in the comparability of these two language versions. Further, this study
contributes to evidence about the validity of the comparisons between these two measures,
generating information important to understanding and using the English and Spanish versions of
these widely used cognitive ability tests. Finally, the current study exemplifies a sophisticated
approach to comparability assessment that may be employed with other translated measures.
5
Preview of Chapter II
Recent advances in test development have provided professionals with assessment
options that previously did not exist, including tests available in other languages (Alvarado,
1999). Today there exist a number of translated tests that compare individual or group
performance across languages and cultures. However, it cannot be assumed that the
psychometric properties of a translated test are the same as the "original" version. In fact, the
translated test is going to have its own unique psychometric properties, and the degree to which
the test is comparable to the "original" version is an empirical question. The literature that will
be presented as part of the foundation for this research project wil l focus on issues and
considerations about establishing the degree to which inferences based on test scores from WJ III
COG and Bateria III C O G are comparable.
6

CHAPTER II: LITERATURE REVIEW
Standards for Test Development and Test Use and Issues of Validity
Developments in the educational measurement field, including advances in statistical
procedures and methodologies, as well as theoretical views of what constitutes "good
measurement" and how one demonstrates that, has pushed test developers and users to build
instruments with good psychometric qualities and be thoughtful about assessment procedures,
respectively. In this section, literature about what constitutes a "good" test and testing practices,
as outlined by major theorists in the measurement field will be presented, as well as related
standards and guidelines as put forth by national organizations in measurement, education, and
psychology. This section highlights the importance of developing and selecting measures with
good psychometric qualities, interpreting scores, and fairness in testing practices.
Validity as a Unitary Construct
The work of Samuel Messick (1989a; 1989b; 1995) has been seminal in furthering how
validity is conceptualized and demonstrated. Traditionally, validity was evaluated by
investigating and demonstrating three separate and distinguishable types of validity; content,
criterion, and construct validity. Messick (1989a) criticized this fragmented and incomplete view
and, instead, presented a unified concept of validity that integrates both the social meaning and
social values in test interpretation and test use into a comprehensive theory of construct validity.
Further, this comprehensive theory was to be used as a general criterion with which to make an
overall evaluative judgment of the degree to which evidence (empirical and theoretical
rationales) support the adequacy and appropriateness of the inferences and actions based on test
scores (1989a). In this way, rather than investigating and presenting compartmentalized types of
validity, Messick called for an evaluative summary of evidence for the actual, as well as
7
potential, consequences of score meaning and utility. Furthermore, Messick's view focused on
the validity of the meaning or inferences of the test scores, rather than validity as a property of
the test, because scores are a function of the items, but also the examinees and the context of the
assessment.
Messick (1989a) conceptualized the construct of validity to be a unitary concept and
encompass evidence and rationales to support the interpretations of scores in terms of
explanatory concepts that address both test performance and score relationships with other
variables. For this, he presented a framework that contains six distinguishable aspects that
highlight the central issues implicit in the notion of validity as a unified concept. These aspects
of construct validity were: content, substantive, structural, generalizability, external and
consequential. With these six aspects of construct validity Messick (1995) maintains that,
together, they provide a means to address the "multiple and interrelated validity questions that
need to be answered to justify score interpretation and use" (p. 746). Further, most score-based
interpretations and action inferences either "evoke these properties or assume them, explicitly or
tacitly" (Messick, 1995, p. 747).
Messick (1995) identified two threats to construct validity that can occur in all
assessments. The first threat occurs when the assessment's design is too narrow and does not
include important dimensions of the construct, called construct underrepresentation. The second
threat occurs when the assessment's design is too broad and includes reliable variance irrelevant
to the interpreted construct, called construct-irrelevant variance. There are two types of
construct-irrelevant variance; construct-irrelevant difficulty and construct-irrelevant easiness. It
is construct-irrelevant difficulty for "individuals and groups that can be a major source of bias in
8

test scoring and interpretation and of unfairness in test use" (Messick, 1995, p. 743) and which
differential item functioning methods are used to identify.
Messick's notion of a unitary concept of construct validity, in which an evaluative
judgment of the validity of the inferences of scores is drawn, provides a useful and practical
means with which to ascertain the degree of construct comparability between two measures. This
framework provides a foundation for specific procedures and statistical methods to investigate
the available aspects of construct validity in order to evaluate and determine the degree to which
the inferences based on scores are valid. It is this conceptualization of validity that is the
foundation for the selection of procedures and types of evidence that are investigated within this
study.
The Standards for Educational and Psychological Testing
Messick's work delineates a theoretical framework in which construct validity is
construed as a unitary concept, where facets of evidence are accumulated to develop a
scientifically sound argument about the adequacy and appropriateness of inferences and actions
based on test scores. His conceptualization of construct validity has been accepted as state of the
art, so much so that the Standards for Educational and Psychological Testing' (AERA et al.,
1999), the recognized authority on educational testing, have produced a practical guide for test
development and test use in which the section that speaks to validity is modeled after his
approach. While the Standards (AERA et al.) also include information and guidelines about
other important and fundamental testing issues, what follows is a summary of the pertinent
information contained with respect to validity and in relation to the research presented herein.
1 For brevity, I will henceforth refer to them as the Standards.
9

The Standards (AERA et al., 1999) present five sources of validity evidence, each of
which is presented and briefly described. One source of validity evidence is providing logical or
empirical analyses between the test's content and the construct it is intended to measure.
Examining the processes that an examinee uses when responding to an item or set of items is
another source of validity evidence. Investigating response processes usually comes from
analyses of individual responses and can provide evidence of the degree of fit between the
construct and the anticipated responses, and the actual responses. Investigating the relationship
of test scores to external variables (i.e., a criteria variable, other test scores) is another source of
validity evidence. For this, analyses seek convergent and discriminant evidence (how test scores
relate to other measures of similar and dissimilar constructs). In other words, what is their
accuracy in predicting a criterion performance, or generalize a test-criterion performance to a
new situation? Validity evidence concerned with the intended and unintended consequences of
testing involves distinguishing between evidence that relates directly to validity issues and those
of social policy. Lastly, analyses of the internal structure of a test provide evidence about the
degree to which the relationships among the test items and test components conform to the
construct of interest. The nature of how the test will be used determines the specific types of
analysis and their interpretations. For example, whether it is important to provide empirical
evidence about the unidimensional nature of a measure, or confirm that items increase in
difficulty within a test component, or show whether items function differently for different
subgroups, wil l dictate the appropriate analyses, as well as provide the context for
interpretations. Another acceptable approach to investigating this source of validity evidence is
to use qualified experts that can evaluate the representativeness of the chosen items. This source
of evidence can be important, particularly when addressing questions about differences in the
10

interpretation of test scores across examinee subgroups. For example, the use of qualified experts
can help identify whether construct underrepresentation or construct irrelevant components
advantaged, or disadvantaged, one or more of the examinee subgroups.
The Standards (AERA et al., 1999) also include information and guidelines about
fairness in testing and test use. The term fairness can be used in multiple ways. Fairness can be
described in relation to equitable treatment in the testing processes. That is, fair treatment of
examinees requires consideration of the test, as well as the context and purpose of testing and the
manner in which the test scores will be used. This would include that all examinees be given an
opportunity to demonstrate their standing on the construct the test is intended to measure. The
Standards (AERA et al.) also relate fairness to the lack of bias, where bias represents the
situation in which deficiencies in a test, including construct-irrelevant components, or the way it
is used, results in different meanings for scores earned by different identifiable groups (AERA et
al.). Evidence for the potential sources of bias may be sought through: (a) the comparison of the
internal structure of test responses for different groups (i.e., Differential Item Functioning) in
order to determine whether the response patterns for members of different groups, matched on
ability, is the same or different, (b) judgmental reviews to follow up Differential Item
Functioning (DIF) in order to examine test content for explanations for statistical difference
based on language, level of familiarity, etc., and (c) the comparison of the internal structure of
the test responses for different groups of examinees (i.e., factor analysis) in order to determine
whether the construct being measured has the same underlying dimensions for both groups.
With respect to translated or adapted tests, two of the standards seem especially relevant,
and are central in providing a framework for the proposed study. Standard 9.7 states the need to
provide "empirical and logical evidence for score reliability and the validity of the translated
11
test's score inferences for the intended uses" (AERA et al., 1999, p. 99). Standard 9.9 relates to
the comparability of multiple language version of a test, and states the importance of reporting
evidence that "the different language versions measure equivalent or similar constructs, and that
the score reliability and the validity of inferences from scores from the two versions are
comparable" (AERA et al., 1999, p. 99). Further, the Principles for Fair Student Assessment
Practices for Education in Canada (1993), a set of principles and guidelines related to fair
assessment practice within the Canadian education context, state that developers should provide
evidence that an assessment method translated into a second language is valid for use with the
second language, as well as provide evidence of the comparability of different instrument forms.
As with Messick (1989a; 1989b; 1995), the Standards (AERA et al., 1999) clearly
articulate that validity is the degree to which a coherent integration of various pieces of evidence
supports the intended inferences of test scores for specific uses. This argument can then be the
bases for refinement, revisions, or suggestions about areas of further study. Taken together the
work of Messick and the guidelines set out by the Standards (AERA et al.) provide both a
theoretical and practical framework from which to base the procedures and methodologies of this
research study in order to evaluate the comparability of the WJ III C O G and the Bateria III COG.
Construct Comparability
Increasingly, educational and psychological tests are being translated in order to compare
individual or group performances across languages and cultures for the purposes of cross-cultural
research, international research programs, comparing the proficiency of a bilingual student's first
and second language abilities, and in order to test students in their first language (Woodcock &
Munoz-Sandoval, 1993). But how does one determine whether or not inferences based on
translated test scores mean the same thing as scores from the original measure? This section
12

presents and reviews research in the area of construct comparability and equivalence, including
the procedures and methods used to determine the degree to which measures are comparable, as
well as research results that provides insights on the degree and the types of problems that can
occur with test translations. Presently, published research results from construct comparability
studies are sparse, because this is an emerging area of study. Guidelines proposed in the early
nineties (i.e., Geisinger, 1994; Hambleton, 1994), including the Guidelines for Adapting
Educational and Psychological Tests, developed by the International Test Commission
(summarized by Van de Vijver & Hambleton, 1996) review problems related to translating and
adapting tests and provide suggestions for maximizing construct equivalence across languages.
These guidelines were developed because "technical literature for guiding the test translation and
adaptation process appeared to be incomplete at the time and scattered through a plethora of
international journals, reports, and books - and there was substantial evidence that current
practices were far from ideal" (Hambleton, 2001, p. 164). Further, while complex measurement
methods (e.g., item response models) appeared to be useful for establishing the equivalence of
scores from different language versions of tests, these methodological advances were not being
used (Hambleton, 2001; Hulin, 1987; van de Vijver & Leung, 1997). Included in these guidelines
are requirements that test developers (or researchers) apply appropriate statistical techniques to
establish the equivalence of the different language versions of the test and identify problematic
components or aspects of the test that may bias the test for one of the language groups (e.g.,
factor analysis and DTP procedures). The research presented below provide examples of the type
of research that these guidelines call for, and mark what is sure to be the beginning of a growing
body of literature.
13

Establishing Construct Comparability
The research presented here investigates three aspects of construct comparability. The
first aspect relates to the structure of the construct for which statistical evaluations (i.e., factor
analysis) are required as evidence of construct equivalence. A second aspect of construct
comparability is to determine that items function similarly in both the translated, or adapted, and
source language versions of the test (Hambleton, 2002). This is accomplished through the
statistical evaluations of DIP. The third and final aspect of construct comparability is concerned
with why items are performing differently between groups. The following sections present
research that addresses these aspects of construct comparability.
Statistical Evaluations of Construct Equivalence
There are two main reasons to investigate the structural equivalence of translated tests
between language groups. First, as part of the determination of construct equivalence, evidence
that that the construct is represented and measured the same way in both languages is necessary
(Hambleton & Patsula, 1998). In other words, it is important to demonstrate that the test is
measuring the same thing in both languages. And second, the item level investigation of
translation effects, or differential item functioning analyses, uses a total score as the matching
criteria, and in order to use this total score construct bias must be ruled out (Sireci & Allalouf,
2003).
Allalouf, Hambleton, and Sireci (1999) investigated the equivalency of different language
versions of the verbal subtests of the Psychometric Entrance Test (PET), a high stakes test used
for admissions to universities in Israel. As part of their study they included analyses investigating
the structural equivalence of the verbal subtest scores across two language groups, differential
item functioning, and a review panel of translators to analyze the type and content of identified

DIF items to discover the potential causes of DIF. Details of the dimensionality analysis are
presented in Sireci, Xing, Bastari, Allalouf, and Fitzgerald (1999). Exploratory factor analysis
(EFA), Multidimensional Scaling (MDS), and Confirmatory Factor Analysis (CFA) were used to
evaluate the structural equivalence of four of the five content areas composing the Verbal
Reasoning subtest of the Hebrew and Russian language versions. Results from the EFA
suggested that there were five factors for the Hebrew version and six for the Russian version. For
both the Hebrew and Russian data, separate factors corresponded to each of the four content
areas, however each data set required two factors for the reading comprehension content area
(corresponding to two different reading passages). Further, the Russian data required two factors
for the analogy content area, one for items related to vocabulary analogies, and the other for
"logic-type" analogies. Using MDS, a five-dimensional solution best represented the data, with
the first three dimensions essentially representing the content areas, and the last two dimensions
segregating two sets of logic items from one another, and logic items from sentence completion.
For the C F A , four separate four-factor models were fit to the data, with the factor loadings for
the items specified in accordance with their content areas. A l l models produced goodness-of-fit
indices of about .96, suggesting reasonable fit to the data. The researchers concluded that the
structural analyses are complimentary, and in general support the conclusion that the content
structure of the PET was similar across the Hebrew and Russian versions of the test. The
differences in the factor structure of the E F A were thought to be related to the presence of a large
degree of differential item functioning across the two language versions (discussed
subsequently).
15
Statistical Evaluations of DIF
Research on test translation and adaptation supports that there are indeed problems
associated with translating tests into other languages. In this section, research as it relates to the
comparability of test items across different groups is presented. One of the methods used in
examining construct comparability in multiple language versions of assessments is differential
item functioning (DIF) analyses. DIF represents a set of analyses that attempts to sort whether
group differences are the result of item impact or item bias (AERA et al., 1999). In other words,
are differences in performance between groups the result of true group differences or is there
construct-irrelevant variance present that biases one group over the other? Items are said to be
functioning differentially for different groups when examinees from one group have a different
probability or likelihood of answering an item correctly when matched on ability. The research
presented below highlights that the amount of DIF on some translated tests is large.
Allalouf et al.'s (1999) investigation of the different language versions of the verbal
subtest of the Psychometric Entrance Test (PET) included a statistical examination of DIF. The
verbal subtest of the PET contains multiple-choice items of various types, including: analogies,
sentence completion, logic and reading comprehension. This 125-item subtest was developed in
Hebrew and translated into a number of languages; however Allalouf et al. only report results
that compare a Russian translation to the original Hebrew version. Sample sizes for the two
language groups ranged from 1,485 to 7,150 for examinees who took the Russian and Hebrew
test versions, respectively. DIF results using the Mantel-Haenzsel procedure (Holland & Thayer,
1988) indicated that 34% of the items exhibited moderate or large amounts of DIF. DIF was
found most frequently in analogy questions and sentence completion questions. Low levels of
DIF were found for the logic and reading comprehension items.
16

Ercikan (1998) examined the equivalence of test items and the comparability of scores
from tests in different languages using different large-scale assessment measures. First, using
assessment data from the 1984 International Association for the Evaluation of Educational
Achievement (IEA) Science Study (Population 2,14-year-olds), Ercikan compared 70 common
items of the English- and French versions of this test with Canadian students. The sample sizes
were 5,543 students and 2,358 students for the English and French language groups,
respectively. Of the common items, 26% were identified as displaying DIF. The second large-
scale assessment measure Ercikan investigated was the International Assessment of Educational
Progress (IAEP) conducted by Educational Testing Services (ETS) in February 1988. This set of
analyses focused on a French-speaking Quebec sample and an English-speaking American
sample of 13-year old students who were administered this mathematics and science
achievement test (60 items were common to the different language versions). The DIF analyses,
completed using the Mantel-Haenzsel (Holland & Thayer, 1988) procedure, indicated that 47%
of items displayed DEF, which is 26% more than the results from the IEA study. Ercikan
suggested possible explanations for the differences in the proportion of DIF items for the two
groups. One explanation was differences between comparison groups, with the IEA comparing
two language groups (English and French) both from Canada, whereas the IAEP study compared
the same language groups, although the English-speakers were from the US and the French-
speakers were from Canada. As a result, the curricula and cultural differences are likely to be
greater for the IAEP study than the IEA study. Another explanation concerned the quality of the
translation processes for the different studies, possibly contributing to the finding a higher
percentage of DIF items in the IAEP study.
17

In a later study, Ercikan and McCreith (2002) investigated the effects of test adaptations
on the comparability of English and French versions of the Third International Mathematics and
Science Study (TIMSS: Martin & Kelly, 1996). This is an international assessment that surveyed
13-year-olds students' mathematics and science achievement in 45 countries; however, the focus
of the investigation of item equivalence was on the English and French versions of the test. Four
countries (England, Canada, France, and the US) allowed for 3 sets of comparisons between the
English and French versions of items (i.e. England vs. France, US vs. France, and English and
French administrations in Canada), as well as comparing the English and French versions when
cultural differences were expected to be minimized (i.e., English and French administrations in
Canada). By completing three sets of comparisons the consistency, or replication, of DIF could
be examined. That is, i f DIF was replicated in two or more comparisons, the authors suggested
that this provided evidence to support that differences might be due to translation related
problems, rather than curricular or cultural differences.
Analyses included 154 to 156 mathematics items and 139 to 149 science items (the
number of items varied depending on the countries used in the comparisons), with sample sizes
ranging from 2,935 to 10,945 for the various language and country administrations. Results from
the Linn and Harnisch (LH) (1981) DIF detection procedure indicated that there were large
numbers of items identified as DIF. For mathematics, 14% to 59% of the items were identified as
DEF, with far fewer DEF items for the Canadian English and French comparison (14%), than
either the US-France (59%), or England-France comparison (39%). For science, 37% to 65% of
the items were identified as DIF, with far fewer DIF items for the Canadian (37%) and England-
France (39%) comparison, than the US-France (65%) comparison.
18
In yet another study Ercikan, Gierl, McCreith, Puhan, and Koh (in press) used data from
the English and French versions of Canada's national examination, the School Achievement
Indicators Program (SAIP). SAIP is used to assess 13- and 16-year old students in the areas of
Language Arts, Mathematics, and Science. Specifically, Ercikan et al. present DIF results for the
Mathematics, Reading, and Science assessments for each of the two age groups. The range of
sample sizes for the various assessments for the 13-year-old samples was 3,230 to 9,029 and
1,097 to 3,509 for the English- and French-speakers, respectively, and for the 16 year-old
samples was 2,296 to 8,263 and 904 to 2,719 for the English- and French-speakers, respectively.
Analyses of the Reading assessment (22 items) focused on only the multiple-choice questions
(the only questions that were comparable across different language versions of the test).
However, the Mathematics (125 items) and Science tests [students completed two out of three
forms; everyone completed Form A (12 items), and based on the results from this form students
were directed to complete either Form B (66 items) or Form C (66 items)] contained both
multiple-choice and constructed response questions that had been translated or adapted into
another language. To verify and confirm DIF results, Ercikan et al. used two DEF detection
methods to identify items in Reading and Science (the multi-stage administration design for
Mathematics created a sparse data matrix that was not compatible with one of the chosen DIF
detection methods). These methods were L H (Linn & Harnisch, 1981) and Simultaneous Item
Bias Test (SUBTEST; Shealy & Stout, 1993).
The degree of DIF detected varied with subject area. For Reading, 36% (32%)2 and 45%
(41%) of the items were identified as DIF for the 13- and 16-year-old students, respectively. For
Mathematics 38% and 32% of the items were identified as DIF for the 13- and 16-year-old
2 Linn-Harnisch results are presented first, and SUBTEST results are presented in parentheses.
19

students, respectively. Lastly, across all three science forms, 55% (38%) and 48% (35%) of the
items were identified as DIF for the 13- and 16-year-old students, respectively.
In another illustration of this type of research, Gierl and Khaliq (2001) used test results
from a Mathematics and Social Studies Achievement Test administered in Alberta. In this study
3,000 English and 2,115 French Immersion students were randomly selected from 38,000
English and 3,000 French Immersions students at two grade levels, 6 and 9. English-speaking
students represented students who were receiving instruction in English, whereas French
Immersion students represented students who were receiving instruction in French, but for whom
French was not there first language. The Grade 6 version of the test contained 50 multiple choice
mathematics questions and 50 multiple-choice social science questions. The Grade 9 version of
the test contained 43 multiple-choice mathematics questions and 55 multiple-choice social
science questions. Gierl and Khaliq report that 14% and 21% of the Math Achievement test were
identified as DIF for the Grade 6 and 9 students, respectively, whereas 58% and 31% of the
Social Studies Achievement test were identified as DIF for the Grade 6 and 9 students,
respectively.
The results of the studies presented above demonstrate that translation DIF spans
different assessment measures, content areas, language and age groups, and that the degree or
presence of DEF can be large. There are, however, some differences in the pattern of results (i.e.,
the degree of DEF for similar content areas varies between studies). Potential reasons for
differences could include quality of translations between the different assessment programs, and
sample selection procedures, neither of which is under the control of the researchers completing
research with these data sets. Another possible reason could be the sensitivity to detect DIF of
the different DEF detection methods. For example, while the DEF procedure of Mantel-Haenzsel
20

(Holland & Thayer, 1988) is a popular DIF method, it only detects uniform and not non-uniform
DIF, and therefore D U results may be an under estimate of the amount of DIF items, whereas
the L H procedure (Linn & Harnisch, 1981) can detect both uniform and non-uniform DIF.
The most basic premise of construct comparability research is to investigate the degree to
which inferences based on test scores are valid. The research reviewed communicates that the
degree of DIF is large, but what does this mean in terms of test scores and inferences? Ercikan
(1998) provides an illustration about the impact of DEF on the comparability of scores for the
IEA study. Differences in the total number-correct scores because of DIF were calculated for
each language group by examining the differences in item difficulties (item /^-values) for the two
groups, conditioned on ability level. Results suggest that high level DIF items could lead to 0.32
to 1.28 number correct score points in favour of the English-speaking group and 0.16 to 0.64
number correct score points in favour of the French-speaking group. Ercikan states that these
differences seem small for a 70-item test, but that indeed these differences could lead to different
rankings of countries in international comparisons.
The information presented above illustrates that DIF is indeed present in translated and
adapted tests. However, the identification of DEF provides no information about why these items
are a problem. In the following section, research results investigating the sources of DIF are
presented.
Qualitative Evaluations of DIF
The process of a judgmental review of items is to discover why items are performing
differently between groups, whether that be to identify problems made during the translation
process, or identify cultural or educational differences between groups that cause performance
differences, or to establish guidelines or procedures that will inform future translations or
21

adaptations. What follows is a presentation of research on the use and results of judgmental
review procedures used for the purposes of establishing construct comparability.
As part of their investigation of the equivalency of different language versions of the
verbal subtest of the Psychometric Entrance Test (PET), Allalouf et al. (1999) used a two-stage
procedure for identifying possible causes of DIF. First, a blind review of 60 items (42 of which
were identified as DIF items) by a panel consisting of five Hebrew-Russian translators was
completed, where the panel predicted for each item whether it displayed DIP, which group did
the item favour, the degree of DIP (moderate or large), and potential causes of DIP. Secondly, in
a committee review session, which included the five translators as well as three Hebrew
researchers, the DIF results were shared with the translators, and translators were asked to defend
their predictions and causes for DEF, and then reach consensus about the causes of DIP for each
of the 42 items.
Based on the reviews by the translators as well as the consensus committee four main
causes for DIF were identified. These were, (1) changes in difficulty of words or sentences, (2)
changes in content (the meaning of the item changed in translation), (3) changes in format (one
language version of the sentence is much longer), and (4) differences in cultural relevance (the
translation was appropriate, however the content of the item interacted with culture).
Gierl and Khaliq's (2001) substantive procedures to investigate potential sources of DIF
used a Mathematics and Social Studies Achievement Test administered in Alberta. The
substantive analysis began with an 11-member review committee consisting of bilingual and
monolingual test translators and test developers, psychometricians and directors for test
development reviewing the English and French versions of items identified as DEF from the
previous years administration of the Grade 6 Mathematics and Social Studies Achievement Test.
22

The committee, which was blind to the DD? status of items, was asked to identify any translation
problems or differences, describe the source of the difference, and specify the direction of DIF
(i.e. which group would the item favor) for each item. Discussion continued until there was
consensus on each of these three points. Four different sources of differences were identified by
this panel: (1) omissions or additions of words, phrases or expressions that affected meaning, (2)
differences in words or expressions inherent to language or culture, (3) differences in words or
expressions not inherent to language or culture (these were differences that appeared to be linked
to poor choices in the translation process), and (4) format differences (for example, differences in
punctuation, typeface or item structure). These sources were then validated by another review of
DD? items. This time, items from the 1997 Mathematics and Social Studies Achievement Test,
which were statistically flagged as DD?, were reviewed by translators, first independently, using
the sources of translation generated by the 11 person committee, and then together to discuss and
reach consensus on the items where there were disagreements.
The overlap between the categories developed by the review committee in the study
completed by Gierl and Khaliq (2001) and those presented in Allalouf et al. (1999) is
considerable, and noted by the authors. However, there are some differences in how sources of
differences were categorized. For example, in Gierl and Khaliq (2001) the second identified
source of DIP includes language differences and cultural differences, which Allalouf et al. have
separated into two categories (change in word difficulty and differences in cultural relevance).
These similarities, and differences, suggest that there exists some notable common sources to
translation problems, but that there exists nuances to how independent reviewers "label"
differences. This area of research is in its infancy in terms of developing methods around
23

conducting reviews to determine sources of DIF. A clearer understanding of translation DIF, as
well as procedures to investigate it would benefit from clear operationalized categories.
Ercikan (1998) examined the 18 items (26% of the total test) that were identified as
displaying DIF from the assessment data from the 1984 International Association for the
Evaluation of Educational Achievement (IEA) Science Study (Population 2, 14-year-olds), for
potential causes of DIF using guidelines to help with translations to English proposed by Brislin,
Lonner and Thorndike (1973). The eight observations cited as possible causes for DIF reflect
similar results as Allalouf et al. (1999), in that problems with translations were linked to changes
in difficulty of words or sentences, changes in content, and changes in format. Of the 18
identified DIF items, eight had explanations related to translation problems.
Ercikan and McCreith's (2002) investigation of translation effects on the comparability
of English and French versions of the TEVISS (Martin & Kelly, 1996) employed three strategies
to identify the sources of DIF. One strategy was to use a judgmental review process, whereby
four translators bilingual in English and French examined the two language versions of the test
for potential differences. If differences were identified, the translators would evaluate the degree
to which the differences would change the meaning of the item. Further, these translators were
used to interpret differences that were identified to be differentially functioning.
In the review of all items by the translators they identified 22% (64 items) of the total
number of items (mathematics and science) as having problems related to translation. The types
of problems described included differences in the specificity of the vocabulary, the clarity of the
questions statement, vocabulary difficulty, clues that were expected to guide examinee thinking
processes, and the number of words in an item (item length). Of these 64 items, 34% were
flagged as DIF in the Canadian comparison. In other words, of the items flagged as having
24

potential translation problems, approximately a third of them were identified as functioning
differently for the two language groups.
The judgmental review and investigation of translation and curricular interpretations of
DIF suggest that 17% (4 items) of the mathematics items and 27% (14 items) of the science
items flagged as DIF had translation related interpretations, while 17% (4 items) of the
mathematics items and 13% (7 items) of the science items flagged as DIF had curricular related
explanations. This leaves a large portion of DEF items that could not be attributed to translation
related or curricular differences.
In their examination of the English and French versions of the Reading, Mathematics and
Science test of SAIP, Ercikan et al. (in press) had four bilingual French-English translators
complete a blind review of the items for identifying potential sources of DEF and adaptation
problems. Reviewers were required to identify differences between the two language versions, as
well as make judgments regarding whether the differences were expected to lead to performance
differences for the two language groups as well. The review process consisted of three stages: (1)
group review of sample of items to discuss and understand criteria involved in reviewing the
items; (2) independent review of each item by four reviewers; and (3) group discussion and
consensus for rating adaptation differences between the two language versions of the items.
Form A of the Reading items, a random sample of Mathematics items, which included all
Mathematics DEF items, and all of the Science items were reviewed. The results of the review
process indicated that all of the Reading DEF items were identified to have adaptation related
differences; for Mathematics, nine (35%) of the common 26 DIF items for both age groups were
identified to have adaptation related differences and 45% to 54% (depending on the age group)
of the DEF items were interpreted to have adaptation related differences. En other words, the
25

review of the different language versions identified 35% to 100% of DIF items to have
differences due to adaptations in the three content areas and across two age groups.
The presentation of the above research point out that there are common problems that can
occur in the process of translating a test to another language and that, in addition to being
statistically identified, a review panel can also identify these problems. Moreover, when
identified by a panel of reviewers, the information about the source of the problems is potentially
identified, and as a result can be rectified.
Summary
The research results presented in this chapter illustrate that when investigated, the degree
of construct comparability between translated tests can be quite low. Further, given the
consensus on the value of construct comparability research, the theoretical underpinnings of
Messick (1989a, 1989b, 1995) and the requirements of the Standards (APA et al., 1999),
beginning to investigate the psychometric properties and the comparability of the WJ III COG
and the Bateria III C O G is warranted. Further this review highlights the important psychometric
aspects that need to be investigated when determining the degree of comparability between
translated measures, as well as the appropriate methods with which to complete this
investigation. Hence, the purpose of this study was to investigate the structural equivalence,
item level equivalence, as well as evaluate the qualitative equivalence of seven tests of cognitive
ability from these measures. As outlined in the next chapter, these investigations and evaluation
were completed using factor analytic methods, item response theory analyses, including
differential item functioning, as well as a judgmental review of items and instructions.
26

CHAPTER III: M E T H O D
As shown in the previous chapter, a number of different methodologies have been used to
investigate the psychometric properties and comparability of translated achievement tests.
However, these methods have yet to be used to examine the construct comparability of different
language versions of cognitive ability tests. In this chapter, the measures, data sources, and test
analysis models, as well as their respective procedures are described. It includes information
about the measures and the specific tests that are the focus of this study, including technical
properties, task descriptions, and the translation process. Further, the procedures and analyses
performed are described. The four-stage procedure used for addressing the research questions is
outlined, and information about each stage and the analyses performed is documented. The
selection of procedures was based on theoretical conceptions of validity, and accompanying
methods used to establish validity, the Standards (AERA et al., 1999), as well as guidelines and
previous research results related to establishing construct equivalence between translated and/or
adapted tests. The purpose of this study was to determine: (1) whether the dimensionality and
structure of each of the selected tests of the WJ III C O G and Bateria III COG were the same; (2)
whether there were specific items from the selected tests of the WJ III C O G and Bateria III COG
that function differentially for English- and Spanish-speaking examinees; and (3) whether the
sources of differences in the constructs being assessed for the two language groups could be
identified.
Measures
The WJ III C O G and the Bateria III C O G are individually administered measures of
cognitive functioning aligned with a stratified model of intellectual abilities defined and refined
by Cattell, Horn, and Carroll, referred to as CHC theory of cognitive abilities, and therefore
27

share the same complex structure (Woodcock et al., 2001; Woodcock et al., in press-a). CHC
theory is based on two major sources of research on the structure of human cognitive abilities,
(a) Gf-Gc theory (Horn & Cattell, 1966), and (b) Carroll's three-stratum theory (1997).
The Bateria III C O G was developed as the Spanish version parallel to the WJ III COG;
the tests included in the Bateria III COG are translated or adapted Spanish versions of the WJ III
COG tests. The test authors claim that the information from these tests, including an individual's
score on both tests, can be directly compared because the Bateria III COG has been equated to
the WJ III COG (Woodcock et al., in press-a). That is, tasks underlying each Spanish test are
rescaled, or equated, to the WJ III COG according to the empirical difficulty of counterpart tasks
in English (Woodcock et al.). In other words, the performance of subjects on the Spanish version
of the test is equated to corresponding levels of ability and difficulty on the English version of
the test.
The WJ III COG, and hence the Bateria III COG, are designed to measure general and
specific cognitive functions. Each of these test batteries is comprised of 20 tests divided equally
between a standard and extended battery. With the revision of the WJ III COG and the Bateria III
COG in 2001 and 2004, respectively, a number of new tests were added to these test batteries,
two of which are included in this study: Decision Speed and Rapid Picture Naming.
A number of derived scores are available with the WJ III/Bateria III scoring system
including, grade and age equivalents, percentile ranks, discrepancy scores, and scores reported
on various scales developed for the WJ III. In addition, two indices of general cognitive
functioning (i.e., intelligence) by means of the General Intellectual Ability (GIA) score and the
Brief Intellectual Ability (BIA) score are provided.
28
Selection of Tests
A l l of the tests included on the Bateria III COG have been either translated or adaptated
from the original versions of the tests on the WJ III COG (Woodcock et al., in press-a). There is
a clear distinction between a translated and adapted test. For test translations, the item(s)
remains exactly the same, and only the directions are translated from English to Spanish;
whereas for test adaptations, the item(s) have been altered in some way (Woodcock et al.). For
the purposes of this study, the focus was on 7 of the 10 common tests that were translated3.
Translated tests were chosen so that for each test every item would be comparable. This would
not have been the case had the adapted tests been chosen, because for these tests the items were
changed in some way. For instance, all of the stimuli for Auditory Attention are different between
the two languages (Woodcock et al., in press-a), and hence item level comparisons are not
possible. At the outset of this project, the Bateria III COG was unpublished and completing
collection of the calibration data, and access to the materials was not possible until a research
agreement had been made between the researcher and test authors and publisher. As such, it was
impossible to determine the degree of adaptation, and hence the degree with which the two
language versions for these tests would be comparable. Thus, a criterion for test selection was i f
the test was translated.
The number of tests to be investigated was limited from 10 for several reasons. First,
there were limitations regarding the availability of some of the data from the test publisher.
Specifically, data from the WJ III COG was unavailable for the Pair Cancellation test. This test
3 The tests were identified as translated or adapted by the test author (Munoz-Sandoval, personal
communication, September 13, 2002).
29

was introduced late in the project and the overall sample size was small, as well as the scoring
and scaling was handled slightly differently when compared to the Bateria III COG (K.S.
McGrew, personal communication, February 3, 2004). Second, it was decided to exclude
Numbers Reversed as part of this research study. This decision was based on the nature of the
stimuli, which is auditory. For all the other tests that are included in this study, the presentation
of stimuli is visual. Lastly, Planning was excluded from this project because of its unique
scoring scheme. For this test, number of errors are scored and used to determine a person's
ability. That is, a score on this test represents the number of incorrect responses. This would
present unique challenges for data analyses that were deemed beyond the scope of this project,
and as such, this test was excluded from this study.
A complete list of tests and the format of the stimuli and response required of the test, as
well as what the tests purport to measure is presented in Tables 1 and 2.
Table 1
Stimulus and Response Required for the Translated Tests of the WJ III COG and Bateria III
COG4
Test Stimuli Response Required
Spatial Relations Visual (drawings) Oral (letters) or motoric (pointing) Concept Formation Visual (drawings) Oral (words) Visual Matching Visual (numbers) Motoric (circling) Picture Recognition Visual (pictures) Oral (words/letters) or motoric (pointing) Analysis-Synthesis Visual (drawings) Oral (words) Decision Speed Visual (pictures) Motoric (circling) Rapid Picture Naming Visual (pictures) Oral (words)
4 Table modified from information presented in the WJ-III COG Technical Manual (McGrew &
Woodcock, 2001).
30

Table 2
Task Description of the Translated Tests for the WJ III COG and Bateria III COG5
Test Test Requirement
Spatial Relations
Concept Formation
Visual Matching
Picture Recognition
Analysis-Synthesis
Decision Speed
Rapid Picture Naming
Measures the ability to visually match and combine shapes. The subject must identify and select from a series of shapes, the component parts to construct a whole shape.
Measures the ability to identify, categorize, and determine the rule for a concept about a set of colored geometric figures when shown instances and non-instances of the concept. This is a "learning" test with corrective feedback and reinforcement of correct answers provided to the subject.
Measures the ability to rapidly locate and circle the two identical numbers in a row of six numbers. The task proceeds in difficulty from single-digit numbers to triple-digit numbers.
Measures the ability to recognize a subset (1 to 4) of previously presented pictures within a field of distracting pictures.
Measures the ability to analyze the components of an incomplete logic puzzle and identify the missing components. This is a "learning" test with corrective feedback and reinforcement of correct answers provided to the subject.
Measures the ability to rapidly scan a row of pictures and decide which two drawings, from a set of seven, are the most similar conceptually. The decisions become slightly more abstract as the test progresses.
Measures the ability to rapidly recognize then retrieve and articulate the names of pictured common objects. The stimulus pictures are presented in rows of five.
5 Table modified from information presented in the WJ III COG Technical (McGrew &
Woodcock, 2001) and Examiner's Manual (Mather & Woodcock, 2001), as well as the Essentials ofWJ
III Cognitive Abilities Assessment (Schrank, Flanagan, Woodcock, & Mascolo, 2002).
31

Woodcock-Johnson III Tests of Cognitive Ability
The general characteristics of the WJ III COG norming sample and standardization
procedure are summarized in the Technical Manual (McGrew & Woodcock, 2001). To
summarize, the data for the WJ III norms were collected from a large, nationally representative
sample (based on the 2000 U.S. census projections) of 8,818 participants (consisting of 1,143
preschool-aged children, 4,783 students in kindergarten through 12th grade, and 1,843 adult
participants) that represents 100 geographically diverse U.S. communities. Subjects were
randomly selected within a stratified sampling design that controlled for 10 specific community
and subject variables (census region, community size, sex, race, Hispanic, type of school, type of
college/university, education of adults, occupational status of adults, occupation of adults in the
labor force) (Note: A l l variables were not relevant at all levels of the norming sample). English
language learners were also included i f they had one year or more of experience in regular
English-speaking classes. A l l participants were administered tests from both the WJ III COG and
the WJ III Achievement by research assistants who were well trained and closely supervised.
Data were collected from September 1996 to August 1999.
The technical manual presents reliabilities for each test for various age groups. For most
tests, reliabilities were calculated using a split-half procedure in conjunction with the Spearman-
Brown correction to adjust for published test length. For speeded tests, as well as those with
multiple-point scoring, reliabilities were calculated by Rasch (1960) analysis procedures. The
age groups are based on one-year age groupings from 2 to 196, and then 10-year age groupings
from 20 to 80. The reliabilities range from 0.61 to 0.98 for the tests selected in this study and
6Where available, for some tests reliabilities are not reported for the youngest age groups (i.e., 2,
3, and 4).
32

across these age groups. A table of the range of reliabilities and median reliability for each test is
presented in Table 3.
Table 3
Reported Reliabilities for the Selected Tests of the WJ III COG
Test # of Items Reliability Range Median Reliability
Spatial Relations 33 .68- .92 .81 Concept Formation 40 .75 - .97 .94 Visual Matching 60 .84- .96 .91 Picture Recognition 24 .61 - .85 .76 Analysis-Synthesis 35 .81 - .95 .90 Decision Speed 40 .78- .92 .87 Rapid Picture Naming 120 .91 - .98 .97
Bateria III Woodcock-Munoz: Pruebas de Habilidades Cognitiva
The general characteristics of the Bateria III COG calibration sample and procedure are
summarized in the Bateria III Technical Abstract (Woodcock et al., in press-a). To summarize,
the data for the calibration of the Bateria III were collected both inside and outside of the United
States. Calibration data were collected from 1,413 native Spanish-speaking participants from
several Spanish-speaking regions including; Mexico, Puerto Rico, Cuba, Spain, Guatemala,
Colombia, Argentina, South Africa, Venezuela, Nicaragua, Ecuador, Panama, Chile, Honduras,
Costa Rica, Dominican Republic, and Uruguay. Two hundred and seventy-nine of these
participants resided in the United States, although many of them were born in another country.
Participants were selected for inclusion in the calibration sample i f they were monolingual
Spanish speakers, based on an informant's opinion.
33

Translation Process
The following information about the translation process for the Bateria III COG was
obtained from the Bateria III Technical Abstract (Woodcock et al., in press-a). Given that the
Bateria III COG represents a third version of this test battery, many of the tests included were
translated or adapted during the development of the earlier editions.
Particular attention was paid to ensure that items and test instructions were appropriate
for all Spanish speaking regions, thus professionals from several different Spanish-speaking
regions were involved in the preparation of the test items and instructions for all tests
(Woodcock et al., in press-a). At the early stages of the history of the Bateria development, a
board of consulting editors was established to review and advise on all aspects of the project
including the item content and Spanish language usage. Approximately 30 examiners from five
Spanish-speaking countries were trained to gather norming data. These examiners were also
responsible for critically reviewing the tests and answer keys for possible Spanish-language
problems based on their regional perspective. Further, the item calibrations were completed
separately for each of the five regions. If there was a significant difference when comparing
regional item difficulties with item difficulties obtained for the total sample, the item was
assumed to be regionally biased, and was dropped from the item pool.
The Bateria III COG contains 12 new tests, for which test translation and adaptation was
performed by, or under the direction and supervision of, Dr. Ana Munoz-Sandoval (this included
two professional translators and a consulting translator). Each of these individuals was a
professionally certificated Spanish translator and a native Spanish-speaker. Once again,
additional information about the suitability of item content, test translation and adaptation across
different Spanish-speaking regions (including, Mexico, Puerto Rico, Spain, Argentina, Panama,
34

Costa Rica, Columbia, and the United States) was gathered by Bateria III standardization
examiners.
The Bateria III Technical Abstract (Woodcock et al., in press-a) does not provide any
information about the method of translation (i.e., whether the translation occurred through back
or forward translation). In their review of sources of error associated with adapting tests,
Hambleton and Patsula (1998) state that "backward translation designs are popular but forward
translations designs provide stronger evidence of test equivalence because both the source and
target language versions of the test are scrutinized" (p. 161). Further, Standard 9.7 of the
Standards and the states "the test translation methods used need to be described in detail"
(AERA et al., 1999, p. 99), a practice also supported by the A P A (APA, 2001).
Equated US Norms
One of the reasons the authors claim that the WJ III C O G and Bateria III COG are
comparable is because the Bateria III has been equated to the WJ III. That is, the tasks for each
test in the Bateria III C O G have been scaled to their empirical difficulty on the WJ III. A brief
description of the process with which the test batteries were equated is presented below.
The calibrating and equating method used to equate the WJ III and the Bateria III is
described in the Bateria III Technical Abstract (Woodcock et al., in press-a), and follows the
procedures presented by Woodcock and Munoz -Sandoval (1993) on their approach to cross-
language test equating. The process involves several stages, or steps. First a bank of items for the
WJ III was developed, calibrated and normed. An item bank for the Bateria III that included
adapted and translated items was then developed and calibrated. The two tests were equated
through a subset of English items (WJ III) and parallel translated English items (Bateria III) that
35
ranged in difficulty (from easy to difficult). The difficulty scale for the Bateria III item bank was
than rescaled to the difficulty scale of WJ III.
Scoring
The WJ III COG and Bateria III COG use ceiling or discontinue rules7 to limit
administration time, as well as minimize frustrations or discouragement of examinees by
attempting to answer questions too difficult for them, as is typical with cognitive ability and
individually administered achievement tests. When scoring, it is assumed for every examinee
that any item above the ceiling would be answered incorrectly. If, hypothetically, items of
greater difficulty appear earlier than they should, a ceiling could be established prematurely. For
IRT models the assumption is made that:
a response to an item is a function only of the student's ability and
the item's difficulty. If a test is speeded and test directions
influence the number of items attempted, then it seems likely that
item responses are no longer a simple function of ability and
difficulty (Ludlow & O'Leary, 1999, p. 165).
As a result, the scoring scheme for the data used in this study was to consider all items that were
not administered to examinees as missing in order that all estimations of ability and analyses are
based on actual response patterns from individuals.
7 Ceiling rules are used to limit the number of items administered and eliminate those items that
are deemed to be too difficult for the subject.
36

Procedure
The procedure outlined here is a multistage process in which each stage contributes to
determining the degree of comparability between the WJ III C O G and the Bateria III COG.
These procedures are based on several works including theoretical, methodological, and
professional standards presented earlier. The stages of this study are: (a) examination of factor
structures to empirically test similarity of factors (i.e. latent variables) or dimensions across the
groups in question, English- and Spanish- speakers; (b) investigation of the respective internal
consistency for the two language groups, by looking at the reliability for each language version
of each test; (c) completion of Item Response Theory (IRT) based analyses, including DEF to
statistically examine items that function differentially for the two language groups; and lastly, (d)
the Judgmental Review of test instructions and items that provides a qualitative evaluation of
their comparability. The following sections outline the various steps undertaken as part of this
study.
Stage 1 — Examination of Factor Structure
Factor analysis was used to examine whether or not the dimensionality and structure of
each of the selected tests of the WJ III COG and Bateria III C O G are the same. If the structures
are the same in the two languages, this supports the hypothesis that both test batteries are
measuring the same construct, and you can infer that individuals from either group attach the
same meaning to the construct as a whole. Investigating the structure of each of the tests
provides one source of validity evidence, as well as the comparison of test structure between the
two language versions is one of the methods used to assess the comparability of constructs.
Factor analysis is a family of multivariate techniques that (a) examines the underlying
patterns or interrelationships for a large number of variables and (b) determines i f these variables
37

can be condensed into a smaller set of factors (Hair, Anderson, Tatham, & Black, 1998). The
goal of this set of analyses was to identify separate underlying dimensions, known as factors, to
maximize their explanation of the entire variable set and then determine the extent to which each
variable is explained by each factor. Further, a major purpose of factor analysis is, by reducing
the number of variables to a few common factors, the description of behaviour becomes
simplified (Anastasi & Urbina, 1997).
Exploratory Factor Analyses (EFA) is a family of statistical procedures that has been
widely used in studying the structure of assessment measures, including investigating the
structural equivalence of different language versions of assessments (Hair et al., 1998; Traub,
1983; van de Vijver & Leung, 1997). The primary reason for choosing E F A relates to the
overarching research question for this study, "Are the tests from the different language versions
comparable?" Thus, the focus of the factor analysis is not to confirm hypotheses about the
overall test structure within the two batteries, but instead on examining similarities and
differences in the factor structure for the different language versions of each of the specific tests,
as well as how the items relate to the factors. That is, the purpose of the factor analysis is to
determine the number of factors that are represented by the items within a particular test in both
languages. For example, how many factors best represents the items within Concept Formation,
and is the factor structure the same for the two language versions? For this purpose, separate
factor analyses were completed for each language group and the pattern of factor loadings was
compared across groups. Evidence of construct equivalence is demonstrated by similar patterns
of factor loadings across groups. While there exists an extensive body of research on the factor
structure of the WJ III and CHC theory, it can not be assumed that the psychometric properties of
a test are the same in a different language. As such, EFA was deemed the most appropriate
38

method with which to compare the factor structure of the different language versions of the
selected tests.
There are, however, limitations associated with using exploratory factor analysis for
evaluating construct equivalence. Primarily, because the analyses are conducted on each group
separately, evaluating the degree to which there is a similar factor structure is difficult (Sireci,
Bastari, & Allalouf, 1998). However, it is possible to compare factor solutions across the
English- and Spanish-speaking language groups, when the factor solutions produce the same
number of factors. The most common and accepted technique to determine factorial similarly is
to calculate a coefficient of congruence (Harman, 1976) between the loadings of the
corresponding factors for the two groups (Reynolds, Lowe, & Saenz, 1999). The coefficient of
congruence, denoted by ^ > / m ,
where (axjl) is a pattern element for the first sample,y'th variable, /th factor, andp is the number
of variables (Harman, 1976). While no firm rules or significance testing procedures exist,
congruence coefficients range from +1 to -1, with +1 being perfect agreement and -1 being
perfect inverse agreement, and .95 might be interpreted to be very comparable, .90 quite
comparable, and .70 only somewhat comparable (Harman).
p
39

Factor Analysis Models
Two different factor analysis models were used as exploratory approaches to determine
the factor structure of the selected tests in the two different language versions, (a) Full-
Information Item Factor Analysis (FIFA) and (b) Principal Component Analysis (PCA) (as the
method of extraction). The P C A was performed using SPSS (version 10.0) and the FIFA was
conducted using TESTFACT (Wilson, Wood, & Gibbons, 1991). For both factor analyses
methods, missing data were handled by using pairwise case exclusion, which excludes from
analysis cases with missing values for either or both of the pair of variables in computing a
specific statistic. Further, once the number of components was determined (criteria for
determination of factors is presented below) a P R O M A X rotation was performed. P R O M A X is
an oblique rotation that allows the factors to correlate. The advantage of allowing the factors to
correlate is that i f the resulting factors prove to be uncorrelated, the model wil l allow for that and
no error would have be made (Kim & Mueller, 1978).
The reason that two different models were employed in this study relates to the data
characteristics for some of the selected tests. That is, for a number of tests the data are
dichotomous. For dichotomous data, linear factor analysis of Pearson (phi) correlations does not
represent the dimensionality of a set Of items correctly (J.B. Carroll, 1983). One option then, has
been to use tetrachoric correlations instead of the phi correlations, but these coefficients become
unstable as they approach extreme values (as is the case with very easy or difficulty items)
(Muraki & Engelhard, 1985). To overcome this limitation, nonlinear factor analysis models have
been proposed, including FIFA, which is described below.
The FIFA model is based on item response theory, and uses distinct item response
vectors instead of computing correlation coefficients. FIFA is regarded as the most sensitive and
40

informative among various methods of investigating the dimensionality of item sets (Bock,
Gibbons, & Muraki, 1988). FIFA analyses were performed using the computer software
TESTFACT (Wilson et al., 1991). TESTFACT maximizes the likelihood of the item factor
loadings given the observed patterns of correct and incorrect responses. The corresponding
likelihood equations are solved by integrating over the latent distribution of factor scores
assumed for the population of examinees. This estimation is called marginal maximum
likelihood (MML). The implementation of item factor analysis by M M L overcomes problems
with factor analysis of tetrachoric correlation coefficients (i.e., it avoids the problems of
indeterminate tetrachoric coefficients of extremely easy or difficult items) (Bock et al.).
The selection of factor-analytic model then was based on the data characteristics of each
test. That is, for tests that used multilevel scoring, PCA was the model of choice. For tests with
dichotomous data, FIFA was the chosen model. However, for the timed tests, which were scored
dichotomously, the extent of missing data, and the very high proportion of correct responses for
many of the items, became problematic for TESTFACT, and the P C A model was used in order
to make some comparison between the factor structures of the two language versions of these
tests. Given the exploratory nature of this study, and that factor structure comparison was the
focus, and that there would be no claims about how many factors, or what these factors represent
for these tests definitively, relaxing the assumptions about dichotomous data and linear factor
analysis was deemed acceptable.
Determination of Factor Solution
Two criteria were considered initially when determining the number of factors to extract
for each test (for each language version). The first criteria, and most commonly used technique,
is the latent root (also known as eigenvalue) criterion, which uses a cutoff of one to determine
41

the number of factors (Hair et al., 1998). That is, the number of factors is equal to the number of
eigenvalues greater than one. However, this cutoff is most reliable when the number of variables
is between 20 and 50 (Hair et al.), where the number of factors extracted can be too few for the
former, or too many for the latter. The second criteria for determining the number of factors
extracted was the scree test criterion advocated by Cattell (1966). For this criterion, one
examines the graph of eigenvalues for the point at which the eigenvalues begin to level off to
form a straight line with an almost horizontal slope. Based on these two criteria, the number of
factors was determined. If there was a discrepancy in the number of factors to extract, a third
criterion, percentage of variance, was considered. This criterion is typically used to extract
factors of practical significance (Hair et al.). That is, factors that account for only a small portion
of variance (i.e. less than 5%) are not considered to add practical significance to the factor
solution.
For the purposes of this study, factor analyses were completed for each set of items that
comprise a test (i.e., all the items from Spatial Relations will be included in one set of factor
analyses, and all the items from Concept Formation will be included in another set of factor
analyses, and so forth). Further, analyses for each battery (i.e., WJ III C O G and the Bateria III
COG), were completed separately. Once the number of extracted factors was determined, the
similarity of factor solutions as well as factor loadings for the different language tests were
compared for similarity. That is, is the number of factors the same or different? If they are the
same, how comparable are the factor solutions (i.e., congruence coefficient)? The degree to
which the solutions are similar contributes to the determination of the comparability and
equivalence of these test batteries.
42

Stage 2 - Internal Consistency
Another source of information used to determine the comparability of the WJ III COG
and the Bateria III C O G was to examine the internal consistency, or the reliability, with which
each test measures what it is intended to measure. Further, reliability evidence is another source
that contributes to an evaluation of validity. That is, how reliable are the scores for each
measure?
Reliability is an indicator about the reproducibility of test scores; can the same test results
be achieved if the same individual(s) were to take the test again under the same circumstances
(Crocker & Algina, 1986)? Traditionally, reliability coefficients fell into three broad categories:
internal consistency, alternate form and test retest. For many tests, internal consistency
coefficients do not different significantly from alternate-form, and may be preferred to the other
reliability coefficients (AERA et a l , 1999).
For the purposes of this study, it is important to demonstrate the internal consistency, or
repeatability, of each of the translated tests for each of the respective batteries, as well as
compare the measurement accuracy for each of these batteries (and language groups). Are the
purported constructs measured with the same accuracy for each of the language groups? This
provides another piece of evidence about the comparability of the tests of the WJ III COG and
the tests of the Bateria III COG.
An internal consistency coefficient is based on the relationships among scores based on
individual items within a test (AERA et al., 1999). In order to calculate the internal consistency
reliability, the total test must be broken down into two separate scoreable parts. The tests that
were included in the present research study utilized different scoring methods. While some tests
were scored dichotomously, others employed multiple scoring levels. That is, for some items it
43

was possible to achieve a score of 0, 1, 2, 3, or 4 points. As such, when the test is split into two
parts, you may not have tests that appear to be the same length because of the differences in
possible scores. Thus, it is important to make sure that the way in which reliability is calculated
is appropriate given the way with which the test of interest is scored. Decisions about the
appropriate method to calculate reliability are based on the following. When the test parts may
exhibit differences in means and observed score variances, the variances of true scores are
heterogeneous and the parts functional length is equal, they can be represented by the essentially
tau-equivalent model (Quails, 1995). Cronbach alpha is an example of an internal consistency
coefficient that conforms to this model, and can be expressed as:
where, k is the number of items on the test and the items are scored dichotomously, &] is the
variance of item i, ando-^. is the total test variance (Crocker & Algina, 1986). However, when
the test parts have different functional lengths, then a congeneric model should be employed
(Quails, 1995). Differences in functional length between two test parts can arise when different
item types (i.e., multiple choice, essay, short-answer) and different scoring methods (i.e.,
dichotomously or polytomous) are employed in the same test. The appropriate reliability
estimate to use in this situation is Feldt-Raju, which can be expressed by:
a = k-l
F-RpXX'' = (l-Yfyo-2/
44
where, cr* equals the observed part-score variances, k} represents the functional length, and a\
is the total test variance (Quails, 1995).
As outlined above, the appropriate measure of reliability depends on the nature of the
items, and the way with which they are scored. While the item type {constructed response or
multiple-choice) was the same for most of the items included in this study, the scoring schemes
vary for the different tests. The table below presents information about each test, including item
type and scoring scheme. For all tests that contain only dichotomously scored items internal
consistency was calculated using Cronbach alpha, whereas for tests that utilized multiple point
scoring systems internal consistency was calculated using Feldt-Raju.
Results obtained from this stage of analyses, again, contribute to the evidence from which
a decision about the comparability of the two different language versions of test will be made.
45
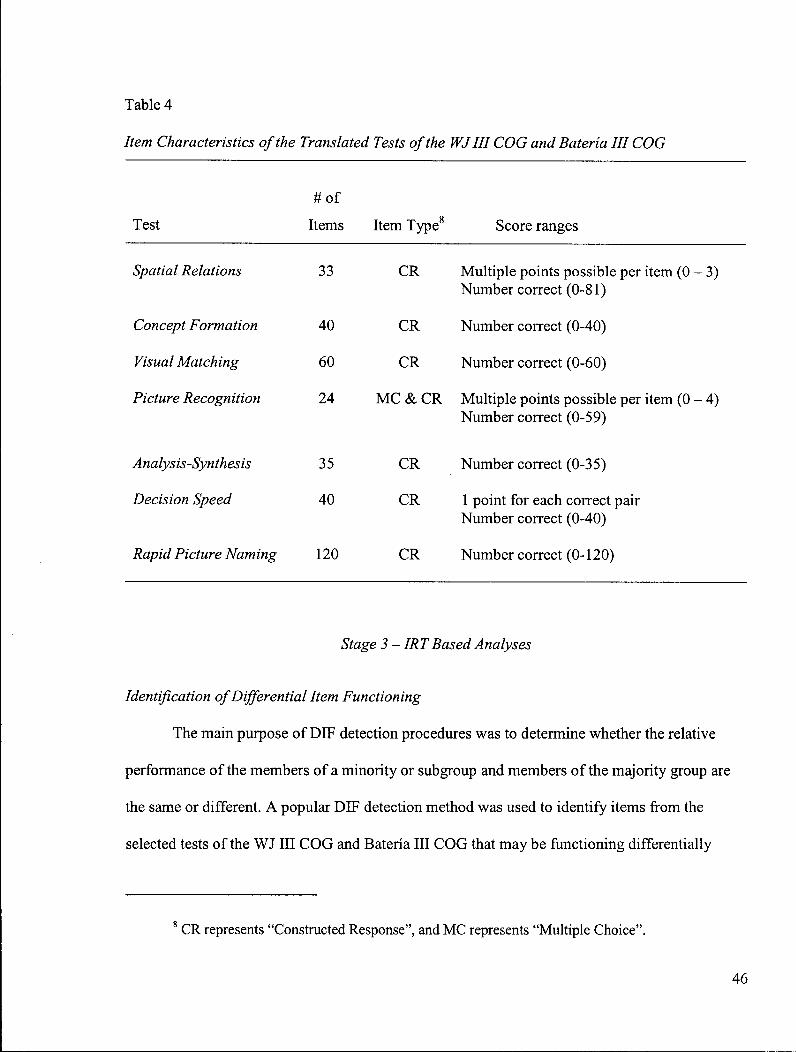
Table 4
Item Characteristics of the Translated Tests of the WJ III COG and Bateria III COG
Test
#of
Items Item Type8 Score ranges
Spatial Relations
Concept Formation
Visual Matching
Picture Recognition
Analysis-Synthesis
Decision Speed
33 CR Multiple points possible per item (0 - 3) Number correct (0-81)
40 CR Number correct (0-40)
60 CR Number correct (0-60)
24 M C & CR Multiple points possible per item (0 - 4) Number correct (0-59)
35 CR Number correct (0-35)
40 CR 1 point for each correct pair Number correct (0-40)
Rapid Picture Naming 120 CR Number correct (0-120)
Stage 3 - IRTBased Analyses
Identification of Differential Item Functioning
The main purpose of DIF detection procedures was to determine whether the relative
performance of the members of a minority or subgroup and members of the majority group are
the same or different. A popular DIF detection method was used to identify items from the
selected tests of the WJ III COG and Bateria III COG that may be functioning differentially
CR represents "Constructed Response", and MC represents "Multiple Choice".
46

between English- and Spanish-speaking examinees. DIF items will be identified using an
application of the Linn-Harnisch method (LH) (1981), which has been established as a useful
approach to identifying item bias due to language and cultural differences and or
flawed/problematic test adaptations (Hambleton & Patsula, 1998; Lee & Lam, 1988). This DEF
detection procedure is capable of detecting uniform, as well as non-uniform DEF, and is
described in greater detail below.
The L H (1981) procedure computes the estimated probability that person j would answer
item / correctly, using:
P..=c.+ ^ y ' l + exp[-1.7a,.(0.-6,.)]'
where a,, 6„ c„ and 0 are all estimates. These estimates, or parameters, are based on the data from
all examinees, and can then be compared to the observed proportion correct for the subgroup, in
this case Spanish speakers. The proportion of examinees in the subgroup (g) expected to answer
the item (i) correctly is:
where ng is the number of persons in the subgroup, and j is a member in the subgroup. Whereas,
the proportion of people in the complete group is:
47

P. = - 5
Then, the observed proportion correct on item z for the subgroup g-, <9,g, is the number of people
in the subgroup who have responded correctly divided by the number of people in the subgroup.
For the complete subgroup it can be calculated from:
• s » . •
g
The difference then, between the observed proportion correct on item i for the complete group
and the subgroup, is an index of the degree to which members of the subgroup perform better or
worse that the complete group. This, overall difference, can be calculated by:
This can be further extended to calculate differences for the subgroups at different ranges of the
ability scale (i.e., at the low or high end of the ability scale, as well as any other range). This
allows one to examine whether or not there are differences between the subgroup and complete
group at different points on the ability scale. For example, i f there is DIF, is it (a) uniform, and
that one group is favored over the other at all points of the ability scale, or (b) non-uniform, and
the degree to which one group is favored over the other is different at various points of the ability
48

scale. The effects of language on performance is expected to vary for different ability levels of
students and as such, it is important that the DIF detection procedure used with translations can
detect non-uniform, as well as uniform DIF. In addition, the L H procedure can be combined with
ERT based analyses to examine psychometric differences of items identified as displaying DIF.
The L H procedure was performed using the computer software program P A R D U X ,
written by George Burket (1998), which applies the procedure developed by Linn and Hamisch
(1981) to item-response theory based item characteristic comparisons. This program computes
for each item the observed and expected mean response and the difference ipdiff) between them
(observed minus predicted) by deciles of the specified subgroup, and for the subgroup as a
whole. The expected values are computed using the parameter estimates obtained from the entire
sample, and the theta estimates (ability estimates) for the members of the specified subgroup.
Based on the difference between expected and observed p-values, a Z-statistic is calculated for
each decile and an average Z-statistic for the item is computed for identifying degree of DIF. The
level of DIP is determined by the set of rules (Ercikan, 2002) presented in Table 5. A negative
difference implies bias against the subgroup, whereas a positive difference implies bias in favour
of the subgroup. Items that display Level 2 or Level 3 DIF are considered then to indicate that
the parameters for those items are not invariant across the two groups (English- and Spanish-
speakers).
49

Table 5
Statistical Rules for Identify Three Levels of DIF
DEF Level Rule Implications
Level 1 |Z| < 2.58 No DEF
Level 2 |Z| > 2.58 and \pdifJ\ < 0.10 DIF
Level 3 |Z| > 2.58 and\pdiff\ > 0.10 Serious DIF
/few Response Theory Models
When performing any statistical procedure it is important that it has been completed and
used in an appropriate fashion. Given there a number of ERT models available, there is a choice
and flexibility afforded the user. Using the appropriate ERT model to represent items is critical,
in that using an inappropriate model can cause inaccurate estimates of item parameters and
decrease the utility of ERT techniques (Reynolds et a l , 1999). For example, i f inaccurate
parameters are used in further analyses, for example Differential Item Functioning (DEF) or
equating, the degree to which the parameters fail to characterize an item will be introduced as
error. Further, accurate parameter estimates are necessary to ensure accurate ability estimates for
each examinee (Weitzman, 1996). The implications of inaccurate item parameters include
inaccurate ability estimates, which in turn could impact inferences made about an individual's
performance or ability level, and quite possibly programming and placement decisions.
The WJ III COG and Bateria III COG are based on the Rasch measurement model. Rasch
(1960) developed the one parameter logistic model, or Rasch model, to scale dichotomously
scored items. As the name suggests, this ERT model utilizes only one parameter, b, item
difficulty. This model assumes that item difficulty is the only item characteristic that influences
50
an examinee's performance (Hambleton, Swaminathan, & Rogers, 1991). That is, ability levels
can be accurately estimated with a measure of item difficulty (i.e., b). Further, this model
assumes that all items are equally discriminating, and that examinees wil l not be able to correctly
answer easy items by guessing. Aspects of this model that appeal to users include: it is easier to
work with because the model involves fewer parameters than other models (i.e., the Rasch model
makes equating easy (Weitzman, 1996); it can be reasonably robust when there are moderate
violations of model assumptions; and there are fewer parameter estimation problems than with
more general models (Hambleton, 1989). Further, the Rasch model obtains the property of
specific objectivity, which means that it can directly compare the difficulty of two items, or the
abilities of two persons directly without having to estimate any other parameters or abilities
(Divgi, 1986). However, the Rasch model is not without limitations. It can be harder to find
items that fit the 1PL model than more general models, and the assumptions of equal item
discrimination and no correct guessing among low ability examinees may not be met by multiple
choice tests (Divgi; Traub, 1983). Interestingly, proponents of the Rasch model would sooner
discard items that do not fit the model, then to investigate using another model to characterize
these items (Hambleton).
The L H procedure wil l be implemented using the three-parameter logistic model (3PL)
(Lord, 1980) for the multiple-choice items and the two-parameter partial credit (2PPC) model
(Yen, 1993) for the remainder of items, which are open-ended in format (constructed response),
to obtain item parameters. A simultaneous calibration of multiple-choice and open-ended items
and identification of DIF will be conducted using P A R D U X (Burket, 1998).
51

Three-parameter logistic model.
The item parameters for the multiple-choice items wil l be obtained using the three-
parameter logistic (3PL) (Lord, 1980). In this model, the probability that a person with a score of
9responds correctly to item i is:
where af is the item discrimination, hi is the item difficulty, and C( is the probability of a correct
response by a very low-scoring student.
Two-parameter partial credit model.
The item parameters for the constructed response items will be obtained using the two-
parameter partial credit model (2PPC) (Yen, 1993). The 2PPC model is a special case of Bock's
(1972) nominal model and is equivalent to Muraki's (1992) generalized partial credit model.
Similar to the generalized partial credit model, in 2PPC, items can vary in their discriminations
and each item has location parameters, one less than the number of score levels. The nominal
model states that the probability of an examinee with ability Shaving a score at the &-th level of
they'-th item is:
l - c , .
1 +exp [-1.7a,(0-&,•)]
Pjk{p) = p{Xj = k-\\e) exp Zjk
, k=l. . .m. mj
l J '
1=1
where,
52

Zjk = AjkO + Cjk .
For the special case of the 2PPC model used here, the following constraints were used:
Ajk=aj(k-\),
and
i = 0
where yj0 = 0, and ccj and are the free parameters to be estimated from the data. The first
constraint implies that items can vary in their discriminations and that higher item scores reflect
higher ability levels. In the 2PPC model, for each item there are ntj -1 independent yp difficulty
parameters and one CCJ discrimination parameter; a total of nij independent item parameters are
estimated.
Evaluation of the IRT Model Assumptions
IRT models, as with most statistical models, include a set of assumptions about the data
to which the model is applied: (a) the ability being measured is unidimensional; (b) that an
examinee's responses to the items in a test are statistically independent; and (c) that item
responses fit the ERT model (Hambleton et al., 1991). How these assumptions were evaluated in
this study is presented below.
53

Unidimensionality.
The assumption of unidimensionality can be satisfied i f the test data can be represented
by a "dominant component or factor" (Hambleton, 1989, p. 150). Thus, the results from the EFA
were used to evaluate whether this assumption was met for each test.
Item fit.
The Qi chi-square statistic developed by Yen (1981) allows one to assess item fit. That is,
Qi is used to test the null hypothesis that there is no statistical difference between the model in
question and the observed responses. The Qj statistic sums over all the standardized residuals for
all the different ability groups, and is distributed as with (number of ability groups - number
of parameters in the model) degrees of freedom. The Qi statistic can then be standardized in the
form of a Z-score (Fitzpatrick et al., 1996). Based on extensive evaluations of fit statistics, to
indicate practical significance, Z-values greater than 4.6 should be flagged as having poor fit
(Ercikan et al., 1998). The computer program P A R D U X (Burket, 1998) was used to estimate
item parameters and calculate the Qi statistic for each of the tests.
Local item dependence (LID).
The Qi statistic developed by Yen (1984) was used to evaluate LID. The Q3 is the
correlation between the performance on two items after taking into account overall test
performance. As a correlation, the interpretation is easy. For locally independent item pairs the
Qi statistic is expected to be O. An item pair is flagged as locally dependent when \Qi\> .20
(Ercikan et al., 1998). The computer program P A R D U X (Burket, 1998) was used to estimate
item parameters and calculate the Qi statistic for each of the tests.
54

Investigation of Item and Test Characteristics
At the most basic level, IRT was designed to describe the relationship between how an
examinee performs on an item and their ability that underlies the performance of the item. This
relationship is expressed in mathematical terms by a monotonically increasing function that can
be used to describe and predict the performance of an examinee on a test item based on the
examinee's ability, or vise versa. This relationship can be represented by an item characteristic
curve (ICC). The ICC depicts visually how an item is functioning for respondents, illustrating
what the associated probability of answering an item correctly is with various levels of ability
Further, IRT models provide a powerful method of describing items and tests through the
use of item-information functions and test-information functions. Item-information functions
display the contribution items make to the ability estimation at any point along the ability scale
(Hambleton, 1989). The sum of these item-information functions at a particular ability level (fT)
represents the amount of information the test provides at that ability level. The contributions
items make to the test largely depend on the discriminating power of the item and the difficulty
of an item. These functions expressed mathematically are:
(6).
, 0=1,2, ,n).
I,{Q) represents the information provided by item i at 6, P, '(d) is the first derivative of
Pi(6) with respect to 6, and Pj(8) is the item response function, and Qi(6)=\-Pi(6) (Hambleton et
al., 1991). Summing the item-information functions at an ability level (fT) indicates the
information that a test provides at an ability level (6). Further, the precision that ability is
estimated at an ability level (6) is inversely related to the amount of information provided by a
test at that ability level. This is called the standard error of measurement (SEM) and is expressed
by:
SE{9) = -jL=.
For this study, item-information functions, standard error of measurement, as well as
correlations between item parameters based on the two separate groups, English- and Spanish-
speakers, will be computed and compared for each test. Information functions can be useful to
examine parallel tests; tests are said to be parallel when the information functions are equal and
they measure the same ability (Samejima, 1977). The results from the investigation of item
characteristics will be used as another piece of evidence in the determination of the degree to
which the WJ III COG and the Bateria III COG are comparable, and parallel.
Stage 4 - Judgmental Review
The DIF procedure is a statistical method used to identify whether or not items are biased
against a subgroup population. While it can address " i f there is bias, it cannot answer "why." In
order to answer the "why" question, a qualitative examination of the items, and their
characteristics, is required (i.e., Allalouf et al., 1999; Ercikan, 1998; Gierl, Rogers, & Klinger,
1999). In previous research related to examining sources of DIP this process is called a
Judgmental Review. The judgmental review process used in this study combines typical aspects
56
of this type of approach that have been used in previous research (e.g., Allalouf et al., 1999;
Ercikan et al., in press; Gierl & Khaliq, 2001).
Selection and Training of Judgmental Reviewers
Research that examines issues related to translating or adapting tests into other languages
offer guidelines about important translator characteristics necessary when using them to translate
or adapt tests into other languages. That is, translators need to be: (a) familiar and competent
with both the source and target languages and cultures involved (Geisinger, 1994; Hambleton,
2002, in press; Hambleton & Patsula, 1998); (b) generally familiar with the construct being
assessed (Geisinger; Hambleton, 2002, in press; Hambleton & Patsula; and (c) familiar with the
principles of good test development practices (Hambleton, 2002, in press; Hambleton & Patsula).
Further, it is also suggested that the use of more than one translator, to allow for interactions to
resolve different points that arise while preparing a test translation or adaptation (Hambleton &
Patsula).
Incorporating the guidelines and suggestions presented above, the Judgmental Review for
this study used two judgmental reviewers, fluent in English and Spanish (but dominant in
Spanish) to examine the equivalence of the English and Spanish test versions. Use of more than
one bilingual reviewer also contributed to the reliability of the reviews. The reviewers were
graduate students in the Educational and Counselling Psychology, and Special Education
department at the University of British Columbia. Both reviewers were native speakers of
Spanish, although their country of origin was different (Columbia and Chile), thereby
representing two different Spanish-speaking regions. Each reviewer had an educational
background that made them generally familiar with the construct being assessed by the WJ III
COG and Bateria III COG, as well as measurement and research methods.
57

Training Session
A training session was conducted to explain to the reviewers the process of the
judgmental review, and provide examples of translation and adaptation errors identified in
previous research. First, the reviewers were briefed about the purpose of the study (examining
the comparability of English and Spanish versions of a cognitive battery), including the role of a
judgmental review in this study (to examine the items and instructions in each language to detect
whether there are differences that may lead to performance differences for the two language
groups). Reviewers were informed that the materials they would be reviewing were measures of
cognitive ability, and as such, confidentiality about the tests was to be maintained. Reviewers
were provided information about the types and examples of translation errors that have been
previously documented (See Appendix A). Each reviewer examined these types and examples of
sources of translation errors, and were encouraged to ask questions for clarification. This list of
sources and examples of translation differences then served as a resource guide for the reviewers
when reviewing the materials. Next, the reviewers were introduced to the rating system to be
used when evaluating the equivalence of the English and Spanish versions, presented in Table 6.
Reviewers were instructed to examine and compare all items and instructions for each language
versions simultaneously and identify when there were differences between the two. When a
difference was identified, reviewers were instructed to rate this difference, according to the
criteria listed in Table 6, paying particular attention to whether the differences would lead to
performance differences between the two language groups. Reviewers were told to record their
ratings and comments on the provided worksheets (See Appendix B). Lastly, the instructions to
reviewers summarized that differences could be related to the translation of instructions (e.g.,
appropriate word use, similarity of meaning, comparable word frequency, etc.), presentation
58

format or graphic quality of items, or differences with the familiarity of task or graphics used in
the tests.
Table 6
Judgmental Review Rating Scale »
Rating Meaning associated with rating
' 0 No difference between the two versions
1 Minimal differences between the two versions
2 Clear differences between the two versions, but differences may not necessarily lead to differences in performance between two groups
3 Clear differences between the two versions that are expected to lead to differences in performance between two groups
Review Session of Test Instructions and Items
At this stage, there was a comprehensive review by the two reviewers of the instructions
and items associated with each test and language version. Reviewers were presented with copies
of the English and Spanish versions of instructions and items for each test. This material
included the directions to examiners, instructions that examiners orally presented to examinees,
as well as the items as they are presented to examinees. Typically, the results of the judgmental
review ratings are reported to identify potential reasons for the statistical identification of DIF
items. As such, reviewers examine DIP items, as well as some non-DIF items; blind to the status
, of the items (DEF or non-DIF). For this study, reviewers completed a comprehensive review of
all items and instructions for each test. While not typical, or an economical way to examine
59

potential reasons for DIF, the scope of review was broadened to all items so that every aspect of
the different language versions of tests was reviewed for possible differences that may impact the
performance differentially for one of the language groups.
The reviewers were responsible to review and identify instructions and items considered
to be different between the two language versions, as well as determine whether the differences
were expected to lead to performance differences for the two language groups. For example, i f a
difference was found between the task or test instructions from one language to another, the
reviewers were asked to judge whether this difference would provide one group an advantage by
positively impacting their performance, or conversely, putting one group at a disadvantage by
negatively impacting their performance. Each reviewer had their own set of materials, but
worked collaboratively when they encountered instances that might be considered different,
which is a typical and advocated approach (Gierl & Khaliq, 2001; e.g., Hambleton & Patsula,
1998). Typically a discussion ensued in Spanish, about the issue at hand, until a consensus about
the nature of the difference, rating of the difference, and whether the difference would impact the
performance of one group or the other was reached. These differences were then recorded on the
worksheet provided. The outcome from this review session was one set of judgmental review
ratings that reflects a thorough and thoughtful deliberation of the qualitative equivalence of the
English and Spanish versions of the instructions and items with which to compare to the
statistical equivalence procedure outcomes.
60
CHAPTER TV: RESULTS
This chapter provides a detailed description of the results of the present study. It is
organized in such a way as to present descriptive statistics related to the tests of cognitive ability
that are the focus of this study, followed by results related to each of the four statistical
procedure stages outlined in the method section. That is, results related to analyses that examine
scale level data (i.e., factor analyses, and internal consistency) will be presented first, followed
by Item Response Theory (IRT) results (i.e., DIF, item information, parameter correlations), with
the qualitative analyses in the form of a judgmental review being presented last. Further, the
presentation of results maps on the purpose of this study in the following manner: (a) the factor
analyses results will determine whether the dimensionality and structure of each of the selected
tests of the WJ III C O G and Bateria III COG are the same; (b) IRT based analyses examines
whether there are specific items from the selected tests of the WJ III C O G and Bateria III COG
that function differentially between English- and Spanish-speaking examinees; and lastly (c) the
results from the judgmental review provide information about what the sources of differences in
constructs being assessed for the two language groups are, should there be any.
The reader is informed that there are instances when the data characteristics for some test
items limited the feasibility of including them in particular analyses, and as a result, the number
of items for some tests may differ across different sets of analyses. These instances are described
in more detail within the pertinent sections.
Data
Data from the norming and calibration samples of the WJ III C O G and the Bateria III
COG, respectively, were used to evaluate the comparability of these two assessment measures.
61
Group Characteristics
While the previous sections describe the norming and calibration samples, of the WJ III
and the Bateria III, respectively, this section describes the two groups that are the crux of this
study. What follows is a description of general group characteristics for each of the WJ III COG
and the Bateria III COG, as well as descriptive statistics for both groups for each of the tests
examined.
The WJ III sample used in this study consisted of 1,290 participants randomly selected
from the norming sample, which represents the data that were released by the publisher. The
Bateria III sample consisted of 1,413, which represents the calibration sample.
The range of ages included in this study is 9 to 29 years of age. This range was chosen for
several reasons. First, for some tests (i.e., Visual Matching and Concept Formation) there are
two sets of stimuli or starting points with accompanying instructions that are contingent on the
age of examinee. For Visual Matching, the Visual Matching 2 stimulus was administered to
examinees aged 5 and above. For Concept Formation, Introduction 2 is the set of instructions
that were administered to examinees that were in Grade 2 and above. Age range was then limited
to include only those examinees that could have been exposed to the same set of testing
materials. Secondly, sample sizes for the tests for each of the batteries decrease substantially
after the age of 29. As a result, the range of age included in this study is 9 to 29 years of age.
The focus of this study was on the comparability of inferences based on scores from tests
administered in two languages. The central issue was around the language of administration -
English or Spanish. A l l the tests and items were the same except for the language spoken by the
administrator and examinee. Therefore the group membership of any person who was
62
administered the WJ III COG was English-speaking. Similarly, the group membership of any
person who was administered the Bateria III COG was Spanish-speaking.
In terms of the number of items included within each test, only the items that were
administered to both language groups (i.e. those administered the WJ III COG, and those
administered the Bateria III COG) were included in the series of analyses in this study. For
Spatial Relations and Picture Recognition the number of "common" items for the WJ III COG
and Bateria III COG are fewer than either published test. The published version of the WJ III
COG was constructed using a "norming scale" (a scale containing only limited items used when
collecting normative data), and then additional items from an item pool were linked/equated
using Item Response Theory (K.S. McGrew, personal communication, February 3, 2004). As a
result, for these selected tests analyses focused on the data for the "common" items.
Descriptive Statistics on the Tests of Cognitive Ability
The sample sizes (see Table 7) and descriptive statistics (see Table 8) for English- and
Spanish-speaking students on each of the tests of cognitive ability are presented below. These
tables provide information about each sample of subjects for the two test batteries, the WJ III
COG and the Bateria III COG, which corresponds to the language of administration, English or
Spanish, respectively. The WJ III COG sample consisted of 1,290 participants randomly selected
from the norming sample and the Bateria III COG sample consisted of 1,413, which represents
the calibration sample. The age range for both samples included in this study is 9 to 29 years of
age.
Overall (across tests), the WJ III COG sample contains slightly more females than males
(n=693 and n=646, respectively), with an average age of 16.0 years (SD=5.1). Whereas, for the
63
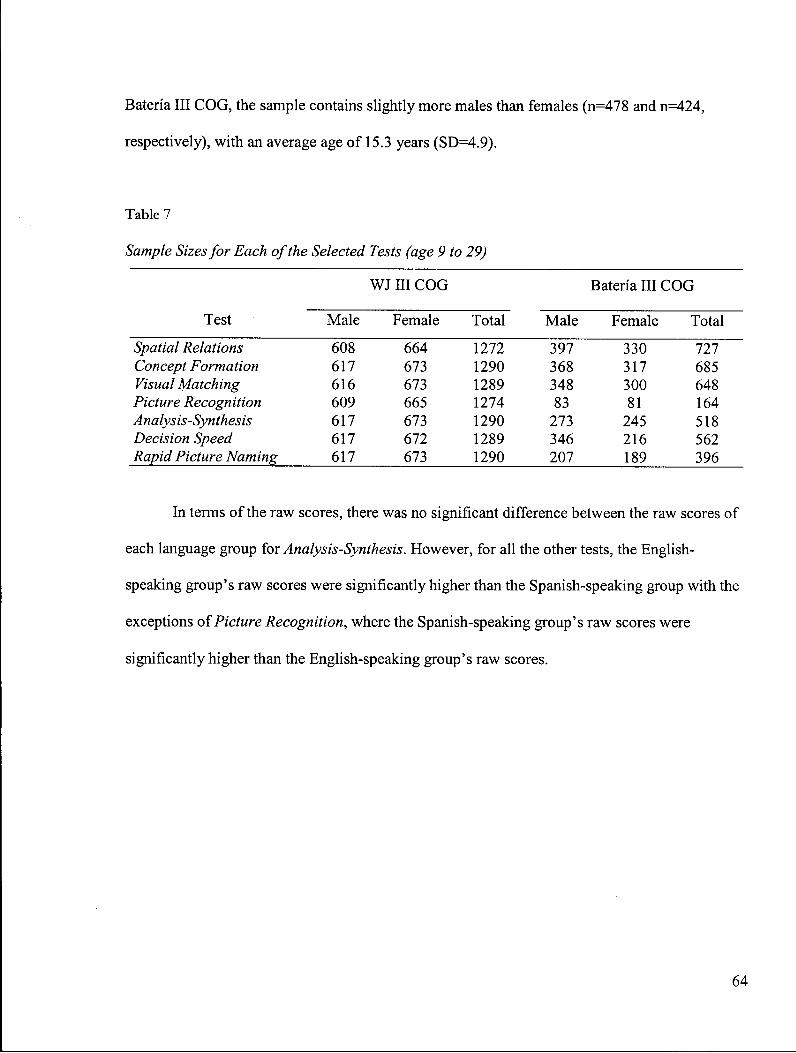
Bateria III COG, the sample contains slightly more males than females (n=478 and n=424,
respectively), with an average age of 15.3 years (SD=4.9).
Table 7
Sample Sizes for Each of the Selected Tests (age 9 to 29)
Test
WJ III COG Bateria III COG
Test Male Female Total Male Female Total
Spatial Relations 608 664 1272 397 330 727 Concept Formation 617 673 1290 368 317 685 Visual Matching 616 673 1289 348 300 648 Picture Recognition 609 665 1274 83 81 164 Analysis-Synthesis 617 673 1290 273 245 518 Decision Speed 617 672 1289 346 216 562 Rapid Picture Naming 617 673 1290 207 189 396
In terms of the raw scores, there was no significant difference between the raw scores of
each language group for Analysis-Synthesis. However, for all the other tests, the English-
speaking group's raw scores were significantly higher than the Spanish-speaking group with the
exceptions of Picture Recognition, where the Spanish-speaking group's raw scores were
significantly higher than the English-speaking group's raw scores.
64

Table 8
Descriptive Statistics for Each of the Selected Tests (age 9 to 29)
WJ III COG Bateria III COG
Test
#of
common items n
Mean
(SD) n
Mean
(SD) Difference
Spatial Relations 12 1272 24.20 (3.35)
727 21.98 (6.53)
2.22*
Concept Formation 35 1290 25.12 (8.04)
685 21.13 (10.06)
3.99*
Visual Matching 60 1289 47.79 (8.24)
648 40.35 (10.54)
7.44*
Picture Recognition 10 1274 17.01 (4.85)
164 18.89 (3.80)
-1.88*
Analysis-Synthesis 35 1290 25.41 (4.79)
518 25.36 (5.60)
0.05
Decision Speed 40 1289 33.39 (5.70)
562 30.13 (5.05)
3.26*
Rapid Picture Naming 120 1290 111.48 (12.97)
396 93.50 (17.85)
17.98*
t Indicates significant differences at/?<0.05. * Indicates significant differences at /K0.01.
Stage 1 - Examination of Factor Structures
To examine the factor structure similarity between the tests administered in English and
Spanish, exploratory factor analysis (EFA), using Principal Component Analysis (PCA) as the
method of extraction with an oblique rotation (PROMAX), and adaptive full-information item
factor analysis (FIFA) for selected tests of the cognitive batteries were conducted. The PCA was
performed using SPSS (version 10.0) and the FIFA were conducted using TESTFACT (Wilson
65

et al., 1991). The extraction and rotation of factors were used to identify the factor structures of
the scores for each language of administration, for each test.
Factor analyses results are presented for each of the selected tests of cognitive ability
separately, and in some cases are grouped according to similarities (i.e., type of FA, or timed
tests).
Spatial Relations
For Spatial Relations, there were 12 common items for the WJ III COG and Bateria III
COG, which represents approximately a third of the total number of items published for both
language versions of this test (33 items). Of these 12 common items there was very little to no
variance in scores for the first 5 items. These five items are targeted to assess early cognitive
development and are very easy items, and as a result very few people responded incorrectly to
them. This limited amount of variance can be problematic when completing factor analyses, and
as such these items were excluded from this set of analyses.
The factor analyses results related to Spatial Relations are given in Tables 9 to 11. Table
9 shows the details related to the eigenvalues and the amount of variance accounted for by an
unrotated factor solution, as well as the cumulative percent of variance accounted for by each
successive factor for each language version of this test. For example, the primary factor for
Spatial Relations has an eigenvalue of 1.92, which accounts for 27.45% of the variance for the
WJ III COG, or English version of the test. The primary factor for the Spanish version of this test
has an eigenvalue of 2.05, which accounts for 29.25% of the variance for the Bateria III COG.
Table 10 summarizes the rotated factor loading values for each factor for each language versions
of the test. For example, Item 6 has a factor loading of .53 and .71 for the WJ III COG and
Bateria III COG, respectively. Lastly, Table 11 contains the inter-factor correlations for each of
66
the language versions of the Spatial Relations test. For example, the correlation between the first
and second factor of the WJ III COG and Bateria III COG is .23 and .19, respectively. Each
subsequent factor analyses results are presented in a similar fashion.
The results of the P C A indicated the data are represented by two factors for both
language versions of the test. A 2-factor solution was indicated by both the eigenvalue criterion
as well as the scree test criterion (see Figure 1), for both language versions. For the English test
version, the first factor accounted for approximately 27% of the variance in the item data, and the
second factor accounted for an additional 16% of the variance. For the Spanish data, the first two
factors accounted for about 29% and 19% of the variance, respectively. The cumulative variance
accounted for by the two factors was 43% and 48% for the English and Spanish data,
respectively.
Table 9
PCA Eigenvalues and Variance Explained for Each Factor for Spatial Relations
WJ III COG Bateria III COG
Factors Eigenvalue % of Variance
accounted for
Cumulative % Eigenvalue % of Variance Cumulative %
accounted for
1 1.92 27.45 27.45 2.05 29.25 29.25
2 1.09 15.54 42.90 1.31 18.75 48.00
67

WJ III COG Data
Component Number
Bateria III COG Data
1 2 3 4 5 6 7
Component Number
Figure 1. Scree Plots for Spatial Relations.
68

In terms of the factor loadings, summarized in Table 10, for both the English and Spanish
data, separate factors corresponded to items that are presented earlier to examinees and items
presented later to examinees. For example the first four items are loading on the first factor,
while the last 3 items are loading on the second factor. The only difference in the pattern of
factor loadings is that while Item 20 loads primarily on the first factor, for the English data, it
loads significantly on the second factor as well.
Table 10
PROMAX Rotated Factor Loadings for Spatial Relations
WJ III COG Bateria III COG
Item# 1 2 1 2
12 .53 .71 15 .70 .70 17 .66 .70 20 .54 .36 .60 26 .66 .73 32 .65 .63 33 .68 .75
Notes. Factor loadings less than .30 are omitted.
The inter-factor correlation matrix (Table 11) shows a similar pattern of correlations
between the two factors for both language versions of the Spatial Relations test, with correlations
of .23 and .19 for the English and Spanish versions, respectively.
69
Table 11
Inter-factor Correlation Matrix for Spatial Relations
WJ III COG Bateria III COG
Factor 1 2 1
1.00 .23 1.00 .19
.23 1.00 .19 1.00
Because the factor solutions for both language versions contain the same number of
factors, it is possible to calculate congruence coefficients for each factor, which provides an
indicator of how comparable the factor solutions are. The resulting congruence coefficients were,
.98 for the first factor, and .92 for the second factor. Using Harman's (1976) criteria9, this means
that the first factors of the English and Spanish test versions are very comparable, and the second
factors are quite comparable.
The results of the factor-analytic procedures for Visual Matching, Decision Speed and
Rapid Picture Naming are presented in succession below. Each of these tests are timed and
presented unique challenges for this set of analyses. First of all, there was very little to no
variance in scores for a number of items, particularly the first set of items. Further, because these
were timed tests, there are a number of items at the end of the test that very few people respond
to; they run out of time first. As such, there is a lot of missing data for later items, which results
in empty cells in the correlation matrix, and completing the factor analyses is not possible. So
then, to evaluate the structure similarity, or dissimilarity, items were included in the factor
9.95 very comparable, .90 quite comparable, and .70 only somewhat comparable
70

analyses for this set of tests if: (a) there was some variance in responses, for both the English and
Spanish test versions, and, (b) i f the set of items did not generate empty cells in the correlation
matrix. As a result, the items at the beginning and very end of these tests were excluded.
Therefore, the results reflect data structure based on items that met these criteria.
Visual Matching
For Visual Matching, there were 60 common items for the WJ III COG and Bateria III
COG, which represents all the items associated with the Visual Matching 2 stimulus, which is
administered to examinees aged 5 and above. Of these 60 common items, a factor analysis was
completed with 13 items, Items 40 through 53, for the reasons mentioned above.
The factor analyses results related to Visual Matching are given in Tables 12 to 14, with
the first table presenting eigenvalues and the variance accounted for by an unrotated factor
solution, the second table summarizing the rotated factor loading values, and the last table
presenting the inter-factor correlations.
The results of the P C A indicated that the different language versions are represented by a
different number of factors. For the English test version, the eigenvalue criterion and scree test
criterion (see Figure 2) differed in the number of factors that represents the data, with the former
suggesting five factors, and the latter suggesting two factors. After examining the percent of
variance accounted for each of the proposed factors, a 5-factor solution was settled on, each of
the five factors accounted for more than 5% of the variance. For the Spanish test version, there
was also a difference between the eigenvalue criteria (six factors) and scree test criteria (three
factors) in terms of the number of factors for the solution. Again, by examining the percent of
variance accounted for each of the proposed factors, a 6-factor solution was settled on, with these
six factors accounting for more than 5% of the variance. For both the English and Spanish data,
71

the first factor accounted for about 17% to 18% of the variance with each of the remaining
factors accounting for between 8% to 12% of the variance. The cumulative variance accounted
for by all of the factors (67%) was considerably more for the 6-factor solution for the Spanish
data, than the cumulative variance accounted for (51%) by five factors for the English data.
Table 12
PCA Eigenvalues and Variance Explained for Each Factor for Visual Matching
WJ III COG Bateria III COG
Factors Eigenvalue % of Variance Cumulative % Eigenvalue % of Variance Cumulative %
accounted for accounted for
1 2.20 16.89 16.89 2.34 18.00 18.00 2 1.26 9.73 26.62 1.61 12.35 30.35 3 1.13 8.68 35.29 1.36 10.47 40.81 4 1.07 8.20 43.49 1.20 9.25 50.06 5 1.02 7.85 51.35 1.12 8.62 58.68 6 1.03 7.94 66.62
72

WJ III COG Data
Component Number
Figure 2. Scree Plots for Visual Matching.
73

In terms of the factor loadings, summarized in Table 13, Factor 4 for the English data and
Factor 2 for the Spanish data have 3 items that overlap (Item numbers 41, 50, and 52). Factor 1
of the English data and Factor 5 of the Spanish data have 2 items in common (Items 43 and 45).
Otherwise the pattern of loadings is not similar for the two language versions of the test.
Table 13
PROMAX Rotated Factor Loadings for Visual Matching
WJ III COG Bateria III COG
Item# 1 2 3 4 5 1 2 3 4 5 6
40 .73 .66
41 .46 .56 .77
42 .72
43 .64 .37 .74
44 .39 .53 .37 .30 .67
45 .56 .48 -.41 .58
46 .73 .63
47 .83 .32 .53 .35 -.42
48 .63 .35 .65 .61
49 .34 .55 .56 .82
50 .56 .73
52 .68 .75 .40 -.39
53 .83 .81 Notes. Factor loadings less than .30 are omitted.
The inter-factor correlation matrix (Table 14) shows that for the WJ III COG Factor 1
correlates with the other factors somewhat, but that the correlations amongst the rest of the
factors are very low, whereas for the Bateria III COG Factor 1 correlates somewhat with Factors
2 and 3 positively, and 5 negatively. Most notable is that for the Bateria III COG there are
74

negative correlations amongst factors, whereas all the correlations for the WJ III COG factors are
positive.
Table 14
Inter-factor Correlation Matrix for Visual Matching
WJ III COG Bateria III COG
Factor 1 2 3 4 5 1 2 3 4 5 6
1 1.00 1.00
2 .22 1.00 .20 1.00
3 .26 .15 1.00 .17 .11 1.00
4 .12 .01 .01 1.00 .01 -.23 -.04 1.00
5 .15 .05 .08 .06 1.00 -.12 .19 -.06 -.26 1.00
6 .03 -.02 .12 -.02 .13 1.00
Decision Speed
For Decision Speed, there were 40 common items for the WJ III COG and Bateria III
COG. Similar to Visual Matching, this is a timed test, and the same problems that occurred with
Visual Matching, were also present with the test. As such, items were eliminated, and a factor
analysis was completed with 23 items (Items 17 through 39).
As with the previous sets of analyses, the three tables (Tables 15-17) that relate to
eigenvalues and variance accounted for, rotated factor loading values, and the inter-factor
correlations for each of the language versions of the Decision Speed test are presented below.
The results of the P C A indicated that the different language versions are represented by a
different number of factors. For the English test version, the eigenvalue criterion and scree test
criterion (see Figure 3) differed in the number of factors that represents the data, with the former
suggesting 10 factors, and the latter 5. After examining the percent of variance accounted for
75

each of the proposed factors, a 5-factor solution was settled on (each of the 5 factors accounts for
more than 5% of the variance). For the Spanish test version there was also a difference between
the eigenvalue criteria (9 factors) and scree test criteria (5 factors) in terms of number of factors
for the solution. After examination of the percent of variance accounted for each of the proposed
factors, a 6-factor solution was settled on (each of the 6 factors accounts for more than 5% of the
variance). For the English test version, the first of five factors accounted for only 10% of the
variance in the item data, and each of the rest of the factors accounted for 5% to 6 % of the
variance. For the Spanish data, the first of six factor accounted for about 15%, and each of the
remaining factors accounted for between 5% and 9% of the variance. The cumulative variance
accounted for by the all of the factors was considerably more for the 6-factor solution for the
Spanish data, with 49% of the variance accounted for by the six factors, while the 5-factor
solution for the English data only accounted for 32% of the cumulative variance.
Table 15
PCA Eigenvalues and Variance Explained for Each Factor for Decision Speed
WJ III COG Bateria III COG
Factors Eigenvalue % of Variance Cumulative % Eigenvalue % of Variance Cumulative %
accounted for accounted for
1 2.20 9.57 9.57 3.44 14.95 14.95 2 1.46 6.34 15.91 1.97 8.55 23.50 3 1.36 5.90 21.80 1.66 7.22 30.72 4 1.23 5.36 27.16 1.49 6.49 37.21 5 1.22 5.30 32.46 1.47 6.39 43.60 6 1.15 5.01 37.48 1.21 5.28 48.88 7 1.15 4.99 42.47 1.10 4.80 53.68 8 1.12 4.88 47.35 1.04 4.53 58.21 9 1.07 4.66 52.01 1.01 4.41 62.62 10 1.02 4.44 56.45
76
WJ III COG Data
2.5 i
2.0
3
> e
1.5
W l.o
Component Number
Figure 3. Scree Plots for Decision Speed.

In terms of the factor loadings, summarized in Table 16, Factor 1 for the Spanish data
seems to have the last items load on it, it appears that these last items are represented by two
factors (Factors 1 and 3) for the English data.
Table 16
PROMAX Rotated Factor Loadings for Decision Speed
WJ III COG Bateria III C O G
Item# 1 2 3 4 5 1 2 3 4 5 6
17 .50 .67
18 .39 .32 .59
19 .51 .61
20 .52 .70
21 .31 .30 .63 .36
22 .44 .68
23 .54 .53
24 .56 .37 .71
25 .56 .32 .33 .49
26 .63 .30 -.43
27 -.39 .35 .31 .44
28 .30 .46 .55
29 .52 .71
30 .42 .37 -.35
31 .51 .42
32 .37 .45
33 .59 .65
34 .39 .32 .60 .33 -.36
35 .49 .64
36 .50 .61 .30
37 .58 .56 -.36 .46 .46
38 .61 .48 .33
39 .41 .77
Notes. Factor loadings less than .30 are omitted.
78

The inter-factor correlation matrix (Table 17) shows that for both the WJ III COG and
Bateria III COG factors are minimally to only somewhat correlated with one another.
Table 17
Inter-factor Correlation Matrix for Decision Speed
WJ III COG Bateria III COG
Factor 1 2 3 4 5 1 2 3 4 5 6
1 1.00 1.00 2 .17 1.00 .06 1.00 3 .11 .04 1.00 .23 .07 1.00 4 .13 .18 .01 1.00 .16 .03 .10 1.00 5 .06 .05 .08 -.06 1.00 -.17 .05 .00 -.22 1.00 6 .13 .18 .06 .15 .06 1.00
Rapid Picture Naming
For Rapid Picture Naming, there were 120 common items for the WJ III COG and
Bateria III COG. This is also a timed test, and the problems that have been described previously
related to these tests also apply to Rapid Picture Naming. As a result, a factor analysis was
completed with 46 common items, which range between Item 39 and 89. The eigenvalues and
variance accounted for, rotated factor loading values, and the inter-factor correlations for each of
the language versions of the Rapid Picture Naming test are presented in Tables 18 to 20.
The results of the P C A indicated that the different language versions are represented by a
different number of factors. For the English test version, the eigenvalue criterion and scree test
criterion differed in the number of factors that represents the data, with the former suggesting 20
factors, and the latter 4. Examining the percent of variance accounted for each of the proposed
factors indicated that only the first factor accounted for more than 5% of the variance, however,
79

because the scree plot (see Figure 4) indicates that there is still a sharp drop for successive
factors, until after the fourth, a 4-factor solution was settled on. For the Spanish test version
there was also a difference between the eigenvalue criteria (21 factors) and scree test criteria (1
factor) in terms of number of factors for the solution. After examining the percent of variance
accounted for each of the proposed factors, a 1-factor solution was settled on because this was
the only factor that accounted for more than 5% of the variance.
For the English test version, all four factors individually accounted for less than 10% of
the variance in the item data. For the Spanish data, the one factor accounted for only 7% of the
variance. The cumulative variance accounted for by all of the factors for the English data were
21%.
80

Table 18
PCA Eigenvalues and Variance Explained for Each Factor for Rapid Picture Naming
W J n i C O G Bateria III C O G
Factors Eigenvalue % of Variance Cumulative % Eigenvalue % of Variance Cumulative %
accounted for accounted for
1 3.65 7.94 7.94 3.01 6.54 6.50 2 2.49 5.42 13.36 1.82 3.96 10.50 3 1.80 3.91 17.28 1.77 3.85 14.35 4 1.54 3.35 20.63 1.73 3.76 18.11 5 1.44 3.12 23.75 1.68 3.65 21.77 6 1.40 3.05 26.80 1.63 3.55 25.32 7 1.39 3.03 29.82 1.58 3.43 28.75 8 1.31 2.84 32.66 1.51 3.29 32.03 9 1.25 2.72 35.38 1.46 3.17 35.21 10 1.18 2.57 37.95 1.43 3.11 38.32 11 1.18 2.55 40.51 1.42 3.10 41.41 12 1.15 2.51 43.01 1.29 2.80 44.21 13 1.10 2.40 45.41 1.23 2.67 46.89 14 1.06 2.30 47.71 1.18 2.56 49.44 15 1.03 2.24 49.94 1.15 2.51 51.95 16 1.02 2.22 52.17 1.13 2.45 54.40 17 1.00 2.18 54.35 1.09 2.37 56.77 18 1.00 2.18 56.52 1.06 2.31 59.07 19 1.00 2.18 58.70 1.06 2.30 61.37 20 1.00 2.18 60.88 1.03 2.23 63.59 21 1.02 2.21 65.80 22 1.00 2.18 67.98
81

WJ III COG Data
1 4 7 10 13 16 19 22 25 28 31 34 37 40 43 46
Component Number
Bateria III COG Data
1 4 7 10 13 16 19 22 25 28 31 34 37 40 43 46
Component Number
Figure 4. Scree Plots for Rapid Picture Naming.
82

In terms of the factor loadings (see Table 19), there were some similarities, where two
items (Items 37 and 38) of the Spanish factor overlap with Factor 3 of the English data structure,
and another three items (Items 43, 49, and 65) overlap with the second component of the English
factor solution.
83
Table 19
PROMAX Rotated Factor Loadings for Rapid Picture Naming
WJ III COG Bateria III COG
Item# 1 2 3 4 1 30 .63 31 .69 33 34 .44 35 36 37 .74 .42 38 .76 .53 39 40 .49 41 .56 .59 43 .62 .60 44 47 .73 48 .56 49 .49 51 .59 53 55 58 59 .43 63 .51 64 65 .32 .30 66 .73 67 68 .37 .50 69 .55 71 .30 72 73 74 .40 75 76 .31 77 .43 78 79 80 .33 81 .59 82 .67 83 .58 85 .48 .47 86 .64 87 RS
.62 oo 89 .75
Notes. Factor loadings less than .30 are omitted.
84

The inter-factor correlation matrix (Table 20) indicated that the factors for the English
data are not correlated with one another.
Table 20
Inter-factor Correlation Matrix for Rapid Picture Naming
WJ III COG Bateria III COG
Factor 1 2 3 4 1
1 1.00 1.00 1.00 2 .06 1.00 3 .05 .10 1.00 4 .05 .07 -.10 1.00
Picture Recognition
For Picture Recognition, there were 10 common items for the WJ III COG and Bateria III
COG, which represents approximately half of the total number of items published for both
language versions of this test (24 items). Of these 10 common items, there was very little to no
variance in scores for the first 4 items. These four items represent very early and very easy items,
and as a result very few people responded incorrectly to them.
Three tables (Tables 21 to 23) are related to Picture Recognition, and contain information
on the eigenvalues and amount of variance accounted for by an unrotated factor solution, a
summary of the rotated factor loadings, and the inter-factor correlations, for each of the language
versions.
The results of the P C A indicated the data are represented by two and three factors for the
WJ III COG and Bateria III COG, respectively. For the English test version, the eigenvalue
criterion and scree test criterion (see Figure 5) were in agreement for a 2-factor solution;
85

however, they were not in agreement for the Spanish test version data. For the Spanish test
version the eigenvalue criteria suggested three factors, while the scree test criteria indicated one
factor. By examining the percent of variance accounted for each of the proposed factors, a 3-
factor solution was settled on because each of the three factors accounted for more than 15% of
the variance. The first factor for both language versions accounted for similar amounts of
variance, 26% and 27%, for the English and Spanish data, respectively.
Table 21
PCA Eigenvalues and Variance Explained for Each Factor for Picture Recognition
WJ III COG Bateria III COG
Factors Eigenvalue % of Variance Cumulative % Eigenvalue % of Variance Cumulative %
accounted for accounted for
1 1.53 25.51 25.51 1.64 27.41 27.41
2 1.08 19.91 43.43 1.17 19.54 46.95
3 1.04 17.27 64.22
86

W J III C O G Data
Figure 5. Scree Plots for Picture Recognition.
The factors that represent the English data corresponded to items that are presented
earlier to examinees and items presented later to examinees, however this pattern is not quite as
clear for the Spanish data. In both cases Item 23 (the last item) is associated with items that were
presented earlier to examinees (i.e., Factor 1 for the English data and Factor 2 for the Spanish
data).
Table 22
PROMAX Rotated Factor Loadings for Picture Recognition
WJ III COG Bateria III C O G
Item # I 2 1 2 3~
11 .62 -.52 .78 16 .64 .78 17 .50 .48 .59 -.54 22 .66 .76 .30 23 .63 .83 24 .49 .34 .59
Notes. Factor loadings less than .30 are omitted.
The inter-factor correlation matrix (Table 23) suggests that Factors 1 and 2, for the
English data are not correlated. However, there is somewhat of a correlation between the first
and second factors for the Spanish data, but Factor 3 is minimally correlated with the other
factors.
88
Table 23
PCA Inter-factor Correlation Matrix for Picture Recognition
Factor
WJ III COG Bateria III COG
Factor 1 2 1 2 3 1 1.00 1.00 2 -.01 1.00 .27 1.00 3 -.09 -.15 1.00
For the following two tests, Concept Formation and Analysis-Synthesis, factor analyses
were completed using TESTFACT (Wilson et al., 1991).
Concept Formation
For Concept Formation, there were 35 common items for the WJ III COG and Bateria III
COG, which represents all the items associated with the use of Introduction 2, which is typically
used for participants who are in Grade 2 and above. The factor analyses results related to
Concept Formation are given in Tables 24 to 26.
The results of the FIFA indicated the data are best represented by a 2-factor solution, for
both different language versions of this test. For the English test version, the eigenvalue criterion
and scree test criterion (see Figure 6) differed in the number of factors that represents the data,
with the former suggesting four factors, and the latter suggesting two factors. Similarly, for the
Spanish test version, the eigenvalue criterion and scree test criterion also differed in the number
of factors that represents the data, with the former suggesting five factors, and the latter
suggesting two factors. After examining the percent of variance accounted for each of the
proposed factors, a 2-factor solution was settled on for both test versions, because each of these
factors accounted for more than 5% of the variance. For the English test version, the first of the
two factors accounted for 44% of the variance in the item data, and the second factor accounted
89

for an additional 6% of the variance. For the Spanish data, the two factors accounted for 49%
and 9% of the variance, respectively. The cumulative variance accounted for by the all of the
factors was 50% and 59% for the English and Spanish data, respectively.
Table 24
FIFA Eigenvalues and Variance Explained for Each Factor for Concept Formation
WJ III COG Bateria III COG
Factors Eigenvalue % of Variance Cumulative % Eigenvalue % of Variance Cumulative %
accounted for accounted for
1 12.82 43.93 43.93 12.18 49.42 49.42
2 4.46 5.68 49.61 5.09 9.34 58.76
3 1.51 4.19 53.80 1.69 4.08 62.84
4 1.00 2.26 56.06 1.47 3.87 66.71
5 1.18 3.09 69.80
90
W J III C O G Data
Component Number
Bateria III C O G Data
H 1 1 1 1 1 1 2 3 4 5 6
Component Number
Figure 6. Scree Plots for Concept Formation,

In terms of the factor loadings, summarized in Table 25, for both the English and Spanish
data the separate factors corresponded to items early and late items, however they are
represented somewhat differently. For example, for the WJ III COG, more difficult items load
primarily on Factor 1, however there are several of the difficult items that load on Factor 2,
which represents the first half of the test. For the Bateria III COG, all of the items that represent
the second half of the test primarily load on the first factor. Interestingly, for Items 32, 36, and
38, which load on the second factor for the English data, also have factor loadings greater than .3
on the second factor for the Spanish data (although they have higher loading on the first factor).
92

Table 25
PROMAX Rotated Factor Loadings for Concept Formation
WJ III C O G Bateria III C O G
Item# 1 2 1 2
6 0.34 0.76 7 0.81 8 0.67 0.74 9 0.58 0.77 10 -0.42 0.84 0.60 11 0.90 0.90 12 0.89 0.68 13 0.64 0.75 14 0.69 0.66 15 0.63 0.73 16 0.73 0.86 17 0.52 0.30 0.58 18 0.54 0.57 19 0.40 0.70 20 0.59 0.30 0.55 21 0.51 0.57 22 0.65 0.44 0.30 23 0.50 0.49 24 0.61 0.80 25 0.76 0.77 26 0.68 0.68 27 0.86 0.78 28 0.84 0.77 29 0.81 0.76 30 0.45 0.89 -0.64 31 0.38 0.84 -0.35 32 0.55 0.45 0.34 33 0.73 0.82 34 0.41 0.74 35 0.90 0.74 36 0.49 0.40 0.34 37 0.95 0.80 38 0.31 0.43 0.50 0.30 39 0.63 0.73 40 1.01 0.65
Notes: Factor loadings less than .30 are omitted.

The inter-factor correlation matrix (Table 26) shows that the two factors are strongly
correlated for both the English and Spanish data.
Table 26
Inter-factor Correlation Matrix for Concept Formation
WJ III COG Bateria III C O G
Factor 1 2 1 2
1 1.00 1.00
2 .75 1.00 0.61 1.00
Because the factor solutions for both language versions contain the same number of
factors, it is possible to calculate congruence coefficients for each factor, providing an indicator
of how comparable the factor solutions are. The resulting congruence coefficients were, .90 for
the first factors, and .85 for the second factors, indicating that both factors are quite comparable
between the two language versions.
Analysis-Synthesis
For Analysis-Synthesis, there were 35 common items for the WJ III COG and Bateria III
COG, which represents all the items. The factor analyses results related to Analysis-Synthesis are
given in Tables 27 to 29.
The results of the FIFA indicated the number of factors that represent that data are
different for the two language versions of this test. For the English test version, the eigenvalue
criterion and scree test criterion (see Figure 7) differed in the number of factors that represents
the data, with the former suggesting six factors, and the latter suggesting two factors. After
examining the percent of variance accounted for each of the proposed factors, a 3-factor solution
94
was settled on because each of the factors accounted for more than 5% of the variance. Similarly,
for the Spanish test version, the eigenvalue criterion and scree test criterion also differed in the
number of factors that represents the data, with the former suggesting seven factors, and the
latter suggesting three factors. After examining the percent of variance accounted for each of the
proposed factors, a 3-factor solution was settled on for both test versions because each of the
factors accounted for more than 5% of the variance. For both language versions of this test, there
is a similar pattern for how much variance is accounted for by each of the factors. With the first
factor for both test versions accounting for 36% of the variance, the second factor accounting for
11 to 13% of the variance (the English and Spanish test, respectively), and the third factor
accounting for approximately another 5% of the variance. The cumulative variance accounted for
by the all of the factors was 53% and 55% for the English and Spanish data, respectively.
Table 27
FIFA Eigenvalues and Variance Explained for Each Factor for Analysis-Synthesis
WJ III COG Bateria III COG
Factors Eigenvalue % of Variance Cumulative % Eigenvalue % of Variance Cumulative %
accounted for accounted for
1 10.21 36.47 36.47 9.60 35.79 35.79 2 4.70 11.02 47.49 4.56 12.90 48.69 3 1.90 5.42 52.91 3.05 5.95 54.64 4 1.65 4.02 56.93 1.77 4.70 59.34 5 1.12 3.47 60.40 1.49 4.21 63.55
1.16 4.21 67.76 1.03 2.22 69.98
95

W J III C O G Data
3
2 3 4 5
Component Number
Bateria III C O G Data
Component Number
Figure 7. Scree Plots for Analysis-Synthesis.

In terms of the factor loadings, summarized in Table 28, for both the English and Spanish
data, separate factors primarily correspond to item order, items located at the beginning of the
test on one factor, items located at the middle of the test on another factor, and items located at
the end of the test on a third factor. However, there are some inconsistencies with this pattern for
some items. For instance, while the first 19 items all primarily load on to Factor 1 for the English
data, the first five items for the Spanish data load on to Factor 2 or 3, and only Items 6 to 19 load
primarily on to Factor 1 in the same way as the English data. Conversely, while all the later items
(Items 27 to 35) load primarily on one factor (Factor 2) for the Spanish data, these items are
dispersed amongst the three factors for the English data.
97

Table 28
PROMAX Rotated Factor Loadings for Analysis-Synthesis
WJ III COG Bateria III COG
Item# 1 2 3 1 2 3 1 0.40 0.87 2 0.68 0.31 0.56 3 0.85 0.42 -0.47 -0.32 1.01 4 0.36 0.31 5 0.71 -0.30 0.34 6 0.64 0.50 7 8
0.81 0.73
0.77 0.72 -0.31
9 0.75 0.76 10 0.60 -0.30 0.48 0.41 11 0.45 0.58 12 0.65 -0.46 0.73 -0.36 13 0.38 0.35 14 0.65 0.78 15 0.96 0.99 16 0.71 0.91 -0.37 17 0.59 0.73 18 0.44 0.64 19 0.79 0.94 20 0.88 0.67 21 0.57 0.42 0.37 22 0.75 0.75 23 1.02 0.81 24 0.94 0.30 0.62 25 0.79 0.77 26 0.63 0.39 0.40 27 0.31 0.32 28 0.70 0.74 29 0.84 0.69 30 -0.40 0.56 0.73 31 -0.40 0.33 0.50 32 0.38 0.39 0.68 33 0.72 0.83 34 0.35 0.42 0.37 0.47 35 0.39 0.37 0.49 0.31
Notes. Factor loadings less than .30 are omitted.
The inter-factor correlation matrix (Table 29) showed that for both the WJ III COG and
Bateria III COG Factors 1 and 3 are strongly correlated with each other. To get an indication of
98

how comparable the factor solutions are between the language versions congruence coefficients
were calculated for each factor. The resulting congruence coefficients were, .83, .80, and .60, for
Factors 1, 2, and 3, respectively. This indicates that the first two factors are quite comparable
between the two language versions, but that the third factor is not.
Table 29
Inter-factor Correlation Matrix for Analysis-Synthesis
WJ III COG Bateria III C O G Factor 1 2 3 1 2 3
1 1.00 1.00 2 0.16 1.00 .036 1.00 3 0.61 0.35 1.00 0.57 0.47 1.00
Summary
In this section, results related to the examination of the factor structure similarity between
the tests administered in English and Spanish were presented. A summary of the factor solutions
for each test and language version is presented in Table 30. The information provided in the table
includes for each test, the type of factor analysis (PCA or FIFA), the number of factors in the
factor solution for each language, and the evaluation of the congruence coefficients (i.e., the
degree to which the factors are congruent) for tests with the same number of factors.
Three (Spatial Relations, Concept Formation, and Analysis-Synthesis) of the seven tests
had the same number of factors represent both language versions. The remaining four tests had
different numbered factor solutions between the two language versions. For the tests with the
same number of factors representing both language versions data, the congruence coefficients
ranged from .60 to .98 and, except in the case of the .60, indicated the factors were somewhat to
99

very comparable. In terms of the tests for which the data were best represented by a different
number of factors for the two language versions the following were observed. The percent of
variance accounted for by the first factor for all of these tests, for both languages, were lower
(7% to 18%) than for the tests with the same number of factors in the factor solution (27% to
49%), as well, the factor solutions typically involved more factors than the tests with the same
number of factors representing both language versions.
Table 30
Summary of Number of Factors for the WJ III COG and Bateria III COG
Type of Number of Factors
Test Factor
Analysis WJ III COG Bateria III C O G Congruence Coefficients
Evaluation Spatial Relations PCA 2 2 Very Comparable to
Quiet Comparable
Picture Recognition PCA 2 3 —
Visual Matching PCA 5 6 —
Decision Speed PCA 5 6 —
Rapid Picture Naming PCA 4 1 —
Concept Formation FIFA 2 2 Quiet Comparable
Analysis-Synthesis FIFA 3 3 Quiet Comparable to
Not Comparable
Stage 2 - Internal Consistency
This section presents the results of analyses related to the internal consistency, or the
degree to which individuals' scores would remain relatively consistent over repeated
administrations of the same test or alternate test forms (Crocker & Algina, 1986), of each of the
translated tests for each of the respective batteries. This set of analyses can be used to compare
100

the measurement accuracy for each of these batteries (and language groups); are the purported
constructs measured with the same accuracy for each of the language groups? This provides
another piece of evidence about the comparability of the tests of the WJ III COG and the tests of
the Bateria III COG.
The calculated reliability estimates for each of the selected tests are shown in Table 31.
Included in the table is information about which method, Cronbach alpha or Feldt-Raju, was
used to calculate the internal consistency estimate. As indicated earlier, the method depended on
the different scoring schemes for the different tests, that is, for all tests that contained only
dichotomously scored items internal consistency was calculated using Cronbach alpha, whereas
for tests that utilize multiple point scoring systems internal consistency was calculated using
Feldt-Raju. These estimates, calculated separately for each population, are compared in an effort
to identify differences in the internal consistency of the scores for the English and Spanish
versions of these tests.
Table 31
Reliabilities for the Selected Tests of the WJ III COG and Bateria III COG
#of Reliability WJHI Bateria
Test Common Items Method C O G III COG |Difference|
Spatial Relations 12 Feldt-Raju 0.77 0.92 0.15 Concept Formation 35 Cronbach alpha 0.94 0.96 0.02 Visual Matching 60 Cronbach alpha 0.94 0.96 0.02 Picture Recognition 10 Feldt-Raju 0.90 0.85 0.05 Analysis-Synthesis 35 Cronbach alpha 0.87 0.89 0.03 Decision Speed 40 Cronbach alpha 0.91 0.91 0.00 Rapid Picture Naming 120 Cronbach alpha 0.97 0.97 0.00
101

The reliability estimates tended to be very similar for the two groups and ranged between
.77 to .97 for the English test version and .85 to .97 for the Spanish test version. The last column
in the table presents the absolute difference between the internal consistency estimates for the
English and Spanish administrations, separately for each test. The difference between internal
consistency estimates between the two language administrations ranged from no difference to
.15. The only difference between internal consistency estimates for the different language
administrations that seems noteworthy, is that of Picture Recognition, where the difference is
.15. A difference of this magnitude suggests that there exists a meaningful difference between
the estimates of internal consistency for the selected common items for this test. In other words,
it appears that for this test, the set of common items are more internally consistent for the
Spanish test version (r=.92) than for the English test version (r=.77).
Stage 3 - Item Response Theory Based Analyses
IRT based analyses were limited to 3 of the 7 selected tests. For a number of items, and
for some tests overall, there was limited variability in the response patterns. Response sets for
items need to include correct as well as incorrect responses in order to have stable and reliable
parameter estimates. In the case where there are large numbers of items with high p-values
(proportion correct), where very few people are providing incorrect responses, parameter
estimates can be unreliable. As a result, IRT related analyses, including DIF, Item and Test
Information, and Correlation of Item Parameters, could not be completed on the timed tests
(Visual Matching, Decision Speed, and Rapid Picture Naming). For these tests items are very
similar from beginning to end, with only minor changes to increase the difficulty of an item, and
it is the speed with which one gets through the task that separates people on an ability scale.
Consequently, there is very little variability in item responses for all the items contained on these
102

tests. That is, typically i f a person reached an item, it was likely they were to get it correct. For
most of the items for these tests the p-values (difficulty) were greater than .95. The implication
for the other tests was that items with p-values greater than .95 were removed from the IRT
based analyses in order that the estimating procedure for the rest of the items was more stable
and reliable. Lastly, the Spanish sample that completed Picture Recognition was too small to
provide reliable and stable parameter estimates, and was therefore also excluded from this set of
analyses.
There were two other instances in which items were not included for some or all of the
IRT based analyses. One situation was when, after the iteration process when estimating
parameters, the calibration procedure did not converge, and parameters could not be estimated.
The other situation was specific to the DIF detection procedure. The DIF detection procedure for
any item divides the two samples into deciles, based on their total score in order to match people
with similar scores (or ability), to detect differences in response patterns between the two groups.
As a result, there are instances when the case counts in a particular decile(s) is too low, or even
empty, for one language group, and a DIP statistic can not be calculated. A summary of items
eliminated and the accompanying reason is presented in Table 32.
103

Table 32
Summary of Eliminated Items and Reasons for Elimination for IRT Related Analyses
Test Eliminated Item(s) Reason for Elimination
Spatial Relations 1 to 2, 4 to 5, and 9 p-value^.95
Concept Formation 6 to 7, and 11 21 to 40*
p-value>.95 Empty cells
Picture Recognition A l l Sample size for Bateria III COG too small for stable parameter estimates
Analysis-Synthesis 1-5,7-10, 12, 15-17 23,24
p-value>.95 Could not be estimated
Visual Matching A l l Little to no variance in item scores
Decision Speed A l l Little to no variance in item scores
Rapid Picture Naming A l l Little to no variance in item scores
Indicates difficulty level of the item * Impacts only the DIF analyses
P A R D U X (Burket, 1998) and its companion software F L U X (Burket, 1993) were used to
perform the Item Response Theory based analyses, including DIF detection, investigation of item
and test information, and the correlation of parameter estimates.
Evaluation of the IRT Model Assumptions
There are three assumptions related to the use of IRT models: (a) the ability being
measured is unidemsional, (b) an examinee's responses to the items in a test have local
independence, and (c) the item responses fit the IRT model (Hambleton et al., 1991). The
evaluations of each of these are presented below and summarized in Table 33.
104
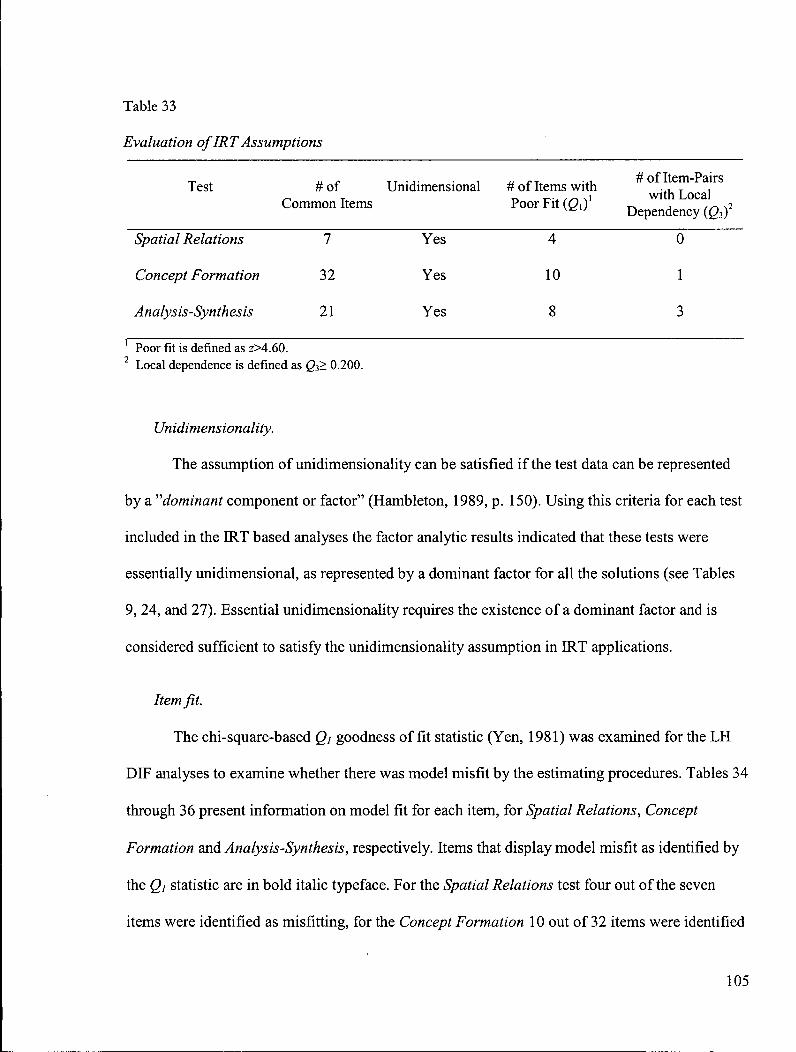
Table 33
Evaluation of IRT Assumptions
Test # of Unidimensional Common Items
# of Items with Poor Fit (g,)1
# of Item-Pairs with Local
Dependency (Qjf
Spatial Relations
Concept Formation
Analysis-Synthesis
7
32
21
Yes
Yes
Yes
4
10
8
0
1
3
Poor fit is defined as z>4.60. Loca l dependence is defined as Q3> 0.200.
Unidimensionality.
The assumption of unidimensionality can be satisfied i f the test data can be represented
by a "dominant component or factor" (Hambleton, 1989, p. 150). Using this criteria for each test
included in the IRT based analyses the factor analytic results indicated that these tests were
essentially unidimensional, as represented by a dominant factor for all the solutions (see Tables
9, 24, and 27). Essential unidimensionality requires the existence of a dominant factor and is
considered sufficient to satisfy the unidimensionality assumption in IRT applications.
Item fit.
The chi-square-based Qj goodness of fit statistic (Yen, 1981) was examined for the L H
DIP analyses to examine whether there was model misfit by the estimating procedures. Tables 34
through 36 present information on model fit for each item, for Spatial Relations, Concept
Formation and Analysis-Synthesis, respectively. Items that display model misfit as identified by
the Qi statistic are in bold italic typeface. For the Spatial Relations test four out of the seven
items were identified as misfitting, for the Concept Formation 10 out of 32 items were identified
105
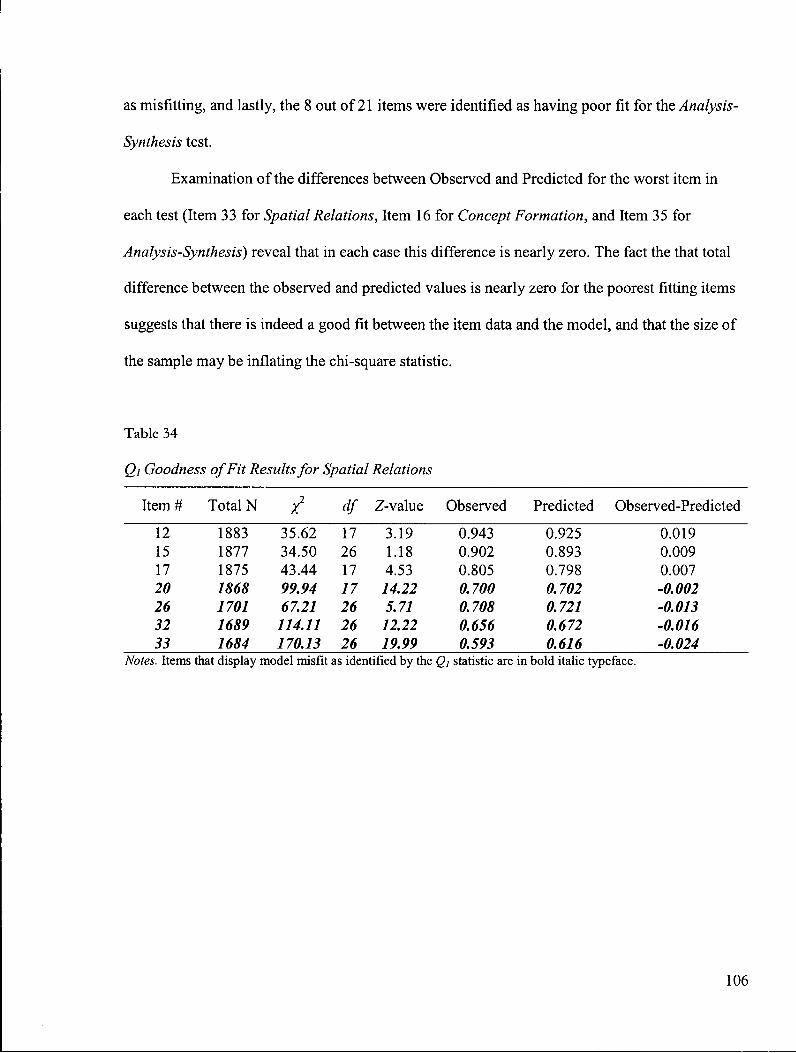
as misfitting, and lastly, the 8 out of 21 items were identified as having poor fit for the Analysis-
Synthesis test.
Examination of the differences between Observed and Predicted for the worst item in
each test (Item 33 for Spatial Relations, Item 16 for Concept Formation, and Item 35 for
Analysis-Synthesis) reveal that in each case this difference is nearly zero. The fact the that total
difference between the observed and predicted values is nearly zero for the poorest fitting items
suggests that there is indeed a good fit between the item data and the model, and that the size of
the sample may be inflating the chi-square statistic.
Table 34
Qi Goodness of Fit Results for Spatial Relations
Item# Total N df Z-value Observed Predicted Observed-Predicted
12 1883 35.62 17 3.19 0.943 0.925 0.019 15 1877 34.50 26 1.18 0.902 0.893 0.009 17 1875 43.44 17 4.53 0.805 0.798 0.007 20 1868 99.94 17 14.22 0.700 0.702 -0.002 26 1701 67.21 26 5.71 0.708 0.721 -0.013 32 1689 114.11 26 12.22 0.656 0.672 -0.016 33 1684 170.13 26 19.99 0.593 0.616 -0.024
Notes. Items that display model misfit as identified by the g/ statistic are in bold italic typeface.
106

Table 35
Qi Goodness of Fit Results for Concept Formation
Item# Total N / df Z-value Observed Predicted Observed-Predicted
* 1844 25.68 8 4.42 0.937 0.919 0.018 9 1844 27.52 8 4.88 0.894 0.878 0.016 10 1844 22.75 8 3.69 0.952 0.935 0.017 12 1829 24.80 8 4.20 0.921 0.912 0.010 13 1829 25.93 8 4.48 0.858 0.851 0.008 14 1829 17.86 8 2.47 0.861 0.852 0.008 15 1829 29.85 8 5.46 0.873 0.865 0.009 16 1829 43.45 8 8.86 0.899 0.890 0.009 17 1828 16.05 8 2.01 0.874 0.865 0.009 18 1829 21.34 8 3.34 0.800 0.793 0.007 19 1829 24.53 8 4.13 0.856 0.847 0.008 20 1828 23.87 8 3.97 0.882 0.873 0.009 21 1684 12.00 8 1.00 0.775 0.775 0.001 22 1684 27.13 8 4.78 0.567 0.572 -0.005 23 1684 12.31 8 1.08 0.618 0.621 -0.003 24 1679 10.45 8 0.61 0.536 0.539 -0.003 25 1679 12.57 8 1.14 0.469 0.474 -0.005 26 1677 10.33 8 ' 0.58 0.516 0.519 -0.004 27 1673 17.22 8 2.31 0.497 0.501 -0.004 28 1673 18.12 8 2.53 0.488 0.493 -0.004 29 1668 11.21 8 0.80 0.444 0.450 -0.006 30 1474 20.09 8 3.02 0.873 0.877 -0.004 31 1475 15.56 8 1.89 0.834 0.839 -0.005 32 1475 37.14 8 7.28 0.713 0.720 -0.008 33 1475 18.31 8 2.58 0.585 0.593 -0.008 34 1475 13.48 8 1.37 0.730 0.737 -0.006 35 1472 8.29 8 0.07 0.361 0.373 -0.012 36 1474 13.74 8 1.43 0.647 0.656 -0.009 37 1474 24.03 8 4.01 0.409 0.420 -0.011 38 1474 6.50 8 -0.37 0.765 0.771 -0.006 39 1473 20.51 8 3.13 0.631 0.639 -0.007 40 1468 11.98 8 1.00 0.435 0.445 -0.010
Notes. Items that display model misfit as identified by the Qt statistic are in bold italic typeface.
107

Table 36
Qi Goodness of Fit Results for Analysis-Synthesis
Item# Total N f df Z-value Observed Predicted Observed-Predicted
6 1788 12.53 8 1.13 0.904 0.893 0.011 11 1788 8.14 8 0.03 0.951 0.944 0.007 13 1787 13.40 8 1.35 0.802 0.798 0.004 14 1788 10.46 8 0.62 0.912 0.905 0.008 18 1788 9.62 8 0.41 0.859 0.854 0.005 19 1788 15.53 8 1.88 0.939 0.928 0.011 20 1763 13.58 8 1.39 0.841 0.832 0.009 21 1763 10.10 8 0.52 0.880 0.875 0.006 22 1763 14.07 8 1.52 0.751 0.744 0.007 23 1762 9.87 8 0.47 0.780 0.772 0.009 25 1759 26.65 4.66 0.723 0.717 0.006 26 1695 39.09 7.77 0.589 0.592 -0.003 27 1695 38.64 8 7.66 0.422 0.432 -0.010 28 1693 34.58 8 6.65 0.233 0.247 -0.014 29 1690 34.19 8 6.55 0.218 0.234 -0.016 30 1689 18.77 8 2.69 0.131 0.144 -0.013 31 1688 5.70 8 -0.58 0.145 0.155 -0.010 32 1399 38.69 8 7.67 0.288 0.310 -0.022 33 1399 23.15 8 3.79 0.142 0.167 -0.025 34 1395 31.72 8 5.93 0.485 0.501 -0.015 35 1398 43.20 8 8.80 0.544 0.556 -0.012
Notes. Items that display model misfit as identified by the Qi statistic are in bold italic typeface.
Local item dependence (LID).
The Qi statistic developed by Yen (1984) was used to evaluate that examinees' responses
to the items in a test are statistically independent, one of the three assumptions related to the use
of ERT models. The Qs statistic is the correlation between the performance on two items after
taking into account overall test performance. An item pair was flagged as locally dependent i f
|05|> .20 (Ercikan et al., 1998).
Overall, there were only four item pairs flagged as LED (See Table 33) across all three
tests included in the IRT-based analysis. The Qi values for these four item pairs ranged from .2
to .3 (see Table 37). In three out of the four instances of item pairs identified as LED, the pair of
108

items are presented one after the other to examinees. While there were three item pairs identified
as LED for Analysis-Synthesis, this represents a very small portion of the total possible number of
item pairs. That is, there were only three item pairs flagged as LID out of 210 item pairs. While
a large amount of LID results in inaccurate estimates of item parameters and test information
(Yen, 1993), this small amount of LED is expected to have minimal effects on item parameters.
Table 37
Item Pairs with Local Item Dependency (LID)
Test Item Pair \QT\ Value
Concept Formation 30 and 31 .30
Analysis-Synthesis 14 and 19 .20
28 and 29 .28
30 and 31 .21
Identification of Differential Item Functioning
The L H (Linn & Harnisch, 1981) DEF detection procedure was used to detect DIF items
for the selected tests of cognitive ability. The main purpose of DEF detection procedures is to
determine whether the relative performance of the members of a minority or subgroup and
members of the majority group is the same or different. The results of the DEF detection
procedures are summarized in Table 38. Table 38 presents the number of items for which DIF
procedures were performed, whether or not the item favoured the English (Pro-English) or the
Spanish (Pro-Spanish) language groups, and their degree of DEF (Level 2 or Level 3) for each
test. For example, for the Concept Formation test, 12 items went through the DEF detection
109

procedure, of which there were two items identified as DIF. These two items were Level 2 DIF
and favoured the participants who were administered the English language test version.
Overall, out of 40 items, 9 items were identified as DIF in the English and Spanish
versions of the Tests of Cognitive Ability. Of these DIF items, 67% (six items) functioned in
favour of the English test version. In terms of the specific tests, the Spatial Relations test had the
greatest number of DIF items (six out of seven items), which were evenly split between the
language versions in terms of which population the items favoured. The Concept Formation and
Analysis-Synthesis tests had only three DIF items between them, all of which favoured the
participants administered the English test version.
Table 38
Number of DIF Items for Each Test of Cognitive Ability
Pro-English Pro-Spanish
#of
Test Common Items Level 2 Level 3 Level 2 Level 3
Spatial Relations 7 1 2 1 2
Concept Formation 12 2 0 0 0
Analysis-Synthesis 21 1 0 0 0
Investigation of Item Characteristics
This section examines information about how well the items are measuring the various
abilities assessed by the two tests for which these analyses could be completed, Concept
110
Formation and Analysis-Synthesis . That is, based on item parameter estimates, we can obtain
item-information functions which are a powerful method of describing and comparing items and
tests. Item information function values were computed based on the item parameter estimates
using F L U X (Burket, 1993).
Item information functions indicate the degree of measurement accuracy provided by test
items for different ability levels. The area under the item information function (Area), the values
of the location of maximum information (Location of Maximum Information), and the height of
the item information function at the location of maximum information (Maximum Information),
for each item were calculated for each population. In order to obtain comparable parameter
estimates for which a mathematical difference between the populations would be meaningful, the
Stocking and Lord (1983) equating procedure was conducted. This method solves for the linear
transformation that minimizes the squared differences between the test characteristic curves from
two separate calibrations for a given ability level. This equating method does not affect the
relative value of the item parameters to one another and, therefore, does not affect the definition
of the scale or trait being estimated. Values for Area, Location of Maximum Information, and
Maximum Information based on the transformed (and therefore comparable) parameters are
shown in Tables 39 and 40. Each table presents information on each item that was comparable
for the two language versions. That is, item parameters were estimated for each item for each
sample. If an item could not be calibrated with one of the samples, then it was dropped from the
other sample as well.
1 0 Spatial Relations was not included in this set of analysis because there were not enough items
from which to draw anchor items in order to equate parameter estimates for the two language versions.
I l l

For Concept Formation, items in the middle of this test have larger amounts of
information, in terms of Area, as well as Maximum Information (the height of information at
maximum utility) than at the beginning or end, for both language versions. In all cases, the
location of maximum information is greater for the Spanish version of items, indicating that
these items provide more information for the Spanish examinees at greater ability levels. There
are some notable differences between the English and Spanish values for Concept Formation.
Overall, the items for the Spanish version of Concept Formation provide 15% more information
than the English version (Total Area). One item in particular, Item 34, provides twice as much
information for the Spanish than the English version of this item. Further, for Item 34 there is a
striking difference between the height of the item information function at the location of
maximum information for the Spanish and English versions, with the height of the Spanish
version more than five times that of the English version.
112

Table 39
Item Information for Concept Formation
Location of
Area Maximum Information Maximum Information
WJIII Bateria III WJIII Bateria III WJ III Bateria III
Item# COG COG Difference COG COG COG COG
8 0.019 0.016 0.003 90 167 0.11 0.09 9 0.011 0.015 -0.004 95 183 0.05 0.08 10 0.008 0.014 -0.007 17 140 0.05 0.08 12 0.027 0.034 -0.007 143 187 0.19 0.29 13 0.018 0.021 -0.004 150 214 0.09 0.12 14 0.016 0.028 -0.011 136 231 0.08 0.19 15 0.022 0.027 -0.005 154 219 0.13 0.19 16 0.025 0.023 0.002 130 213 0.17 0.14 17 0.018 0.028 -0.009 136 225 0.10 0.20 18 0.023 0.020 0.003 185 250 0.14 0.11 19 0.022 0.024 -0.002 155 233 0.13 0.15 20 0.019 0.029 -0.010 142 215 0.10 0.22 21 0.024 0.022 0.002 213 278 0.14 0.12 22 0.017 0.020 -0.003 270 326 0.08 0.10 23 0.019 0.022 -0.003 264 304 0.10 0.13 24 0.028 0.037 -0.009 288 327 0.20 0.35 25 0.036 0.036 0.000 307 334 0.32 0.32 26 0.035 0.034 0.001 295 330 0.31 0.30 27 0.039 0.035 0.004 302 331 0.38 0.31 28 0.037 0.039 -0.002 301 336 0.34 0.38 29 0.030 0.034 -0.004 316 333 0.23 0.29 30 0.018 0.023 -0.005 179 250 0.09 0.13 31 0.017 0.025 -0.007 195 269 0.08 0.15 32 0.015 0.021 -0.007 240 290 0.06 0.12 33 0.029 0.033 -0.004 291 329 0.21 0.27 34 0.018 0.041 -0.024 240 304 0.08 0.43 35 0.031 0.030 0.001 336 369 0.25 0.24 36 0.015 0.017 -0.002 260 308 0.06 0.08 37 0.031 0.030 0.001 328 359 0.24 0.22 38 0.020 0.024 -0.004 230 290 0.10 0.14 39 0.030 0.030 0.000 280 324 0.23 0.23 40 0.037 0.033 0.004 320 358 0.35 0.28
Total Area 0.753 0.864 -0.111
113

For Analysis-Synthesis, as was the case with Concept Formation, items in the middle of
the test have larger amounts of information, in terms of Area, as well as Information (the height
of information at maximum utility) than at the beginning or end, for both language versions, with
the exception of the very last item. In all cases, the location of maximum information is greater
for the Spanish version of items, indicating that these items provide more information for the
Spanish examinees at greater ability levels compared to the English examinees. There are some
notable differences between the English and Spanish values for Analysis-Synthesis as well. In
this case, overall, the items for the Spanish version of Analysis-Synthesis provide 16% less
information than the English version (Total Area). Two items in particular, Items 22 and 25,
provide approximately twice as much information for the English than the Spanish version of
this item. Further, for these items, there is a striking difference between the height of the item
information function at the location of maximum information for the two language versions, with
the height of the English version more than three times that of the English versions.
114
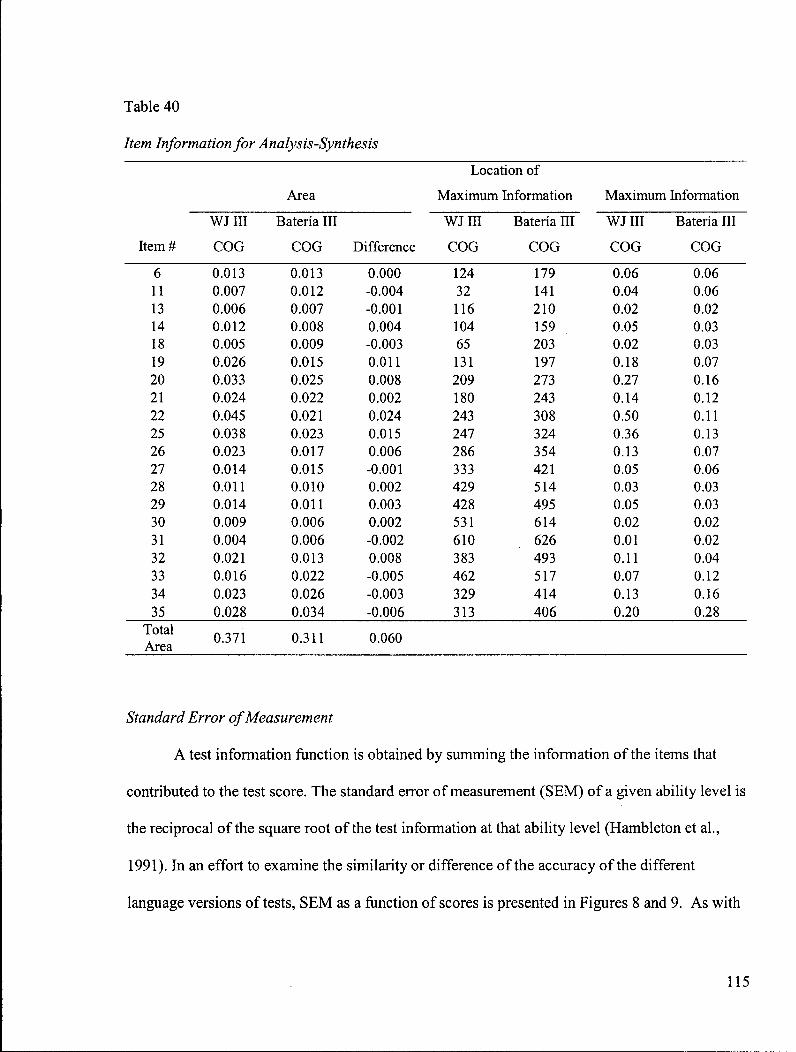
Table 40
Item Information for Analysis-Synthesis
Location of
Area Maximum Information Maximum Information
WJIII Bateria III WJIII Bateria III WJIII Bateria III
Item# COG COG Difference COG COG COG COG
6 0.013 0.013 0.000 124 179 0.06 0.06 11 0.007 0.012 -0.004 32 141 0.04 0.06 13 0.006 0.007 -0.001 116 210 0.02 0.02 14 0.012 0.008 0.004 104 159 0.05 0.03 18 0.005 0.009 -0.003 65 203 0.02 0.03 19 0.026 0.015 0.011 131 197 0.18 0.07 20 0.033 0.025 0.008 209 273 0.27 0.16 21 0.024 0.022 0.002 180 243 0.14 0.12 22 0.045 0.021 0.024 243 308 0.50 0.11 25 0.038 0.023 0.015 247 324 0.36 0.13 26 0.023 0.017 0.006 286 354 0.13 0.07 27 0.014 0.015 -0.001 333 421 0.05 0.06 28 0.011 0.010 0.002 429 514 0.03 0.03 29 0.014 0.011 0.003 428 495 0.05 0.03 30 0.009 0.006 0.002 531 614 0.02 0.02 31 0.004 0.006 -0.002 610 626 0.01 0.02 32 0.021 0.013 0.008 383 493 0.11 0.04 33 0.016 0.022 -0.005 462 517 0.07 0.12 34 0.023 0.026 -0.003 329 414 0.13 0.16 35 0.028 0.034 -0.006 313 406 0.20 0.28
Total Area 0.371 0.311 0.060
Standard Error of Measurement
A test information function is obtained by summing the information of the items that
contributed to the test score. The standard error of measurement (SEM) of a given ability level is
the reciprocal of the square root of the test information at that ability level (Hambleton et al.,
1991). In an effort to examine the similarity or difference of the accuracy of the different
language versions of tests, S E M as a function of scores is presented in Figures 8 and 9. As with
115

the previous section that examined item information functions, this set of analysis could only
completed for two tests, Concept Formation and Analysis-Synthesis11.
For both Concept Formation (Figure 8) and Analysis-Synthesis (Figure 9) the S E M
functions revealed that the accuracy of the test was similar for both language versions, but for
higher scores the test was more accurate for the Spanish-speaking population, while for lower
scores the test was more accurate for the English-speaking population.
Spatial Relations was not included in this set of analysis because there were not enough items
from which to draw anchor items in order to equate parameter estimates for the two language versions.
116

Figure 8. Standard Error of Measurement for Concept Formation.

Figure 9. Standard Error of Measurement for Analysis-Synthesis.

Correlation of Item Parameters
Table 41 presents correlations of item parameters, a and /?, based on the calibrations of
items separately for each language group, as well as separately for each test. The correlations
between the item parameters indicate that the correlations of the difficulty parameters 3, (the
difficulty parameters for each of the levels of the multiple scoring) ranged from .70 to .97. The
correlations were lower for Spatial Relations, particularly for the Level 2 and Level 3 scoring (B2
and Ps). These correlations indicate that the ordering of item difficulties tended to be similar for
these tests. The discrimination parameter (a) correlations were noticeably lower, ranging
between 0.52 and .81. The lower a parameter correlations indicate that the relationship between
what the items are assessing with the overall construct assessed by the whole test varied for some
of the items between the two language versions. The lower the correlations are, the larger the
number of items where differences in the ordering of the discrimination parameters were
observed.
Table 41
Correlation between IRT Item Parameters
Test
#of Correlations
Test Common Items a Pi A A P
Spatial Relations 7 .52 .83 .68 .70 1.00
Concept Formation 35 .71 .97 .993
Analysis-Synthesis 21 .81 .97 .999
Scatter plots (Figures 10 to 12) for the correlations of each parameter for each test
provide visual representation of the relative order of items for the two populations. For Concept
119

Formation and Analysis-Synthesis specific items were flagged as being particularly different in
terms of the discrimination (a) parameter between the two language groups. For Concept
Formation, it was Item 34, and for Analysis-Synthesis it was Item 22. Ln terms of the difficulty
parameters, two Concept Formation items (Items 8 and 16) as well as two Analysis-Synthesis
items (Items 19 and 22) were flagged as being particularly different between the two language
groups.
120

£8 u,sil8ug
u
a hi
c
ts
93
S
a.
s u
V 4 s H 3 u 3
>>3
•2
I-I
I-I
o <ti Q
s C O
18 4 S | l 8 u 3
0 3
C
a o co
5 XI +-»
<s c/3
jo
O 00
I-I
121
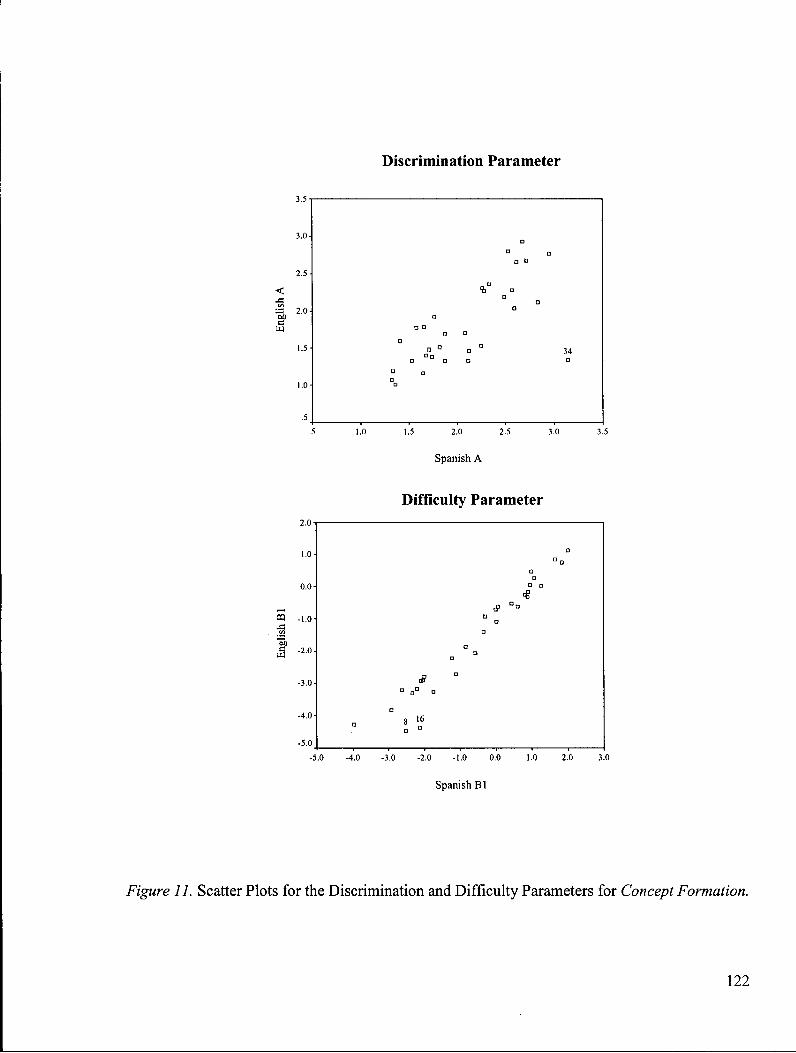
Discrimination Parameter
2.5
<
• • D
• D
a
ft" • •
• •
o • •
• o °
°a a a
O
• • 34 • •
• •
.5 1.0 1.5 2.0 2.5 3.0 3.5
Spanish A
Difficulty Parameter
a • Q
• •
• a
a •
•
a •
•
•
• 8 1 6
o D
-5.0 -4.0 -3.0 -2.0 -1.0 0.0 1.0 2.0 3.0
Spanish B l
Figure 11. Scatter Plots for the Discrimination and Difficulty Parameters for Concept Formation.
122

Discrimination Parameter
< e
3.5 n
2.5
2.0 i
1.0
22
0.0
1.0 1.5 2.0
Spanish A
2.5
3.0-
2.0-
1.0-
Difficulty Parameter
ca .c 60 c
UJ -2.0-
-3.0-
-4.0-
-5.0
-4.0 -3.0
'if
-2.0 -1.0 0.0
Spanish B l
1.0 2.0 3.0
Figure 12. Scatter Plots for the Discrimination and Difficulty Parameters for Analysis-Synthesis.
123

Stage 4 - Judgmental Review
A qualitative examination of the English and Spanish versions of the test items and their
instructions to examinees by the two bilingual reviewers to evaluate the equivalence of the two
language versions was completed. Typically, the results of the judgmental review ratings are
reported to identify potential reasons for the statistical identification of DIP items. Of the tests
included in the DIP analyses {Spatial Relations, Concept Formation, and Analysis-Synthesis)
very few items (nine items in total) were identified as DIP (See Table 38). As such, the results
related to the Judgmental Review are organized by the type of differences they identified, and are
not limited to a review of only the DIF items. Differences that were considered "somewhat
different" or "very different" are described below.1 2
Differences in Items
The judgmental review process did not identify any differences in the items between the
two language versions of the tests. At the outset of the review process, the reviewers were
instructed to look for differences between the presentation or graphic representation of the items,
but also to examine pictures or objects for differences in familiarity (i.e., a picture of a phone that
would be unfamiliar to someone from a Spanish speaking country). This research study
examined only translated tests, in which the items remained exactly the same, and only the
directions were translated from English to Spanish. As such, it is not surprising that the
1 2 Recall that reviewers were asked to rate differences between language versions. A rating of 0-1
indicated no or negligible differences between the two versions; a rating of 2 indicated that there were
clear differences between the translations that may not necessarily lead to performance differences; a
rating of 3 indicated that there were clear differences between the two versions that were expected to lead
to performance differences.
124

reviewers did not find any differences between the items for the two language versions of these
tests, nor did they find any differences related to objects or pictures being more familiar or
common to one language than the other.
Differences in Instructions to Examiner
The reviewers identified several differences in the instructions that are presented to the
examiner, and provide directions related to the administration and scoring of the various tests. In
this case, the impact on the performance of examinees would be indirect, and result if there are
differences in how the test was administered based on these instructions. Examples are presented
below.
For three tests, the administration overview provided to the reviewers identified two
inconsistencies. The English test version reads "Very young subjects or individuals who function
at very low levels may be confused by more than one line per page." In the Spanish version,
instead of "very young subjects" the phrase "Sujetos menores o inmaduros" which means
"immature subjects" was used. The reviewers indicated that "Personas jovenes" would be a
better translation. Another difference identified by reviewers for this statement to administrators,
was that the Spanish test translation was more specific when referring to individuals functioning
at low levels on this test ("otros que tengan dificultad con la prueba"), whereas the English does
not include this sentiment explicitly. The Spanish statement makes specific reference to
performances related to the test in question, whereas it could be interpreted that the English is
speaking about "low functioning individuals" with respect to this test, as well as others, or
overall low functioning. Neither reviewer felt that this would impact how well a person
performed on this test, but it could impact how the test is administered for certain individuals.
Examples of this difference occurred in Spatial Relations, and Concept Formation. A similar
125

difference, related to the first identified difference (young versus immature) was identified for
the Visual Matching instructions to administrators, although in this case the English refers to
"older," while the wording in Spanish was "mature" ("maduros").
In another example of differences in the instructions to examiners, the overview for
Visual Matching in English reads, "If you administer Visual Matching 2 first, and the subject has
difficulty with the Practice Exercise, administer Visual Matching 1 and use that score instead."
Whereas, instead of using the phrase "difficulty with" the Spanish version refers to i f a student
obtains a low score ("obtiene una calificacion muy baja"). The reviewers rated this difference as
"somewhat different" (a rating of 2), but that they were not expected to lead to differences in
performance between the two groups.
There was one instance when the reviewers indicated that there were clear differences in
the instructions to examiners between the two versions, and expected them to lead to difference
in performance between the two groups (a rating of 3). This occurred with Rapid Picture
Naming, where the examiners are instructed to turn the page (of the workbook examinees work
through) immediately if the time limit has not elapsed. Whereas, in the Spanish version
examiners are told to inform subjects to turn the page i f there is still time remaining. Given this
is a timed test, the reviewers believed that the extra verbal instructions to Spanish examinees
could slow down the speed with which examinees proceed through this test, thereby negatively
impacting their total raw score for this test.
Differences in Instructions to Examinees
For these sets of differences, reviewers identified dissimilarities with the instructions to
the examinee. In these cases, the impact on the performance of examinees would be direct.
Examples are presented below.
126
Reviewers identified differences in one of the statements made to examinees during the
introduction and sample items for the Spatial Relations. Specifically, once an examinee has
responded correctly to Sample C, the examiner is to say "That is correct, pieces X and C. You
had to turn piece X to make it fit." The reviewers thought that the same statement in Spanish was
more specific in relation to turning the piece to make it fit. The Spanish version reads "Tienes
que parar la parte X , " which indicates that you had to "stand up" part X . The reviewers thought
the translation should be "Tienes que girar la parte X , " which indicates that a "turn" is required.
The reviewers rated this difference as "somewhat different" (a rating of 2), but that they were not
expected to lead to differences in performance between the two groups.
When introducing the sample items for the Visual Matching 2, the English examiner
reads the following statement "I want to find out how fast you can find two things that look
alike." In Spanish, the phrase is more specific "Haz un circulo alrededor de los dos numeros que
son equales en cada hilera," indicating to the subject that they are required to find two numbers
that are alike (the task involves finding the two numbers in a set of six that are the same). While
different, the reviewers rated it as "somewhat different" and they did not expect it to lead to
differences in performance between the two groups.
During the instructions for Analysis-Synthesis examinees are presented a key (or legend)
and instructed in the English version "Use the key to help work the puzzles." The reviewers
indicated that the Spanish version is less specific ("ayude con los rompecabezas), which they
translated to mean "help with the puzzles." They thought that a more equivalent translation
would have been "ayude a resolver los rompecabezas." Again, while the reviewers indicated that
the translations were "somewhat different," they did not expect it to lead to difference
performances for the two groups.
127
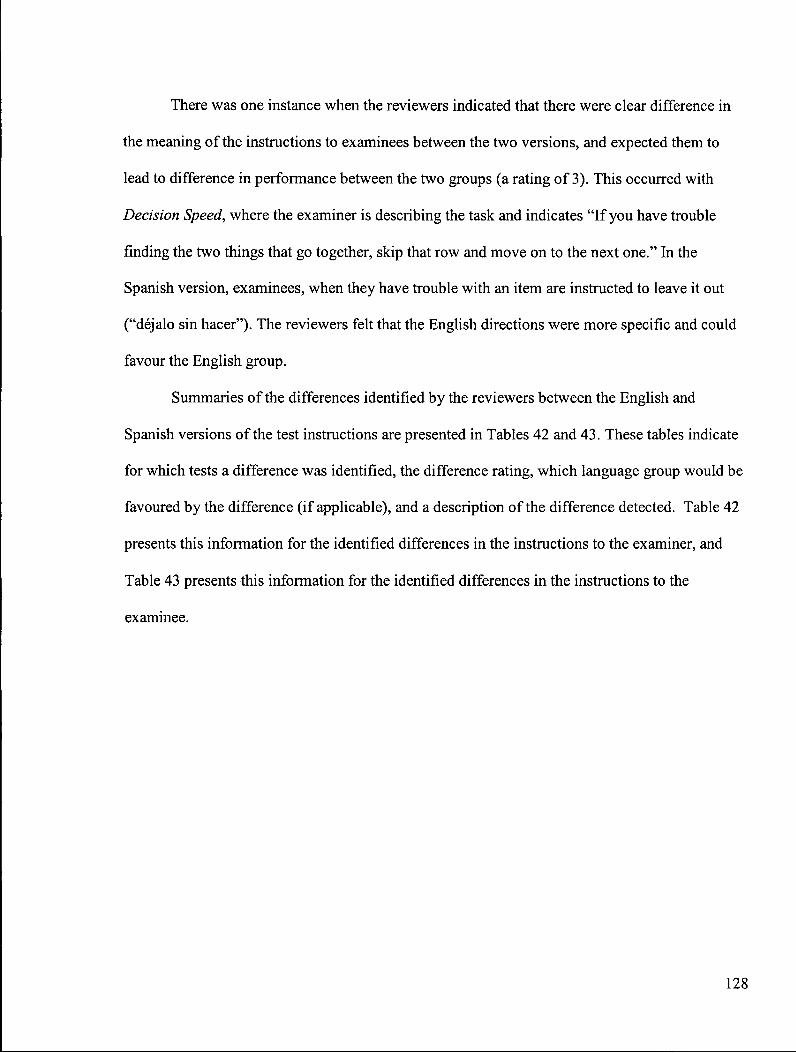
There was one instance when the reviewers indicated that there were clear difference in
the meaning of the instructions to examinees between the two versions, and expected them to
lead to difference in performance between the two groups (a rating of 3). This occurred with
Decision Speed, where the examiner is describing the task and indicates "If you have trouble
finding the two things that go together, skip that row and move on to the next one." In the
Spanish version, examinees, when they have trouble with an item are instructed to leave it out
("dejalo sin hacer"). The reviewers felt that the English directions were more specific and could
favour the English group.
Summaries of the differences identified by the reviewers between the English and
Spanish versions of the test instructions are presented in Tables 42 and 43. These tables indicate
for which tests a difference was identified, the difference rating, which language group would be
favoured by the difference (if applicable), and a description of the difference detected. Table 42
presents this information for the identified differences in the instructions to the examiner, and
Table 43 presents this information for the identified differences in the instructions to the
examinee.
128
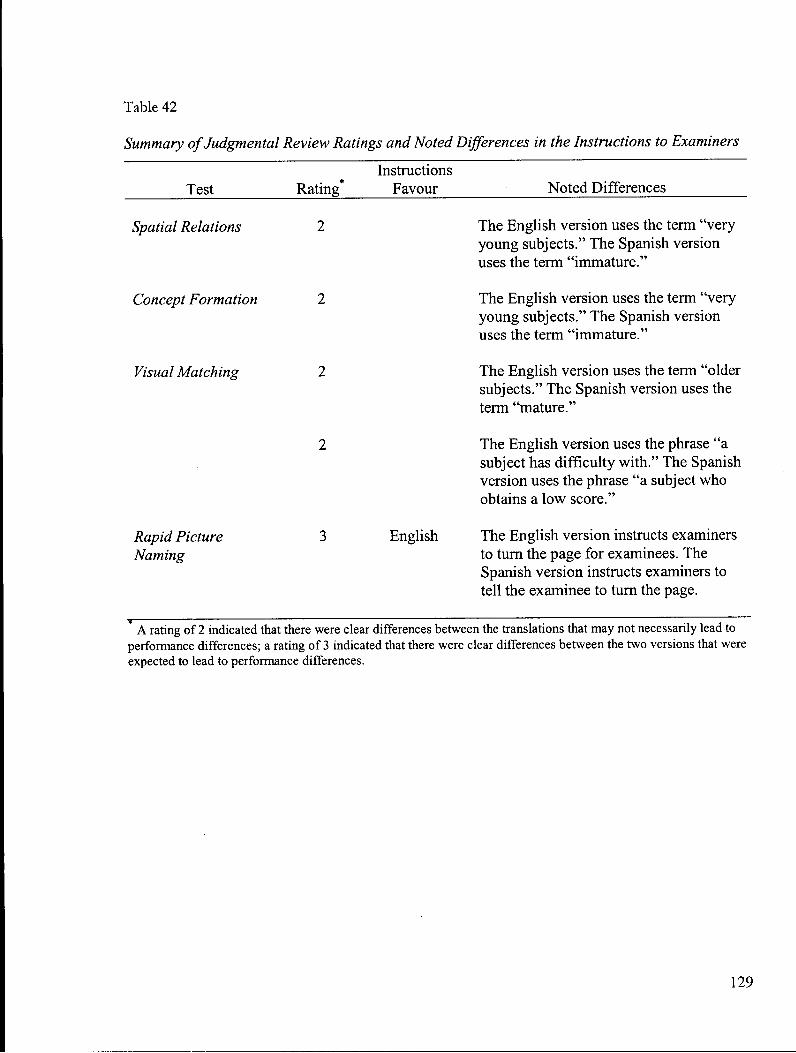
Table 42
Summary of Judgmental Review Ratings and Noted Differences in the Instructions to Examiners
Test Rating Instructions
Favour Noted Differences
Spatial Relations The English version uses the term "very young subjects." The Spanish version uses the term "immature."
Concept Formation
Visual Matching
The English version uses the term "very young subjects." The Spanish version uses the term "immature."
The English version uses the term "older subjects." The Spanish version uses the term "mature."
The English version uses the phrase "a subject has difficulty with." The Spanish version uses the phrase "a subject who obtains a low score."
Rapid Picture Naming
English The English version instructs examiners to turn the page for examinees. The Spanish version instructs examiners to tell the examinee to turn the page.
A rating of 2 indicated that there were clear differences between the translations that may not necessarily lead to performance differences; a rating of 3 indicated that there were clear differences between the two versions that were expected to lead to performance differences.
129
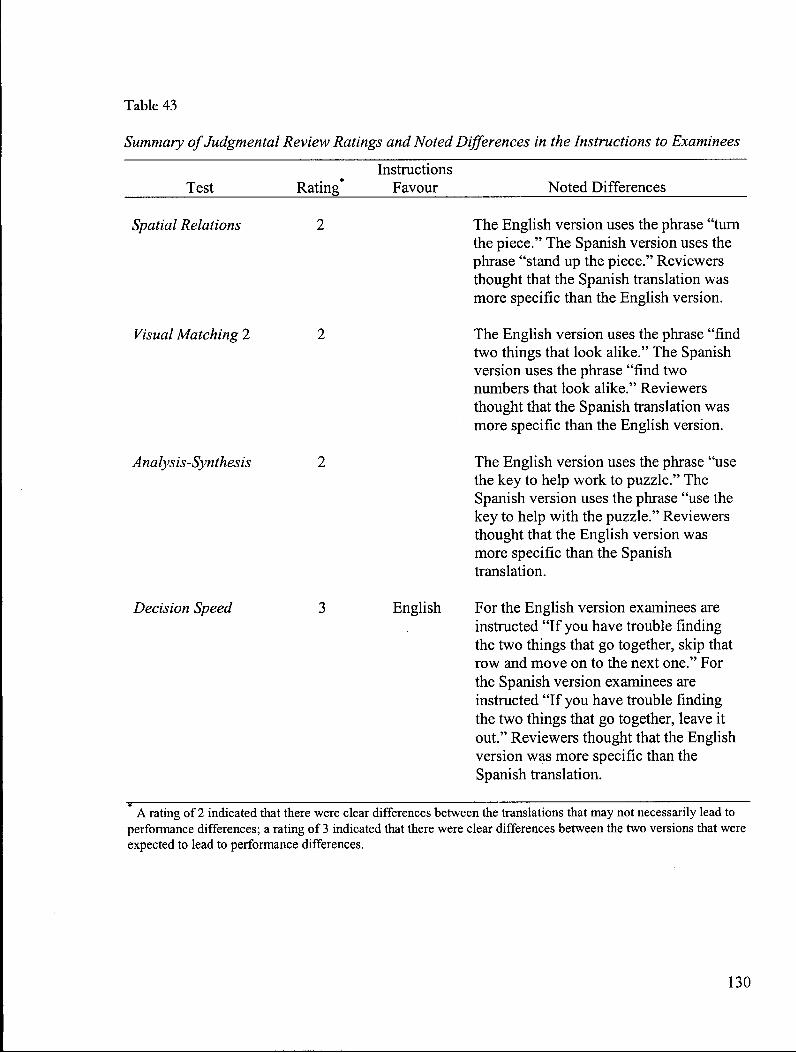
Table 43
Summary of Judgmental Review Ratings and Noted Differences in the Instructions to Examinees
Instructions Test Rating* Favour Noted Differences
Spatial Relations The English version uses the phrase "turn the piece." The Spanish version uses the phrase "stand up the piece." Reviewers thought that the Spanish translation was more specific than the English version.
Visual Matching 2 The English version uses the phrase "find two things that look alike." The Spanish version uses the phrase "find two numbers that look alike." Reviewers thought that the Spanish translation was more specific than the English version.
Analysis-Synthesis The English version uses the phrase "use the key to help work to puzzle." The Spanish version uses the phrase "use the key to help with the puzzle." Reviewers thought that the English version was more specific than the Spanish translation.
Decision Speed 3 English For the English version examinees are instructed "If you have trouble finding the two things that go together, skip that row and move on to the next one." For the Spanish version examinees are instructed "If you have trouble finding the two things that go together, leave it out." Reviewers thought that the English version was more specific than the Spanish translation. ^
A rating of 2 indicated that there were clear differences between the translations that may not necessarily lead to performance differences; a rating of 3 indicated that there were clear differences between the two versions that were expected to lead to performance differences.
130
CHAPTER V : DISCUSSION
Summary
This research study concerned the investigation of the construct comparability of the WJ
III COG and the Bateria III COG, which are the English and Spanish versions of the same
battery, respectively. These are measures of cognitive functioning that purport to be direct
counterparts of one another. The study examined the degree of comparability and sources of
incomparability of seven tests of cognitive ability that were translated from English to Spanish.
These tests were: Spatial Relations, Concept Formation, Visual Matching, Picture Recognition,
Analysis-Synthesis, Decision Speed, and Rapid Picture Naming. The purpose of the study was to
address the following questions:
1. Are the dimensionality and structure of each of the selected tests of the WJ III COG and
Bateria III C O G the same? Are tests within the two batteries measuring the same
constructs?
2. Are there specific items from the selected tests of the WJ III C O G and Bateria III COG
that function differentially for English- and Spanish-speaking examinees? Are there items
that are easier or more difficult for examinees from a particular language group (when
matched on ability)? Which items are they?
3. What are the sources of differences in constructs being assessed for the two language
groups? Are there item characteristics that might be associated with the differential
functioning of the items? Are there problems associated with translation of the items?
Answers to these questions contributed to evidence for determining the degree of
comparability of the inference based on the test scores from the two different language versions.
Between the two language versions of the tests, at the scale as well as the item level, the results
131

indicated that there were different levels of psychometric similarities and differences for some of
the seven tests. The summary of evidence related to each question is discussed below.
Research Question One
In order to assess whether there were differences in the dimensionality and structure of
each of the selected tests of the WJ III COG and Bateria III COG, exploratory factor analysis
was applied. Overall, the factor structures for each of the seven tests for both language versions
suggested that they were "essentially uni-dimensional"(Stout, 1990). That is, there is a primary
factor that accounts for a large proportion of the explained variance in every case. In terms of
the similarity of factor solutions between the two language versions, three out of the seven tests
(Spatial Relations, Concept Formation, and Analysis-Synthesis) had the same number of factors
for both languages. Further, for these three tests the congruence coefficients calculated indicated
that the factors were quite comparable (six out of seven factor comparisons were quite to very
comparable). This means that the constructs are represented and measured in a similar way for
the different language versions of each of these tests. For the remaining tests, while the number
of factors was different between the language versions, there similarities in the factor solutions.
For instance, the amount of variance accounted for by the primary factor for each test was
similar in both languages.
Two more general observations were made about the pattern of factor solutions. First,
the tests with the least amount of variance explained by the factor solutions were timed tests. For
each of the timed tests, items at the beginning and end had to be eliminated in order to complete
factor analysis. As a result, factor solutions are based on only a portion of test items. The fact
that there remains a large portion of variance unexplained by the factor solutions could indicate
that the critical information that is the crux of what these tasks were designed to measure has not
132
been captured. This finding was not surprising given the nature of these tasks, where the speed
with which one moves through the items is in large part what these tests measure, or at least what
separates those who do well from those who do poorly. Hence, by removing items from the end
of these tests critical information about an individual's performance is excluded in the analysis.
Were these items to be included in the factor analysis, the amount of variance accounted for and
the similarity of factor solutions for the different language versions would likely increase.
Second, the factor solutions appeared to be detecting test structure (for example, item
difficulty, ceiling or discontinue rules13, and a shift in task demands). That is, factors seemed to
differentiate between items at the beginning and end of the tests, with items at the beginning of
test being represented by one factor, and items at the end of the test being represented by another
factor. In some cases, the differentiation between early and late items coincided with a ceiling
or a discontinue rule. Thus, it may not be the difficulty of items related to test structure that the
factor solutions are detecting, but the point on the test where some examinees of certain ability or
with a particular score continue with more items, versus those for whom the test is terminated.
Further, some test items beyond the discontinue rule represent a cognitive shift in the task. For
instance, with Concept Formation, as the examinee moves through the test, he or she is required
to incorporate new information and change the cognitive method he or she has used to solve
problems in order to continue to respond correctly. This "cognitive shift" could also be what the
different factors are detecting. From these analyses, it cannot be determined whether it is item
difficulty, position in test, discontinue rules, or changes in the tasks, or something else entirely,
that is being represented by the factor solutions.
1 3 Ceiling rules are used to limit the number of items administered and eliminate those items that
are deemed to be too difficult for the subject.
133

Research Question Two
A series of IRT related analyses were completed to determine whether there were specific
items from the selected tests of the WJ III COG and Bateria III C O G that functioned
differentially for the English- and Spanish-speaking examinees. These analyses included DEF,
examination of differences between item information functions, and an examination of the
correlations between item parameters for the different language versions of the selected tests.
The ERT analyses were limited to three tests: Spatial Relations, Concept Formation, and
Analysis-Synthesis. Data characteristics, such as item difficulty, variance in response patterns for
items, and missing data were all considered in the selection and exclusion of tests for this set of
analyses. That is, items that were very easy (more than 95% of examinees responded correctly)
did not have enough variance in responses to accurately estimate parameters. Items that were
difficult were typically administered to only a small portion of the examinees, those with higher
ability levels, which meant that for the rest of the sample response information was considered
missing (this study used only legitimate, intentional responses in the item estimation process).
The Spatial Relations test had the greatest number of DEF items (six out of seven items),
which were evenly split between the language versions in terms of which population the items
favoured. This means that there were three items that were easier for the English-speaking
examinees than the Spanish-speaking examinees and three items for which the opposite was true.
While the data characteristics limited the analysis to 7 of the 12 items that were common
between the two language versions of this test, this is a large number of DIF items (58%) to be
identified for one test. Concept Formation had two DIF items and Analysis-Synthesis had 1 DEF
item, all of which favoured the English language group. These DEF items represented a smaller
134

proportion of the number of items than in the case of Spatial Relations, 16% and 5% for Concept
Formation and Analysis-Synthesis, respectively.
The examination of item information functions provided more evidence about the
comparability of items between the two language versions. This examination indicated the
degree of measurement accuracy provided by the test items for different ability levels. For the
two tests for which this set of analysis was completed, Concept Formation and Analysis-
Synthesis, the results suggested that for both language versions the items in the middle of the test
have larger amounts of information than those at the beginning or end. In other words, both
language versions of these tests measured examinees more accurately by items placed near the
middle of these two tests, which also corresponded to items of medium difficulty. For both tests
there were specific instances where items displayed very different degrees of measurement
accuracy for the two language versions. For Concept Formation, these items showed a higher
degree of measurement accuracy for the Spanish version, and for Analysis-Synthesis the opposite
was true; items had a higher degree of measurement accuracy for the English version. This
means that there are some differences in how well some items are measuring the construct
between the two language versions. These item level differences will impact how well the
construct is being measured overall. Large differences in how well the construct is measured,
will lead to differences in the degree to which the inferences based on scores from the different
language versions are comparable.
The IRT parameter comparisons indicated some discrepancies between constructs for the
two language versions. If the correlations between the discrimination parameters are low, then
there is a large difference between how items are ordered by discrimination between the two
language versions. Consistent with the pattern of results from the DIF analyses, the most notable
135
differences were with the Spatial Relations test; it had the lowest correlation between the
discrimination parameters. The correlations between the discrimination parameters for Concept
Formation and Analysis-Synthesis were higher, and indicated similarity between the constructs
measured by the two language versions of these tests.
Together, this set of item level analyses demonstrated that there exists a difference
between the two language versions at the item level for Spatial Relations test, whereas, Concept
Formation and Analysis-Synthesis demonstrated a better degree of comparability.
Research Question Three
A qualitative examination of the English and Spanish versions of the test items and their
instructions to examinees was completed to identify the sources of differences in constructs
being assessed by the two language versions of the test. Typically, the results of a judgmental
review are intended to identify potential reasons for DIF items. For this study the review was
expanded to include all test instructions and items as another piece of evidence about the degree
of comparability of the translated tests of the WJ III COG and Bateria III COG.
The judgmental review found that there were no differences in the items between the two
language versions of the tests. At the outset of the review process, the reviewers were instructed
to look for differences between the presentation or graphic representation of the items, but also to
examine pictures or objects for differences in familiarity (e.g., a picture of a phone that would be
unfamiliar to someone from a Spanish speaking country). This research study examined only
translated tests, in which the items remained exactly the same, and only the directions were
translated from English to Spanish. As such, it is not surprising that the reviewers did not find
any differences between the items for the two language versions of these tests, nor did they find
136

any differences related to objects or pictures being more familiar or common to one language
than the other.
With respect to the instructions between the two language versions of tests, the
judgmental review found very few differences in relation to the amount of material that was
reviewed (i.e., all the material associated with the seven tests). Of the differences identified,
there were only two instances in which reviewers thought that these differences would lead to
differences in performance between the two groups. In each instance, the differences identified
related to the instructions provided to the examinee. For example, with Rapid Picture Naming
the Bateria III C O G examiners are instructed to tell the examinee to turn the page when they
reach the end, whereas the WJ III C O G examiners are instructed to just turn the page for the
examinee. For Decision Speed, the reviewers felt that the instructions relating to what to do i f
you have trouble answering an item were more specific in the English test version. In both cases
the reviewers thought that the differences favoured the English-speaking examinees. The
differences that reviewers highlighted related to the timely completion of the tests, important
factors given that both these tests are timed. Anything that may slow down the progress of
examinees through items has the potential to impact their obtained score. None of the
differences that were identified by the judgmental reviewers provided a sound explanation of the
causes of the previously identified DIP items.
Degree of Comparability
The purpose of this study was to examine selected tests of the WJ III COG and Bateria III
COG in order to provide information about the degree of equivalence and comparability of
scores. This project was based on Messick's (1989a; 1989b; 1995) unitary notion of validity in
137
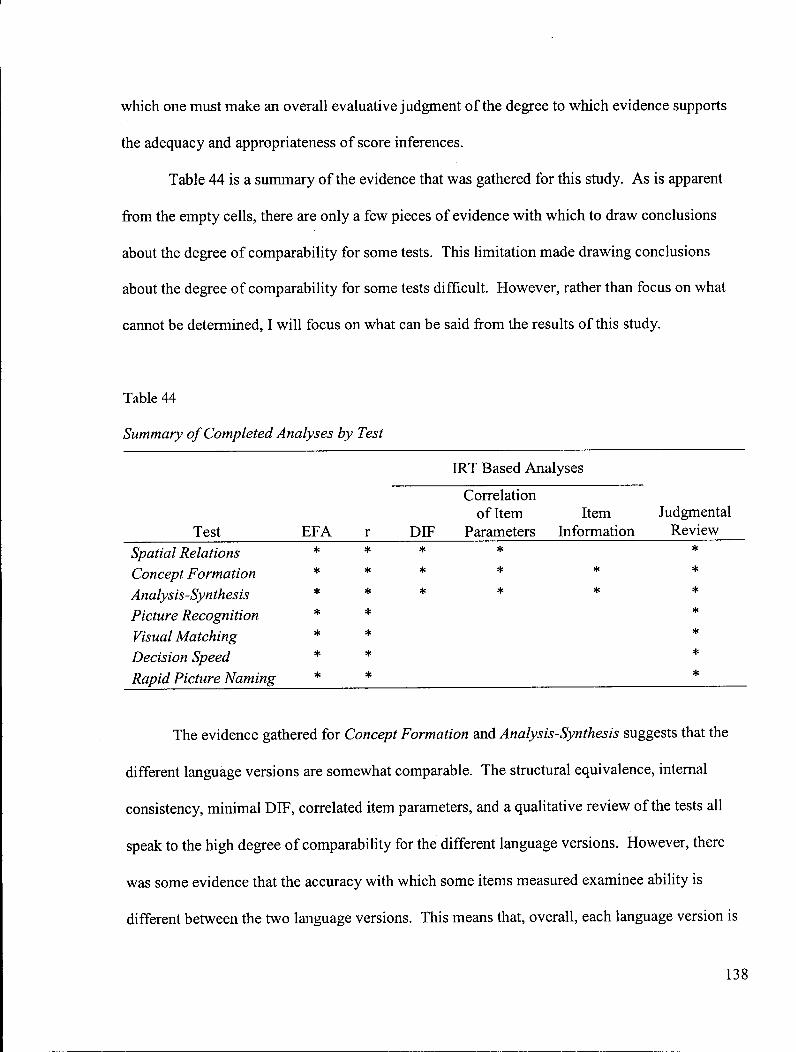
which one must make an overall evaluative judgment of the degree to which evidence supports
the adequacy and appropriateness of score inferences.
Table 44 is a summary of the evidence that was gathered for this study. As is apparent
from the empty cells, there are only a few pieces of evidence with which to draw conclusions
about the degree of comparability for some tests. This limitation made drawing conclusions
about the degree of comparability for some tests difficult. However, rather than focus on what
cannot be determined, I will focus on what can be said from the results of this study.
Table 44
Summary of Completed Analyses by Test
IRT Based Analyses
Correlation of Item Item Judgmental
Test E F A r DIF Parameters Information Review Spatial Relations * * * * * Concept Formation * * * * * * Analysis-Synthesis * * * * * * Picture Recognition * * * Visual Matching * * * Decision Speed * * * Rapid Picture Naming * * *
The evidence gathered for Concept Formation and Analysis-Synthesis suggests that the
different language versions are somewhat comparable. The structural equivalence, internal
consistency, minimal DIF, correlated item parameters, and a qualitative review of the tests all
speak to the high degree of comparability for the different language versions. However, there
was some evidence that the accuracy with which some items measured examinee ability is
different between the two language versions. This means that, overall, each language version is
138

measuring the same construct, with similar accuracy, and that there is a good translation of the
instructions. Together, the gathered evidence suggested that there is a high degree of
comparability between the English and Spanish version of Concept Formation and Analysis-
Synthesis, indicating that inferences based on scores from these two versions are comparable.
The evidence related to Spatial Relations was interesting. There were differences
between the scale and item level results and how they support the degree of comparability of the
inferences based on the scores from the different language versions of this test. That is, the
factor analytic results indicated structural equivalence between the two language versions,
suggesting that the construct is represented and measured the same way by both language
versions of this test. This result is not surprising when you consider that this test is designed to
measure a narrow ability, and that each item contributes to the assessment of that ability.
However, structural equivalence is necessary, but not sufficient when demonstrating the degree
of comparability for two tests. Analysis of the item level data revealed a relatively high number
of DIF items and relatively low item parameter correlations, indicating that there are differences
between how examinees and the items interact for the two language versions. These item level
results put the degree of comparability for the English and Spanish version of this test into
question, and evidence from this study suggested that the inferences based on scores from these
two versions are not comparable.
Conclusions about the degree of comparability of the two language versions for the other
tests (i.e., Picture Recognition, Visual Matching, Decision Speed, and Rapid Picture Naming)
remain in question because the limited scope of analyses. While a Judgmental Review is
typically used to discover the source of DIF, for these four tests, they became one of the only
pieces of evidence of comparability across the language versions. The judgmental review
139

process revealed only minimal differences in the item instructions for the two language versions,
and in fact, both reviewers felt that all the tests were translated well. This was not surprising
given the long history of the WJ III (and its predecessors) and the diligent translation process that
was undertaken for the development of the Bateria III. However, a judgmental review is not
sufficient to determine comparability. To supplement a judgmental review process, statistical
techniques that are able to identify non-equivalent test items than may not be readily detected
when using judgmental review are necessary to determine the degree of comparability
(Hambleton, in press).
Integration of Findings
Contrary to other researchers in the area of test translation and adaptation who have
found relatively large number of DIF items (e.g., Allalouf et al., 1999; Ercikan, 1999; Ercikan &
McCreith, 2002; Gierl, Rogers, & Klinger, 1999; Gierl & Khaliq, 2001), overall there were
relatively few DIF items found for the comparisons made in this study. There are several factors
that could have contributed to the low number of DIF items. First, the translation and history of
these batteries makes them unique. The test authors' commitment to developing and establishing
a quality instrument was apparent. The validation process was driven by the same theoretical
underpinnings and industry standards that drove the present study (i.e., the work of Messick
(1989a; 1989b; 1995), and the criteria outlined by the Standards (AERA et al., 1999). Second,
this study moved beyond group administered achievement type tests, and examined tests of
cognitive ability and focused on tests that were translated and not adapted. The implications of
these characteristics are that the onus of understanding an item has been somewhat removed for
examinees. That is, the nature of cognitive ability tests are that they are more oral and pictoral
than typical achievement tests, and that instructions are presented to the examinee by an
140

examiner, rather than the examinee having to read each particular question. Compared to group
administered achievement tests, the amount of text presented to an examinee and the amount of
text that needs translated or adapted is limited, particularly for the cognitive tests included in this
study. It is possible that the results may appear different for the tests not examined in the present
study. For those tests, the English version was adapted into Spanish, rather than translated, and
adjustments to content were made because of cultural and language considerations (i.e., for a
vocabulary test, word frequency may be different between the two languages). Because of this,
more differences for the different versions of those tests may have manifested because there have
been more alterations made to the item and test content. As a result the impact on psychometric
similarities between the two language versions of those tests may be greater than for the tests that
were the focus of this study.
Implications
The results of this study have several implications related to decisions about and the
methods used to establish the degree of comparability of the WJ III and Bateria III, most of
which centre around the results related to Spatial Relations.
As stated above, the results for Spatial Relations indicated that six out of seven items
were identified as DIP. For these items the pattern of responses is different for English- and
Spanish-speaking examinees, and means that the language of administration impacts the
performance of individuals. Together with the other pieces of evidence, it was determined that
the degree of comparability of the inferences based on the different language versions of this test
is low. As such, the use of these non-equivalent tests will lead to interpretation errors and faulty
conclusions. For instance, i f the consequences based on the respective scores are the same,
141
whether that is a decision about an appropriate intervention or educational classification, and the
scores are incomparable, the decision for one group is going to be inappropriate.
The results for Spatial Relations also bring to light methodological issues related to
equating and DIF detection procedures. With respect to equating, it is critical that items selected
to link the Bateria III to the WJ III meet some basic criteria. That is, the items that are used in
the linking have similar measurement accuracy for both language versions and are DIF free. The
DEF results for Spatial Relations indicated that a large number of the items that were used to
equate the language versions of this test displayed DEF. Further, Spatial Relations was the only
test in which there was a large difference between the internal consistency of scores for the two
language versions. A test form that produces a score with a low reliability estimates will not be
adequately equated (Embretson, 1999). Hence, the use of DEF items, and items which produce a
score with low reliability, are problematic for the equating process, and as a result, the US
English-speaking norms for the Spanish-speaking examinees for this test should not be used.
A large number of DIF items within a test also presents a problem for DIF detection
procedures. Specifically, the L H DIF procedure used an internal matching criterion as a measure
of ability, on which the two language groups are then matched and item response patterns are
compared. The internal matching criterion is based on sum of the number of correct items within
the test. In the case when there are a large number of DEF items present, the total score calculated
on the basis of these DEF items and the other non-DEF items within the test is likely going to be
distorted. This is referred to as contamination of the criterion (Camilli, 1993). A strategy that
has been proposed to address this issue is the use of an iterative DEF procedure. The first stage
of an iterative DIF detection identifies potential DEF items, which are then removed from the
computation of the criterion. This new criterion is then used to detect DEF items. Using a two-
142

stage DEF detection methods has been shown to flag different items as DEF, and that differences
are related to the amount of DEF found in the first stage (Zenisky, Hambleton, & Robin, 2003).
As such, further investigation of Spatial Relations, as well as other test in which there is a large
number of DEF items should use a two-stage DEF detection method.
The results from Concept Formation and Analysis-Synthesis with respect to the
measurement accuracy of items have implications for equating and test construction. The
examination of the amount of information that items measured by the different language versions
of these tests revealed that there are items that vary in their precision for measuring ability for
the two language versions. The more information measured by an item, the more accurate the
estimate of ability. If items have different degrees of measurement accuracy for the different
language versions and are used in the equating process, the transformation of ability estimates
will not be accurate. That is, even i f the difficulty of the items for the two versions have been
equated, the amount of information at different score levels may be different and may be
associated with measurement error.
With respect to test construction, and specifically ceiling rules, it is imperative that items
located around the ceiling(s) of the test are informative for both language versions of the test so
that the decision to discontinue the presentation of items is based on an accurate estimate of
ability. Bias may enter if, for one language version, there is more information, and therefore
more accurate ability estimates. It is possible that for some examinees, a poor estimate of their
ability around a ceiling could lead to premature discontinuation of a test, and therefore
underestimate their ability.
143

Implications for Practitioners
The Bateria III was developed so that test users would be able to measure cognitive
ability of Spanish individuals in their first language. The intention was that the inferences based
on the scores from this test would be more appropriate than to assess these abilities in English,
their second language. However, i f the comparability of the inferences based on the scores of the
Bateria and WJ III is not demonstrated, then the problems that a Spanish test version was
intended to resolve remain. That is, the consequences based on the respective scores may not be
the same for the two language groups. For example, educational programming or intervention
designs that are contingent on the pattern of results from these tests may be applied
inappropriately. The Standards (AERA et al., 1999) clearly articulate that it is the test
developers responsibility to provide "empirical and logical evidence for score reliability and the
validity of the translated test's score inferences for the intended uses" (p. 99), as well as report
evidence that "the different language versions measure equivalent or similar constructs, and that
the score reliability and the validity of inferences from scores form the two versions are
comparable" (p. 99). The results from this study suggest that inferences based on scores from
Concept Formation and Analysis-Synthesis are somewhat comparable, and practitioners can
treat, interpret, and compare scores for these test as such. However, with respect to Spatial
Relations, at this time there is not enough evidence to suggest that inferences based on the scores
from the WJ III COG and Bateria-III COG are comparable, and practitioners should not treat
them as such. The use of this non-equivalent test will lead to interpretation errors and faulty
conclusions about these two groups. For instance, practitioners use scores to make decisions
about an individual's strengths and weaknesses, appropriate interventions, and special education
placements. Presumably, these decisions are going to be the same for scores from the WJ III
144

COG and Bateria III COG. So, if these scores are assumed to be comparable when they are not,
then decisions for one group are going to be inappropriate. In terms of the remaining tests, until
research has demonstrated the comparability of the two language versions, practitioners should
be cautioned not to treat them as comparable.
Limitations
There were several limitations to this study, a number of which are related to the data
characteristics associated with the tests used. Salient features of the data that were problematic
included large amounts of missing data, a lack of variability for a number of easy items, and the
use of different scoring schemes (binary and multiple level scoring) for both language versions.
These test characteristics limited the scope of analyses as well as creating methodological
problems, each of which is described in more detail below.
The amount of missing data was a major hurdle in this study. The extent of missing data
impacted the scope of analyses, as well as the methods and associated software applications.
The missing data in this study can be characterized as questions that were not administered, or
items that were not reached by individuals. A number of the tests used in this study used ceiling
or discontinue rules to limit administration time, as well as minimize frustrations or
discouragement of the examines by attempting to answer questions too difficult for them, as is
typical with cognitive ability and individually administered achievement tests. Specifically,
because of the amount of missing data, a large set of items were excluded from the factor
analysis and DEF analysis, thereby limiting the conclusions with respect to these items or the
tests they are associated with. Furthermore, the missing data in these data sets eliminated
potential software packages that could have been used as a second DIF detection method (so as
to verify items flagged as DEF). While the strategy employed in this study was to use only
145

legitimate, intentional responses in the item estimation process (Ludlow & O'Leary, 1999), the
extent to which there was missing data for the more difficult items on some tests may have
impacted the accuracy with which items at the end of some tests were calibrated because these
items are were only administered to higher-ability examinees and therefore are based on fewer
responses.
Similar to the missing data issue, the lack of variability for a number of easy items
impacted the scope of analyses for this study. That is, the lack of variability for easy items often
led to their exclusion from analyses again restricting the scope of analyses and the items included
in these analyses. Hence, the conclusions and information about the various tests in this study is
only based on a portion of the data. Further, because the items have been excluded there is no
information about the degree of comparability of these items between the two language versions
available.
The polytomous data for the various items and tests limited the statistical software with
which I could appropriately actualize the analyses. For example, some software packages
claimed to handle polytomous data, but by that they meant a key could be used to then impose
dichotomous scoring, thereby losing all the information contained for the multiple levels of
scores. To illustrate, by scoring an item where the possible score ranges from 0 to 4 into right
and wrong (0 or 1), the variability in scores when an item is partially correct (obtaining a 1, 2, or
3) is lost. This, in addition to the extent of missing data, made the use of another DIF detection
procedure (and the accompanying software) to verify DIF items problematic. That is, i f the
necessary modifications to the data were made in order to complete a secondary set of DIF
analyses, the data would have arbitrary characteristics, thereby making it a different data set that
the one the initial analyses were completed on. As a result, a second method would not be a
146
verification of the first set of analyses because the data would be different between the sets of
analyses.
Lastly, while there are a number of pieces of evidence gathered in order to make a
summative judgment about the comparability of the inferences based on these test scores, the
results from this study did not address all the important issues related to validity. Demonstrating
the predicative nature of these scores, or how comparable the other tests of cognitive ability on
these batteries are, or to what extent these tests are comparable for other sub-groups, whether
that be different age groups, or different countries of origin (recall that the calibration sample for
the Bateria III represents a large number of Spanish-speaking countries) are important aspects of
validity that need further investigation. These types of investigations are also important for the
construct comparability research area as a whole.
Contributions of Findings to Literature
There exist a number of guidelines that speak to the need to look at the comparability of
translated tests (e.g., the Standards (AERA et al., 1999), Principles for Fair Student Assessment
Practices for Education in Canada (1993), and the Guidelines for Adapting Educational and
Psychological Tests (summarized by van de Vijver & Hambleton, 1996). This study is an
example of the type of research that is supported and requested by these documents in order to
demonstrate the validity and comparability, or lack of it, for translated tests. In this way this
study contributed to the body of work on construct comparability, which is in the early stages of
development, as well as moves it forward by investigating a cognitive rather than achievement
type of assessment tool. Further, this study began the necessary research required to support or
oppose the validity of the score inferences made from the WJ III and Bateria III. It is important
that test developers establish that the constructs measured by these instruments exist in all sub-
147

groups of the populations of interest, that they are measured in the same manner in all groups,
and that items that are thought to be equivalent across languages are linguistically and
statistically equivalent (Sireci & Allalouf, 2003).
The methodological issues encountered in this study relate mainly to the limitations based
on the data characteristics of these cognitive ability tests. The problematic features of the data
(including, large amounts of missing data, a lack of variability for easy items, and the use of
different scoring schemes) are in large part related to the nature of these tests. That is, cognitive
ability tests are designed to measure ability over a large age range, items are ordered from very
easy to very difficult, and in some cases processing speed is the targeted ability (i.e., timed tests).
The tests that presented the most methodological challenges were the timed tests. Perhaps, the
methodologies used in this study, and other construct comparability research is not suited for
these types of tests. In the same way that new methodologies have been developed to examine
sets of items that are locally dependent (i.e., violate the assumption of local item dependence
(LED) through the use of testlets (e.g., Yen, 1993), perhaps innovative approaches to investigate
the comparability of timed tests should be pursued.
Future Directions
There are a number of different areas of research related to construct comparability
research and the measures that were the focus of this study that deserve further study. First,
while this study marks the beginning of the investigation required in order to determine the
comparability of tests from the WJ III COG and the Bateria-III COG, the investigation must
continue. Determining the degree of comparability for other tests is still an important empirical
question that should be investigated and answered. In order to overcome some of the limitations,
listed previously, of this study, continuing the investigation of the degree of comparability of the
148
WJ III COG and Bateria-III COG there are two possible approaches; (a) continuing with the
existing data, or (b) collect new data. For the first approach, in order to overcome some of the
limitations of this study, specifically the limited variability of item scores and large amounts of
missing data for items at the end of some tests, two strategies could be employed. The first
strategy would be to look at narrower age ranges. By narrowing the age range, the amount of
variability in item scores should increase. For instance, by examining only the data for those
aged 9 to 14 years of age, the proportion of individuals to respond correctly to items at the
beginning of the test would likely decrease, thereby increasing the variability in item scores, and
hence make it possible for them to be included in analyses. A codicil to this type of investigation
may be the discovery that the degree of comparability fluctuates depending on age group. This
approach may, however, come with its own set of limitations. By using smaller age ranges
sample sizes are going to decrease, which will jeopardize parameter estimation, as well as
decrease power (the probability of correctly rejecting the null hypothesis).
The second approach for continuing this research is really a hypothetical one. If, as
researcher I could have designed the data collection for use with this study what would I have
been done differently? First and foremost, data collection would sample a broad ability
distribution, that is a more rectangular shape instead of a bell shaped distribution. Having a
broader ability range would increase the number of people administered items at the beginning of
tests who responded incorrectly, increasing the variability in scores for these items. Further, it
would increase the number of people administered items at the at the end of tests, decreasing the
proportion of missing data for these items. Further, I would have all items published in both
language versions administered to the different language samples. This would overcome the
problem associated with Spatial Relations for which there were only 12 common items because
149

for the English sample, only these 12 were administered during standardization. In this way,
analyses could speak to the comparability of all items, as well as provide the test developers
information with which they could use to select the best items for linking the tests.
This study examined the differences between the item response patterns for individuals
administered the two different language versions of selected tests of the WJ III COG and the
Bateria III COG. Another important program of research to be investigated with these measures
is the degree of comparability and validity of inferences of scores based on the use of US norms
for individuals administered the Bateria III COG. Specifically, derived scores (i.e., scaled scores,
age-equivalents, etc.) for individuals administered the Bateria III COG are calculated using the
US norms of the WJ III COG, which are based on a US nationally representative standardization
sample. This is accomplished by using a calibration sample to determine the empirical difficulty
of the Bateria III COG items and then rescaling them to the empirical difficulty of the English
counterparts of the WJ III COG. Given the diligence that was paid to making the items and
instructions of the Bateria III appropriate for the Spanish-speaking world (Woodcock et al., in
press-a), it seems reasonable to presume that this test will be administered to individuals outside
of the US. As such, is it appropriate to derive norm-referenced scores for these individuals based
on a US standardization sample? Would having a standardization sample based on a
representative sample of Spanish-speakers from countries outside the US that will use this
assessment make a difference? Even the WJIII Technical Manual states "the validity of a test's
norms depends on the degree to which the norming sample represents the population that the
subject's test results will be compared to" (McGrew & Woodcock, 2001, p. 17). The purpose of
a calibration sample is to calibrate item parameters, and may not meet the standards of
representativeness that is the aim of a standardization sample. Hence, the degree of
150
comparability between an English-speaking standardization sample and a Spanish-speaking
calibration sample, versus the degree of comparability between an English-speaking
standardization sample and a Spanish-speaking standardization sample may be different, and is
an empirical question.
Another potential area for further research would be to investigate the differences that
were detected in this study for Spatial Relations further. What happens to the pattern of DIF
when an iterative DIF detection procedure is used? If DIF is still evident, a more thorough
investigation into the causes of this DIF is warranted. While the reviewers used in this study did
not indicate they thought there were differences between the two language versions of this test,
perhaps a larger, more experienced panel with test translation would. Further, the use of think-
aloud protocols may provide information about how the different language groups process items
for this tests. Reviews such as these may discover causes of DIF. Then, with the sources of DIF
identified, it may be possible to revise these items (or instructions), thereby making them viable
to use. The identification and revision of DIF items can be more economical than rebuilding the
test with new items, and has been done successfully by other researchers (e.g., Allalouf, 2003).
Other interesting avenues for investigation are related to item information. This study
used the 2PPC model to estimate parameters. This model includes parameter estimates that
describe an items difficulty as well as how well it discriminates between examinees at different
ability levels. The Rasch model uses only a difficulty parameter, and as such it has been
demonstrated that there is a loss of item information (Sykes & Yen, 2000). It would be
interesting to pursue whether there is indeed a loss of item information when the Rasch model is
used to estimate parameters, and whether there are more or less instances of differences in the
degree of measurement accuracy between the two languages.
151
Results from cognitive ability tests continue to play an important role, as a singular
source of information, for making life altering decisions about children's schooling and
education. Therefore, it is important to expect these tests to meet the highest ethical and
psychometric requirements. This study moved us one step closer to addressing and investigating
these requirements with the hopes that more steps are made in the future.
152

REFERENCES
Allalouf, A . (2003). Revising Translated Differential Item Functioning Items as a Tool for
Improving Cross-Lingual Assessment [Electronic version]. Applied Measurement in
Education, 16, 55-73.
Allalouf, A. , Hambleton, R. K. , & Sireci, S. G. (1999). Identifying the causes of DIF in
translated verbal items. Journal of Educational Measurement, 36, 185-198.
Alvarado, C. G. (1999). A broad cognitive ability-bilingual scale for the WJ-R Tests of Cognitive
Ability and the Bateria Woodcock-Munoz: Pruebas de habilidad cognitive - Revisada
(Research Report No. 2). Itasca, IL: Riverside Publishing.
American Educational Research Association, American Psychological Association, National
Council on Measurement in Education, & Joint Committee on Standards for Educational
and Psychological Testing (U.S.). (1999). Standards for educational and psychological
testing. Washington, DC: American Educational Research Association.
American Psychological Association. (2002). Ethical Principles of Psychologists and Code of
Conduct. American Psychologist, 57, 1060-1073.
American Psychological Association. (2001). Publication manual of the American Psychology
Association (5th ed.). Washington, DC: Author.
Anastasi, A. , & Urbina, S. (1997). Psychological Testing (7th ed.). Upper Saddle River; NJ:
Prentice-Hall.
Bock, R. D. (1972). Estimating item parameters and latent ability when responses are scored in
two or more nominal categories. Psychometrika, 37, 29-51.
Bock, R. D., Gibbons, R., & Muraki, E. (1988). Full-Information Item Factor Analysis. Applied
Psychological Measurement, 12, 261-281.
153
Brislin, R. W., Lonner, W., & Thordike, R. M . (1973). Cross-cultural research methods. New
York: Wiley.
Burket, G. R. (1993). F L U X [Computer software]. Monterey, C A : CTB/McGraw-Hill.
Burket, G. R. (1998). P A R D U X (Version 4.01) [Computer software]. Monterey, CA:
CTB/McGraw-Hill.
Camilli, G. (1993). The case against item bias detection techniques based on internal criteria: Do
item bias procedures obscure test fairness issues? In P. W. Holland & H. Wainer (Eds.),
Differential item functioning (pp. 397-413). Hillsdale, NJ: Lawrence Erlbaum Associates,
Inc.
Canadian Psychological Association. (1987). Guidelines for educational and psychological
testing. Ottawa, ON: Author. Retrieved May 21, 2004, from
http://www.acposb.on.ca/test.htm.
Carroll, J. B. (1983). The difficulty of a test and its factor composition revisited. In S. Messick
(Ed.), Principals of modern psychological measurement (pp. 215-282). Hillsdale, N.J.:
Lawrence Erlbaum Associates.
Carroll, J. B. (1997). The three-stratum theory of cognitive abilities. In D. P. Flanagan, J. L.
Genshaft & P. L . Harrison (Eds.), Contemporary intellectual assessment: Theories, tests
and issues (pp. 122-130). New York, N Y : The Guilford Press.
Cattell, R. B. (1966). The scree test for the number of factors. Multivariate Behavioral Research,
I, 245-276.
Crocker, L. , & Algina, J. (1986). Introduction to Classical and Modern Test Theory. Toronto,
ON, Canada: Harcourt Brace Jovanovich.
154

Divgi, D. R. (1986). Does the Rasch model really work for multiple choice items? Not if you
look closely. Journal of Educational Measurement, 23, 283-298.
Embretson, S. E. (1999). Issues in the measurement of cognitive abilities. In S. E. Embretson &
S. L. Hershberger (Eds.), The new rules of measurement: What every psychologist and
educator should know (pp. 263). Mahwah, NJ: Erlbaum.
Ercikan, K . (1998). Translation effects in international assessment. International Journal of
Educational Research, 29, 543-553.
Ercikan, K. (2002). Disentangling sources of differential item functioning in multilanguage
assessments [Electronic version]. International Journal of Testing, 2, 199-215.
Ercikan, K. , Gierl, M . J., McCreith, T., Puhan, G., & Koh, K . (in press). Comparability of
bilingual versions of assessments: Sources of incomparability of English and French
versions of Canada's national achievement tests. Applied Measurement in Education.
Ercikan, K. , & McCreith, T. (2002). Effects of adaptations on comparability of test items. In D.
Robitaille & A. Beaton (Eds.), Secondary Analysis of TIMSS Results (pp. 391-405).
Dordrecht The Netherlands: Kluwer Academic Publisher.
Ercikan, K. , Schwarz, R. D., Julian, M . W., Burket, G. R., Weber, M . M . , & Link, V . (1998).
Calibration and scoring of tests with multiple-choice and constructed-response item
types. Journal of Educational Measurement, 35, 137-154.
Fitzpatrick, A . R., Link, V . B., Yen, W. M . , Burket, G. R., Ito, K. , & Sykes, R. C. (1996).
Scaling performance assessments: A comparison of one-parameter and two-parameter
partial credit models. Journal of Educational Measurement, 33, 291-314.
Flanagan, D. P., Andrews, T. J., & Genshaft, J. L. (1997). The functional utility of intelligence
tests with special education populations. In P. L. Harrison (Ed.), Contemporary
155

Intellectual Assessment: Theories, Tests and Issues (pp. 457-483). New York, N Y : The
Guilford Press.
Geisinger, K . F. (1994). Cross-Cultural Normative Assessment: Translation and Adaptation
Issues Influencing the Normative Interpretation of Assessment Instruments.
Psychological Assessment, 6, 304-312.
Gierl, M . J., & Khaliq, S. N . (2001). Identifying sources of differential item and bundle
functioning on translated achievement tests: a confirmatory analysis. Journal of
Educational Measurement, 38, 164-187.
Gierl, M . J., Rogers, W. T., & Klinger, D. (1999, April). Using statistical and judgmental
reviews to identify and interpret translation DIF, Paper presented at the annual meeting
of the National Council on Measurement in Education, Montreal, Quebec, Canada.
Hair, J. F., Jr., Anderson, R. E., Tatham, R. L., & Black, W. C. (1998). Multivariable Data
Analyses (5th ed.). Upper Saddle River, NJ: Prentice-Hall, Inc.
Hambleton, R. K . (1989). Principles and selected applications of item response theory. In R. L.
Linn (Ed.), Educational measurement (3rd ed., pp. 147-200). New York, N Y : Macmillan.
Hambleton, R. K . (1994). Guidelines for adapting educational and psychological tests: A
progress report. European Journal of Psychological Assessment, 10, 229-244.
Hambleton, R. K . (2001). The Next Generation of the ITC Test Translation and Adaptation
Guidelines [Electronic version]. European Journal of Psychological Assessment, 17, 164-
172.
Hambleton, R. K . (2002). Adapting achievement tests into multiple languages for international
assessments. In A. C. Porter & A. Gamoran (Eds.), Methodological advances in cross-
156

national surveys of educational achievement (pp. 58-79). Washington, DC: National
Academy Press.
Hambleton, R. K . (in press). Issues, designs, and technical guidelines for adapting tests in
multiple languages and cultures. In R. K. Hambleton, P. F. Merenda & C. D. Spielberger
(Eds.), Adapting Educational and Psychological Tests for Cross-Cultural Assessment.
Hillsdale, NJ: Lawrence Erlbaum.
Hambleton, R. K. , & Patsula, L. (1998). Adapting tests for use in multiple languages and cultures
[Electronic Version]. Social Indicators Research, 45, 153-171.
Hambleton, R. K. , Swaminathan, H. , & Rogers, H . J. (1991). Fundamentals of Item Response
Theory. Newbury Park, DA: Sage.
Harman, H . H . (1976). Modern factor analysis. (2 ed.). Chicago: IL: University Chicago Press.
Holland, P. W., & Thayer, D. T. (1988). Differential item performance and the Mantel-Haenszel
procedures. In H . Wainer & H. Braun (Eds.), Test Validity (pp. 129-145). Hillsdale, NJ:
Lawrence Erlbaum Associates, Inc.
Horn, J. L., & Cattell, R. B. (1966). Refinement of the theory of fluid and crystallized general
intelligences. Journal of Educational Psychology, 57, 253-270.
Hulin, C. L. (1987). A psychometric theory of evaluations of item and scale translations: Fidelity
across languages. Journal of Cross-Cultural Psychology, 18, 115-142.
Individuals with Disabilities Act. (1990). Public Law 101-476, § 1401.
Joint Committee on Testing Practices. (1988). Code of fair testing practices in education.
Washington, DC: Author.
Kim, J., & Mueller, C. W. (1978). Factor analysis: Statistical methods and practical issues.
Beverley Hills, Calif.: Sage Publications.
157

Lee, L . - M . P., & Lam, Y . R. (1988). Confirmatory factor analyses of the Wechsler Intelligence
Scale for Children-Revised and the Hong Kong-Wechsler Intelligence Scale for Children.
Educational and Psychological Measurement, 48, 895-903.
Linn, R. L. , & Harnisch, D. L. (1981). Interactions between item content and group membership
on achievement test items. Journal of Educational Measurement, 18, 109-118.
Lord, F. M . (1980). Applications of item response theory to practical testing problems. Hillsdale,
NJ: Erlbaum.
Ludlow, L. H. , & O'Leary, M . (1999). Scoring omitted and not-reached items: Practical data
analysis implications. Educational and Psychological Measurement, 59, 615-630.
Martin, M . O., & Kelly, D. L. (1996). Third International Mathematics and Science Study
technical report. Volume 1: Design and development. Chestnut Hi l l , M A : International
Association for the Evaluation of Educational Achievement (IEA). Boston College.
Mather, N . , & Woodcock, R. W. (2001). Examiner's Manual. Woodcock-Johnson III Tests of
Cognitive Abilities. Itasca, IL: Riverside Publishing.
McGrew, K . S., & Woodcock, R. W. (2001). Technical Manual. Woodcock-Johnson III. Itasca,
IL: Riverside Publishing.
Messick, S. (1989a). Meaning and values in test validation: The science and ethics of
assessment. Educational Researcher, 18, 5-11.
Messick, S. (1989b). Validity. In R. L. Linn (Ed.), Educational measurement (3rd ed., pp. 13-
103). New York, N Y : Macmillan.
Messick, S. (1995). Validity of psychological assessment: Validation of inferences from persons'
responses and performances as scientific inquiry into score meaning. American
Psychologist, 50, 741-749.
158

Muraki, E. (1992). A generalized partial credit model: Application of an E M algoritym. Applied
Psychological Measurement, 16, 159-176.
Muraki, E., & Engelhard, G., Jr. (1985). Full-Information Item Factor Anlaysis: Applications of
EAP scores. Applied Psychological Measurement, 9, 417-430.
Principles for Fair Student Assessment Practices for Education in Canada. (1993). Edmonton,
Alberta: Joint Advisory Committee. (Mailing Address: Joint Advisory Committee, Centre
for Research in Applied Measurement and Evaluation, 3-104 Education Building North,
University of Alberta, Edmonton, Alberta, T6G 2G5). Retrieved February 12, 2004, from
http://www.gecdsb.onxa/teacherinfo/AssessEval/researchArticles/principlesFair Assess.p
df.
Quails, A . L. (1995). Estimating the reliability of a test containing multiple item formats. Applied
Measurement in Education, 8(2), 111-120.
Rasch, G. (1960). Probabilistic models for some intelligence and attainment tests. Copenhagen:
Danish Institute for Educational Research.
Reschly, D. J., & Grimes, J. P. (2002). Best practices in intellectual assessment. In Best Practices
in School Psychology (4 ed., pp. 1337-1350). Bethesda, M D : NASP Publications.
Reynolds, C. R., Lowe, P. A. , & Saenz, A. L . (1999). The problem of bias in psychological
. assessment. In A . Thomas & J. Grimes (Eds.), Best Practices in School Psychology (Vol.
I l l , pp. 549-595). Bethesda, M L : National Association of School Psychologists.
Samejima, F. (1977). A use of the information function in tailored testing. Applied Psychological
Measurement, 1, 233-247.
159
Samuda, R. J. (1998). Cross-cultural assessment: Issues and alternatives. In R. J. Samuda, R.
Feuerstein, A . S. Kaufman, J. E. Lewis, R. J. Sternberg & Associates (Eds.), Advances in
cross-cultural assessment (pp. 1-19). Thousand Oaks, C A : Sage.
Scheuneman, J. D., & Oakland, T. (1998). High-stakes testing in education. In J. Sandoval, C.
Frisby, K . F. Geisinger, J. D. Scheuneman & J. R. Grenier (Eds.), Test Interpretation and
Diversity: Achieving Equity in Assessment (pp. 77-104). Washington, DC: American
Psychological Association.
Schrank, F. A. , Flanagan, D. P., Woodcock, R. W., & Mascolo, J. T. (2002). Essentials of WJIII
cognitive abilities assessment. New York, N Y : Wiley.
Shealy, R., & Stout, W. F. (1993). An item response theory model for test bias. Ln P. W. Holland
& H . Wainer (Eds.), Differential Item Functioning (pp. 197-239). Hillsdale, NJ:
Lawrence Erlbaum.
Sireci, S. G., & Allalouf, A . (2003). Appraising item equivalence across multiple languages and
cultures [Electronic version]. Language Testing, 20, 148-166.
Sireci, S. G., Bastari, B. , & Allalouf, A . (1998). Evaluating construct equivalence across tests
adapted for use across multiple languages. Paper presented at the American
Psychological Association (Division 5), San Francisco, CA.
Sireci, S. G., Xing, D., Bastari, B. , Allalouf, A. , & Fitzgerald, C. (1999). Evaluating construct
equivalence across tests adapted for use across multiple languages. Unpublished
manuscript, University of Massachusetts at Amherst.
Stout, W. F. (1990). A new item response theory modeling approach with applications to
unidimensionality assessment and ability estimation. Psychometrika, 55, 293-325.
160

Sykes, R. C , & Yen, W. M . (2000). The scaling of mixed-item-format tests with one-parameter
and two-parameter partial credit models. Educational and Psychological Measurement,
56, 779-790.
Traub, R. E. (1983). A priori considerations in choosing an item response model. In R. K .
Hambleton (Ed.), Applications of Item Response Theory (pp. 57-70). Vancouver, BC:
Educational Research Institute of British Columbia,
van de Vijver, F.J.R., & Hambleton, R. K. (1996). Translating Tests: Some Practical Guidelines.
European Psychologist, I, 89-99.
van de Vijver, F.J. R., & Leung, K . (1997). Methods and data analysis of comparative research.
In J. W. Berry, Y . H . Poortinga & J. Pandy (Eds.), Handbook of cross-cultural
psychology (2nd ed., Vol . 1, pp. 257-300). Needham Heights, M A : Allyn & Bacon.
Weitzman, R. A . (1996). The Rasch model plus guessing. Journal of Psychological Educational
Measurement, 33, 291-314.
Wilson, D. T., Wood, R., & Gibbons, R. (1991). TESTFACT: Test scoring, item statistics, and
item factor analysis [Computer software] (Version 4.0). Chicago, IL: Scientific Software.
Woodcock, R. W. (1999). What can Rasch-based scores convey about a person's test
performance? In S. E. Embretson & S. L. Hershberger (Eds.), The New Rules of
Measurement: What Every Psychologist and Educator should know (pp. 105-127).
Mahwah, NJ: Erlbaum.
Woodcock, R. W., McGrew, K . S., & Mather, N . (2001). Woodcock-Johnson III Tests of
Cognitive Abilities. Itasca, IL: Riverside Publishing.
Woodcock, R. W., & Munoz-Sandoval, A . F. (1993). A n IRT approach to cross-language test
equating. European Journal of Psychological Assessment, 9, 233-241.
161

Woodcock, R. W., Munoz-Sandoval, A . F., McGrew, K . S., Mather, N . , & Schrank, F. A . (in
press-a). Bateria III Technical Abstract. Itasca, IL: Riverside Publishing.
Woodcock, R. W., Munoz-Sandoval, A . F., McGrew, K. S., Mather, N . , & Schrank, F. A . (in
press-b). Bateria III Woodcock-Munoz: Pruebas de habilidad cognitive -Third Edition.
Itasca, IL: Riverside Publishing.
Yen, W. M . (1981). Using simulation results to choose a latent trait model. Applied
Psychological Measurement, 5, 245-262.
Yen, W. M . (1984). Effects of local item dependence on the fit and equating performance of the
three-parameter logistic model. Applied Psychological Measurement, 8, 125-145.
Yen, W. M . (1993). Scaling performance assessments: Strategies for managing local item
dependence. Journal of Educational Measurement, 30, 187-214.
Zenisky, A. L. , Hambleton, R. K. , & Robin, F. (2003). Detection of differential item functioning
in large-scale state assessments: A study evaluating a two-stage approach [Electronic
version]. Educational and Psychological Measurement, 63, 51-64.
162

Appendix A
Codes for the Sources of Translation Differences
1. Differences in cultural relevance.
When the relevance of item content to each culture differs.
Example: The content of a reading comprehension passage is more relevant to one
of the groups.
2. Changes in format.
Differences in punctuation, capitalization, item structure, typeface, and other
formatting usages that are likely to affect the performance for one group of
examinees.
Example: A word that appeared only in the stem of the English form was presented
in all four options of the French form thus representing a difference in item structure.
Example: A letter was located above the X-axis for all distractors in the French
form whereas two of the distractors in the English form had the letter below the X -
axis. The variation in the position of the letter might have led the English-speaking
examinees to think that it was relevant. In fact, the location of the letter was not
relevant in answering the item correctly.
3. Changes in content.
The meaning of the item changed in the translation.
163

Example: A word that has a single meaning was translated into a word that has
more than one meaning.
Example: An item dealing with computing number of kilograms of apples in each of
two boxes was stated simply and very clearly in the English form. In the French
form, the item instructed examinees to compute kilograms of apples in each one of
the two boxes. The word "boxes" in French is plural which might have caused some
confusion about whether they were supposed to add the amounts for each box.
Omissions or additions that affect meaning.
Omissions or additions of words, phrases, or expressions that affect meaning and are
likely to affect the performance for one group of examinees.
Example: The English form of an item contained the expression "this number
written in standard form''' while the French form had the phrase "ce nombre est"
("this number is"); the idea of "standard form" is excluded from the French
translation.
Example: The English form of an item contained the word "different" in the phrase
"five different Celsius thermometers" while the French form omitted the word
"different" ("cinq thermometres").
Differences in verb tense.
Example: The word "reads" in the English item was translated into "a lues" in the
French item.
Differential frequency, difficulty or commonness of vocabulary.
164

The translation was accurate but some words became easier or more difficult.
Example: The word "pace" was used in the English item and was translated into
"pas" (step) in the French item. In this case, a very difficult word in the stem was
translated into a very simple word.
Example: The English item used the word "burns" while the French translation used
the word "combustion". The word "combustion" in French is not as common as the
word "burns" in English, and could have made the French version of the item more
difficult.
7. Exclusion or inappropriate translation of key words.
Key words are important vocabulary that provides information, or guides thinking
processes of examinees. Exclusion or inappropriate translation of these words can
lead to confusion or make the item easier or more difficult.
Example: The stem in the English form stated "whenever scientists carefully
measure any quantity many times, they expect that...". The answer is "most of the
measurements wil l be close but not exactly the same". In the French form, the stem
was translated as "when scientist measure the same quantity many times, they expect
that...". The word "same" in the French form could lead to the examinees to think
that this quantity was known and the answer should be that the scientists should get
the same amount every time.
8. Differences in information that guides the examinees' thinking processes.
Additional information can guide examinees' thinking processes.
165
Example: The English item asks "At what point will the reflection of the candle
appear to be?" In the French form, the item asks "En quell point l'image de la bougie
apparaitra-t-elle?" ("At which point will the image of the candle seem to appear to
be?") The French version provides more information by telling the examinees that
the reflection in the mirror may seem different than the actual objects. This
additional information could have made the item in the French version easier.
9. Differential length or complexity of sentences.
The translation was accurate but the sentences became easier or more difficult.
10. Differences in words, expressions, or sentence structure inherent to language and/or
culture.
Differences in words, expressions, or sentence structure of items that are inherent to
the language and/or culture and are likely to affect the performance for one group of
examinees.
Example: The English sentence "Most rollerbladers do not favour a helmet bylaw"
was translated into "La plupart des personnes qui ne font pas de patin a roulettes sont
pour un reglement municipal en faveur du port du casque protecteur" The expression
for "rollerbladers" ("personnes qui font patin a roulettes") and "helmet bylaw" ("un
reglement municipal du casque protecteur") differ dramatically between English and
French forms because "rollerblader" and "helmet bylaw" have no expression that is
directly parallel in French.
166

Example: An English item used a 12-hour clock using A M and P M while the
French translation uses a 24-hour clock. The 12- vs. the 24-hour clock represents an
English-French cultural difference.
Differences in words, expressions, or sentence structure not inherent to language and/or
culture.
Differences in words, expressions, or sentence structure of items that are not inherent
to the language and/or culture and are likely to affect the performance for one group
of examinees.
Example: The English phrase "basic needs met" versus the French phrase "les
services offerts" focuses on "needs" in English and "services" in French.
Example: The English phrase "traditional way of life" versus the French phrase "les
traditions" present two distinct concepts surrounding "a way of life" and "traditions"
in the English and French forms, respectively.
Example: The English phrase "animalpower" versus the French phrase "a I'aide
des animaux" present distinct concepts related to "the power of animals" and "the
help of or aid by animal in the English and French forms, respectively.
In all three examples, alternative phrases would produce items that were closer in
meaning across the two languages. Hence, these differences are not inherent to the
languages unlike the examples in source #10.
167
12. Free feel to add other possible sources of difference:
168

Appendix B
Judgmental Review Sample Worksheet
13
3 O >. ca
Xi.
•8
ao a
g-
U
ta
u •3 a o M u< O
co. >
o J 3
CD
* 00 a
T3 O
? a 5 £
o Z
a o > o
a-cu CD
x> bO
•B a
s u e
=3 r,
CD 4-> CJ CD
& CD
O a
a1
•° « a co 2 a
> x o *> ? . O
'So
cu Z
CO « xi & a S
£ o to j£ •°. o box a "S c
if . 5 * CO CO CO o
a s cu a a a cj w g o
a g Xi ^
F --3
5 M C2
«5
& o CO
•a 1 3 CO
X co
u CD a
a u S o S o
u cn B §•
c 2 a & £ I CD £ ,
• ° co
1 I e £
. s i
'S a ' CD .s
s
cu
o >
a o
CO .a
O X
CO
r CD
SP S)
CD
u CD
XI <u cfl ca CD
CD CD
J3
a
a o 3
CD
O
co 4 2
« » £ X T O
U o
CO Pi
•5
o co co
J 3
CD T 3 O o CD •3
x> a « ;a .22 1 CD u. CO CD CO
•S3 <0 ft.
p
a
a
il&iii
mmm
X'
l i i l i
0)
xs CO
•1u!5«>1.
fr s > '-5
i S
ta 5 j : CJ
E g c«vJ
I tN f N O
I -
Seta g-SQ 111 Q vJ J2 u « c
O
o CJ
Q s = 1 0) O O 00
169

b i c
P i
m
111111 •
SlBlilili
suoipruisuj
170
Copyright © 2022 FDOKUMEN