Validation of the Orientation to Life Questionnaire in Norwegian Adolescents, Construct Validity...
18
1 23 Social Indicators Research An International and Interdisciplinary Journal for Quality-of-Life Measurement ISSN 0303-8300 Soc Indic Res DOI 10.1007/s11205-013-0536-z Validation of the Orientation to Life Questionnaire in Norwegian Adolescents, Construct Validity Across Samples Unni Karin Moksnes & Gørill Haugan
Transcript of Validation of the Orientation to Life Questionnaire in Norwegian Adolescents, Construct Validity...

1 23
Social Indicators ResearchAn International and InterdisciplinaryJournal for Quality-of-Life Measurement ISSN 0303-8300 Soc Indic ResDOI 10.1007/s11205-013-0536-z
Validation of the Orientation to LifeQuestionnaire in Norwegian Adolescents,Construct Validity Across Samples
Unni Karin Moksnes & Gørill Haugan

1 23
Your article is protected by copyright and all
rights are held exclusively by Springer Science
+Business Media Dordrecht. This e-offprint
is for personal use only and shall not be self-
archived in electronic repositories. If you wish
to self-archive your article, please use the
accepted manuscript version for posting on
your own website. You may further deposit
the accepted manuscript version in any
repository, provided it is only made publicly
available 12 months after official publication
or later and provided acknowledgement is
given to the original source of publication
and a link is inserted to the published article
on Springer's website. The link must be
accompanied by the following text: "The final
publication is available at link.springer.com”.

Validation of the Orientation to Life Questionnairein Norwegian Adolescents, Construct Validity AcrossSamples
Unni Karin Moksnes • Gørill Haugan
Accepted: 2 December 2013� Springer Science+Business Media Dordrecht 2013
Abstract In spite of the potential significance of sense of coherence (SOC) for adolescent
health and well-being, the past decades have yielded limited progress in investigating the
psychometric properties of the most used inventory measuring SOC, The Orientation of
Life Questionnaire (OLQ) in adolescents. The present study aimed at investigating the
factorial validity and reliability of the Norwegian version of the 13 item OLQ based on two
adolescent samples 13–18 years from Norway. Concerning the dimensionality of the OLQ,
two measurement models were tested using confirmatory factor analysis; a one-factor
model and a three-factor-model. The results showed that a three-factor solution with
correlated residual variances between item 2 and item 3 showed the best fit across the two
adolescent samples, although five items revealed low factor loadings. The dimensions were
highly correlated and showed adequate composite reliability. The present results indicate
that the 13 item OLQ has potential as an instrument assessing SOC in adolescents.
However, more psychometric testing of the instrument is required in reference to the
modified factor structure and the low reliability found on some of the items in OLQ.
Keywords Confirmatory factor analysis � Psychometric evaluation � Sense
of coherence � Adolescents
1 Introduction
The medical sociologist Aron Antonovsky introduced the theory of Salutogenesis which
focuses on what are the sources for people’s resources and capacity to create health
U. K. Moksnes � G. HauganFaculty of Nursing, Sør-Trøndelag University College, Trondheim, Norway
U. K. Moksnes (&) � G. HauganResearch Centre for Health Promotion and Resources, Mauritz Hansens gt 2, 7030 Trondheim, Norwaye-mail: [email protected]
123
Soc Indic ResDOI 10.1007/s11205-013-0536-z
Author's personal copy

(Salutogenesis) rather than the classic focus on risk, ill health and disease (Pathogenesis;
Antonovsky 1979, 1987). Antonovsky was interested in the explanation for why some
people, regardless of major stressful situations, manage to stay healthy and live good lives,
while others do not (Eriksson and Lindstrom 2005). He formulated the explanation in terms
of the key concepts sense of coherence (SOC) and general resistance resources (GRR)
(Antonovsky 1979; Eriksson 2007).
The first key concept SOC is defined as ‘‘a global orientation that expresses the extent to
which one has a pervasive, enduring though dynamic feeling of confidence that (1) the
stimuli deriving from one’s internal and external environments in the course of living are
structured, predictable, and explicable, (2) the resources are available to one to meet the
demands posed by these stimuli; and (3) these demands are challenges, worthy of
investment and engagement’’ (Antonovsky 1987, p. 19). These three components, termed
comprehensibility, manageability and meaningfulness are thought to be highly interrelated
but separable, forming the construct of SOC. Comprehensibility is a cognitive component
and refers to the degree to which individuals sense that information about themselves and
the social environment is not only understandable, but also ordered, structured, and con-
sistent. However, perceiving events as comprehensible does not mean that they are com-
pletely predictable. Manageability is an instrumental component and refers to the degree to
which individuals feel that available resources are sufficient to adequately cope with the
demands posed by internal and external stimuli. Meaningfulness is a motivational com-
ponent and refers to the extent to which individuals feel that certain areas of life are worthy
of time, effort, personal involvement and commitment (Antonovsky 1987; Eriksson 2007).
According to Antonovsky, the SOC concept reflects an individual resource and disposi-
tional orientation that enables the individual to reflect on its external and internal resources,
and resolve tension in a health-promoting way (Eriksson and Lindstrom 2006).
The other key concept in the salutogenic theory is the resources available to help one to
improve one’s state of health. Antonovsky defined the term general resistance resources
(GRR) as both material and non-material qualities that could be found within people,
bound to their person and capacity, but also to their immediate and distant environment
(Antonovsky 1987). An important point is not what resources are available but the ability
to use and re-use the different resources for intended purpose (Eriksson 2007). A person
with a strong SOC is able to mobilize GRR to promote effective coping. This resolves
tension in a health-promoting manner, and leads toward the salutary health end of the
health ease/dis-ease continuum (Eriksson and Lindstrom 2005; Nielsen and Hansson
2007).
A strong SOC is associated with good health, especially mental health and quality of life
in adult populations (Eriksson and Lindstrom 2006; Lindstrom and Eriksson 2010; Nilsson
et al. 2010). In contrast, far less is known about the role and nature of SOC during
childhood and adolescence, although these developmental stages are considered important
to the development of SOC (Lindstrom and Eriksson 2010; Rivera et al. 2012). However,
previous studies have shown that SOC is an important salutary resource in association with
different health outcomes and well-being in adolescents (Moksnes et al. 2012; Neuner et al.
2011; Nielsen and Hansson 2007; Simonsson et al. 2008; Oztekin and Tezer 2009). It can
therefore be no doubt that SOC constitutes an issue of importance to the broader under-
standing of adolescent health. Consequently, the availability of a valid and reliable
instrument to measure SOC in the adolescent population is required, since the source and
nature of adolescent SOC may be substantially different to how the construct is recognized
in adult populations.
U. K. Moksnes, G. Haugan
123
Author's personal copy

Antonovsky developed the Orientation to Life Questionnaire (OLQ) to operationalize
SOC. The questionnaire exists in two forms: a longer version consisting of 29 items and a
shortened 13 item form (Antonovsky 1987). These two questionnaires are the original ones
and the 13 item version was used for the present study. The OLQ has been translated and
used in at least 43 languages and seems to be a cross-culturally valid, reliable and feasible
instrument, especially in adult samples (Eriksson and Lindstrom 2005; Lindstrom and
Eriksson 2010).
According to Antonovsky (1993) the OLQ comprises one general factor of SOC with
three correlated components of comprehensibility (5 items), manageability (4 items), and
meaningfulness (4 items). However, previous studies have shown that the factor structure
of the scale is not completely clear and seems to measure a multidimensional rather than a
one-dimensional construct (Eriksson and Lindstrom 2005). Studies investigating the factor
structure of the OLQ based on exploratory and confirmatory approaches in adult and older
populations have shown support for a three-factor structure (Ding et al. 2011; Gana and
Garnier 2001), a second-order three factor structure (Ding et al. 2011; Feldt et al. 2007;
Naaldenberg et al. 2011; Richardson et al. 2007) and a one-factor structure (Hittner 2007).
Accordingly, the construct validity of the OLQ 13 does not seem to be clear in reference to
that different factor structures are evident in different populations. It may also be a
question whether the items included in the instrument adequately represent the construct of
SOC and that there may be variations in how the items are understood across different
cultures and age groups. Validations of the factor structure in adolescent populations are
less investigated, but previous studies have found support for a one-factor structure in a
sample of Swedish adolescents (Hagquist and Andrich 2004).
The 13 item OLQ scale has been reported to have internal consistency comparable to
the 29 item version with Cronbach’s alpha ranging between 0.70 and 0.92 (Eriksson and
Lindstrom 2005; Hittner 2007). The internal consistency of the 13 item OLQ are less
evident in adolescent samples, however, studies have reported Cronbach’s alpha values of
0.75 (Braun-Lewensohn and Sagy 2010), 0.82 (Rivera et al. 2012) and 0.86 (Nielsen and
Hansson 2007).
The present psychometric evaluation work is important in order to establish the utility
of an assessment tool aimed for use in adolescent populations, and to allow cross-national
recommendations with regard to the applicability, and broad usefulness of OLQ. Assess-
ment of SOC in adolescent populations is also important for evaluation of educational
programs designed to improve SOC, health and well-being among adolescents.
The aim of the present study was to test the factorial validity and reliability of the 13
item version of the OLQ. Based on theory of the dimensionality of SOC and previous
psychometric validations of the instrument, two hypothesized models of SOC were tested:
A one-factor model (Hagquist and Andrich 2004) and a three-factor model comprising
three correlated dimensions of comprehensibility, manageability and meaningfulness
(Ding et al. 2011; Gana and Garnier 2001).
2 Method
2.1 Participants
The first cross-sectional sample (sample 1) comes from a survey involving the participation
of six (three urban and three rural) public elementary and secondary schools in two
counties in Mid-Norway. A total of 1,229 questionnaires were distributed and the number
Validation of the Orientation to Life Questionnaire
123
Author's personal copy
of completed questionnaires which were returned was 1,209, giving an overall response
rate of 98.4 %; 617 (51.0 %) were girls and 586 (48.5 %) were boys (gender was not
identified for six of the participants). The age range of the sample in the present study was
13–18 years, and 26 subjects were excluded, leaving n = 1,183 cases in the analyses.
The second cross-sectional sample (sample 2) comes from a survey involving public
elementary and secondary schools in Mid-Norway. A total of 1,924 students were asked to
participate in the study and 1,289 completed questionnaires, giving a response rate of
67 %. Non responses were mainly due to students being absent when the questionnaire was
administered, or students who declined to answer the questionnaire. The age range of the
sample in the present study was 13–18 years, and the data analyses were therefore
undertaken for n = 1,239; 634 (51.2 %) were girls and 603 (48.7 %) were boys (gender
was not identified for two participants). The mean age for the entire sample was 15.00
(SD = 1.62); for boys 14.99 (SD = 1.63) and for girls 15.02 (SD = 1.63).
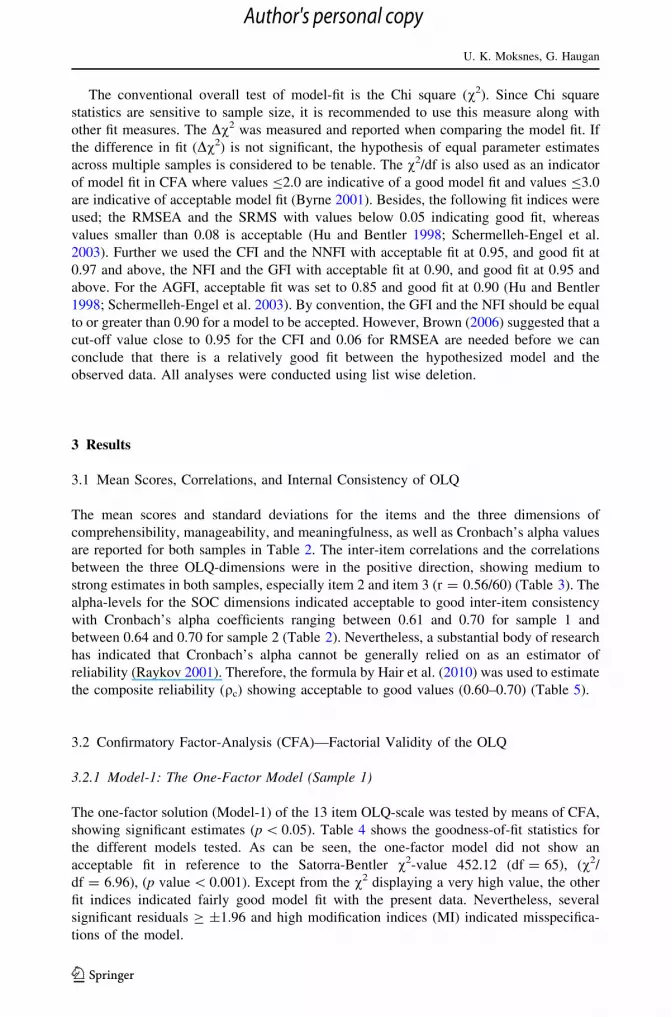
2.2 Procedure
The two data collections were approved by the regional committees for medical research
ethics (REK) and the Norwegian social science data services (NSD). The main author was
responsible for collecting the data for sample 1 and was partaking in the data collection for
sample 2. The project was funded by Sør-Trøndelag University College. The headmaster at
each school approved the content of the questionnaire prior to agreeing to participate in the
surveys.
In the data collection for sample 1, passive consent from the participants was found to
be sufficient because no personal identifying data were collected. Adolescents or their
parents responded only if they did not want their child to participate. As such, any ado-
lescent who did not have an active decline was eligible to be part in the study, which might
have increased the response rate. The adolescents and their parents received an information
letter which briefly explained the purpose of the study. Questionnaire administration was
completed in one section, in whole class groups during one regular school hour of 45 min.
The data were collected during September and October 2008.
In the data collection for sample 2, all the students and parents to students younger than
16 years received an information letter that briefly explained the purpose of the study.
According to research ethical guidelines, written consent was claimed from the participants
and from their parents when students were younger than 16 years old. Questionnaire
administration was completed in whole class groups, during one regular school period of
45 min. The data were collected during October and November 2011.
2.3 Measures
2.3.1 Sense of Coherence
Sense of coheren was assessed by means of a Norwegian 13 item version of the Orientation
to Life Questionnaire based on Antonovsky’s theory (Antonovsky 1987). The respondents
are requested to mark their response to each item on a seven-point scale with two
anchoring verbal responses, for example ‘‘very seldom or never’’ and ‘‘very often.’’ The
total sum ranges from 13 to 91 and higher score indicates a stronger SOC (Antonovsky
1979, 1987). The items included in the instrument are presented in Table 1.
U. K. Moksnes, G. Haugan
123
Author's personal copy

2.4 Statistical Analyses
Data were screened and analysed using the SPSS version 20.0 and Lisrel 8.8 for Windows.
The analyses were done in two steps; sample 1 was used as model sample to evaluate the
factor structure of the 13 item OLQ. In the second step, the procedure was repeated and the
same measurement models were tested in sample 2 in order to investigate the factorial
validity across samples. Mean scores and standard deviations were calculated on each item
and for the three dimensions of comprehensibility, manageability and meaningfulness.
Pearson product-moment correlation was used to test bivariate associations between the
items and the three dimensions. Internal consistency for each original dimension in both
samples was examined with Cronbach’s alpha. Reliability was further investigated in CFA
by means of composite reliability, where values C0.60 are acceptable whereas values
C0.70 are considered to be good (Bagozzi and Yi 1988; Hair Black Babib and Anderson
2010).
Confirmatory factor analysis (CFA) was used to test the factor structure of the OLQ.
Test of multivariate normality on both samples displayed significant skewness and kur-
tosis. Since the standard errors are estimated under non-normality, the Satorra-Bentler
scaled Chi square statistic was applied as a goodness-of-fit statistic which is the correct
asymptotic mean under non-normality. The models were tested using the sample asymp-
totic covariance matrix and robust maximum likelihood estimation (RML) (Brown 2006).
Altogether, two models were tested in this study: a one-factor model, and a three-factor-
model.
Table 1 Items included in the OLQ 13-item version
Item Item description
1 Do you have the feeling that you really don’t care about what is going on around you?
2 Has it happened in the past that you were surprised by the behaviour of people whom you thoughtyou knew well?
3 Has it happened that people whom you counted on disappointed you?
4 Until now your life has had: no clear goals or purpose at all …vs…. very clear goals and purpose
5 Do you have the feeling that you are being treated unfairly?
6 Do you have the feeling that you are in an unfamiliar situation and don’t know what to do?
7 Doing the things you do every day is… a source of deep pleasure and satisfaction vs… a source ofpain and boredom
8 Do you have very mixed-up feelings and ideas?
9 Does it happen that you have feelings inside you would rather not feel’?
10 Many people, even those with a strong character, sometimes feel like sad sacks (losers) incertain situations. How often have you felt this way in the past?
11 When something happened, have you generally found that…you overestimated orunderestimated its importance… vs…. you saw things in the right proportion?
12 How often do you have the feeling that there is little meaning in the things you do in your daily life?
13 How often do you have feelings that you are not sure you can keep under control?
Items 2,6,8,9,11 - ComprehensibilityItems 3,5,10,13 - ManageabilityItems 1,4,7,12 - Meaningfulness
Validation of the Orientation to Life Questionnaire
123
Author's personal copy
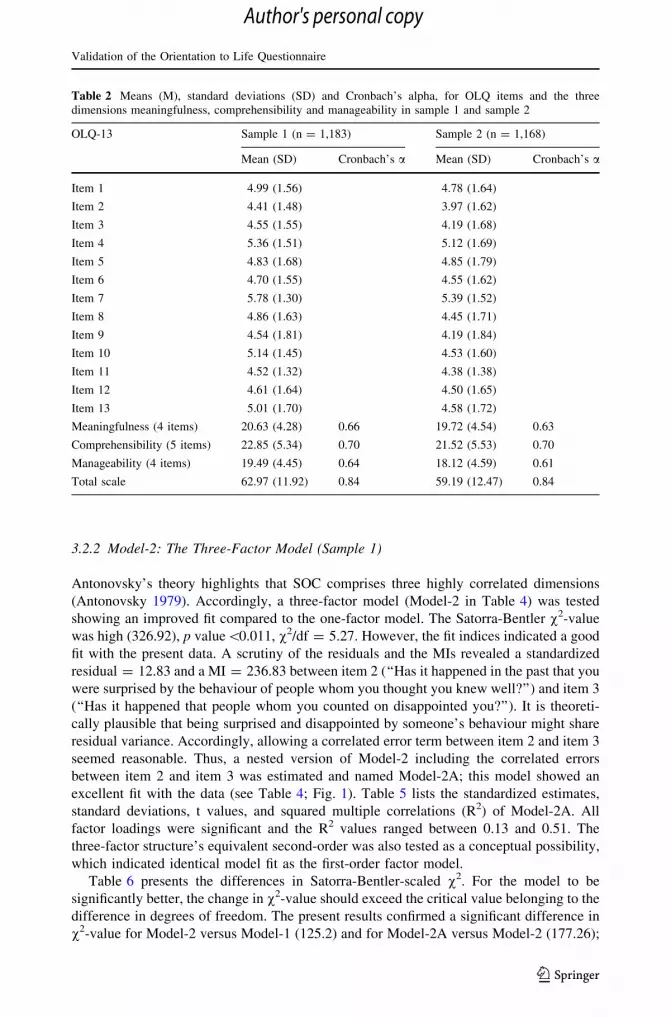
The conventional overall test of model-fit is the Chi square (v2). Since Chi square
statistics are sensitive to sample size, it is recommended to use this measure along with
other fit measures. The Dv2 was measured and reported when comparing the model fit. If
the difference in fit (Dv2) is not significant, the hypothesis of equal parameter estimates
across multiple samples is considered to be tenable. The v2/df is also used as an indicator
of model fit in CFA where values B2.0 are indicative of a good model fit and values B3.0
are indicative of acceptable model fit (Byrne 2001). Besides, the following fit indices were
used; the RMSEA and the SRMS with values below 0.05 indicating good fit, whereas
values smaller than 0.08 is acceptable (Hu and Bentler 1998; Schermelleh-Engel et al.
2003). Further we used the CFI and the NNFI with acceptable fit at 0.95, and good fit at
0.97 and above, the NFI and the GFI with acceptable fit at 0.90, and good fit at 0.95 and
above. For the AGFI, acceptable fit was set to 0.85 and good fit at 0.90 (Hu and Bentler
1998; Schermelleh-Engel et al. 2003). By convention, the GFI and the NFI should be equal
to or greater than 0.90 for a model to be accepted. However, Brown (2006) suggested that a
cut-off value close to 0.95 for the CFI and 0.06 for RMSEA are needed before we can
conclude that there is a relatively good fit between the hypothesized model and the
observed data. All analyses were conducted using list wise deletion.
3 Results
3.1 Mean Scores, Correlations, and Internal Consistency of OLQ
The mean scores and standard deviations for the items and the three dimensions of
comprehensibility, manageability, and meaningfulness, as well as Cronbach’s alpha values
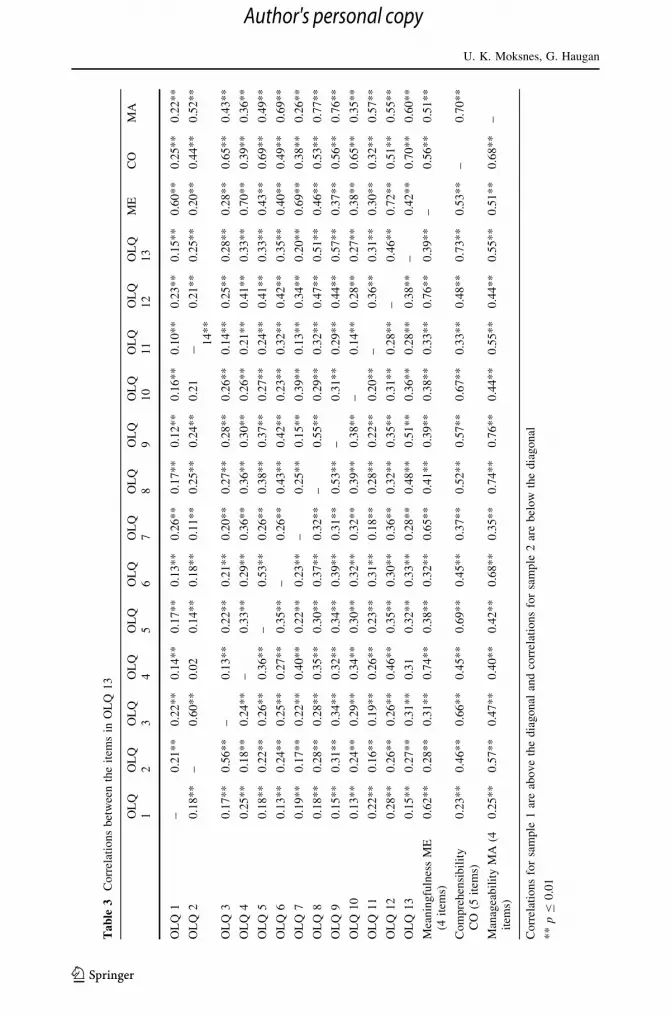
are reported for both samples in Table 2. The inter-item correlations and the correlations
between the three OLQ-dimensions were in the positive direction, showing medium to
strong estimates in both samples, especially item 2 and item 3 (r = 0.56/60) (Table 3). The
alpha-levels for the SOC dimensions indicated acceptable to good inter-item consistency
with Cronbach’s alpha coefficients ranging between 0.61 and 0.70 for sample 1 and
between 0.64 and 0.70 for sample 2 (Table 2). Nevertheless, a substantial body of research
has indicated that Cronbach’s alpha cannot be generally relied on as an estimator of
reliability (Raykov 2001). Therefore, the formula by Hair et al. (2010) was used to estimate
the composite reliability (qc) showing acceptable to good values (0.60–0.70) (Table 5).
3.2 Confirmatory Factor-Analysis (CFA)—Factorial Validity of the OLQ
3.2.1 Model-1: The One-Factor Model (Sample 1)
The one-factor solution (Model-1) of the 13 item OLQ-scale was tested by means of CFA,
showing significant estimates (p \ 0.05). Table 4 shows the goodness-of-fit statistics for
the different models tested. As can be seen, the one-factor model did not show an
acceptable fit in reference to the Satorra-Bentler v2-value 452.12 (df = 65), (v2/
df = 6.96), (p value \ 0.001). Except from the v2 displaying a very high value, the other
fit indices indicated fairly good model fit with the present data. Nevertheless, several
significant residuals C ±1.96 and high modification indices (MI) indicated misspecifica-
tions of the model.
U. K. Moksnes, G. Haugan
123
Author's personal copy
3.2.2 Model-2: The Three-Factor Model (Sample 1)
Antonovsky’s theory highlights that SOC comprises three highly correlated dimensions
(Antonovsky 1979). Accordingly, a three-factor model (Model-2 in Table 4) was tested
showing an improved fit compared to the one-factor model. The Satorra-Bentler v2-value
was high (326.92), p value\0.011, v2/df = 5.27. However, the fit indices indicated a good
fit with the present data. A scrutiny of the residuals and the MIs revealed a standardized
residual = 12.83 and a MI = 236.83 between item 2 (‘‘Has it happened in the past that you
were surprised by the behaviour of people whom you thought you knew well?’’) and item 3
(‘‘Has it happened that people whom you counted on disappointed you?’’). It is theoreti-
cally plausible that being surprised and disappointed by someone’s behaviour might share
residual variance. Accordingly, allowing a correlated error term between item 2 and item 3
seemed reasonable. Thus, a nested version of Model-2 including the correlated errors
between item 2 and item 3 was estimated and named Model-2A; this model showed an
excellent fit with the data (see Table 4; Fig. 1). Table 5 lists the standardized estimates,
standard deviations, t values, and squared multiple correlations (R2) of Model-2A. All
factor loadings were significant and the R2 values ranged between 0.13 and 0.51. The
three-factor structure’s equivalent second-order was also tested as a conceptual possibility,
which indicated identical model fit as the first-order factor model.
Table 6 presents the differences in Satorra-Bentler-scaled v2. For the model to be
significantly better, the change in v2-value should exceed the critical value belonging to the
difference in degrees of freedom. The present results confirmed a significant difference in
v2-value for Model-2 versus Model-1 (125.2) and for Model-2A versus Model-2 (177.26);
Table 2 Means (M), standard deviations (SD) and Cronbach’s alpha, for OLQ items and the threedimensions meaningfulness, comprehensibility and manageability in sample 1 and sample 2
OLQ-13 Sample 1 (n = 1,183) Sample 2 (n = 1,168)
Mean (SD) Cronbach’s a Mean (SD) Cronbach’s a
Item 1 4.99 (1.56) 4.78 (1.64)
Item 2 4.41 (1.48) 3.97 (1.62)
Item 3 4.55 (1.55) 4.19 (1.68)
Item 4 5.36 (1.51) 5.12 (1.69)
Item 5 4.83 (1.68) 4.85 (1.79)
Item 6 4.70 (1.55) 4.55 (1.62)
Item 7 5.78 (1.30) 5.39 (1.52)
Item 8 4.86 (1.63) 4.45 (1.71)
Item 9 4.54 (1.81) 4.19 (1.84)
Item 10 5.14 (1.45) 4.53 (1.60)
Item 11 4.52 (1.32) 4.38 (1.38)
Item 12 4.61 (1.64) 4.50 (1.65)
Item 13 5.01 (1.70) 4.58 (1.72)
Meaningfulness (4 items) 20.63 (4.28) 0.66 19.72 (4.54) 0.63
Comprehensibility (5 items) 22.85 (5.34) 0.70 21.52 (5.53) 0.70
Manageability (4 items) 19.49 (4.45) 0.64 18.12 (4.59) 0.61
Total scale 62.97 (11.92) 0.84 59.19 (12.47) 0.84
Validation of the Orientation to Life Questionnaire
123
Author's personal copy
Ta
ble
3C
orr
elat
ion
sb
etw
een
the
item
sin
OL
Q1
3
OL
Q1
OL
Q2
OL
Q3
OL
Q4
OL
Q5
OL
Q6
OL
Q7
OL
Q8
OL
Q9
OL
Q1
0O
LQ
11
OL
Q1
2O
LQ
13
ME
CO
MA
OL
Q1
–0
.21
**
0.2
2*
*0
.14
**
0.1
7*
*0
.13*
*0
.26*
*0
.17*
*0
.12*
*0
.16*
*0
.10*
*0
.23
**
0.1
5*
*0
.60
**
0.2
5*
*0
.22
**
OL
Q2
0.1
8*
*–
0.6
0*
*0
.02
0.1
4*
*0
.18*
*0
.11*
*0
.25*
*0
.24*
*0
.21
-1
4*
*0
.21
**
0.2
5*
*0
.20
**
0.4
4*
*0
.52
**
OL
Q3
0.1
7*
*0
.56
**
–0
.13
**
0.2
2*
*0
.21*
*0
.20*
*0
.27*
*0
.28*
*0
.26*
*0
.14*
*0
.25
**
0.2
8*
*0
.28
**
0.6
5*
*0
.43
**
OL
Q4
0.2
5*
*0
.18
**
0.2
4*
*–
0.3
3*
*0
.29*
*0
.36*
*0
.36*
*0
.30*
*0
.26*
*0
.21*
*0
.41
**
0.3
3*
*0
.70
**
0.3
9*
*0
.36
**
OL
Q5
0.1
8*
*0
.22
**
0.2
6*
*0
.36
**
–0
.53*
*0
.26*
*0
.38*
*0
.37*
*0
.27*
*0
.24*
*0
.41
**
0.3
3*
*0
.43
**
0.6
9*
*0
.49
**
OL
Q6
0.1
3*
*0
.24
**
0.2
5*
*0
.27
**
0.3
5*
*–
0.2
6*
*0
.43*
*0
.42*
*0
.23*
*0
.32*
*0
.42
**
0.3
5*
*0
.40
**
0.4
9*
*0
.69
**
OL
Q7
0.1
9*
*0
.17
**
0.2
2*
*0
.40
**
0.2
2*
*0
.23*
*–
0.2
5*
*0
.15*
*0
.39*
*0
.13*
*0
.34
**
0.2
0*
*0
.69
**
0.3
8*
*0
.26
**
OL
Q8
0.1
8*
*0
.28
**
0.2
8*
*0
.35
**
0.3
0*
*0
.37*
*0
.32*
*–
0.5
5*
*0
.29*
*0
.32*
*0
.47
**
0.5
1*
*0
.46
**
0.5
3*
*0
.77
**
OL
Q9
0.1
5*
*0
.31
**
0.3
4*
*0
.32
**
0.3
4*
*0
.39*
*0
.31*
*0
.53*
*–
0.3
1*
*0
.29*
*0
.44
**
0.5
7*
*0
.37
**
0.5
6*
*0
.76
**
OL
Q1
00
.13
**
0.2
4*
*0
.29
**
0.3
4*
*0
.30*
*0
.32*
*0
.32*
*0
.39*
*0
.38*
*–
0.1
4*
*0
.28
**
0.2
7*
*0
.38
**
0.6
5*
*0
.35
**
OL
Q1
10
.22
**
0.1
6*
*0
.19
**
0.2
6*
*0
.23*
*0
.31*
*0
.18*
*0
.28*
*0
.22*
*0
.20*
*–
0.3
6*
*0
.31
**
0.3
0*
*0
.32
**
0.5
7*
*
OL
Q1
20
.28
**
0.2
6*
*0
.26
**
0.4
6*
*0
.35*
*0
.30*
*0
.36*
*0
.32*
*0
.35*
*0
.31*
*0
.28*
*–
0.4
6*
*0
.72
**
0.5
1*
*0
.55
**
OL
Q1
30
.15
**
0.2
7*
*0
.31
**
0.3
10
.32*
*0
.33*
*0
.28*
*0
.48*
*0
.51*
*0
.36*
*0
.28*
*0
.38
**
–0
.42
**
0.7
0*
*0
.60
**
Mea
nin
gfu
lnes
sM
E(4
item
s)0
.62
**
0.2
8*
*0
.31
**
0.7
4*
*0
.38*
*0
.32*
*0
.65*
*0
.41*
*0
.39*
*0
.38*
*0
.33*
*0
.76
**
0.3
9*
*–
0.5
6*
*0
.51
**
Co
mpre
hen
sib
ilit
yC
O(5
item
s)0
.23
**
0.4
6*
*0
.66
**
0.4
5*
*0
.69*
*0
.45*
*0
.37*
*0
.52*
*0
.57*
*0
.67*
*0
.33*
*0
.48
**
0.7
3*
*0
.53
**
–0
.70
**
Man
agea
bil
ity
MA
(4it
ems)
0.2
5*
*0
.57
**
0.4
7*
*0
.40
**
0.4
2*
*0
.68*
*0
.35*
*0
.74*
*0
.76*
*0
.44*
*0
.55*
*0
.44
**
0.5
5*
*0
.51
**
0.6
8*
*–
Corr
elat
ions
for
sam
ple
1ar
eab
ove
the
dia
gonal
and
corr
elat
ions
for
sam
ple
2ar
ebel
ow
the
dia
gonal
**
pB
0.0
1
U. K. Moksnes, G. Haugan
123
Author's personal copy

Ta
ble
4G
oo
dnes
s-o
f-fi
tm
easu
res
for
Mo
del
-1,
Mo
del
-2an
dM
od
el-2
A
Fit
mea
sure
Mo
del
-1N
=1
,183
1-f
acto
rR
ML
13
var
iab
les
Sa
mp
le1
Mo
del
-1N
=1
,168
1-f
acto
rR
ML
13
var
iab
les
Sa
mp
le2
Mo
del
-2N
=1
,183
3-f
acto
rR
ML
13
var
iab
les
Sa
mp
le1
Mo
del
-2N
=1
,168
3-f
acto
rR
ML
13
var
iab
les
Sa
mp
le2
Mo
del
-2A
N=
1,1
83
3-f
acto
rR
ML
13
var
iab
les
Sa
mp
le1
Mo
del
-2A
N=
1,0
68
3-f
acto
rR
ML
13
var
iab
les
Sa
mp
le2
v2(S
atorr
a-B
entl
er)
452.1
2790.3
4326.9
2716.1
7149.6
6398.5
8
p-v
alue
\0
.00
1\
0.0
01
\0
.00
1\
0.0
01
\0
.001
\0
.001
Df
65
65
62
62
61
61
v2/D
f6
.96
12
.16
5.2
71
1.5
52
.45
6.5
3
RM
SE
A0
.074
0.0
98
0.0
62
0.9
50
.036
0.0
72
pv
alue
(clo
sefi
tte
st)
\0
.00
01
\0
.00
01
\0
.00
01
\0
.00
01
1.0
00
0.0
00
1
SR
MR
0.0
54
0.0
74
0.0
47
0.0
71
0.0
31
0.0
54
NF
I0
.94
0.9
10
.96
0.9
10
.98
0.9
5
NN
FI
0.9
40
.89
0.9
60
.90
0.9
80
.95
CF
I0
.95
0.9
10
.97
0.9
20
.99
0.9
6
GF
I0
.92
0.8
80
.94
0.8
90
.97
0.9
3
AG
FI
0.8
90
.84
0.9
20
.88
0.9
60
.90
RM
SE
Aro
ot
mea
nsq
uar
eer
ror
of
app
roxim
atio
n,
SR
MS
stan
dar
diz
edro
ot
mea
nsq
uar
ere
sid
ual
,N
FI
no
rmed
fit
ind
ex,
NN
FI
no
n-n
orm
edfi
tin
dex
,C
FI
the
com
par
ativ
efi
tin
dex
,G
FI
go
od
nes
s-o
f-fi
tin
dex
,A
GF
Iad
just
edg
oo
dn
ess-
of-
fit
ind
ex,
RM
Lro
bu
stm
axim
um
lik
elih
oo
d,
Df
deg
rees
of
free
dom
Validation of the Orientation to Life Questionnaire
123
Author's personal copy

all significant at the 0.001 % level. Thus, the null-hypotheses of equal fit for the models
were rejected indicating a significant better v2 for the three-factor-model than for the one-
factor-model.
3.2.3 Evaluation of the Models in Sample 2
As a next step we investigated Model-1, Model-2 and Model-2A in sample 2. These
analyses revealed the same pattern as disclosed by sample 1: the v2 and the fit indices
showed the best fit for Model-2A, Model-2 and Model-1, respectively. Thus, sample 2
supported the findings from sample 1 and the model fit of the three models tested are
presented in Table 4. However, items 1, 2, 3, 10, and 11 displayed low factor loadings and
R2 (Table 5), and a great amount of error variance and very high MIs between several pairs
of items were disclosed.
4 Discussion
The aim of the present study was to extend the understanding of the factorial validity and
reliability of the 13 item version of the OLQ in adolescents, using two samples with
Norwegian adolescents 13–18 years. The psychometric properties of the 13 item OLQ has
been scarcely investigated in adolescents and to the author’s knowledge, no validations
have been made on Norwegian adolescents. Based on theory of the dimensionality of SOC
and previous psychometric validations of the instrument (Feldt et al. 2007; Gana and
Garnier 2001; Hittner 2007; Naaldenberg et al. 2011), a one-factor model and a three-
factor model were evaluated.
Fig. 1 Model-2A, sample 1: three-factor-model of the orientation to life questionnaire (OLQ)
U. K. Moksnes, G. Haugan
123
Author's personal copy

Regarding dimensionality of the OLQ, the results of the CFA showed that the same
pattern of misspecifications was evident for the 13 item one-factor model (Model 1) in both
samples. An improved model fit was found for the three-factor model (Model 2), although
Table 5 Model-2A: Three-factor model including correlated errors between item 2 and item 3, t-values arebased on sample 1
Items Parameter Lisrel estimate t-value (sample 1) R2
Meaningfulness
OLQ 1 kx1,1 0.37 (0.30) 9.37*** 0.13 (0.09)
OLQ 4 kx4,1 0.68 (0.57) 19.55*** 0.46 (0.33)
OLQ 7 kx7,1 0.56 (0.47) 14.64*** 0.32 (0.22)
OLQ 12 kx12,1 0.68 (0.75) 21.65*** 0.47 (0.57)
Comprehensibility
OLQ 2 kx2,2 0.42 (0.32) 13.16*** 0.18 (0.10)
OLQ 6 kx6,2 0.56 (0.63) 18.06*** 0.31 (0.40)
OLQ 8 kx5,2 0.70 (0.73) 26.47*** 0.49 (0.53)
OLQ 9 kx9,2 0.72 (0.71) 29.18*** 0.51 (0.51)
OLQ 11 kx7,2 0.41 (0.45) 11.28*** 0.17 (0.21)
Manageability
OLQ 3 kx3,3 0.47 (0.38) 14.93*** 0.22 (0.15)
OLQ 5 kx5,3 0.54 (0.58) 18.19*** 0.29 (0.33)
OLQ10 kx10,3 0.57 (0.41) 17.86*** 0.32 (0.17)
OLQ 13 kx13,3 0.66 (0.67) 23.15*** 0.44 (0.45)
qc Meaningf. 4 items qc 0.67 (0.60) – –
qc Compreh. 5 items qc 0.70 (0.70) – –
qc Manageab.4 items qc 0.65 (0.60) – –
Standardized factor loadings, squared multiple correlations (R2) and Composite reliability
(qc ¼P
k2
Pkð Þ2þ
Phð Þ
� �based on sample 1 (sample 2)
*** p \ 0.001
Table 6 Statistical comparison and v2 difference test of Model-1, Model-2 and Model-2A based in sample1
v2 Dfd Diff v2 Model-1 Diff v2 Model-2 Diff v2 Model-2A
Models Sample 1
Model-1a 452.12 65 –
Model-2b 326.92 62 125.2*** –
Model-2Ac 149.66 61 302.46*** 177.26*** –
*** p \ 0.001a Model-1: The 1-factor-modelb Model-2: The 3-factor-modelc Model-2A: 3-factor-model including correlated errors between the items 2 and 3d Df Degrees of freedom
Validation of the Orientation to Life Questionnaire
123
Author's personal copy

the Chi square value was still high. Overall, the presence of misspecifications was evident
in reference to correlated error variances between items 2 and 3, indicating that they share
common sources of variance other than to their respective subscales. Thus, a nested version
of the three-factor model was evaluated, allowing a correlated error terms between item 2
and item 3, which resulted in good model fit in both samples (Model 2A). The three-factor
structure’s equivalent second-order factor model was also tested as a conceptual possi-
bility, which indicated similar model fit as the first-order factor model. The CFA also
showed that the components of comprehensibility, manageability and meaningfulness were
highly interrelated. Nevertheless, the Chi square difference test showed that the three-
factor structure was statistically superior the one-factor structure.
The decision of allowing correlated error variances between item 2 and item 3 was
based on statistical considerations, indicated by large Chi square values and residual
variances. It is a well-known problem that Chi square statistics are sensitive to sample size.
That is, as the sample size increases, the chances of rejecting a true model increase (Brown
2006; Byrne 2001). Meanwhile, correlated error variances between items should be con-
ducted only if it makes theoretically sense to do so. The presence of misspecifications was
evident in reference to correlated error variances between item 2: ‘‘Has it happened in the
past that you were surprised by the behavior of people whom you thought you knew well?’’
and item 3: ‘‘Has it happened that people whom you counted on disappointed you?.’’ The
items represent manifestations of an underlying interpersonal unpredictability, in reference
to being surprised and disappointed by people who you know well and account on. If you
know someone well it is also likely that you count on this person and that you will be both
surprised and disappointed if such a person let you down. Thus, allowing correlated errors
for item 2 and item 3 seemed theoretically meaningful. These findings are in line with other
studies which have concluded that especially item 2 and item 3 in the OLQ contributed to
model misspecifications in reference to semantic overlap in the items (Ding et al. 2011;
Hittner 2007; Naaldenberg et al. 2011; Richardson et al. 2007).
According to Antonovsky’s theory (1987), the structure of the SOC concept is one-
dimensional (a global orientation of life) consisting of three components of comprehen-
sibility, manageability and meaningfulness, all three closely correlated and considered as a
whole. A previous review (Eriksson and Lindstrom 2005) summing research on the OLQ
based on different adult populations concludes with that the OLQ dimensionality is
unclear, seeming to be multidimensional rather than one-dimensional. The results of the
present study are in line with Anotnovsky’s theory and previous validations of the 13 item
OLQ, supporting a three factor structure of the instrument, with highly correlated com-
ponents (Ding et al. 2011; Feldt et al. 2007; Richardson et al. 2007). However, the present
results contradict the findings of the study based on Swedish adolescents where a one-
factor structure was supported (Hagquist and Andrich 2004).
All three models presented significant factor loadings in both samples. For the three-
factor model the standardized factor loadings ranged between 0.37 (item 1) and 0.72 (item
9) in sample 1 and between 0.30 (item 1) and 0.73 (item 8) in sample 2. When looking at
the three-factor model with correlated error variances (Model-2A), item 1: ‘‘Do you have
the feeling that you really don’t care what is going on around you?’’, item 2: ‘‘Has it
happened in the past that you were surprised by the behaviour of people whom you thought
you knew well?’’ and item 11: ‘‘When something happened, have you generally found
that…you overestimated or underestimated its importance…versus…you saw things in the
right proportion?’’, exposed R2-values of 0.13, 0.18 and 0.17, respectively. The same
pattern appeared in sample 2, with R2-values of 0.09, 0.10 and 0.21, respectively. Hence,
these items did not explain a noteworthy amount of variance in SOC, indicating low
U. K. Moksnes, G. Haugan
123
Author's personal copy
reliability. Furthermore, item 3 (‘‘Has it happened that people whom you accounted on
disappointed you?’’) and item 10 (‘‘Many people, even those with a strong character,
sometimes feel like sad sacks (losers) in certain situations. How often have you felt this
way in the past?’’) also displayed low factor loadings and R2-values of 0.22/0.15 and 0.32/
0.17, in sample 1/sample 2, respectively. Summarized, the items 1, 2, 3, 10 and 11 indi-
cated low reliability in the two samples investigated.
The low factor loading of item 1 is in accordance with the findings in the study of Ding
et al. (2011) indicating that this item does not contribute to the variance of the mean-
ingfulness dimension in the two adolescent samples investigated. There might be multiple
reasons for this, but caring about what is going around in one’s close environment,
especially with friends during school and leisure time is one of the most important focuses
in adolescents’ lives and something that is meaningful for most adolescents. Therefore, the
item might not be perceived as relevant by the adolescent group.
Item 10 focuses on the feeling of being a loser in certain situations. Being a loser might
be perceived as having an insulting character and give adolescents an association of being
victimized and stigmatized. It is therefore possible that it is difficult for adolescents to
relate to the semantic meaning and wording of this item and respond to it in a reliable way.
Item 11 involves an evaluation of either over- or underestimating a situation at one end,
and reacting in the right proportion at the other end. This item requires a general reflection
and comprehension of a magnitude of situations that may happen in adolescents’ lives in a
retrospective perspective. It is possible that this item has low reliability because the
semantic meaning in reference to ‘‘overestimate’’ and ‘‘underestimate a situation’’ is dif-
fuse and complex to comprehend and therefore difficult to evaluate by adolescents.
The presence of low factor loadings was also evident for item 2 and item 3. As
described previously, it is possible that these items presented low factor loadings and
explained variance because it is difficult to differentiate the cognitive and emotional
aspects of being surprised and disappointed by people adolescents know well and count on.
It is also possible that it would be easier to reflect around such situations if the word
‘‘people’’ was more concrete, allowing adolescents to reflect around situations related to
e.g. teachers, parents or peers.
Moreover, evaluation of the items in the OLQ requires that adolescents are at a level of
cognitive development where they are able to reflect and understand the semantic meaning
of the items. The age range of the adolescent samples was 13–18 years and it may be
especially challenging for the youngest ones to reflect over abstract concepts like ‘‘over-or
underestimating situations in general’’, and ‘‘being disappointed’’ or ‘‘surprised by other
people’s behavior;’’ this may lead to over or under reporting (self-report bias) (Derdikman-
Eiron et al. 2011). Second, there is a challenge regarding the adolescents’ ability to reliably
evaluate and report on experiences and feelings as though self-reports require that ado-
lescents are at a level of cognitive development where they are able to reflect, understand
and differentiate abstract concepts. However, it should be acknowledged that all such data
might be more prone to bias due to the possible influence of social desirability factors
(Derdikman-Eiron et al. 2011). Another aspect in the discussion of interpretation of items
is the relevance of the content and the language which adolescents use, and the jargon they
choose to describe and evaluate their experiences. All these aspects have to be taken into
consideration when evaluating the face validity of the items and the ability of OLQ to
reliably measure SOC in the adolescent group. In reference to the low factor loadings and
R2-values found on some of the items in OLQ (item 1, 2, 3, 10 and 11) across the two
samples investigated, the semantic meaning of the items might be discussed with
Validation of the Orientation to Life Questionnaire
123
Author's personal copy

adolescents in gender and age balanced focus groups in order to evaluate the relevance,
wording and semantic meaning of the items.
Meanwhile, the high factor loadings of the remaining items and the good model fit of
the three-factor model with correlated residual variances between item 2 and item 3
indicate that most of the variance in SOC is explained by the items included in the 13-item
OLQ; this gives support to the reliability of the instrument as well as Antonovsky’s theory
(1987). Moreover, the present results demonstrated that the 13 item three factor model had
a good internal consistency, where composite reliability ranged from 0.65 to 0.70 for
sample 1 and from 0.60 to 0.70 for sample 2. The 13 item OLQ scale has been reported to
have internal consistency comparable to the 29 item version with Cronbach’s alpha ranging
between 0.70 and 0.92 in adult and elderly samples (Eriksson and Lindstrom 2005; Hittner
2007). Among adolescents, the internal consistency is less investigated, however, studies
have reported Cronbach’s alpha of 0.82 (Rivera et al. 2012) and 0.86 (Nielsen and Hansson
2007).
4.1 Limitations
A major strength of the present study is that it is based on two reasonably large sample
sizes with high response rates. Although the sample size was high, differences in sample
characteristics may have had impact on the results. The present results have tested model
data consistency by comparing measurement models and its assumptions to the present
data. However, we do not know if the assumptions for ‘‘model reality consistency’’ are
achieved, that is, whether the model found to fit our data mirrors real-world processes. A
good model fit does not mean we have obtained the ‘‘true’’ model. It is therefore possible
that there are other alternative models that fit the data equally well as the model found in
the present data sets, and that our model may be only one of many that match the data
(Bollen 1989). The present study have investigated the factorial validity and stability of the
instrument across two large samples, however, this is not tested statistically through multi-
group analysis; this analyze technique is recommended in future studies. All findings were
based on self-reports and are therefore subject to potential self-reporting bias, however, the
large sample size of the present study can partially protect against the influences of
potential random error related to self-reporting (Derdikman-Eiron et al. 2011).
5 Conclusion
The results of this study provide further evidence of the psychometric properties of the 13
item OLQ and contribute to an understanding of how the instrument may perform as a
measure of SOC across two Norwegian adolescent samples. The three-factor model with
correlated error parameters between item 2 and item 3 resulted in good fit in the two
samples investigated. Further, the good composite reliability of the dimensions indicates
high inter-correlations among the items, and that items are consistent in measuring the
underlying construct of SOC. However, more psychometric testing of the instrument is
required in reference to the modified factor structure found and that five items had low
factor loadings and R2. The items in the OLQ instrument might be investigated e.g. through
gender and age balanced focus group discussion with adolescents to clarify the relevance,
wording and semantic meaning of the items. The OLQ should also be further validated on
adolescents, as though few studies have tested the psychometric properties of the OLQ on
this population. Additional cross-cultural research exploring the psychometric properties of
U. K. Moksnes, G. Haugan
123
Author's personal copy

OLQ is also necessary in order to assess external validity of the reported findings. On the
basis of evidence reported in this paper, the 13 item OLQ does appear to have potential as
an instrument assessing SOC in the Norwegian adolescent population. Nevertheless, five
items presented low reliability and should be further developed in order to comprehen-
sively assess SOC among teenagers.
References
Antonovsky, A. (1979). Health, stress and coping. San Francisco: Jossey-Bass.Antonovsky, A. (1987). Unraveling the mystery of health. How people manage stress and stay well. San
Fransisco: Jossey-Bass.Antonovsky, A. (1993). The structure and properties of the sense of coherence scale. Social Science and
Medicine, 36, 969–981.Bagozzi, R. P., & Yi, Y. (1988). On the evaluation of structural equation models. Journal of the Academy of
Marketing Science, 16, 74–94.Bollen, K. A. (1989). Structural equations with latent variables. New York: John Wiley & Sons.Braun- Lewensohn, O., & Sagy, S. (2010). Sense of coherence, hope and values among adolescents under
missile attacks: A longitudinal study. International Journal of Children’s Spirituality, 15, 247–260.Brown, T. A. (2006). Confirmatory factor analysis for applied research. London: The Guildford Press.Byrne, M.B. (2001). Structural Equation Modeling with AMOS. Basic concepts, applications, and pro-
gramming. USA: Taylor AND Francis Group.Derdikman-Eiron, R., Indredavik, M. S., Bratberg, G. H., Taraldsen, G., Bakken, I. J., & Colton, M. (2011).
Gender differences in subjective well-being, self-esteem and psychosocial functioning in adolescentssymptoms of anxiety and depression: Findings from the Nord-Trøndelag health study. ScandinavianJournal of Psychology, 52, 261–267.
Ding, Y., Bao, L., Xu, H., & Hallberg, I. R. (2011). Psychometric properties of the Chinese version of senseof coherence scale in women with cervical cancer. Psycho-Oncology, 21, 1205–1214.
Eriksson, M. (2007). Unravelling the mystery of salutogenesis. The evidence base of the salutogenicresearch as measured by Antonovsky’s Sense of Coherence Scale. (Research Report No. 1). Turku:Folkhalsan Research Centre, Health promotion research programme.
Eriksson, M., & Lindstrom, B. (2005). Validity of Antonovsky’s sense of coherence scale: A systematicreview. Journal of Epidemiology and Community Health, 59, 460–466.
Eriksson, M., & Lindstrom, B. (2006). Antonovsky’s sense of coherence scale and the relation with health:A systematic review. Journal of Epidemiology and Community Health, 60, 376–381.
Feldt, T., Lintula, H., Suominen, S., & Koskenuvo, M. (2007). Structural validity and temporal stability ofthe 13-item sense of coherence scale: Prospective evidence from the population-based HeSSup study.Quality of Life Research, 16, 483–493.
Gana, K., & Garnier, S. (2001). Latent structure of the sense of coherence scale in a french sample.Personality and Individual Differences, 31, 1079–1090.
Hagquist, C., & Andrich, D. (2004). Is the sense of coherence-instrument applicable on adolescents? Alatent trait analysis using Rasch-modelling. Personality and Individual Differences, 36, 955–968.
Hair, J., Black, W., Babin, B., & Anderson, R. (2010). Multivariate data analysis: Upper Saddle River:Prentice Hall.
Hittner, J. B. (2007). Factorial invariance of the 13-item sense of coherence scale across gender. Journal ofHealth Psychology, 12, 273–280.
Hu, L., & Bentler, P. (1998). Fit Indices in covariance structure modelling: Sensitivity to underparametrizedmodel misspecification. Psychological Methods, 3, 424–453.
Lindstrom, B., & Eriksson, M. (2010). The Hitchhiker‘s guide to salutogenesis. Salutogenic pathways tohealth promotion. (Research Report No. 2) Helsinki: Folkhalsan Research Centre, Health promotionresearch programme.
Moksnes, U. K., Lohre, A., & Espnes, G. A. (2012). The association between sense of coherence and lifesatisfaction in adolescents. Quality of Life Research, 22, 1331–1338.
Naaldenberg, J., Tobi, H., van den Esker, F., & Vaandrager, L. (2011). Psychometric properties of the OLQ-13 scale to measure Sense of Coherence in a community-dwelling older population. Health and Qualityof Life Outcomes, 9, 37–46.
Validation of the Orientation to Life Questionnaire
123
Author's personal copy

Neuner, B., Busch, M. A., Singer, S., Moons, P., Wellmann, J., Bauer, U., et al. (2011). Sense of Coherenceas a predictor of quality of life in adolescents with congenital heart defects: A register-based 1-yearfollow-up study. Journal of Developmental and Behavioral Pediatrics, 32, 316–327.
Nielsen, A. M., & Hansson, K. (2007). Associations between adolescents’ health, stress and sense ofcoherence. Stress and Health, 23, 331–341.
Nilsson, K. W., Leppert, J., Simonsson, B., & Starrin, B. (2010). Sense of coherence and psychological well-being: Improvements with age. Journal of Epidemiological and Community Health, 64, 347–352.
Oztekin, O., & Tezer, E. (2009). The role of sense of coherence and physical activity in positive andnegative affect of Turkish adolescents. Adolescence, 44, 421–431.
Raykov, T. (2001). Estimation of congeneric scale reliability using covariance structure analysis withnonlinear constraints. British Journal of Mathematical and Statistical Psychology, 54, 315–323.
Richardson, C. G., Ratner, P. A., & Zumbo, B. D. (2007). A test of the age-based measurement invarianceand temporal stability of Antonovsky’s sense of coherence scale. Education and PsychologicalMeasurement, 67, 679–696.
Rivera, F., Garcia-Moya, I., Moreno, C., & Ramos, P. (2012). Developmental contexts and sense ofcoherence in adolescence: A systematic review. Journal of Health Psychology, 18, 800–812.
Schermelleh-Engel, K., Moosbrugger, H., & Muller, H. (2003). Evaluating the fit of structural equationmodels: Tests of significance and descriptive goodness-of-fit measures. Methods of PsychologicalResearch, 8, 23–74.
Simonsson, B., Nilsson, K. W., Leppert, J., Vinod, K., & Diwan, V. K. (2008). Psychosomatic complaintsand sense of coherence among adolescents in a county in Sweden: A cross-sectional school survey.BioPsychoSocial Medicine, 2, 1–8.
U. K. Moksnes, G. Haugan
123
Author's personal copy