Evaluation of Norwegian Space Programs - Regjeringen.no
241
A review of the economi policies for developmen Evaluation of N Space Program Economics policies for developmen capabilities in Norway July 2012 Evaluation commissioned by the Ministry of Trade and Industry ics and public nt of space Norwegian ms nt of space
-
Upload
khangminh22 -
Category
Documents
-
view
5 -
download
0
Transcript of Evaluation of Norwegian Space Programs - Regjeringen.no

A review of the economics and publicpolicies for development of space
Evaluation of NorwegianSpace Programs
Economics
policies for development of spacecapabilities in Norway
July 2012
Evaluationcommissioned by theMinistry of Trade andIndustry
A review of the economics and publicpolicies for development of space
Evaluation of NorwegianSpace Programs
policies for development of space

This material was prepared by PricewaterhouseCoopers AS (PwC) for the specific use of the Ministry of Trade and Industry andrelied upon by any third party without PwC’s prior written consent.
This publication has been prepared for general guidance on matters of interest only, and does not constitute professional advinformation contained in this publication without obtaining specific professional advice. No representation or warranty (expraccuracy or completeness of the information contained in this publication, and, to the extent permitted by law, PwC, its partaccept or assume any liability, responsibility or duty of care for any consequences of you or anyone else acting, or refrainiinformation contained in this publication or for any decision based on it.
The information used by PwC in preparing this report has been obtained from a variety of sources as indicated within the repoanalysis of financial information and accounting records, it has not included an audit in accordance with generally acceptedanalysis of financial information and accounting records, it has not included an audit in accordance with generally acceptedor agreed-upon procedure of the Company’s existing business records, not a qualified legal opninion of compliance with applicablforensic investigations of detailed proceedings. Accordingly we assume no responsibility and make no representations with rescompleteness of any information provided to us.
By its very nature, evaluation work cannot be regarded as an exact science, and the conclusions arrived at in many cases willdependent on the exercise of individual judgment. There is, therefore, no indisputable single value and we normally express olikely range. The statements in this report express PwC opinion at the time the evaluation was performed. We reserve the righnotice.
For inquieries please contact team lead: Ivar Strand [email protected]
PwC
This material was prepared by PricewaterhouseCoopers AS (PwC) for the specific use of the Ministry of Trade and Industry and is not to be used, distributed or
This publication has been prepared for general guidance on matters of interest only, and does not constitute professional advice. You should not act upon theinformation contained in this publication without obtaining specific professional advice. No representation or warranty (express or implied) is given as to theaccuracy or completeness of the information contained in this publication, and, to the extent permitted by law, PwC, its partners, employees and agents do notaccept or assume any liability, responsibility or duty of care for any consequences of you or anyone else acting, or refraining to act, in reliance on the
The information used by PwC in preparing this report has been obtained from a variety of sources as indicated within the report. While our work has involvedanalysis of financial information and accounting records, it has not included an audit in accordance with generally accepted auditing standards, due diligenceanalysis of financial information and accounting records, it has not included an audit in accordance with generally accepted auditing standards, due diligence
upon procedure of the Company’s existing business records, not a qualified legal opninion of compliance with applicable laws and regulations or aforensic investigations of detailed proceedings. Accordingly we assume no responsibility and make no representations with respect to the accuracy or
By its very nature, evaluation work cannot be regarded as an exact science, and the conclusions arrived at in many cases will of necessity be subjective anddependent on the exercise of individual judgment. There is, therefore, no indisputable single value and we normally express our assessment as falling within alikely range. The statements in this report express PwC opinion at the time the evaluation was performed. We reserve the right to change opinion without

Objective of NorwegianObjective of Norwegianspace activities
To provide substantial and persistentcontributions to:
•wealth creation•innovation•knowledge development•environmental
Objective of NorwegianObjective of Norwegian
To provide substantial and persistent
wealth creation
knowledge developmentenvironmental- and public safety
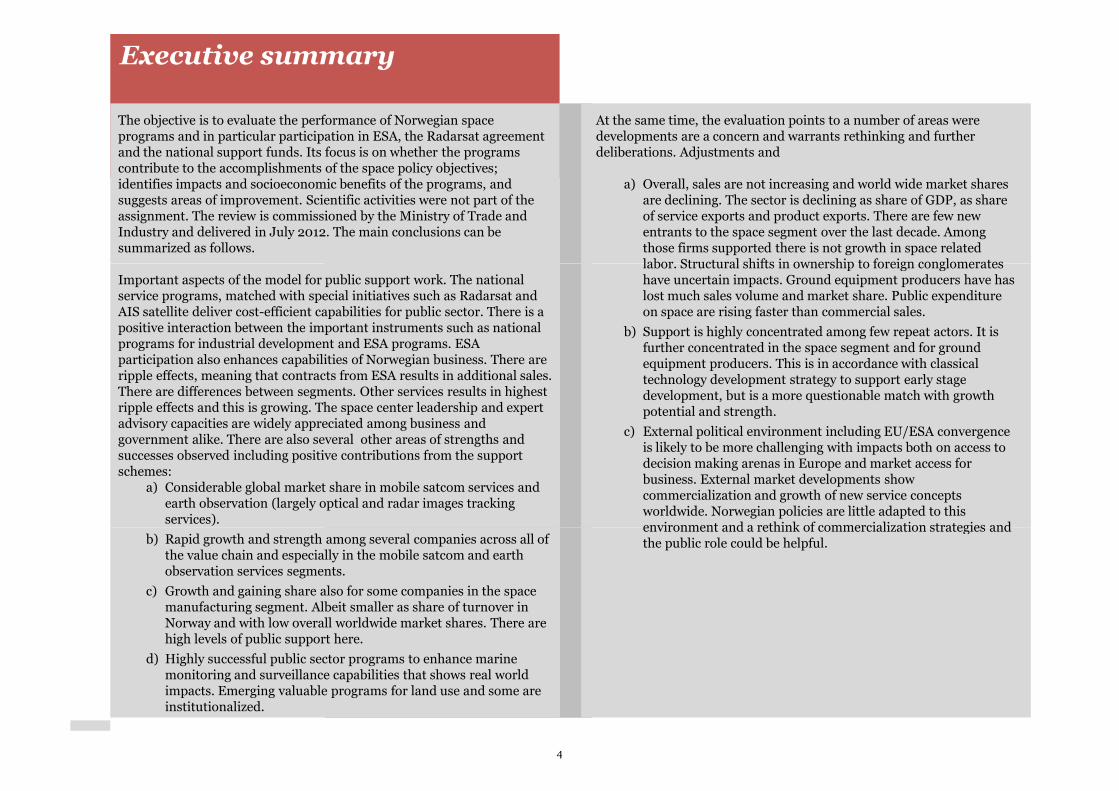
Executive summary
The objective is to evaluate the performance of Norwegian spaceprograms and in particular participation in ESA, the Radarsat agreementand the national support funds. Its focus is on whether the programscontribute to the accomplishments of the space policy objectives;identifies impacts and socioeconomic benefits of the programs, andsuggests areas of improvement. Scientific activities were not part of theassignment. The review is commissioned by the Ministry of Trade andIndustry and delivered in July 2012. The main conclusions can besummarized as follows.
Important aspects of the model for public support work. The nationalservice programs, matched with special initiatives such as Radarsat andAIS satellite deliver cost-efficient capabilities for public sector. There is apositive interaction between the important instruments such as nationalprograms for industrial development and ESA programs. ESAparticipation also enhances capabilities of Norwegian business. There areripple effects, meaning that contracts from ESA results in additional sales.There are differences between segments. Other services results in highestripple effects and this is growing. The space center leadership and expertadvisory capacities are widely appreciated among business andgovernment alike. There are also several other areas of strengths andsuccesses observed including positive contributions from the supportschemes:
a) Considerable global market share in mobile satcom services andearth observation (largely optical and radar images trackingservices).
b) Rapid growth and strength among several companies across all ofthe value chain and especially in the mobile satcom and earthobservation services segments.
c) Growth and gaining share also for some companies in the spacemanufacturing segment. Albeit smaller as share of turnover inNorway and with low overall worldwide market shares. There arehigh levels of public support here.
d) Highly successful public sector programs to enhance marinemonitoring and surveillance capabilities that shows real worldimpacts. Emerging valuable programs for land use and some areinstitutionalized.
4
At the same time, the evaluation points to a number of areas weredevelopments are a concern and warrants rethinking and furtherdeliberations. Adjustments and
a) Overall, sales are not increasing and world wide market sharesare declining. The sector is declining as share of GDP, as shareof service exports and product exports. There are few newentrants to the space segment over the last decade. Amongthose firms supported there is not growth in space relatedlabor. Structural shifts in ownership to foreign conglomerateslabor. Structural shifts in ownership to foreign conglomerateshave uncertain impacts. Ground equipment producers have haslost much sales volume and market share. Public expenditureon space are rising faster than commercial sales.
b) Support is highly concentrated among few repeat actors. It isfurther concentrated in the space segment and for groundequipment producers. This is in accordance with classicaltechnology development strategy to support early stagedevelopment, but is a more questionable match with growthpotential and strength.
c) External political environment including EU/ESA convergenceis likely to be more challenging with impacts both on access todecision making arenas in Europe and market access forbusiness. External market developments showcommercialization and growth of new service conceptsworldwide. Norwegian policies are little adapted to thisenvironment and a rethink of commercialization strategies andenvironment and a rethink of commercialization strategies andthe public role could be helpful.
4

PwC
Summary
Report
This is the short version of the report. Important patterns ofdevelopment, findings, analysis and observations are presentedhere over the next thirty pages.
More in-depth analysis and data work, and a more nuanceddiscussion is presented in a detailed analysis attached to this.Methodologies and appropriate references to data sources arealso found in the detailed analysis.

Table of Contents Summary Report
Summary report
Objective, scope, and methodologies of the review
Overview of developments
The value chain
Section Overview
The value chain
External policy developments
Norwegian policy implementation
ESA participation
Distribution of funds
Industry impacts
Impact on Norwegian economy of ESA participation
Public service programs
Impact of public service programs
Progress against policy objectives
Adjustment of objectives and strategies is recommended
Governance framework and risks
Suggestions
Appendices
1 Detailed analysis
7
8
9
Page
9
14
15
16
17
18
19
20
21
22
2525
27
28
29-240

The objective
The objective is to evaluate the participation in ESA, the Radarsat agreementand the national support funds. The evaluation should also provide a basis forassessing the socio-economic benefits of the programs. The review iscommissioned by the Ministry of Trade and Industry and delivered in July2012. The ministry highlights three themes of particular importance:
-Whether the programs contribute to the accomplishments of the space policyobjectives;
Summary report
Objective, scope, and methodologies of the review
objectives;
-Assess the socioeconomic benefits of participation in the programs, and
-Identify areas of improvement.
The scope
The request from the Ministry outlines a number of areas and detailedquestions, all relevant to evaluate the past performance of the space programs,as well as to point the way ahead. There is a range of policy instruments tosupport space activities in Norway. This work is to focus on the following three:
1. Participation in the ESA. ESA mandatory and the Optional program,
participation in which should reflect the Norwegian priorities.
2. The funds managed by the National Space Center for dedicated programs
for industrial development and public service development including
special initiatives such as AIS and Radarsat to enhance public sector
capabilities.
PwC
capabilities.
3. Purchasing of radar satellite data through a separate agreement with
Canadian firm MDA.
Interactions between these instruments are important and we will explore
those when relevant to inform the analysis. The focus the last ten years and if
data is available, even longer back. There are long lead times in development of
space activities and the fruition of policies may not be seen for decades. The
Ministry mandate focuses on the years 2004-2010. Science is an integral part of
the space activities. There are many space science activities in Norway and
meaningful analysis of this needs to be holistically. That is beyond this work.
7
Objective, scope, and methodologies of the review
Methodology and data
The evaluation combines indepth interviews with considerable quantitative
analysis of the support schemes and the sector in general. This includes:
Administrative and business data: Considerable quantitative data have
been used. The data are collected by the MoTI, NSC and ESA for different
purposes but has some overlaps. As in all administrative datasets there are
certain inconsistencies, broken time series and varying sample sizes. We havecertain inconsistencies, broken time series and varying sample sizes. We have
integrated this as best as possible and supplemented with information from
corporate reports, financial statements and press and investor information. In
total this is robust though there are minor unresolved inconsistencies. The
evaluation also uses company specific information drawn from publically
available sources. We have had access to non-public sensitive information of
single companies and this has been important to calculate certain aggregate
numbers.
Document analysis: Nearly 1500 pages of relevant documents has been
reviewed. Important documents includes annual reports and budget proposals,
company annual reports, international studies, and a range of market analysis.
This also includes information from press releases, investor relation reporting,
financial analysts, as well as quarterly and annual reports.
Interviews. The analysis is further strengthened by interviews of actors across
7
Interviews. The analysis is further strengthened by interviews of actors across
all segments of the value chain, private and public alike.
The value chain for space related activities can be defined in several ways.
We have based the analysis upon prevailing standards in market analysis and
official publications. This is adapted to the Norwegian context where
appropriate.
To utilize international expertise in the area and also to avoid any ties or
conflict of interests with Norwegian space programs, the report has been
develop din English. The report is translated into Norwegian and both versions
made available.

Overview of developments
Activity has declined in real terms but may bereemerging. Turnover declined from 2003 butshown real growth in the last few years. Activitiesincreased strongly prior to 2003 and have sinceleveled off. Total activity in this figure includes bothinstitutional and commercial activities, but excludesconsumer TV i.e.. Canal Digital and Viasat. Theconsumer segments has not been a focus of the
The sector constitutes a little over 0,2 percent ofGDP in 2010, a reduction of about 33 percent from2003. Measured against the less oil dependent GDPMainland numbers we find the same pattern ofdecline albeit with slightly higher numbers.
The export ratio in this sector is quite high, but wefind a decline measured against other Norwegianexports. Measured against other services exports we
Summary report
Figure 1: Turnover space industries in Norway
Turnover declined since 2003
Figure 2: Turnover as share of GDP
Declining share of the economy
consumer segments has not been a focus of theNorwegian space programs.
Activity may have contracted as much as 25 percentbetween 2003 and 2007 if adjusted for producerprice inflation (PPI). The extent of the declinedepends upon how price inflation is adjusted for.
Services constitute the largest segment and hasincreased in significance over time. Productmanufacturing is about 20 percent of total in 2010.
The decline is confirmed when comparing againstother core economic parameters.
exports. Measured against other services exports wealso find a decline of space related exports since2003. Compared against other exports ofmanufactured goods, we find an even moresignificant drop of about 43 percent since 2003.This share has declined since the late nineties and isnow at about 0,3 percent of total product exports.
PwC
7 bn
6 bn
5 bn
4 bn
3 bn
2 bn
1 bn
Nominal
CPI adjusted
PPI adjusted
1997 2010
Sales-25%
1997
GDP
Figure 1: Turnover space industries in Norway Figure 2: Turnover as share of GDP
8
The sector constitutes a little over 0,2 percent ofGDP in 2010, a reduction of about 33 percent from2003. Measured against the less oil dependent GDPMainland numbers we find the same pattern ofdecline albeit with slightly higher numbers.
The export ratio in this sector is quite high, but wefind a decline measured against other Norwegianexports. Measured against other services exports we
Norwegian firms gained global market share duringthe first five years of the decade. This wasparticularly driven by gains in the mobile satcommarkets. Since then the share has declined andcurrently stands at about 2 percent.
The industry remains highly commercial with 75percent of sales to maritime and offshore industries.It is more commercial than its peers in other
2: Turnover as share of GDP
Declining share of the economy
Figure 3: Global market share of Norwegian
Loosing global market share
exports. Measured against other services exports wealso find a decline of space related exports since2003. Compared against other exports ofmanufactured goods, we find an even moresignificant drop of about 43 percent since 2003.This share has declined since the late nineties and isnow at about 0,3 percent of total product exports.
It is more commercial than its peers in othercountries.
In summary, this is a picture of an industrywith declining sales, loosing share of theeconomy, and that looses global marketshare.
0,0 %
0,1 %
0,2 %
0,3 %
0,4 %
0,5 %
2010
-33%
2: Turnover as share of GDP Figure 3: Global market share of Norwegianspace business (excluding consumer markets)
8
0,0 %
0,5 %
1,0 %
1,5 %
2,0 %
2,5 %
3,0 %
2000 2005 2010
Global market share
Details and source information are available on pages 44 to 55 in the main report.

The value chain for space related activities
When assessing how space activities contribute to wealth creation and otherobjectives it is useful to define the scope and range of space activities in theeconomy. We do this by mapping a value chain, that is understanding howactors and stages interact. There are three distinct elements of the space valuechain:
First, there is the institutional segment. Historically, developments havebeen much driven by military needs, i.e. communications and remote sensing
Summary report
been much driven by military needs, i.e. communications and remote sensingneeds. Scientific explorations of space also constitutes a core rationale andother public sector requirements such as environmental monitoring areimportant. These are often requirements for which there exist no privatemarket or suppliers. New developments are necessary and these requiresignificant investments and entails risks that few private enterprises are willingto embark upon alone.
There are also commercial space segments. We can divide this into itsmain value chain activities such as illustrated above. In principle, theinstitutional activities of governments can be grouped along the samedimensions but the commercial activities can be analyzed with moregranularity mostly because of better availability of data and information. Manyof the same private actors are also involved a contractors for developments ofpublic systems and in some cases with mixed public and private financialinvolvement, it is not always possible to distinguish the institutional andcommercial segments entirely.
PwC 9
activities
Much of the commercial value chain is driven by the demand forcommunication services. This creates the demand for satellites, launchers andground equipment. Most important is transmission of TV signals, but also forinternet broadband and other communication services. Of increasingimportance, albeit small yet, is also developments of remote sensingcapabilities such as the images found on Google Earth. These service marketsoperate on pure commercial terms. There are international agreementsgoverning use of frequencies and location of satellites but little other policygoverning use of frequencies and location of satellites but little other policyintervention. Much of the technological base has however been developedunder institutional programs.
The satellite manufacturing and launcher segments are more captive. Most ofthe demand for their products stems from public sources. Nation states (andintergovernmental organizations such as ESA) typically prefer enterprises fromtheir own countries. As such this market segment has more captivecharacteristics than the service segment. i.e. in the U.S government spending isestimated to constitute 85 percent of the demand for space manufacturing inthe U.S. In Europe the ratio is closer to 50 percent. Yet, when a Satellite TVorganization needs to increase their satellite capabilities, the manufacturingand business mechanisms around this are commercial.
The tail end of the value chain is the consumer distribution. This includesservice provision such as TV or broadband access, and also equipmentmanufacturing of i.e. GPS hand- or vehicle equipment, chipsets for smartphones or TV set top boxes. These segments are the largest ones in economic
9
phones or TV set top boxes. These segments are the largest ones in economicterms but has not been a focus of Norwegian space programs and are not partof this analysis.
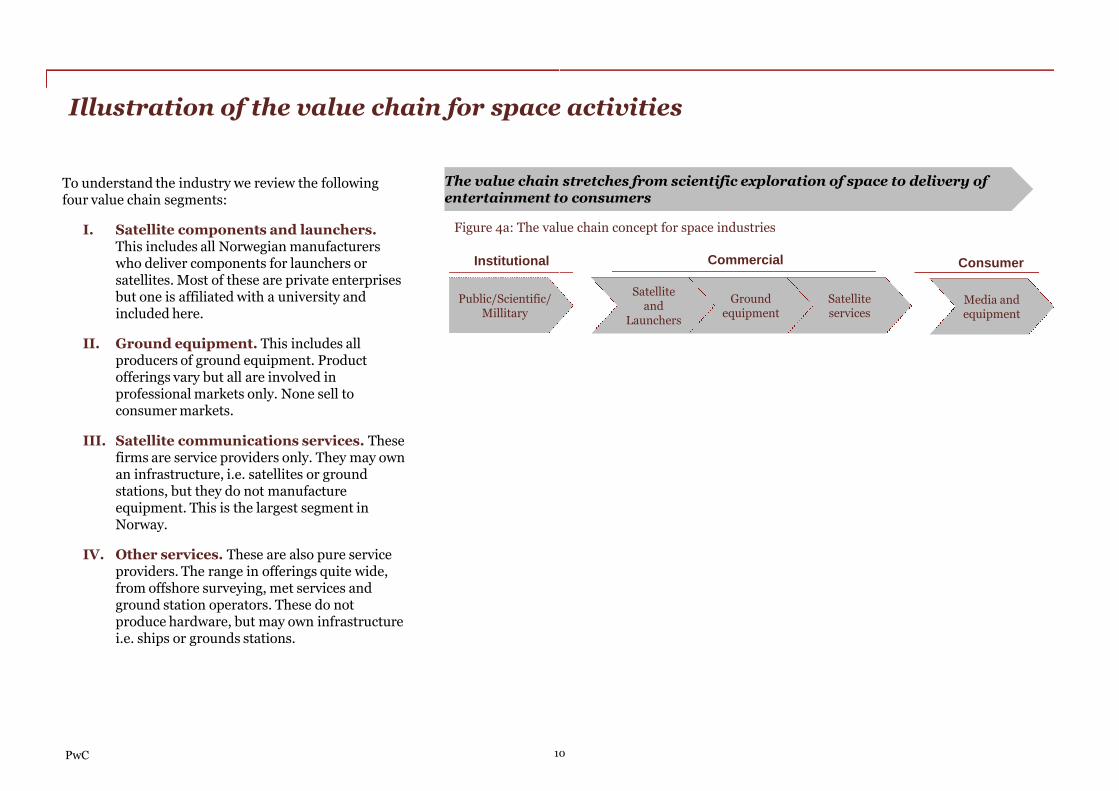
Illustration of the value chain for space
Figure 4a: The value chain concept for space industries
The value chainentertainment to
Institutional
To understand the industry we review the followingfour value chain segments:
I. Satellite components and launchers.This includes all Norwegian manufacturerswho deliver components for launchers or
Public/Scientific/Millitary
Institutionalwho deliver components for launchers orsatellites. Most of these are private enterprisesbut one is affiliated with a university andincluded here.
II. Ground equipment. This includes allproducers of ground equipment. Productofferings vary but all are involved inprofessional markets only. None sell toconsumer markets.
III. Satellite communications services. Thesefirms are service providers only. They may ownan infrastructure, i.e. satellites or groundstations, but they do not manufactureequipment. This is the largest segment inNorway.
PwC 10
Norway.
IV. Other services. These are also pure serviceproviders. The range in offerings quite wide,from offshore surveying, met services andground station operators. These do notproduce hardware, but may own infrastructurei.e. ships or grounds stations.
space activities
value chain concept for space industries
stretches from scientific exploration of space to delivery ofto consumers
Commercial Consumer
Satelliteand
Launchers
Groundequipment
Satelliteservices
Media andequipment
Commercial Consumer
10

Figure 4b: Turnover space value chain global and in Norway ex consumer TV
Norwegian space value chain is very different from global structures, and public supportis directed towards the less commercial segments
The value chain and public support
Global
The size and growth rates of different segments varyacross countries and in Norway the services segmentis particularly large. The figure to the right shows thedistribution of institutional and various commercialsegments.
Globally, we find that the institutional segment of thevalue chain is particularly large. This is mostlyvalue chain is particularly large. This is mostlyexplained by the large U.S government expendituresestimated at nearly 65 billion dollars in 2010equivalent to one- third of total turnover globallyincluding consumer satellite TV.
In Norway we find that the institutional side is muchsmaller than the commercial segments. This reflectsthe success of the industry in global commercialmarkets. The commercial value chain ischaracterized by a very large communication servicessegment. There are companies with large global marketshares included in this. There is also a rapidly evolvingearth observation community, as well as a small butspecialized space manufacturing industry.
At the same time, the public support I Norway isfocused on the upstream production of satellite
Satcomservices
Otherservices
Groundequipment
PwC
focused on the upstream production of satellitecomponents and ground equipment. This constitutesabout 80 percent of total support. The differencebetween support and industry size is most marked forthe satellite components segments where 36 percent ofthe total support is allocated yet the segment onlyconstitutes about 3 percent of the space relatedturnover in Norway.
Satellite communications services, which is by far thelargest segment in Norway, receives nearly no supportwith only about 1 percent of total over the last decade.
Satellitecomponents/Launchers
InstitutionalR&D
11
: Turnover space value chain global and in Norway ex consumer TV- and electronics (2010 est.)
Norwegian space value chain is very different from global structures, and public supportis directed towards the less commercial segments
Global Norway Share of public support in Norway
≤1%
19%
20%
≤1%
12 %
6 %1 %
14 %
61 %
24%
36%
68 %
10 %
3 %
10 %
15 %
11

Figure 5: Turnover space manufacturing andlaunchers
Space manufacturing shows growthand commercial sales
Manufacturing recieves most support but is loosing market shares
Launch and satellite manufacturing receives most of theNorwegian support, and is a small growing segment witha fractional global market share. Launcher marketaccess is only through Ariane-5. Arianespace capturesmost of the commercial launch revenues but competitionis escalating. Growth in demand for launchers, but evenmore rapid growth of supply from commercial, U.S. andAsian providers. It is unclear whether support for
Summary report
Ground equipment has much declinein sales and flat growth for survivors
1990 1995 2000
Public
Commercial
Figure 7: Turnover ground equipment prod.
Asian providers. It is unclear whether support forlaunchers is justified in light of the competitivepositioning and the poor potentials for growth and wealthcreation.
Norwegian satellite component manufacturing ismostly financed by public funds but commercial share hasbeen increasing. High entry barriers for satellitecomponents manufacturing but competition escalating.Access to European institutional markets will becomemore difficult in light of more open competition pushedby the EU. With one exception, the position of Norwegianmanufacturers in commercial markets is not strong. Riskthat they will be insufficient in size and scope to competewith integrated global conglomerates. Also in thissegment there is reason to question the sustainability ofthe support schemes.
PwC
2000
All Supportedfirms
Survivors
the support schemes.
The once large ground equipment industry has seenmuch decline. The Norwegian strength is sales tomaritime industries. There is strong growth of worldwideground equipment markets. Norwegian producers havelost global market share. This is sensitive to the collapseof one large company, but remaining firms have notgrown to cover the gap.
Sales have also developed at a much slower rate than theoverall growth of electronics manufacturing in Norway.The overall electronics industry in Norway does well, andit is not evident why space sales are falling.
12Details and source information are available on pages 56 to 87 in the main report.
: Turnover space manufacturing and
Space manufacturing shows growthand commercial sales
300
Sale
s(m
illion
NO
Kn
om
inal)
Figure 6: Estimated global market share 2009-2010
Sat
…and fractional global commercialmarket share but increasing
most support but is loosing market shares
CAGR10%
Ground equipment has much declinein sales and flat growth for survivors
-
100
200
2000 2005 2010S
ale
s(m
illion
NO
Kn
om
inal)
Launchers≈
0,3%
Satmanufacturing≈
0,2 %
…and loss of global market share
: Turnover ground equipment prod. Figure 8: Estimated global market share 2005-2010 exconsumer equipment
0 %
25 %
50 %
75 %
100 %
2005 2010
consumer equipment
0,0 %
1,0 %
2,0 %
3,0 %
2005 2006 2007 2008 2009 2010
-50%
12

Figure 10: Sales Satcom services ex TVDTH
Satcom services growing albeitslowly…
0,7
NOK
Satcom services are leading globally but loosing shares. Othergrowth potential.
SatCom services have lost some global market sharebut still accounts for two-thirds of commercial spacesales in Norway. It operates nearly autonomous fromthe public support schemes. Relatively small publicinvestments here have had big impacts. This segmenthas also seen new entrants with rapid growth. Fixedsatellite operator Telenor goes strongly, but hasdivested most of its other large engagements in space.
Summary report
Other services has rapid growth…
Figure 12: Turnover other services
0
0,1
0,2
0,3
0,4
0,5
0,6
0,7
2005 2007
Sale
s(B
nU
S)
CAGR3%
divested most of its other large engagements in space.Norwegian firms are global market leaders. Firms inthe fast growing mobile maritime segment have beenattractive acquisition targets for global operators. Newentrants may challenge the positions in maritimemobile markets including from Ericsson. Uncertainimpact of foreign acquisitions on satcom serviceindustry. There is a risk of dwindling satcom servicesactivities and policy tools are not suited to redress theissue.
Other services are emerging with strong Norwegiancapabilities and market shares. The supply side of thismarket is commercializing while demand remainsmostly government. Image data sales market isgrowing rapidly after introduction of high resolutionimage and radar. Norway has no involvement in data
PwC
2005 2006 2007 2008
CAGR16%
image and radar. Norway has no involvement in dataacquisition and risks being locked out of the growingvalue added markets as value chains integrate. KSAThas a sweet spot in ground station and data distributionand a basis for expanding value added services. Thereare advanced commercial surveying and met servicesactors in Norway. Surveying off- and onshoreincreasingly using satellite information in addition tonavigation. One of Europe's fastest growingcommercial met services is based in Norway andoperates in six countries. Government support is veryselective and broader support for commercializationcould be considered.
13Details and source information are available on pages 56 to 87 in the main report.
: Sales Satcom services ex TVDTH
Satcom services growing albeit
Figure 11: Estimated global market share 2005-2010
…but loosing ground in globalmarkets
USD 5,0 %
Satcom services are leading globally but loosing shares. Other servcies ahs
Other services has rapid growth……and possible large global marketshares
: Turnover other services Figure 13: Estimated global market share 2010
0
1
2
3
2009S
ale
s(B
nN
OK
)0,0 %
1,0 %
2,0 %
3,0 %
4,0 %
2005 2006 2007 2008 2009 2010
Glo
balm
ark
etsh
are
CAGR3%
0
0,3
0,6
0,9
2008 2009 2010
Sale
s(B
nN
OK
)
13
Note: Robust estimates of total information services marketvolume does not exist. Better estimates exist of the EO andMet services markets and against those the Norwegianmarket share may be in the range of 3-10 percent.
3-10 percent

External developments contributes to loss of competitiveness
Developments in the external institutional andpolitical arena have implications for the relevanceand effectiveness of the national space programs.
Five perspectives are important:
1. The U.S. 2010 space policy could be a gamechanger for commercialization. It is likely to impactmarkets and industry and also create opportunities
Future contract awards will be more competitivebut likely not fully aligned with EU procurementdirectives in all ESA programs. Contracts under EUfunded programs are likely to remain competitive.This will lead to reduces market access forNorwegian firms compared to today's moreprotected regime.
Summary report
markets and industry and also create opportunitiesfor non-american government to acquire new andbetter services. The definition of commercializationimplies capital risk for private actors and goesbeyond previous practices of sub-contractingcommercial vendors. U.S. business will continue tohave anchor tenants in government but will alsohave stronger incentives to further commercializeproducts and services.
2. European issues. This is primarily about thereconfiguration of ESA and EU relationships withthe implications this has for priorities and directionof policies, as well as governance structures, andaccess and opportunities for Norwegian firms andother interests.
This is an ongoing, and slow moving process, but
There is a considerable financing gap for the policy.EU has not provided financing for space activities inthe Medium-term Financing framework therebythreatening the completion and operation of a.o theGMES Sentinel flagship program for earthobservation. EU wants member states to cover.Future challenges for Norway include both access todecision making arenas in Europe and marketaccess for business to institutional markets inEurope.
3. Peer country developmentsSwitzerland and Sweden are discussed. A commonthread is that all are realigning policies due tochanging environments. Canada has embarkedupon a significant policy process, Sweden has calledfor one, while Switzerland completed its new policy
PwC
This is an ongoing, and slow moving process, butcertain emerging patterns can be ascertained. Theimportant ramifications for Norwegian policyinclude: That the Commission wishes to bettercoordinate activities of member states, and spaceinfrastructure is to be explored jointly.
The EU space policy involves continuation of theflagship programs Galileo and GMES, spaceexploration and military ambitions. It might entailrestructuring of the EU/ESA relationship.
for one, while Switzerland completed its new policyin 2008.
4. Commercialization and private risk.Increasingly national programs organized aspartnerships with commercial orientation andprivate capital at risk. Boundaries between publicand private roles are shifting. This is particularlyseen within the earth observation image and radarsegments but also in military communications. Thisis driven by U.S. and European concepts.
14
External developments contributes to loss of competitiveness
Future contract awards will be more competitivebut likely not fully aligned with EU procurementdirectives in all ESA programs. Contracts under EUfunded programs are likely to remain competitive.This will lead to reduces market access forNorwegian firms compared to today's more
5. Emerging market countries expansion andsigns of future of low-cost space, commoditizationand service expansion will threaten Norwegianfirms. Commercial capabilities are still limited.Those relate primarily to operation of SatComservices for domestic or regional markets; Thelauncher industries of Russia and China havesignificant market shares and especially China has
Figure 14: Indicative market prices highresolution, fresh images, per Sq km
Indian low-cost image challenger
There is a considerable financing gap for the policy.EU has not provided financing for space activities in
term Financing framework therebythreatening the completion and operation of a.o theGMES Sentinel flagship program for earthobservation. EU wants member states to cover.Future challenges for Norway include both access todecision making arenas in Europe and marketaccess for business to institutional markets in
3. Peer country developments. Canada,Switzerland and Sweden are discussed. A commonthread is that all are realigning policies due tochanging environments. Canada has embarkedupon a significant policy process, Sweden has calledfor one, while Switzerland completed its new policy
significant market shares and especially China hasbegun to make inroads into the more profitablesegment of launching commercial communicationssatellites directly in competition with a.oArianespace. In India especially the image segmentis semi-commercialized and they have gainedshares in the global image sales markets.
The Asian space race is driving competition andlaunch of military and surveillance satellites.
$9
$17
$19
$25
Cartosat-2 (1m)
Worldview-1 (0,5m+)
Ikonos (1m)
Geoeye-1 (0,5m+)
for one, while Switzerland completed its new policy
4. Commercialization and private risk.Increasingly national programs organized aspartnerships with commercial orientation andprivate capital at risk. Boundaries between publicand private roles are shifting. This is particularlyseen within the earth observation image and radarsegments but also in military communications. Thisis driven by U.S. and European concepts.
14 Details and source information are available on pages 88 to 111 in the main report.

The objective of this analysis is to review how theprograms have been implemented. What has beenthe activities? Where has the monies been spentand to what effect?
There is real growth in public expenditure forspace and 60 percent of it for Space Centermanaged programs. We also find that other
The core rationale for participation in theEuropean Space Agency relates to access to pooledcapabilities and development programs beyondwhat Norway could accomplish on its own. Theability to get access to “costmeets demand and requirements for publicagencies is emphasized in addition to access toscientific programs and instruments for
Norwegian policy implementation is mostly about ESA, but fastest growth fornational programs
Summary report
managed programs. We also find that otherspending, in particular on R&D is quite significantat about 30 percent of total.
The important dedicated space programs for thisreview includes:
•ESA participation which remains the primaryinstrument for developing capabilities; and
•National programs including special initiativessuch as Radarsat and AIS satellite development.
scientific programs and instruments forresearchers. Another rationale is that Norwegianindustry gets access to technology developmentprograms and qualified ESA assistance, andopportunities to deliver into ESA developmentprograms of satellites and other systems. Largesegments of the space industry value chain iscaptive to government programs, and in absence ofESA access, Norwegian industry would not haveaccess to important markets.
Figure 15: All Norwegian expenditure on spaceincluding ESA, Space programs, science andgovernment agencies
Top line growth in all publicexpenditure on space
Figure 16: ESA and Galileo contributions fromNorway
Contributions to ESA growing evenfaster
PwC
-
150
300
450
600
750
900
2005 2006 2007 2008 2009
MIllio
nN
OK
(Cu
rren
t)
2002 2004 2006
Gallileo
ESA
CAGR10%
CAGR11%
15
The core rationale for participation in theEuropean Space Agency relates to access to pooledcapabilities and development programs beyondwhat Norway could accomplish on its own. Theability to get access to “cost-efficient” systems thatmeets demand and requirements for publicagencies is emphasized in addition to access toscientific programs and instruments for
National program financing is increasing fasterthan ESA contributions. Financing has nearlytripled in monetary terms since 2005, and alsomore than doubled as share of ESA contributions.The increase has mostly been for special programsor initiatives. Prominent among these are theRadarsat agreement, The AIS Satellite programand infrastructure developments such as for
Norwegian policy implementation is mostly about ESA, but fastest growth for
scientific programs and instruments forresearchers. Another rationale is that Norwegianindustry gets access to technology developmentprograms and qualified ESA assistance, andopportunities to deliver into ESA developmentprograms of satellites and other systems. Largesegments of the space industry value chain iscaptive to government programs, and in absence ofESA access, Norwegian industry would not haveaccess to important markets.
and infrastructure developments such as formaintenance at Andøya Rocket range, and supportfor the KSAT station in Antarctica.
The schemes for industry and earth observationservice development have seen some increase inabsolute terms. These programs have decreased insignificance compared to other special programs.
: ESA and Galileo contributions from
Contributions to ESA growing even
Figure 17: All national funds including Radarsat,AIS, industry development, service development
National programs growing fasterthan ESA contributions
-
15
30
45
60
75
2006 2008 2010
MIllio
nE
UR
(Cu
rren
t)
0 %
5 %
10 %
15 %
20 %
-
25
50
75
100
2000 2005 2010
Sh
are
ofE
SA
co
ntr.
Millio
nN
OK
no
min
al
Share of ESA contribution
All national programs
CAGR
15 Details and source information are available on pages 112 to 134 in the main report.
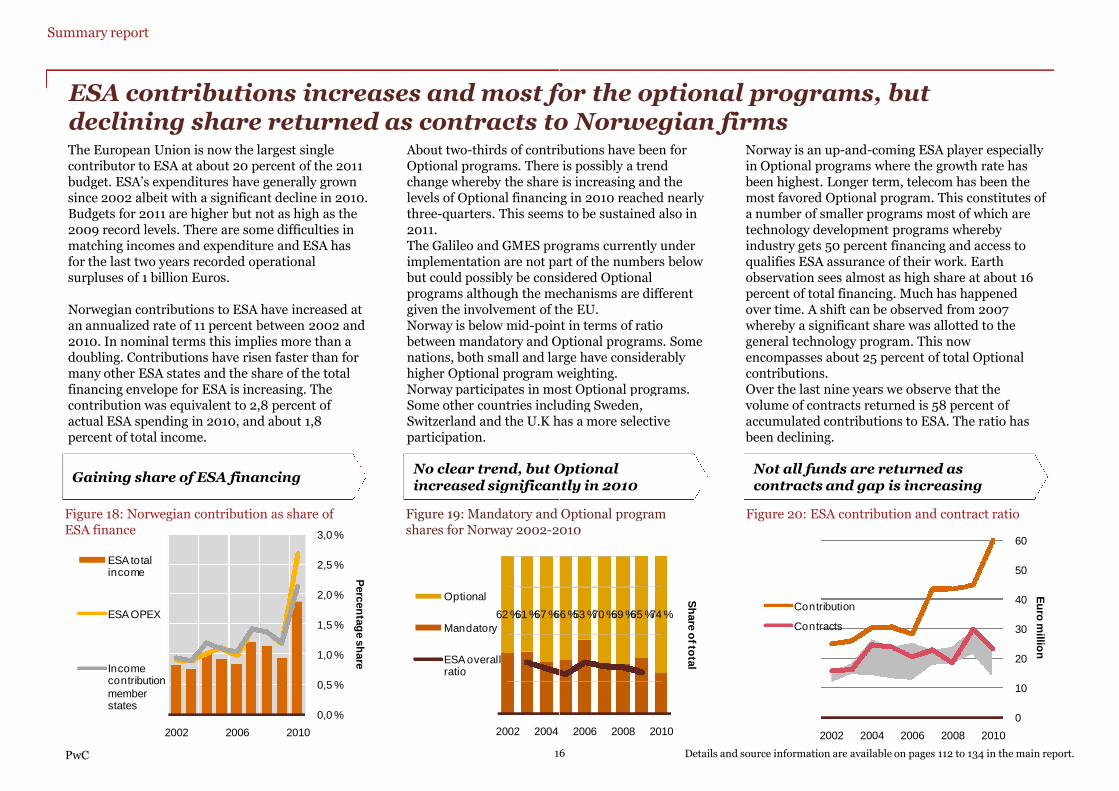
The European Union is now the largest singlecontributor to ESA at about 20 percent of the 2011budget. ESA’s expenditures have generally grownsince 2002 albeit with a significant decline in 2010.Budgets for 2011 are higher but not as high as the2009 record levels. There are some difficulties inmatching incomes and expenditure and ESA hasfor the last two years recorded operational
About two-thirds of contributions have been forOptional programs. There is possibly a trendchange whereby the share is increasing and thelevels of Optional financing in 2010 reached nearlythree-quarters. This seems to be sustained also in2011.The Galileo and GMES programs currently underimplementation are not part of the numbers below
ESA contributions increases and most for the optional programs, butdeclining share returned as contracts to Norwegian firms
Summary report
for the last two years recorded operationalsurpluses of 1 billion Euros.
Norwegian contributions to ESA have increased atan annualized rate of 11 percent between 2002 and2010. In nominal terms this implies more than adoubling. Contributions have risen faster than formany other ESA states and the share of the totalfinancing envelope for ESA is increasing. Thecontribution was equivalent to 2,8 percent ofactual ESA spending in 2010, and about 1,8percent of total income.
implementation are not part of the numbers belowbut could possibly be considered Optionalprograms although the mechanisms are differentgiven the involvement of the EU.Norway is below mid-point in terms of ratiobetween mandatory and Optional programs. Somenations, both small and large have considerablyhigher Optional program weighting.Norway participates in most Optional programs.Some other countries including Sweden,Switzerland and the U.K has a more selectiveparticipation.
Figure 18: Norwegian contribution as share ofESA finance
Gaining share of ESA financing
Figure 19: Mandatory and Optional programshares for Norway 2002-2010
No clear trend, but Optionalincreased significantly in 2010
PwC
ESA finance shares for Norway 2002-2010
0,0 %
0,5 %
1,0 %
1,5 %
2,0 %
2,5 %
3,0 %
2002 2006 2010
Perc
en
tag
esh
are
ESA totalincome
ESA OPEX
Incomecontributionmemberstates
62 %61 %67 %66 %
2002 2004
Optional
Mandatory
ESA overallratio
16
thirds of contributions have been forOptional programs. There is possibly a trendchange whereby the share is increasing and thelevels of Optional financing in 2010 reached nearly
quarters. This seems to be sustained also in
The Galileo and GMES programs currently underimplementation are not part of the numbers below
Norway is an up-and-coming ESA player especiallyin Optional programs where the growth rate hasbeen highest. Longer term, telecom has been themost favored Optional program. This constitutes ofa number of smaller programs most of which aretechnology development programs wherebyindustry gets 50 percent financing and access toqualifies ESA assurance of their work. Earth
ESA contributions increases and most for the optional programs, butdeclining share returned as contracts to Norwegian firms
implementation are not part of the numbers belowbut could possibly be considered Optionalprograms although the mechanisms are differentgiven the involvement of the EU.
point in terms of ratiobetween mandatory and Optional programs. Somenations, both small and large have considerablyhigher Optional program weighting.Norway participates in most Optional programs.Some other countries including Sweden,Switzerland and the U.K has a more selective
qualifies ESA assurance of their work. Earthobservation sees almost as high share at about 16percent of total financing. Much has happenedover time. A shift can be observed from 2007whereby a significant share was allotted to thegeneral technology program. This nowencompasses about 25 percent of total Optionalcontributions.Over the last nine years we observe that thevolume of contracts returned is 58 percent ofaccumulated contributions to ESA. The ratio hasbeen declining.
: Mandatory and Optional program2010
No clear trend, but Optionalincreased significantly in 2010
Figure 20: ESA contribution and contract ratio
Not all funds are returned ascontracts and gap is increasing
2010
66 %53 %70 %69 %65 %74 %
2006 2008 2010
Sh
are
ofto
tal
16
0
10
20
30
40
50
60
2002 2004 2006 2008 2010
Eu
rom
illion
Contribution
Contracts
Details and source information are available on pages 112 to 134 in the main report.

Distribution of funds is highly concentrated: Four firms receives 50 percent;63 organizations share the rest.As many as 67 organizations have been involved ineither the ESA or national space funds programsover the last decade.
Distribution is highly concentrated:
• four firms receiving 50 percent overall; for ESAmandatory programs 80 percent is captured bythree firms;
Regarding distribution of public funds:
Satellite component and launch manufacturersreceive most and more than a third of total. Theshare has declines some but the amounts haveremained about the same. Number of organizationsinvolved have increased over the decade.
Ground equipment captures about twenty
Summary report
Figure 21: Distribution of funds among value chain actors
Most support for space manufacturing, and more R&D organizations participating
Total value of contracts 2000-2010
three firms;
• a further 11 organizations receiving the next 30percent; and
• 52 organizations share the remaining 20 percentand many of these amounts are very small lowerthan 0,1 percent of total.
The ESA system seem in practice favor largerorganizations due to relatively high transactionscosts and risks. Smaller firms have mostly accessedthe technology development programs.
Ground equipment captures about twentypercent.
Other services receive 20 percent butfunding is concentrated to only one or two firms.
Telecom satellite servicesminor amounts distributed across one or two firmsover the decade.
Institutional R&D captures about 24 percent oftotals. Their share has more than doubled over thedecade.
PwC
Satcom services
Earth observation services
Ground equipment
Satellitecomponents/Launchers
Institutional R&D24 %
36 %
19 %
20 %
1 %
0 %
50 %
100 %
All 2000-2010
Total value of contracts 2000-2010
-
5
10
15
20
25
30
35
40
2000
Number of organizations
17
Other services
Distribution of funds is highly concentrated: Four firms receives 50 percent;
Regarding distribution of public funds:
and launch manufacturersreceive most and more than a third of total. Theshare has declines some but the amounts haveremained about the same. Number of organizationsinvolved have increased over the decade.
captures about twenty
Those firm that receive support have a decliningshare of total space sales in Norway. During thistime we have seen an increase in the ESA contractsfor that same group. We should keep in mind thatall this takes place in a context where there hasbeen a real decline in commercial space sales overthe last decade.
Firms that engage with ESA typically target
Most support for space manufacturing, and more R&D organizations participating
Figure 21b: Sales by actor
Sales of those who do not receivesupport grows faster than those thatreceive public support
captures about twenty
ther services receive 20 percent but thefunding is concentrated to only one or two firms.
Telecom satellite services have received onlyminor amounts distributed across one or two firms
captures about 24 percent oftotals. Their share has more than doubled over the
Firms that engage with ESA typically targetdifferent markets segments than those that operateoutside of the institutional markets.
All upstream firms engage with ESA, i.e..manufacturing of launchers and satellitecomponents; while there is much less institutionalactivity from firms that operate in the downstreamsegments i.e.. satellite communications servicesegments. This also reflects the demand structurein the institutional markets which is predominantlyabout science and manufacturing.
2005 2010
Number of organizations
17
1997 2001 2005 2009
Sales non-ESA firms
Sales ESAfirms
ESA sales
Details and source information are available on pages 112 to 134 in the main report.

Most firms that operate in the ESA market haveother business outside of the space markets. Thereare only a few producers that are entirely spacefocused. The share of space related sales havegenerally fallen over the last decade for theseenterprises. This can indicate a shift in focus andlack of alignment in corporate strategy with spacemarkets, or it can indicate faster growth in other
Employment for space work has not picked upeven for the surviving firms. There is a declinesince the late 1990’s having nearly lost half of theemployees that were involved at the peak. Thesurviving firms show a flat trend over the last 15years. Profits have increased in absolute termsthough margins have stayed at about the samelevels indicating cost increases.
Declining turnover of the supported industry, no job creation, butconciderable spinoff sales are reported
Summary report
markets, or it can indicate faster growth in othersegments.
Space revenues have declined overall in particularduring the last five years for ESA firms. This ismuch due to a few companies.Its encouraging that there is robust growth, both innominal and real terms, for the surviving firms.This growth has been consistent since 1985 at anannualized growth rate of about 16 percent.
levels indicating cost increases.
ESA contracts have increased over the last decadenearly doubling. This growth rate is well above theinflation and thus indicating growth in real terms.It is also faster than the growth of ESA budgetsoverall indicating that Norwegian firms have takena larger share of the ESA market. As share of spacesales for these firms we see that ESA contractspeaked significantly in the midpercent.
Figure 22: Sales for ESA involved firms
Decline for all ESA involved firms,though growth for surviving firms
Figure 23: Employment for space related workamong ESA firms
Lost jobs, and no growth forsurviving firms
PwC
0,0
0,3
0,6
0,9
1,2
1,5
1985 1990 1995 2000 2005 2010
Billio
nN
OK
All supported firms
Surviving supported firms
1985 1990 1995 2000
All supported firms
Surviving supported firms
18
CAGR16%
Employment for space work has not picked upeven for the surviving firms. There is a declinesince the late 1990’s having nearly lost half of theemployees that were involved at the peak. Thesurviving firms show a flat trend over the last 15years. Profits have increased in absolute termsthough margins have stayed at about the samelevels indicating cost increases.
An important rationale for public support toprivate firms through ESA is the access it providesto cutting edge technology development programs.Firms emphasize the highly qualified interactionsat all stages in the process including with theNorwegian space centre. Firms also emphasize theinteraction between the national support schemesfor industrial development that allows early stage
Declining turnover of the supported industry, no job creation, but
levels indicating cost increases.
ESA contracts have increased over the last decadenearly doubling. This growth rate is well above theinflation and thus indicating growth in real terms.It is also faster than the growth of ESA budgetsoverall indicating that Norwegian firms have takena larger share of the ESA market. As share of spacesales for these firms we see that ESA contractspeaked significantly in the mid-nineties. Now 20
for industrial development that allows early stagework before ESA.
An important metric to gauge the success of this isthe multiplier between support and sales generatedfrom this. Firms have reported data since the early1990’s. Considerable impacts are observed. Themultiplier is at 4,3 currently adjusted for inflation.Median firm impact is 3,5. Thus one ESA contractresults in additional sales of about four times theamount indicating an impact.
: Employment for space related work
Lost jobs, and no growth for
Figure 24: Multiplier of ESA support on sales
Considerable multiplier on sales
8
0
200
400
600
800
1000
1200
2000 2005 2010
Peo
ple
All supported firms
Surviving supported firms
0
1
2
3
4
5
6
7
8
1989 1994 1999 2004 2009
Mu
ltiplie
r
Inflationadjusted
Nominal
18 Details and source information are available on pages 157 to 171 in the main report.

Positive impacts on Norwegian economy mostly by firms spinoff salesThe multiplier shows divergence across differentvalue chain segments. There are differences inlevels and shifts over time.
Services how the highest levels (6,8) and anincreasing trend. Ground equipment is lower andhas been sliding for decades. Satellite componentand manufacturing show multiplier of about 3,4and slowly increasing.
A measure of the returns for the Norwegianeconomy is to measure the relationship betweenfinancial inputs and outputs. This is a measuretaking into account all Norwegian funding for ESAand corresponding national industrial funds. Wealso take into account overheads in ESA,distribution of contracts by value chain andvariations in multipliers, including contracts forscientific and public agencies, tax cost and import
Summary report
Sales multiplier differs acrosssegments
Figure 25: Sales multiplier by value chainsegment
and slowly increasing.
R&D multiplier is sliding. These are R&D instituteswho are engaged with much applied researchfunded through public or private sources. Theiradditional income may stem from other publicfinanced programs, i.e.. FP7, or industrial sources.Scientific institutions and public agencies with ESAcontracts do not have ripple effects of this natureand are not included.
scientific and public agencies, tax cost and importcontent.
The net gains for economic activity in Norway isabout 16 percent. There may be additional economywide technological gains not accounted for. Abudget allocation of 100 will result in an increasedactivity level in the economy of 100+16. We shouldalso note that Norway has other objectives with ESAparticipation including access and contribution to acommon European infrastructure. Those benefitswill be additional.
Full money cycle analysis show aboutsixteen percent gain in activity
Figure 26: Flow of funds and impacts of ESAmultiplier
PwC
segment
0
2
4
6
8
10
1991 1996 2001 2006
Mu
ltip
lier
Services
Ground equipment
Satellitecomp./Launchers
R&D/Institutional
19
multiplier
Governmentbudget
ESA/Space centre
Contracts
Multipliers
Tax cost andimport content
Net+economy widetech gains
Positive impacts on Norwegian economy mostly by firms spinoff salesA measure of the returns for the Norwegianeconomy is to measure the relationship betweenfinancial inputs and outputs. This is a measuretaking into account all Norwegian funding for ESAand corresponding national industrial funds. Wealso take into account overheads in ESA,distribution of contracts by value chain andvariations in multipliers, including contracts forscientific and public agencies, tax cost and import
To understand the wealth creation dynamics, thecurrently active successful firms have been studiedin more detail.
This analysis looks at the costs associated with afirm contract and compares these to the benefits itcreates. We focus on a more recent time periodfrom 2004 to 2013 (projected sales). A subset of 25currently active firms have been studied.scientific and public agencies, tax cost and import
The net gains for economic activity in Norway isabout 16 percent. There may be additional economywide technological gains not accounted for. Abudget allocation of 100 will result in an increasedactivity level in the economy of 100+16. We shouldalso note that Norway has other objectives with ESAparticipation including access and contribution to acommon European infrastructure. Those benefits
currently active firms have been studied.Costs include ESA contract and NRC supportvalue, ESA admin and foregone returns. Costs areassigned proportionally by contract value. Thisdiffers from the approach to the left where all costsincluding those not attributable to firms wereincluded. Impacts are seen from salaries andprofits. Wage related effects is by far the largestcontributor to benefits comprising 76 percent.
Full money cycle analysis show aboutsixteen percent gain in activity
: Flow of funds and impacts of ESA12
Costs
12000
Benefits
×3,6
Value creation impacts from firmswith ESA contracts at 3,6 ratio
Figure 27: NPV costs and benefits 2004-2013
19
Government
ESA/Space centre
Tax cost andimport content
Net+economy wide
100
100 + ≥160
2
4
6
8
10
0
2000
4000
6000
8000
10000
2000
4000
6000
8000
10000Income tax
Value addedtax
Retail salesrevenue
Corporatetax
Retainedearnings
Wage
Profits
×3,6
Bill
ion
NO
KDetails and source information are available on pages 170 to 173, and 182 to 197 in the main report.

Data from satellites potentially offers cost efficiencies and qualityimprovements for important public sector functions. Satellite borne sensorscan collect data for large areas, repetitively and within short time intervals.A strategy was developed during early 2000’s setting out the objectivespriority activities. Objectives have later been refined and has in practicefocused on two priorities:• Developing infrastructure to secure access to data;• Focus on Ocean and Polar regions as these potentially offered the greatest
Public service programs has enhancedmaritime surveillance capabilities
Summary report
• Focus on Ocean and Polar regions as these potentially offered the greatestcost efficiency potentials for Norway.
Different instruments exists. First, there are special development funds todevelop applications for agencies. Second, there are specialized programssuch as access to radar satellite data and AIS (ship tracking) data. Third, thereare benefits from ESA in terms of access to developments and satelliteinformation.
There are three agencies who operate highly professional and institutionalizedsystems on this basis. Those are the defense, coastal authority and thegeological survey. A fourth, the meteorological institute is a heavy user butoperates mostly on the basis of EUMETSAT specialized data outside of thepurview of this analysis. About ten to fifteen further agencies and R&Dinstitutes have various smaller projects most under implementation.
The flagship program is highly focused on providing maritime operationalservices. This is about surveillance and monitoring of ocean and arctic
PwC 20
services. This is about surveillance and monitoring of ocean and arcticregions, ship traffic, fisheries monitoring, ice coverage and oil spill detection.These services are operating 24/7 integrating the satellite data with othersensors. Land based programs are increasingly important and the geologicalsurvey scans the country to detect surface instabilities and monitors certainhigh risk areas for catastrophic events.
Radar data are purchased to enhance maritime and terrestrial monitoringability. These are much used for defense and security purposes, and wellintegrated into operations. There is also a highly relevant AIS satelliteprogram to enhance maritime surveillance and satellite successfully launchedby government. In total, advanced, integrated and user responsive monitoringsystem, but considerations to cost and governance issues can be addressed.
Figure 28: Snapshot of satellites above Norwegian territories a day inFebruary 2012
Busy above Norwegian waters as ESA satellite Envisatcaptures data enroute north
20 Details and source information are available on pages 135 to 154 in the main report.

Use of satellite earth observation data is increasing.Agencies may also be using communicationssatellites which is more mainstreamed and notincluded here. Data are mostly used for monitoringand surveillance, but also for a range of otherapplications such as mapping and detecting culturalheritage sites. About 22 agencies have some use withfour big users dominating.
There are no direct benefits stemming fromsatellites. The satellites provide informationthe benefits depend upon how the information isacted upon.
Determining the value of information is complex. Arange of outcomes are likely even in the case offairly closed system contexts like the dedicatedNorwegian used satellite systems (i.e. Radarsat and
Net economic benefits of public service programs, but needs focus on costreduction and benefits realization
Summary report
About half of the satellites used are commercial andprovides high resolution optical images or radar.Public satellites offer free information andgovernment accesses both European and U.Ssatellites.
Norwegian used satellite systems (i.e. Radarsat andAIS).
The value will depend upon perceived risks,effectiveness of response options and theincremental information content value. Economicsciences generally find a value of 1 percent of totaloutput stemming from availability of perfectinformation.
Figure 29: Users of radar data under theagreement 2010
Three professional heavy users ofradar data
Figure 30: Value of satellite information fordetecting illegal fishing (example)
Value of satellite information forillegal fishing between 11
32 %
27 %
23 %
Defence
Geological Survey
Coastal Authorithy
PwC
23 %
3,9 %
3,8 %
2,3 %
2,3 %
1,4 %
1,4 %
1,0 %
0,6 %
0,5 %
0,3 %
0,2 %
Coastal Authorithy
Defence research
NORUT
University of Oslo
Metherological Institute
Geotechnical Institute
Univeristy of Tromsø
Directorate of Fisheries
Nansensenteret
Forest and landscape…
Polarinstitute
Computing Center
- 10 20
Cod
Haddock
Million NOK
21
There are no direct benefits stemming fromsatellites. The satellites provide information – andthe benefits depend upon how the information is
Determining the value of information is complex. Arange of outcomes are likely even in the case offairly closed system contexts like the dedicatedNorwegian used satellite systems (i.e. Radarsat and
There can be variations. In particular in caseswhere there are deterrence effects such asmonitoring of fisheries and oil spills.
Value of information for oil spills has been found tobe between 1-10 percent across Europe (PwC2008: Booz Co 2011). Value for fisheriesmonitoring have been found to be in the samerange. Value for geohazards is less because the
Net economic benefits of public service programs, but needs focus on cost
Norwegian used satellite systems (i.e. Radarsat and
The value will depend upon perceived risks,effectiveness of response options and theincremental information content value. Economicsciences generally find a value of 1 percent of totaloutput stemming from availability of perfect
range. Value for geohazards is less because theresponse options are more limited.
The value of satellite information in Norway hasbeen quantified across the main usages: Oil spilldetection; fisheries monitoring and geohazards.
We apply conservative estimates for value andgenerous estimates of cost. The range of benefits isvalued at between 13-65 million annually. Costs areabout 25 million annually. By far the highestimpact is found from fisheries monitoring. Thereare also important impacts from oil spill detectionand geohazards monitoring. Much resources forthe latter is devoted to monitoring of high riskareas. The cost and loss of life of a major landslidein these areas is extraordinarily high. The
: Value of satellite information fordetecting illegal fishing (example)
Value of satellite information forillegal fishing between 11-56 million
in these areas is extraordinarily high. Theprobabilities are unknown and the cost efficiencyof monitoring cannot be meaningfully ascertained.20 30 40 50
30-35 million 13-65 million
CostsValue of
information
21 Details and source information are available on pages 172 to181 in the main report.

The programs have delivered specific results over time, but declining contribution towealth creation and uncertainty about sustainability
Overall objective
Space activities in Norway shall provide substantial and persistent contributions to wealth creation, innovation,knowledge development, and environmental- and public safety.
The overall goal encompasses different elements. The concepts are not mutuallyexclusive and overlap. i.e.. knowledge development and innovation. The
Summary report
Activities through ESA are less directly relevant for the enhanced public sector
exclusive and overlap. i.e.. knowledge development and innovation. TheMinistry has also defined more specific objectives and a discussion of progresson detailed objectives are found in the main report and the annex.
Specific results, but unclear impact on sustainable growth andwealth creationOverall turnover of the space industries in Norway have declined by between15-25 percent since 2003 depending upon how inflation is adjusted for.Contributions to wealth creation overall in Norway had declined by 33 percentsince 2003 as defined by GDP with or without petroleum included. Employeesinvolved in space activities have declined by nearly 50 percent since late 1990’sthough this measures only captures about 80 percent of companies.
Support for space related activities has provided results, but these are probablydeclining. There has been strong sales growth for those firms that receive mostof the support albeit insufficient to offset the larger decline. There is growth insome segments of the value chain and some firms have seen phenomenal
PwC 22
some segments of the value chain and some firms have seen phenomenalsuccess. These do not necessarily coincide with those that receive support.Ripple effects on sales of the public support are reported and the socio-economic benefits are net positive.
The profile of the support portfolio is increasingly decoupled frommarket developments, business structures and growth potentialover time. As such we question the sustainability of the support overtime. It may also mean that the results are better for the evaluation period as awhole rather than the last few years in isolation.
The programs have delivered specific results over time, but declining contribution towealth creation and uncertainty about sustainability
Space activities in Norway shall provide substantial and persistent contributions to wealth creation, innovation,and public safety.
Substantial and persistent contributions to environmental- and publicsafety are seen.The national programs targeting ocean and polar monitoring capabilities havecontributed towards environmental- and public safety. The systems provideinformation important for environmental safety. The space activities have alsocontributed much to the processing and institutionalizing of the information.Thereby increasing the probability of positive impacts on environmental and publicsafety.
Activities through ESA are less directly relevant for the enhanced public sectorcapabilities. ESA satellites or systems are today largely irrelevant for thesecapacities. There are however other linkages. The knowledge and insights, earlydevelopment of algorithms, and development of the ground station have muchdevelopment of algorithms, and development of the ground station have muchbeen through ESA activities. For the future, the EU GMES holds much potentialalso for Norway. Dedicated access to other sources for a.o radar data is likely to berequired also in the future.
Environmental- and public safety are also concepts which may have differentmeanings depending upon circumstances. They are not defined by the Ministry.
22

Further we discuss the relevance of the policies vis-à-vis the objectives. This is assessing to whatextent the activities are suited to purpose. We willreview the following evaluation questions relatedto relevance:
1. Are the instruments adequate from an overallperspective for achieving the space programs
1. Are the instrumentsoverall perspective for achieving thespace programs goals?
There are differences across segments and we willreview those in turn.
Three observations to note:
Policy and objectives might benefit frombenefits
Summary report
perspective for achieving the space programsgoals?
2. Has the space programs achieved anappropriate balance between the variousinstruments?
3. Is there overlap or conflicts of objectivesbetween ESA participation and nationalsupport funds? Are synergies exploited?
4. How has the Space programs managed toadapt its instruments and advice to the largercontext in which space activities interacts withother social, market, economic, political andenvironmental processes?
Three observations to note:
1. Limited growth potential in upstreamproduction
There is a mismatch between support for upstreamproduction companies and the potential for growthand wealth creation in this segment. This includesmanufacturers of launchers, satellite componentsand ground equipment.
The support is insufficientgoal would be to build a large and sustainablespace industry. That would require a considerableincrease in Norway’s participation in ESA, which ishardly justifiable in terms of Norway’s overallpolicy for industry.
PwC
Additional issues are discussed in the detailedanalysis.
policy for industry.
The difficulties of attaining competitiveness in ESAand global commercial markets of the upstreamsegments are an indication of this. A sufficientlystrong domestic demand does not exist to createanchor demand for upstream actors. Marketleaders are from larger countries and have sizeabledomestic upstream markets available to them.
23
Are the instruments adequate from anoverall perspective for achieving thespace programs goals?
There are differences across segments and we will
Three observations to note:
These difficulties will only increase driven by fivetrends indicated in the analysis:
- as value chains of global conglomerates convergeacross segments and between system integratorsand component producers;
- as emerging markets gain competitiveness andglobal market shares;
Policy and objectives might benefit from adjustment to ensure
Three observations to note:
1. Limited growth potential in upstream
There is a mismatch between support for upstreamproduction companies and the potential for growthand wealth creation in this segment. This includes
launchers, satellite components
The support is insufficient in size and scope if thegoal would be to build a large and sustainablespace industry. That would require a considerableincrease in Norway’s participation in ESA, which ishardly justifiable in terms of Norway’s overall
global market shares;- as U.S firms are driven onto global markets;- as European countries launch semi-commercial
national programs; and- as access to semi-protected ESA markets become
more difficult due to convergence of EU and ESA.
2. Growth and comparative advantages in theservice sectorsOpposite these constraints in the upstreamsegment stands exceptionally strong domesticdemand from other economic sectors notably frommaritime and offshore industries.These are growth drivers for space groundequipment manufacturers, and providers ofcommunications and earth observation services. In
The difficulties of attaining competitiveness in ESAand global commercial markets of the upstreamsegments are an indication of this. A sufficientlystrong domestic demand does not exist to createanchor demand for upstream actors. Marketleaders are from larger countries and have sizeabledomestic upstream markets available to them.
communications and earth observation services. Inthese segments Norwegian firms are global marketleaders and have considerable market shares inbroadly defined market segments.
The tools seem adequate for satellitecommunications services. Relatively smallinvestments here have had big impacts. Thissegment has also seen new entrants with rapidgrowth. There is no need to match the funding tothe scale of the industrial turnover in the absenceof market failures. Rebalancing could beconsidered to support development of near-market-ready technologies. ESA is ineffective tosupport this segment.23

Tools are also adequate for the ground equipmentindustry. Although the space related turnover hasdropped, there is little evidence of constraints inother segments of electronics and communicationsequipment markets. Those who produce spaceground equipment have also grown more stronglyin other segments. The declining turnover isrelated to collapse of one company. The inability ofother firms to maintain or gain global marketshares seem related to firm level decisions offocusing on other market opportunities.
3. Tools to support environmental and publicsafety objectives are adequate or almost so.
There is a reasonable balance at the moment.Government demand is increasing.For the ocean/polar region services this is abouthaving more refined capabilities. The combinationof national development programs and dedicatedinvestments in a.o radar and AIS are adequate forocean monitoring currently. Emerging difficultieshere are about having flexible access to other
Summary report
focusing on other market opportunities.
Tools are adequate to support earth observationservices firms but may be constrained in the nearfuture. In fact, this is driven by strong demandfrom government for monitoring and surveillancecapabilities. Needs , as in territorial, are at aboutthe same levels as that of Europe combined andthis creates anchor demand for certain services.Norwegian firms also have strong competitivepositions in these segments. The nationaldevelopment programs are especially well suited.There is however a risk that the use of the supportfunds has been selectively targeted at a few actors.A consequence is a narrow base to recruit newservice providers from.
Risks here relate to future developments of EU
here are about having flexible access to othersources of high resolution data to meet moresophisticated demand.
Future access to continuous radar imagery need tobe secured given that the current main source isexpiring in some years. There are severalcapabilities available that will meet currentrequirements but costs are likely to increase.
Terrestrial demand is currently adequately met.The model of combining development programswith access to radar satellite data is currentlysufficient. Challenges are emerging. There arecapacity constraints and scheduling conflicts forradar data. Access to optical imagery is not securedon a cost-efficient and continuous basis. Tools areadequate at the moment, but may be limited in the
PwC
Risks here relate to future developments of EUGMES programs. Norway needs access to theseprocesses to maintain adequate instruments tosupport firms in this segment.
adequate at the moment, but may be limited in thefuture as user sophistication grows.
In the near future there also needs to be access toEU GMES institutions.
Next we turn to the question of balance.
24
to support environmental and publicsafety objectives are adequate or almost so.
is a reasonable balance at the moment.Government demand is increasing.For the ocean/polar region services this is abouthaving more refined capabilities. The combinationof national development programs and dedicatedinvestments in a.o radar and AIS are adequate forocean monitoring currently. Emerging difficultieshere are about having flexible access to other
2. Has the space programs achieved anappropriate balance between theinstruments?
Four observations to note:
1. The balance of ESA vs. National programallocations is appropriate but can be adjustedlonger term.
The dynamic between the industry developmenthere are about having flexible access to othersources of high resolution data to meet more
Future access to continuous radar imagery need tobe secured given that the current main source isexpiring in some years. There are severalcapabilities available that will meet currentrequirements but costs are likely to increase.
Terrestrial demand is currently adequately met.The model of combining development programswith access to radar satellite data is currentlysufficient. Challenges are emerging. There arecapacity constraints and scheduling conflicts forradar data. Access to optical imagery is not secured
efficient and continuous basis. Tools areadequate at the moment, but may be limited in the
The dynamic between the industry developmentprogram and the ESA programs seem to work well.
There is an observed difference in scale of nationalprograms vis-a-vis ESA contributions compared toother larger space manufacturing nations.
Matching the funding levels of these countries isunattainable. Policy attempts to compensate forthis are futile and will fail. Further selectivity andspecialization may be considered.
The recent scale-up of ESA financing isquestionable to the extent that it is not absorbed byindustry contracts. The ration betweencontributions and contracts is increasing. Theindustrial return coefficient is below target and hasto be met by separate transfer schemes from ESA.adequate at the moment, but may be limited in the
future as user sophistication grows.
In the near future there also needs to be access to
Next we turn to the question of balance.
to be met by separate transfer schemes from ESA.
National program funds on the other hand may beinsufficient to meet public sector demand in thefuture. A necessary scale-up of commercializationstrategies in the services segment for which ESA isless relevant may also be considered. Futuregrowth may need to be directed towards this.
24
2. Intra-ESA program allocations should bereoriented towards those segments with bestpotential for growth and wealth creation
There is a risk that current allocations are drivenby other than cost-efficiency considerationsincluding path dependency. Its fragmented, drivenby expectations about where industries can deliver.Today's and specialization should be revised. Thesupport is not oriented towards those segmentswith the highest growth or wealth creation
3. Allocation of intra-national programshould be reoriented and increase in scope.
Consider increasing service development funds.This is where the highest returns and growthpotentials are seen.
A risk is that current involvement of commercialearth observation firms is too narrow and selective.Increases here need to be met by strategies toincrease broader involvement of commercial
Summary report
with the highest growth or wealth creationpotential.
The current allocation distribution implies mostfinancing for launchers and satellite componentmanufacturers. This is questionable on cost-efficiency grounds as there is less growth potentialand lower ripple effects than other segments. Somerebalancing may be warranted.
At a certain level, optimizing this allocation will beconstrained by the fact that ESA predominantlyoffers opportunities for upstream and hardwareproducers.
Strategies for increasing participation ofdownstream actors, within or outside of ESA mayneed to be considered. This is where ripple effects
increase broader involvement of commercialservice firms. Meeting longer term public sectordemand also speaks for increasing this share.
Another risk is that cost-efficiencies achieved bymonitoring of ocean areas by satellite does notcurrently have its equivalent on the terrestrial side.This may change in the future. But care iswarranted in assessing alternatives.
4. Allocations between scientific activities andindustrial support needs to clarified in atransparent policy., there is an unresolved balancing issue withregards to the funding of scientific space activitiesThese contributions have over the last decade notonly pertained to the ESA mandatory scientificprogram, but also to other programs like the
PwC
need to be considered. This is where ripple effectsare higher and growth potential larger.
The fragmented nature of ESA program allocationsimplies much discretion for the space centre indetermining allocations. The implicit prioritizationof certain industrial segments that the allocationsimply, are not articulated, explicit or transparent.
program, but also to other programs like theInternational Space Station and more importantlythe Earth Observation Program. This reflects thescientific nature of many of the ESA Optionalprograms.
Finding an appropriate ESA investment level thatis targeted at scientific communities need to takeinto consideration the scientific capabilities andpriorities. This is what is being done in practicetoday. Balancing the scientific funding level withother investments however is ultimately a policychoice. It is not transparent today. Resolutioncould be sought within an overall policy frameworkfor space policy including science.25
national program fundsshould be reoriented and increase in scope.
Consider increasing service development funds.This is where the highest returns and growth
A risk is that current involvement of commercialearth observation firms is too narrow and selective.Increases here need to be met by strategies toincrease broader involvement of commercial
3. Is there overlap or conflicts of objectivesbetween ESA participation and nationalprograms? Are synergies exploited? Arethere other conflicts of objectives?
Three observations:
1. the synergies of industrial national supportfunds and ESA participation are strong. There isclear alignment of the priorities of the nationalprogram and the ESA activities. Overlaps orincrease broader involvement of commercial
service firms. Meeting longer term public sectordemand also speaks for increasing this share.
efficiencies achieved bymonitoring of ocean areas by satellite does notcurrently have its equivalent on the terrestrial side.This may change in the future. But care iswarranted in assessing alternatives.
4. Allocations between scientific activities andindustrial support needs to clarified in a
there is an unresolved balancing issue withregards to the funding of scientific space activities.These contributions have over the last decade notonly pertained to the ESA mandatory scientificprogram, but also to other programs like the
program and the ESA activities. Overlaps orconflicts are not significant
2. the synergies between national servicedevelopment programs and ESA are weaker. Theyexists, mostly through the ESA Earth Observationand met programs, but are not as strong as for theindustrial side.
This is a reflection of the priorities of ESA. Thescientific oriented earth observation programs areless suitable for meeting operational demand andrequirements from the public sector in Norway.ESA satellites don’t meet the requirements forcontinuity of access or don’t have the appropriatecapabilities.
In the future, this arena will shift towards the EU.program, but also to other programs like theInternational Space Station and more importantlythe Earth Observation Program. This reflects thescientific nature of many of the ESA Optional
an appropriate ESA investment level thatis targeted at scientific communities need to takeinto consideration the scientific capabilities andpriorities. This is what is being done in practice
the scientific funding level withother investments however is ultimately a policychoice. It is not transparent today. Resolutioncould be sought within an overall policy frameworkfor space policy including science.
In the future, this arena will shift towards the EU.It will be important to influence the EU processesto ensure alignment of objectives.
There is however no future scenario where theobjectives of the national service programs andESA are delinked. A model whereby EU systemsare developed by ESA, such as for GMES, impliesthat there will be linkages also in the future.The same applies for EUMETSAT.
25

The implication is that it will be more important tosecure alignment of objectives between EUpriorities and Norwegian interests in arenasoutside of ESA in addition to continue influencingdevelopment stages within ESA.
3. there are conflicts of objectives between meetingpublic sector demand and industrial developmentstrategies. Meeting public sector demand in costefficient ways is not aligned with schemes tosupport selective industries.
4. allocation decisions between science andindustry do not reflect conflict of objectives.Uncertainties reflects that the balance has not beendetermined at a policy level. The balancingquestion cannot be resolved through cost efficiencyconsiderations. The objectives and priorities arenot defined by policy. That can be resolved throughpolicy development.
5. allocation decisions between segments ofindustry may be seen as a conflict of objectives.
Summary report
support selective industries.
The support for industry is only aligned with publicsector objectives as long as it leads to lower cost forgovernment, or if the support has wealth creationand ripple effects that exceed the increased costsfor governments. This also applies to bilateralsupport arrangements. This has to be assessed on acase-by-case basis through proper optionevaluation methods.
There is a higher level conflict with structuralpolicies for competition, public procurement andstate-aid. Within ESA this is resolved as ESA is notregulated by EU or GATT principles. For nationalprograms and subsidies this is a problem.
Public procurement and state-aid regulations are
industry may be seen as a conflict of objectives.is not. Those can be determined by costconsiderations.
4- How has the Space programs managed toadapt its instruments and advice to thelarger context in which space activitiesinteracts with other social, market,economic, political and environmentalprocesses?
There are several aspects of this. There are severalindications of appropriate adaptations, and onearea where it is more questionable. Fourobservations:
1. Well integrated with the strategicfocus on the arctic. The support for the
PwC
Public procurement and state-aid regulations arenot well aligned with selective industrialdevelopment objectives. T
The practical implication is that national programsthat try to merge these objectives, i.e. AIS satelliteor Radarsat contract runs into legal compliance orcost-benefit difficulties.
There are only synergies in other areas whereNorwegian industry is internationally competitivebut national programs need to follow procedureswhereby the competition is open. This is a problemtoday.
focus on the arctic. The support for theocean/polar and Barents sea activities are theleading examples of this. The leadership to bringNorway into the GMES programs is also areflection of this. The importance given to Galileoand EGNOS coverage for the north is also anindication.
2. Adapted to the EU/ESAmanifested in funding allocations for EU led workprograms and in attention paid to EU policy issues.
26
allocation decisions between science andindustry do not reflect conflict of objectives.Uncertainties reflects that the balance has not beendetermined at a policy level. The balancingquestion cannot be resolved through cost efficiencyconsiderations. The objectives and priorities arenot defined by policy. That can be resolved through
allocation decisions between segments ofindustry may be seen as a conflict of objectives. It
3. Ability to find opportunities for small spacenations. The programs have adopted to the trendwere costs are falling and single missionmicrosatellites are attainable within a smallresource envelope. This creates opportunities forsmall space programs for small nations. The AISsatellite is the practical manifestation of this so far.
4. Limited adaptation to structural marketdevelopments.
industry may be seen as a conflict of objectives. Itis not. Those can be determined by cost-efficiency
How has the Space programs managed toadapt its instruments and advice to thelarger context in which space activitiesinteracts with other social, market,economic, political and environmental
There are several aspects of this. There are severalindications of appropriate adaptations, and onearea where it is more questionable. Four
Well integrated with the strategic politicalThe support for the
Space programs may have not been adapted well toa broader market trend with increased public-private partnerships and commercialization. Suchconcepts are driving developments within the earthobservation segments, geotracking and militarycommunications.
We see three implications:(a)Increased opportunities for cost-efficient publicsector programs in the future. Service offerings arelikely to expand, in particular those relevant forpublic sector requirements. Prices will fall withincreased competition including from low-costcountries. Flexibility in public sector instrumentsare likely to become more important. The ability toswitch between providers of satellite data, and seekavailable low-cost options will be important.The support for the
ocean/polar and Barents sea activities are theleading examples of this. The leadership to bringNorway into the GMES programs is also areflection of this. The importance given to Galileoand EGNOS coverage for the north is also an
to the EU/ESA convergence. This ismanifested in funding allocations for EU led workprograms and in attention paid to EU policy issues.
available low-cost options will be important.
(b) Risks that other countries, and ESA partners,will shift their priorities into public-privatepartnership programs rather than the joined upefforts in ESA.
(c) Opportunities for out-of-the box thinking interms of matching commercial objectives withpolicy objectives. There will be more ideas like theAIS satellite in the future. A conceptual approachthat brings in private risk capital andcommercialization incentives may make programsfinancially feasible.
26

In management of the space programs there arethree issues to be noted:
1. Lack of proper prioritization and hierarchy ofobjectives
The Ministry sets out the overall objective, anddetermines five sub-objectives, and further 13
2. High risk practices for procurement andcompetition and risk of regulatory breach
Governance risks have been identified during thecourse of the study. This is not a focus area of thework but given the consequences for the space
Governance issues and risks to be handled
Summary report
determines five sub-objectives, and further 13objectives at a level below that. There is a total of19 formulations of objectives, 27 indicators (moreas several are truncated) and about 20 activities orprograms described in accordance with the systemof accounts.
We would suggest revisiting this framework. It is:
• Over focused on performance indicators.• Very many objectives with little prioritization
between them• The objectives are not clearly Unclear logical
relationships.• Poor relationships between the different
objectives and the linkages with activities.• Feedback and adjustment mechanisms are
work but given the consequences for the spaceprograms we note them here.
If not ameliorated, consequences includereputational damage and loss of credibility for thespace programs, wasteful spending and reducedcompetitiveness of the industry.
There is a risk that basic regulations for publicprocurement and competition are not adhered towhile implementing the largest national programsincluding AIS and Radarsat
A rationale for pre-selection and exclusive supportto single actors could possibly be justified, but thecosts of such selection needs to be weighted againstthe benefits of alternative solutions.
PwC
• Feedback and adjustment mechanisms areunclear
Two considerations in such a process:
First, establishing the hierarchy of objectivesworks best as a participatory process. Clarifyingand operationalizing the objectives is a first step inimplementing a robust strategy.
Second, consider establishing a logical alignmentbetween the government framework and the long-term space center plan. Any inconsistency wouldintroduce uncertainty about which frameworksprevails.
the benefits of alternative solutions.
The risks may stem from difficult tradeoffsbetween conflicting objectives especially fornational programs.
A better balancing of public sector needs,industrial development and legal compliance needsto be found.
27
2. High risk practices for procurement andcompetition and risk of regulatory breach
risks have been identified during thecourse of the study. This is not a focus area of thework but given the consequences for the space
3. Potential conflict of interests with KSATownership structure
KSAT is recipient of the largest share of the ESAand NRS funds and part of all national governmentspace activities. There are KSAT board guidelinesfor COI but they are insufficient to ameliorate the
issues and risks to be handled
work but given the consequences for the spaceprograms we note them here.
If not ameliorated, consequences includereputational damage and loss of credibility for thespace programs, wasteful spending and reducedcompetitiveness of the industry.
There is a risk that basic regulations for publicprocurement and competition are not adhered towhile implementing the largest national programs
Radarsat.
selection and exclusive supportto single actors could possibly be justified, but thecosts of such selection needs to be weighted againstthe benefits of alternative solutions.
for COI but they are insufficient to ameliorate therisks.
Close relations and extensive support for KSATimplies conflict of interest, fiduciary risks andblocking new entrant out of the market.
These risks are increasing as KSAT grows rapidly,also in the value added segment, and nationalsupport funds and projects involving KSATexpands. Perceptions of preferred provider statusand proximity of relations acts as a disincentive fornew entrants in a market dominated bygovernment demand and space center managedprograms.
The ownership should be managed within thethe benefits of alternative solutions.
risks may stem from difficult tradeoffsbetween conflicting objectives especially for
A better balancing of public sector needs,industrial development and legal compliance needs
The ownership should be managed within theregular structures of state owned enterprises tohelp avoid such conflicts.
27

Strategic needs
Against the background of the evaluations analysis and conclusions we wouldrecommend the following steps:
1. The support should be reoriented towards segments of industry thatoffer better growth potential and comparative advantages. Maritime andoffshore sectors are the dominant growth driver for the commercial activities ofSatCom services and Earth observation services. The global position is very strong.Technologies are more developed but still in growth phase. Support for near-market ready technologies promise high rewards. There is little involvement of the
Summary report
market ready technologies promise high rewards. There is little involvement of thesupport schemes for this segment and this could be reassessed.
2. Services related to earth observation have anchor tenants and growthdrivers in the Norwegian government which can release technologydevelopment and ensure demand for services. Global market position isstrong. Technologies and service concepts are in the growth phase. Support shouldaim to broaden participation to include other companies. A strategy forcommercialization should be developed for government purchases of earthobservation data services to exploit the government demand as growth driver innew value-added segments. This can benefit from involving a broader segment ofbusinesses and a more competitive and open process than it is today.
3. The support for space related business development should increasein scope across the value chain and in number of companies to ensureequal competitive conditions across actors and solutions. Recruitment ofnew businesses from i.e.. R & D, IT and telecom services expand the base form thecurrent low number of firms who have been repeat actors for decades.
PwC 28
current low number of firms who have been repeat actors for decades.
4. Further support for segments with stagnating growth shouldbe reassessed to ensure that the support matches the growthpotential. Space related ground equipment has some maritime anchortenants, but seems to have decoupled with respect to growth. Supportmust be very carefully considered as contributions to growth and wealthcreation are doubtful. Parts of space manufacturing has a strong trackrecord in global sub segment. There are however no domestic growthfactors. Major obstacles are apparent in global markets. This segmentreceives most support today. Rebalancing should be considered takinginto account whether potential growth and wealth creation impacts arebetter elsewhere.
5. ESA programs are mostly relevant for the upstream spacemanufacturers. ESA programs are less useful for services andother tools may need to be developed and prioritized. Thiscould include expansion of national program expansion may benecessary to provide the near-market-ready support for downstreamservices.
28

Operational suggestions
1. The Ministry should develop a holistic policy for space activitiesincluding determining the relative importance of support industrialdevelopment, public sector programs and science.
2. Space related investments should be made subject to broader economicoption analysis if national program investments are to be expanded. Life-
Summary report
option analysis if national program investments are to be expanded. Life-cycle costs, market options, and tradeoffs between national contentprovision and additional cost for government need to be assessedaccording to normal standards.
3. If bilateral deals and industrial return schemes: consider transparencyand competitive schemes for national content to reduce fiduciary risksand optimize outcome. Bilateral agreements and industrial returns donot come for free. Costs of these against alternatives need to madeexplicit or risk serving narrow interests.
4. There is increasingly a market capable of meeting Norwegiangovernment operational requirements for a.o radar and AIS data.Competitive procurement schemes need to be considered. Consideradvanced procurement strategies to ensure competitive offerings a.ocompetitive dialogue, framework agreements and multiple sources.There may be a need to separate the support schemes from acquisition ofpublic services as tehse serve different needs and objectives. Clarify ordevelop policy principles for how to handle the balance of conflicting
PwC 29
develop policy principles for how to handle the balance of conflictingobjectives for: procurement for public need, industrial developmentobjectives, bilateral collaboration; and legal compliance and fiduciaryrisks. The Ministry should review ongoing and planned procurements orsupport schemes to ensure there is regulatory alignment and fiduciaryrisks are handled. Rapid external developments dictates rethinkingbefore further AIS satellite investments. Market options and viability ofgovernment alternative should be reviewed with proper methods.
5. The Ministry and the Space Centre should reassess the governanceframework and tie this more closely to the governance dialogue andstrategy. The logical framework should be reviewed and furthersimplifications and alignment with the long-term strategic plan shouldbe implemented.
6. Improve transparency of the grant schemes and ESA support.Information is not publically available today and this is problematicespecially n light of how few companies that are involved and thatreceives substantial support.
7. Reduce conflict of interest potential with KSAT by reorganizingownership management.
8. Consider reinforcing monitoring of ESA budget and account measuresthrough the IPSAS accounting transition
9. If further scale-up of national programs, the space center may need to bereinforced.
10. If EU/ESA relationship converge further, the space center may needadditional support.
29

PwC
Detailedanalysis

Table of Contents Detailed Analysis
Introduction
Section 1 Analysis of developments
Section 1.1. Market and industry developments
Section Overview
Section 1.1. Market and industry developments
Overview
Value chain developments
Section 1.2 External Institutional & Policy Developments
Global policy drivers
Emerging markets development
Peer country developments
Section 1.3 Implementation of the space programs
ESA activities
National Programs
Section 2 Policy Effectiveness
Section 2.1 Impacts
Industry impacts
Public service impacts
Socio-economic impacts
Section 2.2 Meeting the objectives
Section 2.3 Governance and Risks
Section 3 Suggestions for the future
Appendices
32
42
43
Page
43
44
56
87
88
98
102
112
115
135
155155
156
157
172
182
192202
206
210-240

PwC
Introduction

PwC
Structure ofthe analysis
33
The objective of this section is to establish a factual basisupon which we can have a reasoned discussion of relevance,effectiveness, strength and weaknesses of the national spaceprograms.
Section 1Analysis ofdevelopments
Section 2 Policy effectiveness
The objective of this section is to determine real worldThe objective of this section is to determine real worldimpact, the degree of success of the space programs in reachingthe objectives and governance risks.
Section 3Suggestions for thefuture
The objective of this section is advice on future changes to theprogram priorities, approaches and governance.
33

The objective of this section is to establish a factual basisupon which we can have a reasoned discussion of relevance,effectiveness, strength and weaknesses of the national spaceprograms. Four important issues are covered:
Section 1
The objective of this analysis is to reviewdevelopments in industry and the markets it
The objective of this analysis is to analyzedevelopments in the external institutional and
Analysis ofdevelopments
1.1 Markets and industrialdevelopments
1.2 Institutional and policydevelopments
developments in industry and the markets itcaters to.
We focus on two areas:
I. Overview of developments of spaceindustries in Norway. We focus onimportant metrics that helps us understandhow the industry performance andstructure has evolved over time and vis-à-vis global developments; and,
II. Space industry value chain worldwideand in Norway. This is useful to understandhow the industry is structured and how ithas evolved. What are the industry chaineconomics; supply and demand? What arethe markets segments, trends and resulting
developments in the external institutional andpolitical arena which have implications for therelevance and effectiveness of the national spaceprograms.
There are three perspectives on this:
I. Global policy developmentsreviewed first. This is about the:
• the U.S. 2010 policy.review what the Americans haveenvisioned and discuss how industryand government in Norway may beimpacted; and
•European issues.about the reconfiguration of ESA andEU relationships with the implications
PwC 34
opportunities and risks.
This is a global industry and we analyze demandand supply worldwide, and identify Norwegiancapabilities and trends in the market segments.
EU relationships with the implicationsthis has for priorities and direction ofpolicies.
II. Emerging market developmentsabout how developments in major emergingeconomies may impact space programs inNorway.
III. Peer country review
will focus on how these countries handle issuesof interest for Norway. We focus on threecountries : Canada, Sweden and Switzerland.
of this section is to establish a factual basisupon which we can have a reasoned discussion of relevance,effectiveness, strength and weaknesses of the national spaceprograms. Four important issues are covered:
The objective of this analysis is to analyzedevelopments in the external institutional and
1.2 Institutional and policy
The objective of this analysis is to review howthe programs have been implemented. What has
1.3 Implementation ofprograms
developments in the external institutional andpolitical arena which have implications for therelevance and effectiveness of the national space
There are three perspectives on this:
Global policy developments arereviewed first. This is about the:
the U.S. 2010 policy. We willreview what the Americans haveenvisioned and discuss how industryand government in Norway may beimpacted; and
European issues. This is primarilyabout the reconfiguration of ESA andEU relationships with the implications
the programs have been implemented. What hasbeen the activities? Where has the monies beenspent? How is it governed?
We focus on three areas:
I. ESA Activities. How has Norway engagedwith ESA? What has been the priorities?What are the developments over time?What segments of the value chain areengaged?
II. National programs. These have hadcomplementary and supporting functions tothe ESA engagements. We review thesupport for industry, and the programs toenhance public utilization of spacecapabilities. This includes a review of the
34
EU relationships with the implicationsthis has for priorities and direction of
market developments isabout how developments in major emergingeconomies may impact space programs in
Peer country review
will focus on how these countries handle issuesof interest for Norway. We focus on threecountries : Canada, Sweden and Switzerland.
capabilities. This includes a review of theRadarsat program.
III. Governance. We review the relationshipsbetween the Ministry and the Space Centerand how the programs are managed. How isthe strategy devised, planned and executed?How effectively is it monitored? What risksmay exists?

Section 2 Policy effectiveness
The objective of this section is to determinethe degree of success of the space programs in
The objective of this analysis is to analyze whathas happened as a results of the programs. What
2.1 Impacts 2.2 Meeting objectives
the degree of success of the space programs inreaching the policy objectives.
Two important issues are covered:
I. Relevance. This is assessing to whatextent the activities are suited to purpose.Are the activities and outputs consistentwith the overall goal? Are the activities andoutputs consistent with intended impactsand effects?
II. Effectiveness. This is about assessingwhether the objectives has been achievedand what are the major factors impactingachievement of objectives.
has happened as a results of the programs. Whatreal difference has they made? We presentimportant facts and analysis to help establishwhat the policies have accomplished.
We focus on three areas:
I. Supported space industries. We discussimpacts by segments and over time. Howhas their business evolved? How importantare the public development funds andcontracts? Are there ripple effects and techtransfer? What's the growth, theemployment and the profits?
II. Public sector impacts. Many activitieshas targeted utilization of satellitecapabilities in the public sector. We review
PwC 35
capabilities in the public sector. We reviewwhat impacts are seen.
III. Socio-economic assessment. A deeperanalysis of how the programs contribute toeconomic and social development. Howdoes the costs transfer into broader societalgains? What would have happened in theabsence of the space programs?
of this section is to determinethe degree of success of the space programs in
2.2 Meeting objectives 2.3 Governance and fiduciaryrisks
The objective of this section is to identifygovernance risks, mitigation strategies andthe degree of success of the space programs in
reaching the policy objectives.
Two important issues are covered:
This is assessing to whatextent the activities are suited to purpose.Are the activities and outputs consistentwith the overall goal? Are the activities andoutputs consistent with intended impacts
This is about assessingwhether the objectives has been achievedand what are the major factors impactingachievement of objectives.
governance risks, mitigation strategies andcritical enablers for program success.
This will focus on two areas:
I. The concepts for determiningobjectives, allocating activities andresources and measure and reporton progress; and
II. Important governance andfiduciary risks to the spaceprograms and which should bemitigated.
35

Section 3Suggestions for thefuture
The objective of this section is advice on future changes to the programpriorities, approaches and governance.
This has two important sections:
I. Strategic considerations:misalignment of objectives and approaches and suggest ways toreadjust; and
II. Operational suggestions:deficiencies in realization of objectives, high cost inefficiencies orgovernance risks and suggests mitigation strategies to amelioratethe negative impacts.
PwC 36
Suggestions for thefuture
of this section is advice on future changes to the programpriorities, approaches and governance.
This has two important sections:
Strategic considerations: Identify areas of strategicmisalignment of objectives and approaches and suggest ways to
Operational suggestions: Identify areas where there is risk ofdeficiencies in realization of objectives, high cost inefficiencies orgovernance risks and suggests mitigation strategies to amelioratethe negative impacts.
36

Important legacies have shaped today’s space policy in Norway
“ The Norwegian Space Sector is predominantly “down to earth”.
Pål Sørensen, First Managing Director of the Norwegian Space Center.*
This phrase, as presented by the managing director in his final editorial of theannual review in 1997 encapsulates both the political orientation and theindustry capabilities. In the metaphoric sense, this emphasizes the significance
Introduction
industry capabilities. In the metaphoric sense, this emphasizes the significanceof utilitarian aspects of developing space capabilities in Norway. Policypriorities have been consistently pragmatic focusing on user needs and valuecreation
The phrase also indicates the capabilities and direction of industry and spaceresearchers. The Norwegian Space Community has been dominated by groundequipment producers, earth observation applications, download stations andcommunications. This is very much the case today although increasingly thereare businesses successfully aiming for space in the literal sense.
Legacies
Choices from decades ago shape the structure of Norway’s space capabilitiestoday and these also shape current policies and priorities.
The first important legacy is the decision to focus on business development,and in particular the concerted effort to develop maritime satellitecommunications. This turned out to be a highly significant for today's industry
PwC
communications. This turned out to be a highly significant for today's industrystructure. Today there are world leading maritime satellite communicationsbusinesses in Norway and this is largely the result of visionary leaders and aneffective industrial lobby at that time. In the late 1960’s, focused efforts set thestage for defining telecommunications as the main priority for the Norwegianspace effort. **
37
Source: NSC Annual review 1997; ** Røberg 2005
The telecom focus was originally oriented towards equipment producers butalso through engagements in Inmarsat and other service offerings. There wasan industrial electronics manufacturing base, and as importantly, there werecommercial anchor tenants in the large merchant fleet controlled by NorwegianShip-owners.
Important legacies have shaped today’s space policy in Norway
With some important changes in direction and make-up this still holds truetoday. Maritime satellite communications is by far the largest segment of theindustry. The communications service segment has evolved to become thedominant feature of the industry encompassing some 60 percent of sales. Theservice segment is today mostly about providing internet broadbandcapabilities for ships and platforms. The communications ground equipmentindustries are still significant, but are struggling with increasedcommoditization and competition from low-cost producers. Their relativeimportance in the Norwegian economy has much declined.
The second important legacy stems from the realization that remote sensingand earth observation capabilities of satellites would be an effective solution toresolving strategic challenges for government related to the new-found wealthin the ocean territories of Norway. This argument found traction at the timeand eventually carried over into ESA membership later. Early initiatives wherelaunched i.e. to develop radar data processing capabilities, and also focusedmuch on establishing telemetry stations – originally in Tromsø. These prioritiesmuch on establishing telemetry stations – originally in Tromsø. These prioritieshave remained, and perhaps even increased in importance as the Arctic north isbecoming an important strategic theatre for Norway.
37

Today’s policies are mostly a continuation of the past
Norwegian space policies are still founded upon developing industrial andcommercial capabilities, as well as ensuring that public sector utilitarian needsare met.
The stated objective of Norwegian support for space activities is:
“To provide substantial and sustainable contributions to wealth
Introduction
“To provide substantial and sustainable contributions to wealthcreation, innovation, knowledge development and environmentaland public safety”
The policies are expressed in annual budget appropriation documents, and withregards to particular high profile issues, such as the decisions to participate inGalileo. More detailed documents governing the relationship with the NationalSpace center sets out objectives and targets. The Space Center developstriennial plans which in effect is a more fully fledged strategy.
Government has a set of policy instruments to support these objectives:
• Most significant instrument is participation in the European Space Agency(ESA). Through this involvement, Norwegian businesses, scientists and civilservants participate in developments of programs which by themselves are tocostly and complex for the Norwegian government or industry to undertakeon their own.
• There are also other instruments; including use of national funds to
PwC
• There are also other instruments; including use of national funds tocomplement ESA activities or to achieve other objectives.
Most of the instruments are managed by the Norwegian Space Center whichoperates under the auspices of the Ministry of Trade and Industry.
38
There are also other relevant government institutions and financing involved inspace activities but for different purposes. This includes science; domesticuniversity based activities and financing and contributions to EU Frameworkprograms (FP7); or memberships in other space related internationalorganizations such as the EU meteorological organization EUMETSAT.
Today’s policies are mostly a continuation of the past
Public funding for space activities in Norway, including science and publicsector agency activities constitutes about a sixth of the total economic activity inthe sector. ESA participation constitutes about half of the total governmentspending.
The space industry in Norway extends far beyond those activities which aresupported directly through government instruments. In fact, about 95 percentof Norwegian enterprises sales are for commercial markets.
38

Future directions to take account of important developments
Things have changed. Determinants of much of today's capabilities are stillbased upon important legacies, but current external developments, bothcommercial and political, have altered the landscape. Future direction is lessobvious.
First, the internal capabilities in Norway have expanded greatly over the lastdecades. Space based businesses have become commercial successes in more
Introduction
decades. Space based businesses have become commercial successes in moreareas than before, including in classical space manufacturing disciplines suchas launchers and satellite components. Even within once dominated public areaof telemetry and downloading stations, we now find this as a commercial andglobal enterprise. Maritime satellite communications services are global leadersand this is evolving without any direct public financing. Technologies havebecome cheaper and Norway has launched its first satellite at a cost of “only” 30mill NOK (USD 5,2 mill). This does open new possibilities.
Second, the domestic industry structure is changing and is now mostly directlyforeign owned. Global industrial conglomerates control the largest share ofNorwegian space industries. Maritime communications services firms hasproven to be very attractive acquisition targets. The once successful groundequipment industry has seen much decline, which is only partially compensatedfor by a small growing space manufacturing and launcher industry. The otherservices (other than satellite communications services) segment is the fastestgrowing and second only to satcom in size. The industry turnover in Norwayoverall has seen a decline over the last 5-10 years.
PwC
overall has seen a decline over the last 5-10 years.
Third, the global space industry is emerging as a more commercial structure.Telecommunications services operate fully commercial, but commercializationis increasing also in other areas such as imagery, radar and geotracking. This isstill a world heavily dominated by Governments and public expenditure, butthe relationships are evolving. Important national programs are beingorganized as public private ventures whereby government and business shareboth upside and risks. Remote sensing data, imagery and radar, are nowavailable as commercial products from several producers. The satellites are stillheavily supported by Governments although private financing is involved.
39
Fourth, the military frequently utilizes satellites with dual civilian and militarycapabilities. The Norwegian Military will develop a communications satellitewith Hisdesat, a Spanish based manufacturer, and lease capacity to commercialcustomers. Another case in point is that GeoEye-1, one of the better imagesatellites currently in flight was financed in part by the Geospatial IntelligenceAgency in the U.S and delivers images to the intelligence services, to otherprivate and public customers worldwide, and to Google for its Google Earth
Future directions to take account of important developments
private and public customers worldwide, and to Google for its Google Earthapplication.
Fifth, the world of policy and institutions are also changing. U.S. space policieshave changed much. There is a determined focus on commercialization andpublic expenditures are reduced. Relationships between ESA and the EU arestill being worked out and the outcome has the potential to weakens Norway’sposition and industry’s access to European institutional markets. There may beincreasing opportunities for bilateral relationships with other countries, butgovernment may also find itself involved in various public-private ventures,national and international. The current agreement with Canadian firmMacDonald, Dettwiler and Associates Ltd. (MDA) on use of Radarsat-2 data isan example.
Emerging market nations have entered space and their priorities and industrialcapabilities are considerable and rapidly expanding. China now rivals Russiafor most satellite launches and has already passed the U.S. India rivals U.S.satellite image firms and disrupts the markets by offering images at less than asatellite image firms and disrupts the markets by offering images at less than athird of the price.
These issues will impact outcomes in Norway for years ahead.
39

Objective, scope, and methodologies of the review
The objective
The objective is to evaluate the participation in ESA, the Radarsat agreementand the national support funds. The evaluation should also provide a basis forassessing the socio-economic benefits of the programs.
The review is commissioned by the Ministry of Trade and Industry and
Introduction
The review is commissioned by the Ministry of Trade and Industry anddelivered in March 2012.
The ministry highlights three themes of particular importance:
-Whether the programs contribute to the accomplishments of the space policyobjectives;
-Assess the socioeconomic benefits of participation in the programs, and
-Identify areas of improvement.
The request from the Ministry outlines a number of areas and detailedquestions, all relevant to evaluate the past performance of the space programs,as well as to point the way ahead. Some questions in each area are about therelevance of the objectives such as scaling of programs and priorities, others areabout effectiveness in reaching the objectives, while others again are about thecost-efficiency. It may require different methodologies to answer them all andhence it is useful to distinguish them.
PwC 40
The scope
There is a range of policy instruments to support space activities in Norway. Wewill review the first three on this list. A listing of programs would include:
1. Participation in the ESA. ESA mandatory and the Optional program,
participation in which should reflect the Norwegian priorities.
Objective, scope, and methodologies of the review
participation in which should reflect the Norwegian priorities.
2. The funds managed by the National Space Center for dedicated programs
for industrial development and public service development including
special initiatives such as AIS and Radarsat to enhance public sector
capabilities.
3. Purchasing of radar satellite data through a separate agreement with
Canadian firm MDA.
4. Participation in EU activities, whereby the space component is developed
under ESA, such as Galileo and GMES.
5. Participate in other EU activities; FP7
6. National research programs through the Research Council support.
7. Science activities at universities and colleges.
8. Special programs i.e. (EASP) for national infrastructures, particularly the
rocket range at Andøya.
9. Military activities including development of the new communications
satellite.satellite.
10. Participation in dedicated organizations such as EUMETSAT and
COSPAS-SARSAT.
11. Meteorological activities I Norway and by EUMETSAT.
12. Range of other public expenditures such as basic financing for science,
higher education: and agency funding and activities such as the coastal
authority.
40

Interactions between these instruments are important and we will explore
those when relevant to inform the analysis.
Science is an integral part of the space activities. There are many space science
activities in Norway and meaningful analysis of this needs to be holistically.
That is beyond this work.
The focus the last ten years and if data is available, even longer back. There arelong lead times in development of space activities and the fruition of policiesmay not be seen for decades. The Ministry mandate focuses on the years 2004-2010.
Introduction
2010.
There is an emerging global consensus of how to define the space industries.Our approach to analyze the value chain and its definition is aligned with a.oapproaches by the OECD and other market analysis and adapted to what'srelevant for Norway.
The focus is on providing a robust basis for analyzing questions of to whatextent to the instruments are appropriate for the purpose, their adequacy,consistency and balance. These are important issues for the Ministry andespecially in a context with rapidly evolving external and internal issues.
Determining a way forward, including possible adjustments to the balance ofinstruments, will be deliberated upon among the actors. This work providesuseful analytical background for such discussions.
PwC 41
Methodology and data
The evaluation combines indepth interviews with conciderable quantitative
analysis of the support schemes and the sector in general. This includes:
Administrative and business data: Conciderable quantitative data have
been used. The data are collected by the MoTI, NSC and ESA for different
purposes but has some overlaps. As in all administrative datasets there are
certain inconsistencies, broken time series and varying sample sizes. We have
integrated this as best as possible and supplemented with information from
corporate reports, financial statements and press and investor information. In
total this is robust though there are minor unresolved inconsistencies. Thetotal this is robust though there are minor unresolved inconsistencies. The
evaluation also uses company specific information drawn from publically
available sources. We have had access to non-public sensitive information of
single companies and this has been important to calculate certain aggregate
numbers.
Document analysis: Nearly 1500 pages of relevant documents hae been
reviewed. Important documents includes annual reports and budget proposals,
company annual reports, international studies, and a range of market analysis.
This also includes information from press releases, investor relation reporting,
financial analysts, as well as quarterly and annual reports.
Interviews. The analysis is further strengthened by interviews of actors across
all segments of the value chain, private and public alike.
The value chain for space related activivities can be defined in several ways.The value chain for space related activivities can be defined in several ways.
We have based the analysis upon prevailing standards in market analysis and
official publications. This is adapted to the Norwegian context where
appropriate.
To utilize international expertise in the area and also to avoid any ties or
conflict of interests with Norwegian space programs, the report has been
develop din English. The report is translated into Norwegian and both versions
made available.
41

The objectivehave a reasoned discussion of relevance, effectiveness, strength andweaknesses of the national space programs.
Section 1
weaknesses of the national space programs.Four important issues are covered:
I.
II.
III.
PwC
Section 1
Analysis ofdevelopments
III.
IV.
The objective of this section is to establish a factual basis upon which we canhave a reasoned discussion of relevance, effectiveness, strength andweaknesses of the national space programs.weaknesses of the national space programs.Four important issues are covered:
Market and industry developments. This focuses on externaldevelopments and the Norwegian capabilities in particular. We willreview overall chain economics, supply and demand characteristics, andfocus on those core segments that are most relevant for Norwegianindustry and policy.
II. Institutional and policy developments. This focuses on theinstitutional landscape and how it is evolving. How does the new U.S.policies impact Norway? We will discuss the role of the European SpaceAgency, the emerging importance of the European Union and otherinstitutional structures. Review the emerging markets, the prioritiesamong nations and how are peer countries meeting the challenges?
III. Implementation of the space programs. This includes an analysis ofIII. Implementation of the space programs. This includes an analysis ofhow the monies has been spent and to what effect. We will review thepriorities, the important instruments, initiatives and spending patterns.We focus on the three policy segments:
• ESA activities;• National programs; and• Governance: strategy and execution.
IV. Impacts. This focuses in-depth on the effects on the industry involved,on the public sector and on the broader socio-economic context.

Section 1.1
Markets and industrialdevelopmentsdevelopments
43
The objective of this analysis is to review developmentsin industry and the markets it caters to.
We focus on two areas:
I. An overview of developments of space industriesin Norway. We focus on important metrics thathelps us understand how the industryperformance and structure has evolved over timeand vis-à-vis global developments; and,
II. More detailed review of the space industryII. More detailed review of the space industryvalue chain worldwide and in Norway. This isuseful to understand how the industry isstructured and how it has evolved. What are theindustry chain economics; supply and demand?What are the markets segments, trends andresulting opportunities and risks. What’s theNorwegian value chain and how does it relate tothe global markets? What’s the key performancetrends in major segments? What are theunderlying drivers? What are the barriers tofurther growth for Norwegian companies?
This is a global industry and we analyze demandand supply worldwide, and identify Norwegiancapabilities and trends in the market segments.
43

The overview

Activity has declined in real terms but may be reemerging
Figure 1.1: Turnover of Norwegian space related business by product and service 1997(Current and constant 2010 NOK billion)
Turnover declined from 2003 but shown real growth in the last few years
Activities increased strongly prior to 2003and have since leveled off. In real terms thereis a decline starting from 2003 though theremay have been real growth in the last fewyears. The extent of the decline depends uponhow price inflation is adjusted for but activity
Section 1.1: Market and industry developments
Nominal value
how price inflation is adjusted for but activitymay have contracted as much as 25 percentbetween 2003 and 2007 if adjusted forproducer price inflation (PPI). Total activityin this figure includes both institutional andcommercial activities, but excludes consumerTV i.e. Canal Digital and Viasat.
Services constitute the largest segment andhas increased in significance over time.Product manufacturing is about 20 percent oftotal in 2010.
The declining product share is impacted bythe closure of one company, but the overalldecline started before this company was soldand eventually closed. The services segmentmay have been impacted by other industry
CPI adjusted value
PPI adjusted value
PwC 45
Source and notes: Space related turnover data for 50+ entities proprietary data from NRS;Deflated by Norwegian PPI (Producer Price Inflationmanufacturing base) and CPI (Consumer Price Inflation) Eurostat; Nominal values have normally been reported by NSR and as sucseparately.
1997
may have been impacted by other industryM&A events and the most significant ones areindicated on the slide.
Understanding real growth in this sector ischallenging. Money devalues over time and asuch the value of a 1997 kroner cannot becompared against 2010 values. The spacevalue chain however includes a variety ofdifferent segments where prices develop withsome independence between the segmentsdue to very different competitivecharacteristics. We will come back to this inlater sections.
Activity has declined in real terms but may be reemerging
(NOK)
Figure 1.1: Turnover of Norwegian space related business by product and service 1997-2010(Current and constant 2010 NOK billion)
Turnover declined from 2003 but shown real growth in the last few years
Acquisition of
8 bn
7 bn
6 bn
5 bn
4 bn
3 bn
(NOK)
Sale of NERA, andof Tandberg
(2008)
Sale of TelenorSatellite Servicesto Apax (2007)
Services
-25%
Acquisition ofCOMSAT by
Telenor SatelliteServices
Space related turnover data for 50+ entities proprietary data from NRS;Deflated by Norwegian PPI (Producer Price Inflation -manufacturing base) and CPI (Consumer Price Inflation) Eurostat; Nominal values have normally been reported by NSR and as such this is shown
3 bn
2 bn
1 bn
2000 2003 2005 2008 2010
Product

Declining share of the economy
The pattern of decline is confirmed when comparing against other coreeconomic parameters.
We find that the sector constitutes a little over 0,2 percent of GDP in 2010, areduction of about 33 percent from 2003. Measured against the less oildependent GDP Mainland numbers we find the same pattern of decline albeitwith slightly higher numbers.
The export ratio in this sector is quite high, but we find a decline measuredagainst other Norwegian exports.
Section 1.1: Market and industry developments
against other Norwegian exports.
Comparing space services exports against other service exports, we find adecline since 2003. Sales of space related services constitutes about 1,25percent of total services exports.
Comparing the product exports against other manufacturing exports, we findan even more significant drop of about 43 percent since 2003. This share hasdeclined since the late nineties and is now at about 0,3 percent of total exports.
We assume an equal export share for both products and services.
The significance of the industry is probably not best understood in terms of itssize. i.e. the total 2010 turnover of 5,7 billion NOK is equivalent to one-eight ofthe operating budget of the City of Oslo.
Its significance relates more to the technological transfer potentials , and thecapabilities provided which value cannot entirely be understood on a turnoverbasis alone. We will review these issues later.
PwC
The declining trend is nevertheless a worrisome finding in that it raisesquestions of the longer term viability of the industry in Norway. Especiallygiven that the government spending for the sector has increased faster than thecommercial turnover.
Figure 1.2: Total turnover (Commercial; Institutional) by GDP and exports
46
Percent
Declining share of GDP
This is calculated with andwithout upstream oil activities.The measures are correlated.The total turnover, includingpublic financing for spaceactivities is declining againstboth measurements of GDP.
1997 2003 2010
0,1 %
0,2 %
0,3 %
0,4 %
0,5 %
-33%
both measurements of GDP.
Declining share of servicesexport
The services segment of thespace economy in Norway hasexpanded, but shows a decliningshare of Services export.
This also peaked in 2003 and hasfallen by 35 percent between2003 and 2010.
Declining share of product
0,0 %
0,0 %
0,5 %
1,0 %
1,5 %
2,0 %
-35%
Source: Statistical Bureau Norway; NRS; PwC Analysis
46
Declining share of productexports
The product segment of the spaceeconomy shows and even moredrastic decline measured againstother exports of manufacturedgoods.
This also shows a longer termdecline from the late 1990’s.
0,0 %
0,3 %
0,5 %
0,8 %
1,0 %
-43%

Considerable global market share but loosing ground
Measuring the economic activity in Norwegian currencies has some caveats asmuch of the sales, and the cost base is denominated in US dollars i.e. costs forleasing transponder capacity for mobile satcom providers. Some of their costbase is nevertheless in Norwegian currency, salaries surely and possibly othercosts as well. The ratios are not known. As such, it is possible that presentingturnover in Norwegian currency disguises whether there has been growth ormarket share developments in global markets.
Section 1.1: Market and industry developments
120
140
160
Rebasing all the commercial turnover to USD does indeed show a differentpicture. There has been growth from early 2000’s, a drop during 2008 and anincrease since.
Figure 1.3: Indexed growth of commercial space markets excludingconsumer TV and GPS equipment (USD/NOK nominal based, 2005=100)
USD based turnover shows nominal growth, but slowerthan global growth from 2005
PwC
60
80
100
120
2000 2005 2010
Norway NOK based Global Norway USD based
Source: NRS data; SIA 2011; Space report 2011; PwC Analysis
47
Norwegian firms gained global market share during the first five years of thedecade. This was particularly driven by gains in the mobile satcom markets.There is little market share in other segments. Since then the share hasdeclined and currently stands at about 2 percent. The share measured inNorwegian currency is also shown.
The value of the activities are identical whether measured in Norwegiancurrency or U.S. dollars. What will make a difference in the longer run is
Considerable global market share but loosing ground
currency or U.S. dollars. What will make a difference in the longer run iswhether the cost base develops differently for Norwegian firms than for itscompetitors. As at least a share of the costs are denominated in Norwegiancurrency, which has appreciated against the dollar, Norwegian firms may befaced with a disadvantage over time.
Figure 1.4: Market share of non-institutional space markets (excludingconsumer) (USD and NOK nominal based)
Lost global market share since 2005 mostly in services andground equipment
2,0 %
2,5 %
3,0 %
47
0,0 %
0,5 %
1,0 %
1,5 %
2000 2005 2010
USD basis NOK basis

Exports are falling, but industry remains highly commercial with 75 percent of sales tomaritime and offshore industries
The export share has declined since 2004 from above 80 percent to about 68percent currently. The decline may reflect a loss of competitiveness but couldalso indicate strong growth in domestic markets. Competitiveness has declinedin the sense that exchange rates have appreciated and labor costs increased.The impact on each business will depend upon a.o how much of the cost baseand revenues that are denominated in foreign currencies.
Home markets have also grown very strongly in this period, in particular
Section 1.1: Market and industry developments
81 % 82 % 82 %
71 % 72 % 72 %68 %
Home markets have also grown very strongly in this period, in particularmaritime and petroleum related sectors where many space related businesseshave strong anchor tenants.
Figure 1.5: Share of exports by total turnover
Declining export share since mid-2000’s possibly drivenby strong domestic offshore markets
PwC
71 % 72 % 72 %68 %
2004 2006 2008 2010Source: NRS data; PwC analysis
48
The space economy in Norway is highly commercial and more so than its peersin many other countries. Most of the commercial sales are to maritime andoffshore industries. This drives the ground equipment, satcom services andearth observation/navigation segments. About 60 percent of the commercialturnover stems from mobile maritime satellite services.
In the figure below ,sales to ESA, EU Galileo/GMES and Norwegian
Exports are falling, but industry remains highly commercial with 75 percent of sales to
In the figure below ,sales to ESA, EU Galileo/GMES and Norwegiangovernment space programs are is counted as institutional developmentcontracts .
Figure 1.6: Share of non-institutional revenues (Total of commercialand institutional excluding consumer TV segments)
Much more commercial than its peers in other countries
70%
80%
90%
Norway Global
Ex U.S
1997 2000 2003 2006 2009
48
32%
65%
50%
Ex U.SGovernment
Including U.SGovernment

Public expenditure increasing,commercial sales declining
Zooming in the developments of three categories of space related activity inNorway we note a few striking patterns:
-Commercial turnover is declining in real terms (inflation adjusted);
-Public agency expenditures are rising; and,
Section 1.1: Market and industry developments
-Public agency expenditures are rising; and,
-ESA contracts are rising.
In the next section we will seek to understand what's driving thesedevelopments including a review of the value chain economics.
PwC 49
Figure 1.7: Commercial turnover; government expenditure ex ESA; ESA contracts1997-2010
1,0
2,0
3,0
4,0
5,0
6,0
Billion NOK
Declining commercial sales
These are sales in commercialmarkets by firms who haveprivate capital at risk and notsupported directly byinstitutional funds.
Commercial sales have been flatfor nearly a decade, indicating a
1997 2001 20092005
Flatnominal=
real decline
-
1,0for nearly a decade, indicating areal decline.
Public expenditures rising
This includes science funding,various other agency funding andspace agency financing. ESAfunding not included.
There has been an expansion ofthese of more than 50 percentsince 2005.
ESA contracts rising
0
0,1
0,2
0,3
0,4
Real growth
-
0,05
0,10
0,15
0,20
0,25
0,30
0,35
Source: Statistical Bureau Norway; NRS; PwC Analysis
49
ESA contracts rising
These are supported by publicexpenditures. These show asignificant rise over the lastdecade more than doubling.
The public expendituresassociated with this arecontributions to ESA that arehigher than the contractsreceived.
Real growth

Macroeconomic factors makes competition challenging for Norwegian space firms
It is possible that some of the difficulties observed may be related to macrostructural factors particular for Norway such as labor cost increases andcurrency appreciation. Analyzing the competitiveness of export industries isquite complicated, but the key factors are about labor cost developments andcurrency appreciation. The underlying difficulty in Norway has to do with theimpact of oil and gas exploration and the pressures this creates on labor costs.
Labor cost metrics specific for the space industries does not exist. A proxyindicator is the labor costs of industrial labor. This shows an increase over the
Section 1.1: Market and industry developments
Norway
Belgium
Sweden
Denmark
France
indicator is the labor costs of industrial labor. This shows an increase over thelast decade compared to trading partners. About two thirds of the difference isexplained by wages differentials, the rest by currency appreciation. On average,a third of the developments of labor cost differential in industry can beexplained by currency appreciation.
Figure 1.8: Hourly industry wages indexed compared to EU tradingpartners (2011)
High cost production in Norway
1551008050
PwC
France
Germany
Finland
Netherlands
Austria
Ireland
Italy
Spain
U.K.
Czech Republic
Poland
Source: SSB, Eurostat, Beregningsutvalget 2012: FX rates midpoint of monthly bid-ask spreads O&A
50
It is important to note that while the Norwegian kroner has appreciated againstthe dollar over the last decade, so has nearly every other currency in the world– in particular the Swiss Franc and Canadian dollars.
As such, competitors within the advanced economic zones are faced withsimilar issues. The impact will mostly be about an advantage for U.S. basedexporters against everyone else.
Macroeconomic factors makes competition challenging for Norwegian space firms
EUR/USD NOK/USD CHF/USD CAD/USD
Norwegian kroner has still appreciated a more than the Euro. Most of industrialtrade in Norway is with Sweden and countries in the Euro zone. The particularsfor space industries are not known.
Figure 1.9: Exchange rates against USD 1999-Feb 2012 (Monthly percentagechange)
Currency appreciation against dollar cannot fully explaindecline as competitors are faced with same issue
75%
1998 2001 2004 2007 2010
50
50%
25%
0%
-25%

The ability to compete with high costsdiffer across the value chain and ispoorest for ground equipment producersDifferences in the ability to pass-on cost increases may vary across segments ofthe value chain. This ability impacts the viability to compete in a high costcountry.
The phenomenon can only be observed by way of proxy indicators such aschanges in producer prices. Data does not exist for space industries inparticular, but there are reasonable proxies available. Indices at this level of
Section 1.1: Market and industry developments
particular, but there are reasonable proxies available. Indices at this level ofspecificity are not produced by Norwegian authorities nor Eurostat. The Bureauof Labor Statistics (BLS) in the U.S publishes disaggregated producer priceindices for a range of relevant products and services. Given that space relatedproducts and services are traded globally we believe these U.S. Based indicesare useful indicators of price developments.
An indicator of producer price increases for satellite manufacturing andlauncher segments may be the aerospace products and parts manufacturingindices. This shows considerable price increase over the last decade, meaningthat the prices the producer charges to customers further down the value chainhave increased. This may indicate an ability to pass on labor cost and other costincreases. This segments may have seen less competitive pressures from low-cost producers. Space manufacturing has very high entry barriers which mayfurther support this thesis.
Ground equipment production delivers network equipment, antennas andcables. Proxy indicators could include communications equipment and otherelectronics manufacturing. These all show deflation over the last decade
PwC
electronics manufacturing. These all show deflation over the last decadeindicating that there could be cost pressures from i.e.. low cost producers. Thisability to pass-on cost increases may not exist.
Satellite services is much harder to capture by way of proxy. Cable TVprogramming in the U.S is a substitute for satellite TV and shows an increase.Internet subscriptions prices in the U.S. have fallen, but the content and qualityof deliveries may have increased. For the space segment, and particularlyrelevant for Norwegian enterprises, is that VSAT based broadband deliverieshave a price point (measured as average revenue per customer) at about 50%above the Inmarsat fleet service. The value added of VSAT services is believedto be higher.
Figure 1.10: Producer Prices Indices for relevant market segments (US PPI BLS)
51
Index
Markets for Aerospace productand parts manufacturing may bea proxy for price developmentsfor space manufacturing.
This shows a considerableincrease over the last decade, at
2002 2006 2011
100
120
140Inflation for Satelliteand Launchers
increase over the last decade, atpar with average PPI in the U.S.
Ground equipmentmanufacturers are more exposedto cost pressures from low-costproducers as entry barriers arelower. Indices forcommunications equipmentmanufacturing show decliningprices. Indices for otherelectronics manufacturing showeven larger decreases.
80
80
100
120
140Inflation for Groundequipment
Inflation for Satellite
Source: BLS U.S.
51
Satellite services are harder tomeasure by way of proxy. Cableand other subscriptionprogramming is a substitute forsatellite TV and does show anincrease over the decade.Anecdotal evidence of maritimebroadband deliveries also showincreases. 80
100
120
140Inflation for Satelliteservices

Commercial activity concentrated in large enterprises, most of which are part of globalconglomerates
Astrium Services, part of the larger EADS Astrium group is now the largestactor in Norway having acquired Vizada in 2011. Vizada provides satellitecommunications for maritime, aerospace and defense industries. It’s a marketleader in several segments; Second only to Stratos(US) as reseller of Inmarsatcapacity, and leading the VSAT broadband market. Much of the maritimesegment is managed from Norway where Vizada also runs Eik ground station.The acquisition is expected to increase the revenues of Astrium Services by
Section 1.1: Market and industry developments
The acquisition is expected to increase the revenues of Astrium Services by60%. Vizada has its origins in Telenor Satellite Services which was sold in2007 and merged with France Telecom Mobile Satcom. Vizada has anestimated +4 bn NOK in revenues globally and according to the businessregistries (BBREG), about half of this is accounted for in Norway.
Telenor Satellite Broadcast is the only Norwegian entity which owns andoperates a fleet of geostationary satellites and uses these for transmission ofTV signals and broadband capacity. Its key customer is the Canal Digital (alsoTelenor) in the Nordic region, but is also believed to be selling to MTG andother groups in Eastern Europe and the Middle East. TSB runs Norway’slargest ground station in Nittedal, the station alone employing some 70people. The Telenor group has divested much of its satellite business over thelast decade; including TSS (above) and a large share in Inmarsat. It has latelydone some venture aquisititions of smaller satellite related business.
Kongsberg Group appears to be strengthening its space related businessesthrough recent acquisitions. It operates across the value chain, predominantly
PwC 52
Source: Financial press, analyst reports; quarterly statements and press releases; PwC Analysis
through recent acquisitions. It operates across the value chain, predominantlyin manufacturing of launch, satellite components and ground equipment. Itsunits, such as Norspace, are market leaders globally for certain components.It also operates in the services segment through its part ownership of KSAT.
Inmarsat now operates in Norway through its acquisition of Ship Equip, aninternet provider for the maritime industries (VSAT). Ship equip is reportedto be the fastest growing internet provider for the maritime sector, and secondonly to Vizada as seller of VSAT internet solutions.
Commercial activity concentrated in large enterprises, most of which are part of global
STM (US) picked up Nera Satellite broadband in 2007. Much of the R&D activityis maintained in Norway. STM enjoys an estimated six percent and growing shareof the global VSAT equipment market.
US giant Northrop Grunman is also present in Norway through its ownership ofPark Air systems.
Figure 1.11: Major industrial actors in Norwegian space industries
Satellite andLaunchers
Groundequipment
Satelliteservices
AstriumServices(Vizada)
+2bn
TelenorSatellite
Broadcasting
Kongsberg- SatelliteServices
•Seatex•Spacetec
•Defensesystems
•Norspace
(CanalDigital)
Value chain segment Space related sales(2011 est.)
+1bn(+4 bn)
<1bn
Consumer
Inmarsat(Ship Equip) +0,4bn
STMtechnologies
NorthropGrunman
(Parkair)
<0,3bn
<0,3bn

Significant foreign M&A of high growth and profitable firms, and foreign ownership nowcontrol more than 60 of the commercial value chain (turnover based)
The ownership structure of the industry has changed significantly over the lastfive years. Norwegian enterprises have become favored acquisition targets. Morethan half of the commercial value chain (turnover based) is directly foreignowned.
The impact of the takeovers in Norway is not fully understood. Importantquestions to understand better are: what would have happened if the ownershipwas not transferred; and how would jobs and profitability develop under foreign
Section 1.1: Market and industry developments
Figure 1.12: Major foreign M&A events in the commercial Norwegian Space industries
was not transferred; and how would jobs and profitability develop under foreignownership?
There is a certain weariness in the community given the closures and jobtransfers resulting from the acquisitions of ground equipment producers Neraand Tandberg. Less is understood about how the service companies evolve underforeign ownership.
Telenor Satellite Servicessold to Apax (FR PE group),merged with French TelecomMobile SatCom; Rebranded to
Vizada
Tandberg TV sold toEricson (SE)
Nera sold to Eltek andfurther to Thrane & Thrane
(DK)Nera Broadband (R&D) soldto STM Technologies (US)
Telenor sells allremaining shares
in Inmarsat
PwC 53
2002 2005 2006 2007 2008
Telenor SatelliteServices acquires
COMSAT, and SAITcommunications
Managementbuyout of
Norspace fromAlcatel.
Significant foreign M&A of high growth and profitable firms, and foreign ownership nowcontrol more than 60 of the commercial value chain (turnover based)
The acquisitions may be an indication of growth constraints in Norway. Fastmoving companies need access to global distribution networks and capital tocontinue growth. There are few larger Norwegian based enterprises with whomthere is sufficient strategic alignment to support expansion in the space segment.
There is no appropriate policy response option to this beyond the existingstructural policies which help ensure that headquarters of the largest Norwegianactors i.e. Telenor and Kongsberg are maintained in Norway. And more relevant
sold to Eltek andThrane & Thrane
(DK)Broadband (R&D) sold
Technologies (US)
Vizada (owned by UK PEgroup Apax, sold to
Astrium EADS Services
Ship Equip (managementowned+Norwegian PE
group Ferd) sold toInmarsat (UK)
Virtek sold to KVH(U.S)
actors i.e. Telenor and Kongsberg are maintained in Norway. And more relevantfor space policy in particular - helping to ensure that there remains a healthygrowth of smaller enterprises to fill any void which may appear.
53
2008 2009 2010 2011
Arendals Fossekompani(Nor Investment group)
acquires NCCLBroadband UK

Few new entrants to the space segment over the last decade
Most companies active the space segment in Norway are more than 10 yearsold. 80 percent dates back to 2001 and 60 percent to prior to 1995. Many ofthese firms have seen high sales growth, particularly in the period leading up to2005, but overall there are few new entrants.
There have been some new entrants over the last decade. At least two of thesehave seen considerable commercial success, both in the mobile satellitecommunication segment.
There are many firms for which space related sales only constitute a share of
Section 1.1: Market and industry developments
20
25
Cu
mu
lativ
e%
Nu
mb
er
of
co
rpo
rati
on
s
There are many firms for which space related sales only constitute a share oftotals and they may have entered the space markets late in their history. Assuch, date of incorporation may underestimate the degree of new entrants.Also, product and service offerings have expanded within some of the firms andto understand the success of those we need to review the sales statistics(above).
Figure 1.13: Year of incorporation for active companies in space industries(38 total)
80 percent of active corporations established before 2001
80%
PwC
0
5
10
15
1995 2000 2001 2002 2003 2004 2005 2006 2007 2008 2009 2010
Cu
mu
lativ
e%
Nu
mb
er
of
co
rpo
rati
on
s
Corporations Cumulative %Source: NSR data; BRREG; PwC Analysis
54
50%
Few new entrants to the space segment over the last decade
Entry into the space segment can be reviewed in detail for a subset of companiesthat are active with ESA. They represent three quarters of the companies butonly 20 percent of turnover.
For ESA firms we find a similar pattern whereby 80 percent of the firms enteredthe space markets more than ten years ago. There have been a few new entrantsover the last five years.
Another perspective emerges when reviewing the years in which any firm have
80%
100%
Figure 1.14: Year of first space related turnover for ESA active corporations(Subset of 27)
…and those that are active with ESA are about as old
2002 Net total firms withspace sales per year
Cumulative %
Another perspective emerges when reviewing the years in which any firm haverecorded space related sales. In the period between 1992 and 2006 there is little,if any net increase in number of firms that record space related sales in any year.Activity has increased in the last few years.
Fully owned subsidiaries are recorded as separate corporate entities in thisexercise. The numbers also include industrial oriented R&D institutes.
1985 1990 1995 2000 2005 2010
54
50%
20%
No net increaseof firms withspace sales

Little specialization in space technology patents
Some countries show a high degree of space related technology specialization.This includes Nordic neighbors such as Sweden and Finland. Traditional spacepowers also rank high: i.e. Russia, France, the U.S.. There are also a number ofemerging markets countries high on this list such as Mexico, India, China andBrazil.
This index is defined as the country’s share of patents in a particular field oftechnology, divided by the country’s share in all patents. It is equal to 1 whenthe country share is equal to its share in all fields.
Section 1.1: Market and industry developments
the country share is equal to its share in all fields.
Norway is rated at 0,5 meaning that there is little specialization in this areacompared to other sector in Norway. There are other emerging technologyareas in which Norway has a score below 1, including ICT , bio- and nanotechthough the ratios are higher for ICT and biotech than for space.
The low degree of specialization in Norway could be indication a problems. Itmay rise some concerns with regards to the ability of the sector to drivetechnological advancements throughout the economy.
PwC
Source: OECD Space Economy at a Glance 2011; OECD Science, technology and Industry Scoreboard 2011; OECD patents database
55
Russian FederationFrance
IsraelUnited States
Sweden
Little specialization in space technology patents
Figure 1.15: Revealed technological advantage in space-related technologies;Patent applications filed under the Patent Co-operation Treaty by priority dateand inventor's country
SwedenKorea
FinlandCzech RepublicUnited Kingdom
SpainMexicoCanadaBRIICS
EU27Australia
SwitzerlandIndia
AustriaItaly
ChinaBrazil
Poland
Other sectorsin Norway
0,5
Total=1
0,0 0,5 1,0 1,5 2,0 2,5 3,0 3,5
PolandNetherlands
NorwayGermany
New ZealandBelgium
TurkeySingapore
IrelandJapan
DenmarkSouth Africa
Source: OECD Space Economy at a Glance 2011; OECD Science, technology and Industry Scoreboard 2011; OECD patents database
55
0,40,70,7
0,0 1,0
NanotechBiotech
ICT

The value chain

Overview of spaceindustry value chain
When assessing how space activities contribute to wealth creation and other objectives it is useful todefine the scope and range of space activities in the economy. We do this by mapping a value chain, thatis understanding how actors and stages interact. There are three distinct elements of the space valuechain:
First, there is the institutional segment.capabilities in space and many such systems are also operated by public sector staff. Historically, thesedevelopments have been much driven by military needs, i.e. communications and remote sensing needs.Scientific explorations of space also constitutes a core rationale and other public sector requirementssuch as environmental monitoring are important. These are often requirements for which there exist noprivate market or suppliers. New developments are necessary and these require significant investmentsand entails risks that few private enterprises are willing to embark upon alone.
Section 1.1: Market and industry developments
industry value chainand entails risks that few private enterprises are willing to embark upon alone.
Some of the systems developed by public sector organization have later been made available forcommercial use. This includes the meteorological satellites, which are financed and managed by publicsector agencies, but where the information collected is made available also to commercial meteorologicalorganizations and thereby creating a commercial market. (EUMETSAT and NOAA) The availability ofGPS signals to the public is another example of this concept.
Governments also use private enterprises as contractors for much of the development and operations.i.e. the ESA space systems are largely manufactured by European enterprises.
There is also an increased use of various publicshare risk and upside potential.
Value chain extends from scientific exploration to media and entertainmentconsumer products
PwC 57
Figure 1.16: Value chain concept for space industries
consumer products
Public/Scientific/Military
Institutional
When assessing how space activities contribute to wealth creation and other objectives it is useful todefine the scope and range of space activities in the economy. We do this by mapping a value chain, thatis understanding how actors and stages interact. There are three distinct elements of the space value
the institutional segment. Governments globally spend resources to developcapabilities in space and many such systems are also operated by public sector staff. Historically, thesedevelopments have been much driven by military needs, i.e. communications and remote sensing needs.Scientific explorations of space also constitutes a core rationale and other public sector requirementssuch as environmental monitoring are important. These are often requirements for which there exist noprivate market or suppliers. New developments are necessary and these require significant investmentsand entails risks that few private enterprises are willing to embark upon alone.and entails risks that few private enterprises are willing to embark upon alone.
Some of the systems developed by public sector organization have later been made available forcommercial use. This includes the meteorological satellites, which are financed and managed by publicsector agencies, but where the information collected is made available also to commercial meteorologicalorganizations and thereby creating a commercial market. (EUMETSAT and NOAA) The availability ofGPS signals to the public is another example of this concept.
Governments also use private enterprises as contractors for much of the development and operations.i.e. the ESA space systems are largely manufactured by European enterprises.
There is also an increased use of various public-private partnerships whereby private and public actorsshare risk and upside potential.
Value chain extends from scientific exploration to media and entertainment
57
Figure 1.16: Value chain concept for space industriesConceptual
Satelliteand
Launchers
Groundequipment
Satelliteservices
Media andequipment
Commercial Consumer

Institutional,Commercial and
There are also commercial space segmentssuch as illustrated above. In principle, the institutional activities of governments can be grouped alongthe same dimensions but the commercial activities can be analyzed with more granularity mostlybecause of better availability of data and information. Many of the same private actors are also involved acontractors for developments of public systems and in some cases with mixed public and privatefinancial involvement, it is not always possible to distinguish the institutional and commercial segmentsentirely.
Much of the commercial value chain is driven by the demand for communication services. This createsthe demand for satellites, launchers and ground equipment. Most important is transmission of TVsignals, but also for internet broadband and other communication services. Of increasing importance,albeit small yet, is also developments of remote sensing capabilities such as the images found on Google
Section 1.1: Market and industry developments
Commercial andConsumer markets
albeit small yet, is also developments of remote sensing capabilities such as the images found on GoogleEarth. These service markets operate on pure commercial terms. There are international agreementsgoverning use of frequencies and location of satellites but little other policy intervention. Much of thetechnological base has however been developed under institutional programs.
The satellite manufacturing and launcher segments are more captive. Most of the demand for theirproducts stems from public sources. Nation states (and intergovernmental organizations such as ESA)typically prefer enterprises from their own countries. As such this market segment has more captivecharacteristics than the service segment. i.e. in the U.S government spending is estimated to constitute85 percent of the demand for space manufacturing in the U.S. In Europe the ratio is closer to 50 percent.Yet, when a Satellite TV organization needs to increase their satellite capabilities, the manufacturing andbusiness mechanisms around this are commercial.
The tail end of the value chain is theTV or broadband access, and also equipment manufacturing of i.e. GPS handchipsets for smart phones or TV set top boxes. These segments are the largest ones in economic terms.
PwC 58
commercial space segments. We can divide this into its main value chain activitiessuch as illustrated above. In principle, the institutional activities of governments can be grouped alongthe same dimensions but the commercial activities can be analyzed with more granularity mostlybecause of better availability of data and information. Many of the same private actors are also involved acontractors for developments of public systems and in some cases with mixed public and privatefinancial involvement, it is not always possible to distinguish the institutional and commercial segments
Much of the commercial value chain is driven by the demand for communication services. This createsthe demand for satellites, launchers and ground equipment. Most important is transmission of TVsignals, but also for internet broadband and other communication services. Of increasing importance,albeit small yet, is also developments of remote sensing capabilities such as the images found on Googlealbeit small yet, is also developments of remote sensing capabilities such as the images found on GoogleEarth. These service markets operate on pure commercial terms. There are international agreementsgoverning use of frequencies and location of satellites but little other policy intervention. Much of thetechnological base has however been developed under institutional programs.
The satellite manufacturing and launcher segments are more captive. Most of the demand for theirproducts stems from public sources. Nation states (and intergovernmental organizations such as ESA)typically prefer enterprises from their own countries. As such this market segment has more captivecharacteristics than the service segment. i.e. in the U.S government spending is estimated to constitute85 percent of the demand for space manufacturing in the U.S. In Europe the ratio is closer to 50 percent.Yet, when a Satellite TV organization needs to increase their satellite capabilities, the manufacturing andbusiness mechanisms around this are commercial.
The tail end of the value chain is the consumer distribution. This includes service provision such asTV or broadband access, and also equipment manufacturing of i.e. GPS hand- or vehicle equipment,chipsets for smart phones or TV set top boxes. These segments are the largest ones in economic terms.
58

Fast growing commercial segments in the global value chain
The institutional segment of the value chain is particularly large and only second to the consumer segment. This is mostly explained by the larexpenditures estimated at nearly 65 billion dollars in 2010. Other national programs of significance include countries such aChina. Of particular importance for Norway is the ESA and EU spending at about 6,2 billion dollars. Institutional expenditurefive years.
The commercial value chain is in comparison smaller but is growing more quickly. Most significant segments are the satellite manufacturing aservices. The consumer segments are largest and growing rapidly. This is much about TV distribution but also about consumer electronics such as GPS.
Section 1.1: Market and industry developments
Figure 1.17: Global turnover by value chain segment for space industries (Current US$)
Satellite manufacturingand Launchers
Scientific/Military/Civil Ground equipment
CommercialInstitutional
41 bn87 bn
CAGR 2005-2010
US
2,3%
CAGR 2005-2010
SatelliteGround
equipment7%
3,4%
7,5 bn11 bn65 bn
PwC 59
Other
ESA
EU
2,3%
5,6%
4,5%
-
Launchers8%
4,3 bn16 bn
4,6 bn
1,6 bn
Fast growing commercial segments in the global value chain
segment of the value chain is particularly large and only second to the consumer segment. This is mostly explained by the large U.S governmentexpenditures estimated at nearly 65 billion dollars in 2010. Other national programs of significance include countries such as France, Germany, Canada, Russia andChina. Of particular importance for Norway is the ESA and EU spending at about 6,2 billion dollars. Institutional expenditures have shown nominal growth over the last
value chain is in comparison smaller but is growing more quickly. Most significant segments are the satellite manufacturing and communicationsegments are largest and growing rapidly. This is much about TV distribution but also about consumer electronics such as GPS.
Figure 1.17: Global turnover by value chain segment for space industries (Current US$)
Ground equipment Satellite services Media and equipment
Commercial Consumer
127 bn
Satcom
CAGR 2005-2010
CAGR 2005-2010
CAGR 2005-2010
TV DTH8% 15%
7% 15%
17,3 bn 83,1 bn7,5 bn10%
59
Otherservices
Equipment(GPS)
Other (i.e.GoogleEarth)
15%17%
1-2 bn 44 bn
?

Unusual configuration of Norwegian value chain with small public expenditures andvery large satellite communications services segment
In Norway we find that the institutional side is much smaller than the commercial segments. This reflects partly low government spending in Norway, but also thesuccess of the industry in global commercial markets. The institutional segment, i.e. government spending is growing more rapsegments and also more rapidly than government spending globally.
The commercial value chain is characterized by a very large communication services segment. There are companies with large global market shaThere is also a rapidly evolving earth observation community, as well as an emerging space manufacturing industry. Ground equsome difficulties over the last decade. Overall the commercial segment shows nominal growth but possibly a real decline overis also significant, particularly for TV services. There are no consumer equipment manufacturers based in Norway.
Section 1.1: Market and industry developments
Figure 1.18: Norwegian turnover by value chain segment for space industries (2010 current NOK)
Satellite manufacturingand Launchers
Scientific/Military
Ground equipment
CommercialInstitutional
5,1 bn0,6 bn
CAGR 2005-2010 CAGR 2005
There are about 40 enterprises active in this industry. Some are specialized in the space industries, while for others its on20 public and scientific organizations which have been involved over the last decade.
Next we will turn to review developments in each segment. We discuss mainly the commercial value chain, and will come back tobelow. We will not focus on the consumer segments in this study.
PwC 60
5,1 bn0,6 bn
ESA*
Otherpublic
12%
10%
CAGR 2005-2010
Satelliteand
launchers
Groundequipment
16%
11%
0,6 bn0,2 bn
0,4 bn
0,2 bn
Source and notes: Commercial segments does not include ESA or government sales but there may be unidentified gaps or overlaps
Unusual configuration of Norwegian value chain with small public expenditures andvery large satellite communications services segment
side is much smaller than the commercial segments. This reflects partly low government spending in Norway, but also thesuccess of the industry in global commercial markets. The institutional segment, i.e. government spending is growing more rapidly than turnover in the commercial
value chain is characterized by a very large communication services segment. There are companies with large global market shares included in this.There is also a rapidly evolving earth observation community, as well as an emerging space manufacturing industry. Ground equipment producers in Norway have hadsome difficulties over the last decade. Overall the commercial segment shows nominal growth but possibly a real decline over the last five years. The consumer segmentis also significant, particularly for TV services. There are no consumer equipment manufacturers based in Norway.
Figure 1.18: Norwegian turnover by value chain segment for space industries (2010 current NOK)
Ground equipment Satellite services Media and equipment
Commercial Consumer
4,2 bn
CAGR 2005-2010 CAGR 2005-2010
There are about 40 enterprises active in this industry. Some are specialized in the space industries, while for others its only a share of their business. There are a further
Next we will turn to review developments in each segment. We discuss mainly the commercial value chain, and will come back to the institutional side in section 1b
60
4,2 bn
Satcomservices
Otherinformation
services
CAGR 2005-2010
TV DTH*
Equipment(GPS)
-13%
16%
-2%
0,6 bn
1,5% -2%
3,7 bn
0
4,2 bn0,6 bn
3%
Source and notes: Commercial segments does not include ESA or government sales but there may be unidentified gaps or overlaps. NRS data, BRREG business registry; PwC market analysis
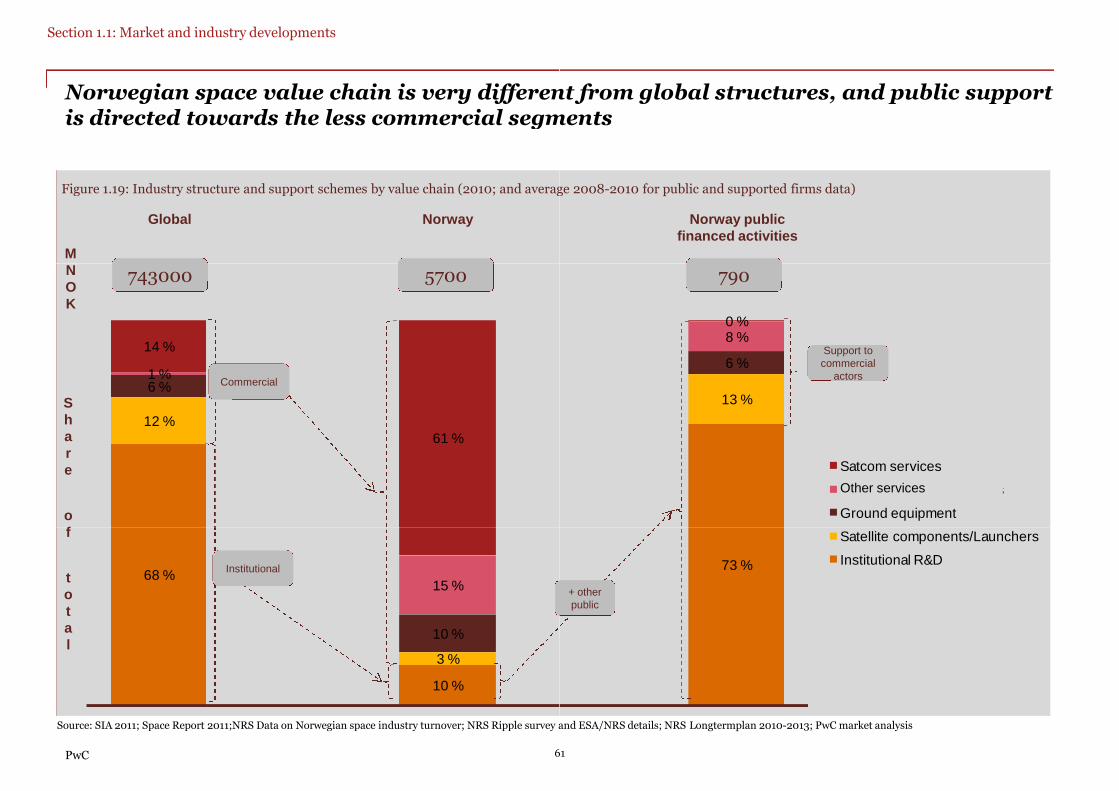
Norwegian space value chain is very different from global structures, and public supportis directed towards the less commercial segments
Global Norway
Figure 1.19: Industry structure and support schemes by value chain (2010; and average 2008
MN
Section 1.1: Market and industry developments
12 %
6 %1 %
14 %
61 %
743000 5700NOK
Share
of
Commercial
PwC
68 %
10 %
3 %
10 %
15 %
Source: SIA 2011; Space Report 2011;NRS Data on Norwegian space industry turnover; NRS Ripple survey and ESA/NRS details; NRS
61
f
total
Institutional
Norwegian space value chain is very different from global structures, and public supportis directed towards the less commercial segments
Norway publicfinanced activities
Figure 1.19: Industry structure and support schemes by value chain (2010; and average 2008-2010 for public and supported firms data)
13 %
6 %
8 %0 %
Satcom services
Earth observation services
Ground equipment
790
Support tocommercial
actors
Other services
73 %
Satellite components/Launchers
Institutional R&D
Source: SIA 2011; Space Report 2011;NRS Data on Norwegian space industry turnover; NRS Ripple survey and ESA/NRS details; NRS Longtermplan 2010-2013; PwC market analysis
61
+ otherpublic
Value chainsegments
To understand whether the policies support the right actors with the appropriate tools we will analyze wthe competitive positioning of Norwegian enterprises across the value chain.
All value chain segments with significant Norwegian activity will be reviewed. Consumer media andentertainment distribution is not discussed.
We focus on four segments:
I. Satellite components and launchers.deliver components for launchers or satellites. Most of these are private enterprises but one isaffiliated with a university and included here.
Section 1.1: Market and industry developments
segmentsII. Ground equipment.
but all are involved in professional markets only. None sell to consumer markets.
III. Satellite communications services.an infrastructure, i.e. satellites or ground stations, but they do not manufacture equipment. Thisis the largest segment in Norway.
IV. Other services.offshore surveying, met services and ground station operators. These do not produce hardware,but may own infrastructure i.e. ships or grounds stations.
There are a number of research institutes active in the space community in Norway. We have notincluded those in the numbers above. From timeare not-for-profit institutions. Some have much government backing, while others sell mostly toindustry. As a matter of definition we have grouped them all in one. This is more important for theanalysis of how ESA and national funds have been distributed.
PwC
When presenting company specific information this is based upon publically available sources. Thisincludes and is not limited to information from press releases, investor relation reporting, financialanalysts, quarterly and annual reports, and official accounting information in the business registries. Wehave had access to non-public sensitive information of single companies and this has been important tocalculate certain aggregate numbers.
62
To understand whether the policies support the right actors with the appropriate tools we will analyze wthe competitive positioning of Norwegian enterprises across the value chain.
All value chain segments with significant Norwegian activity will be reviewed. Consumer media andentertainment distribution is not discussed.
We focus on four segments:
Satellite components and launchers. This includes all Norwegian manufacturers whodeliver components for launchers or satellites. Most of these are private enterprises but one isaffiliated with a university and included here.
Ground equipment. This includes all producers of ground equipment. Product offerings varybut all are involved in professional markets only. None sell to consumer markets.
Satellite communications services. These firms are service providers only. They may ownan infrastructure, i.e. satellites or ground stations, but they do not manufacture equipment. Thisis the largest segment in Norway.
Other services. These are also pure service providers. The range in offerings quite wide, fromoffshore surveying, met services and ground station operators. These do not produce hardware,but may own infrastructure i.e. ships or grounds stations.
There are a number of research institutes active in the space community in Norway. We have notincluded those in the numbers above. From time-to-time we may not have been able to separate. They
profit institutions. Some have much government backing, while others sell mostly toindustry. As a matter of definition we have grouped them all in one. This is more important for theanalysis of how ESA and national funds have been distributed.
When presenting company specific information this is based upon publically available sources. Thisincludes and is not limited to information from press releases, investor relation reporting, financialanalysts, quarterly and annual reports, and official accounting information in the business registries. We
public sensitive information of single companies and this has been important tocalculate certain aggregate numbers.
62

Launch and satellite manufacturing receives most of the Norwegian support, and is asmall growing segment with a fractional global market share
The launcher and satellite component segments combined have received 36percent of total ESA contracts and NRS support funds since 2000. Its share ofthe Norwegian value chain is about 3 percent. The share of global value chainis 0,2 and 0,3 percent respectively for the segments. Ripple effects are about 3,8and increasing.
Section 1.1: Market and industry developments
300 Sale
s(m
illion
NO
Kn
om
inal)
Commercial Public
Figure 1.21: Share of total commercial spacesales Norway 1997-2010
Share of commercial space sales inNorway declined, but gained since2005
Figure 1.20: Sales launchers and satellitecomponents (nominal NOK million)
Growth between 2005 and 2010 butvolatile
CAGR10%
PwC
-
100
200
1990 1995 2000 2005 2010
Sale
s(m
illion
NO
Kn
om
inal)
1997 2000 2003 2006
Source: NRS; BRREG; Space report 2011; SIA 2011; FAA 2011; PwC Analysis63
Next we turn to a discussion of launcher and satellite components segments. Wecannot fully separate the two segments in the Norwegian data but will discusscapabilities, supply, demand and positioning separately.
First, the launcher market. This is exclusively about deliveries to Ariane-5. This isthe ESA developed launcher operated by Arianespace. Its launch services arecommercial.
Launch and satellite manufacturing receives most of the Norwegian support, and is asmall growing segment with a fractional global market share
6 %
Sh
are
of
co
mm
erc
ial
sp
ace
Figure 1.21: Share of total commercial space
Share of commercial space sales inNorway declined, but gained since
commercial.
Second, the satellite component market. This is more varied in terms ofproducers, products and clients.
Figure 1.22: Estimated global market share2009-2010
Fractional global commercialmarket share but increasing
Launchers≈
0,3%
Satmanufacturing≈
0,2 %
0 %
2 %
4 %
2006 2009
Sh
are
of
co
mm
erc
ial
sp
ace
63
0,3% 0,2 %
Note: Commercial Norwegian sales measured againstcommercial global turnover for segment totals. Shares arehigher within particular micro segments or productcategories.
Norwegian firms only deliver components to other primecontractors or system integrators.

Launcher market access only through Ariane
Capabilities
Three Norwegian corporations (and two-three subcontractors) deliverscomponents to the Ariane-5 launcher operated by Arianespace. The Norwegianindustrial capabilities have been developed largely through ESA programs andentry into the segment is one of the important successes of the space programs.Norwegian enterprises broke into this segment in the late 90’s and have sincehad regular deliveries. There have been various upgrades and variations of the
Section 1.1: Market and industry developments
Figure 1.23: Share of launcher payload by commercial/non-commercial(2006-2010)
Two-thirds of payloads are non-commercial, but revenuesfrom commercial payloads are higher at 55 percent
had regular deliveries. There have been various upgrades and variations of thelaunch system in which they have participated.
The European launch vehicle developed through ESA is Ariane-5. This is anexpendable launch vehicle mostly used for geostationary (GEO) orbits andoperates mostly in the commercial market. It is one of the larger vehiclesavailable on the market and is capable of lifting more than one payload(satellite). EADS Astrium is the prime contractor
PwC
34 %
66 %
2006-2010
Non-Commercial
Commercial
64
Arianespace also operates two other launch vehicles put on the market lastyear; a vehicle for smaller launches (the Vega) and a Europeanized version ofthe Russian Soyuz rocket. There are no Norwegian contractors involved in theproduction of these.
Launcher market access only through Ariane-5
12 %
11 % China/India
US
Figure 1.24: Share of commercial launch revenues by nation of primecontractor 2006-2010
Arianespace captures most of the commercial launchrevenues but competition is escalating
CAGR 2006-2010
45 %
30 %
2006-2010
Private multinational
Russia
Europe/Arianespace
CAGR 2006-2010
15%
Source: Federal Aviation Administration (US) 2010-2011
64

Growth in demand for launchers, but even more supply
Demand
The demand for launches of satellites is expected to show an increase over thenext years. Market analysis range quite widely; between 50 (FAA) to 100(Euroconsult) payloads annually of which about 40 percent can be expected tobe for medium-to-heavy GEO satellites in which Ariane-5 is particularlycompetitive. This may translate into about 15-30 launches in the GEO segmentannually over the next decade.
Section 1.1: Market and industry developments
annually over the next decade.
Developments in the markets for Broadcasting Services and Fixed SatelliteCommunications are the core drivers. Other technological and commercialdevelopments such as an trend for increased use of shared payloads may act toreduce overall demand.
Supply
The supply of launch services is increasing and by some measures there isovercapacity. The important factors impacting future supply are:
First, the pure commercial players which offer very competitive pricing,streamlined commercial practices, schedule assurance and choice of launchlocations. SeaLaunch is one such commercial operator remerged frombankruptcy. It operates out of San Diego and launches from the Pacific Oceannear the equator. This company originally had a Norwegian ownership share of25 percent which provided the launch platform (modified offshore oil platform)
PwC
Sources: FAA 2010, Futron 2011; Space report 2011; Press releases by Arianespace.
25 percent which provided the launch platform (modified offshore oil platform)and the mother ship. The company is now fully controlled (95 percent) byRussian investment group Energia Corporation. It also operates a sister entity– Land Launch. Its launch vehicles are Russian built.
65
Growth in demand for launchers, but even more supply
Other commercial players include U.S. based Space X (Falcon 9 and its HeavyVehicle version under design); Orbital’s Thaurus I; ILS (U.S.) with its Proton Mvehicle; and even Arianespace itself with the introduction of the EuropeanizedSoyuz -2 ST launch vehicle (Russian) now operated out of the spaceport inFrench Guiana alongside the Ariane-5 launch site. As the Soyuz has a degree ofoverlapping capabilities with the Ariane-5 it is possible that its introduction willoverlapping capabilities with the Ariane-5 it is possible that its introduction willcannibalize on the Ariane-5 demand.
Second, several national operators are capturing demand currently andmore are expected to emerge in the future. This includes Japan (Jaxa H-IIA),Korean Space Launch Vehicle, and the Indian GSLV Mark III vehicle.
China Great Wall Industry Corporation (CGWIC) has an order book whichincludes a range of Asian and Latin-American satellites, and also satellites forEutelsat (W3S) and satellites produced by European prime manufacturerThales Alenia Space. U.S. export control regulations (ITAR) currentlyconstraints the growth of the Chinese launch vehicle as satellites containing U.Stechnology cannot be transported to China for launch. Regulations may berelaxed in the future but this is uncertain.
Russian launchers leads the market for medium-size satellites whichsometimes may be a substitute for Ariane-5. There have been difficulties withmaintaining regularity and quality of Russian operations over the last years.maintaining regularity and quality of Russian operations over the last years.
Third, declining U.S. space budgets is expected to prompt U.S producers toseek towards commercial markets. Commercialization incentives under the newU.S. Space Policy will further increase this pressure. This includes thecapabilities which may emerge from the U.S. competition to develop a newlauncher for human space flight.
65

Rationale for future support for launchers should be revisited
Competitive positioning
The launcher market has certain captive characteristics which influences itsdevelopment.
First, most governments prefer their national systems when launching non-
Section 1.1: Market and industry developments
First, most governments prefer their national systems when launching non-commercial payloads.
Second, the development costs, and lead times, for developing new systems aresubstantial and mostly fronted by national governments (or through multilateralentities such as ESA).
Third, US export control regulations further limits the international trade.
Figure 1.25: Ares at test site 2009 (PwC illustration photo)
President Obama cancelled mega size launcher Ares to savecosts and encourage commercial developments
PwC66
Future developments of the market position of Norwegian enterprises and thepolicy response options will be impacted by:
(i) The competitive positioning of Arianespace; and,
Rationale for future support for launchers should be revisited
(i) The competitive positioning of Arianespace; and,
(ii) The positioning of Norwegian suppliers within the future developments ofAriane vehicles. This is can be influenced by p0licy.
Arianespace is the market leader in terms of revenues. It has increased itsshare from about 35 percent during 2000-2005 to 45 percent over the last fiveyears. Financial results have not been as impressive. It reports break-evenfinancial results in 2011 but has struggled before that. It receives pricingsupport from its owners (European states and companies) at about ten percentof turnover.
In light of this, there is a risk that the growth in demand for the Ariane-5launcher may level off and it is unlikely to see an increased market share overthe next decade.
It is also likely that Arianespace will experience further price pressures andthat these will transfer onto the sub-contractors including the Norwegianthat these will transfer onto the sub-contractors including the Norwegianentities.
The policy issue will largely be about whether or not to maintain the positionof Norwegian contractors through supporting further development projectsunder ESA, including the mid-life extension program of Ariane-5.
It seems logical that Norway should support those sectors that offer highestripple effects and wealth creation potential. These do not necessarily coincidewith maintaining capabilities. There are reasons to assess the balancing oftoday's funding.
66

Norwegian satellite manufacturing is mostly financed by public funds but commercialshare has been increasing
While growth of the Norwegian penetration of the launch segment is constrainedby the opportunities offered within ESA/Arianespace, the satellitemanufacturing markets offer a larger upside. The satellite market is less captivethan the launch segment and there are more opportunities for commercialdeliveries.
Capabilities
Section 1.1: Market and industry developments
Capabilities
Norwegian producers delivers components that are used by prime manufacturersin the assembly of a satellite or sub-systems. About six Norwegian entities havedelivered components or instruments which have been flown on satellites. Thereis also a group of other entities which have been part of various qualificationprocesses but not had actual production. Both commercial manufacturers, andscience organizations, including R&D groups closely attached to Universities areinvolved in this segment. There is also a range in the product offerings whichexceeds the number of suppliers.
Norwegian deliveries are mostly confined within ESA programs. KongsbergNorspace is the one exception that has been particularly successful in thecommercial market. This is probably the global market leader within its focusedsegment.
The institutional market is most important for Norwegianmanufacturers
PwC 67
54 % 46 %
Institutional Commercial
Figure 1.26: Estimated ratio of institutional vs. commercial sales 2008-2010
Source: Estimated on basis of NRS overall turnover data, company specific information andinformation on institutional programs
Demand
There is demand growth for satellite manufacturing. The range of estimatesvary from a continuation of current volumes to about a 100 percent increaseover the next decade. This is much driven by SatCom as we discussed on theprevious pages under the launcher segment analysis.
Four issues should be noted:
Norwegian satellite manufacturing is mostly financed by public funds but commercial
Four issues should be noted:
• First, much of the demand increase stems from national programs fromemerging space powers. These tend to favor their national producers andmay not lead to much volume increase available for Norwegian suppliers.
0,22 %
Figure 1.27: Estimated Norwegian enterprises share of global commercialsatellite manufacturing revenues
A fraction of the global commercial satellitemanufacturing volume, but growing rapidly
67
0,08 %
2005 2010
188%

High entry barriers for satellite components manufacturing but competition escalating
• Second, there is a trend whereby satellites are becoming smaller, have shorterdevelopment cycles and are less costly. More are single purpose satellitescarrying few instruments. An increasing share of the overall are non-geostationary satellites , and some very small. This serves to lower the barriersto entry for producers and hence increases supply. Its impact on the overallmarket size is less clear as it also increases demand by making satellitetechnologies more affordable.
Section 1.1: Market and industry developments
technologies more affordable.
• Third, the volume available under ESA is particularly important for Norwegianproducers. An expected increased ESA contribution from Norway in the futuremay further expand the ESA institutional market available for Norwegianenterprises. However, the accessible share of the institutional market is inpractice capped by Norwegian contributions to ESA given the industrial returnmechanisms.
• Fourth, there are no significant domestic institutional markets available forNorwegian suppliers as there is in some of the larger countries. Compared tosmaller nations however, the structure is not much different.
Supply
An important characteristic of the supply side is the extreme high barrier toentry. This applies equally to the launch segment discussed above.
Satellite systems involve complex interactions of electrical, optical andmechanical systems which should be able to withstand high stress situations
PwC 68
mechanical systems which should be able to withstand high stress situationsduring launch. Quality requirements are intense and there is no tolerance forfailure. Thus, much of the development, and qualification stage for emergingmanufacturers takes place within the institutional context. The qualificationprocesses are long and expensive. Qualifications and flight heritage gainedthrough these processes are necessary requirements for entering commercialmarkets.
Source: NRS reports: SIA 2011
High entry barriers for satellite components manufacturing but competition escalating
Repeat production potential, particularly for scientific instruments, islimited. These characteristics may discourage many participants. These sameentry barriers also serve to protect incumbents.
Competition is increasing driven by three factors:
• First, producers from emerging markets have gained qualifications andflight heritage. These are likely to expand into global commercial marketsflight heritage. These are likely to expand into global commercial marketsas they have done for launchers. We will review the emerging marketcompetition separately in section 1.2
• Second, U.S. manufacturers are strongly incentivized to expand into globalcommercial markets driven both by declining U.S. public budgets and bychanges in the commercialization policies under the new U.S. space policy.This will also be discussed under section 1.2.
• Third, competition within ESA may intensify given recent fiscal difficultiesfor European countries. The overall size of the institutional market may notincrease much in the future but supply side will remain constant. Related tothis, an increased use of competitive procurement following the EU usingESA as the organization to procure satellites for GMES and Galileo, usingthe EU procurement rules. See section 1.2 for a review of ESA and EUdevelopments.
68

With one exception, the position of Norwegian manufacturers in commercial markets isnot strong and there is risk of mismatch between public funding and wealth creation
Competitive positioning
The positioning in satellite manufacturing markets can only be discussedbroadly. Norwegian firms produce very specific components and there may beseparate micro factors impacting those segments that diverge from the overalltrend.
Section 1.1: Market and industry developments
14 %
Figure 1.28: Share of operational satellites with Kongsberg Norspaceequipment
One-of-seven satellites fly Norspace equipment
Notwithstanding the impressive technological achievements of Norwegianindustry and R&D groups, the challenge remains to break into commercialmarkets. After supporting industry since late 1980’s, one firm has a sustainableposition in commercial markets.
PwC
86 %
Operational Satellites
"Norspace components"
"Other"
Source: NRS reports: SIA 2011: Kongsberg Norspace reports having sold equipment for 140 operativesatellites, 14 percent is our calculation based upon an estimated thousand operational satellites.
69
With one exception, the position of Norwegian manufacturers in commercial markets isnot strong and there is risk of mismatch between public funding and wealth creation
Certain other factors need to be considered:
First, most manufacturers globally are dependent upon public sector demandwhich is organized in captive markets. Few are sustainable on commercialdemand alone. The total institutional share of demand among Europeanspace manufacturers is also in the same range as for Norway (about 50percent).percent).
Second, the impact of low-cost producers is probably not felt much yet.Pricing in the commercial markets seem not to have fallen though preciseestimates are not available. An often used proxy is the producer price indicesfor aerospace manufacturing. Thus, manufacturers seem to be able totransfer some of their cost increases further down the value chain and wemay not have seen similar cost pressures as for terrestrial electronicsmanufacturing. The high barriers to entry, combined with low volume repeatproduction may limit the attractiveness to low margin producers. This maywork in favor of Norwegian producers in this segment.
Third, much of the emerging Asian capacity will be absorbed by growingnational and military demand and may not impact the commercial segmentsfor a while. (see discussion on Asian Space race in section 1.2)
Fourth, the ultimate rationale rests on the ability of the support to contributeto wealth creation. There is evidence of technology transfer and knowledge
69
to wealth creation. There is evidence of technology transfer and knowledgedevelopment. There is also evidence of ripple effects on other sales though itis lower in this segment than in other segments. This is reviewed in detail insection 1.4.
In conclusion, there is a risk of mismatch between the overall funding andsupport for launcher and satellite manufacturing segments (36 percent oftotal), the sustainability of the competitive positioning and the valuecreation.
As for launchers, It seems logical that Norway should support those sectorsthat offer highest ripple effects and wealth creation potential. These do notnecessarily coincide with maintaining capabilities. There are reasons toassess the balancing of today's funding.

Figure 1.29:
Average profit margin
Robust and profitable growth for Norway’s most successful spacemanufacturer
Norspace
is by far Norway’s most successful space manufacturer. The companydelivers communication components to very many of the world’s satellites.Its customers are global and predominantly commercial. Norspace hassucceeded in developing repeat production and as such can produce at scaleand with good profit. It operates entirely in the space segment and has noother production.
The company history dates back to mid-eighties where it started competingfor ESA development and product delivery contracts. These were
Section 1.1: Market and industry developments
instrumental in establishing a track record for the company. It succeeded inpenetrating the commercial market by the late nineties and its sales havesince then been predominantly commercial. It has recently won largecontracts to equip the fleet of Galileo satellites with its components.
Management bought the company from Alcatel Space in 2004 andcontinued operations. Ownership has varied over the decades. Thecompany was acquired by the Kongsberg Group in late 2011.
Kongsberg Defense Systems
has the largest product offering of any Norwegian Space manufacturer. Thespace business is part of the larger defense systems group. Kongsbergdeliveries started with booster attachments for Ariane-5 launchers.Development started in mid-eighties and serial production followed from thenineties. Kongsberg has successfully delivered these components for Ariane-5 launchers over the last few decades.
Figure 1.30:2011
Much potential for technology spillovers at Kongsberg
PwC 70
Source: Company data from BRREG (Business registry), estimates for 2011-12 from press releases: KDS data from Capital Markets Da
5 launchers over the last few decades.
Its production of satellite components has mainly been for ESA scientificmissions. Product offerings include deployment and pointing mechanisms,electro optical components, load carrying composite structures and variousscientific instruments. There is a robust basis for evolving into morecommercial and potentially larger markets.
KDS has a particular potential for technology transfer and spillovers betweenits business segments. There are indications of this happening.
90
120
150 Op
era
ting
inco
me
(Millio
nN
OK
)
Figure 1.29: Operating income and reported estimated sales (2004-2012)
Average profit margin2004-2010
19%
Robust and profitable growth for Norway’s most successful spacemanufacturer
0
30
60
2004 2006 2008 2010 2012
Op
era
ting
inco
me
(Millio
nN
OK
)
19%
25 %
23 %
Missiles
Air Defense
Figure 1.30: Share of turnover by business segments of Kongsberg Defense Systems2011
Much potential for technology spillovers at Kongsberg
70
12 from press releases: KDS data from Capital Markets Day reports 2011
23 %
19 %
16 %
10 %
7 %
Air Defense
Naval systems
Space
Communications
Aerostructures

The once large ground equipment industry has seen much decline
The ground equipment segment has received 19 percent of total ESA contractsand NRS support funds since 2000. Its share of the Norwegian value chain isabout 10 percent. The share of global value chain is about 1,3 percent. Theripple effect is about 4,7 and has been declining every year since the early1990’s.
Share of global market is assessed against the professional equipmentsegments only and not including much larger consumer electronics markets
Section 1.1: Market and industry developments
Survivors All Supported f irms
Figure 1.32: Global indexed growth of groundequipment, not including consumer equipment(NOK based nominal prices y2005=100)
Strong growth of worldwide groundequipment markets
segments only and not including much larger consumer electronics marketsi.e.. GPS handsets and vehicle mounts, and TV set top boxes. These latter areabout 90 percent of global volume.
Figure 1.31: Indexed share of sales of spacerelated ground equipment (estimated, 2000-2010 nominal prices)
Sales decreased by more than 50percent over the decade, flat forsurvivors
PwC
0 %
25 %
50 %
75 %
100 %
2000 2005 2010Source: SIA 2011; NRS; BRREG; PwC Analysis
71
2005 2006 2007 2008
Capabilities
Current product offerings include ground station equipment, VSAT stabilizedantennas to rescue beacons and AIS senders. There are about three firms who havemost of the sales and a larger group of smaller players. The two largest companiesare both broader electronics manufacturers who specialize in the maritimesegments and have anchor tenants there. There is also a company providing groundstation equipment for earth observation. Norwegian producers do not target theconsumer markets. These three constitute nearly 95 percent of turnover.
There has not been new entrants to this market over the last decade though the
The once large ground equipment industry has seen much decline
Figure 1.32: Global indexed growth of groundequipment, not including consumer equipment(NOK based nominal prices y-o-y changes,
Strong growth of worldwide groundequipment markets
There has not been new entrants to this market over the last decade though theproduct offerings have expanded. (One new firm is incorporated, but is organizedas a subsidiary of another larger actor). Sales have declined by about 50 percentsince 2005. There has been some growth in the remaining companies, but notenough to make up for the shortfall from the failed.
1403,0 %
Figure 1.33 Estimated global market share
Much loss of global market share
71
100
110
120
130
2008 2009 2010
0,0 %
1,0 %
2,0 %
2005 2006 2007 2008 2009 2010

The strength is sales to maritime industries
Capabilities (cont.)
The ground equipment development is much about the demise of Nera Satcom.This company was the global hardware market leader targeting mobile satellitecommunications. Their space related turnover declined for some time, and it waseventually bought by its key competitor Thrane & Thrane of Denmark in 2007.15 months later the company shut down production in Norway. T&T cited costreductions and overcapacity. T&T still operates sales activity in Norway but doesnot engage with the Norwegian space programs schemes anymore.
Section 1.1: Market and industry developments
not engage with the Norwegian space programs schemes anymore.
STM (U.S) picked Nera Broadband (much smaller) and has expanded its productrange on the basis of this. Its market share in the VSAT network equipmentmarket is about 6 percent (2009). The R&D activity has been maintained inNorway.
Demand
Globally, there has been real growth in the professional segments of groundequipment over the last decade. Growth is expected to continue driven byexpanding communications and earth observation demand.
Norwegian suppliers cater very specific segments and about 80-90 percent ofsales is for maritime markets. The deep sea merchant fleet in Norway isvery large (about the world fifth largest) and has have been anchor tenants forequipment producers in Norway. This is a common observation in Norwaywhere growth drivers are very often derived demand from maritime andpetroleum sectors that requires customized solutions and have high purchasingpower.
PwC
power.
The maritime sector in general has seen some hard times since the financialcrisis in 2008 and this may explain some the observed lack of growth for thespace related equipment producers. The global fleet has grown in the period, butmany ship operators are faced with difficult markets.
Maritime sectors did however show historical growth in the period leading up tothis and that growth is not reflected in the turnover of the space groundequipment manufacturers. Some segments of the maritime space electronicsdemand globally have seen growth much driven by new internet broadbandtechnologies.
72
Supply
Within these segments, competition and supply stems from mostly U.S. andEuropean based manufacturers. This is driven much by abilities to understandparticular demands of the maritime customers and adapt technologies.
Structural factors such as low-cost production and is a risk longer term.Production is shifting to low-cost countries while R&D and engineering aremaintained. Commoditization is a risk for a.o antenna and network equipment.Indeed, the current Norwegian producers also does their electronics production,
Figure 1.34: Containership (PwC illustration photo)
Nearly all sales to maritime customers
Indeed, the current Norwegian producers also does their electronics production,i.e.. circuit boards, in low-cost countries.
Prices for communications and electronics equipment are dropping globallyindicating cost pressures. PPI indices from the U.S. BLS shows less deflation forspecialized equipment such as rescue beacons.
72

Electronics industry in Norway does well,not evident why space sales are falling
Competitive position
Given how few firms that are actually involved as space ground equipmentproducers in Norway, any findings are sensitive to company specific issuesand may or may not represent a picture of structural realities.
The observed decline of space ground equipment is significant but it is alsohighly sensitive to the collapse of one company. It nevertheless remains afact that the space related turnover of surviving ground equipment
Section 1.1: Market and industry developments
fact that the space related turnover of surviving ground equipmentproducers:
-Have not increased at a rate sufficient to cover the gap;
- Developed at a much slower rate than the overall growth of electronicsmanufacturing in Norway; and
-Lost considerable global market share overall though we don’t knowspecifics for their micro segments.
As such we are left with wondering whether firms find the space segmentparticularly unattractive and deliver to other segments, or if they areactually faced with decreased competitiveness in the space segments. Wehave not been able to uncover whether there are any particular constraintsto growth within the space segments.
There is a lack of linkages between service providers and ground equipmentproducers. The exceptional positions in the service segments by Vizada and
PwC
producers. The exceptional positions in the service segments by Vizada andShip Equip (discussed in next section) are built on equipment technologiesfrom U.S., Israel and Denmark. I.e.. Sea-Tel and Orbit enjoys market sharesof about 70 and 17 percent in the VSAT antenna and network equipmentmarket. Thrane & Thrane is also producing for this segment. There is asmall Norwegian company targeting this segment and it has received muchsupport in recent years.
Future and continued support for companies in this segment need to bebased upon very careful assessments of the business plans and commercialviability of individual firms and product offerings. There are reports of highripple effects, but the effects have been declining for decades.
73
Space specific or sectoral decline?
It is an important question whether the decline is due to company specific issuesor whether it reflects structural issues which cannot be addressed by space policytools alone.
The declining turnover seems likely to be space segment specific andnot representative of the broader electronics industry.
To that end we have investigated the economics of the broader electronicsmanufacturing industry in Norway over the last decade. The industry,encompasses about 300 firms. The space related ground equipmentmanufacturers are included in this sample. Space related electronics is about
50 %
60 %
25
30
Figure 1.35 Sales and profits before tax for electronics industry in Norway
Increasing sales and healthy profits for electronicsmanufacturing in general in Norway
manufacturers are included in this sample. Space related electronics is about2 percent of total and a sharply declining share.
The sector has seen strong growth leading up to 2008 and some volatilitythereafter. Profits have dipped considerably in 2007 but have come back.
(Manufacture of electronic components, loaded electronic boards,communication equipment, instruments and appliances for measuring,testing and navigation: NACE 26.11, 26.12, 26.30, 26.51)
0 %
10 %
20 %
30 %
40 %
-
5
10
15
20
2002 2004 2006 2008 2010
Pro
fit%
Bil
lio
nN
OK
Sales
Prof it % (bt)
73
Source: Business Registry (BRREG); PwC analysis

SatCom services have lost some global market share but still accounts for twocommercial space sales in Norway
The satcom services segment has received 1 percent of total ESA contracts andNRS support funds since 2000. This is less than 0,2 percent of total publicexpenditure on space.
Its share of the Norwegian value chain is about 61 percent. The share of globalvalue chain is about 3,5 percent.
Section 1.1: Market and industry developments
0,7
NOK USD
Figure 1.37: Share of total commercial spacesales Norway
Slight increase and significantshare of Norwegian commercialspace sales
value chain is about 3,5 percent.
High growth communications services firms have received some support but donot respond to the annual ripple effect surveys.
Figure 1.36: Sales commercial satcom services(nominal USD and NOK)
Nominal sales growth especially’09-’10
PwC
2005 2006 2007 2008 2009
0
0,1
0,2
0,3
0,4
0,5
0,6
0
1
2
3
2005 2007 2009
Sale
s(B
nU
S)
Sale
s(B
nN
OK
)
Source: SIA 2011; NRS; BRREG; PwC Analysis74
CAGR3%
≈68%
We will discuss mobile and fixed sub segments separately. Technologies arehowever converging so that fixed operators are also getting capabilities to servicemobile customers.
First, the fixed segment. This has one Norwegian operator, Telenor Broadcastwho operates a fleet of geostationary satellites.
SatCom services have lost some global market share but still accounts for two-thirds of
100 %
Sh
are
of
co
mm
erc
ial
sp
ace
Figure 1.37: Share of total commercial space
Slight increase and significantshare of Norwegian commercial
Second, the maritime mobile segment. This is smaller globally, but hassignificant Norwegian capabilities. This has long been a stronghold of theNorwegian enterprises driven much by demand from the maritime segment.
Figure 1.38: Estimated global market share
Slipping global market share
4,0 %
5,0 %
0 %
25 %
50 %
75 %
2009 2010
Sh
are
of
co
mm
erc
ial
sp
ace
74
0,0 %
1,0 %
2,0 %
3,0 %
4,0 %
2005 2006 2007 2008 2009 2010
Glo
balm
ark
et
sh
are

Fixed satellite operator Telenor goes strongly, but has divested most other engagementsin space
Capabilities, supply and demand fixed satcom
Telenor current satellite business is confined to broadcast. It distributes TVsignals in the Nordic, Easter Europe and Middle Eastern regions andincreasingly also service broadband. It’s a profitable undertaking, recordingEBITDA earnings percentage of close to 70 percent over the last few years. Its
Section 1.1: Market and industry developments
Intelsat
SES
Eutelsat
Telesat
Sky Perfect JSAT
Figure 1.39: Rank of top 15 Fixed Satellite Service operators by revenue(US million 2009)
Telenor operates mainly in TV transmission butincreasingly also in broadband market
EBITDA earnings percentage of close to 70 percent over the last few years. Itsmost important customer is Canal Digital.
It’s the only Norwegian based operator that owns and operates satellites. Itcurrently operates three and a fourth is under construction.
PwC
0 625 1250 1875 2500
Sky Perfect JSAT
SingTel Optus
Hispasat
Russian Satellite Communications
Star One
Arabsat
Telenor Satellite Broadcasting
AsiaSat
Indian Space
Nilesat
Thaicom
75
US million (2009)
The Telenor group was for long the pioneering, and dominant actor withinNorwegian space industries. In line with corporate priorities it has chosen todivest much of its space related business over the last few years. This includesTelenor Satellite Services which has now become Astrium Services. Telenor also
Fixed satellite operator Telenor goes strongly, but has divested most other engagements
Telenor Satellite Services which has now become Astrium Services. Telenor alsohad a considerable ownership share of Inmarsat which is now fully sold.
Telenor Broadcast operates Nittedal ground station in southeastern Norway. Thisis the largest ground facility in Norway serving its fleet of satellites with TVsignals and distribution to the terrestrial networks. It also operates teleportfacilities in the U.K.
Demand is driven principally by TV transmission through fixed geostationarysatellite networks. Global growth in this market averages 8 percent annuallysince 2005. The tail end of this market is the TV distribution to retail marketswhich has been growing at nearly 13 percent annually and is above 80 billiondollars in sales by 2010. Canal Digital operates across the Nordics and iscontrolled by Telenor. Viasat also operates in Norway.
Supply side is dominated by four large operators of geostationary satellites. Theseagain drive about 40 percent of the demand for launches and satellite equipmentdiscussed earlier. Six European based firms of about 50 worldwide.
Market analysts believe Telenor may be once again positioning itself for themobile satellite markets. Their new Thor 7 satellite will have capabilities whichwill allow it to compete head-to-head with Inmarsat for provision of broadbandto the maritime segments in Northern and Mediterranean seas.
Source: Space Report 2011; Company Investor information; Press reports75

Capabilities mobile satcom
The global maritime market is about 1,3 bn US in 2010 of which the VSATsegment may be about 800 million. Technologies are converging and servicesoverlapping. The strength of the two largest Norwegian based enterprises areexceptional in the VSAT markets.
There are two significant Norwegian operators in this segment. These areservice providers, do not own satellites or produce ground equipment. Eik
Global market leaders in maritime satcom and most is divested to foreign owners
Section 1.1: Market and industry developments
service providers, do not own satellites or produce ground equipment. Eikground station in Norway is operated by Vizada. Their equipment is mostly U.S,Israeli or Danish produced.
Figure 1.41: Oil & Gas and Maritime VSAT broadband service, share by vessel (2009 COMSYS)
Global market leaders in the fast growing mobile maritime segment havebeen attractive acquisition targets
Acquired by Astrium Services
Acquired by Inmarsat
A 17 billion dollar pie of which Norwegiancorporations have close to 3,5 percent
Figure 1.40: Global satcom services, fixed and mobile2010
Fixed US 15 bn
Telenor Broadcast(see next pages)
PwC
Source: Inmarsat investor presentations; COMSYS 2010 market surveys; SIA 2011; Press releases; Oslo Stock Exchange reporting;
Arendals Fossekompani(NO Investment group)acquired 80% in 2010
Mobile US 1 bn
U.S based, O&G sector,has operations in NorwayMaritime mobile
US 1,3 bn
Acquired Virtek (NO)2010
Global market leaders in maritime satcom and most is divested to foreign owners
Two of these companies are now fully owned by global service providers;Astrium and Inmarsat. A third is acquired by Telenor. Vizada is the by farlargest space operator in Norway and alone accounts for about 40 percent ofthe space related turnover. Vizada has business outside of VSAT markets.
Telenor’s Maritime Communications Partner offers GSM roaming on shipsand not broadband services as such.
15,3 %
10,1 %
7,1 %
Vizada (NO)
Ship Equip (NO)
MTN
: Oil & Gas and Maritime VSAT broadband service, share by vessel (2009 COMSYS)
Global market leaders in the fast growing mobile maritime segment havebeen attractive acquisition targets
Acquired by Astrium Services
Acquired by Inmarsat
50% 80%
and not broadband services as such.
5,2 %
4,9 %
4,7 %
4,5 %
3,1 %
2,8 %
2,8 %
2,8 %
2,7 %
34,0 %
Schlumberger
KVH
CapRock
Elektrikom
Intelsat
Eutelsat
NSSL (UK)
Radio Holland
Telemar
OthersSource: Inmarsat investor presentations; COMSYS 2010 market surveys; SIA 2011; Press releases; Oslo Stock Exchange reporting; PwC analysis
76
80-100providers
Arendals Fossekompani(NO Investment group)acquired 80% in 2010
U.S based, O&G sector,has operations in Norway
Acquired Virtek (NO)

Demand globally has been driven much by military needs, but of muchimportance for Norwegian based enterprises, a fast growing penetration rate forthe global merchant shipping fleet. The maritime segment is mostly driven bycrew welfare communications. Lately, demand is also driven by increased
New entrants may challenge the positions in maritime mobile markets
Section 1.1: Market and industry developments
crew welfare communications. Lately, demand is also driven by increasedsophistication of ship operations. Some segments, i.e. seismic oil explorationships transmit vast quantities of data. Ship Equip reports that each ship utilizedabout 650 mb of capacity each day, 80 percent of which is for crew personal use.Value additions include offerings such as internet cafes, Wifi, TV, telemedicineand mobile GSM roaming to home numbers.
There are about 100.000 ships in the global merchant fleet and the market isnot yet saturated. The Oil & Gas segment is also important, but it is estimatedthat market penetration is already close to 100 percent.
The services sold by Vizada and Ship Equip differ from earlier generations ofmaritime broadband in that it has higher capacity and is fixed fee. Thetechnologies involved are also different. Price points have been about 50percent above the earlier market leading Inmarsat fleet service.
On the supply side there are both satellite owners and pure service providers.Inmarsat is the dominating satellite operator controlling about 55 percent of the
PwC
Inmarsat is the dominating satellite operator controlling about 55 percent of themarket.
The business model of companies like Vizada and ShipEquip is about resellinga.o Inmarsat capacity and bundling this with various other value added services.Competition in the maritime service segment globally is intense with nearly 100providers, most of whom have emerged over the last five years.
Source: PwC analysis
New entrants may challenge the positions in maritime mobile markets
A new entrant is Ericsson (SE) who recently signed with Maersk (DK) toprovide seven year end-to-end service for 400 container vessels. This isreported to be the largest maritime service contract ever. Thrane & Thrane(DK) will produce the hardware.
Figure 1.42: Illustration Ericsson web and PwC illustration photo
Largest ever maritime satcom contract between Maersk,Ericsson and Thrane & Thrane servicing 400 containervessels
(DK) will produce the hardware.
77

Vizada’s origins are from Telenor Satellite Services that pioneered VSATtechnologies currently driving the market. TSS was sold to U.K based privateequity group Apax in 2007 and merged with French Telecom Mobile Satcom.TSS had annual revenues of 2,4 bn NOK at time of sales and Apax paid fivetimes as much for TSS as for FTMS.
At time of transaction with Astrium in 2010 it was reported that Vizada hadquadrupled revenues and increased earnings sevenfold over the three years.Astrium paid 10 times EBIDTA earnings for Vizada.
Uncertain impact of foreign acquisitions on satcom service industry
Section 1.1: Market and industry developments
Astrium paid 10 times EBIDTA earnings for Vizada.
Vizada revenues before the acquisition was 70 percent commercial, most frommobile satcom, and 30 percent from government customers mostly U.S.military. Much of the maritime mobile sales originates on the Norwegian side ofthe business but the particulars are not known. Vizada has been a reseller ofInmarsat and Iridium satellite capacity.
The core business of Astrium services before acquisition was providingbandwidth to NATO, British and German military. The acquisition will increaseAstrium turnover by 60 percent.
The increases reported in the international press are not reflected in therevenues reported in Norwegian business registries by Vizada. It is possible thatthe growth is accounted for outside of Norway. We cannot determine preciselyhow the level of activity in Norway has developed.
PwC
Uncertain impact of foreign acquisitions on satcom service industry
Ship Equip has captured an impressive market share of the maritimebroadband segment. The company started operations in 2005 and reached above300 million NOK (US50 million) in annual sales by 2010. It has some linkageswith Norwegian producers, i.e.. a broadband distribution agreement withTelenor Satellite Broadcast for the Middle Eastern markets.
Ship Equip was mostly management owned and Ferd PE group had a 19 percentshare at time of sales. Inmarsat acquired the full business in 2010. It isreported to be continuing its Norway based operations.
300 300
reported to be continuing its Norway based operations.
A third firm in this segment, Maritime Communications Partner (MCP)provides GSM roaming capabilities on ships. This has seen nearly as fast growthas Ship Equip and currently reports revenues at about 180 million NOK. MCP isnow fully owned by Telenor.
Figure 1.43: Growth of Ship Equip and MCP sales 2003-2010
Newcomers and fast movers in growing markets
CAGR 2006-2010
35%
Ship Equip MCP
35%
0
50
100
150
200
250
300
2003 2010
78
0
50
100
150
200
250
300
2003 2010
Source: PwC market analysis, Business Registry BRREG corporate data
NO
KM
ill(C
urre
nt)

Risks of dwindling satcom services activities in Norway and policy tools are not suitedto redress the issue
Is there a problem? There could be two:
-Risk of dwindling sales overall, which may be related to the second;
-Impacts of foreign takeovers.
The question is whether or not wealth creation contribution from the maritimecommunications firms are dwindling and whether anything could be done tomitigate that risk?
Section 1.1: Market and industry developments
mitigate that risk?
The risk to wealth creation is that profits are not reinvested in Norway or thatthe activity level and wages, declines. We should keep in mind that financiallyspeaking, the profits realized from sale of the company are in principle thepresent value of expected future earnings and technically there is no loss. Thereare gains to wealth creation if new owners reinvest earnings in the Norwegianenterprise.
Options to mitigate this risks to wealth creation are limited for thefollowing reasons:
- These firm represent the service end of the value chain. The ESA telecomsupport schemes are more relevant for hardware technology development,satellite manufacturing or ground equipment.
- The nature of the business is less about technology development and moreabout bundling and managing a service offering. This may change in thefuture as competition intensifies.
PwC
- There is a policy risk of supporting the firms as Norway cannot be sure thatthe resources provided will contribute to wealth creation in Norway. Thereis bound to be some leakage, i.e.. all profits are likely not reinvested in theNorwegian business. The significance of this risk in comparison with all theother risks associated with supporting firms in the national space programscannot be assessed. It may not be meaningfully more significant.
If there is an actual decline taking place, one could choose to see this as creativedestruction, and recognize the limitations of policy.
There are linkages here to broader telecom and IT sectors. There are nomeaningful clusters for these sectors in Norway although the potential has beenrecognized. Strategies could be discussed in that context.
79
Risks of dwindling satcom services activities in Norway and policy tools are not suited
Figure 1.44: Illustration of ESA telecommunication program priorities
ESA telecom programs are reinvigorated but mostlyrelevant for satellite manufacturing and ground hardware
79

Other satellite information services are emerging with strong Norwegian capabilitiesand market shares
Other satellite information services firms have received 20 percent of total ESAand NRS support funds since 2000. The ripple effect is about 6,8 and has beenincreasing for many years but stagnated since 2007. Public support is highlyconcentrated with only 1-2 firms annually receiving ESA or NRS funds. Thereare also several non-commercial R&D institutes that receives support for earthobservation work. They are included in the estimate of overall turnover.
Capabilities. Four categories of capabilities in Norway:
Section 1.1: Market and industry developments
0,9
Capabilities. Four categories of capabilities in Norway:
I. Offshore- onshore survey services. Almost entirely linked to maritimeand offshore industries. This is as much about satellite navigation as it isabout earth observation. There is also a terrestrial focused geomatics firmincluded here. About 50-60 percent of turnover.
Figure 1.46: Share of total commercial spacesales Norway
Increasing importance inNorwegian space economy secondonly to mobile satcom services
Figure 1.45: Sales other services (nominalNOK billion)
Rapid and real growth in sales
PwC
2005 2006 2007 2008
0
0,3
0,6
2005 2006 2007 2008 2009 2010
Sale
s(B
nN
OK
)80
CAGR16%
Other satellite information services are emerging with strong Norwegian capabilities
II. Commercial meteorological services. Highly competitive global metservice provider based in Norway. Estimated share of turnover in thissegment is 9 percent.
III. Ground stations and related services: These are the two Kongsbergcompanies KSAT and Spacetec. The latter is predominantly a manufacturerof ground station systems, but also develops software and applications. (Inour statistics this is all counted as equipment and not accounted for here.)
15 %
18 %
Sh
are
of
co
mm
erc
ial
sp
ace
our statistics this is all counted as equipment and not accounted for here.)30 percent of turnover.
IV. Institutional R&D. Several institutions with capabilities. Turnover herestems mostly from government funds, FP7 and ESA. Estimated shareabout5-10 percent.
Figure 1.46: Share of total commercial space
Increasing importance inNorwegian space economy secondonly to mobile satcom services
Figure 1.47: Estimated global market shares
Important global market shares ofother services market
3-10 percent
0 %
3 %
6 %
9 %
12 %
2009 2010
Sh
are
of
co
mm
erc
ial
sp
ace
80
Source and notes: Robust estimates of total informationservices market volume does not exist. Better estimates existof the EO and Met services markets and against those theNorwegian market share may be in the range of 3-10 percent.Robust estimates for sales volumes of services that utilizessatnav in basic or more advanced forms have not been foundin forms comparable to the service offerings by Norwegianenterprises.
Sources: NRS data, turnover surveys; BRREG businessregistry; corporate websites and annual reports; Euroconsult2011; Northern Sky Research 2011; PwC Analysis

Advanced commercial surveying and met services markets in Norway
Figure 1.52: Illustration from Fugro corporate webpage
Surveying off- and onshore increasingly using satelliteinformation in addition to navigation
Surveying, and in particular offshore were early adopters of sophisticated use ofpositioning systems. These companies in Norway are driven by the oilexploration markets that are very strong. Norway is by some estimates the worldslargest market for offshore O&G. These firms also dominate the EO segment inNorway with an estimated 50
The same firms also use satelliteexploration particularly in shallow waters. They also sell services for radar datamonitoring to identify leakages (i.e. oil slicks), ice monitoring, oceanography and
Section 1.1: Market and industry developments
60
80
Millio
nN
OK
Sale
s
Figure 1.53: Revenues of StormGEO (NOK million nominal)
Fast mover at the far end of the value chain
CAGR28%
StormGEO’s core business isforecasting has been made possible by decisions of U.S. and European agencies(EUMETSAT) to allow commercial operators access to the met satellite data. U.S.data are provided for free while European data are available for a fixed nominal fee(not cost basis). This has transformed the commercial met services market. Thesatellite infrastructure in Europe has been developed under ESA leadership and isoperated by a dedicatedcurrent and future met satellite developments except for the first satellite of each newgeneration which is financed by ESA.
monitoring to identify leakages (i.e. oil slicks), ice monitoring, oceanography andwave patterns etc.
Landside geomatics firms are to extent challenged by satellite imagery. Much of theircapital is often invested in aero planes and instruments. This is evolving and theirproduction processes change as the satellite products become better and lower cost.
PwC
0
20
40
1998 2000 2002 2004 2006 2008 2010
Millio
nN
OK
Sale
s
Source: BRREG, StormGEO websites; PwC market analysis
81
Note: StormGEO turnover has not been included in the annual statistics collected by the SpaceCenter and as such there may be some inconsistencies wrt totals elsewhere in this report.
28%generation which is financed by ESA.
StormGEO has evolved rapidly since 2004. It originated as a producer for acommercial TV station but has since then moved into specialized forecasts forindustry, maritime and offshore sectors. It operates in six countries including Dubaiand the U.S. StormGEO has also acquired a Swedish based weather routing servicefor deep sea commercial fleet markets.
The market size for commercial met services in Europe is about USD 200 millionwhich would give StormGEO acompound annual growth of about 24 percent since 2004. EBITDA earningspercentage of near 20 percent in 2010. The company is privately held: managementsownership and about 67 percent by Reitan private equity group.
Advanced commercial surveying and met services markets in Norway
Surveying, and in particular offshore were early adopters of sophisticated use ofpositioning systems. These companies in Norway are driven by the oil- and gasexploration markets that are very strong. Norway is by some estimates the worldslargest market for offshore O&G. These firms also dominate the EO segment inNorway with an estimated 50-60 percent.
The same firms also use satellite imagery and radar data products to supportexploration particularly in shallow waters. They also sell services for radar datamonitoring to identify leakages (i.e. oil slicks), ice monitoring, oceanography and
StormGEO’s core business is meteorological services. Commercial weatherforecasting has been made possible by decisions of U.S. and European agencies(EUMETSAT) to allow commercial operators access to the met satellite data. U.S.data are provided for free while European data are available for a fixed nominal fee(not cost basis). This has transformed the commercial met services market. Thesatellite infrastructure in Europe has been developed under ESA leadership and isoperated by a dedicated organization EUMETSAT. Member states foots the bill ofcurrent and future met satellite developments except for the first satellite of each newgeneration which is financed by ESA.
monitoring to identify leakages (i.e. oil slicks), ice monitoring, oceanography andwave patterns etc.
Landside geomatics firms are to extent challenged by satellite imagery. Much of theircapital is often invested in aero planes and instruments. This is evolving and theirproduction processes change as the satellite products become better and lower cost.
81
generation which is financed by ESA.
StormGEO has evolved rapidly since 2004. It originated as a producer for acommercial TV station but has since then moved into specialized forecasts forindustry, maritime and offshore sectors. It operates in six countries including Dubaiand the U.S. StormGEO has also acquired a Swedish based weather routing servicefor deep sea commercial fleet markets.
The market size for commercial met services in Europe is about USD 200 millionwhich would give StormGEO a market share of close to 7 percent. It recordscompound annual growth of about 24 percent since 2004. EBITDA earningspercentage of near 20 percent in 2010. The company is privately held: managementsownership and about 67 percent by Reitan private equity group.

Earth observation services supply side is commercializing while demand remains mostlygovernment
Supply side has become much commercial. This is a structural change over the last 5years.
This is in particular about image and data acquisition from satellites. Pure privateoperators exist here, mostly in high resolution imagery (U.S). Various private-publicpartnerships (Europe) and commercial sales of government satellite data (Asia includingJapan and Russia).
Section 1.1: Market and industry developments
Japan and Russia).
Ground stations services are increasingly commercial. ScanEx of Russia is fully private.Swedish Space Corporation is owned by Ministry of Finance but operates commercially.Kongsberg Satellite Services have much government ownership but operates commercially.Large operators also establish their own ground segments mixing own infrastructure withleased capacity (i.e. Digitalglobe and GeoEye).
Figure 1.48: Value chain Earth Observation
Much Norwegian activity in selected parts of the value chain
Satellites Distribution Value added Customers
CommercialHigh
resolutionoptical/radar
PwC 82
Science/Civil/Military
Value addedservices
Groundstation
Met services
Civil, militaryand privateenterprises
Public
Science/Civil/Military
Meteorologicalsatellites
optical/radar
Value added services have also become commercial althoughgovernments develop much capacity in house including in Norway.This segment is also categorized by participation from R&D institutes.
Commercial meteorological service have evolved particularly in theU.S. but also in Europe. Services are commercial but their data are
Earth observation services supply side is commercializing while demand remains mostly
has become much commercial. This is a structural change over the last 5-10
publicpartnerships (Europe) and commercial sales of government satellite data (Asia including
U.S. but also in Europe. Services are commercial but their data arefrom public sources. Met satellite data from U.S. and Europeanauthorities are distributed through separate systems and accessible forlicensed public and commercial users.
The supply side is integrating. Satellite operators and distributorsmove into the value added market. Ground station operators like KSATalso move into distribution (resale) and value added.
Demand side is mostly government. Estimates range from 60-85percent. This is much driven by large scale purchasing from U.S.Intelligence services. U.S Intelligence also purchases radar data inlarge volumes from the three most important providers (non-American). About 30-40 percent of image sales are for enterprises.
Increasingly there are multiple use of the same systems, especially forcommercial high resolution systems that are used by military, civil andprivate users alike. All the commercial systems have a high degree of
Ground stations services are increasingly commercial. ScanEx of Russia is fully private.Swedish Space Corporation is owned by Ministry of Finance but operates commercially.Kongsberg Satellite Services have much government ownership but operates commercially.Large operators also establish their own ground segments mixing own infrastructure with
Customers
government control and security restrictions.
Demand for value added services is also much from government. Thisis about developing applications and software to read and automateprocessing of image information, but also about data processing, datawarehouses, geotagging of images, advising on image acquisitions etc.
Satellites for remote sensing, i.e. to monitor atmospheric conditions,oceanography, agriculture, climate change monitoring are notcommercialized in downstream segments. Data are distributed throughdedicated systems with general public or scientific access. We are notdiscussing those here.
82
Civil, militaryand privateenterprises
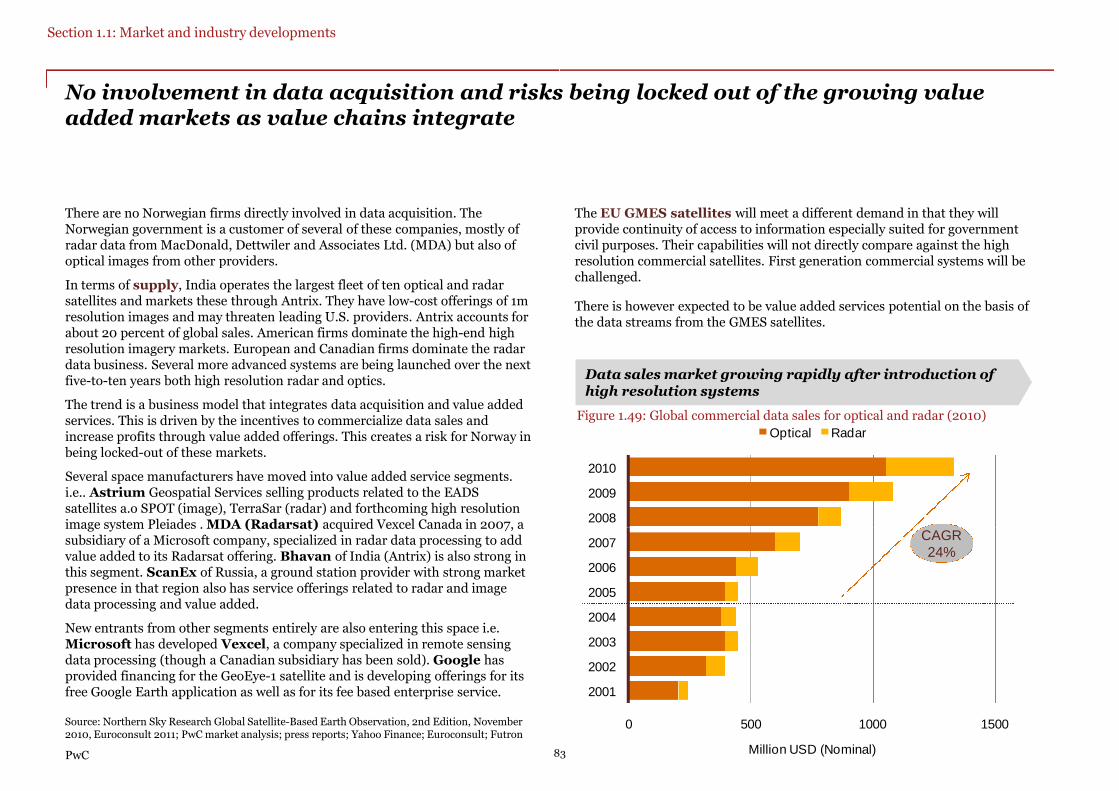
There are no Norwegian firms directly involved in data acquisition. TheNorwegian government is a customer of several of these companies, mostly ofradar data from MacDonald, Dettwiler and Associates Ltd. (MDA) but also ofoptical images from other providers.
No involvement in data acquisition and risks being locked out of the growing valueadded markets as value chains integrate
Section 1.1: Market and industry developments
optical images from other providers.
In terms of supply, India operates the largest fleet of ten optical and radarsatellites and markets these through Antrix. They have low-cost offerings of 1mresolution images and may threaten leading U.S. providers. Antrix accounts forabout 20 percent of global sales. American firms dominate the high-end highresolution imagery markets. European and Canadian firms dominate the radardata business. Several more advanced systems are being launched over the nextfive-to-ten years both high resolution radar and optics.
The trend is a business model that integrates data acquisition and value addedservices. This is driven by the incentives to commercialize data sales andincrease profits through value added offerings. This creates a risk for Norway inbeing locked-out of these markets.
Several space manufacturers have moved into value added service segments.i.e.. Astrium Geospatial Services selling products related to the EADSsatellites a.o SPOT (image), TerraSar (radar) and forthcoming high resolutionimage system Pleiades . MDA (Radarsat) acquired Vexcel Canada in 2007, a
PwC
image system Pleiades . MDA (Radarsat) acquired Vexcel Canada in 2007, asubsidiary of a Microsoft company, specialized in radar data processing to addvalue added to its Radarsat offering. Bhavan of India (Antrix) is also strong inthis segment. ScanEx of Russia, a ground station provider with strong marketpresence in that region also has service offerings related to radar and imagedata processing and value added.
New entrants from other segments entirely are also entering this space i.e.Microsoft has developed Vexcel, a company specialized in remote sensingdata processing (though a Canadian subsidiary has been sold). Google hasprovided financing for the GeoEye-1 satellite and is developing offerings for itsfree Google Earth application as well as for its fee based enterprise service.
83
Source: Northern Sky Research Global Satellite-Based Earth Observation, 2nd Edition, November2010, Euroconsult 2011; PwC market analysis; press reports; Yahoo Finance; Euroconsult; Futron
No involvement in data acquisition and risks being locked out of the growing value
The EU GMES satellites will meet a different demand in that they willprovide continuity of access to information especially suited for governmentcivil purposes. Their capabilities will not directly compare against the highresolution commercial satellites. First generation commercial systems will be
2008
2009
2010
Optical Radar
Figure 1.49: Global commercial data sales for optical and radar (2010)
Data sales market growing rapidly after introduction ofhigh resolution systems
resolution commercial satellites. First generation commercial systems will bechallenged.
There is however expected to be value added services potential on the basis ofthe data streams from the GMES satellites.
0 500 1000 1500
2001
2002
2003
2004
2005
2006
2007
Million USD (Nominal)83
CAGR24%

Sweet spot by KSAT in data distribution and a basis for expanding value added services
Kongsberg Satellite Services (KSAT) provides ground station services for earthobservation satellites. Its customers are global: commercial and government. Itoperates facilities worldwide: Antarctica, Bangalore, Dubai, Singapore , andSouth Africa and in the in addition to its three stations in Norway (Grimstad,Tromsø and Svalbard).
Demand in this market is derived from the growth of remote sensing satellitesand their usage. Demand also includes navigational , low orbit communications(i.e. Iridium) and geotracking systems. The most ambitious analysts indicatethat the fleet of remote sensing satellites in polar orbits may increase by about
Section 1.1: Market and industry developments
0 50 100 150
that the fleet of remote sensing satellites in polar orbits may increase by about250 additions over the next decade. Competition includes other groundstation operators: a.o Serco, DLR, SSC, ScanEx. There are both public andprivate providers.
Its key competitive advantage stems from the Svalbard facility and thesubsea fiber connection to the mainland. Competitors do not have facilitieslocated as far north as Svalbard and cannot offer the same view of all satellitesor same length of download time. Earth observation satellites move fast and thedownload time window is short at other latitudes. Networked locationscompete but Svalbard may achieve better cost-efficiency.
Figure 1.50: Reported tracked satellites for important earth observation groundstation operators (2010/11)*
KSAT among the specialists in earth observation satelliteground station markets
PwC
ScanEx (Russia)
SSC (Sweden)
KSAT
Source: Euroconsult: KSAT annual reports; BRREG (Business registry); Financial press; Corporatewebsite and reporting; *ScanEx 150 satellites is more than estimated number of total EO satellitesin operation. The number may include different types of satellites as well. PwC analysis
84
Longer term technological disruption may challenge the business model. Oneincludes Data Relay Systems which will enable downlink for remote sensingsatellites through geostationary satellites and teleports serving those. If successful,and at a competitive price point, these may be a game changer for the locationbased ground station business. Other technological challenges include crowding offrequencies near the poles as satellite traffic increases, or optical/laser linkageswhich enables faster downloads thereby making non-polar stations more useful.
KSAT has also offers value added services and reports that 23 percent of its
Sweet spot by KSAT in data distribution and a basis for expanding value added services
Sales Prof it %
Figure 1.51 Sales and profits of KSAT 2002-2010 (Nominal NOK, BRREG data)
Sales tripled since 2005 and it is consistently profitable
KSAT has also offers value added services and reports that 23 percent of itsrevenues stems from this. That would make them among the largest actor for EOvalue added in Norway. Anchor demand is from the Norwegian government butthere are also much other sales. Competitors also provides similar services.Competition also includes satellite operators firms which offer similar services withthe images/radar data sales; and specialist firms.
A competitive advantage for KSAT VAS is its perceived independence from satelliteoperators. Customers might be willing to offer additional value for this and KSATcan develop offerings with broader capabilities than satellite operators. It also hasanchor demand from government.
0 %
10 %
20 %
30 %
0
100
200
300
2002 2003 2004 2005 2006 2007 2008 2009 2010
Pro
fit%
Mil
lio
nN
OK
Sale
s
84
CAGR from2005: 23%

Long standing earth observation R&D capacity in Norway but participates few FP7projects
R&D institutes in Norway were early developers of algorithms to analyze radar(SAR) data from satellites. This is to recognize a.o oil spills, ice cover and shipsfrom the radar data streams. National needs drove this research andapplications are in operation in several agencies and R&D institutes. Thesehave been enhanced since. The basic algorithms are now widespread andavailable globally and commercially.
Most government financing for service and value added work has been directed
Section 1.1: Market and industry developments
18 %13 %12 %10 %9 %
3223211816
FRANCEGERMANYBELGIUM
UNITED KINGDOMITALY
Most government financing for service and value added work has been directedat KSAT and these institutes. There are few examples of commercialization, i.e.SME spinoffs within these product and service offerings. This has been seen toa larger extent in other European countries. There is likely to have beenknowledge and skills transfers to the offshore survey and met segments as theyrecruit from much the same base but we have not been able to document this.
Figure 1.54: Prime contractors of FP7 Space projects by country
Norway coordinates 6 projects, 3,5 percent of total butonly 0.9 percent of FP7 Space value
Projects
PwC
9 %8 %5 %4 %
3,5 %3,5 %2,9 %2,3 %1,7 %1,7 %1,2 %0,6 %0,6 %0,6 %0,6 %
16149766543321111
ITALYSPAIN
AUSTRIANETHERLANDS
FINLANDNORWAYSWEDEN
PORTUGALGREECE
SWITZERLANDDENMARK
ESTONIAHUNGARY
IRELANDPOLAND
Source: EU Cordis data; PwC Analysis
85
Project funding=0.9% of EU FP7 Space
Long standing earth observation R&D capacity in Norway but participates few FP7
An indication of the positioning vis-à-vis other countries can be derived from theEU FP7 Space research program. This is focused in particular on developingearth observation services and applications for the forth coming EUGMES series of Sentinel satellites. There are expectations that these will providea basis upon which to expand value added business. EU has funded the programswith 1,43 billion Euro.
Norway has had some success in this program. It leads six projects, about 3,5
60 %59 %50 %42 %39 %
104102877268
GERMANYFRANCE
UNITED KINGDOMITALY
BELGIUM
Figure 1.55: Subcontractors of FP7 Space projects by country
Cooperates in more but less than other countries
Norway has had some success in this program. It leads six projects, about 3,5percent of total. The EU funding for these projects are about 0,9 percent of totalindicating that they are smaller. Norway participates in further 22, or about 13percent of total projects. The value of Norwegian content in those projects ismore significant and estimated at about 16 million EUR and also entails thatNorwegian research institutions would capture about 3,3 percent of the fundingunder the program.
Projects
39 %37 %29 %23 %20 %19 %18 %17 %17 %16 %13 %12 %7 %6 %5 %
68645140353332302927222012118
BELGIUMSPAIN
NETHERLANDSAUSTRIAPOLANDSWEDENFINLAND
SWITZERLANDGREECE
PORTUGALNORWAY
DENMARKHUNGARY
IRELANDESTONIA
85

Geotracking markets emerging with Norwegian capabilitiesThis is an emerging market segment and not classified separately in the valuechain databases created. Development funds used over a four year period areabout 30-40 mill NOK. This would equate to about 4-5 percent of annual ESAcontracts.
Norwegian capabilities: The Norwegian government launched a dedicatedAIS satellite in 2010. This project was initiated by the Space Center andmanaged by the Defense Research Establishment. Data from the Norwegiansatellite are made available to Norwegian public entities.
The project was called a “demonstration” mostly for Government purposes but
Section 1.1: Market and industry developments
Figure 1.56: Illustration of ship density (courtesy NSC)
Global ship density mapped by the Norwegian AIS satellite
The project was called a “demonstration” mostly for Government purposes butalso for commercial value for the hardware manufacturer. It was not presentedas a service concept of commercial value. Government has earlier reported plansto launch another two satellites and appropriations have been made for asecond. Other service providers have emerged and we will briefly review this.
PwC
Source: Corporate websites: press releases, Financial press, ESA Artes 21 reports: Space Centerannual reports; Orbcom 3rd quarter report 2011; Hisdesat press release February 16,2012;PwCAnalysis
86
Demand: There is demand for geotracking services for terrestrial vehiclemanagement and logistics operations, airtrafic and maritime segments. Themaritime version of this is AIS. Ships above 300 tons are required by internationalregulations to carry AIS senders. Government demand is likely to come fromcoastal authorities and harbor management worldwide seeking to enhancemaritime surveillance capabilities. Commercial demand stem from ship-ownersand operators, logistical operations and financial services.
Market volumes are growing. Orbcom reports expectations of about 10-15 millionUS in AIS data sales and associated 90 percent EBITDA margin for 2012. Another
Geotracking markets emerging with Norwegian capabilities
leading operator ComDev/Hisdesat reports contracts with Canada, Australia, NewZealand, Japan and Singapore governments worth at least USD 10 million.
Supply: There is quite a development race ongoing and competition is escalating.Commercial operators have developed concepts, capabilities and are operational.The two most significant actors include Orbcom and ComDev. Of note is that thecompanies are quite small, i.e. annual revenues of Orbcom is about US 40-50million. There is consolidation ongoing and Aprize capabilities were recentlyacquired by ComDev.
• U.S. based Orbcom is an early mover and operated AIS service from 2008.This was under development contract funded by U.S. Coast Guard from 2004.Data sales have been commercialized. Lloyds Registry and Fairplay hasprovided value added services integrating satellite and terrestrial (AISLive)data since 2008. The satellites failed during 2010-11. Orbcom is now equipping18 satellites with AIS terminals and the first second-generation satellites arealready in operation.already in operation.
• Exactearth is a company formed by Canadian ComDev and now jointly ownedby Hisdesat who owns 27 percent of the operation and is marketing services inSpanish speaking countries. Exactearth also has AIS satellites in orbit andplans to have 10 satellite constellation in service by 2014. Three are operationalcurrently. Hisdesat also reports including AIS receivers on its new Pas radarsatellites to be integrated with the ComDev AIS service. MDA reports plans ofAIS receivers on the new RCM radar satellites.
Norwegian competitive positioning: As the government project only involvesone satellite and was not intended as a commercial project a comparison may notbe appropriate. The commercial position is nevertheless weak. The hardwareproducer may have gained relevant experience although its uncertain how thiscompares against those who deliver AIS receivers for the commercial operators.
86

Section 1.2
Institutional andpolicy developmentspolicy developments
The objective of this analysis is to analyze developments in the externalinstitutional and political arena which have implications for therelevance and effectiveness of the national space programs.
There are three perspectives on this:
Global policy developments are reviewed first. This is about the
the U.S. 2010 policy. This could be a game changer especially itsapproach to commercialization. We will review what the Americanshave envisioned and discuss how industry and government in Norwaymay be impacted; and
European issues. This is primarily about the reconfiguration of ESAand EU relationships with the implications this has for priorities anddirection of policies, as well as governance structures, and access andopportunities for Norwegian firms and other interests. This is anongoing, and slow moving process, but certain emerging patterns can beascertained. We will point to the key ramifications for Norwegian policy.
Emerging market developments
is about how developments in major emerging economies may impactspace programs in Norway. This is about increasing competition andcost pressures from a sizeable and fast growing space industry in severalemerging economies.
Peer country review
will focus on how these countries handle issues of interest for Norway.We focus on countries which may have overlapping priorities or sharedissues with Norway. He analysis focuses on features or issues which mayissues with Norway. He analysis focuses on features or issues which maybe interesting for Norwegian policy formulation. Three countries arediscussed: Canada, Sweden and Switzerland.

Global policydrivers

U.S. space policy changes has implications
Leading
Being the giant and still spearheading most advances in science , civil, militaryand commercial application: important policy changes will have implicationsincluding for small and emerging space nations such as Norway.
While much of the national policy focus is understandably on ESA and the EUwhere the money goes, the implications of U.S. policies cannot be ignored.
Section 1.2: External institutional and policy developments
where the money goes, the implications of U.S. policies cannot be ignored.
U.S. public expenditures on space related capabilities are in the area of 64,6billion US in 2010 (370 bn NOK). NASA’s constitutes about 30 percent ofthese, some 43 bn is security spending by Department of Defense, NationalReconnaissance Office and the National Geospatial Intelligence Agency, whilevarious civil agencies, including NOAA and the Science Foundation spendabout 2,25 bn US on space.
This is equivalent to about 75 percent of total global public expenditure, andabout a third of the total value chain turnover including consumer TVdistribution at the far end.
Spending has not increased over the last few years and there are concerns of adecline.
The full complexity of U.S. space programs and policies cannot of course bemeaningfully reviewed within the context of this report, but we will focus oncertain recent changes which should inform formulations of Norwegianpolicies.
PwC
policies.
The Obama 2010 policy
Most administrations in the U.S. have launched space policies outlining keypriorities and principles. The Obama administration is no different and theirpolicy is in many aspects a continuation, but also signifies some importantchanges.
We will turn to the changes in commercialization policies next.
89
A game changer especially for commercialization
Figure 1.57: Illustration of U.S. Space Policy release June 2010
Source: The White House; Space Foundation Report 2011; PwC analysis
89

Policies to drive U.S. commercialization leads to increased competition
The Americans have defined an expansive commercialization policy whichramifications will be felt also in Norway. This is a game changer.
The key is a definition of what commercial space activity implies and a set ofprinciples determining the conduct. The definition implies risk sharing andgoes beyond sub-contracting commercial vendors. A European term for this isPublic-Private-Partnerships. The principles accompanying this are far reachingand have structural impacts. In addition comes possible reductions of publicexpenditure which may drive U.S. producers towards other markets.
Section 1.2: External institutional and policy developments
U.S. business will continue to have defining anchor tenants in government butwill also have stronger incentives to further commercialize products andservices. A key example is the development process for human spaceflightwhereby commercial actors compete. The capabilities developed during thisprocess are likely to impact the launcher markets in the future. Similar impactscan be seen in the remote sensing segment i.e.. the developments of the opticalsatellites discussed earlier whereby private and government interests sharerisks and upsides We are also likely to see increased service developmentsrelated to these segments.
Impacts are twofold:
• Increased competition as U.S. producers are further incentivized to bothdevelop new capabilities and to commercialize them including on globalmarkets; and
• Cost-effective solutions as Norwegian governments may also be customersof these same offerings including in priority areas such as remote sensing and
PwC
of these same offerings including in priority areas such as remote sensing andgeotracking (AIS).
Related developments include possible revisions of the export controlregime. This is originally motivated by security concerns but is increasinglyseen as hampering commercial business developments. If changed, this willincrease global competition.
The free-and-open data access policy for remote sensing satellites willcontinue and Norwegian authorities and businesses benefit from this. Achallenge for U.S. authorities is to formulate such policies for remote sensingdata gathered through privately owned systems where public and privateinterests collide.
90
Policies to drive U.S. commercialization leads to increased competition
The Definition
“The term “commercial,” for the purposes of this policy, refers to space goods,services, or activities provided by private sector enterprises that bear areasonable portion of the investment risk and responsibility for the activity,operate in accordance with typical market-based incentives for controllingcost and optimizing return on investment.”
The Principles (edited)
• Purchase and use commercial space capabilities and services to the maximum• Purchase and use commercial space capabilities and services to the maximumpractical extent when available in the marketplace;
• Actively explore the use of inventive, nontraditional arrangements foracquiring commercial space goods and services, including measures such aspublic-private partnerships, hosting government capabilities on commercialspacecraft, and purchasing scientific or operational data products fromcommercial satellite operators in support of government missions;
• Develop governmental space systems only when it is in the national interestand there is no suitable, cost-effective U.S.commercial or, as appropriate,foreign commercial service or system that is or will be available;
• Refrain from conducting United States Government space activities thatpreclude, discourage, or compete with U.S.commercial space activities, unlessrequired by national security or public safety;
• Pursue potential opportunities for transferring routine, operational spacefunctions to the commercial space sector where beneficial and cost-effective,
Source: U.S. Space Policy 2010 White House; PwC Analysis
90
functions to the commercial space sector where beneficial and cost-effective,except where the government has legal, security, or safety needs that wouldpreclude commercialization;
• Cultivate increased technological innovation and entrepreneurship in thecommercial space sector through the use of incentives such as prizes andcompetitions; and
• Ensure that United States Government space technology and infrastructureare made available for commercial use on a reimbursable, noninterference,and equitable basis to the maximum practical extent.

EU solidifies its position as an importantspace policy actor in Europe
“The long-term and political perspective is to make ESA becomean Agency of the EU by 2014”
Section 1.2: External institutional and policy developments
ESA Director General 2006*
It is still open how the relationship between two institutions will evolve. Thereis an increasing alignment between EU and ESA and this is the dominatinginstitutional development over the last decade. The extent and depth of thisdevelopment in the future will greatly impact the main institutional arena inwhich Norway plays out its space policies.
We will in the following brief point to the most significant developments andindicate scenarios for how this can impact Norwegian space programs.
Two types of impacts particularly relevant. These are impacts on:
1. Governance: Influence on i.e.. articulation of policies, priorities anddetermination of programs and expenditure; and
2. Industrial policy, procurement and competition.
Next we will review the important drivers and impacts.
PwC
Source: PwC Analysis
91
Figure 1.58: Illustration major policy milestones 2000-2012
Ever closer integration of ESA and EU
ESA EU
Space policy 2.0
Lisbon treatyestablishes spacecompetence for EU
9 of 10 new EUmember states nowinvolved with ESA2010
GMES established as second flagship program following Galileo 20052005
2007EU Space Policy
Space Council endorses EU Space Policy 20072007
2009
2011
2013Financing? (MFF)
Ministerial council2012
Parallel ESA and EU resolutions on a “European Strategy for Space”2000 2000
2003
EC green paper onEuropean SpacePolicy
ESA/EU Framework agreement in force 20042004
2003EC white paper andaction plan
“Space Council” ESA Minister council and EU Council meets for thefirst time. 7th consecutive sessions to 2010 20042004
91

Ambitious EU mandate that may be alignedwith broader Norwegian policy priorities
In 2009 the Treaty Of Lisbon established competency for the European Union todraw up a European space Policy, to develop a European Space program, and toestablish any appropriate relations with ESA. On this basis, the Commissionissued a policy communication in 2011 setting out the direction: ” Toward aspace strategy for the European Union that benefits its citizens.”*
The policy is formulated on basis of four problem definitions:
Section 1.2: External institutional and policy developments
1. Security of critical European space infrastructure is not ensured.There is not full and accurate information about satellites and debris orbitingearth and this constitutes a risk to space infrastructure;
2. Europe lacks a long-term strategy and critical mass for spaceexploration. The Commission argues “that space exploration gives nationsinvolved in it a high political profile in the international arena. It is also adriver for technological innovation and is detrimental to Europe from aninternational standpoint, does not allow space exploration potential forinnovation and competitiveness to materialize and could have negative effecton science and education”;
3. Space policies and investments are decided at national/intergovernmental level. The Commission argues that:
a) Space initiatives only indirectly respond to broader European policyobjectives;
b) National space policies' target is national industry, which may beb) National space policies' target is national industry, which may bedetrimental to the competitive development of the European spaceindustry; and
c) There is a risk of overlaps, fragmentation and discontinuity of theactivities in the European space sector; and
4. National investments for dedicated space programs cannotsufficiently address the needs of EU policies and interventions. Dueto the fragmentation of national decision making channels, space governanceframeworks and lack of coordination of funding mechanisms, investment inessential space activities or space exploration cannot acquire the necessarycritical mass.
92
Source: For this and following pages: COM (2011) 152; SEC (2011) 381
The Treaty on the Functioning of the European Union
Article 189
1.To promote scientific and technical progress, industrialcompetitiveness and the implementation of its policies, the Union shalldraw up a European space policy. To this end, it may promote jointinitiatives, support research and technological development and
Figure 1.59: Article 189 of the Treaty of Lisbon
Lisbon treaty establishes competence for the EU on spacepolicy matters
92
initiatives, support research and technological development andcoordinate the efforts needed for the exploration and exploitation ofspace.
2.To contribute to attaining the objectives referred to in paragraph 1,the European Parliament and the Council, acting in accordance with theordinary legislative procedure, shall establish the necessary measures,which may take the form of a European space program, excluding anyharmonization of the laws and regulations of the Member States.
3.The Union shall establish any appropriate relations with theEuropean Space Agency. (4. not shown)

Ambitious EU action plan but with greatfinancial challenges that are currentlyunresolved
Priority actions to redress the situation are identified as follows:
1. Satellite navigation: the Galileo and EGNOS programs. The systems thatemerged from the Galileo and EGNOS programs represent the first majorspace facilities solely belonging to, and managed by, the EU;
2. GMES (Earth monitoring system). The Commission’s aim is to implement the
Section 1.2: External institutional and policy developments
2. GMES (Earth monitoring system). The Commission’s aim is to implement thesystem “quickly and effectively” and is to become operational as of 2014.GMES is to provide current environmental and security-related data.;
3. Secure Space to Achieve Security and Defense Objectives. As an instrument itcan serve the European Union's security and defense interests; as an asset itrequires protection; and
4. Space Exploration. Priorities have been identified including: criticaltechnologies, International Space Station (ISS )and access to space(Launchers).
Economic challengesA core challenge is economic. Range for the policy is estimated between euro 130million and 1,5 billion annually but it is stated that non-quantified costs could be“exponentially higher.” Currently provisions for financing GMES are lagging andthe EU indicates that ESA member states may need to finance this completely.
This relates to structural challenges of EU budgets and medium-term financingframeworks (MFF). The EU budgets overall are small compared to member statesand are not rigged to take on large scale development or operational costs of a.o.space activities. I.e. Galileo and GMES costs have largely been funded by transfersfrom the agricultural programs.The scale of financing that is required for the moreambitious variants of the policy may go beyond what the EU budgets can absorb.
Closing this financing gap is an important and unresolved challenge.
93
Decades of guaranteedcontinuity of GMES earth
observation satellite series
20 percent of ESA 2011budget from EU
Figure 1.60: Illustration of EU space policy implications
EU ambitions already have practical implications
93
22 bn euro end-to-end costs ofGalileo*
Source: * Financial Times Deutschland 2010, 20 yrs of operation
70 mill euro Norwegian contributionto development of Galileo

Future governance of European Space involvesmilitary ambitions, restructuring of ESA andNorway to take part in some programs
1. Coordinate Member States: The Commission wishes to bettercoordinate activities of member states, space infrastructure is to beexplored jointly. Space program management remains fragmented andinternational investment segregated. The proliferation of protagonists – theMember States via the space agencies, the ESA, EUMETSAT and the EU –is not conducive to effective decision-making or implementation.
Section 1.2: External institutional and policy developments
2. Re-assess relations with the ESA. Now, the EU's increasinginvolvement in space entails:
a) Gradually adapting the ESA's operations so that maximum benefitcan be derived from the two organizations.:
b) As far as the Commission is concerned, the ESA should continue todevelop into an organization with an intergovernmental andan EU dimension in which military and civil programs cancoexist.
c) The model should be flexible enough to adapt to the level offunding that the various protagonists set aside for the differentprograms in the future.
d) A flexible membership structure should also be established inorder to enable Switzerland and Norway to take part in someprograms and to offer limited participation to some MemberStates.
3. Third countries cooperation:a) Certain space activities including the International Space Station,
ISS) can only be conducted in cooperation with third countries.b) The Commission wishes to seek a “constructive” solution with
China which claims the same frequencies as Galileo for itssatellite navigation system COMPASS. This is a risk to theindependence and fundamental rationale for the system.
c) The Commission will discuss co-operations with U.S. and Russiain i.e. earth observation.
d) The Commission seeks to utilize space capabilities as aninstrument for development policy with a.o Sub-SaharanAfrica.
94
Future industrial policy will be morecompetitive but likely not fully aligned withEU procurement directives
1. The Commission declares it will draw up, in close cooperation with the ESAand the Member States, a space industry policy that reflects the specificneeds of each sub-sector. The main objectives of such a policy would be thesteady, balanced development of the industrial base as a whole, includingSMEs, greater competitiveness on the world stage, non-dependence forstrategic sub-sectors such as launching, which require special attention, andthe development of the market for space products and services.the development of the market for space products and services.
2. Special significance is given to SatCom: In order to maintain Europe's leadin satellite communication technologies, research must be carried out atEuropean level, given the spin-offs it can create for other application sectors.The availability of the appropriate radio spectrum will be necessary toensure that satellite communications and space infrastructure areoperational and help achieve the European Digital Agenda and EU spacepolicy objectives.
3. In order to improve competitiveness it is seen as necessary to make betteruse of the European regulatory framework:
a) Regarding trade in particular;b) Of the financial instruments to support research and
innovation;c) To define the most appropriate type of procurement procedures
and the applicable award procedures when EU funding is
94
and the applicable award procedures when EU funding isconcerned;
d) The option of adopting specific provisions under particularlegislative acts could be examined.
We wouldn't expect the full procurement volume to be subject to directives 17and 18. Although the EC remains uncompromising on competition andprocurement, in practice, the directives only govern an estimated 20-25 percentof total European public procurement.* Experiences of applying the directivesand in particular the competitive dialogue procedures for Galileo developmentalso showed that there may be a need for adaptations for this to work effectivelyfor space procurement.
Source: PwC and London Economic: Public Procurement in Europe. DG MARKT 2011

ESA governance is independently challenged with rising membership causinginefficiencies and costs
ESA is constituted as an intergovernmental organization. There are currently 19members including two non-EU members Norway and Switzerland. All EU 27states are expected to be members over the coming years and the reminding arecurrently in various stages of accession.
ESA does what the member states decides it should do. Rules of procedurestipulates specific decision rules for different issues. Important decisions such
Section 1.2: External institutional and policy developments
stipulates specific decision rules for different issues. Important decisions suchas level of resources for programs are decided by unanimity. Thus fullconsensus is required, even by members that do not participate in a program.
This can be seen as serving the interests of smaller nations including Norway. Itmay also be seen as an important requirement for a smaller nation to join in thefirst place as it will have some assurance of influence. Norway as such exertsinfluence far beyond its 1-2 percent contribution. Repeat interaction possiblyleads to reduces conflicts and a culture of compromises. This also reflects thatESA is mostly a consensus driven organization otherwise the unanimityprocedures would be unmanageable.
The risk is, as the ESA DG points out*, that it leads to lack of flexibility, costsand delays. These risks will only increase as ESA expands and accepts newstates with the same rights.
Industrial policy rules are faced with similar dilemmas. From an efficiencystandpoint, there is a real risk that the rules which guarantee a contract returnby country equivalent to its contribution are driving costs higher and causing
PwC
by country equivalent to its contribution are driving costs higher and causingdelays. Most states, including Norway participates in all program families, oftenwith very small contributions, and all of these have to be matched by contractsor reimbursements schemes. In the end it is not certain that this increases theoverall competitiveness of European industry, but it will create opportunitiesfor corporations which would otherwise not have been competitive.
The dilemma arises as these same rules also guarantee smaller nations a realvoice and influence and a possibility to build-up industrial capabilities. Withoutthese, ESA may soon loose its attractiveness for smaller nations.
A longer term scenario is that the system will be revised, compromises willbe sought, and smaller nations including Norway may need to be more selectivein its participation.Source: Agenda 2011 ESA; ESA Agenda 2015; PwC Analysis
95
ESA governance is independently challenged with rising membership causing
Figure 1.61: Important decision rules in ESA
Challenging to apply the convention…and not easier withprospects of 29 members
Unanimous:-Level of Resources for programs-Changes of industrial policy
Two-thirds:-Adopt the general budget-Adopt each program-Technology export
Majority of all member states:
19
13
2012 Procedure and decisions 20++
29
19
-Accept Optional programs and prioritization
Simple majority of represented states:-Procurements-Other matters not specified
10
≤ 10
15
≤ 15
95

Norway’s influence will be reduced andEuropean markets more competitive andinaccessible for Norwegian firms
So, where does this leave Norway, small nation and non-EU member? It isdifficult to predict whether Norway will be better off if the EU objectives areachieved. But there definitely a number of challenges:
Influence will decline as EU member states coordinate, possibly pool funds
Section 1.2: External institutional and policy developments
Influence will decline as EU member states coordinate, possibly pool fundsand a larger share of the funding and activity total originates in EU. How much,and with what significance is harder to ascertain.
If small today, the ability to influence priorities, determine the agenda andstrategies will undoubtedly decline in the future. Norway’s current influence isdisproportional to its resource contribution but there are only a few examples ofwhere this has had a marginal impact.
Competitiveness will decline. Increased EU funding, and shifting memberstate money out-of-the juste retour system and applicable under EUprocurement, will on balance damage Norwegian industries competitiveness. Afew of the successful operations in Norway may actually gain as they are hugelycompetitive and are currently constrained by the juste-retour. Net, we wouldexpect a decline.
The risks cannot be ameliorated entirely, but mitigation strategies couldinclude significant scale-up of resource provision, ad-hoc programcontributions ala Galileo; and more out-of-the-box: be prepared to seek
PwC
contributions ala Galileo; and more out-of-the-box: be prepared to seeksupplementary venues for bilateral European or non-European cooperation.
96
Figure 1.62: Illustration policy scenarios
1. Defining parameters
EUFunding
High
Conceptual
Funding
Low
Governance
Intergovernmental Supranational
2. Implications
Competitive
Procurement
Juste Retour
Small country influence
High Low
96

Increasingly national programs organized as partnerships with commercial orientationand private capital at risk
Boundaries between public and private roles are shifting. There arethree models emerging:
• U.S commercialization strategy: Private investments and risks,government service contract backing. Especially seen in the earth observationmarkets for high resolution optical and radar satellites. Privately financed, i.e..the GeoEye-1 satellite was co-financed by the U.S. National Geospatial
Section 1.2: External institutional and policy developments
the GeoEye-1 satellite was co-financed by the U.S. National GeospatialIntelligence Agency and Google. Digitalglobe raised financing for its newsatellite through a public offering of its shares in 2009.
High private risks are involved as evidenced by the recent collapse in stockmarket prices of DigitalGlobe and GeoEye due to signals of cutbacks ofgovernment spending on imagery. U.S. intelligence services have also enteredinto five-year 85 million dollar contracts with non-American firms MDA, EADSand Infoterra for radar data. The competition to develop new launchers andservice capabilities is the other important manifestation of the concept.
Figure 1.63: Important functions of public-private partnership models
Governments use new approaches to lower cost of capital, align incentives and encourage commercialization
Purposes
Lower cost of capital. This is about reducing risks for private participantsthereby lowering the cost of capital.
Aligning incentives. Private capital risk and commercialization incentivesaligns incentive for cost and quality between private and public actors.
Lower life-cycle costs through revenue streams. Commercial salescreates revenue streams and thereby reducing life-cycle costs.
Incentives for commercialization. Incentives to increase revenues, reducerisks and dependency on government sales.
97
Increasingly national programs organized as partnerships with commercial orientation
• European PPP models: U.K/Norway/France/Italy/Germany/Canada/Israel:Public private partnerships model whereby government investments aresignificant and private operators/owners are responsible for operations andcommercialization. This has been seen in optical/radar satellite systems and alsofor military satellite systems. TerraSAR-X is a radar satellite developed byEADS Astrium and the German Space Agency. Rapideye is another private-public financed German project. The four satellite constellation Cosmo-public financed German project. The four satellite constellation Cosmo-Skymed is a military-civilian project which also offer one meter radarresolution images sold commercially through e-Geos/Telespazio.
British military communications system Skynet-5 and Norwegian-Spanishmilitary communications satellite HisNorSat are the other examples. Norwayhas an ownership stake while the British lease capacity from Paradigm andEADS. Both sell excess capacity.
• Asian government commercialization: India/Russia/South Korea: Fullgovernment financing but sales commercialized through a state owned companyor by licensed agents. Earth observation image and radar satellites.
Governments use new approaches to lower cost of capital, align incentives and encourage commercialization
Important challenges
Balancing risks and incentives. The most important difficulty is finding abalance of appropriate balance of private capital participation versus sharing ofupsides. Current programs are likely to provide lessons in this regard but it maybe too early to make any assessment.
97

Emergingmarketsdevelopments

Figure 1.64:
Russian arctic strategy reveals Svalbard ambition and results inconstruction of ground station
Russia
Emerging market but an old space power. Estimated budget for Roscosmosin 2011 at 3,7 billion US* (2,8 billion EUR/21,5 billion NOK). Eight percentnominal growth from 2010 but high inflation may reduce the real gain. Areinvigorated the Russian space programs after decades of decline. TheGLONASS (SatNav) is now operational with 31 satellites in orbit. Onlycountry with ability for human space travel (after retirement of U.S. spaceshuttle) Structurally, Russian industry benefits from large and captivedemand from defense-driven government applications. Industry suffersfrom a retiring workforce and loss of qualifications. Concerns are rising
Section 1.2: External institutional and policy developments
from a retiring workforce and loss of qualifications. Concerns are risingafter a string of recent engine failures of the old Soyuz launcher.
Analysts believe opportunities may exist for European companies.
Russia has also started construction of a satellite ground station atSvalbard. Norwegian authorities dispute the construction on environmentalgrounds and have demanded it removed.
China
Estimates of annual spending range widely between 2,5-6,5 billion US. Highend estimates include the science programs. An ambitious space programand a white paper released last year. Supporting much infrastructuredevelopment: i.e. four launch sites, Chinese space station underdevelopment, seven satellite constellation SatNav system (Beidou), datarelay satellite, military communications and earth observation satellites, andsatellite orbiting the moon.
Figure 1.65:
Catching up to Russia in the medium size satellite launchsegment?
Russia
China
PwC 99
Source: *Globalsecurity.org 2011; Barents Observer 2012 ; New York Times Dec 2011, Federa l Aviation Administration 2011; Spa
satellite orbiting the moon.
Surpassed the U.S. in launches last year and now rivals Russia in launchingmedium-size commercial communications satellites.
About 40 large enterprises and an estimated 48.000 space workers. Annualrevenues of aerospace manufacturers at about 22 bn USD in 2010(NOK127bn/EUR17bn) up 60 percent since 2005, half of it by commercialcompanies. Only parts of these sales are for space and the exact amountcannot be ascertained.
Europe
India
Japan
Figure 1.64: Illustration of Russian Svalbard strategy and construction site
Russian arctic strategy reveals Svalbard ambition and results inconstruction of ground station
Figure 1.65: Number of orbital satellite launches 2011
Catching up to Russia in the medium size satellite launchsegment?
32
18
Russia
China
99
Source: *Globalsecurity.org 2011; Barents Observer 2012 ; New York Times Dec 2011, Federa l Aviation Administration 2011; Space Foundation 2011; OECD 2012
17
7
3
3
1
U.S.
Europe
India
Japan
Iran

Figure 1.66:
The lowIndia
Budget for the space organization of about 1,5 bn US in 2011. More than 30percent increase two years in a row. The space agency has 15.000employees.
Large domestic communications system with eleven satellites providing TVsignals for 90 percent of the population. Fleet of ten optical and radar earthobservation satellites.
Has an estimated market share of 20 percent of the global optical imagebusiness. They will also expand into radar satellites in the near future.
Geoeye
Section 1.2: External institutional and policy developments
business. They will also expand into radar satellites in the near future.Value added services increasing and i.e. Antrix/Bhavan has launched a 3Dmapping image service to rival Google. Some 500 active companies.
Tested ballistic missile defense system in 2011 indicating a focus on militaryprograms in response to the so called “Asian Space Race”. i.e. Japanlaunched two “spy-satellites” in 2011, and several more by the People’sLiberation Army.
Latin-America
The region does not see the same scale-up as in Asia, but there are a numberof countries with space programs, satellite production and ambitions.
Brazil and Mexico are the largest. Mexico has developed a telecom companywith three geostationary satellites in orbit. Other countries with activeprograms and accomplishments include: Argentina (built its owngeostationary com satellite), Chile, Colombia, Peru. Several countries have
Figure 1.67:
Space manufacturing turnover in Brazil is small and not muchahead of Norway though it is growing faster
Worldview
PwC 100
Source: Prices from Telespazio, Antrix. GRES, Astrium Geo Services; Brazil data from Associação das Indústrias Aeroespaciais
geostationary com satellite), Chile, Colombia, Peru. Several countries havehad astronauts in orbit. Most are focused on remote sensing capabilities.
Brazil’s policy in particular is characterized by extensive bilateral cooperationprograms and utilitarian objectives. The flagship program is the Chinese-Brazilian earth observation systems (CBERS), three satellites currently inorbit used for a.o rainforest monitoring and natural resource management.
Brazil also develops a launcher (Cyclone-4) in cooperation with Ukraine.The industry is backed by the significant aerospace industry which is theworlds third largest.
Figure 1.66: Indicative market prices high resolution, fresh images, per Sq km
The low-cost image challenger
$19
$25
Ikonos (1m)
Geoeye-1 (0,5m+)
Figure 1.67: Revenues space manufacturing Brazil (USD Bn Nominal)
Space manufacturing turnover in Brazil is small and not muchahead of Norway though it is growing faster
$9
$17
Cartosat-2 (1m)
Worldview-1 (0,5m+)
0,6
Bn
US
Dn
om
inal
100
Source: Prices from Telespazio, Antrix. GRES, Astrium Geo Services; Brazil data from Associação das Indústrias Aeroespaciais do Brasil
0
0,2
0,4
2005 2006 2007 2008 2009 2010
Bn
US
Dn
om
inal

A future of low-cost space, commoditization and service expansion willthreaten Norwegian firms
A large number of emerging markets are developing space capabilities. Mostly onthe Asian continent, but also in Latin-America. Other more mature markets withexpanding capabilities include Israel , Japan and South-Korea.
Commercial capabilitiesare still somewhat limited. Those relate primarily to operation of SatCom servicesfor domestic or regional markets; The launcher industries of Russia and China
Section 1.2: External institutional and policy developments
for domestic or regional markets; The launcher industries of Russia and Chinahave significant market shares and especially China has begun to make inroadsinto the more profitable segment of launching commercial communicationssatellites directly in competition with a.o Arianespace; Within the broader Earthobservation segment, also in India especially the image segment is semi-commercialized and they have gained shares in the global image sales markets.The satellites are government backed here as everywhere else, but data sales arecommercialized.
There are two trends characterizing these developments:
The Asian Space raceis a heated competition mainly between China, India and Japan but also impactingSouth-Korea, Malaysia, Indonesia, Thailand, Vietnam and Taiwan. There is verylittle cooperation between these nations and no pooling of resources or sharing oftechnologies in the manner seen in ESA. A regional organization do exist, but thecountries mainly pursue national agendas and there are concerns of increasedmilitarization and arms race. This resonates with a broader geopolitical backdrop.militarization and arms race. This resonates with a broader geopolitical backdrop.
Latin-American partnershipscharacterizes the Latin -American developments. Although less evolvedcapabilities, the countries priorities are less driven by security issues. Remotesensing and communication needs drive the developments. Brazil in particular isactive in developing collaboration with others and there are industrial contractsharing deals associated with this.There are also increasing linkages between Asia/Russia and Latin-America.
101
Source: Moltz Nature journal 480 Dec 2011; PwC Analysis
cost space, commoditization and service expansion will
Opportunity or threat?
Implications are twofold:
Growth opportunitiesmay exist. This could be linked to a few manufacturers who maintain globalspecialized competencies in some segments of i.e. satellite components andspecialized competencies in some segments of i.e. satellite components andground equipment. This is however also the area which is likely threatenedlonger term.
Communication services, optical image and radar data will become moreaffordable, systems will have better capabilities and demand will grow as aresult of declining hardware prices globally. Derived demand, i.e.. for valueadded services will grow.
There are certain strengths among Norwegian providers in these segmentswhich may expand on the back of this - particularly within communication andimage/radar value added services. Demand for earth observation downloadservices will grow and the locational advantages at Svalbard does provide acompetitive edge.
Threats prevail
101
Threats prevailparticularly for hardware manufacturers. The institutional markets in Europewill remain protected from these developments backed by politicalconsiderations. The global commercial segments may not.
As more producers in a range of countries gain capabilities, flight heritage andspace qualifications, there will be more competition and lower prices in theglobal markets.
Those producers who are closely linked to anchor tenants in Norwegian orregional markets, i.e. offshore or maritime may maintain advantages. Otherswill have a harder time.

Peer countryPeer countrydevelopments

Peer country review
The purpose of this segment is to highlight developments in three countries.The three countries are selected in collaboration with MoTI. They represent indifferent ways relevant cases for Norwegian policy.
Canada: Has a shared interest in the arctic region. As we shall see its policiesand programs are also oriented towards this. Its public service developmentprograms in particular are similar to those of Norway. Canada has a highly
Section 1.2: External institutional and policy developments
programs in particular are similar to those of Norway. Canada has a highlyfocused and selective space program. The industry structure in Canada is quitesimilar to that of Norway. It is larger in absolute terms but about the same inGDP terms. Industry has seen real growth mostly driven by services segmentsas in Norway. Canada has recently launched a far reaching policy reviewprocess. A rationale for the process is to address emerging challenges andcompetition.
Sweden: Has a tradition of large scientific programs including launches ofown satellites. This seems to be changing. Government is scaling down thenational satellite developments and focusing on ESA participation. There ismuch commitment to the Ariane-5 launcher programs due to strong deliveriesby Volvo Aero and Ruag Saab. Its national programs are at about the same sizeas Norway but the approaches differ. They are more programmatic and closertied to research. The Swedish space agency also manages the science fundingfor space. The industry turnover is smaller than in Norway constituting about0,06 percent of GDP. There has been limited growth but possibly a decline ifadjusted for inflation. There has been calls for a comprehensive space policy
PwC
adjusted for inflation. There has been calls for a comprehensive space policybut no process launched so far.
Switzerland: Has traditionally channeled most of its space program supportthrough ESA. Upon a strategic review, whereby it was found that the context ischanging, Switzerland now has a stated policy that includes an expansion of thevenues and instruments.
Source: PwC analysis
We will review the three countries in turn focusing on issues of interest forNorway and apparent differences in approaches.

Canadian industry has structural similarities with Norwegian industry
ContextBeyond the obvious differences in context there are also some relevantsimilarities.
• Canada has a particular interest in arctic territories. It has large territories forwhich satellite surveillance and communications are important. It also hasstrategic interests in arctic developments due to natural resources deposits andcontrol of the North West passage.
• The industry is mostly service oriented and has a comparable structure to that of
Section 1.2: External institutional and policy developments
50 %
60 %
3
3,5
Revenues Export ratio
• The industry is mostly service oriented and has a comparable structure to that ofNorway.
• It is also seen as a specialist and component producer for U.S. based primemanufacturers.
Canadian dollar has appreciates much against the USD and EUR. More than theNOK over the last decade.
Figure 1.68: Revenues and export ratio Canadian space sector (2010)
Real growth in revenues mostly from telecom, and overallsize comparable to Norway’s GDP ratio
0 %
10 %
20 %
30 %
40 %
50 %
0
0,5
1
1,5
2
2,5
3
2002 2006 2010
Bill
ion
CA
D(N
om
inal
)
104
Source:CSA industry statistics; MoTI Canada Departmental performance Report 2011; IMF Art IV 2012; PwC Analysis
0,21%of GDP
Canadian industry has structural similarities with Norwegian industry
Industry has shown real growth over the last five years. This is reported to bealmost exclusively (97 percent) driven by growing telecommunications services.There is a domestic market constituting about 50 percent of revenue. Exportshave been growing faster than domestic sales over the decade and stabilized atabout 50 percent over the last few years.
Important industry events over the last years include the Cabinet blocking the saleof Vancouver-based MacDonald, Dettwiler and Associates (MDA) to U.S. firmAlliant. This type of government involvement in markets is unusual in Canada
18
12 1
Alliant. This type of government involvement in markets is unusual in Canadaalso in the space segment. Some analysts see this a break with history and a signalof more national ambitions on behalf of the current government. Of note is thatMDA was owned by U.S. Orbital Science Corporation during 1995-2000. Duringwhich time it also acquired Canadian company Radarsat from Spar Aerospace.The Canadian government raised no concern at that time.
Figure 1.69: Space industry turnover Canada by segment (Percent, 2010)
Service oriented industry structure and fastest growth inthe service segment
69
18
Apps & Services Ground segment Space segment Space research
104
PwC Analysis

Focused and selective Canadian space program
Space programsIts space policy and programs are characterized by a highly selective andprogrammatic approach. Its focused on three areas: Earth observation, spaceexploration and Satcom. Each program is composed of a research component,mission developments and operations components. There is also a generictechnology program in support of these three. An emerging, but currently muchsmaller program is for space awareness and learning.
Section 1.2: External institutional and policy developments
Its budget for 2011 is at 322 million CAD, apprx 1,8 billion NOK. This is about 10percent of industry revenue, also comparable to Norway.
Its participation in ESA is linked to these programs. Its ESA contribution is abouta third of Norway’s.
Figure 1.70: Illustration of Canada space program priorities (2011)
Highly programmatic approach and much selectivity
105
Source:CSA industry statistics; MoTI Canada Departmental performance Report 2011; IMF Art IV 2012; PwC Analysis
Focused and selective Canadian space program
The space strategy was approved by government in 2005 after much deliberationand consultation across industry and with other interests.
Its earth observation program has similarities and interfaces with Norway’s.There is a mission development program focusing on Radarsat. Radarsat-2 isowned an operated by MDA but the Canadian government financed about 75percent in return for data. Currently, most expenditure here is for development ofthe planned radar constellation mission (RCM). MDA is prime contractor for this.the planned radar constellation mission (RCM). MDA is prime contractor for this.We will return and discuss this separately as there is much interest for Norway.
Its EO program is also highly focused on service and application development andhas similar approaches tot hat of the service development program in Norway.
There is some uncertainty about the future financing at the moment, but reportsindicate that the EO program is seeing an 30 percent increase driven by the RCMdevelopment.
Figure 1.71: Public development programs Canada by segment (Percent, 2010)
Most public support for exploration and earth observation
49 %Science and exploration
105
PwC Analysis
30 %
14 %
5 %
2 %
Earth observation
Generic technological prorgam
Satellite communications
Space awarness

The Canadians find Radarsat a technical success, but concerns about competition,commercialization strategy and level of government risk
The Canadian government had originally proposed to develop the satellite as anESA program but failed to get approval within ESA. Norway supported this asan ESA project at the time and continued discussions with Canada andeventually entered into an agreement with RSI/MDA.
The Canadian government decided to launch the program and entered into apartner ship with MDA for its development. The Canadian governmentfinanced about 450 million CAD of development cost with MDA providing
Section 1.2: External institutional and policy developments
financed about 450 million CAD of development cost with MDA providingabout 150 million CAD. Government got access to all data and MDA would getthe upside from commercial data sales. MDA owns and operates the satellite.
The Canadians also launched an associated research and development programopen to international participants, to develop applications and support science.
Figure 1.72: Illustration of SOAR program participants and focus
Canadian research program with 192 projects launched butno Norwegian principal investigators
PwC
Source: * Evaluation of Major Crown project Government Consulting Service Canada 2009 **MDA3rd quarter financial report 2011; Investor conference call reported in financial press; MDA pressrelease Sept 23, 2011:
106
The Canadians find Radarsat a technical success, but concerns about competition,commercialization strategy and level of government risk
Canadian experience is reported to have been mixed.*
The success relates to technical performance. The technologies were seen asadvanced and competitive against other recent developments.
Concerns have been raised about the delays which resulted in a competitivedisadvantage as other competing commercial systems were launched first.
Concerns were also raised about the financial arrangements in whichgovernment assumed much of the risk and had little upside. MDA on the otherhand assumed all commercial risk but had a lower investment at stake. The newradar sat project in Canada is planned with full government ownership.
An objective of the program was also to help develop the Earth Observationsector, much like the commercial satellite communications sector had beendeveloped. The sector did not expand as foreseen and MDA reduced the marketpotential estimate by 80 percent. The program may still have been profitable forMDA and contributed to enhanced capacity. Current investor relations reportingfrom MDA reveals an expanding geospatial satellite business line, mostly drivenby sales to U.S. Intelligence services. MDA recently won a contract of sales ofRadarsat-2 data to U.S. intelligence. **
Utilization at government agencies was slow to pick up and an estimated 65percent of allotted capacity was used in 2009. Readiness assessments had beendeveloped and barriers to developments identified. Many were dealt with,mostly through information campaigns and development of applications. Costs
106
mostly through information campaigns and development of applications. Costsof data processing was (is) covered centrally over the Canadian Space Agencybudget.
The most important international element reported was the failure to secure alaunch agreement with NASA. The satellite was launched at a commercialservice. The Americans noted that the program was too commercial and acompetitive threat to U.S. industry.
The agreement with Norway was the only bilateral agreement. Others havebeen organized as commercial contracts later. An early agreement withOrbimage about international data distribution was absolved as MDA acquiredthe company.

Ongoing policy reorientation to address emerging challenges
GoC has launched an extensive policy process recently. A high level commissionhas been appointed to review the aerospace and space strategies. Canada’saerospace sector is estimated to be the world’s fifth largest. The review is tofocus on the following:
• What are the comparative advantages and vulnerabilities of Canada'saerospace sector?• What opportunities and challenges do changing conditions present?
Section 1.2: External institutional and policy developments
• What opportunities and challenges do changing conditions present?• What can the Canadian aerospace sector do to take advantage of theseopportunities and meet these challenges?• What might Canada learn from strategies used by governments, companies,and researchers in other countries?• What impacts are existing policies and programs having?• What modified or alternative policies and programs might governmentconsider?
A discussion paper has been issued. Of significance for the space sector ithighlights the success of the telecoms sector, but points to challenges andcompetetitive threats in the other segments.
PwC 107
Source: www.aerospacereview.ca; * MDA press release 14 nov, 2008* GoC RfP Solicitation NoticeW7714-115156/A ;CSA Radarsat Constellation mission Components and Specifications (readFebruary 2012);****Flett at Nasa presentation October 2010;PwC Analysis
Ongoing policy reorientation to address emerging challenges
Figure 1.73: Important issues with RCM development
New radar satellite development scheduled for launch in2016
The new radar satellite program (Radar Constellation Mission RCM) isorganized as a government program entirely. GoC will own and operatethe satellites. MDA won the tender as prime contractor.* There has beenthe satellites. MDA won the tender as prime contractor.* There has beenamendments to the contract since then. It is a designed as constellation ofthree satellites in polar orbit. There are discussions reported in the pressabout extending the program to global coverage. Canadians see Germanand Israeli developments as the important competitors.
Of interest for Norway is the decision to carry AIS receivers on board thesatellite thereby reducing the correlation problem of having different AISand radar satellites. An RFP for feasibility studies of AIS and radarintegration was solicited in July 2011.** Spanish Hisdesat is expected tolaunch its radar satellites with AIS capabilities in 2012.
Also of interest is that the design concept plans development of a newground segment structure in Canada, and use “foreign” facilities atSvalbard as backup.*** Government has developed an internationalengagement strategy to “Clarify fundamental questions concerning theextra capacity management, constraints, governance and priorities “. ****Government of Canada will own the new constellation in contrast withRadarsat-2 where MDA is the owner and operator.
107
Radarsat-2 where MDA is the owner and operator.

Swedish space program with strong industrial focus and integrated scientific program
Contextual differencesThere are differences in priorities and organization of the space programs inSweden and Norway. Important contextual differences may explain this:
• The economic structure of Sweden is different with a broader industrial baseand less driven by oil & maritime sectors as in Norway. A relevant implication is
Section 1.2: External institutional and policy developments
and less driven by oil & maritime sectors as in Norway. A relevant implication isthe capabilities within Aerospace (Volvo Aero and Ruag (SAAB))
• The arctic interest is also different with no territorial interests beyond NorthernSweden.
• There is also a different historical path with more emphasis on science andnational (science) programs including development and launching of scientificsatellites.
Differences in objectives and focusThe objective of the space programs are also set differently. There is not the allencompassing objective as is defined for Norway. Rather there is a set of definedactivities defined for the space agency. The space agency is mandated to allocategovernment resources to science, space technological development, and remotesensing activities. Practical implications are:
• A dedicated science program (up until 2011 ESA science program was alsobudgeted for within the larger science program)
• Industrial program more explicitly focused on upstream segment (although• Industrial program more explicitly focused on upstream segment (althoughthere are a number of smaller downstream firms also being supported)
• Less extension into public service development programs as seen in Norway.
There is no space policy as such in Sweden although it has recently been called forby the space agency.
108
Source: SFS 2007:1115; Annual report and budget proposals 2010-2011 Rymdstyrelsen; Technopolic 2010;
Swedish space program with strong industrial focus and integrated scientific program
OrganizationThere is a space agency (Rymdstyrelsen) with 14 staff in 2010 compared to about30 in the Norwegian counterpart. The agency is organized under the auspices ofthe Ministry of Education.
In terms of financing however, 75 percent stems from the Ministry of Trade andIn terms of financing however, 75 percent stems from the Ministry of Trade andIndustry. MoE finances the science programs, including contributions to ESAscience programs. The latter is a function of ESA mandatory financialcontribution.
Of relevance is also the Swedish Space Corporation (SSC). This is a fully ownedstate corporation. Ownership is managed under the Ministry of Finance as otherstate owned enterprises. It has a 10 percent profit target by government. It hascurrently four business lines. The two largest are : (i) Satellite managementservices is comparable to KSAT and constitutes about 30 percent of revenue.; and(ii) Science Services is about Esrange and comparable to Andøya Rocket Range.This constitutes about 15 percent of revenue. It also operates Aerospace services(testing at Esrange) and Aerospace systems (surveillance systems including for oilspill detection and fisheries management). It has large holding in varioustechnology and services companies contributing about 35 percent of revenue.
SSC sold its space division in 2011 to German OHB. One of Europe’s top threesatellite manufacturers. The space division had mostly sales to ESA but was also
108
2011 Rymdstyrelsen; Technopolic 2010; PwC Analysis
satellite manufacturers. The space division had mostly sales to ESA but was alsothe main instrument for the earlier national satellite development programs. Theannual report states loss of competitiveness against integrated manufacturers inEurope. Press reports also claims this was related to policy choice of limitedwillingness to continue to support national satellite projects, and focusing mostindustrial resources on the Ariane-5 development where both Volvo Aero andRuag Saab has much interest.

Swedish ESA participation focused on Ariane
ESA and national programsESA contributions constitute 75 percent of total in 2011. This is up from about 65percent in earlier years. The space programs also include a dedicated sciencecomponent which in Norway is budgeted for elsewhere. The science program is intotal about 11 percent and this includes money for Esrange (EASP program as inNorway). The national program vs ESA ratio is closer to 17 percent similar towhat has been seen in Norway in recent years. (adjusting for differences inaccounting for the science programs)
Its ESA optional contributions are more concentrated than for Norway. 35
Section 1.2: External institutional and policy developments
14 %
11 %
Its ESA optional contributions are more concentrated than for Norway. 35percent are for telecoms (about 25 percent in Norway 2010) and 30 percent forAriane. The latter was decided at cabinet level reflecting a decision to supportVolvo Aero and Ruag Saab. There is also an 18 percent share for earth observationat about similar levels as for Norway.
Its national programs have different focus and organization than in Norway.The approach is programmatic. Fewer participants, larger contracts. High degreeof transparency in terms of areas of focus and awards. Sweden has also developeda industry-research program with a longer term R&D approach.
Figure 1.74: Distribution of expenditure Swedish Space Program (2011)
75 percent for ESA and dedicated science program
47 %
17 %
12 %
ESA ESA Ariane ESA Science National andInternational
Space science
109
Source: SFS 2007:1115; Annual report and budget proposals 2010-2011 Rymdstyrelsen; Technopolic 2010;
There is also a smaller earth observation program. This has not the sameoperational focus as the public service development program in Norway althoughthere is some overlap.
There is an important difference with regards to organization of scientificsupport. This is coordinated in full by the space agency and includes nationalprograms (100 mill) and ESA scientific (110 mill). All amounts in SEK.
Industry has seen real decline from 2004 as in Norway. There is an increase in2009. To the extent that the data are comparable, overall turnover is about a third
1,6
2
2009. To the extent that the data are comparable, overall turnover is about a thirdof that in Norway.
Industry turnover represent 0,06 percent of GDP in 2009 compared to about0,2+ percent in Norway and Canada.
Figure 1.75: Space industry turnover Sweden 2004-2009 (Upstreamsegment)
Turnover shows little growth, but jump in 2009
0
0,4
0,8
1,2
2004 2005 2006 2007 2008 2009
Billio
nS
EK
(no
min
al)
109
2011 Rymdstyrelsen; Technopolic 2010; PwC Analysis
0,06%of GDP

Switzerland: High cost, high sophistication but no national program
ContextSwitzerland is particularly relevant as is a non-EU state but is an ESA memberstate.
Swiss exporters are also faced with a difficult macro environment as the SwissFranc is one of the world’s most highly valued currencies and has appreciatedmuch against both the Euro and the dollar. Much more than NOK.(see slide 52).On other parameters, Switzerland is quite different from Norway.
Section 1.2: External institutional and policy developments
• Its industry is mostly about manufacturing of space related components. Thereare few service providers like seen in Canada and Norway. As much as 118companies have been involved with ESA during 2000-2002. About threefold ofin Norway.
• There is only a very limited national program. 97 percent of public resources arefor ESA.
Figure 1.76: Expenditures planned 2011 (2011)
3 percent for national programs
ESA
National
110
Source: Evaluation of Switzerland activities in space 2011; Eurospace manufacturing data 2011; Revision der schweizerischen Weltraump
3 %
Switzerland: High cost, high sophistication but no national program
While industry is mostly manufacturing, it is noted that an SME segment ofservice and application based companies are seeing a considerable upswing.Statistics are not available.
Perceived challenges led to policy revisionSwitzerland commenced upon a review of its space policies in 2006 in light ofperceived challenges. The policy was delivered in fall of 2008. The policy wasframed in the following context:
600
800
Fu
lltie
mE
cq
uiv
ale
nts
• The space sector is experiencing a transformation process• Emerging countries entering the scene• Declining U.S. budget and flat European budgets• EU entering the scene with challenges for competition policy• Increasing national programs• Industry consolidation and emerging new smaller fast moving players
Figure 1.77: Space manufacturing employment Norway and Switzerland
Robust manufacturing sector showing growth inemployment
-
200
400
2000 2005 2010
Fu
lltie
mE
cq
uiv
ale
nts
Switzerland
Norway
110
Evaluation of Switzerland activities in space 2011; Eurospace manufacturing data 2011; Revision der schweizerischen Weltraumpolitik 2008; PwC Analysis

Switzerland: Policy revision to address EU and ESA challenges
Important elements of Swiss strategy
• The strategy needs to be changed systematically. Ensure Swiss access to andparticipation in EU components of the EU/ESA programs, and define anappropriate legal and financially secure framework or engagement with theEU.
Section 1.2: External institutional and policy developments
EU.
• Given the declining relative importance of Switzerland within ESA and non-membership in the EU, alternative means are required. Activities can bebilateral as well as multilateral forms of cooperation.
111
Source: Revision der schweizerischen Weltraumpolitik 2008; PwC Analysis
Switzerland: Policy revision to address EU and ESA challenges
Specific proposals include:
Consolidation of existing tools:- Commitment to development of ESA- Targeted participation in ESA using existing instruments- Participate in relevant international organization (EUMETSAT,- Participate in relevant international organization (EUMETSAT,
EUTELSAT, IMSO and ITSO)- Foster international cooperation for peaceful purposes as part of
UNCOPUOS.- Support international organizations use of information gathered from
space and in communications
New needs:- Examine opening bilateral and multilateral cooperation within and
outside of Europe- Defend Swiss interest in terms of access and sub-participation in the
preparatory and operational phases of EU programs- Ensure systematic identification and coordination of user needs
111

Section 1.3
Implementation of thespace programs in Norwayspace programs in Norway
The objective of this analysis is to review how theprograms have been implemented. What has been theactivities? Where has the monies been spent and towhat effect?
We focus on three areas:
I. ESA Activities. How has Norway engaged withESA? What has been the priorities? What are thedevelopments over time? What segments of thevalue chain are engaged? We also reviewrelationships between ESA contracts and Spacerelationships between ESA contracts and SpaceCenter support funds.
II. National programs. These have hadcomplementary and supporting functions to theESA engagements. We review the support forindustry, and the programs to enhance publicutilization of space capabilities. This includes areview of the Radarsat program.
III. Governance. We review the relationshipsbetween the Ministry and the Space Center andhow the programs are managed. How is thestrategy devised, planned and executed? Howeffectively is it monitored? What risks may exists?

Real growth in public expenditure and most of it for Space Center managed programs
First, a birds eye perspective on total public sector spending on space relatedmatters. Most of the financing is related to the activities managed by the spacecenter which constitutes nearly 60 percent of total. We shall see later that thishas increased over the last five years. We also find that other spending, inparticular on R&D is quite significant and at 30 percent of total. There are severalsources for this, including basic financing for Universities, Research Councils,and EU FP7 . Of other institutional financing it is mostly the Met institute andMapping authority that matters.
Section 1.3: Implementation of space programs
Figure 1.80: Distribution of public expenditure 2009
Sixty percent of public funds for Space Center Managed programs
Total: 790 mill
Space direct
ESA
NRS funds
NRS Admin
Bilateral
R&D
University
59 %
46 %
5 %
5 %
3 %
29 %
13 %
PwC
Source: NRS LTP 2006-2010; Numbers for ESA differ from those used elsewhere in this analysis as these e numbers are appropriatio
113
University
R&D Institutes
Research Council
EU FP7
Defence Research
Institutional
Met Inst.
Mapping authorithy
Ministries/Agencies
13 %
7 %
3 %
3 %
3 %
12 %
5 %
4 %
3 %50% 20%80%
Real growth in public expenditure and most of it for Space Center managed programs
There has been real growth, above inflation, in public expenditure over the lastfive years. Much of this growth is seen within the Space Center managedprograms.
Next we turn to the ESA activities.
Following this we will review the important national programs.
Real top line growth in public budgets
450
600
750
900
MIl
lio
nN
OK
(Cu
rren
t) CAGR10%
Figure 1.81: Growth of public expenditure 2005-2009 (nominal)
2010; Numbers for ESA differ from those used elsewhere in this analysis as these e numbers are appropriations and not the contract volume which firms receive. Excludes Defense sector.
113
-
150
300
450
2005 2006 2007 2008 2009
MIl
lio
nN
OK
(Cu
rren
t)

Norway participates in other space related international fora and agencies
The focus of this study is on the ESA engagement, related activities and on public sector users needs. There are however a nufora in which Norway participates. We present here a short overview of three important agencies. There are intersections betwEUMETSAT.
EUMETSATEuropean Organization for theExploitation of Meteorological Satellites
COSPAS-SARSATInternational search and rescue signalsystem.
Section 1.3: Implementation of space programs
Exploitation of Meteorological Satellites
The main purpose of EUMETSAT is to deliverweather and climate-related satellite data, imagesand products. This information is supplied to theNational Meteorological agencies of the memberstates, as well as other users including commercialusers world-wide. EUMETSAT is constituted as aninternational organization and was founded in 1986.Norway was a founding member.
Satellite earth observation has transformedmeteorology. Satellites are now the most importantinformation source upon which forecast models arebuilt.
EUMETSAT has similar membership construction toESA. Contributions are determined on a GDP basis.
system.
The purpose of COSPAS-SARSAT is to enable aglobal distress alert and location data system helpsearch and rescue authorities locate people indistress. Participant nations implement and developa satellite system capable of detecting signals fromradio beacons anywhere on the globe.The organization does not operate the system itselfbut establishes standards for interoperability andprocesses. Member states contribute with satellitecapabilities and transfer signals to relevant Searchand Rescue services. The EU Galileo satellites areexpected to carry search and rescue receivers.
Founded in 1979 originally by Canada, France, theU.S. and USSR – a novel cold war cooperation at thetime. Norway is a contributing state and the practicalimplication is that it manages a ground segment at
PwC
Source: Organizational websites; EUMETSAT 25 years anniversary study; COSPAS-SARSAT system data December 2011; PwC analysis
114
ESA. Contributions are determined on a GDP basis.
There is a very close operational relationship withESA. The principle is that development work,including delivery of the first satellite in a series, isdone by ESA.
As such there is much involvement with ESA also forthe met institute in Norway. The space centersupports this. The met institute participates invarious development programs of new satellites toinfluence developments and learn.
implication is that it manages a ground segment atthe search- and rescue facility in Bodø.
The system contributed to the rescue of 2300persons in 2010 and a total of 33000 persons overthe lifetime of the system.
There is a commercial link as rescue beacons thatcomply with standards are developed by commercialmanufacturers. Total population of beacons isestimated to about 1 million. A manufacturer inNorway produces a share of this.
Norway participates in other space related international fora and agencies
The focus of this study is on the ESA engagement, related activities and on public sector users needs. There are however a number of related international agencies andfora in which Norway participates. We present here a short overview of three important agencies. There are intersections between these and ESA, in particular for
International search and rescue signalITUInternational Telecommunications Union
ITU is constituted as a specialized U.N. agency.SARSAT is to enable a
global distress alert and location data system helpsearch and rescue authorities locate people indistress. Participant nations implement and developa satellite system capable of detecting signals fromradio beacons anywhere on the globe.The organization does not operate the system itselfbut establishes standards for interoperability andprocesses. Member states contribute with satellitecapabilities and transfer signals to relevant Searchand Rescue services. The EU Galileo satellites areexpected to carry search and rescue receivers.
Founded in 1979 originally by Canada, France, thea novel cold war cooperation at the
time. Norway is a contributing state and the practicalimplication is that it manages a ground segment at
ITU is constituted as a specialized U.N. agency.Members are 193 countries and 700 private sectororganizations (business and civil society).
Its relevance for space activities are about twofundamental issues:
• Coordination and allocation of radio frequencies.There are regulations and processes adopted forthe purpose. Frequencies is a scares good andallocation needs to be managed.
• Coordinates orbital slots for satellites. A process isestablished with various filing requirements.
A satellite projects success is entirely contingentupon getting access to usable radio spectrum and an
SARSAT system data December 2011; PwC analysis
114
implication is that it manages a ground segment atand rescue facility in Bodø.
The system contributed to the rescue of 2300persons in 2010 and a total of 33000 persons overthe lifetime of the system.
There is a commercial link as rescue beacons thatcomply with standards are developed by commercialmanufacturers. Total population of beacons isestimated to about 1 million. A manufacturer inNorway produces a share of this.
upon getting access to usable radio spectrum and anorbital slot. Slots for the geostationary orbits arehighly contested. These are particularly valuable anda scarce good.

ESAactivities

ESA participationremains the primary
Norway joined ESA in 1987 having had an associated membership some years before that. Today itremains the primary instrument to support and develop Norwegian space capabilities
The core rationale for participation is related to access to pooled capabilities and development programsbeyond what Norway could accomplish on its own. The ability to get access to “costthat meets demand and requirements for public agencies is emphasized in addition to access to scientificprograms and instruments for researchers. Another rationale is that Norwegian industry gets access totechnology development programs and qualified ESA assistance, and opportunities to deliver into ESAdevelopment programs of satellites and other systems. Large segments of the space industry value chainis captive to government programs, and in absence of ESA access, Norwegian industry would not haveaccess to important markets.
Section 1.3: Implementation of space programs
remains the primaryinstrument Important decision points arise every three
conferences at which longer term priorities and budgets are agreed. Annual budget proposals aresubmitted to Parliament accordingly.
Important ESA mechanisms for Norway include:
I. Mandatory programs.membership. The fee is determined on a GDP basis. Activities supported include general budgetitems and operations of ESA, as well as participation in the scientific program. This also entailsaccess to various committees, scientific development programs, and access for industry tocompete for deliveries under those programs.
II. Optional programs.member states but financial contributions are Optional.
III. Juste Retour. An important mechanisms whereby the volume of industrial contracts is
PwC
III. Juste Retour. An important mechanisms whereby the volume of industrial contracts ismandated as a function of a country’s financial contribution. The target is a longerratio of 1 adjusted for various overheads. The target indicator is measured at the aggregate level,but based upon individual program contracts and contributions. The ratio excludes ESAoverhead costs which are assumed identical for all countries. ESA is not a member of the EU orWTO and general principles for procurement and competition does not apply. The Juste Retoursystem has evolved over decades with several specificities.
Next we turn to a review of Norwegian activities. In section 1.4 we will return to assess the impacts.
116
Norway joined ESA in 1987 having had an associated membership some years before that. Today itremains the primary instrument to support and develop Norwegian space capabilities
The core rationale for participation is related to access to pooled capabilities and development programsbeyond what Norway could accomplish on its own. The ability to get access to “cost-efficient” systemsthat meets demand and requirements for public agencies is emphasized in addition to access to scientificprograms and instruments for researchers. Another rationale is that Norwegian industry gets access totechnology development programs and qualified ESA assistance, and opportunities to deliver into ESAdevelopment programs of satellites and other systems. Large segments of the space industry value chainis captive to government programs, and in absence of ESA access, Norwegian industry would not haveaccess to important markets.
Important decision points arise every three-to-four years in relation with the ESA ministerialconferences at which longer term priorities and budgets are agreed. Annual budget proposals aresubmitted to Parliament accordingly.
Important ESA mechanisms for Norway include:
Mandatory programs. These are activities for which financing is a mandatory function ofmembership. The fee is determined on a GDP basis. Activities supported include general budgetitems and operations of ESA, as well as participation in the scientific program. This also entailsaccess to various committees, scientific development programs, and access for industry tocompete for deliveries under those programs.
Optional programs. These are ESA programs (other than the scientific) decided by themember states but financial contributions are Optional.
. An important mechanisms whereby the volume of industrial contracts is. An important mechanisms whereby the volume of industrial contracts ismandated as a function of a country’s financial contribution. The target is a longer-term returnratio of 1 adjusted for various overheads. The target indicator is measured at the aggregate level,but based upon individual program contracts and contributions. The ratio excludes ESAoverhead costs which are assumed identical for all countries. ESA is not a member of the EU orWTO and general principles for procurement and competition does not apply. The Juste Retoursystem has evolved over decades with several specificities.
Next we turn to a review of Norwegian activities. In section 1.4 we will return to assess the impacts.
116

EU finances 20 percent of ESA budget
First some overall comments regarding ESA budgets.
• Expenditures have generally grown since 2002 albeit with a significantdecline in 2010. Budgets for 2011 are higher but not as high as the 2009record levels.
• Incomes are higher than expenditures as presented in the accounts. Thisresults in a surplus that has accumulated over time and equates to onebillion Euros in 2010. The “reality” and nature of the surplus is a matter ofsome discussion. ESA is in the midst of implementing IPSAS accountingprocedures and it is possible that the new accounting systems may be better
Section 1.3: Implementation of space programs
4
5
procedures and it is possible that the new accounting systems may be bettersuited and offer better financial information and controls than the legacysystems.
Figure 1.82: ESA incomes, expenditure and surplus 2002-2010 (Actual,Euro billion nominal)
Rising ESA expenditure though some drop in 2010
PwC
0
1
2
3
2002 2004 2006 2008 2010
Billio
nE
uro
Surplus
Income
OPEX
Source: ESA audited financial statements 2002-2010; ESA budget information 2011; PwC Analysis
117
• The European Union is now the largest single contributor to ESA at about20 percent of the 2011 budget. The EU is not a member as such, although allmember states except Norway and Switzerland are part of the union. EUfinancing is directed towards Optional programs and there are specificprovisions in the ESA convention governing this relationship requiring i.e.consent of two-thirds of the member states.
• Further four countries contribute in total 80 percent of ESA’s budget. Theremaining 15 countries contribute 20 percent. This includes Canada (non-member ). There are also additional contributions, much smaller, from a
20 %
19 %
18 %
10 %
6,6 %
5,8 %
5,1 %
EU
France
Germany
Italy
UK
Other
Spain
member ). There are also additional contributions, much smaller, from agroup of Central and Eastern European states who are not fully members ofESA.
• Norway is expected to contribute 1,6 percent of total 2011 budget which putsit as number 11 in terms if rank of overall income by actor.
Figure 1.83: Share of ESA income by source (Budget 2011)
4 billion budget for 2011 of which EU is the biggestcontributor
50% 80%
5,1 %
4,1 %
2,4 %
2,1 %
1,6 %
1,5 %
1,3 %
0,8 %
0,5 %
0,5 %
0,4 %
0,4 %
0,4 %
0,3 %
0,3 %
0,2 %
Spain
Belgium
Switzerland
Netherlands
Norway
Sweden
Austria
Denmark
Canada
Finland
Portugal
Ireland
Greece
Luxembourg
Czech
ECSA
117

Considerable increase in Norwegian contributions and gaining share in ESA
Contributions to ESA have increased at an annualized rate of 11 percentbetween 2002 and 2010. In nominal terms this implies more than a doubling.Financing is committed for multiyear funding periods and hence the noticeablejumps in 2007 and 2010. In addition comes contributions to special programssuch as the Galileo with significant financing from 2010.
By 2009-2010 ESA financing constituted about half of the total Norwegianpublic expenditure for space activities. Other financing is increasing faster andthe share of ESA contribution relative to other Norwegian space financing is
Section 1.3: Implementation of space programs
60
75
MIllio
nE
UR
(Cu
rren
t)
the share of ESA contribution relative to other Norwegian space financing isdeclining.
Figure 1.84: ESA expenditures by Norway 2002-2010 (Euro millionnominal)
Rising ESA expenditures of 9,4 percent annually, evenhigher if including Galileo from 2009
PwC
-
15
30
45
2002 2004 2006 2008 2010
MIllio
nE
UR
(Cu
rren
t)
Gallileo
ESA
Source: Norwegian government expenditure data; ESA audited financial statements 2002-2010; PwC Analysis
118
CAGR11%
Contributions have risen faster than for many other ESA states and the share ofthe total financing envelope for ESA is increasing. The contribution wasequivalent to 2,8 percent of actual ESA spending in 2010, and about 1,8 percentof total income. The share has dropped a little in 2011 to an estimated 1,6percent of total income, but this is still higher than long run averages.
The drivers for the increase are both about ESA mandatory financing rules andas a result of Norwegian policy. Contributions for the mandatory budget are
Considerable increase in Norwegian contributions and gaining share in ESA
as a result of Norwegian policy. Contributions for the mandatory budget arerule bound and determined on a GNI basis. This has resulted in increases fora.o Norway over the last years. Other programs are optional and has nomandatory financing but Norway has chosen to increase the share ofcontribution to these.
Figure 1.85: Share of Norwegian contribution by ESA total income; ESA OPEXand other ESA member states contribution, excluding Galileo costs, current2002-2010
Increasing share of ESA OPEX and ESA incomes, andmajor rise in 2010 (some decline in 2011 not shown)
2,5 %
3,0 %
Perc
en
tag
esh
are
2010; PwC Analysis
118
0,0 %
0,5 %
1,0 %
1,5 %
2,0 %
2002 2004 2006 2008 2010
Perc
en
tag
esh
are
ESA total income
ESA OPEX
Income contributionmember states

Most contributions for Optional programs, but less for these than ESA average
About two-thirds of contributions have been for Optional programs. There ispossibly a trend change whereby the share is increasing and the levels ofOptional financing in 2010 reached nearly three-quarters. This seems to besustained also in 2011.
This is still lower than an estimated ESA overall ratio of about 80 percent forOptional program. (measured on the basis of actual program expenditures forthe last decade).
Section 1.3: Implementation of space programs
The Galileo and GMES programs currently under implementation are not partof the numbers below but could possibly be considered Optional programsalthough the mechanisms are slightly different given the involvement of theEU. The total financing package for these two programs is not yet in placeowing to approval delays of the EU financing part.
Figure 1.86: Mandatory and optional program shares for Norway 2002-2010
No clear trend in distribution between mandatory andoptional, but optional increased significantly in 2010
PwC
Source: NRS proprietary data: PwC Analysis
119
62 % 61 % 67 % 66 % 53 % 70 % 69 % 65 % 74 %
2002 2004 2006 2008 2010
Sh
are
of
tota
l
Optional
Mandatory
ESA overall ratio
Norway is below mid-point in terms of ratio between mandatory and Optionalprograms. Some nations, both small and large have considerably higherOptional program weighting. The larger space nations, i.e.. France, Germanyand Italy all have much financing devoted to the Optional programs withFrance recording 89 percent over the last decade. The U.K has only selectiveinvolvements in the Optional programs.
Norway’s share can be understood in the context of an increasing GDP driven
Most contributions for Optional programs, but less for these than ESA average
91 %91 %
89 %85 %
81 %80 %
LuxemburgBelgium
FranceSwitzerland
ItalyESA 18
Norway’s share can be understood in the context of an increasing GDP drivenshare to the mandatory budget, but beyond this a lower degree of overallinvolvement than for many other countries.
Figure 1.87: Mandatory and optional program shares 2000-2011
A longer term estimate puts the Norwegian optional shareat about 67 percent
80 %79 %78 %77 %
74 %72 %
67 %66 %66 %
59 %59 %
53 %50 %
44 %
ESA 18Germany
Czech RepublicSwedenPortugal
SpainNorwayAustria
NetherlandsDenmark
United KingdomFinlandIrelandGreece
119

Up-and-coming ESA player especially in optional programs
Over time we note a number of developments for Norway and other nationswith regards to distribution between mandatory and optional programs. Thedynamics can be understood by comparing growth rates of contributions withlonger term levels.
In the figure below, we have classified all countries by their share ofcontribution to the mandatory and optional programs respectively, andcalculated the growth rates between 2007 and 2010.
Section 1.3: Implementation of space programs
25 %
30 %
2010
(Avrg
.)
Share and growth of program participation(Concept)
Figure 1.88: Share of contribution and growth rates in Mandatory and optional programs
Much andMuch and
The cross indicates the average of those countries, and positions above the linehave higher than average contributions, and to the right of the line have higherthan average growth rates.
DE
UK
15 %
20 %
MANDATORY
PwC
0 %
5 %
10 %
15 %
20 %
25 %
-10 % 0 % 10 % 20 % 30 % 40 %
Co
ntr
ibu
tion
2003-2
010
(Avrg
.)
Growth rate (annualized 07-10)
Source: ESA financial statements 2003-2010; 2007-2010 growth rate is point-to-point CAGR based; PwC Analysis
120
Average
Much andmore
Little andless
Up-and-coming
Much anddeclining
AT
CZDKFI
IT
NL
PL
SECH
0 %
5 %
10 %
15 %
-3,0 % -1,0 %
coming ESA player especially in optional programs
Germany is the largest contributor to the mandatory programs though its shareis declining. So is the UK and Italy. Mandatory contributions from France andSpain have been increasing. France in particular, with its large contributionslifts the average growth statistic. Among the smaller nations we also see somedivergence. Austria, Finland and Switzerland have decreasing shares, and allbelow average to begin with. Sweden and the Netherlands are about at averagegrowth rates. Norway is growing just a little slower than Belgium Ireland andLuxembourg.
: Share of contribution and growth rates in Mandatory and optional programs
Luxembourg.
Optional program contributions shows a similar pattern although France hasbeen reducing its relative share. Some of the new member states record highgrowth rates but from very small levels. Norway records about the same growthrate as the Netherlands and Spain, and lower than Austria, Poland and Greece.Sweden has a decreasing share.
FR
FR
DE
20 %
25 %
30 %
OPTIONAL
point CAGR based; PwC Analysis
120
BE
CZGR
IELU
NL
NO
ES
1,0 % 3,0 %
AT
BE
CACZ
DKEEFI GR
HU
IE
IT
LU
NL
NO
PL PLRO
ES
SE
CH
UK
0 %
5 %
10 %
15 %
20 %
-10 % 0 % 10 % 20 % 30 % 40 %

Participates in most optional programs but recent shifts in priorities
Longer term, telecom has been the most favored optional program. This isactually constitutes of a number of smaller programs most of which aretechnology development programs whereby industry gets 50 percent financingand access to qualifies ESA assurance of their work. Earth observation seesalmost as high share at about 16 percent of total financing. These priorities areinline with longer term Norwegian priorities. This program also attracts manyinstitutional R&D organizations although we do not have data to match theprograms and actors entirely. The general technology program also ranks high,while launchers, space station and navigation follows.
Section 1.3: Implementation of space programs
while launchers, space station and navigation follows.
The linkages between the programs and what actors in Norway thatparticipates are not always obvious. For launchers this is more straight forward,but the other programs sees participation from a range of actors.
Figure 1.89: ESA contributions by program by Norway 2002-2010
Most for telecom and earth observation programs
225 mill EUR
33 %
17 %
Mandatory
Telecommunication
PwC
Source: NRS proprietary data: PwC Analysis
121
16 %
11 %
7 %
7 %
7 %
2 %
0 %
Earth Observation
Technology
Launchers
Space Station
Navigation
Esrange/Andøya
Situational Awareness
Much has happened over time. A shift can be observed from 2007 whereby asignificant share was allotted to the general technology program. This nowencompasses about 25 percent of total. Earth observation has also increasedsignificantly in the last few years.
Telecom has declined in significance as well as launchers. All of this takes placewithin a context or real growth so there is not an observed actual decline inallocations to the latter except possibly for launchers.
Participates in most optional programs but recent shifts in priorities
75 %
100 %
Space situational
Figure 1.90: Share of contributions by optional program 2002-2010
Increase in technology program expenditure, fallingtelecom share
0 %
25 %
50 %
75 %
2002 2004 2006 2008 2010
Space situational
Esrange/Andøya
Navigation
Space Station
Launchers
Technology
Earth Observation
Telecommunication
121

Different than average ESA allocations to programs
The Norwegian expenditure pattern deviates from ESA averages. We zoom inon the last three years to capture recent developments.
Launchers captures about 17 percent of ESA expenditures but only 6 percent ofNorway’s. We also note that the participation in the Technology program, atabout 21 percent of total, far exceeds the ESA average of the last three years.Earth observation remains important for both Norway and ESA while SpaceSituational Awareness sees a higher Norwegian share.
Another perspective emerges when viewing contribution as share of total to the
Section 1.3: Implementation of space programs
Another perspective emerges when viewing contribution as share of total to thesame program. To analyze this we have data for all countries for all programsand those are accumulated for years 2000-2011. As such the technologyprogram share is likely higher currently while Telecom may be lower.
Contributions are generally low for all program families but with a relativehigher contribution to Technology, Telecom and Navigation compared to othercountries.
Figure 1.91: Average share of total ESA expenditures and Norwaycontributions 2008-2010 (ESA financial statements, Norway budgets)
Last three years: Technology, Scientific and EarthObservation most important for Norwegian contribution
17 % Launchers 6 %
PwC
Source: * Mandatory; ESA audited financial statements, Juste Retour statistics ESA; Norwegian budget appropriations; PwC Anal
122
16 %
15 %
13 %
12 %
8 %
3 %
0 %
Earth observation
Human spacef light,Microgravity, Robotic
Navigation
Scientif ic program*
Telecom
Technology
Space awarness
18 %
5 %
8 %
19 %
12 %
21 %
1 %
Its not obvious whether there is any pattern or priority to the Norwegianexpenditures when comparing against all countries for all program families.Overleaf is a presentation of this.
We note that France, Germany and Italy dominates the largest programs. TheUK is quite selective but participates strongly in Telecoms, Earth observationand Navigation.
Of smaller nations of interest we note that Sweden appears quite selective with
Different than average ESA allocations to programs
3,7
2,5
1,9
Space Situational Awareness (SSA)
Technology
Telecommunications
Of smaller nations of interest we note that Sweden appears quite selective withlarger participation in some programs and insignificant contributions in others.
Norway ranks at about the same level for most programs and it is not obviouswhether there is any prioritization. Norway’s relative most significantparticipation is in the smallest (and newest) program Space SituationalAwareness.
Figure 1.92: Share of contribution to program families 2000-2010
Small overall shares for program families
1,9
1,8
1,7
0,7
0,5
0,5
0,3
Telecommunications
Navigation
Earth Observation
Microgravity
Launchers
Human Spacef light
Robotic exploration
Source: * Mandatory; ESA audited financial statements, Juste Retour statistics ESA; Norwegian budget appropriations; PwC Analysis
122

Its mostly French, the launchprogram, and with significantcontributions from Germanyand Italy. Norwegiancontribution at 0,5 percent andrank number nine. Swedish
Figure 1.93: Share of contribution to optional programs by country 2000-2011 (total share of ESA expenditures also shown)
5218144,63,22,52,22,00,50,40,40,2
0,160,040,020,02
-----
1. FR2. DE3. IT4. BE5. ES6. SE7. CH8. NL9. NO10. AT11. UK12. DK13. IE14. PT15. FI
16. GR17. CZ18. CA19. LU20. EE21. HU
50% 80%
Human Spaceflight seesstronger German involvementbut is also mostly for the threelarge nations that finances 80percent. Norwegian contributionat 0,5 percent ranks nine, aboveSweden and five times smaller
Section 1.3: Implementation of space programs
221713
12,78,37,63,72,82,82,51,91,9
1,260,740,630,480,230,160,15
-----
1. FR2. UK3. DE4. IT5. ES6. BE7. CH8. SE9. AT
10. CA11. NL12. NO13. LU14. PT15. IE16. FI
17. DK18. CZ19. GR20. EE21. HU22. PL23. RO24. SI Telecom: 11%
Telecom participation is morewidely distributed. Important formany nations including UK.Norwegian contribution at 1,9percent and ranks number 12.Half of the Swiss and 65 percentof Swedish contribution.
rank number nine. Swedishcontribution five times larger,Swiss four times larger.
-----
20. EE21. HU22. PL23. RO24. SI Launchers: 41%
50% 80%
Sweden and five times smallerthan the Swiss.
Technology program is afavorite among the small nations.Norway at 2,5 percent aboveFrance. Just below Sweden butSwiss contribution is five timeslarger and Belgian contributiontwenty times larger.
PwC 123
271616
14,813,03,52,01,81,21,21,11,1
1,020,370,280,200,070,05
------
1. FR2. UK3. IT4. DE5. ES6. CH7. PT
8. NO9. NL
10. AT11. BE12. CA13. SE14. DK15. FI16. IE
17. GR18. CZ19. LU20. EE21. HU22. PL23. RO24. SI
Navigation: 3%
50% 80%
Navigation participation isdominated by the large four.Norwegian contribution at 1,8percent and ranks number 8,much ahead of Sweden. Swisscontribution at twice theNorwegian level.
Robotic exploration is a smallprogram but dominated by thelarge four. Norwegiancontribution at miniscule 0,3percent and ranks 13. Fifteentimes higher contribution fromSwitzerland.
2011 (total share of ESA expenditures also shown)
3927203,92,82,52,31,10,50,40,40,2
0,090,05
-------
1. DE2. FR3. IT4. BE5. CH6. ES7. NL8. DK9. NO10. SE
11. UK12. CA13. AT14. PT15. CZ16. FI
17. GR18. IE19. LU20. EE
21. HU
50% 80%
232017
12,05,73,93,12,92,62,11,91,7
1,401,190,180,170,130,100,07
--
1. DE2. FR3. UK4. IT5. ES6. CH7. BE8. NL9. SE
10. AT11. CA12. NO13. FI
14. DK15. PT16. LU17. GR18. IE
19. CZ20. EE21. HU
50% 80%
percent. Norwegian contribution
Earth observation is morepopular among many. Sixnations contribute 80 percent.Also one of the few UKpriorities. Norwegian
49118
4,13,02,92,62,62,52,22,01,5
1,471,391,100,900,840,610,590,380,340,240,170,16
1. BE2. CH3. ES4. DE5. AT6. IT7. SE8. NL9. NO10. FR11. UK12. HU13. FI14. IE15. CZ16. RO17. DK18. CA19. PL20. GR21. PT22. EE23. LU24. SI Technology:5%
50% 80%
-----
20. EE21. HU22. PL23. RO24. SI
Human flight:20%
-----
20. EE21. HU22. PL23. RO24. SI Earth Obs.:15%
341614
11,95,74,83,63,22,51,11,00,7
0,380,290,240,19
--------
1. DE2. FR3. IT4. BE5. SE6. CH7. NL8. DK9. ES
10. CA11. AT12. NO13. IE
14. UK15. CZ16. GR17. PT18. FI
19. LU20. EE21. HU22. PL23. RO24. SI Microgravity: 3%
50% 80%
priorities. Norwegiancontribution at 1,7 percent andranks number 12.
favorite among the small nations.Microgravity sees the largenations upfront absent the UK.Swedish contribution at eighttimes the Norwegian. O.7 percentand ranks number 12.
123
322015
10,26,95,23,12,31,51,50,80,6
0,300,300,05
---------
1. IT2. UK3. FR4. DE5. ES6. CH7. BE8. CA9. AT
10. NL11. SE
12. DK13. NO14. PT15. GR16. IE17. CZ18. FI19. LU20. EE
21. HU22. PL23. RO24. SI
Robotic: 1,2%
50% 80%
292218
13,23,83,73,62,41,81,80,70,4
0,18-----------
1. ES2. DE3. FR4. BE5. CH6. NO7. IT8. AT9. GR
10. UK11. LU12. PT13. FI14. IE
15. NL16. SE17. CA18. CZ19. DK20. EE21. HU22. PL23. RO24. SI Space Sit: 0,1%
50% 80%
Space SituationalAwareness appears as a relativeNorwegian priority albeit smallin total. 3,7 percent of totalfinancing and ranks number 6

Allocation decision determined mostly on basis of industrial capabilityThe focus on program families disguises the fact that actual allocations areallotted to sub-programs about 60 each year. For some there is even moregranularity, particular for the technology development programs where specificproject proposals may be proposed by industry and presented to ESA by thespace center.
Interviews suggest that the level of participation is mostly based uponexpectations of industry and institutional R&D capacity to deliver withincertain subcomponents of the programs. This is a puzzle that requires muchand close interaction between the space agency and the actors.
Section 1.3: Implementation of space programs
12 Number of program allocations
Considerations of strategic importance of programs appears less prominent.Official documents do not divulge much about the background or objectives ofthe prioritizations with regards to details in such manner that it is possible tounderstand the determination of the size of allocations.
Figure 1.94: Sub-program allocations for Norway 2002-2010 by value andfrequency
Large number of program allocations with very smallvalues
80%
PwC
0
4
8
5 205 405 605 805 1005 1205
Cu
mu
lativ
eFre
qu
en
cy
Size of allocaton (Euro thousand)
Value of program allocations
Source: NRS proprietary data: PwC Analysis124
50%
20%
Frequency studies reveal that 80 percent of allocations are below 1,2 million Eurosyet they constitute only 35 percent of value. Thus there are a few allocations, 20percent, that comprises 65 percent of value.
We find little patterns when relating the size of each allocation to the share ofcontribution form all countries. The red cross signifies median values of bothallocation values and contribution to the total ESA programs during 2000-2011.This is at subprogram level.
Telecom is all over the place but most individual contributions below the medianallocation reflecting many small sub-programs. For some sub-programs the
Allocation decision determined mostly on basis of industrial capability
10 000
100 000
Earth Observation
allocation reflecting many small sub-programs. For some sub-programs theNorwegian contribution is significant, yet there are small monies involved (lowerright quadrant). Launchers and space flight sees higher individual values yet theshare of total ESA programs are below median. Technology sees higher values andhigher relative importance compared to other countries. Earth observation hashigh allocation value but not significant shares of total program financing.
Figure 1.95: Allocation to optional programs (Vertical) and share of ESA totalwithin that program (Horizontal) (2000-2011 total)
No relationship between size of Norwegian contributionand its share of ESA total program cost
1
10
100
1 000
0,1 1,0 10,0
Eu
roth
ou
san
d
Share of total ESA program contribution
Earth Observation
Launchers
Human Spacef light
Telecommunications
Technology
MEDIAN
Navigation
124

58 percent of contributions come back as contracts and the ratio is falling
Procurement under ESA is as known a tightly managed scheme wherebycountries have expectations about returns of contracts for industry and otherorganizations. We will return to the industrial return scheme in a moment andfirst look at returns in a more pure financial sense.
Over the last nine years we observe that the total accumulated contributions toESA are about twice the level of contracts returned. As such the actual returnover nine years is about 58 percent.
In establishing contract values we have used four different sources that all differto a degree but all estimate the contract levels with a reasonable range seen in the
Section 1.3: Implementation of space programs
to a degree but all estimate the contract levels with a reasonable range seen in thefigure below. The estimates are on the basis of reporting from a subset ofcompanies (ripple survey), detailed space center records, and ESA annual reportsthat details the total contract commitments and share for each country and a finalseries form the space centre. The contracts include development contracts underESA , Galileo and GMES.
Figure 1.96: ESA contributions and contracts by Norway 2002-2010
Contract awards not keeping pace with increase incontribution
50
60
PwC 125
0
10
20
30
40
2002 2004 2006 2008 2010
Eu
rom
illion
Contribution
Contracts
Source: Note re contract values: We have had access to several different sources, none ofwhich are consistent. The calculation here is on the basis of a high-case. Range is shownabove. ESA annual reports 2003-2010; NRS ripple survey and proprietary data: PwCAnalysis
The return percentage seems to be declining. Contracts have not kept pace with theincrease in Norwegian contribution to ESA and growth rates diverge.
There could be several reasons for this: One is of lag time in between contributionsto budget, procurement and distribution of contracts. As such we would expect theratio to even out in years ahead though the growth rates are diverging at anincreasing rate. Another hypothesis is that of lack of absorptive capacity inindustry or lack of competitiveness.
This ratio is lower than what appears when analyzing the industrial return
58 percent of contributions come back as contracts and the ratio is falling
This ratio is lower than what appears when analyzing the industrial returnstatistics. Reasons are that this method will also take account of actual overheadsand issues such as delays or the operating surplus ESA has observed in recentyears.
Figure 1.97: Ratio of contributions and contracts during 2002-2010
Return ratio declines from about two-thirds to one-third
Yearly Cumulative 2002-2010
80%
2002 2004 2006 2008 2010
Contribution
Contracts
125
58%50%
20%

Juste retour on science programsremains under expectations
The industrial return scheme allocates contracts to companies based upon countrycontributions to each program. Each country can expect a return percentage closeto 100% over a defined time interval (decade). Current statistics have beenrecalibrated from 2000 and are expected to run until 2014. These returnpercentages calibrates distribution of contracts among countries. They are usefulfor comparing returns between countries, but they do not constitute the full pictureof financial flows as discussed on the previous page.
There is also an actual financial return coefficient that may be different form the
Section 1.3: Implementation of space programs
There is also an actual financial return coefficient that may be different form theofficial return coefficient. All contracts are not weighted equal in the system. Thisimplies that when calculating the official return coefficient, some contracts areincluded at 100 percent of actual value while others are included with only asmaller percentage of the actual contract value. Most development contracts areweighted 1:1 but certain operational contracts, i.e. providing ground stationservices, are weighted at lower ratios. Thus, we find the unweighted overallfinancial return is close to 100% (excluding overheads) while the weighted return isabout 90 percent per June-2011.
A recurring theme in Norwegian ESA involvement is poorer returns on themandatory science programs. Also during this period the return is about 67percent weighted and at ten points higher in unweighted terms.
Reasons behind this are diverse. Science programs often develop very specializedsatellites, equipment and instruments. Development costs are significant andcommercial payoff less obvious. i.e. there is little reproduction potential. At thesame time this is often where the cutting edge science and technology development
PwC
same time this is often where the cutting edge science and technology developmentmeets and the potentials for technology transfers and new discoveries could besignificant. The fact remains that fewer Norwegian actors deliver into this, and notwell enough to compete with providers from other countries. 80 percent ofcontracts under the mandatory program is delivered by three firms only in Norway.
Industry reports mixed views on the causes of the low return. The scienceprograms are useful entry points for new(er) manufacturers and allows them todevelop a track record. At the same time the commercial viability of producing one-off instrumentation is limited and the risks involved are quite high. R&Dinstitutions are also involved in these programs and may with different objectivesand finds these more unequivocally relevant.
Next we turn to a more detailed view of returns on the optional programs.
126
Figure 1.98: Industrial return by main program categories 2000-2011*(Euro nominal)
Most of it comes back, but losses on the mandatory scienceprograms
67 %Juste retour weigthed
Mandatory
100 %
90 %
Actual
Juste retour weigthed
Overall
Unweigthed
107 %
96 %
Actual
Juste retour weigthed
Optional
77 %Actual
Source: NRS data; PwC Analysis:*Includes certain programs that started in 1997: Ends June 2011126
Unweigthed
Unweigthed

Playing the optional game well and getting strong returns
Many of the optional (sub) program offer guaranteed returns of 100percent. These are technological development programs, general or attached tocertain focus areas such as telecom or launchers. Specific project proposals aresubmitted and Norwegian financing allocated 1:1 less overheads.
Some of the optional programs are non-guaranteed, and contractors competealong the same rules as for the mandatory program.
Norway’s allocation is about 50:50 between the two. Return on the guaranteed
Section 1.3: Implementation of space programs
104 %
100 %
Actual
Juste retour weigthed
Total
100 %Juste retour weigthed
Telecom
Norway’s allocation is about 50:50 between the two. Return on the guaranteedprograms are about 100 percent, in fact a little higher if not adjusted for theweights. Returns on non-guaranteed programs are lower but higher than for themandatory program. Possibly reflecting that these are areas where Norwegiancontractors have relatively better capabilities.
Figure 1.99: Industrial return by key optional program categories 2000-2011* (Euro nominal)
Guaranteed return programs Share of total optional
49%Unweigthed
PwC
100 %
100 %
Actual
Juste retour weigthed
100 %
100 %
Actual
Juste retour weigthed
Technology
109 %
102 %
Actual
Juste retour weigthed
Launchers
Source: NRS data; PwC Analysis: *Includes certain programs that started in 1997: Ends June 2011127
17%
16%
10%
Unweigthed
Unweigthed
Unweigthed
Playing the optional game well and getting strong returns
Industry reports much appreciation of the guaranteed programs fortechnological development. Its about more than the financing (50 percentfinancing requirement) and also about getting access to ESA expertise, qualityassurance and a stamp-of-approval impact. Many of these grants are small andas such there are some concerns about the transaction costs and “bureaucracy”.
Some have also voiced concerns about the integrity of intellectual property andprefers to enter the ESA development contracts when they have secured initialIP’s through other means first. This is possible only a realistic option for the
109 %
84 %
Actual
Juste retour weigthed
Total
99 %Juste retour weigthed
Launchers
2011* (Euro nominal)
Non-guaranteed return programsShare of total optional
51%
IP’s through other means first. This is possible only a realistic option for thelarger companies.
Unweigthed
101 %
99 %
Actual
Juste retour weigthed
107 %
85 %
Actual
Juste retour weigthed
Earth observation
140 %
107 %
Actual
Juste retour weigthed
Human spacefligh
127
9%
26%
10%
Unweigthed
Unweigthed
Unweigthed

Not much potential to increase ratio of Norwegian staffing
Staff are hired by ESA and are not supposed to represent country interest orinfluence on behalf of their member state. ESA recruitment policy gives primaryconsideration to qualifications, knowledge, skills and personal qualities. Policyalso states to give due weight to nationality and gender to ensure fairrepresentation. There is no explicit “quota” system though the constant ratiosbetween nationalities may indicate this in practice.
The ratios between country staff have remained nearly constant for the largercountries over the 2003-2010 period for which we have data. The distribution
Section 1.3: Implementation of space programs
FINLAND
IRELAND
NORWAY
DENMARK
countries over the 2003-2010 period for which we have data. The distributionkey is not entirely correlated to neither GDP, population or contribution beyonda general relationship with size. There are some changes within the group ofsmaller countries (10th percentile). Norway’s share has been marginally reducedfrom about 1,4 percent earlier. Sweden reduced from 2,7 percent to 2 percent,and Switzerland from 1,7 percent to 1,4 percent.
Figure 1.100: ESA staff by nationality A-level 2003-2010 (Not includingnew members states over the period)
ESA is successful at maintaining ratios between country staffover time, but marginal changes are seen
80%
PwC
2003 2004 2005 2006 2007 2008 2009 2010
DENMARK
Canada
SWITZERLAND
AUSTRIA
SWEDEN
NETHERLANDS
BELGIUM
SPAIN
UK
GERMANY
ITALY
FRANCE
Source: ESA Annual reports 2003-2010, PwC analysis
50%
20%
128
Not much potential to increase ratio of Norwegian staffing
The larger countries, especially UK and Span and to a lesser extent Franceshow some increase. Germany show a small reduction.
Staff from new member states have been hired and it seems like some of thisneed to bring new staff within country “quotas” has been accommodated by thesmaller nations including Norway.
Norwegian staff is not necessarily an indicator of influence though informalnetworks and access to insiders generally tend to enhance influence innetworks and access to insiders generally tend to enhance influence ininstitutions. Given these trends, or lack thereof, there does not appear to bemuch potential to increase Norwegian staffing and related influence.
Figure 1.101 Staff distribution by country 2010 (A-level)
Staff numbers correlate much with size
21,9 %
19,4 %
18,8 %
10,3 %
8,9 %
409
363
351
192
166
FRANCE
ITALY
GERMANY
UK
SPAIN 8,9 %
4,4 %
3,3 %
2,0 %
2,0 %
1,4 %
1,5 %
1,1 %
1,2 %
1,0 %
0,8 %
1,1 %
0,9 %
0,2 %
166
83
62
38
37
26
28
21
22
18
15
21
16
3
SPAIN
BELGIUM
NETHERLANDS
SWEDEN
AUSTRIA
SWITZERLAND
CANADA
DENMARK
NORWAY
IRELAND
FINLAND
PORTUGAL
GREECE
CZECH
50
%
80
%
128

There is influence through committee leadership
Leadership positions in committees and statutory bodies can be a differentindication of influence. ESA has a number of standing committees. These includethe program bodies for main optional programs, and “delegate bodies” for i.e.science, industrial policy, administrative and finance and so forth.
Below is a representation of this. Every year a country has had a position iscounted as a person-year over the 2003-2010 period. Most positions are electedfor more than a year.
Of note is that not all membership countries are represented. The bodies
Section 1.3: Implementation of space programs
5
5
5
Sweden
Belgium
Switzerland
France
Germany
Belgium
Figure 1.103: Program boards and delegatebodies (person years 2003
Norway has relatively morerepresentation than manycomparable countries
Of note is that not all membership countries are represented. The bodiesindicated in the charts have representation from 13 nations during the 2003-2010 period.
Chair of Counceil and vice chairs positions since 2003 is marked by leadershippositions of Sweden, Belgium and Switzerland.
Figure 1.102: Counceil and vice-chairs (personyears 2003-2010)
Swedish leadership positions
PwC
4
2
2
0
0
0
0
0
0
0
UK
Germany
Spain
France
Italy
Netherlands
Norway
Denmark
Austria
Finland
Italy
UK
Switzerland
Spain
Netherlands
Norway
Finland
Denmark
Austria
Sweden
Source: ESA Annual reports 2003-2010, PwC analysis
129
50
%
80
%
50
%
The larger number of program board and delegate bodies show leadership fromthe large nations France and Germany. Norway ranks equal to Switzerland,Spain, Netherlands and Finland perhaps indicating some over representationcompared to size or contribution.
The audit committee is here represented by more than the leader. This showsleadership interest from Netherlands and the U.K. Norway ranks high in thisregard albeit with few person years overall. Membership of the audit committeerotates more frequently. The lack of continuity is perhaps surprising given the
There is influence through committee leadership
20
14
8
4
2
2
Netherlands
UK
Italy
Figure 1.103: Program boards and delegatebodies (person years 2003-2010)
Norway has relatively morerepresentation than manycomparable countries
rotates more frequently. The lack of continuity is perhaps surprising given thetransfer to IPSAS accounting and the challenges indicated in the latest auditreports.
Figure 1.104: Audit Committee (person years2003-2010)
Audit a relative priority
8
6
5
5
5
5
5
3
3
2
2
1
1
1
1
0
0
0
0
0
Norway
Sweden
Belgium
Switzerland
Germany
France
Spain
Denmark
Austria
Finland
129
50
%
80
%
50
%
80
%

Most ESA and NRS resources for satellite manufacturing and Institutional R&D
Next we review how the ESA and national funds have been distributed. Weanalyze this by value chain segment of the recipient organization. First we reviewthe overall distribution patterns.
Satellite component and launch manufacturers receive most and more than athird of total. The share has declines some but the amounts have remained aboutthe same. Number of organizations involved have increased over the decade.
Institutional R&D captures about 24 percent of totals. Their share has more
Section 1.3: Implementation of space programs
Figure 1.105: Distribution of all ESA and Space Agency funds by value chain segment (Nominal)
Total value of funds2000-2010
Share of value by year2000-2010Satcom services
Most for financing forSatellite Componentsand Institutional R&D
Increasing share ofInstitutional R&D
Institutional R&D captures about 24 percent of totals. Their share has morethan doubled over the decade. There are many, and an increasing number ofentities involved totaling nearly 20 organizations in 2010.
PwC
Source: NRS ESA data, PwC analysis
24 %
36 %
19 %
20 %1 %
0 %
50 %
100 %
All 2000-2010
0 %
25 %
50 %
75 %
100 %
2000 2005
Earth observation services
Ground equipment
Satellitecomponents/Launchers
Institutional R&D
130
Other services
Most ESA and NRS resources for satellite manufacturing and Institutional R&D
Ground equipment captures about twenty percent. Ground equipmentmonies have remained about constant but the share of total as decreased aseverything else is growing.
Other services also captures about 20 percent. The share of have increased tonear the same levels of components manufacturers. The funding is concentratedto only one or two firms.
Telecom satellite services have received only marginal amounts distributed
Distribution of all ESA and Space Agency funds by value chain segment (Nominal)
Share of value by year Value by year (Million NOKNominal)
40
Number of firms
Increasing share ofValues increase overall,most for R&D andServices
Increasing number oforganizationsparticipate mostly R&D
Telecom satellite services have received only marginal amounts distributedacross one or two firms over the decade.
Next we turn to a more detailed view of the distribution by instruments.
2005 2010
0
50
100
150
200
250
300
350
2000 2005 2010
-
5
10
15
20
25
30
35
40
2000 2005 2010
130

Total financing2000-2010
ESA mandatory programsSatellite components manufacturers capturesmost of this related to the scientific program. Ofthe category “other services” which receivessupport this is mostly for downloading services byKSAT.
The values are highly volatile year-to-year andthere are a limited number of organizations
2 %
32 %
0 %
50 %
75 %
100 %
Most for SatelliteComponents anddownload services
Figure 1.106: Distribution of mandatory, optional andSpace Agency funds by value chain segment (Nominal)
Section 1.3: Implementation of space programs
there are a limited number of organizationsinvolved. No trends are apparent.
ESA Optional programsThese funds are widely distributed across all butthe telecom service segments. Shares are aboutequally distributed across the four mainsegments. Other services and Institutional R&Dhave increased mostly at the expense of groundequipment. Overall values are increasing and thenumber of organizations are about 25 annually.Most of the increase in participation are frominstitutional R&D. Commercial organizationshave not grown much.
10 %
56 %
0 %
25 %
50 %
25 %
32 %
22 %
19 %2 %
0 %
25 %
50 %
75 %
100 %
Widely distributed
PwC 131
National Space Center Support FundsFunds are mostly allocated to institutional R&Dand ground equipment. Priorities have shifted inrecent years, i.e. R&D and EO services growing atthe expense of satellite components and groundequipment.The commercial share has been reduced to about50 percent. Number of entities have growngradually and comprises about twentyorganizations over the last years. Growth inparticipation is fairly widely distributed across thesegments.
0 %
40 %
19 %
30 %
1 %
0 %
25 %
50 %
75 %
100 %
More focused onR&D and groundequipment
Share of value by year Value by year (MillionNOK nominal)
Number of firms
2000 20102005 2000 20102005 2000 20102005
50 %
75 %
100 %
60
90
120
10
15
20
Varying sharesinteryear…
…and interyearvolatility in contractvolume
Few but increasingnumber ororganizations
0 %
25 %
50 %
-
30
60
-
5
10
0 %
25 %
50 %
75 %
100 %
0
50
100
150
200
-
10
20
30
More forinstitutional R&Dand EO services
Overall growthalbeit drop in 2010
Most increase inR&D organizations
131
0 % 0 -
0 %
25 %
50 %
75 %
100 %
0
20
40
60
-
10
20
30
Clear shift inpriorities over time
Steady overallgrowth acrosssegments
Doubling oforganizations overthe decade

Highly concentrated distribution with 4firms receiving 50 percent of funds
As many as 67 organizations have been involved in either of the threeprograms over the last decade.
Distribution is however highly concentrated:
• four firms receiving 50 percent;
Section 1.3: Implementation of space programs
• a further 11 organizations receiving the next 30 percent; and
• 52 organizations share the remaining 20 percent and many of theseamounts are very small lower than 0,1 percent of total.
The ESA system seem in practice favor larger organizations due to relativelyhigh transactions costs and risks. Smaller firms have mostly accessed thetechnology development programs.
By international standards most Norwegian firms are small, but those whodeliver most here belong to larger industrial groups or R&D entities.
Next we turn to a breakdown by instrument.
PwC 132
Figure 1.107: Distribution of all ESA Mandatory and Voluntary programs, and NationalSpace Agency funds by value and recipient organization 2000-2010 (Nominal)
Organization 1Organization 2Organization 3Organization 4Organization 5Organization 6Organization 7Organization 8Organization 9Organization 10Organization 11Organization 12Organization 13Organization 14Organization 15Organization 16
2015
76
54
43,4
3,22,9
2,71,9
1,81,61,51,5
Percen
to
fto
talfinan
cing
20
00
4 organizations 11 organizations 52 org.
Organization 16Organization 17Organization 18Organization 19Organization 20Organization 21Organization 22Organization 23Organization 24Organization 25Organization 26Organization 27Organization 28Organization 29Organization 30Organization 31Organization 32Organization 33Organization 34Organization 35Organization 36Organization 37Organization 38Organization 39Organization 40Organization 41Organization 42Organization 43Organization 44Organization 45
1,51,41,31,21,11,11,11,11,01,00,70,70,60,60,60,530,440,390,380,360,340,300,250,190,180,170,150,140,140,14
50
%
80
%
Percen
to
fto
talfinan
cing
20
00
-20
10
Organization 45Organization 46Organization 47Organization 48Organization 49Organization 50Organization 51Organization 52Organization 53Organization 54Organization 55Organization 56Organization 57Organization 58Organization 59Organization 60Organization 61Organization 62Organization 63Organization 64Organization 65Organization 66Organization 67
0,140,130,110,110,090,090,090,070,060,060,060,060,060,050,050,050,050,050,040,040,040,040,03
Source: NRS data; PwC Analysis132
Distribution of all ESA Mandatory and Voluntary programs, and NationalESA Mand. ESA Vol. NRS

Figure 1.108: Distribution of all ESA Mandatory and Optional programs, and NationalSpace Agency funds by value and recipient organization 2000-2010 (Nominal)
ESA Mandatory programs
These are extraordinarily concentrated with threeorganizations receiving 80 percent of funds. Afurther 24 organizations share the remaining 20percent.
Overall there are 29 organizations with someinvolvement over the last decade.
ESA Optional programs
These engage more organizations, 49 in total overthe decade. There is less concentration with 14organizations receiving 80 percent of funds. Theseorganizations are mostly found in the top ranges ofthe mandatory program as well.
Most organizations receive only small engagementswith 27 organizations having less than one percentshare each over the decade. One percent equates to
Section 1.3: Implementation of space programs
Organization 1Organization 2Organization 3Organization 6Organization 4Organization 7Organization 9Organization 11Organization 8Organization 13Organization 5Organization 14Organization 12Organization 18Organization 16Organization 19Organization 22Organization 21Organization 25Organization 24Organization 27Organization 20Organization 17Organization 23
1811
8
Organization 1Organization 2Organization 5Organization 15Organization 17Organization 3Organization 31Organization 29Organization 10Organization 30Organization 4Organization 12Organization 6Organization 41Organization 40Organization 14Organization 13Organization 21Organization 42Organization 49Organization 46Organization 25Organization 8Organization 50
3232
133,8
3,42,31,71,61,41,11,10,90,80,70,60,60,50,50,40,40,30,30,30,3
3 organizations 24 org. 5 org.
share each over the decade. One percent equates toabout 11 million NOK (1,5 million Euros).
Percen
to
fto
talESAM
and
atory
pro
gramfin
ancin
g2
00
0PwC
Organization 23Organization 26Organization 34Organization 10Organization 32Organization 30Organization 36Organization 37Organization 38Organization 35Organization 15Organization 51Organization 33Organization 52Organization 46Organization 53Organization 55Organization 56Organization 58Organization 59Organization 60Organization 63Organization 40Organization 45Organization 66Organization 69
Organization 50Organization 57Organization 62Organization 19Organization 24Organization 22
0,30,20,20,160,11
50
%
Source: NRS data; PwC Analysis
133
50
%
80
%
Percen
to
fto
talESAM
and
atory
pro
gramfin
ancin
g2
00
0-2
01
0
ESA Mand. ESA Vol. NRS
These engage more organizations, 49 in total overthe decade. There is less concentration with 14organizations receiving 80 percent of funds. Theseorganizations are mostly found in the top ranges ofthe mandatory program as well.
Most organizations receive only small engagementswith 27 organizations having less than one percentshare each over the decade. One percent equates to
National Space Center programs
Have a similar distribution pattern to the Optionalprograms although there are many moreinstitutional R&D entities are active here. 14organizations share 80 percent of which 5 receiveabout 50 percent.
31 organizations share the last 20 percent. Theaverage contribution per entity over the decade forthese is about 2 million NOK (250.000 Euros).
Organization 10Organization 8Organization 3Organization 1Organization 4Organization 2Organization 9Organization 28Organization 23Organization 16Organization 20Organization 12Organization 15Organization 11Organization 33Organization 24Organization 26Organization 29Organization 25Organization 39Organization 5Organization 43Organization 18Organization 44
149
98,6
7,16,5
4,94,1
3,42,7
2,72,6
2,62,22,01,91,61,51,31,21,00,90,90,9
6,96,9
6,64,0
3,93,1
2,72,5
2,52,11,91,81,71,71,61,21,21,21,21,00,8
Percen
to
fto
talNatio
nalSp
aceC
enter
finan
cing
20
00
Percen
to
fto
talESAV
olu
ntary
pro
gramfin
ancin
g2
00
0
9 org. 34 org. 5 org. 9 org. 31 org.
share each over the decade. One percent equates toabout 11 million NOK (1,5 million Euros).
these is about 2 million NOK (250.000 Euros).
Organization 44Organization 31Organization 47Organization 48Organization 6Organization 35Organization 45Organization 19Organization 32Organization 54Organization 13Organization 61Organization 42Organization 64Organization 65Organization 67Organization 22Organization 68Organization 50Organization 17Organization 7
0,90,80,70,720,700,700,600,510,510,400,370,310,300,270,240,200,190,190,170,150,02
0,80,70,60,600,590,570,560,490,420,420,330,140,120,110,110,100,090,090,090,090,080,070,070,070,060,05
50
%
80
%
Percen
to
fto
talNatio
nalSp
aceC
enter
finan
cing
20
00
-20
10
Percen
to
fto
talESAV
olu
ntary
pro
gramfin
ancin
g2
00
0-2
01
0
50
%
80
%
133

Participants emphasize quality experience and valuable engagements albeitcumbersome procedures and concerns about profitability
Participants across the value chain report generally positive experiences. Smallor large firms in different segments report very similar issues.
Positive perceptions relate to:
• The technology development programs in particular (general and their sectoralcounterparts).
- These are seen as particularly helpful in exploring advanced technology
Section 1.3: Implementation of space programs
These are seen as particularly helpful in exploring advanced technologydevelopment under qualified assistance. The assistance and involvement ofESA experts was generally perceived as high value.
- Such programs may lead to getting technologies and products spacequalified by ESA which is perceived necessary for entering the markets.There exist very few alternatives to this, or at least, no examples ofNorwegian firms who have entered space markets without going throughESA. There are however, few firms who have had such deliveries at all, andespecially for other markets than ESA, and little basis to conclude upon.
• Much feedback relates to the importance of ESA as an accessible marketplace,not to whether or not it was a positive or learning experience in itself. It isstrongly perceived that working with ESA is a necessary requirement to gainbroader market access especially for firms who manufacture products that areto enter space.
• Some state that their firms wouldn’t have existed without the ESA program orproducts developed as a result. We will also come back to these impacts in
PwC
Source: NRS ESA data, PwC analysis
section 1.4
• Emphasis is also put on the broader networks and contacts that can be gained.
• Most emphasize the professional expertise at all levels. This also includesadvise and interactions with the space center in Norway. Few have had ESAengagements without deliberations with the space center first. Space centerassistance was also valued at times when there were “difficulties” of proceduralor other nature within ESA.
• Many also emphasize the usefulness of the industrial support funds withregards to qualifying for ESA funds. We will come back to this when we discussimpacts.
Participants emphasize quality experience and valuable engagements albeitcumbersome procedures and concerns about profitability
Concerns relate to:
• Concerns about Norwegian priorities. Both with regards to distribution offunds between large and small actors, and between segments. Some reportthat earlier policies of not supporting smaller firms had now changed. Someperceive the prioritization to be focused on “traditional” firms and less openperceive the prioritization to be focused on “traditional” firms and less opento “newer”. Some claim tat the “one-child” policy from the space center thatentails not supporting competing firms but choosing one has reduced varietyand discouraged firms.
• Some concerns relate to protection of IPR when engaging with ESA asthere is a perception that knowledge and information is distributed morewidely than envisaged. These concerns are mostly voiced by larger actors. It isalso emphasized that national support funds are helpful in that regard as theycan help secure IPR before engaging with ESA.
• Space center perceived as a gatekeeper for entry to ESA. Positive sides ofthis, as it relates to helpfulness and professional advise. Concerns relate to theprioritization issues above.
• Non-specific complaints about bureaucracy and difficult work practices atESA. Small firms in particular reported this as creating difficulties.
• Many claimed the ESA projects themselves had not been profitable and• Many claimed the ESA projects themselves had not been profitable andpossibly represented a loss. There were still perceived wider benefits reportedi.e.. knowledge development and credibility that had positive impacts on thebusiness overall. Only a few reports directly profitable projects with ESA.

National programsNational programs

Number of national programs to strengthen ESA competitiveness, enhance public sectoruse and capabilities
The space center also operates national programs. In total the programs are atabout 20 percent of ESA contributions. The following programs are identifiedidentified:
• National support funds. There are three objectives for these funds:
1. Support Norwegian business and research establishments so that they
Section 1.3: Implementation of space programs
1. Support Norwegian business and research establishments so that theyreach a level of technological readiness to be competitive within ESA sothat Norway can gain from the ESA investments;
2. Contribute to develop space based services to meet national publicneeds in a cost effective manner, including participation indevelopment projects from public agencies; and
3. Support scientific projects which in different ways increases supportfor space based activities from the general population.
• Radarsat: Used for acquisition of data from commercial operator of radarsatellites. Data are distributed across several agencies and researchcommunities;
• AIS satellite development funds: This is to develop an AIS equippedsatellite that was launched in 2010 and preparations for further satellites;
• Infrastructure funds: Used for providing financial support to thefacilities of Kongsberg Satellite Services, Andøya Rocket Range and certain
PwC
facilities of Kongsberg Satellite Services, Andøya Rocket Range and certainGalileo and EGNOSS reference stations to enhance navigational coverage inthe north.
• EASP/Andøya: Support scheme to finance use of the rocket range forscientists. This is organized as multilateral agreement amongst variousEuropean countries with contributions from them as well.
Particularly the service development, Radarsat and AIS work towards theshared objective of enhancing public sector capabilities. The learning anddevelopment funds have also to an extent been used for this purpose.
Source: PwC Analysis
136
Number of national programs to strengthen ESA competitiveness, enhance public sector
The government budget identifies most of these as “national support funds”under which some have earmarked allocations. i.e. the AIS satellite is singled outwith earmarking and so are the infrastructure programs. Radarsat and EASP arebudgeted for in different chapters “International Space Activities”. We aremandated to review the Radarsat agreement but not the EASP.
The following discussion will first present an overview, thereafter discuss the
Figure 1.109: Illustration of important linkages between programs
Several of the national programs are mutually reinforcing
Industrial development
ESA programs
To enhance industrycompetitiveness
Programs Objectives
The following discussion will first present an overview, thereafter discuss themost significant programs.
136
Service development
Radarsat
AIS sat
To enhance publicsector use and
capabilities

National program financing increasing faster than ESA contributions
Financing for national space programs have increased significantly and nearlytripled in monetary terms since 2005
These have increased more than the ESA contribution and more than doubledas share of these.
The financing is recorded under various budget lines, some as “international”i.e.. Radarsat, while others are mapped as National Support Funds (Post 72) orsub-categories thereof. The distribution can be seen to the right.
The data pre-2005 are incomplete and there are gaps in the reporting. Also
Section 1.3: Implementation of space programs
The data pre-2005 are incomplete and there are gaps in the reporting. Alsoafter 2005 when comparing against official government accounts(Statsregnskapet post 72), there are a number of gaps between the details forthe programs reported in annual reports by the space center and the officialaccounts of government that we cannot determine. The figures here should beread with some caution
Figure 1.110: National programs including financing for radar data,Andøya, KSAT Troll station, AIS
Considerable increase of financing for various nationalprograms, also compared to ESA contributions
15 %
20 %
75
100
Sh
are
of
ES
Aco
ntr.
Mil
lio
nN
OK
no
min
al
Share of ESA contribution All national programs
PwC
Source: Governments budget documents 2000-2010; NRS annual reports 2000-2010;; PwC Analysis
137
0 %
5 %
10 %
15 %
-
25
50
75
2000 2005 2010
Sh
are
of
ES
Aco
ntr.
Mil
lio
nN
OK
no
min
al
The increase has mostly been for special programs or initiatives. Prominentamong these are the Radarsat agreement with MacDonald, Dettwiler andAssociates Ltd. (MDA), The AIS Satellite program and infrastructuredevelopments such as for maintenance at Andøya Rocket range, and supportfor the Kongsberg Satellite Services Station in Antarctica.
The more long running support schemes aimed at industry and earthobservation service development have seen some increase in absolute terms.The numbers fluctuate quite much and it is hard to see a clear trend.
National program financing increasing faster than ESA contributions
The industry and service development programs has decreased in significancecompared to other special programs.
Figure 1.111: Share of national program expenditures
Industrial development program less significant, morefocus on other activities
75 %
100 %
EASP/Andøya
Radarsat
AIS
137
0 %
25 %
50 %
2000 2005 2010
AIS
Infrastructure
R&D dev.
Service dev.
Industry

National support funds dedicated tosupport technology- and servicedevelopment, and popular science
First we turn to what is commonly referred to as the “national support funds”(Følgemidler)
This is the core of the national support fund usage. The programs have beenlong running, broadly corresponding to three objectives as stipulated in the
Section 1.3: Implementation of space programs
long running, broadly corresponding to three objectives as stipulated in theofficial government budgets:
1. Support Norwegian business and research establishments so that theyreach a level of technological readiness to be competitive within ESA sothat Norway can gain from the ESA investments;
2. Contribute to develop space based services to meet national public needs ina cost effective manner, including participation in development projectsfrom public agencies; and
3. Support scientific projects which in different ways increases support forspace based activities from the general population.
In the following we will present the important facets of the programs.
We will discuss each of the three programs. The industrial program is moresignificant in terms of financing. It is however very closely linked to ESA and assuch we have presented much detailed information and analysis under the“ESA activities” section above.
PwC
“ESA activities” section above.
The schemes may involve state-aid. Hence they were notified by the EuropeanSurveillance Authority in February 2008. This implies restrictions of whatactivities can be supported and with what level of financing, i.e. scale from 25-100 percent depending upon type of activity. Most fall within the 50 percentsupport category. The state-aid rules are mostly relevant for the industrialscheme where most private sector activities fall. There are also private sectoractivities under the service development program but much smaller in level andfrequency.
138
Source: NRS dataFigure 1.112: Expenditures on national programs(Industry, service and science) (Nominal)
5
10
15
20
25
Million NOK
Industrial developmentprogram
Aimed at supporting technologydevelopment for Norwegianfirms to engage with ESA.
Largest. Slight increase during2004-2009, significant rise in2010.
2000 20102005
Flat until2010
-
-
5
10
15
20
25
2010.
Service development
Aimed at supportingdevelopment of efficient servicesin public sector.
Half of industry funds. Increasedduring 2000-2005, mostly flatsince.
Popular science
2010
Flat
-
5
10
15
20
25
138
Popular science
Aimed at supporting popularscience to enhance publicsupport for space activities.
A quarter of industry funds.Much growth from 2005 butfrom very low levels.
Real growth

Industrial fund scheme to support pre-ESA technological development is the largest
Concept
The purpose of the overall national support scheme is to help financedevelopment projects for future deliveries to the space segment, user equipmentor utilization of data from satellites. The industrial scheme is very closely linkedto that of ESA is that Norwegian companies may need assistance from adedicated program before engaging with ESA or space markets.
This is based upon two considerations:
-Industrial base for space manufacturing in Norway is and has historically been
Section 1.3: Implementation of space programs
-Industrial base for space manufacturing in Norway is and has historically beenquite small and may develop if supported through a dedicated scheme; and
-The larger space nations have industrial scale national programs under whichmuch technology development is supported. If Norwegian enterprises is to standa chance in the competition, they need to be supported.
Figure 1.114: Industrial program as share of ESA Contribution and ESAcontracts (2002-2010)
Possibly declining as share of ESA contribution
15 %
Share ESA Contribution Share ESA Contracts
PwC
Source: NRS interviews and prop reporting; ESA contract is midpoint annual estimate from three sources, see page 125; PwC Ana
139
0 %
5 %
10 %
2000 2005 2010
Perc
en
tag
esh
are
ESA technological development is the largest
Activities
The scheme focuses primarily on technologies as in hardware, Its addressingprimarily space manufacturers and ground equipment producers asdiscussed earlier in this report. Certain services, i.e.. software and applicationsmay have been supported.
A range of areas are indicated: Industrial positioning for manufacturing ofsatellites, deliveries to future navigational satellites; commercialcommunications satellites; earth observation satellites; groundcommunications satellites; earth observation satellites; groundstations/terminals or technology development for the international space station(ISS).
Its an application based scheme but the space agency has authority to initiateprojects at its own will. Certain issues are given priority when deciding anallocation:
Companies must demonstrate:
•“Real” capacity to develop technologies for space activities ;and
•Technological spin-off potential within the space segment or in other markets;
•Organizations that are engaged with ESA technology development programsmay seek support for complementary activities.
There has only been structured reporting of activities for the last two years(2009-2010). That followed a redesign of the fund governance after the EU/EEAstate-aid notification in 2008. The reporting is also quite limited and gives littleability to analyze trends and developments.
Source: NRS interviews and prop reporting; ESA contract is midpoint annual estimate from three sources, see page 125; PwC Analysis
139
ability to analyze trends and developments.
As such, most of the analysis of national funds need to be done without linkinguse of funds directly to the programs (industrial, service). This is analyzed in thesection above.

Users stronglyemphasize linkages
Emphasizing the linkages with ESA programs is a recurring theme from participants. Space centersupport allows them to refine concepts and possibly secure IPR, before engaging with the larger ESAsystem. This applies even for the technology development programs of ESA that also has certain SMEand early stage development objectives.
The support is used by small and large organizations with most funds going to the recurring actors i.e..industrials who engage regularly with ESA.
Some participants argue their firms would not have existed without the initial support from the spacecenter funds.
Participants also emphasize the helpfulness and expertise at the space center allowing them to refine
Section 1.3: Implementation of space programs
emphasize linkageswith ESA programs
Participants also emphasize the helpfulness and expertise at the space center allowing them to refinestrategies for engaging with ESA.
A deeper quantitative analysisqualitative analysis in the section on impacts below.
Next we turn to the service program.
PwC 140
Emphasizing the linkages with ESA programs is a recurring theme from participants. Space centersupport allows them to refine concepts and possibly secure IPR, before engaging with the larger ESAsystem. This applies even for the technology development programs of ESA that also has certain SMEand early stage development objectives.
The support is used by small and large organizations with most funds going to the recurring actors i.e..industrials who engage regularly with ESA.
Some participants argue their firms would not have existed without the initial support from the space
Participants also emphasize the helpfulness and expertise at the space center allowing them to refineParticipants also emphasize the helpfulness and expertise at the space center allowing them to refinestrategies for engaging with ESA.
analysis is found in the chapter on ESA activities (above), and quantitative andqualitative analysis in the section on impacts below.
Next we turn to the service program.
140
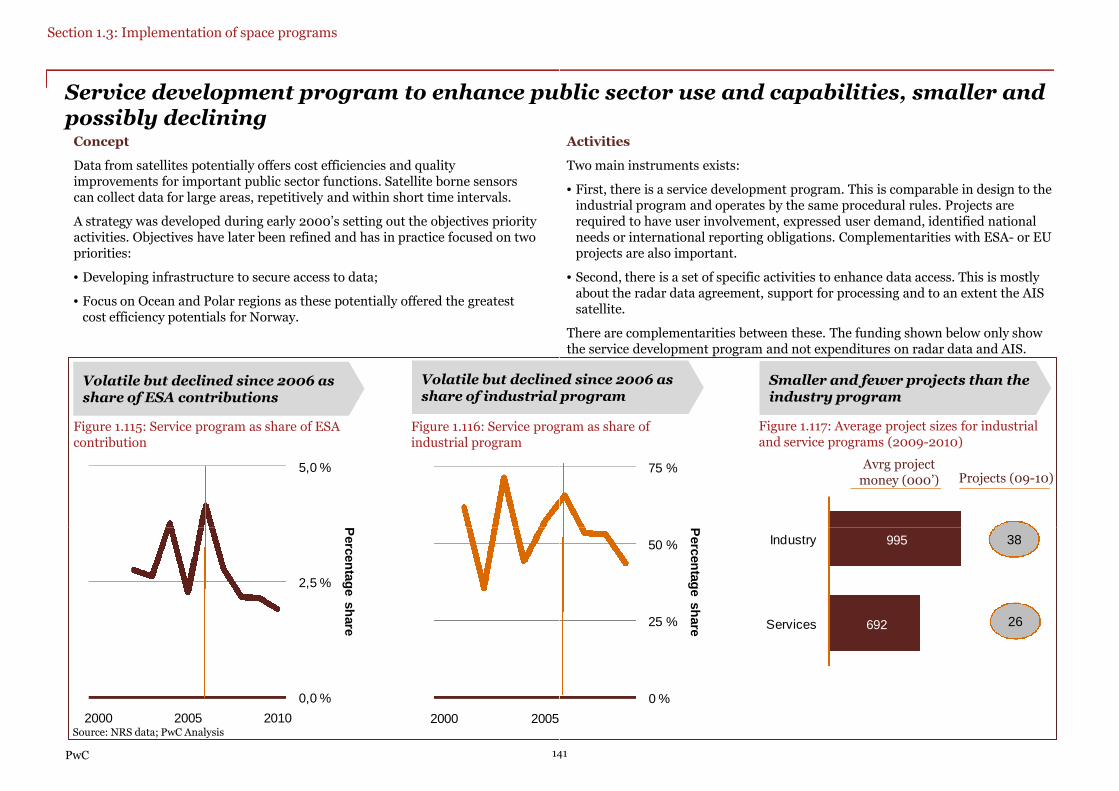
Service development program to enhance public sector use and capabilities, smaller andpossibly declining
Concept
Data from satellites potentially offers cost efficiencies and qualityimprovements for important public sector functions. Satellite borne sensorscan collect data for large areas, repetitively and within short time intervals.
A strategy was developed during early 2000’s setting out the objectives priorityactivities. Objectives have later been refined and has in practice focused on twopriorities:
Section 1.3: Implementation of space programs
5,0 %
Perc
en
tag
esh
are
Figure 1.116: Service program as share ofindustrial program
Volatile but declined since 2006 asshare of industrial program
• Developing infrastructure to secure access to data;
• Focus on Ocean and Polar regions as these potentially offered the greatestcost efficiency potentials for Norway.
Figure 1.115: Service program as share of ESAcontribution
Volatile but declined since 2006 asshare of ESA contributions
PwC
0,0 %
2,5 %
2000 2005 2010
Perc
en
tag
esh
are
2000 2005Source: NRS data; PwC Analysis
141
Activities
Two main instruments exists:
• First, there is a service development program. This is comparable in design to theindustrial program and operates by the same procedural rules. Projects arerequired to have user involvement, expressed user demand, identified nationalneeds or international reporting obligations. Complementarities with ESA- or EUprojects are also important.
Service development program to enhance public sector use and capabilities, smaller and
75 %
Figure 1.116: Service program as share of
Volatile but declined since 2006 asshare of industrial program
• Second, there is a set of specific activities to enhance data access. This is mostlyabout the radar data agreement, support for processing and to an extent the AISsatellite.
There are complementarities between these. The funding shown below only showthe service development program and not expenditures on radar data and AIS.
Figure 1.117: Average project sizes for industrialand service programs (2009-2010)
Smaller and fewer projects than theindustry program
Avrg projectmoney (000’) Projects (09-10)
0 %
25 %
50 %
Perc
en
tag
esh
are
141
995
692
Industry
Services
38
26

Activities range betweenprogrammatic work, toadvisory and coachingfunctions
The tools and purposes are broader compared tothe industry programs and ESA activities. This isalso much about NRS staff time and
Figure 1.118: Illustration of program focus
Data access andapplications
The most instrumental andcostly activities. Includes:• Acquisition of Radarsat-2 data;• Processing support;• Application development; and• coordination of use.
Conceptualized and
Section 1.3: Implementation of space programs
also much about NRS staff time andcompetencies.
First, the most instrumental activities have beenabout ensuring data access and applicationsdevelopment. This is about establishing agovernment wide agreement for access toRadarsat-2; and related work to developapplications and manage the process. Theseactivities uses most NRS funds.
Much of this spending is on institutional R&Dorganizations. Commercial spending is highlyselective and involves mostly KSAT. This isdetailed in section 1.2 above.
Second, there is also, perhaps increasingly,involvement in other government wideprocesses. A flagship program is “Barentswatch”.
Conceptualized andimplemented through programslike SatOcean.
Support for governmentprocesses
Support for government wideprocesses. Main events over thelast years includes processes:• Barentswatch. Supported
concept and strategydevelopment.
• Digitalt Norge. Supported andadvised process of mapping userrequirements.
PwC
processes. A flagship program is “Barentswatch”.Currently led by the coastal authority but beinginstitutionalized in a separate structure. Therehas been much input and assistance from thespace center to this and other processes.
Third, a range of information activities overmany years.
Next we turn to the data access and applicationsprogram in more detail.
We will return in section 2.1 to an analysisof real world impacts.
Source: PwC Analysis
142
Information and advise
Range of activities to sensitize,inform and advise governmentusers.
Advisory and coaching role isimportant and muchappreciated at agencies.
Publications, presentations anddiscussions.
Illustration of program focus
2 data;
advised process of mapping user
142

Flagship program highly focused onproviding maritime operational services
The rationale for the focused effort is related to the effectiveness and cost-efficiencies of satellite systems to monitor the large ocean territories. There arealso valuable economic activities derived from resource use of these areas:Petroleum, Fisheries and maritime transport. The areas cannot be effectivelymonitored by other technologies. Northern location also has some advantages
Section 1.3: Implementation of space programs
monitored by other technologies. Northern location also has some advantagesfor effectiveness of satellite surveillance as earth observation satellites in polarorbits have a relative coverage of the Barents region of 4-5 times more than atthe equator as orbits converge near the poles. The importance of having suchcapabilities is perceived to be increasing as the arctic north is becoming the keystrategic theatre for Norway.
Priorities have been pragmatic. Users from operative agencies have beeninvolved throughout and the purpose has been to solve operational issues andmeet operational requirements.
Activities have been ongoing since mid-eighties supported by the space center.Development projects have involved users, scientists and industry. Activitieswere scaled up upon securing a radar data agreement from MDA/Canada inearly 2000’s. Project funding levels doubled during these years and aconceptual framework was refined: SatOcean.
This was conceptualized as a national program to utilize Earth observation data
PwC
This was conceptualized as a national program to utilize Earth observation datato support national maritime needs. It was an initiative from the space center.The objective was help resolve a long standing problem by establishing acoordinated effort for government institutions to utilize satellite data in a cost-effective way. It was presented as complementary to GMES servicedevelopment in Europe.
Its focus activities have been:
• Securing radar (SAR) utilization. Long-term and routinely supply ofrelevant satellite data at competitive prices for operational use;
• Near Real Time processing and distribution of SAR and AIS data;
• National ground station support to secure national capabilities;
• Application development to serve operational requirements.
143
Figure 1.119: Snapshot of satellites above Norwegian territories a dayin February 2012
Busy above Norwegian waters as ESA satellite Envisatcaptures data enroute north
143

User responsive marine service programhighly operationally advancedThe program was organized with a board of important users and specificdevelopments were defined by these.
Priority services were determined as: (i) Sovereignty and fishery control - shipdetection and AIS; (ii) Environmental monitoring - oil spill (and AIS) and watermasses; (iii) Polar and climate monitoring - sea-ice, ocean circulation; (iv) Fishfarming - algae bloom monitoring; and (v) Operational oceanography - wind, wavesand currents.
Section 1.3: Implementation of space programs
and currents.
Functional priorities included data continuity, access to data (including formatting,near real time processing and service provision); cost effective and good enough asthe standard.
There as been an iterative process whereby demonstration projects have beendeveloped, improved upon methods and processing chains, developed and improvedservices to institutions with monitoring responsibilities; and with adjustments andfurther development work. Multiuse concepts have been encouraged. This impliesreusing data and coordinating acquisitions. An operational implication of this is thatthe Coastal Authority manages the data stream distribution to other agencies. Therehas been less reuse of scenes in practice and we will return to this when discussingthe radar data agreement.
At the user end, radar information is integrated with other sensory information. Thisincludes satellite radar images from other sources, i.e.. oil companies or EMSA; orAIS satellite information for ship identification or the fishing vessel system (VMS).There are 24/7 monitoring and surveillance centers operated using the sensory
PwC
There are 24/7 monitoring and surveillance centers operated using the sensoryinputs from satellites as part of the broader set of surveillance and monitoringarrangements. Coastal Authorities and Coast Guard have various response protocolsdepending upon what is detected.
Programs in Norway are highly advanced compared to developments elsewhere.EMSA operates a similar concept for all of Europe modeled upon the Norwegianmodel. U.S. Coast Guard also explores similar programs. The EMSA system coversEuropean areas including Norway, but capacity is insufficient for full coverage inNorway. There is an allocation protocol which allows Norway access to a share ofradar scenes (300-400). This is often used for near real time high resolutionrequirements for which the Norwegian radar data agreement is insufficient. EMSAoverall acquires no more than about 2000 scenes, same as Norway.
144
Figure 1.120: Illustration of process chain
Space programs instrumental in early process chain anddiminishes as satellite data are integrated into operationalsystems
Radar/AISsatellites
Othersensors
Othersatellite
Space program role
developed, improved upon methods and processing chains, developed and improved
reusing data and coordinating acquisitions. An operational implication of this is thatthe Coastal Authority manages the data stream distribution to other agencies. There
At the user end, radar information is integrated with other sensory information. This
Applications developmentApps.
Operational integration
Operations
Response
arrangements. Coastal Authorities and Coast Guard have various response protocols
144
Response
Two concluding remarks about the role of the space programs:1. The importance is highest at early stages in the process chain, i.e. data
acquisition and applications development. It diminishes as the sensoryinputs are integrated into larger operational systems.
2. Longer term there is a probable scenario whereby data acquisition andinternational cooperation protocols are more mainstreamed and will bemore effectively handled by operational agencies directly. We are notthere yet. The space programs will have a useful and important role indeveloping the next generation of surveillance systems.

Land focused programs are emerging,focused on catastrophic geohazards
Radar interferometry is used to detect surface movements. Radarsat and other earthobservation satellite data has been acquired for these purposes. The main areas forsatellite monitoring on land are (i)glaciers and snow covers (e.g. Norwegian WaterResource and Energy Directorate, Meteorological Institute and The Polar Institute),(ii) forests (e.g. Norwegian Directorate for Nature Management and NorwegianForest and Landscape Institute ) and (iii) areas prone to rock and land slides
Section 1.3: Implementation of space programs
Forest and Landscape Institute ) and (iii) areas prone to rock and land slides(Geological Survey). The by far most frequent user of Radarsat data for mapping andmonitoring of land is the Geological Survey (NGU).
The country is mapped in broad sweeps and high resolution imagery is used foridentified high risk areas. The NGU’s main objective with regards to the Radarsatdata is to do a thorough geological mapping for the purpose of improving safety forpeople and infrastructure. With a satellite dataset they can identify risky areas, inwhich special precautions must be taken with regards to building new or maintainingold infrastructure in order to avoid potentially disastrous rock or mud slides. Certainareas must be monitored, some continuously.
The use of satellite data in the monitoring process is not as institutionalized as it is inthe mapping process. Once risky areas have been identified, a range of ground basedinstruments are put to use to monitor them, weather stations, lasers , seismicmeasuring and small networks of GPS sensors, in addition to some satellitemonitoring.
PwC
monitoring.
This use of a wide range of ground based instruments for monitoring land areas isconsidered to have very high costs. There is a belief that a more steady stream ofsatellite data, accompanied by artificial reflectors on the ground would giveconsiderably better data on movement within rock and land formations, at lower costthen today’s mix of ground based instruments. The prospects of increasing thesatellite share of rock slide monitoring is currently being assessed by the NGU incollaboration with the Space Centre.
There is ongoing development work to develop applications for monitoring oflandslide and avalanches for the road and railway infrastructure.
145
Radar interferometry is used to detect surface movements. Radarsat and other earth
Figure 1.121: Illustration of process chain
The role of satellite data in the process of mapping,monitoring and preparing for rock and land slides
Radar satellite data captured during summer
Mapping
(Geological Survey). The by far most frequent user of Radarsat data for mapping and
which special precautions must be taken with regards to building new or maintainingold infrastructure in order to avoid potentially disastrous rock or mud slides. Certain
The use of satellite data in the monitoring process is not as institutionalized as it is inthe mapping process. Once risky areas have been identified, a range of ground based Lasers
Ground basedradar
Photographsfrom
helicoptersand airplanes
GPS networksRadarsat
Lasers andseismic
measuring
Processing data during the fall using softwaredeveloped under the space programs
Confirmation
Monitoring
considerably better data on movement within rock and land formations, at lower cost
145
Three concluding remarks about the role of satellite data inmapping and monitoring areas prone to rock and land slides:
1. The mapping by satellite to identify areas of risk is well established2. To confirm the risk, airplanes and ground based instruments are used3. For continuous monitoring there is potential for increased satellite usage.
There are barriers of cost and technology currently. Over time this mayreduce the number of instruments and total costs of monitoring.

Current Norwegian EU GMES priorities include financing and prioritization of interests,but over time coordinated government efforts are required to secure benefits
Recent priorities have focused on participation in the development stages ofGMES. This includes financing over ESA Optional programs and contributions toFP7. Activities include research and application development. (see page 87 for anoverview of FP7 participation).
Medium term priorities include securing Norwegian interests inprioritization of services and direction of program development. Government iscurrently negotiating participation in the Initial Operations phase, led by the EU,
Section 1.3: Implementation of space programs
Figure 1.122: Illustration of EU GMES concept
which will determine priorities and operational principles.
Issues include prioritization of use, scheduling of capabilities and priority areas.Although a significant scale-up of capabilities compared to earlier efforts, theGMES systems will meet conflicting demands from different users across Europeand issues of allocation and selectivity will be important. Norway has large areasfor which monitoring capacities are useful but access to the monitoringinfrastructure and capacity is not given at all times.
The game changer for environmental monitoring: EU GMES Sentinels
Satellite series In-situ
PwC
Source: PwC analysis
Sentinels 1 Radar for land and ocean
The component is based oninfrastructure owned and operated byseveral stakeholders and coordinated bythe European Environment Agency(EEA). Instruments for observationinclude ground-based, airborne andship- or buoy-based sensors andinstruments.
Sentinels 4 and 5 Data for atmosphericmonitoring
Sentinels 2 High res optical for landservices
Sentinels 3 optical, radar and altimetryfor land and ocean
Sentinel Jason CS to provide altimetryobservations mainly for ocean
146
Current Norwegian EU GMES priorities include financing and prioritization of interests,but over time coordinated government efforts are required to secure benefits
The risk is that without beneficial resolution over the short term, these issues willlead to higher costs and slower realization of benefits for Norway over the longrun. Benefits may still accrue over time, but there are risks for higher costs andreduced uptake in public sector if services are less relevant for needs.
Longer term success will require continued leadership. The space center is wellexperienced and equipped to perform such a role, but issues of cross-budgetfinancing and coordination is a risk and a constraint longer term.
Of great benefit for Norway is the government wide experience in developing andoperating multiuser satellite information systems. Articulation of requirementsand priorities are highly evolved and there is real life experience.
There is a risk that commercial growth in the downstream service segment will below as little of the Norwegian efforts have focused on developing broadercommercial actors. European programs are more advanced in this regard. This isbalanced by strong involvement of KSAT, and a broader EO R&D segment inNorway which have capabilities. Broader commercial development may stillremain a challenge.
The game changer for environmental monitoring: EU GMES Sentinels
Service segments
Program is funded by the EU.
GMES service provision is organized insix segments:
•Atmosphere•Climate Change•Land Monitoring•Emergency Management•Marine•Security
Program is funded by the EU.
ESA develops the instruments andsatellites. In-situ componentdeveloped by EEA.
Service segment developed underEU and financed by FP7 Space.
EU funded Initial Operationsagency to coordinate developmentsduring 2011-2014
146

Radar data purchased to enhance maritime and terrestrial monitoring ability
Relevance of concept
Satellite radar data are acquired to enable effective surveillance of maritimeareas by security agencies in Norway. Modern radar satellites can detect ships,oil spills and ice coverage. They are also used to monitor land areas and can beused to monitor landslides and snow cover. They are also workable at night andin overcast weather. Optical image satellites cannot provide the same
Section 1.3: Implementation of space programs
in overcast weather. Optical image satellites cannot provide the samefunctionalities. There are also scientific uses for radar data.
The scientific and institutional radar satellites a.o ESA ENVISAT and earlierERS satellites also has radar capabilities but these do not have the samecapabilities. Resolution is lower and revisit times less frequent in areas ofinterest for Norway. ENVISAT is also currently unstable ,drifting in its orbit,and not useful for operational purposes.
Radar capabilities are also available aero planes, including on the Norwegianmilitary Orion surveillance planes. Aero planes are non-competitive for thispurpose as they cannot cover the same large areas with the same time efficiencyas sweeps by satellite borne radar.
Objectives
The ability to meet operational needs are emphasized in the annual governmentbudgets. The agreement with RSI contains other provisions which we will detailon the following pages.
PwC
There are ongoing discussions of how to secure data for the future and we willreturn to this discussion towards the end of this segment.
Source: Coastal Authority webpage; MoTI documents; PwC Analysis
147
Radar data purchased to enhance maritime and terrestrial monitoring ability
Activities and organization
A contract was entered into by the space center with Radarsat International Inc(RSI) in 2002 whereby an agreement was made to purchase data worth USD 10million during 2002-2009 from the satellite Radarsat-2. It also includedprovisions for delivery of data from Radarsat-1 in event of delays in launchingRadarsat-2. The satellite was much delayed and became operational in AugustRadarsat-2. The satellite was much delayed and became operational in August2008. The agreement has been extended until 2014 reportedly without prejudiceor costs for Norway.
RSI is as a subsidiary of MacDonald, Dettwiler and Associates Ltd. (MDA) acompany with its main business in surveillance, intelligence and communicationsectors.
The agreement allows about 2000 scenes with scheduled capacity, and access tofurther 8000 background scenes (non-priority requests). The agreement allowsresolution of up to 3m for Government users only and in predefined areas.Certain security restrictions and privileges for the Canadian government apply.
Kongsberg Satellite Services, under commission, downloads the data at theSvalbard facility, processes and distributes these to Norwegian users. KSAT alsohas access to data for resale and pays government 1,2 million NOK annually forthe privilege.
147
KSAT is further paid 5 million NOK annually by Defense and the CoastalAuthority for processing services. The space center pays 2,5 million to covercosts for smaller users. The latter is recorded as an allocation under the nationalsupport funds.
The space center coordinates users and a process that allocates use of allottedscenes.

Radar data are much used for defense and security purposes, and well integrated intooperationsThe data are much used. Utilization is at about 90 percent of the scheduledallocation. Security purposes dominate. Defense is the predominant user atnearly 36 percent if including the Defense Research. The Coastal Authorityuses further 23 percent. The geological survey uses about 27 percent. Beyondthese the remaining ten agencies use about 15 percent. Some for scientificpurposes.
The geographical coverage has been mostly in northern ocean areas. Less usealong the coast and at the mainland. Sweeps are scheduled for daily (or more
Section 1.3: Implementation of space programs
along the coast and at the mainland. Sweeps are scheduled for daily (or moreoften), weekly or other intervals depending upon user specification. There arealso seasonal variations in use.
There are reports of scheduling conflicts mostly due to the increased use overland areas. Capacity of the system may be borderline full especially for nearreal time acquisitions.
32 %
27 %
23 %
3,9 %
3,8 %
Defence
Geological Survey
Coastal Authorithy
Defence research
NORUT
Figure 1.123: Use of Radarsat-2 data in Norway by agency (2011)
Defense, Geo and Coastal Authority uses more than 80percent
PwC
Source: NRS data; KSAT user needs Radarsat 2011; Evaluation of Major Crown project Government Consulting Service Canada 2009;
148
3,8 %
2,3 %
2,3 %
1,4 %
1,4 %
1,0 %
0,6 %
0,5 %
0,3 %
0,2 %
NORUT
University of Oslo
Metherological Institute
Geotechnical Institute
Univeristy of Tromsø
Directorate of Fisheries
Nansensenteret
Forest and landscape authorithy
Polarinstitute
Computing Center
High res
Standard
50
%
80
%2190 scenes≈
Radar data are much used for defense and security purposes, and well integrated into
The additional capacity of 8000 scenes is severely underutilized. Numbersindicate about 15-20 percent utilization but the figures are considered unreliableby the users. To the extent that the numbers are to be believed, they indicatethat defense uses 70 percent of this – an additional 1000 scenes which is morethan under the scheduled use.
The overall pattern is similar to that of Canadian authorities. Security andnatural resource services constitute 80 percent of usage. Canadians use aboutfive times as much as Norwegians. The Canadian numbers are likely to havefive times as much as Norwegians. The Canadian numbers are likely to haveincreased since 2009 reported below. The expected use was 15.000 scenes.
The impacts must be seen in relation with the other earth observation servicedevelopment programs and the AIS capabilities.
See also the analysis of the Canadian context for Radarsat-2 in section 1.2.
50 %
16 %
14 %
11 %
Canadian Ice Service (EC)
Department of National Defence
Natural Resources Canada
Canadian Space Agency
Figure 1.124: Use of Radarsat-2 data in Canada by agency (2009)
Broadly similar pattern in Canada
Source: NRS data; KSAT user needs Radarsat 2011; Evaluation of Major Crown project Government Consulting Service Canada 2009; PwC Analysis
148
7 %
0,5 %
0,5 %
0,5 %
0,4 %
0,1 %
0,0 %
0,0 %
Department of Fisheries and…
Agriculture and Agri-Food Canada
Government of Canada
Public Safety Canada
Statistics Canada
Parks Canada Agency
Department of Foreign Af fairs…
Indian and Northern Affairs Canada
50
%
80
%
9300 scenes≈

A cost-efficient agreement, but contract included several items unrelated to governmentneeds that raises risks
Cost effective
Commercially, the agreement may have been beneficial for Norway. A fixedfee of USD 10 million was agreed for provision of data to be paid at annualinstallments upon delivery of data. The amount was not inflation adjusted. A
Section 1.3: Implementation of space programs
installments upon delivery of data. The amount was not inflation adjusted. Anominal entry fee was agreed. Currency appreciation has since made theagreement more financially attractive for Norway.
Compared to current published Radarsat-2 prices, the price achieved impliesa discount of about 50 percent if assuming a customary 30 percent volumediscount. Radarsat-2 prices are today determined in a competitive market andare as such indicative of prices form other sources as well.
The financial risks for Norway was associated with risks of not being able toexit the agreement and seek alternative providers if delays.
We cannot determine whether the costs were competitive against otherproviders that launched at the same time as there were no competition ornegotiations with these. The agreement was entered into five years before thesatellite was launched. Other commercial alternatives were available at time oflaunch, but may not have been evident at time of negotiation in 2002.
PwC149
efficient agreement, but contract included several items unrelated to government
Contract contained several provisions unrelated to governmentdata needs
• An exclusive European distribution agreement was given to KongsbergSatellite Services (then TSS);Satellite Services (then TSS);
• Kongsberg is also identified as the exclusive distributor and processor ofdata to the Norwegian government; and
• Ground station contracts to Kongsberg Spacetec;
• An MoU was also agreed indicating areas of civil and scientific cooperationbut without binding financial commitments. There has been little if anyfollow-up of the MoU for bilateral cooperation.
There was no competitive or open process in choosing the Norwegian firmsmentioned in the contract.
There are dilemmas and risks of combining industrial return schemes withthose of acquiring the best option for government. These include:
• Questionable benefits for society and increased costs for government; and
• High fiduciary risks and regulatory issues due to selectivity, favoritism andnon-competitive nature of process.
149
non-competitive nature of process.
There are no straight forward ways to combine such objectives and we wouldadvise to approach this differently in the future. Risks involved are high andmay cause unnecessary damage to the space programs. Transparency andcompetitive procurements are the regulatory default process and we see noreason why this shouldn’t be followed in the next acquisition.

Highly relevant AIS satellite program to enhance maritime surveillance successfullylaunched
Relevance of concept
Ships above 300 mt are required by international regulation to constantlytransmit signals of its identity speed and course and other information. This isoriginally designed as a terrestrial system whereby other ships and coastalstations pick up the VHF signals. Terrestrial systems have limited range andsatellite reading of the signals significantly increases the ability to monitor the
Section 1.3: Implementation of space programs
satellite reading of the signals significantly increases the ability to monitor thetraffic.
A core rational for the system was to develop a satellite system useful formonitoring purposes for coastal authorities, search and rescue, harbormanagement and defense. The space center proposal of 2006 calls it a“concept-demonstrator” to cover the Norwegian economic zone and watersfurther north and east.
It was stated that is the satellite was not to be designed to receive signals formthe North Sea and channel areas with more dense traffic as this would require a“much more advanced satellite”.
Objectives
Specific objectives for the AIS satellite(s) are not stated in the Parliamentarybudgets beyond those generic for the space programs. It is said that theprogram is an important element of a comprehensive surveillance system forthe northern ocean areas.
PwC
The specific proposals by the space center submitted to Government articulatesa whole range of reasons for the program. Those relate to industrial andpolitical considerations in addition to the core relevance of the program.
Source: Coastal Authority webpage; MoTI documents; PwC Analysis
150
Highly relevant AIS satellite program to enhance maritime surveillance successfully
Activities
Proposals have been submitted by the space center during 2006-2013 for theexisting and planned satellites. Appropriations have been made in annualgovernment budgets since 2007 for the first and second satellites but not yet fora third.
The concept originated in a concept competition in the community wherebyThe concept originated in a concept competition in the community wherebyparticipants where invited to propose concepts for national programs. Proposalsincluded other segments such as telecom.
The Defense Research Establishment led and coordinated the project.
The satellite was purchased from a Canadian manufacturer. The AIS receiverwas produced by Kongsberg Seatex. The Kongsberg firm had an earlierdevelopment contract with the space center in which technologies were evolved.Seatex has also later produced an AIS receiver for testing purposes under ESAdevelopment contract. Kongsberg Satellite Services was selected as groundstation provider. The satellite was successfully launched in 2010 from India.Expected design life is between one and three years.
Operations are now with the Coastal Authority and integrated into themonitoring system. Coastal authority manages access to applications for otherusers.
150

AIS system has been enthusiastically received albeit some operational challenges
Results
The coastal authority claims this has been a “small revolution” in monitoring ofocean areas. Vessels can be tracked and their activities investigated. This isreported to have been helpful in determining responsibility for oil spills. Theauthority uses the data, and integrates it with the terrestrial system.
The satellite revisits north eastern waters every 90 minutes. Coverage insouthern Norway is less frequent. Data are downloaded at the KongsbergSvalbard facility and processed at the Defense Research Establishment before
Section 1.3: Implementation of space programs
Svalbard facility and processed at the Defense Research Establishment beforebeing transmitted to the Coastal Authority.
Data access is restricted to public authorities. The data policy is aligned withthat of the terrestrial system. There are commercial applications of these data.Exceptions can be granted if for “useful” purposes.
There are possibilities for integrating AIS data with radar data from othersatellites and combinations creates opportunities including for detectingsources of oil spills or ships that are not carrying AIS senders. The coastal anddefense authorities have access to such capabilities.
Figure 1.126: Illustration of application
Detects signals from ship mounted senders and enhancescoastal authorities monitoring ability
PwC
Source: *AIS User forum, Coastal Authority presentation by senior engineer Aasheim “AIS fra satellitt” page 8; **page5; ***AIand press release re one year anniversary of satellite; PwC Analysis
151
AIS system has been enthusiastically received albeit some operational challenges
Operational difficulties reported include:
- Very many ships are “lost” in areas with dense traffic.* The satellite is unableto detect all messages from ships in high traffic areas. The ship based sendersare designed to work with a terrestrial system which manages conflictingmessages. This difficulty is identified in other AIS satellite systems globallyand various actors claims to have resolved this in different ways. We don’tknow how the Norwegian system compares;know how the Norwegian system compares;
- Messages on ship type and hazardous goods are picked up 10 percent of thetime.** The system picks up messages on identity, navigational status moreconsistently (AIS message type 1,2 and 3).;
- AIS applications software difficulties.*** It is reported to have high userthresholds and issues with robustness and historical data management andintegration with other data sources i.e. ship registries.
We will review impacts taking into account the integration with Radarsat andother programs in section 2.1
Figure 1.127: Accrued and planned earmarked development expenditures forAIS satellites (2008-2015)
Development costs increases for third generation with amore ambitious program
Source: *AIS User forum, Coastal Authority presentation by senior engineer Aasheim “AIS fra satellitt” page 8; **page5; ***AIS user forum, CA presentation, Kamstrup “Statistikk behov” pages 4,8;CA website
151
2008-2010
2010-2012
2013-2015
AISSat-1
AISSat-2
AISSat-3
30 mill.
15 mill.
40 mill.

Questionable life-cycle costs compared to alternatives and this should be properlyassessed before further investments are made
There is no economic option evaluation comparing against alternatives includingthe market options. The proposals for AIS submitted to government over theyears contain a number of arguments for developing the system but littlespecifics on development costs and only indications of life-cycle costs.
The first 2006 proposal had a high level discussion of other terrestrial conceptsas alternatives. At that time there were no other satellite systems operational
Section 1.3: Implementation of space programs
as alternatives. At that time there were no other satellite systems operationalworldwide. The 2012 proposal mentions that they “see a development” wherebyU.S. commercial operators would launch systems but assessed the benefits forNorway to be greater without being specific. The 2013 proposal (submitted in2011) adds that “cost wise it seems to be an advantage compared to if the coastalauthority purchases information from commercial actors. No details of costseither for the government project or the market solutions are presented.
Risks for the government option (one satellite) are not discussed but it points toorisks for the private operators. “In addition we do not know how persistent thecommercial actors will be.”
More recently, market options have become an alternative. Both OrbComm andExactearth have systems with polar orbiting satellites. Capabilities and offeringsmay vary between them and compared to the Norwegian satellite and it is beyondthis study to review the options.
Also of note are the policy developments in Europe. The discussions in Europeare still ongoing and final decisions has not made. ESA claims it is testing the
PwC
are still ongoing and final decisions has not made. ESA claims it is testing thecommercially available systems (OrbComm/Exactearth) against EuropeanMaritime Safety Association (EMSA) requirements and has does not intend tolaunch a public system. Member states may decide differently but no decisionhas been made yet.
152
Source: NRS budget proposals to MoTI 2008-2013; *SEC 10-K filing ORBC March 17, 2008;**10-K filing **10-K March, 2012;***10-K March 2011; Market interviews; PwC Analysis
cycle costs compared to alternatives and this should be properlyassessed before further investments are made
Figure 1.128: Illustration of important cost elements
Life-cycle costs may not be competitive taking into accountcost and quality
This is only to exemplify some cost elements indicating why this is arelevant problem. A full life cycle cost analysis is beyond this study.relevant problem. A full life cycle cost analysis is beyond this study.
Development costs for the Norwegian satellite are indicated as 30million NOK (U.S. 5.2 million) for the first satellite. Other costs includeearlier development work financed under the space center for KongsbergSeatex. There is also defense sector funding, especially in earlier designstages and for bridging financing between disbursements from the spacefunds. Thos costs could be annualized over the expected lifespan of thesatellite indicated at 1-3 years in the proposals.
Recurring costs are in the original 2006 proposal indicated at about 4million NOK annually. It is not specified further. These may be costsrelated to the monitoring of the data stream.
Alternatives in the marketplace for AIS satellite data streams arepriced between 0,3 and 1,2 million USD (1,8-7,2 million NOK) annuallydepending upon specifications of the service (i.e. regional/global). These
152
depending upon specifications of the service (i.e. regional/global). Theseare price estimates from the actors provided to PwC. All providers havearctic coverage though number of satellites and revisit times vary. 5+satellites in polar orbit is available from one system. There are currentlytwo providers actively distributing service and more actors with serviceofferings in preparation.
There are other qualitative elements that would enter into such anassessment. The market options offer better number of satellites, revisittimes, quality of data from areas dense areas, and redundancy of thesystems.
On the other hand, sovereign control of the infrastructure and the datastream would have value for the Norwegian government. This has to beassessed against increased cost, poorer quality and higher risks.

In total, advanced, integrated and user responsive ocean monitoring system, butconsiderations to institutionalize financing may be necessaryThis is to indicate the total costs of running the monitoring and surveillancesystems. These will be compared against the benefits later in this study. Costsare budgeted for under a number of different chapters in government budget.Most are under the space program chapter of the MoTI budget. Not all areexplicit i.e. the annual allocation for KSAT processing costs (2,5 million) isbudgeted as a National support grant.
Longer term: Funds that are essential for maintaining operational capabilitiesshould be identified and made explicit in budget. This would help prepare for
Section 1.3: Implementation of space programs
10 1,2
should be identified and made explicit in budget. This would help prepare forlonger term scenarios whereby services are institutionalized and are no longerrelated to the objectives of the space programs. These are costs are foracquiring essential services cross government and should be identified assuch.
Figure 1.129: Approximate flow of funds for maintaining ocean surveillance capabilities
Approximately 32,5 million NOK in total annual cost excluding other agency recurring costs and provisions for other sensoryinformation
Radar data access Processing
TotalMDA Who pays:
Total paid toKSAT
Totalsuppliers
PwC
10
7,5
1,2
8,9
3,5
2,5
1,5
MDA KSAT MoTI KSAT DefenceSpace centerCoastal
153
In total, advanced, integrated and user responsive ocean monitoring system, butconsiderations to institutionalize financing may be necessary
1. Data access for radarsat-2 data. This includes funds for MDA and apayment from KSAT who has been given privileged access to data andreimburses government.
2. Processing costs to KSAT shared between users. Space agency funds usedto pay KSAT to cover costs for smaller users.
3. Development funds under the national service program
4. AIS development costs annualized and recurring costs (estimate)
10 10
Figure 1.129: Approximate flow of funds for maintaining ocean surveillance capabilities
Approximately 32,5 million NOK in total annual cost excluding other agency recurring costs and provisions for other sensory
Development
Totalsuppliers
Totalsuppliers
AIS
4. AIS development costs annualized and recurring costs (estimate)
5. Other agency recurring costs for applications and monitoring.
5
10
4?
5
10
R&D Space center AIS Space center Recurringagency cost
153

Largest national program is for military communications but with limited involvementfrom Norwegian space firms
We include a short overview of this program. It is a sizeable national programand important for the context of the analysis. This program is beyond thescope of the analysis, and the space programs under the purview of theMinistry of Trade and Industry.
A dedicated defense satellite will be developed to serve the communicationneeds of The Norwegian Defense Forces. Its constructed as a public-private
Section 1.3: Implementation of space programs
needs of The Norwegian Defense Forces. Its constructed as a public-privatepartnership where the commercial operator assumes financial risk and isresponsible for commercializing sales of excess capacity. Spanish firm Hisdesatowns 60 percent and the Norwegian defense logistical corporation 40 percent.Investments for Norway at about 1,3 billion NOK with the Spanish partnercovering the rest. Launch is expected in 2014. The satellite will carry 40-50transponders and excess capacity will be leased on the commercial market. Theprogram also includes about 300 terminals for land, air and maritime forces inaddition to ground equipment.
Three important issues to note:
• First, the choice of concept is based upon formalized cost-benefit assessmentswhereby several models have been considered including short- and long termleases. The conclusion was that an owner/operator model with commercialsales of excess capacity would involve lowest risks, investment and life-cyclecost.
• Second, the public-private-partnership concept is comparable to that of the
PwC
Source: Press, Parliamentary papers, and publically available presentations of the program; PwC Analysis
• Second, the public-private-partnership concept is comparable to that of theBritish Defense Ministry that is established with Skynet-5. Several providerswere invited to bid and Spanish Hisdesat was found most attractive. Thisincluded provision of an orbital slot for the geostationary satellite. Theprocurement process and choice of partner caused some controversy inNorway in that Norwegian industry was largely excluded.
• Third, the arrangement is reported to include sales of military hardware andother offsets in a broader military agreement between the two countries inwhich the satellite is only a part. There is expected to be industrial contractsfor Norwegian space industry and a procurement concept has been developed.
154
Largest national program is for military communications but with limited involvement
Figure 1.130: Illustration of needs met by HisNorSat
HisNorSat will serve most of the needs of a future networkeddefense system
Defense SatCom needs are expected to “explode” asnetworked concepts are deployed. The program isnetworked concepts are deployed. The program isexpected to meet most of these requirements with someexceptions:
• Arctic coverage is limited and there will be continuedleased capacity for these purposes
• F35 needs will be handled by other system most likelythe U.S. Mobile User Objective System underdevelopment by the Pentagon
• UHF capacity from the NATO systems (leased from a.oAstrium services)
Source: Press, Parliamentary papers, and publically available presentations of the program; PwC Analysis
154

Section 2
PwC
Section 2
Policyeffectiveness
There are three objectives of this section:
I. Understand impacts. Analyze what has happened as a results ofthe programs. What real difference has they made? This focuses onthree areas:
• Space industries.
• Public sector impacts.• Public sector impacts.
• Socio-economic.
II. Determine accomplishments vis-à-vis policy objectives. Thisanalysis will determine the degree of success of the space programs inreaching the stated policy objectives. Two issues of focus:
• Relevance. This is assessing to what extent the activities aresuited to purpose.
• Effectiveness. This is about assessing whether the objectiveshas been achieved and what are the major factors impactingachievement of objectives.
III. Identify governance risks, mitigation strategies and criticalenablers. This will focus on two areas:
• The framework for determining objectives, allocatingactivities and resources and measure and report on progress;and
• Governance and fiduciary risks.

Section 2.1
Impacts
The objective of this analysis is to analyze what hashappened as a results of the programs. What realdifference has they made?
We focus on three areas:
I. Industry impacts. We discuss impacts bysegments and over time. How has their businessevolved? How important are the publicdevelopment funds and contracts? Are there rippleeffects and tech transfer? What's the growth, theemployment and the profits?employment and the profits?
II. Public sector impacts. Many activities hastargeted utilization of satellite capabilities in thepublic sector. We review what impacts are seen.
III. Socio-economic assessment. A deeperanalysis of how the programs contribute toeconomic and social development. How does thecosts transfer into broader societal gains? Whatwould have happened in the absence of the spaceprograms?

Industryimpacts

Supported firms have declining share of total space sales in Norway
Firms that are supported by public funds and has contracts with ESA has seen adecline in overall space related turnover of the last 15 years. During that timewe have seen an increase in the ESA contracts for that same group but the ESAshare remains small.
Sales of space related firms that do not receive support has seen an increaseover the period. We should keep in mind that all this takes place in a contextwhere there has been a real decline in commercial space sales over the last
Section 2.1: Impacts
Figure 2.1: Share of total space related sales 1997-2010 (excludingNorwegian public sector expenditures)
Supported firms have declining share of total space sales
where there has been a real decline in commercial space sales over the lastdecade.
80%
Share
ofto
talspace
rela
ted
sale
s
CAGR 1997-2010
+2,3%
PwC
1997 2001 2005 2009
Sales non-ESAf irms
Sales ESAf irms
ESA sales
Source: Basis is NRS 2011 ripples survey data; adjusted for sales of two large service companieswith only nominal ESA engagement; also made adjustments to T&T historical data.
158
50%
20%
Share
ofto
talspace
rela
ted
sale
s
-4,8%
Firms that receive public support typically target different markets segmentsthan those that operate outside of the institutional markets.
All upstream firms receive support and engage with ESA, i.e.. manufacturing oflaunchers and satellite components; while there is much less institutionalactivity from firms that operate in the downstream segments i.e.. satellitecommunications service segments.
Supported firms have declining share of total space sales in Norway
1 000
1 200
1 400
MIl
lion
NO
Kcu
rre
nt
Satcom services
Figure 2.2: Space related sales by value chain segment for ESA firms inNorway (1985-2010)
Ground equipment producers feature strongly among thesupported industries, Satcom Service providers are absent
This reflects the demand structure of ESA where most of the No0rwegianpublic support is are directed.
-
200
400
600
800
1 000
1985 1990 1995 2000 2005 2010
MIl
lion
NO
Kcu
rre
nt
Earth observation services
Ground equipment
Satellitecomponents/Launchers
Institutional R&D
158
Other services

Sales to other sectors is more important than space sector for supported firms
Most firms that operate in the institutional segments have other businessoutside of the space markets. There are only a few producers that are entirelyspace focused.
The share of space related sales have generally fallen over the last decade forthese enterprises. This can indicate a shift in focus and lack of alignment incorporate strategy with space markets, or it can indicate faster growth in othersegments.
Section 2.1: Impacts
23 %
30 %
9
12
Ratio Total sales Space sales
Figure 2.3: Ratio of space sales compared to other sales for industries thatengage with ESA (2000-2010)
Ratio of space related sales has declined
segments.
It should be noted that much of the sales increase over the last five years isattributable to Kongsberg Defense Systems, a large business unit within the KGgroup that has seen much growth. However, the pattern still holds if adjustedfor KDS sales indicating that this may be a broader based development.
PwC
0 %
8 %
15 %
23 %
0
3
6
9
2000 2005 2010
Sp
ace
sale
sra
tio
Bil
lio
nN
OK
Source: Basis is NRS 2011 ripples survey data; adjusted for sales of two very large non-spaceservice companies with only marginal space involvement over the last decade.
159
The specialized producers contribute more to overall space sales. There are 4-5enterprises serving the institutional space markets that have very little salesoutside of the space markets. These are also the same firms that contributemost to total space segment sales.
One company in the sample is off the chart, Nera Satcom which havecontributed as much as 40 percent of total space related sales during 1985-2008 before production closed in Norway. This lifts the average line indicated
Sales to other sectors is more important than space sector for supported firms
10 %
15 %
Co
ntrib
utio
nto
tota
lsale
s
Figure 2.4: Share of space related sales and contribution to total spacesales in Norway for ESA firms (1985-2010)
And specialist space firms contribute more to overall spacesales
2008 before production closed in Norway. This lifts the average line indicatedin the chart below.
Due to the significance of Nera in the statistics we will present a few of thefollowing metrics indicating how the “surviving” companies have performed.
0 %
5 %
10 %
0 % 20 % 40 % 60 % 80 % 100 %
Co
ntrib
utio
nto
tota
lsale
s
Space sales share
159

Declining sales for supported firms and not employing more people
Space revenues have declined overall in particular during the last five years forESA firms. This is much due to the collapse of a few companies.
Its encouraging that there is robust growth, both in nominal and real terms, forthe surviving firms. This growth has been consistent since 1985 at anannualized growth rate of about 16 percent.
The overall success of the policy may still have to judged on the basis of the
Section 2.1: Impacts
1,2
1,5
All supported f irms Surviving supported f irms
Figure 2.5: Space revenues for ESA firms (Billion NOK nominal)
Robust growth for surviving firms
total, but it is promising for the future that these firms show such robustgrowth. It should be noted however that prior to 2003 there were fewindications that there were underlying problems for the whole group whichgrew even faster at that time.
PwC
0,0
0,3
0,6
0,9
1985 1990 1995 2000 2005 2010
Billio
nN
OK
Source: Space Report 2011; Company Investorinformation; Press reports
160
CAGR16%
Given this increase it seems peculiar that employment has not picked up evenfor the surviving firms. Overall there is a decline since the late 1990’s havingnearly lost half of the employees that were involved at the peak.
The surviving firms show a flat trend over the last 15 years. On the positive sidethis could indicate considerable productivity increase as revenues haveincreased in real terms during the same period. The impact on wealth creationwill be a function of how wage cost and profits have increased and are
Declining sales for supported firms and not employing more people
1000
1200
All supported f irms Surviving supported f irms
Figure 2.6: Space related employment for ESA firms (1985-2010)
Employment has not increased over the last decade evenfor survivors
will be a function of how wage cost and profits have increased and aredistributed. Wages have increased but we do not know if they have kept pacewith the sales growth. Profits have increased in absolute terms though marginshave stayed at about the same levels as we will see below.
0
200
400
600
800
1985 1990 1995 2000 2005 2010
Peo
ple
160
No net growth inemployees in
surviving firms

ESA contracts are becoming less important for space sales for supported firms
ESA contracts have increased over the last decade nearly doubling. This growthrate is well above the inflation and thus indicating growth in real terms. It isalso faster than the growth of ESA budgets overall indicating that Norwegianfirms have taken a larger share of the ESA market.
Adjusted for inflation the contracts values have still not reached the peaks seenin the mid-nineties. This probably needs to be understood in the context ofAriane-5 developments. The launcher development had significantdevelopment contracts at that time. Ariane-5 production contracts are now
Section 2.1: Impacts
200
250
All supported f irms Surviving supported f irms
Figure 2.7: ESA contracts 1985-2010 (NOK nominal)
ESA contracts peaked in mid-nineties but have picked upagain over the last decade
development contracts at that time. Ariane-5 production contracts are nowtechnically recorded as commercial contracts. It also reflects however that someof the companies active with ESA at that time have since succeeded incommercial markets beyond launchers. The implication is that the real increaseover the last decade is also due to increased competitiveness in more productcategories.
PwC
0
50
100
150
200
1985 1990 1995 2000 2005 2010
Millio
nN
OK
Source: NRS data; PwC analysis
161
As share of total space sales we see that ESA contracts peaked significantly inthe mid-nineties. At that time the large ESA contracts were for firms involvedin launchers and satellite components, mostly Nammo, Kongsberg KDS andNorspace. There has been some increase in the ESA share since 2002.
The reduced share may also indicate that firms that have engaged with ESA inthe later periods have been less dependent upon the institutional markets. Thisapplies mostly to the ground equipment producers and the service segment.
ESA contracts are becoming less important for space sales for supported firms
50 %
60 %
Sh
are
of
tota
lsp
ace
sale
s
All supported f irms Surviving supported f irms
Figure 2.8: ESA contracts as share of total space revenue for ESA firms
Importance of ESA contracts have increased over last tenyears after significant importance in initial years
0 %
10 %
20 %
30 %
40 %
1985 1990 1995 2000 2005 2010
Sh
are
of
tota
lsp
ace
sale
s
161

The public contributeshalf of ESA active spaceorganizations
Organizations that receive public support are heavily dependent upon public development financing.Public sources finance more than half of development expenditures.
We also note the increased significance of Space Center development funds which have been nearing 20percent of totals in the last few years. These funds are mostly captured by commercial players.
Somewhat surprisingly perhaps we find that resources from the Research Council are quite high andhave also increased in the period. These amounts are above the levels of the space chapter of theResearch Council budget indicating that firms tap into other programs as well. This funding is mostlycaptured by R&D institutes. These are institutes who perform development work for private and publicclients. Basic science organizations are not included.
Section 2.1: Impacts
75 %
100 %
organizationsdevelopment costs
Pure commercial players have a higher corporate contribution above 50 percent in total.
Innovation Norway support is insignificant.
Figure 2.9: Development funds for ESA active organizations (Includes R&D institutes withapplied development activity, not basic science organizations)
Organizations with ESA contracts are very dependent upon public development costs
Share
ofdeve
lopm
entfu
nds
PwC
0 %
25 %
50 %
1985 1990 1995
162
Share
ofdeve
lopm
entfu
nds
Source: NRS ripple survey data; PwC analysis. Category “Other” isassumed to be mostly ESA development contracts or EU FP’s.Details are not known.
Organizations that receive public support are heavily dependent upon public development financing.ublic sources finance more than half of development expenditures.
We also note the increased significance of Space Center development funds which have been nearing 20percent of totals in the last few years. These funds are mostly captured by commercial players.
Somewhat surprisingly perhaps we find that resources from the Research Council are quite high andhave also increased in the period. These amounts are above the levels of the space chapter of theResearch Council budget indicating that firms tap into other programs as well. This funding is mostlycaptured by R&D institutes. These are institutes who perform development work for private and publicclients. Basic science organizations are not included.
Corporate
Pure commercial players have a higher corporate contribution above 50 percent in total.
Innovation Norway support is insignificant.
Development funds for ESA active organizations (Includes R&D institutes withapplied development activity, not basic science organizations)
Organizations with ESA contracts are very dependent upon public development costs
1985-2010
45%
29%
2005-2010
43%
23%
Average
1995 2000 2005 2010
Corporate
Other Institutional
Innovation Norway
Research Council
Space Center
162
2% 2%
16% 23%
8% 19%

Public development support is a significant, but declining as share of profits
Public support has however become a less significant share of overall spacesales for firms that operate in the ESA market. We note the very high ratioduring the eighties. This is at the time when targeted industrial support forspace manufacturers started and it is evident that this stage of theirdevelopment was heavily supported.
The share has been about 10 percent over the last decade with no clear trendevident. The declining share may also be seen as a success of the supportprovided in the initial stages: It may however also indicate that there has notbeen a renewed effort of the type that was seen 25 years ago.
Section 2.1: Impacts
40 %
50 %
Sh
are
of
tota
lsp
ace
sale
s
Public support Prof it %
Figure 2.10: Public support as share of total space sales for ESA firms;profits as share of space sales (profits for subset only, 3 yr moving average)
Public support declines as share of total space sales
been a renewed effort of the type that was seen 25 years ago.
Profits have not been very high compared to what is seen in other segments ofthe value chain i.e. services. No pattern is clear except increased volatility in thelast five years. Profit percentage is generally below 10%. R&D institutes are notincluded in this calculation.
PwC
0 %
10 %
20 %
30 %
40 %
1985 1990 1995 2000 2005 2010
Sh
are
of
tota
lsp
ace
sale
s
Source: NRS ripple survey. Profit numbers should be interpreted with some care. R&D institutes not included. We have made manseries and eliminated extreme (negative) values based alignment with official business registry information. The impact of co
163
In the early years of Norwegian space manufacturing development, the publicdevelopment costs far exceeded profits. This was a heavily subsidized venture.The ration quickly fell however as core products were developed and salesgrowth started.
The ratio is currently in the area of 35 percent of profits indicating that theindustry is still supported significantly compared to many other industries. Thelonger term trend is downward sloping.
Public development support is a significant, but declining as share of profits
250 %
300 %
Sh
are
of
pro
fits
Figure 2.11: Public development support as share of profits for ESA firms
Public funds constitute 35 percent of profits
0 %
50 %
100 %
150 %
200 %
1985 1990 1995 2000 2005 2010
Sh
are
of
pro
fits
Source: NRS ripple survey. Profit numbers should be interpreted with some care. R&D institutes not included. We have made manual adjustments to the reported data to adjust for broken timeseries and eliminated extreme (negative) values based alignment with official business registry information. The impact of correction goes in the positive direction.
163

Some organizationswork with ESAwithout NRS funds but
There are intentional linkages between NRS funds and ESA contracts. One aim of the NRS funds is tohelp businesses qualify for ESA contracts. It should be noted however that much of the increase in NRSfunding over the decade is linked to other purposes than industrial development and recipient entitiesmay have less commercial inclination and ability to compete within ESA.
Business and R&D institutions regards the NRS funds highly and claims it helps them position for ESAcontracts. Initial technology development can commence this may help business enter Europeaninstitutional markets.
Quite a large number of organizations engage with ESA without having any involvement with the NRSfunding schemes (36 percent of organizations). A small subset also engages exclusively with the nationalschemes.
Section 2.1: Impacts
without NRS funds butthese have a low shareof total financing
Moneywise those who engage with both schemes receive the largest share. The shares for those who arenot involved with NRS schemes is only about 7 percent although in terms of organizations their ratio isabout 36 percent.
Next we turn to a review of how the distribution of ESA contracts and NRS funds appears for thoseorganizations who receive both.
Figure 2.12: Number of organizations with ESA contracts and NRS support 2000
Many organizations carry on with ESA without NRS financing, but the big money is withthose who use both
PwC 164
Source: NRS ESA NRS data; PwC analysis.
121
0 %
Organizations #
Money
(NOK million nominal)
There are intentional linkages between NRS funds and ESA contracts. One aim of the NRS funds is tohelp businesses qualify for ESA contracts. It should be noted however that much of the increase in NRSfunding over the decade is linked to other purposes than industrial development and recipient entitiesmay have less commercial inclination and ability to compete within ESA.
Business and R&D institutions regards the NRS funds highly and claims it helps them position for ESAcontracts. Initial technology development can commence this may help business enter European
Quite a large number of organizations engage with ESA without having any involvement with the NRSfunding schemes (36 percent of organizations). A small subset also engages exclusively with the national
Moneywise those who engage with both schemes receive the largest share. The shares for those who arenot involved with NRS schemes is only about 7 percent although in terms of organizations their ratio is
Next we turn to a review of how the distribution of ESA contracts and NRS funds appears for thoseorganizations who receive both.
Number of organizations with ESA contracts and NRS support 2000-2010
Many organizations carry on with ESA without NRS financing, but the big money is with
ESA only ESA with NRS support NRS Only
164
25
121
32
1710
12
30
25 % 50 % 75 % 100 %

Those who receive most ESA funds also receive much NRS fundsAmong those who receive both NRS and ESA funds we can conceptualize thelinkages by dividing the organizations into four equal quadrants along twodimensions:
- All organizations are classified with regards to whether they have received moreor less than the median of NRS funds; and
- By the ratio of NRS funds to ESA contracts. Lower ratio means “better value formoney” for NRS funds.
We should keep in mind that a subset receives ESA contracts without NRS funds
Section 2.1: Impacts
Figure 2.13: Distribution of NRS funds and ESA contracts 2000-2010
We divide all organizationsinto four categories
10,0 %
100,0 %
Shar
eo
fN
RS
fun
ds Laggards
HighMaintenance
Calculate their use of NRSfunds
10,0 %
100,0 %
Shar
eo
fN
RS
fun
ds
44% 36%
Use of NRS funds2000-2010
High
whatsoever, and another subset receives only NRS funds. These are not includedin the calculations. Concept and results are visualized below. Scales arelogarithmic as the range is otherwise to large to scale properly.
PwC
Source: NRS ESA data, PwC analysis
0,0 %
0,1 %
1,0 %
0,00010,011
Shar
eo
fN
RS
fun
ds
NRS ESA Ratio
Perhaps? Cash cows
0,0 %
0,1 %
1,0 %
1
Shar
eo
fN
RS
fun
ds
NRS ESA Ratio
4% 6%median
Low
Poor Better
165
Those who receive most ESA funds also receive much NRS fundsDistinct patterns emerges.
-The laggards receive about 44 percent of NRS funds yet only 12 percent of ESAcontract volume;
-High maintenance firms receive 36 percent of NRS contracts but nearly 55percent of ESA contract volume;
- Cash cows sees only 6 percent of total NRS funds yet sees 25 percent of ESAcontracts.
-- A group of smaller beneficiaries of NRS and ESA funds may or may not move
Shares of ESA contractsshows great differences ineffectiveness of NRS funds
10,0 %
100,0 %
Shar
eo
fN
RS
fun
ds
12% 55%
Calculate their use of NRS
36%
Use of NRS funds2010
ESA contract volume2000-2010
-- A group of smaller beneficiaries of NRS and ESA funds may or may not moveto other categories in the future.
There are distinct differences across value chain segments and we will now turnto review these.
0,0 %
0,1 %
1,0 %
0,00010,011
Shar
eo
fN
RS
fun
ds
NRS ESA Ratio
1,5% 25%
0,00010,01
NRS ESA Ratio
6%
165

Perhaps?Hard to say how this willdevelop. SmallR&D who receives some NRSfunds and a lower proportion ofESA funds.
ESA onlyThose that engage directly withESA are some institutionalR&D and satellitecomponents manufacturers.Overall ESA contract volume isabout 8 percent.
NRS financing: ESA contracts:
20 %
30 %
40 %
50 %
0% 8%
Share of:
Section 2.1: Impacts
LaggardsLarge share ofR&D. These are other types ofR&D organizations than thosewho have better NRS to ESAfund ratio. They are more publicin their orientation and lessindustrial focused. Thecommercials here areequipmentwhich receives much NRS fundsbut less share of ESA contracts.
Cash CowsThese are also mostly satellitecomponents andinstitutional R&D.
2 %9 %2 %
12 %
0 %
10 %
20 %
30 %
40 %
50 %
4 %3 %
0 %
10 %
6% 25%
PwC 166
NRS onlyThese are almost exclusivelyinstitutional R&D but one or twocommercial firms in satellitecomponent or ground equipmentsegment
High maintenanceMostly pure commercial playersin this category.
The Earth observationservices feature heavily here. Alarge share for satellitecomponents/launchers and someground equipment producers.
0 %
15 %23 %
9 %
8 %9 %
22 %
0 %
10 %
20 %
30 %
40 %
50 %
36% 55%
Perhaps?Hard to say how this willdevelop. Small Institutional
who receives some NRSfunds and a lower proportion ofESA funds.
20 %
30 %
40 %
50 %
NRS financing: ESA contracts:
4% 1,5%
LaggardsLarge share of institutional
. These are other types ofR&D organizations than thosewho have better NRS to ESAfund ratio. They are more publicin their orientation and lessindustrial focused. Thecommercials here are groundequipment manufacturerswhich receives much NRS fundsbut less share of ESA contracts.
Satcom services
Earth observationservices
Ground equipment
Satellitecomponents/Launchers
26 %
5 %
18 %
7 %
0 %
10 %
20 %
30 %
40 %
50 %
2 % 1 %0 %
10 %
44% 12%
Other services
166
NRS onlyThese are almost exclusivelyinstitutional R&D but one or twocommercial firms in satellitecomponent or ground equipmentsegment.
InstitutionalR&D
7 %0 %
10 %
20 %
30 %
40 %
50 %
10% 0%

Understanding the ripple effect of ESA support
A key metric to gauge the success of the support schemes is the “ripple effect”.This attempts to measure additional sales generated by the ESA and NRSfunds. Data has been collected since the beginning of the schemes, through aconsistent methodology, and allowing for understanding the impact overtime.
While some countries have adopted similar approaches we don’t find that theconcepts are directly comparable. A recent OECD reports has a slide where itpresents these findings and Norway is ranked very high on this only second to
Section 2.1: Impacts
presents these findings and Norway is ranked very high on this only second tothe U.S. The underlying methods differ however, quite much, and we cannotcompare these prima face.
It is possible that the ripple effects reported in Norway are actually higher asNorwegian industry was mostly an “infant” space industry when this started.We would expect much impact in the early stages. That may not howeverentirely explain why the multiplier is currently nearly twice the levelsobserved in other countries and rising which doesn’t correspond with otherfindings on sales growth and market shares.
The equation aggregates sales from 1988 and support from 1985. A three yearshift is introduced to take account for lag times. Companies are surveyedannually.
Methodologically some issues should be noted. An important difficulty isthat we do not know how and if, firms have discounted the impact of ESAsupport over time. i.e.. is support from 1985 attributed 100 percent to sales in2010 or not? And would it be reasonable to attribute the whole amount over
PwC
2010 or not? And would it be reasonable to attribute the whole amount oversuch a long time period? Possibly not, but the key difficulty is that we don’t forsure whether firms implicitly report with a discount, or what an appropriatediscount rate would be.
The numbers need to be adjusted for inflation Currently the schemescompares values of a 1985 kroner with a 2010 kroner and this is incorrect.Unadjusted this will overestimate the multiplier. We present adjusted valueson the next page.
There are also possible self reporting biases but no alternative informationexists and this is as good as it gets.
167
Regarding interpretation it is important to note that increases in sales arenot identical with wealth creation. The latter, which is the objective of thepolicies, is a function of profits and labor costs.
A second point is that since the equation aggregates values over(increasingly) long time periods, it will become (increasingly) less sensitive toannual changes in outer years. Its “response time” will be slower. Itsusefulness as an indication of impact of current policies, to pick up changes in
Understanding the ripple effect of ESA support
The ripple effect equation takes account of all sales anddevelopment support since 1985
usefulness as an indication of impact of current policies, to pick up changes inrecent years, will be increasingly limited. We recommend it should besupplemented with a shorter-time approach to allow for a better short-timefeedback mechanism.
The indicator features centrally in policy discussions including inparliamentary papers. Some care is warranted in its presentation to ensurethat it is made clear that it is only an indication of ripple effect forcommercial firms that receive ESA contracts. It is not an indicator of the fullmoney cycle of support to ESA or space programs in general. ESA hasoverheads, the industrial return is less than one, and other than commercialactors also receive ESA funds. This leads to a net impact of total spacesupport that is lower than the multiplier alone indicates.
Figure 2.14: Illustration of ripple effect equation
167
All ”ESA generated” sales
1985 2010…..n
All ESA contracts and Space Center support
3 year shift
Ripple effect(Multiplier)

Considerable ripple effects are reported, on both space
Considerable impacts are observed. The multiplier is at 4,3 currently (2010)adjusted for inflation. There is a trend increase since the late 1990’s, havingdeclined in the first decade.
This could be an indication that space production does have tech transferimpacts or that ESA engagements successfully work to qualify firms forcommercial space markets. The indicator is supplemented by a range ofanecdotal examples that seem to support the concept. Few firms report little orno ripple effect and we will review the distribution on the next page.
Section 2.1: Impacts
Figure 2.15: Ripple effect multiplier 1989-2010 (Nominal and Constant PPIadjusted)
Considerable, and increasing multiplier impacts
The impact of inflation adjustment is not dramatic but lowers the estimatedvalue from 4,8 to 4,3 (2010). It would be important to introduce inflationadjustment for future presentation as the impact of unadjusted values willincrease over time. We have used PPI for manufacturing as this isrepresentative for where most funding has been.*
6
7
8
PwC
Source: NRS ripple survey; PwC analysis; PPI manufacturing adjusted (Eurostat). * PPI manufacturing index may overestimate inmanufacturing and possible also services.
168
0
1
2
3
4
5
1989 1994 1999 2004 2009
Mu
ltiplie
r
Inf lation adjusted
Nominal
The impacts can also be measured with regards to space – non-space sales. Itseems there is some more impact on space sales with a slight decline observedover the last decade. The impact is currently close to 50/50 meaning that ESAcontracts are likely to bring about additional space sales of about 2,2 times thecontract amount.
The numbers are remarkably consistent. We should keep in mind that thesurvey respondents have remained nearly the same throughout this period(about 27).
Considerable ripple effects are reported, on both space- and non-space related sales
It does not seem that the ESA ripple effect can explain the relative increase innon-space sales growth as the multiplier for non-space sales have remainednearly constant. As we recall, the share of non-space sales have increasedsignificantly more than space sales in the same period for the surveyed firms(see p 159). These could be sales unrelated to the ESA contracts.
Figure 2.16: Multiplier for space- and non-space sales 1989-2010(Nominal)
More impact on space sales multiplier
80%
Source: NRS ripple survey; PwC analysis; PPI manufacturing adjusted (Eurostat). * PPI manufacturing index may overestimate inflation on ground equipment prices but would be representative for space
168
50%
20%
1989 1994 1999 2004 2009
Non-space sales impact
Space sales impact

Firm median ripple effect at 3,5 compared to 4,3 for the total
Some range is seen in the distribution of impacts. Most firms however fallwithin proximity of the average at 4,3. There are some firms that report little orno impact, and there are a few that report significant multipliers i.e. 20 and 40.
We should keep in mind that the methodology has a certain positive bias.Negative impacts are not possible. Firms that have lost money on ESAcontracts, and not seen ripple effects, will have a negative impact but this willnot be picked up here. There is no indication that negative impacts aresignificant though they may exist.
Section 2.1: Impacts
Figure 2.17: Ripple effect multiplier by firm and total ESA generated sales1985-2010 (Nominal)
Most firms report within a similar range, but there are afew significant outliers
The frequency distribution of number of firms and total sales is quite close alsoindicating that the multiplier is quite consistent across the respondents.Seventy-five percent of firms, and similar on value basis, reports a multiplierless than 5 (nominal). The outlier firms with multipliers above 10 constituteabout 10 percent of total value of sales generated.
2 500
3 000
To
tal
sale
s(M
illi
on
NO
Kn
om
inal)
Firms
PwC
Source: NRS ripple survey; PwC analysis; PPI manufacturing adjusted (Eurostat). * PPI manufacturing index may overestimate inmanufacturing and possible also services.
169
-
500
1 000
1 500
2 000
0 10 20 30 40
To
tal
sale
s(M
illi
on
NO
Kn
om
inal)
Multiplier
Firm level analysis may be a better indication of the expected value whenengaging to support a particular firm. This reveals some distance betweenmean and median numbers indicating the distribution is somewhat skewed ascan be seen on the scatter plot.
The median value shows that half the companies have multipliers above/belowthis particular value in a given year. The mean number shows the arithmeticaverage of all multipliers in a given year.
The mean value is quite sensitive to the two outliers. Beyond those two
Firm median ripple effect at 3,5 compared to 4,3 for the total
The mean value is quite sensitive to the two outliers. Beyond those twocompanies with extreme multipliers the mean and median values are quiteclose and at about 3,5 currently.
Figure 2.18: Firm level mean and median multipliers (constant 2010 PPI)
Firm level data shows more variation and lower medianvalues
8
10
12
Source: NRS ripple survey; PwC analysis; PPI manufacturing adjusted (Eurostat). * PPI manufacturing index may overestimate inflation on ground equipment prices but would be representative for space
169
-
2
4
6
8
1989 1993 1997 2001 2005 2009
Mu
ltiplie
r
Median
Mean

Services multiplierrising fast and groundequipment sliding
The multiplier shows divergence across different value chain segments. There are differences in levelsand shifts over time. The key shift is between Services and Ground Equipment whereby Services arerising fast and Ground Equipment is sliding.
Note that the services shown here include only Earth Observation Services. High growthcommunications services firms have received some support but do not respond to the annual rippleeffect surveys.
Satellite components and Launchers have seen a rise although at lower levels than the services segment.
R&D multiplier is also sliding. These are R&D institutes who are engaged with much applied research
Section 2.1: Impacts
8
10
equipment sliding funded through public or private sources. Their additional income may stem from other public financedprograms, i.e.. FP7, or industrial sources. These institutions capture about 28 percent of the ESAcontracts for science/institutional R&D. The other 72 percent is captured by science or public agencies.
Scientific institutions and public agencies with ESA contracts do not have ripple effects of this nature i.e.increased sales. The benefits of their participation is related to other factors.
Figure 2.19: Multiplier by value chain segment 1991
Much difference of multipliers among value chain segments
PwC
0
2
4
6
8
1991 1996
Mu
ltip
lier
170
Source: NRS ripple survey data; PwC analysis.
The multiplier shows divergence across different value chain segments. There are differences in levelsand shifts over time. The key shift is between Services and Ground Equipment whereby Services arerising fast and Ground Equipment is sliding.
Note that the services shown here include only Earth Observation Services. High growthcommunications services firms have received some support but do not respond to the annual ripple
Satellite components and Launchers have seen a rise although at lower levels than the services segment.
R&D multiplier is also sliding. These are R&D institutes who are engaged with much applied researchfunded through public or private sources. Their additional income may stem from other public financedprograms, i.e.. FP7, or industrial sources. These institutions capture about 28 percent of the ESAcontracts for science/institutional R&D. The other 72 percent is captured by science or public agencies.
Scientific institutions and public agencies with ESA contracts do not have ripple effects of this nature i.e.increased sales. The benefits of their participation is related to other factors.
Multiplier by value chain segment 1991-2010 (Constant 2010 PPI)
Much difference of multipliers among value chain segments
1991-2010
CAGR
1996 2001 2006
170
Services
Groundequipment
Satellitecomp./Launchers
R&D/Institutional
5,4%
-4,2%
2,2%
-4,2%
2010

Net uplift of about 16 percent in increased economic activity in Norway for ESA expenditure
This implies gains of about 16 percent + economy wide technology benefits thatare unknown. Following the flow of funds from government budget we canmodel a scenario based upon the average ratios of the last 10 years. That wouldimply the following scenario:
• Distribution between ESA and Industrial development fund of 5/95
• 58 percent of ESA contribution is returned as contracts (though lower sharein recent years)
• Average distribution across value chain actors
Section 2.1: Impacts
Figure 2.20: Estimated impacts of flow of funds through ESA and back to Norway
A budget allocation of 100 provides an uplift of economic activity in Norway of 0,16 (+ economy wide technological gains)
• Average distribution across value chain actors
• Contracts from ESA and multiplier effects by segment
12
11
Space funds5
Allocation Channel Contract and multiplier through ESA
PwC 171
11
22
15
Government100
ESA95
-40(Overhead)
10060
• Import content of industry at average 40 percent**
• Increase of Norwegian economic activity is 34 (less cost of tax at 30)
Standard cost of tax coefficient is 30% (Min Finance standard) which should bededucted from this. Economy wide technology benefits apply but are unknown.
The R&D multiplier takes account of the distribution betweenscience/public/applied research and hence the net impact on additional sales islower than for the applied institutes alone.
Net uplift of about 16 percent in increased economic activity in Norway for ESA expenditure
A budget allocation of 100 provides an uplift of economic activity in Norway of 0,16 (+ economy wide technological gains)
lower than for the applied institutes alone.
Socio-economic gains are analyzed in a separate section below.
85
66
Contract and multiplier through ESANorwegianeconomy
Services
Ground equipment
171
66
75
18
-98(import)
Ground equipment
Satellitecomp./Launchers
R&D/Institutional
244
-100(initial)
-30 (tax)
46-30 +x ≈ ≥16Gross Tech gainTax cost Net

Public servicePublic serviceimpacts

Understandingthe usage
Before turning to assessments of impacts it is helpful to understand the patterns of use. This pertains touse of earth observation satellites. Agencies may also be using communications satellites and GPSsystems which is not recorded.
Several patterns can be observed:
• Use is increasing. Information from satellites is used by more agencies and from an increasingnumber of satellites.
• There is much use of both public and commercial satellites. The four ESA earth observation (science)satellites are used by a number of agencies. About an equal number uses the American satellites. 6 of14 public satellites being used are American, 8 are European.
Section 2.1: Impacts
the usage14 public satellites being used are American, 8 are European.
• Commercial users are predominantly using the RadarsatThe number of agencies using Radarsat data increased to 14 in 2011. The highsatellites are also popular.
• Public satellites are used more for research purposes. These have other sensors and enables differenttypes of measurements. Private satellites are used much for surveillance but also for a variety of otherpurposes such as surveying cultural landscapes and forestry.
Satellites used
Figure 2.21: Use of satellites
More agencies and more satellites are being used for earth observation
PwC 173
14 15 16
2006
Satellites used
Before turning to assessments of impacts it is helpful to understand the patterns of use. This pertains touse of earth observation satellites. Agencies may also be using communications satellites and GPSsystems which is not recorded.
Several patterns can be observed:
Use is increasing. Information from satellites is used by more agencies and from an increasing
There is much use of both public and commercial satellites. The four ESA earth observation (science)satellites are used by a number of agencies. About an equal number uses the American satellites. 6 of14 public satellites being used are American, 8 are European.14 public satellites being used are American, 8 are European.
Commercial users are predominantly using the Radarsat-2 data for which Norway has a subscription.The number of agencies using Radarsat data increased to 14 in 2011. The high-resolution opticalsatellites are also popular.
Public satellites are used more for research purposes. These have other sensors and enables differenttypes of measurements. Private satellites are used much for surveillance but also for a variety of otherpurposes such as surveying cultural landscapes and forestry.
Agencies using satellites
Figure 2.21: Use of satellites and agencies using them in Norway (2010)
More agencies and more satellites are being used for earth observation
173
16
2022
2010
13
18 18 1921
2006 2010
Agencies using satellites
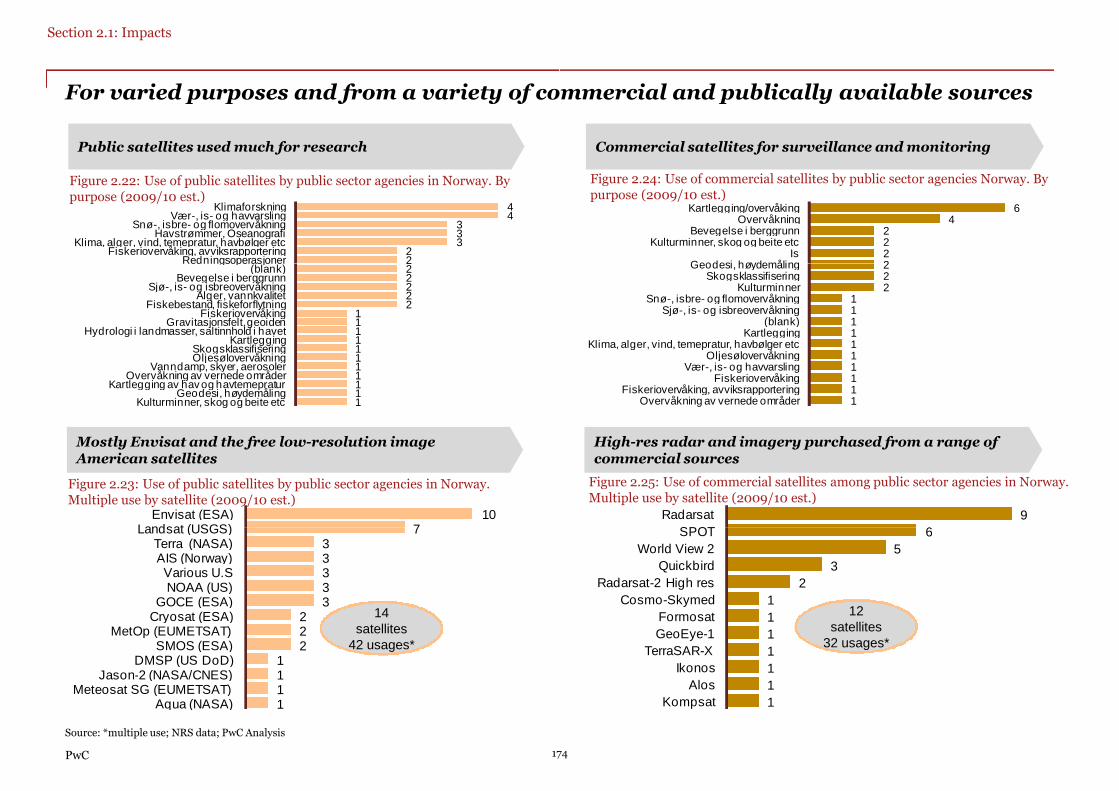
44
333
222
KlimaforskningVær-, is- og havvarsling
Snø-, isbre- og flomovervåkningHavstrømmer, Oseanografi
Klima, alger, vind, temepratur, havbølger etcFiskeriovervåking, avviksrapportering
Redningsoperasjoner(blank)
For varied purposes and from a variety of commercial and publically available sources
Figure 2.22: Use of public satellites by public sector agencies in Norway. Bypurpose (2009/10 est.)
Public satellites used much for research
Section 2.1: Impacts
222222
11111111111
Redningsoperasjoner(blank)
Bevegelse i berggrunnSjø-, is- og isbreovervåkning
Alger, vannkvalitetFiskebestand, fiskeforflytning
FiskeriovervåkingGravitasjonsfelt,geoiden
Hydrologi i landmasser, saltinnhold i havetKartlegging
SkogsklassifiseringOljesølovervåkning
Vanndamp, skyer, aerosolerOvervåkning av vernede områder
Kartlegging av havog havtemepraturGeodesi, høydemåling
Kulturminner, skog og beite etc
107
Envisat (ESA)Landsat (USGS)
Figure 2.23: Use of public satellites by public sector agencies in Norway.Multiple use by satellite (2009/10 est.)
Mostly Envisat and the free low-resolution imageAmerican satellites
PwC
733333
222
1111
Landsat (USGS)Terra (NASA)AIS (Norway)Various U.SNOAA (US)
GOCE (ESA)Cryosat (ESA)
MetOp (EUMETSAT)SMOS (ESA)
DMSP (US DoD)Jason-2 (NASA/CNES)
Meteosat SG (EUMETSAT)Aqua (NASA)
Source: *multiple use; NRS data; PwC Analysis
174
14satellites
42 usages*
64
2222
Kartlegging/overvåkingOvervåkning
Bevegelse i berggrunnKulturminner, skog og beite etc
IsGeodesi, høydemåling
For varied purposes and from a variety of commercial and publically available sources
Figure 2.24: Use of commercial satellites by public sector agencies Norway. Bypurpose (2009/10 est.)
Commercial satellites for surveillance and monitoring
222
1111111111
Geodesi, høydemålingSkogsklassifisering
KulturminnerSnø-, isbre- og flomovervåkning
Sjø-, is- og isbreovervåkning(blank)
KartleggingKlima, alger, vind, temepratur, havbølger etc
OljesølovervåkningVær-, is- og havvarsling
FiskeriovervåkingFiskeriovervåking, avviksrapportering
Overvåkning av vernede områder
9
6
Radarsat
SPOT
Figure 2.25: Use of commercial satellites among public sector agencies in Norway.Multiple use by satellite (2009/10 est.)
High-res radar and imagery purchased from a range ofcommercial sources
6
5
3
2
1
1
1
1
1
1
1
SPOT
World View 2
Quickbird
Radarsat-2 High res
Cosmo-Skymed
Formosat
GeoEye-1
TerraSAR-X
Ikonos
Alos
Kompsat
174
12satellites
32 usages*

But there are only a few high volume usersin the public sector
There are four agencies with persistent professional use integrated intooperations. Those are: the defense institutions including the Coast Guard;Coastal Authority; Geological Survey and the Meteorological institute.
Defense, Coast Guard and Coastal Authority uses the information for continuousmonitoring of events. Civilian purposes include oil spill detection, andmonitoring of fisheries. These have advanced operational systems that integrates
Section 2.1: Impacts
monitoring of fisheries. These have advanced operational systems that integratesthe satellite data with other sensors (seed page 144).
The geological survey uses data much for identifying risk areas for landslides.There is also experimental developments to use radar data to survey roads andrailroads for landslides.
The Met institute mostly accesses the EUMETSAT and American met satellites.Weather forecasts uses sensory information form many sources, but satellitedata has become very important. It also operates an ice monitoring service andoccasionally accesses radar sat data for this purpose. It also operates its ownground station located in Oslo tracking both geostationary and polar orbitingsatellites.
Beyond these four there are several others. Some are R&D institutes who accessinformation for scientific or development work. Other agencies are mostlytesting and experimenting.
Some are quite advanced: i.e. the Cultural Heritage agency developed software
PwC 175
Some are quite advanced: i.e. the Cultural Heritage agency developed softwareapplications to identify cultural heritage sites using data from high resolutionoptical satellites. It is reported to successfully have discovered previouslyundiscovered sites.
The total usage volumes and precise costs cannot be ascertained. Detailed dataare available only for Radarsat and that is presented above.
Next we turn to a discussion of impacts.
Figure 2.26: Illustration of important government users of satellitedata
Four heaviest public sector agency users of satellite data inNorway
Surveillance and monitoring including offisheries
Defense,including CoastGuard
Surveillance and monitoring activities forship traffic, incidents, oil-spill detection,harbor management.
Risk and emergency applications.Surface monitoring of slope instabilities,surface movements in cities (bridges,tunnels, constructions); and waterreservoir and dam monitoring.
CoastalAuthority
GeologicalSurvey (NGU)
Specialized met data are acquired
175
Much lower volume and lower frequency users include: NansenCentre for Remote Sensing; Water Resources and Energy directorate;Directorate for Cultural Heritage; Forestry and landscape Institute; Polarinstitute; Directorate of Fisheries; various scientific institutions.
Specialized met data are acquiredthrough EUMETSAT and US systems.Radar data for ice monitoring are alsoacquired through EUMETSAT.
Met institute

We include a discussion of how to understand the benefits and value of satelliteinformation for public agencies in Norway. There is a more formal cost-benefitassessment in the next section focusing on the industry impacts on the economy.The purpose of this discussions is to provide insights by:
• Understanding the value of information from satellites. There are no
Determining the value of satellite information
Section 2.1: Impacts
• Understanding the value of information from satellites. There are nodirect benefits stemming from satellites. The satellites provide information –and the benefits depend upon how the information is acted upon.
• Gain insight into how the benefits weigh against the costs. Theanalysis does show considerable differences across activities and it may beuseful to focus both on cost aspects, and on benefit enablers in the future.
There are limits to how useful formal economic modeling is for this purpose asthe uncertainties and constraints of assumptions are very high.
The approach presented here is still a valuable concept and could serve as aframework for guiding decisions on future investments. Its being used by a.o theEU in determining GMES priorities.
Source for this section: An influential work on the value of information for policy is by Nordhaus.Nordhaus WD. The value of information. In: Krasnow, RP, editor, Policy aspects of climate
PwC 176
Nordhaus WD. The value of information. In: Krasnow, RP, editor, Policy aspects of climateforecasting. Proceedings, May 4. Washington, DC: Resources for the Future;1986: p.29–34.
Very many studies have built upon this since and expanded the insights into the subject.Particularly in the context of EU GMES preparations has there been relevant work focusing onunderstanding the benefits of satellite information. An important conceptual paper is the work byMacauley: M. K. Macauley, The Value of Information: A Background Paper on measuring theContribution of Space-Derived Earth Science Data to National Resource Management, Resourcesof the Future, 2005.
The discussion in our study is based upon an elegant application of the subject by consulting firmBooz & co from November 2011 in an CBA assessment for the EU GMES commissioned by DGENTR. We will also draw upon findings from an empirical focused PwC study from 2006 on cost-benefits of GMES. We seek to apply these concepts and gain insights into policy implications forNorway.
PwC analysis. The decision parameter model presented here is not discussed in the abovementioned literature but derived from related concepts.
Determining the value of satellite information
Quantifying the value of information is helpful for comparisons againstalternatives. Determining the value of information is complex.
A range of outcomes is likely even in the case of fairly closed system contexts likethe dedicated Norwegian used satellite systems (i.e. Radarsat and AIS).Introducing additional systems that Norway has access to: i.e. ESA, NASA,EUMETSAT and Commercial satellites further expands the range of outcomes toEUMETSAT and Commercial satellites further expands the range of outcomes tothe extent that an overall analysis does not become meaningful.
It is however helpful for structuring an analysis or decision regardingincremental investments in new systems or applications. We will turn to a reviewof Norwegian applications over the next pages.
The approach is based upon modern information economics. The key findingform this is that the value of information can be determine, and that it isremarkably consistent across sectors, and there is some understanding of whatcauses variation.
Across a range of sectors and multiple studies it is found that thevalue of better or perfect information is about 1 percent of totaloutput.***
There are variations: For example studies on U.S. meteorological services findthe value to range between 3-6 percent.* A PwC study on GMES satellite value ofinformation for illegal fishing found the value to be as high as 10 percent. This
176
information for illegal fishing found the value to be as high as 10 percent. Thiswas driven by deterrence effects and effective response mechanisms.**
An assumption of across-the-board 1 percent value of information has also beenapplied in recent cost-benefit assessments for the EU on GMES.***
Source: *NOAA: “An Investigation of the Economic and Social Value of Selected NOAA Data andProduct for Geostationary Operational Environmental Satellites (GOES)”, February 2007. **PwC2008;***Booz & Co 2011.

Three step decision process determining the value of information
The following concept is helpful to assess the value of satellite information fornew applications. In many cases, the value is known. i.e. mapping. The value ofinformation is known to the mapping authorities and it is only a question ofassessing the cost efficiencies of satellite imagery versus aero imagery. Foremerging applications however the value is not fully understood and there aredifficulties in determining priorities and allocating expenditure.A three-step process can be applied to assess the value of information andcompare alternatives:
1. Understanding the importance of a decision. This is driven by two
Section 2.1: Impacts
1. Understanding the importance of a decision. This is driven by twofactors. (I) Risks, which is a factor of probability and consequence; and (ii)Response options. In some cases, the probabilities and consequences areknown (i.e. oil spills) while in other cases the probabilities cannot bedetermined (landslides) If risks are perceived as high and response optionsexists, there will be a willingness to pay.
Figure 2.27: Decision process and parameters for determining investments in satellite information
Incremental
High High
Importance of decision Value of satellite information! @
PwC 177
Incrementalinformation
content value
Low
Effectiveness ofresponse options
Low High
Risks
Low
Low
Importance of
Three step decision process determining the value of information
2. Incremental information value from satellites. This relates tosubjective beliefs about probabilities of events. If subjective beliefs aboutprobability are at extremes, there may be higher willingness to pay. Ifother, substitute information sources exists, there may be less subjectivebeliefs and incremental value of satellite information is lower.For example, there are few information sources available about activitiesin the arctic and Barents regions. Hence, we could expect Norwegianauthorities to value information from satellites highly. Norwegian Barentspolicy would still exist without satellite information, but policy had to be
Decision process and parameters for determining investments in satellite information Conceptual
Cost of
High
Value of satellite informationCost-efficiency of satelliteinformation#
policy would still exist without satellite information, but policy had to bebased upon other sources of information. Other sources exists but theymay be less accurate or timely. The City of Oslo has many sources ofinformation, there is little uncertainty, and it does not perceive anincremental value added of monitoring traffic from satellites.
3. Cost-efficiency assessment by traditional methods.
177
Cost ofalternative
informationsources
Value of informationHigh
Low
Importance ofdecision
Low High

Radar satellites are seen as highly effective in detecting oil spills. The algorithmsfor this have evolved over decades. i.e. there are examples of the alarms beingtriggered by whale carcasses seeping fish oil.* Ship identities can be determinedin combination with AIS or the fishing vessel identification system. Expertsclaim that the deterrent effect is considerable. Over the last decade theregulatory framework has also been made more effective, thereby increasing thedeterrence effect, and there are now significant fees for pollution.
Value of information for oil spill detection has been found to be quite high across
The value of satellite information for oil spill detection is between 1 and 5 millionannually
Section 2.1: Impacts
Value of information for oil spill detection has been found to be quite high acrossEurope. About 10 percent is estimated. We apply a more conservative range hereas the non-satellite monitoring systems in the North Sea are quite extensive.Satellite systems only add an increment to those existing systems and they mayactually be most effective outside of the North Sea, but there is also less risk ofoil spills in those areas.
Incidents m3
Oil
81 244
Cleanup costs (MNOK)**
106
18Norwegian
Sea168
Figure 2.28: Estimated range for value of information of detecting oil spills based upon pre Radarsat
PwC 178
Source: *Coastal Authority interview; Coastal Authority data;**440000 NOK per ton equivalent to estimates in IMO: “Report on60/17, 18th December 2009.; ***PwC 2008 CBA GMES; PwC analysis
60
2
1,3
Sea
North Sea
Barents Sea
Skagerrak
67
8
0,2
The value of satellite information for oil spill detection is between 1 and 5 million
In determining the cost baseline we apply a time period before Radarsat-2 wasemployed to avoid any discount impact of the deterrent effect. There has been ashift in the pattern since then. A reduction has been seen in the Norwegian Seaand the North Sea (Oil Installations) is the most polluted area. There are hardlyany oil spills detected in the Barents Sea, before or after Radarsat-2 deployment.
Cleanup costs are based upon international averages.** Costs are reported toreach 1 million NOK a ton if the oil reaches shore, and ten times lower if handledat source.*
Norwegian Sea
Value of information (MNOK)
VOI 1% VOI 2,5% VOI 5%
1 2,7 5,3
Cleanup costs (MNOK)**
Estimated range for value of information of detecting oil spills based upon pre Radarsat-2 incidents (average of 2004-06)
at source.*
Most incidents are reported by the actors themselves. About two a month areuniquely identified by satellites.* We apply no discount for this in the estimationassuming that this could be related to the deterrent effect.
North Sea
Barents Sea
Skagerrak
178
Source: *Coastal Authority interview; Coastal Authority data;**440000 NOK per ton equivalent to estimates in IMO: “Report on the Correspondence Group on Environmental Risk Evaluation Criteria, MEPC
1 2 3Million NOK 4

The satellite information is also used to monitor illegal fishing. Radar satellitedata in combination with the fishing vessel information systems, and in somecases AIS, are reported to have been helpful. The fishing vessel system is basedupon transmitting vessel data through communications satellites but is notreviewed in this report.
The value of satellite information for detecting illegal fishing is between 11 and 56million NOK annually
Section 2.1: Impacts
reviewed in this report.
Illegal fishing has been a problem in the Barents region home of some of theworlds largest fish stocks. Overfishing is an issue.
Value of information has been estimated to be about 10 percent in other recentwork.* Lower estimates were applied in the 2011 GMES study. We apply aconservative estimate as we did for oil detection.
Kilo Tons Value (MNOK)
81 1100
Output value(MNOK)*
1100
Figure 2.29: Estimated range for value of information of illegal fishing upon pre Radarsat
PwC
912
200
Cod
Haddock
179
Source: CG interviews, Norwegian Fisheries Directorate; SSB; PwC GMES 2008;PwC Analysis
87
24
Cod
Haddock
The value of satellite information for detecting illegal fishing is between 11 and 56
A difficulty in establishing the cost baseline is that is that illegal fishing in theregion is currently reported to have been reduced to zero. This from a range ofabout of 80.ooo-110.000 tons of cod during 2002-2006. This has been a policypriority and a range of initiatives have been implemented. The satellitesurveillance system is believed to be effective but operational details are
Value of information (MNOK)
VOI 1% VOI 2,5% VOI 5%
11 28 56
Output value(MNOK)*
Estimated range for value of information of illegal fishing upon pre Radarsat-2 incidents (average of 2004-06 COD; 05-07 Haddock)
surveillance system is believed to be effective but operational details areclassified.
To avoid discounting the deterrent effect we use baseline data from 2004-06and 2005-07 for two species. There are data reliability issues anduncertainties. 2010 prices are applied.
The range is found to be between 11 and 56 million NOK annually. The highend estimate would double if an 10 percent VOI is applied.
Cod
Haddock
179
10 20 30Million NOK
VOI 1% VOI 2,5% VOI 5%
40 50
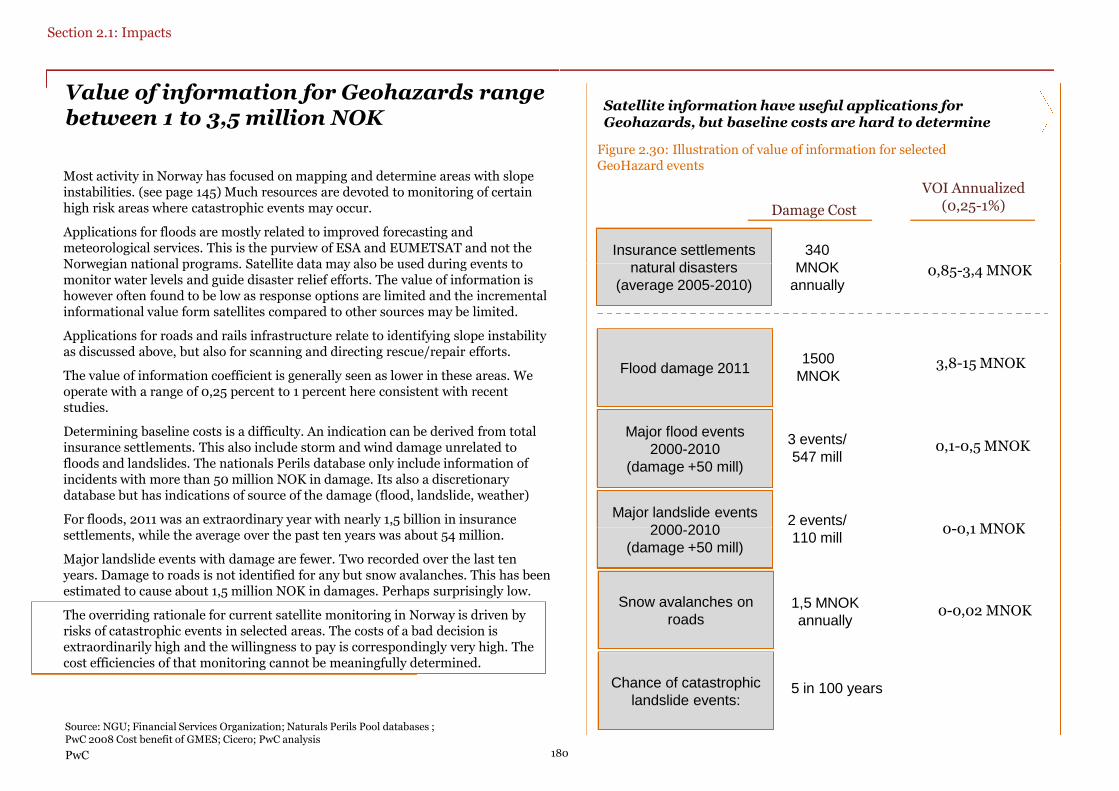
Value of information for Geohazards rangebetween 1 to 3,5 million NOK
Most activity in Norway has focused on mapping and determine areas with slopeinstabilities. (see page 145) Much resources are devoted to monitoring of certainhigh risk areas where catastrophic events may occur.
Applications for floods are mostly related to improved forecasting andmeteorological services. This is the purview of ESA and EUMETSAT and not theNorwegian national programs. Satellite data may also be used during events to
Section 2.1: Impacts
Norwegian national programs. Satellite data may also be used during events tomonitor water levels and guide disaster relief efforts. The value of information ishowever often found to be low as response options are limited and the incrementalinformational value form satellites compared to other sources may be limited.
Applications for roads and rails infrastructure relate to identifying slope instabilityas discussed above, but also for scanning and directing rescue/repair efforts.
The value of information coefficient is generally seen as lower in these areas. Weoperate with a range of 0,25 percent to 1 percent here consistent with recentstudies.
Determining baseline costs is a difficulty. An indication can be derived from totalinsurance settlements. This also include storm and wind damage unrelated tofloods and landslides. The nationals Perils database only include information ofincidents with more than 50 million NOK in damage. Its also a discretionarydatabase but has indications of source of the damage (flood, landslide, weather)
For floods, 2011 was an extraordinary year with nearly 1,5 billion in insurance
PwC 180
settlements, while the average over the past ten years was about 54 million.
Major landslide events with damage are fewer. Two recorded over the last tenyears. Damage to roads is not identified for any but snow avalanches. This has beenestimated to cause about 1,5 million NOK in damages. Perhaps surprisingly low.
The overriding rationale for current satellite monitoring in Norway is driven byrisks of catastrophic events in selected areas. The costs of a bad decision isextraordinarily high and the willingness to pay is correspondingly very high. Thecost efficiencies of that monitoring cannot be meaningfully determined.
Source: NGU; Financial Services Organization; Naturals Perils Pool databases ;PwC 2008 Cost benefit of GMES; Cicero; PwC analysis
Figure 2.30: Illustration of value of information for selectedGeoHazard events
Satellite information have useful applications forGeohazards, but baseline costs are hard to determine
Insurance settlementsnatural disasters
340MNOK
Damage Cost
VOI Annualized(0,25-1%)
0,85-3,4 MNOKnatural disasters(average 2005-2010)
MNOKannually
Major landslide events2000-2010
2 events/
Flood damage 20111500
MNOK
Major flood events2000-2010
(damage +50 mill)
3 events/547 mill
0,85-3,4 MNOK
3,8-15 MNOK
0,1-0,5 MNOK
0-0,1 MNOK
180
Snow avalanches onroads
1,5 MNOKannually
Chance of catastrophiclandslide events:
2000-2010(damage +50 mill)
2 events/110 mill
5 in 100 years
0-0,1 MNOK
0-0,02 MNOK

This review has mostly focused on situations where the important parameter isto understand the incremental value offered by satellites. There will be othersituations where the efficiency of use of satellites can be determined by moretraditional techniques. i.e. shift from airborne to satellite based cartography. Theeconomics of such choices can be determined with much less uncertainty thanwhat is shown here
The focus on oceanic areas seems rational within the limits of this economic
Focus on prioritization and benefit enablers
Section 2.1: Impacts
The focus on oceanic areas seems rational within the limits of this economicassessment. Land focused programs offer less obvious benefits and expansionhere should be viewed with some care.
Some observations on costs and benefits:
CostsThe cost estimate presented is at the high end and includes the full capability ofradarsat-2, AIS and national development programs. (see page 153)Some attention could be paid to the expenditures.
In the near future the cost-structure is likely to be impacted by higher costs forradar data unless a new equally beneficial agreement is found. Current marketprices exceeds Norway’s costs with about 100 percent. Attention is currently paidto this issue but the expected outcome is probably increased costs.
Cost reductions through getting access and priorities assigned from EU GMESSentinels will be important. They have capacities which overlaps with current
PwC 181
Sentinels will be important. They have capacities which overlaps with currentuse of Radardata. Full substitution is not expected and there will be a need fordedicated resources. GMES access and benefits will also be offset by costs ofNorwegian contributions into the larger program.
Longer term, other government wide cost reduction measures such as collectivepurchasing arrangements, central databases etc should be considered as demandexpands. This is possibly mostly relevant longer-term when costs for satelliteinformation will be reduced. Other applications will emerge y then that currentlyare not economically viable.
Benefits
Agency and sector: Challenges to increase the value of satellite information ismostly about strengthening the response mechanisms. Space programs canmostly assist in improving capability to understand incremental value offeredby satellites, and to access cost effective information.
Space programs: GMES readiness will be important to help realize benefitsfrom the systems which EU will provide. GMES will offer possibilities to
CostsValue of
information
from the systems which EU will provide. GMES will offer possibilities toincrease benefit realization in Norway without much incremental costs. Manyapplications can be expected to offer low value of information and will only bejustifiable if the information is provided at low or no incremental cost.
A strategy for broader commercial involvement and value added creation couldbe considered to help offset costs and realize benefits. Much of the Norwegianapplication is advanced but has only involved some few selected providers.There are markets evolving in Europe and the U.S and these are largelysupported by home country government demand.
181
30-35million
13-65million

Socio-economicimpacts

Assessing the socio-economic impacts of Norway’s participation in ESA and the nationalsupport funds
Objective
The objective of this part of the study is to assess the socio-economic impacts(costs and benefits) of Norway’s participation in ESA and the national supportfunds between 2004 and 2010 and to determine whether this space-relatedexpenditure has led to a net cost or a net benefit to the Norwegian economy. Morespecifically:
Section 2.1: Impacts
specifically:
1. Participation in ESA. ESA mandatory programs (General Budget -
management and basic technology - and the Science budget, financed on
GDP basis) and the voluntary program.
2. National support funds. The funds managed by the Norwegian Space
Centre for a range purposes, including dedicated programs for industrial
development, earth observation and learning.
Methodology
The methodology used is Cost-Benefit Analysis (CBA), based on Norwegiangovernment and European Commission impact assessment guidelines, establishedeconomic principles and international best practice (e.g. UK government HMTreasury’s Green Book).
PwC
Data sources include the NSC, the NSC’s Ripple Effects survey, responses to abespoke PwC/LE survey and other official Norwegian sources.
A detailed Excel-based economic model underlies the analysis.
A non-technical description of the analysis is presented on the subsequent slides.A more detailed technical description is provided in the Appendix.
183
economic impacts of Norway’s participation in ESA and the national
This analysis is based on the 25 enterprises (1 of the 26 enterprises did not providedata) that are surveyed as part of the Ripple Effects analysis (more detailsprovided later). A supplementary bespoke survey of these enterprises was carriedout to obtain additional information to permit the Cost-Benefit Analysis.
Details on method
A comprehensive guide and methodology is provided in the annex.A comprehensive guide and methodology is provided in the annex.
183

Important factors in the analysis
•Expenditure: Funding of the European Space Agency (ESA), the Norwegian Space Centre (NSC) and its support scheme (NSCSS)•Research and development/innovation, ESA contracts, ESA programmes•Sales, jobs, revenues, profits, salaries, consumer expenditure
What
Section 2.1: Impacts
•Costs: From 2004 to 2010•Benefits: Direct effects are valued from 2004 to 2010; Indirect effects are valued from 2007 to 2013,indirect effect manifestation (as per the Ripple Effects analysis)
When
•Norwegian Ministry of Trade and Industry, Norwegian Space Centre (NSC), ESA•Norwegian enterprises that win ESA contracts, receive NSC support, supply to Norwegian space sector enterprises undercontract with ESA or use ESA outputs to improve their own products or services
•Research institutes that use the results of space-related research•Norwegian students•Non-Norwegian entities (leakage from the Norwegian economy)
Who
PwC
•Taxation: Corporation tax, income tax, value added tax•Post-tax worker expenditure: Retailer sales revenues•Post-tax profits: Retained earnings•Productivity enhancement and spillovers•Utility benefits to end-users•Attractiveness of careers in Science, Technology, Engineering and Mathematics (STEM)•Competitiveness of the Norwegian economy
How
and London Economics 184
Expenditure: Funding of the European Space Agency (ESA), the Norwegian Space Centre (NSC) and its support scheme (NSCSS)Research and development/innovation, ESA contracts, ESA programmesSales, jobs, revenues, profits, salaries, consumer expenditure
10; Indirect effects are valued from 2007 to 2013, allowing a 3 year lag forindirect effect manifestation (as per the Ripple Effects analysis)
Norwegian Ministry of Trade and Industry, Norwegian Space Centre (NSC), ESANorwegian enterprises that win ESA contracts, receive NSC support, supply to Norwegian space sector enterprises undercontract with ESA or use ESA outputs to improve their own products or services
related research
Norwegian entities (leakage from the Norwegian economy)
Taxation: Corporation tax, income tax, value added tax
Attractiveness of careers in Science, Technology, Engineering and Mathematics (STEM)
184

Both direct and indirect costs and benefits are considered
First we consider the direct effects of this funding:
If an enterprise is successful with a bid for an ESA contract, it will lead to adirect increase in the sales turnover of the ESA contractor, yielding profit (orloss), and supporting related employment, compensated through salaries. Theafter-tax, or disposable, income of the workers will lead to an increase inconsumer expenditures in the economy, with knock-on ‘multiplier’ effects.
Section 2.1: Impacts
consumer expenditures in the economy, with knock-on ‘multiplier’ effects.
There will also be a direct increase in the sales turnover, profit (loss), employmentand salaries of Norwegian suppliers that supply inputs to the ESA contractor infulfillment of the ESA contract.
The socio-economic impacts of these direct effects are:
• Job creation. Whilst increased man-years is estimated as an output in itself,the value of employment created is monetized through wages/salaries, whichare decomposed into income tax and expenditure of disposable income (valueadded tax and retailer sales revenues), see below.
• Income tax is charged on the salaries of workers fulfilling ESA contracts,both in the ESA contractor and their suppliers.
• Value added tax is levied on the expenditure of workers’ disposable (after-tax) income on goods and services.
• Retailer sales revenues are the post-VAT revenues related to the
PwC
• Retailer sales revenues are the post-VAT revenues related to theexpenditure of workers’ disposable income on goods and services.
• Corporation tax is charged on any profit that an ESA contractor and theirsuppliers earn on ESA contract revenue.
• Retained earnings are post-Corporation tax profits.
• There is also likely to be an impact on the effectiveness and efficiency of theESA contractors and their suppliers, through a range of productivity, skillsand efficiency gains, which in turn leads to lower cost and increasedcompetitiveness of the Norwegian economy.
and London Economics 185
Both direct and indirect costs and benefits are considered
There are also indirect effects of the funding:
The enhanced technical and innovative capabilities, expanded contacts andknowledge base and ESA flight heritage gained as a result of the national supportfunds and ESA contracts should allow enterprises to improve their competitiveposition, facilitating increased sales. Such sales may take two forms:
• There may be demand for the products and/or services provided to ESA undercontract from other enterprises within the space sector or other spaceagencies; or
• New, or adapted, products and/or services based on the technology of thoseprovided to ESA under contract, sold to enterprises outside the spacesector (e.g. solar cells developed for satellite use, adapted for earth-baseduse).
Each type of indirect, or secondary, sales is likely to lead to a direct increase in thesales turnover, profit (loss), employment and salaries of Norwegian suppliers.
The socio-economic impacts of the indirect effects mirror those of thedirect effects.
Unfortunately, not all suppliers are Norwegian, and therefore some of thebenefits that could accrue to Norway are lost to other economies (leakage).
Furthermore, research facilities, universities and high technologyFurthermore, research facilities, universities and high technologyenterprises represent end-users that benefit from Norway’s ESA participationthrough usage of the ESA program outputs, earth observation data andany innovative space-inspired technologies.
The fact that Norway plays an important role in space could also mean thatstarting a career in Science, Technology, Engineering or Mathematicsbecomes more appealing.
185

Difference between the Ripple Effects multiplier and the cost
The Ripple Effects multiplier
The Norwegian Space Centre has run an annual data collection exercise withESA contractors and support fund recipients since 1985, with a consistentmethodology, called the ‘Ripple Effects’ survey.
The objective of the Ripple Effects analysis is to understand the impact of ESA
Section 2.1: Impacts
The difference between the two
The Ripple Effects Multiplier focuses on the value of sales as benefits, rather than considering the wealth created (e.g. salaries, productivity improvemenprofits) through socio-economic impacts. There is no consideration of additivity relative to the counterfactual. There is also n
The objective of the Ripple Effects analysis is to understand the impact of ESAsupport on total sales, separated into space- and non-space-related. The primaryoutput of the analysis is the Ripple Effects Multiplier, defined as aggregatesales from 1988 to 2010 divided by aggregate support from 1985 to 2007. Notethat a three year shift is introduced to take account for lag times.
The Ripple Effects Multiplier is calculated as the ratio of the non-deflated andnon-time adjusted sum of ESA generated sales (1988-2010) relative to the non-deflated and non-time adjusted sum of ESA contract value and support funds(1985-2007).
PwC
profits) through socio-economic impacts. There is no consideration of additivity relative to the counterfactual. There is also nand foregone return from ESA, which are legitimate costs.
The Benefit:Cost Ratio on the other hand, includes all costs (including ESA admin) and considers only additive benefits, measured (quantified and vawealth created by the ESA contracts, support funds and facilitated sales and supplier inputs, through corporation tax, incomesales revenues, (post-tax) retained earnings, additional jobs and user utility. The values are deflated to constant 2010 pricesBenefits is used to account for time preference.
Furthermore, the Benefit:Cost Ratio is calculated using data from a shorter and more recent time period, which reduces the temultiplier.
However, the Benefit:Cost ratio does draw on the strengths of the Ripple Effects analysis because it is based on the rich dat
and London Economics 186
Difference between the Ripple Effects multiplier and the cost-benefit ratio
The Benefit:Cost Ratio
The Benefit:Cost Ratio is calculated as the ratio of:
the Present Value sum of costs (ESA contracts, support funds, ESAadministration costs and foregone return from ESA) deflated to constant 2010prices relative to
focuses on the value of sales as benefits, rather than considering the wealth created (e.g. salaries, productivity improvements andeconomic impacts. There is no consideration of additivity relative to the counterfactual. There is also no account of ESA administration costs
prices relative to
the Present Value sum of benefits (corporation tax, income tax, value added tax,retailer sales revenues, retained earnings and user utility resulting from ESAcontracts, support funds and facilitated sales, supplier inputs and end-userusage of program outputs) deflated to constant 2010 prices.
economic impacts. There is no consideration of additivity relative to the counterfactual. There is also no account of ESA administration costs
on the other hand, includes all costs (including ESA admin) and considers only additive benefits, measured (quantified and valued) as thewealth created by the ESA contracts, support funds and facilitated sales and supplier inputs, through corporation tax, income tax, value added tax, (post-tax) retailer
tax) retained earnings, additional jobs and user utility. The values are deflated to constant 2010 prices and the Present Value sum of Costs and
Furthermore, the Benefit:Cost Ratio is calculated using data from a shorter and more recent time period, which reduces the temporal issues of the Ripple Effects
However, the Benefit:Cost ratio does draw on the strengths of the Ripple Effects analysis because it is based on the rich data collected by the Ripple Effects survey.
186

Assessing the costs
Norway’s space expenditure represents the cost side of the Cost-Benefit Analysis.Cost data are available from several sources, each with a different total value, sosome judgment and refinement is necessary. In addition, the data used to estimatebenefits is limited to the 25 enterprises (respondents in 2010) that providedpermission to their Ripple Effect data, so it is important the cost estimates alsoonly pertain to this same (albeit large) subset of enterprises. Thus, the value ofcosts employed in the CBA model utilizes several data sources in order to ensure
Section 2.1: Impacts
costs employed in the CBA model utilizes several data sources in order to ensurethat the costs side of the CBA accurately reflects space-related costs pertaining tothe subset of enterprises that provided individual Ripple Effects information.
The value of costs included in the CBA is derived from the Norwegian SpaceCentre’s budget, the Ripple Effects survey, and data provided by the NorwegianSpace Centre in a way that ensures that the value reflects the magnitude of RippleEffects data and a share of the budget that reflects the data from the NorwegianSpace Centre:*
• Norway’s total ESA budget is available from the Norwegian SpaceCentre’s annual reports. The budget covers contribution to ESA’sprograms, which in turn covers the contracts that Norwegian firms win, andthe administration costs of the ESA programs.
• Data on organization-level ESA contracts and support funds was alsoprovided by the Norwegian Space Centre.
• The individual Ripple Effects data does not hold all the Norwegianenterprises or organizations that won ESA contracts or received funding from
PwC
enterprises or organizations that won ESA contracts or received funding fromthe Norwegian Space Centre’s Support Scheme. As the individual RippleEffects data forms the backbone of the Cost-Benefit Analysis, it is necessaryto include only a share of the ESA budget in the analysis.
• The share of the ESA budget that is included as costs in the CBA comprisesESA contracts to the individual Ripple Effects enterprises and theshare of administration costs of Norway’s ESA participation that isattributable to those firms. Administration costs must be includedbecause the enterprises that supplied individual Ripple Effects responsescould not have got the contracts in the absence of administration costs.
* A technical description of the underlying calculations is available in Appendix 3.
and London Economics 187
In addition to ESA costs, the Norwegian Space Centre’s Support Scheme entersthe CBA on the costs side. The value of those costs is observable from theindividual Ripple Effects survey responses. Administration costs of the NorwegianSpace Centre’s Support Scheme enter the Norwegian Space Centre’s annualreports separately.
The proportion of Norwegian Space Centre administration costs that is included inthe CBA is the same proportion as for ESA administration costs. In nominal termsthe CBA is the same proportion as for ESA administration costs. In nominal termsthe value of ESA contracts far exceeds the value of support scheme funds, andsince the ESA contracts would not have been won if it had not been for theNorwegian Space Centre (and thus its administration costs), we find that the ESAcontract proportion represents the fairest number.
187

Evolution of monetized Costs and Benefits
Costs
ESA contracts and ESA administration costs and foregone return are by far themost important cost drivers.
ESA administration costs and foregone returns fluctuate in value over time, buthave seen an overall increase over the period. ESA has been running operatingsurpluses in recent years, which is likely part of the explanation for the increasein administration costs and foregone returns.
NSC support funds and administration costs have remained largely constant
Section 2.1: Impacts
Costs dominated by ESA-related costs
NSC support funds and administration costs have remained largely constantover the period, with evidence of small growth.
800
1,000
1,200
1,400
1,600
NO
KM
illio
ns
Figure 2.32: Annual Values (2004-2010) of Costs
PwC
See Appendix 3 for a detailed break-down of the calculations underlying the assignmentof administration costs.
-
200
400
600
800
20
04
20
05
20
06
20
07
20
08
20
09
20
10
20
11
20
12
20
13
NSC admin costs
NSC support funds
ESA admin, foregone return
ESA contracts
and London Economics 188
Benefits
In the first three years (2004, 05 and 06), benefits are limited to direct effects,due to the three year lag allowed for indirect effect manifestation.
Annual benefits increase significantly from 2007 onwards when the indirecteffects arising from ESA and/or NSC generated sales are first included. Benefitvalues fall slightly from 2011 on due to the removal of ESA contract value.
ESA contract value alone is not sufficient as an economic rationale forgovernment investment, as can be seen from the first three years’ benefits (< 1:1ratio, due to imports which are a leakage from the Norwegian economy).
The average number of man years supported per year is 642 (6,419 man years
800
1,000
1,200
1,400
1,600
NO
KM
illio
ns
Retained earnings
Corporation tax
Retailer sales revenues
Socio-economic benefits dominated by indirect effects
The average number of man years supported per year is 642 (6,419 man yearsin total between 2004 and 2013).
Directeffects only
Direct andindirecteffects
Indirecteffects only
Figure 2.33: Annual Values (2004-2013) of benefits
-
200
400
600
800
20
04
20
05
20
06
20
07
20
08
20
09
20
10
20
11
20
12
20
13
Value added tax
Income tax
Direct effects are benefits accruing immediately (same year) as the ESA contract and NSCfunding.Indirect effects are benefits accruing over later years associated with the ESA contract and NSCfunding (3 year lag assumed).
188
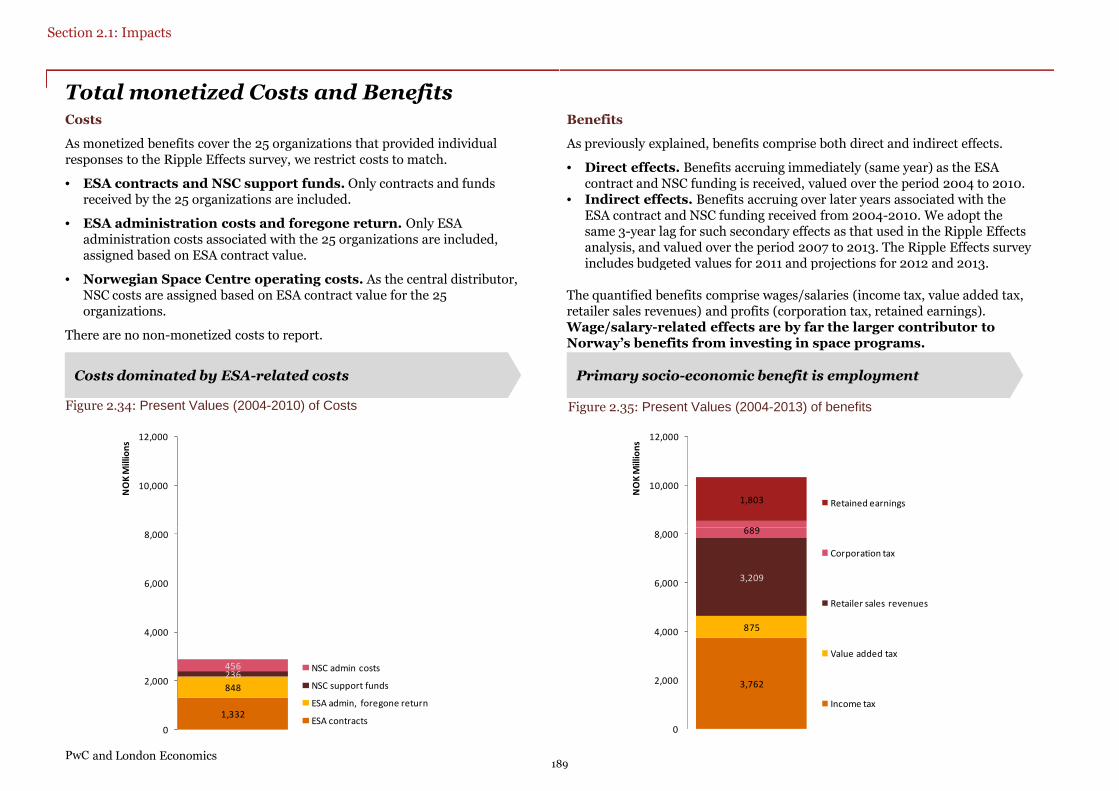
Total monetized Costs and BenefitsCosts
As monetized benefits cover the 25 organizations that provided individualresponses to the Ripple Effects survey, we restrict costs to match.
• ESA contracts and NSC support funds. Only contracts and fundsreceived by the 25 organizations are included.
• ESA administration costs and foregone return. Only ESAadministration costs associated with the 25 organizations are included,assigned based on ESA contract value.
Section 2.1: Impacts
Costs dominated by ESA-related costs
• Norwegian Space Centre operating costs. As the central distributor,NSC costs are assigned based on ESA contract value for the 25organizations.
There are no non-monetized costs to report.
10,000
12,000
NO
KM
illio
ns
Figure 2.34: Present Values (2004-2010) of Costs
PwC189
1,332
848
236456
0
2,000
4,000
6,000
8,000
NSC admin costs
NSC support funds
ESA admin, foregone return
ESA contracts
and London Economics
Benefits
As previously explained, benefits comprise both direct and indirect effects.
• Direct effects. Benefits accruing immediately (same year) as the ESAcontract and NSC funding is received, valued over the period 2004 to 2010.
• Indirect effects. Benefits accruing over later years associated with theESA contract and NSC funding received from 2004-2010. We adopt thesame 3-year lag for such secondary effects as that used in the Ripple Effectsanalysis, and valued over the period 2007 to 2013. The Ripple Effects surveyincludes budgeted values for 2011 and projections for 2012 and 2013.
Primary socio-economic benefit is employment
includes budgeted values for 2011 and projections for 2012 and 2013.
The quantified benefits comprise wages/salaries (income tax, value added tax,retailer sales revenues) and profits (corporation tax, retained earnings).Wage/salary-related effects are by far the larger contributor toNorway’s benefits from investing in space programs.
689
1,803
10,000
12,000
NO
KM
illio
ns
Retained earnings
Figure 2.35: Present Values (2004-2013) of benefits
189
3,762
875
3,209
689
0
2,000
4,000
6,000
8,000
Corporation tax
Retailer sales revenues
Value added tax
Income tax

Cost-Benefit Analysis results
Our objective was to assess the socio-economic impacts of Norway’sparticipation in ESA and the national support funds between 2004 and2010 and to determine whether this space-related expenditure has led to a netcost or a net benefit to the Norwegian economy.
Monetized costs and benefits
The Cost-Benefit Analysis results (based on 25 organizations that providedindividual responses to the Ripple Effects survey) presented in the above tableprovide answers to these questions, summarized as follows:
Section 2.1: Impacts
provide answers to these questions, summarized as follows:
• The total cost of participation (2004-2010) was 2.9 billion NOK, anaverage annual participation cost of 386 million NOK.
• The total benefit of participation (2004-2013) is expected to be 10.3billion NOK, an average annual participation benefit of 1.353 billionNOK.
• We therefore determine that participation in ESA and the nationalsupport funds between 2004 and 2010 brought about a Net Benefit of7.4 billion NOK.
• The Benefit:Cost Ratio of 3.59 : 1, shows that the Present Value ofbenefits exceeded the Present Value of costs in this period by afactor of 3.59.
N.B. It is important to note that 3.59 is the average impact of each NOKof funding from 2004-2010, and that it is not the marginal impactof an additional NOK of funding.
PwC
of an additional NOK of funding.
Non-monetized costs and benefits
We have attempted to monetize all identified costs and so there are non -monetized costs to report. Non-monetized benefits are explored on thesubsequent slides.
and London Economics 190
Summary of Cost-Benefit Analysis results MNOK
Final year of benefit accrual: 2013
Present Value analysis, Discount rate: 4%
Figure 2.36: Summary of costs and benefits
PV(Total Cost) 2,871
Average Annual Cost 386
PV(Total Benefit) 10,295
Average Annual Benefit 1,353
Net Present Value (NPV) = [ PV(Total Benefit) -PV(Total Cost) ] 7,424
Average Annual Net Benefit (or Cost) 998
Benefit:Cost Ratio 3.59
190

Non-monetized benefits: Public agency effectiveness and efficiencyquality primary driver of user benefit
Survey responses
Several different groups of end-users were identified by the survey respondents,including: supranational and Norwegian government organizations,research institutions, private companies, and consumers.
Data availability, accuracy, reliability, and efficiency were the main types ofuser benefits identified by the respondents to the survey. Examples of the specific
Section 2.1: Impacts
user benefits identified by the respondents to the survey. Examples of the specificusage of ESA outputs include:
• Satellites give telecommunications enterprises the opportunity to offer newapplications in broadband and mobile internet to rural areas. This benefits notonly the telecommunications firms and the users, but, potentially, alsoNorwegian competitiveness, as information technology improves productivity.
• Though ESA satellites are one of a number of sources, surveillance data areused by meteorologists who gain access to more detailed data that help themprovide more accurate weather forecasts which benefits, for example thecountry’s fishing fleet, the agricultural sector, and the population as a whole.Surveillance data are also used by military and civilian Norwegian authoritiesinvolved with maritime surveillance. The data enables these authorities tomonitor Norwegian water more closely and assert sovereignty if need be.Earth observation data is also used to monitor land use, forestry, the size andwater content of ice, etc.
• The importance of European access to space was mentioned by one survey
PwC
• The importance of European access to space was mentioned by one surveyrespondent. The fact that Europe, through ESA, has sufficient capacity tobuild and run space ports and satellite launch facilities means that Europe isno longer dependent on foreign goodwill to make space related projectshappen.
Sources: ESA Annual Report, 2010; Convention for the establishment of a European Space Agency &ESA council Rules of Procedure, 2003
and London Economics 191
monetized benefits: Public agency effectiveness and efficiency – Data access and
Discussion
To assess the impact of Norway’s participation in ESA in terms of user benefits,careful consideration of the counterfactual and additivity is essential.
In the first instance, if Norway’s contribution meant the initialization of an ESAprogram, then the additive user benefits could be substantial.
• Norway’s contribution to ESA amounts to roughly 2% of ESA’s budget, and• Norway’s contribution to ESA amounts to roughly 2% of ESA’s budget, andNorway is credited for funding a number of individual projects under differentESA programs (e.g. in Earth Observation). On this evidence, it is plausiblethat Norway’s contribution to ESA has indeed caused initialization of projects.This, in turn, implies that Norwegian users of outputs from those ESAprograms benefit.
In the second instance, if the outputs of the ESA programs would have beenavailable to Norwegian entities in the counterfactual case if Norway had notcontributed to ESA, then the additive user benefits would be small.
• ESA’s Convention states that data and outputs of ESA programs shall be madewidely available. However, some of the ESA data would not have beenavailable, so some industrial benefits would have been missed. Membership ofESA allows Norway to influence decisions made in regard to the ESA projects,so the outputs may be better suited for Norwegian users, but the degree ofadditional user benefits is likely small. On balance, there would still havebeen many benefits available without ESA membership.been many benefits available without ESA membership.
In the third instance, if there exist alternative external sources for similar productsor services, then the additive user benefits would be negligible.
• If ESA program outputs were available from a different supplier, then the userbenefits associated with ESA membership are limited. If similar outputs wereavailable at a price, then the total cost of obtaining the outputs would have tobe weighed against the price of ESA participation to ascertain whether usersbenefit from ESA membership.
In summary, it seems that additive user benefits from Norway’s ESAmembership are limited because most program outputs would have beenavailable if Norway was not a member.
Consequently, consistent with the principle of proportionality, these benefitsare not monetized.
191

Non-monetized benefits: Competitiveness of the Norwegian economy
Competitiveness of the Norwegian economy
In order to assess the impact of space expenditure on the competitiveness of theNorwegian economy, it is important to consider the different channels throughwhich Norwegian enterprises compete with foreign enterprises.
• Quality of the service. Quality is partly reflected in the productdevelopment capabilities of an enterprise, as greater product developmentcapabilities improves the quality of the match between the supplied and the
Section 2.1: Impacts
capabilities improves the quality of the match between the supplied and thedemanded good or service. The PwC/LE bespoke survey asked respondentshow ESA contracts had impacted their product development capabilities, withresponses suggesting that ESA contracts impact product developmentcapabilities of enterprises substantially. Synergies with other markets,lower R&D cost and innovation were cited in responses and of the total of 12responding enterprises, 6 report effects between 20% and 35%, whereas 3report effects between 3% and 10% and 2 respondents report 100%-300%.
• Price of the good or service. Productivity is a ratio of production output toinputs, and improvements in productivity imply cost reductions. Most firmsreport zero productivity effects, but for a few, methodologies andengineering efficiency have improved by between 0.5% to 25%.
• Reputation and experience. If the proposing enterprise is inexperiencedor unknown, it might be more difficult to win the contract. Network, andreputation and flight heritage are by far the most prevailing channelsthrough which ESA contracts impact sales with more than half the
PwC
through which ESA contracts impact sales with more than half therespondents quoting either or both effects. Among the enterprises thatquantify the effects, the range between 5% and 30% dominates.
The PwC/LE bespoke survey asked respondents for their views on the effect ofown ESA contracts on suppliers, beyond the immediate sales effect. The effectson suppliers was not reported to be of great magnitude although it was pointedout that additional suppliers were used and so more enterprises were able to enterthe space sector. In fact, one respondent stated that the very existence of some oftheir suppliers hinges on ESA contracts because working for ESA contractedenterprises makes the suppliers capable to fulfill other contracts, and, to a certaindegree, keeps the suppliers in business. The quality of supplier inputs was alsoreported to have improved.
and London Economics 192
monetized benefits: Competitiveness of the Norwegian economy
Roughly half of the respondents thought that competitors were better off as aresult of the ESA contracts. Effects such as knowledge sharing within the ESAenvironment and the incentive for competitors to keep up with the contractingenterprise were quoted. However, many respondents did not see any effects.
Attractiveness of careers within Science, Technology, Engineering andMathematics subjects
Another, and perhaps more long-term, way involvement in space programsAnother, and perhaps more long-term, way involvement in space programsbenefits Norway is through the attractiveness of a career in science, technology,engineering and mathematics (STEM). If young people decide to educatethemselves within STEM subjects, the returns to society are significant andsubstantial. A recent study by London Economics (2010) shows that the netpresent value of lifetime benefits to the UK finances arising from individualswith a STEM undergraduate degree amount to £64,471-£171,784 comparedto an individual whose highest level of attained education is the GCE A-levels.
These effects arise in spite of more time passing before individuals start earning,and although there is a direct cost associated with education. Tax payments andNational Insurance contribution paid after graduation exceeds that of anindividual with A-levels substantially.
As a full ESA member, Norwegians are entitled to a number of jobs at ESA. As aresult of Norway not filling all of its allocated jobs, ESA made appearances at threeNorwegian universities in January and February 2012. This initiative along withthe general media exposure of the Norwegian Space Centre, space sector firms,
See London Economics, “Estimating the returns to the Chemical Sciences”, Final report for the RoyalSociety of Chemistry, Table 2 for a detailed break-down of the exchequer benefits relating to degrees.
National Insurance is a British unemployment insurance scheme which is operated by the State. Noticethat the analysis is undertaken for the UK whose income tax levels and benefits levels are considerablydifferent from Norway. These numbers provide a feel for the difference in value to the public finances,but cannot be expected to apply literally.
http://romsenter.no/ESA+p%C3%A5+studentjakt+i+Norge.d25-TwlzOYb.ips, accessed 09/02/2012
the general media exposure of the Norwegian Space Centre, space sector firms,ESA symposiums in Norway, and the AnSat student satellite program in which 83students had participated by the end of 2010 all show the opportunities that liewithin different areas of space related employment.
192

Section 2.2
Meeting the objectives
The objective of this section is to determine thedegree of success of the space programs in reaching theobjectives.
Two important issues are covered:
I. Effectiveness. This is about assessing whetherthe objectives has been achieved.
II. Relevance. This is assessing to what extent theactivities are suited to purpose.
Each section will start with a definition of criteria

The programs have delivered specific results over time, but declining contribution towealth creation and uncertainty about sustainability
Overall objective
Space activities in Norway shall provide substantial and persistent contributions to wealth creation, innovation,knowledge development, and environmental- and public safety.
The overall goal encompasses different elements. The concepts are not mutuallyexclusive and overlap. i.e.. knowledge development and innovation. The
Section 2.2 Meeting the objectives
Activities through ESA are less directly relevant for the enhanced public sector
exclusive and overlap. i.e.. knowledge development and innovation. TheMinistry has also defined more specific objectives and a discussion of progresson detailed objectives are found in the main report and the annex.
Specific results, but unclear impact on sustainable growth andwealth creationOverall turnover of the space industries in Norway have declined by between15-25 percent since 2003 depending upon how inflation is adjusted for.Contributions to wealth creation overall in Norway had declined by 33 percentsince 2003 as defined by GDP with or without petroleum included. Employeesinvolved in space activities have declined by nearly 50 percent since late 1990’sthough this measures only captures about 80 percent of companies.
Support for space related activities has provided results, but these are probablydeclining. There has been strong sales growth for those firms that receive mostof the support albeit insufficient to offset the larger decline. There is growth insome segments of the value chain and some firms have seen phenomenal
PwC 194
some segments of the value chain and some firms have seen phenomenalsuccess. These do not necessarily coincide with those that receive support.Ripple effects on sales of the public support are reported and the socio-economic benefits are net positive.
The profile of the support portfolio is increasingly decoupled frommarket developments, business structures and growth potentialover time. As such we question the sustainability of the support overtime. It may also mean that the results are better for the evaluation period as awhole rather than the last few years in isolation.
The programs have delivered specific results over time, but declining contribution towealth creation and uncertainty about sustainability
Space activities in Norway shall provide substantial and persistent contributions to wealth creation, innovation,and public safety.
Substantial and persistent contributions to environmental- and publicsafety are seen.The national programs targeting ocean and polar monitoring capabilities havecontributed towards environmental- and public safety. The systems provideinformation important for environmental safety. The space activities have alsocontributed much to the processing and institutionalizing of the information.Thereby increasing the probability of positive impacts on environmental and publicsafety.
Activities through ESA are less directly relevant for the enhanced public sectorcapabilities. ESA satellites or systems are today largely irrelevant for thesecapacities. There are however other linkages. The knowledge and insights, earlydevelopment of algorithms, and development of the ground station have muchdevelopment of algorithms, and development of the ground station have muchbeen through ESA activities. For the future, the EU GMES holds much potentialalso for Norway. Dedicated access to other sources for a.o radar data is likely to berequired also in the future.
Environmental- and public safety are also concepts which may have differentmeanings depending upon circumstances. They are not defined by the Ministry.
194

Objective 1: The objective is formulated as“Ensuring that space activities havesignificant industrial ripple effects”.
Output measures relate to a range of differentconcepts and there are seven quantitativeindicators defined.
Progress against the objective is mixed. We willreview the important issues.
Norwegian firms have in practice similaraccess to Galileo development contracts asEuropean firms.There were initial restrictions, but specialprovisions and agreements were entered intobetween Norway and relevant EuropeanAuthorities that ameliorated the restrictionseffective from 2009/2010.
There are industrial ripple effects butturnover is decreasing.
Section 2.2 Meeting the objectives
Related to the four government output measureswe find that:
International positions show overalldecline with some bright spots. Overall globalmarket share for Norwegian space firms havedeclined from about 2,8 percent to 2 percentduring 2005-2010. Export shares have fallen.From about 82 percent of sales in 2005 to 68percent in 2010. Exports of both services andproducts have declined relative to other Norwegianexports of services and products respectively.Several individual firms have strong positions inparticular micro segments. This applies across allsegments of the value chain.
There is not full industrial return on the
turnover is decreasing.are seen at about 4.3 in aggregate and at about 3.5median value per firm. The indicator accumulates“ESA generated sales” sales during 1985ESA and space center support.
Turnover has been decreasing since 2003. Inflationadjusted the decline is about 15
Objective 2: The objective is formulated as“High utilization of Norway's geographicaladvantage”. There is only one outputmeasure: “Norway holding a leading role inthe Arctic space related infrastructure”.
Indicators relate to KSAT and Andøya Rocketrange.
PwC
There is not full industrial return on theESA programs. Overall rate is at 90 percent inJune 2011. A special initiative has been launchedby ESA to direct more contracts toward Norway.The ratio is lowest in the mandatory programs at68 percent. It is highest in the technologydevelopment programs with guaranteed returns of100 percent. In other optional programs it is about84 percent. The ratio of contributions toguaranteed and non-guaranteed return is about50/50.
KSAT business is going strong. We have estimatedScanEx of Russia and SSC of Sweden to track moresatellites (150/100) but the comparability anddefinitions are unclear from all parties.
195
Norwegian firms have in practice similaraccess to Galileo development contracts as
There were initial restrictions, but specialprovisions and agreements were entered intobetween Norway and relevant EuropeanAuthorities that ameliorated the restrictionseffective from 2009/2010.
There are industrial ripple effects butturnover is decreasing. Industrial ripple effects
Andøya rocket business has seen some declinethough student rockets are increasing. The declineis reported as being caused by shrinking sciencebudgets. Numbers for their key competitor,Esrange in Kiruna, show about similardevelopments.
Andøya and Esrange are supported through aspecial program to incentivize use, a bilateralagreement between six countries. (EASP)Financing has averaged 24 million NOK annuallyturnover is decreasing. Industrial ripple effects
are seen at about 4.3 in aggregate and at about 3.5median value per firm. The indicator accumulates“ESA generated sales” sales during 1985-2010 byESA and space center support.
Turnover has been decreasing since 2003. Inflationadjusted the decline is about 15-25 percent.
Objective 2: The objective is formulated as“High utilization of Norway's geographicaladvantage”. There is only one outputmeasure: “Norway holding a leading role inthe Arctic space related infrastructure”.
Indicators relate to KSAT and Andøya Rocket
Financing has averaged 24 million NOK annuallysince 2007 and an additional allocation of 15million was provided to support infrastructure in2010. EASP is outside of the purview of this study.
Objective 3: The objective is worded as“Developing cost-effective systems meetingnational and international demand. Outputmeasures relate to two different concepts:
First, the performance of satellitenavigational systems covering the arcticregions. Egnos (airtrafic) performance wasreported as “not full coverage in accordance withoperative demands.” in 2010. From 2011 this isreplaced by a Galileo/GNSS measure.
The logic being that ESA membership wouldKSAT business is going strong. We have estimatedScanEx of Russia and SSC of Sweden to track moresatellites (150/100) but the comparability anddefinitions are unclear from all parties.
The logic being that ESA membership wouldinfluence the performance of these systems inarctic regions. Norway has had influence, inparticular on Galileo design.
Second, this objective of developing cost-effective systems meeting national demandhas driven much of the efforts behind the SatOceanprograms. These efforts can only be seen assuccessful and are discussed extensively in thereport.
195

Objective 4: The objective is worded asStrengthening Norwegian researchcommunities through internationalcooperation.
Output measures relate to two different concepts:Norwegian research communities having centralroles in space related research projects ; andNorwegian scientists having access to the bestsatellite measurements in their field of research.
Objective 5: The objective is worded asIncreasing knowledge in science andtechnology through information from thespace industry.
There are three output measures: Increasing theoutward information flow; Increasing mediaattention and Increasing activity towards students.
The activity level is very high. Four lectures weekly,twice weekly radio appearances, weekly events
Section 2.2 Meeting the objectives
Scientists with access to satellite data hasincreased much over the last five years. Whetherthis represent improved access or more scientistsexploring these fields is not explicit but possiblymostly the first. Number of researchers involved inspace related research projects is reported to beincreasing. Whether and how this can be measuredhas been a recurring theme in the dialoguebetween the space centre and the MoTI.
The logic here is that ESA membership createsaccess for Norwegian scientists. ESA createsopportunities particularly within the scientificprograms. There is a coordination mechanismswith the research council for this. Governmentinstruments to support space sciences are alsoabout more instruments than ESA and includes the
twice weekly radio appearances, weekly eventswith 30 participants on average. This has increasedmuch over the last five years. Website is elaborateand has frequent visitors. There are also studentoffers for support in writing master thesis andother research. TV appearances is the onlyindicator that show a decline.
The broader concept here relates to education,recruitment and work force capabilities over thelong run fro which the space program tools arelimited.
A detailed presentation of all indicators is found inthe annex.
PwC
about more instruments than ESA and includes theresearch council, EU FP’s basic funding foruniversities a.o.
The impact and effectiveness of the science supportmust be analyzed holistically to be meaningful. Wedo not explore this in more depth here.
196
Objective 5: The objective is worded asIncreasing knowledge in science andtechnology through information from the
There are three output measures: Increasing theoutward information flow; Increasing mediaattention and Increasing activity towards students.
The activity level is very high. Four lectures weekly,twice weekly radio appearances, weekly eventstwice weekly radio appearances, weekly eventswith 30 participants on average. This has increasedmuch over the last five years. Website is elaborateand has frequent visitors. There are also studentoffers for support in writing master thesis andother research. TV appearances is the onlyindicator that show a decline.
The broader concept here relates to education,recruitment and work force capabilities over thelong run fro which the space program tools are
A detailed presentation of all indicators is found in
196

Further we discuss the relevance of the policies vis-à-vis the objectives. This is assessing to whatextent the activities are suited to purpose. We willreview the following evaluation questions relatedto relevance:
1. Are the instruments adequate from an overallperspective for achieving the space programs
1. Are the instrumentsoverall perspective for achieving thespace programs goals?
There are differences across segments and we willreview those in turn.
Three observations to note:
Policy and objectives might benefit frombenefits
Section 2.2 Meeting the objectives
perspective for achieving the space programsgoals?
2. Has the space programs achieved anappropriate balance between the variousinstruments?
3. Is there overlap or conflicts of objectivesbetween ESA participation and nationalsupport funds? Are synergies exploited?
4. How has the Space programs managed toadapt its instruments and advice to the largercontext in which space activities interacts withother social, market, economic, political andenvironmental processes?
Three observations to note:
1. Limited growth potential in upstreamproduction
There is a mismatch between support for upstreamproduction companies and the potential for growthand wealth creation in this segment. This includesmanufacturers of launchers, satellite componentsand ground equipment.
The support is insufficientgoal would be to build a large and sustainablespace industry. That would require a considerableincrease in Norway’s participation in ESA, which ishardly justifiable in terms of Norway’s overallpolicy for industry.
PwC
Additional issues are discussed in the detailedanalysis.
policy for industry.
The difficulties of attaining competitiveness in ESAand global commercial markets of the upstreamsegments are an indication of this. A sufficientlystrong domestic demand does not exist to createanchor demand for upstream actors. Marketleaders are from larger countries and have sizeabledomestic upstream markets available to them.
197
Are the instruments adequate from anoverall perspective for achieving thespace programs goals?
There are differences across segments and we will
Three observations to note:
These difficulties will only increase driven by fivetrends indicated in the analysis:
- as value chains of global conglomerates convergeacross segments and between system integratorsand component producers;
- as emerging markets gain competitiveness andglobal market shares;
Policy and objectives might benefit from adjustment to ensure
Three observations to note:
1. Limited growth potential in upstream
There is a mismatch between support for upstreamproduction companies and the potential for growthand wealth creation in this segment. This includes
launchers, satellite components
The support is insufficient in size and scope if thegoal would be to build a large and sustainablespace industry. That would require a considerableincrease in Norway’s participation in ESA, which ishardly justifiable in terms of Norway’s overall
global market shares;- as U.S firms are driven onto global markets;- as European countries launch semi-commercial
national programs; and- as access to semi-protected ESA markets become
more difficult due to convergence of EU and ESA.
2. Growth and comparative advantages in theservice sectorsOpposite these constraints in the upstreamsegment stands exceptionally strong domesticdemand from other economic sectors notably frommaritime and offshore industries.These are growth drivers for space groundequipment manufacturers, and providers ofcommunications and earth observation services. In
The difficulties of attaining competitiveness in ESAand global commercial markets of the upstreamsegments are an indication of this. A sufficientlystrong domestic demand does not exist to createanchor demand for upstream actors. Marketleaders are from larger countries and have sizeabledomestic upstream markets available to them.
communications and earth observation services. Inthese segments Norwegian firms are global marketleaders and have considerable market shares inbroadly defined market segments.
The tools seem adequate for satellitecommunications services. Relatively smallinvestments here have had big impacts. Thissegment has also seen new entrants with rapidgrowth. There is no need to match the funding tothe scale of the industrial turnover in the absenceof market failures. Rebalancing could beconsidered to support development of near-market-ready technologies. ESA is ineffective tosupport this segment.197

Tools are also adequate for the ground equipmentindustry. Although the space related turnover hasdropped, there is little evidence of constraints inother segments of electronics and communicationsequipment markets. Those who produce spaceground equipment have also grown more stronglyin other segments. The declining turnover isrelated to collapse of one company. The inability ofother firms to maintain or gain global marketshares seem related to firm level decisions offocusing on other market opportunities.
3. Tools to support environmental and publicsafety objectives are adequate or almost so.
There is a reasonable balance at the moment.Government demand is increasing.For the ocean/polar region services this is abouthaving more refined capabilities. The combinationof national development programs and dedicatedinvestments in a.o radar and AIS are adequate forocean monitoring currently. Emerging difficultieshere are about having flexible access to other
Section 2.2 Meeting the objectives
focusing on other market opportunities.
Tools are adequate to support earth observationservices firms but may be constrained in the nearfuture. In fact, this is driven by strong demandfrom government for monitoring and surveillancecapabilities. Needs , as in territorial, are at aboutthe same levels as that of Europe combined andthis creates anchor demand for certain services.Norwegian firms also have strong competitivepositions in these segments. The nationaldevelopment programs are especially well suited.There is however a risk that the use of the supportfunds has been selectively targeted at a few actors.A consequence is a narrow base to recruit newservice providers from.
Risks here relate to future developments of EU
here are about having flexible access to othersources of high resolution data to meet moresophisticated demand.
Future access to continuous radar imagery need tobe secured given that the current main source isexpiring in some years. There are severalcapabilities available that will meet currentrequirements but costs are likely to increase.
Terrestrial demand is currently adequately met.The model of combining development programswith access to radar satellite data is currentlysufficient. Challenges are emerging. There arecapacity constraints and scheduling conflicts forradar data. Access to optical imagery is not securedon a cost-efficient and continuous basis. Tools areadequate at the moment, but may be limited in the
PwC
Risks here relate to future developments of EUGMES programs. Norway needs access to theseprocesses to maintain adequate instruments tosupport firms in this segment.
adequate at the moment, but may be limited in thefuture as user sophistication grows.
In the near future there also needs to be access toEU GMES institutions.
Next we turn to the question of balance.
198
to support environmental and publicsafety objectives are adequate or almost so.
is a reasonable balance at the moment.Government demand is increasing.For the ocean/polar region services this is abouthaving more refined capabilities. The combinationof national development programs and dedicatedinvestments in a.o radar and AIS are adequate forocean monitoring currently. Emerging difficultieshere are about having flexible access to other
2. Has the space programs achieved anappropriate balance between theinstruments?
Four observations to note:
1. The balance of ESA vs. National programallocations is appropriate but can be adjustedlonger term.
The dynamic between the industry developmenthere are about having flexible access to othersources of high resolution data to meet more
Future access to continuous radar imagery need tobe secured given that the current main source isexpiring in some years. There are severalcapabilities available that will meet currentrequirements but costs are likely to increase.
Terrestrial demand is currently adequately met.The model of combining development programswith access to radar satellite data is currentlysufficient. Challenges are emerging. There arecapacity constraints and scheduling conflicts forradar data. Access to optical imagery is not secured
efficient and continuous basis. Tools areadequate at the moment, but may be limited in the
The dynamic between the industry developmentprogram and the ESA programs seem to work well.
There is an observed difference in scale of nationalprograms vis-a-vis ESA contributions compared toother larger space manufacturing nations.
Matching the funding levels of these countries isunattainable. Policy attempts to compensate forthis are futile and will fail. Further selectivity andspecialization may be considered.
The recent scale-up of ESA financing isquestionable to the extent that it is not absorbed byindustry contracts. The ration betweencontributions and contracts is increasing. Theindustrial return coefficient is below target and hasto be met by separate transfer schemes from ESA.adequate at the moment, but may be limited in the
future as user sophistication grows.
In the near future there also needs to be access to
Next we turn to the question of balance.
to be met by separate transfer schemes from ESA.
National program funds on the other hand may beinsufficient to meet public sector demand in thefuture. A necessary scale-up of commercializationstrategies in the services segment for which ESA isless relevant may also be considered. Futuregrowth may need to be directed towards this.
198

2. Intra-ESA program allocations should bereoriented towards those segments with bestpotential for growth and wealth creation
There is a risk that current allocations are drivenby other than cost-efficiency considerationsincluding path dependency. Its fragmented, drivenby expectations about where industries can deliver.Today's and specialization should be revised. Thesupport is not oriented towards those segmentswith the highest growth or wealth creation
3. Allocation of intra-national programshould be reoriented and increase in scope.
Consider increasing service development funds.This is where the highest returns and growthpotentials are seen.
A risk is that current involvement of commercialearth observation firms is too narrow and selective.Increases here need to be met by strategies toincrease broader involvement of commercial
Section 2.2 Meeting the objectives
with the highest growth or wealth creationpotential.
The current allocation distribution implies mostfinancing for launchers and satellite componentmanufacturers. This is questionable on cost-efficiency grounds as there is less growth potentialand lower ripple effects than other segments. Somerebalancing may be warranted.
At a certain level, optimizing this allocation will beconstrained by the fact that ESA predominantlyoffers opportunities for upstream and hardwareproducers.
Strategies for increasing participation ofdownstream actors, within or outside of ESA mayneed to be considered. This is where ripple effects
increase broader involvement of commercialservice firms. Meeting longer term public sectordemand also speaks for increasing this share.
Another risk is that cost-efficiencies achieved bymonitoring of ocean areas by satellite does notcurrently have its equivalent on the terrestrial side.This may change in the future. But care iswarranted in assessing alternatives.
4. Allocations between scientific activities andindustrial support needs to clarified in atransparent policy., there is an unresolved balancing issue withregards to the funding of scientific space activitiesThese contributions have over the last decade notonly pertained to the ESA mandatory scientificprogram, but also to other programs like the
PwC
need to be considered. This is where ripple effectsare higher and growth potential larger.
The fragmented nature of ESA program allocationsimplies much discretion for the space centre indetermining allocations. The implicit prioritizationof certain industrial segments that the allocationsimply, are not articulated, explicit or transparent.
program, but also to other programs like theInternational Space Station and more importantlythe Earth Observation Program. This reflects thescientific nature of many of the ESA Optionalprograms.
Finding an appropriate ESA investment level thatis targeted at scientific communities need to takeinto consideration the scientific capabilities andpriorities. This is what is being done in practicetoday. Balancing the scientific funding level withother investments however is ultimately a policychoice. It is not transparent today. Resolutioncould be sought within an overall policy frameworkfor space policy including science.199
national program fundsshould be reoriented and increase in scope.
Consider increasing service development funds.This is where the highest returns and growth
A risk is that current involvement of commercialearth observation firms is too narrow and selective.Increases here need to be met by strategies toincrease broader involvement of commercial
3. Is there overlap or conflicts of objectivesbetween ESA participation and nationalprograms? Are synergies exploited? Arethere other conflicts of objectives?
Three observations:
1. the synergies of industrial national supportfunds and ESA participation are strong. There isclear alignment of the priorities of the nationalprogram and the ESA activities. Overlaps orincrease broader involvement of commercial
service firms. Meeting longer term public sectordemand also speaks for increasing this share.
efficiencies achieved bymonitoring of ocean areas by satellite does notcurrently have its equivalent on the terrestrial side.This may change in the future. But care iswarranted in assessing alternatives.
4. Allocations between scientific activities andindustrial support needs to clarified in a
there is an unresolved balancing issue withregards to the funding of scientific space activities.These contributions have over the last decade notonly pertained to the ESA mandatory scientificprogram, but also to other programs like the
program and the ESA activities. Overlaps orconflicts are not significant
2. the synergies between national servicedevelopment programs and ESA are weaker. Theyexists, mostly through the ESA Earth Observationand met programs, but are not as strong as for theindustrial side.
This is a reflection of the priorities of ESA. Thescientific oriented earth observation programs areless suitable for meeting operational demand andrequirements from the public sector in Norway.ESA satellites don’t meet the requirements forcontinuity of access or don’t have the appropriatecapabilities.
In the future, this arena will shift towards the EU.program, but also to other programs like theInternational Space Station and more importantlythe Earth Observation Program. This reflects thescientific nature of many of the ESA Optional
an appropriate ESA investment level thatis targeted at scientific communities need to takeinto consideration the scientific capabilities andpriorities. This is what is being done in practice
the scientific funding level withother investments however is ultimately a policychoice. It is not transparent today. Resolutioncould be sought within an overall policy frameworkfor space policy including science.
In the future, this arena will shift towards the EU.It will be important to influence the EU processesto ensure alignment of objectives.
There is however no future scenario where theobjectives of the national service programs andESA are delinked. A model whereby EU systemsare developed by ESA, such as for GMES, impliesthat there will be linkages also in the future.The same applies for EUMETSAT.
199

The implication is that it will be more important tosecure alignment of objectives between EUpriorities and Norwegian interests in arenasoutside of ESA in addition to continue influencingdevelopment stages within ESA.
3. there are conflicts of objectives between meetingpublic sector demand and industrial developmentstrategies. Meeting public sector demand in costefficient ways is not aligned with schemes tosupport selective industries.
4. allocation decisions between science andindustry do not reflect conflict of objectives.Uncertainties reflects that the balance has not beendetermined at a policy level. The balancingquestion cannot be resolved through cost efficiencyconsiderations. The objectives and priorities arenot defined by policy. That can be resolved throughpolicy development.
5. allocation decisions between segments ofindustry may be seen as a conflict of objectives.
Section 2.2 Meeting the objectives
support selective industries.
The support for industry is only aligned with publicsector objectives as long as it leads to lower cost forgovernment, or if the support has wealth creationand ripple effects that exceed the increased costsfor governments. This also applies to bilateralsupport arrangements. This has to be assessed on acase-by-case basis through proper optionevaluation methods.
There is a higher level conflict with structuralpolicies for competition, public procurement andstate-aid. Within ESA this is resolved as ESA is notregulated by EU or GATT principles. For nationalprograms and subsidies this is a problem.
Public procurement and state-aid regulations are
industry may be seen as a conflict of objectives.is not. Those can be determined by costconsiderations.
4- How has the Space programs managed toadapt its instruments and advice to thelarger context in which space activitiesinteracts with other social, market,economic, political and environmentalprocesses?
There are several aspects of this. There are severalindications of appropriate adaptations, and onearea where it is more questionable. Fourobservations:
1. Well integrated with the strategicfocus on the arctic. The support for the
PwC
Public procurement and state-aid regulations arenot well aligned with selective industrialdevelopment objectives. T
The practical implication is that national programsthat try to merge these objectives, i.e. AIS satelliteor Radarsat contract runs into legal compliance orcost-benefit difficulties.
There are only synergies in other areas whereNorwegian industry is internationally competitivebut national programs need to follow procedureswhereby the competition is open. This is a problemtoday.
focus on the arctic. The support for theocean/polar and Barents sea activities are theleading examples of this. The leadership to bringNorway into the GMES programs is also areflection of this. The importance given to Galileoand EGNOS coverage for the north is also anindication.
2. Adapted to the EU/ESAmanifested in funding allocations for EU led workprograms and in attention paid to EU policy issues.
200
allocation decisions between science andindustry do not reflect conflict of objectives.Uncertainties reflects that the balance has not beendetermined at a policy level. The balancingquestion cannot be resolved through cost efficiencyconsiderations. The objectives and priorities arenot defined by policy. That can be resolved through
allocation decisions between segments ofindustry may be seen as a conflict of objectives. It
3. Ability to find opportunities for small spacenations. The programs have adopted to the trendwere costs are falling and single missionmicrosatellites are attainable within a smallresource envelope. This creates opportunities forsmall space programs for small nations. The AISsatellite is the practical manifestation of this so far.
4. Limited adaptation to structural marketdevelopments.
industry may be seen as a conflict of objectives. Itis not. Those can be determined by cost-efficiency
How has the Space programs managed toadapt its instruments and advice to thelarger context in which space activitiesinteracts with other social, market,economic, political and environmental
There are several aspects of this. There are severalindications of appropriate adaptations, and onearea where it is more questionable. Four
Well integrated with the strategic politicalThe support for the
Space programs may have not been adapted well toa broader market trend with increased public-private partnerships and commercialization. Suchconcepts are driving developments within the earthobservation segments, geotracking and militarycommunications.
We see three implications:(a)Increased opportunities for cost-efficient publicsector programs in the future. Service offerings arelikely to expand, in particular those relevant forpublic sector requirements. Prices will fall withincreased competition including from low-costcountries. Flexibility in public sector instrumentsare likely to become more important. The ability toswitch between providers of satellite data, and seekavailable low-cost options will be important.The support for the
ocean/polar and Barents sea activities are theleading examples of this. The leadership to bringNorway into the GMES programs is also areflection of this. The importance given to Galileoand EGNOS coverage for the north is also an
to the EU/ESA convergence. This ismanifested in funding allocations for EU led workprograms and in attention paid to EU policy issues.
available low-cost options will be important.
(b) Risks that other countries, and ESA partners,will shift their priorities into public-privatepartnership programs rather than the joined upefforts in ESA.
(c) Opportunities for out-of-the box thinking interms of matching commercial objectives withpolicy objectives. There will be more ideas like theAIS satellite in the future. A conceptual approachthat brings in private risk capital andcommercialization incentives may make programsfinancially feasible.
200

5. How much influence does Norway havein ESA?
There are three dimensions to this : (i)Formalstructures, (ii)organizational capabilities such ascommittee representation and staffing, and (iii)perceptions of actual influence being used.
Three observations:
First, the formal decision making structures doesby default create a strong basis for influence. Thisis unrelated to the size of the country or the size of
Number of Norwegian staff is relatively less thanthe level of financial contribution. The ratiosbetween country staff is in practice quite stable.There may not be much potential to expand this.Growth of new member states further limits thepotential. There are some indications thatNorwegian staff levels have not decreased as muchrelatively speaking, as i.e. Sweden.
Staff are hired by ESA and are in principle not toexert national influence. It is however beneficial toNorway to have access to networks and insiders
Section 2.2 Meeting the objectives
is unrelated to the size of the country or the size ofthe financial contribution. Rules for unanimity andtwo-thirds majority gives potential to negotiate andinfluence.
There are reports that Norway acts in the “general”interest most of the time. We don’t see this as anindication of lack of influence but as a choice inhow to manage the culture of consensus.
There is a risk that influence will decline over timeas the involvement EU and coordination among EUmember states may increase. This is however onlya problem as long as there is misalignment ofobjectives or priorities between ESA and Norway.Currently, the objectives seem aligned.
Second, organizational issues such as committeemembership and staffing. Norway has stronger
Norway to have access to networks and insidersand this may be facilitated by Norwegian staff as itis for all other countries.
Third, much more subjective indications indicatereasonable influence. An earlier research report bythe space center suggested that influence was asmuch as “any other country”. Such perceptions arehighly subjective and this cannot be verified.
Certain events suggests influence in matters ofgreat importance for Norway. In particular theredesign of the Galileo orbital constellation isreported to have been influenced by Norway. Theoriginal design had less coverage of the arctic.Activities included financing analytical work todocument effects of alternatives. It is argued thatthe revised constellation is better for allstakeholders regardless of Norwegian interests. As
PwC
membership and staffing. Norway has strongermembership in the boards and committees than itssize would suggest. It has had leadership positionsin important program boards and committees. Infact the number of leadership positions over thelast decade is at par with Switzerland, Span andNetherlands. This suggests influence.
201
stakeholders regardless of Norwegian interests. Assuch there was alignment of interests. Othercountries also had interests in providing improvedcoverage of the arctic.
Number of Norwegian staff is relatively less thanthe level of financial contribution. The ratiosbetween country staff is in practice quite stable.There may not be much potential to expand this.Growth of new member states further limits thepotential. There are some indications thatNorwegian staff levels have not decreased as muchrelatively speaking, as i.e. Sweden.
Staff are hired by ESA and are in principle not toexert national influence. It is however beneficial toNorway to have access to networks and insiders
..
Norway to have access to networks and insidersand this may be facilitated by Norwegian staff as it
, much more subjective indications indicateearlier research report by
the space center suggested that influence was asmuch as “any other country”. Such perceptions arehighly subjective and this cannot be verified.
Certain events suggests influence in matters ofgreat importance for Norway. In particular theredesign of the Galileo orbital constellation isreported to have been influenced by Norway. Theoriginal design had less coverage of the arctic.Activities included financing analytical work todocument effects of alternatives. It is argued thatthe revised constellation is better for allstakeholders regardless of Norwegian interests. As
201
stakeholders regardless of Norwegian interests. Assuch there was alignment of interests. Othercountries also had interests in providing improved

6. Is the Ministry’s governance andinvolvement at the appropriate level?
Five observations:
There may be a rationale for more involvement inthe following areas:
(a)Policy guidance on how to balanceimplementation of national programs withindustrial objectives. There are conflictingobjectives here. Implementation of national
Section 2.2 Meeting the objectives
(d) There will be a need for stronger governmentwide coordination and leadership in the future.Current involvement is appropriate. Future issuesincludes resolving cross-budget financing ofenhanced public sector space capabilities. Thereare also issues with data management andprocessing capabilities where crosscoordination might be needed in the future.
(e) Governance framework (objectives resultindicators) seem overly detailed and possiblyineffective. Consider revisiting this.
objectives here. Implementation of nationalprograms has run into conflicts with principles ofprocurement, competition, favoritism and stateaid. A better strategy for handling this needs to beimplemented.
(b)Policy guidance on how to balance scienceversus industrial financing could be required. Itscurrently not possible to understand thedistribution of funds between the two based upona.o documents presented to Parliament. Yet, thedistribution has changed much over the last fewyears mostly at the discretion of the space agency.Principles and policies for how much is allocatedtowards research institutions, industry or publicsector agencies is not transparent today.
(c) In a scenario where national programs are to be
ineffective. Consider revisiting this.
(f) The larger role of the EU (currently focused onGALILEO and GMES) extends the traditionalscope of space policy.
PwC
(c) In a scenario where national programs are to bescaled up or continue at recent levels, there will bea case for stronger involvement. In particular withassessing larger investment proposals andprograms. There may be a need for capabilities to“second-guess” or independently assess the qualityof the proposals and analysis provided.
202
7. Does the space centre have theappropriate level of administrativeresources to implement the programs?
This is contingent upon external and internaldevelopments in the future. It may impact both thelevel of financing and the skills mix.
Currently it seems reasonably balanced.
A future with even stronger EU involvement inpolicy and prioritization will require a change. This
(d) There will be a need for stronger government-wide coordination and leadership in the future.Current involvement is appropriate. Future issues
budget financing ofenhanced public sector space capabilities. Thereare also issues with data management andprocessing capabilities where cross- governmentcoordination might be needed in the future.
(e) Governance framework (objectives resultindicators) seem overly detailed and possiblyineffective. Consider revisiting this.
policy and prioritization will require a change. Thiscould also entail increased need for policy analystsand related competencies.
A future with stronger and larger nationalprograms will also require increased resource base.This would include skills for programmanagement, oversight and economic planningoption-analysis.
There are some concerns with regards togovernance and procurement in the larger nationalprograms. We would not suggest that the spacecenter invests in procurement capacity to managelarge scale technical acquisitions. Such capacitiesmay be better to acquire from time to time fromthe operational units who benefit from theacquisitions i.e. Defense or Coastal Authority.
ineffective. Consider revisiting this.
(f) The larger role of the EU (currently focused onGALILEO and GMES) extends the traditional
202
acquisitions i.e. Defense or Coastal Authority.These have professional procurement units tohandle technical acquisitions.

Section 2.3
Governance and risks
The objective of this section is to identify governancerisks, mitigation strategies and critical enablers forprogram success.
This will focus on two areas:
I. The concepts for determining objectives,allocating activities and resources andmeasure and report on progress; and
II. Governance risk areas that shouldII. Governance risk areas that shouldmitigated.

Governance framework
The mandate also asks us to review the framework of objectives, results andmonitoring. This is the framework in which government expresses its objectivesand priorities. The space center as the implementing agency is held accountableagainst results. It is also the framework that guides recurring dialogue betweenthe Ministry and the space center.
Section 2.3 Governance
Government sets out the overall objective, and determines five sub-objectives,and further 13 objectives at a level below that. Accompanying the objectives is adescription of budget appropriations corresponding to the accounts of thegovernment budget. There is a total of 19 formulations of objectives, 27indicators (more as several are truncated) and about 20 activities or programsdescribed in accordance with the system of accounts. The objectives haveremained largely unchanged since 2004 although some of the indicators havebeen revised from time to time. Annual reports are produced every year withdetailed narratives describing progress and activities against the objectives.
In addition there exists a “Long-term plan for space activities sin Norway”developed by the space agency. This is a triennial plan setting out an overallobjective (identical to government’s) and five sub-objectives with acorresponding action plan for each objective. Those five objectives broadlycorrespond to the same concepts as in the government framework but thewording , nuances and possibly meaning are different. The space center is
PwC 204
wording , nuances and possibly meaning are different. The space center ismandated by the directives governing the institution to produce such a plan.
Next we turn to observations and suggestions for the system.
Figure 3.1: Governance framework and results indicator
Governance framework with 19 objectives and 27 indicators
204

Framework should be revisited
Issues1. Over focused on performance indicators. Many of the objectives are
basically a long list of performance indicators. This is related to the next:
2. Unclear or lack of prioritization. Are “media appearances” asimportant as “ Achieving international competitiveness for space
Section 2.3 Governance
important as “ Achieving international competitiveness for spaceindustries”? These are both sub-objectives at the same hierarchical level.
3. Unclear logical relationships. Example: “Norway shall have a leadingrole within space related infrastructure in polar regions” is an indicatorsubordinated to “Ensure that the geographical advantages are utilized”. Itseems logical that the latter is an activity which may contribute to the first.
4. Better linkages with activities. The description of activities does suggestwhat their general purpose is. This can still be made clearer and would helpclarify priorities.
5. Feedback and adjustment mechanisms are unclear. The narrativesin the annual reports are narrative and activity based. There are notabulations of indicators or time series. There are various observations andimportant issues are pointed to. This could be more structured andsimplified. Emphasis should be on items useful for control and learning by
PwC 205
simplified. Emphasis should be on items useful for control and learning bythe Ministry, which will enable them to further develop and improve thespace programs.
SuggestionsWe would suggest revisiting this framework. Two considerations in such aprocess:
First, it works best as a process. Clarifying and operationalizing the objectives isa first step in implementing a strategy. It involves prioritizations and requiresinvolvement at the appropriate level.
Second, consider establishing a logical alignment between the governmentframework and the long-term space center plan. Any inconsistency wouldintroduce uncertainty about which frameworks prevails.
205

Governance risk areas should be addressed
Governance risks have been identified during the course of the study. This isnot a focus area of the work but given the consequences for the spaceprograms we note them here.
If not ameliorated, consequences include reputational damage and loss ofcredibility for the space programs, wasteful spending and reducedcompetitiveness of the industry.
The risks may stem from difficult tradeoffs between conflicting objectivesespecially for national programs.
Section 2.3 Governance
especially for national programs.
A better balancing of public sector needs, industrial development and legalcompliance needs to be found.
The specific risks identified are:
I. Procurement and fiduciary risks with AIS satellite.
Non-competitive procurement of AIS satellite, all components, includingAIS receiver by Norwegian producer and service provider fordownloading. and national content. Markets exists for all products andservices. NO public tendering was done. We recommend reviewing theongoing process with AISSat-2.
We also recommend developing strategies to better balance development ofnational programs and regulatory compliance. The approaches we have seenentails to much fiduciary risk.
PwC 206
II. Radar data acquisition. This is similar but considering the agreementis ten years old the focus should be on the strategy for the next acquisition.The previous agreement was also non-competitive. It also entailed severalprovisions unrelated to government need. i.e. national content provisions.There was no competitive process for provision of the national content.This also entails regulatory and fiduciary risks. Careful considerationsshould be given to the balancing of industrial return with the costincreases it entails for government.increases it entails for government.
III. Conflict of interest with Kongsberg Satellite Services. Closerelations and extensive support for Kongsberg Satellite Services impliesconflict of interest, fiduciary risks and blocking new entrant out of themarket. KSAT is recipient of the largest share of the ESA and NRS fundsand part of all national government space activities and has favorableaccess to a.o radar data and AIS signals. There are NSC guidelines for COIbut they are insufficient to ameliorate the risks. These risks are increasingas KSAT grows rapidly, also in the value added segment, and nationalsupport funds and projects involving KSAT expands.
Perceptions of preferred provider status and proximity of relations acts asa disincentive for new entrants in a market dominated by governmentdemand and space center managed programs.
Mitigation strategies include: Transfer ownership management to thegovernments professional ownership department; and/or other solutionsgovernments professional ownership department; and/or other solutionsinclude further divesting the ownership. There may be industrial reasonsfor the latter but is beyond this report to expand on that subject. We seeno negative impacts of mitigating these risks.
206

PwC
Section 3
Suggestions
The objective of this section is advice on future changes to the programpriorities, approaches and governance.
This has two important sections:
I. Strategic considerations: Identify areas of strategic misalignmentof objectives and approaches and suggest ways to readjust; and
II. Operational suggestions: Identify areas where there is risk ofdeficiencies in realization of objectives, high cost inefficiencies orgovernance risks and suggests mitigation strategies to ameliorate thenegative impacts.

Strategic needs
Against the background of the evaluations analysis and conclusions we wouldrecommend the following steps:
1. The support should be reoriented towards segments of industry thatoffer better growth potential and comparative advantages. Maritime andoffshore sectors are the dominant growth driver for the commercial activities ofSatCom services and Earth observation services. The global position is very strong.Technologies are more developed but still in growth phase. Support for near-market ready technologies promise high rewards. There is little involvement of the
Section 3 Suggestions
market ready technologies promise high rewards. There is little involvement of thesupport schemes for this segment and this could be reassessed.
2. Services related to earth observation have anchor tenants and growthdrivers in the Norwegian government which can release technologydevelopment and ensure demand for services. Global market position isstrong. Technologies and service concepts are in the growth phase. Support shouldaim to broaden participation to include other companies. A strategy forcommercialization should be developed for government purchases of earthobservation data services to exploit the government demand as growth driver innew value-added segments. This can benefit from involving a broader segment ofbusinesses and a more competitive and open process than it is today.
3. The support for space related business development should increasein scope across the value chain and in number of companies to ensureequal competitive conditions across actors and solutions. Recruitment ofnew businesses from i.e.. R & D, IT and telecom services expand the base form thecurrent low number of firms who have been repeat actors for decades.
PwC 208
current low number of firms who have been repeat actors for decades.
4. Further support for segments with stagnating growth shouldbe reassessed to ensure that the support matches the growthpotential. Space related ground equipment has some maritime anchortenants, but seems to have decoupled with respect to growth. Supportmust be very carefully considered as contributions to growth and wealthcreation are doubtful. Parts of space manufacturing has a strong trackrecord in global sub segment. There are however no domestic growthfactors. Major obstacles are apparent in global markets. This segmentreceives most support today. Rebalancing should be considered takinginto account whether potential growth and wealth creation impacts arebetter elsewhere.
5. ESA programs are mostly relevant for the upstream spacemanufacturers. ESA programs are less useful for services andother tools may need to be developed and prioritized. Thiscould include expansion of national program expansion may benecessary to provide the near-market-ready support for downstreamservices.
208

Operational suggestions
1. The Ministry should develop a holistic policy for space activitiesincluding determining the relative importance of support industrialdevelopment, public sector programs and science.
2. Space related investments should be made subject to broader economicoption analysis if national program investments are to be expanded. Life-
Section 3 Suggestions
option analysis if national program investments are to be expanded. Life-cycle costs, market options, and tradeoffs between national contentprovision and additional cost for government need to be assessedaccording to normal standards.
3. If bilateral deals and industrial return schemes: consider transparencyand competitive schemes for national content to reduce fiduciary risksand optimize outcome. Bilateral agreements and industrial returns donot come for free. Costs of these against alternatives need to madeexplicit or risk serving narrow interests.
4. There is increasingly a market capable of meeting Norwegiangovernment operational requirements for a.o radar and AIS data.Competitive procurement schemes need to be considered. Consideradvanced procurement strategies to ensure competitive offerings a.ocompetitive dialogue, framework agreements and multiple sources.There may be a need to separate the support schemes from acquisition ofpublic services as tehse serve different needs and objectives. Clarify ordevelop policy principles for how to handle the balance of conflicting
PwC 209
develop policy principles for how to handle the balance of conflictingobjectives for: procurement for public need, industrial developmentobjectives, bilateral collaboration; and legal compliance and fiduciaryrisks. The Ministry should review ongoing and planned procurements orsupport schemes to ensure there is regulatory alignment and fiduciaryrisks are handled. Rapid external developments dictates rethinkingbefore further AIS satellite investments. Market options and viability ofgovernment alternative should be reviewed with proper methods.
5. The Ministry and the Space Centre should reassess the governanceframework and tie this more closely to the governance dialogue andstrategy. The logical framework should be reviewed and furthersimplifications and alignment with the long-term strategic plan shouldbe implemented.
6. Improve transparency of the grant schemes and ESA support.Information is not publically available today and this is problematicespecially n light of how few companies that are involved and thatreceives substantial support.
7. Reduce conflict of interest potential with KSAT by reorganizingownership management.
8. Consider reinforcing monitoring of ESA budget and account measuresthrough the IPSAS accounting transition
9. If further scale-up of national programs, the space center may need to bereinforced.
10. If EU/ESA relationship converge further, the space center may needadditional support.
209

Appendix
I. Appendix 1. Detailed methodologicalnotes on the socio-economic analysis
II. Appendix 2. Detailed review ofII. Appendix 2. Detailed review ofgovernance indicators
PwC
Space programs in Norway • A review of the economics and public policies for developmentof space related capabilities in Norway
94

Appendix 1
PwC
Appendix 1
Detailed methodologicalnotes on the socio-economicanalysis

Introducing Cost-Benefit Analysis
In everyday life, it is often useful to establish whether an activity is ‘worthwhile’ ornot. To do so, we compare the value of the costs with that of the benefits realizedfrom the activity. If the benefits outweigh the costs, the activity is consideredworthwhile, or cost-effective. This is the crux of Cost-Benefit Analysis.
Cost-Benefit Analysis (CBA) is an economic analysis that quantifies in monetaryterms and compares as many of the costs and benefits of a policy as isfeasible, including items for which the market does not provide a satisfactorymeasure of economic value, in order to determine whether the policy has given
Appendix 1
measure of economic value, in order to determine whether the policy has givenrise to a Net Benefit (i.e.. is cost-effective and is justified by economic rationale,subject to consideration of non-monetized costs and benefits) or a Net Cost.
Deflation, discounting and Present Values
Whether one considers prices of groceries, fuel, or wages (the price of labor) theyincrease over time. In economics, the concept is known as inflation, and thedifference in price from one year to the next is known as the inflation rate. Inorder to be able to compare like for like, values are deflated. In the present setting,the production price index for manufacturing is used to make the valuescomparable.
Deflating values, however, is not sufficient, as people generally prefer to receivegoods and services sooner rather than later, and so they value costs incurred andbenefits reaped in the current year higher than those in future years. Thedifference in value from one year to the next is known as the discount rate.
As costs and benefits of policies arise in different time periods, it is necessary to
PwC
As costs and benefits of policies arise in different time periods, it is necessary todiscount future values to a common base year, known as Present Values (PV),in order to permit direct comparison. The difference between the Present Value ofthe stream of benefits and the Present Value of the stream of costs is called theNet Present Value (NPV). A positive NPV, signaling a Net Benefit, is theprimary criterion for deciding whether government action has been justified.Similarly, the Benefit:Cost Ratio is simply the Present Value of Benefits dividedby the Present Value of Costs.
The principle of proportionality implies that the effort applied to theestimation of cost and benefits, should be proportionate to the scale of the costsand benefits, outcomes at stake, sensitivity of the policy and the time available.
and London Economics 212
Non-monetized costs and benefits
A CBA can only incorporate monetizable costs and benefits. This means that the resultingBenefit:Cost Ratio cannot be considered as exclusive and final evidence, but must beseen in the context of non-quantifiable costs and benefits. Non-quantifiable costs andbenefits are discussed qualitatively on separate slides.
Additionality and the counterfactual
The impact of a policy on socio-economic factors depends on the degree of additionality –The impact of a policy on socio-economic factors depends on the degree of additionality –the degree to which the policy has created activity that would not have otherwiseoccurred absent the policy (the counterfactual). All costs and benefits included aredefined and measured as deviations from the counterfactual – the ESA contracts, otherspace sector sales, sales outside of the space sector and related benefits that would nothave been available if Norway had not participated in ESA, or provided support funds.
In terms of the users of ESA program outputs, despite the fact that some data would nothave been available (and therefore some benefits missed), end-users could have hadaccess to much of the data or outputs they currently use from different sources.
The impact is the highest in a case where ESA effectively employ idle workers in Norway,and the skills, innovation and production processes learned by those workers throughESA’s programs allow them to sell goods and services to other clients. If ESA effectivelycrowd out other potential clients, then the impact will be less pronounced.
Norwegian and international best practice
Our analysis is based on Norwegian government and European Commission impact
Sources: Utredningsinstruksen (issued by Fornyings-, Administrasjons- og Kirkedepartementet), TheGreen Book (issued by HM Treasury), and Impact Assessment Guidelines (SEC(2009) 92).
Our analysis is based on Norwegian government and European Commission impactassessment guidelines and international best practice (e.g. UK government HMTreasury’s Green Book).
Underlying CBA model
A detailed Excel-based economic model underlies the analysis (delivered separately).
Other notes
More detailed technical description is provided.
212

Mapping the flow of socio-economic impactsCosts
Research leading to
an ESA contract
Norwegian Government's space related spending
European Space
Agency
Norwegian Space
Centre
Research and
development
facilitated by NSC
fundingESA contracts
Appendix 1
D irect benefits
Corpo-
rate tax
Retained
earningsIncome tax
Value
added
tax
Retailer
sales
revenue
Expenditure increase
N o rwegian ESA co ntracto rs
Employment increase
Salaries
Turnover increase
Profit
Productivity/skills/
efficiency gains
Valued benefits
Innovation facilitated
by ESA contracts
fundingESA contracts
M ult iplier
Prof it margin
Research no t leading
to an ESA contract
PwC
Indirect benefits
Value added
tax
Retailer
sales
revenue
Profits, productivity/skills/efficiency gains, salaries, additional expenditure of salaries
Employment increase Turnover increaseN o rwegian
suppliers
A ddit io nal sales o f N o rwegian ESA co ntracto rs and/ o r N SC funding recipients
Within the space sector Outside
Employment increase
Income taxCorporate
tax
and London Economics
213
ESA programmes
Figure 2.31: Illustration of mapping ofsocioeconomic impacts
User benef its
Public
bodiesAcademia
ESA programmes
Valued
benefits
C o mmercia l
users
N o n-co mmercia l
users
%of inputs from
Norwegian suppliers
ESA programme
outputs
Productivity/skills/
efficiency gainsN o rwegian suppliers
Employment increase Turnover increaseValued benefits
Corporate
tax/
Retained
earnings
Income
tax
VAT/
Sales
revenue
Valued benefits
User benef its
Profits, productivity/skills/efficiency gains, salaries, additional expenditure of salaries
N o rwegian
suppliers
A ddit io nal sales o f N o rwegian ESA co ntracto rs and/ o r N SC funding recipients
Outside the space sector
Employment increase Turnover increase
Valued benefitsRetained
earningsValued benefits Attractiveness
of STEM
careers
Additional sales
products/services
earnings
213

Existing evaluations are limited in their coverage of economic and social impacts
Very often, assessments of the economic benefits flowing from public spending onspace activities limit themselves to estimating the gross impact on companiesbenefiting from space related contracts and the multiplier effect of this impact onthe rest of the economy. Only in some cases is the net (wealth creation) effect orthe wider impact on innovation and technological change at the companies, theirsuppliers and, potentially, in the rest of the economy considered.
Appendix 1
suppliers and, potentially, in the rest of the economy considered.
Examples of such approaches include:
• The Norwegian Space Centre which estimates that for each NOK ofgovernment funding of space activities (ESA or the national support scheme),Norwegian companies have attained in 2009 an additional turnover of 4.7NOK (i.e.. the spin-off factor is 4.7 unadjusted for inflation).
• The European Space Agency estimates that the direct revenues generatedby the space industry (manufacturing and satellite services) represent only17% of the total financial impact of space on the economy. Indirect revenuesgenerated by suppliers to the space industry accounted for 47% of the totalfinancial impact of the space industry and induced revenues (via themultiplier effect) accounted for 36% of the total financial impact of space onthe economy.
• The study by Amesse et al. (2002) of the economic effects and spin-offs ofCanadian space spending adopted the methodology developed by the Bureaud’Economie Théorique et Appliquée (BETA) of the University Louis
PwC
d’Economie Théorique et Appliquée (BETA) of the University LouisPasteur of Strasbourg. This methodology focuses on the indirect, dynamiceffects of R&D projects such as space programs and distinguishes between:
Indirect technological effects arising from:
o the sale of the same product to other customers (i.e.. the extent towhich the turnover of companies increases as a result of additionalsales to third parties of the product/service sold to the space program
o Improvements in the current product line based on the spacetechnology developed for the space client
o Sales of new products based on the space technology
and London Economics 214
Existing evaluations are limited in their coverage of economic and social impacts
Indirect marketing effects which arise from the enhanced reputation ofthe company selling to the space client and improved image followingsuccessful completion of the project for the space client, and potentiallythe network boosted by new firms that were part of the project
Indirect process and organizational effects, i.e.. the learning of newprocesses, methods, management techniques during the course of theprocesses, methods, management techniques during the course of theproject for the space client and the application of these skills outside theproject
Critical mass effect
Using this BETA approach, the study found that the overall ratio of effects forone CDN$ 1 in payment was 4.2 in 1993.
• The BETA team has undertaken numerous evaluations of ESA programsusing the approach outlined above and in a summary of the their studies (seeBach et al., 2002) undertaken for the eighties, they report an overall ratio ofeffects to ESA contracts of slightly more than 3.2.
• A set older US studies, focusing on the impact on the US economy ofspending by NASA aimed to assess the impact of NASA’s spending on privateproductivity using a production function approach.
• Furthermore, various studies focusing on specific spaceprograms/applications used a cost-benefit analysis framework to assess theprograms/applications used a cost-benefit analysis framework to assess thenet impact of particular activities.
Unfortunately, the studies listed above do not fully take account of all theeconomic and social impacts of space-related activities.
On one hand, the BETA-type studies focus primarily on the direct and indirecteffects on the particular firm arising from the demand of a space agency forparticular goods and services. On the other hand, cost-benefit-analyses focus onthe net (benefits less costs) effect of the full range of impacts of specificactivities/programs funded by a space agency.
214

Utilizing the Ripple Effects survey data
The Norwegian Space Centre has run an annual data collection exercise with ESAcontractors and support fund recipients since 1985, with a consistentmethodology, called the ‘Ripple Effects’ survey.
The objective of the Ripple Effects analysis is to understand the impact of ESAsupport on total sales, separated into space- and non-space-related. The primaryoutput of the analysis is the Ripple Effects Multiplier, defined as aggregatesales from 1988 to 2010 divided by aggregate support from 1985 to 2007. Notethat a three year shift is introduced to take account for lag times.
Appendix 1
that a three year shift is introduced to take account for lag times.
It is important to realize that increases in sales are not equal to wealth creation.Wealth creation is the objective of Norway’s space policy, and is a function ofprofits and labor expenditure.
As the Ripple Effects Multiplier is generated using data spanning several decades,there are issues relating to timing:
• Values are not adjusted for inflation. Inflation erodes value over time.Thus, NOK100 is worth less in real terms (buying power) in 2010 than in2004, and significantly less than NOK100 in 1985 – more NOK is required topurchase the same basket of goods today than in earlier years. As the RippleEffects Multiplier simply sums the stream of support and lagged sales over a23 year period, it incorrectly places equal weight on each NOK1 of support in1985 as each NOK1 of sales in 2010, producing a potentially misleadingestimate. In addition, the 3 year gives rise to a systematic (but minor)overstatement of the multiplier.
• Unclear temporal link between ESA contracts and ESA-generated
PwC
• Unclear temporal link between ESA contracts and ESA-generatedsales. Some enterprises may still be reporting ESA-generated sales associatedwith early ESA contracts, others may not. Enterprises may also discount thedegree of ESA-facilitation of their sales. It is unknown.
• Effect smoothed over time. By aggregating sales and support over 23years, fluctuations due to events specific to one year, or a trend over time, maybe dampened by the sheer volume of previous sales and support.
Spin-off company to handle commercialization
One survey respondent has created a spin-off company to commercialize theknowledge gained from the ESA contract, which is not included in the RippleEffects survey, which only covers recipients of ESA or support funding.
and London Economics 215
The spin-off company is currently in its infancy, but has a promising future withsubstantial funding from industry heavyweights starting to materialize. If thisspin-off approach is adopted by more enterprises, then the Ripple EffectsMultiplier will underestimate the effect.
Ripple Effects data
Despite the noted shortcomings of the Ripple Effects Multiplier, the Ripple Effectsurvey data remain the most comprehensive data source to achieve our objective,so it forms the primary data source used in our assessment.so it forms the primary data source used in our assessment.
The Norwegian Space Centre has supplied the Ripple Effects aggregate surveydata for the purpose of this study. The Norwegian Space Centre also provided a listof contacts in the organizations that respond to the Ripple Effects survey.
Individual enterprise-level Ripple Effects survey data
Because the Norwegian space sector firms differ greatly in terms of size, degree ofspace sector specialization, and position in the value chain, the individualresponses from the Ripple Effects survey are necessary to perform a meaningfulimpact assessment. 25 of a total of 26 enterprises agreed to provide their specificresponses from the Ripple Effects survey. Across the period 2004-2010, these 25enterprises account for approximately 95% of the total value of ESA contracts andthe following shares of key information:
• Individual enterprise level
- 25 out of 26 enterprises
- 95% of total ESA contract value 2004-2010
- 100% of total NSCSS funds
- 50% of total turnover
- 33% of total employment
- 100% of space sector profits
- 99% of ESA generated sales within the space sector
- 80% of ESA generated sales outside the space sector
- 99% of non-ESA generated sales within the space sector
215

Filling the information gaps: PwC/LE bespoke survey and workshops
PwC/LE bespoke survey
In order to inform the impact assessment beyond the information that wasavailable in the Ripple Effects survey, PwC and London Economics used an onlinequestionnaire to survey the Norwegian enterprises that participated in the RippleEffects survey.
The questions relate to the financials of each enterprise, and comprise pre-taxprofit margin, labor cost share, and Norwegian supplier input share. These topics
Appendix 1
profit margin, labor cost share, and Norwegian supplier input share. These topicswere delineated into specific parameters for ESA contracts, ESA generated sales tospace sector enterprises and outside, and other space related sales. In addition,questions on indirect effects, such as productivity and marketing gains, from thecontract were included.
A total of 26 enterprises were invited to take part in the analysis, and after aninitial response period reminders were sent to non-responding enterprises, andfollow-up phone calls made to fill in missing responses. 22 of the 26 enterprisesresponded to the survey. These 22 enterprises account for 85% of enterprises and90% of total ESA contract value.
17 of the respondents completed the survey. The response rate varies between theindividual questions. More than two-thirds of the respondents have providedanswers to the questions about ESA contracts, and more than half of respondentsanswered the questions about additional benefits from ESA contracts. ESAgenerated sales within space and outside space were commented on by roughlytwo-thirds and a half of respondents, respectively. Non-ESA generated sales inspace covered by one-third of respondents and impacts on suppliers touch on by
PwC
space covered by one-third of respondents and impacts on suppliers touch on byonly a few of respondents.
In considering these response numbers, however, it is important to note that notall questions apply to all enterprises (e.g. if an enterprise did not experience ESAgenerated sales, questions relating to such sales are void for that respondent), so acomplete set of responses is not necessarily 25.
PwC/LE workshops
PwC and London Economics hosted a workshop with stakeholders fromNorwegian enterprises and research bodies involved with space. The informationobtained there was used to get a feel for the industry as a whole, and to informqualitative discussions about Norway’s benefits from space activity.
and London Economics 216
Filling the information gaps: PwC/LE bespoke survey and workshops
PwC/LE survey particulars
- 22 respondents of 26 enterprises.
- 90% of total contract value accounted for.
◦ By type of sale: ESA contract, ESA-generated space sales, ESA generated non-space sales, NSC generated sales:
› Degree of facilitation by ESA/NSC› Degree of facilitation by ESA/NSC
› Profit margin
› Share of sales value spent on labor
› Share of sales value spent on Norwegian supplier inputs.
◦ In addition, for ESA contracts, effects beyond direct increase in sales:
› Impact on product development capabilities
› Impact on productivity (output per labor hour)
› Impact on sales (e.g. through marketing effects).
◦ Qualitative questions about:
› Users of services
› User benefits
› Impact on suppliers› Impact on suppliers
› Impact on competitors.
The full survey, including response rates is available in the Appendices.
216

Technical description of CBA methodology, input values and sources (i)
The Cost-Benefit Analysis modeling logic
There are two high-level types of benefits. Direct benefits and Indirectbenefits. The direct benefits follow as an immediate effect of ESA contracts (e.g.sales, employment), whilst any secondary effects are termed indirect benefits.
Two types of enterprises are the basis for calculating the direct benefits. They are
Appendix 1
Two types of enterprises are the basis for calculating the direct benefits. They are(i) Norwegian ESA contractors and (ii) Norwegian suppliers to (i).
Norwegian ESA contractors are the enterprises that win contracts with ESA. Thebenefits driven by Norwegian ESA contractors are further separated into staticbenefits (once-off) and dynamic benefits (ongoing).
Direct static benefits through ESA contractors can be thought of as benefitsthat happen at the same time as the ESA contract is active. The benefits accruingto the Norwegian state are driven by wages and profit, measured by taxrevenue, retailer sales revenues, retained earnings, and employment.Three types of tax are relevant: Income tax, value added tax, andcorporation tax.
Multiplying the ESA contract value (Ripple Effects Survey responses) by the shareof ESA contract value spent on labor inputs (PwC/LE bespoke survey) yields thetotal salary bill relating to ESA contracts of ESA contractors. With the total salarybill related to ESA contracts in place, the income tax generated by ESA contractscan be estimated by multiplying the salary bill by the income tax rate
PwC
can be estimated by multiplying the salary bill by the income tax rate(www.skatteetaten.no).
The employees of ESA contracts are remunerated for their ESA work. Under theassumption that they spend their disposable (i.e.. post-tax) income, they will bepaying value added tax on their purchases. However, the spending of theemployees of the Norwegian ESA contractors helps generating jobs and additionaltax revenue in the economy (multiplier effect). The multiplier is assumed at 1.3(Kommunal- og Regionaldepartementet) and multiplied by the disposable incomeof employees of Norwegian ESA contractors and the value added tax rate(www.skatteetaten.no) yields the tax revenues from value added tax. Themultiplied disposable income less value added tax provides a measure of retailersales revenues.
… continued on the next slide (Assumptions, parameter values and sourcesrelating to the above analysis are presented on the right hand side of thisslide)
Technical description of CBA methodology, input values and sources (i)
Relevant input and assumptions values and sources
Direct static benefits through Norwegian ESA contractors:
•ESA contract value is taken from the individual Ripple Effects Survey responses.
•Salary share of ESA contract value taken from PwC/LE bespoke survey.
- 16 respondents provided an estimate in 2005 and 17 respondentsprovided a number in 2010. The number used in the model is the averageof responses weighted by the value of ESA contracts won by theresponding enterprises.
- If the numbers differ, it is assumed that years before 2005 apply the 2005value, years after 2010 apply the 2010 value, and years between 2005 and2010 apply a linear evolution of the parameter value. The weightedaverage of 2005 values is 63.0% and the weighted average of 2010 valuesis 48.7%, so the 2007 value is 57.3%.
•Income tax rate was found on the website of the Norwegian Tax Authorities(www.skatteetaten.no). The latest income tax rate is assumed to persist in thefuture. The income tax rate for 2007 was not available on the website, so it isassumed that the 2007 income tax rate is the simple average of the 2006 and2008 income tax rates.
•The multiplier is based on the finding in Kommunal- og Regionaldepartementet•The multiplier is based on the finding in Kommunal- og Regionaldepartementet“Effekter og effektivitet”, 2004, that public consumption affects BNP at a factor of1.3. Public consumption is almost exclusively made up of salary expenses, so theeffect arises from additional salaries paid. Thus the multiplier is likely to be closeto 1.3.
•Value added tax rate was found on the website of the Norwegian Tax Authorities(www.skatteetaten.no). In Norway, value added tax is different among food,transportation, and general consumption. Using the average consumption patternof Norwegian consumers found on Statistics Norway’s website (www.ssb.no)consumption weighted average value added tax rate was computed.

Technical description of CBA methodology, input values and sources (ii)
The Cost-Benefit Analysis modeling logic (continued)
The calculation of employment increase (job creation) is based on the totalsalary bill. The number of employee years assigned to ESA contracts is defined asthe total salary bill divided by the average salary in the space sector (StatisticsNorway).
Corporation tax is calculated as the ESA contract value (Ripple Effects Survey)multiplied by the pre-tax profit margin on ESA contracts (PwC/LE bespokesurvey) and the corporation tax rate (www.skatteetaten.no). Retained earningsare measured by subtracting corporation tax from the measured profits.
Direct dynamic benefits through ESA contractors are benefits beyond theimmediate and static benefits.
The productivity gains associated with ESA contracts is available from thePwC/LE bespoke survey. It is assumed that 60% of the productivity improvementis legible as profit increases. Total space-related profits is available from theRipple Effects Survey. Multiplying total space-related profits by productivityimprovement, 60% and the corporation tax rate yields the corporation taxrevenues arising from productivity improvements. Retained earnings aremeasured by subtracting corporation tax from the measured profits.
PwC and London Economics
Technical description of CBA methodology, input values and sources (ii)
Relevant input and assumptions values and sources
•Statistics Norway do not provide the average salary for space, so the simpleaverage salary in industry and communications were chosen to reflect that thespace sector is loaded towards high-skilled employment (communications) butcontains manufacturing and engineers as well (industry).
•ESA contract value is read from the individual Ripple Effects Survey responses.
•Pre-tax profit margin on ESA contracts taken from PwC/LE bespoke survey.
- 15 respondents provided an estimate in 2005 (10.2%) and 17 respondentsprovided a number in 2010 (4.5%). The number used in the model is theaverage of responses weighted by the value of ESA contracts won by theresponding enterprises. See “labor cost share” on the previous slide forthe treatment on years different from 2005 and 2010.
•Corporation tax rate was found on the website of the Norwegian Tax Authorities(www.skatteetaten.no). The 2010 corporation tax rate is assumed to persist.
Direct dynamic benefits through Norwegian ESA contractors:
•Total space-related profits is read from the individual Ripple Effects Surveyresponses.
•Productivity improvement from ESA contracts taken from PwC/LE bespokesurvey.survey.
- 10 respondents provided a number (11.2%). The number used in themodel is the average of responses weighted by total space-related profit ofthe responding enterprises.
•The share of productivity feeding into profits is assumed to be less than 100% asfixed cost may impact the calculation. 60% was chosen by London Economics.

Technical description of CBA methodology, input values and sources (iii)
The Cost-Benefit Analysis modeling logic (continued)
The PwC/LE bespoke survey also asked about the share of overall sales (RippleEffects Survey) that could be attributed to ESA contracts. Multiplying the twoterms by the average of ESA generated space-related pre-tax profit margin andNSC generated, not ESA-facilitated space-related sales (PwC/LE bespoke survey),and corporation tax rate yields the corporation tax revenues arising from
Appendix 1
and corporation tax rate yields the corporation tax revenues arising fromadditional sales driven by ESA contracts. Retained earnings are measured bysubtracting corporation tax from the measured profits.
PwC and London Economics
Technical description of CBA methodology, input values and sources (iii)
Relevant input and assumptions values and sources
•Total sales is read from the individual Ripple Effects Survey responses.
•Overall sales increase driven by ESA contract is available from the PwC/LEbespoke survey:
- 11 respondents provided a number (11.2%). The number used in the- 11 respondents provided a number (11.2%). The number used in themodel is the average of responses weighted by total space-related profit ofthe responding enterprises.
•Pre-tax profit margin on ESA generated space-related sales is taken from PwC/LEbespoke survey.
- 13 respondents provided an estimate in 2005 (12.5%) and 17 respondentsprovided a number in 2010 (14.2%). The number used in the model is theaverage of responses weighted by the value of ESA- facilitated space-related sales of the responding enterprises.
•Pre-tax profit margin on NSC-generated sales not facilitated by ESA is taken fromPwC/LE bespoke survey.
- 10 respondents provided an estimate in 2005 (14.5%) and 11 respondentsprovided a number in 2010 (16.3%). The number used in the model is theaverage of responses weighted by the value of NSC-generated sales notfacilitated by ESA of the responding enterprises.facilitated by ESA of the responding enterprises.

Technical description of CBA methodology, input values and sources (iv)
The Cost-Benefit Analysis modeling logic (continued)
Knowing the share of overall sales that is attributable to ESA contracts and theshare of sales value spent on salaries provides the opportunity to calculate theincome tax revenue accruing as a consequence of ESA work. The PwC/LEbespoke survey asks about the salary share of ESA-generate sales in space and thesalary share of NSC-generated sales not facilitated by ESA. The average is used to
Appendix 1
salary share of NSC-generated sales not facilitated by ESA. The average is used tocompute the salary share of total sales. Multiplying total sales by the degree ofadditional sales beyond the ESA contract and the average salary share and theincome tax rate provides the income tax revenue.
The total salary bill from additional sales divided by the average salary in the spacesector provides an estimate of the number of workers employed as a result ofthe additional sales.
Subtracting income tax revenue from the total salary bill yields the disposableincome of worker employed as a result of additional sales arising from ESAcontracts. The disposable income is multiplied by the multiplier defined above,and the weighted average value added tax rate to yield value added taxrevenues arising through additional sales driven by ESA. The multiplieddisposable income less value added tax provides a measure of retailer salesrevenues.
PwC and London Economics
Technical description of CBA methodology, input values and sources (iv)
Relevant input and assumptions values and sources
•Total sales is read from the individual Ripple Effects Survey responses.
•Overall sales increase driven by ESA contract is available from the PwC/LEbespoke survey:
- 10 respondents provided a number (11.2%). The number used in the- 10 respondents provided a number (11.2%). The number used in themodel is the average of responses weighted by total space-related profit ofthe responding enterprises.
•Salary share of ESA generated space-related sales is taken from PwC/LE bespokesurvey.
- 13 respondents provided an estimate in 2005 (39.6%) and 17 respondentsprovided a number in 2010 (38.8%). The number used in the model is theaverage of responses weighted by the value of ESA- facilitated space-related sales of the responding enterprises.
•Salary share of NSC-generated sales not facilitated by ESA is taken from PwC/LEbespoke survey.
- 10 respondents provided an estimate in 2005 (50.5%) and 9 respondentsprovided a number in 2010 (35.4%). The number used in the model is theaverage of responses weighted by the value of NSC-generated sales notfacilitated by ESA of the responding enterprises.facilitated by ESA of the responding enterprises.
•Statistics Norway do not provide the average salary for space, so the simpleaverage salary in industry and communications were chosen to reflect that thespace sector is loaded towards high-skilled employment (communications) butcontains manufacturing and engineers as well (industry).
•Income tax rate, average salary in space, dynamic multiplier, and value added taxrate all defined above.

Technical description of CBA methodology, input values and sources (v)
The Cost-Benefit Analysis modeling logic (continued)
Direct static benefits through suppliers to ESA contractors are measuredusing the share of ESA contract value that is spent on inputs from Norwegiansuppliers (PwC/LE bespoke survey). Multiplying the value of ESA contracts by theshare of ESA contract value spent on inputs from Norwegian suppliers yields thetotal turnover of Norwegian ESA suppliers driven by ESA contracts. Assuming
Appendix 1
total turnover of Norwegian ESA suppliers driven by ESA contracts. Assumingthat salary share and pre-tax profit margin of Norwegian suppliers to ESAcontractors mirror the averages of space-related sales for ESA generated sales forESA contractors (PwC/LE bespoke survey) provides the bases for calculatingcorporation tax revenue and income tax revenue taken through Norwegiansuppliers to ESA contractors.
Corporation tax revenue is calculated as ESA contract value multiplied byNorwegian supplier share (PwC/LE bespoke survey), average pre-tax profitmargin on space-related sales (PwC/LE bespoke survey), and corporation tax rate.Retained earnings are measured by subtracting corporation tax from themeasured profits.
A share of the ESA contract value that goes to suppliers trickles further down thesystem to the suppliers of the suppliers to ESA contractors. Assuming that theratio of leakage to supplier share among suppliers is the same as the ratio amongESA contractors provides a way of calculating the value of what trickles through.The share is defined as
PwC
The share is defined as
Suppliersharesuppliers = Suppliersharecontractors * (1-salarysharesuppliers –profitmarginsuppliers)/(1-salarysharecontractors – profitmargincontractors)
Multiplying the supplier share for suppliers by the value that goes to suppliersyields the value that goes to the suppliers of suppliers. This value is counted asretained earnings.
Income tax revenue is calculated as ESA contract value multiplied byNorwegian supplier share (PwC/LE bespoke survey), average salary share of spacerelated sales (PwC/LE bespoke survey), and income tax rate.
Workers employed by suppliers to ESA contractors caused by the ESAcontracts is calculated as the total salary bill divided by the average salary ofspace-related employees.
and London Economics
Technical description of CBA methodology, input values and sources (v)
Relevant input and assumptions values and sources
Direct static benefits through suppliers to ESA contractors
•ESA contract value is read from the individual Ripple Effects Survey responses.
•Norwegian supplier share of ESA contract value is taken from PwC/LE bespokesurvey.survey.
- 15 respondents provided an estimate in 2005 (12.1%) and 17 respondentsprovided a number in 2010 (21.9%). The number used in the model is theaverage of responses weighted by the value of ESA contracts of theresponding enterprises.
•Average pre-tax profit margin from space-related sales is defined above.
•Average salary share on space-related sales is defined above.
•Pre-tax profit margin and salary shares for contractors are defined above.
•Corporation tax rate and income tax rate are defined above.
•Average salary in space sector is defined above.

Technical description of CBA methodology, input values and sources (vi)
The Cost-Benefit Analysis modeling logic (continued)
Value added tax revenue is calculated as the total salary bill driven by ESAcontracts for suppliers to ESA contractors multiplied by the dynamic multiplierand the value added tax rate. The multiplied disposable income less value addedtax provides a measure of retailer sales revenues.
Appendix 1
Direct dynamic benefits through suppliers to ESA contractors are driven byincreases in productivity.
The productivity gains accruing to suppliers as a result of ESA contracts isavailable from the PwC/LE bespoke survey. It is assumed that 60% of theproductivity improvement is legible as profit increases. The profits calculatedabove form the base of the calculation. Multiplying profits by productivityimprovement, 60% and the corporation tax rate yields the corporation taxrevenues arising from productivity improvements. Retained earnings aremeasured by subtracting corporation tax from the measured profits.
PwC and London Economics
Technical description of CBA methodology, input values and sources (vi)
Relevant input and assumptions values and sources
The dynamic multiplier and value added tax rate are defined above.
Direct dynamic benefits through suppliers to ESA contractors
•Supplier productivity gains driven by ESA contract is available from the PwC/LEbespoke survey:bespoke survey:
- Few respondents were able to quantify additional benefits to suppliers.Those that did quantify, and had supplies in the relevant years, estimated10%, which is the number used in the model.

Technical description of CBA methodology, input values and sources (vii)
The Cost-Benefit Analysis modeling logic (continued)
Indirect static benefits through ESA contractors due to ESA-generatedsales within the space sector are based on ESA-generated sales within the spacesector (Ripple Effects Survey). Multiplying by the share of ESA-generated saleswithin the space sector that is attributable to ESA (PwC/LE bespoke survey) andpre-tax profit margin (PwC/LE bespoke survey) yields the profits earned by ESA
Appendix 1
pre-tax profit margin (PwC/LE bespoke survey) yields the profits earned by ESAgenerated sales for ESA contractors. Further multiplying by the corporation taxrate yields the total corporation tax revenues. Retained earnings aremeasured by subtracting corporation tax from the measured profits.
Multiplying the value of ESA-generated sales within the space sector by the salaryshare of ESA-generated sales within the space sector (PwC/LE bespoke survey)yields the total salary bill attributable to ESA-generated sales within the spacesector. Further multiplying by the income tax rate yields the total income taxrevenue arising from ESA-generated sales within the space sector.
Subtracting the total income tax revenue from the total salary bill attributable toESA-generated sales within the space sector yields disposable income. Multiplyingby the dynamic multiplier and the value added tax rate gives the total valueadded tax revenues caused by ESA-generated sales within the space sector. Themultiplied disposable income less value added tax provides a measure of retailersales revenues.
Dividing the total salary bill by the average salary in the space sector gives the
PwC
Dividing the total salary bill by the average salary in the space sector gives thenumber of workers employed due to ESA-generated sales within the spacesector.
and London Economics
Technical description of CBA methodology, input values and sources (vii)
Relevant input and assumptions values and sources
Indirect static benefits through ESA contractors due to ESA-generated saleswithin the space sector.
•The value of ESA-generated sales within the space sector is read from theindividual Ripple Effects Survey responses.individual Ripple Effects Survey responses.
•The share of ESA-generated sales within the space sector attributable to ESA istaken from the PwC/LE bespoke survey.
- 13 respondents provided an estimate in 2005 (92.7%) and 17 respondentsprovided a number in 2010 (90.7%). The number used in the model is theaverage of responses weighted by the value of ESA- facilitated space-related sales of the responding enterprises.
•Pre-tax profit margin on ESA generated sales within the space sector is takenfrom PwC/LE bespoke survey.
- 12 respondents provided an estimate in 2005 (12.7%) and 17 respondentsprovided a number in 2010 (14.2%). The number used in the model is theaverage of responses weighted by the value of ESA- facilitated space-related sales of the responding enterprises.
•The corporation tax rate is defined above.
•Salary share of ESA generated sales within the space sector is taken from PwC/LE•Salary share of ESA generated sales within the space sector is taken from PwC/LEbespoke survey.
- 13 respondents provided an estimate in 2005 (39.6%) and 17 respondentsprovided a number in 2010 (38.8%). The number used in the model is theaverage of responses weighted by the value of ESA- facilitated space-related sales of the responding enterprises.
•The income tax rate is defined above.
•The dynamic multiplier and weighted average value added tax rate is definedabove.
•The average salary in the space sector is defined above.

Technical description of CBA methodology, input values and sources (viii)
The Cost-Benefit Analysis modeling logic (continued)
Indirect static benefits through suppliers to ESA contractors due to ESA-generated sales within the space sector are based on ESA-generated sales withinthe space sector (Ripple Effects Survey), the share of ESA-generated sales that isattributable to ESA (PwC/LE bespoke survey), and the share thereof spent oninputs from Norwegian supplier (PwC/LE bespoke survey). The product of those
Appendix 1
inputs from Norwegian supplier (PwC/LE bespoke survey). The product of thosefactors forms the basis for the calculations.
Multiplying the basis by the average pre-tax profit margin within space and thecorporation tax rate yields the total corporation tax receipts from suppliers.Retained earnings are measured by subtracting corporation tax from themeasured profits.
A share of the ESA-generated sales that goes to suppliers trickles further down thesystem to the suppliers of the suppliers to ESA contractors who experienceadditional sales. Assuming that the ratio of leakage to supplier share amongsuppliers is the same as the ratio among ESA contractors provides a way ofcalculating the value of what trickles through. The share is defined as
Suppliersharesuppliers = Suppliersharecontractors * (1-salarysharesuppliers –profitmarginsuppliers)/(1-salarysharecontractors – profitmargincontractors)
Multiplying the supplier share for suppliers by the value that goes to suppliersyields the value that goes to the suppliers of suppliers. This value is counted as
PwC
yields the value that goes to the suppliers of suppliers. This value is counted asretained earnings.
The basis multiplied by the average salary share within the space sector yields thetotal salary bill, and the income tax rate provides the total income tax receiptsfrom suppliers.
Subtracting the total income tax receipts from the total salary bill yields disposableincome, and multiplying that number by the dynamic multiplier and the valueadded tax rate provides the total value added tax receipts. The multiplieddisposable income less value added tax provides a measure of retailer salesrevenues.
Dividing the salary bill by the average salary in the space sector provides thenumber of workers employed by suppliers fulfill ESA-generated sales withinthe space sector.
and London Economics
Technical description of CBA methodology, input values and sources (viii)
Relevant input and assumptions values and sources
Indirect static benefits through suppliers to ESA contractors.
•The share of ESA-generated sales within the space sector that is attributable toESA is defined above.
•Norwegian supplier share of the value of ESA-generated sales within the space•Norwegian supplier share of the value of ESA-generated sales within the spacesector is taken from PwC/LE bespoke survey.
- 13 respondents provided an estimate in 2005 (18.4%) and 17 respondentsprovided a number in 2010 (17.7%). The number used in the model is theaverage of responses weighted by the value of ESA-generated salesoutside the space sector of the responding enterprises.
•The average pre-tax profit margin and the corporation tax rate are defined above.
•The average salary share and the income tax rate are defined above.
•Pre-tax profit margin and salary shares for contractors are defined above.
•The dynamic multiplier and the weighted average value added tax rate aredefined above.
•The average salary is defined above.

Technical description of CBA methodology, input values and sources (ix)
The Cost-Benefit Analysis modeling logic (continued)
Indirect static benefits through ESA contractors due to ESA-generatedsales outside the space sector are based on ESA-generated sales outside the spacesector (Ripple Effects Survey) and the share of ESA-generated sales outside thespace sector that is attributable to ESA (PwC/LE bespoke survey). Multiplying bythe pre-tax profit margin (PwC/LE bespoke survey) yields the profits earned by
Appendix 1
the pre-tax profit margin (PwC/LE bespoke survey) yields the profits earned byESA generated sales for ESA contractors. Further multiplying by the corporationtax rate yields the total corporation tax revenues. Retained earnings aremeasured by subtracting corporation tax from the measured profits.
Multiplying the value of ESA-generated sales outside the space sector by the salaryshare of ESA-generated sales outside the space sector (PwC/LE bespoke survey)yields the total salary bill attributable to ESA-generated sales within the spacesector. Further multiplying by the income tax rate yields the total income taxrevenue arising from ESA-generated sales within the space sector.
Subtracting the total income tax revenue from the total salary bill attributable toESA-generated sales outside the space sector yields disposable income.Multiplying by the dynamic multiplier and the value added tax rate gives the totalvalue added tax revenues caused by ESA-generated sales within the spacesector. The multiplied disposable income less value added tax provides a measureof retailer sales revenues.
Dividing the total salary bill by the average salary in the space sector gives the
PwC
Dividing the total salary bill by the average salary in the space sector gives thenumber of workers employed due to ESA-generated sales outside the spacesector.
and London Economics
Technical description of CBA methodology, input values and sources (ix)
Relevant input and assumptions values and sources
Indirect static benefits through ESA contractors due to ESA-generated salesoutside the space sector.
•The value of ESA-generated sales outside the space sector is read from theindividual Ripple Effects Survey responses.individual Ripple Effects Survey responses.
•The share of ESA-generated sales outside the space sector attributable to ESA istaken from the PwC/LE bespoke survey.
- 8 respondents provided an estimate in 2005 (18.7%) and 9 respondentsprovided a number in 2010 (21.0%). The number used in the model is theaverage of responses weighted by the value of ESA- facilitated non space-related sales of the responding enterprises.
•Pre-tax profit margin on ESA generated space-related sales outside the spacesector is taken from PwC/LE bespoke survey.
- 7 respondents provided an estimate in 2005 (6.0%) and 10 respondentsprovided a number in 2010 (9.5%). The number used in the model is theaverage of responses weighted by the value of ESA- facilitated non space-related sales of the responding enterprises.
•The corporation tax rate is defined above.
•Salary share of ESA generated non space-related sales is taken from PwC/LE•Salary share of ESA generated non space-related sales is taken from PwC/LEbespoke survey.
- 8 respondents provided an estimate in 2005 (45.5%) and 10 respondentsprovided a number in 2010 (53.0%). The number used in the model is theaverage of responses weighted by the value of ESA- facilitated non space-related sales of the responding enterprises.
•The income tax rate is defined above.
•The dynamic multiplier and weighted average value added tax rate is definedabove.
•The average salary in the space sector is defined above.

Technical description of CBA methodology, input values and sources (x)
The Cost-Benefit Analysis modeling logic (continued)
Indirect static benefits through suppliers to ESA contractors due to ESA-generated sales outside the space sector are based on ESA-generated sales outsidethe space sector (Ripple Effects Survey) and the share thereof spent on inputsfrom Norwegian supplier (PwC/LE bespoke survey). The product of those factorsforms the basis for the calculations.
Appendix 1
forms the basis for the calculations.
Multiplying the basis by the average pre-tax profit margin outside space and thecorporation tax rate yields the total corporation tax receipts from suppliers.Retained earnings are measured by subtracting corporation tax from themeasured profits.
A share of the ESA-generated sales that goes to suppliers trickles further down thesystem to the suppliers of the suppliers to ESA contractors who experienceadditional sales. Assuming that the ratio of leakage to supplier share amongsuppliers is the same as the ratio among ESA contractors provides a way ofcalculating the value of what trickles through. The share is defined as
Suppliersharesuppliers = Suppliersharecontractors * (1-salarysharesuppliers –profitmarginsuppliers)/(1-salarysharecontractors – profitmargincontractors)
Multiplying the supplier share for suppliers by the value that goes to suppliersyields the value that goes to the suppliers of suppliers. This value is counted asretained earnings.
PwC
retained earnings.
The basis multiplied by the average salary share outside the space sector yields thetotal salary bill, and the income tax rate provides the total income tax receiptsfrom suppliers.
Subtracting the total income tax receipts from the total salary bill yields disposableincome, and multiplying that number by the dynamic multiplier and the valueadded tax rate provides the total value added tax receipts. The multiplieddisposable income less value added tax provides a measure of retailer salesrevenues.
Dividing the salary bill by the average salary in the space sector provides thenumber of workers employed by suppliers fulfill ESA-generated sales withinthe space sector.
and London Economics
Technical description of CBA methodology, input values and sources (x)
Relevant input and assumptions values and sources
Indirect static benefits through suppliers to ESA contractors.
•The share of ESA-generated sales outside the space sector that is attributable toESA is defined above.
•Norwegian supplier share of the value of ESA-generated sales outside the space•Norwegian supplier share of the value of ESA-generated sales outside the spacesector is taken from PwC/LE bespoke survey.
- 7 respondents provided an estimate in 2005 (16.0%) and 9 respondentsprovided a number in 2010 (11.5%). The number used in the model is theaverage of responses weighted by the value of ESA-generated salesoutside the space sector of the responding enterprises.
•The average pre-tax profit margin and the corporation tax rate are defined above.
•The average salary share and the income tax rate are defined above.
•Pre-tax profit margin and salary shares for contractors are defined above.
•The dynamic multiplier and the weighted average value added tax rate aredefined above.
•The average salary is defined above.

Technical description of CBA methodology, input values and sources (xi)
The Cost-Benefit Analysis modeling logic (continued)
Indirect static benefits through ESA contractors due to NSC-generatedsales within the space sector not facilitated by ESA are based on other sales withinthe space sector (Ripple Effects Survey). Multiplying by the share of other salesattributable to NSC and not ESA (PwC/LE bespoke survey) and pre-tax profitmargin (PwC/LE bespoke survey) yields the profits earned by NSC-generated
Appendix 1
margin (PwC/LE bespoke survey) yields the profits earned by NSC-generatedsales. Further multiplying by the corporation tax rate yields the totalcorporation tax revenues. Retained earnings are measured by subtractingcorporation tax from the measured profits.
Multiplying the value of NSC-generated sales within the space sector by the salaryshare of NSC-generated sales within the space sector (PwC/LE bespoke survey)yields the total salary bill attributable to NSC-generated sales within the spacesector. Further multiplying by the income tax rate yields the total income taxrevenue arising from NSC-generated sales within the space sector.
Subtracting the total income tax revenue from the total salary bill attributable toNSC-generated sales within the space sector yields disposable income. Multiplyingby the dynamic multiplier and the value added tax rate gives the total valueadded tax revenues caused by NSC-generated sales within the space sector. Themultiplied disposable income less value added tax provides a measure of retailersales revenues.
Dividing the total salary bill by the average salary in the space sector gives the
PwC
Dividing the total salary bill by the average salary in the space sector gives thenumber of workers employed due to NSC-generated sales within the spacesector.
and London Economics
Technical description of CBA methodology, input values and sources (xi)
Relevant input and assumptions values and sources
Indirect static benefits due to NSC-generated sales within the space sector.
•The value of other sales within the space sector is read from the individual RippleEffects Survey responses.
•The share of NSC-generated sales within the space sector not attributable to ESA•The share of NSC-generated sales within the space sector not attributable to ESAis taken from the PwC/LE bespoke survey.
- 10 respondents provided an estimate in 2005 (36.9%) and 11 respondentsprovided a number in 2010 (60.5%). The number used in the model is theaverage of responses weighted by the value of other space-related sales ofthe responding enterprises.
•Pre-tax profit margin on NSC-generated sales within the space sector is takenfrom PwC/LE bespoke survey.
- 6 respondents provided an estimate in 2005 (14.5%) and 8 respondentsprovided a number in 2010 (16.3%). The number used in the model is theaverage of responses weighted by the value of other space-related sales ofthe responding enterprises.
•The corporation tax rate is defined above.
•Salary share of NSC-generated sales within the space sector is taken fromPwC/LE bespoke survey.PwC/LE bespoke survey.
- 7 respondents provided an estimate in 2005 (50.5%) and 9 respondentsprovided a number in 2010 (35.4%). The number used in the model is theaverage of responses weighted by the value of other space-related sales ofthe responding enterprises.
•The income tax rate is defined above.
•The dynamic multiplier and weighted average value added tax rate is definedabove.
•The average salary in the space sector is defined above.

Technical description of CBA methodology, input values and sources (xii)
The Cost-Benefit Analysis modeling logic (continued)
Indirect static benefits through suppliers due to NSC-generated sales withinthe space sector are based on ESA-generated sales within the space sector (RippleEffects Survey), the share of other sales that is attributable to NSC (PwC/LEbespoke survey), and the share thereof spent on inputs from Norwegian supplier(PwC/LE bespoke survey). The product of those factors forms the basis for the
Appendix 1
(PwC/LE bespoke survey). The product of those factors forms the basis for thecalculations.
Multiplying the basis by the average pre-tax profit margin within space and thecorporation tax rate yields the total corporation tax receipts from suppliers.Retained earnings are measured by subtracting corporation tax from themeasured profits.
A share of the NSC-generated sales that goes to suppliers trickles further down thesystem to the suppliers of the suppliers to ESA contractors who experienceadditional sales. Assuming that the ratio of leakage to supplier share amongsuppliers is the same as the ratio among ESA contractors provides a way ofcalculating the value of what trickles through. The share is defined as
Suppliersharesuppliers = Suppliersharecontractors * (1-salarysharesuppliers –profitmarginsuppliers)/(1-salarysharecontractors – profitmargincontractors)
Multiplying the supplier share for suppliers by the value that goes to suppliersyields the value that goes to the suppliers of suppliers. This value is counted as
PwC
yields the value that goes to the suppliers of suppliers. This value is counted asretained earnings.
The basis multiplied by the average salary share within the space sector yields thetotal salary bill, and the income tax rate provides the total income tax receiptsfrom suppliers.
Subtracting the total income tax receipts from the total salary bill yields disposableincome, and multiplying that number by the dynamic multiplier and the valueadded tax rate provides the total value added tax receipts. The multiplieddisposable income less value added tax provides a measure of retailer salesrevenues.
Dividing the salary bill by the average salary in the space sector provides thenumber of workers employed by suppliers fulfill NSC-generated sales withinthe space sector.
and London Economics
Technical description of CBA methodology, input values and sources (xii)
Relevant input and assumptions values and sources
Indirect static benefits through suppliers to NSC-generated sellers.
•The share of other sales within the space sector that is attributable to NSC isdefined above.
•Norwegian supplier share of the value of NSC-generated sales within the space•Norwegian supplier share of the value of NSC-generated sales within the spacesector is taken from PwC/LE bespoke survey.
- 6 respondents provided an estimate in 2005 (12.1%) and 8 respondentsprovided a number in 2010 (17.2%). The number used in the model is theaverage of responses weighted by the value of other sales of theresponding enterprises.
•The average pre-tax profit margin and the corporation tax rate are defined above.
•The average salary share and the income tax rate are defined above.
•Pre-tax profit margin and salary shares for contractors are defined above.
•The dynamic multiplier and the weighted average value added tax rate aredefined above.
•The average salary is defined above.

Technical description of CBA methodology, input values and sources (xiii)
The Cost-Benefit Analysis modeling logic (continued)
Static benefits arising from recouped expenses on the running the NorwegianSpace Centre.
One entry of the running cost of the Norwegian Space Centre is likely to be partlyrecouped. Salaries and social expenses (NSC Annual Reports) are liable for
Appendix 1
recouped. Salaries and social expenses (NSC Annual Reports) are liable forincome tax.
Multiplying salaries and social expenses by the income tax rate yields the totalincome tax receipts attributable to Norwegian Space Centre employees.
Subtracting income tax receipts from the total salary bill of the Norwegian SpaceCentre yields the disposable income of Norwegian Space Centre employees.Multiplying the disposable income by the dynamic multiplier and the weightedaverage value added tax rate provides the value added tax receipts fromNorwegian Space Centre employees. The multiplied disposable income less valueadded tax provides a measure of retailer sales revenues.
Temporal assumption
In order to make fair comparisons between present, future and past costs andbenefits, a discount factor (Finansdepartementet) is used.
PwC and London Economics
Technical description of CBA methodology, input values and sources (xiii)
Relevant input and assumptions values and sources
Static benefits arising from recouped expenses on the running the NorwegianSpace Centre.
•Salaries and social expenses is read from the annual reports of the NorwegianSpace Centre for the period 2004-2010.Space Centre for the period 2004-2010.
•The income tax rate is defined above.
•The dynamic multiplier and weighted average value added tax rate are definedabove.
Temporal assumption
•The discount rate used is the one recommended in Finansdepartementet, R-109/2005, 2005.

PwC and London Economics bespoke survey (i)
PwC/LE bespoke survey questions and number of responses:
Q1: Please provide the name of your enterprise: 22 responses.
Q2: If your enterprise received NSC support funds between 2004 and 2010, wouldyou say these funds were a critical enabler* to winning the types of contractslisted below?
Appendix 1
listed below?
a. An ESA contract: 19 responses. (16 Yes)
b. A non-ESA space-related contract: 16 responses. (11 Yes)
c. A non-space-related contract: 14 responses. (4 Yes)
Q3: In respect of your enterprise’s ESA contracts in 2005 and 2010, pleaseindicate the following items as a percentage (%) of total contract value:
a. Labor costs %: 2005: 16 responses, 2010: 17 responses.
b. Inputs from Norwegian suppliers %: 2005: 15 responses, 2010: 17responses.
c. Pre-tax profit margin %: 2005: 15 responses, 2010: 17 responses.
Q4: Would you say that ESA contracts and/or NSC support funds have an impacton you enterprise in addition to the direct increase in sales turnover andemployment? 21 responses. (16 Yes)
PwC
Q5: Please indicate the nature and approximate effect size** of such additionalimpacts.
a. Your product development capabilities: Type of effect: 12 responses,Effect size: 12 responses.
b. Productivity (i.e.. process efficiency): Type of effect: 9 responses, Effectsize: 10 responses
*: it would not have been possible for your enterprise to win the contract without the NSC supportfunds.
**: In addition to the numerical effect size, please choose and specify (in the answer box) your measure(for example: % reduction in R&D cost; % reduction in unit production costs; % increase in turnover;etc.).
and London Economics
PwC and London Economics bespoke survey (i)
c. Sales (i.e.. network, reputation, flight heritage): Type of effect: 11responses, Effect size: 10 responses.
d. Other (please specify): Type of effect: 7 responses, Effect size: 2responses.
Q6: In respect of the ultimate end-users of the ESA program to which your ESAQ6: In respect of the ultimate end-users of the ESA program to which your ESAcontract(s) contributed (e.g. government agencies, commercial enterprises,consumers), please indicate:
a. What are the main end-users of the ESA program?: 18 responses
b. What benefits would such end-users derive from the ESA program?: 18responses
Q7: In respect of ‘Space-related sales facilitated by an ESA contract and anyrelated NSC funding’ in 2005 and 2010, please indicate the following items asa percentage (%) of the total value of such sales.
a. Degree of facilitation by ESA contract/NSC funding %: 2005: 13responses, 2010: 17 responses.
b. Labor cost %: 2005: 13 responses, 2010: 17 responses.
c. Inputs from Norwegian suppliers %: 2005: 13 responses, 2010: 17responses.
d. Pre-tax profit margin %: 2005: 12 responses, 2010: 17 responses.
Q8: End-users of ‘Space-related sales facilitated by an ESA contract and anyrelated NSC funding’
a. What are the main groups of end-users? 13 responses
b. What benefits would such end-users derive?: 14 responses

PwC and London Economics bespoke survey (ii)
Q9: In respect of ‘Non-space-related sales facilitated by an ESA contract and anyrelated NSC funding’ in 2005 and 2010, please indicate the following items asa percentage (%) of the total value of such sales.
a. Degree of facilitation by ESA contract/NSC funding %: 2005: 8 responses,2010: 11 responses.
Appendix 1
b. Labor cost %: 2005: 8 responses, 2010: 10 responses.
c. Inputs from Norwegian suppliers %: 2005: 7 responses, 2010: 9responses.
d. Pre-tax profit margin %: 2005: 7 responses, 2010: 10 responses.
Q10: End-users of ‘Non-space-related sales facilitated by an ESA contract and anyrelated NSC funding’
a. What are the main groups of end-users? 10 responses
b. What benefits would such end-users derive?: 10 responses
Q11: In respect of ‘Other-space-related sales, NOT facilitated by an ESA contractand any related NSC funding’ in 2005 and 2010, please indicate the followingitems as a percentage (%) of the total value of such sales.
a. Degree of facilitation by NSC funding (please consider only NSC fundingthat did not lead to an ESA contract*) %: 2005: 10 responses, 2010: 11
PwC
that did not lead to an ESA contract*) %: 2005: 10 responses, 2010: 11responses.
b. Labor cost %: 2005: 7 responses, 2010: 9 responses.
c. Inputs from Norwegian suppliers %: 2005: 6 responses, 2010: 8responses.
d. Pre-tax profit margin %: 2005: 6 responses, 2010: 8 responses.
*: NSC support funds that did lead to an ESA contract has already been considered in earlier questions.The responses given here will be matched to the ‘Other space-related sales’ data from the Ripple Effectssurvey.
and London Economics
PwC and London Economics bespoke survey (ii)
Q12: End-users of ‘Other-space-related sales, NOT facilitated by an ESA contractand any related NSC funding’
a. What are the main groups of end-users? 8 responses
b. What benefits would such end-users derive?: 8 responses
Q13: Would you say that your enterprise’s ESA contracts and/or NSC supportQ13: Would you say that your enterprise’s ESA contracts and/or NSC supportfunds have any impact on your suppliers, in addition to the direct sales andemployment effects? 15 responses. (6 Yes)
Q14: Please indicate the nature and approximate effect size** of such supplierimpacts.
a. Suppliers’ product development capabilities: Type of effect: 5 responses,Effect size: 4 responses.
b. Suppliers’ productivity (i.e.. process efficiency): Type of effect: 3responses, Effect size: 4 responses
c. Suppliers’ sales (i.e.. network, reputation, flight heritage): Type of effect:6 responses, Effect size: 5 responses.
d. Other (please specify): Type of effect: 2 responses, Effect size: 3responses.
Q15: Would you say that your enterprise’s ESA contracts and/or NSC support
**: In addition to the numerical effect size, please choose and specify (in the answer box) your measure(for example: % reduction in R&D cost; % reduction in unit production costs; % increase in turnover;etc.).
Q15: Would you say that your enterprise’s ESA contracts and/or NSC supportfunds have any impact on your competitors. If yes, please explain. 9responses.
Q16: Are there any other comments that you wish to make to the project team? 13responses

Derivation of cost inputs (Norwegian ESA expenditure)
Potential costs data are available from a number of sources, but the values arequite different. The following approach rests on several data sources in order toensure that the costs side of the CBA accurately reflects space-related costspertaining to the subset of enterprises that provided individual Ripple Effects(RE).
Norway’s total ESA budget (budget) is available from the Norwegian Space
Appendix 1
Norway’s total ESA budget (budget) is available from the Norwegian SpaceCentre’s annual reports. The budget covers contribution to ESA’s programs, whichin turn covers the contracts (contracts) that Norwegian firms win, and theadministration costs (admin) of the ESA programs.
The individual Ripple Effects data does not hold all the Norwegian enterprises ororganizations that won ESA contracts or received funding from the NorwegianSpace Centre’s Support Scheme. As the individual Ripple Effects data forms thebackbone of the Cost-Benefit Analysis, it is necessary to include only a share of thebudget in the analysis.
The share of the budget that is included in the CBA comprises ESA contracts to theindividual Ripple Effects enterprises, and the share of admin costs of Norway’sESA participation that is attributable to those firms. Admin costs must be includedbecause the enterprises that supplied individual Ripple Effects responses couldnot have got the contracts in the absence of admin costs.
The contract value used in the CBA is directly loaded from the individual RippleEffects survey. The value of admin costs pertaining to the individual Ripple Effects
PwC
Effects survey. The value of admin costs pertaining to the individual Ripple Effectssurvey enterprises is calculated using the following formula:
(Budget – Contract value (RE) – Contract value (Non-RE))* (Contract value(RE)/Contract value (Non-RE))
Contract value (non-RE) is calculated based on the Norwegian Space Centre’s datafor ESA contract value. The numbers from this source do not match with thenumbers from the Ripple Effects survey, but we assume that the shares areaccurate. Thus, the ratio of total contract value (non-RE) from the NorwegianSpace Centre source over total contract value (RE), multiplied by contractvalue(RE) yields a number that is comparable in size to the number from theRipple Effects survey, and a ratio comparable to the numbers from the NorwegianSpace Centre data.
and London Economics
Derivation of cost inputs (Norwegian ESA expenditure)

Appendix 2
PwC
Appendix 2
Detailed review ofgovernance indicators

Objective 1a
Objective 1The objective is formulated as “Ensuring that space activities have significantindustrial ripple effects”. Output measures relate to a range of different concepts andthere are seven quantitative indicators defined.
Progress against the objective is mixed. We will review the issues in turn:
Appendix 2
1a): International positions show overall decline with some bright spots.Overall global market share for Norwegian space firms have declined from about2,8 percent to 2 percent during 2005-2010. There are declining market shares inlarge segments of the industry including ground equipment and satellitecommunications services. Ground equipment producers may have dropped fromabove 3 to about 1 percent over the last five years. SatCom services also show adecline from about 4,5 to 3,8 percent. Satellite manufacturing and launchersshow small market shares of about 0,2-3 percent. These are increasing. Mostgrowth is seen in earth observation services and there are considerable marketshares in this segment. About 10-20 percent in aggregate depending upon howthe market is defined.
Export shares have fallen. From about 82 percent of sales in 2005 to 68 percentin 2010. Exports of both services and products have declined relative to otherNorwegian exports of services and products respectively. Product export hasdeclined since 1997. Reductions since 2003 are 33 and 43 percent respectively.
PwC 234
declined since 1997. Reductions since 2003 are 33 and 43 percent respectively.
Several individual firms have strong positions in particular micro segments. Thisapplies across all segments of the value chain.
Source: See section 1.1. and 1.2 for a definition of the value chain, market segments and moredetailed analysis of development, positioning and growth constraints.
industrial ripple effects”. Output measures relate to a range of different concepts andOutcome Output Indicator
1a) Norwegian spaceenterprises achieving
Export share of
Figure 2.40: MoTI framework for objective 1
1a): International positions show overall decline with some bright spots.Overall global market share for Norwegian space firms have declined from about
2010. There are declining market shares in
communications services. Ground equipment producers may have dropped from
Export shares have fallen. From about 82 percent of sales in 2005 to 68 percent1) Significant
industrial rippleeffects
enterprises achievingstrong internationalpositions
Export share ofNorwegian spaceindustry
1b) Full industrialreturn on ESA
programs
Accumulated returncoefficient (from 2000)
Accumulated value ofESA contracts (from2000)
1 c) Norwegianenterprises competingon same terms asEuropean firms for
Galileo contracts toNorwegian enterprises[New 2011]
234
Several individual firms have strong positions in particular micro segments. This
Galileo contracts [New2011]
[New 2011]
1d) Industrial rippleeffects in addition to
return on ESAprograms
Ripple factor
Value of Norwegianproduced goods andservices in spaceindustry

1 b) There is not full industrial return on the ESA programs
Overall rate is at 90 percent in June 2011. A special initiative has beenlaunched by ESA to direct more contracts toward Norway. The ratio islowest in the mandatory programs at 68 percent. It is highest in thetechnology development programs with guaranteed returns of 100 percent.
Objective 1b-c
Appendix 2
technology development programs with guaranteed returns of 100 percent.In other Optional programs it is about 84 percent. The ratio of contributionsto guaranteed and non-guaranteed return is about 50/50.
Without taking into account the juste retour weights, the overall returnexceeds 100 percent. Many Norwegian contracts are for service delivery andthese have lower weights.
Contract volumes have increased. They have not fully met the target.
Actual financial return ratio is about 58 percent. This is the ratio betweenactual contributions from Norway and value of all contracts received. Thisratio has been decreasing from about two-thirds earlier in the decade. Thisis impacted by a rise in Norwegian contributions to ESA which have notbeen fully matched by rising contract volumes.
PwC 235
1 c) Norwegian firms have in practice similar access to Galileodevelopment contracts as European
ESA is an implementing agency of the EU in this regard. The procurement iscompetitive and do not follow the ESA industrial return scheme. Themarkets are open to companies with headquarters located outside themarkets are open to companies with headquarters located outside theborders of the Union, without prejudice. However, in the original provisionsfor Galileo procurement, for security reasons only EU firms may participatein public procurement of the deployment phase. The holder of a contractmay, however, outsource production of non-security sensitive productsand services to a.o countries of the European Economic Area(Norway) or other third countries.*
Special provisions and agreements were entered into between Norway andrelevant European Authorities that ameliorated the restrictions effectivefrom 2009/2010.
A Norwegian firm won a subcontract of about 170 million NOK in 2010.Total Norwegian appropriations for Galileo development phase are at about550 million NOK and spread over 2008-2013.
235
1 d) There are industrial ripple effects but turnover is decreasing.
Industrial ripple effects are seen at about 4.3 in aggregate and at about 3.5median value per firm. The indicator accumulates “ESA generated sales”sales during 1985-2010 by ESA and space center support.
There are differences among segments whereby earth observation servicesare highest at about 7 and with highest growth rate. Support to Institutional
Objective 1d
Appendix 2
are highest at about 7 and with highest growth rate. Support to InstitutionalR&D have lowest ripple effects. Ground equipment show declining rippleeffects over two decades but remain second highest. Satellite componentand launcher producers show slowly increasing ripple effects at about 3.7.Satcom services ripple effects cannot be measured as the firms who havereceived support do not respond to the survey. Those firms have shownrapid growth but the impact of ESA support cannot be ascertained here.
Ripple effects impact space sales and non-space sales about equally. Totalnon-space sales for the supported firms have however been increasing evenfaster indicating that those sales are driven by other factors than impactfrom the ESA support.
There is also an indicator for total turnover for the industry. This has beendecreasing since 2003. Inflation adjusted the decline is about 15-25 percent.See discussion of the overall objective 2 pages above and analysis of rippleeffects on pages 167.
PwC 236
Note: Our numbers differ from earlier space center reports as we have adjusted the 1985-2010values for inflation. See page 167 for a discussion of ripple effect methodology.
236

Objective 2
Objective 2The objective is formulated as “High utilization of Norway's geographical advantage”. There is onlyone output measure: “Norway holding a leading role in the Arctic space related infrastructure”.
There are four indicators relating to business performance targets for Kongsberg Satellite Servicesand Andøya Rocket range. It also asks to include an assessment of market shares. The latter is not
Appendix 2
and Andøya Rocket range. It also asks to include an assessment of market shares. The latter is notreported in a structured format. This is only part of the monitoring framework that has businessperformance targets for specific commercial businesses aligned with government targets.
Two additional targets were added in 2011 and not shown here. They pertain to the navigationalmatters: Number of Galileo and EGNOS ground stations and participation in Global NavigationSatellite System(GNSS) research.
KSAT business is going strong. The company operates commercially but has strong governmentbacking. There has been some capital support for its Antarctica site. Its market share is hard todetermine. We have estimated ScanEx of Russia and SSC of Sweden to track more satellites (150/100)but the exact definitions of the performance indicators is not available from all parties andcomparability cannot be fully assessed. Total market value globally may be estimated but is beyondthis study to investigate. The complicating factor is that many ground stations are operated as fullyfunded government agencies. Others are built by satellite operators. There are however not manyindependent ground station operators serving polar satellites exclusively. The market forgeostationary ground stations/teleports is much larger and possible to define, but less relevant as
PwC 237
geostationary ground stations/teleports is much larger and possible to define, but less relevant asbenchmark though there may be some substitution. See our analysis of KSAT on page 83.
Andøya rocket business has seen some decline though student rockets are increasing. The decline isreported as being caused by shrinking science budgets. Numbers for their key competitor, Esrange inKiruna, show about similar numbers. Andøya is supported through a special program to incentivizeuse, a bilateral agreement between six countries including Esrange. (EASP) Financing has averaged24 million NOK annually since 2007 and an additional allocation of 15 million was provided tosupport infrastructure in 2010. EASP is outside of the purview of this study.
Source: See section 1.1. and 1.2 for a definition of the value chain, market segments and moredetailed analysis of development, positioning and growth constraints.
The objective is formulated as “High utilization of Norway's geographical advantage”. There is onlyone output measure: “Norway holding a leading role in the Arctic space related infrastructure”.
There are four indicators relating to business performance targets for Kongsberg Satellite Servicesand Andøya Rocket range. It also asks to include an assessment of market shares. The latter is not
Antennas Satellites tracked
KSAT growing
Figure 2.40: MoTI framework for objective 2
and Andøya Rocket range. It also asks to include an assessment of market shares. The latter is notreported in a structured format. This is only part of the monitoring framework that has businessperformance targets for specific commercial businesses aligned with government targets.
Two additional targets were added in 2011 and not shown here. They pertain to the navigationalmatters: Number of Galileo and EGNOS ground stations and participation in Global Navigation
KSAT business is going strong. The company operates commercially but has strong governmentbacking. There has been some capital support for its Antarctica site. Its market share is hard todetermine. We have estimated ScanEx of Russia and SSC of Sweden to track more satellites (150/100)but the exact definitions of the performance indicators is not available from all parties andcomparability cannot be fully assessed. Total market value globally may be estimated but is beyondthis study to investigate. The complicating factor is that many ground stations are operated as fullyfunded government agencies. Others are built by satellite operators. There are however not manyindependent ground station operators serving polar satellites exclusively. The market forgeostationary ground stations/teleports is much larger and possible to define, but less relevant as
19 1925
33
2007 2010
Antennas
3950 50
70
2007 2010
Satellites tracked
87
4
Science rockets
1
Technology rockets
Andøya activity declining
237
geostationary ground stations/teleports is much larger and possible to define, but less relevant asbenchmark though there may be some substitution. See our analysis of KSAT on page 83.
Andøya rocket business has seen some decline though student rockets are increasing. The decline isreported as being caused by shrinking science budgets. Numbers for their key competitor, Esrange inKiruna, show about similar numbers. Andøya is supported through a special program to incentivizeuse, a bilateral agreement between six countries including Esrange. (EASP) Financing has averaged24 million NOK annually since 2007 and an additional allocation of 15 million was provided to
1
2007 2010
0 0 0
2007 2010
6 7 6
13
2007 2010
Student rockets
3001 2999
10941765
2007 2010
Research days

Objective 3
Objective 3The objective is worded as developing cost-effective systems meeting nationaland international demand. Output measures relate to two different concepts:
First, the performance of satellite navigational systems covering the arcticregions. Those presented here relate to EGNOS (Airtrafic) and have recently
Appendix 2
regions. Those presented here relate to EGNOS (Airtrafic) and have recentlybeen replaced by Galileo. Egnos (airtrafic) performance was reported as “not fullcoverage in accordance with operative demands.” in 2010. From 2011 this isreplaced by a Galileo/GNSS measure.
The logic being that ESA membership would influence the performance of thesesystems in arctic regions. We have earlier discussed the influence. Norway heldthe chairmanship of the navigational committee in ESA for some years duringmid-2000’s when Galileo was being designed. There are indications ofNorwegian influence, in particular on Galileo design as pointed to earlier.
Second, this objective of developing cost-effective systems meeting nationaldemand has driven much of the efforts behind the SatOcean program discussedin section 2.2. These efforts can only be seen as successful and are discussedextensively above. The indicators presented here may not fully capture theimpacts of these programs.
PwC 238
We note that the number of satellites being used, and the number of agenciesusing them are increasing. Most of this use is quite sporadic. Agencies aretesting, experimenting and much is ad-hoc. It still seem accurate that usageoverall is increasing. There are about four agencies in Norway that can be seen ashigh level users where satellite information is an integral part of their operations.The numbers do not capture use of mainstreamed satellite services, i.e.telephone or satellite TV. Government use is discussed above in section 1.3 andimpacts in 2.1.
Source: See section 1.3. and 2.1 for a more extensive analysis of government use and impacts.
Figure 2.41: Government satellite usage (2006-2010)
Four heavy users of satellite data in general andmany more emerging
Figure 2.40: MoTI definition of objective 3
13
18 18 1921
2006 2010
Agencies using sat.
Outcome Output Indicator
3a) Adequate ArcticEGNOS performance[replaced 2011]
EGNOS performance inKirkenes/Tromsø [2010replaced 2011]
14 15 1620 22
2006 2010
Gov satellite use
238
3) Developing cost-effective systemsmeeting nationaland international
demand
[replaced 2011] replaced 2011]
3c) Norway being aleading nation in
satellite informationusage
No. of satellites usedregularly by Norwegiangovernment agencies
No. of Norwegiangovernment agenciesusing satelliteinformation regularly

Objective 4
Objective 4The objective is worded as Strengthening Norwegian research communitiesthrough international cooperation. Output measures relate to two differentconcepts: Norwegian research communities having central roles in space relatedresearch projects ; and Norwegian scientists having access to the best satellitemeasurements in their field of research.
Appendix 2
measurements in their field of research.
Scientists with access to satellite data has increased much over the last five years.Whether this represent improved access or more scientists exploring these fields isnot explicit but possibly mostly the first. Number of researchers involved in spacerelated research projects is reported to be increasing. Whether and how this can bemeasured has been a recurring theme in the dialogue between the space centre andthe MoTI.
The logic here is that ESA membership creates access for Norwegian scientists. ESAcreates opportunities particularly within the scientific programs. There is acoordination mechanisms with the research council for this. Governmentinstruments to support space sciences are also about more instruments than ESAand includes the research council, EU FP’s basic funding for universities a.o.
A large scientific ESA engagement by Norway relates to experiments on theInternational Space Station (ISS). An extensive multi-disciplinary program
PwC 239
International Space Station (ISS). An extensive multi-disciplinary programmanaged by NTNU. This includes a control center, one of ten globally. About 7percent of the Norway’s ESA Optional contracts over the last decade has beendevoted to this.
The impact and effectiveness of the science support must be analyzed holistically tobe meaningful. We do not explore this in more depth here. Issues of coordinationhave been discussed in section above under relevance (page 199).
Four heavy users of satellite data in general andradar data in particular
Figure 2.43: MoTI definition of objective 4
Outcome Output Indicator
4a) Norwegian researchcommunities havingcentral roles in space
No. of projects withNorwegian
Figure 2.42: Scientific satellite usage
249314 320
388
2007 2010
Scientists using sat.
239
4) StrengtheningNorwegian research
communitiesthrough
internationalcooperation
central roles in spacerelated researchprojects
Norwegianparticipants/ leaders
4b) Norwegianscientists having accessto the best satellitemeasurements in theirfield of research
No. of scientistsactively using data fromsatellites, spacestations etc.

Objective 5
Objective 5The objective is worded as Increasing knowledge in science and technology throughinformation from the space industry. There are three output measures: Increasing theoutward information flow; Increasing media attention and Increasing activity towards students.
The activity level is very high. Four lectures weekly, twice weekly radio appearances, weekly events
Appendix 2
The activity level is very high. Four lectures weekly, twice weekly radio appearances, weekly eventswith 30 participants on average. This has increased much over the last five years. Website iselaborate and has frequent visitors. There are also student offers for support in writing master thesisand other research. TV appearances is the only indicator that show a decline.
The broader concept here relates to education, recruitment and work force capabilities over the longrun. The
PwC 240
Increasing knowledge in science and technology throughThere are three output measures: Increasing the
outward information flow; Increasing media attention and Increasing activity towards students.
The activity level is very high. Four lectures weekly, twice weekly radio appearances, weekly events
Figure 2.43: Outreach activities
922
4350
60 60
Space center events
10001210
934
160020001900
Event participants
The activity level is very high. Four lectures weekly, twice weekly radio appearances, weekly eventswith 30 participants on average. This has increased much over the last five years. Website iselaborate and has frequent visitors. There are also student offers for support in writing master thesis
The broader concept here relates to education, recruitment and work force capabilities over the long
922
2005 2010 2005 2010
95 115140
160200 200
2005 2010
External lectures
138500
130000
136000
200000
215000
130000
2005 2010
Website visitors
896689
1430
759 850 1000
Citations
6575 70
60 65 70
Radio appearance
240
689 759 850
2005 2010 2005 2010
27 3025
2015
10
2005 2010
TV appearance
8064 65
35
60
83
2005 2010
Study offer

PwC copyright 20012