Book Inventory Book Inventory System Application - Sample database lab project
Upload
khangminh22Category
view
0download
0
Documents 21/2011
Trond Sandmo
The Norwegian Emission Inventory 2011
Documentation of methodologies for estimating emissions of greenhouse gases and long-range transboundary air pollutants
Statistisk sentralbyrå • Statistics NorwayOslo–Kongsvinger

In this series, documentation, method descriptions, model descriptions and standards are published.
Documents
Symbols in tables SymbolCategory not applicable .Data not available ..Data not yet available …Not for publication :Nil -Less than 0.5 of unit employed 0Less than 0.05 of unit employed 0.0Provisional or preliminary figure *Break in the homogeneity of a vertical series —Break in the homogeneity of a horizontal series |
© Statistics Norway, June 2011 When using material from this publication, Statistics Norway shall be quoted as the source. ISBN 978-82-537-8131-0 Printed version ISBN 978-82-537-8132-7 Electronic version ISSN 1891-5906 Subject: 01.90, 01.04.10 Print: Statistics Norway
Decimal punctuation mark .

Documents 21/2011 The Norwegian Emission Inventory 2011
Statistics Norway 3
Preface This report documents the methodologies used in the Norwegian inventory of emissions to air. The present report is the latest in a series of annually updated versions of a report originally published in 2005. The Norwegian emission inventory is a joint undertaking between the Climate and Pollution Agency and Statistics Norway. Emission data are used for a range of national applications and for international reporting. The emissions covered in this report are those embraced by the conventions for emissions of greenhouse gases and long-range transboundary pollutants, i.e. they are defined with a territorial delimitation. The calculation methods used and the documentation of these, are, as far as possible, in accordance with the strict demands formulated in the emission conventions. The report has been prepared by Statistics Norway’s Division for Environmental Statistics, and has been edited by Trond Sandmo, with contributions from Kathrine Loe Bjønness, Ketil Flugsrud, Britta Hoem, Nina Holmengen, Lisbet Høgset, Marte Kittilsen, Håkon Skullerud and Kristin Aasestad. The Climate and Pollution Agency has also contributed to the report. The emission statistics are available at http://www.ssb.no/english/subjects/01/klima_luft_en/.

The Norwegian Emission Inventory 2011 Documents 21/2011
4 Statistics Norway
Abstract The Norwegian emission inventory is a joint undertaking between the Climate and Pollution Agency1 and Statistics Norway. Statistics Norway is responsible for the collection and development of activity data, and emission figures are derived from models operated by Statistics Norway. The Climate and Pollution Agency is responsible for the emission factors, for providing data from specific industries and sources and for considering the quality, and assuring necessary updating, of emission models like, e.g., the road traffic model and calculation of methane emissions from landfills. Emission data are used for a range of national applications and for international reporting. The Climate and Pollution Agency is responsible for the Norwegian reporting to United Nations Framework Convention on Climate Change (UNFCCC) and to United Nations Economic Commission Europe (UN-ECE). This report documents the methodologies used in the Norwegian emission inventory of greenhouse gases (GHG), acidifying pollutants, heavy metals (HM) and persistent organic pollutants (POPs). The documentation will also serve as a part of the National Inventory Report submitted by Norway to the United Nations Framework Convention on Climate Change (UNFCCC), and as documentation of the reported emissions to UNECE for the pollutants restricted by CLRTAP (Convention on Long-Range Transboundary Air Pollution). LULUCF is not considered in this report, see the National Inventory Report (Climate and Pollution Agency 2011b) for documentation on this topic. This report replaces the previous documentation of the emission model (Sandmo 2010), and is the latest annually updated version of a report edited by Britta Hoem in 2005. The most important changes since last year’s documentation are:
• To define the different economic sectors in the Norwegian emission model, the standard industrial classification SIC2007 has replaced the previous SIC2002 (Appendix F)
• A new model for calculating emissions to air (HBEFA) from road traffic has been incorporated. The time series for CH4, N2O, NOX, NMVOC, CO, NH3 and particle emissions from road traffic have thus been recalculated. There have been some changes made to the activity data, e.g. a new data source on annual driving lengths has been utilised and more detailed information on traffic activity has been taken into account
• Emissions of CH4 from gas distribution have for the first time been included in the inventory
• The calculation method for NOx emissions from production of silicon metal has been revised
• For national navigation, revised emission factors for NOX emissions from gas engines and emissions of particulate matter from oil based fuels and LNG have been introduced
• A new uncertainty analysis for greenhouse gases has been performed, and the main results are documented in this report
Furthermore, there are lower emission figures for CH4 for all years since 1990 due to revisions of Statistics Norway’s waste statistics, but there are no methodological changes in the calculation of these emissions. There have also been several minor changes in the emission figures, e.g. due to changes in figures on energy combustion. Chapter 8 Recalculations gives a more thorough description of changes in the most recent emission calculations.
The Norwegian Emission Inventory 2011; Documentation of methodologies for estimating emissions of greenhouse gases and long-range transboundary air pollutants is also available at http://www.ssb.no.
1 The Climate and Pollution Agency was up to 2010 called The Norwegian Pollution Control Authority, abbreviated SFT. In this publication, the previous name and abbreviation are used in some contexts, mainly in connection with references to publications.

Documents 21/2011 The Norwegian Emission Inventory 2011
Statistics Norway 5
Contents Preface ................................................................................................................................. 3 Abstract................................................................................................................................. 4 1. Introduction ............................................................................................................ 7 1.1. Inventory documentation: Needs and plans .............................................................. 7 1.2. Institutional arrangements ......................................................................................... 8 1.3. The process of inventory preparation ........................................................................ 9 1.4. Definitions and structure.......................................................................................... 10 1.5. Quality Assurance and Quality Control (QA/QC)..................................................... 11 1.6. Uncertainties in total emissions............................................................................... 16 1.7. Key category analyses ............................................................................................ 20 1.8. Completeness ......................................................................................................... 21 1.9. Indirect CO2 emissions from CH4 and NMVOC....................................................... 23 2. The Norwegian emission model; general description....................................... 25 2.1. Structure of the general emission model ................................................................. 25 2.2. The four axes: Pollutants, industries, fuels, and sources ........................................ 25 2.3. Regions: a fifth axis ................................................................................................. 28 3. Energy ................................................................................................................... 29 3.1. Overview ................................................................................................................. 29 3.2. Energy combustion.................................................................................................. 29 3.2.1. Overview ................................................................................................................. 29 3.2.2. Energy industries..................................................................................................... 37 3.2.3. Manufacturing industries and construction .............................................................. 42 3.2.4. Transport................................................................................................................. 43 3.2.5. Other sectors........................................................................................................... 63 3.2.6. International bunkers............................................................................................... 65 3.2.7. CO2 emissions from biomass .................................................................................. 66 3.3. Energy production (fugitive emissions from fuels) ................................................... 66 3.3.1. Overview ................................................................................................................. 66 3.3.2. Fugitive emissions from coal mining and handling .................................................. 67 3.3.3. Fugitive emissions from uncontrolled combustion and burning coal dumps............ 69 3.3.4. Oil and natural gas .................................................................................................. 69 3.3.5. CO2 capture and storage at the oil and gas production field Sleipner West ............ 77 3.3.6. CO2 capture and storage at Hammerfest LNG/the gas-condensate production
field Snøhvit ............................................................................................................ 79
4. Industrial processes............................................................................................. 83 4.1. Overview ................................................................................................................. 83 4.2. Mineral products...................................................................................................... 83 4.2.1. Cement production .................................................................................................. 83 4.2.2. Lime production....................................................................................................... 85 4.2.3. Limestone and Dolomite Use .................................................................................. 86 4.2.4. Concrete pumice stone ........................................................................................... 87 4.2.5. Rock wool production .............................................................................................. 88 4.2.6. Glass and glassfibre production .............................................................................. 89 4.2.7. Ore mines................................................................................................................ 90 4.2.8. Mining and extraction of stones and minerals ......................................................... 91 4.2.9. Production of mineral white (plaster) ....................................................................... 92 4.2.10. Construction and repairing of vessels - Sandblasting............................................. 93 4.2.11. Sandpit and rock-crushing plant .............................................................................. 94 4.2.12. Construction and building........................................................................................ 95 4.2.13. Leather preparing .................................................................................................... 95 4.3. Chemical Industry.................................................................................................... 96 4.3.1. Production of fertilisers............................................................................................ 96 4.3.2. Carbide production .................................................................................................. 98 4.3.3. Manufacture of other inorganic chemicals............................................................. 104 4.4. Metal production.................................................................................................... 109 4.4.1. Production of iron and steel................................................................................... 109 4.4.2. Production of ferroalloys........................................................................................ 111 4.4.3. Production of primary aluminium........................................................................... 117 4.4.4. Production of secondary aluminium ...................................................................... 122 4.4.5. Production of magnesium...................................................................................... 123 4.4.6. Other metals.......................................................................................................... 125 4.4.7. Manufacture of anodes.......................................................................................... 127 4.5. Other production.................................................................................................... 128 4.5.1. Pulp and paper ...................................................................................................... 128 4.5.2. Food and Drink...................................................................................................... 130 4.6. Consumption of halocarbons and SF6................................................................... 131 4.6.1. HFCs and PFCs from products and processes ..................................................... 131

The Norwegian Emission Inventory 2011 Documents 21/2011
6 Statistics Norway
4.6.2. Emissions of SF6 from products and processes ................................................... 132 4.7. Other Lubricants and waxes.................................................................................. 134 4.7.1. Paraffin wax use.................................................................................................... 134
5. Solvent and other product use.......................................................................... 136 5.1. Overview ............................................................................................................... 136 5.2. Solvent losses (NMVOC) ...................................................................................... 136 5.3. Use of solvents...................................................................................................... 139 5.4. Production of asphalt............................................................................................. 141 5.5. Other product use.................................................................................................. 142 6. Agriculture .......................................................................................................... 145 6.1. Overview ............................................................................................................... 145 6.2. Emissions from enteric fermentation in domestic livestock ................................... 145 6.3. Emissions from manure management................................................................... 148 6.4. Direct and indirect emissions from agricultural soils.............................................. 155 6.5. Emissions from agricultural residue burning (agricultural wastes)......................... 163 6.6. Other agricultural emission sources ...................................................................... 165 7. Waste................................................................................................................... 167 7.1. Overview ............................................................................................................... 167 7.2. Solid waste disposal on land ................................................................................. 167 7.3. Waste water handling............................................................................................ 171 7.4. Waste incineration................................................................................................. 175 7.5. Other emission sources from the waste sector ..................................................... 177 8. Recalculations .................................................................................................... 179 8.1. Specific description of the recalculations............................................................... 179 8.2. Implications of the recalculations for the greenhouse gases ................................. 185 8.3. Overall description of the recalculations for the long-range transboundary air
pollutants............................................................................................................... 186 8.4. Specific description of the recalculations............................................................... 187 8.5. Implications of the recalculations for long-range transboundary air pollutants ...... 195 9. Areas for further improvement.......................................................................... 197 9.1. Overview ............................................................................................................... 197 9.2. General ................................................................................................................. 197 9.3. Energy................................................................................................................... 197 9.4. Industry ................................................................................................................. 197 9.5. Agriculture ............................................................................................................. 197 References........................................................................................................................ 198 Appendix A: Abbreviations ............................................................................................. 210 Appendix B: Emission factors ........................................................................................ 211 Appendix C: Activity data and emission figures ........................................................... 225 Appendix D: Uncertainty estimates for single sources ................................................ 226 Appendix E: Key category analysis for GHG................................................................. 243 Appendix F: Economic sectors in the Norwegian emission model ............................. 244 Appendix G: Source classifications used in the Norwegian emission inventory....... 248 Appendix H: Methane emissions from enteric fermentation in Norway’s cattle
and sheep population................................................................................ 251 Appendix I: QA/QC performed for GHG emissions from industrial plants included
in the national GHG inventory .................................................................... 261 List of figures.................................................................................................................... 264 List of tables ..................................................................................................................... 265

Documents 21/2011 The Norwegian Emission Inventory 2011
Statistics Norway 7
1. Introduction
1.1. Inventory documentation: Needs and plans Emission data are used in many contexts nationally, and also reported internationally. There is widespread interest for the emission figures and for the methods used to perform the calculations. The emission data are based on a mix of measurements and calculations. The purpose of this report is to document the methodologies used in the Norwegian emission inventory of greenhouse gases (GHG), acidifying pollutants, heavy metals (HM) and persistent organic pollutants (POPs). The documentation has also served as a part of the National Inventory Report (Climate and Pollution Agency 2011b) submitted by Norway to the United Nations Framework Convention on Climate Change (UNFCCC), and as documentation of the reported emissions to UNECE for the pollutants restricted by CLRTAP (Convention on Long-Range Transboundary Air Pollution). The emissions covered in this report are those embraced by the conventions for emissions of greenhouse gases and long-range transboundary pollutants, i.e. they are defined with a territorial delimitation. The calculation methods used and the documentation of these, are, as far as possible, in accordance with the strict demands formulated in the emission conventions. The structure of this report follows, as does the National Inventory Report (Climate and Pollution Agency 2011b), guidelines given by UNFCCC. However, the National Inventory Report discusses only greenhouse gases, and also includes LULUCF emissions. As the latter emissions not are included in the emission figures estimated and presented by Statistics Norway, they are not discussed in this report. This documentation report will be updated annually, usually in early summer. Users of the printed version of the documentation are advised to consult the web version (at www.ssb.no/english/subjects/01/04/10/) for possible recent updates. This documentation report is the latest in a series of updated versions of a report edited by Britta Hoem in 2005, and replaces the preceding (Sandmo 2010). The most important changes in this edition are the inclusion of emissions of CH4 from gas distribution, the introduction of a new model for estimating emissions from road traffic, a new calculation method for NOx emissions from production of silicon metal, and revised emission factors for NOx and particulate matter from ships. Also, a new standard for industrial classification has been introduced, as SIC2007 replaces SIC2002, and the main results from a new uncertainty analysis for greenhouse gases are presented. In addition there have been several minor changes in the emission figures in the 2011 inventory, e.g., some figures reported from plants to the Climate and Pollution Agency have replaced earlier reported figures. Chapter 8 Recalculations gives a more thorough description of changes in the most recent emission calculations. The Division for Environmental Statistics at Statistics Norway has prepared this report. The report has been edited by Trond Sandmo, with contributions from Kathrine Loe Bjønness, Ketil Flugsrud, Britta Hoem, Nina Holmengen, Lisbet Høgset, Marte Kittilsen, Håkon Skullerud and Kristin Aasestad at Statistics Norway. The Climate and Pollution Agency has also contributed to the report.

The Norwegian Emission Inventory 2011 Documents 21/2011
8 Statistics Norway
1.2. Institutional arrangements
1.2.1. Responsibilities for emission calculations The Norwegian emissions inventories have been produced for more than two decades as a collaboration between Statistics Norway (SSB) and the Climate and Pollution Agency. Statistics Norway is responsible for the official statistics on emissions to air. This includes:
• collection of activity data • operation and further development of models for emission estimation • emission calculations • filling in most of the tables for international reporting to UNFCCC and
UNECE • publishing national official statistics on emissions to air.
The Climate and Pollution Agency is responsible for:
• overall responsibility for international reporting to UNFCCC and UNECE • emission factors for all sources • measured emission data from large industrial plants based on individual
reports submitted to the Climate and Pollution Agency on a regular basis • considering the quality and assuring necessary updating, of emission
models like, e.g., the road traffic model and calculation of methane emissions from landfills
• submitting amounts of import and export data of HFCs, PFCs and SF6. Activity data2 are collected either internally at Statistics Norway (e.g. data on energy use, industrial production, number of animals, etc.) or reported to Statistics Norway from external sources such as the Norwegian Petroleum Directorate (OD) and the Public Road Administration (VD). Emission figures are derived from models operated by Statistics Norway. In the modelling activities Statistics Norway makes use of the data collected by the Climate and Pollution Agency on emission factors, emissions from industrial plants and on imports and exports of HFCs, PFCs and SF6. The Climate and Pollution Agency is responsible for quality control of the data they deliver to the emission model operated by Statistics Norway, but Statistics Norway makes an additional consistency check (see chapter 1.5). Statistics Norway is responsible for quality control of the activity data and the emission figures from the model, but the Climate and Pollution Agency also participates in this quality control.
1.2.2. National entity under the Kyoto protocol The Climate and Pollution Agency has been appointed by the Ministry of the Environment as the national entity for greenhouse gas inventories as defined by Article 5.1 of the Kyoto Protocol through the budget proposition to the Storting (Norwegian parliament) for 2006, which states that "The Norwegian system will build on an existing cooperation between the Climate and Pollution Agency and i.a. Statistics Norway. On this background the Climate and Pollution Agency is appointed as a national entity with overall responsibility for the inventory and reporting". (St. prop. No. 1 (2005-2006)). The Ministry of the Environment proposes building the national system around well-established institutional cooperation. The data collection and data management is secured through three main acts, the Pollution Control Act (forurensningsloven), the Greenhouse Gas Emission Trading Act (klimakvoteloven) and the Statistical Act (statistikkloven).
2 Data on the magnitude of human activity resulting in emissions or removals taking place during a given period of time.
Documents 21/2011 The Norwegian Emission Inventory 2011
Statistics Norway 9
The Norwegian national system for production of greenhouse gas inventories is based on an extensive institutional cooperation. The Climate and Pollution Agency, Statistics Norway and the Norwegian Forest and Landscape Institute are the core institutions in the national system. The Norwegian Forest and Landscape Institute is responsible for calculations of emissions and removals from IPCC sector 5, Land Use and Land Use Change and Forestry - LULUCF (until 2006 the Norwegian Institute of Land Inventory (NIJOS)) and Article 3.3 and 3.4 under the Kyoto Protocol. Sector 5 is not included in this report since sinks and sources of greenhouse gases from LULUCF are not included in the national emission data presented by Statistics Norway each year.
1.3. The process of inventory preparation The Norwegian emission inventory is based on a general emission model and a series of more detailed satellite models, which cover specific emission sources and pollutants (e.g. road traffic, air traffic, landfills, solvents, HFCs, SF6, PFCs). These models are operated by Statistics Norway. Data and information on point sources are recorded at the Climate and Pollution Agency in the database Forurensning and published in Norske utslipp (http://www.norskeutslipp.no). This is the Norwegian Pollutant Release and Transfer Register (PRTR). Forurensning is a further development of the old register Inkosys, which was introduced in 1978 as an internal tool for the authorities. The database was upgraded in 1992, and has later been under con-tinuous development in order to harmonise with the PRTR adopted by the OECD in 1996. Each polluting industrial installation or plant is subjected to licensing and is obliged to produce an annual report to the pollution control authorities. The report should provide activity data, emission figures and information about the particular source, and it should address compliance with current environmental standards. The Climate and Pollution Agency supplies Statistics Norway with data from the Norwegian PRTR which are relevant for the preparation of the national emission inventory.
1.3.1. Pollutants included, data collection, processing and archiving Statistics Norway collects the majority of data necessary to run the Norwegian emission model. These are as follows: activity levels, emission factors, aggregated results from the satellite models and emission figures for point sources. Table 1.1 gives an overview of the pollutants included in the emission inventory.

The Norwegian Emission Inventory 2011 Documents 21/2011
10 Statistics Norway
Table 1.1. Definition of pollutants in the Norwegian emission inventory
Class Pollutant Symbol Definition
Greenhouse gases
Carbon dioxide CO2
Methane CH4
Nitrous oxide N2O
Perfluorocarbons PFCs CF4 + C2F6 + C3F8
Hydrofluorocarbons HFCs HFC-23, HFC-32, HFC-125, HFC-134, HFC-134a, HFC-143, HFC-143a, HFC-152a, HFC-227ea
Sulphur hexafluoride SF6
Acidifying gases
Sulphur dioxide SO2
Nitrogen oxides NOx NO + NO2
Ammonia NH3
Heavy metals (HM)
Lead Pb
Cadmium Cd
Mercury Hg
Arsenic As
Chromium Cr
Copper Cu
Persistent organic pollutants (POPs)
Polycyclic Aromatic Hydrocarbons
PAH Emissions are calculated for PAH-total, PAH-6 and PAH-4. PAH-total includes 16 components according to Norwegian Standard (NS9815). PAH-6 is OSPARs Borneff-6 and include 6 components. PAH-4 is consisting of four components used as an indicator for PAH emissions required for reporting to CLRTAP.
Dioxins - Dioxin emissions are given in the unit I-TEQ, which is required for reporting to CLRTAP. I-TEQ is based on the international model ("Nato-modell") and is the sum of PCDD/PCDF multiplied by the components toxicity equivalency factor (I-TEF). TEQ = sum (PCDDi * TEFi) + sum (PCDDj * TEFj).
Particulates
Total suspended particulates
TSP
- PM10 Particulate matter with diameter less than 10μm - PM2.5 Particulate matter with diameter less than 2.5μm Other pollutants
Carbon monoxide CO
Non-methane volatile organic compounds
NMVOC
The collected data are subjected to the Quality Assurance and Quality Control (QA/QC) routines described in section 1.5 as well as source specific routines as described under each source chapter. They are subsequently processed by Statistics Norway into a format appropriate to enter the emission models. The models are designed in a manner that accommodates both the estimation methodologies reflecting Norwegian conditions and those recommended internationally. Input data used and the model output are all stored at Statistics Norway. Relevant information including dates and procedures followed are also recorded.
1.4. Definitions and structure The structure of this documentation follows the nomenclature used for reporting to UNFCCC in the Common Reporting Format (CRF) and to the Convention on Long-Range Transboundary Air Pollution (CLRTAP) as Nomenclature For Reporting (NFR). The main sectors here are: 1A. Energy combustion

Documents 21/2011 The Norwegian Emission Inventory 2011
Statistics Norway 11
1B. Energy production 2. Industrial processes 3. Solvent and other product use 4. Agriculture 5. Land use change and forestry 6. Waste The description of the pollutants included is given in table 1.1. Emissions of heavy metals, POPs and particulates are further described in the reports Finstad et al. (2001), Finstad et al. (2002b), Finstad and Rypdal (2003) and Finstad et al. (2003).
1.5. Quality Assurance and Quality Control (QA/QC) This chapter describes general QA/QC procedures. For source specific QA/QC, see each source sector for detailed descriptions. The QA/QC work has several dimensions. In addition to accuracy, also timeliness is essential. As these two aspects may be in conflict, the QA/QC improvements in recent years have been focused on how to implement an effective QA/QC procedure and how to obtain a more efficient dataflow in the inventory system. During the past years several quality assurance and quality control procedures for the preparation of the national emission inventory have been established in Norway. Statistics Norway made its first emission inventory for some gases in 1983 for the calculation year 1973. The emission estimation methodologies and the QA/QC procedures have been developed continuously since then. Norway has implemented a formal quality assurance/quality control or verification plan. A detailed description of this is presented in Annex V in the National Inventory Report 2011. The established QA/QC procedures include the following:
• The Climate and Pollution Agency is the national entity designated to be responsible for the reporting of the national inventory of greenhouse gases to the UNFCCC. This includes coordination of the QA/QC procedures;
• Statistics Norway is responsible for the quality control system with regard to technical activities of the inventory preparation;
• A Tier 1 general inventory level QC procedures, as listed in table 8.1 of the IPCC Good Practice Guidance is performed every year;
• Source category-specific QC procedures are performed for all key categories and some non-key categories; with regard to emission factors, activity data and uncertainty estimates (Tier 2).
1.5.1. QA Procedures According to the IPCC Good practice guidance, good practice for QA procedures requires an objective review to assess the quality of the inventory and to identify areas where improvements could be made. Furthermore, it is good practice to use QA reviewers that have not been involved in preparing the inventory. In Norway, the Climate and Pollution Agency is responsible for reviewing the inventory with regard to quality and areas for improvement. For most sources it is a person within the the Climate and Pollution Agency who has not been involved in the calculations and the quality controls who performs the QA for the particular source. Norway has performed several studies comparing inventories from different countries (Haakonsen et al. 2000). Verification of emission data is another element to be assessed during the elaboration of a QA/QC and verification plan.

The Norwegian Emission Inventory 2011 Documents 21/2011
12 Statistics Norway
All three core institutions are responsible for archiving the data they collect and the estimates they calculate with associated methodology documentation and internal documentation on QA/QC. Due to the differences in the character of data collected, Norway has chosen to keep archiving systems in the three core institutions, which means that not all information is archived at a single location. These archiving systems are, however, consistent, and operate under the same rules. Although the data are archived separately, all can be accessed efficiently during a review.
1.5.2. General QC procedures The Norwegian emission inventory is produced in several steps. Preliminary estimates are first produced three months after the end of the inventory year. These data are based on preliminary statistics and indicators and data that have been subjected to a less thorough quality control. The "final" update takes place about one year after the inventory year. At this stage, final statistics are available for all sources and also regional emission data are calculated. Recalculations of the inventory are performed annually, as methodological changes and refinements are implemented. In itself, this stepwise procedure is a part of the QA/QC-procedure since all differences in data are recorded and verified by the Climate and Pollution Agency before publication of the emission figures (see section 1.2). For each of the steps described above, general quality control procedures are performed, but with different levels of detail and thoroughness as mentioned. The national emission model was revised in 2002 in order to facilitate the QC of the input data rather than the emission data only. Input data include emissions reported from large plants, activity data, emission factors and other estimation parameters. In the following, the procedures listed in table 8.1 of the Good Practice Guidance (IPCC 2000), the Tier 1 General Inventory Level QC Procedures, are gone through, and it is described how these checks are performed for the Norwegian greenhouse gas emission inventory. Check that assumptions and criteria for the selection of activity data and emissions factors are documented Thorough checks of emission factors and activity data and their documentation have been performed for existing emission sources. When new sources appear (for example a new industrial plant) or existing sources for the first time are recognised as a source, the Climate and Pollution Agency delivers all relevant information to Statistics Norway. This information is then thoroughly checked by two members of the inventory team at Statistics Norway. All changes in methodologies or data are documented and kept up to date. Check for transcription errors in data input and references Activity data are often statistical data. Official statistical data undergo a systematic revision process, which may be manual or, increasingly frequently, computerised. The revision significantly reduces the number of errors in the statistics used as input to the inventory. Check that emissions are calculated correctly When possible, estimates based on different methodologies are compared. An important example is the metal production sector where CO2 estimates reported by the plants are compared with estimates based on the Good Practice methodology corrected for national circumstances. In this case, both production based and reducing agent based calculations are performed to verify the reported value. The Climate and Pollution Agency and Statistics Norway control and verify emission data reported to the Climate and Pollution Agency by industrial enterprises, registered in the database Forurensning. First, the Climate and Pollution Agency checks the data received from these plants, and if errors are discovered, they may then ask the plants’ responsible to submit new data. Subsequently, Statistics Norway makes, where possible, comparable emission calculations based on

Documents 21/2011 The Norwegian Emission Inventory 2011
Statistics Norway 13
activity data sampled in official statistics, and deviations are explained through contact with the plants. Regarding more detailed information about the QC of data reported by industrial plants, see section 1.5.3. Check that parameter and emission units are correctly recorded and that appropriate conversion factors are used All parameter values are compared with values used in previous years and with any preliminary figures available. Whenever large deviations are detected, the value of the parameter in question is first checked for typing errors or unit errors. Changes in emissions from large plants are compared with changes in activity level. If necessary, the primary data suppliers (e.g. the Norwegian Forest and Landscape Institute, The Norwegian Petroleum Directorate, Norwegian Public Roads Administration, various plants etc) are contacted for explanations and possible corrections. Check the integrity of database files Control checks of whether appropriate data processing steps and data relationships are correctly represented are made for each step of the process. Furthermore, it is verified that data fields are properly labelled and have correct design specifications and that adequate documentation of database and model structure and operation are archived. Check for consistency in data between source categories Emission data for the last year are compared with data for the previous year, in order to check the consistency and explain any changes in the data behaviour. For example, in 2010 Statistics Norway and the Climate and Pollution Agency calculated emission data for 2009 for the first time. These data were compared with the 2008 figures for detection of any considerable deviations. There may be large deviations that are correct, caused for instance by the shutdown of large industrial plants or the launch of new ones. Check that the movement for inventory data among processing steps is correct Statistics Norway has established automated procedures to check that inventory data fed into the model does not deviate too much from the figures for earlier years, and that the calculations within the model are correctly made. Checks are also made that emissions data are correctly transcribed between different intermediate products. The model is constructed so that it gives error messages if factors are lacking, which makes it quite robust to miscalculations. Check that uncertainties in emissions and removals are estimated correctly A new uncertainty analysis for greenhouse gases was undertaken in 2006, see further information in section 1.6.1 and Appendix D. Undertake review of internal documentation For some sources expert judgements dating some years back are employed with regard to activity data/emission factors. In most of the cases these judgements have not been reviewed since then, and may not be properly documented, which may be a weakness of the inventory. The procedures have improved the last few years, and the requirements for internal documentation to support estimates are now quite strict; all expert judgements and assumptions made by the Statistics Norway staff must be documented. This should enable duplication of emissions and uncertainty estimates. The new model at Statistics Norway has improved the process of archiving inventory data, supporting data and inventory records, which does facilitate review. The model runs are stored and may be reconstructed, and all input data from the Climate and Pollution Agency as well as notes with explanations on changes in emissions are stored. This is a continuous process of improvement at Statistics Norway.

The Norwegian Emission Inventory 2011 Documents 21/2011
14 Statistics Norway
Check methodological data changes resulting in recalculations Emission time series are recalculated every year in order to account for methodological changes. The recalculated emission data for a year is compared with the corresponding figures estimated the year before. For example, CO2 data calculated for 1990 in 2010 are compared with the 1990 CO2 data calculated in 2009. It is our intention to explain all major differences as far as possible. Changes may be due to revisions in energy data, new plants, correcting for former errors, new emission methodologies or there may be caused by new errors. These checks lead to corrections and re-runs of the emission model. Undertake completeness checks Estimates are reported for all source categories and for all years as far as we know, apart from a few known data gaps, which are listed in section 1.8 Completeness. There may, of course, exist sources of greenhouse gases which are not covered. However, we are quite certain that emissions from potentially additional sources are very small or negligible. Compare estimates to previous estimates Internal checks of time series for all emission sources are performed every year when an emission calculation for a new year is done. It is then examined whether any detected inconsistencies are due to data or/and methodology changes. For example, in 2010 Statistics Norway/the Climate and Pollution Agency calculated emission data for 2009 for the first time. These data were compared with the 2008 figures for detection of any considerable deviations. There may be large deviations that are correct, caused for instance by the shutdown of large industrial plants or the launch of new ones.
1.5.3. Source category-specific QC procedures Statistics Norway and the Climate and Pollution Agency have carried out several studies on specific emission sources, e.g. emissions from road, sea, and air transport, emissions from landfills as well as emissions of HFCs and SF6. These projects are repeated in regular intervals when new information is available. During the studies, emission factors have been assessed and amended in order to represent the best estimates for national circumstances, and a rational for the choice of emission factor is provided. The emission factors are often compared with factors from literature. Furthermore, activity data have been closely examined and quality controlled and so has the uncertainty estimates. The QC procedures with regard to emissions data, activity data and uncertainty estimates for the different emission sources are described in the QA/QC-chapters of the relevant source-categories. The source category-specific analyses have primarily been performed for key categories on a case-by-case basis, which is described as being good practice. The QA/QC process for many of the sources could be improved. The QC procedures is described in the report on the National System whitch was submitted by 1. January 2007. The ERT requested in 2005 further information regarding the verification of quality of data reported by companies. The general checks performed are described under section 1.5.2. In the following is a more detailed description of QC of emission data reported from plants: Plant emission data that are used in the emission trading system will undergo annual QC checks. The source-specific QC checks for other plants are performed less frequently (every 3 years) for emission estimates used in key categories, which account for 25-30 per cent of the total of that category. The frequency of checking of non-key plants which are not included in the emission trading scheme is every 5 years. Statistics Norway is responsible for reporting the results of the key category analysis to the Climate and Pollution Agency, while the Climate and Pollution Agency will perform the assessment of the “key plants” within a category.

Documents 21/2011 The Norwegian Emission Inventory 2011
Statistics Norway 15
The QC checks include: • An assessment of the internal QA/QC of the plants reporting data to the Climate
and Pollution Agency o Their QA/QC system including archiving o Any changes to the QA/QC system
• An assessment and documentation of measurements and sampling o Measurement frequency o Sampling o Use of standards (e.g. ISO) o Documentation for archiving
• An assessment and explanation of changes in emissions over time (e.g. changes in technology, production level or fuels) (annual check)
• An assessment of time-series consistency back to 1990 in cooperation with the Climate and Pollution Agency (if plant emission data are missing for some years and estimates are made using aggregate activity data and emission factors)
• A comparison of plant emissions to production ratios with those of other plants, including explanations of differences
• A comparison of the production level and/or fuel consumption with independent statistics
• An assessment of reported uncertainties (including statistical and non-statistical errors) to the extent this has been included in the reporting
The QC checks are made in close cooperation with the emission reporting plants. For more details of QA/QC of specific source categories, see “source specific QA/QC” in relevant chapters.
1.5.4. Verification studies In general, the final inventory data provided by Statistics Norway are checked and verified by the Climate and Pollution Agency. A formal verification procedure is about to be established in Norway as part of the implementation of the National System. In the following, some verification studies which have been performed are briefly described. Emission estimates for a source are often compared with estimates performed with a different methodology. In particular, Norway has conducted a study on verification of the Norwegian emission inventory (Haakonsen et al. 2000). The main goals of that work were to investigate the possibility of using statistical data as indicators for comparing emission figures between countries on a general basis, and to test the method on the Norwegian national emission estimates. In the report, Norwegian emission data were compared with national data for Canada, Sweden and New Zealand. It was concluded that no large errors in the Norwegian emission inventory were detected. The process of verification did, however, reveal several smaller reporting errors; emissions that had been reported in other categories than they should have been. These errors have been corrected in later reports to the UNFCCC. We do realise that this method of verification only considers consistency compared with what other countries report. It is not a verification of the scientific value of the inventory data themselves. In 2002, a project initiated by the Nordic Council of Ministers was completed, where the results for emissions of greenhouse gases from the agricultural sector in the national emission inventories were compared with the results using the IPCC default methodology and the IPCC default factors. The results for the Nordic countries were collected in a report (Petersen and Olesen 2002). In 2004, the Nordic Council of Ministers initiated a new project that was finalised in 2006. This project focused on NMVOC, heavy metals and POPs. An unpublished, final report has been worked out, containing the following elements:

The Norwegian Emission Inventory 2011 Documents 21/2011
16 Statistics Norway
• comparisons of the emission estimation methodologies and emission factors used in each country (review)
• identification of gaps in knowledge • identification of possible "burden sharings" with respect to research areas
(research taking place in one country, but used in all countries) • discussions of the particular Nordic aspects influencing the emissions • discussions of the possible contributions from research in the Nordic
countries • proposals for research areas
In 2006, the Nordic Council of Ministers initiated a new project that focuses on emission of particulate matter. A final report will be published with the following elements:
• comparisons of the emission estimation methodologies and emission factors used in each country (review)
• identification of gaps in knowledge • discussions of the particular Nordic aspects influencing the emissions • discussions of the possible contributions from research in the Nordic
countries • proposals for research areas • recommendations for further work
1.5.5. Archiving The national emissions inventory is a part of Statistics Norway's data archiving system. All input data to, and results from, the general Norwegian emission model from every publication cycle are stored and documented in this system. Several input data are used in preliminary calculations before entering into the general Norwegian emission model. This includes satellite models such as road traffic and air traffic, as well as a number of simpler calculations that do not fit into the framework of the general model. The preliminary calculations are not included in the central archiving system, which is not suited for such a diverse collection of data. For some satellite models there is an established archiving routine where all input data and results from every calculation cycle are stored.
1.6. Uncertainties in total emissions The uncertainty in the Norwegian greenhouse gas emission inventory has been investigated by a tier 2 analysis in 2011 and the results are described in section 1.6.1 and in Appendix D. A tier 2 analysis for the greenhouse gases was also performed in 2006, and the results from that analysis is given in (Sandmo 2010). The uncertainty in the Norwegian emission inventory has also earlier been investigated systematically in three reports (Rypdal 1999; Rypdal and Zhang 2000; Rypdal and Zhang 2001). The first two reports focused on the uncertainty in the greenhouse gas emissions, and the last report investigated the uncertainty in the emission estimates of long-range air pollutants.
1.6.1. Greenhouse gases The uncertainty analysis performed in 2011 was an update of the uncertainty analyses performed for the greenhouse gas inventory in 2006 and 2000. The report Uncertainties in the Norwegian Greenhouse Gas Emission Inventory (Rypdal and Zhang 2000) includes more detailed documentation of the analysis method used in all analyses. A report that describes the analysis performed in 2011 more in detail is under preparation. The national greenhouse gas (GHG) emission inventory is compiled from estimates based on emission factors and activity data and direct measurements by plants. All these data and parameters will contribute to the overall inventory uncertainty. The

Documents 21/2011 The Norwegian Emission Inventory 2011
Statistics Norway 17
uncertainties and probability distributions of the inventory input parameters have been assessed based on available data and expert judgements. Finally, the level and trend uncertainties of the national GHG emission inventory have been estimated using Monte Carlo simulation. The methods used in the analysis correspond to an IPCC Tier 2 method, as described in (IPCC 2000). Analyses have been made both excluding and including the sector LULUCF (land use, land-use change and forestry).
1.6.1.1. Uncertainty in emission levels The estimated uncertainties of the levels of total emissions and in each gas are shown in table 1.2 and table 1.3.
Table 1.2. Uncertainties in emission levels. Each gas and total GWP weighted emissions. Excluding the LULUCF sector
1990 μ (mean) Fraction of total emissions
Uncertainty 2σ (per cent of mean)
Total 50 mill. Tonnes 1 5
CO2 35 mill. Tonnes 0.70 3
CH4 4.7 mill. Tonnes 0.09 17
N2O 4.7 mill. Tonnes 0.10 40
HFC 18 tonnes 0.00 50
PFC 3.4 mill. Tonnes 0.07 21
SF6 2.2 mill. Tonnes 0.04 2
2009 μ (mean) Fraction of total emissions
Uncertainty 2σ (per cent of mean)
Total 51 mill. Tonnes 1 4
CO2 43 mill. Tonnes 0.84 2
CH4 4.3 mill. Tonnes 0.08 14
N2O 3.0 mill. Tonnes 0.06 58
HFC 708 ktonnes 0.01 48
PFC 379 ktonnes 0.01 20
SF6 64 ktonnes 0.00 56
Table 1.3. Uncertainties in emission levels. Each gas and total GWP weighted emissions. Including the LULUCF sector
1990 μ (mean) Fraction of total emissions
Uncertainty 2σ (per cent of mean)
Total 41 mill. tonnes 1 7
CO2 26 mill. tonnes 0.64 9
CH4 4.7 mill. tonnes 0.11 16
N2O 4.7 mill. tonnes 0.12 38
HFC 18 tonnes 0.00 50
PFC 3.4 mill. tonnes 0.08 21
SF6 2.2 mill. tonnes 0.05 1
2009 μ (mean) Fraction of total emissions
Uncertainty 2σ (per cent of mean)
Total 26 mill. tonnes 1 17
CO2 17 mill. tonnes 0.67 23
CH4 4.3 mill. tonnes 0.16 14
N2O 3.1 mill. tonnes 0.12 55
HFC 708 ktonnes 0.03 48
PFC 379 ktonnes 0.01 20
SF6 64 ktonnes 0.00 63
The total national emissions of GHG (LULUCF sector excluded) in 1990 are estimated with an uncertainty of 5 per cent of the mean. The main emission component CO2 is known with an uncertainty of 3 per cent of the mean. The total uncertainty level was 4 per cent of the mean in 2009. There have been major

The Norwegian Emission Inventory 2011 Documents 21/2011
18 Statistics Norway
changes in uncertainty level for the different emission components between the two years. The highest uncertainty change between 1990 and 2009 is in the uncertainty estimates for the SF6 emissions, which has increased from 2 to 56 per cent of the mean. However, the SF6 emissions are strongly reduced because magnesium production was closed down. The figures for the emission of SF6 from magnesium production was quite well known, but now a larger part of the SF6 emissions comes from sources with higher uncertainty. For N2O there is also a considerable increase in the uncertainty between the years. One reason for the change can be found in that N2O from the production of synthetic fertiliser with a quite low uncertainty contributes to a smaller part of the total N2O emissions in 2009 than in 1990, For the other gases there are only smaller changes in the uncertainty. By including the LULUCF sector the results from the analysis show a total uncertainty of 7 per cent of the mean in 1990 and 17 per cent in 2009. This is due to the fact that the uncertainty in the LULUCF sector in general is higher than in most other sectors. In the tier 2 uncertainty analysis carried out in the year 2006 (Sandmo 2010), the uncertainty for the total national emissions of GHG (LULUCF sector excluded) in 1990 was estimated to be 7 per cent of the mean. In the new analysis the uncertainty estimate is reduced with two percentage points. There are several reasons for the new lower estimate. One reason is that Statistics Norway and the Climate and Pollution Agency have increased the inventory quality by using improved methodologies for important sources, as for example emissions from road traffic and from plants that participate in the emission trading system. But the main reason for the reduced uncertainty is that Statistics Norway has collected new and lower uncertainty estimates for some activity data and emission factors that contributed substantially to the total uncertainty in the emission estimate. This means that much of the reduction in the total uncertainty of the inventory is not due to improved inventory methods, since the lower uncertainty partly is an effect of improved uncertainty estimates for some source categories which earlier were overestimated. A source category with important reductions in uncertainty since the analysis in 2006 is the uncertainty in emissions of direct N2O from other agricultural soil sources. This category includes emissions from crop residues, and the uncertainty reduction is mainly a result of lower crop production. Since the uncertainty estimates for agricultural soils are very dominating, changes in these source categories have large impact on the total uncertainty for the inventory. In the 2006 analysis, the uncertainty in the N2O estimate was estimated to 57 per cent of the mean. In this years’ analysis the uncertainty estimate is reduced to 40 per cent of the mean. The other emission components show just minor changes in the uncertainty estimates for 1990 in the new analysis compared to the analysis from 2006. For the last year in the two analyses (2004 in the 2006 analysis, 2009 in the present work), the reduction in total uncertainty from 6 to 4 per cent may simply reflect changes in the relative importance of the gases. The share of CO2 is increased, while the share of N2O is reduced. As mentioned above, another reason for the reduced uncertainty is that in the years between the two analyses important inventory improvement work has been carried through. New emission sources have also been included to make the greenhouse gas inventory for Norway more complete.

Documents 21/2011 The Norwegian Emission Inventory 2011
Statistics Norway 19
1.6.1.2. Uncertainty in emission trend The estimated uncertainties of the trends of total emissions and each gas are shown in table 1.4 and Table 1.5.
Table 1.4. Uncertainty of emission trends. 1990-2009. Excluding the LULUCF sector
Per cent change ((μ2009-μ1990)*100/μ1990)
Uncertainty (2*σ*100/μ1990)
Total 3 3
CO2 23 3
CH4 -9 10
N2O -36 11
HFC - -
PFC -89 17
SF6 -97 0
Table 1.5. Uncertainty of emission trends. 1990-2009. Including the LULUCF sector
Per cent change ((μ2009-μ1990)*100/μ1990)
Uncertainty (2*σ*100/μ1990)
Total -37 7
CO2 -33 10
CH4 -9 10
N2O -36 12
HFC - -
PFC -89 19
SF6 -97 0
The result shows that the increase in the total GHG emissions from 1990 to 2009 is 3 per cent, with an uncertainty in the trend on ±3 percentage points, when the LULUCF sector is not included. This means that the 2009 emissions are likely between 0 and 6 per cent above the 1990 emissions (a 95 percent confidence interval). Norway is by the ratification of the Kyoto Protocol obliged to limit the emissions of greenhouse gases in the period 2008-2012 to 1 per cent over the emissions in 1990 after trading with CO2 quotas and the other Kyoto mechanisms is taken into account. It is important to keep in mind that the emission figures reported to the Kyoto Protocol has an uncertainty connected to the reported values. With the sector LULUCF included in the calculations there has been a decrease in the total emissions figures on -37 per cent, with a trend uncertainty on ±7 percentage points.
1.6.2. Acidifying substances and NMVOC The emission estimates for long-range air pollutants in the Norwegian emission model may be ranked roughly in order of increasing uncertainty as follows: SO2 < NOX < NH3 ≈ NMVOC The sources of uncertainty in the emission estimates include sampling errors, poor relevance of emission factors or activity data, and gross errors. Evaluation of the uncertainty in the long-range air pollutants is given in the report Rypdal and Zhang (2001). Summary tables with the results are given in Appendix D.
1.6.3.Heavy metals and POPs The uncertainty is generally higher for HM and POPs than for other components in the Norwegian emission model except for N2O. There are various reasons for this high uncertainty. The most important reason is that there is limited information about emission factors, and it is not clear how usable the emission factors found in international literature are for Norwegian conditions. Emission factors for some

The Norwegian Emission Inventory 2011 Documents 21/2011
20 Statistics Norway
HM and POPs components are insufficient for some sources, so emission factors for similar sources have then been used. In addition it is not certain that all emission sources are known or sufficiently mapped. The industrial reporting to the Climate and Pollution Agency has improved in recent years. The reported figures can, however, vary a great deal from one year to another. For earlier years they can be insufficient, and since HM and POPs are to be calculated from 1990, recalculations are necessary. These recalculations are based on a combination of assumptions and knowledge of the plants. Emission figures from the early 1990s are therefore more uncertain than figures produced today.
1.7. Key category analyses For the greenhouse gases key category analyses were performed, following the IPCC Good Practice Guidance (IPCC 2000). No systematic key category analyses have been made for other emissions.
1.7.1. Greenhouse gases According to the IPCC definition, key categories are those that add up to 90 per cent of the total uncertainty in level and/or trend. In the Norwegian greenhouse gas emission inventory key categories are primarily identified by means of a Tier 2 methodology. A description of the methodology as well as background tables and the results from the analyses is presented in Appendix E. In this chapter a summary of the analyses and the results are described. According to the IPCC Good Practice Guidance (IPCC 2000) it is good practice to give the results at the Tier 2 level if available. The advantage of using a Tier 2 methodology is that uncertainties are taken into account and the ranking shows where uncertainties can be reduced. However, in the 2006 IPCC guidelines it is suggested that good practice reporting should include key categories from both the Tier 1 and Tier 2. The Tier 2 and Tier 1 analyses was performed at the level of IPCC source categories and each greenhouse gas from each source category was considered separately with respect to total GWP weighted emissions, except land-use, land-use change and forestry. The results from the key category analyses are summarized in table 1.6. The categories identified in the Tier 2 are arranged according to the last year level analysis. In addition we have also included in table 1.6 those source categories that according to Tier 1 key category analysis or qualitative criteria in the NIR are defined as key categories. Fugitive emissions from coal mining and handling is included as a key category due to change in trend in the coal production and the fact that the national emission factors used is an order of magnitude less than IPCC’s default factors. The last identified key category is CO2 capture and storage. This removal category is considered key since there is presently no methodology as such defined in the IPCC guidelines and because these operations are unique internationally.

Documents 21/2011 The Norwegian Emission Inventory 2011
Statistics Norway 21
Table 1.6. Summary of identified key categories for the greenhouse gases except LULUCF. Per cent contribution to the total uncertainty in level and/or trend. Bold numbers are key
Source category Gas
Level assessment Tier 2 1990
Level assessment Tier 2 2009
Trend assessment
Tier 2 1990-2009
Method (Tier) 2009
Tier 2 key categories (large contribution to the total inventory uncertainty) 4D1 Direct soil emissions N2O 28.96 25.71 9.50 Tier 1a1A Stationary Fuel Combustion (1A1-1A2-1A4), Gaseous Fuels CO2 4.39 10.16 15.71 Tier 21A3b Road Transportation CO2 4.68 5.75 2.95 Tier 24D3 Indirect emissions N2O 5.35 5.01 0.90 Tier 1a4A Enteric Fermentation CH4 5.34 4.91 1.11 Tier 1/2*1B2a Oil (incl. oil refineries, gasoline distribution) CO2 4.83 4.13 1.88 Tier 21A3d Navigation CO2 3.61 4.11 1.41 Tier 26A Solid Waste Disposal on Land CH4 6.37 3.91 6.66 Tier 22F Consumption of Halocarbons and Sulphur Hexafluoride HFCs 0.00 3.60 9.78 Tier 21B2c Venting and Flaring CH4 1.16 2.53 3.73 Tier 21A3e Other (snow scooters, boats, motorized equipment) CO2 1.62 2.49 2.39 Tier 21A Stationary Fuel Combustion (1A1-1A2-1A4), Liquid Fuels CO2 2.90 2.30 1.63 Tier 21A3a Civil Aviation CO2 1.44 2.20 2.07 Tier 21A4 Other sectors - Mobile Fuel Combustion CO2 2.01 1.89 0.31 Tier 22C3 Aluminium Production CO2 1.56 1.83 0.76 Tier 24D2 Animal production N2O 1.76 1.58 0.49 Tier 1a1B2c Venting and Flaring CO2 1.70 1.54 0.43 Tier 21A Stationary Fuel Combustion (1A1-1A2-1A4), Other Fuels CO2 0.32 1.47 3.14 Tier 21A3e Other (snow scooters, boats, motorized equipment) N2O 0.74 1.29 1.51 Tier 26B Wastewater Handling N2O 0.91 1.20 0.79 Tier 11A Stationary Fuel Combustion (1A1-1A2-1A4), Biomass CH4 0.98 1.19 0.58 Tier 24B Manure Management N2O 1.06 0.98 0.23 Tier 11B2a Oil (incl. oil refineries, gasoline distribution) CH4 0.69 0.82 0.35 Tier 22C3 Aluminium Production PFCs 7.16 0.78 17.30 Tier 21A Stationary Fuel Combustion (1A1-1A2-1A4), Solid Fuels CO2 0.92 0.72 0.54 Tier 21A Stationary Fuel Combustion (1A1-1A2-1A4), Gaseous Fuels CH4 0.31 0.68 1.01 Tier 22C2 Ferroalloys Production CO2 0.81 0.44 0.98 Tier 21A3d Navigation CH4 0.04 0.39 0.98 Tier 21B2b Natural Gas CH4 0.02 0.34 0.88 Tier 22B2 Nitric Acid Production N2O 1.30 0.28 2.77 Tier 22B4 Carbide Production CO2 0.44 0.05 1.04 Tier 2Tier 1 key categories (large contribution to the total emissions) 4B Manure Management CH4 0.80 0.82 0.05 Tier 22B1 Ammonia Production CO2 0.40 0.26 0.38 Tier 21A5b Military - Mobile CO2 0.29 0.16 0.35 Tier 22A1 Cement Production CO2 0.05 0.06 0.04 Tier 22C1 Iron and Steel Production CO2 0.04 0.05 0.03 Tier 22C4 SF6 Used in Aluminium and Magnesium Foundries SF6 0.06 . . Tier 24B Manure Management CH4 0.80 0.82 0.05 Tier 2Qualitative key categories 1B1a Coal Mining and Handling CH4 0.41 0.43 0.06 Tier 2 Capture and storage CO2 CS (Tier 2)
Bold figures indicate whether the source category is a key.
1.8. Completeness An assessment of the completeness of the emission inventory should, according to the IPCC Good Practice Guidance (IPCC 2000), address the issues of spatial, temporal and sectoral coverage along with all underlying source categories and activities. Confidentiality is an additional element of relevance.
1.8.1. Greenhouse gases In terms of spatial coverage, the GHG emissions calculated cover all activities within Norway’s jurisdiction. In the case of temporal coverage, complete sets of emission figures are produced and updated every year for the years 1980, 1987 and for all years from 1989. With regard to sectoral coverage, emissions from the IPCC sector 5 LULUCF (Land Use, Land Use Change and Forestry) are not included in this documentation. The reason for this exclusion is that this sector is not part of the calculations in the Norwegian emission model operated by Statistics Norway, and it is not included in the national emission data presented by Statistics Norway each year. Norway reports emissions and removals from this sector to the UNFCCC, though. A further

The Norwegian Emission Inventory 2011 Documents 21/2011
22 Statistics Norway
description of the calculations of the data Norway report for LULUCF to the UNFCCC, is given in the National Inventory Report 2011 (Climate and Pollution Agency 2011b) Otherwise, the Norwegian GHG emission inventory includes estimates from all known relevant sources or sinks. There are, however, a few exceptions of minor sources/sinks, which are not covered. These are:
• Emissions of CH4 from agricultural waste, after it is applied to soils. In the IPCC Guidelines it is written that "Agricultural soils may also emit CH4", but no calculation methodology is proposed.
• Carbon stock change of harvested wood products. The IPCC default method is used, where harvested wood is counted as emissions the year the harvest takes places.
The reason for not including the above activities is lack of data and/or exclusion from the list of priorities in the national inventory work because of the source’s insignificant contribution to the national total. Emissions from the use of feedstock are in accordance with Good Practice Guidance, and they are generally accounted for in the industrial processes sector in the Norwegian inventory. By-products from processes like CO gas that is sold and combusted are accounted for and reported under the energy sector.
1.8.2. Other pollutants Norway is requested to report emissions to UNECE for the pollutants restricted by CLRTAP (Convention on Long-Range Transboundary Air Pollution). Minimum reporting request each year includes the acidifying pollutants (NOX, SO2, NH3) and NMVOC, the heavy metals Pb, Cd and Hg, particulate matter (TSP, PM10 and PM2.5) and CO. Norway also reports, under the section "additional reporting", the heavy metals As, Cr and Cu, and the POPs dioxins and PAH. In terms of spatial coverage, the calculated air emissions cover all activities within Norway's jurisdiction. In the case of temporal coverage, emission figures for CO, SO2, NOX, NH3 and NMVOC are produced and updated every year for the years 1980, 1987 and for all years from 1989. For HM, POPs and particles, emission figures are produced for all years from 1990. With regard to sectoral coverage, the following sources with relevant emission amounts are not covered in the inventory even if emissions can be expected: Energy sector:
• NH3 emissions from Civil aviation, domestic cruise (1A3aii (ii)) • Emissions of particulate matters from clutch wear (1A3b) • Emissions of particulate matters from use of unpaved roads (1A3b) • Emissions of particulate matters from sand strewing (1A3b) • Fugitive emissions of HM from solid fuel transformation (1B1b) • Fugitive emissions of NOX from natural gas (by land-based
desulphurisation) (1B2b) Industry sector:
• Emissions of NMVOC from asphalt roofing (2A5) and NMVOC and PAH from road paving with asphalt (2A6)
• Emissions of NOX, NMVOC and NH3 from ammonia production (2B1) • Emissions of NMVOC from Nitric acid production (2B2) • Emissions of NOX from production of NPK-fertilisers (2B5) and emissions
of Cd from production of Phosphate fertilisers (2B5) • Emissions of NMVOC from the pulp and paper industry (2D1)

Documents 21/2011 The Norwegian Emission Inventory 2011
Statistics Norway 23
• Emissions of NH3 from refrigeration and air conditioning equipments using other products than halocarbons (2G)
Agricultural sector:
• Emissions of NMVOC from manure management (4B) • Emissions of NMVOC from agricultural soils (4D) • Emissions of NMVOC from field burning of agricultural wastes (4F)
Waste sector:
• Emissions of NOX, NMVOC, NH3 and CO from solid waste disposal on land (6A)
• Emissions of NMVOC and NH3 from waste-water handling (6B) • Emissions of particulate matters and POPs from burning of bonfire,
emissions of POPs from burning of garden waste, and emissions of particulate matters, POPs and HM from burning of animal carcasses and burning of waste in household stoves (6C)
• Emissions of HM and POPs in connection with fires and open burning at landfills (6C)
• Evaporation of Hg from landfills and emission of Pb by detonation of explosives (6C)
• Emissions of dioxins by smoking processes for preservation of meat and fish (6C)
The reasons for not including these emission sources are mainly lack of activity data, emission factors or known calculation methodology.
1.9. Indirect CO2 emissions from CH4 and NMVOC According to the reporting guidelines to the Climate Convention, all emissions of carbon from fossil compounds are to be included in the national emission inventory. When methane or NMVOC are oxidised in the atmosphere, indirect CO2 emissions are formed. The emissions of CH4 and NMVOC from some sources will partly be of fossil origin and should therefore be included. Fossil carbon in fuels combusted are automatically included in the emission inventory due to the fact that the guidelines for calculating the emissions take into account the fossil carbon in the fuel. These indirect CO2 emissions are included in the Norwegian emission inventory. However, indirect CO2 emissions from non-combustion sources originating from the fossil part of CH4 and NMVOC are taken into account separately, calculated on the basis of average carbon content. Fossil carbon in the emissions of CH4 and NMVOC from the following non-combustion sources are included in the Norwegian emission inventory: • Coal Mining and Handling – 1B1a • Gas terminals – 1B2b • Oil terminals – 1B2a • Refineries – 1B2a • Oil gas extraction activity – especially from loading of crude oil – 1B2a
and 2B2c • Distribution of oil products – 1B2a • Silicon carbide - 2B4.1 • Calcium carbide - 2B4.2 • Methanol - 2B5.5 • Plastic - 2B.5 • Ferroalloys - 2C.2 • Solvent and other product use - 3

The Norwegian Emission Inventory 2011 Documents 21/2011
24 Statistics Norway
The indirect CO2 emissions from oxidised CH4 and NMVOC are calculated from the content of fossil carbon in the compounds. The average amount of carbon is estimated to be 75 per cent in methane and 82 per cent in NMVOC. This leads to the emission factors 2.74 kg CO2/kg CH4 and 3 kg CO2/kg NMVOC, calculated on basis of mass of molecules.

Documents 21/2011 The Norwegian Emission Inventory 2011
Statistics Norway 25
2. The Norwegian emission model; general description
This chapter describes the general structure of the Norwegian emission model. The model was developed by Statistics Norway (Daasvatn et al. 1992; Daasvatn et al. 1994). It was redesigned in 2003 in order to improve reporting to the UNFCCC and UNECE, and to improve QA/QC procedures. The Norwegian emission model is organised around a general emission model called “Kuben” (“the Cube”). Several emission sources, e.g. road traffic, air traffic and solvents are covered by more detailed satellite models. Aggregated results from the side models are used as input to the general model. The satellite models are presented in the appropriate sections of chapters 3-7. This chapter describes the general emission model.
2.1. Structure of the general emission model The general emission model is based on equation (2.1). (2.1) Emissions (E) = Activity level (A) ⋅ Emission Factor (EF) For emissions from combustion, the activity data concern energy use. In the Norwegian energy accounts, the use of different forms of energy is allocated to industries (economic sectors). In order to calculate emissions to air, energy use must also be allocated to technical sources (e.g. equipment). After energy use has been allocated in this way, the energy accounts may be viewed as a cube in which the three axes are fuels, industries, and sources. The energy use data are combined with a corresponding matrix of emission factors. In principle, there should be one emission factor for each combination of fuel, industry, source, and pollutant. Thus, the factors may be viewed as a four-dimensional cube with pollutants as the additional dimension. However, in a matrix with a cell for each combination, most of the cells would be empty (no consumption). In addition, the same emission factor would apply to many cells. Emissions of some pollutants from major manufacturing plants (point sources) are available from measurements or other plant-specific calculations. When such measured data are available it is possible to replace the estimated values by the measured ones: (2.2) Emissions (E) = [ (A - APS) ⋅ EF] + EPS where APS and EPS are the activity and the measured emissions at the point sources, respectively. Emissions from activity for which no point source estimate is available (A-APS) are still estimated with the regular emission factor. Non-combustion emissions are generally calculated in the same way, by combining appropriate activity data with emission factors. Some emissions may be obtained from current reports and investigations, and some are measured directly as described in chapters 3-7. The emissions are fitted into the general model using the parameters industry, source, and pollutant. The fuel parameter is not relevant here. The source sector categories are based on EMEP/NFR and UNFCCC/CRF categories, with further subdivisions where more detailed methods are available. An overview of the source sector categories used is given in Appendix G.
2.2. The four axes: Pollutants, industries, fuels, and sources
The pollutants currently included in the model are listed in table 1.1, see section 1.3.

The Norwegian Emission Inventory 2011 Documents 21/2011
26 Statistics Norway
The model uses approximately 130 industries (economic sectors). The classification is common with the basis data in the energy balance/accounts, and is almost identical to that used in the national accounts, which is aggregated from the European NACE (rev. 2) classification. The allocation of energy use and emissions to industries is the basis for combining inventory results with economic data in economic/environmental accounts (Erlandsen 2002) and with economic models. The large number of sectors is an advantage in dealing with important emissions from manufacturing industries. The disadvantage is an unnecessary disaggregation of sectors with very small emissions. To make the standard sectors more appropriate for calculation of emissions, a few changes have been made, e.g. "Private households" is defined as a sector. The list of sectors is shown in Appendix F. The fuels and technical sources used for combustion with energy use (NFR source sector 1A) are shown in tables 2.1-2.3.
Table 2.1. Energy commodities in the Norwegian emission inventory
Energy commodity Aggregate fuel category in CRF
Coal Solid Fuels Coke Solid Fuels Petrol coke Liquid Fuels Wood Biomass Wood waste Biomass Black liquor Biomass Wood pellets Biomass Wood briquettes Biomass Charcoal Biomass Natural gas Gaseous Fuels Refinery gas Liquid Fuels Blast furnace gas Solid Fuels Landfill gas Biomass Biogas Biomass Fuel gas Liquid Fuels LPG Liquid Fuels Gasoline (road transport) Liquid Fuels Aviation gasoline Liquid Fuels Kerosene (heating) Liquid Fuels Jet kerosene Liquid Fuels Autodiesel Liquid Fuels Marine gas oil Liquid Fuels Light fuel oils Liquid Fuels Heavy distillate Liquid Fuels Heavy fuel oil Liquid Fuels Municipal waste Other Fuels Special waste Liquid Fuels

Documents 21/2011 The Norwegian Emission Inventory 2011
Statistics Norway 27
Table 2.2. Sources for energy combustion in the Norwegian emission inventory
Source CRF/NFR Stationary combustion Direct fired furnaces 1A1, 1A2 Gas turbines 1A1c, 1A3e, 1A4a Boilers 1A1, 1A2, 1A4, 1A5 Small stoves 1A2, 1A4, 1A5 Flaring 1B2C, 6C Mobile combustion* Passenger car 1A3b i, 1A5b Light duty vehicles 1A3b ii, 1A5b Heavy duty vehicles 1A3b iii, 1A5b Motorcycle 1A3b iv Moped 1A3b iv Snowscooter 1A4b, c Railway 1A3c Aviation jet/turboprop (0-100 m) 1A3a ii (i), 1A5b Aviation jet/turboprop (100-1000m) 1A3a ii (i), 1A5b Aviation jet/turboprop (cruise) 1A3a ii (ii), 1A5b Aviation helicopter (0-100 m) 1A3a ii (i) Aviation helicopter (100-1000m) 1A3a ii (i) Aviation helicopter (cruise) 1A3a ii (ii) Aviation small craft (0-100 m) 1A3a ii (i) Aviation small craft (100-1000m) 1A3a ii (i) Aviation small craft (cruise) 1A3a ii (ii) Ships 1A3d, 1A4c, 1A5b Small boats 2 stroke 1A4b Small boats 4 stroke 1A4b, c Equipment 2 stroke 1A3e, 1A4c Equipment 4 stroke, tractor 1A3e, 1A4b, c, 1A5b
* For road transport the source split is more detailed in the sub-model. See section 3.2.4.2.
Table 2.3. Combinations of fuels and sources in use
Dire
ct fi
red
furn
ace
s
Gas
turb
ines
Boi
lers
Sm
all
sto
ves
Fla
ring
Pas
seng
er c
ar
Ligh
t dut
y ve
hicl
es
Hea
vy d
uty
vehi
cles
Mot
orcy
cle
Mop
ed
Sno
wsc
oote
r
Rai
lway
Avi
atio
n je
t/tur
bopr
op
Avi
atio
n he
licop
ter
Avi
atio
n sm
all c
raft
Sh
ips
Sm
all b
oats
2 s
trok
e
Sm
all b
oats
4 s
trok
e
Equ
ipm
ent 2
str
oke
Equ
ipm
ent 4
str
oke
, tra
ctor
Coal x .. x x .. .. .. .. .. .. .. .. .. .. .. .. .. .. .. .. Coke x .. x x .. .. .. .. .. .. .. .. .. .. .. .. .. .. .. .. Petrol coke x .. x .. .. .. .. .. .. .. .. .. .. .. .. .. .. .. .. .. Fuel wood .. .. .. x .. .. .. .. .. .. .. .. .. .. .. .. .. .. .. .. Wood waste .. .. x .. .. .. .. .. .. .. .. .. .. .. .. .. .. .. .. .. Black liquor .. .. x .. .. .. .. .. .. .. .. .. .. .. .. .. .. .. .. .. Wood pellets .. .. x x .. .. .. .. .. .. .. .. .. .. .. .. .. .. .. .. Wood briquettes .. .. x .. .. .. .. .. .. .. .. .. .. .. .. .. .. .. .. .. Charcoal .. .. .. x .. .. .. .. .. .. .. .. .. .. .. .. .. .. .. .. Natural gas x x x .. x x .. x .. .. .. .. .. .. .. x .. .. .. .. Refinery gas x .. x .. x .. .. .. .. .. .. .. .. .. .. .. .. .. .. .. Blast furnace gas x .. x .. .. .. .. .. .. .. .. .. .. .. .. .. .. .. .. .. Landfill gas .. .. x .. x .. .. .. .. .. .. .. .. .. .. .. .. .. .. .. Biogass .. x .. .. .. .. .. .. .. .. .. .. .. .. .. .. .. .. .. .. Fuel gas x .. x .. .. .. .. .. .. .. .. .. .. .. .. .. .. .. .. .. LPG .. .. x x .. x .. .. .. .. .. .. .. .. .. .. .. .. .. .. Motor gasoline .. .. .. .. .. x x x x x x .. .. .. .. .. x x x x Aviation gasoline .. .. .. .. .. .. .. .. .. .. .. .. .. .. x .. .. .. .. .. Kerosene (heating) .. .. x x .. .. .. .. .. .. .. .. .. .. .. .. .. .. .. .. Jet kerosene .. .. .. .. .. .. .. .. .. .. .. .. x x .. .. .. .. .. .. Auto diesel .. .. x .. .. x x x .. .. .. x .. .. .. .. .. x .. x Marine gas oil/diesel x x x .. .. .. .. .. .. .. .. .. .. .. .. x .. .. .. .. Light fuel oils .. .. x x .. .. .. .. .. .. .. .. .. .. .. x .. .. .. x Heavy distillate x .. x .. .. .. .. .. .. .. .. .. .. .. .. x .. .. .. .. Heavy fuel oil x .. x .. .. .. .. .. .. .. .. .. .. .. .. x .. .. .. .. Municipal waste .. .. x .. .. .. .. .. .. .. .. .. .. .. .. .. .. .. .. .. Special waste x .. x .. .. .. .. .. .. .. .. .. .. .. .. .. .. .. .. ..

The Norwegian Emission Inventory 2011 Documents 21/2011
28 Statistics Norway
The sources for non-combustion emissions and for combustion without energy use are based on EMEP/NFR and UNFCCC/CRF categories, with further subdivisions where more detailed methods are available (Appendix G).
2.3. Regions: a fifth axis Information about the geographical distribution of emissions is useful for modelling and control purposes. The spatial distribution of emissions introduces another dimension (axis) to the general model.
2.3.1. Municipalities The municipalities, of which there are 430 on the mainland (in 2011), have been chosen as the smallest unit for regionalisation. In addition we have included the regions Svalbard, sea areas north and south of 62 °N, and air space 100-1000 m and more than 1000 m above ground level. Emissions are allocated to geographical units after the national totals have been calculated. Emissions are allocated in one of three ways: • Emissions from point sources are allocated directly to municipalities. • When figures for the activity used to calculate emissions are available directly at
municipal level, these figures are used. Examples are fuel combustion in manufacturing industries and emissions from animals.
• When the activity at the municipal level is unknown, the national emissions are allocated indirectly using surrogate statistical data. For example, fuel combustion in service industries is allocated using employment figures. In a number of cases the activity is known directly at the intermediate level (county), but allocation within counties uses surrogate data.
Data from several important sources, e.g. industrial statistics, are not available at the municipal level until one and a half years after the year of emissions.
2.3.2. EMEP grid squares Emissions by EMEP 50 km x 50 km grid square are reported to the UNECE and used in models of long-range air pollution. The emissions are allocated to grid squares as follows: • Emissions from large point sources are allocated directly to the appropriate
squares. From 2000, this also includes emissions from offshore petroleum activities.
• Emissions at sea from national sea traffic and offshore petroleum activities (before 2000) are allocated to squares on the basis of a detailed analysis of 1993 activity data (Flugsrud and Rypdal 1996). The 1993 emissions are projected using national emission trends for each of the categories fishing, other sea traffic, flaring, other combustion, and other emissions in the petroleum sector.
• The remaining emissions in each municipality are allocated to squares according to the proportion of the area of the municipality in each square.
The method assumes that emissions are evenly distributed within municipalities. In reality, emissions often occur only in small parts of a municipality. If a munici-pality is large relative to the grid squares, the emissions may be allocated wrongly. However, few municipalities measure more than 50 km across and the larger municipalities are usually sparsely populated, with small emissions. It is therefore assumed that the level of error due to the method is acceptable. The direct allocation of large point sources also reduces the potential error.

Documents 21/2011 The Norwegian Emission Inventory 2011
Statistics Norway 29
3. Energy
3.1. Overview This chapter provides descriptions of methodologies employed to calculate emissions from the energy sector. The disposition of the chapter is following the IPCC and NFR classifications of the emission sources. In section 3.2 emission estimations from energy combustion are described. This includes combustion emissions from energy industries, manufacturing industries and construction, transport and other combustion sources. Section 3.2 also includes memo items about international bunker fuels and CO2 emissions from biomass. In section 3.3 a description is given for fugitive emissions from fuels. This includes fugitive emissions from coal mining and handling, and from oil and natural gas. Section 3.3 also includes a description of the CO2 capture and storage at the oil and gas production fields Sleipner West and Snøhvit.
3.2. Energy combustion IPCC 1A NFR 1A Last update: 30.05.11
3.2.1. Overview Combustion of fossil fuels and biomass leads to emissions of greenhouse gases (CO2, CH4, N2O, fluorinated gases), SO2, NOx, NMVOC, CO, particulate matter, heavy metals, PAH and dioxins. Small amounts of NH3 can also be emitted. Emissions from energy combustion include contributions from all sources addressed in the IPCC/UNECE Guidelines. Emissions from waste incineration at district heating plants are accounted for under the energy sector, as the energy is utilised. Methane from landfills used for energy purposes is also accounted for in this sector. Emissions from flaring in the energy sectors are described in section 3.3 Energy production. Coal and coke used as reducing agents and gas used for production of ammonia (non-energy part) are accounted for under industrial processes. Flaring of natural gas and fuel gas in chemical industry is recorded in section 4.3.3. Other flaring outside the energy sectors is described in chapter 7 Waste. The same applies to emissions from accidental fires etc. Emissions from burning of crop residues and agricultural waste are accounted for in chapter 6 Agriculture. Emissions from tobacco are described in chapter 5 Solvents and other product use. The main source for calculation of emissions from energy combustion is the energy balance, which annually is prepared by Statistics Norway. The data used in the emission calculations are at a much more disaggregated level than the published energy balance. Many different sources are utilised in the preparation of the energy balance. E.g., energy use in extraction of oil and gas, which constitutes an important part of Norwegian energy use, is reported from the Norwegian Petroleum Directorate. Other energy producers, such as oil refineries and district heating plants, also report their own energy use to Statistics Norway. For different oil products, the total frame for annual use is given by Statistics Norway’s statistics on deliveries of petroleum products. These statistics are also used in the estimation of use in different economic sectors, together with other available information. The distribution between sectors is of varying quality – e.g., in some cases projections of previous surveys are used in this process. For manufacturing industries, however, Statistics Norway’s annual survey on all types of energy use, based on reports from plants responsible for approximately 96 per cent of the energy use in these sectors, combined with estimations for the remaining plants, provides figures of high quality.

The Norwegian Emission Inventory 2011 Documents 21/2011
30 Statistics Norway
3.2.1.1. Method Emissions from energy combustion are estimated at the sectoral level in accordance with the IPCC sectoral approach Tier 2/Tier 3. Often total fuel consumption is better known than the sectoral consumption. The general method to estimate emissions from fuel combustion is multiplication of fuel consumption by source and sector by an appropriate emission factor. Exceptions are road and air transport where more detailed estimation models are used, involving additional activity data (see section 3.2.4.2 and 3.2.4.1 respectively). Fuel consumption figures are taken from the Norwegian energy balance. The mean theoretical energy content of fuels and their density are listed in table 3.1.
Table 3.1. Average energy content and density of fuels
Energy commodity Theoretical energy content1 Density
Coal 28.1 GJ/tonne ..
Coal coke 28.5 GJ/tonne ..
Petrol coke 35.0 GJ/tonne ..
Crude oil 42.3 GJ/tonne = 36.0 GJ/m3 0.85 tonne/m3
Refinery gas 48.6 GJ/tonne ..
Natural gas (dry gas)2 35.5 GJ/1000 Sm3 0.74 kg/Sm3 (domestic use)
Natural gas (rich gas)2 40.3 GJ/1000 Sm3 0.85 kg/Sm3 (continental shelf)
Liquefied propane and butane (LPG)
46.1 GJ/tonne = 24.4 GJ/m3 0.53 tonne/m3
Fuel gas 50.0 GJ/tonne ..
Petrol 43.9 GJ/tonne = 32.5 GJ/m3 0.74 tonne/m3
Kerosene 43.1 GJ/tonne = 34.9 GJ/m3 0.81 tonne/m3
Diesel oil, gas oil and light fuel oil 43.1 GJ/tonne = 36.2 GJ/m3 0.84 tonne/m3
Heavy distillate 43.1 GJ/tonne = 37.9 GJ/m3 0.88 tonne/m3
Heavy fuel oil 40.6 GJ/tonne = 39.8 GJ/m3 0.98 tonne/m3
Methane 50.2 GJ/tonne ..
Wood 16.8 GJ/tonne = 8.4 GJ/solid m3
0.5 tonne/solid m3
Wood waste (dry wt) 16.25-18 GJ/tonne ..
Black liquor (dry wt) 7.2-9.2 GJ/tonne ..
Waste 12.0 GJ/tonne .. 1 The theoretical energy content of a particular energy commodity may vary; Figures indicate mean values. 2 Sm3 = standard cubic metre (at 15 °C and 1 atmospheric pressure). Source: Energy statistics, Statistics Norway.

Documents 21/2011 The Norwegian Emission Inventory 2011
Statistics Norway 31
Table 3.2. Overview of estimated and reported greenhouse gases CO2, CH4 and N2O for the energy combustion in 2009
CO2 CH4 N2O
Estimated Reported Estimated Reported Estimated ReportedA. Fuel Combustion Activities (Sectoral Approach) 1. Energy Industries a. Public Electricity and Heat Production ....................................... 40 % 60 % 97 % 3 % 46 % 54 %b. Petroleum Refining ....................... 3 % 97 % 79 % 21 % 100 %c. Manufacture of Solid Fuels and Other Energy Industries .................... 2 % 98 % 1 % 99 % 100 %2. Manufacturing Industries and Construction a. Iron and Steel .............................. 9 % 91 % 100 % 100 %b. Non-Ferrous Metals ...................... 100 % 100 % 100 %c. Chemicals ................................... 17 % 83 % 97 % 3 % 74 % 26 %d. Pulp, Paper and Print .................... 100 % 11 % 89 % 13 % 87 %e. Food Processing, Beverages and Tobacco .......................................... 100 % 100 % 100 %f. Other (Oil drilling, construction, other manufacturing) ................................ 52 % 48 % 100 % 100 %3. Transport ................................... 100 % 100 % 100 %a. Civil Aviation ................................ 100 % 100 % 100 %b. Road Transportation ..................... 100 % 100 % 100 %c. Railways ...................................... 100 % 100 % 100 %d. Navigation ................................... 100 % 100 % 100 %e. Other Transportation (Snow scooters, boats, motorized equipment, pipeline transport) ............................ 100 % 100 % 100 %4. Other Sectors ............................. 100 % 100 % 100 %a. Commercial/Institutional ................ 100 % 100 % 100 %b. Residential .................................. 100 % 100 % 100 %c. Agriculture/Forestry/Fisheries ........ 100 % 100 % 100 %5. Other (Military) ........................... 100 % 100 % 100 %
Reported means that emission figures in the national emission inventory are based on figures reported by the plants. Estimated means that the figures are estimated by Statistics Norway (activity data * emission factor).
However, for some major manufacturing plants (in particular offshore activities, refineries, gas terminals, cement industry, production of plastics, ammonia production), emissions of one or more compounds, reported to the Climate and Pollution Agency from the plants, are used instead of figures calculated as described above. In these cases, the energy consumption at the plants in question is subtracted from the total energy use before the general method is used to calculate the remaining emissions of the compound in question, in order to prevent double counting. Reported figures are used for a relatively small number of plants, but as these contribute to a large share of the total energy use, a major part of the total emissions are based on such reported figures. For the source categories petroleum refining, manufacture of solid fuels and other energy industries and iron and steel, more than 90 per cent of the sector emissions are based on reported data from plants. The reports are from the mandatory reporting obligation that is a part of the plants’ permits given by the authorities, and from 2005 the emission data are from the emission trading system (ETS). The ETS was a voluntary system in the period 2005-2007, and has been a part of EU ETS since 2008. From 1997 there have been different voluntary agreements between national authorities and the industries. From 1997, the agreements covered the aluminum producers and from 2005 industries not included in the ETS. The industries have in the different voluntary agreements committed themselves to reduce their greenhouse gas emissions as a group. As part of the agreement, the plants have every year reported detailed activity data and emissions to the Climate and Pollution Agency. The agreement involves industries such as ferroalloy, aluminum and ammonia production. Figures on energy use are based on data reported from the plants to Statistics Norway. Some of the energy figures used to calculate reported emissions may deviate from the figures in Statistics Norway’s energy balance. This may in some cases cause inaccuracies in IEFs (implied emission factors), but, generally, this should not be regarded as an important issue.

The Norwegian Emission Inventory 2011 Documents 21/2011
32 Statistics Norway
An overview of the distribution between estimated and reported emissions of CO2, CH4 and N2O in 2009 in main sector groups is given in table 3.2. Four documentation reports have been published describing the methodologies used for road traffic (Bang et al. 1999), aviation (Finstad et al. 2002a) and navigation (Tornsjø 2001) and (Flugsrud et al. 2010).
3.2.1.2. Activity data The annual energy balance, compiled by Statistics Norway, forms the framework for the calculation of emissions from energy use. However, a large part of the total emissions are based on reports from plants which use much energy, i.e. offshore activities and energy-intensive industries on shore. Such energy use is included in the energy balance, but is subtracted before the remaining emissions are calculated by the standard method of multiplying energy use by emission factors. Energy figures reported from the plants to Statistics Norway, which are used in the energy balance, sometimes deviate from the energy figures used to estimate reported emission figures, and this may cause inaccuracies in implied emission factors. The energy balance surveys the flow of the different energy carriers within Norwegian territory. It includes energy carriers used as raw materials and reducing agents, but these are presented in a separate item and are not included in the data used to estimate emissions from combustion. Some emissions vary with the combustion technology; a distribution between different sources is thus required. Total use of the different oil products is based on the Norwegian sales statistics for petroleum products. For other energy carriers, the total use of each energy carrier is determined by summing up reported/estimated consumption in the different sectors. A short summary of the determination of amounts used of the main groups of energy carriers and the distribution between emission sources is given below. Natural gas Most of the combustion of natural gas is related to extraction of oil and gas on the Norwegian continental shelf. The amounts of gas combusted, distributed between gas turbines and flaring, are reported annually to Statistics Norway by the Norwegian Petroleum Directorate (NPD). These figures include natural gas combusted in gas turbines on the various oil and gas fields as well as on Norway’s four gas terminals on shore. However, emission figures of CO2 from the largest gas consumers, e.g. offshore activities, gas terminals and petrochemical industry, are reported by the plants. The data are of high quality, due to the Norwegian system of CO2 taxation on fuel combustion. Statistics Norway's annual survey on energy use in manufacturing industries and sales figures from distributors give the remainder. Some manufacturing industries use natural gas in direct-fired furnaces; the rest is burned in boilers and, in some cases, flared. LPG and other gases Consumption of LPG in manufacturing industries is reported by the plants to Statistics Norway in the annual survey on energy use. Figures on use of LPG in households are based on sales figures, collected annually from the oil companies. Use in agriculture and construction is based on non-annual surveys; the figure for agriculture is interpolated for years not included in surveys, whereas the figure for construction is adjusted annually, based on employment figures. Use of refinery gas is reported to Statistics Norway from the refineries. The distribution between the sources direct-fired furnaces, flaring and boilers is based on information collected from the refineries in the early 1990's. However, the total emissions from the refineries included in the inventory are equal to emissions reported from the plants and are regarded being of high quality. At some industrial plants, excess gas from chemical and metallurgical industrial processes is burned, partly in direct-fired furnaces and partly in boilers. These amounts of gases are reported to Statistics Norway. Two ferroalloy plants sell

Documents 21/2011 The Norwegian Emission Inventory 2011
Statistics Norway 33
excess gas (CO gas) to some other plants (one producer of ammonia, a district heating plant, iron and steel producers and mineral industry), where it is combusted for energy purposes. Amounts sold are annually reported to Statistics Norway. One sewage treatment plant utilizes biogas extracted at the plant, and reports quantities combusted (in turbines). By definition, no CO2 emissions arise from bio gas, but other emissions are estimated by Statistics Norway, using the same emission factors as for combustion of natural gas in turbines. Oil products Total use of the different oil products is based on Statistics Norway's annual sales statistics for petroleum products. The data are generally considered reliable (with some reservations which are accounted for further down in this chapter), since all major oil companies selling oil products have interest in and report to these statistics3. The use of sales statistics provides a given total for the use of oil products, which the use in the different sectors must sum up to. This is not the case for the other energy carriers. The method used for oil products defines use as identical to sales; in practice, there will be annual changes in consumer stocks, which are not accounted for. However, since the late 1990s the distribution in the sales statistics between different middle distillates has not been in accordance with the bottom-up estimated consumption of the products. In particular, the registered sales of light fuel oil have generally been too low, and it is known that some auto diesel also is used for heating. In order to balance the accounts for the different products, it has since 1998 been necessary to transfer some amounts between products instead of using the sales figures directly. The most important transfer is from auto diesel to light fuel oil, but in addition some auto diesel has also been transferred to heavy distillate. Due to inaccuracies in the reporting of sales of marine gas oil from approximately 2005, there is also some uncertainty connected to the distribution between domestic and international sea transport for the latest years. Stationary use takes place in boilers and, in some manufacturing industries, in direct-fired furnaces. There is also some combustion in small ovens, mainly in private households. Mobile combustion is distributed between a number of different sources, described in more detail in chapter 3.2.4 Transport. In addition to oil products included in the sales statistics, figures on use of waste oil are given in Statistics Norway's statistics on energy use in the manufacturing industries. Statistics Norway also collects additional information directly from a few companies about the use of waste oil as a fuel source. Generally, in Norway there is a continual shift between use of oil and hydroelectricity, corresponding to changes in prices. Between years, this may cause changes in use of oil products and corresponding emissions which can be considerable. Coal Use of coal, coke and petrol coke in manufacturing industries is annually reported from the plants to Statistics Norway. The statistics cover all main consumers and are of high quality. Combustion takes place partly in direct-fired furnaces, partly in boilers. Figures on some minor quantities burned in small ovens in private households are based on sales figures. In addition, the figure on an insignificant use of coal in the agricultural sector was formerly collected from one farmer. Since 2002, there has been no use of coal in Norwegian agriculture.
3 The statistics are corrected for direct import by other importers or companies.

The Norwegian Emission Inventory 2011 Documents 21/2011
34 Statistics Norway
Biofuels Use of wood waste and black liquor in manufacturing industries is taken from Statistics Norway's annual survey on energy use in these sectors. Use of wood in households is based on figures on the amount of wood burned from the annual survey on consumer expenditure for the years before 2005. The statistics cover purchase in physical units and estimates for self-harvest. The survey figures refer to quantities acquired, which not necessarily correspond to use. The survey gathers monthly data that cover the preceding twelve months; the figure used in the emission calculations (taken from the energy balance), is the average of the survey figures from the year in question and the following year. For the years after 2005 the figures are based on responses to questions relating to wood-burning in Statistics Norway’s Travel and Holiday Survey. The figures in the new survey refer to quantities of wood used. The survey quarterly gathers data that cover the preceding twelve months. The figure used in the emission calculations is the average of 5 quarterly surveys. Figures on some minor use in agriculture and in construction are derived from earlier surveys for these sectors. Combustion takes place in boilers and in small ovens in private households. Consumption figures for wood pellets and wood briquettes are estimates, based on annual information from producers and distributors. Data on use of peat for energy purposes is not available, but according to the Energy Farm, the centre for Bioenergy in Norway, such use is very limited (Hohle 2005). Waste District heating plants and incineration plants annually report combusted amounts of waste (boilers) to Statistics Norway and the Climate and Pollution Agency. There is also some combustion in manufacturing industries, reported to Statistics Norway. According to the Norwegian Pollution Act, each incineration plant has to report emission data for SO2, NOX, CO, NH3, particles, heavy metals and dioxins, and the amount of waste incinerated to the county governor. The county governor then reports this information to the Climate and Pollution Agency. If emissions are not reported, the general method to estimate emissions from waste incineration is to multiply the amount of waste used by an appropriate emission factor. Normally a plant specific emission factor is made for the component in question. This factor is based on the ratio between previous emission figures and quantities of waste burned. This factor is then multiplied with the amount of waste incinerated that specific year. Energy balance sheets vs. energy accounts There are two different ways of presenting energy balances: Energy balance sheets (EBS) and energy accounts. The energy figures used in the emission calculations are mainly based on the energy balance sheets. The energy accounts follow the energy consumption in Norwegian economic activity in the same way as the national accounts. All energy used by Norwegian enterprises and households is to be included. Energy used by Norwegian transport trades and tourists abroad is also included, while the energy used by foreign transport industries and tourists in Norway is excluded. The energy balance sheet follows the flow of energy within Norway. This means that the figures only include energy sold in Norway, regardless of the users' nationality. This leads to deviations between the energy balance sheet and the energy accounts, especially for international shipping and aviation. The energy balance sheet has a separate item for energy sources consumed for transportation purposes. The energy accounts place the consumption of all energy under the relevant consumer sector, regardless of whether the consumption refers to transportation, heating or processing.

Documents 21/2011 The Norwegian Emission Inventory 2011
Statistics Norway 35
Figures from the energy sources balance sheet are reported to international organisations such as the OECD and the UN. The energy balance sheet will therefore usually be comparable with international energy statistics. Important differences between figures presented in the energy balance sheet (EBS) and figures used in the emission calculations (EC) are:
• Air transport: EC use only Norwegian domestic air traffic (excluding military), while EBS includes all energy sold in Norway for air transport, including military and energy used for international air transport.
• Coal/coke for non-energy purposes: This consumption is included in net domestic consumption in EBS, whereas EC include only energy used for combustion in the calculation of emissions from energy.
3.2.1.3. Emission factors Emission factors used for the energy sector are given in Appendix B. Emission factors for CO2 and SO2 are independent of combustion technology. In cases where technology for cleansing of SO2 has been installed, this will be reflected in the emission figures reported from the respective plants. For the other emission components further descriptions are also given for each source sector. The emission factors of NOX, CO, NMVOC, NH3, N2O and CH4 for stationary combustion have been evaluated by Norsk Energi for the Climate and Pollution Agency. The evaluation is described in the report ”Vurdering av utslippsfaktorer for beregning av NOX-utslipp med mer fra stasjonær forbrenning i Norge” (Evaluation of NOX emissions factors etcetera from stationary combustion in Norway) (Norsk Energi 2003). The report focused mainly on NOX, but also emission factors for CO, NMVOC, NH3, N2O and CH4 were considered. The conclusion in Norsk Energi (2003) was that there are significant discrepancies between the emission factors from literature and the factors used in the inventory. Some of the emission factors used in the national inventory are higher and some lower than the emission factors found in literature. To some extent the discrepancy is due to the fact that the emission factors from literature are not reflecting technology used in Norway and therefore not are valid for Norwegian conditions. In addition it is considered that some of the Norwegian emission factors are based on more reliable data than the factors from literature. However,(Norsk Energi 2003) proposed to change some of the emissions factors, due to the fact that the factors from literature were considered to be of better quality than those used in the Norwegian emission inventory. One of the factors was the NOX emission factor for heavy fuel oil, see below. In general, for all other compounds the emissions factors proposed in Norsk Energi (2003) were lower than the emission factors that are used in the Norwegian emission inventory. We consider that the effect on national totals of not replacing the emission factors with the proposed factors in Norsk Energi (2003) has led to overestimated emissions. However, Norway is continuously considering all aspects of the Norwegian emission inventory, including the emission factors, and with the updated EMEP 2009 Guidelines (EMEP 2009) we now consider to evaluate the emission factors in our inventory. CO2 Emission factors for CO2 are independent of technology. The factors for different fuels are based on the average carbon content in each fuel. From the 2010 emission inventory, the standard factor for natural gas was changed from 2.34 kg/Sm3 to 1.99 kg/Sm3. In practice, this factor is only used for consumption of dry gas outside the energy sector. The old factor reflected offshore combustion of rich gas. For the latter emissions, reported figures are now used in the inventory.

The Norwegian Emission Inventory 2011 Documents 21/2011
36 Statistics Norway
Biofuels for transport are not handled as separate fuels. The consumption is included with gasoline and autodiesel. The CO2 factors for these fuels are adjusted annually according to the biofuel content. CH4 and N2O For CH4 and N2O, information on emission factors is generally very limited, because, unlike the CO2 emission factors, they depend on the source of the emissions and the sector where the emissions take place. The emission inventory uses mostly default factors from IPCC (1997a). The emission factor for methane from fuel wood is taken from SINTEF (Karlsvik 1995). Due to lack of data, some emission factors are used for sector/source combinations other than those they have been estimated for. NOX The NOX emission factors used in the Norwegian emission inventory have, as mentioned above, been evaluated by Norsk Energi in Norsk Energi (2003) and also in “NOX-utslipp i forbindelse med eventuell NOX-avgift” (Evaluation of NOX emissions in connection with implementing NOX tax) (Norsk Energi 2006). The conclusion in both reports is that the NOX emission factors used in the inventory are within the intervals Norsk Energi found in their own measured data and from literature. Norsk Energi (2003) concluded that the general emission factor for heavy fuel oil should be considered to be changed from 4.2 to 5 kg NOX per tonne fuel and for chemical and metal industry from 5 to 6 kg NOX per tonne heavy fuel oil. The consumption of heavy fuel oil in stationary combustion in Norway is very small and NOX emissions in the Norwegian inventory from the largest consumers of heavy fuel oil in industry are based on plant specific data. Due to this, the proposed emission factors from Norsk Energi (2003, 2006) are not included in the Norwegian emission inventory. Norway intends to compare the NOX emission factors in our inventory with EMEP 2009 Guidelines. SO2 The emission factors for SO2 from oil products change yearly, in accordance with variations in the sulphur content in the products. The presented factors refer to uncleansed emissions; in cases where the emissions are reduced through installed cleansing measures, this will be reflected in emission figures reported from the respective plants.
3.2.1.4. Uncertainties Uncertainty estimates for greenhouse gases and long-range transboundary air pollutants are given in Appendix D, as well as under the individual underlying source categories. Generally, the total energy use is less uncertain than the energy use in each sector. For some sectors (e.g. the energy and manufacturing industries) the energy use is well known, while it is more uncertain in households and the service sectors. The energy use in the most uncertain sectors has been adjusted in the official energy statistics, so that the sum of the energy use in all sectors equals the total sales.
3.2.1.5. Completeness All known combustion with energy utilization in different industries and private households is included.
3.2.1.6. QA/QC The emission sources in the energy sector are subjected to the QA/QC procedures described in section 1.5. Four documentation reports have been published

Documents 21/2011 The Norwegian Emission Inventory 2011
Statistics Norway 37
describing the methodologies used for road traffic (Bang et al. 1999), aviation (Finstad et al. 2002a) and navigation (Tornsjø 2001) and (Flugsrud et al. 2010).
3.2.2. Energy industries IPCC 1A1, Key category for CO2 from combustion of gas, liquid, solid and other fuels. Key category for CH4 for combustion of gas and biomass NFR 1A1 Last update: 30.05.11
3.2.2.1. Description Energy industries include emissions from electricity and heat generation and distribution, extraction of oil and natural gas, coal production, gas terminals and oil refineries. Norway produces electricity mainly from hydropower, so emissions from electricity production are small compared to most other countries. Due to the large production of oil and gas, the emissions from combustion in energy production are high. Emissions from drilling at moveable offshore installations are included here. (Reallocated from navigation in this inventory cycle.) Emissions from these installations while not in operation (during transport, etc.) are included with 1A3D Navigation.
3.2.2.2. Method A general description of the method used for estimation of emissions from fuel combustion is given in section 3.2.1.1. For waste incineration also a more detailed description of the methodology for some components is given in this section. Waste incineration CO2 and CH4 Net CO2 emissions from wood/ biomass burning are not considered in the inventory, because the amount of CO2 released during burning is the same as that absorbed by the plant during growth. Carbon emitted in compounds other than CO2, e.g. as CO, CH4 and NMVOC, is also included in the CO2 emission estimates. N2O and NOx Emissions of NOX are reported from each plant to the Climate and Pollution Agency. An estimated amount of 2.5 per cent of this NOX is subtracted and reported to UNFCCC as N2O (Sandgren et al. 1996). Accordingly, the net NOX emissions constitute 97.5 per cent of the emissions reported by the plants. For some years, emissions of NOx have not been reported for a number of plants. In these cases, specific emission factors for the plants have been made, based upon earlier emissions and amounts of waste incinerated. These new factors have been used to estimate the missing figures. Particles Emissions of particles from district heating plants are reported to the Climate and Pollution Agency. The different plants started to report particulate emissions at various points in time. Most of them started reporting from 1994. Emissions of particles in the years before reporting have been assumed to be the same as in the first year the plant reported. New control device systems (mainly wet scrubbers) were installed at the end of the 1980s at the largest plants. Around 1995 more control device systems were installed as a result of stricter emission requirements. Most plants today have fabric filter or electrofilter together with wet scrubbers. Only two plants do not have wet scrubbers. The emission permits do not state which particle fraction that is going to be measured. It is common to measure total amount of particles. It is however presumed that the particles emitted are less than PM2.5. TSP and PM10 are therefore the same as PM2.5.

The Norwegian Emission Inventory 2011 Documents 21/2011
38 Statistics Norway
Dioxins Emissions of dioxins from waste burning at district heating plants are reported to the Climate and Pollution Agency. We have reported data for each plant from the period 1994/1995. Before 1994 we have only national totals. For estimating the emissions of dioxins for each plant before 1994 we derived an emission factor from total amount of waste burned together with the total dioxin estimate. The emissions of dioxins were estimated by multiplying the given emission factor of 20 μg/tonne waste by the amount of waste burned at each plant. This calculation was done for each of the missing years for plants that did not report emissions. Heavy metals The estimate of heavy metals from waste combustion at district heating plants is reported to the Climate and Pollution Agency. Before 1999 many emissions of heavy metals were reported together as one group. This made it difficult to use the data to estimate the emission of each component. From 1999 there are separate data for each component, but for As, Cr and Cu there are a few plants that have insufficient reporting. To calculate the emissions of heavy metals before 1999 we have estimated an emission factor for each plant with the aid of reported emission data and amount of waste burned at each plant. The emission factor derived has been used to calculate emissions for previous years by multiplying each specific emission factor with the amount burned for the corresponding year for each plant. Every district heating plant had stricter emission requirements for particles from 1995. It is expected that the emissions of heavy metals, except for mercury, were reduced analogously. At the same time the emission of mercury was regulated from 0.1 mg/Nm3 to 0.05 mg/Nm3. These regulations are considered while calculating emissions for previous years.
3.2.2.3. Activity data Electricity and heat generation and distribution The energy producers annually report their use of different energy carriers to Statistics Norway. There is only some minor use of oil products at plants producing electricity from hydropower. Combustion of coal at Norway's only dual purpose power plant at Svalbard/Spitsbergen is of a somewhat larger size. The amount of waste combusted at district heating plants is reported annually both to Statistics Norway and the Climate and Pollution Agency. The data are considered to be of high quality. Extraction of oil and natural gas Production of oil and natural gas is the dominating sector for emissions from combustion in the energy industries in Norway. The Norwegian Petroleum Directorate annually reports the amounts of gas combusted in turbines and diesel burned in turbines and direct-fired furnaces on the oil and gas fields. The data are of high quality, due to the CO2 tax on fuel combustion. These activity data are used for 1990-2002. From 2003 onwards, reported emission figures from the field operators are used. Coal production Norway's coal production takes place on Svalbard. The only coal producing company annually reports its coal consumption and some minor use of oil products. In addition to emissions related to Norway's own coal production, also emissions from Russian activities are included in the Norwegian emission inventory. Russian activity data are scarce, and emissions from an estimated quantity of coal combusted in Russian power plants are calculated. Since 1999 there has been only one such plant, in earlier years there were two of those. Gas terminals Natural gas from the Norwegian continental shelf is landed, treated and distributed at gas terminals on shore. There are four gas terminals in Norway. The eldest

Documents 21/2011 The Norwegian Emission Inventory 2011
Statistics Norway 39
started up before 1990, one in 1996 and two in 2007. Annual figures on natural gas combusted in turbines and flared are reported to the Norwegian Petroleum Directorate (figures on flaring at one plant is reported to the Climate and Pollution Agency). Gas power plants Norway had in 2009 one major gas power plant and several minor ones. The large plant was opened in 2007 and runs intermittently, depending on electricity and gas prices. It was shut down for most of 2008. Several of the smaller plants are back-up plants that are run only in emergency situations. Thus, there will be large annual fluctuations in emissions. In 2010, a new plant was opened, which will cause higher emissions in coming years. Oil refineries The oil refineries annually report their use of different energy carriers to Statistics Norway. Refinery gas is most important, but there is also some use of LPG and oil products. Burning of coke while regenerating the catalyst in cracker units is reported under 1B2A4 – Fugitive emissions – Refining/Storage.
3.2.2.4. Emission factors Emission factors used for the energy sector are given in Appendix B. For some industries and components more information about the derivation of the emission factors are given in this section.
3.2.2.4.1. CO2 Waste incineration The CO2 emission factor for the fossil part of waste combusted in waste incineration plants in Norway has been revised in 2011. The new factor is based on there being 2.708 tonnes CO2 per tonne plastic combusted (based upon the same composition of polymers combusted as in Danish calculations (National Environmental Research Institute 2011)) and that 20 per cent of the combusted waste is fossil (Avfall Norge 2006). This factor is based on surveys of the composition of waste combusted in 2004 and before, and is used from 1996 onwards. In the mid 1990s there were conducted surveys on the composition of waste combusted, and the conclusion was that the content of fossil waste in combusted waste was about 9 per cent (Sandgren et al. 1996) – this factor is used before 1996. The energy content in combusted waste used in the calculations is in average 12 GJ per tonne waste (Avfall Norge 2006). This energy content is used from 1996 onwards, while 10.5 GJ per tonne waste is used for earlier years. Due to lack of data the factors are used as constants for the two time periods, although it is likely that there is a gradual increase in the content of fossil waste. This subject matter will be looked further into in coming years. Extraction of oil and natural gas For all years up to 2002 emissions of CO2 from gas combustion offshore are calculated by Statistics Norway on the basis of activity data reported by the oil companies to NPD (the Norwegian Petroleum Directorate) and the Climate and Pollution Agency and appropriate emission factors. For 2003 and later, the data used in the inventory are emissions reported directly by the field operators. The latter are obliged to report these and other emissions annually to NPD and the Climate and Pollution Agency. The CO2 emission factor used for all years up to 1998, and for all fields except one, is an average (standard) factor based upon a survey carried out in the early 1990s (The Norwegian oil industry association 1993, 1994). From 1999 onwards, the emission factors employed increasingly reflect field specific conditions as individual emission factors have been reported directly from the fields. The measurement frequency varies among the installations. An increasing number uses

The Norwegian Emission Inventory 2011 Documents 21/2011
40 Statistics Norway
continuous gas chromatography analysis. Table B5 in Appendix B displays the time series of such emission factors, expressed as averages. The carbon content of gas burnt varies considerably between the various oil and gas fields. These changes are reflected in the reported emissions. Up to the early 1990s, most of the gas was used in the Ekofisk area, which has a below average carbon content. From around 2000, fields with higher carbon content came into production. In the last few years, there has again been a shift towards fields with somewhat lower carbon content. Gas terminals and gas-fired power plants The CO2 emission factors for combustion of natural gas on gas terminals and power plants are based on continuous or daily plant-specific measurements. Oil refineries The CO2 emission factor for combustion of refinery gas is based on daily or weekly plant-specific measurements. The refinery gas consists of hydrogen and various hydrocarbons. The composition is variable, leading to changing emissions factors measured as t CO2/t fuel or t CO2/TJ. A high hydrogen content leads to low emission factors as measured in t CO2/TJ. As an example, a gas with 40 per cent hydrogen and 60 per cent hydrocarbons with an average carbon number of 2 gives an emission factor of 50 t CO2/TJ. In the Norwegian inventory, the emission factors vary in the range 45-60 t CO2/TJ.
3.2.2.4.2. CH4
Waste incineration The emission factor for combustion of waste (fossil part only) was calculated by the Climate and Pollution Agency (Sandgren et al. 1996).
3.2.2.4.3. SO2 Russian electricity and heat production Emissions from combustion of coal for electricity production in the Russian settlements on Svalbard are included in the Norwegian emission inventory. Up to 1998 there were two Russian settlements with electricity and heat production: Barentsburg and Pyramiden. Since the coal production at Pyramiden was closed down in 1998, the settlement was abandoned, and all activity now takes place in Barentsburg. For SO2, emission factors are based on information from Trust Arktikugol in Moscow. From 1999 the factor 70 kg/tonne is used, and for earlier years 16 kg/tonne.
3.2.2.4.4. TSP, PM10 and PM2.5 Electricity and heat generation Emission factors for TSP, PM10 and PM2.5 are based on emission data given in EPA (2002). EPA (2002) gives emission data based on measurements made from various boilers using different control device systems. The Norwegian power plant at Svalbard is equipped with a multicyclone, and emission factors derived from measurements from boilers controlled with multicyclone device systems are used.
3.2.2.4.5. Dioxins and PAH Electricity and heat generation Dioxin emissions from coal combustion at the power plants at Svalbard are derived from emission factors found in literature. The emission factor used is the emission factor recommended in Bremmer et al. (1994). The same emission factor is also used in Parma et al. (1995) and Hansen (2000). Burning of coal at power plants is also expected to give particle-bound dioxin emissions, but because of the effective control device using multicyclone collector, the emissions are expected to be low. Emission factors for PAH-4, PAH-6 and PAH-total are derived from an emission profile developed from emission measurements from boilers using different control device systems (EPA 1998).

Documents 21/2011 The Norwegian Emission Inventory 2011
Statistics Norway 41
PAH emissions from waste incineration are calculated by emission factors and amount of waste burned. The emission factor used for calculating emissions of PAH before 1995 is 2.5 g PAH/tonne waste burned. It is assumed that the emissions have been reduced by 70 per cent since then because of stricter emission requirements from 1995. The new emission factors have been identified using information from Sweden. We have no plant or country specific emission profile of PAH from waste incineration at district heating plants in Norway. Instead an emission profile from a district heating plant in Sweden, burning wood powder, is used (Karlsson et al. 1992; Norwegian institute for air research and Norwegian institute for water research 1995).
3.2.2.4.6. Heavy metals Electricity and heat generation The emission factors for heavy metals used for calculating emissions from coal fired power plants are from EEA (2001). The factors are, however, not specific for coal fired power plants but standard factors recommended for calculating emissions from coal combustion in energy and transformation industries.
3.2.2.5. Uncertainties Uncertainty estimates for greenhouse gases and long-range air pollutants are given in Appendix D. Since the energy use is well known for the energy industries, the uncertainty in the activity data is considered to be minor. The uncertainty in the activity data is ± 3 per cent of the mean for oil, ± 4 per cent for gas and ± 5 per cent of the mean for coal/coke and waste. In the case of the emission factors for CO2, the uncertainty is ±3 per cent of the mean for oil, ±7 per cent for coal/coke and gas and ± 30 per cent of the mean for waste. Emission factors for CH4 and N2O are very uncertain. Distributions are strongly skewed with uncertainties which lie below and above the mean by a factor of 2 and 3, respectively.
3.2.2.6. Completeness Major missing emission sources are not likely.
3.2.2.7. Source specific QA/QC The energy industries are subjected to the general QA/QC procedures described in section 1.5. Some source specific QA/QC activities were conducted in the following industries: Heat generation in district heating plants Emissions of heavy metals and POPs from waste incineration have been subject to detailed control. The estimates are based on measurements, but the values are uncertain due to high variability. Reported emission values can vary by orders of magnitude from year to year. Each historical value has been checked in the QA/QC process, and some data have been rejected and replaced by calculated values. Extraction of oil and natural gas For emissions of NOX from turbines offshore, time series over the emissions calculated with field specific emission factors have been compared with the emissions given, using the earlier used average emission factor. From 2003 onwards field specific emission figures reported from the companies are used directly in the emission model. These figures are compared with emissions calculated on the basis of field specific activity data and emission factors.

The Norwegian Emission Inventory 2011 Documents 21/2011
42 Statistics Norway
Oil refineries The CO2 emissions reported from the refineries are compared with the emissions estimated by Statistics Norway on the basis of activity data and emission factors for the different energy carriers used. Results from the above studies have so far shown that emission estimates are in agreement with the reported figures
3.2.3. Manufacturing industries and construction IPCC 1A2, Key category for CO2 from combustion of gas, liquid, solid and other fuels. Key category for CH4 for combustion of gas and biomass NFR 1A2 Last update: 20.05.09
3.2.3.1. Description Emissions from the sector of manufacturing industries and construction include industrial emissions to a large extent originating from the production of raw materials and semi-manufactured goods (e.g. metals, petrochemicals, pulp and paper and mineral products). These emissions are related to fuel combustion only, that is, emissions from use of oil or gas for heating purposes. Consumption of coal as feedstock and reduction medium is not included in this sector, but it is accounted for under the industrial processes sector (chapter 4).
3.2.3.2. Activity data Most of the emission figures are calculated on the basis of activity data and emission factors. For some large plants varying emission figures are based on reported figures from the plants. Statistics Norway carries out annual surveys on energy use in manufacturing industries, which supply most of the data material for the calculation of combustion emissions in these sectors in cases when reported emission figures not are used. The energy use survey is assumed to cover approximately 96 per cent of the energy use in this sector. For the remaining companies, figures are estimated based on data from the sample, together with data on economic turnover, taking into account use of different energy carriers in the same industries and size groups. A change in methodology from 1998 has had minor consequences for the time series, since the energy use is mainly concentrated to a few major plants within the industry, from which data were collected both in the present and the earlier method. The data on energy use in manufacturing industries are considered to be of high quality. Information on use of waste oil and other hazardous waste is also collected through the energy use statistics. For the construction industry, the figures on use of the different energy carriers are partly taken from the annual sales statistics for petroleum products and partly projected from earlier surveys; the energy data are considered rather uncertain. In some sectors autodiesel is mainly used in machinery and off-road vehicles, particularly in mining and construction. This amount of fuel is based on reported consumption of duty-free autodiesel in the manufacturing industries and on reported sales of duty-free autodiesel to construction. The methods for calculating emissions from motorized equipment are discussed in section 3.2.4.7. Emissions from off-road machinery in industry are currently reported in the CRF/NFR category 1A3e Other transportation. According to the guidelines, they should be included in category 1A2. In the NFR, emissions from off-road machinery in industry are specifically assigned to category 1A2f i.
3.2.3.3. Emission factors Emission factors used for the energy sector are given in Appendix B.

Documents 21/2011 The Norwegian Emission Inventory 2011
Statistics Norway 43
Blast furnace gas sold from metal plants to other industries is reported under solid fuels. This may lead to very high emission factors in t CO2/TJ for solid fuels in the sectors using the gas. In particular, this applies to 1A2C Chemical industry, with an emission factor in the range of 200 t CO2/TJ. The default emission factor for blast furnace gas in the 2006 guidelines is 70.8 t C/TJ, or 260 t CO2/TJ.
3.2.3.4. Uncertainties Uncertainty estimates for greenhouse gases and long-range air pollutants are given in Appendix D. The energy use is considered well known for the manufacturing industries.
3.2.3.5. Completeness Major missing emission sources are not likely.
3.2.3.6. Source specific QA/QC There is no specific QA/QC procedure for this source. See section 1.5.1 for the description of the general QA/QC procedure.
3.2.4. Transport IPCC 1A3 NFR 1A3
3.2.4.1. Aviation IPCC 1A3a, Key category for CO2 NFR 1A3a Last update: 13.06.06
3.2.4.1.1. Method The calculation methodology applied is described in Finstad et al. (2002a). According to the IPCC Good Practice Guidance the methodology used is Tier 2 based on the detailed methodology in EEA (2001). This methodology allows estimation of emissions and fuel consumption for different types of aircraft according to the average flying distance and numbers of landings and take-offs (LTO). All movements below 1000 m are included in the "Landing Take Off" (LTO) cycle. Movements over 1000 m are included in the cruise phase. All emissions from international aviation are excluded from national totals, and are reported separately (see section 3.2.6.3).
3.2.4.1.2. Activity data Statistics Norway annually collects data on use of fuel from the air traffic companies. These data include specifications on domestic use and amounts bought in Norway and abroad. The types of fuel used in aircraft are both jet fuel (kerosene) and aviation petrol. The latter is used in small aircraft only. Emissions from the consumption of jet kerosene in domestic air traffic are based directly on these reported figures. Domestic consumption of jet kerosene has been reported to Statistics Norway by the airlines since 1993. The survey is annual, but data from the surveys for 1993 and 1994 have not been used here, as one of the largest airlines in Norway was not included. Domestic consumption prior to 1995 is estimated by extrapolation on the basis of domestic kilometres flown and is more uncertain (Finstad et al. 2002a). Sales figures are used for the minor use of aviation petrol.
3.2.4.1.3. Emission factors Emission factors used are given in Appendix B, table B1 and B3, and tables B6-B8. The Norwegian Petroleum Industry Association provides emission factors for CO2 and SO2 for the combustion of jet fuel and gasoline (Finstad et al. 2002a). The emission factor for SO2 varies annually depending on the sulphur content of the

The Norwegian Emission Inventory 2011 Documents 21/2011
44 Statistics Norway
fuel used. Emission factors for particles are from Brock et al. (1999) and Döpelheuer and Lecht (1998), and all particles are found to be less than PM2.5 (Finstad et al. 2002a). A default emission factor for N2O for all aircraft is used (IPCC 2000) and is valid for both LTO and the cruise phase. EEA (2001) and IPCC (IPCC 2000) suggest using an emission factor for CH4, given in Olivier (1991), to be 10 per cent of total VOC. This is, however, only valid for LTO since studies indicate that only insignificant amounts of methane is emitted during the cruise phase. No methane is therefore calculated for the cruise phase and all emissions are assumed to be VOC (HC). The NOX, CO and VOC emission factors are aircraft specific as given in EEA (2001). Only aggregated emission factors (kg/tonnes fuel used) are used in the Norwegian inventory. The emission factors are calculated based on total emission divided by activity data for LTO and in the cruise phase, respectively. Recalculations have been done based on the new methodology (EEA 2001; Finstad et al. 2002a) and this led to a change in emission factors for previous years. New emission factors back to 1980 have therefore been used in the inventory. Emission factors were calculated with activity data for 1989, 1995, and 2000. Factors for the years 1990-1994 and 1996-1999 were interpolated. Factors before 1989 and after 2000 were kept constant. Emission factors for small aircraft are the same for the whole period.
3.2.4.1.4. Uncertainties Activity data The uncertainty in the activity data for civil aviation is estimated to be ±20 per cent of the mean, primarily due to the difficulty in separating domestic emissions from emissions from fuel used in international transport (Rypdal and Zhang 2000). In a study on emissions from aircraft (Finstad et al. 2002a), fuel consumption was also estimated bottom-up and compared to the reported figures (see also section 3.2.4.1.6.). The estimated and reported data differed by about 10 per cent. However, the reported data are considered most accurate and were used in the calculation. As described above, data before 1995 are more uncertain than for later years. Emission factors The uncertainty in the CO2 emission factors is ±3 per cent. The uncertainty in the emission factors for CH4 and N2O lies below and above the mean by a factor of 2 and 3, respectively.
3.2.4.1.5. Completeness Major missing emission sources are not likely.
3.2.4.1.6. Source specific QA/QC In 2002 a methodology improvement was made in the emission calculations for civil aviation (Finstad et al. 2002a). According to the IPCC Good Practice Guidance the methodology used is Tier 2 based on the detailed methodology in EEA (2001) . This methodology allows estimation of emissions and fuel consumption for different types of aircraft according to the average flying distance and numbers of landings and take-offs (LTO).

Documents 21/2011 The Norwegian Emission Inventory 2011
Statistics Norway 45
3.2.4.2. Road transport IPCC 1A3b, Key category for CO2, NFR 1A3b i-v Last update: 17.03.2011
3.2.4.2.1. Method Total emissions of CO2 are estimated directly from total consumption of each fuel. The consumption of gasoline for road traffic is estimated as total sales minus consumption for other uses, i.e a top-down approach. Other uses for gasoline are e.g. small boats, snow scooters and motorized equipment. For auto diesel, the total consumption in road traffic is all auto diesel charged with auto diesel tax, with two per cent addition for assumed tax free auto diesel used in road traffic. For the years prior to 1997, the auto diesel taxation was incomplete, and the consumption of auto diesel in road traffic was calculated as for gasoline, by subtracting the consumption for other uses. Other uses of auto diesel are e.g. motorized equipment in agriculture and construction. CNG and LPG are estimated by bottom-up approaches. The total consumption of each fuel is attributed to different vehicle classes based on results from the emission model of the Handbook of Emission Factors (HBEFA; (INFRAS 2009)). The other pollutants are estimated by the emission model of the Handbook of Emission Factors (HBEFA; (INFRAS 2009)). The model uses a mileage approach: Emissions = mileage · emission per km. The model results are used directly without any adjustment for discrepancies between estimated and registered fuel consumption. The HBEFA model provides emission factors and possibilities for calculating emissions for segments and sub-segments for the vehicle classes passenger cars, light commercial vehicles, heavy commercial vehicles, urban buses, coaches and motorcycles (including mopeds). The segments are based on engine volume for passenger cars and motorcycles, total weight for heavy commercial vehicles, urban buses and coaches, and gross weight for light commercial vehicles. The segments are further disaggregated to subsegments based on fuel type and technology type (e.g. Euro-1 – Euro-5). The segments used for Norway in the HBEFA model are given in table 3.3

The Norwegian Emission Inventory 2011 Documents 21/2011
46 Statistics Norway
Table 3.3 Segments used for Norway in the HBEFA
Vehicle class Segment Fuel typeSegment split
based on Engine volume/
weight classPassenger car PC petrol <1,4L Petrol Engine volume < 1.4 litres PC petrol 1,4-<2L Petrol Engine volume 1.4- 2.0 litres PC petrol >=2L Petrol Engine volume >= 2.0 litres PC diesel <1,4L Diesel Engine volume < 1.4 litres PC diesel 1,4-<2L Diesel Engine volume 1.4- 2.0 litres PC diesel >=2L Diesel Engine volume >= 2.0 litres PC LPG LPG - All engine volumesLight commercial vehicles LCV petrol M+N1-I Petrol Tare weight < 1305 kilos LCV petrol N1-II Petrol Tare weight >= 1305-1760 kilos LCV petrol N1-III Petrol Tare weight >= 1760-3859 kilos LCV diesel M+N1-I Diesel Tare weight < 1305 kilos LCV diesel N1-II Diesel Tare weight >= 1305-1760 kilos LCV diesel N1-III Diesel Tare weight >= 1760-3859 kilos Heavy goods vehicles RT petrol Petrol - Alle gross weights RigidTruck <7,5t Diesel Gross weight <= 7.5 tonnes RigidTruck 7,5-12t Diesel Gross weight > 7.5 - 12 tonnes RigidTruck >12-14t Diesel Gross weight > 12 - 14 tonnes RigidTruck >14-20t Diesel Gross weight > 14 - 20 tonnes RigidTruck >20-26t Diesel Gross weight > 20 - 26 tonnes RigidTruck >26-28t Diesel Gross weight > 26 - 28 tonnes RigidTruck >28-32t Diesel Gross weight > 28 - 32 tonnes RigidTruck >32t Diesel Gross weight > 32 tonnes
Tractor for AT <=7,5t Diesel Gross weight <= 7.5 tonnes
Tractor for AT>7,5-14t Diesel Gross weight > 7,5 - 14 tonnes
Tractor for AT>14-20t Diesel Gross weight > 14 - 20 tonnes
Tractor for AT>20-28t Diesel Gross weight > 20 - 28 tonnes
Tractor for AT >34-40t Diesel Gross weight > 34 - 40 tonnes
Tractor for AT >40-50t Diesel Gross weight > 40 - 50 tonnes
Tractor for AT >50-60t Diesel Gross weight > 50 - 60 tonnes
Coach Coach Std <=18t Diesel Gross weight <= 18 tonnes Coach 3-Axes >18t Diesel Gross weight > 18 tonnesUrban bus Ubus Midi <=15t Diesel Gross weight <= 15 tonnes Ubus Std >15-18t Diesel Gross weight >15 - 18 tonnes Ubus Artic >18t Diesel Gross weight > 18 tonnes
Ubus Std >15-18t CNG CNG Gross weight >15 - 18 tonnes
Ubus Artic >18t CNG CNG Gross weight > 18 tonnes
Motorcycles and mopeds
Moped <=50cc (v<50kmh) Petrol Engine volume <= 50 cc
MC 2S <=150cc Petrol Engine volume <= 150 cc MC 2S >150cc Petrol Engine volume >150 cc MC 4S <=150cc Petrol Engine volume <= 150 cc MC 4S 151-250cc Petrol Engine volume 151-250 cc MC 4S 251-750cc Petrol Engine volume 251-750 cc MC 4S >750cc Petrol Engine volume > 750 cc
The model combines the number of vehicles within each segment with driving lengths for the same segments to produce annual national mileage per subsegment. For heavy goods vehicles, the vehicle number is corrected for vehicles driving with trailers, and the driving is split into three load classes (empty, half loaded and fully loaded). The annual national mileage is split between shares driven in different traffic situations. The traffic situations are a combination of area (urban/rural), road type (e.g. trunk road and access road), speed limit and level of service (freeflow, heavy, saturated, and stop and go). The traffic situations are further disaggregated by gradients, where the amount of driving on roads with slopes ranging from -6 per cent to 6 per cent is specified for each traffic situation. Hot emission factors are provided on the disaggregated level of subsegments and traffic situations with different gradients, and the emissions are estimated after these steps of disaggregation.

Documents 21/2011 The Norwegian Emission Inventory 2011
Statistics Norway 47
The HBEFA model provides emission factors for cold emissions and evaporative emissions (soak, running losses and diurnal), in addition to hot emission factors. In order to calculate cold and evaporative emissions, information on diurnal variation in curves of traffic, trip length distributions, parking time distributions and driving behaviour distributions must be provided, in addition to variations in mean air temperature and humidity.
3.2.4.2.2. Activity data All activity data are, as far as possible, updated for every year of the inventory. Data are taken primarily from official registers, public statistics and surveys. However, some of the data are based on assumptions. Many of the data sources are less comprehensive for the earliest years in the inventory. The sources of activity data are listed below: • Total fuel consumption: the total amounts of fuels consumed are corrected for
off-road use (in boats, snow scooters, motorized equipment, etc.). These corrections are estimated either from assumptions about the number of units, annual operation time and specific fuel consumption, or from assumptions about and investigations of the fraction of consumption used off-road in each sector. Statistics Norway’s sales statistics for petroleum products supply the data for total fuel consumption (Statistics Norway Annually-b).
• Number of vehicles: the number of vehicles in the various categories and age groups is taken from the official register of the Norwegian Directorate of Public Roads. The model input is number of vehicles per vehicle class for each inventory year, and the share of vehicles for any given combination of segment and fuel type. These data are combined with information on the introduction of technology classes to provide number of vehicles within each subsegment. The information on introduction of technology classes are for recent years based on information from the official register of the Norwegian Directorate of Public Roads, and on legislation for the years in which the information in the register is insufficient. • The HBEFA model distinguishes between two types of buses: urban buses,
mainly used for urban driving, and coaches, mainly used for rural and motorway driving. Due to lack of specific information in the national vehicle register, the distinction between urban buses and coaches are based on a methodology used in Sweden (Swedish environmental protection agency 2011), where the split is made based on the ratio p/w. Here, p is equal to the maximum allowed number of passengers (number of seats plus number of allowed standing passengers), and w is equal to the gross vehicle weight. These data are available from the national vehicle register. Buses with a p/w-value above 3.75 are classified as urban buses, whereas buses with a p/w-value below 3.75 are classified as coaches.
• Average annual mileage: Mileages for passenger cars, light commercial
vehicles, heavy goods vehicles, coaches and urban buses are from 2005 onwards based on odometer readings taken during annual or biannual roadworthiness tests. The readings are collected by the Directorate of Public Roads and further processed by Statistics Norway (Statistics Norway 2010a). For earlier years, most figures are determined from surveys by Statistics Norway or the Institute of Transport Economics. In some instances assumptions are needed.
• The average annual mileages vary as a function of age, with older vehicles generally driving shorter annual distances than newer vehicles. The correction of driving as a function of vehicle age is based on odometer readings taken during the roadworthiness test. The functions are calculated as the mean of the years 2005-2008, and the same correction curve is used for all years.
• Motorcycles and mopeds are not subject to roadworthiness tests in Norway. Average annual mileages are taken from a report on transport volumes in Norway (Vågane and Rideng 2010). Due to lack of data, corrections of annual mileage as a function of age for motor cycles and mopeds are taken

The Norwegian Emission Inventory 2011 Documents 21/2011
48 Statistics Norway
from a Swedish survey (Bjørketun and Nilsson 2007) under the assumption that annual mileages as a function of age are comparable in Norway and Sweden.
• Load data are taken from the Road goods transport survey (Statistics Norway 2010b).
• Transformation patterns are calculated using information from Statistics Norway’ Road goods transport survey on use of trailers and trailer size (Statistics Norway 2010b).
• Traffic situations: The Directorate of Public Roads has data on the annual number of vehicle-kilometres driven on national and county roads. The data are allocated by speed limits, road type, area type (urban/rural), and vehicle size (small/ large). Traffic on municipal roads (approx. 15 per cent) is estimated by Statistics Norway based on road lengths, detailed population data, traffic on adjoining roads, etc. The HBEFA model has emission factors for different situations of traffic flow (freeflow, heavy traffic, saturated traffic, and stop and go). Assumptions have been made as to this distribution for the different combinations of area type, road type and speed limits for Norway. Effects of road gradients are included, based primarily on Swiss data supplied to the HBEFA.
• Ambient conditions (air temperature and humidity) are included in the model to calculate cold and evaporative emissions. An average of five larger Norwegian cities has been used for spring, summer, autumn and winter separately. The data are based on measurements from the Norwegian Meteorological Institute.
• Trip length and parking time distributions are calculated from the Norwegian travel survey (Institute of transport economics 1993). The distributions are given on an hourly basis.
3.2.4.2.3. Emission factors Emission factors (except CO2) are taken from the Handbook of Emission Factors (HBEFA). Factors are given as emission per vehicle kilometers for detailed combinations of subsegments and traffic situations. Biofuels for transport are not handled as separate fuels. The consumption is included with gasoline and autodiesel. The CO2 factors for these fuels are adjusted annually according to the biofuel content. Average factors are listed in Appendix B.
3.2.4.2.4. Uncertainties With regard to CO2 emissions from road transportation, the uncertainty in the activity data and emission factors is found to be ±5 per cent and ±3 per cent of the mean, respectively. In the case of CH4 and N2O the uncertainty in the emission factors lies on ±45 and ±65, respectively (Gustafsson 2005). The uncertainty estimates are given in Appendix D.
3.2.4.2.5. Completeness Major missing emission sources are not likely.
3.2.4.2.6. Source specific QA/QC Top-down and bottom-up data on fuel consumption are compared for gasoline and diesel vehicles on an annual basis. The consumption of gasoline and auto diesel for road traffic is estimated as total sales minus consumption for other uses, i.e. a top-down approach. The HBEFA emission model also makes bottom-up estimates of consumption, which can be compared with the top-down data. The estimated fuel consumption from HBEFA deviates from the top-down estimate by approximately 5-15 per cent per year, with the higher value for auto diesel.. The causes are on the one hand uncertainties in the amount of non-road use and on the other hand uncertainties in mileage and specific consumption.

Documents 21/2011 The Norwegian Emission Inventory 2011
Statistics Norway 49
However, the total consumption of auto diesel, and hence the CO2 emission from this fuel, is well known. The uncertainty concerns the allocation between road and non-road use.
3.2.4.3. Railways IPCC 1A3c NFR 1A3c Last update: 07.06.11
3.2.4.3.1. Description Railway traffic in Norway uses mainly electricity. Auto diesel is used at a small number of lines, for shunting etc.
3.2.4.3.2. Method General estimation methodology for calculating combustion emissions from consumption figures and emission factors is used.
3.2.4.3.3. Activity data Consumption figures for auto diesel used in locomotives are collected annually from the Norwegian State Railways.
3.2.4.3.4. Emission factors Emission factors for NOx, HC, CO, and PM10 were estimated by Bang (1993) based on a literature survey and data on Norwegian usage profiles. The HC factor of 4 g/kg was used directly for NMVOC. The other emission factors are the same as for diesel machinery in mining and quarrying (see section 3.2.4.7.4), with the following exceptions: • N2O: 1.2 g/kg vs 1.3 g/kg for machinery (IPCC Guidelines) • NH3: 0 g/kg vs 0.005 g/kg for machinery.
3.2.4.3.5. Uncertainties The consumption data are of high quality. Their uncertainty is estimated to be ±5 per cent of the mean. The uncertainty in the emission factor for CO2 is ±3per cent of the mean, whereas for CH4 and N2O the uncertainty is below and above the mean by a factor of 2 and 3, respectively.
3.2.4.3.6. Completeness Major missing emission compounds are not likely.
3.2.4.3.7. Source specific QA/QC Consumption data from the Norwegian State Railways are compared with sales to railways according to the Petroleum statistics. However, the latter includes some consumption by buses operated by the Norwegian State Railways. From 1998, the reported sales of "tax-free" auto diesel to railways have been higher than the consumption data from the Norwegian State Railways, although there was only a minor difference in 2009. The reason for this discrepancy has not been checked. "Tax-free" auto diesel is only for non-road use, so consumption by buses should not be the cause.
3.2.4.4. Electric railway conductions IPCC 1A3c NFR 1A3c Last update: 01.09.05
3.2.4.4.1. Method Electric railway conductions contain copper that is emitted in contact with trains. In the inventory copper emissions are calculated by emission factors and activity data.
The Norwegian Emission Inventory 2011 Documents 21/2011
50 Statistics Norway
3.2.4.4.2. Activity data The activity data used for calculating emissions of copper from electric wires are annual train kilometers given by the Norwegian State Railways (NSB).
3.2.4.4.3. Emission factors According to Norwegian State Railways (Rypdal and Mykkelbost 1997) the weight of a contact wire is 0.91 kg/meters. The weight is reduced by 20 per cent after 3 million train passes. This gives an emission factor of 0.06 g/train kilometers. It is, however, uncertain how much of this is emitted to air. In the inventory it is assumed that 50 per cent is emitted to air. This gives an emission factor of 0.03 g/ train kilometer.
Table 3.4. Emission factor for electric railway conductions. g/km
Emission factor (g/train kilometers) Cu 0.03
3.2.4.4.4. Uncertainties The emission factor used is uncertain. First, there is an uncertainty connected to the reduction of 20 per cent after 3 millions train passes. Secondly, there is uncertainty regarding the assumption that 50 per cent are emissions to air (Finstad and Rypdal 2003).
3.2.4.4.5. Completeness No major components are assumed missing.
3.2.4.4.6. Source specific QA/QC There is no specific QA/QC procedure for this source. See section 1.5.1 for the description of the general QA/QC procedure.
3.2.4.5. Navigation IPCC 1A3d, Key category for CO2 and CH4 NFR 1A3d Last update: 17.03.11
3.2.4.5.1. Description According to CLRTAP and UNFCCC, Norwegian national sea traffic is defined as ships moving between two Norwegian ports. In this connection, installations at the Norwegian part of the continental shelf are defined as ports. Fishing is described in section 3.2.5
3.2.4.5.2. Method Emissions from navigation are estimated according to the Tier 2 IPCC methodology. Emissions from moveable installations used in oil and gas exploration and extraction are split between 1A1 – energy industries (section 3.2.2) and navigation: Emissions from drilling are reported under 1A1, while emissions from transport and other activities are reported under navigation. Emissions from international marine bunkers are excluded from the national totals and are reported separately (section 3.2.6.2), in accordance with the IPCC Good Practice Guidance. Annual emissions are estimated from sales of fuel to domestic shipping, using average emission factors in the calculations. For 1993, 1998, 2004 and 2007 emissions have also been estimated based on a bottom-up approach. Fuel consumption data were collected for all categories of ships (based on the full population of Norwegian ships in domestic transport); freight vessels (bulk and tank), oil loading vessels, supply/standby ships, tug boats, passenger vessels, fishing vessels, military ships and other ships. Emissions were estimated from ship specific emission factors and fuel use. From this information, average emission factors were estimated for application in the annual update based

Documents 21/2011 The Norwegian Emission Inventory 2011
Statistics Norway 51
on fuel sales. This approach is unfortunately too resource demanding to perform annually.
3.2.4.5.3. Activity data The annual sales statistics for petroleum products gives figures on the use of marine gas oil, heavy distillates and heavy fuel oil in domestic navigation. Informa-tion on fuel used in the ship categories in the bottom-up analysis is mainly given by data from the Business Sector’s NOx fund for 2007 and by earlier SSB analyses for 1993 and 1998 (Tornsjø 2001), and 2004. Data on fuel consumed by public road ferries are available from the Directorate of Public Roads. Information on fuel use at mobile drilling rigs is taken from the sales statistics, but information on use (whether it is used for drilling, stationary combustion etc,) is taken from Environmental Web (reported from oil companies to the Climate and Pollution Agency and the Norwegian Petroleum Directorate). For marine gas oil, the amount used for navigation is equal to total sales figures except bunkers, after the deduction of estimated stationary use, mainly in oil and gas extraction, but also some minor use in manufacturing industries and construction. Due to inaccuracies in the reporting of distribution of marine gas oil between domestic and international shipping from approximately 2005, there is some uncertainty connected to the figures for the latest years. Use of natural gas in navigation, which was introduced in 2000 and has increased considerably from 2007, is based on sales figures reported to Statistics Norway from the distributors.
3.2.4.5.4. Emission factors Emission factors used for navigation are given in Appendix B, table B1, table B3 and tables B12-B16. CO2 For CO2 the following standard emission factors based on carbon content are used:
• Marine gas oil/diesel and special distillate: 3.17 kg/kg fuel • Heavy fuel oil: 3.20 kg/kg fuel
N2O and CH4 For liquid fuels the general/standard emission factors for N2O and CH4 used in the emission inventory are taken from IPCC/OECD: 0.23 kg CH4/tonne fuel and 0.08 kg N2O/tonne fuel. In the case of oil drilling, the employed factors are as follows:
• CH4: 0.8 kg/tonne marine gas oil/diesel; 1.9 kg/tonne heavy fuel oil • N2O: 0.02 kg/tonne marine gas oil/diesel
Some natural gas is combusted in ferry transportation and offshore supply; the CH4 emission factors used are based on the emission factors in table 3.5. From 2000, when the first gas vessel started operating, a mean factor for all ships weighted after consumption data for the different ship categories (ferries and supply ships) are calculated. The emission factors used in the inventory are given in Appendix B, table B15. Ferry consumption data used in the calculations are given by the Directorate of Public Roads (Norddal 2010).
Table 3.5. Methane emission factors for gas operated vessels.
Vessel category Methane emission factor (kg CH4/ tonnes LNG)
Ferry (currently lean burn engines only) ................ 44
Offshore supply (Currently dual fuel engines only) . 80Source: Bremnes Nielsen and Stenersen (2010).

The Norwegian Emission Inventory 2011 Documents 21/2011
52 Statistics Norway
SO2 The emission factors are determined from the sulphur content of the fuel. NOx NOx factors for different engine types (slow, medium and high speed) have been estimated by Marintek based on data from a comprehensive measure programme for NOx emissions from ships, which has been implemented under the leadership of the Business Sector’s NOx fund. The new basis factors from Marintek apply to emissions from different engine types built before and after emission restrictions were implemented in 2000 (Bremnes Nielsen and Stenersen 2009).
Table 3.6. Recommended emission factors for NOx for different engine types
Engine building year
Before 2000 kg NOx/tonne fuel
After 2000 kg NOx/tonne fuel
Slow speed NOX factor ............................................ 82 78Medium speed NOX factor ....................................... 54 53High speed NOX factor ............................................ 47 41Source: Bremnes Nielsen and Stenersen (2009).
The factors were weighted in two steps: First, by engine type distribution within ship categories (passenger, general cargo, offshore, fishing, etc). Secondly, by estimated fuel consumption among categories. The fuel consumption weights were calculated based on data for 1993, 1998, 2004 and 2007, which are years with good availability of activity data. Average factors for other years were interpolated. In the interpolation of the average factors over the time series, a peak in the use of shuttle tankers has been taken into consideration. The fact that we have reported data for public road ferries for some years, and a gradual change to new engines with lower emissions starting in 2000 due to new restrictions, has also been taken into consideration. The NOx factors used in the inventory are documented in (Flugsrud et al. 2010). For gas engines the NOX factor 5.6 kg NOX/ tonne LNG is established based on the mass of LNG consumed (Bremnes Nielsen and Stenersen 2010). Average NOX factors for fishing and for general shipping are given in Appendix B, table B14. Particles Factors for particulate matter are based on measurements performed by MARINTEK and literature sources. The factors are presented in table 3.7.
Table 3.7. Particulate matter emission factors for oil and gas operated vessels.
Fuel Emission factor
PM2.5 PM10, TSP
Marine gas oil, light fuel oils (kg/tonne) ..... 1.5 1.6
Heavy fuel oil, heavy distillate (kg/tonne) .. 5.1 5.4
LNG (kg/1000 Sm3) ................................ 0.032 0.032Source: Bremnes Nielsen and Stenersen (2010).and Bremnes Nielsen (pers.comm.4)
For oil based fuels it is assumed that all particles are included in PM10 and 95 per cent of the particles are included in PM2.5 (Finstad et al. 2003).
4 Bremnes Nielsen, J. (2010): Personal information, email from Jørgen Bremnes Nielsen, 11 Nov. 2010, Marintek.

Documents 21/2011 The Norwegian Emission Inventory 2011
Statistics Norway 53
Emission factors for particle emissions from gas operated vessels are based on measurements made by MARINTEK (Bremnes Nielsen, pers.comm), which show 95-99 per cent emission reduction compared to marine gas oil.
3.2.4.5.5. Uncertainties The estimation of fuel used by fishing vessels is assumed to be rather uncertain. There is also uncertainty connected to the fuel use for other domestic sea traffic due to uncertainty in the sales statistics for petroleum products. Particularly, the delimitation between sales of marine gas oil for national use and bunkers has become more uncertain from approximately 2005, due to new and less accurate reporting routines in some oil companies. Some uncertainty is also connected to the emission factors. The uncertainty in the activity data for navigation is assessed to be ±20 per cent. For CO2 the uncertainty in the emission factors for ships and fishing vessels is ±3 per cent of the mean, while for CH4 it ranges between -50 and +100 per cent of the mean. For N2O the uncertainty range is between -66 and +200 per cent of the mean (Rypdal and Zhang 2000). The uncertainty in the NOx factors depends both on the uncertainty in the basis factors from Marintek (Bremnes Nielsen and Stenersen 2009) and on the uncertainty in the allocations that are made of the factors between ship types and years. Marintek has estimated the uncertainty in their basis NOx factors for different engine types to ±5 per cent. Uncertainties in emission factors are shown in table 3.8.
Table 3.8. Uncertainties in emission factors for ships and fishing vessels. Per cent
Standard deviation (2σ) CO2 ±3 CH4 -50 to +100 N2O -66 to +200 SO2 ±25 NOx
1 ±15 NMVOC ±50 1 It is assumed that the uncertainty might be lower now than in this estimate from Rypdal and Zhang (2001) since more measures have been performed in connection with the Business Sector’s NOx fund. Source: Rypdal and Zhang (2000; 2001).
3.2.4.5.6. Completeness Major missing emission sources are not likely.
3.2.4.5.7. Source specific QA/QC As mentioned, emission estimates for ships have been made bottom-up for 1993 and 1998 (Tornsjø 2001) and for 2004 and 2007. These results have been compared with top-down data (from sales) on fuel consumption used in the annual estimates. The outcome showed that data from sales were only 1 per cent higher than data from reported consumption in 2007. For 2004 the sales data were 27 per cent higher than the consumption data in the bottom-up analysis. This can be explained by the fact that the bottom-up method does not cover all ships, but it may also be that the domestic/international distinction is not specified precisely enough in the sales statistics. Another element, which not has been taken into account, is possible changes in stock. For the years 1993 and 1998 a deviation of -12 and -15 per cent, respectively, has been found. In the calculations, sales figures are used, as they are assumed to be more complete and are annually available.
3.2.4.6. Pipeline IPCC 1A3e NFR 1A3e i Last update: 22.03.10

The Norwegian Emission Inventory 2011 Documents 21/2011
54 Statistics Norway
Figures on natural gas used in turbines for pipeline transport at two separate facilities are reported annually from the Norwegian Petroleum Directorate to Statistics Norway. However, energy generation for pipeline transport also takes place at the production facilities. Specific data on consumption for transport are not available. Thus, the consumption at the two pipeline facilites does not give a correct picture of the activity in this sector. As a consequence, all emissions from pipelines are reported under NFR/IPCC 1A1.
3.2.4.7. Motorized equipment IPCC 1A3e etc. Key category for CO2 and N2O from other mobile. NFR 1A3e ii etc. Last update: 06.04.11
3.2.4.7.1. Description The category "motorized equipment" comprises all mobile combustion sources except road, sea, air, and railway transport. Farm and construction equipment are the most important categories. Other categories include mines and quarries, forestry, snow scooters, small boats and miscellaneous household equipment. Emissions from motorized equipment are reported under several categories:
• Agriculture/Forestry/Fishing: NFR 1A4c-ii /IPCC 1A4c • Households: NFR 1A4b-ii /IPCC 1A3e • Military: NFR 1A5b /IPCC 1A5b • Other: NFR 1A3e-ii /IPCC 1A3e
Primarily consumption of gasoline and auto diesel is considered. A small amount of fuel oil used for equipment in construction is also accounted for.
3.2.4.7.2. Method Emissions are estimated through the general methodology described earlier, involving consumption figures and appropriate emission factors.
3.2.4.7.3. Activity data Gasoline and auto diesel are handled differently. Consumption of gasoline is estimated bottom-up for each type of machinery based on data on the number of each type of equipment, usage and specific consumption. Snow scooters: Number of equipment is obtained annually from the Norwegian Public Roads Administration. We assume a mileage of 850 km/year and a specific consumption of 0.15 l/km (National institute of technology 1991). A portion of 16 per cent of petrol consumption in agriculture is assigned to snow scooters. The remaining snow scooter fuel consumption is assigned to households. Chainsaws and other two-stroke equipment: Only consumption in forestry is considered, based on felling data. Felling statistics are gathered by Statistics Norway. 50 per cent is supposed to be felled with use of chain saws, with a consumption of 0.33 l/m3. Note: Consumption has been kept fixed since 1994 based on a calculation by the Institute of Technology (Bang 1996). Lawn mowers and other four-stroke equipment: Only consumption in households is considered. Consumption of auto diesel is based on data from the energy balance. Total use of auto diesel in motorized equipment is given as the difference between total sales and estimated use in other sources. From 2001, a certain fraction of the consumption in a number of industries is allocated to motorized equipment, based on the distribution of taxed and tax-free diesel – the latter is meant for use outside road transport. The distribution formulas are based on figures from the statistics on energy use in manufacturing industries or from the sales statistics. The statistics on

Documents 21/2011 The Norwegian Emission Inventory 2011
Statistics Norway 55
energy use in manufacturing industries did not have such a split before 2001, and therefore distribution formulas for 2001 are used for 2000 and earlier years.
3.2.4.7.4. Emission factors Emission factors used are given in Appendix B. For diesel machinery, emission factors for HC, CO, and PM10 were estimated by Bang (1993), based on a literature survey and data on Norwegian usage profiles. Source for emission factor for NOX from diesel machinery is from Bang (1993) for motor gasoline and light fuel oils. For autodiesel emission factors from a Danish report (Winther and Nielsen 2006) is used. NMVOC factors were calculated by subtracting an assumed CH4 fraction of 0.3 g/kg diesel.
3.2.4.7.5. Uncertainties The estimates of consumption are considered quite uncertain, particularly for gasoline. However, the total consumption of gasoline is well known. For auto diesel, some uncertainty in the delimitation of different middle distillates may cause variations in figures on total use in motorized equipment between years.
3.2.4.7.6. Completeness Major missing emission sources are not likely.
3.2.4.7.7. Source specific QA/QC There is no source specific QA/QC procedure for this sector. See section 1.5.1 for the description of the general QA/QC procedure.
3.2.4.8. Automobile tyre and brake wear IPCC 1A3b NFR 1A3b vi Last update: 01.09.05
3.2.4.8.1. Tyre wear
3.2.4.8.1.1. Description Tyre wear is a source for emission of particles, heavy metals and persistent organic pollutants. The tyres are worn down by 10 to 20 per cent of its total weight during its lifetime. Most of the rubber is lost during acceleration and braking. All rubber lost is assumed to be particles containing heavy metals and PAH.
3.2.4.8.1.2. Method Particles All rubber lost is assumed to be small particles. The emissions of particles are calculated based on emission factors and annual mileage. Heavy metals Rubber particles contain heavy metals. Emissions of the heavy metals As, Cd, Cu, Cr, Pb and Hg are calculated based on annual mileage and emission factors. PAH The particles emitted from tyre wear contain PAH. Emissions are calculated based on emission factors and annual mileage.
3.2.4.8.1.3. Activity data Annual mileage is used for calculating the emissions from tyre wear. Annual mileage is given by the road traffic model, see section 3.2.4.2.

The Norwegian Emission Inventory 2011 Documents 21/2011
56 Statistics Norway
3.2.4.8.1.4. Emission factors Particles The emission factors used for calculating the emission of particles are given by TNO (Institute of environmental and energy technology 2002). The emission factors are based on several Dutch and British studies. It is assumed that all fine particles, PM10, are emitted to air, while all particles greater than 10 μm are emitted to soil or water. This is based on Dutch expert judgement. Recommended emission factors from TNO (Institute of environmental and energy technology 2002) are given in table 3.9.
Table 3.9. Emission factors for particles from tyre wear. kg/mill. km
PM10
Private cars 3.45 Van 4.5 Heavy duty vehicles 18.563 MC 1.725
Source: TNO (Institute of environmental and energy technology 2002)).
Heavy metals The emission factors used for the heavy metals As, Cd, Cu, Cr and Pb are derived from a particle-heavy metal distribution given by Dutch studies (van den Brink 1996). The content of heavy metals in the particles, given by this distribution, is multiplied by the PM10 emission factor (table 3.9). This gives the emission factors for the heavy metals As, Cd, Cu, Cr and Pb from tyre wear (table 3.10).
Table 3.10. Emission factors for heavy metals from tyre wear. g/mill. km
As Cd Cu Cr Pb
Private cars 0.003 0.007 1.691 0.014 0.552Van 0.005 0.009 2.205 0.018 0.720Heavy duty vehicles 0.019 0.037 9.096 0.074 2.970MC 0.002 0.003 0.845 0.007 0.276
The emission factor used for the estimation of the emissions of Hg is 0.38 g/tonn tyre. This emission factor is derived from a study of heavy metal content in tyres (Bækken 1993). PAH Emission factors for PAH are given in Finstad et al. (2001), but there is no information about how much of the emissions that are emitted to air, and how much that goes to soil and to water. All emissions are therefore supposed to be emitted to air. There is also no PAH profile available, so in lack of other data the same PAH profile as for burning of tyres is used (EPA 1998). PAH emission factors for tyre wear are given in table 3.11.
Table 3.11. Emission factors for PAH from tyre wear. g/mill. km
PAH
Light duty vehicles 10.4 Heavy duty vehicles 0.1 Source: Finstad et al. (2001).
3.2.4.8.1.5. Uncertainties The calculation of emissions from tyre wear is uncertain. First, the emission factors for particles used are based on international studies and not on Norwegian conditions. There is also uncertainty concerning how much of the particles that are emitted to air. According to a Dutch judgement, all particles emitted to air are PM10. This is however only a judgement, and not based on scientific research. PAH emissions have been held constant since 1998. The heavy metal emission factors are based on the particle emission factors for PM10, and since this factor is uncertain, the heavy metal emission factors will also be uncertain. The content of heavy metals in the particles emitted from tyre wear is

Documents 21/2011 The Norwegian Emission Inventory 2011
Statistics Norway 57
based on a Dutch study and can therefore differ from Norwegian conditions and type of tyres used.
3.2.4.8.1.6. Completeness Tyre wear also leads to emissions of other heavy metal components, such as zinc, nickel etc., but these components are not included in the Norwegian emission inventory. Until 2004, different methods for calculating the emissions of heavy metals from tyre wear were used. One method was used for calculating emissions of Pb, Cd and Hg (Finstad et al. 2001) and another for calculating emissions of Cu, Cr and As (Finstad and Rypdal 2003). From 2004 the same method has been used for all the heavy metal components.
3.2.4.8.1.7. Source specific QA/QC There is no specific QA/QC procedure for this source. See section 1.5 for the description of the general QA/QC procedure.
3.2.4.8.2. Brake wear
3.2.4.8.2.1. Description Brake blocks will wear during braking and this generates dust containing various metals. In the inventory, emissions of particles and heavy metals are included from this source.
3.2.4.8.2.2. Method Particles Emissions of particles are calculated based on emission factors and annual mileage. Heavy metals Emissions of lead, copper and chromium are calculated after a method described in SLB (Stockholms luft- och bulleranalys 1998). The calculations are based on annual brake wear, driven kilometers and the brake blocks' metal content. Brake wear, private cars and vans To calculate emissions, brake wear first has to be estimated. It is assumed that private cars change brake blocks every fourth year. The background for this assumption is that private cars, by normal driving, change brake blocks at front after 3 000 - 4 000 thousand kilometers and at the back after 6 000-8 000 thousand kilometers. A private car drives in average 1 500 thousand kilometers each year. Assuming that the brake blocks are changed after 6 000 thousand kilometers, the car will be four years old when blocks first are changed. The brake blocks at front weigh 0.13-0.15 kg and 0.09-0.11 kg at the back. It is assumed in the calculations that the brake blocks weigh 0.15 kg at the front and 0.11 kg at the back, that the brake blocks are worn 70 per cent before they are changed and that the front and back blocks are changed after 4 000 and 6 000 thousand kilometers, respectively. This gives equations (3.4) and (3.5): (3.4) Front brake blocks (private cars): 0.7*4*0.15/4000*driven thousand
kilometer (3.5) Back brake blocks (private cars): 0.7*4*0.11/6000*driven thousand
kilometer The same method is used for calculating emissions from brake wear for vans and minibuses.

The Norwegian Emission Inventory 2011 Documents 21/2011
58 Statistics Norway
Brake wear, heavy duty vehicles The number of brake blocks at a heavy duty vehicle varies with both brand and model. It is assumed that each front brake block weighs 2.5 kg and 3.5 kg at the back (Stockholms luft- och bulleranalys 1998). This means that a truck with four wheels have 12 kg of brake blocks. It is assumed that the blocks are changed after 10 000 thousand kilometers when the brake blocks are worn 70 per cent. Metal content The metal content in the brake blocks for new and old cars have been tested (Stockholms luft- och bulleranalys 1998). For calculating the emissions from brake blocks, annual brake wear has been multiplied by the metal content. For private cars and vans the cars are separated into new and old cars. Cars four years old or younger are accounted as new. The metal content in the brake blocks in front of the car differs from the content in the brake blocks at the back (table 3.12). For heavy duty vehicles, the metal content is independent of age or type of brake block.
Table 3.12. Metal content in brake blocks. mg/kg
New private cars Old private cars Heavy duty vehicles
Front Back Front Back Front and back
Cr 137 73.4 92 151 165Cu 117 941 92 198 71 990 51 240 9 031Pb 9 052 18 655 13 651 9 110 457
How much of the heavy metal emissions that are emitted to air were investigated by Sternbeck et al. (2001). Tunnel experiments showed that approximately 20 per cent of the brake wear emissions were emitted to air. This result is used in the calculations of brake wear emissions.
3.2.4.8.2.3. Activity data For calculating the emissions of particles, are annual mileage given by the road traffic model, see section 3.2.4.2. For calculating the emissions of heavy metals, annually driven kilometers and the ratio between new and old cars are also given by the road traffic model.
3.2.4.8.2.4. Emission factors Particles Emission factors recommended by TNO (Institute of environmental and energy technology 2002), based on different European studies, are used (table 3.13).
Table 3.13. Particle emission factors for brake wear. kg/mill. km
PM2.5 PM10 TSP
Private cars (BM1+DM1) 6 6 6
Van (BN1+DN1) 7.5 7.5 7.5
Heavy duty vehicles 32.25 32.25 32.25MC 3 3 3Source: TNO (Institute of environmental and energy technology 2002).
Heavy metals Emission factors for Cr, Cu and Pb are derived based on the above information and are given in table 3.14.
Table 3.14. Heavy metal emission factors for brake wear. g/mill. km
New private cars and vans Old private cars and vans Heavy duty vehicles
Cr 0.36 0.35 14.82
Cu 342.33 203.79 303.44Pb 38.16 38.02 40.95

Documents 21/2011 The Norwegian Emission Inventory 2011
Statistics Norway 59
3.2.4.8.2.5. Uncertainties There is high uncertainty in different steps in the emission calculations of heavy metals from brake wear, since many assumptions have been done. For example, there is uncertainty connected to the weight and the metal content of the brake blocks, and to the number of driven kilometers before blocks are changed.
3.2.4.8.2.6. Completeness Brake wear also leads to emissions of other heavy metal components, such as zinc, nickel etc., but these components are not included in the Norwegian emission inventory. No other major emission components are assumed missing.
3.2.4.8.2.7. Source specific QA/QC There is no specific QA/QC procedure for this source. See section 1.5 for the description of the general QA/QC procedure.
3.2.4.9. Automobile road abrasion IPCC 1A3b NFR 1A3bvii Last update: 26.05.10
3.2.4.9.1. Description Asphalt dust is emitted to air while using studded tires. The abrasion layer on asphalt roads can contain approximately 90 per cent stones (rock/minerals) and 5 per cent filler. The rest is bitumen. During studded tyre abrasion, stone materials are worn down to minor particles and will together with detached filler and bitumen whirl up and become airborne. How much dust/particles studded tires generate depends on:
• Weight of the stud • The road surface resistance against abrasion • Vehicle velocity • Share of heavy vehicle • If the road surface is dry, wet or ice coated
A great share of the dust from studded tyres will bind up to the water film when the road surface is wet. Some of it will however whirl up again when the road surface dries up. This is not included in the calculation. Bitumen is a mixture of a great number of organic components, including PAH components. The emissions of PAH from road abrasion are calculated and included in the emission inventory. Calculated emissions of Cd are also included.
3.2.4.9.2. Method Particles PM10
The method is prepared by TI/SINTEF and documented in Bang et al. (1999). For calculating average emission Q (ton/year) of PM10 formula (3.6) is used: (3.6) QPM10 (ton/year) = SPS * n * 1 * m * p * w * α/106
All vehicle categories SPS: The specific wear of studded tyres (SPS). Gives an estimate of how much of
the road surface that is worn off on one road kilometer of a vehicle with studded tyres
n: Number of cars of a vehicle category in the area l: Annual mileage for a vehicle category in the area m: Part of the year with studded tyres in the area (between 0 and 1)

The Norwegian Emission Inventory 2011 Documents 21/2011
60 Statistics Norway
p: Share of the vehicle category using studded tyres w: Correction factor for wet and frozen road surface. In the calculation of w,
frozen surface is given 0, wet surface 0.5 and dry surface 1. If the mileage with studded tyres on a wet and frozen surface respectively is v and x, w = (0.05*v)+(1(1-v-x))
α: Share of the road dust in air that is PM10. There is no data for this factor. The share of PM10 on ground is used as a reference. There is very varied data for the size of this factor (Hedalen 1994). Hedalen gives a PM10 share of 3-4 per cent. In the calculations 3 per cent is used as a first estimate. Hedalen (1994) states further that the PM2.5 share of total road dust is 0.5-1 per cent.
The road surface has stronger wear resistance on roads with heavy traffic than on roads with little traffic. The SPS value can therefore vary with the amount of traffic. SPS values for different ÅDT5 intervals were estimated based on analysis of track depths over the years 1988-1995 (Norwegian public roads administration 1996).
SPS is also dependent on the weight of the studs. The studs have in the recent years become lighter. The requirement in 1988 was that the stud on light vehicles should not exceed 2.0 gram, in 1990 this was changed to 1.8 gram, and it changed again in 1992 to 1.1 gram (Norwegian public roads administration 1997). The so-called "light studs" has a weight on 0.7 gram. Studs used on tyres for heavy vehicles could until 1992 weigh 8.0 gram, but this demand was changed to 3.0 gram. There are also other factors influencing the SPS values, for example the road surface wear resistance and the quality of the stone materials used. SPS values used in the calculations are given in table 3.15. The SPS values are divided on classes of ÅDT (Evensen, pers. comm.6). Values are given for 1993-1997 and a prediction for 2002. For the years in between a moving average is calculated. For the years after 2002 the 2002 SPS values are used. In the calculations average values for SPS, weighted after the size of traffic load on roads with different ÅDT, are used. The values are given in g/km and are valid for all vehicles. To estimate how much of the emissions that originate from heavy vehicles, it is provided that heavy vehicles wear 5 times more than light vehicles. The vehicle velocity is not given as an own factor, since it is included in the calculation of SPS.
Table 3.15. SPS values. g/km
ÅDT 1973-1980 1981-1987 1988-1992 1993-1997 20020-1500 22 20 20 18 161500-3000 20 20 18 16 143000-5000 16 15 14 12 10>5000 14 12 11 10 9Average1 17.1 15.6 14.7 13.1 11.61 Weight after traffic load on roads with differerent ÅDT. Source: Evensen, pers.comm.6
Annual traffic load (trafikkarbeid) (n • l in the formula) used in the calculations are based on Rideng (2001). Use of studded tyres is forbidden in Norway from the first Monday after Easter and until 31st of October. There is an exception from this rule in the three northern counties, Nordland, Troms and Finnmark. In these counties, use of studded tyres is forbidden between 1st of May to 15th of October. It is assumed in the calculations that studded tyres are used the whole period when it is allowed. This means that m is 6.5/12 in the northern counties and 5.5/12 for rest of the country.
5 ÅDT = Average annual daily traffic 6 Evensen, R. (2007). Note for Johnny Johansen. 14/12 1997. Bærum: ViaNova.

Documents 21/2011 The Norwegian Emission Inventory 2011
Statistics Norway 61
Shares of traffic load on studded tyres in the five largest towns in Norway are given in table 3.16. There has been a decrease in use of studded tyres in Norway during the latest years. The factor p in the formula will therefore vary from one year to another. Information regarding the share of studded tyres originates from the Norwegian Public Roads Administration. There is also national data on share of the car fleet with studded tyres. The data material is based on interviews of car drivers (Norwegian public roads administration 1995a, b, 1998). The question-naires were given out at daytime and caused that most of the answers were from local car drivers. Accordingly, the survey included too many car drivers with annual mileage over 20 000 km. The survey from 1997 was however done differently. In the calculation program, the studded tyre share was decided to be 0.2. This value was adjusted by the different local road administrations, based on interviews or other available knowledge. In 2000, the Norwegian Public Roads Administration made a new investigation over local use of studded tyre (Johansen and Amundsen 2000). In 2006, Gjensidige made a survey over the use of studded tyres in different counties in Norway, winter 05/06 (Vaaje 2006). For 2001-2004 averages of the two investigations are calculated for the counties. For the five largest cities data from the Norwegian Public Roads Administration was used also for 2001-2005, but for the rest of the country the results from Gjensidige (Vaaje 2006) was used. The data are given in table 3.17. For the period 1973-1990 is it assumed that the studded tyre share was 90 per cent.
Table 3.16. Use of studded tyres in five prioritized communities. Share of traffic load with studded tyres. Light duty vehicles
1998/ 1999
1999/2000
2000/2001
2001/2002
2002/2003
2003/2004
2004/2005
2005/ 2006
2006/ 2007
2007/2008
2008/2009
2009/2010
Oslo 51.9 32.4 21.2 31.3 29.2 28.4 24.0 19.9 20.3 17.0 16.4 14.3Drammen 49.6 48.7 52.1 41.8 42.3 40.6 31.5 27.0 28.0 27.3 22.9 25.0Stavanger 38.1 31.3 26.8 29.3 28.8 35.2 30.1 32.2 28.4 33.2 19.6 19.0Bergen 37.0 29.4 28.3 31 30.7 30.4 30.3 29.6 21.4 10.5 14.7 14.3Trondheim 67 64.4 62.1 44.4 40.2 38.8 38.1 32.9 31.2 19.4 28.6 28.6
Source: The Norwegian Public Roads Administration.
Table 3.17. Averaged studded tyre share in Norway weighted by traffic load in the different counties. Light duty vehicles
Year 1990 0.90 1991 0.87 1992 0.88 1993 0.88 1994 0.87 1995 0.86 1996 0.83 1997 0.79 1998 0.70 1999 0.63 2000 0.58 2001 0.56 2002 0.55 2003 0.53 2004 0.51 2005 0.49 2006 0.48 2007 0.46 2008 0.45 2009 0.45 Source: Statistics Norway based on data from the Norwegian Public Roads Administration and Gjensidige.
To calculate the correction factor for humid road surface, traffic load data is used. This is divided into different road conditions after Evensen (pers. comm.7) (table 3.18). Share of wet and dry road surface will change some as a consequence of varied share of studded tyres. In the calculations for 1973-1997 a correction factor
7 Evensen, R. (1997) Personal information, telephone call 20/11 1997. Bærum: ViaNova.

The Norwegian Emission Inventory 2011 Documents 21/2011
62 Statistics Norway
is used, based on the estimation that 80 per cent of light duty vehicles and 60 per cent of heavy duty vehicles use studded tyres.
Table 3.18. Grouping of wet, dry and icy road surface
In the Norwegian emission inventoryWet WetDry DrySlush WetLoose snow Wet1
Hard snow Hard snow/iceBare tracks 80 per cent dry and 20 per cent wet2
1 Assumption made of NILU and Statistics Norway. 2 Assumption made by Evensen (pers. comm.,7).
TSP Hedalen and Myran (1994) analysed road dust depots from Trondheim and found that 30 weight percentage of the particles were below PM10. This gives a distribu-tion where PM10 is 0.3*TSP. This distribution is used in the inventory. Cd Emissions of Cd are calculated based on emission factors from Bækken (1993) and annually generated road dust of PM10.
PAH Emissions of PAH are calculated based on emission factors from Larssen (1985) and annually generated road dust of PM10.
3.2.4.9.3. Activity data Cd and PAH The activity data used for calculating the emissions of Cd and PAH are annually generated PM10 of road dust, see sectionr 3.2.4.9.2.
3.2.4.9.4. Emission factors Particles The emission factors can be derived from the factors given under 0. The emission figures are calculated as a product of SPS values for the given year, the number of kilometers driven, part of the cars with studded tyres, part of the year with winter season, correction for icy surface and the PM10 share of the emission (α).The emission factors do not reflect the whirl up of road dust. Heavy duty vehicles whirl up much more than light duty vehicles. Cd The Cd content in the bitumen is uncertain. According to Bækken (1993), the Cd content varies between 1.9 and 43 g Cd per tonne road dust. Statistics Norway has chosen an average emission factor of 22.5 g/ton, see table 3.19.
Table 3.19. PAH and Cd emission factors from road dust1. g/tonne. PM10 of road dust
Emission factor (g/tonne PM10 from road dust)
Norwegian standard (PAH-total) 61.7PAH-6 24.7PAH-4 5.5 Cd 22.51 Dry road surface. Source: Finstad et al. (2001).
PAH The PAH content in the bitumen is uncertain and can vary over time. According to Larssen (1985), the PAH content in airborne dust from wet roads is 330 ppm and 75 ppm from dry roads. Statistics Norway has chosen 85 ppm. In table 3.19, the emission factor of 85 g/ton is converted to correspond to the PAH components included in NS9815. This gives an emission factor of 61.7 g/ton for PAH-total.

Documents 21/2011 The Norwegian Emission Inventory 2011
Statistics Norway 63
3.2.4.9.5. Uncertainties Particle distribution of road dust has also been investigated by others than Hedalen and Myran, among them the Norwegain Institute for Air Research (NILU). The results from these measurements show another distribution than Hedalen and Myran, with a PM10-fraction much lower than 30 weight percentage. In the calculation of PM10, data from Hedalen and Myran (1994) are used, and for consistency reasons the same source is used for estimating TSP, despite the uncer-tainty and the discrepancy with NILUs estimations. The value of α (PM10 share in road dust) is very uncertain. An average velocity is assumed in the calculations. This is further complicated when road surface on roads with high velocities have another wear resistance than other road surfaces. The emission factor used for calculating Cd emissions is uncertain since it is based on two measurements. The estimation of the PAH content in road dust from Larssen (1985) is very uncertain, since it is based on only one measurement in Oslo, but it is the only estimate available, and is used in lack of other data.
3.2.4.9.6. Completeness Major missing emission sources are not likely.
3.2.4.9.7. Source specific QA/QC There is no source specific QA/QC procedure for this sector. See section 1.5 for the description of the general QA/QC procedure.
3.2.5. Other sectors IPCC 1A4, Key category for CO2 from stationary combustion of gas, liquid, solid and other fuels and for mobile fuel combustion. Key category for CH4 for combustion of gas and biomass IPCC 1A5, Key category for CO2 for military mobile combustion NFR 1A4/1A5 Last update: 13.04.10
3.2.5.1. Description The source category "Other sectors" includes all military combustion, stationary combustion in agriculture, forestry, fishing, commercial and institutional sectors and households, motorized equipment and snow scooters in agriculture and forestry, and ships and boats in fishing.
3.2.5.2. Activity data Motorized equipment is described in section 3.2.4.7. Households Use of wood in households for the years after 2005 are based on responses to questions relating to wood-burning in Statistics Norway’s Travel and Holiday Survey. The figures in the survey refer to quantities of wood used. The survey quarterly gathers data that cover the preceding twelve months. The figure used in the emission calculations is the average of five quarterly surveys. For the years before 2005 figures are based on the amount of wood burned from the annual survey on consumer expenditure. The statistics cover purchase in physical units and estimates for self-harvest. The survey figures refer to quantities acquired, which not necessarily correspond to use. The survey gathers monthly data that cover the preceding twelve months; the figure used in the emission calculations (taken from the energy accounts), is the average of the survey figures from the year in question and the following year. Combustion takes place in small ovens in private households.

The Norwegian Emission Inventory 2011 Documents 21/2011
64 Statistics Norway
Figures on use of coal and coal coke are derived from information from the main importer. Formerly, Norway's only coal producing company had figures on coal sold for residential heating in Norway. From about 2000, this sale was replaced by imports from abroad. Figures for LPG are collected from the suppliers. Heavy fuel oil is taken from the sales statistics for petroleum products. As the consumption of each energy carrier shall balance against the total sales in the sales statistics, use of fuel oil, kerosene and heavy distillates in households is given as the residual after consumption in all other sectors has been assessed. Use of natural gas is based on sales figures reported to Statistics Norway from the distributors. Agriculture Data on energy use in hothouses are collected in surveys performed regularly. Sales figures are used to project the figures for consumption of oil products in the years between. For biofuels and LPG figures are interpolated for years not included in surveys. The Agricultural Budgeting Board has figures on the use of gasoline, auto diesel and fuel oil in agriculture excluding hothouses. A figure on the minor use of coal was previously collected annually from the only consumer. Since 2002, however, there has been no known use of coal in the Norwegian agricultural activities. Use of natural gas in agriculture, which has increased considerably since it first was registered in 2003, is based on sales figures reported to Statistics Norway from the distributors. Fishing Figures on the use of marine gas fuel, heavy distillate and heavy fuel oil are identical with the registered sales to fishing in the sales statistics for petroleum products. In addition to these figures on use in large fishing vessels, a minor figure on estimated use of gasoline in small fishing boats is also included. Commercial and institutional sectors Figures on energy use in wholesale and retail trade and hotels and restaurants, are based on a survey for 2000, performed by Statistics Norway. For the following years, figures from this survey have been adjusted proportionally to the development in employment in the industries in question. For earlier years, the figures are based on a survey from the mid-1980s (Sagen 1987). LPG figures for the whole period from 1990 have, however, been estimated separately after consultation with an oil company. For most other commercial and institutional sectors, the total use of fuel oil appears as a residual after the use in all other sectors has been estimated; the distribution of this residual between sub-sectors is done by using figures on energy use per man-labour year from the energy survey from the mid-1980s. Use of heating kerosene in commercial industries is calculated by projecting a figure on use from the mid-1980s proportionally with the registered sales to buildings in industrial industries outside the manufacturing industries. The estimated total amount is distributed between sub-sectors by using figures on energy use per man-labour year from the mid-1980s survey. Use of natural gas is based on sales figures reported to Statistics Norway from the distributors. Calculated emissions from combustion of biogas at a sewage treatment plant are included for all years since 1993. Military Figures on fuel oil are annually collected directly from the military administration, while figures from the sales statistics for petroleum products are used for other energy carriers.

Documents 21/2011 The Norwegian Emission Inventory 2011
Statistics Norway 65
3.2.5.3. Emission factor Emission factors used are given in Appendix B. Emission factors for fuelwood are based on data for different oven technologies. Ovens made in 1998 and later have significantly improved combustion and reduced emissions. The factors are weighted based on information from the surveys of the amount of wood burned in ovens with the different technologies. The yearly weighted factors are given in appendix B.
Table 3.20. Emission factors for fuelwood, g/kg dry matter
Open
fireplaces Ovens -1997
Ovens 1998-
NOx 1.3 0.97 0.97 CO 126.3 150 50.5
PM10, PM2,5, and TSP 17.3 33 (large cities) 40 (other areas) 6.2
PAH – total 17.4 52 0.0226 PAH – OSPAR 6.1 8.1 0.0045 PAH - 4 3 2.7 0.0025 Source: PAH : Finstad et al (2001), other pollutants : Haakonsen and Kvingedal (2001).
3.2.5.4. Uncertainties Uncertainty in fishing is described together with navigation in section. 3.2.4.5.5. The method used for finding the use of fuel oil, kerosene and heavy distillates in households implies a great deal of uncertainty regarding the quality of these figures, particularly for fuel oil, which is the most important of these three energy carriers. Since the late 1990s it also has been necessary to adjust figures for other sectors in order to get consumption figures for households that look reasonable. Hopefully, new surveys will improve the quality of these figures in the future. As the total use of the different oil products is defined as equal to the registered sales, use in some sectors are given as a residual. This applies to use of heating kerosene and heavy distillates in households, and total use of fuel oil in commercial and institutional sectors. Accordingly, these quantities must be regarded as uncertain, as they are not based on direct calculations. This uncertainty, however, applies only to the distribution of use between sectors - the total use is defined as equal to registered sales, regardless of changes in stock. There have been large variations in annual sales of military aviation kerosene; as stock changes are not taken into account, the actual annual use is uncertain.
3.2.5.5. Completeness Major missing emission sources are not likely.
3.2.5.6. Source specific QA/QC There is no source specific QA/QC procedure for this sector. See section 1.5 for the description of the general QA/QC procedure.
3.2.6. International bunkers IPCC - memo item NFR - memo item Last update: 31.03.06
3.2.6.1. Description Emissions from international bunkers (marine and aviation) have been estimated and reported separately from national estimates, in accordance with the IPCC Guidelines. Differences between the IEA (International Energy Agency) data and the data reported to UNFCCC in sectoral data for marine shipping and aviation are due to the fact that different definitions of domestic use are employed. In the

The Norwegian Emission Inventory 2011 Documents 21/2011
66 Statistics Norway
Norwegian inventory, domestic consumption is based on a census in accordance with the IPCC good practice guidance. On the other hand, the IEA makes its own assessment with respect to the split between the domestic and the international market.
3.2.6.2. Shipping 3.2.6.2.1. Method Emissions are calculated by multiplying activity data with emission factors. The sales statistics for petroleum products, which is based on reports from the oil companies to Statistics Norway, has figures on sales for bunkers of marine gas oil, heavy distillates and heavy fuel oil. The same emission factors as in the Norwegian national calculations are used.
3.2.6.2.2. Activity data Sales figures for international sea transport from Statistics Norway's sales statistics for petroleum products are used for marine gas oil, heavy distillates and heavy fuel oil.
3.2.6.2.3. Emission factor Emission factors used for Shipping are described under Navigation in section 3.2.4.5.
3.2.6.3. Aviation 3.2.6.3.1. Method The consumption of aviation bunker fuel in Norway is estimated as the difference between total purchases of jet kerosene in Norway for civil aviation and reported domestic consumption. Figures on total aviation fuel consumption are derived from sales data reported to Statistics Norway from the oil companies. These data do not distinguish between national and international uses. Data on domestic fuel purchase and consumption are therefore collected by Statistics Norway from all airline companies operating domestic traffic in Norway. The figures on domestic consumption from airlines are subtracted from the total sales of jet kerosene to arrive at the total fuel sales for international aviation. The bottom-up approach of Norway is the detailed Tier 2 CORINAIR methodology. The methodology is based on detailed information on types of aircraft and number of LTOs, as well as cruise distances.
3.2.6.3.2. Activity data Statistics Norway annually collects data on use of fuel from the air traffic companies, including specifications on domestic use and purchases of fuel in Norway and abroad.
3.2.6.3.3. Emission factor Emission factors used for Aviation are described under Aviation in section 3.2.4.1.
3.2.7. CO2 emissions from biomass IPCC - memo item Emissions are estimated from figures in the energy accounts on use of wood, wood waste and black liquor. According to the guidelines, these CO2 emissions are not included in the national total in the Norwegian emission inventory.
3.3. Energy production (fugitive emissions from fuels) IPCC 1B NFR 1B
3.3.1. Overview Emission sources included in the inventory from the sector Fugitive emissions from fuels are fugitive emissions from coal mining and handling, and from oil and natural gas.

Documents 21/2011 The Norwegian Emission Inventory 2011
Statistics Norway 67
Fugitive emissions from oil and natural gas include emissions from loading and refining of oil, gasoline distribution, and fugitive emissions from the gas terminals on shore. There are also fugitive emissions in connection with venting and flaring offshore.
3.3.2. Fugitive emissions from coal mining and handling IPCC 1B1 a, Key category for CH4 NFR 1B1 Last update: 07.06.11
3.3.2.1. Description There are today two coal mines at Spitsbergen (the largest island in the Svalbard archipelago) operated by a Norwegian company. The second mine was opened in 2001. As the Norwegian GHG inventory, according to official definitions, shall include emissions from all activities at Svalbard, also emissions from Russian coal production have been estimated. Until 1998, there was production in two Russian coal mines, but since then, production takes place only in the Barentsburg mine. The production there have in the later years been considerably smaller than the Norwegian production, and due to a fire that started in 2008 the production in 2008 and 2009 was very small. Russian activity data are more uncertain than the Norwegian, which causes a correspondingly higher uncertainty in the emission figures. At Svalbard there was a smouldering fire in the Russian mine that was closed down in 1998. At an inspection in 2005, no emissions were registered, which indicates that the fire had burnt out. Due to lack of data, emissions for earlier years from this fire have not been estimated. However, Norwegian authorities assume that these emissions are limited. Due to lack of an appropriate emission factor for emissions of PM from coal mining, such emissions are not included in the Norwegian emission inventory.
3.3.2.2. Method CO2 Indirect CO2 emissions from methane oxidized in the atmosphere are calculated by multiplying the calculated CH4 emission with the factor 2.74 tonne CO2 per tonne CH4. (See chapter 1.9 for more information on indirect CO2). CH4 Emissions of methane from coal mining on Svalbard are calculated by multiplying the amount of coal extracted (raw coal production) with country specific emission factors (Tier 2); the factor for the Barentsburg mine differs from the factor for Norwegian coal production. The calculations are performed by Statistics Norway.
3.3.2.3. Activity data Figures on Norwegian production (raw coal production) are reported by the plant to Statistics Norway. Russian figures are reported to the Norwegian authorities on Svalbard; these figures are, however, regarded as highly uncertain, consisting of a mixture of figures on production and shipments.
3.3.2.4. Emission factor CH4 For Norwegian coal production, a country specific emission factor of CH4 from extraction of coal was determined in 2000 in two separate studies performed by IMC (2000) and Bergfald & Co AS (2000). The emissions of methane from coal mining were in the study measured in two steps. First, coal was sampled and the methane content in coal was analysed (IMC 2000). The sampling process started after a long period (a week) of continuous

The Norwegian Emission Inventory 2011 Documents 21/2011
68 Statistics Norway
production. Small samples of coal were removed directly from the coalface as soon as possible after a cut was taken. This was to minimise degassing losses in the samples if the face or heading had been standing for a long time. The samples yielded an estimate of seam gas content of 0.535-1.325 m3 methane per tonne coal derived from an average content of 0.79 m3 per tonne. This factor includes the total possible methane emissions from coal mining, loading and transport on shore and on sea. The factor also includes the possible emission from handling and crushing of coal at the coal power plant. Secondly, the methane content in ventilation air from the underground coal mines at Spitsbergen was measured (Bergfald & Co AS 2000). From the Norwegian mines the methane content in the ventilation air was measured to 0.1-0.4 m3 methane per tonne coal. Considering the measurements it was therefore decided to use 0.54 kg methane per tonne coal as emission factor when calculating methane emissions from coal mining in Norway. According to IPCC`s Good Practice Guidance, the Norwegian mines at Spitsbergen have characteristics that should define the mines as underground mines, whereas the emission factor we use is more characteristic for surface mines. The low content of methane is explained with the mine’s location 300-400 metres above sea level. Furthermore, the rock at Spitsbergen is porous and therefore methane has been aired through many years. For the Russian mine in Barentsburg, the emission factor for CH4 has been estimated in the same manner as the Norwegian factor, based on measurements by Bergfald & Co AS (2000). This is an underground mine, which causes considerably higher emissions than from the Norwegian mines; we use the factor 7.16 kg methane per tonne coal for this mine. The Russian mine that was closed down in 1998, however, was situated more like the Norwegian mines; accordingly we use the same emission factor for this as for the Norwegian mines.
3.3.2.5. Uncertainties 3.3.2.5.1. Activity data The uncertainty in the activity data concerning Norwegian coal production is regarded as being low. The uncertainty in Russian data is considerably higher.
3.3.2.5.2. Emission factor In the uncertainty analysis for greenhouse gases performed in 2006 (Appendix D) the uncertainty in the emission factor was estimated by expert judgments to as much as -50 to +100 per cent. But this estimate was based on the earlier use of an IPCC default emission factor in the calculations. Today, country specific factors based on measurements are used in the calculations and the uncertainty in the emission factors is probably lower than -50 to +100 per cent. The emission factor we use for the Norwegian mines is an average of the measure-ment of methane in coal sampled in the study (IMC 2000). This average emission factor is two to eight times higher than the methane content measured in ventilation air by Bergfald & Co AS (2000). This should indicate that the chosen emission factor is rather conservative.
3.3.2.6. Completeness Emissions from Russian coal extraction on Svalbard are now included in the Norwegian emission inventory. No major missing emission sources are known.

Documents 21/2011 The Norwegian Emission Inventory 2011
Statistics Norway 69
3.3.2.7. Source specific QA/QC Independent methods to estimate the emission factors used in the calculations are described above in this chapter. Statistics Norway and the Climate and Pollution Agency carry out internal checks of the emission time-series and corrections are made when errors are detected; see chapter 1.5 for general QA/QC procedures.
3.3.3. Fugitive emissions from uncontrolled combustion and burning coal dumps
IPCC 1B1 b NFR 1B1 Last update: 07.06.11
3.3.3.1. Description In 2005, a fire broke out in one of the Norwegian coal mines at Spitsbergen, causing minor emissions.
3.3.3.2. Method Emissions have been calculated by multiplication of the quantity of coal combusted by standard emission factors for combustion of coal.
3.3.3.3. Activity data The company operating the mine has provided an estimate on the quantity of coal combusted in the fire.
3.3.3.4. Emission factors Emission factors for direct-fired furnaces, as given in Appendix B, have been used in the calculations.
3.3.3.5. Uncertainties The uncertainty in the activity data, that is the quantity of coal combusted, is unknown. However, as the emissions are small, the uncertainty is insignificant.
3.3.3.6. Completeness The only fire in a Norwegian coal mine since 1990 is included. Emissions from a smouldering fire in a Russian mine, which is supposed to have lasted for several years, are not included in the emission inventory, due to lack of data. The same applies to another fire in 2008. These emissions are, however, probably insignificant.
3.3.3.7. Source specific QA/QC There is no specific QA/QC procedure for this source.
3.3.4. Oil and natural gas IPCC 1B2, 1B2a is key category for CO2 and CH4, 1B2b for CH4 and 1B2c for CO2 and CH4 NFR 1B2 Last update: 30.05.11
3.3.4.1. Description 1B2a covers emissions from loading and storage of crude oil, refining of oil and distribution of gasoline. Loading, unloading and storage of crude oil on the oil fields off shore and at oil terminals on shore cause direct emissions of CH4 and NMVOC and indirect emissions of CO2 from oxidised CH4 and NMVOC. Non-combustion emissions from Norway's two oil refineries (a third was closed down in 2000) include CO2, CH4, NOx, NMVOC, SO2 and particulates. Gasoline distribution causes emissions of NMVOC, which lead to indirect CO2 emissions. 1B2b covers fugitive emissions of CH4 and NMVOC and indirect emissions of CO2 from gas terminals on shore.

The Norwegian Emission Inventory 2011 Documents 21/2011
70 Statistics Norway
Table 3.21. Fugitive emissions from oil and natural gas. Emission sources, compounds, methods, emission factors and activity data included in the Norwegian GHG Inventory
B Fugitive emissions from fuels CO2 CH4 N2O NMVOC Method Emission factor
Activity data
1.B.2.a Oil
i. Exploration IE IE NO IE Tier II CS PS ii. Production IE IE NO IE Tier II CS PS iii. Transport E R/E NO R/E Tier II CS PS iv. Refining/Storage R/E R NO R Tier I/II CS PS v. Distribution of oil products E NE NO R/E Tier I C/CS CS/PS vi. Other NO NO NO NO
1.B.2.b Natural gas
i. Exploration IE IE NO IE IE IE IE ii. Production/Processing IE IE NO IE IE IE IE iii. Transmission IE IE NO IE IE IE IE iv. Distribution IE E NO IE Tier II OTH CS/PS v. Other leakage industrial plants, power stations E R NO R Tier II CS PS residential/commercial sectors NO NO NO NO
1.B.2.c
Venting i. Oil IE IE NO IE Tier II CS/PS PS ii. Gas IE IE NO IE Tier II CS/PS PS iii. Combined R/E R/E NO R/E Tier II CS/PS PS
Flaring
i. Oil (well testing) R/E E E R/E Tier II CS PS ii. Gas Gas and oil fields R/E R/E E R/E Tier II CS PS Gas terminals R R E R/E Tier I CS CS Refineries R R R/E E Tier I CS CS iii. Combined IE IE IE IE Tier I CS CS
R = emission figures in the national emission inventory are based on figures reported by the plants. E = emission figures are estimated by Statistics Norway (Activity data * emission factor). IE = Included elsewhere, NO = Not occurring, CS = Country specific, PS = Plant specific, Tier = the qualitative level of the methodology used, C=Corinair, OTH=Other.
1B2c covers fugitive emissions from venting and flaring. Venting emissions include emissions of CO2, CH4 and NMVOC from exploration and production drilling of gas and oil, and reinjection of CO2 at two oil fields (Sleipner and Snøhvit). The major source is cold vent and leakage of CH4 and NMVOC from production drilling and hence indirect CO2 emissions. CO2 emissions vented to the atmosphere when the injection of CO2 has to stop for maintenance etc. are reported in this sector. See sections 3.3.5 and 3.3.6 for further description of this source. Most of the emissions in 1B2c come from flaring of natural gas offshore (during both well testing, extraction and pipeline transport) and at gas terminals and flaring of refinery gas at the refineries. This flaring causes emissions of CO2, CH4, N2O, NOX, NMVOC, SO2, CO, particulates, PAH and dioxins. There is also some flaring of oil in connection with well testing - amounts flared and emissions are reported to NPD (the Norwegian Petroleum Directorate) and the Climate and Pollution Agency. The major source in sector 1B2 is flaring of natural gas on the Norwegian continental shelf. Table 3.21 gives an overview over the calculations of the fugitive emissions of CO2, CH4, N2O and NMVOC.
3.3.4.2. Method Loading and storage of crude oil off shore and on shore CH4 and NMVOC From 2003, emission of CH4 and NMVOC from loading and storage of crude oil on shuttle tankers included in the GHG inventory are based on reported emission figures from the oil companies. Emissions, activity, and to some extent emission factors, are reported from each field operator into the database Environmental Web. The database is operated by NPD, the Climate and Pollution Agency and The

Documents 21/2011 The Norwegian Emission Inventory 2011
Statistics Norway 71
Norwegian Oil Industry Association (OLF). In addition the field operators each year deliver a report where they describe the activities during the last year. Before 2003, the emissions of CH4 and NMVOC were calculated by Statistics Norway. The calculation was based on the field specific amounts of crude oil loaded and stored multiplied with field specific emission factors. Field specific activity data and emission factors (the latter only to the Climate and Pollution Agency) used in the calculation were annually reported by the field operators to Statistics Norway and the Climate and Pollution Agency. Since year 2000 an increasing share of the shuttle tankers have had installed vapour recovery units (VRU), and emissions from loading of crude oil on shuttle tankers with and without VRU were calculated separately for each field. In addition, emission figures were annually reported to the Climate and Pollution Agency and used in the QC of the calculated emission figures. Only emissions from loading and storage of the Norwegian part of oil production are included in the inventory. For the Norwegian oil terminals on shore, the emissions from loading of crude oil are reported annually from the terminals to the Climate and Pollution Agency. At one of the terminals VRU for recovering NMVOC was installed in 1996. The calculation of the emissions of CH4 and NMVOC at the terminals is based upon the amount of crude oil loaded and oil specific emission factors dependent on the origin of the crude oil loaded. The indirect CO2 emissions from the oxidation of CH4 and NMVOC in the atmosphere for this source category are calculated by Statistics Norway. Oil refineries CO2, CH4, NOx, NMVOC, SO2 and particulates Emission figures from the oil refineries are reported to the Climate and Pollution Agency, and are after QA/QC procedures used in the emission inventory. CH4 emissions from the largest refinery are, however, estimated by the Climate and Pollution Agency by multiplying the yearly amount of crude oil throughput by a plant specific emission factor. The CO2 emissions originate from the coke on the catalyst that is burned off and from the coke calcining kilns. The CO2 emissions from catalytic cracker and calcining kilns are calculated from the formula (3.7): (3.7) tonne CO2 per year = ((Nm3 RG per year * volume% CO2 ) / 100 * ( molar weight of CO2 / 22.4)) / 1000
• the amount of stack gas (RG) is measured continously • the density of the stack gas is 1.31 kg/Nm3 • volume percentage of CO2 is based on continuously measurements.
However, if the refinery can document that the volume percentage of CO2 is not fluctuating more than 2 per cent from last years report it is not mandatory to have continuous measurements.
Both CH4 and NMVOC emissions are based on measurements carried out by Spectracyne in 2002 and 2005. The indirect CO2 from oxidized CH4 and NMVOC is calculated by Statistics Norway. Gasoline distribution NMVOC Emissions from gasoline distribution are calculated from figures on amounts of gasoline sold and emission factors for, respectively, loading of tanker at gasoline depot, loading of tanks at gasoline stations and loading of cars.

The Norwegian Emission Inventory 2011 Documents 21/2011
72 Statistics Norway
Gas terminals CH4 and NMVOC Fugitive emissions of CH4 and NMVOC from gas terminals are annually reported from the terminals to the Climate and Pollution Agency. The emissions are calculated based on the number of sealed and leaky equipment units that is recorded through the measuring and maintenance program for reducing the leakage. The number of sealed and leaky equipment units is collected two times a year and the average number of the countings is used in the calculation. It is assumed in the calculation that a leakage has lasted the whole year if not the opposite is documented. Measurements of the total emissions were carried out in 2002 and 2003. Gas distribution CH4 Emissions of CH4 from three different subgroups of distribution of natural gas are estimated:
• High pressure transmission pipelines: Large diameter pipelines that transport gas long distances from field production and processing areas to distribution systems or large volume customers such as power plants or chemical plants. Emissions are calculated by multiplying pipeline distance with an emission factor.
• Low pressure distribution pipelines: Distribution pipelines which take the high-pressure gas from the transmission system at “city gate” stations, reduce the pressure and distribute the gas through primarily underground mains and service lines to individual end users. Emissions are calculated by multiplying pipeline distance with an emission factor.
• Storage: Emissions from end users’ storage. Emissions are calculated by multiplying the amount of gas consumed with an emission factor.
Venting CH4 and NMVOC Emissions of CH4 and NMVOC from cold venting and diffuse emissions for each field are reported annually to the Climate and Pollution Agency from the field operator. The emissions are mostly calculated by multiplying the amount of gas produced with an emission factor for each emission source identified at the field. The indirect CO2 emissions are calculated by Statistics Norway. The vented CO2 at Sleipner West and Snøhvit is measured. Flaring CO2, CH4, N2O, NOX, NMVOC, CO, particulates, PAH and dioxins Emissions from flaring of natural gas off shore are calculated by Statistics Norway on the basis of field specific gas consumption data and emission factors. For CO2, CH4, NOX, NMVOC and SO2, calculated emissions are used in the inventory for the years until 2002. From 2003, emissions of these pollutantts from flaring offshore have been reported by the oil companies to NPD and the Climate and Pollution Agency are used in the inventory. The same method is used in the calculation of emissions from flaring in connection with well testing. Emissions of CO2, CH4 and NOX from flaring at gas terminals are reported for all years. For NMVOC, emissions are calculated for one gas terminal and reported figures used for the others. Other emissions from the gas terminals are based on activity data and emission factors. The refineries annually report CO2 emissions from flaring to the Climate and Pollution Agency. The emissions are calculated by multiplying the amount of gas flared with plant specific emission factors.

Documents 21/2011 The Norwegian Emission Inventory 2011
Statistics Norway 73
3.3.4.3. Activity data Loading and storage of crude oil off shore and on shore The amount of oil buoy loaded and oil loaded from storage tankers is reported by the field operators in an annual report to the Climate and Pollution Agency and the Norwegian Petroleum Directorate (NPD). The amount of oil loaded on shuttle tankers with or without VRU is separated in the report. Before 2003, Statistics Norway gathered data on amounts of crude oil loaded at shuttle tankers and stored at storage vessels from the NPD. The data from each field are reported monthly by the field operators to NPD on both a mass and a volume basis. The allocation of the amount of crude oil loaded at shuttle tankers and stored at storage vessels with or without VRU is from the annually report the field operators are committed to deliver to the Climate and Pollution Agency and NPD. The amount of oil loaded at on shore oil terminals is also reported to the Climate and Pollution Agency and NPD. Oil refineries The crude oil throughput is annually reported by the plant to the Climate and Pollution Agency. Gasoline distribution Gasoline sold is annually collected in Statistics Norway's sales statistics for petroleum products. Gas terminals Activity data that the terminals use in their emission calculations are sampled through the terminals measuring and maintenance program, whose aim is to reduce leakage. Gas distribution In the estimation of CH4 emissions from storage, figures on use of natural gas from the energy statistics are used. Emissions from transmission and distribution are based on data on pipeline distances collected from gas distributors. Venting Amounts of gas produced or handled at the platforms are reported from NPD and used in the QC of the reported emissions. Flaring Amounts of gas flared at offshore oil and gas installations are reported monthly by the operators to the Norwegian Petroleum Directorate (NPD). Amounts flared at the gas terminals are reported to NPD and the Climate and Pollution Agency. Amounts of refinery gas flared are found by distributing the total amounts between different combustion technologies by using an old distribution key, based on data collected from the refineries in the early 1990s. This distribution was confirmed in 2003.
3.3.4.4. Emission factors Loading and storage of crude oil offshore and on shore For the years before 2003, emission factors used in the calculation of CH4 and NMVOC emissions offshore are field specific and were reported to the Climate and Pollution Agency and NPD in an annual report. The Climate and Pollution Agency forwarded the emission factors to Statistics Norway. From 2003 the emission figures reported by the field operators are used in the inventory. The evaporation rate varies from field to field and over time, and the emission factors are dependent on the composition of the crude oil as indicated by density

The Norwegian Emission Inventory 2011 Documents 21/2011
74 Statistics Norway
and Reid vapour pressure (RVP). The VOC evaporation emission factors are obtained from measurements, which include emissions from loading and washing of shuttle tankers. For some fields the emission factors are not measured, only estimated. The CH4 content of the VOC evaporated is also measured so that total emissions of VOC are split between CH4 and NMVOC. The emission factors that the field operators use in their calculations are reported to the Climate and Pollution Agency and NPD. They report emissions factors with and without VRU and the split beteen CH4 and NMVOC. Loading on shore: The emission factors are considerably lower at one of Norway's two oil terminals than at the other, because the oil is transported by ship and therefore the lightest fractions have already evaporated. At the other terminal the oil is delivered by pipeline. The latter terminal has installed VRU, which may reduce NMVOC emissions from loading of ships at the terminal by about 90 per cent. NMVOC emissions at this terminal are estimated to be more than 50 per cent lower than they would have been without VRU. However, the VRU technology is not designed to reduce methane and ethane emissions. Oil refineries The emission factor used in the calculation of methane emissions from the largest refinery is based upon measurements performed by Spectracyne in 2002 and 2005. The EF is deduced from the measured methane emissions and the crude oil throughput in 2005. Gasoline distribution The emission factor for NMVOC from refuelling of gasoline in cars (1.48 kg NMVOC/tonne gasoline) is taken from EEA (2001). Gas distribution Since country specific emission factors for Norway not are available, Austrian factors are used in the estimations (Umweltbundesamt 2011). The factors for both storage and transmission may be too high.
Table 3.22. Emission factors for gas distribution
CH4
Emission factor Unit
High pressure transmission pipelines 0.475 tonnes per km pipeline
Low pressure distribution pipelines 0.013 tonnes per km pipeline
Storage 0.005145 tonnes per mill. Sm3 gas consumed .Source: (Umweltbundesamt 2011)
Venting The emission factors used are listed in table 3.23.

Documents 21/2011 The Norwegian Emission Inventory 2011
Statistics Norway 75
Table 3.23. Emission factors for cold vents and leakage at gas fields offshore
NMVOC
Emission factor CH4
Emission factor Calculation method
Emission source [g/Sm3] [g/Sm3]
Glycol regeneration 0.065 0.27
Gas dissolved in liquid from K.O. Drum 0.004 0.00
Gas from produced water system 0.03 0.03
Seal oil systems 0.015 0.01
Leaks through dry compressor gaskets 0.0014 0.00
Start gas for turbines1 0.4 0.36 Tonne per start up
Depressurisation of equipment 0.005 0.02
Instrument flushing and sampling 0.00021 0.00
Purge and blanket gas 1 0.032 0.02
Extinguished flare 0.014 0.02
Leaks in process 0.007 0.02
Depressurisation of annulus 0.0000005 0.00 Drilling 0.55 0.25 Tonne per well
1 The gas source is standard fuel gas. Source: Aker Engineering (1992).
Flaring From 2003, CO2 emission figures reported by the oil companies to the Climate and Pollution Agency and NPD are used in the inventory. For the years 1990-2002, average emission factors, based on field specific factors, are used, except for one field, for which a field specific factor is used for all years. In table 3.24, the CO2 emission factors for flaring offshore and at one gas terminal are shown. The average emission factor for the three types of flares (high pressure, low pressure, maintenance flare) at one of the other gas terminal was in 2009 2.50 tonne CO2/tonne gas flared. For the two last gas terminals the average emission factors were 2.93 and 1.94 tonne CO2 per tonne gas, respectively, in 2009. Emission factors used in the calculations for well testing are shown in table 3.25.
Table 3.24. Emission factors for flaring of natural gas at offshore oil fields and one gas terminal on shore
Average emission factor for flaring at one gas terminaltonne CO2 /tonne natural gas
Average emission factor for flaring off shore
kg CO2 / Sm3 natural gas1990 2.70 2.341991 2.70 2.341992 2.70 2.341993 2.70 2.341994 2.70 2.341995 2.70 2.421996 2.70 2.341997 2.70 2.341998 2.70 2.341999 2.70 2.482000 2.70 2.522001 2.70 2.422002 2.70 2.472003 2.70 -2004 2.70 -2005 2.70 -2006 2.69 -2007 2.67 -2008 2.67 -2009 2.67 -
Source: The Climate and Pollution Agency/ Norwegian Petroleum Directorate.

The Norwegian Emission Inventory 2011 Documents 21/2011
76 Statistics Norway
Table 3.25. Emission factors for flaring in connection with well testing
Compounds (unit) unit/tonnes flared oil
Source unit/kSm3 flared natural gas
Source
CO2 (tonnes) 3.2 (Norwegian pollution control authority 1990)
2.34 (Norwegian pollution control authority 1990)
CH4 (tonnes) 0.0004 0.00024 (IPCC 1997a) N2O (tonnes) 0.00003
Same factors as for fuel oil used for boilers in manufacturing
0.00002
NOX (tonnes) 0.0037 0.012 NMVOC (tonnes) 0.0033 0.00006 CO (tonnes) 0.018
(The Norwegian oil industry association 2009)
0.0015
(The Norwegian oil industry association 2009)
TSP (tonnes) 0.025 2.0E-06 PM10 (tonnes) 0.0215 2.0E-06 PM2.5 (tonnes) 0.014
Measurements (OLF1) Use the same distribution as for combustion of heavy fuel oil in industry (EPA 2002)
2.0E-06
(EPA 2002)
PAH (kg) 0.012 0 PAH-OSPAR (kg) 0.0024 0 PAH-4 (kg) 0.00024
(The Norwegian oil industry association 1991) Use the same distribution as for combustion of heavy fuel oil in industry (EPA 1998)
0
Dioxins (mg) 0.01 Measurements (OLF) 0 1The Norwegian Oil Industry Association (OLF).
3.3.4.5. Uncertainties The uncertainty in the emission factors for methane (Rypdal and Zhang 2000) and NMVOC (Rypdal and Zhang 2001) from oil loading is estimated to be ± 40 per cent and in the activity data ± 3 per cent. The uncertainty in the amount of gas flared is in regarded as being low, ±1.4 per cent, based on data reported in the emission trading scheme (Climate and Pollution Agency 2011a) and assumptions in Rypdal and Zhang (2000). The uncertainty in the CO2 emission factor for flaring is ±4.5 (Climate and Pollution Agency 2011a) and (Rypdal and Zhang 2000). The uncertainty in CH4 and NMVOC emissions from venting and, hence, in the indirect emissions of CO2, is much higher than for flaring. The emission factors for both storage and transmission of natural gas are uncertain, since Austrian factors are used in lack of country specific Norwegian factors. All uncertainty estimates for this source are given in Appendix D.
3.3.4.6. Source-specific QA/QC and verification Statistics Norway gathers activity data on oil and gas activities from the Norwegian Petroleum Directorate (NPD). These data are reported monthly by the field operators to NPD. The activity data are quality controlled by comparing them with the figures reported in the field operator's annual report to the Climate and Pollution Agency and NPD. The emissions calculated by Statistics Norway for 1990-2002 are compared with the emission data that the field operators report to the Climate and Pollution Agency and NPD. From 2003, Statistics Norway estimate emissions based on activity data that the field operators monthly report to NPD, and reported emission factors. When discrepancies are found between the two sets of data these are investigated and corrections are made if appropriate. If errors are found, the Climate and Pollution Agency contacts the plant to discuss the reported data and changes are made if necessary.

Documents 21/2011 The Norwegian Emission Inventory 2011
Statistics Norway 77
The reported emissions from the gas terminals are compared with previous years’ emissions. Statistics Norway collects the activity data used for venting and flaring in the calculation from the NPD. The figures are quality controlled by comparing them with the figures reported in the field operators’ annual report to the Climate and Pollution Agency and NPD, and time series are checked. The calculated emissions are compared with the emission data the field operators have reported to the Climate and Pollution Agency and NPD, before 2003. From 2003 reported emissions are checked by the Climate and Pollution Agency and Statistics Norway. Statistics Norway calculates emissions from reported emission factors and activity data collected monthly by the office of statistics in NPD. When discrepancies are found between the two sets of data this is investigated and corrections are made if appropriate. If errors are found, the Climate and Pollution Agency contacts the plant to discuss the reported data, and changes are made if necessary. Statistics Norway and the Climate and Pollution Agency perform internal checks of the reported data for venting from the field operators. Some errors in the time-series are usually found and the field operators are contacted and changes are made. The same procedure is followed to check the amount of gas reported as flared. The quality of the activity data is considered to be high, due to the fact that there is a tax on gas flared offshore. NPD has a thorough control of the amount of gas reported as flared.
3.3.5. CO2 capture and storage at the oil and gas production field Sleipner West
IPCC 1B2c NFR- Last update: 31.05.11
3.3.5.1. Description The natural gas in the Sleipner Vest offshore gas-condensate field contains about 9 per cent CO2. The CO2 content has to be reduced to about 2.5 per cent before the gas is transported to the consumers on shore. The CO2 to be removed amounts to about 1 million tonnes per year. When this North Sea field was planned around 1990 the considerations were influenced by the discussions about strategies to reduce greenhouse gas emissions and a possible national tax on CO2 emissions (introduced in 1991 and extended in 1996). It was therefore decided that the removed CO2 should be injected for permanent storage into a geological reservoir. The selection of an appropriate reservoir is essential for the success of geological storage of CO2. In their search for a suitable reservoir the companies were looking for a saline aquifer with reasonable high porosity and a capture rock above to prevent leakage. Furthermore the CO2 should be stored under high pressure - preferably more than 800 meters below the surface. Under these conditions CO2 is buoyant and less likely to move upwards than CO2 in gaseous form. The chosen reservoir is the Utsira formation, which is a sandstone saline aquifer 800 - 1000 metres below sea level. The reservoir was characterised by reservoir information such as seismic surveys and information from core drillings. The field and the injection program have been in operation since 1996. Statoil monitors the injected CO2 with respect to leakages. Investigations carried out so far show that the injected CO2 has been kept in place without leaking out. In case unexpected CO2 movements take place beyond the capture rock in the future it can be registered by the monitoring techniques. Table 3.26 gives the amount of CO2 injected in the Utsira formation since the project started in 1996.

The Norwegian Emission Inventory 2011 Documents 21/2011
78 Statistics Norway
When the injection has to stop for maintenance etc. the CO2 is vented to the atmosphere. The amount vented to the atmosphere is included in the greenhouse gas inventory reported under 1B2c - see section 3.3.4. The emission figures are given in table 3.27.
3.3.5.2. Method The reported data cover emissions to the atmosphere, e.g. when the injection system is out of operation. These emissions are measured by continuous metering of the gas stream by VCONE-meter. The reported amounts of CO2 which are injected in the Utsira formation are based on continuous metering of the gas stream by orifice meter. The Sleipner CO2-injection project is considered as the first industrial-scale, environmentally driven CO2-injection project in the world. In order to document what happens with the CO2 a European research project initially called SACS (“The saline aquifer carbon dioxide storage project”) was organized around it. The SACS project ended in 2002 and was succeeded by the ongoing the EU co-funded CO2STORE. The projects have run parallel to the development of Sleipner Vest and have special focus on monitoring and simulation. Research institutes and energy companies from several countries participate in the projects. The core of the projects has been to arrive at a reasoned view of whether carbon dioxide remains in the Utsira sand and whether developments in this formation can be monitored. The spread of carbon dioxide through the aquifer is recorded by seismic surveys. Base line 3D seismic data were acquired in 1994, prior to injection, and the first repeat survey was acquired in 1999, when some 2.28 mill tonnes of CO2 had been injected into the reservoir. This was followed by seismic surveys in 1999, 2001, 2002, 2004, 2006 and 2008. The stored CO2 has been monitored using time lapse seismic to confirm its behaviour and evaluate
• whether any of it has leaked into the overburden seal, the ocean or the atmosphere, or
• whether any of it has migrated towards the Sleipner installations, potentially leading to corrosion problems for well casing.
The results show that neither of these eventualities has occurred. So far there are no signs of CO2 above the top of the Utsira Formation. Results from the projects are given in several reports and articles such as: “Final Tecnical Report of the SACS2 project – EU project NNE-1999-00521, issued 30.07. 2002” (European Union 2002), “Recent time-lapse seismic data show no indication of leakage at the Sleipner CO2-injection site” published at 7th Greenhouse Gas Control Technologies Conference (GHGT7),Vancouver 2004 (Arts et al. 2004) and "4D seismic imaging of an injected CO2 plume at the Sleipner field, central North Sea” (Chadwick et al. 2004). The project has confirmed that sound waves reflect differently from carbon dioxide and salt water. Comparing seismic data collected before and after injection started has allowed researchers to show how CO2 deep inside the Utsira formation migrates. It is held under the layer of shale cap rock, 80 metres thick, which covers the whole formation. This extends for several hundred kilometres in length and about 150 kilometres in width. The time-lapse seismic data clearly image the CO2 within the reservoir, both as high amplitude reflections and as a pronounced velocity pushdown. The data also resolve a vertical CO2 chimney, which is regarded the primary feeder of CO2 in the upper part of the bubble. There are no seismic indications of faults within the upper part of the reservoir, and no indications of leakage into the capture rock.

Documents 21/2011 The Norwegian Emission Inventory 2011
Statistics Norway 79
The time-lapse seismic images clearly show the development of the CO2 plume, and also have been used to calculate the amount of CO2 in the reservoir. The volume calculated from the observed reflectivity and velocity pushdown is consistent with the injected volume.
3.3.5.3. Uncertainties The reported data cover emissions to the atmosphere, e.g. when the injection system is out of operation. The accuracy in these measurements made by VCONE-meter is +/- 5 per cent. The orifice meter used to meter the amount of CO2 injected in the Utsira formation have +/- 3 per cent accuracy. So far there have not been detected any leakage from the storage. We expect to have more information from the SACS/CO2STORE-projects and the monitoring program as the Sleipner project develops – see QA/QC below.
3.3.5.4. Source specific QA/QC The results are promising and so far the injected gas remains in place. In Norway storage projects like Sleipner have to apply for a permit after the Pollution control Act. The storage of CO2 is included in the emission licence for the Sleipner Vest field. According to the license, the operator Statoil is obliged to monitor the CO2 storage. Furthermore, Statoil reports the amount of CO2 emitted and the amount injected every year to the Climate and Pollution Agency. The monitoring gives a system for QA. So far the monitoring is included in the SACS/CO2STORE projects and when these projects are finalized a decision will be taken about a further monitoring program for the Sleipner injection project. The injected CO2 is so far proven to be removed from the atmosphere and hence it is not reported as in the emission inventory. When the injection have to stop for maintenance etc., Statoil have to pay a CO2 tax for the emissions. These emissions are reported to the Norwegian Petroleum Directorate. In this national emission inventory these fugitive emissions are reported under 1B2c.
Table 3.26. CO2 from the Sleipner field injected in the Utsira formation, 1000 tonnes
1996 1997 1998 1999 2000 2001 2002 2003 2004 2005 2006 2007 2008 2009 CO2 (ktonnes) 70 665 842 971 933 1 009 955 914 750 858 820 921 814 860 Source: The Climate and Pollution Agency.
Table 3.27. Emissions of CO2 from the Sleipner CO2 injection plant due to inaccessibility of the injection facilities, tonnes
1996 1997 1998 1999 2000 2001 2002 2003 2004 2005 2006 2007 2008 2009 CO2 (tonnes) 81 000 29 000 4 195 9 105 8 318 3 050 7 567 23 910 21 377 6 191 2 471 6 413 13 569 4595 Source: The Climate and Pollution Agency.
3.3.6. CO2 capture and storage at Hammerfest LNG/the gas-condensate production field Snøhvit
IPCC 1B2c NFR- Last update: 11.06.10
3.3.6.1. Description The natural gas in the Snøhvit gas-condensate subsea field contains about 5-7.5 per cent CO2. Prior to the LNG production process at Hammerfest LNG, the CO2 in the feed gas has to be removed as the gas is liquefied to LNG and stored at -163 ºC. The CO2 removed from the well stream is compressed and reinjected into the Tubåen formation on Snøhvit. About 0.7 Mtonnes CO2 are removed from the feed gas every year at full production. A total of about 23 Mtonnes CO2 will be separated from the feed gas during the field‘s lifetime. The Tubåen formation is a saline aquifer lying around 100-200 metres below the gas cap at Snøhvit and 2600 metres below sea level. Hammerfest LNG (former Snøhvit LNG Statoil) was granted a permit pursuant to the Pollution Control Act to inject 730 000 tonnes of CO2 per year into the Tubåen

The Norwegian Emission Inventory 2011 Documents 21/2011
80 Statistics Norway
formation. The permit was issued on 13 September 2004 by the Climate and Pollution Agency. Tubåen formation is water filled and has a thickness between 45 and 75 metres. Core samples show that the formation consists of relatively pure quartz sand. The porosity and permeability are 10-16 per cent and 200-800 md, respectively. The formation is bounded by large faults on all sides. It is unlikely that the injected CO2 will come in contact with the gas cap in the main reservoir (Stø). This is because the Nordmela formation, a 100 metres thick formation with large shale intervals, lies between Tubåen and Stø. The reservoir was characterised by reservoir information such as seismic surveys and information from core drilling. The CO2 injection in the Tubåen formation is still in an early phase and during the first two years of injection, several challenges have occurred. These challenges and the ongoing work to address them are further described below. The injection pipeline is 152 km long. At Snøhvit, all facilities for separation and injection of CO2 are placed onshore at the Hammerfest LNG process plant at Melkøya. CO2 in the feed gas (natural gas) are removed to avoid it freezing out in the downstream liquefaction process. An amine absorption unit performs this operation. The recovered CO2 is condensed and recompressed before being reinjected into Tubåen. CO2 is most likely re-injected as a single phase (liquid condition in the pipeline from the export pump to the well head, transformed to supercritical condition in the reservoir where the temperature is higher). CO2 well stream specification o >99 per cent CO2 o max 100 ppm (mol) H2S o max 50 ppm (wt) H2O o traces of HC and N2 CO2 venting is foreseen in case of shut down of the CO2 reinjection system. The maximum vent rate is almost equal to the CO2 removal flow rate. A separate vent stack for the CO2 is provided at the plant. CO2 injection at Snøhvit started in April 2008. Almost immediately after start up, challenges occurred. By mid-December 2008, the main concern was low injectivity. This issue was resolved in December 2008, and since then the rise of reservoir pressure (near well) has been the main focus and concern. The injection pressure (while injecting & shut-in) has risen significantly. A 3D/4D seismic survey focused around the injection well was acquired autumn 2009. The main observation was that existing perforation in the injection well does not communicate enough and/or with a large enough hydraulic volume (aquifer). No hydrocarbons or residuals hydrocarbons (HC) were found in Tubåen when the well was drilled. The status by 1 January 2010 is that 504 ktonnes CO2 has been injected into the Tubåen formation and 143.2 ktonnes CO2 has been vented (table 3.28).
Table 3.28. Injected and vented CO2. Hammerfest LNG/Snøhvit field. Tonnes
2008 2009 Total CO2 injected 196 087 308 146 504 233 CO2 vented 93 409 49 821 143 230 Source: The Climate and Pollution Agency
3.3.6.2. Method and uncertainties The reported data covers CO2 emissions to the atmosphere, e.g. when the injection system is out of operation. These emissions are measured by a venturi flow meter with an uncertainty of 3-5 per cent. Flow metering of the well stream to the CO2 injector is measured by an orifice meter with an uncertainty of 3-5 per cent. No manual or online analyses are done. Gas composition of injected or vented gas from the CO2 injector is controlled by analyses. This is primarily done as a quality assurance of the CO2 removal system

Documents 21/2011 The Norwegian Emission Inventory 2011
Statistics Norway 81
(system 22). For environmental reporting, design values are used (99.56 weight per cent CO2) and the analysis confirms these values. The Snøhvit license is preparing an application for a revised integrated permit for the Snøhvit plant, and as a part of this process the emission factors are verified by weekly analyses of the gas. The 3D/4D seismic monitoring survey was shot from 24 August – 9 September 2009. A clear amplitude response is seen on the seismic in the lower part of Tubåen, up to 3 km2 from the well. The upper two perforations give a response of about 600 m2. The results indicate that the main amount of CO2 is injected into the lower part of Tubåen, with some minor amounts injected into middle Tubåen. The pressure development in the injection well is monitored on a daily basis by using data from the pressure and temperature gauge installed in the well, 800 metres above the reservoir. Since autumn 2008, different models for the Tubåen formation have been used to match and understand the pressure behaviour in the injection well. All models used have been Eclipse 100 (―black oil) where the CO2 is modelled as a gas-phase, but given fluid parameters as for CO2. The cumulative injection volume as per autumn 2009 is not very large, only around 800.000 Rm³ of CO2 has been injected5. This reservoir volume is the same as 500.000 tonnes of CO2 or 270 mill. Sm³ of CO2. For the entire field-life, more than 30 mill. Rm³ of CO2 is planned to be injected. Several models/approaches seem to give reasonable match, but it has not been straight-forward to match pressure increase during injection and, at the same time, have match for those periods where injection has stopped (decline periods). 41 concrete benchmarks across the Snøhvit reservoir were pre-installed in 2007. The closest is 419 metres from the CO2 injection well. No repeat survey has been done yet. A possible repeat survey may take place in 2011. Challenges with pressure increase in the CO2 well have lead to a great effort to find solutions that makes the CO2 injection as robust as possible. The authorities have been kept informed about the situation and the activities and measures planned. The following is a list of the main ongoing activities:
• Continuous monitoring of the pressure development in the well • 4D interpretation and analysis • Studies of injection in Tubåen based on results from 4D seismic including
predictions on reservoir performance for Tubåen with or without additional perforations.
• Analysis of the limitation and how long CO2 can be injected in Upper Tubåen
• Studies on possible Stø injection – consequences • Planning for a well intervention in the injection well summer 2010 • Planning for a possible new injector well
So far it appears that volume(s) in Tubåen is not large enough, or does not communicate enough with the surroundings. Question remains if the planned additional perforation, of remaining sands in Tubåen, will resolve the pressure and volume challenge, or if bottom of the Stø formation in the present injection well, also needs to be perforated in near future. The present situation, with pressure build-up in the early phase of injecting into Tubåen was also addressed prior to start of CO2 injection. It was described in the documentation report on Snøhvit CO2-model-compositional simulations that if no HC is available and F-2 connects a reservoir volume of 330 mill. Rm³, fracture pressure will be reached after 150 days of injection.
3.3.6.3. Source specific QA/QC Storage projects like the injection at the Snøhvit area have to apply for a permit after the Pollution Control Act. According to the permit Statoil has implemented

The Norwegian Emission Inventory 2011 Documents 21/2011
82 Statistics Norway
systems for monitoring the CO2 storage. So far there is no sign of emissions to the water column or the atmosphere from the injected CO2. Hence the CO2 injected is not reported as emissions in the emission inventory. When the injection facility is out of operation due to maintenance etc., Statoil has to pay a CO2 tax for the emissions. These emissions are reported to the Norwegian Petroleum directorate. In the national emission inventory, the amount CO2 vented at Hammerfest LNG (Snøhvit CO2 storage project) should be reported under 1B2c, but were erroneously reported under 1B2aiii in the 2010 inventory.

Documents 21/2011 The Norwegian Emission Inventory 2011
Statistics Norway 83
4. Industrial processes IPCC 2 NFR 2
4.1. Overview This chapter provides descriptions of the methodologies employed to calculate emissions of greenhouse gases and long-range transboundary air pollutants from industrial processes. Only non-combustion emissions are included in this chapter. Emissions from fuel combustion in the manufacturing industries are reported in chapter 3 Energy. Emission figures are either reported by plants to the Climate and Pollution Agency or calculated by Statistics Norway, based on emission factors and activity data. The emission factors are collected from different sources, while the activity data used in calculations carried out by Statistics Norway mainly come from official statistics collected by Statistics Norway. A specific QA/QC has been carried out for the industrial processes sector in 2006. The QA/QC covered the greenhouse gas emissions from the largest industrial plants to be included in the greenhouse gas inventory. The methodology for the performances of the QA/QC is presented in Appendix I.
4.2. Mineral products IPCC 2A NFR 2A Last update: 17.06.09 The sector category Mineral products in the Norwegian inventory include emissions from thirteen different products (see table 4.1). CO2, SO2, NH3, particles, heavy metals and dioxins are components that are emitted during the production of mineral products and included in the inventory. Table 4.1 shows the various components emitted from the different activities, and for which components the emission figures in the national inventory are based on figures reported by the plants (R) and for which the figures are estimated by Statistics Norway (E).
Table 4.1. Mineral products. Components emitted and included in the Norwegian inventory1
Mineral products CO2 SO2 NH3 Particles Heavy metals Dioxins -- Cement production R R NA R R R -- Lime production R NA NA R R NA -- Limestone and dolomite use R NA NA NA NA NA -- Concrete pumice stone NA R NA R NA NA -- Rock wool production NA NA R R R NA -- Glass and glass fibre NA NA R R R NA -- Ore mines NA R NA R NA R -- Mining and extraction of stones and minerals NA NA NA R NA NA -- Production of mineral white NA NA NA R R NA -- Construction /repairing of vessels - Sandblasting NA NA NA R NA NA -- Sandpit and rock-chrushing plants NA NA NA E NA NA -- Construction and building NA NA NA E NA NA -- Leather preparing NA NA R NA NA NA
1 R means that emission figures in the national emission inventory are based on figures reported by the plants. E means that the figures are estimated by Statistics Norway (Activity data * emission factor). NA = Not Applicable.
4.2.1. Cement production IPCC 2A1 Key category for CO2 NFR 2A1 Last update: 17.06.09
4.2.1.1. Description Two plants in Norway produce cement. Production of cement gives rise to both non-combustion and combustion emissions of SO2 and CO2. The emission from combustion is reported in chapter 3 Energy. The non-combustion emissions originate

The Norwegian Emission Inventory 2011 Documents 21/2011
84 Statistics Norway
from the raw material calcium carbonate (CaCO3). The resulting calcium oxide (CaO) is heated to form clinker and then crushed to form cement. The emissions of SO2 and CO2 from non-combustion are reported to The Climate and Pollution Agency. (4.1) CaCO3 + heat → CaO + CO2 SO2 from cement production is emitted from sulphur in the fuel (reported under Energy) and in the raw materials, especially pyrite in limestone. Only the SO2 from the raw materials should be counted as non-combustion emissions. Particles as well as heavy metals are emitted during the production process. More than 90 per cent of the emission of mercury is due to mercury in the limestone while the emissions of Pb, Cd, Cu, Cr and As originate both from processes and combustion of fuel. Emissions of dioxins are due to the thermal process in the clinker production.
4.2.1.2 Method CO2
Emission figures are reported by the two plants to the Climate and Pollution Agency. Figures are reported for all years since 1990. Emissions are estimated by the plants by multiplying the annual clinker production,including the Cement Kiln Dust (CKD), at the plant with plant specific emission factors (Andersen and Karstensen 1998).This is regarded as a Tier 2 method. SO2 The plants annually report emissions of SO2 to the Climate and Pollution Agency. Figures are based on measurements at the plants. SO2 emissions from production of cement come from energy carriers like e.g. coal and oil and from limestone. The sulphur from the energy carriers is to a large extent included in the clinker during the process. The emissions are distributed between combustion and non-combustion emissions based on studies conducted by Institute for Energy Technology in 1970 and 1999. Both studies indicate that 80-99 per cent of the sulphur from energy carriers is included in the clinker. The total SO2 emissions from the two plants are based on measurements. When the SO2 emissions reported from the plant are not distributed between combustion and non-combustion emissions, the Climate and Pollution Agency distributes the total emissions, using the same percentage distribution as in the last year with reported distributed SO2 emissions. The production technology is to some extent different for the two plants. In the last years, the distribution between combustion and non-combustion emissions is about 10/90 for one plant and 18/82 for the other plant. The difference is assumed to be due to the fact that one plant has a ”by-pass” system where some of the flue gas is not in contact with the raw materials. The amount of energy carriers used in cement production is subtracted from the energy balance to avoid double counting, see section 3.2.1.2. Particles Emissions have been reported to the Climate and Pollution Agency since 1991 for one plant and since 1992 for the other. It is believed that the reported figures also include emissions from combustion. Therefore emissions from combustion of coal, coke and waste oil used in cement production are not calculated, to avoid double counting. The plants have installed particle filter. Particle size distribution for emitted particles from cement production is found in TNO (Institute of environmental and energy technology 2002). In the Norwegian emission inventory, PM10 and PM2.5 are assumed to be 85 and 30 per cent of TSP, respectively.

Documents 21/2011 The Norwegian Emission Inventory 2011
Statistics Norway 85
Heavy metals and POPs Emission figures for heavy metals are reported to the Climate and Pollution Agency. It is believed that these figures also include emissions from combustion. Therefore emissions from combustion of coal, coke and waste oil used in cement production are not calculated, to avoid double counting. Dioxin figures are reported to the Climate and Pollution Agency. It is also here assumed that the reported figures include emissions from fuel combustion, therefore emissions from combustion are not calculated.
4.2.1.3. Uncertainties Uncertainty estimates for greenhouse gases and long-range transboundary air pollutants are given in Appendix D. Reported emission figures for particles have varied a great deal as a result of changes the plants have undergone to reduce emissions. There are also uncertain measurements due to annual variations. Regarding the heavy metals, it has varied when the two plants started reporting the various components, and therefore estimations have been necessary for the years when reporting have been insufficient. The reported figures also vary from a year to another due to process technical conditions, variations in the metal content in the limestone used and uncertain measurements.
4.2.1.4. Completeness Major missing emission components are not likely.
4.2.1.5. Source specific QA/QC Statistics Norway occasionally calculate alternative emission figures for CO2 and compare with the emission figures reported by the plants to the Climate and Pollution Agency to check if they are reasonable. The calculations are based on the clinker production (reported annually from the plants to Statistics Norway). The emission factors used are recommended by SINTEF (Andersen and Karstensen 1998) and are based on the actual composition of the raw materials used. These emission factors are calculated particularly for the two Norwegian factories and are 0.520 and 0.541 tonne CO2 per tonne clinker, respectively. The IPCC default emission factor is 0.5071 tonne CO2/tonne clinker. The calculated emission figures agree quite well with emissions figures reported by the plants. The specific QA/QC carried out in 2006 for greenhouse gases from industrial processes is described in Appendix I.
4.2.2. Lime production IPCC 2A2 NFR 2A2 Last update: 31.05.11
4.2.2.1. Description Three lime producing plants in Norway report process emissions of CO2 to the Climate and Pollution Agency. One of the plants also reports emissions of particulate matter.
4.2.2.2. Method CO2
All three plants calculate the emissions of CO2 based on actual production volumes of lime and plant specific emission factors for CO2 from limestone and dolomite respectively. The emissions are reported to the Climate and Pollution Agency. For

The Norwegian Emission Inventory 2011 Documents 21/2011
86 Statistics Norway
one of the plants, emissions from 2002-2004 have been estimated by the Climate and Pollution Agency, based on activity data and plant specific emission factors. For the same plant, emissions for the years 1991-1997 have been interpolated by the Climate and Pollution Agency. Particles For one plant, emission figures for particulate matter have been reported to the Climate and Pollution Agency since 1990. Emission figures from 1990 to 1995 are based on calculations, using emission factors and production volume. Since 1996, the figures are a result of measurements at the plant. The plant has installed particle filter. In the inventory, a particle size distribution suggested by TNO (Institute of environmental and energy technology 2002) is used. PM10 is 0.4*TSP while PM2.5 is 0.08*TSP.
4.2.2.3. Activity data The activity data is the input of limestone and dolomite; these amounts are annually reported by the plants to the Climate and Pollution Agency. For two of the plants, the input of limestone is determined by adding up the production volumes of lime (weighed on a scale for trucks). Analysis of the contents of CaO in lime is then used to calculate the input of limestone. For the third plant, the amounts of limestone and dolomite going into the production process are weighed in batches. The weights of these batches are then added to get an annual figure.
4.2.2.4. Emission factors The plants use emission factors in the range of 0.4254 to 0.437 tonnes CO2 per tonne limestone and 0.474 tonnes CO2 per tonne dolime produced.
4.2.2.5. Uncertainties Uncertainty estimate for the emission of CO2 is given in Appendix D. The particle distribution used is not specified for the plants, and the particles emitted might therefore have another distribution than the one suggested from TNO (Institute of environmental and energy technology 2002).
4.2.2.6. Completeness Major missing emission components are not likely.
4.2.2.7. Source specific QA/QC There is no source specific QA/QC procedure for this sector. See section 1.5 for the description of the general QA/QC procedure. The specific QA/QC carried out in 2006 for greenhouse gases from industrial processes is described in Appendix I.
4.2.3. Limestone and Dolomite Use IPCC 2A3 NFR 2A3 Last update: 27.05.10
4.2.3.1. Description Three plants report emissions from limestone and dolomite use to the Climate and Pollution Agency. One plant neutralizes sulphuric acid waste with limestone and fly ash. During the neutralization prosess CO2 is produced. The use of fly ash decreases the CO2 emissions compared with when limestone is used. The second plant is a brick producer and uses limestone in its production. The third plant produces calcium oxide and magnesium oxide from limestone and dolomite.

Documents 21/2011 The Norwegian Emission Inventory 2011
Statistics Norway 87
4.2.3.2. Method The plants report emission figures for CO2 to the Climate and Pollution Agency. The emissions are calculated by multiplying the amount of sulphuric acid and limestone with emission factors.
4.2.3.3. Activity data The amount of limestone and dolomite used by the plants in their calculation is annually reported to the Climate and Pollution Agency.
4.2.3.4. Emission factors The plant that neutralizes sulphuric acid waste uses an emission factor of 0.45 tonnes CO2 per tonne sulphuric acid, calculated from the reaction equation. The brick producing plant uses an emission factor of 0.440 tonnes CO2 per tonne CaCO3. The plant producing calcium oxide and magnesium oxide uses emission factors of 0.44 tonnes CO2 per tonne limestone and 0.46 tonnes CO2 per tonne dolomite
4.2.3.5 Uncertainties Uncertainty estimates are given in Appendix D.
4.2.3.6. Completeness Major missing emission components are not likely.
4.2.3.7. Source specific QA/QC There is no source specific QA/QC procedure for this sector. See section 1.5 for the description of the general QA/QC procedure. The specific QA/QC carried out in 2006 for greenhouse gases from industrial processes is described in Appendix I.
4.2.4. Concrete pumice stone IPCC 2A7 NFR 2A7iii Last update: 17.02.10
4.2.4.1. Description Two factories produced concrete pumice stone until 2004 when one of them was closed down. The plants report emissions of SO2 and particles to the Climate and Pollution Agency. Non-combustion emissions of SO2 originate from the clay used in the production process.
4.2.4.2. Method SO2
Emission figures for SO2 are reported to the Climate and Pollution Agency, based on measurements at the two manufacturing plants in Norway. The plants have installed flue gas desulphurisation equipment. Particles The plants have reported emissions of particles to the Climate and Pollution Agency since 1990. It is assumed that the reported figures include both process and combustion emissions, so emission calculations from fuel combustion are not done for these two plants. The plants have installed particle filters. No information concerning particle size is found in national or international literature, but the Climate and Pollution Agency assumes that most of the particles emitted from these plants are smaller than PM10.
Statistics Norway has decided to use the same particle size distribution for production of cement as given in TNO (Institute of environmental and energy technology 2002). PM10 is therefore assumed to be 0.85*TSP and PM2.5 is 0.3*TSP.

The Norwegian Emission Inventory 2011 Documents 21/2011
88 Statistics Norway
4.2.4.3. Uncertainties The particle size distribution used is not specific for production of concrete pumice stone, but used due to lack of specific size distribution data for this source. The particle size distribution can therefore only be seen as an estimate.
4.2.4.4. Completeness Particles often contain heavy metals, but type of metals and volumes will depend on the origin of the particles. Metals might therefore be emitted during production of concrete pumice stone. Statistics Norway and the Climate and Pollution Agency have, however, no data available for calculating emissions of heavy metals from this source.
4.2.4.5. Source specific QA/QC There is no source specific QA/QC procedure for this sector. See section 1.5 for the description of the general QA/QC procedure.
4.2.5. Rock wool production IPCC - NFR 2A7iii Last update: 01.09.05
4.2.5.1. Description Three plants in Norway produced rock wool until 2003 when one of them was closed down. In the inventory, emission figures for NH3, particles and heavy metals are included. Particles originate from the cutting of the mineral wool and from fuel used in the production. The emissions of heavy metals are partly due to use of coal/coke, but mainly due to the stone used in the production. Emissions of dioxins and PAHs are neither reported nor calculated since emissions of these components are minor or not occurring.
4.2.5.2. Method NH3
Emission figures are reported to the Climate and Pollution Agency. Figures exist from 1992. It is assumed in the inventory that emission figures for 1990 and 1991 are the same as the reported figure in 1992. Particles Emission figures are reported to the Climate and Pollution Agency. Most of the emissions come from the spin chamber, and the particle size is assumed to be less than 1 μm. Particles emitted from the fabric filter are also assumed to be smaller than 1 μm. All emissions are therefore set to be smaller than PM2.5. All assumptions are made by the Climate and Pollution Agency in accordance with the industry. It is assumed that the reported figures include both non-combustion and combustion emissions. Combustion emissions of particles are therefore not calculated. Heavy metals and POPs Emission figures for Pb, Cd, As and Cr have been reported annually from one of the plants to the Climate and Pollution Agency since 1999. The figures are based on measurements. It is assumed that the reported figures include combustion emissions, and emission calculations from fuel combustion are not done for these heavy metals. Statistics Norway has calculated the emission figures for missing years (1990-1998) based on reported figures in 1999 and production rates for previous years. For the two plants not reporting, Statistics Norway calculates emissions based on derived emission factors from the one plant that reports and production volumes at each plant.
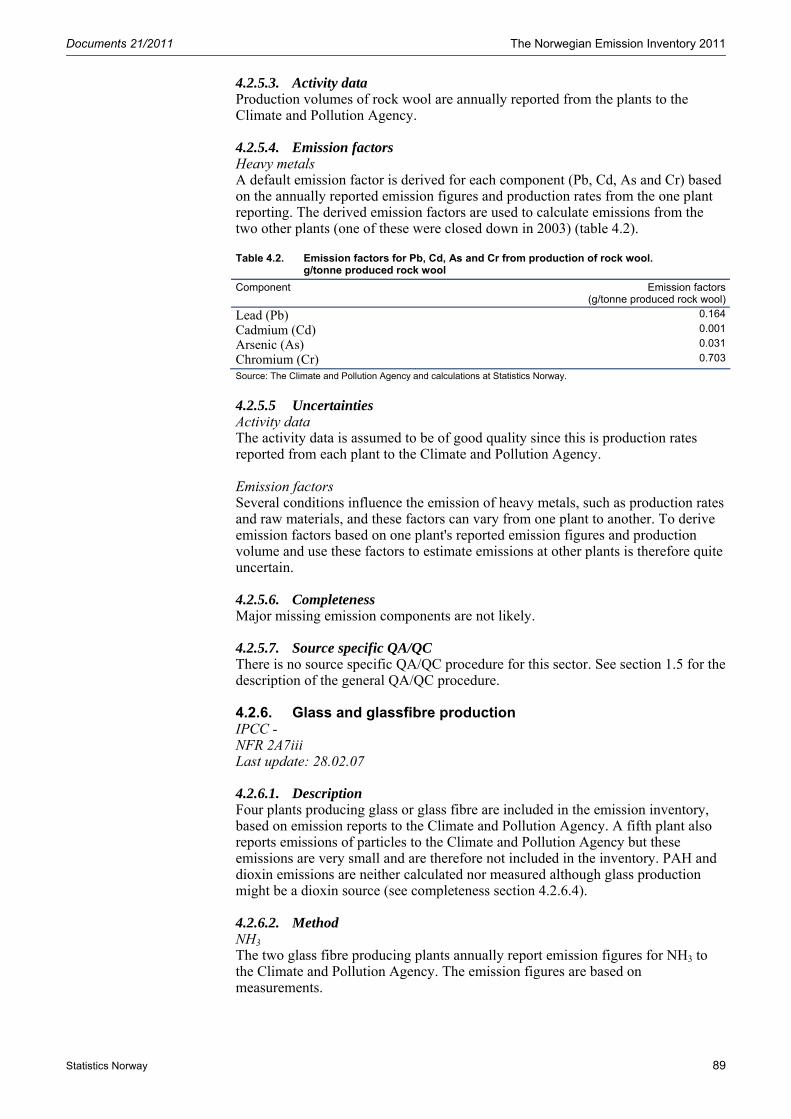
Documents 21/2011 The Norwegian Emission Inventory 2011
Statistics Norway 89
4.2.5.3. Activity data Production volumes of rock wool are annually reported from the plants to the Climate and Pollution Agency.
4.2.5.4. Emission factors Heavy metals A default emission factor is derived for each component (Pb, Cd, As and Cr) based on the annually reported emission figures and production rates from the one plant reporting. The derived emission factors are used to calculate emissions from the two other plants (one of these were closed down in 2003) (table 4.2).
Table 4.2. Emission factors for Pb, Cd, As and Cr from production of rock wool. g/tonne produced rock wool
Component Emission factors (g/tonne produced rock wool)
Lead (Pb) 0.164
Cadmium (Cd) 0.001
Arsenic (As) 0.031
Chromium (Cr) 0.703
Source: The Climate and Pollution Agency and calculations at Statistics Norway.
4.2.5.5 Uncertainties Activity data The activity data is assumed to be of good quality since this is production rates reported from each plant to the Climate and Pollution Agency. Emission factors Several conditions influence the emission of heavy metals, such as production rates and raw materials, and these factors can vary from one plant to another. To derive emission factors based on one plant's reported emission figures and production volume and use these factors to estimate emissions at other plants is therefore quite uncertain.
4.2.5.6. Completeness Major missing emission components are not likely.
4.2.5.7. Source specific QA/QC There is no source specific QA/QC procedure for this sector. See section 1.5 for the description of the general QA/QC procedure.
4.2.6. Glass and glassfibre production IPCC - NFR 2A7iii Last update: 28.02.07
4.2.6.1. Description Four plants producing glass or glass fibre are included in the emission inventory, based on emission reports to the Climate and Pollution Agency. A fifth plant also reports emissions of particles to the Climate and Pollution Agency but these emissions are very small and are therefore not included in the inventory. PAH and dioxin emissions are neither calculated nor measured although glass production might be a dioxin source (see completeness section 4.2.6.4).
4.2.6.2. Method NH3
The two glass fibre producing plants annually report emission figures for NH3 to the Climate and Pollution Agency. The emission figures are based on measurements.

The Norwegian Emission Inventory 2011 Documents 21/2011
90 Statistics Norway
Particles The two plants producing glass fibre have reported emission figures since 1990 to the Climate and Pollution Agency. The one glass-producer with particle emissions has reported since 1995. Emission figures from 1990 to 1994 were therefore assumed to be the same as reported figures in 1995. This plant was however closed down in 1999. TNO (Institute of environmental and energy technology 2002) suggests using a particle size distribution of the emissions where PM2.5 is 80 per cent of TSP and PM10 is 90 per cent of TSP, and this size distribution is used in the Norwegian inventory. Heavy metals and POPs Emission of lead has been reported from two glass-producers to the Climate and Pollution Agency. One of them was closed down in 1999. The emission of lead is due to the lead content in the raw material used. Emission of arsenic was reported in the early nineties when one of the plants used raw materials containing arsenic. No arsenic emissions were reported in the period 1993-2004. In 2005, a minor figure was reported, which also has been used for the following years. Emissions of other heavy metals are not reported, so we assume there are not significant emissions.
4.2.6.3. Uncertainties For the years where reported emission figures for particles do not exist, Statistics Norway has assumed that emissions are in the same order of magnitude as for the first year of reporting. This is uncertain and only an estimate, since it does not consider annual changes in raw materials, production rates, nor possible cleaning devices.
4.2.6.4. Completeness Production of glass can be a source for dioxin emissions, but no reported figures are available. Emission factors are found in literature, but since activity data (production rate) is not available and it is assumed that the emission factor is dependent on type of glass produced, emissions are not calculated. Emissions of particles are also reported from three other glass-producers in Norway, but since annual emissions are low (less than 1 tonne), they are not included in the inventory.
4.2.6.5. Source specific QA/QC There is no source specific QA/QC procedure for this sector. See section 1.5 for the description of the general QA/QC procedure.
4.2.7. Ore mines IPCC - NFR 2A7i Last update: 27.05.10
4.2.7.1. Description Three ore mines are included in the Norwegian Inventory, but one of the mines was closed down in 1996. Emission figures of SO2, particles and dioxins are included. The treatment of ore generates emissions of SO2, and particles are also emitted. Dioxin emissions are due to the thermal process during the pellet production. The ore mine which closed down in 1996, had large dioxin emissions due to the thermal process during the pellet production.

Documents 21/2011 The Norwegian Emission Inventory 2011
Statistics Norway 91
4.2.7.2. Method SO2 The ore mine which was closed down in 1996, reported emission figures for SO2 to the Climate and Pollution Agency. None of the two other ore mines report any non-combustion SO2 emissions. Particles All the three ore mines report emission figures for particles to the Climate and Pollution Agency. Emissions for the two existing ore mines are reported from respectively 1994 and 1996 and it is assumed by Statistics Norway, in accordance with the Climate and Pollution Agency, that emissions for previous years have been in the same order of size. The size distribution used in the Norwegian inventory is according to TNO (Institute of environmental and energy technology 2002) (table 4.3).
Table 4.3. Particle size distribution for particles emitted from ore mining. Ratio X1/TSP
Component Particle size distribution (ratio)TSP 1PM10 0.49PM2.5 0.071 X is either PM2.5, PM10 or TSP. Source: TNO (Institute of environmental and energy technology 2002).
Dioxins Emissions of dioxins are registered only for the ore mine which was closed down in 1996. Emission figures were first reported to the Climate and Pollution Agency in 1994 and emissions for previous years have been assumed by Statistics Norway, in accordance with the Climate and Pollution Agency, to be in the same order of size as the reported figure in 1994.
4.2.7.3. Uncertainties For years where reported emission figures do not exist for particles and dioxins, Statistics Norway has assumed, in accordance with the Climate and Pollution Agency, that the emissions are in the same order of size as for the first year of reporting. This is uncertain and a result of lack of better data. The size of the particles emitted from ore mining will also depend on the type of ore and production process. The particle size distribution used in the inventory does not consider these differences.
4.2.7.4. Completeness SO2 emissions are only included in the inventory for the ore mine that was closed down in 1996. The SO2 emissions from the two other ore mines are not included in the inventory.
4.2.7.5. Source specific QA/QC There is no source specific QA/QC procedure for this sector. See section 1.5 for the description of the general QA/QC procedure.
4.2.8. Mining and extraction of stones and minerals IPCC - NFR 2A7i Last update: 01.09.05
4.2.8.1. Description Mining and extraction of stones and minerals are done by several plants. Particles are emitted during these processes.

The Norwegian Emission Inventory 2011 Documents 21/2011
92 Statistics Norway
4.2.8.2. Method Particles Emission figures are reported to the Climate and Pollution Agency. Reported figures exist from 1992. Emission figures for 1990 and 1991 are assumed by Statistics Norway, in accordance with the Climate and Pollution Agency, to be the same as reported figures in 1992. An exception is one plant, which only reported emissions for 1992. For this plant, Statistics Norway has calculated emissions based on production rates for previous and later years. It is given for most plants that they use fabric filter or textile fibre to clean their particle emissions. It is assumed by the Climate and Pollution Agency that the particles emitted are larger than PM10. The Norwegian inventory uses the size distribution recommended by TNO (Institute of environmental and energy technology 2002) for sandpits and rock-crushing plants (table 4.4).
4.2.8.3. Uncertainties For years where reported emission figures do not exist, Statistics Norway has assumed that emissions are in the same order of size as for the first year of reporting. This is uncertain and a result of lack of better data. The size of the particles emitted from mining and extraction will also depend on the type of stone/mineral and production process. The particle size distribution used in the inventory does not consider these differences.
4.2.8.4. Completeness Emission of particles is often a source of heavy metal emissions since particles often contain heavy metals. Type of metals will however depend on the origin of the particles. Metals might therefore be emitted during mining and extraction of stones and minerals. There are, however, no data available for calculating emissions of heavy metals.
4.2.8.5. Source specific QA/QC There is no source specific QA/QC procedure for this sector. See section 1.5 for the description of the general QA/QC procedure.
4.2.9. Production of mineral white (plaster) IPCC - NFR 2A7iii Last update: 01.09.05
4.2.9.1. Description Two plants producing mineral white in Norway are included in the inventory with their emissions of mercury and particles. The mercury content in the raw materials leads to emission of mercury, and during the production process, particles are emitted.
4.2.9.2. Method Particles Emission figures are reported to the Climate and Pollution Agency. Reported emission figures exist since 1992 and figures for 1990 and 1991 are assumed by Statistics Norway, in accordance with the Climate and Pollution Agency, to be the same as the figures reported in 1992. The particles are purified through a fabric filter, and it is assumed by the Climate and Pollution Agency that the particles emitted after the filter are smaller than PM10. According to TNO (Institute of environmental and energy technology 2002), PM2.5
is 30 per cent of TSP, while PM10 is assumed to be the same as TSP. The Norwegian inventory uses this distribution.

Documents 21/2011 The Norwegian Emission Inventory 2011
Statistics Norway 93
Heavy metals The plants have reported emission figures to the Climate and Pollution Agency since 2000. For one of the plants, historical emissions are based on reported figures for 2000 and production volumes. For the other plant, emission figures for 1990-1999 are assumed to be the same as the reported figure for 2000, due to lack of production data for previous years. Annual emissions are assumed to be low.
4.2.9.3. Activity data Production volumes for calculation of historical emissions of mercury for one of the plants are reported to the Climate and Pollution Agency.
4.2.9.4. Emission factors Emission factors for mercury are derived from historical calculations for one plant, based on reported figures for the first year of reporting and production volumes.
4.2.9.5. Uncertainties Historical emissions of mercury for both plants are uncertain. For one plant, the emission figures are based on a derived emission factor and production volumes and do not take into account changes in raw materials and possible cleaning devices. For the other plant, it is assumed, due to lack of historical production data, that the historical emissions are the same as the reported figures for 2000. This is just an estimate and does not consider annual changes in raw materials, production rates, or possible cleaning devices. The particle size distribution used in the inventory is not specific for the plants. The particles emitted might therefore have another distribution than the one suggested by TNO, which is used in the inventory.
4.2.9.6. Completeness Major missing emission components are not likely.
4.2.9.7. Source specific QA/QC There is no source specific QA/QC procedure for this sector. See section 1.5 for the description of the general QA/QC procedure.
4.2.10. Construction and repairing of vessels - Sandblasting IPCC - NFR 2A7iii Last update: 01.09.05
4.2.10.1. Description Five plants constructing and repairing vessels are included in the inventory with their particle emissions. One of the plants was closed down in 2000. Emission of particles is due to the different processes during construction and repairing of vessels, but most of the particles are emitted from sandblasting.
4.2.10.2. Method Particles Emission figures are reported to the Climate and Pollution Agency. For four of the five plants, there are no information regarding cleaning device, but it is assumed by the Climate and Pollution Agency that they have fabric filter and/or wet washer. For the last one, particle emissions are purified in cyclones, and the size of the particles emitted is larger than PM10. It is difficult to decide particle size of the particles emitted based on the above information. It is however assumed by the Climate and Pollution Agency that most

The Norwegian Emission Inventory 2011 Documents 21/2011
94 Statistics Norway
of the particles are larger than PM10 and therefore all particles are assumed to be TSP.
4.2.10.3. Uncertainties The size of the particles emitted is uncertain and will depend on the cleaning device used at each plant. The different activities during construction and repairing can also result in emission of particles of different sizes.
4.2.10.4. Completeness Emission of particles is often a source of heavy metal emissions since particles often contain heavy metals. Type of metals will however depend on the origin of the particles. Metals might therefore be emitted during sandblasting and repairing/construction of vessels. There are however no data available for calculating emissions of heavy metals.
4.2.10.5. Source specific QA/QC There is no source specific QA/QC procedure for this sector. See section 1.5 for the description of the general QA/QC procedure.
4.2.11. Sandpit and rock-crushing plant IPCC - NFR 2A7iii Last update: 01.09.05
4.2.11.1. Method Particles will be emitted during crushing of rocks and at sandpits. In the inventory, emissions are estimated based on the production of sand and crushed stone from the production statistics at Statistics Norway, and emission factors recommended by Fontelle (pers. comm.8).
4.2.11.2. Activity data The production of sand and crushed stone is annually given by Statistics Norway’s production statistics.
4.2.11.3. Emission factors The emission factors used are based on Fontelle (pers. comm.8) (table 4.4).
Table 4.4. Particle emission factors for sandpits and rock-crushing plants. Ratio X1/TSP
Component g/tonne producedTSP 160PM10 60PM2.5 01 X is either PM2.5, PM10 or TSP. Source: Fontelle (pers. comm.8).
4.2.11.4. Uncertainties This emission source is highly uncertain since the emissions will vary from one place to another depending on the different processes in use, type of raw materials and of course the activity level. Little information is available in the literature. The emission factors used are only based on one source and are uncertain. In addition, there is uncertainty regarding the activity data. The PRODCOM codes used in the production statistics include total production of sand and crushed stone in Norway, but some of it might not be relevant for these calculations.
4.2.11.5. Completeness Emission of particles is often a source of heavy metal emissions since particles often contain heavy metals. Type of metals will however depend on the origin of the particles. Metals might therefore be emitted during crushing at sandpits and
8 Fontelle, J.P. (2002). Personal information (e-mail correspondence), April 2002, CITEPA.

Documents 21/2011 The Norwegian Emission Inventory 2011
Statistics Norway 95
rock-crushing plants. There are however no data available for calculating emission of heavy metals.
4.2.11.6. Source specific QA/QC There is no source specific QA/QC procedure for this sector. See section 1.5 for the description of the general QA/QC procedure.
4.2.12. Construction and building IPCC - NFR 2A7ii Last update: 01.09.05
4.2.12.1. Description Construction and building includes a lot of different activities that will generate particle emissions.
4.2.12.2. Method Particles Emission factors and activity data are used to estimate the Norwegian emissions.
4.2.12.3. Emission factors The emission factors used are based on an evaluation the French institute CITEPA made of different emission factors from this source and their calculation of average emission factors for TSP, PM10 and PM2.5 (table 4.5).
Table 4.5. Particle emission factors for building and construction. Tonne/hectare/year
Component Tonne/hectare/yearTSP 9.79PM10 1.52PM2.5 0.52Source: Fontelle (pers.comm.8).
4.2.12.4. Activity data The activity data used is the annual area of completed buildings from the building statistics at Statistics Norway.
4.2.12.5. Uncertainties The particle emissions depend on climate conditions as well as building traditions and building materials. Since the emission factors used are based on surveys in other countries than Norway, these factors might not be ideal for Norwegian conditions.
4.2.12.6. Completeness Building of roads, railways, tunnels and demolition of buildings is also a source of particle emissions, but no emission factors are found in the literature, and therefore such emissions are not included in the inventory.
4.2.12.7. Source specific QA/QC There is no source specific QA/QC procedure for this sector. See section 1.5 for the description of the general QA/QC procedure.
4.2.13. Leather preparing IPCC - NFR 2A7iii Last update: 01.09.05
4.2.13.1. Method NH3 NH3 is used to adjust the pH level in the fattening and colouring process in leather preparing. This means that NH3 is dissolved in an aqueous solution to feed fatty substances to leather. One plant reports emission figures for NH3 to the Climate

The Norwegian Emission Inventory 2011 Documents 21/2011
96 Statistics Norway
and Pollution Agency. Emission figures are available from 1994. Emissions for the years 1990-1993 are assumed by Statistics Norway and the Climate and Pollution Agency to be the same as the reported figure for 1994. The emission of NH3 reported by the plant is equal to the consumption of NH3.
4.2.13.2. Uncertainties It is not clear if it is correct to assume that all NH3 consumed is emitted to air. This assumption may have to be revised.
4.2.13.3. Completeness Major missing emission components are not likely.
4.2.13.4. Source specific QA/QC There is no source specific QA/QC procedure for this sector. See section 1.5 for the description of the general QA/QC procedure.
4.3. Chemical Industry IPCC 2B NFR 2B Last update: 17.06.09 In the Norwegian emission inventory, there are 14 different activities included under chemical industry. Nearly all emission figures from this industry included in the inventory are reported from the plants to the Climate and Pollution Agency. Production of carbides causes emissions of many components, but most of the other activities within the sector chemical industry cause only emissions of one or two components (table 4.6).
Table 4.6. Chemical industry. Components emitted and included in the Norwegian inventory
CO2 CO N2O NOX CH4 NMVOC SO2 NH3 PM HM POP
Production of:
Ammonia R NA NA IE1 NA NA NA NA NA NA NA Nitric acid NA NA R R NA NA NA R R NA NA Other fertilisers NA NA NA R NA NA NA R NA NA NA Silicon carbide R+E E NA NA R/E R R NA R R R Calcium carbide R NA NA R NA R NA NA R R NA Methanol E NA NA NA R R NA NA NA NA NA Titanium dioxide NA NA NA NA NA NA R NA R R NA Sulphuric acid NA NA NA NA NA NA R NA NA NA NA Plastic R+E NA NA NA R R NA R R NA R Explosives NA NA NA R NA NA NA NA NA NA NA Chloralkali NA NA NA NA NA NA NA NA NA R NA Pigments NA NA NA NA NA NA NA NA NA R NA Soap NA NA NA NA NA NA NA NA R NA NA Paint and varnish NA NA NA NA NA NA NA NA R NA NA E = Figures estimated by Statistics Norway. R = Figures reported by the plant to the Climate and Pollution Agency. NA = Not Applicable. IE = Included Elsewhere. 1 Included in reported figures for nitric acid and other fertilisers.
4.3.1. Production of fertilisers
4.3.1.1. Ammonia Production IPCC 2B1, Key category for CO2 NFR - Last update: 26.05.08
4.3.1.1.1. Description In Norway, ammonia is produced by catalytic steam reforming of wet fuel gas (containing ethane, propane and some buthan). This is one of the steps during fertiliser production. Hydrogen is needed to produce ammonia, and wet fuel gas is the basis for the production of hydrogen. A substantial amount of CO2 is recovered from the production process.

Documents 21/2011 The Norwegian Emission Inventory 2011
Statistics Norway 97
4.3.1.1.2. Method CO2
The CO2 emission figures in the Norwegian emission inventory model are based on annual reports from the only ammonia producing plant. The plant calculates the emissions by multiplying the amount of each gas used with gas specific emission factor. The plant has reported consistent figures back to 1990. A part of the CO2, which is generated during the production process, is captured and sold for other use (in soft drinks etc.), and therefore deducted from the emission figures for this source and reported in IPCC sector 2D2, as described in section 4.5.2.3. Some of the captured CO2 is exported to other countries, but is nevertheless included in the Norwegian emission inventory. NOX During the production of ammonia there are some non-combustion emissions of NOX. These emission figures are included in the reported NOX emission from nitric acid production and production of other fertilisers.
4.3.1.1.3. Emission factor CO2
The emission factors used in the calculations of emissions are based on carbon content in the gases consumed.
4.3.1.1.4. Uncertainties The amount of gas is measured by using turbine meters and the meters are controlled by the Norwegian Metrology Service. The uncertainty in the measurement of propane and butanes is calculated to ± 0.2 and ethane ± 0.13 per cent. The mix of propane/butanes is as average 60 per cent propane and 60 per cent butanes. The uncertainties in the figures reported by the plant are believed to be limited. Uncertainty estimates are given in Appendix D.
4.3.1.1.5. Completeness Major missing emission components are not likely.
4.3.1.1.6. Source specific QA/QC The plant annually reports the total amount of gas consumed to Statistics Norway. The emission figures reported from the plant are compared to calculations done by Statistics Norway based on total amount of gas consumed and an emission factor of 3 tonnes CO2/tonne LPG, as recommended by IPCC (1997a). The calculated emission figures agree quite well with emission figures reported by the plant. The specific QA/QC carried out in 2006 for greenhouse gases from industrial processes is described in Appendix I.
4.3.1.2. Production of nitric acid IPCC 2B2, Key category for N2O NFR 2B2 Last update: 27.05.10
4.3.1.2.1. Description There are two plants in Norway where nitric acid is produced. Nitric acid is used as a raw material in the manufacture of nitrogenous-based fertiliser. The production of nitric acid (HNO3) generates nitrous oxide (N2O) and NOx as by-products of high temperature catalytic oxidation of ammonia (NH3). The production of nitrogenous-based fertiliser also leads to emissions of particles. The two plants have together five production lines. One production line was rebuilt in 1991 and in 2006 two lines were equipped with technology to decompose N2O by extension of the reactor chamber. Since then, all production lines have to a certain extent been equipped with this technology. The full effect of implementing the technology will be reached in 2010.

The Norwegian Emission Inventory 2011 Documents 21/2011
98 Statistics Norway
4.3.1.2.2. Method NO2 and NOx The two plants report the emissions of N2O and NOX to the Climate and Pollution Agency. The N2O emissions have been continuously measured since 1991 at one production line, and from 2000 at another. The emissions at the three other production lines were previously based on monthly and weekly measurements, but from 2008 figures on N2O emissions from all production lines are based on continuous measurements. NH3 Emission figures for NH3 are annually reported to the Climate and Pollution Agency. Particles Both plants report emission figures to the Climate and Pollution Agency and have done so since 1990 and 1992. One of the plants has also reported emissions from combustion, but since it is only 1 per cent of the non-combustion emissions, these figures are included in the figures for non-combustion emissions. For this plant, there is no information regarding cleaning devices and size of the particles emitted, but the Climate and Pollution Agency assumes that the particles are smaller than PM10. For the other plant, a fabric filter was installed in the beginning of the 1990s. In lack of plant specific information regarding particle size distribution of the emitted particles, Statistics Norway uses the distribution given by TNO (Institute of environmental and energy technology 2002) for production of nitrogenous-based fertilisers where PM10 is 0.8*TSP and PM2.5 is 0.6*TSP.
4.3.1.2.3. Uncertainties Uncertainty estimates for greenhouse gases and long-range transboundary air pollutants are given in Appendix D. The uncertainty in the measurements of N2O is estimated to be ±7 per cent based on expert judgement by the industry (Yara 2006) and data reported in the emission trading scheme (Klif 2011). However, in the 2006 report to the Climate and Pollution Agency one plant reported that the uncertainty in measurements of N2O was calculated to ±1-3 per cent. There is uncertainty regarding the size of the particles emitted since there is no plant specific information available. The distribution recommended by TNO is used in lack of other data.
4.3.1.2.4. Completeness Major missing emission components are not likely.
4.3.1.2.5. Source specific QA/QC The plants report the production of HNO3 to the Climate and Pollution Agency. They compare the trends in the production data with the trend in N2O emission and use this as a quality check. There is no other source specific QA/QC procedure for this sector. See section 1.5 for the description of the general QA/QC procedure. The specific QA/QC carried out in 2006 for greenhouse gases from industrial processes is described in Appendix I.
4.3.2. Carbide production IPCC 2B4, Key category for CO2 NFR 2B4 Last update: 20.05.09

Documents 21/2011 The Norwegian Emission Inventory 2011
Statistics Norway 99
4.3.2.1. Description Silicon carbide was produced at three plants until 2006 when one plant was closed down. Previously, calcium carbide was produced at one plant. This plant was closed down in 2003.
4.3.2.2. Silicon carbide 4.3.2.2.1. Description Silicon carbide (SiC) is produced by reduction of quartz (SiO2) with petrol coke as a reducing agent. (4.2) SiO2 + 3C → SiC + 2CO
CO ⎯⎯→⎯ 2O CO2
In the production of silicon carbide, CO2 and CO are released as by-products from the reaction between quartz and carbon. Sulphur, CH4, NMVOCs, particles, heavy metals and PAH may also be emitted during the production process. Sulphur originates from the petrol coke.
4.3.2.2.2. Method In 2006, Norway changed the method for calculating CO2 emissions from silicon carbide production from the mass balance method described in the Revised 1996 IPCC Guidelines (using input of reducing agents) to an EF-based method (using crude silicon carbide production as activity data). Both methods are regarded as being Tier 2 methods in IPCC 2006. During the review of the initial report in 2007 the reviewer questioned the change of method, but concluded after consideration that the two methods provide very similar results, except for 1990, and that the use of the present method is justified. CO2 Emission figures are reported by the three plants to the Climate and Pollution Agency. All the three plants have estimated the CO2 emissions by multiplying the amount of crude silicon carbide produced with an emission factor. Indirect emissions of CO2 are calculated by Statistics Norway based on the emission of CH4, see chapter 1.9. NMVOC Emission figures are reported to the Climate and Pollution Agency by the plants. The emissions are calculated by multiplying annual production of silicon carbide by an emission factor. From 2007 and onwards, the emission factor is based on measures made once a year. For previous years, an average of the measured emissions in 2007 and 2008 is applied. CH4
Emission figures are reported annually by the three plants to the Climate and Pollution Agency. Emissions are calculated by the plants using a country specific emission factor and amount of produced crude silicon carbide. CO The emissions of CO are calculated by Statistics Norway from the consumption of petrol coke and an emission factor in accordance with the IPCC Guidelines (IPCC 1997a). SO2
Emission figures are reported to the Climate and Pollution Agency by the plants. The emissions are calculated from the consumption of petrol coke in dry weight and the sulphur content in the coke. It is assumed that 3 per cent of the sulphur is left in the product or as wastage.

The Norwegian Emission Inventory 2011 Documents 21/2011
100 Statistics Norway
Particles Emission figures for particles are reported to the Climate and Pollution Agency. Two of the plants have reported since 1990 while the third has reported since 1991. Emission figures for 1990 for this plant are assumed by Statistics Norway and the Climate and Pollution Agency to be the same as the reported figure for 1991. For one of the plants, reported figures have not been used in the inventory for 1990-1993, since the plant means these emission figures are not representative, but a result of different measurement and calculation methods. For this plant, reported emission figures for 1994 have been used for 1990-1993. There is no detailed information about the particle size distribution for the emissions from silicon carbide production. The Climate and Pollution Agency assumes the emissions have the same particle size distribution as emissions of particles from production of ferroalloys, where all particles are expected to be smaller than PM2.5. This is however an uncertain estimate. This leads to a distribution where TSP=PM10=PM2.5. Heavy metals Emission figures have been reported to the Climate and Pollution Agency since 1999/2000. For Pb, Hg and Cd, historical emissions are based on emission factors derived from reported emission figures and production rates for the first year of reporting. Using these emission factors for each plant together with production rates for previous years, historical emissions have been calculated. Cd is reported from one plant for the years after 1992. The calculations for Pb and Cd have been corrected for dust regulations, while emissions of mercury are not affected by these regulations. Historical emissions of Cu, Cr and As are based on dust emissions for each plant. This has been recommended by the Climate and Pollution Agency, since historical production rate data lack for some years and because changes in emissions will be easier to find when installation of dust control systems reduces the emissions of these metals. Emissions of As are reported to the Climate and Pollution Agency from one plant. Reported figures exist since 1992, and emissions in 1990 and 1991 are assumed to be the same as reported figures in 1992. Emission figures for Cu, Cr and Pb are annually reported for all the three plants. In 1999, the plants also reported Hg and Cd due to a heavy metal investigation under the leadership of the Climate and Pollution Agency. After 1999, the plants have not been required to report these metals due to low emissions. Still, one of the plants have reported Cd and Hg figures for all following years, whereas another has reported only Cd; for this plant the 1999 figure for Hg has been used for all later years. For the plant which now has been closed down, the 1999 figures for both Cd and Hg have been used for all later years when the plant still was operating. POPs Emission figures for PAH are reported from the plants to the Climate and Pollution Agency. Two of the plants have reported emissions since 1991, while the third one has only reported since 1997. Historical emissions back to 1990 have been calculated based on production rates and an emission factor derived from the first year of reporting and production rate for that year. No PAH profile is available for this source, so lacking of other information, the same profile as for aluminium production is used (table 4.7). No emissions of dioxins are reported or calculated.
Table 4.7. Distribution of PAH emissions from silicon carbide production. Ratio X1/PAH
Component Distribution of PAH emissions (ratio)PAH (Norwegian standard) 1PAH-6 (OSPAR) 0.3PAH-4 (CLRTAP) 0.151 X is either PAH, PAH-6 or PAH-4. Source: Finstad et al. (2001).

Documents 21/2011 The Norwegian Emission Inventory 2011
Statistics Norway 101
4.3.2.2.3. Activity data The activity data used by the plants for the calculation of CO2 and CH4 emissions are the amount of silicon carbide produced. The activity data used by the plants for the calculation of SO2 emissions is the consumption of petrol coke in dry weight. The activity data used by Statistics Norway for the calculation of CO emissions is the consumption of petrol coke reported to Statistics Norway. Historical calculations of particle emissions are based on annual production rates and dust emission figures reported to the Climate and Pollution Agency.
4.3.2.2.4. Emission factors CO2 All three plants have used the emission factor 2.62 tonne CO2 per tonne produced crude silicon carbide (IPCC 2006). CH4 For calculation of methane emissions, the country specific emission factor 4.2 kg CH4/tonne crude SiC is used. The factor used is based on measurements in the plants. CO CO emissions are calculated from the consumption of petrol coke, using a factor of 0.4 tonnes CO/tonnes petrol coke, as recommended by Rosland (1987). NMVOC From 2007 and onwards the emission factor is based on measurements made once a year. The emission factors for 2007 are 10.906 tonne NMVOC/kilotonne Sic for one of the plants in operation and 10.84 tonne NMVOC/kilotonne Sic for the other. For previous years, the emission factor for the latter plant has been more or less constant whereas the emission factor for the first plant varies.
4.3.2.2.5. Uncertainties Uncertainty estimates for greenhouse gases and long-range transboundary air pollutants are given in Appendix D. Heavy metals The historical calculations for heavy metals are based on derived emission factors for each plant and either production or dust data for previous years, and can only be seen as estimates. The emission figures reported also vary from one year to another, and this is assumed to be, in addition to differences in raw materials, a result of few and uncertain measurements. For the one plant that has not reported emission figures for Hg and Cd since 1999, the same emission figures as those reported in 1999 are used for later years. For the other plant, emissions of Cd have been reported for all years since 1992. Emission figures for Hg have not been reported since 1999. The emission figure for 1999 is used for later years. This is also highly uncertain, but the emission figures are very small and have only marginal impact on the total emissions of these metals. Particles The particle size distribution used is not specific for production of silicon carbide, but used due to lack of specific size distribution data for this source. The particle size distribution can therefore only be seen as an estimate. For the years where reported emission figures do not exist, Statistics Norway has assumed that emissions are in the same order as the first year of reporting. This is uncertain and a result of lack of better data.
4.3.2.2.6. Completeness Major missing emission components are not likely.

The Norwegian Emission Inventory 2011 Documents 21/2011
102 Statistics Norway
4.3.2.2.7. Source spesific QA/QC The quality of the reported figures of CO2 is from time to time controlled by Statistics Norway and the Climate and Pollution Agency. Statistics Norway calculates the emissions from the consumption of petrol coke reported by the plant to Statistics Norway and the emission factor of 2.51 tonnes CO2/tonne petrol coke (Raaness and Olsen 1998). The comparison shows accordance between the reported data and Statistics Norway's estimates. The specific QA/QC carried out in 2006 for greenhouse gases from industrial processes is described in Appendix I.
4.3.2.3. Production of calcium carbide 4.3.2.3.1. Description One plant in Norway was producing calcium carbide until 2003. The production of calcium carbide generates CO2 emissions when limestone is heated and when petrol coke is used as a reducing agent. The process can be described through the following equations: (4.3) CaCO3 → CaO + CO2 which takes place when limestone (calcium carbonate) is heated. and (4.4) CaO + C (petrol coke) → CaC2 + CO
(4.5) CO ⎯⎯→⎯ 2O CO2 where petrol coke is used as a reducing agent to reduce the CaO to calcium carbide. Some of the carbon from petrol coke will be sequestered in the product, but not permanently. Thus, this carbon is included in the emission estimate. NMVOC originates from the use of petrol coke in the production process, and NOx is mainly produced during the high temperature oxidation of nitrogen in the air. Particles are also emitted during the production process. Emission of heavy metals is a result of the heavy metal content in the raw materials.
4.3.2.3.2. Method CO2 The figures in the National emission inventory are based on emission figures reported from the plant to the Climate and Pollution Agency. The emission estimates are based on the amount of calcium carbide produced each year and an emission factor estimated by Raaness and Olsen (1998) Some of the carbon from petrol coke will be sequestered in the product, but not permanently. Thus, this carbon is included in the emission estimate. NOx Emission figures for NOx were annually reported to the Climate and Pollution Agency. The reported values are based on calculations. NMVOC Reported figures were annually reported to the Climate and Pollution Agency, based on calculations. Particles Emission figures for particles were reported from 1992. Figures for 1990 and 1991 are assumed to be the same as for 1992. It does not exist any detailed information about the particle size distribution of the emissions from calcium carbide production. The Climate and Pollution Agency assumes that the emissions are in the same order as emission of particles from production of ferroalloys, where all particles are expected to be smaller than PM2.5. This is however an uncertain estimate. A particle size distribution where PM10 and PM2.5 is expected to be the same as TSP, is used in the Norwegian Inventory.

Documents 21/2011 The Norwegian Emission Inventory 2011
Statistics Norway 103
Heavy metals and POPs Emission figures for heavy metals were reported to the Climate and Pollution Agency from 1999. Historical emissions are calculated based on production rates for Pb, Cd and Hg, and based on particle emissions for As, Cu and Cr (see section 4.3.2.3.3). No emission figures for PAH or dioxins are available.
4.3.2.3.3. Activity data Particle emissions used in the calculations of As, Cu and Cr have been reported to the Climate and Pollution Agency.
4.3.2.3.4. Emission factors The emission factor used by the plants in the calculation of CO2 varies from year to year in the range from 1.48-1.59 tonne CO2/ tonne calcium carbide (SINTEF and Det Norske Veritas 2004). The default IPCC factor is 1.8 tonnes/tonne. Raaness and Olsen (1998) concludes that the one reason for the difference between the factors is that the IPCC assumes that all calcium carbonate is calcinated. However, in the production process at the plant they first produced CaC that gives CO2 emissions. Some of the CaC was then refined to DICY in a process that consumed CO2. This CO2 gas was collected from one of the first steps of the CaC production. The net consumption of CO2 in production of DICY is according to SINTEF about 1.3 tonne CO2 per tonne DICY produced. This implies that the specific CO2 IEF varies between years, corresponding to variations in DICY production..
4.3.2.3.5. Uncertainties Uncertainty estimates for greenhouse gases and long-range transboundary air pollutants are given in Appendix D. Heavy metals Historical emissions are based on a derived emission factor for the first year of reporting (1999) and calculated with production/particle emission figures for previous years. This is uncertain and only an estimate in lack of other data. Particles The particle size distribution used is not specific for production of calcium carbide, but used due to lack of specific size distribution data for this source. The particle size distribution can therefore only be seen as an estimate. For the years where reported emission figures do not exist, Statistics Norway has assumed that emissions are in the same order of magnitude as for the first year of reporting. This is uncertain and a result of lack of better data.
4.3.2.3.6. Completeness Major missing emission components are not likely.
4.3.2.3.7. Source specific QA/QC For CO2, the data reported from the plant has been compared to calculations done by Statistics Norway. The amount of calcium carbide produced has been reported by the plant to Statistics Norway, and was multiplied with the emission factor 1.71 tonnes/ tonne (Raaness and Olsen 1998). The default IPCC factor is 1.8 tonnes/tonne. This amount was subtracted 1.3 tonnes of CO2 per tonnes DICY produced. The netto emission was then estimated. There is no other source specific QA/QC procedure for this sector. See section 1.5 for the description of the general QA/QC procedure. The specific QA/QC carried out in 2006 for greenhouse gases from industrial processes is described in Appendix I.

The Norwegian Emission Inventory 2011 Documents 21/2011
104 Statistics Norway
4.3.3. Manufacture of other inorganic chemicals IPCC 2B5 NFR 2B5 Last update: 18.02.11
4.3.3.1. Production of methanol 4.3.3.1.1. Description One plant in Norway produces methanol. Natural gas and oxygen are used in the production of methanol. The conversion from the raw materials to methanol is done in various steps and on different locations at the plant. CH4 and NMVOC are emitted during the production process. Indirect emissions of CO2 are calculated by Statistics Norway based on the emission of CH4 and NMVOC, see chapter 1.9. Emissions from flaring of natural gas in connection with production of methanol are now reported under 2B5, as recommended by IPCC’s review team.
4.3.3.1.2. Method The plant reports emission figures for CH4, NMVOC and NOx, to the Climate and Pollution Agency. The reported emissions are based on measurements. Emissions from flaring of natural gas are estimated by multiplying the amount of gas flared with the emission factors shown in table 4.8.
Table 4.8. Emission factors for flare
Component Flare natural gas
kg/1000 Sm3
SO2 0CO2 19901
CO 1.5NOx
2
Particles 0.0018NMVOC 0.06CH4 0.24N2O 0.02 mg/tonnePb 0.25Cd 1.7Hg 1Cu 16Cr 21As 3.8Dioxins 0.00005PAH 15.3PAH-4 0PAH-Ospar 0.851 Reported to the Climate and Pollution Agency since 2000. 2 Reported to the Climate and Pollution Agency.
4.3.3.1.3. Uncertainties Uncertainty estimates for greenhouse gases and long-range transboundary air pollutants are given in Appendix D.
4.3.3.1.4. Completeness Major missing emission components are not likely.
4.3.3.1.5. Source specific QA/QC There is no source specific QA/QC procedure for this sector. See section 1.5 for the description of the general QA/QC procedure. The specific QA/QC carried out in 2006 for greenhouse gases from industrial processes is described in Appendix I.
4.3.3.2. Production of titanium dioxide
4.3.3.2.1. Description One plant in Norway produces titanium dioxide. The ore is crushed and pulverized in mills. The crushed raw material is separated in various steps. Ilmenite and the by-product magnetite are cleaned during acid treatment and flotation. The ilmenite

Documents 21/2011 The Norwegian Emission Inventory 2011
Statistics Norway 105
concentrate is drained and the water content is reduced to approximately 3.5 per cent. Emissions of SO2, heavy metals and particles from the plant are included in the inventory. The particle emissions are a result of the crushing of the ore in the mills and from the annealing furnace, while the heavy metal emissions are due to the metal content in the raw material used.
4.3.3.2.2. Method SO2
The emission figures for SO2 are based on calculations and are reported annually to the Climate and Pollution Agency. Particles Since 1990, emissions of particles have been reported annually to the Climate and Pollution Agency. The particles are assumed to be of a size less than PM2.5. Heavy metals Emissions figures for Pb, Cd and Hg have been reported from 1990 to 1999. After 1999, there has not been any reporting, as a result of very small emission figures. No emissions of persistent organic pollutants are reported or calculated.
4.3.3.2.3. Uncertainties No source specific uncertainty is known.
4.3.3.2.4. Completeness Major missing emission components are not likely.
4.3.3.2.5. Source specific QA/QC There is no source specific QA/QC procedure for this sector. See section 1.5 for the description of the general QA/QC procedure.
4.3.3.3. Production of sulphuric acid 4.3.3.3.1. Description Three plants in Norway produced sulphuric acid until March 2006 when one of them was closed down. The production of sulphuric acid leads to emissions of SO2. All the three plants report the emissions from the production to the Climate and Pollution Agency, but only one plant have specified that the emissions come from the production of sulphuric acid. For the two other plants, the emissions have been included in the reported emissions from the plants' main production (production of nickel and zinc, respectively).
4.3.3.3.2. Method The plant reports annually emission figures for SO2 to the Climate and Pollution Agency. The reported figures are based on measurements.
4.3.3.3.3. Uncertainties No source specific uncertainty is known.
4.3.3.3.4. Completeness Major missing emission components are not likely.
4.3.3.3.5. Source specific QA/QC There is no source specific QA/QC procedure for this sector. See section 1.5 for the description of the general QA/QC procedure.
4.3.3.4. Production of plastic 4.3.3.4.1. Description Three plants report emissions to the Climate and Pollution Agency under this source category. One of the plants produces ethylene, one propylene and

The Norwegian Emission Inventory 2011 Documents 21/2011
106 Statistics Norway
polyethylene and the third plant has vinyl chloride production. Two of the reporting plants were merged up to 2001. Various components are emitted during the production of plastic. CH4 and NMVOC emissions are from leakages in the process. Direct CO2 emissions are from combustion and are reported in chapter 3 Energy. During the production process of ethylene and vinyl chloride there is an oxide chloride step for production of ethylene chloride, followed by cracking to vinyl chloride monomer and hydrochloric acid. Various chloride components are produced during these processes, including dioxins. However, most of the dioxins end up in the EDC-tar, which is combusted in an own chloride recycling installation. Particles (PVC-dust) are also emitted during the production of vinyl chloride. Emissions from flaring of fuel gas in connection with production of plastic are now reported under 2B5.
4.3.3.4.2. Method CO2 Indirect emissions of CO2 are calculated based on the emission of CH4 and NMVOC, see chapter 1.9. CH4, NH3 and NMVOC Emission figures are annually reported to the Climate and Pollution Agency. Reported CH4 and NMVOC emissions are based on measurements. The emissions of NH3 are regarded as equal to use. As some of the ammonia is stored in the product, the emissions are probably somewhat overestimated. Particles Emission figures have been reported to the Climate and Pollution Agency since 1992. Emission figures for 1991 and 1990 are assumed to be the same as reported figures in 1992. The particle emissions have decreased since 1996 as a result of installation of cleaning devices. The emissions are purified in cyclones, but there is no available information regarding particle size. In lack of plant specific information, the distribution TSP=PM10=PM2.5, as in TNO (Institute of environmental and energy technology 2002), is used in the calculation. Dioxins The plant producing vinyl chloride reports dioxin emission figures. Figures are reported since 1990 except for 1992 and 1994. Emission figures for 1992 and 1994 are based on the reported data for 1991 and 1993.
4.3.3.4.3. Uncertainties Uncertainty estimates for greenhouse gases are given in Appendix D. It is difficult to measure leakages of CH4 and NMVOC and therefore the uncertainty is regarded as being high. The particle size distribution used is not specific for the plants, and the particles emitted might therefore have another distribution than the one suggested by TNO.
4.3.3.4.4. Completeness Major missing emission components are not likely.
4.3.3.4.5. Source specific QA/QC There is no source specific QA/QC procedure for this sector. See section 1.5 for the description of the general QA/QC procedure. The specific QA/QC carried out in 2006 for greenhouse gases from industrial processes is described in Appendix I.

Documents 21/2011 The Norwegian Emission Inventory 2011
Statistics Norway 107
4.3.3.5. Production of explosives 4.3.3.5.1. Description There has been one plant in Norway producing explosives, but the plant was closed down in 2001. Nitric acid was used as a raw material in the manufacture of explosives, and during the production of nitric acid, NOx was emitted.
4.3.3.5.2. Method NOx Emission figures were annually reported to the Climate and Pollution Agency, and the figures were based on calculations.
4.3.3.5.3. Uncertainties No source specific uncertainty is known.
4.3.3.5.4. Completeness Particles Reported emission figures to the Climate and Pollution Agency exist only for 1997-1999. Annual emissions were so low that they have not been included in the Norwegian inventory.
4.3.3.5.5. Source specific QA/QC There is no source specific QA/QC procedure for this sector. See section 1.5 for the description of the general QA/QC procedure.
4.3.3.6. Chloralkali production
4.3.3.6.1. Description One plant in Norway produced chloralkali until 2005. Before 1997, mercury was used in the chloralkali production and emitted during the process. In 1997, the plant changed its production process and stopped using mercury, but in the following years there were still some mercury emissions.
4.3.3.6.2. Method Hg Emission figures were reported to the Climate and Pollution Agency.
4.3.3.6.3. Uncertainties No source specific uncertainty is known.
4.3.3.6.4. Completeness Major missing emission components are not likely.
4.3.3.6.5. Source specific QA/QC There is no source specific QA/QC procedure for this sector. See section 1.5 for the description of the general QA/QC procedure.
4.3.3.7. Production of pigments 4.3.3.7.1. Description Two plants are included in the inventory. One plant produces copper oxide for bottom paint and emits copper to air during the production process. Emissions of Cd and Pb have been reported since 2002. Emissions for 1990-2001 are set to be the same as the reported figure in 2002. Also minor amounts of arsenic and chromium are emitted. The other plant produces zinc chromate, and chromium is emitted.
4.3.3.7.2. Method Emission figures are reported to the Climate and Pollution Agency.

The Norwegian Emission Inventory 2011 Documents 21/2011
108 Statistics Norway
4.3.3.7.3. Uncertainties Reported emission figures for 1990 and 1991 for the plant producing zinc chromate are not occurring. In the inventory, the same figure as reported for 1992 is used for 1990 and 1991.
4.3.3.7.4. Completeness Major missing emission components are not likely.
4.3.3.7.5. Source specific QA/QC There is no source specific QA/QC procedure for this sector. See section 1.5 for the description of the general QA/QC procedure.
4.3.3.8. Production of soap 4.3.3.8.1. Method Two plants producing soap have reported emission figures for particles to the Climate and Pollution Agency. One of the plants has only reported for 1990 and 1991. The plant has after 1991 had a temporary permission without reporting requirements and is therefore not included after 1991 due to lack of data. The other plant reported figures for 1992-1994. Emissions for 1990 and 1991 are assumed to be the same as reported figure in 1992, while emissions for 1995-1997 are assumed to be the same as reported figure in 1994. Annual emission figures are low. The particles have been purified through filters and scrubbers and the Climate and Pollution Agency assumes the sizes of the particles are smaller than PM2.5.
4.3.3.8.2. Uncertainties For the years where reported emission figures do not exist, Statistics Norway has assumed that emissions are in the same order as reported in one of the other years. This is uncertain and a result of lack of better data.
4.3.3.8.3. Completeness Major missing emission components are not likely.
4.3.3.8.4. Source specific QA/QC There is no source specific QA/QC procedure for this sector. See section 1.5 for the description of the general QA/QC procedure.
4.3.3.9. Paint and varnish production 4.3.3.9.1. Method One plant producing paint has reported emission figures for particles to the Climate and Pollution Agency since 1995, after first getting an emission permit in 1994. Annual emissions are small. It is assumed by the Climate and Pollution Agency that the particles emitted are smaller than PM2.5.
4.3.3.9.2. Uncertainties No source specific uncertainty is known.
4.3.3.9.3. Completeness Major missing emission components are not likely.
4.3.3.9.4. Source specific QA/QC There is no source specific QA/QC procedure for this sector. See section 1.5 for the description of the general QA/QC procedure QA/QC procedure

Documents 21/2011 The Norwegian Emission Inventory 2011
Statistics Norway 109
4.4. Metal production IPCC 2C NFR 2C Last update: 17.06.09
Metal production in Norway includes plants producing iron and steel, ferroalloys, aluminium, nickel and zinc and also magnesium until spring 2006. Production of anodes is also included in this chapter. As shown in table 4.9, most of the figures in the national inventory are from the plants’ annual reports to the Climate and Pollution Agency.
Table 4.9. Metal production. Components emitted and included in the Norwegian inventory
CO2 CH4 N2O PFCs SF6 SO2 NOX NH3 NMVOC CO PM HM POP
Production of: 2C1 Iron and steel R NA NA NA NA R R NA NA NA R R R 2C2 Ferroalloys R R R NA NA R R NA E NA R R R 2C3 Primary aluminium R NA NA R R R E NA NA NA R R R/E 2C4 Secondary aluminium NA NA NA NA R NA NA R NA NA R R R 2C4 Magnesium R NA NA NA R R NA NA NA R R R R 2C5 Nickel R NA NA NA NA R R R NA NA R R NA 2C5 Zinc NA NA NA NA NA R NA NA NA NA R R NA 2C5 Anodes R NA NA NA NA R R NA NA NA R R R E = Figures estimated by Statistics Norway (Activity data * emission factor). R = Figures reported by the plant to the Climate and Pollution Agency. NA = Not Applicable.
4.4.1. Production of iron and steel IPCC 2C1, Key category for CO2 NFR 2C1 Last update: 27.05.10
4.4.1.1. Description Three plants producing iron and steel are included in the Norwegian inventory, one of these report only emission figures for particles. CO2 emissions are registered for two plants which produce, respectively, pig iron and steel. In Norway, pig iron is produced from ilmenite, and coal is used as a reducing agent. Various components are emitted during the production process. For the steel producing plant, process emissions of CO2 come from the consumption of various types of scrap iron. The use of coal as a reducing agent also generates CO, which is sold for energy use to other industries. The amount of CO gas sold is hence subtracted from the emissions reported under this category and included in energy consumption in manufacturing industries and construction (IPCC 1A2, NFR 1A2). SO2 originates from the sulphur in the reducing agent used, while NOx is produced primarily by the high temperature oxidation of nitrogen in the air. Heavy metal emissions are due to the metallurgical melting process and the content of heavy metals in the raw materials used. Particles are also emitted during the process.
4.4.1.2. Method CO2
In the Norwegian emission inventory, emission figures for CO2, annually reported to the Climate and Pollution Agency, are used. For pig iron, the method used for all years can be defined as a calculation based on carbon balance. This method accounts for all the carbon in the materials entering the process and subtracts the CO2 captured in the products. For steel, the large majority of the CO2 emissions are calculated based on the use of each type of scrap iron (AD) and the appurtenant content of carbon in each type of scrap iron. E.g., in 2008 the plant used 9 types of scrap iron. The types of scrap

The Norwegian Emission Inventory 2011 Documents 21/2011
110 Statistics Norway
iron are according to the UK steel protocol and the carbon content in the types of scrap used varies from 0.15 per cent up to 4 per cent. SO2
SO2 emissions are based on measurements and reported to the Climate and Pollution Agency. NOx
NOx emissions are estimated and reported to the Climate and Pollution Agency. Particles Two of the plants have reported figures since 1990 while the third one has only reported since 1998. For this plant, historical emissions in the period 1990-1997 have been assumed to be the same as the reported figure in 1998, since production rate data for previous years are not available. The Climate and Pollution Agency assumes that the particles emitted in the production of iron and steel are smaller than PM2.5. We can, however, not disregard that some of the particles emitted are larger than PM2.5. Heavy metals and POPs Two plants report emission figures to the Climate and Pollution Agency. Reported figures for heavy metals (Pb, Cd, Cr, Cu, As and Hg) exist from 1990, 1992 or later, depending on type of heavy metal. For dioxins and PAH, reported figures have only been available from 1997 and 1999. Diffuse emissions have been included from one plant. In lack of production rate data for previous years, it has been assumed that yearly emissions are the same as in the first year of reporting.
4.4.1.3. Uncertainties Uncertainty estimates for greenhouse gases and long-range transboundary air pollutants are given in Appendix D. Heavy metals and POPs Reported emission figures vary from one year to another, partly due to differences in raw materials, but mainly as a result of uncertain measurements. The reported figures are based on a limited number of measurements, and the emissions will vary from minute to minute, since the production of iron and steel is a non-continuous process. For the years where reported emission figures do not exist, Statistics Norway has assumed that emissions are in the same order as the first year of reporting. This is uncertain and a result of lack of better data. Particles The particle size distribution used is only an assumption, and we can not preclude that the distribution is different from the one used in the inventory. For the years where reported emission figures do not exist, Statistics Norway has assumed that emissions are in the same order of magnitude as for the first year of reporting. This is an uncertain estimate due to lack of better data.
4.4.1.4. Source specific QA/QC CO2 emission figures reported to the Climate and Pollution Agency are compared with calculations at Statistics Norway using the amount of reducing agents and emission factors. This method is recommended by IPCC when data from measurements are not available. Annually reported emission figures are first controlled by the Climate and Pollution Agency and then by Statistics Norway. Adjustments and recalculations have been done for years where reported emission figures seem to be unreasonably high or low compared with previous years. This is applicable when the variations in the reported emission figures do not have a

Documents 21/2011 The Norwegian Emission Inventory 2011
Statistics Norway 111
natural explanation. The specific QA/QC carried out in 2006 for greenhouse gases from industrial processes is described in Appendix I.
4.4.2. Production of ferroalloys IPCC 2C2, Key category for CO2 NFR 2C2 Last update: 01.06.11
4.4.2.1. Description There were 12 plants producing ferroalloys in Norway in 2008. One plant closed down in 2001, two plants were closed down during 2003 and two in 2006. One plant was out of production in 2006, but started up again in 2007. Ferrosilicon, silicon metal, ferromanganese and silicon manganese are now produced in Norway. Ferrochromium was produced until summer in 2001. Ferrosilicon with 65 to 96 per cent Si and silicon metal with 98-99 per cent Si is produced. The raw material for silicon is quarts (SiO2). SiO2 is reduced to Si and CO using reducing agents like coal, coke and charcoal. (4.6) SiO2 → SiO → Si + CO The waste gas CO and some SiO burns to form CO2 and SiO2 (silica dust). Some of the CO generated from coal is sold for energy use to other industries. The amount of CO gas sold is hence subtracted from the emissions reported under this category and included in energy use in manufacturing industries and construction (IPCC 1A2, NFR 1A2). In ferroalloy production, raw ore, carbon materials and slag forming materials are mixed and heated to high temperatures for reduction and smelting. The carbon materials used are coal, coke and some biocarbon (charcoal and wood). Electric submerged arc furnaces with graphite electrodes or consumable Soederberg electrodes are used. The heat is produced by the electric arcs and by the resistance in the charge materials. The furnaces used in Norway are open, semi-covered or covered. Several components are emitted from production of ferroalloys. Emission of CO2 is a result of the oxidation of the reducing agent used in the production of ferroalloys. From the production of ferromanganese (FeMn), silicon manganese (SiMn) and ferrochromium (FeCr) there is only CO2 emissions. SO2 originates from the sulphur in the reducing agent used, while NOx is produced primarily by the high temperature oxidation of nitrogen in the air. NMVOC, N2O and CH4 emissions originate from the use of coal and coke in the production processes by producing ferrosilicon and silicon metal. Heavy metals are emitted from the raw materials (ore) during the metallurgical process, and the particles emitted are mainly silica dust generated during the production process.
4.4.2.2. Method CO2
Emission data based on calculations is reported from each plant in an annual report to the Climate and Pollution Agency. The method used in the calculation of CO2 emissions from the production of ferroalloys is in accordance with the method recommended by the IPCC (IPCC 1997a, 2000, 2006). The plants have used two different methods to calculate the CO2 emissions. Most of the plants base their calculations on carbon mass balance in the process (method I). In the carbon mass balance the emissions of CO2 are calculated by adding the total input of C in raw materials before subtracting the total amount of C in products, wastes and sold gases (Tier 3). The carbon content of each raw material is from carbon certificates from the suppliers. The carbon in each product, CO gas sold etc., is calculated from the mass of product and carbon content.

The Norwegian Emission Inventory 2011 Documents 21/2011
112 Statistics Norway
The other plants calculate the emissions from the dry weight consumption of the reducing agents and electrodes and country specific emission factors for coal, coke, petrol coke, electrodes, carbonate ore, anthracite, limestone and dolomite (method II) (Tier 2) see table 4.11. The two methods are regarded as being consistent and each plant has used the same method for the entire time series. Indirect emissions of CO2 are calculated by Statistics Norway based on the emission of CH4, see chapter 1.9. CH4 and N2O Emission figures are reported annually by each plant to the Climate and Pollution Agency. Measurements performed at Norwegian plants producing ferroalloys indicate emissions of N2O in addition to CH4. The emissions of CH4 and N2O are influenced by the following parameters:
• The silicon level of the alloy (65, 75, 90 or 98 % Si) and the silicon yield • The method used for charging the furnace (batch or continuously) • The amount of air used to burn the gases at the top controlling the
temperature in off gases. The emission factors used in the inventory represent the longer-term average N2O and CH4 concentration measurements outside the peaks in concentration, which occur due to avalanches (sudden fall of large amounts of colder charge into the furnace). These occur from time to time, and are not fully reflected in the emission factors. We regard the emission factors as conservative, particularly for the early 1990s when the avalanches were more frequent than in the latest years. All companies apply sector specific emission factors in the emission calculation, see table 4.12. The factors are developed by the Norwegian Ferroalloy Producers Research Organisation (FFF) and standardized in a meeting with The Federation of Norwegian Process Industries (PIL) (today named Federation of Norwegian Industries) in February 2007. SO2
Each plant annually reports emission figures to the Climate and Pollution Agency. Some of the sulphur is trapped in the product. For production of ferromanganese and silicon manganese, 98-99 per cent of the sulphur is trapped, while for other ferroalloys it is assumed that about 5 per cent is trapped. The emissions are calculated from the consumption of reducing agents and electrodes and the content of sulphur in the materials. NOx
Emissions of NOX originate from production of ferrosilicon and silicon metal. Ferromanganese, ferrochrome and silicomanganese do not have significant emissions of NOX. Emission figures are annually reported by each plant to the Climate and Pollution Agency. The reported emissions are calculated either from the production of metal and metal specific emission factors, see table 4.13, or on the basis of continuous measurements. NMVOC The emissions are estimated by Statistics Norway from the consumption of reducing agents and an emission factor. Particles All plants producing ferroalloys report emission figures to the Climate and Pollution Agency. Some have reported since 1990, others since 1992. For plants reported since 1992, emission figures from 1990 and 1991 have been assumed to be the same as reported figures in 1992. According to the ferroalloy industry, particles emitted are

Documents 21/2011 The Norwegian Emission Inventory 2011
Statistics Norway 113
smaller than PM2.5 (Eikeland, pers.comm.9). This is, however, an assumption, and we can not preclude that some of the particles might be larger than PM2.5. In the inventory, we have decided to use this distribution for all particles emitted from the production of ferroalloys. This means that TSP=PM10= PM2.5. Heavy metals Emission figures for heavy metals are reported from all plants producing ferroalloys after the Climate and Pollution Agency in 1999 imposed larger metallurgical plants to map their emissions of heavy metals. Most plants have therefore reported figures to the Climate and Pollution Agency since 1999, but some reported for the first time in 2000 and 2001. An emission factor has been derived for each plant, based on the emission figure and production rate for the first year of reporting. These emission factors have been used together with production rates for each year to calculate the emissions back to 1990 for each plant. Dioxins All plants producing ferrosilicon report emission figures for dioxins to the Climate and Pollution Agency. It varies, however, when the plants started reporting, so calculations of historical figures back to 1990 have been necessary. An emission factor was derived for each plant based on reported emission data and production rates, and this factor was used to calculate historical emissions based on production rates for each year. None of the four plants producing ferromanganese and ferrochromium10 report emission figures for dioxins to the Climate and Pollution Agency. The reason is probably that the emissions are so small that they are not measured and therefore not reported (the Norwegian Pollution Control Authority, pers. comm.11). Instead, the emissions are calculated by Statistics Norway based on the general emission factor for combustion of coke and coal in the industry (table 4.15). PAH Emissions of PAH from the production of ferroalloys are reported to the Climate and Pollution Agency for plants producing ferrosilicon and silicon metal. All these plants have reported emission figures since 2000. Historical emissions back to 1990 have been calculated based on production rates for each year and an emission factor derived for each plant based on reported figures for 2000, 2001 and 2002. Reported figures and historical calculations are only done for plants producing ferrosilicon and silicon metal. This is based on the assumption that these alloys are produced in open ovens and therefore cause larger emissions of PAH compared to other alloys that are produced in closed ovens, and are assumed to cause no or minor emissions of PAH. The PAH emission figures are reported according to Norwegian Standard, but no PAH profile is available. In lack of other data, the same profile as for aluminium production is used.
Table 4.10. Distribution of PAH emissions from production of ferroalloys
Component Distribution of PAH emissions (ratio)PAH (Norwegian standard) 1PAH-6 (Ospar) 0.3PAH-4 (CLRTAP) 0.15Source: Finstad et al. (2001).
9 Eikeland (2002): Personal information, e-mail dated 29/05 2002. [email protected] 10 The ferrochromium plant was closed down in 2003. 11 Norwegian Pollution Control Authority (2001): Units for dioxins (dioxins.doc). Personal information C. Benestad, 13/03 2001, Oslo: Norwegian Pollution Control Authority.

The Norwegian Emission Inventory 2011 Documents 21/2011
114 Statistics Norway
4.4.2.3. Activity data CO2 The plants’ calculations of emissions are based on the consumption of gross reducing agents and electrodes in the production of ferroalloys. CH4 and N2O The gross production of different ferroalloys is used in the calculation by the plants. NMVOC The amounts of reducing agents that are used for the calculation of NMVOC emissions are annually reported to Statistics Norway from each plant.
4.4.2.4. Emission factors CO2 Emission factors used by the plants in the Tier 2 calculations are shown in table 4.11. The factors are from Norwegian sources, based on the actual composition of the raw materials.
Table 4.11. Emission factors for production of ferroalloys.Tonnes CO2/tonne reducing agent or electrode
Coal Coke Petrol coke
Elec- trodes
Carbonate ore
Dolomite, limestone
Ferrosilicon 3.08 3.36 - 3.36 - -Silicon metal 3.12 3.36 - 3.54 - -Ferrochromium - 3.22 - 3.51 - -Silicon manganese - 3.24 3.59 3.51 0.16-0.35 0.43-0.47Ferromanganese - 3.24 3.59 3.51 0.16-0.35 0.43-0.47Source: SINTEF (Monsen 1998; Monsen and Olsen 1998; Raaness 1998).
CH4 and N2O The plants apply sector specific emission factors in the emission calculations, see table 4.12. The factors are developed by the Norwegian Ferroalloy Producers’ Research Organisation (FFF) and standardized in a meeting with The Federation of Norwegian Process Industries (PIL) (today named Federation of Norwegian Industries) in February 2007.
Table 4.12. Emission factors for CH4 and N2O from production of ferroalloys. Emission factors in kg per tonne produced ferroalloy
Si-met FeSi-75% FeSi-65% Alloy, charging routines and tempera-ture
Batch-charg-
ing
Sprinkle-charg-
ing1
Sprinkle-charg-
ing and >750°C2
Batch-charg-
ing
Sprinkle-charg-
ing1
Sprinkle-charging
and >750°C2
Batch-charg-
ing Sprinkle-charging1
Sprinkle-charging
and >750°C2
kg CH4 per tonne metal 0.1187 0.0881 0.1000 0.0890 0.0661 0.0750 0.0772 0.0573 0.0650
M M E E E E E E Ekg N2O per tonne metal 0.0433 0.0214 0.0252 0.0297 0.0136 0.0161 0.0117 0.0078 0.0097 E E E E E E E E E
1 Sprinkle-charging is charging intermittently every minute. 2 Temperature in off-gas channel measured where the thermocouple cannot ‘see’ the combustion in the furnace hood. M=measurements and E= estimates based un measurements
NOX The emission factors used by the ferrosilicon plants in the calculations are based on measurements carried out at three plants. The emission factors in table 4.13 are based on several measuring campaigns at four different ferroalloy plants that were carried out from 1995 to 2007. Each measurement period lasted 4 to 8 hours with different operation conditions. Based on this, emission factors for different ferroalloys and operational conditions have

Documents 21/2011 The Norwegian Emission Inventory 2011
Statistics Norway 115
been established. The measurements have been carried out by Det norske Veritas, Norsk Energi, SINTEF and TÜV. The silicon plants have applied a new method. They have used online measurement instruments to measure the emissions of NOx. The measurements were undertaken in 2010. The instrument applied is NEO laser gas and Testo 350 as a control of the results from the NEO laser gas device. So far there are only two plants where the online measurement devices are installed on a permanent basis. For the other plants the online measurement instruments are used periodically to derive emission factors. The following emission factors are used by four plants in one major ferroalloy producing company (kg NOx/tonne metal produced): 27 (based on measuring campaigns), 34 and 39 (based on online measurements) and 45 (based on a combination of online measurements and campaigns). The uncertainties associated with the measurements mainly come from measurement of off-gas flow and measurement of concentration of the NOx in the off-gas. In addition, the periodical measurement campaigns will not include all variations in the emissions gained over time.
Table 4.13. Emission factors for production of ferrosilicon. Kg NOX /tonne metal produced.
Normal operations
Dryss -chargering
Dryss- chargering >
750 °C
Source
Ferrosilicon 75 per cent
15.3 7.0 8.3 Measured in 1995 at Rana Metal and the Thamshavn plant 2005
Ferrosilicon 65 per cent
6.0 4.0 5.0 Estimations 1
1 Estimations means that this emission factor is not measured but estimated by the plants based on general process experiences.
NMVOC Statistics Norway uses an emission factor of 1.7 kg NMVOC/tonne coal or coke (EPA 1986) in the calculations. Dioxins The emission factors used by the plants in the calculations are given in table 4.14.
Table 4.14. Emission factors for production of ferroalloys. μg dioxin /tonne metal produced
Normal operations
Dryss -chargering
Dryss- chargering >
750 °C
Source
Silicon metal 3 1.2 0.2 Measured in 1995 at the Fiskaa plant
Ferrosilicon 90 per cent
4 1.2 0.2 Estimations1
Ferrosilicon 75 per cent
5 1.2 0.2 Measured in 1995 at Rana Metall
Ferrosilicon 65 per cent
5 1.2 0.2 Estimations
Si96 3 1.2 0.2 Estimations 1 Estimations means that this emission factor is not measured but estimated by the plants based on general process experiences.
Emission calculations of dioxins for plants not reporting figures to the Climate and Pollution Agency use an emission factor for combustion of coke and coal in the industry (table 4.15).
Table 4.15. Emission factor used by Statistics Norway to calculate dioxin emissions from production of ferro manganese/chromium
Emission factorCoal and coke 1.6 µg/tonne
Source: Bremmer et al. (1994) and Finstad et al. (2002b).
PAH The emission factors used by the plants in the calculations are given in table 4.16.

The Norwegian Emission Inventory 2011 Documents 21/2011
116 Statistics Norway
Table 4.16. Emission factors for production of ferroalloys. g PAH /tonne metal produced
Normal operations
Dryss -chargering
Dryss- chargering
> 750 °C
Source
Silicon metal 3 2.6 1.6 Measured in 1995 at the Fiskaa plant
Ferrosilicon 90 per cent 2 2 1 Estimations1 Ferrosilicon 75 per cent 1.5 1.3 0.8 Measured in 1995 at Rana Metal
and the Thamshavn plant Ferrosilicon 65 per cent 1 1.3 0.8 Estimations Si96 3 2.6 1.6 Estimations 1 Estimations means that this emission factor is not measured but estimated by the plants based on general process experiences.
4.4.2.5. Uncertainties Uncertainty estimates for greenhouse gases and long-range transboundary air pollutants are given in Appendix D. Particles The inventory uses a particle size distribution which is an assumption from the ferroalloy industry and not based on measurements. We can therefore not preclude that some of the particles might be larger than PM2.5. Heavy metals and POPs Historical emissions are based on derived emission factors for the first year of reporting, and calculated using production figures for previous years. This is uncertain since the calculation method does not consider quality changes of the raw materials or changes in the production profile at each plant that can have big impact on yearly emissions.
4.4.2.6. Source specific QA/QC CO2, CH4 and N2O The Climate and Pollution Agency compared the reported emissions from the plants with emission data given in "the white book" (SINTEF and Det Norske Veritas 2004) and other relevant data available. In some cases, the emission data were verified by making control calculations based on emission factors and activity data. In all cases, the construction of charts and figures of emissions and activity data helped identifying missing data and possible errors. All the main producers of ferroalloys in Norway were contacted and asked to supply missing emission and activity data, and to explain any possible errors identified. The feedback from the companies made it possible to make corrections and filling of gaps in the series of data. A complete time series from 1990 to 2004 could be established for all three relevant greenhouse gas parameters for most companies. Data from "the white book" and the reported company data corresponded well. During the review of the initial report in 2007, activity data like coal, coke, electrodes, petrol coke and bio carbon were collected from each plant once again and so were emissions of CH4 and N2O based on EFs shown in Table 4.12. With very few exceptions the AD reported in the CRF are data that the plants have reported to the Climate and Pollution Agency. The IEF for the sector and also for each plant is fluctuating from year to year mainly due to variation in sold CO and in production of ferroalloy products. The CO2 emissions are in addition calculated by Statistics Norway based on IPCC's recommended Tier 1 method, using the reported amount of reducing agents (raw material) used. Emission factors used are the factors in table 4.11. The calculated emissions are used as a quality check of the reported data.

Documents 21/2011 The Norwegian Emission Inventory 2011
Statistics Norway 117
The specific QA/QC carried out in 2006 for greenhouse gases from industrial processes is described in Appendix I. NOX, NMVOC and CO The reported emission figures for NOX, NMVOC and CO are compared with calculations at Statistics Norway. For the quality check on the reported NOx emission figures, an emission factor estimated from two ferroalloy plants are used together with production data. The applied emission factor of 11.7 kg NOx/ tonne ferroalloy is rather uncertain since it is estimated from measurements at only two of the Norwegian ferroalloy plants. Emission figures for NMVOC are controlled by multiplying the amount of reducing agents with an emission factor recommended by EPA (1986). PAH In 2004, there was a quality improvement of the historical calculation of PAH. PAH was first included in the Norwegian Inventory in 2000, and at that time only two plants producing ferrosilicon and silicon metal reported emission figures to the Climate and Pollution Agency for the year 1999. The ferroalloy industry and the Climate and Pollution Agency therefore derived emission factors to estimate PAH emissions from the production of ferrosilicon and silicon metal (Benestad, pers. comm.12). It was then decided to use these factors in the Norwegian inventory to calculate PAH emissions. From 2000, all plants producing ferrosilicon and silicon metal, however, started reporting emission figures to the Climate and Pollution Agency, and these figures have been used instead of the calculated emissions based on emission factors and activity data. In 2004, the historical emissions were recalculated. Based on the plants' reported emission figures for 2000, 2001 and 2002 and production volumes, a specific emission factor for each plant was derived. These factors were then used to recalculate the plants' historical emissions of PAH. A specific emission factor for each plant was considered better to use for historical emissions, instead of using a default emission factor for all plants. The specific emission factors derived for each plant with the new method were lower than those suggested by Benestad (pers. comm.12), and this caused approximately 2-12 per cent lower yearly PAH emissions from 1990 to 1999 from this source.
4.4.3. Production of primary aluminium IPCC 2C3, Key category for CO2 and PFC (SF6: 2C4, Key category for SF6) NFR 2C3 Last update: 30.06.08
4.4.3.1. Description There are seven plants in Norway producing aluminium. Both prebaked anode and the Soederberg production methods are used. In the Soederberg technology, the anodes are baked in the electrolysis oven, while in the prebaked technology the anodes are baked in a separate plant. In general, the emissions are larger from the Soederberg technology than from the prebaked technology. There has been a shift from Soederberg to prebaked technology. In 1990, 57 per cent of the aluminium production in Norway was produced with prebaked technology and the share of aluminium production from prebaked increased to 92 per cent in 2009. Two new plants with prebaked technology were established in 2002 and two plants using Soederberg technology were closed down in 2001 and 2003. Since 2007 three plants using Soederberg technology have been closed down, one in 2007, one in 2008 and one in 2009. There is now only one plant left where Soederberg technology is used.
12 Benestad, C. (2000): Personal information, e-mail dated 30/10 2000.

The Norwegian Emission Inventory 2011 Documents 21/2011
118 Statistics Norway
Production of aluminium leads to emissions of various components, such as CO2, SO2, NOx, perfluorocarbons (PFCs), heavy metals and persistent organic pollutants. The emission of CO2 is due to the electrolysis process during the production of aluminium, while the SO2 emissions are from the sulphur in the reducing agents used. NOX is primarily produced by the high temperature oxidation of nitrogen in the air. All plants also report emissions of particles, heavy metals and PAH. Emissions of heavy metals are due to the metal content in the raw materials used and the reducing agents.
4.4.3.2. Method CO2
The inventory uses the emission figures reported to the Climate and Pollution Agency, calculated by each plant on the basis of consumption of reducing agents. This includes carbon electrodes, electrode mass and petroleum coke. The emission factors are primarily calculated from the carbon content of the reducing agents. Previously, Statistics Norway estimated the CO2 emissions from consumption data provided by the plants, but now figures reported by the plants are used. Reported figures are available since 1992. For 1990 and 1991 there were no data, hence recalculation was made using production data and reported emission data for 1992. The aluminium industry calculates the CO2 emissions separate for each technology. The following methods are used: CO2 from Prebake Cells (4.7) Q = A*C*3.67 Where Q is the total yearly emissions of CO2 A is the yearly net consumption of anodes C is per cent carbon in the anodes 3.67 is the mol-factor CO2/C CO2 from Soederberg Cells (4.8) Q = S*3.67*(K*C1+P*C2) Where Q is the total yearly emissions of CO2
S is the yearly consumption of Soederberg paste K is the share of coke in the Soederberg paste P is the share of pitch in the Soederberg paste K+P=1 C1 is the fraction of carbon in the coke. Fraction is per cent Carbon/100 C2 is the fraction of carbon in the pitch. Fraction is per cent Carbon/100 SO2
The plants report emission figures of SO2 to the Climate and Pollution Agency. The figures are estimated by each plant based on the amounts of reducing agents used and their sulphur content. All plants have installed flue gas treatment, like, for example, sea water scrubber.

Documents 21/2011 The Norwegian Emission Inventory 2011
Statistics Norway 119
NOx
NOx emissions are estimated by Statistics Norway from the level of production and an emission factor derived from measurements at two Norwegian plants. The figure is rather uncertain. Perflourocarbons (PFCs) The emissions of PFC are reported annually by the plants to the Climate and Pollution Agency. Perfluorinated hydrocarbons (PFCs), e.g. tetrafluoromethane (CF4) and hexafluoroethane (C2F6), are produced during anode effects (AE) in the Prebake and Soederberg cells, when the voltage of the cells increases from the normal 4-5V to 25-40V. During normal operating condition, PFCs are not produced. The fluorine in the PFCs produced during anode effects originates from cryolite. Molten cryolite is necessary as a solvent for alumina in the production process. Emissions of PFCs from a pot line (or from smelters) are dependent on the number of anode effects and their intensity and duration. Anode effect characteristics will be different from plant to plant and also depend on the technology used (Prebake or Soederberg). During electrolysis two perfluorocarbon gases (PFCs), tetrafluormethane (CF4) and heksafluorethane (C2F6), may be produced in the following reactions: Reaction 1: (4.9) 463 3CF12NaF4Al3CAlF4Na ++→+
Reaction 2: (4.10) 6263 FC212NaF4Al4CAlF4Na ++→+ The national data are based on calculated plant specific figures from each of the seven Norwegian plants. The plants have used the Tier 2 method in their calculations, which are based on a technology specific relationship between anode effect performance and PFCs emissions. The PFCs emissions are then calculated by the so-called slope method, where a constant slope coefficient (see table 4.17), given as kg CF4/tonne Al/anode effect minutes per cellday, is multiplied by the product of anode effect frequency and anode effect duration (in other words, by the number of anode effect minutes per cell day), and this product is finally multiplied by the annual aluminium production figure (tonnes of Al/year). The basis for the plants calculations of PFCs is the amount of primary aluminium produced in the potlines and sent to the cast house. Thus, any remelted metal is not included here. The formula for calculating the PFC emissions is: (4.11) kg CF4 per year = SCF4 • AEM • MP
and (4.12) kg C2F6 per year = kg CF4 per year • FC2F6/CF4 Where : SCF4 = “Slope coefficient” for CF4, (kg PFC/tAl/anode effect minutes/cellday AEM = anode effect minutes per cellday MP = aluminium production, tonnes Al per year FC2F6/CF4 = weight fraction of C2F6/CF4

The Norwegian Emission Inventory 2011 Documents 21/2011
120 Statistics Norway
Table 4.17. Technology specific slope and overvoltage coefficients for the calculation of PFCs emissions from aluminium production
Technology a ”Slope coefficient”b,c (kg PFC/tAl)/ (anode effect/cellday)
Weight fraction C2F6/CF4
SCF4 Uncertainty(±per cent)
FC2F6/CF4 Uncertainty (±per cent)
CWPB 0.143 6 0.121 11 SWPB 0.272 15 0.252 23 VSS 0.092 17 0.053 15 HSS 0.099 44 0.085 48 a. Centre Worked Prebake (CWPB), Side Worked Prebake (SWPB), Vertical Stud Soederberg (VSS), Horizontal Stud Soederberg (HSS). b. Source: Measurements reported to IAI, US EPA sponsored measurements and multiple site measurements. c. Embedded in each slope coefficient is an assumed emission collection efficiency as follows: CWPB 98 per cent, SWPB 90 per cent, VSS 85 per cent, HSS 90 per cent. These collection efficiencies have been assumed based on measured PFC collection fractions, measured fluoride collection efficiencies and expert opinion.
“Slope coefficient” is the number of kg CF4 per tonne aluminium produced divided by the number of anode effects per cellday. The parameter cellday is the average number of cells producing on a yearly basis multiplied with the number of days in a year that the cells have been producing. Measurements of PFCs at several aluminium plants have established a connection between anode parameters and emissions of CF4 and C2F6. The mechanisms for producing emissions of PFCs are the same as for producing CF4 and C2F6. The two PFC gases are therefore considered together when PFC emissions are calculated. The C2F6 emissions are calculated as a fraction of the CF4 emissions. The Tier 2 coefficients for Centre Worked Prebake cells (CWPB) are average values from about 70 international measurement campaigns made during the last decade, while there are fewer data (less than 20) for Vertical Stud Soederberg cells (VSS). The main reason for the choice of the Tier 2 method is that the uncertainties in the facility specific slope coefficients are lower than the facility specific based slope coefficients in Tier 3. This means that there is nothing to gain in accuracy of the data by doing measurements with higher uncertainties. Sulphur hexafluoride (SF6) SF6 used as cover gas in the aluminium industry is assumed to be inert, and SF6 emissions are therefore assumed to be equal to consumption. At one plant, SF6 was used as cover gas in the production of a specific quality of aluminium from 1992 to 1996. The aluminium plant no longer produces this quality, which means that SF6 emissions have stopped. Particles Emission figures have been reported to the Climate and Pollution Agency since 1990. The Climate and Pollution Agency assumes that the particles emitted are smaller than PM10. According to TNO (Institute of environmental and energy technology 2002), PM10 is 97 per cent of TSP, and PM2.5 is 43 per cent of TSP. The Norwegian inventory uses the particle size distribution suggested by TNO (Institute of environmental and energy technology 2002). Heavy metals The plants report emission figures to the Climate and Pollution Agency. The first requirement for reporting came in 1999, so emission figures before that are insufficient. The concentrations of heavy metals in the air emissions are very low and therefore impossible to measure. Emissions are therefore calculated at each plant, based on the mass flow. Dioxins Since the process uses coal and coke as reducing agents, it is assumed that production of primary aluminium gives dioxin emissions. Reported figures for dioxins are not available. The emissions are believed to be so small that reporting is not necessary. Emissions are therefore calculated based on the combustion factor for coal in the industry.

Documents 21/2011 The Norwegian Emission Inventory 2011
Statistics Norway 121
PAH The reported emission data are assumed to be according to Norwegian standard (NS9815). It is further assumed by the Climate and Pollution Agency that the emissions are due to emissions from the use of the Soederberg method. Historical emission figures have been calculated based on changes in production of aluminium after the Soederberg method. The PAH profile has been measured at three plants. These profiles show little variation. Based on these profiles it is believed that PAH-4 accounts for 15 per cent and PAH-OSPAR 30 per cent of total PAH emissions from production of aluminium after the Soederberg method (table 4.18).
Table 4.18. Distribution of PAH emissions from production of primary aluminium. Ratio
Component Distribution of PAH emissions (ratio)
PAH (Norwegian standard) 1
PAH-6 (Ospar) 0.3
PAH-4 (CLRTAP) 0.15
4.4.3.3. Activity data NOX The activity data for the NOX calculation are production figures, which are reported annually from the plants to the Climate and Pollution Agency. Dioxins The calculation of emissions of dioxins is based on consumption of raw materials. The figures are reported annually from the plants to Statistics Norway.
4.4.3.4. Emission factors NOX Statistics Norway uses the emission factor 0.00071 tonnes NOX/ tonne produced aluminium in the calculations. This emission factor is assumed by the Climate and Pollution Agency and is based on measurements. Dioxins Emissions of dioxins are calculated based on the consumption of coal and an emission factor from Bremmer et al. (1994).
Table 4.19. Emission factor used to calculate dioxin emissions from aluminium production
Emission factor SourceCoal and coke 1.6 µg/tonne Bremmer et al. (1994)
4.4.3.5. Uncertainties Uncertainty estimates for greenhouse gases and long-range transboundary air pollutants are given in Appendix D. Perflourocarbons (PFCs) The uncertainties in the so-called tier 2 slope coefficients from IAI (International Aluminium Institute) is lower ( 6 per cent and 17 per cent for CWPB and VSS cells, respectively), compared to the measured facility specific based slope coefficients, where the uncertainties are around 20 per cent, even when the most modern measuring equipment is used (the continuous extractive-type Fourier Transform Infrared (FTIR) spectroscopic system). Control measurements in two Hydro Aluminium plants (Karmøy and Sunndal) done in November 2004, showed that the measured values for CWPB and VSS cells were well within the uncertainty range of the tier 2 slope coefficients. Particles The particle size distribution are not reported by the plants. Actual emissions are propably somewhat different from those estimated with the size distribution from TNO (Institute of environmental and energy technology 2002).

The Norwegian Emission Inventory 2011 Documents 21/2011
122 Statistics Norway
4.4.3.6. Completeness Major missing emission components are not likely.
4.4.3.7. Source specific QA/QC The specific QA/QC carried out in 2006 for greenhouse gases from industrial processes is described in Appendix I. CO2
The emission figures reported by the plants are checked by the Climate and Pollution Agency and Statistics Norway. Statistics Norway makes own estimates based on the consumption of reducing agents and production data collected in an annual survey and average emission factors. If errors are found, the plants are contacted and changes in the emissions are made when necessary. Perflourocarbons (PFCs) The emission figures from the aluminium plants are reported to the Climate and Pollution Agency annually. As a quality control, it is checked that the reports are complete. Each figure is compared with similar reports from previous years and also analysed, taking technical changes and utilisation of production capacity during the year into account. If errors are found, the Climate and Pollution Agency contacts the plant to discuss the reported data, and changes are made if necessary. The Climate and Pollution Agency has regular meetings with the aluminium industry where all plants are represented. This forum is used for discussion of uncertainties and improvement possibilities. The Climate and Pollution Agency’s auditing department are regularly auditing the aluminium plants. As part of the audits, their system for monitoring, calculation and reporting of emissions are checked. PAH The Climate and Pollution Agency had recently audits at all aluminium plants to check their system for monitoring of emissions of PAH. It will be considered whether similar audits should have climate gases as the main target. Heavy metals First requirement for reporting of heavy metals was given in 1999, and the reported figures were that year based on concentration measurements. The concentration of heavy metals in the air emissions are very low and therefore subject to high degree of uncertainty. The reported emission figures showed large differences from plant to plant, also in the cases where the raw materials came from the same supplier. The Climate and Pollution Agency has had a long discussion with the aluminium industry to find a better method to estimate heavy metals from aluminium production. In 2001 it was decided that reported figures should be based on calculations. New calculations have shown that earlier calculations gave too high emissions of heavy metals. It was therefore recommended by the Climate and Pollution Agency to recalculate historical reported data based on the new calculation method. Recalculation of historical data are normally based on production rate data, but due to very low emissions and relative stable production rates, historical data are set to be the same as the first year of reporting.
4.4.4. Production of secondary aluminium IPCC -, (SF6: 2C4, Key category for SF6) NFR 2C3 Last update: 01.09.05
4.4.4.1. Description One open mill in Norway is handling secondary aluminium production. Heavy metals and persistent organic pollutants (dioxins and PAH) are emitted in the

Documents 21/2011 The Norwegian Emission Inventory 2011
Statistics Norway 123
production of secondary aluminium due to the remelting process. Particles are also emitted during the production process. For earlier years there have also been some emissions of NH3 and SF6.
4.4.4.2. Method NH3
For the years 1993-2001, emissions of NH3 were reported from one plant. This plant closed down in 2001. Sulphur hexafluoride (SF6) For the years 1998, 1999 and 2000, emissions of SF6 have been reported to the Climate and Pollution Agency. Particles The plant has reported emission figures to the Climate and Pollution Agency from 1993 until its closure in 2001. Emission figures for 1990 to 1992 are in the inventory assumed to be the same as the reported figure in 1993. The following particle size distribution is assumed and used in the Norwegian inventory; PM10 is 0.8*TSP and PM2.5 is 0.32*TSP (Institute of environmental and energy technology 2002). Heavy metals and POPs The figures are reported annually to the Climate and Pollution Agency. Emission figures exist since 1993, and emissions before 1993 have been supposed to be the same as reported figures in 1993. The emission figures for heavy metals are based on metal analyses of dust samples. Figures of Pb, Cd and Cr have been reported since 1997. Annual figures can vary a lot from one year to another, and therefore we have used mean values for years when the changes can not be explained by the industry. We have assumed that the emission figures for 1990-1996 are the same as reported figures in 1997, since there are no reported figures of heavy metals and PAH before 1997.
4.4.4.3. Uncertainties Heavy metals and POPs The reported figures for heavy metals are estimated based on heavy metal content in the dust samples. The metal content were only analysed for a few dust samples yearly and the reported figures are therefore only a presumption of yearly emission figures. Calculation of emission figures before 1997 are assumed to be the same as reported figures in 1997, and this gives highly uncertain figures since raw materials and production variations may have changed during the period. The reported emission figures for dioxins and particles vary from one year to another, and it is assumed that this is due to uncertain measurements and process readjustments.
4.4.4.4. Source specific QA/QC There is no source specific QA/QC procedure for this sector. See section 1.5 for the description of the general QA/QC procedure.
4.4.5. Production of magnesium IPCC 2C5, (SF6: 2C4) NFR 2C5 Last update: 27.05.10
4.4.5.1. Description There has been one magnesium producing plant in Norway. The plant closed down the production of primary magnesium in 2002. The production of cast magnesium continued, but this production has no CO2 emissions from processes. During 2006

The Norwegian Emission Inventory 2011 Documents 21/2011
124 Statistics Norway
also the production of remelting Mg stopped. From the mid-1970s, both the magnesium chloride brine process and the chlorination process were used for magnesium production. Since 1991, only the chlorination process was in use. Production of magnesium leads to non-combustion CO2 and CO emissions. During the calcination of dolomite (MgCa(CO3)2) to magnesium oxide, CO2 is emitted. During the next step, magnesium oxide is chlorinated to magnesium chloride, and coke is added to bind the oxygen as CO and CO2. SO2 is emitted due to the sulphur in the reducing agent used. In the foundry, producing cast magnesium, SF6 is used as a cover gas to prevent oxidation of magnesium. The Norwegian producer of cast magnesium has assessed whether SF6 used as cover gas reacts with other components in the furnace. The results indicate that it is relatively inert, and it is therefore assumed that all SF6 used as cover gas is emitted to air.
4.4.5.2. Method CO2 The inventory uses emission figures reported to the Climate and Pollution Agency. Previously, Statistics Norway calculated the CO2 emissions by using annual production volumes and the emission factor recommended by SINTEF (Olsen et al. 1998). SF6 Studies performed by the Norwegian producer have assessed that SF6 used as cover gas is inert. Therefore the consumption figures for the cover gas (SF6) are used as the emission estimates in accordance with the IPCC Guidelines (IPCC 1997b, a). The SF6 emissions were reported annually to the Climate and Pollution Agency. CO Emission figures of CO were reported annually to the Climate and Pollution Agency. These emissions disappeared when the plant closed down the production of primary magnesium in 2002. SO2
The SO2 emissions were estimated from the amounts of reducing agent used (coke) and their sulphur content and reported from the plants to the Climate and Pollution Agency. Particles The plant reported emission figures for particles for the first time for the year 1992. Emissions of particles for 1990 and 1991 are assumed to be larger than the reported figure in 1992, since a cleaning device was installed in 1992. Statistics Norway has no information that can be used to estimate emissions in 1990 and 1991, so the inventory uses the reported emission figure for 1992 also for 1990 and 1991. The Climate and Pollution Agency assumes that reported figures also include emissions from combustion. No information is found regarding the particle size distribution for particles emitted during magnesium production. In lack of other data, we use the same distribution as for aluminium production (PM10 is 97 per cent of TSP, and PM2.5 is 43 per cent of TSP). Heavy metals and POPs Emission of heavy metals is due to the metal content in the reducing agent used. Emission data of Hg, As, Cr and dioxins were reported to the Climate and Pollution Agency. When the plant closed down the production of primary magnesium in 2002, the emissions of As disappeared. Reported figures of heavy metals have only

Documents 21/2011 The Norwegian Emission Inventory 2011
Statistics Norway 125
been available since 2000. Emission figures are calculated back to 1990 based on the production rate for each year. During the chlorination process and the use of coke as a reducing agent, dioxins are emitted. Emission figures for dioxins were reported to the Climate and Pollution Agency from 1990.
4.4.5.3. Activity data The Norwegian emission inventory uses production volumes as activity data in the calculation of CO2. This method is recommended by SINTEF (Olsen et al. 1998). The consumption figures used as emission figures for SF6 were reported to the Climate and Pollution Agency.
4.4.5.4. Emission factor An emission factor of 4.07 tonnes CO2/tonnes produced magnesium is used by Statistics Norway to calculate the annual emissions of CO2 (Olsen et al. 1998).
4.4.5.5. Uncertainties Uncertainty estimates for greenhouse gases and long-range transboundary air pollutants are given in Appendix D. Particles For years where reported emission figures do not exist, Statistics Norway has assumed that emissions are in the same order as that of the first year of reporting. This is uncertain and a result of lack of better data. The particle size distribution used is not specific for production of magnesium, but used due to lack of specific size distribution data for this source. The particle size distribution can therefore only be seen as an estimate. Heavy metals Historical emissions are based on a derived emission factor for the first year of reporting and calculated with production figures for previous years. This is uncertain and only an estimate since it does not consider annually changes in raw materials nor possible cleaning devices.
4.4.5.6. Completeness Major missing emission components are not likely.
4.4.5.7. Source specific QA/QC The latest reported emission data from the plant were compared with previous reported data and the emissions were compared with the production.
4.4.6. Other metals IPCC 2C5 NFR 2C5 Last update: 05.04.06 In addition to the metals in the previous chapters, nickel and zinc are also produced in Norway.
4.4.6.1. Production of nickel 4.4.6.1.1. Description One plant in Norway produces nickel. During the production of nickel, CO2, SO2, NOx, NH3, particles and heavy metals are emitted. CO2 is emitted in the production of nickel, due to the soda from the production of nickel carbonate and use of coke as a reducing agent, while SO2 is a result of the sulphur content in the coke used. NOx is produced primarily by the high temperature oxidation of nitrogen in the air. Emission of heavy metals is due to the metal content in reducing agent used.

The Norwegian Emission Inventory 2011 Documents 21/2011
126 Statistics Norway
Particles are also emitted during the production process. PAHs and dioxins are not reported or calculated.
4.4.6.1.2. Method CO2
Emission figures are annually reported from the plant to the Climate and Pollution Agency based on calculation of material balance. SO2
Emission figures of SO2 are reported from the plant to the Climate and Pollution Agency based on continuous measurements. Flue gas treatment is installed at the plant. NOx
Emission figures of NOx are annually reported from the plant to the Climate and Pollution Agency. The emission figures are based on calculations. NH3 Emission figures based on calculations are annually reported from the plant to the Climate and Pollution Agency. Particles Emission figures for particles have been reported to the Climate and Pollution Agency since 1992. Emissions in 1990 and 1991 are assumed to be the same as the reported figure in 1992. The emission permit sets requirements to emissions from the melting furnace, transport, crushing and packing of the raw materials and products. The Climate and Pollution Agency assumes that the particles emitted are smaller than PM2.5. This means that TSP=PM10=PM2.5 is used in the inventory. Heavy metals and POPs Emission figures for Cu have been reported to the Climate and Pollution Agency since 1990. Reported figures for Cd, Hg and Pb were available from 1990-1994, but because of low emissions the plant stopped reporting these metals.
4.4.6.1.3. Uncertainties Uncertainty estimates for greenhouse gases and long-range transboundary air pollutants are given in Appendix D. Particles The particle size distribution used is only an assumption and we can not preclude that the distribution might be different than the one suggested. The particle size distribution can therefore only be seen as an estimate.
4.4.6.1.4. Completeness Major missing emission components are not likely.
4.4.6.1.5. Source specific QA/QC There is no source specific QA/QC procedure for this sector. See section 1.5 for the description of the general QA/QC procedure. The specific QA/QC carried out in 2006 for greenhouse gases from industrial processes is described in Appendix I.
4.4.6.2. Production of zinc 4.4.6.2.1. Description One plant in Norway produces zinc. SO2, particles and heavy metals are emitted during the process. Emission of SO2 originates from the sulphur in the reducing agent used.

Documents 21/2011 The Norwegian Emission Inventory 2011
Statistics Norway 127
4.4.6.2.2. Method SO2 The plant reports emission figures to the Climate and Pollution Agency. The SO2 emissions are estimated from infrequent measurements combined with calculations. Particles Emission figures for particles have been reported since 1991. Emissions for 1990 are assumed to be the same as the reported figure for 1991. It is assumed that of the particles emitted, 90 per cent is PM10 and 80 per cent is PM2.5 (Institute of environmental and energy technology 2002) and this particle size distribution is used in the Norwegian inventory. Heavy metals and POPs The plant reports emission figures for Cd, Pb, Hg, Cu, Cr and As. Reported figures exist since 1992, and emissions in 1990 and 1991 are assumed to be the same as reported figures in 1992. Figures are not reported for PAH and dioxins.
4.4.6.2.3. Source specific QA/QC There is no source specific QA/QC procedure for this sector. See section 1.5 for the description of the general QA/QC procedure.
4.4.7. Manufacture of anodes IPCC 2C5 NFR 2C5 Last update: 20.05.09
4.4.7.1. Description Three plants in Norway produce anodes. Prebaked anodes and coal electrodes are alternatives to the use of coal and coke as reducing agents in the production process for aluminium and ferroalloys. The anodes and coal electrodes are produced from coal and coke. The production of anodes and coal electrodes leads to emissions of CO2, NOx, SO2, PAH and heavy metals.
4.4.7.2. Method CO2 The emissions of CO2 are calculated by each plant and the method is based on the Aluminium Sector Greenhouse Gas Protocol by the International Aluminium Institute (International Aluminium Institute 2005). SO2 and NOx
Emission figures of SO2 are based on measurements while NOX emissions are calculated by the plants and reported to the Climate and Pollution Agency. Particles Production of anodes leads to emission of particles. One of the plants has reported emissions since 1990, while the other one has reported since 1992. Emission figures for 1990 and 1991 are assumed to be the same as the reported figure in 1992 for this plant. The Climate and Pollution Agency assumes that the particles emitted are smaller than PM10, but also expects some to be smaller than PM2.5. No information has been found regarding the particle size distribution, so in lack of other data we use the same distribution profile as used for production of aluminium where PM10 is 97 per cent of TSP and PM2.5 is 43 per cent of TSP. PAH Emission figures for PAH are based on measurements and reported from both plants to the Climate and Pollution Agency. One plant has developed a new and

The Norwegian Emission Inventory 2011 Documents 21/2011
128 Statistics Norway
better method for measuring PAH. This method is used for the period 1992 to 2003. The reported figures of PAH are assumed to be according to the Norwegian standard (NS9815). Measurements from production of Soederberg paste (at three Norwegians plants) and a PAH-profile of baked anodes from EPA are used to derive a PAH-profile to find the emission of PAH-OSPAR and PAH-4. Based on these profiles it is assumed that PAH-OSPAR and PAH-4 account for respectively 25 per cent and 5 per cent of the total PAH emissions (table 4.20).
Table 4.20. Distribution of PAH emissions from production of anodes. Ratio
Component Distribution of PAH emissions (ratio)PAH (Norwegian standard) 1PAH-6 (Ospar) 0.25PAH-4 (CLRTAP) 0.05Source: Norwegian pollution control authority (1999b).
Heavy metals Production of anodes leads to emission of heavy metals due to the metal content in the reducing agents (coke and coal). Emission figures are based on measurements and are reported for arsenic and mercury from one plant since 2001. Emission figures have not been measured or reported before 2001 and are therefore not available for previous years. Historical emission figures back to 1990 are assumed to be the same as reported figures for 2001.
4.4.7.3. Uncertainties Historical calculations of heavy metals from 1990 to 2001 are very uncertain since they are assumed to be the same as reported figures for the first year of reporting (2001). Annual changes in production volumes, coke quality and the amount of heavy metals in the reducing agents are not taken into account, and the historical emissions can only be seen as an estimate in lack of better data.
4.4.7.4. Completeness Major missing emission components are not likely.
4.4.7.5. Source specific QA/QC There is no source specific QA/QC procedure for this sector. See section 1.5 for the description of the general QA/QC procedure. The specific QA/QC carried out in 2006 for greenhouse gases from industrial processes is described in Appendix I.
4.5. Other production IPCC 2D NFR 2D
4.5.1. Pulp and paper IPCC 2D1 NFR 2D1 Last update: 20.05.09
4.5.1.1. Description Pulp and paper production has three major processing steps; pulping, bleaching and paper production. Kraft (sulphate) pulping is the most widely used pulping process and is generally used to produce strong paper products. The Kraft pulping process includes bleaching, chemical recovery and by-products recovery. The sulphite pulping is another chemical pulping process. It produces a weaker paper than some other types of pulping, but the pulp is less coloured, making it more suitable for printing, often with little bleaching. In Norway, SO2 and particles are reported emitted from production of pulp and paper. In the Kraft pulping process, sodium sulphide and sodium hydroxide are used to chemically dissolve the lignin that binds the cellulose fibres, and in the acid sulphite pulping process, sulphurous acid solution is used. SO2 is emitted in these processes. There are also reported non-combustion CO2 emissions from one plant in this sector. The emissions originate from limestone.

Documents 21/2011 The Norwegian Emission Inventory 2011
Statistics Norway 129
4.5.1.2. Method CO2
The CO2 emissions are calculated by multiplying the amount of limestone by an emission factor. For the years 1990-97 the emissions are calculated by the Climate and Pollution Agency based upon activity data reported to the Climate and Pollution Agency by the plant and emission factor. The emissions in the period 1998-2004 are reported in the plant’s application for CO2-permits within the Norwegian emissions trading scheme. From 2005 and onwards, the plant reports the emissions through the annual reporting under the emissions trading scheme. SO2
Emission figures are reported from producers of chemical pulp to the Climate and Pollution Agency. SO2 is measured continuously and emission estimates are made from these measurements. Particles Four plants producing pulp and paper, report non-combustion emissions of particles to the Climate and Pollution Agency. Two of these plants have not reported emission figures from combustion and it is assumed that the reported non-combustion emission figures include emissions from combustion. It varies when the plants started reporting emission figures for particles, and due to lack of data, emission for those years is assumed to be the same as in the first year of reporting. Two of the plants state that they clean the emissions by electric filter and wet scrubbers, and it is assumed by the Climate and Pollution Agency that the particles emitted are smaller than PM2.5. The other two clean their emissions using only wet scrubbers, and it is assumed the particles are smaller than PM10. According to TNO (Institute of environmental and energy technology 2002), PM2.5 is 20 per cent of PM10 and PM10 is the same as TSP.
4.5.1.3. Activity data CO2 Activity data is reported by the plant to the Climate and Pollution Agency. The amount of limestone is calculated from purchased amount.
4.5.1.4. Emission factor CO2 The emission factor used in the calculation is 0.44 tonne CO2 per tonne limestone.
4.5.1.5. Uncertainties Uncertainty estimates for emission of CO2 are given in Appendix D. The particle size distribution used is not plant specific and might therefore be different from the one suggested by TNO.
4.5.1.6. Completeness Major missing emission components are not likely.
4.5.1.7. Source specific QA/QC There is no source specific QA/QC procedure for this sector. See section 1.5 for the description of the general QA/QC procedure. The specific QA/QC carried out in 2006 for greenhouse gases from industrial processes is described in Appendix I.

The Norwegian Emission Inventory 2011 Documents 21/2011
130 Statistics Norway
4.5.2. Food and Drink IPCC 2D2, Key Category for CO2 NFR 2D2 Last update: 23.03.06
4.5.2.1. Description This source category includes NMVOC emissions from production of bread and beer, CO2 from carbonic acid mainly used in breweries, export of captured CO2 and CO2 from production of bio protein.
4.5.2.2. Production of bread and beer 4.5.2.2.1. Method NMVOC Production of bread and beer (and other similar yeast products) involves fermentation processes that lead to emission of NMVOC (ethanol). Emissions are calculated based on production volumes and emission factors.
4.5.2.2.2. Activity data Production volumes of bread and beverages are annually reported to Statistics Norway.
4.5.2.2.3. Emission factors The emission factors are taken from EEA (1996).
Table 4.21. NMVOC emission factors from production of bread and beverage
Emission factor UnitProduction of bread 0.003 tonnes/tonnes producedProduction of beverage 0.2 kg/1000 litres
Source: EEA (1996).
4.5.2.2.4. Uncertainties The emission factors used are recommended by EEA (1996) and are not specific for Norwegian conditions.
4.5.2.2.5. Completeness Major missing emission components are not likely.
4.5.2.2.6. Source specific QA/QC There is no source specific QA/QC procedure for this sector. See section 1.5 for the description of the general QA/QC procedure. The specific QA/QC carried out in 2006 for greenhouse gases from industrial processes is described in Appendix I.
4.5.2.3. Carbonic acid to breweries As mentioned under section 4.3.1.1, some CO2 from ammonia production is used as carbonic acid in carbonated beverages. During the ammonia production, CO2 is generated and then captured and sold to other companies in Norway or exported. Most of it is sold for lemonade production. All of the emissions are reported under this source, although the largest part of the emissions takes place after the bottles are opened, and not in the breweries. Also exported CO2 is included in the Norwegian emission inventory. The figures are based on the sales statistics from the ammonia producing plant.
4.5.2.4. Production of bio protein CO2 emissions from production of bio protein from natural gas are included from the year 2001 when this production started. The bio protein is being used as animal fodder. Emission data reported from the plant to the Climate and Pollution Agency are used.

Documents 21/2011 The Norwegian Emission Inventory 2011
Statistics Norway 131
4.6. Consumption of halocarbons and SF6 IPCC 2F, Key category for HFC NFR - Last update: 31.05.11
4.6.1. HFCs and PFCs from products and processes
4.6.1.1. Description HFCs and PFCs can be used as substitutes for ozone depleting substances (CFCs and HCFCs) that are being phased out according to the Montreal Protocol. They are used in various applications, including refrigeration and air conditioning equipment, as well as in foam blowing, fire extinguishers, aerosol propellants and for analysing purposes. There is no production of HFCs and PFCs in Norway (however, PFCs are emitted as a by-product during the production of aluminium, see chapter 4.4.3). HFCs and PFCs registered for use in Norway are HFC-23, HFC-32, HFK-125, HFC-134, HFC-134a, HFC-143, HFC-143a, HFC-152a, HFC-227ea and PFC-218. The most significant gases, measured in CO2 equivalents are HFC-134a, HFC-143a and HFC-125. Measured in metric tonnes emissions of the low-GWP HFC-152a are also significant. Due to, i.e., high taxation, the use of PFCs in product-applications is very low. In January 2003 a tax on import and production of HFC and PFC was introduced. In July 2004 this tax was supplemented with a refund system for the destruction of used gas. In 2009 the tax and refund were both 205 NOK (approximately 27 Euro) per tonnes of CO2 equivalents. Based on these new realities a project was established to review the emission calculations of HFC and PFC. This work was completed in March 2007 (Hansen 2007) and is reflected in this report. In May 2010, EU regulation (EC) No 842/2006 on certain fluorinated greenhouse gases was included in Norwegian legislation. Consequently there is no direct effect from the regulation reflected in the emissions so far. However, some minor indirect effects due to adjustment to expected implementation are probable.
4.6.1.2. Method Actual emissions of HFCs and PFCs are calculated using the Tier 2 methodology. This methodology takes into account the time lag in emissions from long lived sources, such as refrigerators and air-conditioning equipment. The chemicals slowly leak out from seams and ruptures during the lifetime of the equipment. The leakage rate, or emission factor, varies considerably depending on type of equipment. Potential emissions are calculated employing the Tier 1b methodology, which only considers the import, export and destruction of chemicals in bulk and in products without time lag. It was found that the ratio between potential (Tier 1b) and actual emissions (Tier 2) was about 2:1 in 2008.
4.6.1.3. Activity data There is no production of HFC or PFC in Norway. Hence all emissions of these chemicals are originating from imported chemicals. The methodology requires that annual imported amounts of each chemical are obtained by source category. Imported and exported amounts of chemicals in bulk are collected annually by the Climate and Pollution Agency. Imported and exported amounts of chemicals in products for the years 1995-1997 were collected through a survey in 1999 (Rypdal 1999), and this information was used to estimate imports and exports the years previous to and after the survey. For the source category refrigeration, data on imports from customs statistics were used to update the estimated amounts for years after 1997.
4.6.1.4. Emission factors Leakage rates and product lifetimes used in the calculations are shown in table 4.22.

The Norwegian Emission Inventory 2011 Documents 21/2011
132 Statistics Norway
Table 4.22. Emission factors for HFCs from products and lifetime of products
Application category
Annual emissions
during lifetime(per cent of
initial charge)
Lifetime of products
(years)
Refrigeration and air conditioning Household refrigerators and freezers 1 15 Commercial and industrial applications, imported 3.5 15 Refrigerated transport, imported 20 15 Air conditioning aggregates and heat pumps, imported 4 15 Water/liquid refrigerating aggregates, water-based heat pumps, imported 5 15Stationary equipment produced in Norway 10 15 Mobile air conditioners 10 12
Foam Polyurethane with diffusion barrier 1 40 Polyurethane without diffusion barrier 5 20 Extruded polystyrene 3 30
Fire extinguishers 5 15
Solvents 50 2
Aerosol propellants 50 2Source: Hansen (2007).
4.6.1.5. Uncertainties In 2006, the uncertainties of the different components of the national greenhouse gas inventory were evaluated in detail by Statistics Norway (See Appendix D). Both the leakage rate (emission factor) and the stored amount of chemicals (activity data) are considered quite uncertain. The total uncertainties for the emission estimates for consumption of halocarbons are estimated to be ±50 per cent for both HFCs and PFCs.
4.6.1.6. Completeness Major missing emission sources are not likely
4.6.1.7. Source specific QA/QC There is no specific QA/QC procedure for this sector. See section 1.5 for the description of the general QA/QC procedure.
4.6.2. Emissions of SF6 from products and processes
4.6.2.1. Description In Mars 2002, a voluntary agreement was signed between the Ministry of Environment and the most important users and producers of GIS (gas-insulated switchgear). According to this agreement, emissions from this sector should be reduced by 13 per cent in 2005 and 30 per cent in 2010 with 2000 as base year. For the following up of this agreement, the users (electricity plants and distributors) and producers (one factory) have reported yearly to the government. This voluntary agreement was terminated successfully in 2010, but a continuation is being planned.
4.6.2.2. Method The general methodology for estimating SF6 emissions was revised in 1999 (Norwegian pollution control authority 1999a), while the sector-specific methodology for GIS was revised in the 2010 reporting based on new information from the agreement. The current method for GIS is largely in accordance with the Tier 3a methodology in the IPPC Good Practice Guidance (IPCC 2000). The method for other sources is largely in accordance with the Tier 2 methodology in the IPPC guidelines for emission inventories (IPCC 1997b, a). The calculations take into account imports, exports, recycling, accumulation in bank, technical lifetimes of products, and different rates of leakage from processes, products and production processes. From 2003 and onwards emission estimates reported directly

Documents 21/2011 The Norwegian Emission Inventory 2011
Statistics Norway 133
from users and producers, according to the voluntary agreement, are important input. Emissions from production of GIS (one factory) were included for the first time in 2003. The company has, as part of the voluntary agreement with the Ministry of the Environment, made detailed emission estimates back to 1985. These emissions constitute a significant part of national emissions of SF6. In recent years emissions rates have been considerably reduced due to new investments and better routines. The company now performs detailed emission calculations based on accounting of the SF6 use throughout the whole production chain.
4.6.2.3. Activity data Data are collected from direct consultations with importers and exporters of bulk chemicals and products containing SF6, and from companies that use SF6 in various processes.
4.6.2.4. Emission factors Leakage rates and product lifetimes used in the calculations are shown in tables 4.23 and 4.24.
Table 4.23. Yearly rate of leakage of SF6 from different processes
Emission source Leakage rate (per cent of input of SF6)
Secondary magnesium foundries 100
Tracer gas in the offshore sector 0
Tracer gas in scientific experiments 100
Production of semiconductors 50
Medical use (retinal surgery) 100
Production of sound-insulating windows 2Other minor sources 100Source: Norwefgian pollution control authority (1999a).
Table 4.24. Product lifetimes and leakage rates from products containing SF6
Product emission source Yearly rate of leakage (per cent of remaining content)
Product lifetime (years)
Gas-insulated switchgear (GIS) 1 30Sealed medium voltage switchgear 0.1 30Electrical transformers for measurements 1 30Sound-insulating windows 1 30Footwear (trainers) 25 9Other minor sources .. ..
Source: Norwegian pollution control authority (1999a).
4.6.2.5. Completeness Major missing emission components are not likely.
4.6.2.6. Source specific QA/QC During the work on the new methodology for 2004 emissions, historical data were recalculated, emission factors from different sources were established and the bank of SF6 in existing installations was estimated. For GIS, information from the industry, attained through the voluntary agreement with the Ministry of the Environment, was important input in this recalculation.

The Norwegian Emission Inventory 2011 Documents 21/2011
134 Statistics Norway
4.7. Other: Lubricants and waxes IPCC 2G NFR- Last update:08.01.08
4.7.1. Paraffin wax use
4.7.1.1. Description Paraffin waxes are produced from crude oil and used in a number of different applications, including candles, tapers and the like. Combustion of such products results in emissions of fossil CO2.
4.7.1.2. Method Emissions of CO2 from the burning of candles, tapers and the like are calculated using a modified version of equation 5.4 for Waxes – Tier 1 Method of the 2006 IPCC Guidelines: (4.13) Emissions = PC ·PF · CCWax · 44/12 Where: CO2 Emissions = CO2 emissions from waxes, tonne CO2 PC = total candle consumption, TJ PF = fraction of candles made of paraffin waxes CCWax = carbon content of paraffin wax (default), tonne C/TJ (Lower Heating Value basis) 44/12 = mass ratio of CO2/C Consumption figures on paraffin wax are multiplied by the default net calorific values (NCV) given in the 2006 IPCC Guidelines. Net consumption in calorific value is then converted to carbon amount, using the value for carbon content (Lower Heating Value basis) and finally to CO2 emissions, using the mass ratio of CO2/C.
4.7.1.3. Activity data Statistics Norway collects data on import, export and sold amounts of "Candles, tapers and the like (including night lights fitted with a float)". Using these data, net consumption of paraffin waxes and other candle waxes (including stearin) can be calculated.
4.7.1.4. Emission factors Parameter values used in the emissions calculations are given in table 4.25.
Table 4.25 Parameters employed when calculating emission figures
Parameters Factor Unit
Net calorific value (NCV) 40.20 TJ/Gg
Carbon content (CCWax, Lower Heating Value basis) 20.00 tonnes C/TJ = kg C/GJ
Mass ratio of CO2/C 3.67 - Fraction of paraffin wax (PF) 0.66 -
The assumption of 0.66 as the fraction of all candles being made of paraffin waxes is based on estimates obtained in 2007 from one major candle and wax importer (estimating approx. 0.5) and one Norwegian candle manufacturer (estimating approx. 0.8). The importer estimated the fraction to be about 5 per cent higher in 1990. However, since this possible change is considerably smaller than the difference between the two fraction estimates, we have chosen to set this factor constant for the whole time series. The fraction of paraffin waxes has probably varied during the period, as it, according to the importer, strongly depends on the price relation between paraffin wax and other, non-fossil waxes. However, at present we do not have any basis for incorporating such factor changes.

Documents 21/2011 The Norwegian Emission Inventory 2011
Statistics Norway 135
Furthermore, we assume that practically all of the candle wax is burned during use, so that emissions due to incineration of candle waste are negligible.
4.7.1.5. Uncertainties According to the 2006 IPCC Guidelines, the default emission factors are highly uncertain. However, the default factor with the highest uncertainty is made redundant in our calculations, due to the level of detail in our activity data.
4.7.1.6. Completeness Emissions from the incineration of products containing paraffin wax, such as wax coated boxes, are covered by emission estimates from waste incineration.
4.7.1.7. Source specific QA/QC There is no specific QA/QC procedure for this sector. See section 1.5 for the description of the general QA/QC procedure.

The Norwegian Emission Inventory 2011 Documents 21/2011
136 Statistics Norway
5. Solvent and other product use IPCC 3 NFR 3
5.1. Overview This chapter describes emissions from solvents and other products. Use of solvents and products containing solvents result in emissions of non-methane volatile organic compounds (NMVOC), which are regarded as indirect greenhouse gases. The NMVOC emissions will over a period of time in the atmosphere oxidise to CO2. In addition to solvents emitting NMVOC, there are other products that emit other volatile components. Creosote treated materials and tarry jointing paste cause emissions of PAH (poly-aromatic hydrocarbons). PAH and dioxins are also emitted during production of asphalt. Emissions of N2O from anaesthesia procedures and propellants, mercury from mercury-containing products as well as emissions from combustion of tobacco are also included in the Norwegian inventory.
5.2. Solvent losses (NMVOC) IPCC 3A, 3B 3C and 3D NFR 3A, 3B, 3C and 3D Last update: 26.01.09
5.2.1. Method Our general model is a simplified version of the detailed methodology described in chapter 6 of the EMEP/CORINAIR Guidebook 2007 (EEA 2007). It represents a mass balance per substance, where emissions are calculated by multiplying relevant activity data with an emission factor. For better coverage, point sources reported from industries to the Climate and Pollution Agency and calculated emissions from a side model for cosmetics are added to the estimates. For a detailed description of method and activity data, see Holmengen and Kittilsen (2009).
It is assumed that all products are used the same year as they are registered, and substances are not assumed to accumulate in long-lived products. In other words, it is assumed that all emissions generated by the use of a given product during its lifetime take place in the same year as the product is declared to our data source, the Norwegian Product Register. In sum, this leads to emission estimates that do not fully reflect the actual emissions taking place in a given year. Emissions that in real life are spread out over several years all appear in the emission estimate for the year of registration. However, this systematic overestimation for a given year probably more or less compensates for emissions due to previously accumulated amounts not being included in the estimate figures.
No official definition of solvents exists, and a list of substances to be included in the inventory on NMVOC emissions was thus created. The substance list used in the Swedish NMVOC inventory (Skårman et al. 2006) was used as a basis. This substance list is based on the definition stated in the UNECE Guidelines13. The list is supplemented by NMVOC reported in the UK’s National Atmospheric Emissions Inventory (NAEI) (AEA 2007). The resulting list comprises 678 substances. Of these, 355 were found in the Norwegian Product Register for one or more years in the period 2005-2007.
13 “Volatile compound (VOC) shall mean any organic compound having at 293.15 degrees K a vapor pressure of 0.01 kPa or more, or having a corresponding volatility under the particular conditions of use."

Documents 21/2011 The Norwegian Emission Inventory 2011
Statistics Norway 137
Cosmetics Cosmetics are not subject to the duty of declaration. The side model is based on a study in 2004, when the Climate and Pollution Agency calculated the consumption of pharmaceuticals and cosmetics (Norwegian pollution control authority 2005a). The consumption was calculated for product groups such as shaving products, hair dye, body lotions and antiperspirants. The consumption in tonnes each year is calculated by using the relationship between consumption in Norwegian kroner and in tonnes in 2004. Figures on VOC content and emission factors for each product group were taken for the most part from a study in the Netherlands (IVAM 2005), with some supplements from the previous Norwegian solvent balance (the previous NMVOC emission model).
NMVOC and CO2
The use of solvents leads to emissions of non-methane volatile organic compounds (NMVOC) which is regarded as an indirect greenhouse gas. The NMVOC emissions will over a period of time in the atmosphere oxidise to CO2, which is included in the total greenhouse gas emissions reported to UNFCCC (see chapter 1.9).
5.2.2. Activity data The data source is the Norwegian Product Register. Any person placing dangerous chemicals on the Norwegian market for professional or private use has a duty of declaration to the Product Register, and import, export and manufacturing is reported annually. The only exception is when the amount of a given product placed on the market by a given importer/producer is less than 100 kg per year.
The information in the data from the Product Register makes it possible to analyse the activity data on a substance level, distributed over product types (given in UCN codes; (The Norwegian product register 2007)), industrial sectors (following standard industrial classification (NACE), including private households (no NACE), or a combination of both. As a consequence, the identification of specific substances, products or industrial sectors that have a major influence on the emissions is greatly facilitated.
Cosmetics The side model for cosmetics is updated each year with data on from the Norwegian Association of Cosmetics, Toiletries and Fragrance Suppliers (KLF).
Point sources Data from nine point sources provided by the Climate and Pollution Agency are added to the emissions estimates. The point sources are reported from the industrial sector “Manufacture of chemicals and chemical products” (NACE 20). In order to avoid double counting, NMVOC used as raw materials in this sector are excluded from the emission estimates from the Product Register data.
5.2.3. Emission factors Emission factors are specific for combinations of product type and industrial sector. Emission factors from the Swedish model for estimating NMVOC emissions from solvent and other product use (Skårman et al. 2006) are used. The emission factors take into account different application techniques, abating measures and alternative pathways of release (e.g. waste or water). These country-specific emission factors apply to 12 different industries or activities that correspond to sub-divisions of the four major emission source categories for solvents used in international reporting of air pollution (EEA 2007).
It is assumed that the factors developed for Sweden are representative for Norwegian conditions, as we at present have no reason to believe that product types, patterns of use or abatement measures differ significantly between the two countries. Some adjustments in the Swedish emission factors were made (See Holmengen and Kittilsen (2009)).

The Norwegian Emission Inventory 2011 Documents 21/2011
138 Statistics Norway
In accordance with the Swedish model, emission factors were set to zero for a few products that are assumed to be completely converted through combustion processes, such as EP-additives, soldering agents and welding auxiliaries. Quantities that have not been registered to industrial sector or product type are given emission factor 0.95 (maximum). Emission factors may change over time, and such changes may be included in this model. However, all emission factors are at the moment constant for all years.
5.2.4. Uncertainties Uncertainty in emission factors The emission factors are more detailed in the new NMVOC model than in the previous model, as this model can take into account that emissions are different in different sectors and products, even when the substance is the same. However, for this to be correct, a thorough evaluation of each area of use is desirable, but not possible within a limited time frame. Thus, the emission factor is set with general evaluations, which leads to uncertainty.
The emission factors are taken from several different sources, with different level of accuracy. The uncertainties in emission factors depend on how detailed assessment has been undertaken when the emission factor was established. Some emission factors are assumed to be unbiased, while others are set close to the expected maximum of the range of probable emission factors. This, together with the fact that the parameter range is limited, gives us a non-symmetrical confidence interval around some of the emission factors. For each emission factor we thus have two uncertainties; one negative (n) and one positive (p). These are aggregated separately, and the aggregated uncertainty is thus not necessarily symmetrical. Uncertainty in activity data For the activity data, the simplified declarations and the negative figures due to exports lead to known overestimations, for which the uncertainty to a large extent is known. A more elaborate problem in calculations of uncertainty is estimating the level of omissions in declaration for products where the duty of declaration does apply. In addition, while declarations with large, incorrect consumption figures are routinely identified during the QA/QC procedure, faulty declarations with small consumption figures will only occasionally be discovered. There is however no reason to believe that the Product Register data are more uncertain than the data source used in the previous model (statistics on production and external trade), as similar QA/QC routines are used for these statistics. The errors in activity data are not directly quantifiable. Any under-coverage in the Product Register is not taken into account. Skårman et al. (2006) found that the activity data from the Swedish Product register had an uncertainty of about 15 per cent. The Norwegian Product Register is assumed to be comparable to the Swedish, and thus the uncertainty in the activity data is assumed to be 15 per cent. For some products, simplified declarations give an indication of maximum and minimum possible amounts. In these cases, the maximum amount is used, and the positive uncertainty is set to 15 per cent as for other activity data, while the negative uncertainty is assumed to be the interval between maximum and minimum amount. All activity data are set to zero if negative. For a detailed description of the uncertainty analysis, see Holmengen and Kittilsen (2009). The variance of total emission was estimated from the variance estimates obtained for emission factors and activity data, using standard formulas for the variance of a sum and the variance of a product of independent random variables.The aggregated uncertainties in level and trend are given in table 5.1 and 5.2.

Documents 21/2011 The Norwegian Emission Inventory 2011
Statistics Norway 139
Table 5.1. Uncertainty estimates for level of NMVOC emissions, 2005-2007. Tonnes and per cent
Uncertainty in level
Negative (n) Negative (n) (per cent of total
emissions)
Positive (p) Positive (p) (per cent of total emissions)
2005 2 288 4.58 1 437 2.88
2006 1 651 3.70 1 103 2.47
2007 1 299 2.79 1 168 2.51
Table 5.2. Uncertainty estimates for trend in NMVOC emissions, 2005-2007. Tonnes
Uncertainty in trend Negative (n) Positive (p) 95% confidence interval for change
2005-2006 2 135 1 067 (-7 366 , -4 164)
2006-2007 1 420 947 (407 , 2 774)
2005-2007 1 882 1 076 (-5 286 , -2 328)
5.2.5. Completeness No major missing emission sources are likely.
5.2.6. Source specific QA/QC • Large between-year discrepancies in the time series of substance quantities
are routinely identified and investigated, in order to correct errors in consumption figures.
• Large within-year discrepancies between minimum and maximum quantities in simplified declarations are routinely identified and investigated, in order to prevent overestimation for substances where consumption figures are given in intervals.
• Large within-year discrepancies between totals for industrial sectors (NACE) and totals for products (UCN) are routinely identified and investigated, in order to detect erroneous or incomplete industrial sectoral and product type distribution.
5.3. Use of solvents IPCC - NFR 3C Last update: 01.09.05
5.3.1. Creosote-treated materials
5.3.1.1. Description Creosote is mainly used in quay materials and conduction poles, but also in fence poles and roof boards. In Norway there is a requirement that all creosote in use should contain less than 50 mg/kg benzo(a)pyren (Miljøverndepartementet 2004). PAH-components will evaporate from the creosote-treated materials in hot weather. In addition, PAH-components will evaporate during impregnation. The smallest PAH-components, like naphthalene, are most volatile, but several components used in wood treatment will not evaporate.
5.3.1.2. Method Emissions of PAH are calculated based on the import of creosote oil and emission factors. For simplicity, it is assumed that all PAH is emitted the same year as the materials are produced.

The Norwegian Emission Inventory 2011 Documents 21/2011
140 Statistics Norway
5.3.1.3. Activity data Data on imported amounts of creosote oil are taken from Statistics Norway’s statistics on external trade.
5.3.1.4. Emission factors The emission factor used is taken from (Finstad et al. 2001). It is assumed that imported creosot oil contains on average 55 per cent PAH and that one per cent will evaporate during the lifetime of the creosot-treated materials.
5.3.1.5. Uncertainties In the inventory it is assumed that all PAH is emitted the same year as the materials are used. This is however not the case, since PAH will be emitted as long as the creosote-treated materials are in use. However, most of it is likely to be emitted during the first years.
5.3.1.6. Completeness No major missing emission components or sources are likely.
5.3.1.7. Source specific QA/QC There is no source specific QA/QC procedure for this sector. See section 1.5 for the description of the general QA/QC procedure.
5.3.2. Tarry jointing paste
5.3.2.1. Description Tarry jointing paste is resistant to oil and fuels, and is therefore used in concrete constructions where spills of such products can occur, e.g. in joints in bridges, auto repair shops and airports. Tarry jointing paste contains PAH-components that can evaporate to air.
5.3.2.2. Method The Norwegian institute for air research (NILU) and the Norwegian institute for water research (NIVA) (1995) have estimated an annual emission of 125 kg PAH/year. This estimation is based on imported tarry paste and a tar content of 16 per cent. This kind of jointing paste is mainly used at airports. There is no available PAH-profile for this emission, and due to the lack of data, the same PAH-profile as that of asphalt production is used (table 5.3). The emission is assumed to be rather constant each year.
Table 5.3. Emission of PAH from use of tarry jointing paste1. kg PAH/year
Norwegian standard 9815 125Borneff (PAH-6) 3LRTAP (PAH-4) 0.01 Emission factors are from production of asphalt.
5.3.2.3. Uncertainties There is uncertainty regarding the PAH-profile since in lack of a specific profile, the same PAH-profile as for asphalt production is used.
5.3.2.4. Completeness There are a couple of very minor sources of PAH that are not included in the Norwegian inventory. PAH-containing products are used in tar paper and fishing nets. According to NILU/NIVA (1995), the annual emissions are low. In Rypdal and Mykkelbost (1997), emission factors of 0.3 g/tonnes and 28 g/tonnes are given for tar paper and fishing net respectively, but emissions from these sources are not included in the inventory. Also anticorrosive paint used for treatment of ships and platforms is a potential source of PAH emissions. In Rypdal and Mykkelbost (1997), emission factors of 7.5 mg/ship/year at shipyard, 1.9 mg/ship/year at harbour and 96 mg/ship/year in

Documents 21/2011 The Norwegian Emission Inventory 2011
Statistics Norway 141
service are given. This presupposes treatment every third year. The emissions are low compared to other sources, and are not included in the inventory.
5.3.2.5. Source specific QA/QC There is no source specific QA/QC procedure for this sector. See section 1.5 for the description of the general QA/QC procedure.
5.4. Production of asphalt IPCC - NFR 3C Last update: 01.09.05
5.4.1. Method PAH Most of the asphalt produced in Norway uses the batch-method (Haakonsen et al. 1998). Emissions are calculated by multiplying the amount of asphalt produced with an emission factor. Dioxins Asphalt preparations and asphalt recycling are supposed to be a possible dioxin source, especially in countries using extensive recycling, and that use salt on the roads during winter. A lot of salt is used on Norwegian roads during winter, and when this asphalt is heated during recycling, it is assumed to give emissions of dioxins (Hansen 2000).
5.4.2. Activity data The activity data used is production of asphalt in Norway. In NILU/NIVA (1995), there is a figure of production of asphalt from 1991. The same figure is used for all years due to lack of better data.
5.4.3. Emission factors PAH NILU/NIVA (1995) estimated the emission of PAH to be 15 mg/tonne asphalt. This includes however naphthalene and other components not to be included in PAH after Norwegian standard (NS3815). However, if this emission factor is combined with speciation data from Jebsens miljøteknikk (1991), an emission factor of 2.8 mg/tonne is found. This agrees well with the emission factor 2.0 mg/tonne suggested by EPA (U.S. Environmental protection agency). Dioxins Two emission factors are found in the literature. OSPAR (The Oslo and Paris Convention) (Norwegian pollution control authority 2001) suggests an emission factor of 0.047 µg/tonne asphalt. This emission factor is however assumed to be very high since it is based on data from a plant only re-circulating old asphalt. Fyns Amt (2000) operates with a much lower emission factor, which probably reflects dioxin emissions from preparation of new asphalt. Since Norway both makes new asphalt and recycles old asphalt it is assumed that an emission factor in between those suggested from OSPAR and Fyns Amt would be most correct for Norwegian conditions (table 5.4).
Table 5.4 Dioxin emission factor for asphalt production. µg I-TEQ/tonne produced asphalt
Source Emission factorOSPAR (Norwegian pollution control authority 2001)
0.047
Fyns Amt (2000) 0.0022Emission factor chosen 0.025
5.4.4. Uncertainties The activity data used are from 1991, and due to lack of better information, the same figure has been used for all years. The emission factors used, both for

The Norwegian Emission Inventory 2011 Documents 21/2011
142 Statistics Norway
estimating PAH and dioxins, are also uncertain. The annual emissions are low however, and will not have any impact on the total level of these types of emissions.
5.4.5. Completeness No major missing emission components are likely.
5.4.6. Source specific QA/QC There is no source specific QA/QC procedure for this sector. See section 1.5 for the description of the general QA/QC procedure.
5.5. Other product use IPCC 3D NFR 3D Last update: 17.02.11
5.5.1. Use of N2O in anaesthesia
5.5.1.1. Method N2O is used in anaesthesia procedures and will lead to emissions of N2O. The figures are based on N2O data from the two major producers and importers in 2000. Annual consumption is estimated on basis of these figures and the number of births and number of bednights in hospitals for each year.
5.5.1.2. Activity data For this source, actual sale of N2O is used for the year 2000. Number of births and bednigths in hospitals are annually taken from the Statistical yearbook of Norway.
5.5.1.3. Emission factors As mentioned, no emission factors are used, since the figures are based on sales of N2O.
5.5.1.4. Uncertainties The figures are uncertain. There may be small importers not included in Statistics Norway's telephone survey in 2000, but the emissions are small, so it is believed that the uncertainty is at an acceptable level.
5.5.1.5. Completeness A minor consumption from small importers may be missing, but these probably account for an insignificant fraction of the total N2O emissions.
5.5.1.6. Source specific QA/QC There is no source specific QA/QC procedure for this sector. See section 1.5 for the description of the general QA/QC procedure.
5.5.2. Use of N2O as propellant N2O is used as a propellant in spray boxes and this use will lead to emissions of N2O. It is also used in research work, for instance in the food industry and at universities. Small amounts are used at engineering workshops, among others for drag-racing. There is no production of N2O for these purposes in Norway.
5.5.2.1. Method Information on sales volumes is reported by the plants to Statistics Norway. Statistics Norway assumes that all propellant is released to air.
5.5.2.2. Uncertainties The figures for 2000 are used for all years. It is believed that all figures from all major importers are included in the inventory.

Documents 21/2011 The Norwegian Emission Inventory 2011
Statistics Norway 143
5.5.2.3. Completeness No major missing emission components are likely.
5.5.2.4. Source specific QA/QC There is no source specific QA/QC procedure for this sector. See section 1.5 for the description of the general QA/QC procedure.
5.5.3. Mercury-containing products
5.5.3.1. Method Breakage of mercury-containing thermometers, fluorescent tubes and various measuring and analytical instruments leads to emissions of mercury. The emission estimates are based on an annual report from the Climate and Pollution Agency ("Miljøgifter i produkter"). The sale of mercury-containing thermometers and fluorescent tubes has decreased strongly since the mid-1990s, and the mercury content in these products has been reduced. A prohibition against the production, import and export of mercury-containing products entered into force in 1998, except for some thermometers for professional use, which were prohibited in 2001. Since these products have long operating life times, there will be emissions from these products for many years. In the calculations, however, it is assumed that the emissions occur the same year as the product is sold. For thermometers, it is assumed that all mercury is emitted in hospitals, despite some breakage of mercury-containing thermometers that occur in households. For fluorescent tubes, all emissions are placed in households, although emissions occur in all sectors. For measuring and analytical instruments, all emissions are placed under research and development work.
5.5.3.2. Uncertainties The emissions are assumed to be emitted the same year as the products are sold. This is not accurate, since most of these products have long operating life times. It is however impossible to predict the annual breakage and the mercury content in each of them.
5.5.3.3. Completeness No major missing emission components are likely.
5.5.3.4. Source specific QA/QC There is no source specific QA/QC procedure for this sector. See section 1.5 for the description of the general QA/QC procedure.
5.5.4. Tobacco
5.5.4.1. Method NOX, NMVOC, CO, particles, heavy metals and POPs The emission components included from the combustion of tobacco are NOX, NMVOC, CO, particles, heavy metals and POPs (Persistent organic pollutants). Emission figures have been calculated by multiplying the annual consumption of tobacco with emission factors for each pollutant. As recommended by the UNFCCC ERT (expert review team), emissions from use of tobacco are reported under NFR 3D.
5.5.4.2. Activity data The total consumption of tobacco in Norway is given by the net import of tobacco from Statistics Norway's external trade statistics.

The Norwegian Emission Inventory 2011 Documents 21/2011
144 Statistics Norway
5.5.4.3. Emission factors Table 5.5 gives emission factors used for tobacco combustion. For NOX, NMVOC and CO the emission factors are calculated by Statistics Norway, based on values given in Directorate for Health (1990).
Table 5.5. Emission factors used for tobacco combustion
Tobacco (unit/kg tobacco)
Source
NOX (kg) 0.0034652 Statistics Norway, Directorate for Health (1990) NMVOC (kg) 0.0048374 Statistics Norway, Directorate for Health (1990) CO (kg) 0.1215475 Statistics Norway, Directorate for Health (1990) TSP (kg) 0.04 TNO (Institute of environmental and energy technology
2002) PM10 (kg) 0.04 TNO (Institute of environmental and energy technology
2002) PM2.5 (kg) 0.04 TNO (Institute of environmental and energy technology
2002) Pb (g) 0.00005 Finstad et al. (2001) Cd (g) 0.0001 Finstad et al. (2001) Hg (g) 0.0001 Finstad et al. (2001) As (g) 0.000159 Finstad and Rypdal (2003) Cr (g) 0.000354 Finstad and Rypdal (2003) Cu (g) 0.000152 Finstad and Rypdal (2003) PAH (g) 0.00825 Finstad et al. (2001) PAH OSPAR (g) 0.00125 Finstad et al. (2001) Dioxins (µg) 0.0013 Finstad et al. (2002b)
5.5.4.4. Uncertainties The emissions are assumed to be emitted the same year as the products are imported.
5.5.4.5. Completeness Tobacco bought tax free abroad and tobacco smuggled are not included in the inventory.
5.5.4.6. Source specific QA/QC There is no source specific QA/QC procedure for this sector. See section 1.5 for the description of the general QA/QC procedure.

Documents 21/2011 The Norwegian Emission Inventory 2011
Statistics Norway 145
6. Agriculture IPCC 4 NFR 4
6.1. Overview Agriculture contributes particularly to CH4, N2O and NH3 emissions. Domestic animals are the major source of CH4 emissions from agriculture. Both enteric fermentation and manure management contribute to non-combustion emissions of CH4. Manure management also generates emissions of N2O. Microbiological processes in soil lead to emissions of N2O. Three sources of N2O are distinguished in the IPCC methodology and are included in the Norwegian inventory: 1. direct emissions from agricultural soils (from use of synthetic fertilisers,
animal excreta nitrogen used as fertiliser, biological nitrogen fixation, crop residues, industrial and urban wastes and cultivation of soils with a high organic content)
2. direct soil emissions from animal production (emissions from droppings on pastures)
3. N2O emissions indirectly induced by agricultural activities (N losses by volatilisation, leaching and runoff).
Animal manure and the use of fertiliser also generate emissions of NH3. Another source of NH3 is treatment of straw using NH3 as a chemical. Non-combustion emissions of particles in the agricultural sector are also calculated. There are also some emissions arising from the burning of agricultural residues described in chapter 6.5.
6.2. Emissions from enteric fermentation in domestic livestock
IPCC 4A, Key category for CH4 NFR - Last update: 31.05.10
6.2.1. Description An important end product from the ruminal fermentation is methane (CH4). The amount of CH4 produced from enteric fermentation is dependent on several factors, like animal species, production level, quantity and quality of feed ingested and environmental conditions. According to IPCC (2000) the method for estimating CH4 emission from enteric fermentation requires three basic items: 1. The livestock population must be divided into animal subgroups, which
describe animal type and production level. 2. Estimate the emission factors for each subgroup in terms of kilograms of CH4
per animal per year. 3. Multiply the subgroup emission factors by the subgroup populations to estimate
subgroup emission, and sum across the subgroups to estimate total emission.
6.2.2. Method A Tier 2 methodology is used for calculating CH4 from enteric fermentation for the main emission sources cattle and sheep. The Tier 2 methodology used is described more in detail in Appendix H. The methodology for calculating CH4 from enteric fermentation for the other animal categories is in accordance with IPCC’s Good Practice Guidance Tier 1 method (IPCC 1997b, a). The numbers of animals of each kind and average emission factors of tonnes CH4/ animal/ year for each kind of animal are used to calculate the emissions.

The Norwegian Emission Inventory 2011 Documents 21/2011
146 Statistics Norway
6.2.3. Activity data The Tier 2 method of calculation requires subdividing the cattle and sheep populations by animal type, physiological status (dry, lactating or pregnant) live weight and age. Table 6.1 describes the animal categories used for cattle and sheep in the calculations. For dairy cows, additional information from the Cow Recording System concerning annual milk production and proportion of concentrate in the diet is used (Tine BA annually). The Cow Recording System also supplies annual information about slaughter age and slaughter weight for growing cattle (Moen, pers. comm.14). Average daily weight gain (ADG) which is utilized in the calculations for growing cattle was in 2005 taken from the Cow Recording System when the Tier 2 model was developed.
Table 6.1. Categories of cattle and sheep used in the Norwegian calculations of methane emission from enteric fermentation
Categories of cattle and sheep
Dairy cows
Beef cows
Replacement heifers, < one year
Replacement heifers, > one year
Finisher heifers, < one year
Finisher heifers, > one year
Finisher bulls, < one year
Finisher bulls, > one year
Breeding sheep, > one year
Breeding sheep, < one year
Slaughter lamb, < one year. Jan- May
Slaughter lamb, < one year. Jun- Dec
The main source of the livestock statistics is the register of production subsidies. The register covers 90-100 per cent of the animal populations, except for horses and reindeer. The register is used in order to get consistent time series of data. Animals are counted twice a year and the register is updated with these counts. The average number of the two counts is used. In addition to the animals included in the register of production subsidies, an estimate of the number of horses that are not used in farming is obtained from the Norwegian Agricultural Economics Research Institute (NILF). The number of reindeer is obtained from the Norwegian Reindeer Husbandry Administration. For some categories of animals not living a whole year, for instance lambs, lifetime is taken into account to get a yearly average for the number of animals. An expert judgment suggests an average lifetime of 143 days for lambs (UMB, pers. comm15 ). The formula for calculating the average figure for lambs will then be:
(6.1) 365143
*Lambs
There are some differences between these numbers and the FAO statistics. The explanation is that the figures reported to the FAO are supplied by the Norwegian Agricultural Economics Research Institute NILF. NILF elaborates an overall calculation for the agricultural sector, which is the basis for the annual negotiations for the economic compensation to the sector. The overall calculation includes a grouping of all agricultural activities, comprising area, number of animals and production data. This method is a little different from the one used by Statistics Norway. Differences include
14 Moen, O. (annually): Personal information, email from Oddvar Moen Tine Rådgivning annually. 15 UMB (2001): Expert judgement by Department of Animal Science, Ås: Norwegian University of Life Sciences.

Documents 21/2011 The Norwegian Emission Inventory 2011
Statistics Norway 147
• Different emphasis on the dates for counting, 31.07 and 31.12 • NILF does not register pigs under 8 weeks, whilst Statistics Norway does.
6.2.4. Emission factors For cattle and sheep the following basic equation is used to calculate the CH4 emission factor for the subgroups (Tier 2): (6.2) EF = (GE · Ym · 365 days/yr) / 55.65 MJ/kg CH4 Where: EF = emission factor, kg CH4/head/yr GE = gross energy intake, MJ/head/day Ym = CH4 conversion rate, which is the fraction of gross energy in feed converted to CH4. M = animal category This equation assumes an emission factor for an entire year (365 days). In some circumstances the animal category may be alive for a shorter period or a period longer than one year and in this case the emission factor will be estimated for the specific period (e.g. lambs living for only 143 days and for beef cattle which are slaughtered after 540 days). Further description of the determination of the variables GE and Ym for the different animal categories is given in Appendix H. The emissions from domestic reindeer, deer, ostrich and fur-bearing animals are also included in the Norwegian calculations. The emission factor 19.9 kg/animal/yr has been used for domestic reindeer (Statistics Finland 2009; Swedish environmental protection agency 2009). The source of this factor is the Swedish and the Finnish emission inventories where it has been developed by a Tier 2 method. Emission factors for deer, ostrich and fur-bearing animals are developed by scaling emission factors for other animals that are assumed most similar with regard to digestive system and feeding. The scaling is done by comparing average weights of the actual animal groups. The emission factor for deer of 52.64 kg/animal/yr has been estimated by scaling the emission factor for dairy cattle, and the emission factor 4.97 kg/animal/yr for ostrich by scaling the emission factor for horses. The emission factor for fur-bearing animals is set to 0.10 kg/animal/yr, and has been estimated by scaling the emission factor for pigs. For the other animal categories the Tier 1 default emission factors for each kind of animal (IPCC 1997a) is used.
Table 6.2. Emission factors for CH4 from enteric fermentation and different animal types
Animal Emission factor (Tonnes/animal/year)Horses 0.018
Goats 0.005 Pigs 0.0015 Hens 0.00002 Turkeys 0.00002 Reindeer 0.0199
Deer 0.0526Ostrich 0.00497Fur-bearing animals 0.0001
Source: IPCC (1997b), Statistics Finland (2009), Swedish Environmental Protection Agency (2009) and Agricultural Statistics from Statistics Norway.
6.2.5. Uncertainties Activity data The uncertainty in the data is considered to be within ±5 per cent. There is also an uncertainty connected to the fact that some animals are only alive part of the year and how long this part is.

The Norwegian Emission Inventory 2011 Documents 21/2011
148 Statistics Norway
Emission factors Although the emissions depend on several factors and therefore vary between different individuals of one kind of animal, average emission factors for each kind are used in the tier 1 methodology for all animal categories except cattle and sheep, where a Tier 2 methodolgy is used . The standard deviation of the emission factors is considered to be ±40 per cent, which is the estimate from (IPCC 2006). An uncertainty estimate of ±25 per cent is used for the emission factors for cattle and sheep in the Tier 2 methodology (Volden, pers. comm.16).
6.2.6. Completeness Major missing emission sources are not likely.
6.2.7. Source specific QA/QC In 2001, a project was initiated to improve the estimate of the number of animals. This was completed in 2002. The revised data on animal populations form the basis for the emission calculations for all years. In 2005-2006, Statistics Norway and the Climate and Pollution Agency carried out a project in cooperation with the Norwegian University of Life Sciences, which resulted in an update of the emission estimations for cattle and sheep using a tier 2 method. In 2009, the emission factor for reindeer has been revised and changed to a Tier 2 factor for reindeer used by Sweden and Finland.
6.3. Emissions from manure management IPCC 4B Key category for N2O and CH4 NFR 4B Last update: 16.02.11
6.3.1. Description The relevant pollutants emitted from this source category are CH4 (IPCC 4B(a)), N2O (IPCC 4B(b)) and NH3 (NFR 4B). Emissions from cattle are most important in Norway for all three components. Organic material in manure is transformed to CH4 in an anaerobic environment by microbiological processes. The emissions from manure depend on several factors; type of animal, feeding, manure management system and weather conditions (temperature and humidity). During storage and handling of manure (i.e. before the manure is added to soils), some nitrogen is converted to N2O. The amount released depends on the system and duration of manure management. Solid storage and dry lot of manure is the most important source. Emissions of NH3 from manure depend on several factors, e.g. type of animal, nitrogen content in fodder, manure management, climate, time of spreading of manure, cultivation practices and characteristics of the soil. In the IPCC default method a NH3 volatilisation fraction of 20 per cent is used for the total N excretion by animals in the country. But in the Norwegian emission inventory, yearly updated NH3 volatilisation values from Statistics Norway's NH3 model are used, which are expected to give more correct values for Norway. The estimated national volatilisation fractions have differed between 17-20 per cent since 1990, and are now close to the IPCC default value of 20 per cent.
16 Volden, H. (2006): Personal information, email from Harald Volden 27/01-06, Ås: Norwegian University of Life Sciences.

Documents 21/2011 The Norwegian Emission Inventory 2011
Statistics Norway 149
6.3.2. Method CH4 Emissions of methane from manure are estimated using the following equation, in accordance with the IPCC Tier 2 method (IPCC 1997b, a):
(6.3) 1000
0 iiiii
MCFBVSMNE i
⋅⋅⋅⋅= * ρCH4
E: Emissions of methaneN: Population of animalsM: Production of manure (kg/animal/year)VS: Volatile solids (per cent)17
B0: Maximum methane-producing capacity (m3/kg-VS)MCF: Methane conversion factori: SpeciesρCH4: Density methane (0.662 kg/m3)
Table 6.3. Norwegian factors used to estimate CH4 from manure management in the IPCC Tier 2 method
Manure (kg/animal/day)
VS (per cent)
B0
(m3/kg-VS)
MCF (per cent)
Dairy cattle 45 9.2 0.18 8 Bulls > 1 year 35 9.2 0.21 8Heifers > 1 year 30 9.2 0.21 8Non-dairy cattle < 1 year 15 9.2 0.21 8Horses 25.5 16.4 0.21 8 Sheep > 1 year 2 19.5 0.19 5Sheep < 1 year 1 19.5 0.19 5Diary goats 1.8 23 0.19 5Other goats 1 23 0.19 5Pigs for breeding 9 9.5 0.21 8Pigs for slaughter 4.5 9.5 0.21 8Hens 0.16 15.6 0.25 8Chicks bred for laying hens 0.085 19.4 0.25 8Chicks for slaughter 0.085 19.4 0.25 8Ducks for breeding 0.17 16 0.25 8Ducks for slaughter 0.057 16 0.25 8Turkey and goose for breeding 0.7 16 0.25 8Turkey and goose for slaughter 0.29 16 0.25 8Mink, males 0.35 16 0.25 8Mink, females 0.7 16 0.25 8Fox, males 0.56 16 0.25 8Fox, females 1.12 16 0.25 8Reindeer 2 19.5 0.19 2 Deer 23.7 9.2 0.18 8Ostrich 7.05 16.4 0.21 8Source: Agricultural Statistics from Statistics Norway and Norwegian University of Life Sciences.
The factors M, VS, B0 and MCF are average factors meant to represent the whole country. The factor B0 represents the maximum potential production of methane under optimum conditions. MCF is a correction of B0 according to how the manure is handled reflecting Norwegian manure handling practices for each type of animal waste. The factors are estimated jointly by Statistics Norway and the Norwegian University of Life Sciences (Institute of Chemistry and Biotechnology, Section for Microbiology). N2O In Norway, all animal excreta that are not deposited during grazing are managed as manure. N2O emissions from manure are estimated in accordance with the IPCC default method (IPCC 1997a), but with Norwegian values for N in excreta from different animals according to table 6.4. Based on typical Norwegian feedstock ratios, the excretion of nitrogen (N) and phosphorous (P) were calculated by subtracting N and P in growth and products from assimilated N and P. The
17 Volatile solids (VS) are the degradable organic material in livestock manure (IPCC 1997b, a).

The Norwegian Emission Inventory 2011 Documents 21/2011
150 Statistics Norway
numbers were in some cases compared to numbers found in balance experiments. Norwegian values are also used for the fraction of total excretion per species for each management system (MS) and for pasture. The fractions are updated every year and are given in table 6.5. The distributions between the usage of different storage systems and pasture used in the estimations of N2O emissions are consistent with the distributions used for calculating NH3 emissions.
Table 6.4. N in excreta from different animals
kg/animal/year1
Dairy cattle 82Heifer < 1 year 29Bull < 1 year 24Heifer > 1 year 35Bull > 1 year 35Horses 50Sheep < 1 year 7.7Sheep > 1 year 11.6Goats 15.5Pigs for breeding 18.3Pigs for slaughtering2 4.4Hens 0.7Chicks bred for laying hens2 0.147Chicks for slaughtering2 0.053Ducks, turkeys/ goose for breeding2 2Ducks, turkeys/ goose for slaughtering2 0.34Mink 4.27Foxes 9Reindeer 6Deer 12Ostrich 121 Includes pasture. 2 Per stalled animal. Stall we define as the room for one animal. An animal that lives one year needs one stall the whole year. But for example in a stall (or pen) for slaughter swine you breed more than one slaughter swine per year. This means that the N in excreta for dairy cattle is from one cattle per year, but for slaughter swine is "per stalled animal equal to 2.5 slaughter swine per stall (or pen) per year. Source: Sundstøl and Mroz (1988) and estimations by Statistics Norway.
Table 6.5. Fraction of total excretion per species for each management system and for pasture 2008
Anaerobic lagoon
Liquid system Solid storage and dry lot
Pasture range and paddock
Other manure management
systemsDairy cattle 0 0.73 0.05 0.22 0Non-dairy cattle 0 0.64 0.05 0.31 0Poultry 0 0.27 0.73 0 0Sheep 0 0.25 0.30 0.45 0Swine 0 0.88 0.12 0 0Other animals 0 0.26 0.29 0.46 0
Source: Data for storage systems from Statistics Norway (2004) and Gundersen and Rognstad (2001) (poultry) and data for pasture times from (Tine BA annually) (Dairy cattle, goat), Statistics Norway's Sample Survey 2001 (Statistics Norway 2002) (non-dairy cattle, sheep) and expert judgements.
The emissions of nitrous oxide from manure are estimated using the following equation, in accordance with the IPCC Tier 2 method (IPCC 1997b, a):
(6.4) ( )[ ]{ } ⋅⋅⋅= s si s,iii EFMSNexNE
E: Emissions of N2O-N (kg N2O-N/year, N2O-N is the nitrogen amount in the nitrous oxide compound)
N: Population of animals Nex: Annual average N excretion (kg N/animal/year) MS: Fraction of total excretion per specie for each management system EF: N2O emission factor (kg N2O-N/kg N) S: Manure management system i: Species For liquid system and solid storage and dry lot a correction is made for the NH3 volatilisation from manure storage.

Documents 21/2011 The Norwegian Emission Inventory 2011
Statistics Norway 151
NH3 Statistics Norway's NH3 model is used for calculating the emissions of NH3 from manure management. The principle of the model is illustrated in figure 6.1. The storage module in the NH3 model gives the relative distribution of manure nitrogen to the different storage management systems. Total emissions from storage are estimated by multiplying the different emission factors for the storage systems by the amount of manure nitrogen for each storage system, and summarizing the results. The amount of nitrogen is estimated by the number of animals and nitrogen excretion factors for each type of animal (see table 6.4).
Figure 6.1. The principle of the NH3 model
Spreading module: Gives a relative distribution of manure on different spreading methods and loss factors for these.
Pasture data: Pasture times for different animal categories. Coupling ofloss factors.
Storage module: Gives a relative distribution of manure to different storage management systems and loss factors for these.
Animal population data:Scaling of manure amounts.
Calculated loss of NH 34 in
absolute numbers distributed om storage, spreading and pasture.
6.3.3. Activity data CH4 and N2O Emissions are estimated from the animal population. How the animal population is estimated is described in section 6.2.3. NH3 Activity data on storage systems are rare, and the only source practically available is the Sample survey of agriculture and forestry 2003 (Statistics Norway 2004) and the Statistics Norway survey of different storage systems in 2000 (Gundersen and Rognstad 2001). Data for storage systems are unavailable for other years. Analyses and estimations of the effects on emissions of the assumed changes in storage systems since 1990, show that the assumed change is of little significance to the emissions. In addition, data on animal populations are used to estimate the amounts of manure. How the animal population is estimated is described in section 6.2.3. The manure is distributed to the following storage systems categories:
• Manure cellar for slurry • Manure pit for slurry • Indoor built up/deep litter • Outdoor built up/enclosure • Storage for solid dung and urine
Each of these categories are given for all combinations of the following productions and regions:

The Norwegian Emission Inventory 2011 Documents 21/2011
152 Statistics Norway
Regions: • South-Eastern Norway • Hedmark and Oppland • Rogaland • Western Norway • Trøndelag • Northern Norway
Production: • Cattle • Pigs • Sheep and goats • Poultry • Horses, farm raised fur-bearing animals
6.3.4. Emission factors CH4 The calculated average emission factors for different animal types are shown in table 6.6. They are country specific factors, which may deviate from the IPCC default values.
Table 6.6. Average CH4 emission factors for manure management in the Norwegian method. kg/animal/day
Emission factor Dairy cattle 14.41Bulls > 1 year 13.07Heifers > 1 year 11.20Non-dairy cattle < 1 year 5.60Horses 16.98Sheep > 1 year 0.90Sheep < 1 year 0.45Dairy goats 0.95Other goats 0.53Pigs for breeding 3.47Pigs for slaughter 1.74Hens 0.12Chicks bred for laying hens 0.08Chicks for slaughter 0.08Ducks for breeding 0.13Ducks for slaughter 0.04Turkey and goose for breeding 0.54Turkey and goose for slaughter 0.23Mink, males 0.27Mink, females 0.54Fox, males 0.43Fox, females 0.87Reindeer 0.36Deer 7.58Ostrich 4.69Source: Agricultural Statistics from Statistics Norway.

Documents 21/2011 The Norwegian Emission Inventory 2011
Statistics Norway 153
N2O The IPCC default values for N2O emission factors from manure management are used in the calculations. These are consistent with the good practice guidance (IPCC 2000).
Table 6.7. N2O emission factors for manure management per manure management system
Manure management system Emission factor, kg N2O-N/kg NLiquid system 0.001Solid storage and dry lot 0.02Pasture range and paddock 0.02Source: IPCC (1997a).
NH3 Emission factors vary with production and storage system; in the model there is no variation between regions. The factors are based on data from Denmark, Germany and Netherlands, since measurements of NH3-losses in storage rooms have so far not been carried out in Norway. The factors are shown in table 6.8.
Table 6.8. Emission factors for various storage systems and productions. Per cent losses of N of total N
Storage system
Manure cellar for slurry
Open manure pit for slurry
Manure pit for slurry with lid
Open flag-stones
Indoor built up/deep litter
Outdoor built up/enclosure
Storage for solid dung and urine
Gutter Gutter Drainage to gutter
Cattle, milking cow: Loss from animal room 5 5 5 5 8 8 5Loss from storage room 2 9 2 2 15 15 15Total loss 7 14 7 7 23 23 20
Pigs:
Loss from animal room 15 15 15 15 15 15 20Loss from storage room 4 6 2 2 25 25 30Total loss 19 21 17 17 40 40 50
Sheep and goats:
Loss from animal room 15 15 15 15 15 15 15Loss from storage room 2 6 2 2 10 10 10Total loss 17 21 17 17 25 25 25
Poultry:
Loss from animal room 12 10 12 12 25 25 25Loss from storage room 15 15 15 15 25 25 25Total loss 27 25 27 27 50 50 50
Other animals:
Loss from animal room 5 0 0 0 15 15 15Loss from storage room 10 0 0 0 15 15 15Total loss 15 0 0 0 30 30 30
Source: Morken, pers. comm18.
18 Morken, J. (2003): Personal information, Ås: Department of Agricultural Engineering, Norwegian University of Life Sciences.

The Norwegian Emission Inventory 2011 Documents 21/2011
154 Statistics Norway
The factors are combined with the activity data in the Statistics Norway survey of different storage systems in 2000 (Gundersen and Rognstad 2001) and the Sample survey of agriculture and forestry 2003 (Statistics Norway 2004), and emission factors for NH3 emissions from storage of manure and stalled animals are calculated for production and region (table 6.9). To estimate losses, these emission factors are in turn multiplied with the amount of manure (based on number of animals and N-factors per animal, table 6.4). The number of animals is the only activity data that differs from year to year.
Table 6.9. Average emission factors for the manure storage systems used, distributed on type of animal production and region. Per cent of total N
South-Eastern Norway
Hedmark/Oppland
Rogaland Western Norway
Trøndelag Northern Norway
Cattle 10.1 8.4 8.0 8.0 7.7 7.9Pigs 26.2 22.1 19.8 20.3 21.0 21.2Sheep and goats 22.5 21.8 18.6 20.9 21.4 21.1Poultry 47.0 46.4 38.7 37.3 41.7 44.5Other animals 25.7 24.7 17.1 19.1 23.5 21.6Source: Statistics Norway, NH3-model estimations.
6.3.5. Uncertainties Uncertainty estimates are given in Appendix D.
6.3.5.1. Activity data CH4 The data for the number of animals are considered to be known within ±5 per cent. Other activity data are the different kinds of treatment of manure (which will determine the emission factor), which have been assessed by expert judgements. This will contribute to the uncertainty. N2O Emissions are estimated from the animal population. The data for the number of animals are considered to be known within ±5 per cent. For the emissions of N2O from manure management, Norwegian data for N in excreta are used. The nitrogen excretion factors are uncertain, but the range is considered to be within ±15 per cent (Rypdal 1999). The uncertainty is connected to differences in excretion between farms in different parts of the country, that the survey farms may not have been representative, general measurement uncertainty and the fact that fodder and fodder practices have changed since the factors were determined. There is also an uncertainty connected to the division between different storage systems for manure, which is considered to be within ±10 per cent, and the division between storage and pasture, which is considered to be within ±15 per cent.
6.3.5.2. Emission factors CH4 Norway is using the IPCC default factors (Tier 2 methodology) for the emission of CH4, but with some national data. The emission factors are considered to have an uncertainty range of ±25 per cent (Rypdal and Zhang 2000). N2O For the emission of N2O from different storage systems, IPCC default emission factors are used. They have an uncertainty range of -50 to +100 per cent (IPCC 2000) except for the storage category "daily spread" where it is not applicable. NH3 Ammonia emissions from agriculture are estimated based on national conditions. There are uncertainties in several parameters (fraction of manure left on pastures, amount of manure, conditions of storage, conditions of spreading and climate conditions. An uncertainty analysis for the revised NH3 model, which has been in

Documents 21/2011 The Norwegian Emission Inventory 2011
Statistics Norway 155
use since 2003, has not been performed. However, the revision of the model is believed to have reduced the uncertainty.
6.3.6. Completeness Major missing emission sources are not likely.
6.3.7. Source specific QA/QC In a Nordic project in 2002, the results for emissions of both CH4 and N2O from manure management in the national emission inventories have been compared with the results using the IPCC default methodology and the IPCC default factors (Petersen and Olesen 2002). This study contributed to discover differences and gaps in each of the Nordic national methodologies. Statistics Norway, in cooperation with the Norwegian University of Life Sciences (UMB), made in 2003 improvements in the calculation model for NH3 emissions from the agricultural sector. Data sources used for the recalculations in the revised NH3 model are coefficients from the Norwegian University of Life Sciences, and two surveys from Statistics Norway; a manure survey (Gundersen and Rognstad 2001) and the sample survey of agriculture and forestry (2001) (Statistics Norway 2002). Statistics Norway’s detailed manure survey gave more extended activity data which are better related to emission source categories, for manure management and spreading. New loss factors for different manure management categories are also used in the revised NH3-model. These factors are closer connected to specific activities.
6.4. Direct and indirect emissions from agricultural soils IPCC 4D, Key category for N2O NFR 4D Last update: 16.02.11
6.4.1. Description Three sources of N2O from agricultural soils are distinguished in the IPCC methodology, namely:
• Direct emissions from agricultural soils (from use of synthetic fertilisers, animal excreta nitrogen used as fertiliser, biological nitrogen fixation, crop residues, industrial and urban wastes and cultivation of soils with a high organic content);
• Direct soil emissions from animal production (emissions from droppings on pastures);
• N2O emissions indirectly induced by agricultural activities (N losses by volatilisation, leaching and runoff).
The use of synthetic fertilisers, animal excreta nitrogen used as fertiliser, and droppings on pastures also result in emissions of NH3. For the first two sources, the calculated amount of nitrogen that is emitted directly as N2O has been corrected for the nitrogen emitted as NH3.
6.4.2. Method
6.4.2.1. Synthetic fertiliser N2O The direct emissions of N2O from use of synthetic fertiliser are calculated from data on total annual amount of fertiliser sold in Norway and its nitrogen content corrected for the amount of synthetic fertiliser applied in forest. The resulting amount that is applied on agricultural fields is multiplied with the IPCC default

The Norwegian Emission Inventory 2011 Documents 21/2011
156 Statistics Norway
emission factor. The emissions are corrected for NH3 that volatilises during spreading. NH3 Statistics Norway's NH3 model (described in section 6.3.2) is used for calculating the emissions of NH3 from the use of synthetic fertiliser. The calculations of NH3 emissions from the use of synthetic fertiliser are based on the amounts of nitrogen supplied and emission factors for the percentage of nitrogen emitted as NH3 during spreading.
6.4.2.2. Manure applied to soils N2O In Norway, all animal excreta that are not deposited during grazing are used as manure and applied to soils. Further, it is assumed that animals do not emit N2O themselves, but emissions of N2O and NH3 from manure management before manure application on fields are taken into account (see section 6.3.2). The emission of N2O from manure used as fertiliser is calculated by multiplying the total amount of N in manure used as fertiliser with the IPCC default emission factor. The N2O emissions are corrected for NH3 that volatilises during spreading. NH3 Statistics Norway's NH3 model is used for calculating emissions of NH3 from spreading of manure on cultivated fields and meadow. The principle for the model is given in figure 6.1 in section 6.3.2. A spreading module in the NH3 model gives the relative distribution of manure spread as fertiliser, distributed on different spreading methods. Total emissions from spreading are estimated by emission factors for the different spreading methods multiplied by the amount of manure. The amount of manure is estimated by the number of animals and manure production factors for each type of animal.
6.4.2.3. N2O from biological nitrogen fixation Another source of N2O emissions is biological nitrogen fixation. The most important N-fixing crop in Norway is clover. The amount of nitrogen fixed by a crop is very uncertain, and it is difficult to assign a conversion factor for N2O emissions derived from nitrogen fixation (IPCC 1997b, a). The amount of nitrogen fixed is multiplied with the IPCC default emission factor.
6.4.2.4. N2O from crop residues Concerning re-utilisation of nitrogen from crop residues, there is only limited information. N2O emissions associated with crop residue decomposition are calculated by using the Tier 1b method, as described in the IPCC (IPCC 2000). Due to lack of national or default factors, factors from the Swedish National Inventory (Swedish environmental protection agency 2005) have been used for the Residue/Crop ratio for grass and green fodder, for FracDM for rapeseed, potato, roots for feed and green fodder, and for FracN for grass, rapeseed and green fodder. Factors from the Austrian National Inventory Report (Umweltbundesamt 2005) have been used for vegetables.
(6.5) ( )
−−
= iREMOVEDiBURNiNi
DMiiiCR FracFrac*Frac
*Frac*)Crop/s(Re*CropF
1
FCR = N in crop residue returned to soils (tonnes) Cropi = Annual crop production of crop i (tonnes) Res/Crop = The residue to crop product mass ratio (table 6.10) FracDM = Dry matter content (table 6.10) FracN = Nitrogen content (table 6.10) FracBURN = Fraction of crop residue burned on field FracREMOVED = Fraction of crop residue removed used as fodder and straw in animal rooms

Documents 21/2011 The Norwegian Emission Inventory 2011
Statistics Norway 157
Table 6.10. Factors used for calculation of the nitrogen content in crop residues returned to soils
Residue/Crop FracDM FracN
Grass1 0.25 0.85 0.014Wheat 1.3 0.85 0.0028Rye 1.6 0.85 0.0048Ryewheat 1.45 0.85 0.0038Barley 1.2 0.85 0.0043Oats 1.3 0.85 0.007Rapeseed 1.8 0.91 0.0107Potatoes 0.4 0.2 0.011Roots for feed 0.3 0.2 0.0228Green fodder 0.25 0.835 0.013Vegetables 0.8 0.2 0.005Peas 1.5 0.87 0.0142Beans 2.1 0.855 0.01421 Including perennial grasses and grass-clover mixtures Source: IPCC (2000), Swedish Environmental Protection Agency (2005), Umweltbundesamt (2005), Statistics Norway.
6.4.2.5. N2O from industrial and urban wastes No data are available for the amount of N in industrial waste applied as fertiliser, but this source is assumed to be very limited in Norway. Data for the N2O emission arising from sewage sludge applied on fields has been calculated by multiplying the amount of nitrate in the sewage sludge applied with the IPCC default emission factor. Statistics Norway’s waste water statistics annually gives values for the amount of sewage sludge and the fraction of the sewage sludge that is applied on fields. The N-content in the sludge is given in Statistics Norway (2001), and the same value of 2.82 per cent is used for all years.
6.4.2.6. N2O from cultivation of soils with a high organic content Large N2O emissions occur as a result of cultivation of organic soils (histosols) due to enhanced mineralization of old, N-rich organic matter (IPCC 1997b, a). The emissions are calculated using the IPCC default emission factor of 8 kg N2O-N/ha per year, and estimations of the area of cultivated organic soil in Norway. The area estimate of organic soils is based on measurements of C in the soil. National figures for the carbon content in agricultural soils is estimated on the basis of carbon and area data from a soil database by The Norwegian Forest and Landscape Institute, which covers about 50 per cent of the agricultural area in Norway. The figures are scaled up to national level by using an area resource database by The Norwegian Forest and Landscape Institute and a soil database by the Norwegian Institute for Agricultural and Environmental Research. The soil database contains results from about 600 000 soil samples. The soil samples represent about 65 per cent of the farms in Norway (Grønlund et al. 2008). The soil mapping was mainly carried out in 1994, which gives a relatively accurate figure for the area estimate this year, ca. 830 000 km2. After 1995 is the area reduced by the transition to mineral soil after that peat layer are decomposed and moor has turned unmanaged. This reduction has to some extent been counteracted by cultivation of earlier unmanaged moor. Mean area figures for the development in cultivated area after 1994 have been estimated by Bioforsk (Grønlund, pers. comm19.) based on four different estimates for reduction and new cultivation over the time period. The four scenarios were based on the assumptions of a yearly area decline of 1.4 or 1.0 per cent, and a yearly cultivation of new moor on 2 000 alternatively 4 000 dekar.
6.4.2.7. Direct soil emissions from animal production (emissions from droppings on pastures)
N2O The fraction of the total amount of animal manure produced that is droppings on pastures is given by national data for the distribution of manure to different storage systems and data for pasture times (table 6.5). The amount of N deposited during grazing is multiplied with the IPCC default emission factor. 19 Grønlund, A. (2010): Personal information, email from Arne Grønlund 16/8-2010, Ås: Bioforsk.

The Norwegian Emission Inventory 2011 Documents 21/2011
158 Statistics Norway
NH3 Statistics Norway's NH3 model is used for calculating the emissions of NH3 from pastures. Animal population data, data for pasture times, and factors for the nitrogen amount in excreta for different animal categories give the nitrogen amounts for the animal categories on pastures. Specific emission factors by animal category are used.
6.4.2.8. N losses by volatilisation Atmospheric deposition of nitrogen compounds fertilises soils and surface waters, and enhances biogenic N2O formation. Climate and fertiliser type influence the NH3 volatilisation. Deposition of NH3 is assumed to correspond to the amount of NH3 that volatilises during the spreading of synthetic fertiliser, storage and spreading of manure, and volatilisation from pastures. This amount is obtained from Statistics Norway's NH3 model. The N2O emissions are calculated by multiplying the amount of N from deposition with the IPCC default emission factor.
6.4.2.9. N2O from leaching and runoff A considerable amount of fertiliser nitrogen is lost from agricultural soils through leaching and runoff. Fertiliser nitrogen in ground water and surface waters enhances biogenic production of N2O as the nitrogen undergoes nitrification and denitrification. The fraction of the fertiliser and manure nitrogen lost to leaching and surface runoff may range from 10 to 80 per cent. IPCC (IPCC 1997b, a) proposes a default value of 30 per cent, but in the Norwegian inventory a national factor of 18 per cent is used, that is believed to give better results under Norwegian conditions. This country specific factor has been calculated based on an estimate of the amount of nitrate leaching, 33 kg N/hectare (Vagstad et al. 1998), which comes from a runoff model by the Norwegian Centre for Soil and Environmental Research. The figure is an estimated average based on measurements of N-leaching in 12 small watershed areas, and expresses the discharge to nearest surface water recipient. Behind this average figure, there is a huge variation in N-leaching, depending on weather conditions, soil types, farm practices, geographical location etc. Climate data, soil data, agricultural practices etc. are monitored closely in these 12 watershed areas. The areas are chosen so that they together make up a representative selection of Norwegian farming with regard to farming practices, geographical localization and climate and soil conditions. The amount of nitrogen lost to leaching is multiplied with the IPCC default emission factor to calculate the emission of N2O.
6.4.3. Activity data N2O The activity data significant for the estimation of direct and indirect emissions of N2O from agricultural soils and N2O emissions from pastures, and the sources for the activity data are listed in table 6.11. The calculation of emissions from use of nitrogen fertiliser is based on sales figures for each year. It was a strong price increase for nitrogen fertiliser, which caused a stock building in 2008 and corresponding lower purchases in 2009. In addition, new fertilisation standards may have brought about reduced amounts of fertiliser. To correct for this, a transfer of fertiliser use has been made from 2008 to 2009.

Documents 21/2011 The Norwegian Emission Inventory 2011
Statistics Norway 159
Table 6.11. Activity data for non-combustion emissions of N2O in the agriculture
Sources Consumption of synthetic fertiliser
Total sale of synthetic fertiliser from Norwegian Food Safety Authority (Annually). Fertilizing of forest from Statistics Norway´s Silvicultural statistics. (Statistics Norway Annually-c)
Number of animals Statistics Norway (applications for productions subsidies)
Distribution between manure storage systems Sample Survey of agriculture and forestry 2003 (Statistics Norway 2004) and Gundersen and Rognstad (2001)
Pasture times for different animal categories (Tine BA annually) (Dairy cattle, goat), Statistics Norway's Sample Survey 2001 (Statistics Norway 2002) (non-dairy cattle, sheep), expert judgements.
Biological N-fixation
Aakra and Bleken (1997)
Crop yield
Statistics Norway, agriculture statistics (Statistics Norway Annually-a)
Amount of sewage sludge
Statistics Norway, waste water statistics (annual data)
Fraction sewage sludge applied on fields
Statistics Norway, waste water statistics (annual data)
Area of cultivated organic soils
(Grønlund et al. 2008) and Grønlund, pers. comm20.
NH3 Synthetic fertiliser The Norwegian Food Safety Authority calculates a total value for annual consumption of synthetic fertilisers in Norway based on sales figures. These data are corrected for the amount of fertiliser used in forests, which is given by silviculture statistics from Statistics Norway. The silviculture statistics gives annually the weight of the fertiliser used on wet forest land (moor) and on dry forest land. An expert judgement has been made, which concludes that almost only NPK (nitrogen, phosphorus, potassium) with a nitrogen content of 15 per cent is used on wet forest land. On dry forest land it is assumed that half of the used synthetic fertiliser is NPK and the other half is fertiliser with a nitrogen content of 30 per cent (Rypdal et al. 2005). For the calculation of the emission of NH3 we need a specification of the use of different types of synthetic fertiliser. This is given by the Norwegian Food Safety Authority for the years from 2000. Due to lack of data for the years before 2000, we have to assume that the percentual distribution between the usage of different fertiliser types is the same as in 1994 for these years. Animal manure applied to soil and pasture There are several sources of activity data on spreading of manure in the NH3-model. The main sources are the manure survey in 2000 by Statistics Norway (Gundersen and Rognstad 2001), various sample surveys of agriculture and forestry 1990-2007 and the animal population. Animal population is updated annually. The animal population estimation methodology is described in section 6.2.3. Data from the manure survey do only exist for 2000, while the data from the sample surveys have been updated for several, but not all, years. Data for time on pasture and share of animals on pasture are collected from the Sample Survey in Statistics Norway 2001 and from TINE BA (TINE BA is the sales and marketing organisation for Norway's dairy cooperative and covers most of the milk production). The data from TINE BA comprises pasture data for goats and milking cows and are updated annually. All other pasture data are from the Statistics Norway Sample survey 2001. The parameters used in the calculations and their sources are shown in table 6.12.
20 Grønlund, A. (2010): Personal information, email from Arne Grønlund 16/8-2010, Ås: Bioforsk.

The Norwegian Emission Inventory 2011 Documents 21/2011
160 Statistics Norway
Table 6.12. Parameters included in the estimation of NH3 emissions from manure Parameters (input) Sources Number of animals Statistics Norway (applications for productions
subsidies)
Nitrogen factors for manure Various sources, compiled by Statistics Norway Area where manure is spread, split on cultivated field and meadow.
Statistics Norway (Sample Surveys of Agriculture, various years), Gundersen and Rognstad (2001)
Area and amount where manure is spread, split on spring and autumn.
Gundersen and Rognstad (2001)
Amount of manure is spread, split on spring and autumn.
Statistics Norway (Sample Surveys of Agriculture, various years)
Addition of water to manure Gundersen and Rognstad (2001), expert judgements, Statistics Norway’s Sample Survey 2007
Spreading techniques Gundersen and Rognstad (2001), expert judgements,
Usage and time of harrowing and ploughing. Statistics Norway (Sample Surveys of Agriculture), Gundersen and Rognstad (2001), expert judgements,
Pasture times for different animal categories
(Tine BA annually) (Dairy cattle, goats), Statistics Norway's Sample Survey 2001 (Statistics Norway 2002) (non-dairy cattle, sheep), expert judgements.
6.4.4. Emission factors N2O The IPCC default emission factor of 0.0125 kg N2O-N/kg N has been used for all sources of direct N2O emissions from agricultural soils, with the following two exceptions: Emissions of N2O from animals on pastures are calculated using the IPCC factor of 0.02 kg N2O-N/kg N, and the emissions that occur as a result of cultivation of organic soils are calculated by using the IPCC default emission factor of 8 kg N2O-N/ha per year (IPCC 2000). The IPCC default emission factor of 0.01 kg N2O-N/kg NH3-N is used to calculate emissions of N2O from deposition of N from volatilised NH3. The IPCC default emission factor of 0.025 kg N2O-N/kg N lost to leaching/runoff is used.
Table 6.13. Emission factors for NH3-N for different fertilisers
Fertiliser Emission factor ( per cent of applied N)
Urea 15Ammonium sulphate and Ammonium nitrate 5Calcium nitrate 0Calcium ammonium nitrate 1NPK (Nitrogen, phosphorus, potassium) 1Other 1
Source: ECETOC (1994) and Norsk Hydro, pers. comm.21
NH3 Synthetic fertiliser Different types of synthetic fertilisers are being used, resulting in different emissions of NH3. Their share is based on sales statistics annually given by the Norwegian Food Safety Authority for the years from 2000. For earlier years the distribution is based on data from 1994. The NH3 emission factors (per cent loss of N) for the different types of fertilisers are shown in table 6.13. Animal manure applied to soil and pasture Emission factors for spreading of stored manure vary with spreading method (Gundersen and Rognstad 2001), water content (Statistics Norway 2007), type and time of treatment of soil (Gundersen and Rognstad 2001), time of year of spreading (Gundersen and Rognstad 2001; Statistics Norway 2007), cultivation, and region. The basic factors used are shown in table 6.14.
21 Norsk Hydro (1995): Personal information, Kaarstad, Norsk Hydro.

Documents 21/2011 The Norwegian Emission Inventory 2011
Statistics Norway 161
Table 6.14. Emission factors for NH3-N for various methods of spreading of manure. Per cent of total N
Western and northern Norway
Southern and eastern Norway
Spring Summer Autumn Spring Summer Autumn
Meadow
Surface spreading 0.5 0.6 0.4 0.5 0.6 0.4
Injection 0.1 0.1 0.05 0.1 0.1 0.05
Water mixing 0.3 0.3 0.2 0.3 0.3 0.2
Dry manure 0.04 0.1 0.1 0.04 0.1 0.1
Open fields
Method Time before down-moulding Type of down-moulding
Surface spreading 0-4 hrs plow 0.2 0.2 0.15 0.3
Surface spreading + 4 hrs plow 0.5 0.35 0.4 0.4
Surface spreading 0-4 hrs harrow 0.4 0.35 0.35 0.35
Surface spreading + 4 hrs harrow 0.5 0.45 0.45 0.45
Water mixing 0-4 hrs plow 0.1 0.1 0.1 0.15
Water mixing + 4 hrs plow 0.25 0.2 0.2 0.25
Water mixing 0-4 hrs harrow 0.2 0.2 0.2 0.2
Water mixing + 4 hrs harrow 0.3 0.25 0.25 0.25
Dry manure 0.04 0.1 0.04 0.1
Source: Morken and Nesheim (2004).
Table 6.15. Average NH3 emission factors for cultivated fields and meadows after time of spreading and region. 2009. Per cent.
South-Eastern Norway
Hedmark/ Oppland
Rogaland
Western Norway
Trøndelag
Northern Norway
Field Meadow Field Meadow Field Meadow Field Meadow Field Meadow Field MeadowSpring 32.9 44.4 35.3 44.3 23.2 48.2 4.0 40.2 28.4 46.9 5.1 47.6Autumn 28.6 33.3 28.9 33.2 21.3 34.4 10.0 28.9 30.9 34.4 11.0 33.2Source: Statistics Norway, NH3-model estimations.
The factors in table 6.14 are combined with the activity data in the Sample survey of agriculture and forestry 2007 (Statistics Norway 2007) and a time series on mixture of water in manure, and emission factors for NH3 emissions from spreading of manure distributed to meadow and cultivated fields, time of season and region are calculated (see table 6.15). These factors are in turn connected to activity data that are updated in the years since 1990, i.e. number of animals (amount of manure), time of spreading and type of cultivation of the areas where the manure is spread. The emission factors used for the calculation of the NH3 emissions from grazing animals are shown in table 6.16. These are the same as the emission factors used in Germany (Dämmgen et al. 2002) and Denmark (Hutchings et al. 2001).
Table 6.16. NH3 emission factors from droppings from grazing animals on pasture. Per cent
N-loss/N appliedCattle 7.5Sheep and goats 4.1Reindeer 4.1Other animals 7.5Source: Dämmgen et al. (2002), Hutchings et al. (2001).
6.4.5. Uncertainties
6.4.5.1. Activity data There are several types of activity data entering the calculation scheme: Sales of nitrogen fertiliser: The data are based on sales figures during one year (The Norwegian Food Safety Authority). The uncertainty in the sales figures is within ±5 per cent (Rypdal and Zhang 2000). In addition comes a possible error due to the fact that sales do not necessarily equal consumption in a particular year, due to storage. The share of the various types of nitrogen fertiliser is assumed to be

The Norwegian Emission Inventory 2011 Documents 21/2011
162 Statistics Norway
the same as in an investigation in 1994, and the error connected to this approach has probably increased over the years.The effect for the uncertainty in activity data due to these two factors has not been quantified, but it is assumed that it can be more important than the uncertainty in the sales figures. NH3 losses from fertiliser containing ammonium (NH4) are related to soil pH. This could probably also lead to uncertainty, but Norwegian soils are very dominated by soils with low pH, which leads to small losses of this type. Amount of nitrogen in manure: The figures are generated for each animal type, by multiplying the number of animals with a nitrogen excretion factor. The nitrogen excretion factors are uncertain. The range is considered to be within ±15 per cent (Rypdal 1999). The uncertainty is connected to differences in excreted N between farms in different parts of the country, that the survey farms may not have been representative, general measurement uncertainty and the fact that fodder and feeding practices have changed since the factors were determined. The uncertainty connected to the estimate of the amount of manure is higher than for the amount of synthetic fertiliser used. Fate of manure: There is significant uncertainty connected to the allocation of manure between what is used as fertiliser and droppings on pastures. Atmospheric deposition of NH3: The data are based on national NH3 emission figures. These are within ±30 per cent (Rypdal 1999). Leakage of nitrogen: The upper limit for the leakage is the applied nitrogen. The uncertainty is roughly about ±70 per cent (Rypdal 1999).
6.4.5.2. Emission factors N2O Uncertainty estimates used for the N2O emission factors are given in Appendix D. NH3 The uncertainty in the estimate of emissions of NH3 from use of fertiliser is assessed to be about ±20 per cent (Rypdal and Zhang 2001). This uncertainty could be lower if better data on fertiliser composition were obtained. The uncertainty is higher for animal manure (±30 per cent (Rypdal and Zhang 2001)). This is due to uncertainties in several parameters (fraction of manure left on pastures, amount of manure, conditions of storage, conditions of spreading and climate conditions) (Rypdal and Zhang 2001). Other factors that could lead to uncertainty are variation in storage periods, variation in house types and climate, and variation in manure properties.
6.4.6. Completeness All sources described in the IPCC reporting guidelines are included in the estimates. However, the emission factors might not be reflecting national conditions.
6.4.7. Source specific QA/QC In a Nordic project in 2002, the estimates for emissions of direct and indirect N2O from agricultural soils in the national emission inventories were compared with the results using the IPCC default methodology and the IPCC default factors. The results for the Nordic countries are presented in a report (Petersen and Olesen 2002). Statistics Norway, in cooperation with the Norwegian University of Life Sciences (UMB), made in 2003 improvements in the calculation model for NH3 emissions from the agricultural sector. Data sources used for the recalculations in the revised

Documents 21/2011 The Norwegian Emission Inventory 2011
Statistics Norway 163
NH3 model are coefficients from the Norwegian University of Life Sciences, and two surveys from Statistics Norway; a manure survey (Gundersen and Rognstad 2001) and the sample survey of agriculture and forestry (2001). In 2006, the methodology used for estimating N2O from crop residues was changed to the method Tier 1b recommended in (IPCC 2000). The new method is more detailed and is supposed to better reflect the real emissions than the earlier used national method. In 2009, the earlier used constant estimate for the area of cultivated organic soils was replaced with new estimates for the whole time series. The recalculations give a decrease in N2O emissions for the whole period.
6.5. Emissions from agricultural residue burning (agricultural wastes)
IPCC 4F NFR 4F Last update: 30.11.10
6.5.1. Description Burning of agricultural residues gives emissions of a large range of standard combustion products. Included in the inventory are emissions of CH4, N2O, NOX, CO, NH3, NMVOC, SO2, particles and the heavy metals Pb, Cd, Hg, As, Cu and Cr, and PAH and dioxins.
6.5.2. Method The emissions from the burning of crop residues are being calculated in accordance with a Tier 1 approach (EEA 2009): EPollutant = ARresidue_burnt * EFPollutant EPollutant = emission (E) of pollutant ARresidue_burnt = activity rate (AR), mass of residue burnt (dry matter) EFPollutant = emission factor (EF) for pollutant
6.5.3. Activity data The annual amount of crop residue burned on the fields is calculated based on crop production data for cereals and rapeseed from Statistics Norway, and estimates of the fraction burned made by the Norwegian Crop Research Institute and Statistics Norway (section 6.4.2.4). For cereals a water content of 15 per cent is used (IPCC 1997a) and the water content for rapeseed is set to 9 per cent (Swedish environmental protection agency 2005). The activity data are consistent with the data used in the estimations of N2O from crop residues.

The Norwegian Emission Inventory 2011 Documents 21/2011
164 Statistics Norway
6.5.4. Emission factors
Table 6.17. Emission factors for agricultural residue burning.
Components Emission factors Unit SourceGreenhouse gases
CH4 2.7 kg/ tonnes crop residue (d.m.) burned
(IPCC 2006)
N2O 0.07 kg/ tonnes crop residue (d.m.) burned
(IPCC 2006)
Precursors
NOX 2.4 kg/ tonnes crop residue (d.m.) burned
(EEA 2009)
CO 58.9 kg/ tonnes crop residue (d.m.) burned
(EEA 2009)
SO2 0.3 kg/ tonnes crop residue (d.m.) burned
(EEA 2009)
NMVOC 6.3 kg/ tonnes crop residue (d.m.) burned
(EEA 2009)
NH3 2.4 kg /tonnes crop residue (d.m.) burned
(EEA 2009)
Heavy metals
Pb 0.865 g/ tonnes crop residue (d.m.) burned
(EEA 2009)
Hg 0.008 g/ tonnes crop residue (d.m.) burned
(EEA 2009)
Cd 0.049 g/ tonnes crop residue (d.m.) burned
(EEA 2009)
As 0.058 g/ tonnes crop residue (d.m.) burned
(EEA 2009)
Cr 0.22 g/tonnes crop residue (d.m.) burned
(EEA 2009)
Cu 0.354 g/ tonnes crop residue (d.m.) burned
(EEA 2009)
Particles TSP, PM10 5.8 kg/ tonnes crop residue
(d.m.) burned (EEA 2009)
PM2.5 5.5 kg/ tonnes crop residue (d.m.) burned
(EEA 2009)
POPs
PAH-total 30.0 g/ tonnes crop residue (d.m.) burned
(Norwegian institute for air research and Norwegian institute for water research
1995), (EPA 1998)PAH-6 13.9 g/ tonnes crop residue
(d.m.) burned (Norwegian institute for air research and Norwegian institute for water research
1995), (EPA 1998)PAH-4 3.0 g/ tonnes crop residue
(d.m.) burned (Norwegian institute for air research and Norwegian institute for water research
1995), (EPA 1998)Dioxins 17 iμg I-TEQ/tonnes crop
residue (d.m.) burned (Norwegian pollution control
authority 2001)
Heavy metals and POPs The emission factors recommended in EPA (2002) are used for Cu. For the other heavy metals default emission factors from the EMEP/EEA emission inventory guidebook are used (EEA 2009). The emissions of dioxins and PAH are calculated based on emission factors respectively from OSPAR (Norwegian pollution control authority 2001) and NILU/NIVA (Norwegian institute for air research and Norwegian institute for water research 1995). The emission profile used for PAH is the one presented for open burning of garden waste (EPA 1998).
6.5.5. Uncertainties Uncertainty estimates for the greenhouse gases and long-range transboundary air pollutants are given in Appendix D.

Documents 21/2011 The Norwegian Emission Inventory 2011
Statistics Norway 165
6.5.6. Completeness The main emission components from burning of agricultural residues are considered to be covered in the emission calculations.
6.5.7. Source specific QA/QC In 2002, the emissions of CH4, N2O, NOX, CO, Pb, Hg, Cd, PAHs and dioxins from agricultural residual burning were included in the Norwegian inventory, and in 2003, the emissions of particles, As, Cr and Cu were added. In 2011, also emissions of SO2, NMVOC and NH3 were included in the inventory. The time series were included but it should be noted that the figures for the earlier years have a higher uncertainty than the more recent years.
6.6. Other agricultural emission sources IPCC - NFR 4G Last update: 15.02.11
6.6.1. Description Straw treated with NH3 to be utilised as fodder is a source of NH3 emissions in Norway. Agricultural activities are also a source of non-combustion emissions of particles.
6.6.2. NH3 emissions from treatment of straw
6.6.2.1. Method Emissions of NH3 from treatment of straw depend only on the amount of NH3 used. The total amount of NH3 used for treatment of straw in Norway is multiplied with the share of the NH3 that is not integrated in the straw.
6.6.2.2. Activity data The amount of NH3 used per year is obtained from the Budget Committee for Agriculture (NILF 2010). The area of cultivated fields is annually updated from Statistics Norway’s agriculture statistics.
6.6.2.3. Emission factor It is estimated that 65 per cent of the NH3 applied is not integrated with the straw, and is therefore emitted after the treatment (Morken 2003). The same estimation is being used in Denmark.
6.6.2.4. Uncertainties Uncertainty in the estimate of emissions from NH3 treatment of straw is rather low (±5 per cent) (Rypdal and Zhang 2001).
6.6.2.5. Completeness Major missing emission components are not likely.
6.6.2.6. Source specific QA/QC There is no source specific QA/QC procedure for this sector. See section 1.5 for the description of the general QA/QC procedure.
6.6.3. Particle emissions from the agricultural sector Agriculture is responsible for various types of non-combustion emissions of particles. This is for example dust from crops that are harvested, soil dust from work with agricultural machines, wood particles from felling of trees etc.
6.6.3.1. Method Due to the relatively few analyses of particle emissions from agriculture, the calculations from this source are limited. Emission figures for three types of non-combustion emissions of particles from the agriculture are calculated; emissions

The Norwegian Emission Inventory 2011 Documents 21/2011
166 Statistics Norway
from reaper, and from loading and transport on the fields. The total grain cultivation area in Norway is multiplied with emission factors, which gives emissions per area unit. For other actual activities in the agricultural fields, no emission factors have been found.
6.6.3.2. Activity data The total grain cultivation area in Norway is used as activity data. Data source used is statistics from Statistics Norway on the area on holdings used for grain seeds.
6.6.3.3. Emission factor The emission factors used are shown in table 6.18. These factors refer to wheat cultivation, but they are used for all grain cultivation in Norway. The factors are based on measurements of particles with a diameter less than 7 µm. No measurements have been made for estimating the ratio between PM2.5, PM10 and TSP. Therefore the estimation has been made that the calculated emission figures (in reality PM7) is PM10 = PM2.5 = TSP.
Table 6.18. Emission factors for non-combustion emissions of particles from the agricultural sector. g/km2
Emission source Reaper 170Loading 12Transport 110Source: EPA (1998).
6.6.3.4. Uncertainties No uncertainty analysis has been made for this source. The few studies made in this field give a relatively high uncertainty for this source.
6.6.3.5. Completeness The information about this emission source is poor, and it is likely that there are more particle sources from the agricultural sector than included here.
6.6.3.6. Source specific QA/QC There is no source specific QA/QC procedure for this sector. See section 1.5 for the description of the general QA/QC procedure.

Documents 21/2011 The Norwegian Emission Inventory 2011
Statistics Norway 167
7. Waste IPCC 1A and 6 NFR 1A1a
7.1. Overview This sector includes emissions from landfills (6A), waste water handling (6B), and small-scale waste incineration (6C). Emissions from waste incineration included here are emissions from flaring, except flaring from energy sectors, emissions from cremation and hospital waste (until 2005), emissions from car fires, house fires, emissions from recovering processes in the waste trade, and emissions from combustion of hazardous waste (6D). Emissions from waste incineration from plants with energy utilization are accounted for under 1A (Energy combustion).
7.2. Solid waste disposal on land IPCC 6A, Key category for CH4 NFR 6A
7.2.1. Managed waste disposal on land IPCC 6A1 NFR 6A1 Last update: 31.05.11
7.2.1.1. Description CH4 and non-fossil CO2 are emitted during biological decomposition of waste. This transformation of organic matter takes place in several steps. During the first weeks or months, decomposition is aerobic, and the main decomposition product is CO2. When there is no more oxygen left, the decomposition becomes anaerobic, and methane emissions start to increase. After a year or so, CH4 emissions reach a peak, after that the emissions will decrease over some decades (Jensen et al. 1999; Barlaz 2004). The emissions of methane have decreased considerably since 1990 due to reduction of the amount of degradable waste disposed at disposal sites. This reduction in emissions is the result of several measures which were introduced in the waste sector, particularly in the 1990s. With a few exceptions, it is prohibited to dispose easily degradable organic waste, sewage sludge included, at landfills in Norway. In 1999 a tax was introduced on waste delivered to final disposal sites. In 2009 this tax was 447 NOK per tonne waste disposed at landfill sites with double side and bottom lining and 583 NOK per tonne waste disposed at landfills without double lining. From July 1 2009 it is prohibited to deposit degradable organic waste to landfills and this will result in reduced methane emissions. Because of this, the tax was reduced to 275 NOK per tonne waste in 2010. However, there is a possibility of exemption from the prohibition of depositing waste at landfills – in such cases the tax is 455 NOK per tonne waste. In addition to the policy measures described above, landfills receiving biodegradable waste (waste containing degradable organic carbon (DOC)) are required to collect and treat landfill gas. In 2009 a total of 79 landfills had installed a landfill gas extraction system, and almost 21 ktonnes of methane were recovered. In addition, the amounts of waste recycled have increased significantly since 1990. The total amount of waste generated has increased by about 45 per cent from 1995 to 2007, but due to the increase in material recycling and energy utilization in the period there has not been a similar increase in degradable waste to landfills.

The Norwegian Emission Inventory 2011 Documents 21/2011
168 Statistics Norway
7.2.1.2. Method CH4. Norway uses the IPCC Waste model for estimating CH4 emissions from SWDS (solid waste disposal sites) (Tier 3). This is a FOD (first order decay) spreadsheet model based on waste composition data. The amounts of different types of degradable waste material (food, paper, wood, textile and plastic) in MSW (municipal solid waste) are entered separately into the model. The model starts with the calculation of the amount of dissimilating DDOCm (mass of dissimilable organic carbon = the part of DOC (degradable organic carbon) that will dissimilate (degrade) under anaerobic conditions) contained in the amount of material being landfilled. As this is a first order reaction, the amount of product formed will always be proportional to the amount of reactant. This means that it is of no concern to the process when the DDOCm came into the landfill. As far as we know the amount of DDOCm in the landfill at the start of the year, all years can be considered to be the first calculating year. This simplifies calculations. With reaction start set to be on January 1 the year after landfilling, the “motor” of the new calculating model has been made out of these two very simple equations: (7.1) DDOCmdiss = (DDOCma(ly) + DDOCmd) * (1- e^-k) (7.2) DDOCma = (DDOCma(ly) + DDOCmd) * e^-k. Equation (7.1) calculates DDOC mass dissimilating (DDOCmdiss), from the not dissimilated DDOC mass accumulated from last year (DDOCma(ly)), plus DDOC mass landfilled last year (DDOCmd). Equation (7.2) calculates the DDOC mass accumulated as not dissimilated (DDOCma), for next year’s calculations from the same basis as equation (7.1). After that the amount of dissimilated DDOCm has been found, CH4 produced and CH4 emitted is found by using the same set of procedures and factors as in the former model. The full set of equations is found below. If the reaction is set to start in the year of landfilling, separate calculations have to be made for that year and two extra calculating equations will have to be added. They are included in the equations below. To calculate DDOCmd from the amount of material: (7.3) DDOCmd = W * MCF * DOC * DOCf To calculate DDOCm accumulated in the SWDS: (7.4) DDOCml = DDOCmd * e^-k*((13-M)/12) (7.5) DDOCma = DDOCma(ly) * e^-k + DDOCml To calculate DDOCm dissimilated: (7.6) DDOCmdi = DDOCmd * (1-e^-k*((13-M)/12)) (7.7) DDOCmdiss = DDOCma(ly) * (1-e^-k) + DDOCmdi To calculate methane produced from DDOC dissimilated: (7.8) CH4 prod = DDOCmdiss * F * 16/12 To calculate methane emitted:

Documents 21/2011 The Norwegian Emission Inventory 2011
Statistics Norway 169
(7.9) CH4 emitted in year T = (∑ CH4 prod (T)) - R(T)) * (1-OX) Where: W : amount landfilled MCF : Methane Correction Factor M : Month number for reaction start. (January 1, year after landfilling,
M=13) DOC : Degradable Organic Carbon DOCf : Fraction of DOC dissimilating, anaerobic conditions DDOC : Dissimilatable Organic Carbon, anaerobic conditions DDOCmd : DDOC mass landfilled DDOCml : DDOC mass left not dissimilated from DDOCm landfilled, year of
landfilling DDOCma : DDOC mass left not dissimilated at end of year DDOCma(ly): DDOC mass accumulated from last year DDOCmdi : DDOC mass dissimilated from DDOCm landfilled, year of landfilling DDOCmdiss : DDOC mass dissimilated in calculation year CH4 prod : CH4 produced F : Fraction of CH4 by volume in generated landfill gas 16/12 : Conversion factor from C to CH4 R(T) : Recovered CH4 in year of calculation OX : Oxidation factor (fraction).
7.2.1.3. Activity data The methane is formed by decomposition of biological waste in landfills. The decomposition time varies from material to material. Easily degradable waste (food, etc.) has the shortest decomposition time, while wood waste has the longest decomposition time. Other materials do not emit methane at all, either because they are inorganic (metal, glass, etc.) or because they break down extremely slowly (plastic). It is therefore of vital importance for the calculations that the waste quantities used as input to the model are correct, both total quantity and the distribution by material. Data on the amount of different waste materials is taken from Statistics Norway's waste accounts. Statistics Norway's waste accounts consist of data from several sources, such as special surveys, register data and statistics, sorting analyses, indirect data sources such as production statistics, foreign trade statistics and different factors combined with activity data. Data from all these sources are put together and used in the waste accounts, which give an overview of waste quantities in Norway, divided into type of product, material, industry and method of treatment. Historic data have been recalculated from the former waste category basis, to a waste material basis. The amount of each material type deposited is estimated based on surveys and sorting analyses. The model is based on types of waste materials, for instance food waste, paper, wood and textiles. All sources of waste, MSW, industrial, commercial, construction and demolition waste are accounted for in these annual surveys. Municipal landfills Historical data for the years before 1973 on municipal solid waste deposited are based upon: 1. New statistics on municipal waste, divided into household waste and industrial waste (1974 to 1997) 2. Estimates based on population 3. The assumption that less people were connected to public waste management during the forties and fifties.

The Norwegian Emission Inventory 2011 Documents 21/2011
170 Statistics Norway
Since 1974, the amount of municipal waste is based upon questionnaires and linear interpolation. Surveys were held in 1974, 1980 and 1985. The amounts of waste deposited at landfills are allocated to material based on sorting analyses. For the period 1995-2009 the amounts of waste are taken from the waste accounts, with three exceptions:
• The content of wood in woodcontaining sludge deposited at industrial sites is added to the amount of deposited wood from the waste accounts. The amount of woodcontaining sludge deposited at industrial sites decreased to 0 in year 2000.
• Textiles are supposed to consist of 50 per cent plastic (Norwegian pollution control authority 2005b). The plastic fraction of deposited textiles is therefore subtracted from the amount of deposited textiles and added to deposited plastic.
• The material category “Other” is supposed to contain 13 per cent biodegradable waste, which is added to the amount of paper.
Linear interpolation of the amount of waste deposited has been applied for the period 1985 to 1995. Industrial disposal sites Historical data for industrial waste for years before 1970 are made by extrapolation, using the same trend as for municipal waste. After 1970, literature studies and information from the industrial waste study from the years 1993, 1996, 1999 and 2003 have been used. Linear interpolation is used for the years where data are missing. Data from each landfill site with methane recovery units are compiled by the county governors and reported to the Climate and Pollution Agency. These data are imported into the national model for calculating methane from landfills.
7.2.1.4. Emission factors The emission factors used in the Norwegian model are a mixture of country-specific factors and IPCC default values. Table 7.1 shows some of the variables used in the calculations of methane emissions from solid waste disposals.
Table 7.1. Variables used in the calculations of methane from landfills
Description Type of waste
Variables Food waste Paper Wood Textilest1/2 Half life time 3.7 years 11.6 years 23.1 years 11.6 yearsDOC 0.150 Mg/Mg 0.400 Mg/Mg 0.400 Mg/Mg 0.400 Mg/MgDOCf Part of DOC dissimilating 0.5 0.5 0.5 0.5Ox. Methane oxidized in top layer 0.1 0.1 0.1 0.1F. Part of methane in generated landfill gas 0.5 0.5 0.5 0.5Source: The Climate and Pollution Agency (Norwegian pollution control authority 2005b) and Skullerud (2006).
7.2.1.5. Uncertainties The amount of different waste materials is considered to be known within ±20 per cent. The emission factors used are considered to have the uncertainty range ±30 per cent. More information about the uncertainty estimates for this source is given in Appendix D. The importance of the uncertainties in calculations of methane from landfills will decrease with decreased source contribution and improved IPCC default parameter values, but most likely it will still remain among the main uncertainties in the Norwegian GHG inventory. The methodology Statistics Norway/the Climate and Pollution Agency use to calculate methane emissions from landfills is identical for the whole time series.

Documents 21/2011 The Norwegian Emission Inventory 2011
Statistics Norway 171
The quality of the activity data used in the model has been improved in the last years. This is also the case regarding the data for recovered methane.
7.2.1.6. Completeness Major missing emission sources are not likely.
7.2.1.7. Source specific QA/QC Internal checks of time series for all emission sources are made every year when an emission calculation for a new year is performed. Internal checks of time series of waste data, methane recovered at landfill sites and calculated methane emissions from the model are carried out and corrections are made if any kind of errors are found. If there is a change in the trend of methane recovered from a landfill site, the site is contacted to identify a plausible explanation. Corrections are made if there is no plausible explanation of the change.
7.2.2. Unmanaged waste disposal sites IPCC 6A2 NFR 6A2 Last update: 01.09.05 In Norway landfilling of solid waste has been regulated and controlled for some decades, and unmanaged landfills are from before 1970. Furthermore, the methane emissions for all years have been calculated from the total amounts of landfilled materials. Therefore Norway does not separately report emissions from unauthorized/unmanaged SWDSs.
7.3. Waste water handling IPCC 6B, Key category for N2O NFR 6B Last update: 18.03.10
7.3.1. Method CH4 Emissions of methane from domestic and commercial waste water have been calculated. Emissions from water consumption in food processing industries (breweries, dairies and slaughterhouses) are included for all years since 1990. Emissions of methane from industries with their own waste water treatment plants are small, because the plants are mainly aerobic or the methane gas is being recovered. CH4 from domestic sludge is calculated together with the waste water emissions. Emissions of methane from domestic waste water are calculated according to the IPCC default methodology: (7.10) MCFBDNE ii ∗∗∗= 0 E: Emissions of methane N: Population in Norway D: Organic load in biochemical oxygen demand (kg BOD/1000 persons/year)B0: Maximum methane-producing capacity (kg CH4/kg DC) MCF: Methane conversion factor i: Year Emissions of methane from water consumption in each food processing industry are calculated using the same equation as for domestic water, except that COD is estimated based on water consumption multiplied with mg COD/litre wastewater.

The Norwegian Emission Inventory 2011 Documents 21/2011
172 Statistics Norway
(7.11) Ei = Wi * CODi * B0* MCF E: Emissions of methane W: Water consumption/economic turnover (mill. NOK) COD: Organic load in chemical oxygen demand (kg COD/unit wastewater) B0: Maximum methane-producing capacity (kg CH4/kg DC) MCF: Methane conversion factor i: Industry N2O For this source emissions of nitrous oxide from domestic and commercial wastewater have been calculated. Before 2008, only N2O emissions from the part of the population and the part of the industry connected to large waste water treatment plants (>50 pe) have been estimated. As recommended by the IPCC review team Norway now estimates N2O emissions from human sewage which is not treated in sewage treatment plants. Emissions of N2O from industries with their own waste water treatment plants are not estimated. N2O emissions from the part of the population and the part of the industry connected to large treatment plants (>50 pe) are calculated from nitrification/ denitrification that occurs in the pipelines and the N2O emissions that occur as a by-product in biological nitrogen-removal plants. This is assumed to be a more precise method than the recommended IPCC method that is based on the annual per capita protein intake. The N2O from sewage sludge applied on fields is included under Agriculture in chapter 6. For the part of the population connected to treatment plants (> 50 pe), the N2O emissions are estimated like this: N2O emissions from pipelines: N2O(S) = Nsupplied to pipelines x 0.01 x 1.57 For the part of the population that is connected to large treatment plants the N2O emissions are calculated by multiplying the total amount of nitrate supplied to the pipelines by the IPCC default emission factor of 0.01 kg N2O-N/kg sewage-N produced. Conversion factor of N2O-N to N2O is 1.57 N2O emissions in biological nitrogen removal plants: N2O(S) = Nremoved x 0.02 x 1.57 It is assumed that 2 per cent of the nitrogen removed from plants will form N2O. This country-specific emission factor is given in Norwegian pollution control authority (1992), and the assumption is based on measurements in plants and comparisons with factors used in Sweden. The amount of N removed is multiplied with 0.02 and then multiplied with the factor of 1.57 for conversion of N-removed to N2O-N For the part of the population that is not connected to large treatment plants, the N2O emissions are estimated as recommended by the IPCC review team. The IPCC method based on the annual per capita protein intake is being used. Emissions of N2O from the part of the population not connected to large waste water plants (> 50 pe) are estimated by Tier 1 method, using the equation: N2O(S) = Protein x FracNPR x NRPEOPLE x EF6 N2O(s): N2O emissions from human sewage (kg N2O -N/ yr) Protein: annual per capita protein intake (kg/person/yr)

Documents 21/2011 The Norwegian Emission Inventory 2011
Statistics Norway 173
NRPEOPLE : number of people not connected to treatment plants EF6: emission factor (default 0.01 (0.002-0.12) kg N2O -N/kg sewage- N
produced) FracNPR: fraction of nitrogen in protein (default = 0.16 kg N/kg protein)
7.3.2. Activity data CH4 Data for the number of people in Norway are taken from Statistics Norway's population statistics. Population for a year is calculated by the average of the population at the beginning of the year and the end of the same year. The IPCC default value of 18 250 kg BOD/1000 persons/year is used for D, the degradable organic component in the waste, for all years. Industrial wastewater from breweries, dairies and slaughterhouses are released into domestic sewer systems. Emissions of methane from industries with their own wastewater treatment plants are small, because the plants are mainly aerobic or the methane gas is being recovered. Norway estimates emissions of CH4 from food processing industries. The estimations are based on water consumption, in NACE 15 (SIC2002, which now has been replaced by NACE 10/11 in SIC2007) for the year 2004 (Stave 2006) and information from the national accounts on gross values from industry (NACE 15 (SIC2002) or NACE 10/11 (SIC2007)) in constant 2000 prices for the period 1990 to 2009. Data for the economic turnover in million NOK for each industry are taken from Statistics Norway’s national accounts on gross values from industry (NACE 10/11 (SIC2007)). N2O A yearly estimate for the amount of nitrate supplied to the pipelines is obtained from Statistics Norway’s waste water statistics. These figures are used for estimating N2O emissions from the part of the population and the part of industry connected to large waste water treatment plants. Data on the amount of nitrogen that is removed in the biological step in the actual waste water plants is obtained from Statistics Norway’s waste water statistics. An overview of plants that remove nitrogen is given by the Climate and Pollution Agency. Data on the number of people in Norway connected to waste water treatment plants are obtained from Statistics Norway’s waste water statistics. We know the number of inhabitants connected to large treatment plants (>50 pe) for the years after 1990, and the number of inhabitants connected to small treatment plants (<50 pe) for the years after 2002 We have also received the percentage connected for 1990, which were 75 per cent. For the years between 1990 and 2002 the percentage connected has been interpolated. The number of people connected to different treatment systems each year is calculated by the average of the number of people connected at the beginning of the year and the end of the same year.
7.3.3. Emission factors CH4 The IPCC emission factor for B0 of 0.6 kg CH4/kg DC is used. The methane conversion factor (MCF) is, according to good practice, given by the fraction of BOD that will ultimately degrade anaerobically. Country-specific MCF factors are estimated by Statistics Norway for the years after 2000, based on the part of the population connected to tanks with anaerobic conditions. The factors are from Statistics Norway’s waste water statistics, and correspond to the fraction of the

The Norwegian Emission Inventory 2011 Documents 21/2011
174 Statistics Norway
waste water plants that are categorized as "Sealed tank", “Sealed tank for black water” and partly the category "Separate toilet system". The MCF factor is about 0.01 (1 per cent) for the years after 2000. We assume that in 1990, 2 per cent of the population was connected to anaerobic treatment systems for waste water and that the share gradually has decreased until 2000. From our best knowledge, we therefore assume that the MCF factor of 0.02 is reflecting the condition in 1990 and that the factor for 1990 is consistent with the calculated factors for the years after 2000. Emissions from water consumption in food processing industries are calculated using the average MCF factor (0.01) for wastewater. The IPCC emission factor for B0 of 0.6 kg CH4/kg DC is used. The COD factors for the different groups are taken from IPCC 2006 and some are average factors made by Statistics Norway, based on the water consumption and gross values from industry in 2004. We know the water consumption per economic turnover. The same factor is used for all years for the different products (table 7.2). Table 7.2 also shows the default COD factors for the different products. COD factors for manufacture of animal feeds and dry general food products are the average of all the others.
Table 7.2. The developed water consumption coefficients and chemical oxygen demand. m3/mill NOK and mg/l
m3/mill NOK COD mg/l
Manufacture of meat products and cooking oil 125 2.9
Manufacture of fish products 476 2.5
Manufacture of fruit, vegetables and
grain mill products 499 5.2
Manufacture of dairy products 314 1.5
Manufacture of animal feeds 154 2.72
Manufacture of dry general food products 170 2.72Manufacture of beverages 317 1.5Source: IPCC (2006) and Statistics Norway
N2O For the part of the population and the part of the industry that are connected to large treatment plants, the N2O emissions are calculated by multiplying the total amount of nitrate supplied to the pipelines by the IPCC default emission factor of 0.01 kg N2O-N/kg sewage-N produced. Conversion factor of N2O-N to N2O is 1.57. N2O emissions also occur as a by-product in biological nitrogen removal plants. It is assumed that 2 per cent of the nitrogen removed from plants will form N2O (country-specific EF). The amount of N removed at the plants is multiplied with 0.02 and then multiplied with the factor of 1.57 for conversion of N-removed to N2O-N. For the part of the population that is not connected to large treatment plants, the emission factors are as follows: The IPCC emission factors for EF6 of 0.01kg N2O/kg sewage -N produced are used, and the fraction of nitrogen in protein, FracNPR, is 0.16 kg N/kg protein. Protein is annual per capita protein intake (kg/person/yr). A report from the Directorate for Health and Social Affairs estimates the amount of daily per capita protein intake for Norway for 1997 (Johansson and Solvoll 1999). There has not been done any other survey like this, where the daily per capita protein intake for Norway has been estimated. In 1997 the daily per capita protein intake for Norway was 86 grammes, which gives 31.39 kilos per year. For the years 1990, 1995, 2000, 2003, 2004 and 2005 the Directorate for Health and Social Affairs has estimated the potential protein intake for the population (Directorate for Health and Social Affairs 2006).

Documents 21/2011 The Norwegian Emission Inventory 2011
Statistics Norway 175
The estimation is based on the equation: Potential protein intake = production + import - export This estimation does not reflect that the actual consumption is lower because not everything is eaten. Parts of the food end up as waste and so on. Norway uses an estimated protein intake of 31.39 kilos per person for 1997 and the trend in potential protein intake when making the time series. Statistics Norway has estimated the intermediate years by interpolation. This is based on recommendations from the Directorate for Health and Social Affairs (Johansson, pers. comm22). This is shown in table 7.3
Table 7.3 Potencial protein intake, and estimated protein intake. g/person/day, kg/person/year.1990-2009
Year Potencial protein
intake g/person/day kg/person/year Index 1997 =100 Estimated protein
intake kg/person/year
1990 94 34.3 100.2 31.51991 93.8 34.2 100.0 31.41992 93.6 34.2 99.8 31.31993 93.4 34.1 99.6 31.31994 93.2 34.0 99.4 31.2
1995 93 33.9 99.1 31.11996 93.4 34.1 99.6 31.3
1997 93.8 34.24 100 31.391998 94.2 34.4 100.4 31.51999 94.6 34.5 100.9 31.7
2000 95 34.7 101.3 31.82001 96 35.0 102.3 32.12002 97 35.4 103.4 32.5
2003 98 35.8 104.5 32.8
2004 101 36.9 108,07 33.92005 100 36.5 107.0 33.62006 102 37.2 109.1 34.22007 112 40.9 119.8 37.620081 112 40.9 119.8 36.620091 112 40.9 119.8 37.6
Numbers in bold in column 2 are from the Directorate for Health and Social Affairs, 2006 (2006) 1Estimates for 2007 are also used for 2008 and 2009, due to lack of newer data.
7.3.4. Uncertainties Uncertainty estimates for this source are given in Appendix D.
7.3.5. Completeness Major missing emission components are not likely.
7.3.6. Source specific QA/QC There is no source specific QA/QC procedure for this sector. See section 1.5 for the description of the general QA/QC procedure.
7.4. Waste incineration IPCC 1A1a, 1A2d and 6C NFR 1A1a, 1A2d and 6C Last update: 14.03.11
7.4.1. Description Emissions from waste incineration in district heating plants are reported under energy (IPCC 1A1a), as the energy is utilised, and therefore described in section 3.2.2. In 2009, there were 15 waste incineration plants where household waste is incinerated. In addition, some incineration plants burn waste other than household waste, mainly wooden waste, paper, pasteboard and cardboard. These emissions are reported and
22 Johansson, L. (2005): Personal information by telephone, Directorate for Health and Social Affairs.

The Norwegian Emission Inventory 2011 Documents 21/2011
176 Statistics Norway
described under energy (IPCC 1A2d). Waste, other than household waste, is also used as energy source in some manufacturing industries. In this chapter, the focus will be on waste reported in IPCC sector 6C. This includes emissions from flaring, except flaring from energy sectors, and emissions from cremation and hospital waste until 2005.
7.4.2. Method Emissions from flaring of landfill gas are estimated. However, CO2 emissions from flaring of landfill gas are not included in the inventory, as these are considered as being of biogenic origin. The emissions are estimated by multiplying the amount of gas flared with the emission factors shown in table 7.4. Emissions from cremation and hospital waste are estimated by emission factors multiplied with activity data. For hospital waste, the emissions of heavy metals used in the model are reported to the Climate and Pollution Agency. Since 2006 all hospital waste is incinerated at waste incineration plants.
7.4.3. Activity data Landfill gas The total amount of landfill gas extracted each year is reported by landfill owners to the Climate and Pollution Agency. Statistics Norway subtracts the amount utilized for district heating and thermal power, which is given by the energy statistics in Statistics Norway. Information on the amount flared is given by the Climate and Pollution Agency. Natural gas The amount of natural gas flared by the production of methanol is, as recommended by the IPCC review team, reported under 2B5. Hospital waste The amount of hospital waste was reported to Statistics Norway for the years 1998 and 1999. For the period 1990-1997 the average for 1998 and 1999 has been used. After 1999 there has been no collection of hospital waste data. Due to the lack of better information, the waste amount for 1999 has been used to calculate the emissions for subsequent years. The hospital incinerators have gradually been closed down, mainly due to new emission limits. Since 2006, no hospital incinerators have been in operation. Today hospital waste is incinerated in incinerators for municipal waste and emissions are included under 1A1a. Cremation The number of cremated bodies is gathered by the Ministry of Culture and published in Statistics Norway’s Statistical Yearbook.

Documents 21/2011 The Norwegian Emission Inventory 2011
Statistics Norway 177
7.4.4. Emission factors
Table 7.4. Emission factors for flare of landfill gas, cremation and hospital waste incineration
Component Flare landfill gas kg/tonnes
Cremation Tonnes/body
Hospital waste Tonnes/tonnes
SO2 0.02 0.00001813 0.0014 CO2 0 0 0.3 CO 0.04 0.000735 0.0028 NOx 0.17 0.0000441 0.0014 Particles PM10 0.14 2.54E-08 0.0005 TSP 0.0005 PM2.5 0.0005 NMVOC 0 0.0000637 0.0007 CH4 0.37 0.00001176 0.00023 N2O 0.0015 0.0000147 0.000035 kg/body mg/tonne Pb NA 1.86E-08 Plant-specific emission factors Cd NA 3.11E-09 Plant-specific emission factors Hg NA 0.005 Reported Cu NA 7.70E-09 2594.6 Cr NA 8.44E-09 4705.6 As NA 1.10E-08 1272.4 Dioxins NA 9.99E-09 0.29685 PAH NA 0.0343 2.5 PAH-4 NA 0.01127 0.04 PAH-Ospar NA 0.00049 0.9 NA=Not Applicable.
7.4.5. Uncertainties Uncertainty estimates for greenhouse gases and long-range transboundary air pollutants are given in Appendix D.
7.4.5.1. Activity data No new data on amounts of hospital waste have been reported since 1999. The amount of hospital waste the subsequent years may vary from the data reported in 1998 and 1999. Since 2006, no hospital incinerators have been in operation.
7.4.5.2. Emission factors If the composition of the hospital waste is different to the waste the emission factors are based on, the calculated emissions will be incorrect. Combustion engineering and processes also influence the emissions. These uncertainties have not been calculated.
7.4.6. Source specific QA/QC There is no source specific QA/QC procedure for this sector. See section 1.5 for the description of the general QA/QC procedure.
7.5. Other emission sources from the waste sector IPCC - NFR 6D Last update: 18.03.10
7.5.1. Description Other emission sources included in the waste sector are emissions from car fires, house fires, emissions from recovering processes in the waste trade, and emissions from combustion of hazardous waste.
7.5.2. Method
7.5.2.1. Car and house fires Particles, heavy metals and POPs Emissions of particles and dioxins are calculated for car fires and house fires. In addition, heavy metals are calculated for house fires. Emissions are calculated by multiplying the annual number of car and house fires with emission factors. Four

The Norwegian Emission Inventory 2011 Documents 21/2011
178 Statistics Norway
types of buildings are separated with different emission factors: detached houses, undetached houses, apartment buildings and industrial buildings.
7.5.2.2. Waste trade NH3, particles, heavy metals and POPs Emissions from recovering processes in the waste trade include emissions of NH3, particles, heavy metals and PAH. The emission figures are reported annually by the actual plants to the Climate and Pollution Agency.
7.5.3. Activity data
7.5.3.1. Car and house fires Data on the number of car and house fires are provided annually by the Directorate for Civil Protection and Emergency Planning. These figures only include fires reported to the fire service.
7.5.4. Emission factors
7.5.4.1. Car fires The emission factor for particles is given by EPA (2002). EPA recommends the factor of 0.9 kg/car for combustion of wrecked cars without car tyres, and a factor for combustion of car tyres of 1.4 kg/car. This results in an overall emission factor of 2.3 kg/car. The emission factor for emission of dioxins from car fires is found in Hansen (2000).
7.5.4.2. House fires It is difficult to estimate the amount of material burned in a house fire. In Finstad et al. (2002b) a calculation was made that has been used to scale the chosen emission factors, to reflect how much of the building that is lost in a fire. This scaling calculation is based on the amount of damage estimated in monetary value, and value on how much of the building and the furniture that is burned. The emission factors used for particles in the inventory are given by scaling the emission factors used for combustion of fuelwood in the households (Haakonsen and Kvingedal 2001). The emission factors for heavy metals are given by scaling the emission factors for combustion of wood waste in the industry (EPA 2002). For dioxins, OSPAR (Norwegian pollution control authority 2001) gives the emission factor of 170 µg I-TEQ per tonne burned material. The scaled emission factors used for the different building types are given in table 7.5.
Table 7.5. Emission factors used for car fires and house fires, unit/fire
Car Detached house Undetached house
Apartment building
Industrial building
TSP (kg) 0.0023 0.14382 0.06162 0.04378 0.02723PM10 (kg) 0.0023 0.14382 0.06162 0.04378 0.02723PM2.5 (kg) 0.0023 0.14382 0.06162 0.04378 0.02723Pb (g) 0.00042 0.00018 0.00013 8E-05Cd (g) 0.00085 0.00036 0.00026 0.00016Hg (g) 0.00085 0.00036 0.00026 0.00016As (g) 0.00135 0.00058 0.00041 0.00025Cr (g) 0.00129 0.00055 0.00039 0.00024Cu (g) 0.00299 0.00128 0.00091 0.00057Dioxins (µg) 0.047 1.43817 0.61621 0.43779 0.27234

Documents 21/2011 The Norwegian Emission Inventory 2011
Statistics Norway 179
8. Recalculations The Norwegian greenhouse gas emission inventory has in 2011 been recalculated for the entire time series 1990-2008 for all components and sources, to account for new knowledge on activity data and emission factors and to correct for discovered errors in the calculations. There is also a continuous process for improving and correcting the inventory and the documentation of the methodologies employed, based on questions and comments received in connection with the annual reviews performed by UNFCCC. The figures in this inventory are therefore, as far as possible, consistent through the whole time series. The driving force for making improvements in the emission inventory is to meet the reporting requirements in the UNFCCC Reporting Guidelines on Annual Inventories as adopted by the COP by its Decision 18/CP. In addition, it is important for decision makers and others to have accurate emission estimates as basis for making decisions of what measures to introduce to reduce emissions. The most important recalculations for greenhouse gases in the 2011 submission are
1. The introduction of a new emission factor for CO2 from combustion of waste for 1996 and later years has caused emission increases in the order of 128-253 000 tonnes CO2 for these years. The impact on total CO2 emissions from this change increases successively from 0.3 per cent in 1996 to 0.6 per cent in 2008
2. Emissions of CH4 from gas distribution have for the first time been included in the inventory. The emissions are, however, small, 30 tonnes CH4 at most
3. A revision in the model estimating emissions from road traffic has caused changes in emissions of CH4 and N2O for all years. The emissions have increased in the first years in the period and decreased from 1996 (CH4) and 1993 (N2O). Concerning impact on national totals, the largest increase for CH4 is 0.3 per cent in 1990 and the largest decrease 0.3 per cent in 2004-2008. For N2O the corresponding figures are 0.2 per cent increase in 1990 and 2.4-2.7 per cent decrease in 2005-2008
4. CH4 emissions from 6A Solid waste disposal on land have been revised for the whole time period. The emissions have been reduced for all years. The annual percentage reduction increased from 0.06 per cent in 1990 to 1.5 per cent in 2006. The reduction in 2007 and 2008 was 1.3 and 0.8 per cent, respectively. The impact of the change on total national CH4 emissions rose from 0.02 per cent in 1990 to 0.4 per cent in 2006
5. Reported emissions of CO2 for some large plants in 1A2d Pulp, paper and print have been replaced by figures calculated from reported energy use. The changes vary for different years, but are most important for 1993 and 1994, where the impact on total emissions is a reduction of 0.3 and 0.5 per cent, respectively.
A reallocation of emissions from exploration and extraction drilling at moveable installations used in oil and gas production from 1A3d National navigation to 1A1c Manufacture of solid fuels and other energy industries has led to changes in both these groups, but has not had any effect on national totals. Emissions connected to sailing of movable installations are still included in 1A3d National navigation.
8.1. Specific description of the recalculations
8.1.1. Energy Most of the recalculations have been performed for 2008, because the energy figures for 2008 used in the previous inventory were preliminary. There will always be some changes in the energy figures, e.g. some figures on energy use in manufacturing industries will be adjusted, which will lead to adjustments in other

The Norwegian Emission Inventory 2011 Documents 21/2011
180 Statistics Norway
sectors, as total use of oil products must sum up to national sales. Now the final figures for energy use are available and are used in the emission calculations. Changes in the emission figures due to such changes in the energy statistics will not be commented on specifically under each IPCC code. In the following, reported emissions are emissions calculated by the plants and reported to the Climate and Pollution Agency, whereas calculated emissions are emissions calculated by Statistics Norway, based on figures on energy use reported to Statistics Norway. 1A 1a Public electricity and heat production
• New data. A new district heating plant has been included in the inventory for the years 2005-2008.
• Revised method. Previously, emission figures for CO2 and CH4 from district heating plants were a mixture of figures reported by the plants to Climate and Pollution Agency and figures calculated by Statistics Norway from energy use (mainly waste). Now all emissions are calculated, which results in minor emission changes for most years.
• Revised emission factor. The emission factor for CO2 from combustion of waste has been changed for the years after 1996. The emission factor has increased from 251 to 541.7 kg CO2 per tonne waste. The emissions of CO2 have increased by 0.3 to 0.6 per cent, or 128 to 253 ktonnes, for the years after 1996. The change in emission factor is the main cause for the increase, but also other changes recorded under 1A1a contribute.
• Revised data. Figures on combustion of waste at one district heating plant 2005-2007 have been revised.
• Correction of error: All combustion emissions from one plant in 2007 have been removed because there was no activity at the plant. The emission figures were earlier erroneously included.
• Correction of error. One district heating plant was wrongly assumed to be closed in 2007 and 2008. Accordingly, the emission figures were in the previous inventory erroneously excluded, but are now included in the inventory.
1A 1c Manufacture of solid fuels and other energy industries
• Reallocation. Emissions from exploration and extraction drilling at moveable installations used in oil and gas production have been moved from 1A3d Navigation, to 1A1c. This has led to increased emissions of all compounds in the source category 1A1c.
1A 2a Iron and steel • Revised data. Reported CO2 figures for one plant have been revised for
1990-1992, 1994-1997 and 2002-2004. For most years there has been an emission decrease in the order of 2-3 000 tonnes, but for 2002 and 2003 there has been an increase of 9 500 - 10 100 tonnes.
1A 2 c Chemicals
• Revised data. Figures on use of LPG for combustion at one plant 1990-1998 have been added, whereas LPG figures for 1999-2003 have been reduced. This causes changes in emissions of CO2 and CH4. For CH4 the emissions are increased by 7-14 tonnes in 1990-1998 and reduced by 3-6 tonnes in 1999-2003.
• Reallocation. For one plant, parts of the use of fuel gas in 2006-2008 have been reallocated from boilers to flaring. This implies a reallocation of emissions from 1A2c to 2B5.4 Industrial processes: Chemical industry - plastic. The CO2 emissions are in the order of 72-75 000 tonnes annually.
• Correction of error. A previous double counting for one plant in 1991 has been corrected, causing a reduction in CO2 emissions at 17 600 tonnes and also minor reductions for CH4 and N2O.
1A 2 d Pulp and paper.

Documents 21/2011 The Norwegian Emission Inventory 2011
Statistics Norway 181
• New method. Previously, reported figures of CO2 were used for some of the largest plants. Since some of these figures seemed to deviate considerably from figures based on reported energy use, all reported figures have been replaced by figures calculated from figures on reported energy use. The largest emission reductions have taken place in 1993 and 1994 (123 200 and 172 000 tonnes respectively). In 1992, 1995 and 2000 there have been reductions in the order of 18-47 000 tonnes, whereas the emissions in 1998 and 2002 have increased by 22-23 000 tonnes. For other years there have been smaller increases or decreases.
• Revised data. Use of special waste 2005-2008, which previously not has been included in the energy data, has been added, causing emission increases in the order of 6 400 – 45 300 tonnes CO2. The increases have partly been counteracted by decreases caused by the change in method mentioned above.
• Revised data. Figures on use of wood waste at one plant 2007-2008 have been somewhat increased, causing minor increases in emissions of CH4 and N2O.
• Reallocation. Due to new revised standard for industry classification (Nace rev. 2 http://www.ssb.no/emner/10/01/nos_sn/ ), emissions from publishing, which previously were included in 1A2d, have been transferred to 1A4a Commercial/Institutional.
• Correction of error. Due to minor double countings at some plants in 1990, there are small reductions in the emissions of CO2, CH4 and N2O (3 000 tonnes CO2).
1A 2 f Other
• Revised data. For three rock wool producing plants, reported CO2 figures replace previously calculated figures. For most years, the emission figures have been changed. The largest reduction has taken place in 2000 (4 700 tonnes) and the largest increase in 2008 (9 000 tonnes).
• Revised data. Use of special waste at one plant in 2008, previously not included in the energy data used in the calculations, has been added, causing emission increases for CH4 and N2O.
• Reallocation. Due to new revised standard for industry classification (Nace rev. 2 http://www.ssb.no/emner/10/01/nos_sn/ ) recovery plants has been moved from C Manufacturing to E Water supply; sewerage waste management and remediation activities. Emissions from recovery plants are now reported under 1A4A Commercial/Institutional.
• Correction of error: Previously wrongly calculated figures on emissions of CH4 and N2O from one plant in 1991 have been removed, since there was no activity at the plant this year.
1A 3a Civil aviation
• Revised data. The figures on the use of jet fuel in 2008 have been revised, causing a reduction in the emissions of CO2, CH4 and N2O (16 600 tonnes CO2).
1A 3 b i-iii Road transport
• New model. A new model for calculating emissions to air (HBEFA) from road traffic has been incorporated. The time series for N2O and CH4 emissions from road traffic have thus been recalculated. There have been some changes in the activity data, e.g. a new data source on annual driving lengths has been utilised and more detailed information on traffic activity has been taken into account. The largest differences in calculated N2O and CH4 emissions are, however, due to changes in emission factors. The changes are most prominent for petrol cars, where both components are adjusted upwards in the beginning of the time series (1990-1997 for CH4 and 1990-1995 for N2O) and downwards for the remainder of the time

The Norwegian Emission Inventory 2011 Documents 21/2011
182 Statistics Norway
series, and for heavy duty diesel vehicles, where the time series has been adjusted downwards for all years.
N2O and CH4 emissions are no longer corrected for total fuel sales, because the emissions are more strongly dependent on mileage than on fuel consumption. There are no changes in the time series for CO2 emissions, as these emissions are still based on total sales of energy goods to road traffic.
• Revised data. The consumption of auto diesel includes a certain amount of biodiesel. The emission factor for CO2 is reduced to account for this effect. Due to revised figures on total sales of auto diesel for the year 2008, the emission factor for CO2 has been upwards adjusted.
1A 3d National navigation
• Revised emission factor. Some natural gas is combusted in ferry transportation and offshore supply ships; the CH4 emission factors used are based on the following emission factors:
Methane emission factors for gas operated vessels.
Vessel category Methane emission factor (kg CH4 / tonnes LNG)
Methane emission factor (kg CH4/ 1000
Sm3 LNG)Ferry (currently lean burn engines only) 44 32Offshore supply ship (Currently dual fuel engines only) 80 59Source: Bremnes Nielsen and Stenersen (2010) and estimations from Statistcs Norway.
From the year 2000, when the first gas fired vessel started operating, a mean factor for all ships weighted after consumption data for the different ship categories (ferries and supply ships) are calculated. Ferry consumption data used in the calculations are given by the Directorate of Public Roads (Norddal 2010). This has given higher emissions for the years 2003-2006 and lower emissions for the years 2000-2002 and 2007-2008 (earlier used factor was 40.029 kg CH4/ 1000 Sm3 LNG for all ship types).
• Reallocation. Emissions from exploration and extraction drilling at
moveable installations used in oil and gas production have been moved from 1A3d to 1A1c, Manufacture of Solid Fuels and Other Energy Industries. This has led to decreased emissions of all compounds from national navigation. Emissions connected to sailing of movable installations are still included in 1A3d.
1A 3 e Other (snow scooters, boats, motorized equipment) • Revised data. The number of snow scooters in 2007 and 2008 have been
revised, which causes increased CO2 emissions (1 700 and 2 500 tonnes, respectively, in 2007 and 2008).
• Revised emission factor. For snow scooters we use the same emission factors for CH4 as for mopeds. A revision of these factors has caused an emission increase for snow scooters for the whole period 1990-2008. The increase grows through the period, from 25 tonnes CH4 in 1990 to 89 tonnes in 2008. For 2007 and 2008, a part of the increase is due to the revised figures on numbers, described above.
1A 4 a Commercial/institutional: Stationary
• Revised data. Figures on use of special waste for one plant have been increased 2003-2008 and somewhat adjusted for another plant in 2003, 2004 and 2007. The effect of the changes is annual emission increases in the order of 12-52 000 tonnes CO2.
• Revised data. New figures on use of recovered methane from landfills have caused minor changes in emission figures for CH4 and N2O in 2006-2008.
• Reallocation: Due to a revised standard for industry classification (Nace rev. 2 http://www.ssb.no/emner/10/01/nos_sn/) stationary emissions from publishing, previously reported under 1A2d Pulp, paper and print, are now reported under 1A4a Commercial/Institutional.

Documents 21/2011 The Norwegian Emission Inventory 2011
Statistics Norway 183
• Reallocation. Due to a revised standard for industry classification (Nace rev. 2 http://www.ssb.no/emner/10/01/nos_sn/ ) stationary emissions from recovery plants , which recycle waste and scrap, have been moved from 1A2f, Manufacturing industries - other, to 1A4a Commercial/Institutional.
1A 4 b Residential
• Revised activity data. For the years 2005-2008 the amount of wood burned in private households has been revised. CH4 emissions from the residential sector have increased by 270 tonnes (4 per cent) in 2007 and less than 2 per cent in 2005, 2006 and 2008.
1A 4 c Agriculture/Forestry/Fishing
• Correction of error. For 2006 the amount of LPG in the agricultural sector has been increased, causing an emission increase of 8 400 tonnes CO2.
1A 5a Other – military stationary
• Revised data. Revised data on stationary military energy use have caused minor emission reductions in 2003 and 2004 and increases in 2007 and 2008.
1A 5b Other – military mobile
• New model. Emissions from military road transport have been changed in the same way as other road transport, described under 1A3b Road transport.
• Revised data. Revised data on military energy use in air and sea transport in 2008 have caused increased emissions, respectively 39 000 and 69 000 tonnes CO2.
• Revised data. From 2008, a new data source has been used for military use of auto diesel in motorized equipment. This has caused considerably higher emissions from this source compared with figures in the previous submission (14 000 tonnes CO2 in 2008), and also a conspicuous break in time series between 2007 and 2008.
1B 2b Natural gas - gas distribution
• New data. For the first time, emissions of CH4 from distribution of natural gas have been estimated. In the period 1994-2002 the annual emissions are estimated to be 1-2 tonnes CH4, and for later years 29-30 tonnes.
1B 2c1 Venting and flaring; venting combined
• Reallocation. Reported CO2 emissions (106 500 tonnes) from one plant in 2008 have been reallocated from 1B2aiii Oil and natural gas – transport to 1B2c1iii Oil and natural gas – venting combined.
8.1.2. Industrial processes 2 B5.4 Plastic
• Reallocation. For one plant, parts of the use of fuel gas in 2006-2008 have been reallocated from boilers to flaring. This implies a reallocation of emissions from 1A2c Chemicals to 2B5.4. The CO2 emissions are in the order of 72-75 000 tonnes annually.
2 C 1 Iron and steel production
• Revised data. For one plant, reported CO2 figures have been increased in the order of 1 500 – 3 800 tonnes for the years 1990-2001 and 2006.

The Norwegian Emission Inventory 2011 Documents 21/2011
184 Statistics Norway
2 C 2 Ferroalloys production • Revised data. Reported CO2 figures for one plant have been revised for
2006-2008, causing annual emission reductions in the order of 1 500 - 1 600 tonnes CO2.
2 C 3 Aluminium production
• Revised data. The reported CO2 figure in 2008 for one plant has been revised, increasing the emissions by 24 400 tonnes.
8.1.3. Solvents and other product use 3 A-D Solvents
• Revised method and activity data. Due to methodological changes in the model for NMVOC emissions from solvent use (induced by revision of the standard industrial classification (SIC), from SIC 2002 to SIC 2007) and some revisions in activity data, the indirect CO2 emissions from the use of solvents have decreased in the years 2005-2008. The decreases amount to less than 10 000 tonnes of CO2 annually.
8.1.4. Agriculture 4D Emissions from agricultural soils
• Revised activity data. There was a strong price increase for nitrogen fertiliser, which caused a stock building in 2008 and corresponding lower purchases in 2009. The calculation of N2O emissions from use of nitrogen fertiliser is based on sales figures for each year. In addition, new fertilisation standards may have brought about reduced amounts of fertiliser. To correct for this there has been a transfer of fertiliser from 2008 to 2009 in the calculations. This has resulted in a major reduction in the N2O emissions from this source in 2008.
• Revised activity data. New time series for the area cultivated organic soil
has given a growing decrease in estimated N2O emissions for the period 1995-2008. Soil mapping was mainly carried out in 1994. After 1995 the area is reduced by the transition to mineral soil after that peat layer are decomposed and moor has turned unmanaged. This reduction has to some extent been counteracted by cultivation of earlier unmanaged moor. Mean area figures for the development in cultivated area after 1994 have been estimated by Bioforsk (Grønlund, pers. comm .) based on four different estimates for reduction and new cultivation over the time period.
• Revised activity data. Revised data for sewage sludge applied on fields in
2008 has given a minor increase in the N2O emissions. 4D Emissions from agricultural soils and 4F Burning of crop residues
• Revised activity data. Revised data for crop production in 2008 has given minor increases in the N2O emissions from crop residues and from burning of crop residues for all components.
4F Burning of crop residues
• Revised emission factors. Emission factors from the 2006 IPCC guidelines for national greenhouse gas inventories (IPCC 2006) have been used, which have given minor decreases in the CH4 emissions and minor increases in the N2O emissions for the whole time series.
8.1.5. Waste 6 A Solid waste disposal on land
• Revised activity data. For the years after 2006 reported figures on disposed waste in Statistics Norway’s waste statistics have replaced estimates based on projections from 2005.

Documents 21/2011 The Norwegian Emission Inventory 2011
Statistics Norway 185
• Revised activity data. A significant amount (about 50 000 to 60 000 tonnes) of the category "other materials" was previously registered as “landfilled”, for the whole time period 1990-2008. This amount is now registered as "other or unspecified handling". It is assumed that this waste is used as filling compound. 13 per cent of this amount is considered to be biodegradable, and given the same half time as paper.
8.2. Implications of the recalculations for the greenhouse gases
8.2.1. Implications for emissions levels Table 8.1 shows the effects of recalculations on the emission figures for CO2, CH4 and N2O 1990-2008. Table 8.2 shows the effect on recalculations on the emission figures for HFCs, PFCs and SF6 1990-2008.
Table 8.1. Recalculations in 2011 submission to the UNFCCC compared to the 2010 submission. CO2, CH4 and N2O. Tonnes CO2-equivalents
CO2 CH4 N2O
2010 submission
2011 submission
Difference (%)
2010 submission
2011 submission
Difference (%)
2010 submission
2011 submission
Difference (%)
1990 34802.2 34794.7 0.0 4655.3 4665.6 0.2 4719.5 4728.7 0.21991 33379.5 33342.5 -0.1 4697.2 4707.1 0.2 4574.2 4581.8 0.21992 34206.7 34152.2 -0.2 4756.4 4762.2 0.1 4013.9 4015.8 0.01993 35918.5 35797.0 -0.3 4821.2 4824.3 0.1 4238.7 4232.7 -0.11994 37879.2 37704.5 -0.5 4890.1 4891.8 0.0 4331.7 4323.8 -0.21995 37801.1 37776.5 -0.1 4865.0 4864.1 0.0 4393.2 4378.4 -0.31996 40890.8 41022.7 0.3 4877.9 4872.6 -0.1 4440.2 4417.5 -0.51997 41002.6 41129.6 0.3 4893.3 4886.9 -0.1 4443.9 4416.0 -0.61998 41143.6 41305.4 0.4 4759.6 4749.5 -0.2 4490.4 4454.1 -0.81999 42004.5 42153.2 0.4 4609.5 4596.6 -0.3 4698.3 4655.2 -0.92000 41589.2 41738.8 0.4 4738.2 4722.9 -0.3 4479.8 4433.3 -1.02001 42937.6 43107.8 0.4 4744.8 4726.2 -0.4 4394.0 4337.3 -1.32002 42052.9 42246.6 0.5 4573.7 4553.0 -0.5 4582.4 4521.5 -1.32003 43379.6 43602.0 0.5 4663.1 4642.9 -0.4 4427.4 4360.9 -1.52004 43831.2 44041.4 0.5 4637.1 4617.0 -0.4 4581.9 4511.0 -1.52005 42822.4 43281.3 1.1 4443.7 4424.6 -0.4 4676.4 4575.6 -2.22006 43234.7 43511.0 0.6 4307.6 4282.7 -0.6 4321.9 4222.1 -2.32007 45087.0 45298.8 0.5 4445.2 4423.3 -0.5 4150.3 4057.4 -2.22008 44156.4 44417.8 0.6 4313.7 4296.9 -0.4 3768.0 3571.1 -5.2

The Norwegian Emission Inventory 2011 Documents 21/2011
186 Statistics Norway
Table 8.2. Recalculations in 2011 to the UNFCCC submission compared to the 2010 submission. HFCs, PFCs and SF6. Ktonnes CO2-equivalents
HFCs PFCs SF6
2010 submission
2011 submission
Difference (%)
2010 submission
2011 submission
Difference (%)
2010 submission
2011 submission
Difference (%)
1990 0.02 0.02 -100.00 3370.40 3370.40 0.00 2199.78 2199.78 0.001991 0.11 0.11 0.04 2992.92 2992.92 0.00 2079.15 2079.15 0.001992 0.34 0.34 0.00 2286.92 2286.92 0.00 705.03 705.03 0.001993 2.42 2.42 0.00 2297.72 2297.72 0.00 737.71 737.71 0.001994 9.21 9.20 -0.01 2032.47 2032.47 0.00 877.98 877.98 0.001995 25.82 25.82 0.00 2007.74 2007.74 0.00 607.79 607.79 0.001996 52.24 52.24 0.00 1829.08 1829.08 0.00 574.10 574.10 0.001997 86.52 86.52 0.00 1632.94 1632.94 0.00 579.86 579.86 0.001998 129.82 129.82 0.00 1485.53 1485.53 0.00 726.74 726.74 0.001999 180.56 180.56 0.00 1388.46 1388.46 0.00 873.96 873.96 0.002000 238.36 238.36 0.00 1317.90 1317.90 0.00 934.42 934.42 0.002001 303.71 303.71 0.00 1328.63 1328.63 0.00 791.20 791.20 0.002002 362.68 362.68 0.00 1437.60 1437.60 0.00 238.30 238.30 0.002003 402.84 402.84 0.00 909.10 909.10 0.00 234.86 234.86 0.002004 439.42 439.42 0.00 879.94 879.94 0.00 276.05 276.05 0.002005 481.80 481.80 0.00 828.65 828.65 0.00 312.03 312.03 0.002006 520.24 520.24 0.00 742.49 742.50 0.00 212.09 212.09 0.002007 565.00 565.00 0.00 820.91 820.91 0.00 76.24 76.24 0.002008 623.91 623.92 0.00 772.74 772.74 0.00 65.40 65.40 0.00
Table 8.3. Trends in emissions 1990-2008. 2011 submission compared to 2010 submission. GHG. Per cent change 1990-2008
Total GHG CO2 CH4 N2O PFCs SF6 HFCs
2011 submission 8.02 27.66 -7.90 -24.48 -77.07 -97.03 3 404 0642010 submission 7.95 26.88 -7.34 -20.16 -77.07 -97.03 3 404 063
8.2.2. Implications for emission trends In this submission compared to the 2010 submission, CO2 emissions have increased for 1996 and later years, mainly because of a new, higher emission factor for combustion of waste. Emissions of CH4 and N2O have decreased for most of the years in the period. The changes are largest for N2O, due to lower emissions from road traffic. A recalculation of emissions from agricultural soils in 2008 has caused a particularly strong reduction for this year. The emission trend for total greenhouse gas emissions from 1990 to 2008 shows a somewhat larger increase in the 2011 submission compared with the 2010 submission, due to a larger growth in CO2 emissions in the period. For CH4 and, particularly, N2O, the emission trend shows larger reductions in the 2011 than in the 2010 submission, mainly due to changes in emission trends for road traffic. For HFCs, PFCs and SF6 there are only a few insignificant differences between the emissions in the 2010 and 2011 submissions.
8.3. Overall description of the recalculations for the long-range transboundary air pollutants
As part of the continual process of improving the emission estimates, the Norwegian emission inventory has been recalculated. The process involves correcting discovered errors and utilising new or improved information where this has become available. The entire time series 1990-2008 are recalculated when the method for a certain source category is revised. The figures in the inventory are therefore, as far as possible, consistent through the whole time series. The most important recalculations in the 2011 submission are:
1. Emissions from road traffic: A new model for calculating emissions to air
(HBEFA) from road traffic has been incorporated. The time series for NOX, NMVOC, CO, NH3 and particle emissions from road traffic has thus been recalculated. There have been some changes made to the activity

Documents 21/2011 The Norwegian Emission Inventory 2011
Statistics Norway 187
data, e.g. a new data source on annual driving lengths has been utilised and more detailed information on traffic activity has been taken into account.
2. National navigation; Revised emission factors have been developed by Marintek, and give lower values for NOX emissions from gas engines. For particulate matter, revised emission factors for oil based fuels (marine gas oil, light fuel oils, heavy distillate, heavy fuel oil) and LNG have resulted in higher emissions.
3. Production of aluminium; Revised emission data for PAHs from aluminium production for the period 1995 to 2005. Emissions now contain both the emissions of particle bound PAHs and PAHs in the gas phase. The time series for lead, cadmium, arsenic, chromium mercury and copper from aluminium production for the period 1990 to 2008 have been revised. The figures reported now also include emissions from consumption of anodes in the industry.
4. Due to a new calculation method, NOx emissions from production of silicon metal have increased for the whole time period. The largest increase has taken place for the most recent years, due to an increasing shift from production of FeSi to silicon metal.
In combination with some minor changes from other sources, the recalculations have caused several large changes in the emission figures, see tables 8.4-8.6. Due to major changes in both actual emission figures and emission trend for road traffic, there has also been a dramatic trend change for total NOx emissions, see table 8.7. Compared with the previous submission, total NOx emissions in 1990 have been reduced by 12 800 tonnes, whereas the 2008 emissions have increased by 14 900 tonnes.
8.4. Specific description of the recalculations
8.4.1. Energy Energy figures for the last year in the previous submission (2008) have been extensively revised, because the energy figures for 2008 used in the previous inventory were preliminary. There will always be some changes in the energy figures for the last year, e.g. some figures on energy use in manufacturing industries will be adjusted, which will lead to adjustments in other sectors, as total use of oil products in the energy accounts sum up to national sales of petroleum products. Now the final figures for energy use are available and are used in the emission calculations. Changes in emission figures caused by such revisions will not be commented on specifically under each NFR code. 1A 1a Public electricity and heat production
• New data. Another district heating plant has been included in the inventory for the years 2005-2008
• Revised data. Former calculated emissions of cadmium from burning of wood waste at one district heating plant for the years 2002 -2008 have been replaced by reported emissions. This has led to lower emissions for all years
• Revised data. Figures on combustion of waste at one district heating plant 2005-2007 have been revised.
• Revised data. There are some minor changes in reported figures for arsenic in the period 2006-2008
• Revised data. Revised emission figures for one plant for SO2 in 2007-2008 and NOx in 2008
• Correction of error: All combustion emissions from one plant in 2007 have been removed because there was no activity at the plant. The emission figures were earlier erroneously included
• Correction of error. One district heating plant was wrongly assumed to be closed in 2007 and 2008. Accordingly, the emission figures were in the

The Norwegian Emission Inventory 2011 Documents 21/2011
188 Statistics Norway
previous inventory erroneously excluded, but are now included in the inventory
• Correction of error. Emission figures for SO2, NOx and CO at one plant, which previously by mistake were not included, have been added into the inventory.
1A 1c Manufacture of Solid Fuels and Other Energy Industries
• Revised emission factors. Factors for particulate matter from combustion of marine diesel at mobile installations used in production and exploration of oil and gas are based on measurements performed by Marintek and literature sources. The revised factors have given an increase in the emissions of particulate matter for the whole time series, ranging from 56 to 145 tonnes annually. See comments on revised emission factor under 1A3d
• Reallocation. Emissions from moveable installations used in oil and gas exploration and extraction have been moved from 1A3d to 1A1c. This has led to increased emissions of all compounds in the source category 1A1c. Some examples on how this influences the inventory: for 2000; 8 440 tonnes of NOX are now reported under 1A1c which earlier where reported under 1A3dii. 603 tonnes NMVOC, 217 tonnes SO2, 340 tonnes PM10 and between 1 and 12 kilos heavy metals have been moved from 1A3dii to 1A 1c
• Reallocation. There has been a minor reallocation of NOx emissions between natural gas and (auto) diesel in 2000-2008 for one plant and in 2008 for another
• Reallocation. NOx emissions from one plant 2007-2008 have been reallocated from 1B2ai to 1A1c.
1A 2 c Chemicals
• Revised data. The inclusion of new figures on use of special waste 2005-2008 at one plant in 1A2d causes a shift between 1A2c and 1A2d for reported SO2 emissions, since the plant has activities in both these groups
• Revised data. Figures on use of LPG for combustion at one plant 1990-1998 have been added, whereas LPG figures for 1999-2003 have been reduced. This causes corresponding changes in emissions of many compounds
• Reallocation. Some use of blast furnace gas at one plant 2006-2008 has been reallocated from boilers to flaring, which causes a corresponding reallocation of emissions between 1A2c and 2B5a
• Correction of error. The NOx figure for one plant in 2008 has been somewhat increased.
1A 2 d Pulp and paper
• Revised data. Previously not included figures on use of special waste 2005-2008 at one plant have been added. This causes increase in emissions and also reallocation of SO2 emissions between 1A2c and 1A2d, since the plant has activities in both these groups
• Revised data. There has been a minor increase in the use of wood waste at one plant in 2007 and 2008
• Reallocation. Due to new revised standard for industry classification (Nace rev. 2 http://www.ssb.no/emner/10/01/nos_sn/ ), emissions from publishing, which previously were included in 1A2d, have been transferred to 1A4a Commercial/Institutional
• Correction of error. For 1990, there has been a minor decrease in all emissions except NH3, due to a previous double counting.

Documents 21/2011 The Norwegian Emission Inventory 2011
Statistics Norway 189
1A 2 f Other manufacturing • Revised data. A previously not included figure on use of special waste in
2008 at one plant has been added. • Reallocation. Due to new revised standard for industry classification (Nace
rev. 2 http://www.ssb.no/emner/10/01/nos_sn/ ) recovery plants has been moved from code C Manufacturing to code E Water supply; sewerage waste management and remediation activities. Emissions from recovery plants are now reported under 1A4A Commercial/Institutional. The same applies to emissions from motorized equipment in publishing, which have been moved from 1A2fii to 1A4aii
• Correction of error. All combustion emissions from one plant in 1991 have been removed. Since there was no activity at the plant this year, the emission figures have so far been erroneously included.
1A 3a Civil aviation
• Revised data. The figures on the use of jet fuel in 2008 have been revised. 1A 3 b i-iii Road transport
New model. A new model for calculating emissions to air (HBEFA) from road traffic has been incorporated in the Norwegian national inventory. The time series for NOX, NMVOC, CO, NH3 and particle emissions from road traffic have thus been recalculated. There have been some changes made to the activity data, e.g. a new data source on annual driving lengths has been utilised and more detailed information on traffic activity has been taken into account. Because emission factors from HBEFA are based on mileage and not on fuel consumption, emissions of NOX, NMVOC, CO, NH3 and particles are no longer calibrated to account for total fuel sales. Emissions of NOX have been adjusted downwards in the beginning of the time series and upwards from 1997 onwards for passenger cars, light duty vehicles and heavy duty vehicles. The NOX emission time series for mopeds and motorcycles are slightly upwards adjusted in the beginning of the time series, and downwards adjusted from 1996. NOx emissions from road traffic have been reduced by 13 300 tonnes (18 per cent) in 1990 and increased by 13 100 tonnes (43 per cent in 2008). NMVOC emissions are calculated to be lower for all vehicle categories for all years. The recalculated CO emissions are lower for all years for passenger cars, mopeds and motorcycles. For heavy duty vehicles, the recalculated emissions are lower until 2005, and increased thereafter. Light duty vehicle CO emissions are recalculated to be lower for all years except 1999-2001. The recalculated NH3 emissions are higher for all years for heavy duty vehicles. For passenger cars the emissions are increased for the years 1995-2003, and decreased for the years prior to and after this time period. For light duty vehicles there has been an increase in calculated emissions for 1995-2001, a decrease after this time period, and a slight decrease prior to it.
Emissions of SO2, heavy metals, PAH and dioxins are based on fuel sales, and emission factors have thus not been altered. There have, however, been made some changes to the allocation of fuel use between light and heavy duty vehicles. Due to a mistake, emissions from LPG and CNG vehicles were excluded for the years 1996-2006. Data for 2007-2009 are correct. Before 1996, no consumption was recorded. The error will be corrected in the next

The Norwegian Emission Inventory 2011 Documents 21/2011
190 Statistics Norway
submission. The consumption of these fuels was up to 5000 tonnes, or 0.2 per cent of total consumption in road transport. The errors in emission figures is generally lower, because emission factors for gas vehicles are lower than for conventional fuels.
1A 3 b vi Road transport: Automobile tyre and brake wear
• Revised data: Due to the incorporation of a new model for calculating emissions from road transport, the total annual vehicle kilometres have been recalculated for the years 1990-2008. This has given lower emissions for particles (all sizes), Pb, Cd, Cr and Cu for all years.
1A 3d National navigation
• Revised activity data. Revised energy data from the energy balance for navigation (fishing and domestic sea transport) has given higher fuel consumption data for 2007 and reduced consumption data for 2008 for marine gas oil, heavy distillate and heavy fuel oil
• Revised emission factors. The emission factors for NOX from oil based fuels (marine gas oil, light fuel oils, heavy distillate, heavy fuel oil) have been revised based on revised energy data from the energy balance (2007-2008), revised data for 2007-2008 for the effects of NOX emission reductions caused by technical efforts financed by the Business Sector’s NOX fund, and new fuel consumption data for oil based fuels for ferries given by the Directorate of Public Roads for 2008. These changes have given a minor reduction in the emissions of NOX from navigation
• Revised emission factors. For gas engines the NOX factor 5.6 kg NOX/ tonn LNG (4.0 kg NOX/ 1000 Sm3 LNG) is established by Marintek based on the mass of LNG consumed (Bremnes Nielsen and Stenersen 2010). Earlier used factor was 7.407 kg NOX/1000 Sm3
• Revised emission factors. Factors for particulate matters are based on measurements performed by Marintek and literature sources. The revised factors have more than doubled the emissions of particulate matters from navigation for the whole time series.
Particulate matter emission factors for oil and gas operated vessels.
Fuel Emission factor
PM2.5 PM10, TSPMarine gas oil, light fuel oils (kg/tonnes) .... 1.5 1.6Heavy fuel oil, heavy distillate (kg/tonnes) .. 5.1 5.4LNG (kg/1000 Sm3) ................................. 0.032 0.032Source: Bremnes Nielsen and Stenersen (2010).and Bremnes Nielsen (pers.comm.23)
• Reallocation. Emissions from moveable installations used in oil and gas
exploration and extraction have been moved from 1A3d to 1A1c. This has led to decreased emissions of all compounds from national navigation
1 A 4 a i Commercial / Institutional: Stationary
• New data. Reported emissions of lead and cadmium from one recovery plant have been included for the years 2004-2008.
• Revised data. The figures for combusted special waste 2003-2008 have been revised, and this has led to increased emissions for all compounds. In addition, there have been minor changes in use of recovered methane from landfills 2006-2008
• Reallocation: Due to a revised standard for industry classification (Nace rev. 2 http://www.ssb.no/emner/10/01/nos_sn/) stationary emissions from publishing, previously reported under 1A2d are now reported under 1A4ai Commercial/Institutional: Stationary
23 Bremnes Nielsen, J. (2010): Personal information, email from Jørgen Bremnes Nielsen 11/11-10, Marintek.

Documents 21/2011 The Norwegian Emission Inventory 2011
Statistics Norway 191
• Reallocation. Due to a revised standard for industry classification (Nace rev. 2 http://www.ssb.no/emner/10/01/nos_sn/ ) stationary emissions from recovery plants , which recycle waste and scrap, have been moved from 1A2fi to 1A4ai
1 A 4 a ii Commercial / Institutional: Mobile
• Reallocation. Due to a revised standard for industry classification (Nace rev. 2 http://www.ssb.no/emner/10/01/nos_sn/ ), emissions from motorized equipment in publishing and recovery plants have been moved from 1A2fii to 1A4aii.
1 A 4 b i Residential plants
• Revised activity data. For the years 2005-2008 the amount of wood burned in private households has been revised. This has led to increased emissions of all components
• Revised activity data. For 2008 the amount of wood pellets and wood briquettes has been revised. This has led to a minor decrease in emissions of all components
• Revised emission factors. Emissions factors for particulate matter, NOX, PAH, PAH-OSPAR and PAH-6 have been revised for the years 2005 to 2008 due to new information about the amount of wood burned in stoves with different technology.
1 A 4 b ii Household and gardening (mobile)
• Revised activity data. There have been minor changes in energy use in snow scooters 2007-2008, which cause corresponding emission changes
• Revised emission factors. The emission factors for NOx, NMVOC, CO, NH3 and PM from snow scooters have been revised.
1A 4c i Agriculture/forestry/fishing, stationary
• Correction of error. For 2006 the amount of LPG in agriculture has been increased, causing corresponding emission increases.
1 A 4 c iii National fishing
• Revised data. Minor changes in energy use 2007-2008 cause corresponding emission changes.
1A 5a Other, stationary
• Revised data. The figures for combusted special waste 2003, 2004 and 2007 have been somewhat adjusted
• Revised data. Figures on stationary military energy use in 2008 have been revised, which causes minor emission increases for most components.
1 B 2 a i Oil exploration, production, transport
• Reallocation. NOx emissions from one plant 2007-2008 have been reallocated from 1B2ai to 1A1c.
1B 2a v Distribution of oil products
• Revised data. Figures on NMVOC from petrol distribution in 2006-2008 have been decreased.
8.4.2. Industrial processes 2 A 1 Cement production
• Correction of error. All emissions of PM and heavy metals have been removed from one plant in 1991. Since there was no activity at the plant this year, the emission figures have so far been erroneously included. A previously missing SO2 figure for the same plant in 1992 has been added.

The Norwegian Emission Inventory 2011 Documents 21/2011
192 Statistics Norway
2A 3 Limestone and Dolomite Use • Reallocation. PM emissions from one plant 2005-2008 have been
reallocated from 2C5e to 2A3. 2 B 4 Carbide production
• Revised data. The reported figure for emissions of mercury from one plant has replaced earlier calculated emissions. Mercury emissions have increased for the years 1990 to 2004 and decreased for later years.
2 B 5 Other chemical production
• Revised data. There have been minor changes in reported emissions of NMVOC 2006-2008 for one plant
• Reallocation. Some use of blast furnace gas at one plant 2006-2008 has been reallocated from boilers to flaring, which causes a corresponding reallocation of emissions between 1A2c and 2B5a
• Correction of error. The NMVOC figure for one plant has been reduced in 2008. For another plant, the reported NMVOC figure for 2008 has been corrected.
2C 2 Ferroalloys production
• Revised data. Due to a new calculation method, revised NOx data for three plants have caused partly large emission increases for the whole time series 1990-2008. The largest increase has taken place for the most recent years due to change in production from FeSi to silicon metal. The emission increase varies from 275 tonnes (3 per cent) in 1990 to 3567 tonnes (59 per cent) in 2008.
2 C 3 Aluminium production
• Revised data. Revised emission data for PAHs from aluminium production for the period 1995 to 2005. Emissions now include both the emissions of particle bound PAHs and PAHs in the gas phase. The emission data for 1995 is used for the period 1990-1995. Emissions for all these years have increased. Due to this correction, the total emissions of PAH have increased by 47 to 93 per cent. The emissions of PAH-OSPAR have increased by 57 to 104 per cent and the emissions of PAH-4 have increased by 75 to 127 per cent
• Revised data. The time series for lead, cadmium, arsenic, chromium, mercury and copper from aluminium production for the period 1990 to 2008 have been revised. The figures reported now also include emissions from consumption of anodes in the industry. Emissions for all these years have increased. Due to this correction, the total emissions of lead has increased by 0.3 to 6 per cent. The emissions of cadmium have increased by 7 to 17 per cent. The emissions of arsenic have increased by 10 to 32 per cent. The emissions of chromium have increased by 1 to 5 per cent and the emissions of copper have increased by 3 to 7 per cent
• Correction of error. Reduction in PAH in 2007 and 2008 are due to that one plant reports no emissions of PAH for these years. Emission data from 2006 was earlier used for 2007 and 2008. Another plant also reports no emission of PAH in 2008 while emission data from 2007 was earlier used in the emission estimation
• Correction of error. All emissions of PM have been removed from one plant in 2008. Since the plant had closed down, the emission figures have so far been erroneously included.
2 C 5 e Other Metal Production
• Additional data. Reported emissions of cadmium from production of anodes have been includes in the inventory for the whole period from 1990Revised data. Revised emission data for PAHs from production of

Documents 21/2011 The Norwegian Emission Inventory 2011
Statistics Norway 193
anodes for the period 1995 to 2002. This also affects the emissions of PAH-OSPAR and PAH-6. Emissions have therefore increased for all yearsReallocation. PM emissions from one plant 2005-2008 have been reallocated from 2C5e to 2A3Correction of error. The emission factor for PM10 from production of anodes has been corrected for the years after 2002. The EF was earlier set to PM10 = TSP, but is now corrected to PM10 = 0.97 * TSP. This results in minor emission reductions.
2D 2 Food and drink
• Revised data. A minor increase in emissions of NMVOC in 2008, due to revised production figures for bread.
8.4.3. Solvent and other product use Due to methodological changes in the model for NMVOC emissions from solvent use (induced by revision of the standard industrial classification, from SIC 2002 to SIC 2007) and some revisions in activity data, the estimates of NMVOC emissions from the use of solvents have increased by 355 tonnes in 2005 and 389 tonnes in 2006 and decreased by 1273 tonnes in 2007 and 3117 tonnes in 2008. 3 A 3 Other coating application
• Revised method for NMVOC emissions from solvent use. Emissions are adjusted downwards by approximately 60 tonnes for each of the years 2006, 2007 and 2008.
3 B 1 Degreasing and dry cleaning
• Correction of error and revised method.. In last year’s submission, 400-500 tonnes of HFCs were included in the NMVOC emissions from this source in the years 2005, 2007 and 2008. Due to this erroneous inclusion of HFCs, in addition to revisions of the method for NMVOC emissions from solvent use (change in standard industrial classification, from SIC 2002 to SIC 2007) and some revisions in activity data, the emissions are adjusted downwards by approximately 500 tonnes for each of the years 2005, 2007 and 2008.
3 B 2 Dry cleaning
• Revised method for NMVOC emissions from solvent use. Emissions are adjusted downwards by approximately 20 tonnes for each of the years 2005- 2008.
3 C Chemical products
• Revised activity data/method for NMVOC emissions from solvent use. Emissions are adjusted downwards by 10 tonnes in 2005 and approximately 200 tonnes in for each of the years 2006 and 2007 and adjusted upwards by 483 tonnes in 2008.
3 D 2 Domestic solvent use
• Revised activity data/method for NMVOC emissions from solvent use. Emissions are adjusted upwards by 85 tonnes in 2005 and 623 tonnes in 2006 and adjusted downwards by 738 tonnes in 2007 and 1876 tonnes in 2008.
3 D 3 Other product use
• Reallocation. Emissions from tobacco have been reallocated from 6D to 3D3 Other product use.
• Revised activity data. Emissions of mercury from fluorescent tubes have been adjusted downwards for 2007 and 2008. In addition emissions of mercury from instruments has been adjusted downwards for 2008

The Norwegian Emission Inventory 2011 Documents 21/2011
194 Statistics Norway
• Revised activity data/method for NMVOC emissions from solvent use. Emissions are adjusted upwards by 815 tonnes in 2005, and downwards by 206 tonnes in 2006, 8 tonnes in 2007 and 788 tonnes in 2008.
8.4.4. Agriculture 4B Manure Management and 4D Emissions from agricultural soils
• Reallocation. Emission of NH3 from manure has been reallocated from a distribution on the two sources manure management and manure spreading, to a distribution on ten different animal categories. This does not change the total emissions of NH3 from the agriculture sector.
4D Emissions from agricultural soils
• Revised activity data. From 2000, a yearly distribution of the use of different types of nitrogen fertilisers has been used in the NH3-model. Annual sales statistics for the different fertiliser types is given by the Norwegian Food Safety Authority. The NH3 emission factors (per cent of applied N) are different for the different types of nitrogen fertilisers and give changes to the emission figures from 2000. For the calculation of the emission of NH3 we need a specification of the use of different types of synthetic fertiliser. Due to lack of data for the years before 2000, we have to assume that the percentual distribution between the usage of different fertiliser types is the same as in 1994 for these years
• Revised activity data. The calculation of NH3 emissions from use of nitrogen fertiliser is based on sales figures for each year. There was a strong price increase for nitrogen fertiliser, which caused a stock building in 2008 and corresponding lower purchases in 2009. In addition, new fertilisation standards may have brought about reduced amounts of fertiliser in 2009. To correct for the stock building there has been a transfer of fertiliser from 2008 to 2009 in the calculations. This correction has contributed to reduction in the NH3 emissions from this source in 2008, but the effect of the recalculation of activity data due to new information about fertiliser type has more than made up for this correction and given a total increase for 2008 for NH3 from mineral fertiliser use.
4F Burning of crop residues
• Revised activity data. The amount of burned crop residue has been corrected for the water content, which has decreased the emission figures of all components
• Revised emission factors. Emission factors from the EMEP/EEA emission inventory guidebook are used (EEA 2009). SO2, NMVOC and NH3 are included in the inventory for the first time. For NOX and CO the new factors have only given minor changes but for PM the recalculation has given a decrease in emissions with more than fifty percent for all years.
4G Other agricultural emission sources
• Revised activity data. Revised time series for the amount of NH3 used for treatment of straw. Data source for the amount has been changed from the Norwegian Agricultural Supply Cooperative to the Budget Committee for Agriculture to ensure completeness.
8.4.5. Waste 6 D Other Waste
• Reallocation. Emissions from tobacco have been reallocated from 6D to 3D3 Other product use.

Documents 21/2011 The Norwegian Emission Inventory 2011
Statistics Norway 195
8.5. Implications of the recalculations for long-range transboundary air pollutants
8.5.1. Implications for emissions levels Table 8.4 shows the effects of recalculations on the emission figures for the main pollutants 1990-2008, table 8.5 the effect on the PM emissions and table 8.6 the effects on the POP and heavy metal emission figures.
Table 8.4. Recalculations in 2011 submission compared to the 2010 submission. Main pollutants
SO2 NOX NMVOC CO NH3
tonnes tonnes Tonnes tonnes tonnes
1990 32 -12 796 -10 104 -120 925 8391991 83 -12 072 -9 796 -106 949 6291992 89 -11 338 -12 490 -119 576 2681993 71 -11 187 -10 702 -114 536 3991994 51 -4 984 -9 704 -102 226 2021995 62 -3 685 -8 633 -91 520 5221996 69 -2 853 -8 514 -87 508 5061997 49 3 727 -6 583 -66 390 3351998 52 4 249 -7 224 -66 944 6871999 47 6 199 -6 904 -61 411 5572000 50 8 479 -6 028 -53 668 7102001 39 7 929 -6 870 -58 574 6302002 29 9 179 -6 958 -56 931 4302003 83 10 156 -7 323 -56 725 3362004 62 10 650 -7 619 -56 449 3452005 220 17 736 -7 941 -59 967 2062006 97 13 550 -8 496 -59 073 2622007 76 13 469 -9 828 -50 335 3282008 88 14 935 -11 359 -49 708 170
Table 8.5. Recalculations in 2011 submission compared to the 2010 submission. Particulate matter
TSP PM10 PM2.5
Tonnes
1990 -3 484 -3 284 -3 4681991 -2 955 -2 763 -2 9181992 -2 230 -2 031 -2 1381993 -2 824 -2 765 -2 8871994 -1 687 -1 613 -1 7811995 -1 734 -1 680 -1 8711996 -1 595 -1 512 -1 7351997 -476 -437 -6901998 -427 -363 -6201999 72 143 -1372000 160 232 -502001 294 369 1022002 738 782 5442003 965 1 053 8402004 915 1 041 8382005 1 054 1 257 1 0382006 1 230 1 360 1 1282007 3 030 3 013 2 7602008 1 621 1 740 1 958

The Norwegian Emission Inventory 2011 Documents 21/2011
196 Statistics Norway
Table 8.6. Recalculations in 2011 submission compared to the 2010 submission. POPs and heavy metals
Pb Cd Hg As Cr Cu PAH-4
(CLRTAP) Dioxins
Kg Kg Kg Kg Kg Kg Kg mg1990 823 62 -43 368 183 891 21 836 -1 2181991 654 65 -36 377 177 887 16 343 -9721992 609 76 -18 386 167 846 17 328 -5391993 651 69 -25 381 177 1 013 18 209 -7541994 571 71 -17 376 167 934 13 858 -5461995 586 65 -22 350 174 879 12 280 -6791996 593 65 -24 359 173 851 14 252 -7221997 592 80 -17 404 181 1 174 17 693 -5201998 585 76 -18 426 188 1 053 13 514 -5411999 597 85 -16 448 193 1 154 12 572 -4932000 623 87 -17 458 201 1 268 10 578 -5222001 578 90 -14 466 202 1 287 11 479 -4312002 539 86 -10 425 236 1 295 13 588 -3242003 536 88 -7 448 369 1 108 10 320 -2382004 496 77 -9 403 227 1 031 12 705 -3382005 558 92 -7 468 363 1 035 14 032 -2852006 410 88 -5 427 618 1 198 3 424 -1882007 613 69 -14 340 670 1 124 22 -302008 610 54 -22 194 869 979 -1 321 -1 142
8.5.2. Implications for emission trends As a result of the different recalculations for 1990-2008 there have been some changes in the trends. The differences are shown in the tables below. As it appears, the most remarkable change has taken place for NOx.
Table 8.7. Trends in emissions 1990-2008. This submission vs. previous submission. Main Pollutants. Per cent change 1990-2008
SO2 NOX NMVOC CO NH3
2011 submission -61.1 -0.7 -45.6 -55.5 8.32010 submission -61.2 -14.3 -43.7 -56.0 11.9
Table 8.8. Trends in emissions 1990-2008. This submission vs. previous submission. Particulate Matter. Per cent change 1990-2008
TSP PM10 PM2.5
2011 submission -19.9 -24.6 -24.52010 submission -24.9 -30.7 -32.0
Table 8.9. Trends in emissions 1990-2008. This submission vs previous submission. POPs and heavy metals. Per cent change 1990-2008
Pb Cd Hg As Cr Cu PAH-4
(CLRTAP) Dioxins
2011 submission -96.6 -48.9 -59.1 -51.0 -74.9 2.8 -61.5 -82.9
2010 submission -96.9 -50.9 -58.8 -51.5 -81.5 2.5 4.8 -82.1

Documents 21/2011 The Norwegian Emission Inventory 2011
Statistics Norway 197
9. Areas for further improvement
9.1. Overview There are several areas where improvement actions are needed to improve the Norwegian emission inventory system. In this chapter the main issues are listed. For greenhouse gases the yearly international review identifies areas where the Norwegian inventory needs improvements to be consistent with the IPCC Guidelines. The long-range transboundary air pollutants reported to UNECE also undergo a yearly international review.
9.2. General • Many of the emission factors used in the inventory are relatively old, some
over 10 years, and they need to be analysed. Some of them also lack good documentation and source references.
• Emissions of PCB and HCB will be included.
9.3. Energy • The sulphur content in fuel wood and carbon used for stationary
combustion need to be revised. The calculations used today are highly uncertain. There may also be a need to improve other emission factors for POPs and heavy metals for fuel wood combustion.
• Wear of asphalt from studded tyres is one of the most important sources of particulate emissions in Norway (along with fuel wood burning and road traffic exhaust). The model used for calculating these emissions was developed in 1998 and needs evaluation and probably also revision.
• The energy statistics used as input to the Norwegian emission inventory need to be improved for some sectors. For use of petroleum products, Statistics Norway's sales statistics for petroleum products are used. The division between sectors in the sales statistics is not as detailed as the one needed in the energy statistics. A number of different methods are being used to distribute the energy use of the different energy products on actual sectors. Some are based on very old assumptions and surveys that need to be updated.
9.4. Industry • HFCs and PFCs from Products and Processes.The methodology will
progressively be improved as new import statistics and information from users and sectors become available.
9.5. Agriculture • High uncertainty is connected to the calculations of N2O from agricultural
soils. The calculations are based on a simple Tier 1 methodology, which results in that some efforts made to reduce the emissions not are reflected in the calculations, e.g. changes in soil cultivation practices. Changes are proposed the methodology and emission factors used for the calculations of N2O from agricultural soils in IPCC (2006). These changes need to be implemented in the Norwegian emission inventory.
• The national Norwegian NH3 model needs to be better documented.

The Norwegian Emission Inventory 2011 Documents 21/2011
198 Statistics Norway
References In this inventory, SFT is the former Norwegian abbreviation for the Climate and Pollution Agency, which early in 2010 changed its name from The Norwegian Pollution Control Authority Aakra, Å. and Bleken, M.A. (1997): N2O emissions from Norwegian agriculture as estimated by the IPCC methodology, Ås: Norwegian university of life sciences AEA (2007): UK's national atmospheric inventory http://www.naei.org.uk/ Aker Engineering (1992): Direct hydrocarbon gas emissions from production and riser platforms, Aker Engineering Andersen, T. and Karstensen, K.H. (1998): Emisjonsfaktorer for CO2-utslipp fra sementproduksjon i Norge for 1990 og 1997 (Emission factors for CO2 emissions from cement production in Norway for 1990 and 1997), Report STF66 A98511, Oslo: SINTEF (Institute for social research in industry) Arts, R., Chadwick, A. and Eiken, O. (2004). Recent time-lapse seismic data show no indication of leakage at the Sleipner CO2-injection site. 7th Greenhouse Gas Control Technologies Conference (GHGT7), Vancouver Avfall Norge (2006): Fornybar andel i avfall til norske forbrenningsanlegg (Share of renewable waste in Norwegian combustion plants ), Rapport 7/2006, Oslo: Avfall Norge Bækken, T. (1993): Miljøvirkninger av vegtrafikkens asfalt og dekkslitasje (Environmental Effects of Traffic Pollution Caused by Wear and Tear of Road Surfaces and Tyres), Report O-92090, Oslo: Norwegian institute of water research http://www.niva.no/symfoni/infoportal/publikasjon.nsf/b3fa54ae867808cbc1256ebc0033d836/96aaa98306e38958c125754e00290a01/$FILE/2874_72dpi.pdf Bang, J. (1993): Utslipp fra dieseldrevne anleggsmaskiner, arbeidsredskaper, traktorer og lokomotiver (Emissions from diesel-powered construction machinery, tools, tractors and locomotives), Oslo: National institute of technology Bang, J. (1996): Utslipp av NMVOC fra fritidsbåter og bensindrevne motorredskaper (Emissions of NMVOC from leisure craft and gasoline-powered equipment), Oslo: National institute of technology Bang, J., Flugsrud, K., Haakonsen, G., Holtskog, S., Larssen, S., Maldum, K.O., Rypdal, K. and Skedsmo, A. (1999): Utslipp fra veitrafikk i Norge. Dokumentasjon av beregningsmetode, data og resultater (Emissions from road traffic in Norway - Method for estimation, input data and emission estimates), Report 99:04, Oslo: Norwegian pollution control authority Barlaz, M. (2004): Critical review of forest products decomposition in municipal solid waste landfills, Technical Bulletin 872, Research Triangle Park, NC: National council for air and stream improvement http://www.ncasi.org Bergfald & Co AS (2000): Utslipp av metan fra kullgruver på Svalbard (Emissions of methane from coal mining at Svalbard), Bergfald & Co AS Bjørketun, U. and Nilsson, G. (2007): Skaderisker för motorcyklister, Rapport 566, Linköping: VTI

Documents 21/2011 The Norwegian Emission Inventory 2011
Statistics Norway 199
Bremmer, H.J., Troost, L.M., Kuipers, G., de Koning, J. and Sein, A.A. (1994): Emission of dioxins in the Netherlands, Bilthoven: National institute of public health and enviromental protection (RIVM) http://www.rivm.nl/bibliotheek/rapporten/770501018.pdf Bremnes Nielsen, J. and Stenersen, D. (2009): Analysis of NOx emission factor for ships, 2009, MT22 F09-150, Marintek Bremnes Nielsen, J. and Stenersen, D. (2010): Emission factors for CH4, NOx, particulates and black carbon for domestic shipping in Norway, Trondheim: Marintek Brock, C.A., Döpelheuer, A., Petzol, A. and Schröder, F. (1999): In situ observations and model calculations of black carbon emissions by aircraft at cruise altitude, Journal of Geophysical Research, 104(D18), 22,171–22,181. Chadwick, R.A., Arts, R., Eiken, O., Kirby, G.A., Lindeberg, E. and Zweigel, P. (2004): 4D Seismic Imaging of an Injected CO2 Plume at the Sleipner Field, Central North Sea, Geological Society, London, Memoirs, 29, 311-320. Climate and Pollution Agency (2011a): Klimakvoter for 2008–2012 http://www.klif.no/Tema/Klima-og-ozon/CO2-kvoter/Klimakvoter-for-2008/ Climate and Pollution Agency (2011b): National Inventory Report. Greenhouse gas emissions 1990-2009, TA-2789/2011, Oslo: Climate and Pollution Agency http://www.klif.no/publikasjoner/2789/ta2789.pdf Daasvatn, L., Flugsrud, K., Høie, H., Rypdal, K. and Sandmo, T. (1992): Modell for beregning av nasjonale utslipp til luft. Dokumentasjon (Model for calculation of national air emissions. Documentation), Interne notater 92/17, Statistics Norway Daasvatn, L., Flugsrud, K., Hunnes, O.K. and Rypdal, K. (1994): Beregning av regionaliserte utslipp til luft. Beskrivelse av modell og metoder for estimering (Calculation of emissions to air on a regional basis. Description of a model and estimation methods), Notater 94/16, Statistics Norway Dämmgen, U., Lüttich, M., Döhler, H., Eurich-Menden, B. and Osterburg, B. (2002): GAS-EM - A Procedure to Calculate Gaseous Emissions from Agriculture, Landbauforschung Völkenrode, 52, 19-42. Directorate for Health (1990): Retningslinjer for inneluftkvalitet (Guidelines for indoor air quality), Helsedirektoratets utredningsserie 6/90, Directorate of Health Directorate for Health and Social Affairs (2006): Utviklingen i norsk kosthold 2006, Matforsyningsstatistikk og Forbruksundersøkelser. 12/2006. IS-1406, http://www.helsedirektoratet.no/vp/multimedia/archive/00013/IS-1406_13269a.pdf Döpelheuer, A. and Lecht, M. (1998). Influence of engine performance on emission characteristics. RTO AVT Symposium on "Gas Turbine Engine Combustion, Emissions and Alternative Fuels". NATO research and technology organization. RTO Meeting proceedings. 14. ECETOC (1994): Ammonia emissions to air in Western Europe, ECETOC Technical report nr. 62, Brussels: European centre for ccotoxicology and toxicology of chemicals EEA (1996): EMEP/Corinair. The atmospheric emission inventory guidebook. First edition, Copenhagen: European environmental agency

The Norwegian Emission Inventory 2011 Documents 21/2011
200 Statistics Norway
EEA (2001): Emission inventory guidebook, 3rd edition. A joint EMEP/CORINAIR production, Copenhagen: European environmental agency EEA (2007): Emission inventory guidebook - 2007 (Internet version). Group 6. A joint EMEP/CORINAIR production. http://reports.eea.europa.eu/EMEPCORINAIR5/en/page002.html EEA (2009): EMEP/EEA air pollutant emission inventory guidebook - 2009, Technical report No 6/2009 Copenhagen: European environment agency http://www.eea.europa.eu/publications/emep-eea-emission-inventory-guidebook-2009/ EMEP (2009): EMEP/EEA air pollutant emission inventory guidebook. http://www.eea.europa.eu/emep-eea-guidebook EPA (1986): Ferro-alloy industry particulate emissions: Source category report, EPA/600/7-86/039, U.S. environmental protection agency EPA (1998): Locating and estimating air emissions from sources of polycyclic organic matter, EPA-454/R-98-014, U.S. environmental protection agency EPA (2002): Compilation of air pollutant emission factors. Fifth edition, AP-42, Volume 1, Stationary point & area sources, Update 2001 & Update 2002, U.S. environmental protection agency Erlandsen, K., J. L. Hass and K.Ø. Sørensen (2002): Norwegian economic and environment accounts (NOREEA) Project report - 2001, Documents 2002/15, Statistics Norway European Union (2002): Final technical report of the SACS2 project, issued 30. Aug. 2002, EU project NNE-1999-00521, EU Finstad, A., Flugsrud, K. and Rypdal, K. (2002a): Utslipp til luft fra norsk luftfart (Emissions to air from Norwegian air traffic), Report 2002/8, Statistics Norway http://www.ssb.no/emner/01/04/10/rapp_200208/rapp_200208.pdf Finstad, A., Haakonsen, G., Kvingedal, E. and Rypdal, K. (2001): Utslipp til luft av noen miljøgifter i Norge - Dokumentasjon av metode og resultater (Emissions of some hazardous chemicals to air in Norway - Documentation of methodology and results), Report 2001/17, Statistics Norway http://www.ssb.no/emner/01/04/10/rapp_200117/rapp_200117.pdf Finstad, A., Haakonsen, G. and Rypdal, K. (2002b): Utslipp til luft av dioksiner i Norge - Dokumentasjon av metode og resultater (Emissions to air of dioxins in Norway - Documentation of methodology and results), Report 2002/7, Statistics Norway http://www.ssb.no/emner/01/04/10/rapp_200207/rapp_200207.pdf Finstad, A., Haakonsen, G. and Rypdal, K. (2003): Utslipp til luft av partikler i Norge - Dokumentasjon av metode og resultater (Emissions to air of particles in Norway - Documentation of methodology and results), Report 2003/15, Statistics Norway http://www.ssb.no/emner/01/04/10/rapp_200315/ Finstad, A. and Rypdal, K. (2003): Utslipp til luft av kobber, krom og arsen i Norge - Dokumentasjon av metode og resultater (Emissions to air of copper, chromium and arsenic in Norway - Documentation of methodology and results), Report 2003/7, Statistics Norway http://www.ssb.no/emner/01/04/10/rapp_200307/rapp_200307.pdf

Documents 21/2011 The Norwegian Emission Inventory 2011
Statistics Norway 201
Flugsrud, K., Hoem, B. and Aasestad, K. (2010): Utslipp til luft av NOx fra innenriks sjøfart og fiske (NOx emissions to air from domestic navigation and fishing), Report 40/2010, Statistics Norway http://www.ssb.no/emner/01/04/10/rapp_201040/rapp_201040.pdf Flugsrud, K. and Rypdal, K. (1996): Utslipp til luft fra innenriks sjøfart, fiske og annen sjøtrafikk mellom norske havner (Emissions to air from domestic shipping, fisheries and other maritime traffic between Norwegian ports), Report 96/17, Statistics Norway http://www.ssb.no/emner/01/04/rapp_9617/rapp_9617.pdf Fyns Amt (2000): Estimert beregning for årlig dioxinemission på 8 anlæg i Fyns Amt (Estimated calculation for yearly dioxin emissions on 8 plants in Fyns Amt), Report 15.420, dk-TEKNIK Fredericia Grønlund, A., Knoth de Zarruk, K., Rasse, D., Riley, H., Klakegg, O. and Nystuen, I. (2008): Kunnskapsstatus for utslipp og binding av karbon i jordbruksjord (Status of knowledge for emissions and fixation of carbon in agricultural soils), Bioforsk Report Vol.3 Nr. 132/2008, Ås: Bioforsk Gundersen, G.I. and Rognstad, O. (2001): Lagring og bruk av husdyrgjødsel (Storage and use of manure), Reports 2001/39, Statistics Norway http://www.ssb.no/emner/10/04/10/rapp_200139/rapp_200139.pdf Gustafsson, T. (2005): Improved structures for uncertainty analysis in the Swedish Greenhouse Gas Emission Inventory., Swedish Methodology for Environmental Data (SMED) Haakonsen, G., Holtskog, S., Kvingedal, E., Rypdal, K. and Tornsjø, B. (2000): Verification of the Norwegian emission inventory. Comparing emission intensity values with similar countries, Rapport 2000:1736, Oslo: Statens forurensningstilsyn og Statistisk sentralbyrå Haakonsen, G. and Kvingedal, E. (2001): Utslipp til luft fra vedfyring i Norge. Utslippsfaktorer, ildstedsbestand og fyringsvaner (Emissions to air from combustion of wood in Norway), Report 2001/36, Statistics Norway http://www.ssb.no/emner/01/04/10/rapp_200136/rapp_200136.pdf Haakonsen, G., Rypdal, K. and Tornsjø, B. (1998): Utslippsfaktorer for lokale utslipp - PAH, partikler og NMVOC (Emission factors for local emissions - PAH, particles and NMVOC), Notater 98/29, Statistics Norway Hansen, E. (2000): Substance flow analysis for dioxins in Denmark, Environmental project No 570 2000, Danish environmental protection agency, Danish ministry of the environment Hansen, K.L. (2007): Emissions from consumption of HFCs, PFCs and SF6 in Norway, Documents 2007/8, Statistics Norway http://www.ssb.no/english/subjects/01/04/10/doc_200708_en/doc_200708_en.pdf Hedalen, T. (1994): Vegslitasje - partikkelstørrelsesfordeling (Road abrasion - particle size distribution), Report no. STF36 A94011, Trondheim: Institute of social research in industry (SINTEF), Bergteknikk Hedalen, T. and Myran, T. (1994): Vegstøvdepot i Trondheim - partikkelstørrelsesfordeling, kjemisk og mineralogisk sammensetning (Road dust depot in Trondheim - particle size distribution, chemical and mineralogic composition), STF36 A94037, Trondheim: Institute of social research in industry (SINTEF), Bergteknikk

The Norwegian Emission Inventory 2011 Documents 21/2011
202 Statistics Norway
Hohle, E.E., (ed.) (2005): Bioenergi. Miljø, teknikk og marked (Bio energy. Environment, technology and market), Brandbu: Energigården Holmengen, N. and Kittilsen, M.O. (2009): Estimating emissions of NMVOC from solvent and other product use. Revised model, Report 2009/14, Statistics Norway http://www.ssb.no/english/subjects/01/04/10/rapp_200914_en Hutchings, N.J., Sommer, S.G., Andersen, J.M. and Asman, W.A.H. (2001): A detailed ammonia emission inventory for Denmark, Atmospheric Environment 35, 1959-1968. IMC (2000): Seam gas content analysis., Technical services limited. INFRAS (2009): Handbook emission factors for road transport (HBEFA) http://www.hbefa.net/ Institute of environmental and energy technology (2002): CEPMEIP Database www.mep.tno.nl Institute of transport economics (1993): Norske reisevaner. Dokumentasjonsrapport for den landsomfattende reisevaneundersøkelsen 1991-92 (Documentation of the Norwegian national travel survey 1991-92 (In Norwegian)), Oslo: Institute of transport economics International Aluminium Institute (2005): The Aluminium Sector Greenhouse Gas Protocol, 2005, http://www.world-aluminium.org/Downloads/Publications/Download IPCC (1997a): Greenhouse gas inventory. Reference manual. Revised 1996. IPCC guidelines for national greenhouse gas inventories, Volume 3, London: Intergovernmental panel on climate change IPCC (1997b): Greenhouse gas inventory. Workbook. IPCC guidelines for national greenhouse gas inventories, Volume 2, London: Intergovernmental panel on climate change IPCC (2000): "Good practice guidance and uncertainty management in national greenhouse gas inventories", In: (eds. Penman, J, D Kruger, IE Galbally and T Hiraishi). Hayama, Japan: IPCC national greenhouse gas inventories programme, Technical support unit. IPCC (2006): 2006 IPCC guidelines for national greenhouse gas inventories, Institute for Global Environmental Strategies (IGES) IVAM (2005): VOC emissions from cosmetics and cleaning agents. Amsterdam, the Netherlands.: IVAM research and consultancy on sustainability Jebsens miljøteknikk (1991): Undersøkelse av utslipp av støv, PAH, CO, SO2 og tyngre organiske forbindelser fra et motstrøms og et ordinært trommelblandeverk for asfalt. (Examination of emissions of dust, PAH, CO, SO2 and heavy organic compounds from a counter-flow and an ordinary drum mixer for asphalt). Jensen, J.E.F., Williksen, T. and Bartnes, J. (1999): Beregningsmodell for utslipp av metangass fra norske deponier (Model for estimation of CH4 from landfills in Norway), Report 99:16, Oslo: Norwegian pollution control authority Johansen, K. and Amundsen, F.H. (2000): Piggdekkundersøkelsen 2000. Modell for piggdekkbruk (The investigation of studded tyres 2000. A model for the use of studded tyres), Note dated 28.2.2000, Norwegian public roads administration

Documents 21/2011 The Norwegian Emission Inventory 2011
Statistics Norway 203
Johansson, L. and Solvoll, K. (1999): Norkost 1997, Landsomfattende kostholdsundersøkelse blant menn og kvinner i alderen 16-79 år (Norkost 1997- nationwide dietetical survey among men and women aged 16-79), Report 2/1999 Oslo: http://www.helsedirektoratet.no/vp/multimedia/archive/00003/IS-0168_3745a.pdf Karlsson, M.L., Wallin, P.A. and Gustavsson, L. (1992): Emissioner från biobrensle-eldade anläggningar mellan 0,5 och 10 MW (Emissions from biofuel plants between 0,5 and 10 MW), SP report 1992:46, Borås: Swedish national testing and research institute. Karlsvik, E. (1995): Round robin test of a wood stove-emissions, Report STF12 F95012, Trondheim: SINTEF (Institute of social research in industry) Larssen, S. (1985): Støv fra asfaltveier. Karakterisering av luftbåret veistøv. Fase 1: Målinger i Oslo, våren 1985 (Dust from asphalt roads. Characterization of air carried road dust. Phase 1: Measurements in Oslo, spring 1985), O-8431, Kjeller: Norwegian institute for air research (NILU). Miljøverndepartementet (2004). Forskrift om begrensning i bruk av helse- og miljøfarlige kjemikalier og andre produkter (produktforskriften) (Regulations relating to restrictions on the manufacture, import, export, sale and use of chemicals and other products hazardous to health and the environment (Product regulations)), http://www.sft.no/lover/produktforskriften/. Monsen, B. (1998): Omregningsfaktorer for CO2-utslipp fra metallurgisk industri og sementproduksjon. Delprosjekt 2. Produksjon av ferrosilisium og silisiummetall i Norge (Conversion factors for CO2 emissions from metal manufacturing and cement production. Part 2. Production of ferro silicon and silicon metal in Norway), Revised edition, Report STF24 A98537, Trondheim: Institute of social research in industry (SINTEF) Monsen, B. and Olsen, S.E. (1998): Omregningsfaktorer for CO2-utslipp fra metallurgisk industri og sementproduksjon. Delprosjekt 3. Produksjon av ferromangan, silikomangan og ferrokrom i Norge (Conversion factors for CO2 emissions from metal manufacturing and cement production. Part 3. Production of ferro manganese, silicon manganese and ferro chromium i Norway), STF24 A98548, Trondheim: Institute of social reseach in industry (SINTEF) Morken, J. (2003): Evaluering av ammoniakkutslippsmodellen (Evaluation of the ammonia emission model, internal note), Ås: Department of agricultural engineering, Norwegian university of life sciences Morken, J. and Nesheim, L. (2004): Utnytting og tap av næringsstoff i husdyrgjødsel - framtidige utfordringar (Utilization and loss of nutrients in manure - future challenges), Grønn kunnskap, 8, 51-61. National Environmental Research Institute (2011): Denmark's National Inventory Report 2011, NERI Technical Report no. 827, 2011, Aarhus: National Environmental Research Institute http://www2.dmu.dk/Pub/FR827.pdf National institute of technology (1991): Tiltak 11. Reduksjon av VOC-utslipp fra totaktsmotorer. (Reduction of VOC-emissions from two stroke engines), Report carried out on behalf of the Norwegian pollution control authority, Oslo: National institute of technology NILF (2010): Totalkalkylen for jordbruket http://www.nilf.no/Totalkalkylen/Bm/2009/BMposter/BM_R_220B.shtml

The Norwegian Emission Inventory 2011 Documents 21/2011
204 Statistics Norway
Norddal, T. (2010): Miljørapport for innenriks ferjetrafikk 2009, Sjøfartsdirektoratet, Statens vegvesen, Rederienes Landsforening Norsk Energi (2003): Vurdering av utslippsfaktorer for beregning av NOX-utslipp med mer fra stasjonær forbrenning i Norge (Evaluation of NOX emissions factors etcetera from stationary combustion in Norway), unpublished, carried out on behalf of SFT, Norsk Energi Norsk Energi (2006): NOX-utslipp i forbindelse med eventuell NOX-avgift (Evaluation of NOX emissions in connection with the implementation of NOX tax), unpublished, carried on behalf of SFT, Norsk Energi Norwegian Food Safety Authority (Annually): Statistikk. Mineralgjødsel http://www.mattilsynet.no/planter/gjodsler/omsetningsstatistikker/statistikk__mineralgj_dsel_18420 Norwegian institute for air research and Norwegian institute for water research (1995): Materialstrømsanalyse av PAH, 1995 (Material flow analysis of PAHs, 1995), Report O-92108, Kjeller and Oslo: NILU/NIVA Norwegian pollution control authority (1990): Klimagassregnskap for Norge. Beskrivelse av utslippsmengder, drivhusstyrke og utslippsfaktorer. Bidrag til den interdepartementale klimautredningen (Greenhouse gas inventory for Norway. Emission figures, global warming potentials and emission factors. Contribution to the interministerial climate report), Report 1990, Oslo: Norwegian pollution control authority Norwegian pollution control authority (1999a): Materialstrømsanalyse av SF6. Beregning av potensielt og faktisk utslipp over tid (Material flow analysis of SF6. Calculation of potential and actual emissions over time), Report 99:14, Oslo: Norwegian pollution control authority Norwegian pollution control authority (1999b): PAH-utslipp til sjø og luft fra aluminiumsverkene på Lista, Karmøy og Mosjøen (PAH emissions to sea and air from the aluminium works at Lista, Karmøy and Mosjøen), Note, Oslo: Norwegian pollution control authority Norwegian pollution control authority (2001): Harmonized quantfication and reporting procedures (HARP-HAZ Prototype), Report 1789/2001, Oslo: Norwegian pollution control authority Norwegian pollution control authority (2005a): Kartlegging av omsetning av enkelte miljøskadelige stoffer i legemidler og kosmetikk (Survey of turnover of some environmentally hazardous substances in pharmaceuticals and cosmetics), Report 2128/2005, Oslo: Norwegian pollution control authority Norwegian pollution control authority (2005b): Methane emissions from solid waste disposal sites, Report 2079/2005, Oslo: Norwegian pollution control authority Norwegian pollution control authority (2006): Documentation of methodology and results: QA/QC perfomred for greenhouse gas emissions for industrial plants included in the National Inventory, Norwegian public roads administration (1995a): Undersøkelse av vegvedlikehold og kjøreforhold - vinteren 1994/1995. Del I: Samlet fremstilling og analyser av undersøkelsene i perioden 1990 - 94 (Investigation of road maintenance and driving circumstances -Winter 1994/1995. Part I: Summary description and

Documents 21/2011 The Norwegian Emission Inventory 2011
Statistics Norway 205
analyses of the investigations in the period 1990-94), Nr. 95-333, Norwegian public roads administration Norwegian public roads administration (1995b): Undersøkelse av vegvedlikehold og kjøreforhold - vinteren 1994/1995. Del II: Statistikkhefte for undersøkelsene i perioden 1990 - 94 (Investigation of road maintenance and driving circumstances -Winter 1994/1995. Part II: Statistical booklet about the investigations in the period 1990-94), Nr. 95-334, Norwegian public roads administration Norwegian public roads administration (1996): Veg-grepsprosjektet; Delprosjekt 5.15: Samfunnsøkonomiske konsekvenser; Dokumentasjon av beregningsmodell (The road grip project; Part project 5.15: Social economic consequences; Documentation of calculation model), Internal report no. 1918, Norwegian public roads administration Norwegian public roads administration (1997): Veg-grepsprosjektet: Samlerapport; Konklusjoner, forslag til ny veg-grepspolitikk og resultater (The road grip project: Summary report; Conclutions, proposals for new road grip politics and results), Internal report no. 1994, Norwegian public roads administration Norwegian public roads administration (1998): Undersøkelse av vegvedlikehold og kjøreforhold - vinteren 1997/98 Landssammenstilling (Investigation of road maintenance and driving circumstances -Winter 1997/98, Country collocation), STF22 A98561, Norwegian public roads administration Olivier, J.G.J. (1991): Inventory of aircraft emissions: A review of recent literature, Report 736 301 008, Bilthoven: National institute of public health and environmental protection Olsen, K., Støre, T. and Tunold, R. (1998): Omregningsfaktorer for CO2-utslipp fra metallurgisk industri og sementproduksjon. Delprosjekt 5. Produksjon av magnesium (Conversion factors for CO2 emissions from metal manufacturing and cement production. Part 5. Magnesium production), STF24 A98574, Trondheim Institute of social research in industry (SINTEF) Parma, Z., Vosta, J., Horejs, J., Pacyna, J.M. and Thomas, D. (1995): Atmospheric emission inventory guidelines for persistent organic pollutants (POPs), Report for external affairs Canada, Prague: http://web.agrsci.dk/djfpublikation/djfpdf/djfm81.pdf Petersen, S.O. and Olesen, J.E. (2002): Greenhouse gas inventories for agriculture in the Nordic countries. Proceedings from an international workshop, Helsingør, Denmark 24-25 January 2002, Report Plant production no. 81, DIAS http://web.agrsci.dk/djfpublikation/djfpdf/djfm81.pdf Raaness, O. (1998): Omregningsfaktorer for CO2-utslipp fra metallurgisk industri of sementproduksjon. Delprosjekt 1. CO2-utslipp fra forskjellige typer reduksjonsmaterialer (Conversion factors for CO2 emissions from metal manufacturing and cement production. Part 1. CO2 emissions from various types of reducing agents), Revised edition, Report STF24 A98550, Trondheim: Institute of social research in industry (SINTEF) Raaness, O. and Olsen, S.E. (1998): Omregningsfaktorer for CO2-utslipp fra metallurgisk industri og sementproduksjon. Delprosjekt 4. Utslipp av CO2 ved produksjon av silisiumkarbid og kalisumkarbid (Conversion factors for CO2 emissions from metal manufacturing and cement production. Part 4. CO2 emissions from production of silicon carbide and calcium carbide), STF24 A98549, Trondheim: Institute of social reseach in industry (SINTEF)

The Norwegian Emission Inventory 2011 Documents 21/2011
206 Statistics Norway
Rideng, A. (2001): Transportytelser i Norge 1946-2000 (Transport performance in Norway 1946-2000), Report 515/2001, Oslo: Institute of transport economics Rosland, A. (1987): Utslippskoeffesienter. Oversikt over koeffesienter for utslipp til luft og metoder for å beregne disse (Emission factors. Overview of factors for emissions to air and methods of calculating), Report 15.08.1987, Oslo: Norwegian pollution control authority Rypdal, K. (1999): Evaluation of uncertainty in the Norwegian emission inventory, Report 99:01, Oslo: Norwegian pollution control authority Rypdal, K., Bloch, V.V.H., Flugsrud, K., Gobakken, T., Hoem, B., Tomter, S.M. and Aalde, H. (2005): Emissions and removals of greenhouse gases from land use, land-use change and forestry in Norway Report 11/05, Ås: Norwegian institute of land inventory (NIJOS) http://www.skogoglandskap.no/publikasjon/nj_rapport_11_05 Rypdal, K. and Flugsrud, K. (2001): Sensitivity analysis as a tool for systematic reductions in greenhouse gas inventory uncertainties, Environmental Science & Policy 4, 117-135. Rypdal, K. and Mykkelbost, T. (1997): Utslippsfaktorer for miljøgifter (Emission factors for hazardous chemicals), Internal notes 25.06.1997, Statistics Norway Rypdal, K. and Zhang, L.-C. (2000): Uncertainties in the Norwegian greenhouse gas emission inventory, Report 2000/13, Statistics Norway http://www.ssb.no/emner/01/04/10/rapp_200013/rapp_200013.pdf Rypdal, K. and Zhang, L.-C. (2001): Uncertainties in emissions of long-range air pollutants, Report 2001/37, Statistics Norway http://www.ssb.no/emner/01/04/10/rapp_200137/rapp_200137.pdf Sagen, J. (1987): Energiundersøkelsen 1985. Energibruk i privat og offentlig tjenesteyting (Energy survey 1985. Energy use in private and public services), Report 87/15, Statistics Norway Sandgren, J., Heie, A. and Sverud, T. (1996): Utslipp ved håndtering av kommunalt avfall (Emissions from municipal waste management), Report 96:16, Oslo: Norwegian pollution control authority Sandmo, T. (ed.) (2010): The Norwegian emission inventory 2010. Documentation of methodologies for estimating emissions of long-range transboundary air pollutants, Documents 21/2010, Statistics Norway SINTEF and Det Norske Veritas (2004): Hvitbok om klimagassutslipp fra norsk landbasert prosessindustri (White book about greenhouse gas emissions from Norwegian land based process industry), SINTEF Report STF24 A03501, DNV Report 2002-1609, Trondheim: Institute of social research in industry (SINTEF) Skårman, T., Danielsson, H., Henningsson, E. and Östmann, M. (2006): Revised method for estimating emissions of NMVOC from solvent and other product use i Sweden, Swedish methodology for environmental data Skullerud, H. (2006): Methane emissions from Norwegian landfills. Revised calculations for waste landfilled 1945-2004, Documents 2006/7, Statistics Norway http://www.ssb.no/emner/01/04/10/doc_200607/doc_200607.pdf

Documents 21/2011 The Norwegian Emission Inventory 2011
Statistics Norway 207
Statistics Finland (2009): Greenhouse gas emissions in Finland 1990-2007. National inventory report under the UNFCCC and the Kyoto protocol, http://cdr.eionet.europa.eu/fi/un/colsdyjvw/envsdykfg/FI_NIR_030409.pdf Statistics Norway (2001): Natural resources and the environment 2001. Norway, Statistical Analyses 47, Oslo: Statistics Norway Statistics Norway (2002): Sample survey of agriculture and forestry 2001 http://www.ssb.no/lu_en/arkiv/ Statistics Norway (2004): Sample survey of agriculture and forestry 2003 http://www.ssb.no/lu_en/arkiv/ Statistics Norway (2007): Sample survey of agriculture and forestry 2006, http://www.ssb.no/lu_en/arkiv/ Statistics Norway (2009): Standard Industrial Classification (SIC2007), internet version http://www3.ssb.no/stabas/ItemsFrames.asp?ID=5552001&Language=en&VersionLevel=ClassVersion Statistics Norway (2010a): Registered distances covered by vehicles 2009 http://www.ssb.no/english/subjects/10/12/20/klreg_en/ Statistics Norway (2010b): Road goods transport http://www.ssb.no/english/subjects/10/12/20/lbunasj_en/ Statistics Norway (Annually-a): Avlingsstatistikk http://www.ssb.no/jordbruksavling_en/ http://www.ssb.no/korn_en/ http://www.ssb.no/hagebruk/ Statistics Norway (Annually-b): Sales of petroleum products http://www.ssb.no/english/subjects/10/10/10/petroleumsalg_en/ Statistics Norway (Annually-c): Skogkultur http://www.ssb.no/english/subjects/10/04/20/skogkultur_en/ Stave, S.E. (2006): Water consumption in the food processing and the service industries in Norway, Documents 2006/12, Statistics Norway http://www.ssb.no/emner/01/04/20/doc_200612/doc_200612.pdf Sternbeck, J., Sjödin, Å. and Andrèasson, K. (2001): Spridning av metaller från vägtrafik, Report B1431, Stockholm: IVL Swedish environmental research institute Stockholms luft- och bulleranalys (1998): Metallemission från trafiken i Stockholm - Slitasje av bromsbelägg (Metal emissions from the traffic in Stockholm- Brake wear), Report 2:98, Stockholm: Stockholms luft- och bulleranalys Sundstøl, F. and Mroz, Z. (1988): Utskillelsen av nitrogen og fosfor i gjødsel og urin fra husdyr i Norge (Nitrogen and phosphorus in manure and urine from domestic animals in Norway - see Bolstad 1994), Ås: Norwegian university of life sciences Swedish environmental protection agency (2005): Sweden's national inventory report 2005 - Submission under the EC monitoring mechanism, Vienna: Swedish environmental protection agency

The Norwegian Emission Inventory 2011 Documents 21/2011
208 Statistics Norway
Swedish environmental protection agency (2009): National inventory report 2009 Sweden. Submitted under the United Nations framework convention on climate change and the Kyoto protocol, Swedish environmental protection agency http://cdr.eionet.europa.eu/se/un/colqlvbpw/envsdnleq/NIR_submission_2009.pdf Swedish environmental protection agency (2011): National inventory report 2011 Sweden - Annexes, Swedish environmental protection agency http://www.naturvardsverket.se/upload/05_klimat_i_forandring/statistik/2010/NIR-submission-2011-Annex.pdf The Norwegian oil industry association (1991): Environmental programme. Emissions to air. Report phase I - Part A, Stavanger: The Norwegian oil industry association The Norwegian oil industry association (1993): Environmental programme. Emissions to air. Phase II. Summray report, March 1993, Stavanger: The Norwegian oil industry association The Norwegian oil industry association (1994): Anbefalte retningslinjer for utslippsberegning. Identifisering, kvantifisering og rapportering av forbruks- og utslippsdata fra aktiviteter i norsk oljevirksomhet (Recommended guidelines for emission calculations. Identification, quantification and reporting of data on consumption and emissions from activities in the Norwegian oil and gas sector), Stavanger: The Norwegian oil industry association The Norwegian oil industry association (2009): Veiledning til den årlige utslippsrapporteringen. Gjelder: Vedlegg til Opplysningspliktforskriften; Krav til rapportering fra offshore petroleumsvirksomhet på norsk kontinentalsokkel, Stavanger: The Norwegian oil industry association http://www.olf.no/getfile.php/Dokumenter/Publikasjoner/Milj%C3%B8rapporter/Veiledning%20til%20utslippsrapportering%202009.pdf The Norwegian product register (2007): Guidelines for declaration of chemical products. Appendix 7: Codes for product use (UCN) http://www.sft.no/seksjonsartikkel____41938.aspx Tine BA (annually): Nøkkeltall http://medlem.tine.no/cf/nokkeltall.cfm Tornsjø, B. (2001): Utslipp til luft fra innenriks sjøfart, fiske og annen sjøtrafikk mellom norske havner (Emissions to air from fishing fleet and sea traffic between Norwegian harbours), Report 2001/6, Oslo: Statistics Norway Umweltbundesamt (2005): Austria's national inventory report 2005 - Submission under the EC monitoring mechanism, Vienna: Umweltbundesamt Umweltbundesamt (2011): Austria's National Inventory Report 2011, Report 0308, Vienna: Umweltbundesamt http://www.umweltbundesamt.at/fileadmin/site/publikationen/REP0308.pdf Vaaje, T. (2006): Piggdekk eller piggfritt? Hvilke valg gjør norske bilister i 2006? (Studded tyres or free from stud? What choices are made by Norwegian motorists in 2006?), Sollerud: Gjensidige Vågane, L. and Rideng, A. (2010): Transportytelser i Norge 1946-2009 (Transport volumes in Norway 1946-2009), Report 1090/2010 (in Norwegian), Oslo: Institute of transport economics http://www.toi.no/getfile.php/Publikasjoner/T%D8I%20rapporter/2010/1090-2010/1090-hele%20rapporten%20nett.pdf

Documents 21/2011 The Norwegian Emission Inventory 2011
Statistics Norway 209
Vagstad, N., Bechmann, M., Stålnacke, P., Eggestad, H.O. and Deelstra, J. (1998): Report from the monitoring of nutrients in 1997 Ås: Centre for soil and environmental research. van den Brink, R.M.M. (1996): Deeltjesemissie door wegverkeer; emissiefactoren, deeltjesgrootteverdeling en chemische samenstelling (Particulate emissions from road traffic: emission factors, size distribution and chemical composition), Bilthoven: National institute of public health and enviromental protection (RIVM) http://www.rivm.nl/bibliotheek/rapporten/773002008.pdf Winther, M. and Nielsen, O.-K. (2006): Fuel use and emissions from non-road machinery in Denmark from 1985-2004 - and projections from 2005-2030, Environmental project no. 1092 2006, National environmental research institute, Danish ministry of the environment

The Norwegian Emission Inventory 2011 Documents 21/2011
210 Statistics Norway
Appendix A: Abbreviations Pollutants GHG Greenhouse gases CO2 Carbon dioxide CH4 Methane N2O Nitrous oxide PFCs Perfluorocarbons HFCs Hydrofluorocarbons SF6 Sulphur hexafluoride SO2 Sulphur dioxide NOX Nitrogen oxides NH3 Ammonia CO Carbon monoxide (NM)VOC (Non-methane) volatile organic compounds TSP Total suspended particulates HM Heavy metals Pb Lead Cd Cadmium Hg Mercury As Arsenic Cr Chromium Cu Copper POPs Persistent organic pollutants
Other BOD Biological oxygen demand CLRTAP Convention on Long-Range Transboundary Air Pollution CRB Crop residue burned CRF Common Reporting Format DOC Degradable organic carbon EEA European Environment Agency EPA U.S. Environmental protection agency GIS Gas-insulated switchgear Forurensning Register at the the Climate and Pollution Agency with data and information on point sources IAI International Aluminium Institute IPCC Intergovernmental Panel on Climate Change Jordforsk Norwegian Centre for Soil and Environmental research Klif The Climate and Pollution Agency LPG Liquid Petroleum Gas LTO Landing Take off NFR Nomenclature For Reporting Skog + Landskap Norwegian Forest and Landscape Institute (until 2006
Norwegian Institute of Land Inventory NIJOS) NILF Norwegian Agricultural Economics Research Institute NILU Norwegian Institute for Air Research NIVA Norwegian Institute for Water Research NPD Norwegian Petroleum Directorate NPRA Norwegian Public Roads Administration OECD Organisation for Economic Co-operation and Development OLF Norwegian Oil Industry Association OSPAR The Oslo and Paris Convention PRODCOM PRODucts of the European COMmunity QA/QC Quality Assurance and Quality Control RVP Reid vapour pressure SACS Saline aquifer carbon dioxide storage project SFT Norwegian Pollution Control Authority. From 2010: The Climate and Pollution Agency SINTEF Institute of Social Research in Industry SPS Specific wear of studded tyres SWDS Solid waste disposal sites TNO Institute of Environmental and Energy Technology UNECE United nations - Economic Commission for Europe UNFCCC United Nations Framework Convention on Climate Change VPU Vapour recovery units

Documents 21/2011 The Norwegian Emission Inventory 2011
Statistics Norway 211
Appendix B: Emission factors In the calculations the numbers are used with the highest available accuracy. In this tables though, they are only shown rounded off, which i some cases can lead to the result that the exceptions looks the same as the general factors. For road traffic this general view of the emission factors only includes last years factors and not all time series. In the tables for stationary combustion, dotted cells indicate combinations of fuel and source without consumption. A description of the sector codes used in the tables is given in Appendix F.
CO2, SO2 and heavy metals - Stationary and mobile combustion
Table B1. General emission factors for CO2, SO2 and heavy metals
CO2 SO21 Pb Cd Hg As Cr Cu
tonne/tonne2 kg/tonne2 g/tonne2 g/tonne2 g/tonne2 g/tonne2 g/tonne2 g/tonne2
Coal 2.52 163 0.23 0.0033 0.053 0.0893 0.0653 0.0873
Coke 3.19 18 0.23 0.0033 0.053 0.0893 0.0653 0.0873
Petrol coke 3.59 18 0.2 0.003 0.05 0.089 0.065 0.087Motor gasoline 3.13 0.01 0.034 0.01 0 0.05 0.05 1.7Aviation gasoline 3.13 0.4 675.7 0.01 0 0.05 0.05 1.7Kerosene (heating) 3.15 0.302 0.07 0.01 0.03 0.05 0.04 0.05Jet kerosene 3.15 0.371 0.07 0.01 0.03 0.05 0.05 0.05Auto diesel 3.175 0.02856 0.1 0.01 0.05 0.05 0.05 1.7Marine gas oil/diesel 3.17 1.069 0.1 0.01 0.05 0.05 0.04 0.05Light fuel oils 3.17 0.949 0.1 0.01 0.05 0.05 0.04 0.05Heavy distillate 3.17 4.31 0.1 0.01 0.05 0.05 0.04 0.05Heavy fuel oil 3.2 17.427 1 0.1 0.2 0.057 1.35 0.53Natural gas (1000 Sm3) 1.99/2.348 0 0.00025 0.002 0.001 0.004 0.021 0.016LPG 3 0 0 0 0 0.004 0.021 0.016Refinery gas 2.8 0 0 0 0 0.004 0.021 0.016Blast furnace gas 1.571 0 0 0 0 0.004 0.021 0.016Fuel gas 2.5 0 0 0 0 0.004 0.021 0.016Landfill gas 0 0.019 0 0 0 0.004 0.021 0.016Biogas 0 0 0.000294 0.001998 0.001175 0.004446 0.024679 0.018803Fuel wood 0 0.2 0.05 0.1 0.010244 0.159 0.152 0.354Wood waste 0 0.37 0.05 0.1 0.010244 0.159 0.152 0.354Black liquor 0 0.37 0.05 0.1 0.010244 0.159 0.152 0.354Municipal waste 0.54179 1.4 0.00304 0.00015 0.00016 0.022 0.001 0.000985Special waste 3.2 9.2 14 0.6 0.2 1 31 251 Applies to 2009 for petroleum products; the factors change yearly, in accordance with changes in the sulphur content in the products. 2 For natural gas: 1000 Sm3. 3 Exceptions: Direct-fired furnaces in cement production = 9.1 and small stoves in households = 20. 4 From 1997 - considerably higher earlier years. Earlier used factors are not shown in this Appendix. 5 From 2006 the emission factor has been corrected for use of bio diesel, which not causes emissions of CO2: 2006: 3.159, 2007: 3.114, 2008: 3.029, 2009: 3.006 . 6 Applies to road traffic.Weighted average of duty-free and dutiable auto diesel. 7 Stationary combustion. 8 Respectively dry gas (domestic use) and rich gas (continental shelf). 9 From 1996. For earlier years: 0.251. Numbers in italics have exceptions for some sectors, see table B2 and B5. Bold numbers are different for different years, see table B3, B4 and B5. Source: Norwegian Petroleum Industry Association, Rosland (1987), SFT (Norwegian pollution control authority 1990), SFT (Sandgren et al. 1996), Finstad et al. (2001) and Finstad et al. (2003) .
Table B2. Exceptions from the general emission factors for heavy metals: Solid fuels in small stoves (households)
Pb Cd Hg As Cr Cu
g/tonne g/tonne g/tonne g/tonne g/tonne g/tonneCoal 2.5 0.15 0.3 1.2 0.9 1.2Coke 2.5 0.15 0.3 1.2 0.9 1.2

The Norwegian Emission Inventory 2011 Documents 21/2011
212 Statistics Norway
Table B3. Time series for variable emission factors for SO2 (kg/tonne)
Years V11 Motor
gasoline
V13 Kerosene (heating)
V14 Jet
kerosene
V15 Auto diesel
V17 Marine
gas oil/diesel
V18 Light
fuel oils
V19 Heavy
distillate
V20 Heavy fuel oil
(LS-oil)
V20 Heavy fuel oil
(NS-oil)
General General General General M.1A3B.1 Passenger
cars
M.1A3B.2 Light duty
vehicles
M.1A3B.3 Heavy
duty vehicles
General General General General General
1980 1 0.2 0.2 6.6 . . . 6.6 6.6 15 19 461987 0.7 0.4 0.4 4.4 . . . 4.4 4.4 9 19 441989 0.6 0.4 0.4 3.4 . . . 3.4 3.4 7.6 18.2 401990 0.6 0.3 0.3 3.2 . . . 3.2 3.2 6 17 39.41991 0.6 0.38 0.38 2.8 . . . 2.8 2.8 4.6 16.8 43.61992 0.6 0.32 0.32 2.6 . . . 2.6 2.6 4.4 16.4 42.61993 0.6 0.42 0.42 2.2 . . . 2.2 2.2 4.4 16.2 45.81994 0.6 0.36 0.36 1.4 . . . 1.4 1.4 4.2 14.2 44.81995 0.24 0.46 0.46 1.4 . . . 1.4 1.4 4.6 11.8 43.41996 0.22 0.46 0.5 1.2 . . . 1.2 1.2 3.8 12.6 46.61997 0.16 0.46 0.46 1.2 . . . 1.2 1.2 3.8 12.6 47.21998 0.16 0.42 0.42 0.8 . . . 1.8 1.8 4.2 12.4 42.81999 0.22 0.32 0.32 0.6 . . . 1.6 1.6 4.4 12.8 392000 0.18 0.36 0.36 1.4 0.1174 0.1174 0.1174 1.8 1.8 4.6 14.4 312001 0.18 0.46 0.46 0.8 0.0885 0.0885 0.0885 1.8 1.8 4.8 13.2 44.42002 0.2 0.32 0.32 0.6 0.0708 0.0708 0.0708 1.6 1.2 4.8 12 43.82003 0.1 0.3 0.3 0.8 0.0748 0.0748 0.0748 2 0.8 4.6 14 44.22004 0.06 0.3 0.3 0.8 0.0748 0.0748 0.0748 1.8 0.8 5 14.2 44.22005 0.01 0.28 0.28 0.8 0.0278 0.0278 0.0278 1.8 0.8 4.6 13.6 39.22006 0.01 0.27 0.27 1.38 0.0393 0.0393 0.0393 2 1.38 4.44 10.4 26.22007 0.01 0.296 0.296 0.73 0.0244 0.0244 0.0244 1.53 0.73 4.17 17.8 19.972008 0.01 0.286 0.286 0.786 0.0285 0.0285 0.0285 1.562 0.986 3.098 17.5 28.542009 0.01 0.302 0.371 0.016 0.0285 0.0285 0.0285 1.069 0.949 4.31 17.4 27.8
Table B4. Time series for variable emission factors for heavy metals, stationary combustion. g/tonne
1990-1991 1992-
Sector Source Fuel Pb Cd Hg Pb Cd HgGeneral S.03 V51 0.0085 0.00047 0.00035 0.00304 0.00015 0.00016
Table B5. Exceptions with time series for variable emission factors for natural gas combusted by oil exploration, tonne CO2/1000 Sm3 natural gas
Sector Source Fuel Component 1990-1994
1995 1996 1997 1998 1999 2000 2001 2002*
230600.1 S.02 V31 CO2 2.34 2.29 2.3 2.3 2.31 2.5 2.48 2.47 2.45230600.1 S.1B2C V31 CO2 2.34 2.42 2.34 2.34 2.34 2.48 2.52 2.42 2.47*For the years after 2002 reported emissions are used

Documents 21/2011 The Norwegian Emission Inventory 2011
Statistics Norway 213
Aviation - CH4, N2O, NOX, NMVOC, CO, particles and PAH
Table B6. General emission factors for aviation
Source Fuel CH4 kg/
tonne
N2O kg/
tonne
NOX
kg/tonne
NMVOC kg/
tonne
CO kg
/tonne
NH3
kg/tonne
TSP, PM10, PM2.5
kg/tonne
PAH g/ tonne
PAH-OSPAR g/tonne
PAH-4 g/tonne
Dioxinsug/
tonne
M.1A3A.111 Jet/turboprop 0-100 m
V14 Jet kerosene
0.185 0.1 6.854 1.668 18.764 0 0.025 0.54 0.02 0.005 0.06
M.1A3A.112 Jet/turboprop 100-1000 m
V14 Jet kerosene
0.030 0.1 13.208 0.273 2.036 0 0.025 0.32 0.02 0.005 0.06
M.1A3A.12 Jet/turboprop cruise
V14 Jet kerosene
0 0.1 12.106 0.569 3.080 0 0.007 0.29 0.02 0.005 0.06
M.1A3A.211 Helicopter 0-100 m
V14 Jet kerosene
3.2 0.1 6.67 28.8 36.6 0 0.025 0.54 0.02 0.005 0.06
M.1A3A.212 Helikopter 100-1000 m
V14 Jet kerosene
3.2 0.1 6.67 28.8 36.6 0 0.025 0.32 0.02 0.005 0.06
M.1A3A.22 Helicopter cruise
V14 Jet kerosene
0 0.1 6.67 32 36.6 0 0.007 0.29 0.02 0.005 0.06
M.1A3A.311 Small aircrafts 0-100 m
V12 Aviation gasoline
3.61 0.1 0 32.5 898.7 0 0.025 0.54 0.02 0.005 2
M.1A3A.312 Small aircrafts 100-1000 m
V12 Aviation gasoline
1.55 0.1 3.617 13.95 932.5 0 0.025 0.32 0.02 0.005 2
M.1A3A.32 Small aircrafts cruise
V12 Aviation gasoline
0 0.1 2.92 19.48 926 0 0.007 0.29 0.02 0.005 2
Numbers in italics have exceptions for some sectors, see table B7, and bold numbers are different for different years, see table B8. Source: IPCC (2000), Finstad et al. (2001) and Finstad et al. (2002a).
Table B7. Exceptions from the general factors for aviation
Component Emission factor
Fuel Source Sectors
CH4 0.35 V14 Jet kerosene M.1A3A.111-112, M1A3A.211-212 248422NOX 13.51 V14 Jet kerosene M.1A3A.111, M1A3A.211 248422NOX 13.29 V14 Jet kerosene M.1A3A.112, M1A3A.212 248422NOX 11.7 V14 Jet kerosene M.1A3A.12, M.1A3A.22 248422NMVOC 7.43 V14 Jet kerosene M.1A3A.111, M1A3A.211 248422NMVOC 7.36 V14 Jet kerosene M.1A3A.112, M1A3A.212 248422NMVOC 4.3 V14 Jet kerosene M.1A3A.12, M.1A3A.22 248422CO 23.67 V14 Jet kerosene M.1A3A.111, M1A3A.211 248422CO 23.15 V14 Jet kerosene M.1A3A.112, M1A3A.212 248422CO 20.9 V14 Jet kerosene M.1A3A.12, M.1A3A.22 248422PAH 0.18 V12, 14 Aviation gasoline, jet kerosene M.1A3A.111, M1A3A.211, M1A3A.311 235100.2NPAH 0.05 V12, 14 Aviation gasoline, jet kerosene M.1A3A.112, M1A3A.212, M1A3A.312 235100.2NPAH 0.1 V12, 14 Aviation gasoline, jet kerosene M.1A3A.12, M.1A3A.22, M.1A3A.32 235100.2NPAH-OSPAR, PAH-4 0 V12, 14 Aviation gasoline, jet kerosene M.1A3A.112, M.1A3A.12, M1A3A.212,
M.1A3A.22, M1A3A.312, M.1A3A.32 235100.2N
Table B8. Time series for variable emission factors for aviation. Factors for 1989, 1995, and 2000 are calculated as given in the table. Factors for 1990-1994 and 1996-1999 are calculated by linear interpolation. Factors before 1989 and after 2000 are kept constant
CH4 NOX NMVOC CO
Sector Source Fuel 1989 1995 2000 1989 1995 2000 1989 1995 2000 1989 1995 2000 M.1A3A.111 V14 0.156 0.201 0.185 6.026 7.2 6.854 1.402 1.8 1.668 11.105 17.5 18.764M.1A3A.112 V14 0.026 0.033 0.030 11.611 13.904 13.208 0.230 0.297 0.273 1.205 1.895 2.036General M.1A3A.12 V14 0 0 0 10.663 12.061 12.106 1.022 0.660 0.569 3.450 3.268 3.080M.1A3A.111 V14 0.157 0.336 0.393 6.725 8.118 7.689 1.410 3.025 3.534 11.557 17.213 18.954M.1A3A.112 V14 0.026 0.055 0.067 12.960 15.643 15.619 0.231 0.495 0.605 1.254 1.868 2.978235100.2N M.1A3A.12 V14 0 0 0 10.663 11.572 11.333 1.022 3.505 0.502 3.450 6.293 1.701M.1A3A.111 V14 0.157 0.336 0.393 6.725 8.118 7.689 1.410 3.025 3.534 11.557 17.213 18.954M.1A3A.112 V14 0.026 0.055 0.067 12.960 15.643 15.619 0.231 0.495 0.605 1.254 1.868 2.978665100.2 M.1A3A.12 V14 0 0 0 10.663 11.572 11.333 1.022 3.505 0.502 3.450 6.293 1.701

The Norwegian Emission Inventory 2011 Documents 21/2011
214 Statistics Norway
Road traffic - CH4, N2O, NOX, NMVOC, CO, NH3, particles and PAH
Table B9. General emission factors for road traffic
Source Fuel CH4 kg/tonne
N2O kg/tonne
NOX kg/tonne
NMVOC kg/tonne
CO kg/tonne
NH3 kg/tonne
TSP, PM10
kg/tonne
PM2.5kg/tonne
PAH g/tonne
PAH-OSPAR g/tonne
PAH-4 g/tonne
Dioxinsug/tonne
V11 Motor gasoline 0.509 0.068 6.721 8.623 56.264 1.335 0.055 0.055 1.000 0.446 0.126 0.1V15 Auto diesel 0.021 0.081 9.360 0.843 4.555 0.019 0.647 0.615 4.367 2.383 0.447 0.1V31 Natural gas 0.261 0.0255 0.871 0.0653 1.69 0 0.122 0.122 0.015 0.00085 0 0.05
M.1A3B.1 Passenger car
V32 LPG 0 0.052 2.331 0 11.914 0 0.061 0.061 0 0 0 0.06V11 Motor gasoline 0.701 0.137 8.952 12.035 127.396 1.107 0.103 0.103 1.000 0.446 0.126 0.1
M.1A3B.2 Other light duty cars V15 Auto
diesel 0.022 0.061 12.402 0.896 5.289 0.014 1.191 1.132 4.367 2.383 0.447 0.1V11 Motor gasoline 0.566 0.043 27.520 16.489 21.919 0.018 0 0 1.995 0.998 0.21 0.1V15 Auto diesel 0.021 0.031 22.647 0.859 5.566 0.009 0.458 0.435 3.563 1.782 0.428 0.1
M.1A3B.3 Heavy duty vehicles
V31 Natural gas 0 0 33.974 0 5.899 0.0075 0.139 0.139 0.015 0.00085 0 0.05
M.1A3B.41 Moped
V11 Motor gasoline 19.481 0.051 3.202 124.855 219.281 0.051 0 0 2 0.53 0.08 0.1
M.1A3B.42 Motorcycle
V11 Motor gasoline 1.276 0.058 4.775 22.918 241.448 0.058 0 0 2 0.53 0.08 0.1
Bold numbers are different for different years, but only the 2009 data are shown in this Appendix, except for CH4 (table B10) and N2O (table B11). Source: Results from Statistiics Norway’s use of HBEFA (INFRAS 2009) and Finstad et al. (2001).
Table B10. Average CH4 emission factors for road traffic including cold start emissions and evaporation, g CH4/ kg fuel
V11 Motor gasoline V15 Auto diesel
Passenger car
Other light duty cars
Heavy duty vehicles
Moped Motorcycle Passenger car
Other light duty cars
Heavy duty vehicles
1980 2.024 2.282 0.587 13.285 3.815 0.119 0.109 0.1161987 2.021 2.273 0.592 13.417 3.853 0.109 0.099 0.1001989 1.961 2.239 0.584 13.234 3.622 0.118 0.108 0.1081990 1.866 2.180 0.570 12.913 3.363 0.096 0.087 0.0871991 1.823 2.186 0.574 12.998 3.108 0.092 0.085 0.0861992 1.773 2.151 0.575 13.025 2.872 0.084 0.080 0.0821993 1.716 2.077 0.576 13.039 2.612 0.078 0.077 0.0681994 1.653 1.993 0.578 13.075 2.409 0.086 0.089 0.0741995 1.584 1.884 0.580 13.136 2.250 0.082 0.085 0.0711996 1.442 1.726 0.571 12.934 2.013 0.078 0.080 0.0671997 1.382 1.671 0.587 13.288 1.950 0.080 0.082 0.0661998 1.253 1.508 0.570 12.915 1.682 0.076 0.074 0.0561999 1.152 1.407 0.568 12.859 1.592 0.073 0.070 0.0522000 1.093 1.344 0.583 13.198 1.540 0.070 0.067 0.0502001 0.964 1.174 0.559 12.671 1.426 0.060 0.058 0.0432002 0.879 1.075 0.558 12.652 1.397 0.053 0.053 0.0402003 0.793 0.994 0.551 13.133 1.407 0.047 0.049 0.0382004 0.709 0.914 0.544 14.283 1.425 0.041 0.044 0.035
2005 0.631 0.837 0.532 15.203 1.425 0.035 0.039 0.032
2006 0.583 0.791 0.539 16.440 1.414 0.030 0.034 0.030
2007 0.560 0.765 0.556 17.832 1.389 0.027 0.030 0.028
2008 0.526 0.721 0.556 18.582 1.289 0.023 0.025 0.024
2009 0.509 0.701 0.566 19.481 1.276 0.021 0.022 0.021Source: Results from Statistics Norway’s use of HBEFA (INFRAS 2009)

Documents 21/2011 The Norwegian Emission Inventory 2011
Statistics Norway 215
Table B11. Average N2O emission factors for road traffic including cold start emissions and evaporation, g N2O/ kg fuel
V11 Motor gasoline V15 Auto diesel
Passenger car Other light duty cars
Heavy duty vehicles
Moped Motorcycle Passenger car Other light duty cars
Heavy duty vehicles
1980 0.086 0.116 0.045 0.053 0.058 0 0 0.0321987 0.095 0.114 0.045 0.054 0.059 0 0 0.0291989 0.098 0.112 0.045 0.053 0.058 0 0 0.0311990 0.099 0.109 0.044 0.052 0.057 0 0 0.0251991 0.105 0.109 0.044 0.052 0.057 0 0 0.0241992 0.110 0.111 0.044 0.052 0.058 0 0 0.0231993 0.117 0.116 0.044 0.052 0.058 0 0 0.0221994 0.125 0.123 0.044 0.052 0.058 0 0 0.0251995 0.136 0.134 0.044 0.053 0.058 0.003 0.005 0.0261996 0.147 0.143 0.044 0.052 0.057 0.009 0.012 0.0261997 0.156 0.158 0.045 0.053 0.059 0.019 0.020 0.0291998 0.154 0.161 0.044 0.052 0.057 0.028 0.026 0.0281999 0.155 0.168 0.043 0.052 0.057 0.037 0.034 0.0282000 0.161 0.180 0.044 0.053 0.059 0.047 0.041 0.0292001 0.156 0.188 0.043 0.051 0.057 0.051 0.043 0.0272002 0.156 0.204 0.043 0.051 0.057 0.057 0.046 0.0262003 0.152 0.179 0.042 0.050 0.056 0.062 0.049 0.0252004 0.147 0.178 0.042 0.050 0.056 0.066 0.052 0.024
2005 0.080 0.155 0.041 0.048 0.055 0.069 0.054 0.023
2006 0.076 0.152 0.041 0.049 0.055 0.072 0.057 0.022
2007 0.075 0.152 0.042 0.051 0.057 0.078 0.061 0.0242008 0.071 0.143 0.042 0.051 0.057 0.080 0.061 0.026
2009 0.068 0.137 0.043 0.051 0.058 0.081 0.061 0.031Source: Results from Statistics Norway’s use of HBEFA (INFRAS 2009)
Navigation - CH4, N2O, NOX, NMVOC, CO, particles and POPs
Table B12. General emission factors for navigation
CH4 kg/
tonne
N2O kg/
tonne
NOX kg/
tonne
NMVOC kg
/tonne
CO kg/
tonne
NH3
kg/tonne
TSP, PM10 kg/
tonne
PM2.5
kg/tonne
PAH g/ tonne
PAH-OSPAR
g /tonne
PAH-4 g/
tonne
Dioxinsug/
tonne
V17 Marine gas oil/diesel, V18 Light fuel oils 0.23 0.08 49.03 2.4 2.9 0 1.6 1.5 1.6 0.26 0.04 4V19 Heavy distillate, V20 Heavy fuel oil 0.23 0.08 49.03 2.4 2.9 0 5.4 5.1 1.6 0.26 0.04 4V31 Natural gas (1000 Sm3) 41.65 0 4.0 0.814 2.143 0 0.032 0.032 0.015 0.00085 0 0.05Numbers in italics have exceptions for some sectors, see table B13, and bold numbers are different for different years, see table B14-B16. Source: Flugsrud and Rypdal (1996), Tornsjø (2001), Finstad et al. (2001), Finstad et al. (2002b), Finstad et al. (2003), Bremnes Nielsen and Stenersen (2010).

The Norwegian Emission Inventory 2011 Documents 21/2011
216 Statistics Norway
Table B13. Exceptions from the general factors for navigation
Component Emission factor (kg/tonne)
Fuel Sector
CH4 0.8 V17 Marine gas oil/diesel 230600.1 -230600.3 CH4 1.9 V20 Heavy fuel oil 230600.1 -230600.3 N2O 0.02 V17 Marine gas oil/diesel 230600.1 -230600.3 NOX 47.53 V17, 19, 20 Marine gas oil/diesel, light fuel oils, heavy distillate, heavy fuel oil 230310.N
NOX 70 V17, 20 Marine gas oil/diesel, light fuel oils, heavy distillate, Heavy fuel oil 230600.1 -230600.3
NOX 47,88 V17, 19, 20 Marine gas oil/diesel, light fuel oils, heavy distillate, heavy fuel oil 248422 NMVOC 1.4 V17, 18, 19, 20 Marine gas oil/diesel, light fuel oils, heavy distillate, heavy fuel oil 230310.N
NMVOC 2.3 V17, 19, 20 Marine gas oil/diesel, light fuel oils, heavy distillate, heavy fuel oil 248422
NMVOC 5 V17 Marine gas oil/diesel, light fuel oils 230600.1 -230600.3 NMVOC 5 V19, 20 Heavy distillate, heavy fuel oil 230600.1 -230600.3
CO 7.9 V17, 18, 19, 20 Marine gas oil/diesel, light fuel oils, heavy distillate, heavy fuel oil 230310.N CO 1.6 V17, 18, 19, 20 Marine gas oil/diesel, light fuel oils, heavy distillate, heavy fuel oil 230600.1 CO 7 V17, 19, 20 Marine gas oil/diesel, light fuel oils, heavy distillate, heavy fuel oil 230600.1 -230600.3 CO 2.3 V17, 19, 20 Marine gas oil/diesel, light fuel oils, heavy distillate, heavy fuel oil 248422
Table B14. Time series for variable emission factors for navigation. NOX
Sector Fuel 1980-1998
1980- 1986
1987 1989 1990 1991 1992 1993 1994 1995 1996 1997 1998
General V17-20 57.33 56.99 56.90 56.85 56.80 56.89 56.77 56.82 56.68 57.23 57.47 57.41 1999 2000 2001 2002 2003 2004 2005 2006 2007 2008 2009General V17-20 56.82 57.82 57.96 57.18 56.80 56.51 55.90 55.55 54.26 51.66 49.03230310.N V17, 19,
20 52.11 52.11 52.12 52.01 51.90 51.80 51.69 51.58 51.48 51.07 50.05 47.53248422 V17, 19,
20 50.17 50.17 49.82 49.60 49.39 49.17 48.95 48.74 48.52 48.31 48.09 47.88Source: (Flugsrud et al. 2010)
Table B15. Time series for variable emission factors for navigation. CH4
Sector Fuel 2000 2001 2002 2003 2004 2005 2006 2007 2008 2009General V31 31.43 31.43 31.43 49.99 52.71 54.55 54.43 36.81 38.83 41.65
Table B16. Time series for variable emission factors for navigation. NMVOC and CO
NMVOC CO Sector Fuel
1980-1990 1980-1997 1980-1998 1991- 1998- 1999- 1980-1997 1998- General V17-20 3.1 2.9 230310.N V17-20 1.5 1.4 230600.1 V17-20 2 1.6 230600.1,230910 V19,20 6.4 5 230600.1,230910 V 20 248422 V17-20 2.2 2.3

Documents 21/2011 The Norwegian Emission Inventory 2011
Statistics Norway 217
Other mobile sources including railways - CH4, N2O, NOX, NMVOC, CO, NH3, particles and POPs
Table B17. General emission factors for other mobile sources
CH4 kg/ tonne
N2O kg/
tonne
NOX kg/
tonne
NMVOC kg/
tonne
CO kg/
tonne
NH3 kg/
Tonne
TSP, PM10
kg/tonne
PM2.5 kg/
tonne
PAH g/ tonne
PAH-OSPAR g/tonne
PAH-4 g/
tonne
Dioxins ug/
tonne
M.1A3C Railway
V15 Auto diesel 0.18 1.2 47 4 11 0 3.8 3.8 3.3 0.53 0.08 0.1
M.1A3E.21 Small boats 2 stroke
V11 Motor gasoline 5.1 0.02 6 240 415 0 8 8 2 0.53 0.08 0.1V11 Motor gasoline 1.7 0.08 12 40 1 000 0 1 1 2 0.53 0.08 0.1
M.1A3E.22 Small boats 4 stroke V15 Auto
diesel 0.18 0.03 54 27 25 0 4 4 3.3 0.53 0.08 0.1M.1A3E.31 Motorized equipment 2 stroke
V11 Motor gasoline 6 0.02 21 500 700 0 8 8 2 0.53 0.08 0.1V11 Motor gasoline 2.2 0.07 10 110 1 200 0 1 1 2 0.53 0.08 0.1V15 Auto diesel 0.17 1.3 26.1 6 15 0.005 4 3.8 3.3 0.53 0.08 0.1
M.1A3E.32 Motorized equipment 4t
V18 Light fuel oils 0.17 1.3 50 6 15 0.005 7.1 6.75 3.3 0.53 0.08 0.1
M.1A3E.1 Snow scooter has the same emission factors as M.1A3B.41 Moped, see table B9. Bold numbers are different for different years. 1Before 1995 the emission factor was 1.3. Numbers in italics have exceptions for some sectors, see table B18–B19. Sources: Bang (1993), SFT (Bang et al. 1999), Finstad et al. (2001), Finstad et al. (2002b), Finstad et al. (2003) and Winther and Nielsen (2006).
Table B18. Exceptions from the general factors for greenhouse gases and precursors for other mobile sources
Component Emission factor (kg/tonne)
Fuel Source Sectors
CH4 6.2 V11 Motor gasoline M.1A3E.31 Motorized equipment 2 stroke 230100CH4 3.7 V11 Motor gasoline M.1A3E.32 Motorized equipment 4 stroke 230100CH4 7.7 V11 Motor gasoline M.1A3E.31 Motorized equipment 2 stroke 230210CH4 8.1 V11 Motor gasoline M.1A3E.31 Motorized equipment 2 stroke 330000CH4 5.5 V11 Motor gasoline M.1A3E.32 Motorized equipment 4 stroke 330000CH4 0.18 V15 Auto diesel M.1A3E.32 Motorized equipment 4 stroke 330000N2O 0.08 V11 Motor gasoline M.1A3E.32 Motorized equipment 4 stroke 230500-233320 NOX 30.3 V15 Auto diesel M.1A3E.32 Motorized equipment 4 stroke 230100
NOX 22.0 V15 Auto diesel M.1A3E.32 Motorized equipment 4 stroke 230210
NOX 54 V18 Light fuel oils M.1A3E.32 Motorized equipment 4 stroke 230100NOX 52 V18 Light fuel oils M.1A3E.32 Motorized equipment 4 stroke 230210NOX 47 V18 Light fuel oils M.1A3E.32 Motorized equipment 4 stroke 230710-230892,
234910 NOX 48 V18 Light fuel oils M.1A3E.32 Motorized equipment 4 stroke 232360, 248422 NOX 46 V18 Light fuel oils M.1A3E.32 Motorized equipment 4 stroke 234110-234120NMVOC 7.2 V15, 18 Auto diesel, light fuel oils M.1A3E.32 Motorized equipment 4 stroke 230100NMVOC 5.7 V15, 18 Auto diesel, light fuel oils M.1A3E.32 Motorized equipment 4 stroke 230210NMVOC 4 V15, 18 Auto diesel, light fuel oils M.1A3E.32 Motorized equipment 4 stroke 230710-
230892,234910 NMVOC 4.8 V15, 18 Auto diesel, light fuel oils M.1A3E.32 Motorized equipment 4 stroke 232360, 248422 NMVOC 3.8 V15, 18 Auto diesel, light fuel oils M.1A3E.32 Motorized equipment 4 stroke 234110-234120CO 25 V15, 18 Auto diesel, light fuel oils M.1A3E.32 Motorized equipment 4 stroke 230100CO 20 V15, 18 Auto diesel, light fuel oils M.1A3E.32 Motorized equipment 4 stroke 230210CO 11 V15, 18 Auto diesel, light fuel oils M.1A3E.32 Motorized equipment 4 stroke 230710-230892,
234910 CO 17 V15, 18 Auto diesel, light fuel oils M.1A3E.32 Motorized equipment 4 stroke 234110-234120CO 18 V15, 18 Auto diesel, light fuel oils M.1A3E.32 Motorized equipment 4 stroke 248422
Bold numbers are different for different years, see table B20.

The Norwegian Emission Inventory 2011 Documents 21/2011
218 Statistics Norway
Table B19. Exceptions from the general factors for other pollutants for other mobile sources
Component Emission factor (kg/tonne)
Fuel Source Sectors
TSP, PM10 7.1 V15 Auto diesel M.1A3E.32 Motorized equipment 4 stroke 230100-230210 TSP, PM10 3.8 V15, 18 Auto diesel, light fuel oils M.1A3E.32 Motorized equipment 4 stroke 230710-230892, 234910 TSP, PM10 4.2 V15, 18 Auto diesel, light fuel oils M.1A3E.32 Motorized equipment 4 stroke 232360TSP, PM10 5.3 V15, 18 Auto diesel, light fuel oils M.1A3E.32 Motorized equipment 4 stroke 234110-234120TSP, PM10 5.4 V15, 18 Auto diesel, light fuel oils M.1A3E.32 Motorized equipment 4 stroke 248422PM2.5 6.75 V15 Auto diesel M.1A3E.32 Motorized equipment 4 stroke 230100-230210 PM2.5 3.61 V15, 18 Auto diesel, light fuel oils M.1A3E.32 Motorized equipment 4 stroke 230710-230892, 234910 PM2.5 3.99 V15, 18 Auto diesel, light fuel oils M.1A3E.32 Motorized equipment 4 stroke 232360PM2.5 5.04 V15, 18 Auto diesel, light fuel oils M.1A3E.32 Motorized equipment 4 stroke 234110-234120PM2.5 5.13 V15, 18 Auto diesel, light fuel oils M.1A3E.32 Motorized equipment 4 stroke 248422
Table B20. Time series1 for NOX emission factors for use of auto diesel in motorized equipment 4t
Sector 1980 1987 1989 1990 1997 1998 1999 2000 2001 2002 2003 2004 2005 2006 2007 2008 2009General 38.8 39.4 39.9 40.2 44.3 44.5 43.6 42.6 41.2 39.7 37.7 35.7 34.0 32.2 29.9 27.6 26.1230100 30.1 31.2 32.2 32.7 39.3 40.0 40.7 41.3 41.8 40.8 39.3 37.9 36.3 34.4 32.3 30.3 28.4230210 31.2 34.0 36.2 37.2 45.4 46.0 45.7 45.4 44.8 42.3 38.7 35.5 32.0 28.1 24.4 22.0 19.51 Emission factoes for the years 1991 to 1996 can be given on request. Source: Winther and Nielsen (2006). Data for 2005 and later are extrapolations.
Table B21. Time series for variable emission factors for other mobile sources
Fuel Component 1980-1990 1991 1992 1993 1994 1995 1996 1997-V11 Gasoline Dioxins 1.32 1.11 0.95 0.69 0.25 0.23 0.11 0.1
CH4 - Stationary combustion
Table B22. General emission factors, kg CH4/tonne fuel
Source V01 Coal
V02 Coke
V03 Petrol coke
V41 Fuel
wood
V42 Wood waste
V43 Black liquor
V44 Wood
pellets
V45 Wood
briquettes
V04 Char-
coal
V31 Natural
gas (1000 Sm3)
V33 Re-
finery gas
V34 Blast
fur-nace gas
V36 Land-
fill gas
V35 Fuel gas
V32 LPG
V13 Kero-sene
(heating)
V17 Marine
gas oil/
diesel
V18 Light
fuel oils
V19 Heavy
dis-tillate
V20 Heavy
fuel oil
V51 Muni-cipal
waste
V52 Special
waste
S.01 Direct-fired furnaces 0.028 0 0 . . . . . . 0.05 0.054 0.054 . 0.05 . . 0.016 . 0.04 0.04 . 0.04S.02 Gas turbines . . . . . . . . . 0.91 . . . . . . 0 . . . . .S.03 Boilers 0.28 0.28 0.28 . 0.25 0.25 0.25 0.25 . 0.2 0.24 0.24 0.24 0.24 0.17 0.17 0.4 0.4 0.4 0.4 0.23 0.4S.04 Small stoves 8.4 8.4 . 5.3 . . 5.3 . 8.4 . . . . . 0.24 0.3 . 0.4 0.4 . . .S.1B2C Flares . . . . . . . . . 0.24 0.28 . 0.37 . . . . . . . . .
Numbers in italics have exceptions for some sectors, see table B23. Source: IPCC (1997a), SFT (Sandgren et al. 1996), SINTEF (Karlsvik 1995) and OLF (The Norwegian oil industry association 1994).
Table B23. Exceptions from the general factors for CH4, stationary combustion (kg CH4/tonne fuel)
Emission factor
Fuel Source Sectors
0 V31, 35 Natural gas (1000 Sm3), fuel gas S.01 Direct fired furnaces 232350-2323600.085 V31 Natural gas (1000 Sm3) S.01 Direct fired furnaces 2320140.03 V01 Coal S.03 Boilers 230500, 230600.1, 230600.3, 231922,
233510-2335300.1 V17, 18, 19, 20, 52 Fuel oils incl. spezial waste S.03 Boilers 230500-233530 (Industry incl. power
supply)0.0425 V31 Natural gas (1000 Sm3) S.03 Boilers 230500, 230600.1, 230600.3, 231922,
233510-2335300 V34 Blast furnace gas S.03 Boilers 2319221 V33 Refinery gas S.02 Gas turbines 233511

Documents 21/2011 The Norwegian Emission Inventory 2011
Statistics Norway 219
N2O - Stationary combustion
Table B24. General emission factors. kg N2O/tonne fuel
Source V01 Coal
V02 Coke
V03 Petrol coke
V41 Fuel
wood
V42 Wood waste
V43 Black liquor
V44 Wood
pellets
V45 Wood
bri-quettes
V04 Char-
coal
V31 Natural
gas (1000 Sm3)
V33 Re-
finery gas
V34 Blast furn-ace gas
V36 Land-
fill gas
V35 Fuel gas
V32 LPG
V13 Kero-sene
(heating)
V17 Marine
gas oil/
diesel
V18 Light
fuel oils
V19 Heavy
dis-tillate
V20 Heavy fuel oil
V51 Munici-
pal waste
V52 Special
waste
S.01 Direct-fired furnaces 0 0 0 . . . . . . 0.02 0.024 0.024 0.024 0.024 . . 0.03 . 0.03 0.03 . 0.03S.02 Gas turbines . . . . . . . . . 0.019 . . . . . . 0.024 . . . . .S.03 Boilers 0.04 0.04 0.04 . 0,07 0,07 0.07 0.07 . 0.004 0.005 0.005 0.005 0.005 0.03 0.03 0.03 0.03 0.03 0.03 0.035 0.03S.04 Small stoves 0.04 0.04 . 0.032 . . 0.032 . 0.04 . . . . . 0.03 0.03 . 0.03 0.03 . . .S.1B2C Flares . . . . . . . . . 0.02 0.024 . 0.002 . . . . . . . . .
Numbers in italics have exceptions for some sectors, see table B25. Source: IPCC (1997a), SFT (Sandgren et al. 1996) and OLF (The Norwegian oil industry association 1994).
Table B25. Exceptions from the general factors for N2O. Stationary combustion (kg N2O/1000 Sm3 natural gas)
Emission factor Fuel Source Sectors
0.017 V31 Natural gas S.01 Direct-fired furnaces 232014 0.023 V33 Refinery gas S.02 Gas turbines 233511
NOX - Stationary combustion
Table B26. General emission factors. kg NOX/tonne fuel
Source V01Coal
V02 Coke
V03 Petrol coke
V41 Fuel
wood
V42 Wood waste
V43 Black liquor
V44 Wood
pellets
V45 Wood
bri-quettes
V04 Char-
coal
V31 Natural
gas (1000 Sm3)
V33 Re-
finery gas
V34 Blast furn-ace gas
V36 Land-
fill gas
V35 Fuel gas
V32 LPG
V13Kero-sene
(heating)
V17 Marine
gas oil/
diesel
V18Lightfueloils
V19 Heavy
dis-tillate
V20 Heavy
fuel oil
V51 Munici-
pal waste
V52 Special
waste
S.01 Direct-fired furnaces 16 20 20 . . . . . . 5.95 5.4 5.4 . 5.4 . . 70 . 5 5 . 5S.02 Gas turbines . . . . . . . . . 6.27 . . . . . . 16 . . . . .S.03 Boilers 3 3 3.4 . 0.9 0.9 1.3 1.3 . 2.55 3 3 0.01 3 2.3 3 2.5 2.5 2.5 4.2 1.365 4.2S.04 Small stoves 3 3 .0.986 . . 1.1 . 1.4 . . . . . 2.3 2.5 . 2.5 2.5 . . .S.1B2C Flares . . . . . . . . . 1.4 7 . 0.17 . . . . . . . . .Numbers in italics have exceptions for some sectors, see table B27, and bold numbers are different for different years, see table B28. Source: Rosland (1987). Fuel wood factor based on data from annual surveys on use of fuel wood in households.
Table B27. Exceptions from the general factors for NOX. Stationary combustion. kg NOX /tonne fuel
Emission factor
Fuel Source Sectors
24 V19, 20, 52 Heavy distillate, heavy fuel oil, special waste S.01 Direct-fired furnaces 231910.2, 232350
6.13 V31 Natural gas (1000 Sm3) S.01 Direct-fired furnaces 232014
9.5 V19, 20 Heavy distillate, heavy fuel oil S.01 Direct-fired furnaces 232360
8.681 V31 Natural gas (1000 Sm3) S.02 Gas turbines 230600.1
3 V17, 18, 19 Fuel oils S.03 Boilers 230500-233320 4.5 V01 Coal S.03 Boilers 230500-233320 3.4 V02 Coke S.03 Boilers 230500-233320 5 V20, 52 Heavy fuel oil, special waste S.03 Boilers 230500-233320 2.9 V35 Fuel gas S.03 Boilers 232011-232050, 232411-2324420.01 V34 Blast furnace gas S.03 Boilers 233510-233530 6.27 V33 Refinery gas S.02 Gas turbines 2335111.4 V01, 02 Coal, coke S.04 Small stoves 330000

The Norwegian Emission Inventory 2011 Documents 21/2011
220 Statistics Norway
Table B28. Time series for variable emission factors for NOX. Stationary combustion. kg NOX /tonne fuel
Sector Source Fuel 1980-1990
1991 1992-1994
1995 1996-1998
1999-2004
2005 2006 2007 2008 2009
General S.04 V41 0.982 0.981 0.982 0.981 0.982 0.981 0.985 0.984 0.987 0.988 0.986 Sector Source Fuel 1980-
1990 1991 1992 1993 1994 1995 1996 1997 1998 1999 2000-
2009
230600.1 S.02 V31 8.223 8.172 8.234 8.444 8.617 8.874 9.128 9.185 9.528 9.087 8.681
NMVOC - Stationary combustion
Table B29. General emission factors. kg NMVOC/tonne fuel
Source V01Coal
V02 Coke
V03 Petrol coke
V41 Fuel
wood
V42 Wood waste
V43Blackliquor
V44 Wood
pellets
V45 Wood
bri-quettes
V04 Char-
coal
V31 Natural
gas (1000 Sm3)
V33 Re-
finery gas
V34 Blast
furnace gas
V36Land-
fillgas
V35 Fuel gas
V32 LPG
V13Kero-sene
(heating)
V17 Marine gas oil/ diesel
V18 Light
fuel oils
V19 Heavy
dis-tillate
V20 Heavy fuel oil
V51 Munici-
pal waste
V52 Special
waste
S.01 Direct-fired furnaces 0 0 0 . . . . . . 0 0.1 0. 0. . 5 . 0.3 0.3 . 0.3S.02 Gas turbines . . . . . . . . . 0.24 . . . . . . 0.03 . . . . .S.03 Boilers 1.1 0.6 0.6. 1.30 1.3 1.3 . 0.085 0.1 0.10 0.1 0.1 0.4 0.4 0.4 0.4 0.3 0.7 0.3S.04 Small stoves 1.1 0.6 . 7.0 . . 6.501 . 10. .. . . 0.1 0.4. 0.4 0.4 . .S.1B2C Flares . . . . . . . . . 0.06 13.5. 0 . . . . . . . . .
Numbers in italics have exceptions for some sectors, see table B30. Source: Rosland (1987) and SFT (Sandgren et al. 1996).
Table B30. Exceptions from the general factors for NMVOC. Stationary combustion. kg NMVOC/tonne fuel
Emission factor
Fuel Source Sectors
0 V 19, 20, 52 Heavy distillate, heavy fuel oil, special waste S.01 Direct-fired furnaces
231910.2, 232350
0.1 V34 Blast furnace gas S.01 Direct-fired furnaces
231910.2
0.085034 V31 Natural gas (1000 Sm3) S.01 Direct-fired furnaces
232014
0.9 V19, 20 Heavy distillate, heavy fuel oil S.01 Direct-fired furnaces
232360
0.8 V01 Coal S.03 Boilers 230500-233320 0 V32, 34, 35, 42 LPG, blast furnace gas, fuel gas, wood waste S.03 Boilers 230500-233320, 231711, 232011-
232050, 233510-233530 0.6 V17, 18, 19 Fuel oils S.03 Boilers 33000010 V01 Coal S.04 Small stoves 3300000.6 V13 Kerosene (heating) S.04 Small stoves 330000
CO - Stationary combustion
Table B31. General emission factors. kg CO/tonne fuel
Source V01 Coal
V02 Coke
V03 Petrol coke
V41 Fuel
wood
V42 Wood waste
V43 Black liquor
V44 Wood
pellets
V45 Wood
bri-quettes
V04 Char-
coal
V31 Natural
gas (1000 Sm3)
V33 Re-
finery gas
V34 Blast furn-ace gas
V36 Land-
fill gas
V35 Fuel gas
V32 LPG
V13 Kero-sene
(heating)
V17 Marine
gas oil/
diesel
V18 Light fuel oils
V19 Heavy
dis-tillate
V20 Heavy
fuel oil
V51 Munici-
pal waste
V52 Special
waste
S.01 Direct-fired furnaces 0 0 0 . . . . . . 0 0 0 . 0 . . 5 . 0.2 0.2 . 0.2S.02 Gas turbines . . . . . . . . . 1.7 . . . . . . 0.7 . . . . .S.03 Boilers 3 3 3 . 15 0 15 15 . 0 0 0 0 0 0.5 2 2 2 2 0.4 2.8 0.4S.04 Small stoves 3 3 . 105.1 . . 2.6 . 100 . . . . . 0.5 2 . 2 2 . . .S.1B2C Flares . . . . . . . . . 1.5 0 . 0.04 . . . . . . . . .
Numbers in italics have exceptions for some sectors, see table B32, and bold numbers are different for different years, see table B33.

Documents 21/2011 The Norwegian Emission Inventory 2011
Statistics Norway 221
Table B32. Exceptions from the general factors for CO. Stationary combustion. kg CO/tonne fuel
Emission factor
Fuel Source Sectors
0 V 19, 20, 52 Heavy distillate, heavy fuel oil, special waste S.01 Direct-fired furnaces 231910.2, 232350, 2323600.01 V34 Blast furnace gas S.01 Direct-fired furnaces 231910.20.2 V20. 52 Heavy fuel oil, special waste S.03 Boilers 230500-233320 0 V32, 42 LPG, wood waste S.03 Boilers 230500-233320, 231711 6.5 V17, 18, 19 Fuel oils S.03 Boilers 330000100 V01, 02 Coal, coke S.04 Small stoves 3300006.5 V13 Kerosene (heating) S.04 Small stoves 3300001.7 V31 Natural gas (1000 Sm3) S.1B2C Flares 231922
Table B33. Time series for variable emission factors for CO. Stationary combustion. kg CO/tonne fuel
Sector Source Fuel 1980-1990
1991 1992-1994
1995 1996-1997
1998 1999 2000 2001 2002 2003 2004 2005 2006 2007
General S.04 V41 149.1 149.2 149.1 149.2 149.1 145.5 142.1 138.5 135.0 131.4 127.4 123.5 115.6 111.8 110.1
Sector Source Fuel 2008 2009
General S.04 V41 107.1 105.1
NH3 - Stationary combustion
Table B34. General emission factors. kg NH3/tonne fuel
Source V01Coal
V02 Coke
V03 Petrol coke
V41 Fuel
wood
V42 Wood waste
V43 Black liquor
V44 Wood
pellets
V45Wood
bri-quettes
V04 Char-
coal
V31 Natural
gas (1000 Sm3)
V33 Re-
finery gas
V34 Blast furn-ace gas
V36 Land-
fill gas
V35 Fuel gas
V32LPG
V13 Kero-sene
(heating)
V17 Marine
gas oil/
diesel
V18Lightfueloils
V19 Heavy
dis-tillate
V20 Heavy fuel oil
V51 Munici-
pal waste
V52 Special
waste
S.04 Small stoves . . . 0.066 . . 0.066 . . . . . . . . . . . . . . .All other sources 0 0 0 . 0 0 0 0 0 0 0 0 0 0 0 0 0 0 0 0 0 0

The Norwegian Emission Inventory 2011 Documents 21/2011
222 Statistics Norway
Particulate matter - Stationary combustion
Table B35. General emission factors. kg particle component/tonne fuel
Com-po-nent
Source V01 Coal
V02 Coke
V03 Pe-trol
coke
V41 Fuel
wood
V42 Wood waste
V43 Black liquor
V44 Wood
pellets
V45 Wood
bri-quettes
V04 Char-
coal
V31 Natural
gas (1000 Sm3)
V33 Re-
finery gas
V34 Blast furn-ace gas
V36 Landf
ill gas
V35 Fuel gas
V32 LPG
V13 Kero-sene
(heat-ing)
V17 Marine
gas oil/
diesel
V18 Light fuel oils
V19 Heavy
dis-tillate
V20 Heavy
fuel oil
V51 Munici-
pal waste
V52 Spe-
cial waste
TSP
S.01 Direct-fired furnaces 1.6 1.6 1.6 . . . . . . 0.122 0.144 0.144 . 0.144 . . 0.286 . * * . 5.68
TSP S.02 Gas turbines . . . . . . . . . 0.122 . . . . . . 0.286 . . . . .
TSP S.03 Boilers 1.6 1.6 1.6 . 0.22 0 0.216 0.216 . 0.122 0.144 0.144 0.144 0.144 0.136 0.296 0.286 0.286 * * 0.05 5.68
TSP
S.04 Small stoves 4.2 2.85 3.5 23.86 . . 1.1 . 2.4 . . . . . 0.136 0.3 . 0.3 . . . .
TSP S.1B2C Flares . . . . . . . . . 0.002 0.144 . 0.144 . . . . . . . . .
PM10
S.01 Direct-fired furnaces 1.14 1.14 1.14 . . . . . . 0.122 0.144 0.144 . 0.144 . . 0.143 . * * . 4.87
PM10 S.02 Gas turbines . . . . . . . . . 0.122 . . . . . . 0.143 . . . . .
PM10 S.03 Boilers 1.14 1.14 1.14 . 0.22 0 0.216 0.216 . 0.122 0.144 0.144 0.144 0.144 0.136 0.148 0.143 0.15 * * 0.05 4.87
PM10
S.04 Small stoves 2.8 1.71 2.1 23.86 . . 1.1 . 2.4 . . . . . 0.136 0.16 . 0.155 . . . .
PM10 S.1B2C Flares . . . . . . . . . 0.002 0.144 . 0.144 . . . . . . . . .
PM2.5
S.01 Direct-fired furnaces 0.82 0.82 0.82 . . . . . . 0.122 0.144 0.144 . 0.144 . . 0.036 . * * . 3.2
PM2.5 S.02 Gas turbines . . . . . . . . . 0.122 . . . . . . 0.036 . . . . .
PM2.5 S.03 Boilers 0.82 0.82 0.82 . 0.22 0 0.216 0.216 . 0.122 0.144 0.144 0.144 0.144 0.136 0.037 0.12 0.12 * * 0.05 3.2
PM2.5
S.04 Small stoves 0.86 0.86 1.05 23.86 . . 1.1 . 2.4 . . . . . 0.136 0.12 . 0.119 . . . .
PM2.5 S.1B2C Flares . . . . . . . . . 0.002 0.144 . 0.144 . . . . . . . . .
Numbers in italics have exceptions for some sectors, see table B37, and bold numbers are different for different years, see table B38. * General emission factors for all sources for heavy distillate and heavy fuel oil are given in table B36 for all years. Source: Finstad et al. (2003). Fuel wood factor based on data from annual surveys on use of fuel wood in households
Table B36. General particle emission factors for heavy distillate and heavy fuel oil for all sources. Factors dependent on sulphur content. kg particle component /tonne fuel
Fuel Com-ponent
1980-1981
1982 1983 1984 1985-1986
1987-1988
1989 1990 1991 1992 1993 1994 1995 1996-1997
1998 1999 2000-2009
TSP 1.376 1.058 1.185 1.058 1.058 0.994 0.905 0.803 0.714 0.701 0.701 0.688 0.714 0.663 0.688 0.701 0.714
PM10 1.183 0.909 1.019 0.909 0.909 0.855 0.778 0.690 0.614 0.603 0.603 0.592 0.614 0.570 0.592 0.603 0.614
V19
PM2.5 0.771 0.592 0.664 0.592 0.592 0.557 0.507 0.450 0.400 0.393 0.393 0.385 0.400 0.371 0.385 0.393 0.400
TSP 1.464 1.464 1.522 1.350 1.487 1.464 1.419 1.350 1.339 1.316 1.304 1.190 1.053 1.098 1.087 1.110 1.201
PM10 1.259 1.259 1.308 1.161 1.279 1.259 1.220 1.161 1.151 1.131 1.121 1.023 0.905 0.944 0.934 0.954 1.033
V20
PM2.5 0.825 0.825 0.858 0.761 0.838 0.825 0.800 0.761 0.754 0.741 0.735 0.671 0.593 0.619 0.613 0.625 0.677
Source: Finstad et al. (2003).

Documents 21/2011 The Norwegian Emission Inventory 2011
Statistics Norway 223
Table B37. Exceptions from the general factors for particles. Stationary combustion
Emission factor (kg TSP/tonne)
Emission factor (kg PM10/tonne)
Emission factor (kg PM2.5/tonne)
Fuel Source Sectors
4.06 2.4 1.4 V52 Special waste S.01 Direct-fired furnaces 230500-233320 5.45 3.54 1.45 V01 Coal S.01 Direct-fired furnaces 2335304.2 2.8 0.86 V01 Coal S.03 Boilers 230100. 0.143 (V18) 0.036 (V17, 18) V17, 18 Light fuel oils S.03 Boilers 230500-233320 4.06 2.4 1.4 V52 Special waste S.03 Boilers 230500-233320 5.45 3.54 1.45 V01 Coal S.03 Boilers 2335300.5 0.5 0.5 V51 Municipal waste S.03 Boilers 2538000.3 0.155 0.119 V13 Kerosene (heating) S.04 Small stoves 330000
Table B38. Time series for variable emission factors for particles1. Stationary combustion. kg particle component /tonne fuel
Sector Source Fuel 1980-1990
1996 1997 1998 1999 2000 2001 2002 2003 2004 2005 2006 2007 2008 2009
General S.04 V41 38.86 38.89 38.90 37.74 36.83 35.62 34.41 33.20 31.85 30.50 27.39 26.17 25.46 24.43 23.86General S.03 V51 0.2 0.05 0.05 0.05 0.05 0.05 0.05 0.05 0.05 0.05 0.05 0.05 0.05 0.05 0.051 Emission factors for the years 1991 to 1995 can be given on request.
POPs (Persistent Organic Pollutants) - Stationary combustion
Table B39.General emission factors for PAH
Component Source V01Coal
V02 Coke
V03 Petrol coke
V41Fuel
wood
V42 Wood waste
V43 Black liquor
V44 Wood
pellets
V45 Wood
bri-quettes
V04Char-
coal
V31 Natural
gas (1000 Sm3)
V33 Re-
finery gas
V34 Blast furn-ace gas
V36 Land-
fill gas
V35 Fuel gas
V32 LPG
V13 Kero-sene
(heat-ing)
V17 Marine gas oil/
diesel
V18 Light fuel oils
V19 Heavy
dis-tillate
V20Heavyfuel oil
V51 Munici-
pal waste
V52 Special
waste
PAH g/tonne
S.01 Direct-fired furnaces 0.17 0.17 0.17 . 0.0180.018 . . . 0.015 0.0180.018 .0.018 . . 1.6 . 0.015 0.015 . 0.015
PAH g/tonne
S.02 Gas turbines . . . . . . . . . 0.015 . . . . . . 1.6 . . . . .
PAH g/tonne
S.03 Boilers 0.46 0.46 0.46 . 0.0180.018 0.16 0.16 . 0.015 0.018 0 0.0180.0180.018 0.007 0.01 0.01 0.015 0.015 2.5 0.015
PAH g/tonne
S.04 Small stoves 39.9 27.8 27.827.48 . .38.8 . 39.9 . . . . .0.039 0.039 . 1.01 . . . .
PAH g/tonne
S.1B2C Flares . . . . . . . . . 0.015 0.018 . 0.018 . . . . . . . . .
PAH-OSPAR g/tonne
S.01 Direct-fired furnaces 0.02 0.02 0.02 . . . . . . 9E-04 0.0010.001 .0.001 . . 0.26 . 0.004 0.004 . 0.004
PAH-OSPAR g/tonne
S.02 Gas turbines . . . . . . . . . 9E-04 . . . . . . 0.26 . . . . .
PAH-OSPAR g/tonne
S.03 Boilers
0.16 0.16 0.16 . 0.0610.061 0.061 0.061 . 9E-04 0.0010.001 00.0010.001 8E-04 0.004 0.004 0.7 0.004 PAH-OSPAR g/tonne
S.04 Small stoves 18 13.4 13.4 4.44 . . 6.8 . 18 . . . . .0.007 0.007 . 0.57 . . . .
PAH-OSPAR g/tonne
S.1B2C Flares
. . . . . . . . . 9E-04 0.001 . 0 . . . . . . . . . PAH-4 g/tonne
S.01 Direct-fired furnaces 0 0 0 . . . . . . 0 0 0 . 0 . . 0.04 . 4E-04 4E-04 . 4E-04
PAH-4 g/tonne
S.02 Gas turbines . . . . . . . . . 0 . . . . . . 0.04 . . . . .
PAH-4 g/tonne
S.03 Boilers 0.0240.024 0.024 . 0.0160.016 0.016 0.016 . 0 0 0 0 0 0 1E-04 1E-04 1E-04 4E-04 4E-04 4E-04
PAH-4 g/tonne
S.04 Small stoves 2.6 0.4 0.4 1.53 . . 2.5 . 2.6 . . . . . 0 0 . 0.003 . . . .
PAH-4 g/tonne
S.1B2C Flares . . . . . . . . . 0 0 . 0 . . . . . . . . .
Numbers in italics have exceptions for some sectors, see table B42, and bold numbers are different for different years, see tables B40 and B43. Source: Finstad et al. (2001). Fuel wood factor based on data from annual surveys on use of fuel wood in households

The Norwegian Emission Inventory 2011 Documents 21/2011
224 Statistics Norway
Table B40. Time series for variable emission factors for PAH1. Stationary combustion (g component /tonne fuel)
Compo-nent
Source Fuel 1980-1990
1996 1997 1998 1999 2000 2001 2002 2003 2004 2005 2006 2007 2008 2009
PAH S.04 V41 50.69 50.70 50.70 48.85 47.13 45.27 43.41 41.55 39.47 37.39 33.03 31.09 30.01 28.40 27.48PAH-OSPAR S.04 V41 8.02 8.02 8.02 7.73 7.45 7.16 6.88 6.59 6.26 5.94 5.30 4.99 4.85 4.61 4.44PAH-4 S.04 V41 2.71 2.71 2.71 2.61 2.52 2.42 2.32 2.23 2.12 2.01 1.81 1.70 1.67 1.59 1.531 Emission factors for the years 1991 to 1995 can be given on request.
Table B41. General emission factors for dioxins
Com-ponent
Source V01 Coal
V02 Coke
V03 Petrol coke
V41 Fuel
wood
V42 Wood waste
V43 Black liquor
V44 Wood
pellets
V45 Wood
bri-quettes
V04 Char-
coal
V31 Natural
gas (1000 Sm3)
V33 Re-
finery
gas
V34 Blast furn-acegas
V36 Land-
fill gas
V35 Fuel gas
V32 LPG
V13 Kero-sene
(heat-ing)
V17 Marine
gas oil/
diesel
V18 Light
fuel oils
V19 Heavy
dis-tillate
V20 Heavy
fuel oil
V51 Munici-
pal waste
V52 Special
waste
Dioxins ug/tonne
S.01 Direct-fired furnaces 1.6 1.6 1.6 . . . . . . 0.05 0 0 . 0 . . 4 . 0.1 0.1 . 4
Dioxins ug/tonne
S.02 Gas turbines . . . . . . . . . 0.05 . . . . . . 4 . . . . .
Dioxins ug/tonne
S.03 Boilers 1.6 1.6 1.6 . 1 1 1 1 . 0.05 0 0 0 1 0.06 0.1 0.1 0.1 0.1 0.1 0.02 4
Dioxins ug/tonne
S.04 Small stoves 10 10 10 5.9 . . 5.9 . 10 . . . . . 0.06 0.06 . 0.2 . . . .
Dioxins ug/tonne
S.1B2C Flares . . . . . . . . . 0.05 0 . 0 . . . . . . . . .
Numbers in italics have exceptions for some sectors, see table B42. Source: Finstad et al. (2002b).
Table B42. Exceptions from the general factors for POPs. Stationary combustion
Emission factor (g PAH/tonne)
Emission factor (g PAH-OSPAR/tonne)
Emission factor (g PAH-4/tonne)
Emission factor (ug dioxin/tonne)
Fuel Source Sectors
0.0008 0.0005 . . V17, 18 Fuel oils S.03 Boilers 230500-233320
. . . 0.2 V18, 19 Heavy distillate, heavy fuel oil S.03 Boilers 330000 0.75 0.2 0.01 . V51 Municipal waste S.03 Boilers 233530
Table B43. Time series for variable emission factors for PAH. Stationary combustion
1980-1994 1995-
Sector Source Fuel Emission factor (g PAH/tonne)
Emission factor (g PAH-
OSPAR/tonne)
Emission factor (g PAH-4/tonne)
Emission factor (g PAH/tonne)
Emission factor (g PAH-
OSPAR/tonne)
Emission factor (g PAH-4/tonne)
General S.03 V51 2.5 0.7 0.03 0.75 0.2 0.01
Source: NILU/NIVA (Norwegian institute for air research and Norwegian institute for water research 1995)/ Karlsson et al. (1992).

Documents 21/2011 The Norwegian Emission Inventory 2011
Statistics Norway 225
Appendix C: Activity data and emission figures StatBank Norway is a service operated by Statistics Norway where you may select scope and content of each table, and then may export the result in various formats to your own PC. For air emissions you find data for:
• Emissions to air, summary data (1973-2009). • Emissions to air, by source and fuel (1990-2009).
The StatBank is found at: http://statbank.ssb.no//statistikkbanken/default_fr.asp?PLanguage=1 Reported air emission data for Norway, and the activity data used in the calculations, is given at the homepage to the European Environment Information and Observation Network (EIONET):
• Data for greenhouse gases reported to the UNFCCC: http://cdr.eionet.eu.int/no/un/UNFCCC/ • Data for long-range transboundary air pollutants reported to the ECE:
http://cdr.eionet.eu.int/no/un/CLRTAP/

The Norwegian Emission Inventory 2011 Documents 21/2011
226 Statistics Norway
Appendix D: Uncertainty estimates for single sources
Greenhouse gases The national greenhouse gas (GHG) emission inventory is compiled from estimates based on emission factors and activity data and direct measurements by plants. All these data and parameters will contribute to the overall inventory uncertainty. The uncertainties and probability distributions of the inventory input parameters have been assessed based on available data and expert judgements. Finally, the level and trend uncertainties of the national GHG emission inventory have been estimated using Monte Carlo simulation. The methods used in the analysis correspond to an IPCC Tier 2 method, as described in (IPCC 2000). Analyses have been made both excluding and including the sector LULUCF (land use, land-use change and forestry). The uncertainty analysis performed in 2011 was an update of the uncertainty analyses performed for the greenhouse gas inventory in 2006 and 2000. The report Uncertainties in the Norwegian Greenhouse Gas Emission Inventory (Rypdal and Zhang (2000)) includes more detailed documentation of the analysis method used in all analyses. In this note we mainly focus on the changes since last analysis in 2006. This includes new methodology for several source categories as well as revised uncertainty estimates. During the project we have been in contact with experts, and have collected information about uncertainty from them. There has been a focus on the sources where methodological changes have been made since the last uncertainty analysis was performed in 2006. For the industries included in the emission trading system, new information from the reports about uncertainty in activity data and CO2 emission factor has been used. This has improved the quality of the uncertainty estimates for the energy and manufacturing sectors. The results show that the uncertainty in the calculated greenhouse gas emissions for 2009 is ±5 per cent. The uncertainty estimate is lower now than earlier analyses have shown. This is partly due to a considerable work made to improve the calculation methodology. It is also partly the uncertainty estimates themselves that have been improved. Level of the analysis The uncertainty analysis is performed at the most detailed level of IPCC source categories (IPCC 2000). For some sources even a more detailed separation is made, e.g. where different pollutants from a source sector have to be connected to different activity measures, as for example for the source category 6B Waste water, or to be able to consider dependencies between only parts of the source groups, which for example is the case for the source categories 4D1 Direct soil emissions and 4D3 Indirect soil emissions. Energy carriers have been grouped into five main types; solid, gaseous, liquid, waste and bio energy. The allocation in groups has been made using international definitions based on the type of the original energy carrier, e.g, refinery gas and fuel gas is placed in “liquid” and CO gas is placed in “solid”. This is a change from the preceding analysis, when all these three gases were allocated to “gaseous” fuels. This change affects the allocation of emissions on sources with different uncertainty estimates. The definitions of sources have also been changed to some extent since the preceding analysis, and this also affects the results of the uncertainty analysis. The most important changes are:
• Emissions from mobile installations in oil and gas exploration have been moved from “Mobile combustion-Coastal traffic” to “Stationary combustion-Oil and gas extraction”.
• Emissions from district heating and electricity production are now placed in a new category called Energy supply.
• There are some minor adjustments in limitation and also some changes of names and order. In table D3, source category level used in the study is listed. For some emission sources a separation into activity and emission factors is not possible due to lack of information. Examples are estimates based on measurements, emissions reported by plants (in the cases when the plants have reported only emissions and not activity data and emission factor used), and emissions that are aggregated from sources with diverse methods (for example emissions from 2C5 Other metal production). These emissions have been assigned activity equal to 1, and emission factor to be equal to the estimated value. This is possible since the total uncertainty estimate is independent of scale for activity and emission factor24. Emissions from landfills, HFCs and some other sources have been transferred into the form of emission factor
24 We may state the activity in any given unit, as long as the emission factor is stated in the corresponding unit. Examples: tonnes and kg/tonne, Gg and kg/Gg, or, as in this case, unit value and total emissions in kg.

Documents 21/2011 The Norwegian Emission Inventory 2011
Statistics Norway 227
multiplied with activity rate, in spite of the fact that the estimates are based on more complex estimation models (e.g. taking time lag into account and using several activity data and emission factors).
Uncertainties in input parameters Emission estimates In the analysis emission estimates for the different source categories (table D3) for the years 1990 and 2009 are taken from the Norwegian emission inventory. The emission estimates used in the analysis come from the national GHG emission inventory and are based on Norwegian measurements, literature data or statistical surveys. Some data are based on expert judgements. Standard deviation and probability density The probability densities used in this study have been divided into four types of model shapes: 1. Normal distribution 2. Truncated normal distribution 3. Lognormal distribution 4. Beta distribution For low uncertainties all the distributions 2-4 above approach the normal distribution. For large uncertainties the normal distribution may lead to negative values. To avoid this, the distributions are, when necessary, truncated at 0, which means that there is a given probability of the value 0. The lognormal distribution and beta distribution are both asymmetrical distributions, giving a heavier tail of probabilities towards higher values. These two distributions are very similar in shape for low to medium size uncertainties. For higher uncertainties the beta distribution is more flat and the peak in the distribution is more close to the mean value. The beta distribution is, however, only defined for variables taking values between 0 and 1. The densities were used in the following way: Normal or lognormal distributions were used for most of the categories. Normal distribution was used for uncertainties up to 30 per cent, while lognormal distribution was used for higher uncertainties. Normal distribution was also used for carbon balances that were in princple a difference between larger gains and losses that likely were normally distributed with lower uncertainties. These carbon balances might take both positive and negative values. Beta distribution and truncated normal distribution were used only in a few special cases. Beta distribution was used for N2O emissions from combustion. Truncated normal distribution was used for CH4 emissions from stationary combustion of liquid fuels, and from flaring. The uncertainties and densities given in the following sections are based on information for 2009. However, they were also used for 1990 and for the trend analysis. In reality, due to improved methods, the quality of the 2009 data inventory is higher than that of the 1990 data for several categories. Thus, the analysis may underestimate the uncertainty in 1990 emissions and in the trend. The CO2 emissions are likely most affected by this problem. Activity data The assessed standard deviations and corresponding probability densities are summarised in table D1.

The Norwegian Emission Inventory 2011 Documents 21/2011
228 Statistics Norway
Table D1. Summary of standard deviation and probability density of activity data
IPCC Source category
Pollutant source Standard deviation (2σ). per cent1
Density shape
Source/ comment
1A1, 1A2 Coal/coke - general 5 Normal Expert judgement industry, Norcem (2006) 1A1B Coal/coke – petroleum refining 1.1 Normal Emission trading scheme (Klif 2011), Spread
in data, Rypdal and Zhang (2000) 1A2A Coal/coke - iron and steel 4.1 Normal Emission trading scheme (Klif 2011), Expert
judgement industry, Norcem (2006) 1A2F Coal/coke - other 0.8 Normal Emission trading scheme (Klif 2011), Expert
judgement industry, Norcem (2006) 1A4B Coal/coke - residential 20 Normal Expert judgement, Rypdal and Zhang (2000) 1A4C Coal/coke - agriculture 30 Normal Expert judgement, Statistics Norway 1A1, 1A2, 1A4
Wood 30 Lognormal Expert judgement, Rypdal and Zhang (2000)
1A1A Gas – public electricity and heat production
0.8 Normal Emission trading scheme (Klif 2011), Expert judgement, Statistics Norway
1A2 Gas - general 4 Normal Norwegian Petroleum Directorate, Rypdal and Zhang (2000)
1A1C Gas - manufacture of solid fuels and other energy industries
0.2 Normal Emission trading scheme (Klif 2011), NPD (2006)
1A2C Gas - chemicals 1.7 Normal Emission trading scheme (Klif 2011), Norwegian Petroleum Directorate, Rypdal and Zhang (2000)
1A2D Gas - pulp, paper, print 1.7 Normal Emission trading scheme (Klif 2011), Norwegian Petroleum Directorate, Rypdal and Zhang (2000)
1A4A Gas - commercial/institutional 10 Normal Expert judgement, Statistics Norway 1A4B, 1A4C Gas - residential,
agriculture/forestry/fishing 30 Normal Expert judgement, Statistics Norway
1A1, 1A2 Oil - general 3 Normal Spread in data, Rypdal and Zhang (2000) 1A1B Oil - petroleum refining 1.1 Normal Emission trading scheme (Klif 2011), Spread
in data, Rypdal and Zhang (2000) 1A1C Oil – manufacture of solid fuels and
other energy industries 1.8 Normal Emission trading scheme (Klif 2011), Spread
in data, Rypdal and Zhang (2000) 1A2A Oil - iron and steel 0.5 Normal Emission trading scheme (Klif 2011), Spread
in data, Rypdal and Zhang (2000) 1A2C Oil - chemicals 14.4 Normal Emission trading scheme (Klif 2011), Spread
in data, Rypdal and Zhang (2000) 1A2D Oil – pulp, paper, print 0.7 Normal Emission trading scheme (Klif 2011), Spread
in data, Rypdal and Zhang (2000) 1A2F Oil - other 2.6 Normal Emission trading scheme (Klif 2011), Spread
in data, Rypdal and Zhang (2000) 1A4A Oil - commercial/institutional 20 Normal Expert judgement, Statistics Norway 1A4B Oil - residential 9.5 Normal Emission trading scheme (Klif 2011), Expert
judgement, Statistics Norway 1A4C Oil - agriculture/forestry 10 Normal Expert judgement, Statistics Norway 1A1A Waste – general 5 Normal Expert judgement, Rypdal and Zhang (2000) 1A2F Waste - other manufacturing 3.2 Normal Emission trading scheme (Klif 2011), Expert
judgement, Rypdal and Zhang (2000) 1A4A Waste - commercial/institutional 30 Lognormal Expert judgement, Rypdal and Zhang (2000) 1A3A, 1A3E Transport fuel - civil aviation, motorized
equipment and pipeline 20 Normal Expert judgement, Rypdal and Zhang (2000)
1A3B Transport fuel - road 5 Normal Expert judgement, Statistics Norway 1A3C Transport fuel - railway 5 Normal Expert judgement, Statistics Norway 1A3D Transport fuel - navigation 20 Normal Expert judgement, Statistics Norway 1A5A, 1A5B Military fuel - stationary and mobile 5 Normal Expert judgement, Statistics Norway 1B1A, 1B2B Coal mining, extraction of natural gas 3 Normal Expert judgement, Rypdal and Zhang (2000) 1B2A Extraction of oil - transport,
refining/storage 3 Normal Expert judgement, Rypdal and Zhang (2000)
1B2A Extraction of oil - distribution gasoline 5 Normal Expert judgement, Rypdal and Zhang (2000) 1B2C Venting - - See emission factor 1B2C Flaring 1.4 Normal Emission trading scheme (Klif 2011), Expert
judgement, Rypdal and Zhang (2000) 1B2C Well testing 30 Normal Expert judgement, Rypdal and Zhang (2000) 2A1 Cement production 0.4 Normal Emission trading scheme (Klif 2011) 2A2 Lime production 0.4 Normal Emission trading scheme (Klif 2011) 2A3 Limestone and dolomite use 14.1 Normal Emission trading scheme (Klif 2011) 2A7 Other mineral production 0.1 Normal Emission trading scheme (Klif 2011) 2B1 Ammonia production 3 Normal Expert judgement industry, Yara (2006) 2B2 Nitric acid production - - See emission factor 2B4 Carbide production - SiC 3 Normal Expert judgement industry, St. Gobain and
Orkla Exolon (2006) 2B4 Carbide production - CaC 3 Normal Expert judgement, Rypdal and Zhang (2000) 2B5 Methanol and plastic production 9.0 Normal Emission trading scheme (Klif 2011) 2C1 Iron and steel production 1.23 Normal Expert judgement industry, Tinfos (2006) 2C2 Ferroalloys production - - See emission factor

Documents 21/2011 The Norwegian Emission Inventory 2011
Statistics Norway 229
2C3 Aluminium production 3 Normal Expert judgement industry, Norsk Hydro (2006a)
2C4 SF6 used in Al and Mg foundries - - See emission factor 2C5 Mg production 0.25 Normal Expert judgement industry, Norsk Hydro
(2006b) 2C5 Ni production, anodes 10 Normal Expert judgement, Statistics Norway 2D1 Pulp and paper 0.9 Normal Emission trading scheme (Klif 2011) 2D2 Carbonic acid, bio protein 10 Normal Expert judgement, Statistics Norway 2F Consumption of halocarbons and SF6 - - See emission factor 3A, 3B, 3C, 3D
Solvent and other product use - CO2 - - See emission factor
3D Use of N2O in anasthesia and as propellant – N2O
- - See emission factor
4A Enteric fermentation 5 Normal Expert judgement, Statistics Norway (2006a), Division for agricultural statistics
4B1-9, 4B13 Manure management - CH4 5 Normal Expert judgement, Statistics Norway (2006a), Division for agricultural statistics
4B11-12 Manure management - N2O 24 Normal Expert judgement2, Statistics Norway (2006a), Statistics Norway (2006b), and Statistics Norway (2006c)
4D1 Direct soil emission - fertiliser 5 Normal SFT (1999a) 4D1 Direct soil emission - manure 20 Normal Rypdal and Zhang (2000) 4D1 Direct soil emission - other 64 Lognormal Expert judgement3, Statistics Norway and
Rypdal and Zhang (2000) 4D1 Direct soil emission - organic soil Fac2 Lognormal Expert judgement, Statistics Norway 4D2 Animal production 22 Normal Expert judgement4, Statistics Norway 4D3 Indirect soil emission - deposition 30 Lognormal SFT (1999a) 4D3 Indirect soil emission - leakage 70 Lognormal SFT (1999a) 4F1 Agricultural residue burning 10 Normal Expert judgement, Statistics Norway 5A1 Forest Land remaining Forest Land, -
general - - See emission factor
5A1 Forest Land remaining Forest Land - wildfires
20 Normal Expert judgement, Statistics Norway
5A2 Land converted to Forest Land - - See emission factor
5B1 Cropland remaining Cropland - general - - See emission factor
5B1 Cropland remaining Cropland - liming 5 Normal Expert judgement, Statistics Norway
5B2 Land converted to Cropland - - See emission factor
5C1 Grassland remaining Grassland - - See emission factor
5C2 Cropland converted to Grassland - - See emission factor
5D1 Wetlands remaining Wetlands - - See emission factor
5D2 Land converted to Wetland - - See emission factor
5E2 Land converted to Settlements - - See emission factor
5F2 Land converted to Other land - - See emission factor 5G Other; Liming of lakes and rivers 5 Normal Expert judgement, Statistics Norway 6A Solid waste disposal 20 Normal Expert judgement, Statistics Norway (2010)
and SFT (2006a)
6B Waste water treatment - CH4 1 Lognormal Expert judgement, Statistics Norway
6B Waste water treatment - N2O pipeline and plant
25 Normal Expert judgement, Statistics Norway (2006e)
6B Waste water treatment - N2O, not connected
30 Normal Expert judgement, Statistics Norway (2011)
6C Waste incineration 30 Normal Expert judgement, Statistics Norway 1 Strongly skewed distributions are characterised as fac3 etc, indicating that 2σ is a factor 3 below and above the mean. 2 Population 5% (Statistics Norway 2006a), Nex 15% (Statistics Norway 2006b), distribution AWMS 10% (Statistics Norway 2006c), distribution pasture/ storage 15% (Statistics Norway 2006b) 3 N fixation 40% and crop residues 50% (Rypdal and Zhang 2000) 4 Population 5% (Statistics Norway 2006a), Nex 15% (Statistics Norway 2006b, distribution pasture/ storage 15% (Statistics Norway 2006b)
Emission factors The assigned values and probability densities are shown in table D2.

The Norwegian Emission Inventory 2011 Documents 21/2011
230 Statistics Norway
Table D2. Summary of standard deviation and probability density of emission factors
IPCC Source category
Pollutant source Gas (2σ). per cent1
Density shape
Source/ comment
1A1, 1A2B, 1A2D, 1A2E, 1A4
Coal/coke - general CO2 7 Normal Spread in data, Rypdal and Zhang (2000)
1A1B Coal/coke – petroleum refining CO2 0.9 Normal Emission trading scheme (Klif 2011), Spread in data, Rypdal and Zhang (2000)
1A2A Coal/coke – iron and steel CO2 16.0 Normal Emission trading scheme (Klif 2011), Spread in data, Rypdal and Zhang (2000)
1A2F Coal/coke - other CO2 2.0 Normal Emission trading scheme (Klif 2011), Spread in data, Rypdal and Zhang (2000)
1A2, 1A4 Gas - general CO2 3.5 Normal IPCC (2006), expert judgement, Statistics Norway
1A1A Gas – public electricity and heat prod CO2 0.6 Normal Emission trading scheme (Klif 2011), Norwegian Petroleum Directorate, Rypdal and Zhand (2000)
1A1C Gas – Manufacture of solid fuels and other energy
CO2 2.6 Normal Emission trading scheme (Klif 2011), Norwegian Petroleum Directorate, Rypdal and Zhand (2000)
1A2C Gas - Chemicals CO2 1.6 Normal Emission trading scheme (Klif 2011), Norwegian Petroleum Directorate, Rypdal and Zhand (2000)
1A1, 1A2, 1A4 Oil - general CO2 3 Normal Spread in data, Rypdal and Zhang (2000)
1A1B Oil – petroleum refining CO2 0.9 Normal Emission trading scheme (Klif 2011), Spread in data, Rypdal and Zhang (2000)
1A2C Oil - Chemicals CO2 1.1 Normal Emission trading scheme (Klif 2011), Spread in data, Rypdal and Zhang (2000)
1A2F Oil - other CO2 2.6 Normal Emission trading scheme (Klif 2011), Spread in data, Rypdal and Zhang (2000)
1A4B Oil - residential CO2 3.4 Normal Emission trading scheme (Klif 2011), Spread in data, Rypdal and Zhang (2000)
1A1, 1A4 Waste - general CO2 30 Normal Spread in data, Rypdal and Zhang (2000)
1A2F Waste - other CO2 25.2 Normal Emission trading scheme (Klif 2011), Spread in data, Rypdal and Zhang (2000)
1A3A, 1A3B, 1A3C, 1A3D
Transport fuel CO2 3 Normal Spread in data, Rypdal and Zhang (2000)
1A5 Military fuel - stationary and mobile CO2 5 Normal Expert judgement, Statistics Norway
1A1, 1A2, 1A4 Coal/coke, wood, waste - general CH4 Fac2 Lognormal Spread in data, Rypdal and Zhang (2000)
1A1B Coal/coke – petroleum refining CH4 Fac2 Truncated N
Spread in data, Rypdal and Zhang (2000)
1A1, 1A2, 1A4, 1A5
Gas – general, military fuel – stationary and mobile
CH4 Fac2 Lognormal Expert judgement, Statistics Norway
1A1, 1A2, 1A4 Oil - general CH4 Fac2 Truncated N
Spread in data, Rypdal and Zhang (2000)
1A3A, 1A3C, 1A3D
Transport fuel CH4 Fac2 Lognormal Spread in data. Expert judgement, Rypdal and Zhang (2000)
1A3B Transport fuel CH4 45 Lognormal (Gustafsson 2005)
1A1, 1A2, 1A4, 1A5
Coal/coke, wood, gas, waste – general, military fuel – stationary and mobile
N2O Fac3 Beta Expert judgement, Statistics Norway
1A1, 1A2, 1A4 Oil - general N2O Fac3 Beta Spread in data. Expert judgement. IPCC (1997), Rypdal and Zhang (2000)
1A1B Coal/coke – petroleum refining N2O Fac3 Beta Spread in data. Expert judgement. IPCC (1997), Rypdal and Zhang (2000)

Documents 21/2011 The Norwegian Emission Inventory 2011
Statistics Norway 231
1A3A, 1A3C, 1A3D
Transport fuel N2O Fac3 Beta Spread in data. Expert judgement, Rypdal and Zhang (2000)
1A3B Transport fuel N2O 65 Lognormal (Gustafsson 2005)
1B1A, 1B2B Coal mining, extraction of natural gas CO2 Fac2 Lognormal Expert judgement, Statistics Norway
1B2A Extraction of oil - transport, refining/storage, distribution gasoline
CO2 40 Lognormal Expert judgement, Statistics Norway
1B2C Venting CO2 Fac2 Lognormal Expert judgement, Rypdal and Zhang (2000)
1B2C Flaring CO2 4.5 Normal Emission trading scheme (Klif 2011), Rypdal and Zhang (2000)
1B2C Well testing CO2 7 Normal Expert judgement, Rypdal and Zhang (2000)
1B1A, 1B2B, 1B2C
Coal mining, extraction of natural gas, venting
CH4 Fac2 Lognormal Expert judgement, Rypdal and Zhang (2000)
1B2A Extraction of oil - transport, refining/storage
CH4 40 Lognormal Expert judgement, Statistics Norway
1B2C Flaring, well testing CH4 Fac2 Truncated N
Expert judgement, Rypdal and Zhang (2000)
1B2C Flaring, well testing N2O Fac3 Beta Expert judgement, Rypdal and Zhang (2000)
2A1 Cement production CO2 0.6 Normal Emission trading scheme (Klif 2011), IPCC (1997)
2A2 Lime production CO2 0.5 Normal Emission trading scheme (Klif 2011), Expert judgement, Statistics Norway
2A3, 2A7 Limestone and dolomite use, other mineral production
CO2 7 Normal Expert judgement, Statistics Norway
2B1 Ammonia production CO2 7 Normal Expert judgement industry, Yara (2006)
2B4 Carbide production - SiC CO2 10 Normal Expert judgement industry, St. Gobain and Orkla Exolon (2006)
2B4 Carbide production - CaC CO2 10 Normal Spread in data, Rypdal and Zhang (2000)
2B5 Methanol and plastic production CO2 0.7 Normal Emission trading scheme (Klif 2011),Expert judgement, Statistics Norway
2B4 Carbide production - SiC CH4 10 Normal SFT (2006b)
2B5 Methanol and plastic production CH4 Fac2 Lognormal Expert judgement, Statistics Norway
2B2 Nitric acid production N2O 6.0 Normal Expert judgement industry, Yara (2006), Emission trading scheme (Klif 2011)
2C1 Iron and steel production CO2 1.3 Normal Emission trading scheme (Klif 2011), Expert judgement industry, Tinfos (2006)
2C2 Ferroalloys production CO2 3 Normal Expert judgement, SINTEF (2006)
2C3 Aluminium production CO2 10 Normal International Aluminium Institute (IAI), Norsk Hydro (2006a)
2C5 Mg production, Ni production, anodes CO2 10 Normal Expert judgement, Statistics Norway
2C2 Ferroalloys production CH4 Fac2 Lognormal Expert judgement, Statistics Norway
2C2 Ferroalloys production N2O 10 Normal Expert judgement, Statistics Norway

The Norwegian Emission Inventory 2011 Documents 21/2011
232 Statistics Norway
2C3 Aluminium production PFK 20 Normal Expert judgement industry, Norsk Hydro (2006a)
2C4 SF6 used in Al and Mg foundries SF6 0.25 Normal Expert judgement industry, Norsk Hydro (2006b)
2D1 Pulp and paper CO2 10 Normal Expert judgement, Statistics Norway
2D2 Carbonic acid, bio protein CO2 10 Normal Expert judgement, Statistics Norway
2F Consumption of HFK and PFK HFK/PFK 50 Lognormal Apply to HFK. Expert judgement, Statistics Norway
2F Consumption of SF6 SF6 60 Lognormal Expert judgement, Statistics Norway
3A, 3B,3C, 3D Solvent and other product use CO2 10 Normal Expert judgement, Statistics Norway (2010)
3D Use of N2O in anasthesia and as propellant
N2O 15 Normal Expert judgement, Statistics Norway (2010)
A1, 4A3 Enteric fermentation - cattle and sheep CH4 25 Normal Expert judgement, UMB (2006)
4A4-10 Enteric fermentation - other animal CH4 40 Normal IPCC (2006)
4B1-9, 4B13 Manure management CH4 25 Normal IPCC (1997)
4B11-12 Manure management - N2O N2O Fac2 Lognormal IPCC (1997)
4D1 Direct soil emission N2O Fac5 Lognormal IPCC (2000)
4D2 Animal production N2O Fac2 Lognormal IPCC (2000)
4D3 Indirect soil emission N2O Fac3 Lognormal IPCC (1997)
4F1 Agricultural residue burning CH4 Fac2 Lognormal Expert judgement, Statistics Norway
4F1 Agricultural residue burning N2O Fac3 Beta Expert judgement, Statistics Norway
5A1 Forest Land remaining Forest Land, Fertiliser
N2O Fac5 Lognormal NIJOS (2005)
5A1 Forest Land remaining Forest Land, Drainage N2O
Fac10 Lognormal NIJOS (2005)
5A1 Forest Land remaining Forest Land, Wildfires
CH4/ N2O 75 Lognormal NIJOS (2005)
5A1 Forest Land remaining Forest Land, Forest inventory area, Living Biomass
CO2 15 Normal NIJOS (2005)
5A1 Forest Land remaining Forest Land, Forest inventory area, Dead Biomass
CO2 50 Lognormal NIJOS (2005)
5A1 Forest Land remaining Forest Land, Forest inventory area, Soils, Mineral
CO2 25 Normal NIJOS (2005)
5A1 Forest Land remaining Forest Land, Forest inventory area, Soils, Organic
CO2 Fac10 Lognormal NIJOS (2005)
5A2 Land converted to Forest Land, Living biomass
CO2 25 Normal Expert judgement, Statistics Norway
5A2 Land converted to Forest Land, Soils, Mineral
CO2 50 Lognormal Expert judgement, Statistics Norway
5B1 Cropland remaining Cropland, Liming CO2 10 Normal NIJOS (2005)
5B1 Cropland remaining Cropland, Horticulture, Living biomass
CO2 25 Normal NIJOS (2005)

Documents 21/2011 The Norwegian Emission Inventory 2011
Statistics Norway 233
5B1 Cropland remaining Cropland, Reduced tillage, Soils CO2 Fac2 Lognormal NIJOS (2005)
5B1 Cropland remaining Cropland, Erosion of new agriculture land, Soils
5B1 Cropland remaining Cropland, Histosols, Soils CO2 Fac3 Lognormal NIJOS (2005)
5B2 Land converted to Cropland, Living biomass CO2 25 Normal NIJOS (2005)
5B2 Land converted to Cropland, Soils, Mineral CO2 50 Lognormal Expert judgement, Statistics Norway
5B2 Cropland, Disturbance N2O Fac10 Lognormal NIJOS (2005)
5C1 Grassland remaining Grassland, Other Grassland, Living biomass
CO2 50 Lognormal Expert judgement, Statistics Norway
5C1 Grassland remaining Grassland, Histosols, Soils CO2 Fac3 Lognormal NIJOS (2005)
5C2 Cropland converted to Grassland, Horticulture, Living biomass
CO2 25 Normal NIJOS (2005)
5D1 Wetlands remaining Wetlands, Living biomass CO2 25 Normal Expert judgement, Statistics Norway
5D1 Wetland remaining Wetland, Peat extraction, Soils CO2 Fac3 Lognormal NIJOS (2005)
5D2 Land converted to Wetland, Drainage N2O Fac10 Lognormal NIJOS (2005)
5E2 Land converted to Settlements, Living biomass CO2 50 Lognormal NIJOS (2005)
5E2 Land converted to Settlements, Soils CO2 50 Lognormal Expert judgement, Statistics Norway
5F2 Land converted to Other land, Living biomass CO2 50 Lognormal Expert judgement, Statistics Norway
5G Other; Liming of lakes and rivers CO2 10 Normal NIJOS (2005)
6A Solid waste disposal CH4 30 Lognormal SFT (2006a)
6B Waste water treatment - CH4 CH4 50 Lognormal IPCC (2000) and expert judgement, Statistics Norway (2010)2
6B Waste water treatment - N2O, pipeline and plant N2O 70 Lognormal Expert judgement, Rypdal and Zhang (2000)
6B Waste water treatment - N2O, not connected N2O Fac5 Lognormal IPCC (2006) and expert judgement, Statistics Norway (2010)
6C Waste incineration CO2 30 Normal Expert judgement, Statistics Norway
6C Waste incineration CH4 Fac2 Lognormal Expert judgement, Statistics Norway
6C Waste incineration N2O Fac3 Lognormal Expert judgement, Statistics Norway 1 Strongly skewed distributions are characterised as fac2, fac3, fac5 and fac10, indicating that 2σ is respectively a factor 2, 3, 5 and 10 below and above the mean. 2 BOD/ person 30%, Bo 30% (IPCC 2000) and MCF 25%. Dependencies between parameters
Dependencies between parameters Some of the input parameters (emission factors and activity data) are for various reasons not independent, that means that their values are dependent (or correlated). The problem of dependencies may be solved by appropriate aggregation of the data or explicitly by modelling. In this work we have partly designed the dataset to reduce the problem with dependencies as well as introduced a number of dependence assumptions into the model. The determination of dependencies is sometimes a difficult task and requires some understanding of the data set and the assumptions it is based on. Initial estimates with variable assumptions have shown that the assumptions on dependencies generally have little effect on the final conclusions on uncertainties. The assumptions of dependencies of data between years are, however, crucial for the determination of trend uncertainty (Rypdal and Zhang 2000).

The Norwegian Emission Inventory 2011 Documents 21/2011
234 Statistics Norway
Dependencies between activity data The activity data are in principle independent. However, the same activity data may be used to estimate more than one source category (e.g. in the agriculture sector). Also the same activity data are used for estimating emissions of more than one pollutant (especially in the case of energy emissions). The cases when activity data are assumed dependent in the statistical modelling are: • The consumption of oil products in each sector. The sum of all oil products has a lower uncertainty than the
consumption in each sector. In practice, this is treated by assuming that sectors are independent, and then by scaling all uncertainties so that total uncertainty equals a specified value.
• Where the same activity data are used to estimate emissions of more than one pollutant • The number of domestic animals. The same population data are used for estimation of a) methane from
enteric fermentation, b) methane and nitrous oxide from manure management and c) nitrous oxide from agricultural soils
• For estimation of N2O from manure management, N2O from manure spreading and N2O from animal production (pasture) the following dependency estimation has been used for the activity data:
70 % of emissions dependent on cattle population 30 % of emissions dependent on sheep population
• For estimation of N2O from indirect soil emissions the following dependency estimation has been used for the activity data:
23 % of emissions dependent on cattle population 10 % of emissions dependent on sheep population 67 % of emissions dependent on amount of synthetic fertiliser used
Dependencies between emission factors Where emission factors have been assumed equal, we have treated them as dependent in the analysis. The following assumptions have been made: • The CO2 emission factors for each fuel type are dependent • The methane and nitrous oxide emission factors from combustion are dependent where they have been
assumed equal in the emission inventory model • In a few cases the emission factors of different pollutants are correlated. That is in cases when CO2 is
oxidised from methane (oil extraction, loading and coal mining). • For all direct emissions of N2O from agricultural soils, except for N2O from cultivation of organic soil, the
same emission factor is being used, and the sources are dependent. • There is a dependency between the emission factor used for calculating emissions from cropland liming and
other liming. There are also likely dependencies between other sources in LULUCF, e.g. between the activity data in the sources 5A2 Forest remaining forest and 5Q1 Forest drainage. But we have no estimates for the uncertainty in activity data, and anyhow the uncertainty in the emission factors is so large that even if the activity data is given an uncertainty it will have a minimal effect on the total uncertainty estimate for the source. Dependencies between data in base year and end year The estimates made for 1990 and 2009 will to a large extent be based on the same data and assumptions. Activity data The activity data are determined independently in the two years and are in principle not dependent. Correlation could be considered in cases where activity data can not be updated annually or where updates are based on extrapolations or interpolations of data for another year. This implies that we have assumed that errors in activity data are random, hence that systematic method errors are insignificant. It is, however, likely that there is a certain correlation between the activity data as they have been determined using the same methods. Emission factors Most of the emission factors are assumed unchanged from 1990 and 2009. Those that are not are all based on the same assumptions. This implies that all the emission factors are fully correlated between the two years.

Documents 21/2011 The Norwegian Emission Inventory 2011
Statistics Norway 235
This means that we have assumed that the emission factors assumed unchanged actually are unchanged from the base to end year. In reality it is expected that most emission factors are changing, but the degree of change is usually not known.
The statistical modelling Uncertainty analysis based on probabilistic analysis implies that uncertainties in model inputs are used to propagate uncertainties in model outputs. The result of the uncertainty estimation gives us the range and likelihood of various output values (Cullen and Frey 1999). Having generated a data set according to the specified parametric simultaneous distribution of the data described in table D1 and table D2, we may calculate any desired output defined as a function of the data. This gives us one simulated random realisation of this output, according to its marginal distribution derived from the underlying simultaneous distribution of the data. Independent repetition of the simulation gives an independent sample of the desired output according to its marginal distribution. The size of the sample is given by the number of repeated simulations, and has nothing to do with the size of the original data set. Based on such an independent and identically distributed sample, we may use the sample mean as an estimate of the mean of the output; we may also use the sample standard deviation as an estimate of the standard deviation of the output.
Results of the Tier 2 Uncertainty analysis Results for the uncertainties in the total emissions and trends for the GHG inventory, excluding and including the LULUCF sector are given in Chapter 1.6.1.
Source category level used in the analysis Source category level used in the analysis is listed in table D3.

The Norwegian Emission Inventory 2011 Documents 21/2011
236 Statistics Norway
Table D3. Source category level used in the analysis
IPCC Source Category Pollutant source 1A1A Public electricity and heat prod Coal/coke combustion 1A1A Public electricity and heat prod Wood combustion 1A1A Public electricity and heat prod Gas combustion 1A1A Public electricity and heat prod Oil combustion 1A1A Public electricity and heat prod Waste combustion 1A1B Petroleum refining Coal/coke combustion 1A1B Petroleum refining Oil combustion 1A1C Manufacture of solid fuels and other energy Gas combustion 1A1C Manufacture of solid fuels and other energy Oil combustion 1A2A Iron and steel Coal/coke combustion 1A2A Iron and steel Wood combustion 1A2A Iron and steel Gas combustion 1A2A Iron and steel Oil combustion 1A2B Non-ferrous metal Coal/coke combustion 1A2B Non-ferrous metal Wood combustion 1A2B Non-ferrous metal Gas combustion 1A2B Non-ferrous metal Oil combustion 1A2C Chemicals Coal/coke combustion 1A2C Chemicals Wood combustion 1A2C Chemicals Gas combustion 1A2C Chemicals Oil combustion 1A2D Pulp, paper, print Coal/coke combustion 1A2D Pulp, paper, print Wood combustion 1A2D Pulp, paper, print Gas combustion 1A2D Pulp, paper, print Oil combustion 1A2E Food prosessing, beverages, tobacco Coal/coke combustion 1A2E Food prosessing, beverages, tobacco Wood combustion 1A2E Food prosessing, beverages, tobacco Gas combustion 1A2E Food prosessing, beverages, tobacco Oil combustion 1A2F Other manufacturing Coal/coke combustion 1A2F Other manufacturing Wood combustion 1A2F Other manufacturing Gas combustion 1A2F Other manufacturing Oil combustion 1A2F Other manufacturing Waste combustion 1A3A Transport fuel - civil aviation 1A3B Transport fuel - road transportation 1A3C Transport fuel - railway 1A3D Transport fuel - navigation 1A3E Transport fuel - motorized equipment and pipeline 1A4A Commercial/institutional Coal/coke combustion 1A4A Commercial/institutional Wood combustion 1A4A Commercial/institutional Gas combustion 1A4A Commercial/institutional Oil combustion 1A4A Commercial/institutional Waste combustion 1A4B Residential Coal/coke combustion 1A4B Residential Wood combustion 1A4B Residential Gas combustion 1A4B Residential Oil combustion 1A4C Agriculture/forestry/fishing Coal/coke combustion 1A4C Agriculture/forestry/fishing Wood combustion 1A4C Agriculture/forestry/fishing Gas combustion 1A4C Agriculture/forestry/fishing Oil combustion 1A5A Military Military fuel - stationary 1A5B Military Military fuel - mobile 1B1A Coal mining, Extraction of natural gas 1B2A Extraction of oil - transport 1B2A Extraction of oil - refining/storage 1B2A Extraction of oil - distribution gasoline 1B2B Coal mining, Extraction of natural gas 1B2C Venting 1B2C Well testing 1B2C Flaring 2A1 Cement production 2A2 Lime production 2A3 Limestone and dolomite use 2A7 Other mineral production 2B1 Ammonia production 2B2 Nitric acid production 2B4 Silicium carbide production 2B4 Calcium carbide production 2B5 Methanol and plastic production 2C1 Iron and steel production 2C2 Ferroalloys production 2C3 Aluminium production 2C4 SF6 used in Al and Mg foundries 2C5 Mg production 2C5 Ni production, anodes 2D1 Pulp and paper 2D2 Carbonic acid, bio protein

Documents 21/2011 The Norwegian Emission Inventory 2011
Statistics Norway 237
2F consumption of halocarbons and SF6 3A Paint application 3B Degreasing and dry cleaning 3C Chemical products, Manufacture and processing 3D Other 4A1 Enteric fermentation - cattle 4A10 Enteric fermentation - other animal 4A3 Enteric fermentation - sheep 4A4 Enteric fermentation - goat 4A6 Enteric fermentation - horse 4A8 Enteric fermentation - swine 4A9 Enteric fermentation - poultry 4B1 Manure management - CH4 -cattle 4B11 Manure management - N2O - Liquid storage 4B12 Manure management - N2O - solid storage 4B13 Manure management - CH4 - other animal 4B3 Manure management - CH4 - sheep 4B4 Manure management - CH4 -goat 4B6 Manure management - CH4- horse 4B8 Manure management - CH4- swine 4B9 Manure management - CH4- poultry 4D1 Direct soil emission - Fertiliser 4D1 Direct soil emission - Manure 4D1 Direct soil emission- Other 4D1 Direct soil emission- Organic soil 4D2 Animal production 4D3 Indirect soil emission- Deposition 4D3 Indirect soil emission - Leaching, other 4F1 Burning of straw 5A1 Forest Land remaining Forest Land, Fertiliser 5A1 Forest Land remaining Forest Land, Drainage 5A1 Forest Land remaining Forest Land, Wildfires 5A1 Forest Land remaining Forest Land, Forest inventory area, Living
Biomass
5A1 Forest Land remaining Forest Land, Forest inventory area, Dead Biomass
5A1 Forest Land remaining Forest Land, Forest inventory area, Soils, Mineral
5A1 Forest Land remaining Forest Land, Forest inventory area, Soils, Organic
5A2 Land converted to Forest Land, Living biomass 5A2 Land converted to Forest Land, Soils, Mineral 5B1 Cropland remaining Cropland, Liming 5B1 Cropland remaining Cropland, Horticulture, Living biomass 5B1 Cropland remaining Cropland, Reduced tillage, Soils 5B1 Cropland remaining Cropland, Erosion of new agriculture land, Soils 5B1 Cropland remaining Cropland, Histosols, Soils 5B2 Land converted to Cropland, Living biomass 5B2 Land converted to Cropland, Soils, Mineral 5B2 Cropland, Disturbance 5C1 Grassland remaining Grassland, Other Grassland, Living biomass 5C1 Grassland remaining Grassland, Histosols, Soils 5C2 Cropland converted to Grassland, Horticulture, Living biomass 5D1 Wetlands remaining Wetlands, Living biomass 5D1 Wetland remaining Wetland, Peat extraction, Soils 5D2 Land converted to Wetland, Drainage 5E2 Land converted to Settlements, Living biomass 5E2 Land converted to Settlements, Soils 5F2 Land converted to Other land, Living biomass 5G Other; Liming of lakes and rivers 6A Managed waste disposal on land 6B Waste water -CH4 6B Waste water - N2O pipeline 6B Waste water - N2O plant 6B Waste water - N2O not connected 6C Waste incineration

The Norwegian Emission Inventory 2011 Documents 21/2011
238 Statistics Norway
Reference list Cullen, A.C, and H.C. Frey (1999): Probabilistic Techniqies in Exposure Assessment. A Handbook for Delaing with Variability and Uncertainty in Models and Inputs. ISBN 0-306-45957-4. Gustafsson (2005): Improved structures for uncertainty analysis in the Swedish Greenhouse Gas Emission Inventory. SMED, Swedish Methodology for Environmental Data IPCC (1997): Greenhouse Gas Inventory. Reference Manual. Revised 1996. IPCC Guidelines for National Greenhouse Gas Inventories, Volume 3, London: Intergovernmental Panel on Climate Change. IPCC (2000): Good Practice Guidance and Uncertainty Management in National Greenhouse Gas Inventories. J. Penman et. al. (eds.), Hayama, Japan: IPCC National Greenhouse Gas Inventories Programme, Technical Support Unit. IPCC (2006): 2006 IPCC guidelines for national greenhouse gas inventories, Instiute for Global Environmental Strategies (IGES) Klif (2011): http://www.klif.no/Tema/Klima-og-ozon/CO2-kvoter/Klimakvoter-for-2008/ NIJOS (2005): Emissions and removals of greenhouse gases from land use, land-use change and forestry in Norway, NIJOS Report 11/2005, Ås/Oslo: CICERO, Statistics Norway and NIJOS. Norcem (2006): Email from Lars André Tokheim, January 24 2006 Norsk Hydro (2006a): Email from Halvor Kvande, January 18 2006 Norsk Hydro (2006b): Email from Vidar Ersnes, January 18 2006 NPD (2006): Email from Marta Melhus, January 26 2006 Rypdal, K. (1999): Evaluation of uncertainty in the Norwegian emission inventory, Report 99:01, Oslo: Norwegian pollution control authority Rypdal, K. and L-C. Zhang (2000): Uncertainties in the Norwegian Greenhouse Gas Emission Inventory, Report 2000/13, Statistics Norway. Rypdal, K. and L-C. Zhang (2001): Uncertainties in Emissions of Long-Range Air Pollutants, Report 2001/37, Statistics Norway. Sandmo, T. (ed) (2010): The Norwegian Emission Inventory 2010. Documentation of methodologies for estimating emissions of long-range transboundary air pollutants, Documents 21/2010, Statistics Norway. SFT (1999a): Evaluation of uncertainty in the Norwegian emission inventory, Report 99:01 (Author: K. Rypdal), Oslo: Norwegian Pollution Control Authority. SFT (2006a): Email from Per Svardal, the Norwegian Pollution Control Authority, January 27 2006 SFT (2006b): Email from Eilev Gjerald, the Norwegian Pollution Control Authority, January 20 2006 SINTEF (2006): Email from Bodil Monsen, February 3 2006 Statistics Norway (2006a): Email from Berit Bjørlo, Division for agricultural statistics, January 26 2006 Statistics Norway (2006b): Personal communication with Henning Høie, Division for environmental statistics, Februar 2006 Statistics Norway (2006c): Personal communication with Ole Rognstad, Division for agricultural statistics, Februar 2006

Documents 21/2011 The Norwegian Emission Inventory 2011
Statistics Norway 239
Statistics Norway (2006e): Email from Svein Erik Stave, Division for environmental statistics, February 2 2006 Statistics Norway (2010): Email from Håkon Skullerud, Division for environmental statistics, August 13 2010 St. Gobain and Orkla Exolon (2006): Email from Svein Haarsaker (Orkla Exolon), January 20 2006 Tinfos (2006): Email from Helga Gustavson, Tinfos Titan & Iron KS, January 26 2006 UMB (2006) : Email from Harald Volden, the Norwegian University of Life Sciences, January 27 2006 Yara (2006): Email from Tore Jensen, January 19 2006
Long-range transboundary air pollutants Source for the uncertainty estimates for long-range transboundary air pollutants is Rypdal and Zhang (2001).
Table D4. Summary of expert judgements of uncertainties in point sources
Production type Number of plants
Pollutant Emission determination method and uncertainty evaluation Assessment (average)
Pulp and paper 6 SO2 Continuous emission measurements and estimations from sulphur content of fuel. Diffuse emissions of sulphur compounds when producing sulphite pulp. The latter has a higher uncertainty than both the measured and estimated stack emissions.
± 4 %
Oil refineries 2 (3) SO2 Continuous emission measurements and estimations from sulphur content of fuel.
± 5 %
NOx Based on measurements and calculations. ± 10 % NMVOC Combination of point measurements and calculations. Emissions
are variable with possibilities of systematic errors. Emissions from loading of products have lower uncertainty than the fugitive. Differences between the refineries due to different technology, products and operations.
± 45 %
Petrochemical industries and gas terminal
4 NOx Annual measurements and/or calculations ± 7 %
NMVOC Several emission points. Difficult to measure properly and high variability. Uncertainty is in any case lower than for the refineries as mostly gas is handled (high demand for security).
± 25 %
Cement 2 SO2 Continuous measurements and annual measurements/calculations. High variability as cement plants incinerates special waste.
± 12 %
NOx Continuous measurements and annual measurements/calculations. High variability as cement plants incinerates special waste.
± 12 %
Ammonia and fertiliser
2 NOx Continuous/weekly measurements. ± 7 %
NH3 Several emission points. Several measurements performed each year. Low variability.
± 10 %
Silicon carbide (SiC)
3 SO2 Emissions are estimates based on consumption and sulphur content of coke. The sulphur content is measured independently for every delivery. There is, however, uncertainty connected to the end products and degree of oxidation and definition applied, so reporting can seem inconsistent.
± 20 %
Ferroalloys 16 SO2 Emissions are estimates based on consumption and sulphur content of coke and the sulphur in products. The sulphur content is measured independently for every delivery. The sulphur content of products are measured regularly, but shows small variability.
± 2 %
NOx Estimates using emission factors. Emission factors are based on measurements. Emission factors are, however, only available for some types of ferroalloys and emissions are not estimated for the others.
± 10-20 %*
Aluminium 8 SO2 Monthly measurements (covering emissions from stack and ceiling)
± 7 %
NOx Emissions are estimated based on emission factors (see table 4). -Waste incineration
8 SO2 Annual representative measurements. Variable emissions due to the waste fraction incinerated.
± 7 %
NOx Annual representative measurements. ± 10 %* Additional uncertainty due to possible incomplete reporting.

The Norwegian Emission Inventory 2011 Documents 21/2011
240 Statistics Norway
Table D5. Summary of standard deviation and probability density of activity data
SNAP category Pollutant source Important for Standard deviation (2σ). %
Density shape
Source/Comment
01, 02, 03 Gas combustion NOx ± 4 Normal Directorate of oil and gas
01, 02, 03, 07, 08
Oil combustion (total) SO2, NOx ± 3 Normal Spread in data.
0102 Waste combustion - Energy industries
SO2, NOx, NMVOC ± 5 Normal Expert judgement
0202 Coal and coke combustion - Residential
SO2, NOx, NMVOC ± 20 Normal Expert judgement
090201 Waste combustion - Other sectors SO2, NOx, NMVOC ± 30 Lognormal Expert judgement 01, 02, 03 Wood combustion - All sectors SO2, NOx, NMVOC ± 30 Lognormal Expert judgement 01, 03 Coal and coke combustion-
Industry SO2, NOx, NMVOC ± 5 Normal Spread in data
07, 08 Oil, road/off-road/catalytic/non-catalytic
SO2, NOx, NMVOC, NH3
± 20 Normal Comparisons of data
0805 Oil combustion - Aviation SO2, NOx, NMVOC ± 20 Normal Expert judgement 0804 Oil combustion - Shipping SO2, NOx, NMVOC ± 10 Normal Comparisons of data 0401 Refineries (throughput) NMVOC ± 3 Normal Expert judgement 040301 Aluminium production NOx ± 3 Normal Expert judgement 040302 Ferroalloy production NOx ± 3 Normal Expert judgement 040605 Bread production NMVOC ± 30 Normal Expert judgement 040607 Beer production NMVOC ± 10 Normal Expert judgement 050202 Loading of crude oil NMVOC ± 3 Normal Expert judgement 0505 Gasoline distribution NMVOC ± 3 Normal Expert judgement 0601 Solvent use NMVOC See emission factor 09 Waste combustion in small scale SO2, NOx, NMVOC ± 50 Lognormal Expert judgement 090201 Methane incineration (landfills) NOx, NMVOC ± 5 Normal Expert judgement 090204 Flaring of natural gas NOx, NMVOC ± 4 Normal As combustion of gas 090204 "Flaring" of crude oil SO2, NOx, NMVOC ± 10 Normal Expert judgement 090203/4 Other flaring NOx, NMVOC ± 5 Normal Expert judgement 090207 Incineration of hospital waste NOx, NMVOC ± 20 Normal Expert judgement 090901 Cremation SO2, NOx, NMVOC ± 20 Normal Expert judgement 10 Animal population NH3 ± 5-10 Normal Expert judgement 10 Agricultural soils - Treatment of
straw NH3 See emission factor
1001 Agricultural soils - Fertiliser use NH3 ± 5 Normal Agriculture authorities 1009 Agricultural soils - Manure use NH3 ± 20 Normal Expert judgement

Documents 21/2011 The Norwegian Emission Inventory 2011
Statistics Norway 241
Table D6 Summary of standard deviation and probability density of emission factors
SNAP source category
Pollutant source Standard deviation (2σ). %
Density shape
Source/Comment
01, 02, 03 SO2 - Oil combustion, general ± 1 Normal Expert judgement. Oil companies 01, 02, 03 SO2 - Oil combustion, heavy fuel oil -50 - +100 Normal Expert judgement. Oil companies 01, 03 SO2 - Coal combustion -50 - +100 Lognormal Spread in data 01, 03 SO2 - Wood combustion -50 - +100 Lognormal Spread in data 0804 SO2 - Oil combustion, domestic
shipping ± 25 Normal Expert judgement. Oil companies
01, 02 (+03) NOx - Combustion in area sources ± 40-50 Normal Spread in data 0105 NOx - Combustion off-shore ± 40 Lognormal Expert judgement 040301 NOx - Aluminium production -50 - +100 Lognormal Expert judgement 07 NOx - Road traffic ± 25-30 Normal Expert judgement, spread in data 0704/0705 NOx - Motorcycles ± 40 Normal Expert judgement, spread in data 0801-02, 0806-09 NOx - Equipment and railways ± 40 Normal Spread in data 0804 NOx - Shipping ± 15 Normal Spread in data 0805 NOx - Aircraft ± 20 Normal EEA (2000) 0902 NOx - Flaring ± 40 Lognormal Expert judgement 01, 02 (+03) NMVOC - Combustion in area
sources ± 40-50 Normal Spread in data
0105 NMVOC - Combustion offshore ± 50 Lognormal Expert judgement 040605/07 NMVOC- Beer and bread production -50 - +100 Lognormal EEA (2000) 050201 NMVOC- Oil loading onshore ± 30 Normal Rypdal (1999), Expert judgement 050202 NMVOC- Oil loading offshore ± 40 Normal Rypdal (1999), Expert judgement 0505 NMVOC - Gasoline distribution ± 50 Lognormal EEA (2000) 0601 NMVOC - Solvent use ± 30 Normal Rypdal (1995) 0701 NMVOC - Road traffic (gasoline
vehicles) ± 40-50 Normal Expert judgement, spread in data
0703 NMVOC - Road traffic (diesel vehicles)
± 20-30 Normal Expert judgement, spread in data
0704/0705 NMVOC - Motorcycles ± 40 Normal Expert judgement, spread in data 0801-02, 0806-09 NMVOC - Equipment and railways ± 40 Normal Spread in data 0804 NMVOC - Shipping ± 50 Normal Spread in data 0805 NMVOC - Aircraft ± 25 Normal EEA (2000) 0902 NMVOC - Flaring ± 50 Lognormal Expert judgement 07 NH3 - Road traffic Factor 3 Lognormal Expert judgement, spread in data 1001 NH3 -Agriculture, fertiliser ± 20 Normal Expert judgement 1005 NH3 -Agriculture, animal manure ± 30 Normal Expert judgement 10 NH3 -Agriculture, treatment of straw ± 5 Normal Expert judgement
Table D7. Uncertainty in emission level of pollutants. 1990, 1998 and 2010
1990 μ (mean) ktonnes
Relative standard deviation (σ/μ) Uncertainty 2σ (% of mean)
Uncertainty 2σ (ktonnes)
SO2 52.7 0.02 4.0 2 NOx 219.0 0.062 12 27 NMVOC 298.4 0.09 18 54 NH3 22.9 0.104 21 5 1998 μ (mean)
ktonnes Relative standard deviation (σ/μ) Uncertainty
2σ (% of mean) Uncertainty 2σ (ktonnes)
SO2 29.8 0.021 4.2 1 NOx 224.0 0.062 12 27 NMVOC 344.5 0.105 21 72 NH3 27.0 0.091 18 5 2010* μ (mean)
ktonnes Relative standard deviation (σ/μ) Uncertainty
2σ (% of mean) Uncertainty 2σ (ktonnes)
SO2 22.0 0.025 5.0 1 NOx 156.0 0.062 12 19 NMVOC 194.0 0.074 15 29 NH3 23.0 0.105 21 5 * Projected data with uncertainties as if they were historical.

The Norwegian Emission Inventory 2011 Documents 21/2011
242 Statistics Norway
Table D8. Uncertainties in emission trends 1990-1998 and 1990-2010
Absolute change (μ2010-μ1990)
% change ((μ2010-μ1990)*100/μ1990)
Relative standard deviation (σ/(μ2010-μ1990))
Uncertainty 2σ (absolute change)
Uncertainty 2σ (%-point of change)
1990-1998 SO2 -23.0 -43 -0.04 1.7 3.2 NOx +4.8 +2 +3.00 28 13 NMVOC +43.8 +15 +0.40 35 12 NH3 +4.1 +18 +0.22 1.8 8.0 1990-2010 SO2 -30.7 -58 -0.03 1.8 3.4 NOx -62.8 -29 -0.21 26.9 12 NMVOC -104.9 -35 -0.18 38 13 NH3 +0.0 0 61.3 3.1 13
* Projected values with uncertainties as if they were historical.

Documents 21/2011 The Norwegian Emission Inventory 2011
Statistics Norway 243
Appendix E: Key category analysis for GHG This chapter outlines the Tier 2 methodologies used to find which sources are key categories in the Norwegian greenhouse gas emission inventory. Two different methods are used for the key category analysis. First, the standard method as described in IPCC Good Practice Guidance (IPCC 2000) is used, both at the Tier 1 level and at the Tier 2 level with uncertainties. Second, a sensitivity analysis is performed using the specification of the model for the uncertainty analysis, as described in Rypdal and Zhang (2000)). The uncertainty model is presented in Annex II. The discussion focuses primarily on the standard method. The sensitivity analysis is presented as supporting data. Key categories are identified as the emission sources that add up to 90 per cent of total uncertainty in level and/or trend. This definition of a key category is according to IPCC (IPCC 2000) which is based on Rypdal and Flugsrud (2001). A Tier 2 analysis for the LULUCF sector has also been performed. However, key categories for non-LULUCF sources are based on the analysis without LULUCF. The key category analysis is performed at the level of IPCC source categories and each GHG from each source category is considered separately with respect to total GWP weighted emissions (HFCs and PFCs are grouped together). The advantage in using a Tier 2 rather than the Tier 1 methodology is that uncertainties are taken into account so the ranking shows where uncertainties can be reduced. The steps taken to find key categories with respect to level and trend were the determination of uncertainties in input parameters (AD = activity data and EF = emission factors). Uncertainties of activity data and emissions
factors were combined to source uncertainty by the error propagation rule 22EFADsource UUU += (IPCC (2000),
equation 6.4). The next step was the use of sensitivity analysis to identify the parameters in the inventory that most influence most the total GHG emissions in level and in trend. The standard method does not take into account correlations. This has partly been handled by aggregating sources with the same emission factors. However, sources with similar emission factors in stationary combustion, categories 1A1, 1A2, and 1A4, were treated separately as suggested in the proposed 2006 guidelines. Also, correlations due to common activity data for several pollutants have not been taken into account. This may lead to an underestimation of the uncertainty importance for such sources. In the sensitivity analysis, such correlations may be specified in the model. The sensitivity analysis also allows separate treatment of activity data and emission factors. Compilations of the uncertainty importance elasticity lead to the estimation of uncertainty importance of each input parameter with respect to total level and trend uncertainty. Out of this we get a ranked list of parameters which add up to 90 per cent of total uncertainty in level and trend. The LULUCF key categories come in addition to this.

The Norwegian Emission Inventory 2011 Documents 21/2011
244 Statistics Norway
Appendix F: Economic sectors in the Norwegian emission model The classification is an aggregated version of the one used in the national accounts. To make the standard sectors more appropriate for emission calculations, a few changes have been made, e.g. "Private households" is defined as a sector. The classification is aggregated from the Norwegian Standard Industrial Classification, SIC2007 (Statistics Norway 2009). The SIC is identical to the European NACE (rev. 2) classification up to the four-digit level. A national level has been introduced at the five-digit level. The sector numbers in the model have six or, in a few cases, eight digits. The first two digits refer to the main sectors of the economy: 23 = private sector, 24 = central government, 25 = local government, 33 = private households, and 66 = foreign activity. For clarity, the two first digits are only included for the first sector listed in each main sector in the table below. The next four digits are approximate SIC codes. The first two of these in most cases correspond to SIC at the two-digit level, but some sector numbers, particularly those used for service industries, are aggregates of several SIC divisions. The detailed relationship is shown in the following table, where the sectors are listed with the corresponding SIC codes. For emissions from solvents and paraffin wax, figures are available at a somewhat more disaggregated sector level, but since these sectors do not reflect the general detailing level in the emission calculations, they are not included in the table below.

Documents 21/2011 The Norwegian Emission Inventory 2011
Statistics Norway 245
Sector number
SIC code Sector name
Agriculture and forestry 230100 01.01-5, 01.7 Agriculture
0160 01.6 Services related to agriculture
0210 02 Forestry and logging
Fishing
0310-N 03.1 Fishing
0320 03.2 Operation of fish farms
Energy sectors 0500 05 Coal mining
0600.1 06 part, 49.5 Extraction of crude petroleum and natural gas, offshore: Permanent installations
0600.2 06 part Extraction of crude petroleum and natural gas, offshore: Moveable installations
0600.3 06 part Extraction of crude petroleum and natural gas: Plants on shore
1910.2 19.1 part Coking plants
1922 19.2 part Manufacture of refined petroleum products
3510 35.12, 35.13, 35.14 Transmission, distribution and trade of electricity
3511 35.11 Production of electricity
3520 35.2 Manufacture and distribution of gas
3530 35.3 Steam and hot water supply
Mining/manufacturing 0710 07.1, 07.29 Mining of ores except uranium and thorium
0721 07.21 Mining of uranium and thorium ores
0810 08 except 08.92 Quarrying and mining except ores and extraction of peat
0892 08.92 Extraction and agglomeration of peat
0910 09.1, 52.215 Service activities incidental to oil and gas extraction
0990 09.9 Service activities incidental to mining
1010 10.1 Production, processing and preserving of meat and meat products
1020 10.2 Processing and preserving of fish and fish products
1030 10.3 Processing and preserving of fruit and vegetables
1040 10.4 Manufacture of vegetable and animal oils and fats
1050 10.5 Manufacture of dairy products
1060 10.6 Manufacture of grain mill products, starches and starch products
1080 10.7, 10.8 Manufacture of other food products
1090 10.9 Manufacture of prepared animal feeds
1100 11 Manufacture of beverages
1200 12 Manufacture of tobacco products
1300 13 Manufacture of textiles and textile products
1400 14 Manufacture of wearing apparel
1500 15 Manufacture of leather, leather products and footwear
1610 16.1 Sawmilling and planing of wood, impregnation of wood
1620 16.21, 16.22, 16.24, 16.29 Manufacture of products of wood, cork, straw and plaiting materials, except furniture
1630 16.23 Manufacture of builders' supplies
1711 17.11 Manufacture of pulp
1712 17.12 Manufacture of paper and paperboard
1720 17.2 Manufacture of articles of paper and paperboard
1800 18 Printing and service activities related to printing and reproduction of recorded media
1910.1 19.1 part Manufacture of coke oven products
1921 19.2 part Manufacture of refined petroleum products except oil refineries
2011 20.11, 20.12, 20.13 Manufacture of basic chemicals
2014 20.14 Manufacture of other organic basic chemicals
2015 20.15 Manufacture of fertilisers and nitrogen compounds
2016 20.16, 20.17 Manufacture of plastics and synthetic rubber in primary forms
2020 20.2 Manufacture of pesticides and other agrochemical products
2030 20.3 Manufacture of paints and varnishes, printing ink and mastics
2040 20.4 Manufacture of soap and detergents and toilet preparations

The Norwegian Emission Inventory 2011 Documents 21/2011
246 Statistics Norway
Sector number
SIC code Sector name
2050 20.5, 20.6 Manufacture of other chemical products
2100 21 Manufacture of basic pharmaceutical products and pharmaceutical preparations
2200 22 Manufacture of rubber and plastic products
2310 23.1 Manufacture of glass and glass products
2320 23.2, 23.3, 23.4 Manufacture of refractory products, clay building materials and other porcelain and ceramic products
2350 23.5 Manufacture of cement, lime and plaster
2360 23,6, 23.7, 23.9 Manufacture of products of cement, lime and plaster and other non-metallic mineral products
2411 24.101, 24.2, 24.3 Manufacture of basic iron and steel
2412 24.102 Manufacture of ferroalloys
2440 24.4 except 24.42 Other non-ferrous metal production
2442 24.42 Aluminium production
2451 24.51, 24.52 Casting of iron and steel
2453 24.53, 24.54 Casting of light metals and other non-ferrous metals
2510 25.1, 25.2, 25.3 Manufacture of structural metal products, tanks, reservoirs and containers etc. of metal
2570 25.7 Manufacture of cutlery, tools and general hardware
2590 25.4, 25.5, 25.6, 25.9 Manufacture of other metal products
2610 26.1, 26.2 Manufacture of electronic components and computers
2630 26.3 Manufacture of communication equipment
2640 26.4 Manufacture of consumer electronics
2650 26.5, 26.6, 26.7, 26.8 Manufacture of other electronic and optical products
2750 27.5 Manufacture of domestic appliances
2790 27.1, 27.2, 27.3, 27.4, 27.9 Manufacture of other electrical apparatus and equipment
2810 28.1, 28.2 Manufacture of general-purpose machinery
2830 28.3, 28.4, 28.9 Manufacture of special-purpose machinery
2900 29 Manufacture of motor vehicles and parts and accessories for motor vehicles
3011 30.1 except 30.113 and 30.116
Building of ships and boats
3012 30.113, 30.116 Building of oil platforms
3020 30.2 Manufacture of railway and tramway locomotives and rolling stock
3030 30.3 Manufacture of aircraft and spacecraft
3090 30.4, 30.9 Manufacture of other transport equipment
3100 31 Manufacture of furniture
3210 32.1 Manufacture of jewellery, bijouterie and related articles
3290 32.2, 32.3, 32.4, 32.5, 32.9 Other manufacturing
3310 33.1 Repair of fabricated metal products, machinery and equipment
3320 33.2 Installation of industrial machinery and equipment
Water supply, sewerage, waste management and remediation activities
3600 36 Water collection, treatment and supply 3800 37-39 Sewerage, waste collection, treatment and disposal activities; materials recovery
Construction
4120 41.2, 42, 43 Construction
Wholesale and retail trade 4700 45, 46, 47 Wholesale and retail trade, repair of motor vehicles and personal and household goods
Transport etc. 4910 49.1, 49.2 Transport via railways
4932 49.32 Taxi operation
4939 49.31, 49.39 Other land passenger transport
4940 49.4 Freight transport by road
5020.N 50.101, 50.201 Ocean transport
5030 50.102, 50.109, 50.202, 50.203, 50.204, 50.3, 50.4
Inland and coastal water transport
5100.1N 51 part Domestic air transport
5100.2N 51 part International air transport
5222 52 except 52.215, 79 Supporting and auxiliary transport activities
5300 53, 61 Post and telecommunications

Documents 21/2011 The Norwegian Emission Inventory 2011
Statistics Norway 247
Sector number
SIC code Sector name
Accommodation and food service activities
5500 55, 56 Accommodation, food and beverage service activities
Business services 5800 58 Publishing activities
6200 62, 63, 95 Information technology services
6600 64, 65, 66 Financial and insurance activities
6810 41.1, 68 Real estate activities
7100 69-71, 73-74, 78, 80-82 Other business activities
7200 72 Research and development
7700 77 Rental and leasing activities
8500 85 Education
8600 75, 86-88 Health and social work
9300 59-60, 90-93 Recreational, cultural and sporting activities
9400 94, 99 Activities of membership organisations
9600 96 Other service activities
Central government 245222 52, 79 Supporting and auxiliary transport activities
7100 69-71, 73-74, 78, 80-82 Other business activities
7200 72 Research and development
8410 84.1, 84.21, 84.23, 84.24, 84.25, 84.3
Public administration
8422 84.22 Defence
8500 85 Education
8600 75, 86-88 Health and social work
9300 59-60, 90-93 Other service activities
Local government 253700 37 Sewerage
3800 38 Waste collection, treatment and disposal activities; materials recovery
6000 59-60, 90-93 Other service activities
8410 84.1, 84.21, 84.23, 84.24, 84.25, 84.3
Public administration
8500 85 Education
8600 75, 86-88 Health and social work
9600 96 Other personal service activities
Private households 330000 n.a. Private households
Foreign activities in Norway 665020 n.a. Foreign activities in Norway, ocean transport
665100.2 n.a. Foreign activities in Norway, air transport

The Norwegian Emission Inventory 2011 Documents 21/2011
248 Statistics Norway
Appendix G: Source classifications used in the Norwegian emission inventory
Table G1. Source classifications used in the national emission inventory
Stationary combustion Oil and gas extraction Natural gas Flaring Diesel combustion Gas terminals Manufacturing and mining Refining Manufacture of pulp and paper Manufacture of mineral products Manufacture of chemicals Manufacture of metals Other manufacturing Other industries Dwellings Incineration of waste and landfill gas Process emissions Oil and gas extraction Venting, leaks, etc. Oil loading at sea Oil loading, on shore Gas terminals Manufacturing and mining Refining Manufacture of pulp and paper Manufacture of chemicals Manufacture of mineral products Manufacture of metals Iron, steel and ferroalloys Aluminium Other metals Other manufacturing Petrol distribution Agriculture Landfill gas Solvents Road dust Other process emissions Mobile combustion Road traffic Petrol engines Passenger cars Other light vehicles Heavy vehicles Diesel engines Passenger cars Other light vehicles Heavy vehicles Motorcycles, mopeds Motorcycles Mopeds Snow scooters Small boats Motorized equipment Railways Air traffic Domestic < 1000 m Domestic > 1000 m Shipping Coastal traffic, etc. Fishing vessels Mobile oil rigs, etc.

Documents 21/2011 The Norwegian Emission Inventory 2011
Statistics Norway 249
Table G2. UNFCCC/CRF1 and EMEP/NFR source sector categories
CRF NFR 1A1a Public Electricity and Heat Production 1A1a Public electricity and heat production 1A1b Petroleum refining 1A1b Petroleum refining 1A1c Manufacture of Solid Fuels and Other Energy
Industries 1A1c Manufacture of solid fuels and other energy
industries 1A2a Iron and Steel 1A2a Iron and steel 1A2b Non-Ferrous Metals 1A2b Non-ferrous Metals 1A2c Chemicals 1A2c Chemicals 1A2d Pulp, Paper and Print 1A2d Pulp, paper and print 1A2e Food Processing, Beverages and Tobacco 1A2e Food processing, beverages and tobacco 1A2f Other (oil drilling, construction, all other
manufacturing industries) 1A2fi Stationary combustion in manufacturing industries
and construction: Other 1A3e Other transportation/ Off-road vehicles and other
machinery 1A2fii Mobile Combustion in Manufacturing Industries
and Construction 1C1a International bunkers/ Aviation (1) 1A3ai(i) International aviation (LTO) 1A3ai(ii) International aviation (Cruise) (1) 1A3a Civil aviation (Domestic) 1A3aii(i) Civil aviation (Domestic, LTO) 1A3aii(ii) Civil aviation (Domestic, Cruise) (1) 1A3b Road transportation 1A3bi Road transport: Passenger cars 1A3bii Road transport: Light duty vehicles 1A3biii Road transport: Heavy duty vehicles 1A3biv Road transport: Mopeds & motorcycles 1A3bv Road transport: Gasoline evaporation 1A3bvi Road transport: Automobile tyre and brake wear 1A3bvii Road transport: Automobile road abrasion 1A3c Railways 1A3c Railways 1C1b International bunkers/ Marine (1) 1A3di(i) International maritime navigation (1) 1A3d Navigation 1A3dii National navigation (Shipping) 1A3e Other transportation/ Other non-specified 1A3e Pipeline compressors 1A4a Commercial/Institutional 1A4ai Commercial / institutional: Stationary 1A3e Other transportation/ Off-road vehicles and other
machinery 1A4aii Commercial / institutional: Mobile
1A4b Residential 1A4bi Residential: Stationary plants 1A3e Other transportation/ Off-road vehicles and other
machinery 1A4bii Residential: Household and gardening (mobile)
1A4c Agriculture/Forestry/Fishing 1A4ci Agriculture/Forestry/Fishing: Stationary 1A4cii Agriculture/Forestry/Fishing: Off-road vehicles and
other machinery 1A4ciii Agriculture/Forestry/Fishing: National fishing 1A5a Other stationary (including military) 1A5a Other stationary (including military) 1A5b Other, Mobile (including military) 1A5b Other, Mobile (including military, land based and
recreational boats) 1B1a Fugitive emissions from fuels/ Coal mining and
handling 1B1a Fugitive emission from solid fuels: Coal mining and
handling 1B1b Fugitive emissions from fuels/ Solid Fuel
Transformation 1B1b Fugitive emission from solid fuels: Solid fuel
transformation 1B2aiii Fugitive Emissions from Fuels/ Oil/ Transport 1B2aiii Transport 1B2aiv Fugitive Emissions from Fuels/ Oil/ Refining /
storage 1B2aiv Refining / storage
1B2av Fugitive Emissions from Fuels/ Oil/ Distribution of oil products
1B2av Distribution of oil products
1B2b Fugitive Emissions from Fuels/ Natural gas 1B2b Natural gas 1B2c Fugitive Emissions from Fuels/ Oil and natural gas/
Venting and Flaring 1B2c Venting and flaring
2A1 Cement Production 2A1 Cement production 2A2 Lime Production 2A2 Lime production 2A3 Limestone and Dolomite Use 2A3 Limestone and dolomite use 2A7a Quarrying and mining of minerals other than coal 2A7b Construction and demolition 2A7d Other Mineral products 2A7→ Leca Production 2A7→ Ore 2B1 Ammonia Production 2B1 Ammonia production 2B2 Nitric Acid Production 2B2 Nitric acid production 2B4.1 Silicon Carbide 2B4 Carbide production 2B4.2 Calcium Carbide 2B5.5 Methanol 2B5a Other chemical industry 2B5→ Plastic 2B5→ Production of Explosives 2B5→ Sulphuric acid production 2B5→ Titanium Dioxide Production 2C1 Iron and Steel Production 2C1 Iron and steel production 2C2 Ferroalloys Production 2C2 Ferroalloys production 2C3 Aluminium Production 2C3 Aluminum production 2C4 Aluminium and Magnesium Foundries 2C5 Metal Production/ Other 2C5e Other metal production 2D1 Pulp and Paper 2D1 Pulp and paper 2D2 Food and Drink 2D2 Food and drink 2F Consumption of Halocarbons and SF6 2G Industrial processes/ Other (Paraffin wax) 2G Other production, consumption, storage,

The Norwegian Emission Inventory 2011 Documents 21/2011
250 Statistics Norway
transportation or handling of bulk products 3A Paint Application 3A1 Decorative coating application 3A2 Industrial coating application 3A3 Other coating application 3B Degreasing and Dry Cleaning 3B1 Degreasing 3B2 Dry cleaning 3C Chemical Products, Manufacture and Processing 3C Chemical products 3D Solvent and other product use/ Other 3D1 Printing 3D2 Domestic solvent use including fungicides 3D3 Other product use 4A1 Enteric fermentation/ Cattle/ Mature Dairy Cattle
Mature Non-Dairy Cattle Young Cattle
4A3 Enteric fermentation/ Sheep 4A4 Enteric fermentation/ Goats 4A6 Enteric fermentation/ Horses 4A8 Enteric fermentation/ Swine 4A9 Enteric fermentation/ Poultry 4A10 Enteric fermentation/ Other 4B1a Manure management/ Cattle/ Mature Dairy Cattle
Mature Non-Dairy Cattle Young Cattle 4B1a Cattle dairy
4B3 Manure management/ Sheep 4B3 Sheep 4B4 Manure management/ Goats 4B6 Manure management/ Horses included in 4B13 4B8 Manure management/ Swine 4B8 Swine 4B9 Manure management/ Poultry 4B9b Broilers 4B10 Manure managemen/ Other included in 4B13 4B12 Manure managemen/ Liquid Systems 4B13 Manure management/ Solid Storage and Dry Lot 4B13 Other 4D1 Agricultural soils/ Direct soil emission 4D1a Synthetic N-fertilisers 4D2 Agricultural soils/ Pasture, Range and Paddock
Manure 4D2c N-excretion on pasture range and paddock
unspecified 4D3 Agricultural soils/ Indirect emissions 4D4 Agricultural soils/ Other 4F1 Field burning of agricultural wastes/ Cereals 4F Field burning of agricultural wastes 4G Agriculture other 5 Land Use, Land Use Change and Forestry (2) 6A1 Managed waste disposal on land 6A Solid waste disposal on land 6B1 Industrial Wastewater 6B Waste-water handling 6B2 Domestic and Commercial Waste Water 6Cb→ Waste Incineration/ Incineration of hospital wastes 6Ca Clinical wasteincineration 6Ca Waste Incineration/ Biogenic 6Cc Municipal waste incineration 6Cb→ Waste Incineration/ Incineration of corpses 6Cd Cremation 6D Waste/ Other 6D Other waste(e)
(1) Memo items
(2) Land Use, Land Use Change and Forestry is calculated and documented by Skog og landskap 1 Reporting in the CRF is more detailed for some source categories than shown in the table. In particular, emissions from energy use in 1A are reported by fuel, and emissions from use of fluorinated compounds in 2F are reported by substance and usage.

Documents 21/2011 The Norwegian Emission Inventory 2011
Statistics Norway 251
Appendix H: Methane emissions from enteric fermentation in Norway’s cattle and sheep population
.Method description By Harald Volden and Silje K. Nes, Department of Animal and Aquacultural Sciences, Norwegian University of Life Sciences.
Introduction An important end product from the ruminal fermentation is methane (CH4), and it is well known that the ruminants are important contributors to global warming through CH4 production. The Norwegian calculation of CH4 emission from livestock has been based on the Tier 1 method proposed by the Intergovernmental Panel on Climate Change (IPCC). However, the amount of CH4 produced from enteric fermentation is dependent on several factors, like animal species, production level, quantity and quality of feed ingested and environmental conditions. Therefore, IPCC (IPCC, 2001) has recommended to use more advanced methods when estimating CH4 gas emission, which take into consideration the influencing factors described above. According to IPCC (IPCC, 2001) the method for estimating CH4 emission from enteric fermentation requires three basic items:
• No. 1 The livestock population must be divided into animal subgroups, which describe animal type and production level.
• No 2. Estimate the emission factors for each subgroup in terms of kilograms of CH4 per animal per year. • No 3. Multiply the subgroup emission factors by the subgroup populations to estimate subgroup
emission, and sum across the subgroups to estimate total emission. Earlier the Tier 1 method, which is a simplified approach based on default emission factors from the literature, has been used. However, according to IPCC (IPCC, 2001) the Tier 2 approach should be used if livestock enteric fermentation represents a large proportion of the country’s total emissions or important animal subgroups data is available for more correct estimation CH4 emission. In Norway detailed information of the cattle production is available from the Cow recording System (TINE BA), which gives information of dairy cow production level and feeding. The system also gives information on beef production which includes age at slaughter, carcass weight, and average daily gain. This information will give additional country-specific information and can be used to develop sophisticated models that better incorporate information of diet composition, feed quality and animal production level and intensity. The objective of this manuscript is to describe the methods used to estimate the CH4 emissions from enteric fermentation in Norwegian’s cattle and sheep production.
General emission factor development and animal subgroups In all animal subgroups the following basic equation is used to calculate the CH4 emission factor: EF = (GE · Ym · 365 days/yr) / 55.65 MJ/kg CH4 Where: EF = emission factor, kg CH4/head/yr GE = gross energy intake, MJ/head/day Ym = CH4 conversion rate, which is the fraction of gross energy in feed converted to CH4. This equation assumes an emission factor for an entire year (365 days). In some circumstances the animal category may be defined for a shorter period or a period longer than one year and in this case the emission factor will be estimated for the specific period (e.g., lambs living for only 143 days and for beef cattle which are slaughtered after 540 days). The new methods of calculation require subdividing the cattle and sheep populations by animal type, physiological status (dry, lactating or pregnant) live weight and age, and table H1 describe the animal categories used in the calculations. In dairy cows additional information from the Cow Recording System concerning annual milk production and proportion of concentrate in the diet are used. The Cow Recording System also supply information about

The Norwegian Emission Inventory 2011 Documents 21/2011
252 Statistics Norway
slaughter age, slaughter weight and average daily weight gain (ADG) for growing cattle, which are utilized in the calculations for growing cattle.
Table H1. Categories of cattle and sheep used in the Norwegian calculations of methane emission from enteric fermentation. Animal numbers from 2004
Categories of cattle and sheep Number of animal by year 2004 Dairy cows 315224 Beef cows 51802 Replacement heifers, < one year 156712 Replacement heifers, > one year 174568 Finisher heifers, < one year 3263
Finisher heifers, > one year 18410 Finisher bulls, < one year 13114 Finisher bulls, > one year 106308 Breeding sheep, > one year 878405 Breeding sheep, < one year 387860 Slaughter lamb, < one year. Jan- May 86554 Slaughter lamb, < one year. Jun- Sept 1010461
The number of animals in each category is based on the official register of production subsidies. The register covers 90-100 % of the animal populations. Calculation of methane emission from enteric fermentation in dairy cows and beef cows To develop equations to calculate CH4 emission from enteric fermentation in dairy cows the following set of equations were needed: 1. In the estimation of CH4 emission we wanted to take into account the production level and diet composition.
Therefore, we used 1.16 million observations from the Cow Recording System to develop standard lactation curves, which were used for calculation of standard feeding rations. The lactation curves were used to predict animal requirement for milk production through the whole lactation cycle. The lactation curve was estimated using a gamma distribution model as described by Wood et al. (1967). Length of the lactation period was standardised to 305 days, which gives a dry period of 60 days. The lactation curves were estimated in 500 kg intervals from 4500 to 9500 kg of milk (305 day lactation yields).
2. To calculate feed energy value (gross energy, metabolizable energy and net energy content), animal energy requirement and energy supplementation the Dutch net energy lactation system (NEL) was used (Van Es, 1975). This system has been used as the official energy system in Norway since 1992. Standard feed rations at different lactation yields (500 kg intervals) were calculated using three different forage qualities representing low, medium and high energy content (5.7, 6.1 and 6.6 MJ NEL per kg dry matter, respectively). These qualities represent a normal range in forage qualities found in the Norwegian cattle production. Four different concentrate mixtures were used in the diet formulation to complement the animal energy requirement at different production levels. The concentrate mixtures are representative of what is used in practical diet formulation in Norway.
3. To estimate total feed intake and ration forage:concentrate ratio in the dry period and trough the lactation period a NDF (Neutral Detergent Fibre) intake system was used (Volden and Kjos, 2003). In the system, effect of daily milk yield and stage of lactation are taken into account when estimating the animal NDF intake capacity (g NDF per kg live weight). Daily feed intake is calculated from the following equation:
Where: NDFIC = NDF intake capacity, g/kg body weight ARNEL =Animal energy requirement, NEL per day P = proportion of forage in the total ration NDFF = forage NDF content, g/kg DM NDFC = concentrate NDF content, g/kg DM NELF = forage NEL content, per kg DM NELC = concentrate NEL content, per kg DM The point where the animal NDF intake capacity and the animal requirement intersect there is a unique solution, which represent the maximum intake and where the animal requirement is met. Consequently this equation can be used to maximize forage intake and at the same time fulfill the animal requirement at a chosen production
Intake = =
NDFIC
(P)NDFF + (1-P)NDFC ARNEL
(P)NELF + (1-P)NELC

Documents 21/2011 The Norwegian Emission Inventory 2011
Statistics Norway 253
level. In the equation the lactation curve information is used to define the animal requirement at different stages of lactation and different 305 d lactation yields. Figure H1 presents an example of estimated feed intake trough the lactation cycle for a lactation yield of 7000 kg. The estimates are based on the medium forage quality.
Figure H1. Example of estimated daily feed intake through the lactation cycle. Medium forage quality and a 305 d lactation yield of 7000 kg
0
2
4
6
8
10
12
14
16
-6 -1 4 9 14 19 24 29 34 39 44
lactation week
Dry
ma
tte
r in
tak
e,
kg
/d k
Forage
Concentrate
4. In Norway grass silage is the dominating winter forage, approx. 40 % of the total fed ration calculated on
energy basis, and the dairy cows are normally fed indoors for a period of six to eight months. Therefore, when estimating the CH4 production from enteric fermentation we wanted to use equations are based on grass silage measurements, and that take into account the effect of diet composition on CH4 production. This is in accordance with the recommendations of IPCC (IPCC, 2001), which suggest to use a Tier 2 or a Tier 3 approach when estimation CH4 emissions. After evaluating the literature we decided to use two equations published by Mills et al. (2003) and Kirchgessner et al. (1995). In the Mills et al. (2003) equation the effect of feed intake and dietary ADF and starch content are taken into account when predicting daily CH4 production. The following non linear model is used:
Methane (MJ/d) = 45.98 - 45.98 · e(-(-0.0011 · starch/ADF+0.0045) ·ME)
Where: Starch = diet starch content, g/kg dry matter’ ADF = diet ADF content, g/kg dry matter ME = daily intake of metabolizable energy, MJ The advantage of this equation is that it takes into account that both the feed intake level (expressed as metabolizable energy) and the ratio between rumen easily degradable carbohydrates and fibre which has shown to affect CH4 production. Test of this equation has shown that it is robust and it covers both dry cows and cows at different production levels. The second equation we used was the one described by Kirchgessner et al. (1995). The advantage of this equation is that it covers a wide range of cattle production (growing cattle and lactating cattle) and that it includes information about diet composition. This equation also takes into account that CH4 production is affected by dietary crude fat content: Methane (MJ/d) = (63+79 · CF + 10 · NFE + 26 · CP – 212 · CFat) · 55.65 Where: CF = crude fibre, kg/d NFE = nitrogen free extracts, kg/d CP = crude protein, kg/d CFat = Crude fat, kg/d In development of the CH4 emission equations we used average values of the two equations.

The Norwegian Emission Inventory 2011 Documents 21/2011
254 Statistics Norway
The information from the four points described above were used to calculate daily total feed intake, GE intake, ME intake and Ym. Daily feed intake was calculated in 14 d intervals for the different 305 d milk yields and the three different forage qualities. From this data set we developed two multiple regression equations, which were used to calculate average daily GE intake, across stage of lactation, at different 305 d lactation yields and different concentrate proportion in the diet. The reason why we used this approach is that both these variables are available from the Cow Recording System. In the statistical analysis a Proc Mixed procedure was used with stage of lactation as a repeated measurement. GE was predicted from the following equation: GE = 150.8 + 0.0205 · Milk305 + 0.3651· Concentrate_prop Where: GE = gross energy intake, MJ/day Milk305 = 305 d lactation yield, Concentrate_proportion = proportion of concentrate in the total diet. Calculated on net energy basis. The extent to which feed energy is converted to CH4 depends on several feeding and animal factors. From the dataset described above it is directly or indirectly possible to take into account several of these factors. The following equation was developed to predict Ym for dairy cows: Ym = 10.0 – 0.0002807 · Milk305 – 0.02304 · Concentrate_prop Where: Ym = methane conversion rate, % Milk305 = 305 d lactation yield, Concentrate_proportion = proportion of concentrate in the total diet. Calculated on net energy basis. From this equation it can be seen that the proportion of GE converted to CH4 decrease with increased milk yield and the proportion of concentrate in the diet. Table H2 present examples of GE and Ym at different production levels and different proportions of concentrate in the diet.
Table H2. Daily intakes of gross energy (GE) and methane conversion rate (Ym) at different milk yields (305 d yield) and concentrate proportions in the diet
Milk yield, 305 d Concentrate proportion, % GE, MJ/d1 Ym, % 5000 20 261 8.1 5000 50 272 7.4 7000 20 302 7.6 7000 50 313 6.9 9000 20 342 7.0 9000 50 354 6.3 1Feeding in the non lactating period included.
The Ym values presented in table H2 are higher than the standard value suggested in IPCC Tier 2 (IPCC 2001), which is 6.5% for dairy cows. The discrepancies can probably be explained by differences in diet composition, which has a high proportion of forage in Norway, and the relative moderate milk yield compared to other western European countries and North America. Another reason can be differences in the scientific basis for prediction of CH4 from enteric fermentation. The same approach was used when predicting CH4 production from beef cows. However, variable milk yield was not used. The lactation yield was fixed to 2500 kg and the concentrate proportion to 15%.
Calculation of methane emission from enteric fermentation in growing and finishing cattle In the Norwegian Cow recording System growing and slaughter information is available for different categories of growing and finishing cattle. Approximately 90% of the growing cattle are attended to the recording system. Information about age at slaughter, carcass weight and ADG are available. When developing equations for predicting CH4 emission in growing cattle we wanted to utilize this information. Therefore, the same approach as for dairy cows was used, including development of standard feed rations, which used the same forage qualities as for the dairy cows. Beef production in Norway comes mainly from one breed (Norwegian Red Cattle), which is described as an early-maturing breed. The feed rations used in practise contain an high proportion forage, with grass silage as the dominating forage, even during the finishing period. The carcasses required by the Norwegian market are normally heavy and average weight is approximately 300 kg.

Documents 21/2011 The Norwegian Emission Inventory 2011
Statistics Norway 255
To develop equations to calculate CH4 emission from enteric fermentation in growing cattle the following set of basic equations were needed: 1. To describe changes in live weight and ADG over time a Gompertz growth equation based on Norwegian
slaughter data was used (F. Walland, personal communication). From the Gompertz equation (figure H2) it is possible to estimate animal live weight (LW) and ADG. This information are further used to calculate animal energy requirement for maintenance and growth.
Figure H2. Gompertz growth function for prediction of live weight change and daily weight gain
0
100
200
300
400
500
600
7000
63
126
18
9
25
2
315
37
8
44
1
50
4
56
7
63
0
69
3
75
6
81
9
88
2
945
100
8
107
1
113
4
Age, days
Liv
e w
eig
ht
0
1
2
3
4
5
6
7
8
9
10
Live weightDaily weight gain
Wei
gh
t gai
n
Animal energy requirement was estimated based on an adjusted version of the Dutch Net energy lactation system (Van Es, 1975). The following equation was used to predict daily total energy requirement (NE MJ/d) for early-maturing bulls and heifers (Berg and Matre, 2001): NE = 0.2926 · LW0,75 + 0,020 · LW + 17.3 · ADG – 6.57 Where: NE = net energy requirement for maintenance and growth LW = live weight, kg ADG = average daily weight gain, kg 2. To calculate feed energy value and energy supplementation the same system as for dairy cows, the Dutch
net energy lactation system (NEL), was used (Van Es, 1975). Standard feed rations at different carcass weights and slaughter ages were calculated using the three different forage qualities. The French fill unit system (INRA, 1989) was used to estimate feed intake. Tests of this system have shown good agreements to what have been observed in Norwegian growing cattle experiments (J. Berg, personal communication). Animal feed intake capacity (IC) is dependent on LWt and age at maturing. In Norway, the forage is fed ad libitum, since a maximum forage intake is generally sought, and then the minimum allowance of concentrate necessary to meet energy requirement related to the production goal provided. Therefore, the same approach as for dairy cows was used to formulate feed rations:
Where: IC = animal intake, intake capacity, kg per day ARNEL =Animal energy requirement, NEL per day P = proportion of forage in the total ration FVF = forage fill value, g/kg DM FVC = concentrate fill vallue, g/kg DM NELF = forage NEL content, per kg DM
Intake = =
IC
(P)FVF + (1-P)FVC
ARNEL
(P)NELF + (1-P)NELC

The Norwegian Emission Inventory 2011 Documents 21/2011
256 Statistics Norway
NELC = concentrate NEL content, per kg DM In this formula information from the growth curve (figure H1) is used to define the animal energy requirement at different age, LW and ADG. The growth curve is also used to predict IC from the relationship between age and LW. Standard rations were calculated for slaughter ages of 14, 18 and 22 months. Within slaughter age three different carcass weights were used; 290, 320 and 350 kg. This data matrix is a representative variation of what is observed in practise in Norway. Feed rations were calculated in 30 day intervals from day 150 to slaughter. 3. Since the most commonly used feeding strategy for growing cattle is to maximise the forage intake and that
grass silage is the dominating forage in beef production the same equations as used for dairy cows was used to predict CH4 production. These equations are expected to be robust because different production levels (Mills et al., 2003) and animal categories (Kirchgessner et al.,1995).
Based on the standard feed rations, daily intake of GE, ME and Ym were predicted. From the dataset a multiple regression analysis were accomplish to develop equations that predict GE and Ym from animal characteristics available from the Cow Recording System. The analysis showed that it was necessary to develop two set of equations, one for the period when animals are younger than one year and one from one year to slaughter. The following equations were developed to predict average daily intake of GE: From day 150 to 365 days of age: GE = 102.2 + 0.3849 · CAW – 6.25 · SLA From 366 days to slaughter: GE = 118.5 + 0.375 · CAW – 4.05 · SLA Where: GE = gross energy, MJ/d CAW = carcass weight, kg SLA = months at slaughter Equations to estimate Ym: From day 150 to 365 days of age: Ym = 9.79 - 0.0187 · CAW + 0.3155 · SLA From 366 days to slaughter: Ym = 9.64 - 0.0045 · CAW + 0.074 · SLA Where: Ym = methane conversion rate, % CAW = slaughter weight, kg SLA = months at slaughter Table H3 present examples of daily GE intake and Ym at different age at slaughter and carcass weights.
Table H3. Estimated average daily intake of gross energy (GE) and methane conversion rate Ym (%) at different slaughter age and carcass weights
Period: 150 – 365 d Period: 366 d - slaughter Months at slaughter
Carcass weight GE, MJ/d Ym, % GE, MJ/d Ym, % 14 290 126 8.8 191 9.4 14 350 149 7.7 193 9.1 22 290 76 11.3 138 10.0 22 350 99 10.2 161 9.7 The Ym values presented in table H3 are higher than those presented as standard values in IPCC Tier 2 (IPCC 2001), which are 3% for feedlot cattle (90% or more concentrates in the diet) and 6,5% for other cattle. The discrepancies can probably be explained by differences in diet composition and the scientific basis for prediction of CH4 from enteric fermentation.
Methane emissions from Norwegian’s cattle population calculated from the developed equations are presented in table H4. To be able to compare our values to what has been suggested by IPCC, CH4 emission per animal has been is standardised to kg/head/year. In prediction of total CH4 emission from enteric fermentation data has been corrected for animal lifetime. Our emission factors (kg CH4/head/yr) for dairy cows and beef cows are comparable to what is presented by IPCC (IPCC, 2001) for Western European cows. Our estimate is 10%

Documents 21/2011 The Norwegian Emission Inventory 2011
Statistics Norway 257
higher, which are mainly due to differences in dry matter intake and the Ym factor. The latter can be explained by a high proportion of forage in the diet and scientific basis for the equations used to predict CH4 production. The same effect is found for growing cattle, which in IPCC (IPCC, 2001) is suggested to be 57 kg CH4/head/yr. Our average value, across all growing cattle categories, is 64 kg CH4/head/yr, which is 11% higher than the IPCC value suggested for Western European countries (IPCC, 2001).
Table H4. Methane emissions from enteric fermentation in Norwegian’s cattle and sheep, as determined by emission factors taken from European literature (cattle) and IPCC Tier 2 guidelines for 2006 (sheep). Animal predictions from year 2004
Methane, t per year
Categories of cattle and sheep GE intake, MJ/d
Methane lost, % of gross
energy intake
Methane, kg per head per
year12
1990 2000 2004
Dairy cows1 297 7.3 143 46194 40236 37605
Beef cows2 208 9.0 122 1971 6932 6312
Replacement heifers3 68 11.1 49 7999 8340 7611
Finisher heifers, < one year4 93 10.3 63 92 163 133
Finisher heifers, > one year5 74 11.1 67 742 982 997
Finisher bulls, < one year6 104 9.8 67 335 617 543
Finisher bulls, > one year7 114 10.1 76 10265 9716 9559
Breeding sheep, < one year8 51 4.5 15 3317 4212 2876
Breeding sheep, > one year9 40 6.5 17 13688 15127 14976
Slaughter lamb, < one year. Jan- May10 51 4.5 15 389 387 467
Slaughter lamb, < one year. Jun- Dec11 49 4.5 14 3142 3120 37681dairy cows: milk yield of 6469 kg per year 2Beef cows: milk yield of 2500 kg per year 3Replacement heifers: 27 months of at calving 4Finisher heifers < one year: 7.8 months at slaughter 5Finisher heifers > one year: 23.2 months at slaughter 6Finisher bulls, < one year: 19.8 months at slaughter 8Breeding sheep, < one year: 9Breeding sheep, > one year: 10Slaughter lamb, < one year. Jan- May: 4.8 moths at slaughter 11Slaughter lamb, < one year. Jun- Dec: 11 moths at slaughter 12Methane in kg per head per year was calculated as follows: ((GE intake, MJ/d x methane lost as % of GE/100)/55.65 MJ/kg)*365, where 55.65 is the energy content (MJ) of 1 kg of methane.
Calculation of methane emission from enteric fermentation in sheep In Norway sheep are used for meat- and not for milk production. No information system as the Cow Recording System is available for sheep. Information is restricted to number of sheep younger and alder 1 year, the number of slaughtered sheep younger and alder 1 year, and how many sheep younger than 1year that are slaughtered each month throughout the year. Prediction of methane emission from sheep is therefore based on the Tier 2 method described by IPCC (IPCC, 2001). In Norway most ewes lamb in the period march to may. There is a big demand for lamb meat around Christmas, and therefore, the major part of the lambs is slaughtered in the period October to December. Lambs that don’t fulfil the minimum levels for weight will be fed and slaughtered the next year together with ewe lambs that are not pregnant. On this basis the sheep population has been divided in four categories: 1) lambs under 1 year of age slaughtered in the period from June 1st to December 31st, 2) lambs under 1 year of age slaughtered in the period from January 1st to may 31st, 3) breeding sheep under 1 year of age and 4) breeding sheep over 1 year. Slaughtered lambs younger than 1 one year are divided in two groups because lambs that live longer then December will have an increased energy requirement for maintenance, activity and growth. To be able to divide the number of slaughtered lambs younger than 1 year in the two groups, the portion of slaughtered lambs for each are calculated. This calculation are based on available information of the number of slaughtered lambs younger than 1 year, and the number of lambs slaughtered each month, for two subsequent years. The number of lambs slaughtered in the period from June 1st to December 31st, and in the period from January 1st to may 31st, are added up for each year and the portion according to total number for each period and year were calculated, and an average number of the same period from the two subsequent years where used. The average portion of lambs slaughtered in June – December were found to be 0.921 and the portion slaughtered in January – May were 0.0789. Prediction of methane emission from sheep is based on the intake of GE and the fraction of GE converted to CH4 (the CH4 conversion rate, Ym). The intake of GE is estimated from the net energy requirement and concersion factors from net energy to GE. According to IPCC (IPCC, 2001) the Ym for sheep over one year is 6.5 % and 4.5 % for sheep under one year. The following equation was used to predict GE:

The Norwegian Emission Inventory 2011 Documents 21/2011
258 Statistics Norway
GE = [(NEm + NEa + NEl + NEp)/NEMef] + [(NEg + NEwool)/NEGef]/ (DE/100), Where: GE = gross energy, MJ/day NEm = net energy for maintenance, MJ/day Nem = Cfi · (bodyweight)0, 75
NEa = net energy for activity, MJ/day Nea = Ca · bodyweight NEl = net energy for unknown lactation, MJ/day NEl = ((5 · Wgwean) / 365 days) · EVmilk NEp = net energy for pregnancy, MJ/day NEp = Cpregnancy · NEm NEg = net energy for growth, MJ/day NEg = / (365 days/year) NEwool = net energy for one year of wool production, MJ/day NEwool = (EVwool · yearly wool production, kg/year)/ (365 days/year) NEMef = the ratio of net energy available in a diet for maintenance to digestible energy consumed NEGef = the ratio of net energy available for growth in a diet to digestible energy consumed DE = digestible energy in present of gross energy Net energy for maintenance is calculated as metabolic bodyweight (bodyweight0, 75) multiplied with a coefficient (Cfi) varying with age and sex. Cfi provided by IPCC (IPCC, 2001) is 0.217 for ewes over one year and 0.2496 for intact males over one year. For sheep under one year it is 0.236 for ewes and 0.2714 for intact male lambs. It is not possible to divide the number of sheep by sex, and therefore an average value of 0.2333 for sheep over one year and 0.2537 for sheep under one year has been used. Net energy for activity is calculated as bodyweight multiplied by a coefficient (Ca) corresponding to the animal’s feeding situation. According to IPCC (IPCC, 2001) Ca for housed ewes is 0.009, sheep grazing on flat pasture 0.0107, sheep grazing on hilly pasture 0.024, and for lambs kept indoor 0.0067. The feeding situation varies during the year, and therefore an average of the first three values (0.0146) has been used for sheep over one year, and an average of the three last values (0.0138) has been used for sheep under one year. Calculation of net energy for lactation is based on the formula for unknown lactation, because sheep in Norway are used for meat production. This formula includes average daily gain for each lamb in the period from birth to weaning, (WGwean), in kg. Weaning was set at seven weeks of age, which is taken as the time when the lambs are dependent on milk for half their energy requirement, and WGwean was set to 21.5 kg. The energy required for producing 1 kg of milk (EVmilk) is 4.6 MJ /kg. Net energy for lactation is calculated for breeding sheep over one year, and for two lambs for each ewe. Net energy for pregnancy is calculated from a coefficient for pregnancy, (Cpregnancy), multiplied with net energy for maintenance. According to IPCC (IPCC, 2001) Cpregnancy is 0.077 for one lamb, 0.126 for two lambs and 0.15 for more than two lambs. When the GE intake is calculated an average of the first two values (0.1015) is used for breeding sheep under one year, and an average of all three values (0.1177) is used for breeding sheep over one year. The formula used for calculating net energy for growth include bodyweight at the time of weaning (BWi), bodyweight at one year of age or at the time of slaughtering (BWf), average daily gain in the period from weaning to on year of age or slaughtering (WGlamb), and the given factors a and b. This formula was tried out, but the outcome was not in accordance with expected theoretical numbers, and therefore, another method was used to estimate the net energy requirement for growth. This method is based on average daily gain from birth to slaughtering and a net energy requirement of 17.3 MJ per kg gain was used. Average daily gain was calculated on the assumptions that weight at birth was 4.5 kg (Nedkvitne, 1989). Net energy for growth is calculated for both slaughtered and breeding sheep younger than 1 year. The need for net energy for wool production is calculated as the amount of wool produced during a year multiplied with the net energy content of 1 kg wool (EVwool), which is 24 MJ/kg (IPCC, 2001). The quantity of wool produced was set to 1.9 kg for sheep under one year and 4.1 kg for sheep over one year. From the estimated net energy requirement, daily GE intake is calculated based on conversion factors from net energy to GE. Conversion ratios was derived from the Dutch net energy system (Van Es, 1975), where values of 65, 81 and 43 % were used as average conversion rates from net energy to metabolizable energy, from metabolizable energy to digestible energy and from digestible energy to GE, respectively. For slaughtered lamb under one year, the requirements for net energy (MJ/day), NEm, NEa, NEg, and NEwool, where added up and converted into GE as described above. For these two animal sub-categories, June –

Documents 21/2011 The Norwegian Emission Inventory 2011
Statistics Norway 259
December and January – May, the CH4 emission was calculated for the living period, since the lamb live shorter than one year. When calculating methane emission from lambs it is, according to IPCC (2001), assumed that lambs do not emit methane until half of their energy requirement is covered from milk, and this phase has been set to 7 weeks of age. Therefore, when calculating methane emission from lambs younger than one year, daily emission is multiplied with the age at slaughter subtracted the 7 weeks. For breeding sheep under one year the requirements for net energy (MJ/day), NEm, NEa, NEg, and NEwool, where multiplied by 365 days, and net energy for pregnancy in MJ/day where multiplied by 150 days. Then the total requirement for net energy, MJ/year, was divided by 365 to get the energy requirement in MJ/day, and then converted GE. For breeding sheep over one year calculation of total net energy requirement was done in the same way as for breeding sheep under one year. For this category of sheep net energy for unknown lactation (IPCC, 2001) was used and this was done by multiplying daily requirement by 96 days, and then divided by 365 days. In table H4 daily GE intake and CH4 production for the different sub-categories of sheep is presented. The CH4 emission values, expressed as kg CH4/head /year, are higher than IPCC Tier 1 values. It is likely that the IPCC Tier 1 CH4 emission factors for sheep under Norwegian feeding practices and management strategies are set too low.

The Norwegian Emission Inventory 2011 Documents 21/2011
260 Statistics Norway
References for Appendix H INRA (1989): Ruminant Nutrition: recommended allowances and Feed Tables. Ed: Jarrige, R., INRA Publications, Paris, John Libbey Eurotext, London, Paris. 389 p. IPCC (2001): Good Practice Guidance and Uncertainty Management in National Greenhouse Gas Inventories. J. Penman et. al. (eds.), Hayama, Japan: IPCC National Greenhouse Gas Inventories Programme, Technical Support Unit. Kirchgessner, M. Windisch and H. L. Muller (1995): Nutritional factors for the quantification of methane production. In: W. v. Engelhardt, S. Leonhard-Marek, G. Breves and D. Giesecke (eds.) Ruminant physiology: Digestion, Metabolism, Growth and Reproduction. Proceedings of the Eight International Symposium on Ruminant Physiology. Ferdinand Enke Verlag Stuttgart 1995. Mills, J. A. N., E. Kebreab, C. M. Yates, L. A. Crompton, S. B. Cammell, M. S. Dhanoa, R. E. Agnew and J. France (2003): J. Anim. Sci. 81: 3141-3150. Nedkvitne, J.J. (1989): Fôring og stell av sau. I: Saueboka. Landbruksforlaget ISBN: 82-529-1219-2. redigert av Arne Maurtvedt (in Norwegian). Van Es, A. J. H. (1975): Feed evaluation for dairy cows. Livestock Production Science 2: 95-107. Volden, H. and N. P. Kjos (2003): Use of NDF-systems to predict forage intake. Proceedings of the International syposium “ Earley harvested forage in milk and meat production. 23-24 October 2003. Kringler, Nannestad, Norway. p. 35-43. Wood, P. D. P. (1967): Algebraic model of the lactation curve in cattle. Nature, 216:164-165.

Documents 21/2011 The Norwegian Emission Inventory 2011
Statistics Norway 261
Appendix I: QA/QC performed for GHG emissions from industrial plants included in the national GHG inventory
Introduction This appendix presents the methodology for the performance of QA/QC on time series from 1990 to 2004 of greenhouse gas (GHG) emissions from the largest industrial plants in Norway. The work was carried out by Section for climate and energy at the Climate and Pollution Agency in the period from February to April 2006. The following sectors of industry were covered: Cement production, mineral fertilisers, carbide industry, production of ferroalloys, production of primary aluminium, anode manufacture, production of iron and steel, nickel production, pulp and paper manufacture, oil refineries, gas terminals, lime production, other mineral production, methanol production, plastics, other chemical industry and production of magnesium. The goal of this work was to establish final time series of greenhouse gas emissions from 1990 to 2004 for these sectors. The main documentation from this work is contained in Excel spread sheets giving the resulting time series for each plant included in this revision, and in a documentation report "Documentation of methodology and results: QA/QC performed for GHG emissions from industrial plants included in the national GHG inventory" (Norwegian pollution control authority 2006). There have been several changes since the methodology was described:
• The 2005 GHG inventory data from the preliminary emission trading system (2005-2007) has been used. Onwards from 2008, the GHG inventory will include data from the emissions trading scheme (2008-2012) that is linked with the EU emission trading scheme. There was a voluntary agreement between industry and authorities covering the most carbon-intensive industry not included in the trading system in 2005-2007. This has made the reporting requirements stricter than before and QC is even more detailed.
• Changes of more than 20 per cent (10 per cent for plants included in emission trading) are flagged in the Excel spread sheets for further QC in collaboration with the plant.
• The Inkosys database has been replaced by the Forurensning database. Data have been transferred from Inkosys to Forurensning.
• Based on responses from ERT, more attention is given to implied emission factors (IEF). • New plants and a new sector (gas-fired power plants) are now included • Several time series have been recalculated
Method for establishing and verifying data series of emissions The following work procedure was established to verify data series: 1. For each plant; a first time series of emission data as well as activity data were established with basis on
existing sources of data (see section on data sources). 2. The first time series of emission data and activity data were presented in both a table format as well as a
graphic presentation. See figure I1 and figure I2 for examples. 3. Based on the table with compiled data and the graphic presentation, it was possible to identify:
• Lack of emission data and activity data for any year or time series. • Possible errors in the reported data. Possible errors were typically identified if there were discrepancies between reported activity data (consumption of raw materials, production volumes etc) and emissions, or if there were large variations in the existing time series of emissions.
4. The emission data where supplemented and/or corrected if possible by one or more of the following sources of information: • Supply of new data from the company • Supplementary data from the Climate and Pollution Agency paper archives. • Verification of reported emission data by new calculations based on reported activity data. • Calculation of missing emissions (if sufficient activity data were present).
5. A final time series of greenhouse gas emissions from 1990 to 2004 were established, and presented both as a tables and a figure. The origin of the data was documented by the use of colour codes.
6. The differences between former and new time series of emissions were identified and documented.

The Norwegian Emission Inventory 2011 Documents 21/2011
262 Statistics Norway
In the tables, colour codes were used to describe the source and type of the data. See figure I1 as an example of a data table with the explanations of the colour codes.
Figure I1. Examples of presentation in data tables and the use of colour codes 1990 1991 1992 1993 1994 1995 1996 1997 1998 1999 2000 2001 2002 2003 2004
CO2 process (1000 ton) 218,0 232,6 252,0 256,0 243,6 273,0 271,9 242,0 265,4 272,7 272,5 218,0 129,1 209,0 229,5CH4 (ton) 79,5 69 72 77 74 84 84 80 88 86 87 74 52 69 76N2O (ton) 26,5 26 27 29 27 31 31 30 33 32 33 28 20 28 31Activity data -whitebook(1000 ton) 69,68 84,33 85,1 84,55 70,05Activity data -Inkosys (1000 ton) 61 64 78,6 80,2 87,9 85,4 73,2 79,7 80,3 79,8 53,5 45,6 72,4 Time Serie 1990 1991 1992 1993 1994 1995 1996 1997 1998 1999 2000 2001 2002 2003 2004total CO2 (1000 tons) 47 32 64 84 161 151 207 207 202 185 128 213 153 135 137CO2 combustion (1000 tons) 38 23 55 75 152 143 199 198 193 177 119 205 145 127 127CO2 process (1000 tons) 9 9 9 9 9 9 9 9 9 8 9 8 8 9 10CH4 (ton) 2,0 2,2 2,5 0,9 7,4 7,0 9,8 9,9 9,6 8,7 5,8 10,1 7,1 6,0 6,2N2O (ton) 0,40 0,42 0,43 0,63 1,33 1,33 1,83 1,83 1,80 1,60 1,10 1,90 1,4 1,1 1,2Activity data white book (1000 tons) 12,2 60,5 55,4 37,2 64,1Activity data Inkosys (1000 tons) 17,3 7,4 48,1 45,1 62,6 63,0 60,7 55,4 35,6 64,1 45,7 39,4 41,3 Data from: Color codeWhite book on GHG Forurensning database Former time serie reported to Statistics Norway New, calculations by the Climate and Pollution Agency New, by intrapolation New, provided by company As the figure shows, there were six main sources of final data to the time series: the white book on GHG (SINTEF and Det Norske Veritas 2004), the Forurensning database (described in section on data sources), new data calculated by the Climate and Pollution Agency based on reported activity data, new data provided by company, and new data based on intrapolation between. Intrapolation was typically used as a method to establish data for the year 1991, if the emissions from 1990 and 1992 were given. The emission data and the activity data were presented in graphic presentation for a visual presentation. Figure I2 illustrates a presentation of the emissions and activity data from a pulp and paper plant.
Figure I2. Example of graphic presentation
0
50
100
150
200
250
1990 1991 1992 1993 1994 1995 1996 1997 1998 1999 2000 2001 2002 2003 2004
total CO2 (1000 tons)
CO2 combustion (1000 tons)
CO2 process (1000 tons)
CH4 (ton)
N2O (ton)
Activity data white book (1000 tons)
Activity data Inkosys (1000 tons)

Documents 21/2011 The Norwegian Emission Inventory 2011
Statistics Norway 263
Data sources The Forurensning database Data from the annual company emission reports are stored in the Climate and Pollution Agency database Forurensning. The database contains data from 1992, and holds emission and activity data from all companies reporting emissions to the Climate and Pollution Agency. The Forurensning database holds reported emissions and activity data from Norwegian companies. The companies report the data according to a manual25. In the Climate and Pollution Agency, the respective responsible officer undertakes a control of the data, before they are inserted in the database. The white book on climate gases from Norwegian process industry The white book on climate gases from Norwegian process industry (SINTEF and Det Norske Veritas 2004) was initiated by the Federation of Norwegian Process industry (PIL), Norwegian Chemical Industrial Worker’s Union (NKIF) and Norwegian Oil- and Petrochemical Worker`s Union (NOPEF). The work was carried out by DNV and Sintef, who collected, compiled, controlled and verified all emissions of climate gasses from these industrial plants for the years 1990, 1998, 1999, 2000 and 2001. The method of work as well as the main results are described in the reports from this project published by Federation of Norwegian Process Industry 2003. The main data files and verification tables from this work have been made available for the Climate and Pollution Agency. The white book includes data from 60 process industry plants. Since the emission data in this white book has gone through a thorough verification process, these emissions were assumed to be correct, unless any other information proved them incorrect. If several data sources reported different series of emissions, the data series from the white book were used. The white book on climate gases from Norwegian pulp and paper industry The white book on climate gases from Norwegian pulp and paper industry work was initiated by the Norwegian Pulp and Paper Association, and was carried out by DNV, Sintef and the Norwegian Association of Energy Users and Suppliers. They collected, compiled, controlled and verified all emissions of climate gasses from the relevant pulp and paper plants for the years 1990, 1998, 1999, 2000 and 2001. The method of work as well as the main results are described in the reports from this project published by Norwegian Pulp and Paper Association 2003. The main data files from this work have been made available for the Climate and Pollution Agency. Since the emission data in this white book has gone through a thorough verification process, these emissions were assumed to be correct, unless any other information proved them incorrect. If several data sources reported different series of emissions, the data series from the white book were used. Other sources Other data sources also available for this work were:
• Annual update of the climate gas inventories based on annual reports from Norwegian industry. Reported to Statistics Norway.
• Yearly (paper) reports from industry of emission to air, water and soil (Egenrapportering). • Applications for CO2-permits for the Norwegian emissions trading scheme.
Documentation of calculations and time series The main documentation from the work is contained in Excel spread sheets giving the resulting time series for each plant included in this revision. Each spread sheet includes emission data and activity data from the relevant data sources for each production plant. It includes the proposed time series for the relevant greenhouse gases, and states the sources for this information. Relevant information related to the QA/QC process for the specific site is noted as a comment or as a text box for each plant.
25 SFT (2004): Bedriftenes egenrapportering til forurensningsmyndighetene. Veiledning. Manual. Declaration of emissions. TA-1929/2004.

The Norwegian Emission Inventory 2011 Documents 21/2011
264 Statistics Norway
List of figures 6.1. The principle of the NH3 model ....................................................................................................................................151 H1. Example of estimated daily feed intake through the lactation cycle. Medium forage quality and a 305 d lactation
yield of 7000 kg............................................................................................................................................................253 H2. Gompertz growth function for prediction of live weight change and daily weight gain..................................................255 I1. Examples of presentation in data tables and the use of colour codes .........................................................................262 I2. Example of graphic presentation..................................................................................................................................262

Documents 21/2011 The Norwegian Emission Inventory 2011
Statistics Norway 265
List of tables Table 1.1. Definition of pollutants in the Norwegian emission inventory...........................................................................10 Table 1.2. Uncertainties in emission levels. Each gas and total GWP weighted emissions. Excluding the LULUCF
sector ..............................................................................................................................................................17 Table 1.3. Uncertainties in emission levels. Each gas and total GWP weighted emissions. Including the LULUCF
sector ..............................................................................................................................................................17 Table 1.4. Uncertainty of emission trends. 1990-2009. Excluding the LULUCF sector ....................................................19 Table 1.5. Uncertainty of emission trends. 1990-2009. Including the LULUCF sector .....................................................19 Table 1.6. Summary of identified key categories for the greenhouse gases except LULUCF. Per cent contribution to
the total uncertainty in level and/or trend. Bold numbers are key....................................................................21 Table 2.1. Energy commodities in the Norwegian emission inventory .............................................................................26 Table 2.2. Sources for energy combustion in the Norwegian emission inventory ............................................................27 Table 2.3. Combinations of fuels and sources in use.......................................................................................................27 Table 3.1. Average energy content and density of fuels ..................................................................................................30 Table 3.2. Overview of estimated and reported greenhouse gases CO2, CH4 and N2O for the energy combustion in
2009 ................................................................................................................................................................31 Table 3.3 Segments used for Norway in the HBEFA ......................................................................................................46 Table 3.4. Emission factor for electric railway conductions. g/km ...................................................................................50 Table 3.5. Methane emission factors for gas operated vessels. ......................................................................................51 Table 3.6. Recommended emission factors for NOx for different engine types ...............................................................52 Table 3.7. Particulate matter emission factors for oil and gas operated vessels. .............................................................52 Table 3.8. Uncertainties in emission factors for ships and fishing vessels. Per cent........................................................53 Table 3.9. Emission factors for particles from tyre wear. kg/mill. km................................................................................56 Table 3.10. Emission factors for heavy metals from tyre wear. g/mill. km..........................................................................56 Table 3.11. Emission factors for PAH from tyre wear. g/mill. km .......................................................................................56 Table 3.12. Metal content in brake blocks. mg/kg ..............................................................................................................58 Table 3.13. Particle emission factors for brake wear. kg/mill. km.......................................................................................58 Table 3.14. Heavy metal emission factors for brake wear. g/mill. km ................................................................................58 Table 3.15. SPS values. g/km............................................................................................................................................60 Table 3.16. Use of studded tyres in five prioritized communities. Share of traffic load with studded tyres. Light duty
vehicles ...........................................................................................................................................................61 Table 3.17. Averaged studded tyre share in Norway weighted by traffic load in the different counties. Light duty
vehicles ...........................................................................................................................................................61 Table 3.18. Grouping of wet, dry and icy road surface.......................................................................................................62 Table 3.19. PAH and Cd emission factors from road dust1. g/tonne. PM10 of road dust ....................................................62 Table 3.20. Emission factors for fuelwood, g/kg dry matter................................................................................................65 Table 3.21. Fugitive emissions from oil and natural gas. Emission sources, compounds, methods, emission factors
and activity data included in the Norwegian GHG Inventory ...........................................................................70 Table 3.22. Emission factors for gas distribution................................................................................................................74 Table 3.23. Emission factors for cold vents and leakage at gas fields offshore .................................................................75 Table 3.24. Emission factors for flaring of natural gas at offshore oil fields and one gas terminal on shore ......................75 Table 3.25. Emission factors for flaring in connection with well testing ..............................................................................76 Table 3.26. CO2 from the Sleipner field injected in the Utsira formation, 1000 tonnes.......................................................79 Table 3.27. Emissions of CO2 from the Sleipner CO2 injection plant due to inaccessibility of the injection facilities,
tonnes .............................................................................................................................................................79 Table 3.28. Injected and vented CO2. Hammerfest LNG/Snøhvit field. Tonnes .................................................................80 Table 4.1. Mineral products. Components emitted and included in the Norwegian inventory1 .........................................83 Table 4.2. Emission factors for Pb, Cd, As and Cr from production of rock wool. g/tonne produced rock wool ..............89 Table 4.3. Particle size distribution for particles emitted from ore mining. Ratio X1/TSP..................................................91 Table 4.4. Particle emission factors for sandpits and rock-crushing plants. Ratio X1/TSP...............................................94 Table 4.5. Particle emission factors for building and construction. Tonne/hectare/year...................................................95 Table 4.6. Chemical industry. Components emitted and included in the Norwegian inventory ........................................96 Table 4.7. Distribution of PAH emissions from silicon carbide production. Ratio X1/PAH ..............................................100 Table 4.8. Emission factors for flare...............................................................................................................................104 Table 4.9. Metal production. Components emitted and included in the Norwegian inventory ........................................109 Table 4.10. Distribution of PAH emissions from production of ferroalloys........................................................................113 Table 4.11. Emission factors for production of ferroalloys.Tonnes CO2/tonne reducing agent or electrode....................114 Table 4.12. Emission factors for CH4 and N2O from production of ferroalloys. Emission factors in kg per tonne
produced ferroalloy .......................................................................................................................................114 Table 4.13. Emission factors for production of ferrosilicon. Kg NOX /tonne metal produced. ...........................................115 Table 4.14. Emission factors for production of ferroalloys. μg dioxin /tonne metal produced...........................................115 Table 4.15. Emission factor used by Statistics Norway to calculate dioxin emissions from production of ferro
manganese/chromium...................................................................................................................................115 Table 4.16. Emission factors for production of ferroalloys. g PAH /tonne metal produced...............................................116 Table 4.17. Technology specific slope and overvoltage coefficients for the calculation of PFCs emissions from
aluminium production ....................................................................................................................................120 Table 4.18. Distribution of PAH emissions from production of primary aluminium. Ratio.................................................121 Table 4.19. Emission factor used to calculate dioxin emissions from aluminium production............................................121 Table 4.20. Distribution of PAH emissions from production of anodes. Ratio ..................................................................128 Table 4.21. NMVOC emission factors from production of bread and beverage ...............................................................130 Table 4.22. Emission factors for HFCs from products and lifetime of products................................................................132

The Norwegian Emission Inventory 2011 Documents 21/2011
266 Statistics Norway
Table 4.23. Yearly rate of leakage of SF6 from different processes .................................................................................133 Table 4.24. Product lifetimes and leakage rates from products containing SF6 ...............................................................133 Table 4.25 Parameters employed when calculating emission figures.............................................................................134 Table 5.1. Uncertainty estimates for level of NMVOC emissions, 2005-2007. Tonnes and per cent ............................139 Table 5.2. Uncertainty estimates for trend in NMVOC emissions, 2005-2007. Tonnes..................................................139 Table 5.3. Emission of PAH from use of tarry jointing paste1. kg PAH/year...................................................................140 Table 5.4 Dioxin emission factor for asphalt production. µg I-TEQ/tonne produced asphalt .........................................141 Table 5.5. Emission factors used for tobacco combustion .............................................................................................144 Table 6.1. Categories of cattle and sheep used in the Norwegian calculations of methane emission from enteric
fermentation ..................................................................................................................................................146 Table 6.2. Emission factors for CH4 from enteric fermentation and different animal types.............................................147 Table 6.3. Norwegian factors used to estimate CH4 from manure management in the IPCC Tier 2 method ................149 Table 6.4. N in excreta from different animals................................................................................................................150 Table 6.5. Fraction of total excretion per species for each management system and for pasture 2008........................150 Table 6.6. Average CH4 emission factors for manure management in the Norwegian method. kg/animal/day..............152 Table 6.7. N2O emission factors for manure management per manure management system .......................................153 Table 6.8. Emission factors for various storage systems and productions. Per cent losses of N of total N....................153 Table 6.9. Average emission factors for the manure storage systems used, distributed on type of animal production
and region. Per cent of total N.......................................................................................................................154 Table 6.10. Factors used for calculation of the nitrogen content in crop residues returned to soils .................................157 Table 6.11. Activity data for non-combustion emissions of N2O in the agriculture ...........................................................159 Table 6.13. Emission factors for NH3-N for different fertilisers .........................................................................................160 Table 6.14. Emission factors for NH3-N for various methods of spreading of manure. Per cent of total N.......................161 Table 6.15. Average NH3 emission factors for cultivated fields and meadows after time of spreading and region. 2009.
Per cent.........................................................................................................................................................161 Table 6.16. NH3 emission factors from droppings from grazing animals on pasture. Per cent.........................................161 Table 6.17. Emission factors for agricultural residue burning...........................................................................................164 Table 6.18. Emission factors for non-combustion emissions of particles from the agricultural sector. g/km2...................166 Table 7.1. Variables used in the calculations of methane from landfills .........................................................................170 Table 7.2. The developed water consumption coefficients and chemical oxygen demand. m3/mill NOK and mg/l .......174 Table 7.3 Potencial protein intake, and estimated protein intake. g/person/day, kg/person/year.1990-2009................175 Table 7.4. Emission factors for flare of landfill gas, cremation and hospital waste incineration .....................................177 Table 7.5. Emission factors used for car fires and house fires, unit/fire .........................................................................178 Table 8.1. Recalculations in 2011 submission to the UNFCCC compared to the 2010 submission. CO2, CH4 and
N2O. Tonnes CO2-equivalents.......................................................................................................................185 Table 8.2. Recalculations in 2011 to the UNFCCC submission compared to the 2010 submission. HFCs, PFCs and
SF6. Ktonnes CO2-equivalents ......................................................................................................................186 Table 8.3. Trends in emissions 1990-2008. 2011 submission compared to 2010 submission. GHG. Per cent change
1990-2008 .....................................................................................................................................................186 Table 8.4. Recalculations in 2011 submission compared to the 2010 submission. Main pollutants...............................195 Table 8.5. Recalculations in 2011 submission compared to the 2010 submission. Particulate matter..........................195 Table 8.6. Recalculations in 2011 submission compared to the 2010 submission. POPs and heavy metals ...............196 Table 8.7. Trends in emissions 1990-2008. This submission vs. previous submission. Main Pollutants. Per cent
change 1990-2008 ........................................................................................................................................196 Table 8.8. Trends in emissions 1990-2008. This submission vs. previous submission. Particulate Matter. Per cent
change 1990-2008 ........................................................................................................................................196 Table 8.9. Trends in emissions 1990-2008. This submission vs previous submission. POPs and heavy metals.
Per cent change 1990-2008 ..........................................................................................................................196 Table B1. General emission factors for CO2, SO2 and heavy metals ............................................................................211 Table B2. Exceptions from the general emission factors for heavy metals: Solid fuels in small stoves (households) ...211 Table B3. Time series for variable emission factors for SO2 (kg/tonne) ........................................................................212 Table B4. Time series for variable emission factors for heavy metals, stationary combustion. g/tonne ........................212 Table B5. Exceptions with time series for variable emission factors for natural gas combusted by oil exploration,
tonne CO2/1000 Sm3 natural gas ..................................................................................................................212 Table B6. General emission factors for aviation ............................................................................................................213 Table B7. Exceptions from the general factors for aviation ...........................................................................................213 Table B8. Time series for variable emission factors for aviation. Factors for 1989, 1995, and 2000 are calculated as
given in the table. Factors for 1990-1994 and 1996-1999 are calculated by linear interpolation. Factors before 1989 and after 2000 are kept constant...............................................................................................213
Table B9. General emission factors for road traffic .......................................................................................................214 Table B10. Average CH4 emission factors for road traffic including cold start emissions and evaporation, g CH4/ kg
fuel ................................................................................................................................................................214 Table B11. Average N2O emission factors for road traffic including cold start emissions and evaporation, g N2O/ kg
fuel ................................................................................................................................................................215 Table B12. General emission factors for navigation ........................................................................................................215 Table B13. Exceptions from the general factors for navigation .......................................................................................216 Table B14. Time series for variable emission factors for navigation. NOX.......................................................................216 Table B15. Time series for variable emission factors for navigation. CH4 .......................................................................216 Table B16. Time series for variable emission factors for navigation. NMVOC and CO ...................................................216 Table B17. General emission factors for other mobile sources .......................................................................................217 Table B18. Exceptions from the general factors for greenhouse gases and precursors for other mobile sources ..........217

Documents 21/2011 The Norwegian Emission Inventory 2011
Statistics Norway 267
Table B19. Exceptions from the general factors for other pollutants for other mobile sources ........................................218 Table B20. Time series1 for NOX emission factors for use of auto diesel in motorized equipment 4t ..............................218 Table B21. Time series for variable emission factors for other mobile sources...............................................................218 Table B22. General emission factors, kg CH4/tonne fuel.................................................................................................218 Table B23. Exceptions from the general factors for CH4, stationary combustion (kg CH4/tonne fuel) .............................218 Table B24. General emission factors. kg N2O/tonne fuel ................................................................................................219 Table B25. Exceptions from the general factors for N2O. Stationary combustion (kg N2O/1000 Sm3 natural gas)..........219 Table B26. General emission factors. kg NOX/tonne fuel ................................................................................................219 Table B27. Exceptions from the general factors for NOX. Stationary combustion. kg NOX /tonne fuel ............................219 Table B28. Time series for variable emission factors for NOX. Stationary combustion. kg NOX /tonne fuel ....................220 Table B29. General emission factors. kg NMVOC/tonne fuel..........................................................................................220 Table B30. Exceptions from the general factors for NMVOC. Stationary combustion. kg NMVOC/tonne fuel ................220 Table B31. General emission factors. kg CO/tonne fuel..................................................................................................220 Table B32. Exceptions from the general factors for CO. Stationary combustion. kg CO/tonne fuel ................................221 Table B33. Time series for variable emission factors for CO. Stationary combustion. kg CO/tonne fuel.........................221 Table B34. General emission factors. kg NH3/tonne fuel.................................................................................................221 Table B35. General emission factors. kg particle component/tonne fuel .........................................................................222 Table B36. General particle emission factors for heavy distillate and heavy fuel oil for all sources. Factors dependent
on sulphur content. kg particle component /tonne fuel ..................................................................................222 Table B37. Exceptions from the general factors for particles. Stationary combustion .....................................................223 Table B38. Time series for variable emission factors for particles1. Stationary combustion. kg particle component / ..........
tonne fuel ......................................................................................................................................................223 Table B39. General emission factors for PAH .................................................................................................................223 Table B40. Time series for variable emission factors for PAH1. Stationary combustion (g component /tonne fuel) ........224 Table B41. General emission factors for dioxins .............................................................................................................224 Table B42. Exceptions from the general factors for POPs. Stationary combustion .........................................................224 Table B43. Time series for variable emission factors for PAH. Stationary combustion ...................................................224 Table D1. Summary of standard deviation and probability density of activity data ........................................................228 Table D2. Summary of standard deviation and probability density of emission factors .................................................230 Table D3. Source category level used in the analysis ...................................................................................................236 Table D4. Summary of expert judgements of uncertainties in point sources .................................................................239 Table D5. Summary of standard deviation and probability density of activity data ........................................................240 Table D6 Summary of standard deviation and probability density of emission factors .................................................241 Table D7. Uncertainty in emission level of pollutants. 1990, 1998 and 2010.................................................................241 Table D8. Uncertainties in emission trends 1990-1998 and 1990-2010 ........................................................................242 Table G1. Source classifications used in the national emission inventory .....................................................................248 Table G2. UNFCCC/CRF1 and EMEP/NFR source sector categories ...........................................................................249 Table H1. Categories of cattle and sheep used in the Norwegian calculations of methane emission from enteric
fermentation. Animal numbers from 2004 .....................................................................................................252 Table H2. Daily intakes of gross energy (GE) and methane conversion rate (Ym) at different milk yields (305 d yield)
and concentrate proportions in the diet .........................................................................................................254 Table H3. Estimated average daily intake of gross energy (GE) and methane conversion rate Ym (%) at different
slaughter age and carcass weights ...............................................................................................................256 Table H4. Methane emissions from enteric fermentation in Norwegian’s cattle and sheep, as determined by
emission factors taken from European literature (cattle) and IPCC Tier 2 guidelines for 2006 (sheep). Animal predictions from year 2004................................................................................................................257
Copyright © 2022 FDOKUMEN