Incremental Response Spectrum Analysis (IRSA) Procedure ...
15
13 th World Conference on Earthquake Engineering Vancouver, B.C., Canada August 1-6, 2004 Paper No. 1440 INCREMENTAL RESPONSE SPECTRUM ANALYSIS (IRSA) PROCEDURE FOR MULTI-MODE PUSHOVER INCLUDING P-DELTA EFFECTS M. Nuray AYDINOGLU 1 SUMMARY The multi-mode pushover analysis procedure IRSA (Incremental Response Spectrum Analysis) is introduced recently to enable the two- and three-dimensional nonlinear analyses of buildings and bridges in a practical manner. It is essentially based on a piecewise linear Response Spectrum Analysis (RSA) procedure applied at each incremental step of a nonlinear analysis. The well-known equal displacement rule is utilized in practical applications to scale modal displacement increments using smoothed response spectra. P-delta effects are considered in IRSA on a rational basis, replacing the intuitive approach governing the current practice. Application of IRSA to three-dimensional pushover analysis of a building is presented. INTRODUCTION The Nonlinear Static Procedure (NSP) based on conventional pushover analysis under prescribed seismic loads with invariant patterns has been recognized as a standard tool for the deformation-based seismic evaluation of structures [1,2]. However, it needs to be admitted that in spite of its ever-increasing popularity, the development of pushover analysis has been an intuitive process rather than a rigorous one. In fact, lateral loads with various distribution patterns (including a highly controversial uniform pattern) have been intuitively prescribed to represent the static-equivalent seismic loads that are assumed effective in the fundamental mode of the structure. The nonlinear deformation of the structure is generally characterized by the roof displacement and its variation with respect to base shear defines the basic coordinates of the conventional pushover curve. As with the prescription of the lateral load patterns, the selection of the roof displacement as a control displacement results from an intuitive decision. Difficulties may arise in the case of bridges in selecting the control displacement [3]. The major drawback of NSP in its current form lies in the fact that it is essentially restricted with a single- mode response. Therefore the procedure can be reliably applied to only two-dimensional response of low- 1 Bogazici University, Department of Earthquake Engineering, Kandilli Observatory and Earthquake Research Institute, Cengelkoy, Istanbul, Turkey. Email: [email protected]
-
Upload
khangminh22 -
Category
Documents
-
view
4 -
download
0
Transcript of Incremental Response Spectrum Analysis (IRSA) Procedure ...

13th World Conference on Earthquake Engineering Vancouver, B.C., Canada
August 1-6, 2004 Paper No. 1440
INCREMENTAL RESPONSE SPECTRUM ANALYSIS (IRSA) PROCEDURE FOR MULTI-MODE PUSHOVER
INCLUDING P-DELTA EFFECTS
M. Nuray AYDINOGLU1
SUMMARY The multi-mode pushover analysis procedure IRSA (Incremental Response Spectrum Analysis) is introduced recently to enable the two- and three-dimensional nonlinear analyses of buildings and bridges in a practical manner. It is essentially based on a piecewise linear Response Spectrum Analysis (RSA) procedure applied at each incremental step of a nonlinear analysis. The well-known equal displacement rule is utilized in practical applications to scale modal displacement increments using smoothed response spectra. P-delta effects are considered in IRSA on a rational basis, replacing the intuitive approach governing the current practice. Application of IRSA to three-dimensional pushover analysis of a building is presented.
INTRODUCTION The Nonlinear Static Procedure (NSP) based on conventional pushover analysis under prescribed seismic loads with invariant patterns has been recognized as a standard tool for the deformation-based seismic evaluation of structures [1,2]. However, it needs to be admitted that in spite of its ever-increasing popularity, the development of pushover analysis has been an intuitive process rather than a rigorous one. In fact, lateral loads with various distribution patterns (including a highly controversial uniform pattern) have been intuitively prescribed to represent the static-equivalent seismic loads that are assumed effective in the fundamental mode of the structure. The nonlinear deformation of the structure is generally characterized by the roof displacement and its variation with respect to base shear defines the basic coordinates of the conventional pushover curve. As with the prescription of the lateral load patterns, the selection of the roof displacement as a control displacement results from an intuitive decision. Difficulties may arise in the case of bridges in selecting the control displacement [3]. The major drawback of NSP in its current form lies in the fact that it is essentially restricted with a single-mode response. Therefore the procedure can be reliably applied to only two-dimensional response of low-
1 Bogazici University, Department of Earthquake Engineering, Kandilli Observatory and Earthquake Research Institute, Cengelkoy, Istanbul, Turkey. Email: [email protected]

rise building structures regular in plan, where the seismic response is essentially governed by the first mode. Consequently, improved procedures are required for high-rise and/or plan-irregular buildings, which are able to account for multi-mode response in a practical, but at the same time, a rational manner. However it is not likely that this objective could be achieved by the existing intuitive approach. Major problems associated with this approach in current procedures are summarized in the following.
MAJOR PROBLEMS IN CURRENT PUSHOVER ANALYSIS PROCEDURES Single-mode analysis procedures Regarding the current single-mode pushover analysis procedure, a clear sign of the intuitive approach can be observed in the arbitrary prescription of the invariant load patterns to represent the height-wise distribution of static-equivalent seismic loads. Strictly speaking, none of the prescribed load patterns used in the current practice [2], i.e., first mode shape-like, constant, inverted triangular, to name a few is theoretically appropriate. Note that invariant load patterns violate the basic requirement of compatibility in single-mode response: Load patterns should be compatible with the resulting deformation patterns. This condition requires load patterns to change continuously with varying nonlinear response, which means that only adaptive load patterns can maintain the compatibility between loads and resulting deformations. It is shown in this paper that when modal adaptive patterns are employed, plotting the traditional pushover curve are completely avoided and the so-called modal capacity diagrams of equivalent single-degree-of-freedom (SDOF) systems can be directly obtained in both single-mode and multi-mode applications (Note that in current procedures one may come up with different capacity diagrams for each invariant load pattern used). Consideration of P-delta effects presents yet another source of concern in traditional single-mode pushover analysis procedure. First, difficulties arise in analysis phase when second-order stiffness matrix turns negative-definite, which makes pushing impossible to continue with a prescribed invariant load pattern. It is then generally shifted to an analysis based on an invariant displacement pattern using the last calculated displacement profile, which is doubtful to represent the post-buckling deformation state of the structure correctly. More important, however, is the serious problem being created in calculating the contribution of the equivalent P-delta forces to the base shear. Note that generally linear shape functions are adopted for an approximate development of the geometric stiffness matrix, which represents P-delta effects in the second-order stiffness matrix. In a two-dimensional response of a structure with rigid floor diaphragms, this approximation results in a P-delta moment at each story (total story axial force times the story drift), which is then divided to the story height and thus converted to an equivalent force couple. Resultants of those forces help define a tri-diagonal geometric stiffness matrix [4], which is used in most analysis software. However, it is clear that in calculating the contribution of P-delta forces in base shear, the sum of those equivalent force couples vanishes at every story except in the first story. Since the force at the bottom hits the foundation, the upper one at the first floor level remains as the only force counted in the base shear. Thus it means that, P-delta effect of only the first story is being considered in the base shear of the conventional pushover curve. For example if a structure has a strong first story, a weak intermediate story susceptible to an adverse P-delta effect can never be identified and the post-yield slope of the pushover curve may remain positive. Note that the base shear so obtained is then converted to pseudo-acceleration of the equivalent SDOF system by dividing it to the effective participating mass of the first mode, which is derived from the sum of static-equivalent seismic forces acting simultaneously at all stories (defined according to first mode shape without P-delta effects considered). The problem is evident and inconsistency speaks for itself. The analysis procedure presented in this paper brings a rational approach to this problem along with the improved characterization of the multi-mode effects.

Multi-mode analysis procedures Recent years have witnessed the development of a few pushover analysis procedures attempting to consider multi-mode effects. Among them is the so-called Modal Pushover Analysis (MPA) procedure [5], which may be regarded as a straightforward extension of the single-mode pushover analysis. In this procedure, conventional pushover analyses are run for each mode independently where invariant seismic load patterns are defined according to the elastic mode shape amplitudes. Modal pushover curves are plotted and then converted to SDOF capacity diagrams using modal conversion parameters based on the same shapes. Seismic demands, i.e., peak response quantities are then separately estimated for each individual mode and combined with an appropriate modal combination rule. It is seen that MPA is not immune from the problems described above for the single-mode analysis including the inconsistencies associated with the consideration of P-delta effects. Moreover, neglecting the effect of other modes in an individual pushover analysis is a controversial aspect of MPA. In the second group of multi-mode pushover analysis procedures developed by Gupta and Kunnath [6] and Antoniou et al. [7], modal scaling techniques applied in an adaptive manner. In both procedures, instantaneous free vibration modes and corresponding elastic spectral accelerations are calculated for the current state of the structure and then used for scaling modal seismic loads. In the former, incremental response quantities are calculated and combined with a modal combination rule, while in the latter seismic loads are directly combined to define the instantaneous load patterns at each analysis step. Here again the intuitive approach proves itself in the use of elastic spectral accelerations for modal scaling. It is clear that they are not consistent with the inelastic behavior of the structure. Furthermore, these procedures are unable to calculate the seismic demands, i.e., peak response quantities under a given earthquake identified with an elastic response spectrum, which should be considered as the ultimate goal of any pushover analysis procedure for practical engineering applications. Objective of IRSA The main objective of IRSA was to provide a rational methodology for multi-mode pushover analysis with a sound theoretical background to replace the existing intuitive approach [8]. To this end, IRSA was developed as a multi-mode process in which modal displacements are calculated incrementally until they reach their peak values, i.e., inelastic spectral displacements in each mode. This was achieved by applying a piecewise linear Response Spectrum Analysis (RSA) procedure at each incremental step in between the formation of the two consecutive plastic hinges. Once modal displacement increments are obtained for each mode at each step, the increments of all response quantities of interest, i.e., story displacements, story drifts, plastic hinge rotations, internal forces, etc. can be readily calculated using an appropriate modal combination rule. In the practical application of IRSA, the well-known equal displacement rule is utilized and the earthquake input is identified in the form of an elastic response spectrum. Moreover, IRSA is not restricted with two-dimensional response as with the current single-mode procedures and it is capable of analyzing three-dimensional response of buildings, bridges, etc including a rational consideration of P-delta effects.
DEVELOPMENT OF INCREMENTAL RESPONSE SPECTRUM ANALYSIS (IRSA) PROCEDURE FOR PRACTICAL APPLICATIONS
As it is mentioned above, multi-mode pushover analysis procedure IRSA (Incremental Response Spectrum Analysis – [8]) is essentially based on a piecewise linear Response Spectrum Analysis (RSA) applied at each incremental step of analysis. Adopting lumped plasticity approach, i.e., considering plastic hinges to characterize the nonlinear behavior of structural members, any incremental step or the so-called pushover step (i) represents the response increment in between the formation of two consecutive plastic hinges at discrete response points (i–1) and (i) during the so-called pushover-history process. Considering

a piecewise linear mode-superposition process along the (i)’th pushover step, n’th mode increment of the displacement vector, (i)
n∆u , can be expressed as (i) (i) (i) (i)
n n xn n = ∆∆u Ψ dΓ (1) where (i)
n∆d represents n’th mode increment of the modal displacement: (i) (i) (i 1)
n n n = d d d −∆ − (2) In Eq.1, (i)
nΨ denotes the instantaneous n’th mode shape vector defined through an eigenvalue analysis governed by (i) (i) (i) (i) 2 (i)
G n n n( ) = (ω )K K Ψ MΨ− (3) in which M is the mass matrix and (i)K and (i)
GK represent the elements of the second-order stiffness
matrix, namely instantaneous (tangent) stiffness and geometric stiffness matrices, respectively, the latter of which is due to P-delta effects (compressive axial forces are taken positive). (i) 2
n(ω ) is the instantaneous
eigenvalue at the (i)’th pushover step and (i)xnΓ in Eq.1 denotes the instantaneous modal participation factor
for an earthquake ground motion in x direction, which is defined as (i) (i) (i)T (i) (i) (i)T g
xn xn n n xn n x = / ( ) ; = Ψ MΨ Ψ M IL LΓ (4) where g
xI refers to an influence vector accounting for the pseudo-static transmission of the ground acceleration to the structure. In a three-dimensional response, its elements associated with the x direction are unity and all others are zero. The static-equivalent seismic load increment compatible with the displacement increment given in Eq.1 can be written as (i) (i) (i) (i) (i) (i) (i)
Sn G n n xn n= ( ) = ∆∆f K K ∆u MΨ a− Γ (5)
where (i)
n∆a represents modal pseudo-acceleration increment, which is defined as (i) (i) 2 (i)
n n n = (ω )a d∆ ∆ (6) Note that Eq.5 is written for the sake of completeness only, because IRSA is a displacement-based approach aiming at estimation of modal displacement increments given in Eq.2. Modal Capacity Diagrams It has been shown [8] that as a result of a hypothetical nonlinear time-history analysis based on a piecewise linear mode-superposition method, modal pseudo-acceleration versus modal displacement diagrams, i.e., an – dn diagrams can be constructed to represent the modal hysteresis loops, the outer envelopes of which are schematically depicted in Figure 1. It is observed that the loops are the flattest and fattest in the first mode and get steeper and thinner as the mode number increases. The backbone curves of those loops in the first quadrant (denoted with solid lines) can be appropriately called the modal capacity diagrams. The end points of diagrams define the peak modal displacements, in other words, inelastic spectral displacements in corresponding modes. By definition, first-mode capacity diagram is essentially identical to the capacity spectrum defined in the Capacity Spectrum Method [1] of the conventional pushover analysis where only the first mode is taken into account.
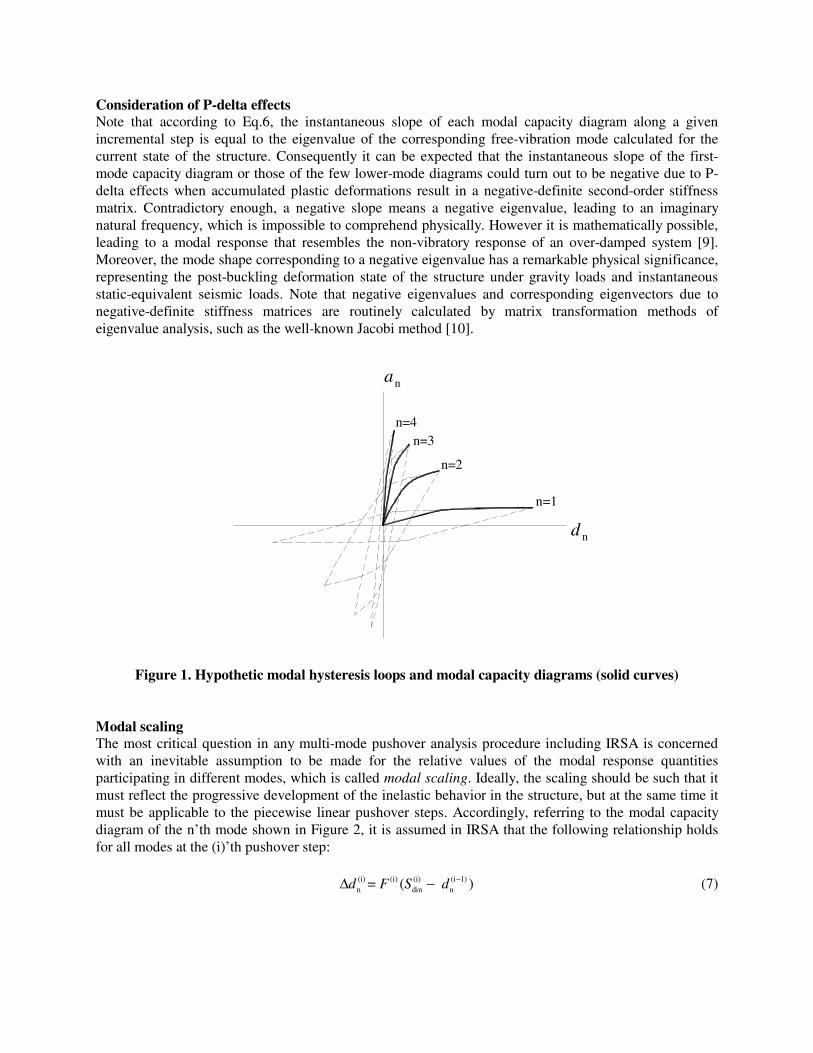
Consideration of P-delta effects Note that according to Eq.6, the instantaneous slope of each modal capacity diagram along a given incremental step is equal to the eigenvalue of the corresponding free-vibration mode calculated for the current state of the structure. Consequently it can be expected that the instantaneous slope of the first-mode capacity diagram or those of the few lower-mode diagrams could turn out to be negative due to P-delta effects when accumulated plastic deformations result in a negative-definite second-order stiffness matrix. Contradictory enough, a negative slope means a negative eigenvalue, leading to an imaginary natural frequency, which is impossible to comprehend physically. However it is mathematically possible, leading to a modal response that resembles the non-vibratory response of an over-damped system [9]. Moreover, the mode shape corresponding to a negative eigenvalue has a remarkable physical significance, representing the post-buckling deformation state of the structure under gravity loads and instantaneous static-equivalent seismic loads. Note that negative eigenvalues and corresponding eigenvectors due to negative-definite stiffness matrices are routinely calculated by matrix transformation methods of eigenvalue analysis, such as the well-known Jacobi method [10].
n=3
n=2
n=4
an
n=1
d n
Figure 1. Hypothetic modal hysteresis loops and modal capacity diagrams (solid curves) Modal scaling The most critical question in any multi-mode pushover analysis procedure including IRSA is concerned with an inevitable assumption to be made for the relative values of the modal response quantities participating in different modes, which is called modal scaling. Ideally, the scaling should be such that it must reflect the progressive development of the inelastic behavior in the structure, but at the same time it must be applicable to the piecewise linear pushover steps. Accordingly, referring to the modal capacity diagram of the n’th mode shown in Figure 2, it is assumed in IRSA that the following relationship holds for all modes at the (i)’th pushover step: (i) (i) (i) (i 1)
n din n= ( )d F S d −∆ − (7)

a
1
d(i-1)n
n
(i)dinS dn
2ω(i)( n )
an(i-1)
(i)nd
nSdin d
(i)∆dn
(i) (i-1)
Figure 2. Scaling modal displacement increment at (i)’th pushover step
where (i)F is a constant scale factor applicable to all modes and (i 1)
nd − denotes the n’th modal
displacement obtained at the end of the previous pushover step. In the expression above, (i)dinS refers to the
peak inelastic modal displacement, i.e., inelastic spectral displacement obtained from the nonlinear solution of SDOF modal equation of motion where the hysteretic behavior is represented by the modal capacity diagram corresponding to the instantaneous configuration of the plastic hinges at the beginning of the (i)’th pushover step (Figure 2). In other words, (i)
dinS represents the peak inelastic modal
displacement as if the previous hinge at (i–1) were the final hinge yielded in the system, thus reflecting approximately the progressive development of inelastic behavior in the structure. The proposed scaling procedure assumes that at the first pushover step (i=1) in which (0)
n = 0d , modal displacement increments
are scaled with respect to elastic spectral displacements and the scale factor ( (1) < 1F ) is determined at the first plastic hinge formation (Note that in a fully elastic RSA, (1)F = 1). At a typical pushover step (i) after the first step, the origins of the capacity diagrams may be assumed shifted to (i–1), which corresponds to the previous hinge, and again the same scaling procedure is actually applied, where the modal displacement increments are scaled with respect to the inelastic spectral displacements measured from the shifted origins, i.e., (i) (i 1)
din n S d −− .
The calculation of (i)
dinS for a given earthquake can best be achieved by Piecewise Exact Method [9]
including the case of negative post-yield slope(s) of the modal capacity diagram(s) due to P-delta effect. However such a time-history analysis requirement is contrary to the notion of practicality of pushover analysis, even if it involves simple, SDOF systems. Therefore such SDOF analyses are to be restricted mainly to the validation studies [8]. In practical applications it is required that inelastic spectral displacement, (i)
dinS , be calculated in a simple manner, preferably using the code-specified smoothed
response spectrum. Simplified modal scaling based on Equal Displacement Rule It is well known that inelastic spectral displacements may be estimated by appropriately modifying the elastic spectral displacements. In fact this is the practical approach adopted in FEMA 356 [2] as well as by others [11,12]. The approach is essentially based on the well-known equal displacement rule, which means that the spectral displacement of an inelastic SDOF system and that of the corresponding elastic

system are practically equal to each other provided that the effective initial period is longer than the characteristic period of the elastic response spectrum. The characteristic period is approximately defined as the transition period from the constant acceleration segment to the constant velocity segment of the spectrum. For periods shorter than the characteristic period, the elastic spectral displacement is amplified using a displacement modification factor, i.e., C1 coefficient given in FEMA 356 [2]. However such a situation is seldom encountered in mid- to high-rise structures involving multi-mode response. In such structures, effective initial periods of the first few modes are likely to be longer than the above-defined characteristic period and therefore those modes automatically qualify for the equal displacement rule. On the other hand, effective post-yield slopes of the modal capacity diagrams get steeper and steeper in the higher modes with gradually diminishing inelastic behavior (Fig. 1). Therefore it can be comfortably assumed that the peak modal displacement response in higher modes would not be different from the peak elastic response. Hence, the smooth elastic response spectrum as a whole may be effectively used in IRSA without modification for the inelastic behavior. In such a practical application, effective initial periods may be assumed equal to the elastic periods calculated in the first pushover step. Thus for a given n’th mode, inelastic spectral displacements, (i)
dinS , at all pushover steps can be taken equal to the elastic
spectral displacement, (1)denS , defined at the first step:
(i) (1)
din den = (i = 2, 3, .....)S S (8)
Accordingly, the basic scaling expression given by Eq.7 can now be simplified as (i) (i) (1)
n den= d F S∆ (9)
where (i)F is a constant scale factor replacing (i)F in Eq.7, which is again applicable to all modes at the (i)’th pushover step. Instead of using Eq.9 directly for scaling, it may be preferable to express the modal displacement increment in a given mode in terms of a reference modal displacement increment. Appropriately selecting the first mode as the reference mode, Eq.9 may be alternatively expressed as (i) (i) (i)
n n 1= λd d∆ ∆ (10) where (i)
nλ , which may be called inter-modal scale factor, is defined as (i) (1) (1) (1)
n n den de1λ = λ = / (i = 2, 3, .....)S S (11)
Thanks to the simple application of the equal displacement rule, inter-modal scale factor becomes constant at all pushover steps for a given n’th mode. It is clear that at every pushover step inter-modal scale factor associated with the first mode is always unity: (i)
1λ = 1 (12) while those of the higher modes are smaller for a standard smoothed response spectrum. It is worth noting that it is further possible to write a general scaling expression using Eq.9, which defines the cumulative modal displacement developed at the end of the (i)’th pushover step as

(i) (i) (1)n den= d F S% (13)
where (i)F% refers to the cumulative scale factor. Remarkably, Eq.13 corresponds to the monotonic scaling of the entire smoothed response spectrum progressively at each pushover step, which may be regarded analogous to the scaling of an individual earthquake record as applied in the Incremental Dynamic Analysis (IDA) procedure [13]. In other words, when the initial elastic periods are used in the implementation of the equal displacement rule, IRSA can be looked upon as the spectral analog of IDA. It is worth noting that equal displacement rule may not be valid for near-fault records with forward directivity effect where inelastic spectral displacements may amplify disproportionately at certain period ranges. The legitimacy of the equal displacement rule with P-delta effects is another issue, which will be addressed later in the paper. Modal combination n’th mode the increment of the displacement vector given in Eq.1 can be appropriately expressed as (i) (i) (i)
n n n = ∆∆u u d (14) where (i)
nu represents the displacement vector due to unit modal displacement increment in the n’th mode:
(i) (i) (i)n n xn= u Ψ Γ (15)
Thus, n’th mode increment of a generic response quantity of interest, such as the increment of an internal force, a displacement component, a story drift or the plastic rotation of a previously developed plastic hinge etc, may be written as (i) (i) (i)
n n n∆ = ∆r r d (16) in which (i)
nr refers to the response quantity readily obtained from (i)nu defined in Eq.15. Participation of
all modes considered in the analysis can be appropriately combined with a suitable modal combination rule. Utilizing for example CQC (Complete Quadratic Combination) rule, the increment of the combined generic response quantity developed at the (i)’th pushover step, (i)
∆r , can be estimated as
s sN N
(i) (i) (i) (i)mn m n
m=1 n=1∆ = ( ∆ ∆ ) r r rρ∑∑ (17)
where Ns refers to the total number of considered in the analysis and (i)
mn ρ represents the cross-correlation coefficient of the CQC rule [14]. Now Eq.10 and Eq.16 can be substituted in Eq.17 to express the increment of the combined generic response quantity in terms of the first modal displacement increment only: (i) (i) (i)
1∆ = ∆r r d (18)
in which (i)r is defined as
s sN N
(i) (i) (i) (i)mn m n
m=1 n=1 = ( ) r r rρ∑∑ (19)

Here (i)mnρ can be expressed as
(i) (i) (i) (i)mn mn m n = ρ ρ λ λ (20)
Thus, generic response quantity at the end of the (i)’th pushover step can be estimated as (i) (i 1) (i) (i 1) (i) (i)
1 = + ∆ = + ∆r r r r r d− − (21) provided that the first modal displacement increment is determined. Estimating response increments: Pushover-history Each pushover step involves the formation of a new hinge. In order to locate the next hinge and estimate the response quantities to develop at the end of the (i)’th pushover step, the generic expression given in Eq.21 is specialized for the response quantities that define the coordinates of the yield surfaces of all potential plastic hinges, i.e., biaxial bending moments and axial forces in a general, three-dimensional response of framed structures. The section that yields with the minimum positive increment of the first modal displacement, (i)
1∆d , is identified as the new hinge. In order to avoid iterative search operations in the hinge location process, yield surfaces are linearized in a piecewise fashion, i.e., they are represented by finite number of lines and planes in two- and three-dimensional cases, respectively (see example application). Once (i)
1∆d is determined, the new value of any response quantity of interest at the end of the (i)’th pushover step can be obtained from the general expression of Eq.21. Subsequently, modal displacement increments of other modes are obtained from Eq.10 and the increments of modal pseudo-accelerations are then calculated from Eq.6. Adding to those calculated at the end of the previous step, the new coordinates of all modal capacity diagrams are simultaneously determined as (i) (i 1) (i) (i 1) (i) (i)
n n n n n 1 = + = + λd d d d d− −∆ ∆ (22a)
(i) (i 1) (i) (i 1) (i) (i) 2 (i)n n n n n n 1 = + = + λ (ω )a a a a d− −∆ ∆ (22b)
Estimating peak response quantities The above-described pushover-history procedure is repeated until any of the modal displacements, say, the first modal displacement obtained at the end of a pushover step exceeds the corresponding inelastic spectral displacement. It means that the peak response has been reached somewhere within this step. When such a step is detected, which is indicated by superscript (p), modal displacements are set equal to the inelastic spectral displacements: (p) (p)
n din = d S (23)
which are equal to elastic spectral displacements according to equal displacement rule (Eq.8). The last increments of modal displacements are then calculated from Eq.22a as (p) (p) (p 1)
n din n = d S d −∆ − (24)
which means that modal displacements reach their peaks in all modes simultaneously with a scale factor
of (p) = 1F (see Eq.7). Finally the peak response quantities of interest are obtained from Eq.21 as (p) (p 1) (p) (p)
1 = + ∆r r r d− (25)

Single-mode adaptive pushover analysis: Special case of IRSA The single-mode adaptive pushover analysis can be readily performed as a special case of the Incremental Response Spectrum Analysis (IRSA) procedure. Although the response spectrum approach is not relevant to a single-mode response, it is clear that the expressions given for multi-mode IRSA in Eqs.1-25 are equally applicable to the single-mode case when they are simply written for n = 1. Thanks to the selection of the first mode as a reference mode, the inter-modal scale factor defined in Eq.11 is always unity at all pushover steps and the response is solely controlled by a single independent parameter, namely the first modal displacement, (i)
1∆d . It means that the course of development of the modal capacity diagram, i.e., the pushover-history is independent of the earthquake specified, which needs to be considered only at the last pushover step to estimate the peak response quantities according to Eqs.24,25.
ILLUSTRATIVE EXAMPLE: 2-D AND 3-D PUSHOVER ANALYSES OF A 9-STORY BUILDING
The structure selected for demonstrating the capabilities of IRSA is the 9-story benchmark steel building with a basement designed for the Los Angeles area as part of the SAC project [15]. The building has four identical moment resisting perimeter frames on each side as shown in Figure 3. Internal frames are designed for gravity loading only, without any contribution to the seismic resistance of the building. Looking from outside, perimeter frame beams located at the rightmost bays are connected to the columns on every corner with hinge connections. Weak-axis bending stiffnesses of the perimeter frame elements (out-of-plane) and those of corner columns with beam-hinge connections (in-plane) are neglected. It means that bi-axial bending is omitted in columns for simplicity. Centerline-to-centerline dimensions are considered in the analysis model. Rigid-plastic point hinges are used for potential sections at the ends of columns and beams with an elastic-perfectly plastic hysteretic behavior. Yield surfaces in steel columns are linearized with a constant plastic moment up to 15% of the column squash load followed by a linearly decreasing yield moment with increasing axial force in both compression and tension. Gravity loading compatible with the seismic mass distribution is first applied to the structure and the resulting internal forces are used as initial values for IRSA. The geometric stiffness matrix is calculated as compatible with the seismic masses in accordance with rigid diaphragm modeling.
Sou
th
Nor
th
East
West
CM
EQ
e
Figure 3. Plan and elevation of 9-story steel building with a basement

Earthquake ground motion is applied in N-S direction and identified as a standard response spectrum [2] with short-period and one-second spectral accelerations being 1.375 g and 0.80 g, respectively. The first set of analysis is intended to demonstrate the importance of higher mode effects with a 2-D model. Two IRSA runs are made considering four modes and a single mode, respectively, for a symmetrical response (with e = 0 in Fig.3), in both of which P-delta effects are taken into account. Figure 4 shows height-wise variations of peak floor displacements, story drift ratios and right-end plastic hinge rotations of central span beams in eastern frame. Modal capacity diagrams of the four-mode solution are also shown on the same figure with graphical implementation of equal displacement rule using smoothed response spectrum plotted in acceleration-displacement response spectrum (ADRS) format. Significant effects of higher modes in story drift ratios and plastic hinge rotations are evident.
Figure 4. (a) Peak floor displacements, (b) story drift ratios, (c) right-end plastic hinge rotations of central span beams in eastern frame estimated by IRSA considering 4 modes and a single mode,
(d) modal capacity diagrams for 4-modes IRSA with implementation of Equal Displacement Rule

The significance of P-delta effects are demonstrated in the second set of analysis performed again with the same 2-D model. Considering four modes, typical results obtained in two IRSA runs with and without P-delta effects are presented in Figure 5. Modal capacity diagrams with P-delta effects are those already given Fig. 4(d). The diagrams without P-delta effects are not shown because the differences are not noticeable. Very small negative instantaneous eigenvalues and consequently small negative slopes developed only in the first mode during the formation of the last five hinges (out of total 76 hinges developed at each frame – locations not shown). Therefore it is reasonable to expect that such negligible negative slopes developing at large modal displacements near the peak spectral displacement may not affect the inelastic response and hence the use of the equal displacement rule may be justified. On the other hand however, it is observed from Fig. 5 that the peak response quantities, especially story drift ratios and plastic hinge rotations are influenced from P-delta effects, which appear to be mainly due to significant changes occurred in mode shapes (especially in the first mode shape) that are derived from negative-definite instantaneous second-order stiffness matrices. In fact, amplifications in story drifts and plastic hinge rotations in lower stories due to P-delta effects and on the contrary de-amplifications observed in upper stories (Fig.5) can be attributed to those changes.
Figure 5. (a) Peak floor displacements, (b) story drift ratios, (c) right-end plastic hinge rotations of central span beams in eastern frame estimated by 4-modes IRSA with and without P-delta effects
It is admitted that the legitimacy of the equal displacement rule with P-delta effects is debatable. Inelastic SDOF system analyses based on bilinear backbone curves with negative slopes indicate that such systems are susceptible to dynamic instability rather than having amplified displacements due to P-delta effects. It is known that dynamic instability phenomenon is affected from the hysteretic model used in the analysis [9], as well as from the characteristics of the earthquake record. The dynamic instability primarily depends on certain parameters such as yield strength, initial stiffness and the negative post-yield stiffness of SDOF oscillator. Practical guidelines are proposed for minimum strength limits in terms of other parameters to avoid instability [16]. Further research is needed for the realistic cases of hysteretic backbone curves represented by modal capacity diagrams, which exhibit multiple post-yield slopes with both ascending and descending branches. For the time being, equal displacement rule could be used in IRSA excluding near-fault earthquakes with forward directivity, provided that an imminent danger of dynamic instability is not expected according to the above-mentioned practical guidelines.
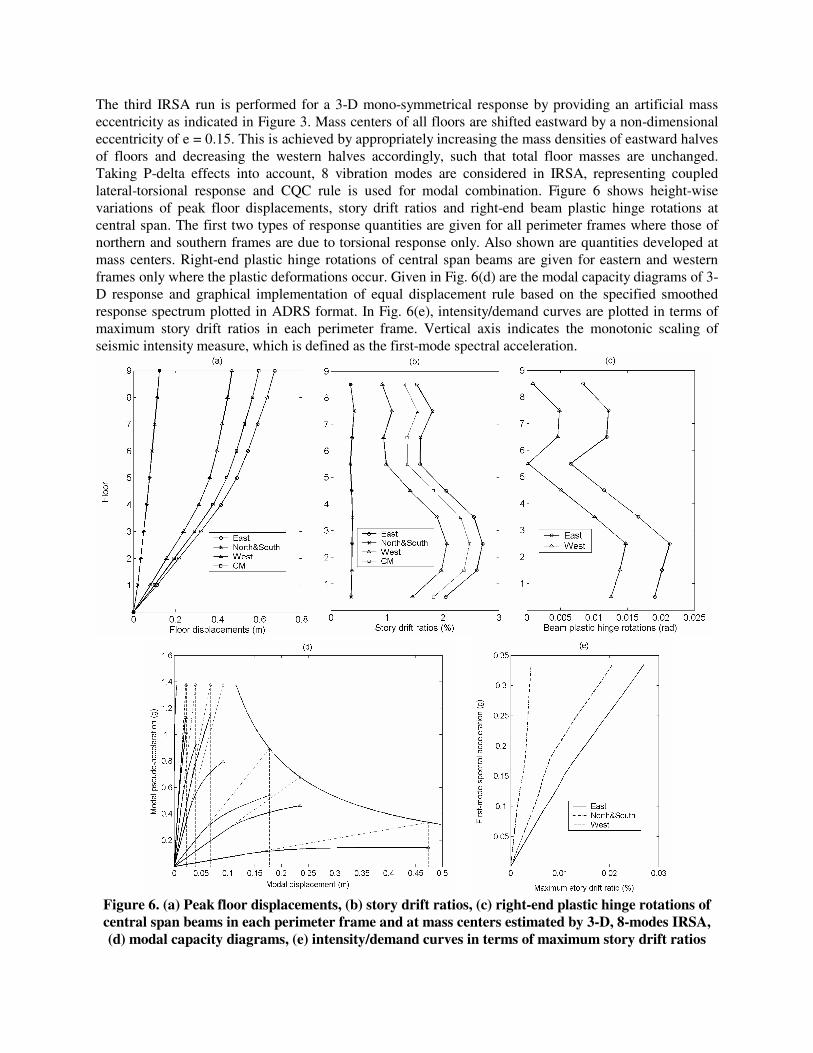
The third IRSA run is performed for a 3-D mono-symmetrical response by providing an artificial mass eccentricity as indicated in Figure 3. Mass centers of all floors are shifted eastward by a non-dimensional eccentricity of e = 0.15. This is achieved by appropriately increasing the mass densities of eastward halves of floors and decreasing the western halves accordingly, such that total floor masses are unchanged. Taking P-delta effects into account, 8 vibration modes are considered in IRSA, representing coupled lateral-torsional response and CQC rule is used for modal combination. Figure 6 shows height-wise variations of peak floor displacements, story drift ratios and right-end beam plastic hinge rotations at central span. The first two types of response quantities are given for all perimeter frames where those of northern and southern frames are due to torsional response only. Also shown are quantities developed at mass centers. Right-end plastic hinge rotations of central span beams are given for eastern and western frames only where the plastic deformations occur. Given in Fig. 6(d) are the modal capacity diagrams of 3-D response and graphical implementation of equal displacement rule based on the specified smoothed response spectrum plotted in ADRS format. In Fig. 6(e), intensity/demand curves are plotted in terms of maximum story drift ratios in each perimeter frame. Vertical axis indicates the monotonic scaling of seismic intensity measure, which is defined as the first-mode spectral acceleration.
Figure 6. (a) Peak floor displacements, (b) story drift ratios, (c) right-end plastic hinge rotations of central span beams in each perimeter frame and at mass centers estimated by 3-D, 8-modes IRSA, (d) modal capacity diagrams, (e) intensity/demand curves in terms of maximum story drift ratios

Finally Figure 7 depicts the plastic hinge map shown on unfolded perimeter frames.
Figure 7. Locations of plastic hinges (indicated by hollow circles) estimated by 3-D, 8-modes IRSA
shown on unfolded perimeter frames (solid circles indicate built-in hinged connections)
CONCLUSIONS
Recently introduced Incremental Response Spectrum Analysis (IRSA) procedure attempts to replace the intuitive approach governing the current applications of single-mode and multi-mode pushover analysis with a rigorous approach established on a theoretical basis. It is shown in the present paper that the consequences of the current intuitive approach leads to serious problems in the consideration of P-delta effects through the conventional pushover curve. IRSA handles the P-delta effects in a straightforward manner without requiring any additional effort over the analysis case where those effects are neglected. The ultimate aim of any pushover analysis should be the practical estimation of the seismic demand, in other words the estimation of the peak response quantities associated with the nonlinear deformation of the structure and its elements. The notion of practicality requires that the application of the pushover analysis should be simple enough and it should not involve any time-history analysis. Thus, it follows that seismic input is to be defined through the conventional tool: smoothed response spectrum. On the other hand, as its name implies, any multi-mode pushover procedure has to be based on a kind of response spectrum technique. In this respect, IRSA appears to satisfy all such requirements through an incremental application of the conventional Response Spectrum Analysis (RSA) combined with a simple use of the well-known equal displacement rule. Using a code-specified smoothed response spectrum, 2-D and 3-D

applications of IRSA, i.e., estimation of peak response quantities of interest are demonstrated in an illustrative example.
REFERENCES 1. Applied Technology Council (ATC). “Seismic evaluation and retrofit of concrete buildings (ATC-
40).” Redwood City, California, 1996. 2. Federal Emergency Management Agency (FEMA). “Prestandard and commentary for the seismic
rehabilitation of buildings (FEMA 356).” Washington D.C., 2000. 3. Fajfar P, Gaspersic P, Drobnic D. “A simplified nonlinear method for seismic damage analysis of
structures.” Fajfar P, Krawinkler H, Editors. Seismic design methodologies for the next generation of codes. Rotterdam: AA Balkema, 1997: 183-94.
4. Clough RW, Penzien J. “Dynamics of Structures” Second edition, New York: McGraw-Hill, 1993. 5. Chopra AK, Goel RK. “A modal pushover analysis for estimating seismic demands for buildings.”
Earthquake Engineering and Structural Dynamics 2002; 31(3): 561-82. 6. Gupta B, Kunnath SK. “Adaptive spectra-based pushover procedure for seismic evaluation of
structures.” Earthquake Spectra 2000; 16(2): 367-91. 7. Antoniou S, Rovithakis A, Pinho R. “Development and verification of a fully adaptive pushover
procedure.” Proceedings of the 12th European Conference on Earthquake Engineering, London. Paper no.882, 2002.
8. Aydinoglu MN. “An incremental response spectrum analysis based on inelastic spectral displacements for multi-mode seismic performance evaluation.” Bulletin of Earthquake Engineering 2003; 1(1): 3-36.
9. Aydinoglu MN, Fahjan YM. “A unified formulation of the piecewise exact method for inelastic seismic demand analysis including the P-delta effect.” Earthquake Engineering and Structural Dynamics 2003; 32(6): 871-90.
10. Bathe KJ. “Finite Element Procedures.” New Jersey: Prentice Hall, 1996. 11. Fajfar P. “Capacity Spectrum Method based on inelastic demand spectra.” Earthquake Engineering
and Structural Dynamics 1999; 28(9): 979-93. 12. Fajfar P. “Structural analysis in earthquake engineering – A breakthrough of simplified non-linear
methods.” Proceedings of the 12th European Conference on Earthquake Engineering, London. Paper no.843, 2002.
13. Vamvatsikos D, Cornell CA. “Incremental dynamic analysis.” Earthquake Engineering and Structural Dynamics 2002; 31(3): 491-514.
14. Chopra AK. “Dynamics of Structures.” Second edition, New Jersey: Prentice Hall, 2001. 15. Gupta A, Krawinkler H. “Seismic demands for performance evaluation of steel moment resisting
frame structures.” The John A. Blume Earthquake Engineering Center, Stanford University, California, Report no.132, 1999.
16. Miranda E, Akkar SD. “Dynamic instability of simple structural systems.” Journal of Structural Engineering 2003; 129(12): 1722-26.