Fundamentals of Spatial and Doppler Frequencies in Radar STAP
Engineering, 2009, 1, 167-176 doi:10.4236/eng.2009.13020 Published Online November 2009 (http://www.scirp.org/journal/eng).
Copyright © 2009 SciRes. ENGINEERING
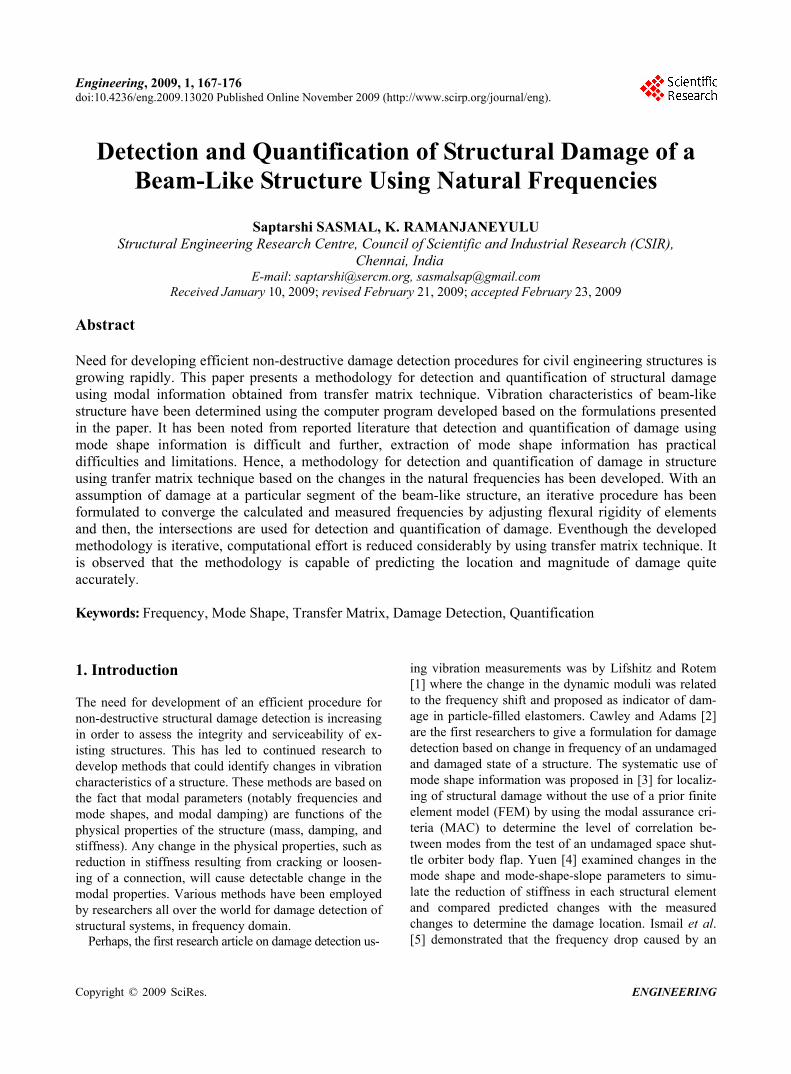
Detection and Quantification of Structural Damage of a Beam-Like Structure Using Natural Frequencies
Saptarshi SASMAL, K. RAMANJANEYULU
Structural Engineering Research Centre, Council of Scientific and Industrial Research (CSIR), Chennai, India
E-mail: [email protected], [email protected] Received January 10, 2009; revised February 21, 2009; accepted February 23, 2009
Abstract Need for developing efficient non-destructive damage detection procedures for civil engineering structures is growing rapidly. This paper presents a methodology for detection and quantification of structural damage using modal information obtained from transfer matrix technique. Vibration characteristics of beam-like structure have been determined using the computer program developed based on the formulations presented in the paper. It has been noted from reported literature that detection and quantification of damage using mode shape information is difficult and further, extraction of mode shape information has practical difficulties and limitations. Hence, a methodology for detection and quantification of damage in structure using tranfer matrix technique based on the changes in the natural frequencies has been developed. With an assumption of damage at a particular segment of the beam-like structure, an iterative procedure has been formulated to converge the calculated and measured frequencies by adjusting flexural rigidity of elements and then, the intersections are used for detection and quantification of damage. Eventhough the developed methodology is iterative, computational effort is reduced considerably by using transfer matrix technique. It is observed that the methodology is capable of predicting the location and magnitude of damage quite accurately. Keywords: Frequency, Mode Shape, Transfer Matrix, Damage Detection, Quantification
1. Introduction The need for development of an efficient procedure for non-destructive structural damage detection is increasing in order to assess the integrity and serviceability of ex-isting structures. This has led to continued research to develop methods that could identify changes in vibration characteristics of a structure. These methods are based on the fact that modal parameters (notably frequencies and mode shapes, and modal damping) are functions of the physical properties of the structure (mass, damping, and stiffness). Any change in the physical properties, such as reduction in stiffness resulting from cracking or loosen-ing of a connection, will cause detectable change in the modal properties. Various methods have been employed by researchers all over the world for damage detection of structural systems, in frequency domain.
Perhaps, the first research article on damage detection us-
ing vibration measurements was by Lifshitz and Rotem [1] where the change in the dynamic moduli was related to the frequency shift and proposed as indicator of dam-age in particle-filled elastomers. Cawley and Adams [2] are the first researchers to give a formulation for damage detection based on change in frequency of an undamaged and damaged state of a structure. The systematic use of mode shape information was proposed in [3] for localiz-ing of structural damage without the use of a prior finite element model (FEM) by using the modal assurance cri-teria (MAC) to determine the level of correlation be-tween modes from the test of an undamaged space shut-tle orbiter body flap. Yuen [4] examined changes in the mode shape and mode-shape-slope parameters to simu-late the reduction of stiffness in each structural element and compared predicted changes with the measured changes to determine the damage location. Ismail et al. [5] demonstrated that the frequency drop caused by an

S. SASMAL AND K. RAMANJANEYULU
Copyright © 2009 SciRes. ENGINEERING
168
opening and closing crack is less than that caused by an open crack. This property is a potentially large source of error that is considered by few of the researchers using frequency changes. A simple and easy method for one- dimensional structures by representing crack using a spring that connects the two half components was pre-sented by [6]. The natural frequencies were expressed as functions of the crack depth and location. Hearn and Testa [7] developed a damage detection method using frequency shift of a structure due to damage. The fre-quency sensitivity method combined with inter-nal-state-variable theory to detect damage in composites was used in [8]. They presented a damage indicator which is capable of detecting damage due to 1) exten-sional stiffness changes caused by matrix micro-cracking and 2) changes in bending stiffness caused by transverse cracks in the 90-degree plies. An experimental study on the sensitivity of the measured modal parameters of a shell structure was conducted in [9] to damage in the form of a notch. A method for the detection of the exis-tence and location of structural damage using the identi-fied eigen solution together with properties of the eigen-value problem was proposed in [10].
Slater and Shelley [11] presented a method based on frequency-shift measurements to detect damage in a smart structure by using the theory of modal filters to track the frequency changes over time. Narkis [12] de-duced a closed-form solution for the crack position, as function of the frequency shift of two modes of the same mechanical model and located the crack from measuring either bending or axial frequencies of two modes only. A transfer matrix technique was used in [13] to detect damage for beam like structures. Ratcliffe [14] devel-oped a technique for identifying the location of structural damage in a beam using modified Laplacian Operator on mode shape data. A sensitivity- and statistical- based method to localize structural damage by direct use of incomplete mode shapes was presented in [15]. and [16]. A numerical study of damage detection using the rela-tionship between damage characteristics and the changes in the dynamic properties was presented by [17]. It was found that the rotation of mode shape is a sensitive indi-cator of damage localisation. Another damage localisa-tion method based on changes in uniform load surface (ULS) curvature was developed by Wu and Law [18]. A procedure using gap smoothing method was proposed in [19] wherein local features in vibration curvature shapes were extracted using a localized curve fit (i.e., smooth-ing). Alvandi and Cremona [20] reviewed usual vibra-tion-based damage identification techniques for struc-tural damage evaluation. With the help of a simply sup-ported beam with different damage levels, the reliability of these techniques was investigated by using only few mode shapes and/or modal frequencies of the structure that can be easily obtained by dynamic tests and con-
cluded that broadly the detection judgement depends on a threshold level of damage. 1.1. Detection of Damage Using Mode Shape
Information
From the review of literature, it is found that the vibra-tion data such as frequency and mode shape are very important parameters for detecting the damage in struc-tures and a number of research works was carried out on detection of damage using frequency or mode shape. But, there is no confirmation on superiority of any method over the others. Though, changes in mode shape are much more sensitive to local damage compared to changes in frequency, use of mode shape information is restricted because 1) lower modes (usually measured from vibration tests of large structure) may not signifi-cantly reflect the local damage, 2) extracted mode shapes are prone to environmental noise and 3) number of sen-sors and the choice of sensor location may have a crucial effect on accuracy of damage detection. So, a detailed investigation has been carried out by the authors to as-sess the influence of location and degree of damage on mode shape. It is found that 1) displacement mode shapes are sensitive to damage and the mode shape changes with damage, 2) though higher modes are more predominant in showing the shift in mode shape dis-placements due to damage in the structure, lower modes may not significantly reflect the damage, 3) shift in mode shape largely depends on the location of damage and the mode considered. Higher mode will magnify the shift in mode shape, if the damage location does not fall near the zero-displacement points, 4) any shift in mode shape of a damaged structure with respect to the mode shape of undamaged structure may lead to an interpretation of damage in that location, and in most of the cases, it may go wrong. Further, for higher modes, if the damage is located at a location where zero displacement occurs in that particular mode, shift in mode shape will be re-flected in place other than the place where damage has really taken place, 5) Shift in mode shape is predominant in higher modes than in the lower modes. It may show a number of locations with shift in mode shape with re-spect to undamaged mode shape which may lead to mis-interpretation of location of damage. So, it can be stated that mode shape information alone can not provide cor-rect information on detection of damage in the structure unless it is treated otherwise, and 6) it is very difficult to quantify damage accurately from mode shape information alone. Further studies can be seen elsewhere [21,22].
Though significant damage might cause very small changes in natural frequency (particularly for large structures), natural frequencies are easy to be measured and are less influenced by environmental noise. The choice of using the natural frequency as a basic vibration

S. SASMAL AND K. RAMANJANEYULU 169 characteristic for damage detection is the most attractive one due to the fact that the natural frequencies of a structure can be measured at one single location in the structure, thus rendering a means for a rapid and global technique. Further, it is observed that studies related to the extension of transfer matrix method for detection of damage are very few. Hence, in this study, a methodol-ogy for detection of damage in structures using transfer matrix technique has been proposed based on change in natural frequency. The extent of research work carried out towards quantification of damage is considerably less compared to studies on localisation of damage. In view of this, a methodology has been developed in this study for detection and quantification of damage using transfer matrix method based on modal frequencies obtained from a damaged structure. Transfer matrix method [23] is used in this study because of its versatility and ease with which it can be applied to a structure of either uni-form or non-uniform cross section and under a variety of boundary conditions such as simple support, cantilever support, and even for beam on elastic foundation. More-over, for a methodology based on an iterative algorithm, as proposed in this study, transfer matrix method is very useful and easy to handle compared to FE formulation. Theoretical developments of the methodology for detec-tion and quantification of damage are presented first, followed by detailed numerical studies to demonstrate the efficacy of the proposed method. 2. Transfer Matrix Method for Obtaining
Modal Parameters
For computing plane flexural vibrations of a straight beam using transfer matrix method, the beam section is modelled by discrete uniform structural elements inter-connected at the nodal points. Using the conventional assumption of a mass-less beam, the inertia effects of the beam element are dynamically represented by two lumped masses at both ends of the element (as shown in Figure 1).
Each individual beam is considered to be of individual homogenous material property and geometry which can be represented by area moment of inertia and Young’s modulus of that particular element. Two displacements, viz., vertical deflection () and rotation () and the cor-
Figure 1. Beam with concentrated masses.
X
M
V Y
Figure 2. Sign convention for state array variables of beam element.
Z
responding forces viz., shear force (V) and bending mo-ment (M) are considered for describing the state array variables at each section and the sign convention of the state array variables is shown in Figure 2.
The equilibrium between sections i and i-1 of an ele-ment will be maintained by
1 0L Ri iV V (1)
1 0L R Li i i iM M V l (2)
where the superscript L and R stands for left and right side of a section respectively.
Two more equations that are required for solving the problem can be obtained from compatibility conditions and the final equations can be expressed as
2 3
1 12 6 1L R R Ri ii i i i i i
i i
l ll M
EI EI RV (3)
2
1 1 2 1L R Ri ii i i i
i i
l l RM VEI EI
1
(4)
1L Ri i i i
RM M l V (5)
1L R
i iV V (6)
and can be expressed in matrix form as,
L
i
M
V
=
2 3
2
1
12 6
0 12
0 0 1
0 0 0 1
R
i
i
l ll
EI EI
l lMEI EI
l V
(7)
So, from Equation (7), the field matrix (Fi) connecting
with can be expressed as LiZ R
iZ 1
1L Ri i iZ Z F (8)
The point matrix (Pi) connecting with is
found by using continuity of deflection, slope and mo-ment across the concentrated mass mi,
RiZ L
iZ
Copyright © 2009 SciRes. ENGINEERING

S. SASMAL AND K. RAMANJANEYULU
Copyright © 2009 SciRes. ENGINEERING
170
Figure 3. Free-body diagram of mass mi.
R Li i ; R L
i i and R Li iM M (9)
The vibrating mass, however, introduces the inertial force which causes discontinuity in shear. The free-body diagram shown in Figure 3 yields a relation from simple equilibrium considerations as:
2R Li i iV V m i (10)
(in formulation, a particular sign convention has been followed) Equations (9) and (10) can be expressed in matrix form as:
12 14
32 34n nu u
n nu u
R
i
M
V
=
2
1 0 0 0
0 1 0 0
0 0 1 0
0 0 1
L
i ii
M
m V
(11)
R Li i iZ Z P (12)
By combining both field and point matrices, relation between the state vectors of adjacent ends (i and i-1) can be obtained as
1R Ri i i iZ Z P F (13)
2.1. Transfer Matrix for Frequency
Determinant The transfer matrix method can be applied to solve more complicated problems by considering a beam that is made up of piecewise uniform mass-less elements, with masses concentrated at discrete points. If a structural element is made up of n segments (between the ends 0 to n), relationship between the state vectors at the extreme ends (0 and n) of the beam can be obtained as
n n-1 1 4 4 3 3 2 2 1 1 0F P F P F P F P F P Fn nZ Z ...........
0nZ Z U (14)
Equation (14) can be written in full, as
n
η
M
V
=
11 12 13 14
21 22 23 24
31 32 33 34
41 42 43 44 0
n n n n
n n n n
n n n n
n n n n
i
ηu u u u
u u u u
Mu u u u
Vu u u u
where the coefficients to are functions of cir- nu11nu44
cular frequency . Boundary conditions can be applied to the equations formulated from Equation (15) to arrive at the frequency determinant. For example, a beam (con-sists of n segments) with simply supported ends can be-solved as follows: The boundary conditions at simply supported ends are
n = 0 , = 0 , nM 0 = 0 , a n d = 0 ; 0M
By substituting these boundary conditions in Equation (15), the following relation can be obtained
12 0 14 0 0n nu u V (16a)
And,
32 0 34 0 0n nu u V (16b)
where is element of ith row and jth column of the
transfer matrix which can be obtained by using Equation (15) and superscript k denotes the number of segments. The normal modes can be found for the system using the following procedure.
kiju
For a nontrivial solution of Equations (16a) and (16b), the determinant of the coefficients must be zero, that is
12 14
32 34
n n
n n
u u
u u=0 (17)
The same procedure can be followed for other bound-
ary conditions also. Since, the elements are func-
tions of the circular frequencyiju
, this determinant serves to compute the natural circular frequencies. In view of the fact that a beam which possesses n segments will have n-1 discrete masses, the expansion of the frequency
determinant leads to an equation of n-1 degree in . 2
2.2. Numerical Procedure for Solution of Frequency Equation
In the preceding section, the matrix multiplications have
been made by treating as a free parameter. After applying the boundary conditions the resulting frequency
equations are solved for . For complicated systems, the algebraic solution would become complicated and furthermore, it would be very cumbersome to extract the roots. In such cases, it is advantageous to replace alge-braic solution with numerical computation. For system with 'n' segments with simply supported ends, the fre-quency determinant (as described in Equation 17) would become
2
2
(15) 12 14
22 24
n n
n n
u u
u u =0 (18)
If the matrix multiplication is carried out algebraically,

S. SASMAL AND K. RAMANJANEYULU 171
then the coefficients , , and and con-
sequently the frequency condition would be complicated
functions of . The procedure adopted in practice,
however, is to choose certain values for and com-pute the corresponding values of the frequency determi-nant
nu12nu14
nu22nu24
2
2
)( . The value of the determinant is then
plotted against
, the zero values of occur at the
natural circular frequencies of the system. This proce-dure has been adopted in the study for tracking of fre-quencies.
3. Determination of Frequency of a
Structure Using Transfer Matrix Method
In this study, a computer program called FREQ has been developed based on the formulation presented in the preceding sections and the flow-chart of the program for obtaining frequencies of a structure, is shown in Figure 4. The formulations and the computer program have been validated by comparing the results of this study with those obtained using Finite Element Analysis (FEA). Table 1 gives the comparison of frequencies obtained by using transfer matrix method and FEA. From this table, it can be seen that the results of this study are in good agreement with those obtained using satndard FEA package. For the validation study, a beam with 90 elements have been considered with Young's modulus (E)= 25106 kN/m2, moment of inertia (I)= 0.001333 m4 and cross sectional area (A) = 0.1 m2.
As discussed in the preceding section, the determinant for the whole beam after incorporating the boundary conditions is computed for an assumed (initial) natural frequency. Then, an iterative procedure has been carried out by incrementing natural frequency to get the deter-minant of the transfer matrix. The frequency for which the determinant value is nearly zero, has been assigned as the natural frequency of the beam. The variation of the determinant of the transfer matrix for different modes of the beam is shown in Figure 5. For clarity, the determi-nant value () has been scaled down suitably after reaching a particular frequency. For example, for first, second and third natural frequencies, the determinant () of the transfer matrix is scaled down to 1/10th, 1/100th
Table 1. Comparison of frequency obtained using transfer matrix method and FEA.
Modes Frequency () in Hz First mode 5.648 (5.670) Second mode 22.564 (22.557) Third mode 50.478 (50.306) Fourth mode 88.108 (88.352)
Note: Results obtained from FEA are presented in brackets
Figure 4. Flow-chart of computer program (FREQ).
and 1/500th respectively. The frequencies corresponding to zero values of the determinant () represent the natu-ral frequencies () of the beam for different modes (as shown in Figure 5).
The central philosophy of detection of damage of beam like structure using transfer matrix formulation presented here, is to determine the reduction in flexural rigidity of one or more elements of the beam which would signify the existence of damage in the structure. In this context, question may arise that how far the frequen-cies of a structure are influenced by the damage in a par-ticular element(s), in other words, what is the change in the determinant of transfer matrix with the change in flexural rigidity in one or more elements of the beam. In view of this, a study has been carried out to evaluate the frequency determinant by changing the magnitude and locations of the damaged element(s) to evaluate the in-fluence of location and magnitude of damage on fre-quency of a structure. It is noticed that the frequencies corresponding to higher modes are influenced predomi-nantly by change in flexural rigidity of one or more ele-ments of the beam. For clarity, the changes in determi-nant values for the first two frequencies are shown in Figure 6. It is observed from the figure that by reducing
End
Start
Input - geometry and details for dynamic analysis
Idealization of structure into 2D beam
Discretization of the beam into no. of elements
Assume initial value of for first fundamental mode
Formation of Field (F) and Point (P) Transfer Matrices
Calculation of Global Transfer Matrix for the beam
Determinant () of frequency matrix for the beam incorporating the boundary conditions
If 0
yes
no =+0.1
Calculation of fundamental frequency of that mode
no If No. of modes required
=+1
yes
Copyright © 2009 SciRes. ENGINEERING

S. SASMAL AND K. RAMANJANEYULU
Copyright © 2009 SciRes. ENGINEERING
172
-1500
-1000
-500
0
500
1000
0 10 20 30 40 50 60 70 80 90 100 110 120 130 140 150 160 170 180 190 200 210 220 230 240 250 260 270 280 290 300 310 320
Frequency (Hz)
Det
erm
ina
nt
val
ue
First frequency
Second frequency
Third frequency
Fourth frequency
Figure 5. Variation of determinant of transfer matrix for different modes.
-200
-150
-100
-50
0
50
100
150
200
1 2 3 4 5 6 7 8 9 10 11 12 13
Frequencies
Det
erm
inan
t va
lue
EI=100 EI=200 EI=300 EI=400EI=500 EI=600 EI=700 EI=800EI=900 EI=1000 EI=2000 EI=3000EI=4000 EI=5000 EI=6000 EI=7000EI=8000 EI=9000 EI=10000
1
(a) For first fundamental frequency.
-1000
0
1000
2000
3000
4000
5000
6000
7000
13 14 15 16 17 18 19 20 21 22 23 24 25 26 27 28 29 30 31 32 33 34 35 36 37 38 39 40 41 42 43 44 45 46 47 48 49 50
Frequencies
Det
erm
inan
t va
lue
EI=100 EI=200 EI=300 EI=400EI=500 EI=600 EI=700 EI=800EI=900 EI=1000 EI=2000 EI=3000EI=4000 EI=5000 EI=6000 EI=7000EI=8000 EI=9000 EI=10000
2 (b) For second fundamental frequency.
Figure 6. Variation of determinant with degree of damage (EI in kNm2). flexural rigidity of a particular element of the beam con-sidered in this study, frequency of the second mode var-ies over a wider range than that of the first mode. This signifies that the shift in frequency of second mode due to damage is more predominant than that in the first mode frequency. It is also noted from the study that this phenomenon is valid for next higher modes. 4. Results and Discussions Though the transfer matrix technique can easily be ap-plied to any type of structure with appropriate boundary conditions, a beam like structure with simply supported ends is considered in this study to demonstrate the effi-cacy of the methodology and its accuracy. The material
Node number
Figure 7. A typical beam like structure with elements and node numbers.
and sectional properties of the beam considered in this study are same as that mentioned for validation study. It is true that a finer division of a structure would lead to a more precise result, but for demonstrating the methodol-ogy proposed in this study, a beam like structure with 10 elements (as shown in Figure 7) has been considered for better representation, faster computation and clarity. An-other reason behind considering less number of elements in this study is that for single-spread damage case, coarser mesh can occupy maximum amount of damage in minimum number of elements which would reduce the computation time without sacrificing the efficiency. 4.1. Solution Procedure for Detection of Damage
Using Change in Frequencies. The methodology proposed in this study, uses natural frequency information obtained from the transfer matrix formulations, for detection, quantification and localiza-tion of damage. A beam with known location and mag-nitude of damage has been analysed for extracting the natural frequencies. The existence of orthogonal damage in a beam structure can be simulated numerically via a change in flexural rigidity (EI) in a particular beam ele-ment. Such changes or reduction in flexural rigidity would result in change or decrease in the natural fre-quencies of the system. Through the measurement of the system natural frequencies of the structure, the location and magnitude of the damage can be determined. As-suming that flexural rigidity of all the segments of the system are known, the dynamics of the system can be obtained by the numerical model described in the pre-ceding section.
When damage has occurred in a certain beam segment, it can be detected through the changes in the system natural frequencies. For the system containing damage, the iterative procedure starts with an assumption that the damage is located at the first beam element. The corre-sponding flexural rigidity of the element is adjusted until the first natural frequency of the system is matched with the measured one. The process is then continued with the second segment of the structure and the first natural fre-quency of the system is again matched by adjusting the flexural rigidity of the second element. The process is repeated for all the segments of the structure. The same
1 2 3 4 5 6 7 8 9 10 11
L
1 2 3 4 5 6 7 8 9 10
Damage location
Element number

S. SASMAL AND K. RAMANJANEYULU 173 technique is followed for other modes which can be measured through vibration testing. The location and magnitude of the damage of the structure can be identi-fied by the intersection of various rigidity-versus- dam-aged beam element location curves. The intersection of the curves obtained for different modes represent damage locations and magnitudes (flexural rigidity) which caused the changes in the system natural frequencies. Flow-chart of the computer program developed in this study based on the formulation described above for de-tection and quantification of structural damage is shown in Figure 8.
4.2. Case Study For a numerical simulation, a beam is considered where the geometric and material properties are same as that mentioned for validation study. It is significant to men-tion that, in this study, 1) single damage does not repre-sent only one damage (one crack) in the entire structure which is not practical in real structure too. As the formu-lation states, an element in the structure can be chosen to take a considerable length of the structure. The proposed methodology would show the location and magnitude of damage in an element considering all the damages oc-curred in that particular element which can be used for further discretisation, if required, to arrive at more par-ticular locations. 2) It is also noticed that the most of the reported methodologies for damage detection perform well when degree of damage is very severe. But, in real practice, when large damages are already included in the structure, a sophisticated methodology for damage detec-tion is not required, rather it can be located either by visual observation or simple inspection techniques. So, in this study, low levels of damages are considered to illus-trate the methodology and to check its acceptability. 3) For all the case studies presented here, frequencies cor-responding to only first four modes are considered be-cause more number of modes may not be available from the field experiments. It is always a challenging problem to detect and quantify damage from less number of modes. Further, consideration of more number of modes is computationally expensive too.
Three levels of damage in two different locations have been studied separately, i.e, a beam with 10%, 20% and 30% damage in an element near support (3rd element as shown in Figure 7) and near centre (5th element as shown in Figure 7) respectively. These studies have been con-sidered to examine the performance of the proposed methodology because it is known that the change in fre-quency with damage (reduction in flexural rigidity) of a structure greatly depends on the degree and location of damage.
Using the proposed methodology and computer pro-
gram developed based on the flow-chart shown in Figure 8, iterative study has been carried out for satisfying the frequencies corresponding to different modes of a dam-aged beam. Final flexural rigidities of each element along the length of the beam are obtained from the com-puter program and plotted for the cases mentioned above. It is observed that the true location and magnitude of the damage are identified by the intersection of the various rigidity versus element location curves. Cases with damage of 10% (remaining flexural rigidity of 29993 kNm2) in 3rd and 5th element are shown in Figure 9 and Figure 10 respectively. It is observed from Figures 9 and 10 that intersections of curves for different modes correctly indicate the damage locations (in 3rd and 5th element) with a remaining flexural rigidity of 30000 kNm2.
Start
Input- geometric and details for dynamic analysis Input- measured frequency and mode shapes of beam
Figure 8. Flow chart for detection and localisation of struc-tural damage.
Flexural rigidity of ith element (EIi)=100 kNm2 with the other segments as undamaged sections
Calculate frequency of jth mode (ji) from ‘FREQ’ for the beam with assumed rigidity (EIi) for ith element
For no. of modes available (j) = 1 to m
For no. of element (i) = 1 to n
Increase rigidity(i=i+1)
If ji measured frequency
no
yes
yes If element i n
no
If modes j m no
yes
(j=j+1)
Plot the rigidity versus element diagram for all the modes available from experiment
Intersection of results for different modes represent the prob-able location of the structural damage and corresponding
rigidity value (EI) denotes the magnitude of damage
End
Copyright © 2009 SciRes. ENGINEERING

S. SASMAL AND K. RAMANJANEYULU
Copyright © 2009 SciRes. ENGINEERING
174
0
5000
10000
15000
20000
25000
30000
35000
1 2 3 4 5 6 7 8 9
Element nummer
Fle
xu
ral r
igid
ity
(k
Nm
2 )
10
First mode
Second mode
Third mode
Fourth mode
Figure 9. Flexural rigidity versus element diagram for 10% damage in 3rd element.
0
5000
10000
15000
20000
25000
30000
35000
1 2 3 4 5 6 7 8 9 10Element nummer
Fle
xu
ral r
igid
ity
(k
Nm
2 )
First mode
Second mode
Third mode
Fourth mode
Figure 10. Flexural rigidity versus element diagram for 10% damage in 5th element.
0
5000
10000
15000
20000
25000
30000
35000
1 2 3 4 5 6 7 8 9 10Element nummer
Fle
xu
ral r
igid
ity
(k
Nm
2 )
First mode
Second mode
Third mode
Fourth mode
Figure 11. Flexural rigidity versus element diagram for 20% damage in 3rd element.
Similarly, Cases with damage of 20% (remaining flex- ural rigidity of 26660 kNm2) and 30% (remaining flex- ural rigidity of 23328 kNm2) in 3rd and 5th element are shown in Figures 11-12 and Figure 13-14 respectively which indicate damage in the correct elements with a magnitude of 26500 kNm2 (as shown in Figure 11 and Figure 12) and 23500 kNm2 (as shown in Figure 13 and Figure 14), respectively.
It is important to note that the evaluated magnitudes of damage are quite close to the actual values.
In these studies discussed above, known degrees and locations of damages have been considered for validating
0
5000
10000
15000
20000
25000
30000
35000
1 2 3 4 5 6 7 8 9 10Element nummer
Fle
xu
ral r
igid
ity
(k
Nm
2 )
First mode
Second mode
Third mode
Fourth mode
Figure 12. Flexural rigidity versus element diagram for 20% damage in 5th element.
0
5000
10000
15000
20000
25000
30000
35000
1 2 3 4 5 6 7 8 9 1Element nummer
Fle
xu
ral r
igid
ity
(k
Nm
2 )
0
First mode
Second mode
Third mode
Fourth mode
Figure 13. Flexural rigidity versus element diagram for 30% damage in 3rd element.
0
5000
10000
15000
20000
25000
30000
35000
1 2 3 4 5 6 7 8 9 1Element nummer
Fle
xu
ral r
igid
ity
(k
Nm
2 )
0
First mode
Second mode
Third mode
Fourth mode
Figure 14. Flexural rigidity versus element diagram for 30% damage in 5th element. the methodology for detection and localisation of dam-age. It is found that the procedure is able to identify the location and magnitude of damage. Hence, this proce-dure can be adopted for detection and quantification of damage of structures using measured frequencies of first few modes. In this study, the problems are selected in such a way that both strengths and limitations of the proposed methodology can be examined. From the re-sults shown in Figures 9-14, a few observations can be made as: 1) frequency based methodology proposed in this study can be used for localisation as well as quanti-fication of damage, 2) since, the proposed methodology is based on only frequency information, structures with symmetrical boundary condition would always show two

S. SASMAL AND K. RAMANJANEYULU 175 possible locations of damage, and, 3) it is desirable to obtain the lowest measured frequency of a damaged structure with maximum possible accuracy to get an im-proved and more accurate estimation.
During the study, it is further observed that the pro-posed methodology is able to provide information about the state of damage and its location in a damaged struc-ture, but the accuracy and reliability of the results (both localisation and quantification) also depends on correct-ness of information on the undamaged state. So, the proposed methodology would perform satisfactorily with a condition of availability of information (flexural rigid-ity) in its undamaged state. Hence, the study is further being extended to formulate a procedure which can be used for identification of damage when information about the undamaged state of a structure is not available, and it is being explored to check the efficacy and the suitable solutions (if any) for the proposed methodology with various levels of noise in modal data. 5. Concluding Remarks
The present paper addresses the methodology for detection, localisation and quantification of damage based on the formulations made using transfer matrix technique. First, the formulations and the computer program have been developed for obtaining the vibration characteristics of beam-like structures. The computer program has been validated by comparing the results of this study with those obtained using Finite Element Analysis (FEA) package. The results of this study are in good agreement with those obtained using standard FEA package. From the existing studies, it is noted that dis-placement mode shapes are sensitive to damage and higher modes show predominant shift in mode shape displacements due to damage in the structure. But, shift in mode shape largely depends on the location of damage and the mode considered and it is difficult to quantify damage from mode shape information. Hence, a meth-odology for detection, localisation and quantification of damage in structures has been proposed based on change in natural frequency obtained from transfer matrix tech-nique. The existence of orthogonal damage in a beam structure can be simulated numerically through change in flexural rigidity (EI) in a particular beam element. For the system containing damage, an iterative procedure has been adopted by adjusting the flexural rigidity of the element such that computed frequency matches with the measured values. The location and magnitude of the damage of the structure can be identified by the intersec-tion of the various rigidity-versus-element location curves. Studies have been presented by considering single spread-damage cases with different degrees and locations of damage to validate the accuracy, reliability and to identify the possible limitation of the proposed
methodology. It is found that the proposed methodology can localise and quantify damage in a structure with con-siderable accuracy. 6. Acknowledgements This paper is being published with the kind permission of the Director, Structural Engineering Research Centre, Chennai, India.
7. References
[1] J. M. Lifshitz and A. Rotem, “Determination of rein-forcement unbonding of composites by a vibration tech-nique,” Journal of Composite Materials, Vol. 3, pp. 412–423, 1969.
[2] P. Cawley and R.D. Adams, “The locations of defects in structures from measurements of natural frequencies,” Journal of Strain Analysis, Vol. 14, No. 2, pp. 49–57, 1979.
[3] W. M. West, “Illustration of the use of modal assurance criterion to detect structural changes in an orbiter test specimen,” Proceedings in Air Force Conference on Air-craft Structural Integrity, 1984.
[4] M. M. F. Yuen, “A numerical study of the eigenparame-ters of a damaged cantilever,” Journal of Sound and Vi-bration, Vol. 103, No. 3, pp. 301–310, 1985.
[5] F. Ismail, A. Ibrahim, and H.R. Martin, “Identification of fatigue cracks from vibration testing,” Journal of Sound and Vibration, Vol. 140, No. 2, pp. 305–317, 1990.
[6] P. F. Rizos, N. Aspragathos, and A.D. Dimarogonas, “Identification of crack location and magnitude in a can-tilever beam from the vibration modes,” Journal of Sound and Vibration, Vol. 138, No. 3, pp. 381–388, 1990.
[7] G. Hearn, and R. G. Testa, “Modal analysis for damage detection in structures,” Journal of Structural Engineering, ASCE, Vol. 117, No. 10, pp. 3042–3063, 1991.
[8] D. Sanders, Y. I. Kim, and R.N. Stubbs, “Nondestructive evaluation of damage in composite structures using mo-dal parameters,” Experimental Mechanics, Vol. 32, pp. 240–251, 1992.
[9] M. G. Srinivasan and C. A. Kot, “Effects of damage on the modal parameters of a cylindrical shell,” Proceedings of the 10th International Modal Analysis Conference, pp. 529–535, 1992.
[10] H. Baruh and S. Ratan, “Damage detection in flexible structures,” Journal of Sound and Vibration, Vol. 166, No. 1, pp. 21–30, 1993.
[11] G. L. Slater and S. Shelley, “Health monitoring of flexi-ble structures using modal filter concepts,” Proceedings of the North American Conference on Smart Structures and Materials, Albuquerque, New Mexico, pp. 997–1007, 1993.
[12] Y. Narkis, “Identification of crack location in vibrating simply supported beams,” Journal of Sound and Vibra-tion, Vol. 172, No. 4, pp. 549–558, 1994.
Copyright © 2009 SciRes. ENGINEERING

S. SASMAL AND K. RAMANJANEYULU
Copyright © 2009 SciRes. ENGINEERING
176
[13] F. K. Choy, R. Liang, and P. Xu, “Fault identification of beams on elastic foundation,” Computers and Geotech-nics, Vol. 17, No. 2, pp. 157–176, 1995.
[14] C. P. Ratcliffe, “Damage detection using a modified laplacian operator on mode shape data,” Journal of Sound and Vibration, Vol. 204, No. 3, pp. 505–517, 1997.
[15] S. S. Law, Z. Y. Shi, and L. M. Zhang, “Structural dam-age detection from incomplete and noisy modal test data,” Journal of Engineering Mechanics, ASCE, Vol. 124, No. 11, pp. 1280–1288, 1998.
[16] Z. Y. Shi, S. S. Law, and L. M. Zhang, “Damage local-ization by directly using incomplete mode shapes,” Jour-nal of Engineering Mechanics, ASCE, Vol. 126, No. 6, pp. 656–660, 2000.
[17] M. A.-B. Abdo and M. Hori, “A numerical study of structural damage detection using changes in the rotation of mode shapes,” Journal of Sound and Vibration, Vol. 251, No. 2, pp. 227–239, 2002.
[18] D. Wu and S. S. Law, “Damage localization in plate structures from uniform load surface curvature,” Journal of Sound and Vibration, Vol. 276, No. 1–2, pp. 227–244, 2004.
[19] M. K. Yoon, D. Heider, J. W. Gillespie, C. P. Ratcliffe, and R. M. Crane, “Local damage detection using the two-dimensional gapped smoothing method,” Journal of Sound and Vibration, Vol. 279, No. 1–2, pp. 119–139, 2004.
[20] A. Alvandi and C. Cremona, “Assessment of vibra-tion-based damage identification techniques,” Journal of Sound and Vibration, Vol. 292, No. 1–2, pp. 179–202, 2006.
[21] S. Sasmal, K. Ramanjaneyulu, and N. Lakshmanan, “Transfer matrix method for identification of damage in structures using vibration characteristics,” SERC Re-search Report, No. RCS-RCS-MLP10741-RR-2005-2, 2005.
[22] V. Srinivas, S. Sasmal, and K. Ramanjaneyulu, “Studies on methodological developments in structural damage identification,” Structural Durability and Health Moni-toring, Vol. 5, No. 2, pp. 133–160, 2009.
[23] E. G. Pestel and F. A. Leckie, Matrix Methods in Elasto-Mechanics, McGraw Hill Book Company Inc., New York, 1963.
Copyright © 2022 FDOKUMEN