Detection of natural oil slicks in the NW Gulf of Mexico using MODIS imagery
6
Geophysical Research Letters 16 JANUARY 2009 Volume 36 Number 1 American Geophysical Union • Natural oil seepage in Gulf of Mexico occurs more often than thought • Freak waves in moderate Japanese waters may have caused fishing boat sinking • Fate of climate feedbacks as temperatures warm • Atmosphere driven by cascades, an aid to numerical weather prediction
-
Upload
independent -
Category
Documents
-
view
6 -
download
0
Transcript of Detection of natural oil slicks in the NW Gulf of Mexico using MODIS imagery
GeophysicalResearchLetters
16 JANUARY 2009Volume 36 Number 1
American Geophysical Union
• Natural oil seepage in Gulf of Mexico occurs more often than thought• Freak waves in moderate Japanese waters may have caused fishing boat sinking
• Fate of climate feedbacks as temperatures warm • Atmosphere driven bycascades, an aid to numerical weather prediction
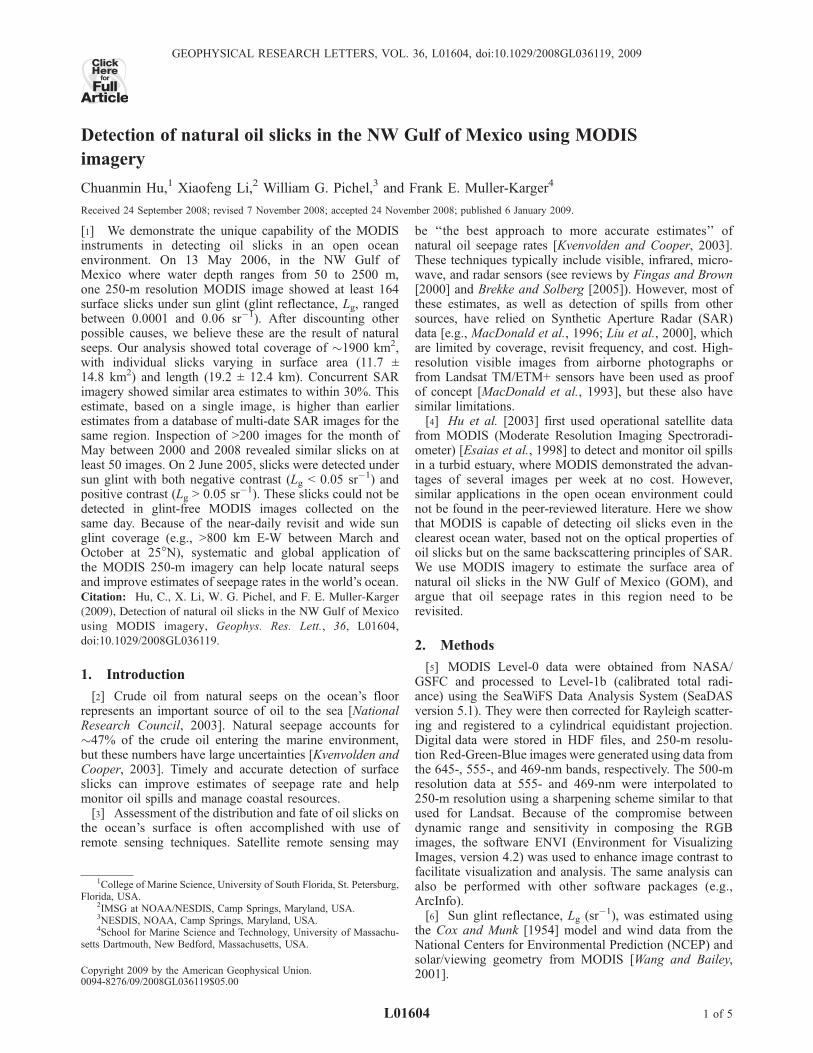
Detection of natural oil slicks in the NW Gulf of Mexico using MODIS
imagery
Chuanmin Hu,1 Xiaofeng Li,2 William G. Pichel,3 and Frank E. Muller-Karger4
Received 24 September 2008; revised 7 November 2008; accepted 24 November 2008; published 6 January 2009.
[1] We demonstrate the unique capability of the MODISinstruments in detecting oil slicks in an open oceanenvironment. On 13 May 2006, in the NW Gulf ofMexico where water depth ranges from 50 to 2500 m,one 250-m resolution MODIS image showed at least 164surface slicks under sun glint (glint reflectance, Lg, rangedbetween 0.0001 and 0.06 sr�1). After discounting otherpossible causes, we believe these are the result of naturalseeps. Our analysis showed total coverage of �1900 km2,with individual slicks varying in surface area (11.7 ±14.8 km2) and length (19.2 ± 12.4 km). Concurrent SARimagery showed similar area estimates to within 30%. Thisestimate, based on a single image, is higher than earlierestimates from a database of multi-date SAR images for thesame region. Inspection of >200 images for the month ofMay between 2000 and 2008 revealed similar slicks on atleast 50 images. On 2 June 2005, slicks were detected undersun glint with both negative contrast (Lg < 0.05 sr�1) andpositive contrast (Lg > 0.05 sr�1). These slicks could not bedetected in glint-free MODIS images collected on thesame day. Because of the near-daily revisit and wide sunglint coverage (e.g., >800 km E-W between March andOctober at 25�N), systematic and global application ofthe MODIS 250-m imagery can help locate natural seepsand improve estimates of seepage rates in the world’s ocean.Citation: Hu, C., X. Li, W. G. Pichel, and F. E. Muller-Karger
(2009), Detection of natural oil slicks in the NW Gulf of Mexico
using MODIS imagery, Geophys. Res. Lett., 36, L01604,
doi:10.1029/2008GL036119.
1. Introduction
[2] Crude oil from natural seeps on the ocean’s floorrepresents an important source of oil to the sea [NationalResearch Council, 2003]. Natural seepage accounts for�47% of the crude oil entering the marine environment,but these numbers have large uncertainties [Kvenvolden andCooper, 2003]. Timely and accurate detection of surfaceslicks can improve estimates of seepage rate and helpmonitor oil spills and manage coastal resources.[3] Assessment of the distribution and fate of oil slicks on
the ocean’s surface is often accomplished with use ofremote sensing techniques. Satellite remote sensing may
be ‘‘the best approach to more accurate estimates’’ ofnatural oil seepage rates [Kvenvolden and Cooper, 2003].These techniques typically include visible, infrared, micro-wave, and radar sensors (see reviews by Fingas and Brown[2000] and Brekke and Solberg [2005]). However, most ofthese estimates, as well as detection of spills from othersources, have relied on Synthetic Aperture Radar (SAR)data [e.g., MacDonald et al., 1996; Liu et al., 2000], whichare limited by coverage, revisit frequency, and cost. High-resolution visible images from airborne photographs orfrom Landsat TM/ETM+ sensors have been used as proofof concept [MacDonald et al., 1993], but these also havesimilar limitations.[4] Hu et al. [2003] first used operational satellite data
from MODIS (Moderate Resolution Imaging Spectroradi-ometer) [Esaias et al., 1998] to detect and monitor oil spillsin a turbid estuary, where MODIS demonstrated the advan-tages of several images per week at no cost. However,similar applications in the open ocean environment couldnot be found in the peer-reviewed literature. Here we showthat MODIS is capable of detecting oil slicks even in theclearest ocean water, based not on the optical properties ofoil slicks but on the same backscattering principles of SAR.We use MODIS imagery to estimate the surface area ofnatural oil slicks in the NW Gulf of Mexico (GOM), andargue that oil seepage rates in this region need to berevisited.
2. Methods
[5] MODIS Level-0 data were obtained from NASA/GSFC and processed to Level-1b (calibrated total radi-ance) using the SeaWiFS Data Analysis System (SeaDASversion 5.1). They were then corrected for Rayleigh scatter-ing and registered to a cylindrical equidistant projection.Digital data were stored in HDF files, and 250-m resolu-tion Red-Green-Blue images were generated using data fromthe 645-, 555-, and 469-nm bands, respectively. The 500-mresolution data at 555- and 469-nm were interpolated to250-m resolution using a sharpening scheme similar to thatused for Landsat. Because of the compromise betweendynamic range and sensitivity in composing the RGBimages, the software ENVI (Environment for VisualizingImages, version 4.2) was used to enhance image contrast tofacilitate visualization and analysis. The same analysis canalso be performed with other software packages (e.g.,ArcInfo).[6] Sun glint reflectance, Lg (sr�1), was estimated using
the Cox and Munk [1954] model and wind data from theNational Centers for Environmental Prediction (NCEP) andsolar/viewing geometry from MODIS [Wang and Bailey,2001].
GEOPHYSICAL RESEARCH LETTERS, VOL. 36, L01604, doi:10.1029/2008GL036119, 2009ClickHere
for
FullArticle
1College of Marine Science, University of South Florida, St. Petersburg,Florida, USA.
2IMSG at NOAA/NESDIS, Camp Springs, Maryland, USA.3NESDIS, NOAA, Camp Springs, Maryland, USA.4School for Marine Science and Technology, University of Massachu-
setts Dartmouth, New Bedford, Massachusetts, USA.
Copyright 2009 by the American Geophysical Union.0094-8276/09/2008GL036119$05.00
L01604 1 of 5
[7] SAR data from RADARSAT-1 (a C-band radar withhorizontal polarization and 100-km swath width) wereobtained during the Alaska SAR Demonstration(AKDEMO) project. These 25-m resolution images werestandard beam mode scenes, processed at the Alaska Satel-lite Facility (ASF) at the University of Alaska, Fairbanks.The images were navigated and analyzed using ENVI.
3. Results
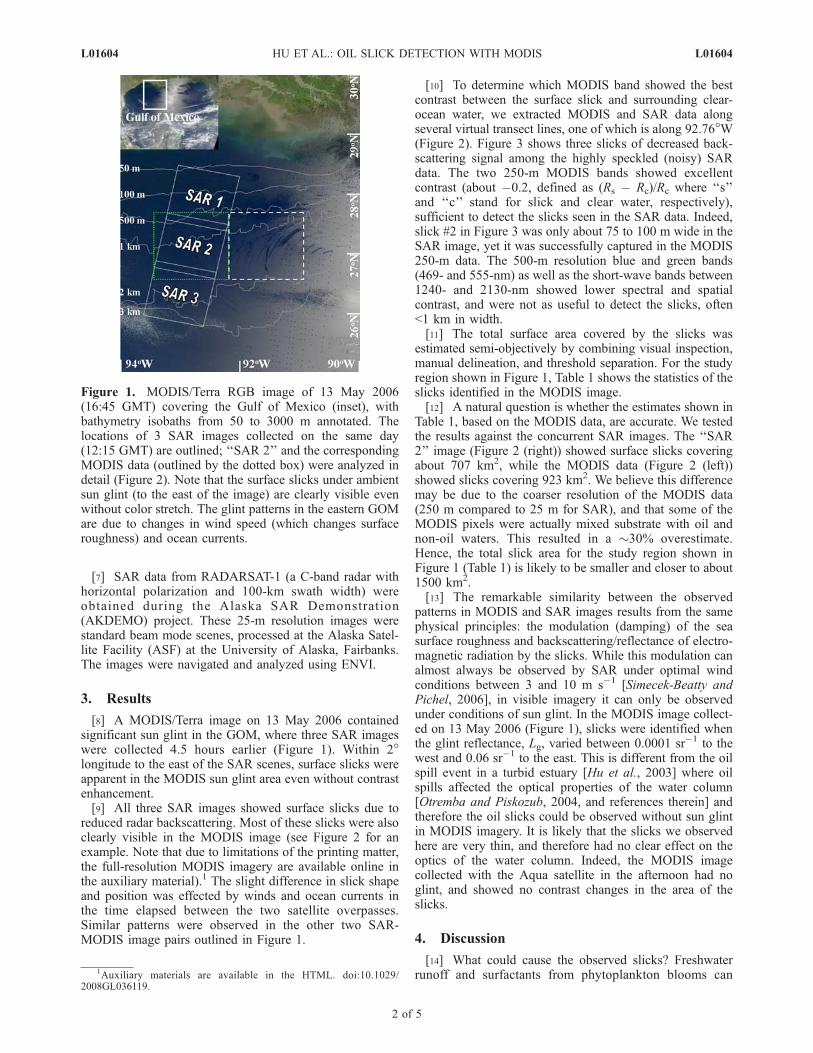
[8] A MODIS/Terra image on 13 May 2006 containedsignificant sun glint in the GOM, where three SAR imageswere collected 4.5 hours earlier (Figure 1). Within 2�longitude to the east of the SAR scenes, surface slicks wereapparent in the MODIS sun glint area even without contrastenhancement.[9] All three SAR images showed surface slicks due to
reduced radar backscattering. Most of these slicks were alsoclearly visible in the MODIS image (see Figure 2 for anexample. Note that due to limitations of the printing matter,the full-resolution MODIS imagery are available online inthe auxiliary material).1 The slight difference in slick shapeand position was effected by winds and ocean currents inthe time elapsed between the two satellite overpasses.Similar patterns were observed in the other two SAR-MODIS image pairs outlined in Figure 1.
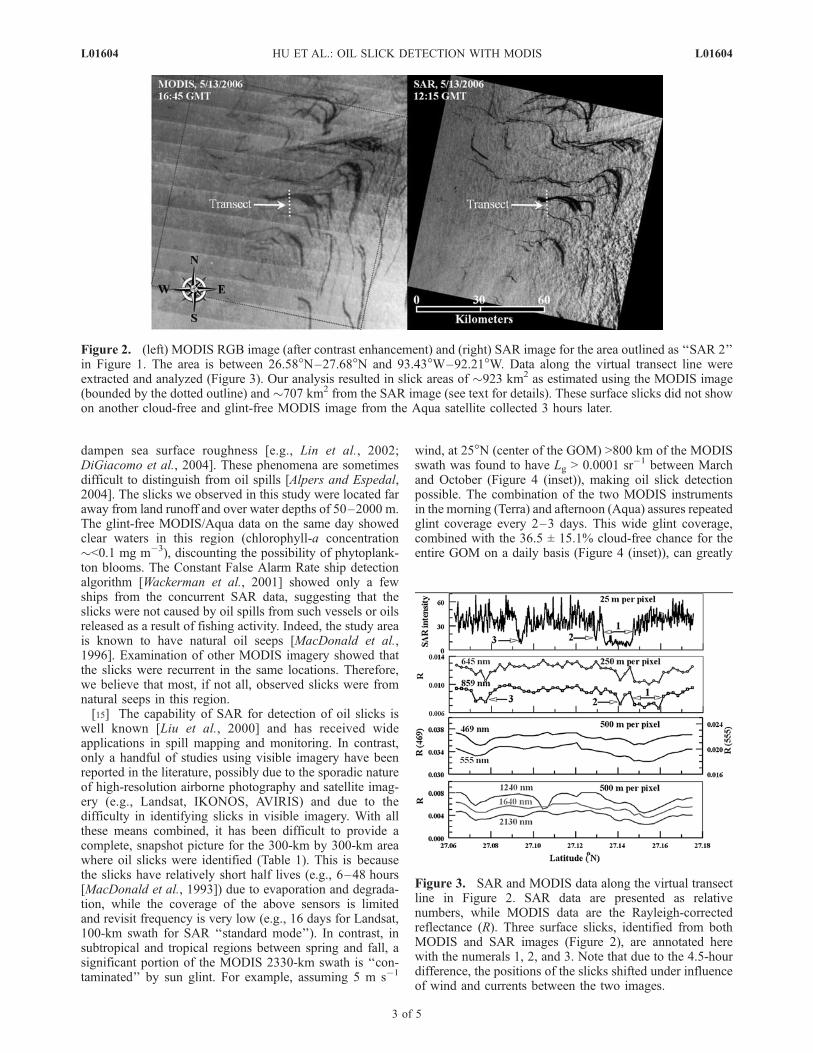
[10] To determine which MODIS band showed the bestcontrast between the surface slick and surrounding clear-ocean water, we extracted MODIS and SAR data alongseveral virtual transect lines, one of which is along 92.76�W(Figure 2). Figure 3 shows three slicks of decreased back-scattering signal among the highly speckled (noisy) SARdata. The two 250-m MODIS bands showed excellentcontrast (about �0.2, defined as (Rs � Rc)/Rc where ‘‘s’’and ‘‘c’’ stand for slick and clear water, respectively),sufficient to detect the slicks seen in the SAR data. Indeed,slick #2 in Figure 3 was only about 75 to 100 m wide in theSAR image, yet it was successfully captured in the MODIS250-m data. The 500-m resolution blue and green bands(469- and 555-nm) as well as the short-wave bands between1240- and 2130-nm showed lower spectral and spatialcontrast, and were not as useful to detect the slicks, often<1 km in width.[11] The total surface area covered by the slicks was
estimated semi-objectively by combining visual inspection,manual delineation, and threshold separation. For the studyregion shown in Figure 1, Table 1 shows the statistics of theslicks identified in the MODIS image.[12] A natural question is whether the estimates shown in
Table 1, based on the MODIS data, are accurate. We testedthe results against the concurrent SAR images. The ‘‘SAR2’’ image (Figure 2 (right)) showed surface slicks coveringabout 707 km2, while the MODIS data (Figure 2 (left))showed slicks covering 923 km2. We believe this differencemay be due to the coarser resolution of the MODIS data(250 m compared to 25 m for SAR), and that some of theMODIS pixels were actually mixed substrate with oil andnon-oil waters. This resulted in a �30% overestimate.Hence, the total slick area for the study region shown inFigure 1 (Table 1) is likely to be smaller and closer to about1500 km2.[13] The remarkable similarity between the observed
patterns in MODIS and SAR images results from the samephysical principles: the modulation (damping) of the seasurface roughness and backscattering/reflectance of electro-magnetic radiation by the slicks. While this modulation canalmost always be observed by SAR under optimal windconditions between 3 and 10 m s�1 [Simecek-Beatty andPichel, 2006], in visible imagery it can only be observedunder conditions of sun glint. In the MODIS image collect-ed on 13 May 2006 (Figure 1), slicks were identified whenthe glint reflectance, Lg, varied between 0.0001 sr�1 to thewest and 0.06 sr�1 to the east. This is different from the oilspill event in a turbid estuary [Hu et al., 2003] where oilspills affected the optical properties of the water column[Otremba and Piskozub, 2004, and references therein] andtherefore the oil slicks could be observed without sun glintin MODIS imagery. It is likely that the slicks we observedhere are very thin, and therefore had no clear effect on theoptics of the water column. Indeed, the MODIS imagecollected with the Aqua satellite in the afternoon had noglint, and showed no contrast changes in the area of theslicks.
4. Discussion
[14] What could cause the observed slicks? Freshwaterrunoff and surfactants from phytoplankton blooms can
Figure 1. MODIS/Terra RGB image of 13 May 2006(16:45 GMT) covering the Gulf of Mexico (inset), withbathymetry isobaths from 50 to 3000 m annotated. Thelocations of 3 SAR images collected on the same day(12:15 GMT) are outlined; ‘‘SAR 2’’ and the correspondingMODIS data (outlined by the dotted box) were analyzed indetail (Figure 2). Note that the surface slicks under ambientsun glint (to the east of the image) are clearly visible evenwithout color stretch. The glint patterns in the eastern GOMare due to changes in wind speed (which changes surfaceroughness) and ocean currents.
1Auxiliary materials are available in the HTML. doi:10.1029/2008GL036119.
L01604 HU ET AL.: OIL SLICK DETECTION WITH MODIS L01604
2 of 5
dampen sea surface roughness [e.g., Lin et al., 2002;DiGiacomo et al., 2004]. These phenomena are sometimesdifficult to distinguish from oil spills [Alpers and Espedal,2004]. The slicks we observed in this study were located faraway from land runoff and over water depths of 50–2000 m.The glint-free MODIS/Aqua data on the same day showedclear waters in this region (chlorophyll-a concentration�<0.1 mg m�3), discounting the possibility of phytoplank-ton blooms. The Constant False Alarm Rate ship detectionalgorithm [Wackerman et al., 2001] showed only a fewships from the concurrent SAR data, suggesting that theslicks were not caused by oil spills from such vessels or oilsreleased as a result of fishing activity. Indeed, the study areais known to have natural oil seeps [MacDonald et al.,1996]. Examination of other MODIS imagery showed thatthe slicks were recurrent in the same locations. Therefore,we believe that most, if not all, observed slicks were fromnatural seeps in this region.[15] The capability of SAR for detection of oil slicks is
well known [Liu et al., 2000] and has received wideapplications in spill mapping and monitoring. In contrast,only a handful of studies using visible imagery have beenreported in the literature, possibly due to the sporadic natureof high-resolution airborne photography and satellite imag-ery (e.g., Landsat, IKONOS, AVIRIS) and due to thedifficulty in identifying slicks in visible imagery. With allthese means combined, it has been difficult to provide acomplete, snapshot picture for the 300-km by 300-km areawhere oil slicks were identified (Table 1). This is becausethe slicks have relatively short half lives (e.g., 6–48 hours[MacDonald et al., 1993]) due to evaporation and degrada-tion, while the coverage of the above sensors is limitedand revisit frequency is very low (e.g., 16 days for Landsat,100-km swath for SAR ‘‘standard mode’’). In contrast, insubtropical and tropical regions between spring and fall, asignificant portion of the MODIS 2330-km swath is ‘‘con-taminated’’ by sun glint. For example, assuming 5 m s�1
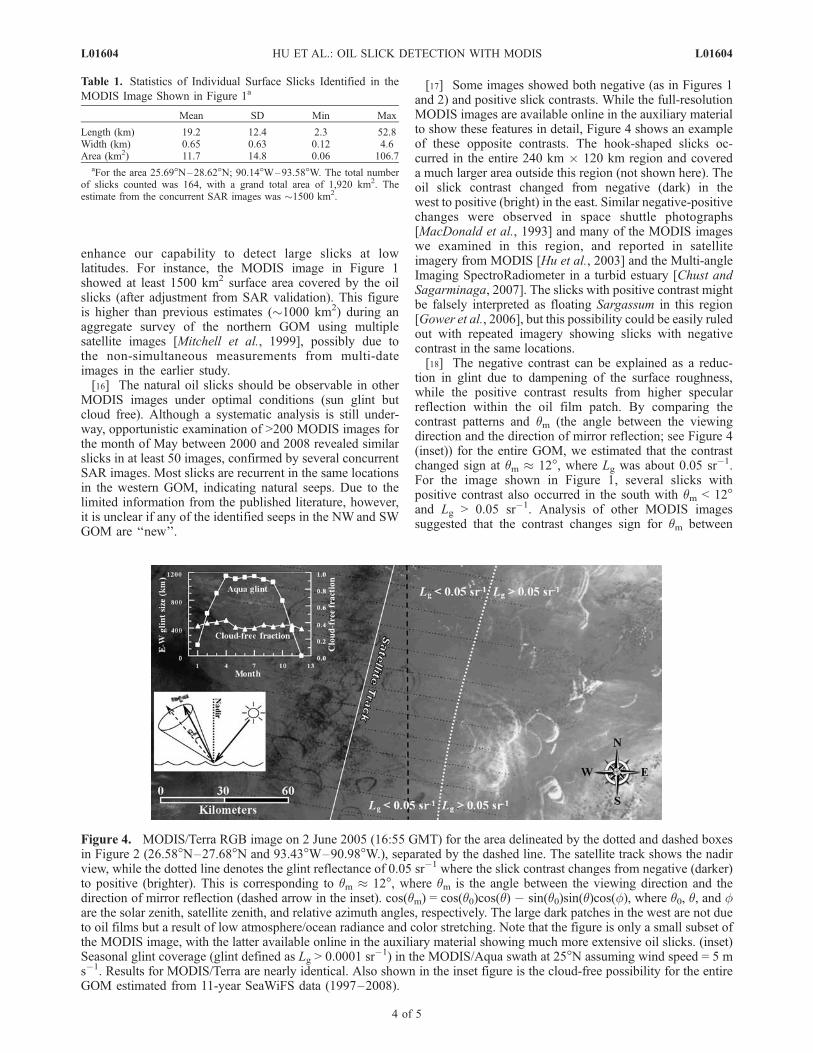
wind, at 25�N (center of the GOM) >800 km of the MODISswath was found to have Lg > 0.0001 sr�1 between Marchand October (Figure 4 (inset)), making oil slick detectionpossible. The combination of the two MODIS instrumentsin the morning (Terra) and afternoon (Aqua) assures repeatedglint coverage every 2–3 days. This wide glint coverage,combined with the 36.5 ± 15.1% cloud-free chance for theentire GOM on a daily basis (Figure 4 (inset)), can greatly
Figure 2. (left) MODIS RGB image (after contrast enhancement) and (right) SAR image for the area outlined as ‘‘SAR 2’’in Figure 1. The area is between 26.58�N–27.68�N and 93.43�W–92.21�W. Data along the virtual transect line wereextracted and analyzed (Figure 3). Our analysis resulted in slick areas of �923 km2 as estimated using the MODIS image(bounded by the dotted outline) and �707 km2 from the SAR image (see text for details). These surface slicks did not showon another cloud-free and glint-free MODIS image from the Aqua satellite collected 3 hours later.
Figure 3. SAR and MODIS data along the virtual transectline in Figure 2. SAR data are presented as relativenumbers, while MODIS data are the Rayleigh-correctedreflectance (R). Three surface slicks, identified from bothMODIS and SAR images (Figure 2), are annotated herewith the numerals 1, 2, and 3. Note that due to the 4.5-hourdifference, the positions of the slicks shifted under influenceof wind and currents between the two images.
L01604 HU ET AL.: OIL SLICK DETECTION WITH MODIS L01604
3 of 5
enhance our capability to detect large slicks at lowlatitudes. For instance, the MODIS image in Figure 1showed at least 1500 km2 surface area covered by the oilslicks (after adjustment from SAR validation). This figureis higher than previous estimates (�1000 km2) during anaggregate survey of the northern GOM using multiplesatellite images [Mitchell et al., 1999], possibly due tothe non-simultaneous measurements from multi-dateimages in the earlier study.[16] The natural oil slicks should be observable in other
MODIS images under optimal conditions (sun glint butcloud free). Although a systematic analysis is still under-way, opportunistic examination of >200 MODIS images forthe month of May between 2000 and 2008 revealed similarslicks in at least 50 images, confirmed by several concurrentSAR images. Most slicks are recurrent in the same locationsin the western GOM, indicating natural seeps. Due to thelimited information from the published literature, however,it is unclear if any of the identified seeps in the NW and SWGOM are ‘‘new’’.
[17] Some images showed both negative (as in Figures 1and 2) and positive slick contrasts. While the full-resolutionMODIS images are available online in the auxiliary materialto show these features in detail, Figure 4 shows an exampleof these opposite contrasts. The hook-shaped slicks oc-curred in the entire 240 km � 120 km region and covereda much larger area outside this region (not shown here). Theoil slick contrast changed from negative (dark) in thewest to positive (bright) in the east. Similar negative-positivechanges were observed in space shuttle photographs[MacDonald et al., 1993] and many of the MODIS imageswe examined in this region, and reported in satelliteimagery from MODIS [Hu et al., 2003] and the Multi-angleImaging SpectroRadiometer in a turbid estuary [Chust andSagarminaga, 2007]. The slicks with positive contrast mightbe falsely interpreted as floating Sargassum in this region[Gower et al., 2006], but this possibility could be easily ruledout with repeated imagery showing slicks with negativecontrast in the same locations.[18] The negative contrast can be explained as a reduc-
tion in glint due to dampening of the surface roughness,while the positive contrast results from higher specularreflection within the oil film patch. By comparing thecontrast patterns and qm (the angle between the viewingdirection and the direction of mirror reflection; see Figure 4(inset)) for the entire GOM, we estimated that the contrastchanged sign at qm � 12�, where Lg was about 0.05 sr�1.For the image shown in Figure 1, several slicks withpositive contrast also occurred in the south with qm < 12�and Lg > 0.05 sr�1. Analysis of other MODIS imagessuggested that the contrast changes sign for qm between
Table 1. Statistics of Individual Surface Slicks Identified in the
MODIS Image Shown in Figure 1a
Mean SD Min Max
Length (km) 19.2 12.4 2.3 52.8Width (km) 0.65 0.63 0.12 4.6Area (km2) 11.7 14.8 0.06 106.7
aFor the area 25.69�N–28.62�N; 90.14�W–93.58�W. The total numberof slicks counted was 164, with a grand total area of 1,920 km2. Theestimate from the concurrent SAR images was �1500 km2.
Figure 4. MODIS/Terra RGB image on 2 June 2005 (16:55 GMT) for the area delineated by the dotted and dashed boxesin Figure 2 (26.58�N–27.68�N and 93.43�W–90.98�W.), separated by the dashed line. The satellite track shows the nadirview, while the dotted line denotes the glint reflectance of 0.05 sr�1 where the slick contrast changes from negative (darker)to positive (brighter). This is corresponding to qm � 12�, where qm is the angle between the viewing direction and thedirection of mirror reflection (dashed arrow in the inset). cos(qm) = cos(q0)cos(q) � sin(q0)sin(q)cos(f), where q0, q, and fare the solar zenith, satellite zenith, and relative azimuth angles, respectively. The large dark patches in the west are not dueto oil films but a result of low atmosphere/ocean radiance and color stretching. Note that the figure is only a small subset ofthe MODIS image, with the latter available online in the auxiliary material showing much more extensive oil slicks. (inset)Seasonal glint coverage (glint defined as Lg > 0.0001 sr�1) in the MODIS/Aqua swath at 25�N assuming wind speed = 5 ms�1. Results for MODIS/Terra are nearly identical. Also shown in the inset figure is the cloud-free possibility for the entireGOM estimated from 11-year SeaWiFS data (1997–2008).
L01604 HU ET AL.: OIL SLICK DETECTION WITH MODIS L01604
4 of 5

12� and 14� and Lg between 0.04 and 0.05 sr�1. However,whether this observation can be generalized still needsfurther research, including a simulation study with bi-directional optical properties of the oil film [e.g., Otrembaand Piskozub, 2004].
5. Conclusion
[19] The unique capability of the MODIS instruments indetecting oil slicks in an oligotrophic ocean has beendemonstrated. The image pairs from concurrent MODISand SAR measurements prove the ability to examine largeareas for oil slicks using MODIS. MODIS helps by expand-ing the coverage and revisit frequency. Our results suggestthat annual seepage rates in the northwestern Gulf ofMexico may have been underestimated in past studies, buta systematic examination of an extensive MODIS timeseries is required to assess annual slick formation rates.Because of the global availability of the medium-resolution(250-m and 500-m) MODIS data and their consistentcoverage of sun glint in tropical and subtropical regions,systematic application may also improve the estimation ofglobal annual seepage rates and help identify new oil seeps.
[20] Acknowledgments. This work was supported by the U.S.NOAA (NA06NES4400004) and NASA (NNS04AB59G). We thank theNASA/GSFC for providing MODIS data and software. SAR data wereobtained under the NASA RADARSAT-0011-0071 and NOAA/NESDIS/STAR Ocean Remote Sensing programs. The views, opinions, and findingscontained in this report are those of the authors and should not be construedas an official NOAA or U.S. Government position, policy, or decision.IMaRS contribution 128.
ReferencesAlpers, W., and H. A. Espedal (2004), Oils and surfactants, in SyntheticAperture Radar Marine User’s Manual, edited by C. R. Jackson and J. R.Apel, pp. 263–275, U.S. Dep. of Commer., Washington, D. C.
Brekke, C., and A. H. S. Solberg (2005), Oil spill detection by satelliteremote sensing, Remote Sens. Environ., 95, 1–13.
Chust, G., and Y. Sagarminaga (2007), The multi-angle view of MISRdetects oil slicks under sun glitter conditions, Remote Sens. Environ.,107, 232–239.
Cox, C., and W. H. Munk (1954), The measurement of the roughness of thesea surface from photographs of the sun’s glitter, J. Opt. Soc. Am., 44,838–850.
DiGiacomo, P. M., L. Washburn, B. Holt, and B. H. Jones (2004), Coastalpollution hazards in southern California observed by SAR imagery:Stormwater plumes, wastewater plumes, and natural hydrocarbon seeps,Mar. Pollut. Bull., 49, 1013–1024.
Esaias, W. E., et al. (1998), An overview of MODIS capabilities for oceanscience observations, IEEE Trans. Geosci. Remote Sens., 36, 1250–1265.
Fingas, M., and C. Brown (2000), Oil-spill remote sensing—An update,Sea Technol., 41, 21–26.
Gower, J., C. Hu, G. Borstad, and S. King (2006), Ocean color satellitesshow extensive lines of floating Sargassum in the Gulf of Mexico, IEEETrans. Geosci. Remote Sens., 44(12), 3619 – 3625, doi:10.1109/TGRS.2006.882258.
Hu, C., F. E. Muller-Karger, C. Taylor, D.Myhre, B. Murch, A. L. Odriozola,and G. Godoy (2003), MODIS detects oil spills in Lake Maracaibo,Venezuela, Eos Trans. AGU, 84(33), doi:10.1029/2003EO330002.
Kvenvolden, K. A., and C. K. Cooper (2003), Natural seepage of crude oilinto the marine environment, Geo Mar. Lett., 23, 140–146.
Lin, I.-I., L. Wen, K. Liu, W. Tsai, and A. K. Liu (2002), Evidence andquantification of the correlation between radar backscatter and oceancolour supported by simultaneously acquired in situ sea truth, Geophys.Res. Lett., 29(10), 1464, doi:10.1029/2001GL014039.
Liu, A. K., S. Y. Wu, W. Y. Tseng, and W. G. Pichel (2000), Waveletanalysis of SAR images for coastal monitoring, Can. J. Remote Sens.,26, 494–500.
Macdonald, I. R., N. L. Guinasso Jr., S. G. Ackleson, J. F. Amos,R. Duckworth, R. Sassen, and J. M. Brooks (1993), Natural oil slicks inthe Gulf of Mexico visible from space, J. Geophys. Res., 98, 16,351–16,364.
MacDonald, I. R., et al. (1996), Remote sensing inventory of active oilseeps and chemosynthetic communities in the northern Gulf of Mexico,in Hydrocarbon Migration and Its Near-Surface Expression, edited byD. Schumacher and M. A. Abrams, AAPG Mem., 66, 27–37.
Mitchell, R., I. R. MacDonald, and K. Kvenvolden (1999), Estimates oftotal hydrocarbon seepage into the Gulf of Mexico based on satelliteremote sensing images, Eos Trans. AGU, 80(49), Ocean Sci. Meet.Suppl., Abstract OS411-02.
National Research Council (2003), Oil in the Sea III: Inputs, Fates, andEffects, Natl. Acad. Press, Washington, D. C.
Otremba, Z., and J. Piskozub (2004), Modelling the bidirectional reflec-tance distribution function (BRDF) of seawater polluted by an oil film,Opt. Express, 12, 1671–1676.
Simecek-Beatty, D., and W. Pichel (2006), RADARSAT-1 synthetic aper-ture radar analysis for M/V Selendang Ayu oil spill, paper presented atthe 29th Arctic and Marine Oil spill Program Technical Seminar, Envir-on. Can., Vancouver, B. C., Canada, 6–8 June.
Wackerman, C. C., K. S. Friedman, W. G. Pichel, P. Clemente-Colon, andX. Li (2001), Automatic Detection of Ships in RADARSAT-1 SAR ima-gery, Can. J. Remote Sens., 27, 568–577.
Wang, M., and S. W. Bailey (2001), Correction of sun glint contaminationon the SeaWiFS ocean and atmosphere products, Appl. Opt., 40, 4790–4798.
�����������������������C. Hu, College of Marine Science, University of South Florida, 140
Seventh Avenue, South, St. Petersburg, FL 33701, USA. ([email protected])X. Li and W. G. Pichel, NESDIS, NOAA, 5200 Auth Road, Camp
Springs, MD 20746, USA.F. E. Muller-Karger, School for Marine Science and Technology,
University of Massachusetts Dartmouth, 706 South Rodney FrenchBoulevard, New Bedford, MA 02744, USA.
L01604 HU ET AL.: OIL SLICK DETECTION WITH MODIS L01604
5 of 5