Wave directional spectrum from SAR imagery
10
Photonirvachak Journal of the Indian Society of Remote Sensing, Vol. 28, No. 1, 2000 Wave Directional Spectrum From SAR Imagery A.A. FERNANDES 1 . Y.V.B. SARMA 1 , H.B. MENON 2 and P. VETHAMONY 1 1 National Institute of Oceanography, Dona Paula. Goa 403004 2 Goa University. Taleigao Plateau, Goa 403 206 ABSTRACT Gaussian smoothed SAR image spectra have been evaluated from 512 x 512 pixel sub- scenes of image mode ERS-1 SAR scenes off Goa, Visakhapatnam, Paradeep and Portugal. The two recently acquired scenes off Portugal showed the signature of swell of wavelength 200m and internal waves of wavelength > 400m. Only internal waves of wavelength > 400m were seen in the scene off Goa observed on 11 March 1992. The scenes off Visakhapatnam and Paradeep did not show any wave like features, the latter appearing to be of "white noise" nature. There exists a 180° ambiguity in wave direction observed from radar imageries. Based on the method of Atanassov et al (1985), a computer program has been developed for the removal of the 180° ambiguity by using two images of the same area separated by a time interval which is small compared to the period of the dominant waves. The computer program has been successfully tested with computer simulated images. Introduction The first Synthetic Aperture Radar (SAR) was flown aboard the short lived SEASAT. the first satellite dedicated to the study of the oceans. A review of SEASAT performance is given in the book "Satellite microwave remote sensing" by Allan (ED) (1983). Allan's article therein reports that the SEASAT SAR imaged ocean waves, internal waves, slicks and streaks. Articles by D W S Lodge and NH Kenyon also Reed. 22 Feb. '99; in final form 21 Feb. 2000 therein reported that SEASAT SAR imaged large scale marine bedforms like sand banks and sand waves and was useful in identifying the direction of current flows and in indicating whether the flood or ebb current is dominant. One of SEASAT SAR mission's objectives was to detect sea and fresh water ice and to map snow cover. Johannessen et al. (1994) reported that ERS-1 SAR has imaged horizontal roll vortices in the atmosphere, atmospheric gravity waves, wind and current fronts, wind direction, rain cells, eddies, sea ice, internal waves, slicks and surface wind waves, especially swell. SAR is also useful for ship detection Ocean waves are weakly
-
Upload
independent -
Category
Documents
-
view
0 -
download
0
Transcript of Wave directional spectrum from SAR imagery

PhotonirvachakJournal of the Indian Society of Remote Sensing, Vol. 28, No. 1, 2000
Wave Directional Spectrum From SAR ImageryA.A. FERNANDES1. Y.V.B. SARMA1, H.B. MENON2 and P. VETHAMONY1
1National Institute of Oceanography, Dona Paula. Goa 4030042Goa University. Taleigao Plateau, Goa 403 206
ABSTRACT
Gaussian smoothed SAR image spectra have been evaluated from 512 x 512 pixel sub- scenes of image mode ERS-1 SAR scenes off Goa, Visakhapatnam, Paradeep and Portugal. The two recently acquired scenes off Portugal showed the signature of swell of wavelength 200m and internal waves of wavelength > 400m. Only internal waves of wavelength > 400m were seen in the scene off Goa observed on 11 March 1992. The scenes off Visakhapatnam and Paradeep did not show any wave like features, the latter appearing to be of "white noise" nature.
There exists a 180° ambiguity in wave direction observed from radar imageries. Based on the method of Atanassov et al (1985), a computer program has been developed for the removal of the 180° ambiguity by using two images of the same area separated by a time interval which is small compared to the period of the dominant waves. The computer program has been successfully tested with computer simulated images.
Introduction
The first Synthetic Aperture Radar (SAR) was flown aboard the short lived SEASAT. the first satellite dedicated to the study of the oceans. A review of SEASAT performance is given in the book "Satellite microwave remote sensing" by Allan (ED) (1983). Allan's article therein reports that the SEASAT SAR imaged ocean waves, internal waves, slicks and streaks. Articles by D W S Lodge and NH Kenyon also
Reed. 22 Feb. '99; in final form 21 Feb. 2000
therein reported that SEASAT SAR imaged large scale marine bedforms like sand banks and sand waves and was useful in identifying the direction of current flows and in indicating whether the flood or ebb current is dominant. One of SEASAT SAR mission's objectives was to detect sea and fresh water ice and to map snow cover. Johannessen et al. (1994) reported that ERS-1 SAR has imaged horizontal roll vortices in the atmosphere, atmospheric gravity waves, wind and current fronts, wind direction, rain cells, eddies, sea ice, internal waves, slicks and surface wind waves, especially swell. SAR is also useful for ship detection Ocean waves are weakly
10 A.A. Fernandes et al.
imaged and can be recognized from SAR imagery from their fine "finger print" like signature. In contrast with ocean waves, internal waves and bathymetric features are more strongly imaged. SEASAT SAR operated at L- band (1.4Ghz, 22cm), while ERS-1 SAR operates at C-band (5.3Ghz, 6cm).
The mechanism for imaging of long ocean waves/internal waves by all types of radar including ship radar, Real Aperture Radar (RAR) mounted on aeroplanes and Synthetic. Aperture Radar (SAR) mounted on satellites, is by modulation of the back-scatter from short Bragg resonant capillary-gravity waves (having wavelength, 6cm in case of ERS-1) by the long gravity waves/internal waves ( > 75m). For Bragg scattering to be effective the radar incidence angle with respect to the vertical is generally between 20° and 70°. At near zero degrees or nadir incidence, specular reflection dominates while at angles larger than 70°, "shadowing" effect dominates.
The theory of imaging of longer ocean waves by all types of radar is discussed in terms of the 'Two-scale' model in which the sea surface is treated as a superposition of short Bragg scattering ripples superimposed on the longer gravity waves; and is applied locally in a reference system lying in the tangent plane ('facet') of the long waves. Three processes contribute to ocean wave imaging by radar, the first two of which are common to both RAR and SAR, while the third is a feature solely of SAR: [ I ] the changes caused by the long wave slope, in the effective angle of incidence relative to the local facet normal (electromagnetic interactions or tilt modulation), [2] the modulation of the energy of the short Bragg scattering ripples through interactions between the ripple waves and the long gravity waves (hydrodynamic interactions or modulation), and [3] the temporal variation in facet position and the Bragg scattering coefficients of the facets during the finite integration time in which SAR sees the facet (motion effects or velocity bunching). A
review of the theory of imaging of ocean waves by SAR is given by Hasselmann et al. (1985).
Being an active microwave sensor SAR has an all-weather, day/night capability. High resolution in range (across track) direction is achieved by transmitting very short pulses to illuminate the sea surface. High resolution in azimuthal (along track) direction is achieved by using the forward motion of the satellite to synthesize an aperture of very great length.
Determination of the wave directional spectrum from image mode SAR imagery off the coast of India has been previously reported by Kumar et al (1996, 1997 and 1999) and Sarma (1997). Mahadevan et al (1990) are the pioneers in India in the field of ocean wave imaging by SAR. In PART 1 we shall discuss the results of our present work with ERS-1 image mode SAR scenes off Goa, Visakhapatnam, Paradeep and Portugal for detecting wind waves and internal waves, and an indication of future line of work is given. In PART 11 we shall discuss about the removal of the 180° ambiguity in wave direction associated with radar imagery.
1. SAR Measurements
Digital ERS-1 image mode SAR scenes off Goa, Paradeep and Visakhapatnam were acquired from the National Remote Sensing Agency (NRSA), Hyderabad, India, with the intention of studying the spatial evolution of directional ocean wave spectra. The NRSA supplied the scenes off Goa and Paradeep. including header and trailer files on ½" Computer Compatible Tape (CCT). The scene off Visakhapatnam was supplied on CDROM. The image data was 8-bit and comprised of 6801 lines each of 6680 pixels. The line/pixel spacing was 15m.
Monaldo and Lyzenga (1986) outlined the methodology for evaluating the directional ocean wave spectra of 512 x 512 or 256 x 256 pixel sub-scenes drawn from the full imagery,

Wave Directional Spectrum From SAR Imagery 11
according to which the following steps of computation have to be performed: (i) fractional modulation; (ii) 2-dimensional Fourier transform, which transforms the data from spatial domain to wave number domain; (iii) stationary response correction, to make allowance for azimuthal and range fall off in energy; (iv) Gaussian smoothing; (v) speckle noise removal; (vi) tilt and velocity bunching modulation transfer function (correction). The spectrum obtained on performing each of the steps (ii) through (v) is known as the SAR image spectrum. The spectrum obtained on completion of step (vi) is known as the wave directional spectrum, viz., wave height spectrum or wave slope spectrum depending on whether normalization with wave number is done or not.
Fractional modulation comprises of subtracting the mean value of the back scatter from each element of the sub-scene and dividing the difference by the mean value. Stationary response correction is performed to make allowance for the well known azimuthal and range fall off of energy by using polynomials of even degree, the coefficients of which are evaluated separately from azimuthal and range spectral profiles of spectrally "white" sub-scenes, i.e., scenes which do not show any wave like features. Gaussian smoothing and speckle noise removal along with stationary response correction are meant to enhance the signal due to ocean waves. Tilt and velocity bunching modulation transfer functions are applied to take care of the imaging mechanism of ocean waves by SAR. It may be noted that in the scheme of Monaldo and Lyzenga (1986) the effect of another imaging mechanism, the hydrodynamic modulation transfer function is not taken into consideration as its amplitude is small compared to that of the tilt modulation transfer function.
The ERS-1 SAR scene off Goa (descending orbit 3413, path 727, row 207, scene centre 15.2798N 73.3497E) was observed on 11 March 1992 at 0534 GMT, i.e., 1104 IST. Sea truth was obtained with an ENDECO directional wave track buoy deployed for eight days (from 5 to 13
March 1992) off Candolim (Lat 15°30' N; Long 73°44' E) in a mean water depth of 14 metres. Fernandes et al. (1994) observed low wave conditions prevailed during the entire period of buoy measurements. The significant wave height was in the range 0.53-0.96m and the zero- crossing period was in the range 4.36-5.98s. As computed by the ENDECO program 1156DBP. EXE, which computes spectral density and wave direction separately as a function of frequency using the digital band, pass filtering method, the buoy observation at 1050 IST showed (Table 1) that there were two main spectral peaks, both due to "swell" ( waves generated by distant storms), the dominant peak being centred at 5.00s (direction 32.0°N, deep water wavelength 39m), and the subsidiary peak centred at 12.50s (direction 22.8°M, deep water wavelength 244m). At 1100 hours on 10 March 1992, the swell direction corresponding to the dominant swell peak was roughly estimated as 33.0°N by visual observation. A glossy photograph of the full SAR image accompanying the digital data on CCT, showed the presence of internal waves. We therefore extracted from the digital data, several 512 x 512 sub-scenes of area 7.68 x 7.68 Km2,some of which were centred around the prominent internal waves in the glossy photograph. Both the SAR sub-scenes as well as the corresponding Gaussian smoothed SAR image spectra, showed only the signature of internal waves of wavelength > 400m. Because of the well known azimuthal and range fall off with increasing wave number, as expected the signature of the dominant "swell" of 5.00s was not present. The signature of the "swell" of 12.50s was also absent probably because the significant wave height was less than one metre. Gonzalez et al. (1979) from an analysis of SEASAT SAR imagery concluded that when the significant wave height is lower than l-2m, the waves are not imaged. It may also be pointed out that the zero-crossing period, i.e., the mean period was < 5s such that the waves could not be imaged by SAR.
The SAR scene off Paradeep (descending
12 A.A. Fernandes et al.
Table 1. Sea truth (short term wave statistics) observed with an ENDECO wave directional buoy off Goa, and with a DATAWELL wave directional buoy off Visakhapatnam and Pradeep.
Location Date Time(IST)
Hs(m)
T2(s)
Tp(s)
p(deg)
Tp '(s)
p’(deg)
Goa 11.3.92 0900 0.51 4.35 5.00 310 12.50 205
1030 0.56 4.03 4.76 311 12.50 202
1050# 0.57 3.77 5.00 320 12.50 228
1200 0.57 3.63 5.26 316 12.50 263
1300 0.59 3.33 5.00 314 12.50 242
Visakhapatnam 2.12.97 0530 0.55 5.41 15.38 162 5.88 132
0900# 0.54 5.48 14.29 172 5.56 121
1530 0.58 3.51 10.52 155 4.76 124
1730 0.62 3.51 15.38 150 5.00 122
Paradeep 31.5.96 1245 1.66 5.56 8.33 194 5.56 118
1545# 1.57 5.06 7.69 198 5.00 151
1815 2.06 4.89 8.33 198 5.00 198
2145 1.93 5 13 7.69 202 5.00 201
# indicates time of wave buoy observation nearest to the time of ERS-1 satellite overpass.
Hs and T2 are the significant wave height (mean of the highest 1/3 waves) and the zero-crossing period (mean pe- riod): Tp and p are the wave period and wave direction corresponding to the principal peak in the energy spectrum; Tp' and p' are the wave period and wave direction corresponding to the secondary peak in the energy spectrum.
orbit 5813, path 857, row 201, scene centre 20.0630N 87.2920E) was observed on 31 May 1996 at 1044 GMT, i.e., 1614 IST. Since there was no glossy photograph of the full SAR image accompanying the digital data, a decimated image, i.e., an image formed by taking every tenth pixel/line was extracted from the full image. The decimated image did not show any land part or any wave like features. We therefore extracted at random several 512 x 512 sub- scenes of area 7.68 x 7.68 Km2. Both the sub- scenes as well as the corresponding Gaussian smoothed SAR image spectra, showed that the Paradeep scene was entirely of "white noise" nature.
The SAR scene off Visakhapatnam (descending orbit 13686, path 821, row 204, scene centre 17.6727N 83.1856E) observed on December 2, 1997 at 0456 GMT, i.e., 1026 IST. showed some land part but no signature of any wave like features. Several 512 x 512 sub-scenes of area 7.68 x 7.68 Km2 were extracted from the full image. Neither the sub-scenes nor the SAR image spectra derived from them showed the signature of any ocean waves or internal waves. Thus none of the Gaussian smoothed SAR image spectra from the three scenes along the coast ot India analyzed, viz., Paradeep, Goa and Visakhapatnam showed any ocean waves As mentioned above, the reason for non imaging of
Wave Directional Spectrum From SAR Imagery 13
Fig. I. Portugal 5 1 2 x 5 1 2 sub-scene
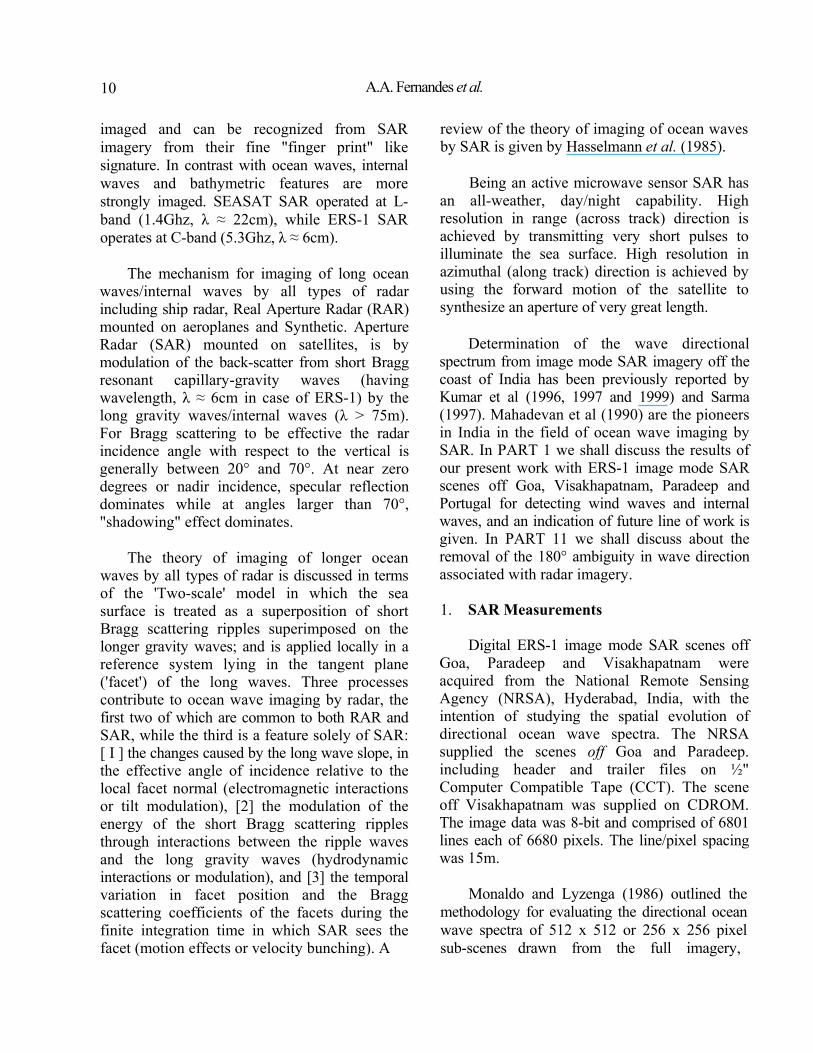
Fig. 2. FFT of Portugal sub-scene Circles denote wavelengths of 50. 100. 200. 400 m

14 A.A. Fernandes et al
the buoy observed waves (Table 1) is probably due to the fact that the observed significant wave height < 2m and the zero-crossing period during the satellite overpass is small (< 6s, < 60m).
We therefore utilized the visit of one of the authors (Sarma) to the Southampton Oceanographic Centre, U.K., to procure two ERS-1 digital image mode SAR scenes off Portugal, an area in which swell and internal waves were simultaneously imaged by SEASAT as reported by Allan (1983). The SAR scenes off Portugal had 8201 lines each of 8006 pixels, the data being of 16 bits. The pixel/line spacing of the data is 12.5m. Both the scenes off Portugal showed the signature of swell as well as internal waves. Fig. 1 depicts a 512 x 512 pixel sub-scene of area 6.4 x 6.4 Km2, from one of the scenes (p023-783) selected using its decimated image slightly away from an area where internal waves are prominent. Figure. 2 is its Gaussian smoothed SAR image spectrum, which shows swell of wavelength 200m with direction 40° with respect to the range direction, and internal waves of wavelength > 400m travelling in the range direction. The above SAR scene off Portugal (ascending orbit 10023, frame 783, scene centre 39.4771N 9.7890W) was observed on 15 June 1993 at 2254 GMT. The sub-scene shown in Fig 1 has top left coordinates [pixel = 4280, scanline = 3770]
Analysis was restricted to 512 x 512 pixel sub-scenes to Gaussian smoothing of the raw SAR image spectra, as we wanted to be sure that ocean wave signals were enhanced and not the "noise". We plan to develop subroutines for the other enhancements of the wave signal outlined by Monaldo and Lyzenga (1986), using the scenes off Portugal as they definitely contain ocean waves. If feasible we also plan to try to adopt the more sophisticated strategy of inverting the SAR image spectrum by the method of Hasselmann and Hasselmann (1991) to yield the wave directional spectrum; the method being based on the iterative minimization of a cost function, which requires a model derived wave spectrum as a starting point.
2. Removal of 180 Degrees Ambiguity
Some of the instruments used for obtaining radar imageries are (i) navigational radar mounted on ships (ii) SLAR (Side Looking Airborne Radar) or RAR (Real Aperture Radar) mounted on aircraft and (iii) SAR (Synthetic Aperture Radar) mounted on satellites. These radar imageries are used to obtain information about the wave directional spectrum. However the wave directional spectra obtained from radar imageries suffer from a serious drawback, viz., the 180° ambiguity in the determination of the wave propagation direction. This drawback is usually overcome by assuming that ~ the waves travel towards shore or downwind. The above assumptions therefore require additional knowledge of the wind field and the shore boundaries.
Atanassov et al. (1985) has proposed a method for removal of the 180° ambiguity which requires just two images of the same area separated by a time interval T which is small compared to the wave period corresponding to the dominant wavelength in the imageries. The processing of the imageries is done in spectral ( frequency or wave number) domain and uses the well known wave dispersion relation:
2 = (2 f)2 kg tanh kd ...................(1)
where k = (2 )/ , where K and are the wave number and wavelength. Atanassov et al. (1985)successfully implemented their method both with computer simulated imageries as well as with actual PPI (Plan Position Indicator) imageries obtained with a ship radar. The method of Atanassov et al. (1985) has also been applied to SLAR by Vachon and Raney (1989) and to SAR by Rosenthal et al. (1989) respectively. In SAR multi-look data (imagery) is essentially data observed at different times, the time interval being small. Multi-look data, which is normally used for reducing the "speckle" noise from SAR imagery, was used by Rosenthal et al. (1989) forremoving the 180° ambiguity in wave direction.

Wave Directional Spectrum From SAR Imagery ] 5
Fig. 3. Simulated image
Fig. 4. Ambiguous spectrum
Fig. 5. Unambiguous spectrum
16 A A. Fernandes et al
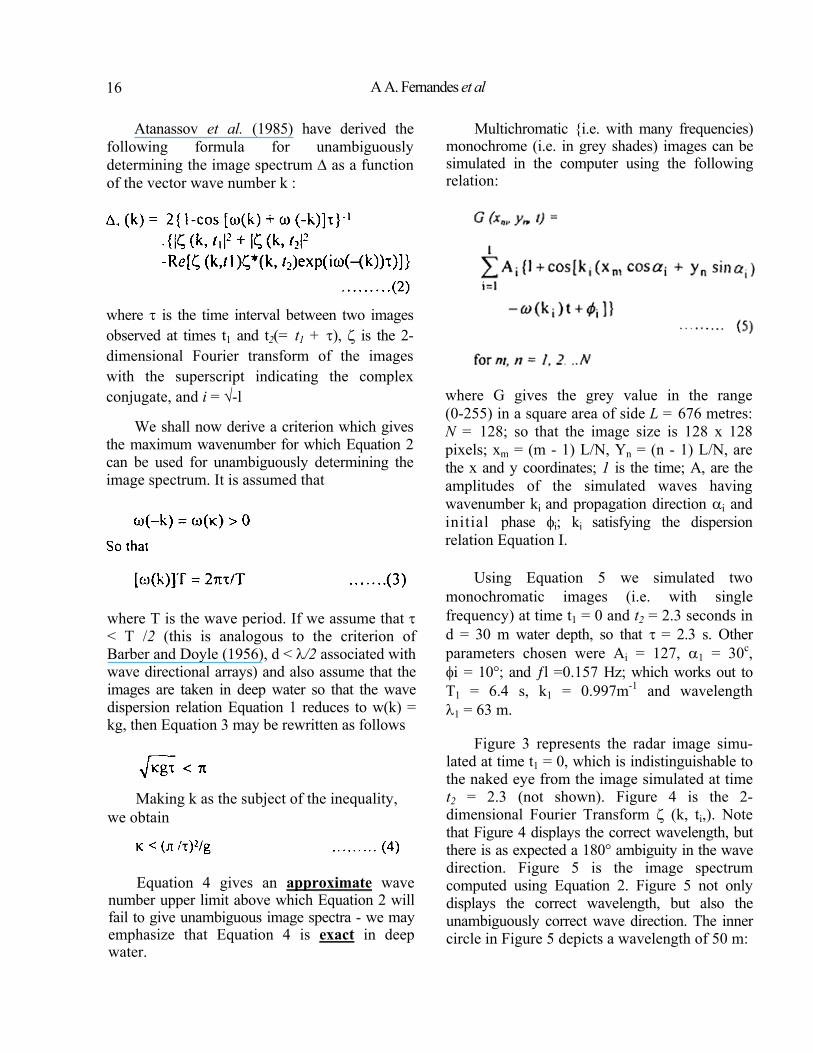
Atanassov et al. (1985) have derived the following formula for unambiguously determining the image spectrum as a function of the vector wave number k :
Multichromatic {i.e. with many frequencies)monochrome (i.e. in grey shades) images can be simulated in the computer using the following relation:
where is the time interval between two images observed at times t1 and t2(= t1 + ), is the 2- dimensional Fourier transform of the images with the superscript indicating the complex conjugate, and i = -l
We shall now derive a criterion which gives the maximum wavenumber for which Equation 2 can be used for unambiguously determining the image spectrum. It is assumed that
where G gives the grey value in the range (0-255) in a square area of side L = 676 metres: N = 128; so that the image size is 128 x 128 pixels; xm = (m - 1) L/N, Yn = (n - 1) L/N, are the x and y coordinates; 1 is the time; A, are the amplitudes of the simulated waves having wavenumber ki and propagation direction i and initial phase i; ki satisfying the dispersion relation Equation I.
Using Equation 5 we simulated two monochromatic images (i.e. with single frequency) at time t1 = 0 and t2 = 2.3 seconds in d = 30 m water depth, so that = 2.3 s. Other parameters chosen were Ai = 127, 1 = 30c,
i = 10°; and ƒl =0.157 Hz; which works out to T1 = 6.4 s, k1 = 0.997m-1 and wavelength
1 = 63 m.
Figure 3 represents the radar image simu- lated at time t1 = 0, which is indistinguishable to the naked eye from the image simulated at time t2 = 2.3 (not shown). Figure 4 is the 2- dimensional Fourier Transform (k, ti,). Note that Figure 4 displays the correct wavelength, but there is as expected a 180° ambiguity in the wave direction. Figure 5 is the image spectrum computed using Equation 2. Figure 5 not only displays the correct wavelength, but also the unambiguously correct wave direction. The inner circle in Figure 5 depicts a wavelength of 50 m:
where T is the wave period. If we assume that < T /2 (this is analogous to the criterion of Barber and Doyle (1956), d < /2 associated with wave directional arrays) and also assume that the images are taken in deep water so that the wave dispersion relation Equation 1 reduces to w(k) = kg, then Equation 3 may be rewritten as follows
Making k as the subject of the inequality, we obtain
Equation 4 gives an approximate wavenumber upper limit above which Equation 2 will fail to give unambiguous image spectra - we may emphasize that Equation 4 is exact in deep water.

Wave Directional Spectrum From SAR Imagery 17
the outer circle depicts a wavelength of 33 m, which corresponds to the maximum wave number given by Equation 4, for which Figure 5 gives correct results. The dot in Figure 5 representing the simulated wavelength of 63 m and wave direction of 30°, lies exactly along the circle of wavelength of 63 m ( not shown ).
Conclusions
Having failed to find a clear Signature of ocean waves from three SAR scenes along the coast of India, we located two scenes off Portugal showing "swell" waves. Software developed for the removal of 180° ambiguity in wave direction from computer simulated images should be useful to remove the said ambiguity from actual ERS-1 SAR imagery if at least two looks of the multi-look data is available.
Acknowledgements
We wish to thank the Director, NIO for the facilities provided. Installation of Debian Linux on our personal computer could not have been successful without the supervision and help of D Shankar. We wish to thank the scientists of SAC, Ahmedabad, specially Raj Kumar for providing a subroutine for 2-dimensional FFT as well as a computer program for downloading SAR data from CCT. Finally we owe a debt of gratitude to J C da Silva, Southampton Oceanographic Centre, U K for sharing some of his SAR data with us.
References
Allan T. D. (Ed) (1983). Satellite microwave remote sensing. Ellis Horwood Ltd, Chichester
Atanassov V., Rosenthal, W. and Ziemer F. (1985). Removal of ambiguity of two dimensional power spectra obtained by processing ship radar images of ocean waves, J. Geophys. Res., 90(CI):1061-1067.
Barber N. F. and D. Doyle, D. (1956). A method of recording the direction of travel of ocean swell. Deep-Sea Research, 3(3):206-213.
Fernandes A. A.. Almeida, A. M., Vaithiyanathan R.
and Vethamony P. (1994). Determination of wave direction using an orbital following buoy. In: Ocean technology perspectives (Eds.: S. K. Agadi, V. Kesava Das and B. N. Dessai). Publication and Information Directorate, New Delhi, pp. 378-388.
Gonzalez F. I., Beal R. C, Brown W. E., Deleonibus P. S., Sherman J. W.. Gower J. F. R., Lichy D., Ross D. B., Rufenach C. L. and Schuchma R. A. (1979). Seasat synthetic aperture radar: Ocean wave detection capabilities. Science, 204:1418- 1421.
Hasselmann K. and Hasselmann S. (1991). On the nonlinear mapping of an ocean wave spectrum into a SAR image spectrum and its inversion. J. Geophys. Res., 90:10713-10729.
Hasselmann K., Raney R. K. Plant W. J., Alpers. W., Schuchman R. A., Lyzenga D. R., Rufenach C. L. and Tucker M. J. (1985). Theory of synthetic aperture radar ocean imaging: A MARSEN view. J. Geophys. Res., 90:4659-4686.
Johannessen J. A., Digranes G.. Espedal H.. Johannessen O. M. and Samuel, P. (1994). SAR Ocean feature catalogue. ESA SP-1174, European Space Agency.
Kumar R., Sarkar. A. and Pandey P. C. (1996). Bathymetry in east coast of India by synthetic aperture radar. Proc Int Conf in Ocean Engng COE'96, held at IIT, Madras. India, from Dec.17- 20,1996. pp. 515-519.
Kumar R., Sarma Y. V. B. and Abhijit Sarkar (1997). Estimation of ocean wave spectrum and its validation with in-situ data. Proc. Tenth National Space Sci.Symp., held at PRL, Ahmedabad, from Nov. 25-28, 1997, pp. 208-209.
Kumar R., Sarkar A. and Pandey, P. C. (1999). Estimation of ocean depths off Goa coast using ERS-1 synthetic aperture radar. Continental Shelf Res., 19:171-181.
Mahadevan R., Srinivasan D. and Daniel Jacob (1990). Final Report on: Computer software development for processing ocean wave data obtained from NRSA. Project sponsored by the Department of Ocean Development, Government of India. Ocean Engineering Centre. Indian Institute of Technology, Madras -600 036.

18 A.A. Fernandes et al
Monaldo F. M and Lyzenga D. R (1986). On the estimation of wave slope and heightvariance spectra from SAR imagery. IEEE Trans. Geoscience and Remote Sensing, GE-24(4):543- 551
Rosenthal \V., Ziemcr F., Raney K. and Vachon, P. (1989). Removal of 180 ambiguity in SAR images of ocean waves. Proc. 1GARSS, 1989, Vol. 4, pp. 2342-2345.
Sarma Y. V. B. (1997). Some aspects of ocean surface waves from synthetic aperture radar imageries. PhD Thesis, Andhra University. Visakhapatnam.
Vachon, P. W. and Raney, R. K. (1989). Resolution of ocean wave propagation direction in single-pass airborne SAR imagery. Proc IGARSS. 1989, Vol 4. pp. 2320-2323.