Spatial and Temporal Variation Characteristics of Glacier ...
Upload
independentCategory
view
1download
0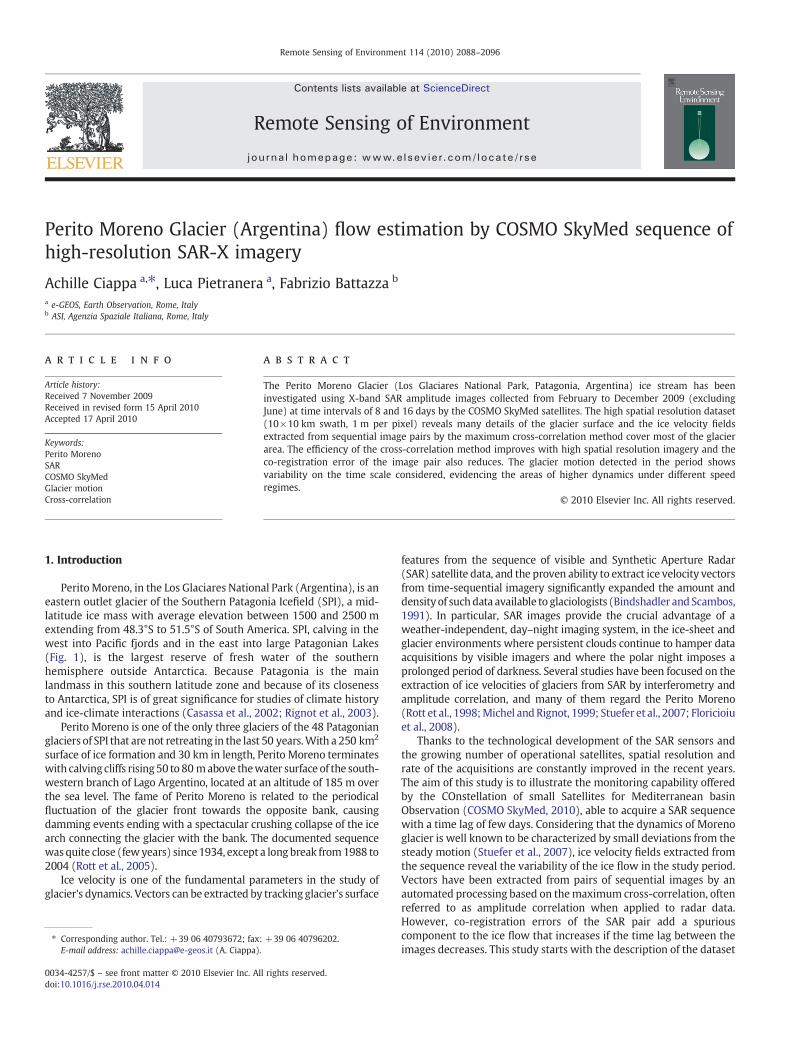
Remote Sensing of Environment 114 (2010) 2088–2096
Contents lists available at ScienceDirect
Remote Sensing of Environment
j ourna l homepage: www.e lsev ie r.com/ locate / rse
Perito Moreno Glacier (Argentina) flow estimation by COSMO SkyMed sequence ofhigh-resolution SAR-X imagery
Achille Ciappa a,⁎, Luca Pietranera a, Fabrizio Battazza b
a e-GEOS, Earth Observation, Rome, Italyb ASI, Agenzia Spaziale Italiana, Rome, Italy
⁎ Corresponding author. Tel.: +39 06 40793672; fax:E-mail address: [email protected] (A. Ciappa)
0034-4257/$ – see front matter © 2010 Elsevier Inc. Aldoi:10.1016/j.rse.2010.04.014
a b s t r a c t
a r t i c l e i n f oArticle history:Received 7 November 2009Received in revised form 15 April 2010Accepted 17 April 2010
Keywords:Perito MorenoSARCOSMO SkyMedGlacier motionCross-correlation
The Perito Moreno Glacier (Los Glaciares National Park, Patagonia, Argentina) ice stream has beeninvestigated using X-band SAR amplitude images collected from February to December 2009 (excludingJune) at time intervals of 8 and 16 days by the COSMO SkyMed satellites. The high spatial resolution dataset(10×10 km swath, 1 m per pixel) reveals many details of the glacier surface and the ice velocity fieldsextracted from sequential image pairs by the maximum cross-correlation method cover most of the glacierarea. The efficiency of the cross-correlation method improves with high spatial resolution imagery and theco-registration error of the image pair also reduces. The glacier motion detected in the period showsvariability on the time scale considered, evidencing the areas of higher dynamics under different speedregimes.
+39 06 40796202..
l rights reserved.
© 2010 Elsevier Inc. All rights reserved.
1. Introduction
Perito Moreno, in the Los Glaciares National Park (Argentina), is aneastern outlet glacier of the Southern Patagonia Icefield (SPI), a mid-latitude ice mass with average elevation between 1500 and 2500 mextending from 48.3°S to 51.5°S of South America. SPI, calving in thewest into Pacific fjords and in the east into large Patagonian Lakes(Fig. 1), is the largest reserve of fresh water of the southernhemisphere outside Antarctica. Because Patagonia is the mainlandmass in this southern latitude zone and because of its closenessto Antarctica, SPI is of great significance for studies of climate historyand ice-climate interactions (Casassa et al., 2002; Rignot et al., 2003).
Perito Moreno is one of the only three glaciers of the 48 Patagonianglaciers of SPI that are not retreating in the last 50 years.With a 250 km2
surface of ice formation and 30 km in length, Perito Moreno terminateswith calving cliffs rising50 to 80 mabove thewater surface of the south-western branch of Lago Argentino, located at an altitude of 185 m overthe sea level. The fame of Perito Moreno is related to the periodicalfluctuation of the glacier front towards the opposite bank, causingdamming events ending with a spectacular crushing collapse of the icearch connecting the glacier with the bank. The documented sequencewasquite close (fewyears) since 1934, except a long break from1988 to2004 (Rott et al., 2005).
Ice velocity is one of the fundamental parameters in the study ofglacier's dynamics. Vectors can be extracted by tracking glacier's surface
features from the sequence of visible and Synthetic Aperture Radar(SAR) satellite data, and the proven ability to extract ice velocity vectorsfrom time-sequential imagery significantly expanded the amount anddensity of suchdata available to glaciologists (Bindshadler and Scambos,1991). In particular, SAR images provide the crucial advantage of aweather-independent, day–night imaging system, in the ice-sheet andglacier environments where persistent clouds continue to hamper dataacquisitions by visible imagers and where the polar night imposes aprolonged period of darkness. Several studies have been focused on theextraction of ice velocities of glaciers from SAR by interferometry andamplitude correlation, and many of them regard the Perito Moreno(Rott et al., 1998;Michel andRignot, 1999; Stuefer et al., 2007; Floricioiuet al., 2008).
Thanks to the technological development of the SAR sensors andthe growing number of operational satellites, spatial resolution andrate of the acquisitions are constantly improved in the recent years.The aim of this study is to illustrate the monitoring capability offeredby the COnstellation of small Satellites for Mediterranean basinObservation (COSMO SkyMed, 2010), able to acquire a SAR sequencewith a time lag of few days. Considering that the dynamics of Morenoglacier is well known to be characterized by small deviations from thesteady motion (Stuefer et al., 2007), ice velocity fields extracted fromthe sequence reveal the variability of the ice flow in the study period.Vectors have been extracted from pairs of sequential images by anautomated processing based on themaximum cross-correlation, oftenreferred to as amplitude correlation when applied to radar data.However, co-registration errors of the SAR pair add a spuriouscomponent to the ice flow that increases if the time lag between theimages decreases. This study starts with the description of the dataset
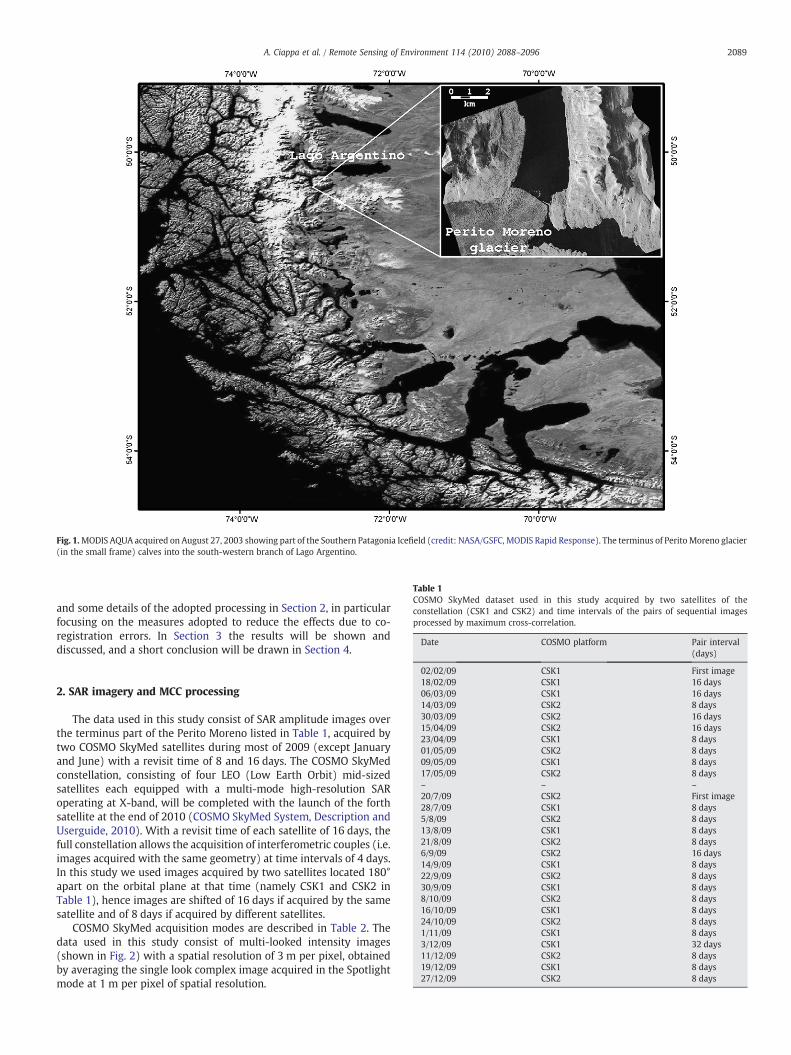
Fig. 1.MODIS AQUA acquired on August 27, 2003 showing part of the Southern Patagonia Icefield (credit: NASA/GSFC, MODIS Rapid Response). The terminus of Perito Moreno glacier(in the small frame) calves into the south-western branch of Lago Argentino.
Table 1COSMO SkyMed dataset used in this study acquired by two satellites of theconstellation (CSK1 and CSK2) and time intervals of the pairs of sequential imagesprocessed by maximum cross-correlation.
Date COSMO platform Pair interval(days)
2089A. Ciappa et al. / Remote Sensing of Environment 114 (2010) 2088–2096
and some details of the adopted processing in Section 2, in particularfocusing on the measures adopted to reduce the effects due to co-registration errors. In Section 3 the results will be shown anddiscussed, and a short conclusion will be drawn in Section 4.
02/02/09 CSK1 First image18/02/09 CSK1 16 days06/03/09 CSK1 16 days14/03/09 CSK2 8 days30/03/09 CSK2 16 days15/04/09 CSK2 16 days23/04/09 CSK1 8 days01/05/09 CSK2 8 days09/05/09 CSK1 8 days17/05/09 CSK2 8 days– – –
20/7/09 CSK2 First image28/7/09 CSK1 8 days5/8/09 CSK2 8 days13/8/09 CSK1 8 days21/8/09 CSK2 8 days6/9/09 CSK2 16 days14/9/09 CSK1 8 days22/9/09 CSK2 8 days30/9/09 CSK1 8 days8/10/09 CSK2 8 days16/10/09 CSK1 8 days24/10/09 CSK2 8 days1/11/09 CSK1 8 days3/12/09 CSK1 32 days11/12/09 CSK2 8 days19/12/09 CSK1 8 days27/12/09 CSK2 8 days
2. SAR imagery and MCC processing
The data used in this study consist of SAR amplitude images overthe terminus part of the Perito Moreno listed in Table 1, acquired bytwo COSMO SkyMed satellites during most of 2009 (except Januaryand June) with a revisit time of 8 and 16 days. The COSMO SkyMedconstellation, consisting of four LEO (Low Earth Orbit) mid-sizedsatellites each equipped with a multi-mode high-resolution SARoperating at X-band, will be completed with the launch of the forthsatellite at the end of 2010 (COSMO SkyMed System, Description andUserguide, 2010). With a revisit time of each satellite of 16 days, thefull constellation allows the acquisition of interferometric couples (i.e.images acquired with the same geometry) at time intervals of 4 days.In this study we used images acquired by two satellites located 180°apart on the orbital plane at that time (namely CSK1 and CSK2 inTable 1), hence images are shifted of 16 days if acquired by the samesatellite and of 8 days if acquired by different satellites.
COSMO SkyMed acquisition modes are described in Table 2. Thedata used in this study consist of multi-looked intensity images(shown in Fig. 2) with a spatial resolution of 3 m per pixel, obtainedby averaging the single look complex image acquired in the Spotlightmode at 1 m per pixel of spatial resolution.
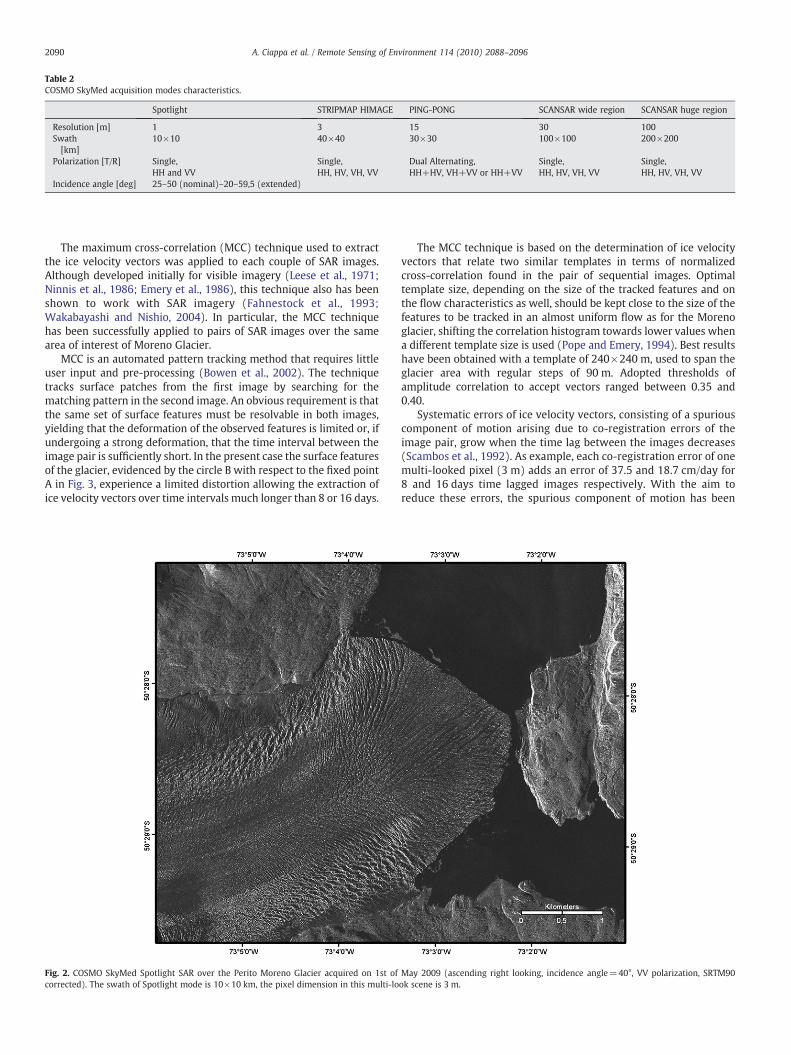
Table 2COSMO SkyMed acquisition modes characteristics.
Spotlight STRIPMAP HIMAGE PING-PONG SCANSAR wide region SCANSAR huge region
Resolution [m] 1 3 15 30 100Swath[km]
10×10 40×40 30×30 100×100 200×200
Polarization [T/R] Single,HH and VV
Single,HH, HV, VH, VV
Dual Alternating,HH+HV, VH+VV or HH+VV
Single,HH, HV, VH, VV
Single,HH, HV, VH, VV
Incidence angle [deg] 25–50 (nominal)–20–59,5 (extended)
2090 A. Ciappa et al. / Remote Sensing of Environment 114 (2010) 2088–2096
The maximum cross-correlation (MCC) technique used to extractthe ice velocity vectors was applied to each couple of SAR images.Although developed initially for visible imagery (Leese et al., 1971;Ninnis et al., 1986; Emery et al., 1986), this technique also has beenshown to work with SAR imagery (Fahnestock et al., 1993;Wakabayashi and Nishio, 2004). In particular, the MCC techniquehas been successfully applied to pairs of SAR images over the samearea of interest of Moreno Glacier.
MCC is an automated pattern tracking method that requires littleuser input and pre-processing (Bowen et al., 2002). The techniquetracks surface patches from the first image by searching for thematching pattern in the second image. An obvious requirement is thatthe same set of surface features must be resolvable in both images,yielding that the deformation of the observed features is limited or, ifundergoing a strong deformation, that the time interval between theimage pair is sufficiently short. In the present case the surface featuresof the glacier, evidenced by the circle B with respect to the fixed pointA in Fig. 3, experience a limited distortion allowing the extraction ofice velocity vectors over time intervals much longer than 8 or 16 days.
Fig. 2. COSMO SkyMed Spotlight SAR over the Perito Moreno Glacier acquired on 1st ofcorrected). The swath of Spotlight mode is 10×10 km, the pixel dimension in this multi-lo
The MCC technique is based on the determination of ice velocityvectors that relate two similar templates in terms of normalizedcross-correlation found in the pair of sequential images. Optimaltemplate size, depending on the size of the tracked features and onthe flow characteristics as well, should be kept close to the size of thefeatures to be tracked in an almost uniform flow as for the Morenoglacier, shifting the correlation histogram towards lower values whena different template size is used (Pope and Emery, 1994). Best resultshave been obtained with a template of 240×240 m, used to span theglacier area with regular steps of 90 m. Adopted thresholds ofamplitude correlation to accept vectors ranged between 0.35 and0.40.
Systematic errors of ice velocity vectors, consisting of a spuriouscomponent of motion arising due to co-registration errors of theimage pair, grow when the time lag between the images decreases(Scambos et al., 1992). As example, each co-registration error of onemulti-looked pixel (3 m) adds an error of 37.5 and 18.7 cm/day for8 and 16 days time lagged images respectively. With the aim toreduce these errors, the spurious component of motion has been
May 2009 (ascending right looking, incidence angle=40°, VV polarization, SRTM90ok scene is 3 m.
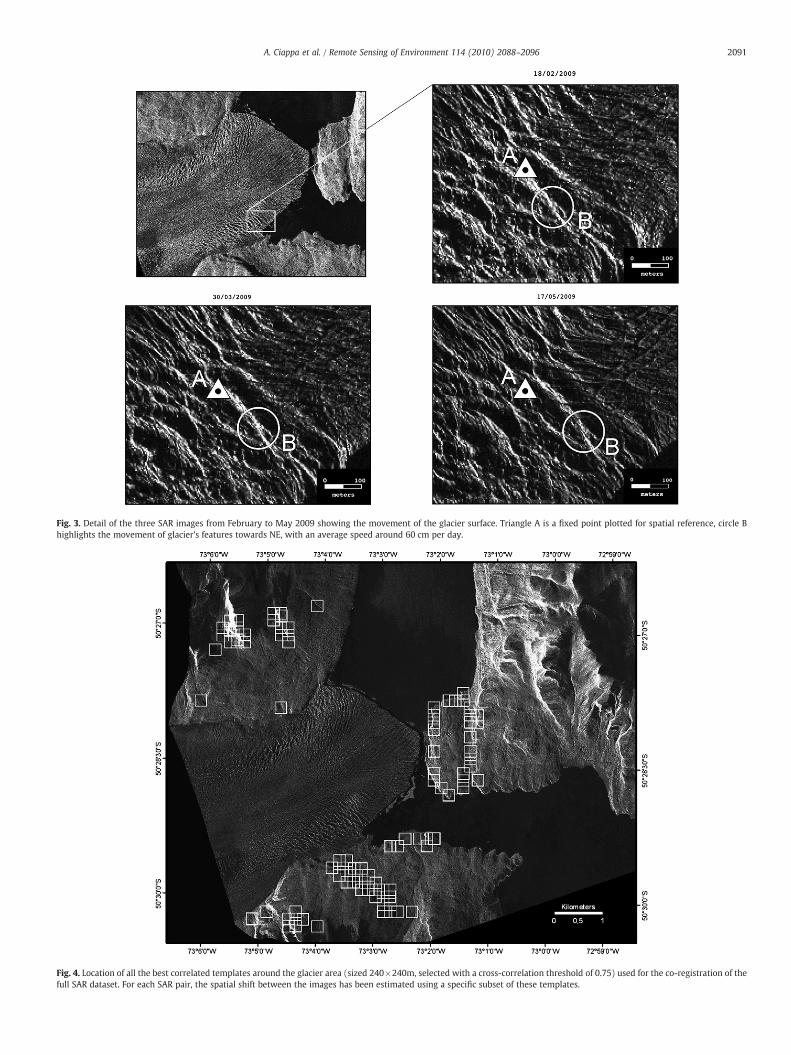
Fig. 3. Detail of the three SAR images from February to May 2009 showing the movement of the glacier surface. Triangle A is a fixed point plotted for spatial reference, circle Bhighlights the movement of glacier's features towards NE, with an average speed around 60 cm per day.
Fig. 4. Location of all the best correlated templates around the glacier area (sized 240×240m, selected with a cross-correlation threshold of 0.75) used for the co-registration of thefull SAR dataset. For each SAR pair, the spatial shift between the images has been estimated using a specific subset of these templates.
2091A. Ciappa et al. / Remote Sensing of Environment 114 (2010) 2088–2096
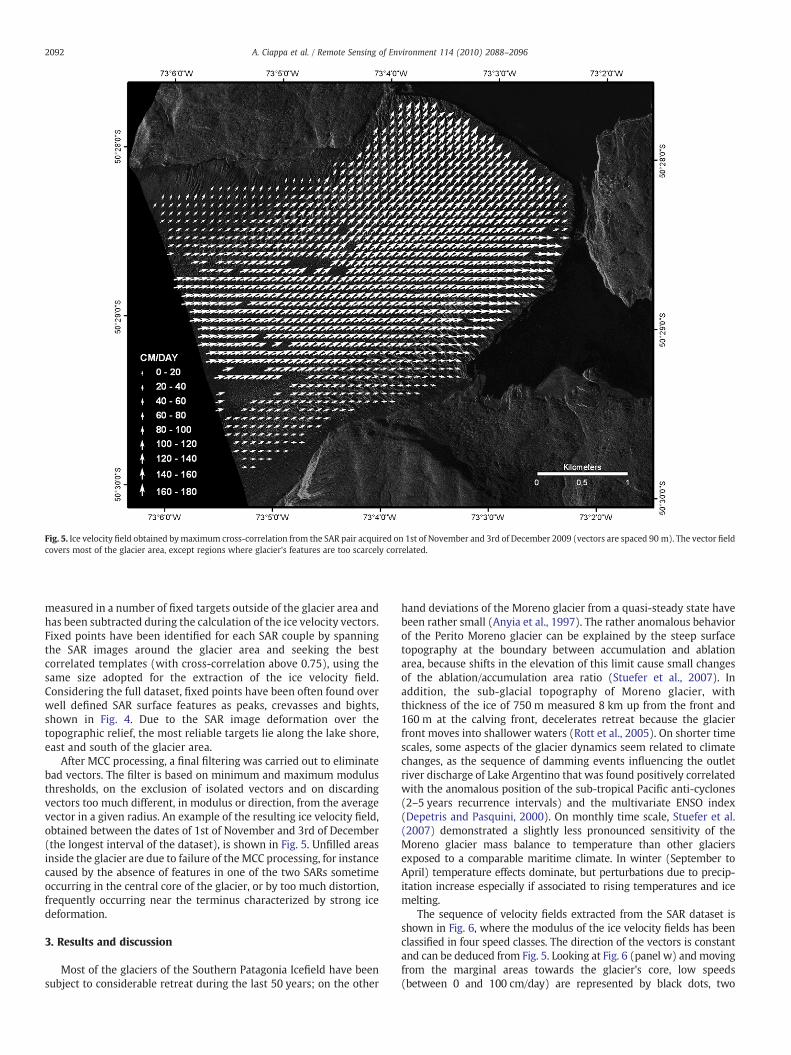
Fig. 5. Ice velocity field obtained bymaximum cross-correlation from the SAR pair acquired on 1st of November and 3rd of December 2009 (vectors are spaced 90 m). The vector fieldcovers most of the glacier area, except regions where glacier's features are too scarcely correlated.
2092 A. Ciappa et al. / Remote Sensing of Environment 114 (2010) 2088–2096
measured in a number of fixed targets outside of the glacier area andhas been subtracted during the calculation of the ice velocity vectors.Fixed points have been identified for each SAR couple by spanningthe SAR images around the glacier area and seeking the bestcorrelated templates (with cross-correlation above 0.75), using thesame size adopted for the extraction of the ice velocity field.Considering the full dataset, fixed points have been often found overwell defined SAR surface features as peaks, crevasses and bights,shown in Fig. 4. Due to the SAR image deformation over thetopographic relief, the most reliable targets lie along the lake shore,east and south of the glacier area.
After MCC processing, a final filtering was carried out to eliminatebad vectors. The filter is based on minimum and maximum modulusthresholds, on the exclusion of isolated vectors and on discardingvectors too much different, in modulus or direction, from the averagevector in a given radius. An example of the resulting ice velocity field,obtained between the dates of 1st of November and 3rd of December(the longest interval of the dataset), is shown in Fig. 5. Unfilled areasinside the glacier are due to failure of the MCC processing, for instancecaused by the absence of features in one of the two SARs sometimeoccurring in the central core of the glacier, or by too much distortion,frequently occurring near the terminus characterized by strong icedeformation.
3. Results and discussion
Most of the glaciers of the Southern Patagonia Icefield have beensubject to considerable retreat during the last 50 years; on the other
hand deviations of the Moreno glacier from a quasi-steady state havebeen rather small (Anyia et al., 1997). The rather anomalous behaviorof the Perito Moreno glacier can be explained by the steep surfacetopography at the boundary between accumulation and ablationarea, because shifts in the elevation of this limit cause small changesof the ablation/accumulation area ratio (Stuefer et al., 2007). Inaddition, the sub-glacial topography of Moreno glacier, withthickness of the ice of 750 m measured 8 km up from the front and160 m at the calving front, decelerates retreat because the glacierfront moves into shallower waters (Rott et al., 2005). On shorter timescales, some aspects of the glacier dynamics seem related to climatechanges, as the sequence of damming events influencing the outletriver discharge of Lake Argentino that was found positively correlatedwith the anomalous position of the sub-tropical Pacific anti-cyclones(2–5 years recurrence intervals) and the multivariate ENSO index(Depetris and Pasquini, 2000). On monthly time scale, Stuefer et al.(2007) demonstrated a slightly less pronounced sensitivity of theMoreno glacier mass balance to temperature than other glaciersexposed to a comparable maritime climate. In winter (September toApril) temperature effects dominate, but perturbations due to precip-itation increase especially if associated to rising temperatures and icemelting.
The sequence of velocity fields extracted from the SAR dataset isshown in Fig. 6, where the modulus of the ice velocity fields has beenclassified in four speed classes. The direction of the vectors is constantand can be deduced from Fig. 5. Looking at Fig. 6 (panel w) and movingfrom the marginal areas towards the glacier's core, low speeds(between 0 and 100 cm/day) are represented by black dots, two
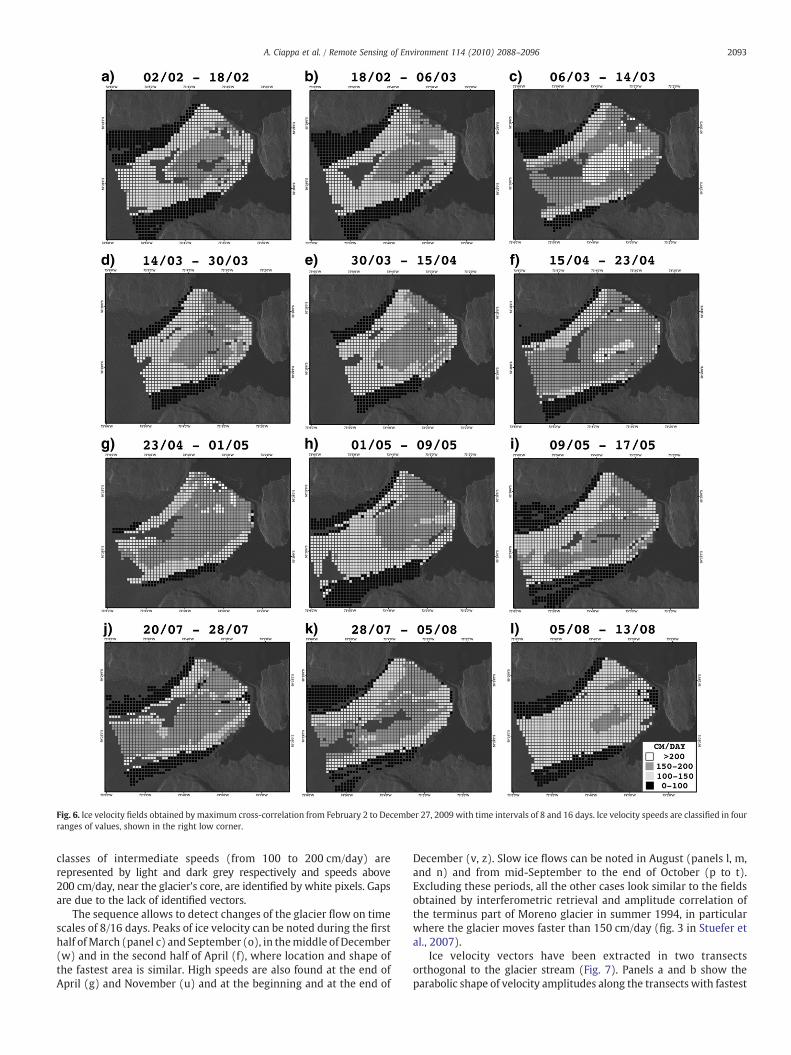
Fig. 6. Ice velocity fields obtained by maximum cross-correlation from February 2 to December 27, 2009 with time intervals of 8 and 16 days. Ice velocity speeds are classified in fourranges of values, shown in the right low corner.
2093A. Ciappa et al. / Remote Sensing of Environment 114 (2010) 2088–2096
classes of intermediate speeds (from 100 to 200 cm/day) arerepresented by light and dark grey respectively and speeds above200 cm/day, near the glacier's core, are identified by white pixels. Gapsare due to the lack of identified vectors.
The sequence allows to detect changes of the glacier flow on timescales of 8/16 days. Peaks of ice velocity can be noted during the firsthalf ofMarch (panel c) and September (o), in themiddle of December(w) and in the second half of April (f), where location and shape ofthe fastest area is similar. High speeds are also found at the end ofApril (g) and November (u) and at the beginning and at the end of
December (v, z). Slow ice flows can be noted in August (panels l, m,and n) and from mid-September to the end of October (p to t).Excluding these periods, all the other cases look similar to the fieldsobtained by interferometric retrieval and amplitude correlation ofthe terminus part of Moreno glacier in summer 1994, in particularwhere the glacier moves faster than 150 cm/day (fig. 3 in Stuefer etal., 2007).
Ice velocity vectors have been extracted in two transectsorthogonal to the glacier stream (Fig. 7). Panels a and b show theparabolic shape of velocity amplitudes along the transects with fastest
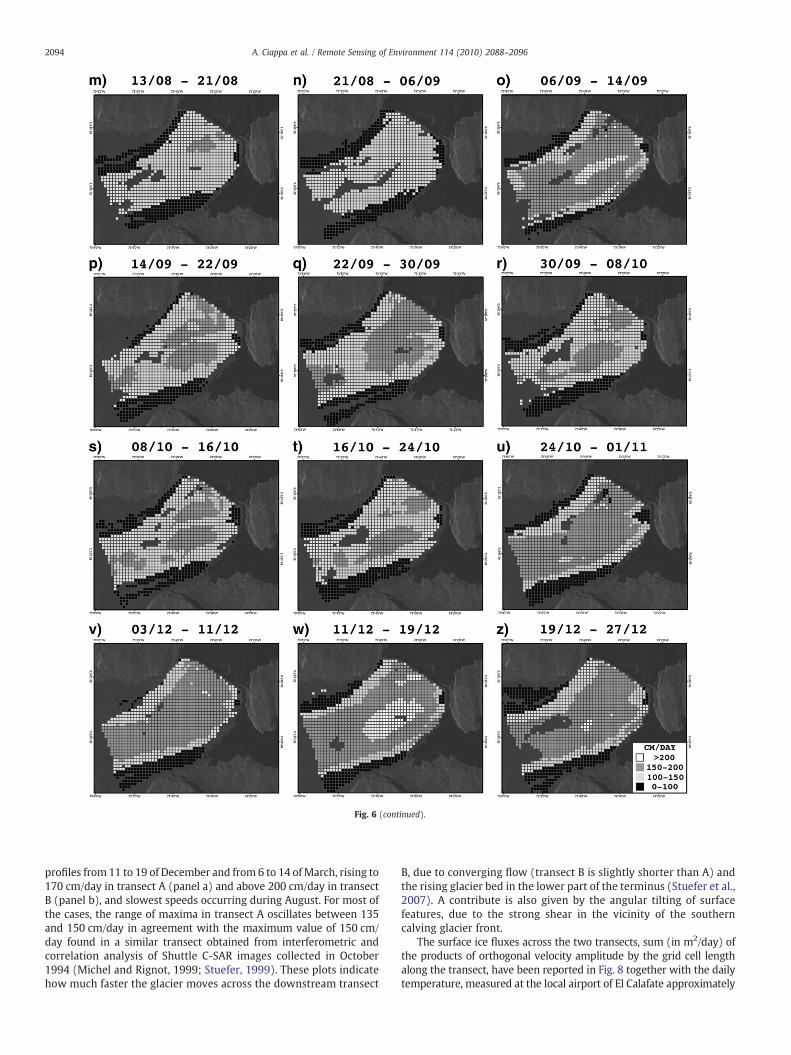
Fig. 6 (continued).
2094 A. Ciappa et al. / Remote Sensing of Environment 114 (2010) 2088–2096
profiles from 11 to 19 of December and from 6 to 14 ofMarch, rising to170 cm/day in transect A (panel a) and above 200 cm/day in transectB (panel b), and slowest speeds occurring during August. For most ofthe cases, the range of maxima in transect A oscillates between 135and 150 cm/day in agreement with the maximum value of 150 cm/day found in a similar transect obtained from interferometric andcorrelation analysis of Shuttle C-SAR images collected in October1994 (Michel and Rignot, 1999; Stuefer, 1999). These plots indicatehow much faster the glacier moves across the downstream transect
B, due to converging flow (transect B is slightly shorter than A) andthe rising glacier bed in the lower part of the terminus (Stuefer et al.,2007). A contribute is also given by the angular tilting of surfacefeatures, due to the strong shear in the vicinity of the southerncalving glacier front.
The surface ice fluxes across the two transects, sum (in m2/day) ofthe products of orthogonal velocity amplitude by the grid cell lengthalong the transect, have been reported in Fig. 8 together with the dailytemperature, measured at the local airport of El Calafate approximately
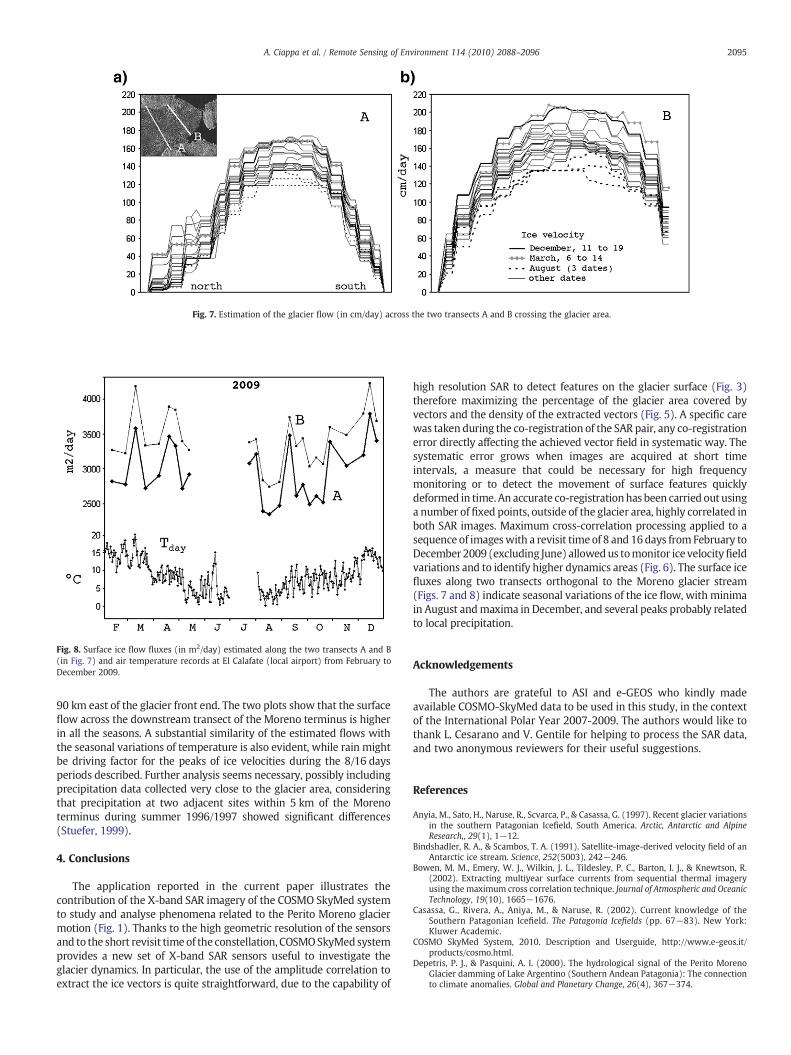
Fig. 7. Estimation of the glacier flow (in cm/day) across the two transects A and B crossing the glacier area.
Fig. 8. Surface ice flow fluxes (in m2/day) estimated along the two transects A and B(in Fig. 7) and air temperature records at El Calafate (local airport) from February toDecember 2009.
2095A. Ciappa et al. / Remote Sensing of Environment 114 (2010) 2088–2096
90 km east of the glacier front end. The two plots show that the surfaceflow across the downstream transect of the Moreno terminus is higherin all the seasons. A substantial similarity of the estimated flows withthe seasonal variations of temperature is also evident, while rain mightbe driving factor for the peaks of ice velocities during the 8/16 daysperiods described. Further analysis seems necessary, possibly includingprecipitation data collected very close to the glacier area, consideringthat precipitation at two adjacent sites within 5 km of the Morenoterminus during summer 1996/1997 showed significant differences(Stuefer, 1999).
4. Conclusions
The application reported in the current paper illustrates thecontribution of the X-band SAR imagery of the COSMO SkyMed systemto study and analyse phenomena related to the Perito Moreno glaciermotion (Fig. 1). Thanks to the high geometric resolution of the sensorsand to the short revisit time of the constellation, COSMOSkyMed systemprovides a new set of X-band SAR sensors useful to investigate theglacier dynamics. In particular, the use of the amplitude correlation toextract the ice vectors is quite straightforward, due to the capability of
high resolution SAR to detect features on the glacier surface (Fig. 3)therefore maximizing the percentage of the glacier area covered byvectors and the density of the extracted vectors (Fig. 5). A specific carewas taken during the co-registration of the SAR pair, any co-registrationerror directly affecting the achieved vector field in systematic way. Thesystematic error grows when images are acquired at short timeintervals, a measure that could be necessary for high frequencymonitoring or to detect the movement of surface features quicklydeformed in time. An accurate co-registrationhas been carried out usinga number of fixed points, outside of the glacier area, highly correlated inboth SAR images. Maximum cross-correlation processing applied to asequence of imageswith a revisit time of 8 and 16days fromFebruary toDecember 2009 (excluding June) allowedus tomonitor ice velocityfieldvariations and to identify higher dynamics areas (Fig. 6). The surface icefluxes along two transects orthogonal to the Moreno glacier stream(Figs. 7 and 8) indicate seasonal variations of the ice flow, with minimain August andmaxima in December, and several peaks probably relatedto local precipitation.
Acknowledgements
The authors are grateful to ASI and e-GEOS who kindly madeavailable COSMO-SkyMed data to be used in this study, in the contextof the International Polar Year 2007-2009. The authors would like tothank L. Cesarano and V. Gentile for helping to process the SAR data,and two anonymous reviewers for their useful suggestions.
References
Anyia, M., Sato, H., Naruse, R., Scvarca, P., & Casassa, G. (1997). Recent glacier variationsin the southern Patagonian Icefield, South America. Arctic, Antarctic and AlpineResearch,, 29(1), 1−12.
Bindshadler, R. A., & Scambos, T. A. (1991). Satellite-image-derived velocity field of anAntarctic ice stream. Science, 252(5003), 242−246.
Bowen, M. M., Emery, W. J., Wilkin, J. L., Tildesley, P. C., Barton, I. J., & Knewtson, R.(2002). Extracting multiyear surface currents from sequential thermal imageryusing the maximum cross correlation technique. Journal of Atmospheric and OceanicTechnology, 19(10), 1665−1676.
Casassa, G., Rivera, A., Aniya, M., & Naruse, R. (2002). Current knowledge of theSouthern Patagonian Icefield. The Patagonia Icefields (pp. 67−83). New York:Kluwer Academic.
COSMO SkyMed System, 2010. Description and Userguide, http://www.e-geos.it/products/cosmo.html.
Depetris, P. J., & Pasquini, A. I. (2000). The hydrological signal of the Perito MorenoGlacier damming of Lake Argentino (Southern Andean Patagonia): The connectionto climate anomalies. Global and Planetary Change, 26(4), 367−374.

2096 A. Ciappa et al. / Remote Sensing of Environment 114 (2010) 2088–2096
Emery, W. J., Thomas, A. C., Collins, M. J., Crawford, W. R., & Mackas, D. L. (1986). Anobjective method for computing advective surface velocities for sequential infraredsatellite images. Journal of Geophysical Research, 91, 12865−12878.
Fahnestock, M. A., Bindschadler, R. A., Kwok, R., & Jezec, K. C. (1993). Greenland icesheet surface properties and ice flow from ERS-1 SAR imagery. Science, 262,1530−1534.
Floricioiu, D., Eineder, M., Rott, F., & Nagler, T. (2008). Velocities of major outlet glaciers ofthe Patagonia Icefield observed by TerraSAR-X. Proceedings of ‘2008 IEEE InternationalGeoscience and Remote Sensing Symposium’, Boston U.S., IGARSS '08.
Leese, J. A., Novak, C. S., & Clark, B. B. (1971). An automated technique for obtainingcloud motion from geosynchronous satellite data using cross-correlation. Journal ofApplied Meteorology, 10, 118−132.
Michel, R., & Rignot, E. (1999). Flow of Glaciar Moreno, Argentina, from repeat-passShuttle Imaging Radar images: Comparison of the phase correlation method withradar interferometry. Journal of Glaciology, 45(149), 93−100.
NASA/GSFC MODIS Rapid Response System, http://rapidfire.sci.gsfc.nasa.gov/.Ninnis, R. M., Emery, W. J., & Collins, M. J. (1986). Automated extraction of pack ice motion
fromadvanced very high resolution radiometer imagery. Journal of Geophysical Research,91, 10725−10734.
Pope, P. A., & Emery, W. J. (January 1994). Sea surface velocities from visible and infraredMulti-spectral Atmospheric Mapping Sensor (MAMS) imagery. IEEE Transactions, 32(1).
Rignot, E., Rivera, A., & Casassa, G. (2003). Contribution of the Patagonia Icefields ofSouth America to sea level rise. Science, 302, 434−436.
Rott, H., Stuefer, M., Siegel, A., Skvarca, P., & Eckstaller, A. (1998). Mass fluxes anddynamics of Moreno Glacier, Southern Patagonia Icefield. Geophysical ResearchLetters, 25(9), 1407−1410.
Rott, H., Stuefer, M., Nagler, T., & Riedl, C. (2005). Recent fluctuations and damming ofglacier Perito Moreno, Patagonia, observed by means of ERS and ENVISAT imagery.Proceedings of the 2004 Envisat & ERS Symposium, 6–10 September 2004, Salzburg,Austria (ESA SP-572, April 2005).
Scambos, T. A., Dutkiewiwicz, M. J., Wilson, J. C., & Bindschdler, R. A. (1992). Applicationof image cross-correlation to the measurement of glacier velocity using satelliteimage data. Remote Sensing of Environment, 42, 177−186.
Stuefer M., 1999. Investigations on Mass Balance and Dynamics of Moreno Glacierbased on Field Measurements and Satellite Imagery. PhD thesis, Institute forMeteorology and Geophysics, Universität Innsbruck.
Stuefer, M., Rott, H., & Skvarca, P. (2007). Glaciar Perito Moreno, Patagonia: climatesensitivities and glacier characteristics preceding the 2003/04 and 2005/06damming events. Journal of Glaciology, 53(180), 3−16.
Wakabayashi, H., & Nishio, F. (2004). Glacier flow estimation by SAR image correlation.Proceedings of the Geoscience and Remote Sensing Symposium', Anchorage, Alaska US,IGARSS '04.
Copyright © 2022 FDOKUMEN